2011 comprehensive annual financial report · 2011 comprehensive annual financial report ... serve...
TRANSCRIPT


2011 COMPREHENSIVE ANNUAL FINANCIAL REPORT OF THE CHICAGO MIDWAY INTERNATIONAL AIRPORT
Table of Contents
PART I - INTRODUCTORY SECTION
Letter of Transmittal..............................................................................................................................................................2 Certificate of Achievement for Excellence in Financial Reporting.................................................................................. 6 Organization Chart/List of Principal Officials.....................................................................................................................7
PART II - FINANCIAL SECTION Independent Auditors’ Report and
Financial Statements Independent Auditors’ Report……...................................................................…........................................................9 Management’s Discussion and Analysis……................................................…..........................................................11
Basic Financial Statements Statements of Net Assets....................................................................................….............................................................19 Statements of Revenues, Expenses and Changes in Net Assets ..................…............................................................. 20 Statements of Cash Flows……………………………………. ..........................…............................................................21 Notes to Basic Financial Statements…………………………. .........................…............................................................23
ADDITIONAL INFORMATION Calculations of Coverage
Chicago Midway Airport Revenue Bonds………………...................................................................................................48 Chicago Midway Airport Second Lien Revenue Bonds…………....................................................................................50
PART III - STATISTICAL SECTION (Unaudited)
Historical Operating Results, Each of Ten Years Ended December 31, 2002-2011...........................................................53 Debt Service Schedule.......................................................................................................................................................54 Midway Airport Revenue Bonds, Series 1996 Estimated Bond-Funded Costs as of December 31, 2011..................................................................................................................................................55 Capital Improvement Program 2012- 2018 Estimated Source and Uses of Funds as of December 31, 2011, .............................................................................................................................................56 Terminal Development Program, Estimated Sources and Uses of Funds as of December 31, 2011………..…………57 Historical Enplaned Passengers, Each of Ten Years Ended December 31, 2002-2011................................................…..58 Enplaned Commercial Passengers by Airline, Each of Ten Years Ended December 31, 2002-2011………………….…59 Historical Enplaned Passengers Chicago Region Airports, Each of Ten Years Ended December 31, 2002-2011….…….60 Historical Total Origin and Destination (O&D) Enplanements Chicago Region Airports, Each of Ten Years Ended December 31, 2002-2011.....................................................61
Aircraft Operations, Each of Ten Years Ended December 31, 2002-2011…....................................................................62 Net Assets by Component, Each of Six Years Ended December 31, 2006-2011……………………………………….63 Change in Net Assets, Each of Six Years Ended December 31, 2006-2011.…….………….……….………………….64 Long Term Debt. Each of Six Years Ended December 31, 2006-2011 .…………………………………………...……65 Full Time Equivalent Chicago O’Hare Airport Employees By Function, Each of Six Years Ended December 31, 2006 - 2011…….…………………………………………………………66 Principal Employers (Non-Government)…………………………………….…………………………………………….67 Population and Income Statistics……………………………….…….…………….………….…………………………..68 Landing Fees and Terminal Area Use Charges…………………………………….…….………….…………………..69


4
with generally accepted accounting principles. The internal control structure is designed to provide reasonable assurance that the assets, resources and operations of the Airport are handled in a manner that protects against waste, theft or neglect and other irregularities that may hinder the operations of the Airport. This objective is being met by adequate supervision of employees, segregation of duties and multiple approvals of expenditures. The Airport’s budget is developed in connection with the City’s annual budget and is based on an analysis of the Airport’s historical operating expenses. The Commissioner of Aviation recommends the final proposed budget to the Budget Director. After approval by the Budget Director, the proposed budget is recommended to the Mayor for submission to the City Council for its approval following public hearings. The budget process is designed to ensure that the Airport will have adequate funding to meet its operational objectives. The Airport cannot, by law, exceed the level of funding as established by the City Council-approved budget. The Budget Director uses an allotment system to manage each department’s expenditures against its respective annual appropriations. The Budget Director, through the allotment system, has the authority to institute economic measures for the Airport to ensure that its expenditures do not exceed its revenue collection. The Airport uses encumbrances to control expenditures by preventing appropriated dollars from being used for any purpose other than that for which they have been legally appropriated. RELEVANT FINANCIAL POLICIES The Airport is owned by the City and operated by the Chicago Department of Aviation (“CDA”) and is accounted for as a self-supporting enterprise fund of the City. The City maintains the books, records and accounts of the Airport in accordance with generally accepted accounting principles and as required by the provisions of the Airport Use Agreements, the Bond Ordinance, and Bond Indentures as supplemented and amended. The Airport Use Agreements specify a residual rate-making methodology for the calculation of airline rates and charges. Under this methodology, total operating and maintenance expenses and debt service (including coverage) are calculated for each cost-revenue center and offset by nonairline revenues. The Airport Use Agreements provide that the aggregate of Airport Fees and Charges paid by the Airline Parties must be sufficient to pay for the net cost of


INDEPENDENT AUDITORS’ REPORT
The Honorable Rahm Emanuel, Mayor, and Members of the City Council City of Chicago, Illinois
We have audited the accompanying basic financial statements of Chicago Midway International Airport (Midway), an enterprise fund of the City of Chicago, Illinois (City), as of December 31, 2011 and 2010, and for the years then ended, as listed in the foregoing table of contents. These financial statements are the responsibility of the City’s management. Our responsibility is to express an opinion on these basic financial statements based on our audits.
We conducted our audits in accordance with auditing standards generally accepted in the United States of America. Those standards require that we plan and perform the audit to obtain reasonable assurance about whether the financial statements are free of material misstatement. An audit includes consideration of internal control over financial reporting as a basis for designing audit procedures that are appropriate in the circumstances, but not for the purpose of expressing an opinion on the effectiveness of the City’s internal control over financial reporting for Midway. Accordingly, we express no such opinion. An audit also includes examining, on a test basis, evidence supporting the amounts and disclosures in the financial statements, assessing the accounting principles used and significant estimates made by management, as well as evaluating the overall financial statement presentation. We believe that our audits provide a reasonable basis for our opinion.
As discussed in Note 1, the basic financial statements referred to above present only Chicago Midway International Airport, an enterprise fund of the City of Chicago and do not purport to, and do not present the financial position of the City of Chicago Illinois as of December 31, 2011 and 2010, changes in its financial position, or where applicable, its cash flows, in conformity with accounting principles generally accepted in the United States of America.
In our opinion, the basic financial statements, referred to previously, present fairly, in all material respects, the financial position of Chicago Midway International Airport as of December 31, 2011 and 2010, and the results of its operations and its cash flows for the years then ended, in conformity with accounting principles generally accepted in the United States of America.
As discussed in Note 1 to the basic financial statements, effective January 1, 2010, the City adopted Government Accounting Standards Board Statement No. 53 (GASB), Accounting and Financial Reporting for Derivative Instruments.
Accounting principles generally accepted in the United States of America require that the management’s discussion and analysis as listed in the foregoing table of contents be presented to supplement the basic financial statements. Such information, although not a part of the basic financial statements, is required by the GASB who considers it to be an essential part of financial reporting for placing the basic financial statements in an appropriate operational, economic, or historical context. We have applied certain limited procedures to the required supplementary information in accordance with auditing standards generally

- 10 -
accepted in the United States of America, which consisted of inquiries of management about the methods of preparing the information and comparing the information for consistency with management’s responses to our inquiries, the basic financial statements, and other knowledge we obtained during our audits of the basic financial statements. We do not express an opinion or provide any assurance on the information because the limited procedures do not provide us with sufficient evidence to express an opinion or provide any assurance.
Our audits were conducted for the purpose of forming an opinion on the basic financial statements taken as a whole. The additional supplementary information is presented for purposes of additional analysis and is not a required part of the basic financial statements. Such information is the responsibility of management and was derived from, and relates directly to, the underlying accounting and other records used to prepare the basic financial statements. The information has been subjected to the auditing procedures applied in the audit of the basic financial statements and certain additional procedures, including comparing and reconciling such information directly to the underlying accounting and other records used to prepare the basic financial statements or to the basic financial statements themselves, and other additional procedures in accordance with auditing standards generally accepted in the United States of America. In our opinion, the information is fairly stated in all material respects in relation to the basic financial statements as a whole.
Our audits were conducted for the purpose of forming an opinion on the basic financial statements taken as a whole. The introductory and statistical information as listed in the table of contents is also presented for purposes of additional analysis and is not a required part of the basic financial statements. Such information has not been subjected to the auditing procedures applied in the audit of the basic financial statements, and accordingly, we do not express an opinion or provide any assurance on it.
June 29, 2012

- 11 -
MANAGEMENT’S DISCUSSION AND ANALYSIS ($ IN THOUSANDS)
This following discussion and analysis of the Chicago Midway International Airport’s (Airport) performance provides an introduction and overview of the Airport’s financial activities for the years ended December 31, 2011 and 2010. Please read this discussion in conjunction with the Airport’s basic financial statements and the notes to basic financial statements following this section.
FINANCIAL HIGHLIGHTS
2011
• Operating revenues for 2011 increased by $9,547 compared to prior-year operating revenues.
• Operating expenses before depreciation and amortization increased by $1,753 compared to 2010, primarily due to an increase in repairs and maintenance offset by other operating expenses.
• The Airport’s total net assets at December 31, 2011 were $174,448. This is an increase of $3,522 compared to total net assets at December 31, 2010.
• Capital asset additions for 2011 were $43,346, principally due to land acquisition, terminal improvements, security enhancements and runway improvements.
2010
• Operating revenues for 2010 increased by $26,755 compared to prior-year operating revenues.
• Operating expenses before depreciation and amortization increased by $8,695 compared to 2009, primarily due to reimbursement in 2009 for professional fees related to the study of the privatization of the Airport.
• The Airport’s total net assets at December 31, 2010 were $170,926. This is a decrease of $34,088 compared to total net assets at December 31, 2009.
• Capital asset additions for 2010 were $27,963, principally due to land acquisition, terminal improvements, security enhancements and runway improvements.

- 12 -
OVERVIEW OF THE BASIC FINANCIAL STATEMENTS
This discussion and analysis is intended to serve as an introduction to the Airport’s basic financial statements. The Airport is included in the City of Chicago’s (City) reporting entity as an Enterprise Fund. The Airport’s basic financial statements are composed of the basic financial statements and the notes to basic financial statements. In addition to the basic financial statements this report also presents additional and statistical information after the notes to basic financial statements.
The Statements of Net Assets present all of the Airport’s assets and liabilities using the accrual basis of accounting, which is similar to the accounting used by private-sector companies. The difference between assets, deferred outflows and liabilities is reported as net assets. The increase or decrease in net assets may serve as an indicator, over time, whether the Airport’s financial position is improving or deteriorating. However, the consideration of other non-financial factors such as changes within the airline industry may be necessary in the assessment of the overall financial position and health of the Airport.
The Statements of Revenues, Expenses and Changes in Net Assets present all current fiscal year revenues and expenses, regardless of when cash is received or paid, and the ensuing change in net assets.
The Statements of Cash Flows report how cash and cash equivalents are provided and used by the Airport’s operating, capital financing and investing activities. These statements are prepared on a cash basis and present the cash received and disbursed, the net increase or decrease in cash and cash equivalents for the year and the cash and cash equivalents balance at year-end.
The Notes to Basic Financial Statements are an integral part of the basic financial statements; accordingly, such disclosures are essential to a full understanding of the information provided in the basic financial statements.
In addition to the basic financial statements, this report includes Additional Supplementary and Statistical Information. The Additional Supplementary Information section presents debt service coverage calculations and the Statistical Information section includes certain unaudited information related to the Airport’s historical financial and non-financial operating results and capital activities.
FINANCIAL ANALYSIS
Landing fees and terminal area use charges and fueling system charges are assessed to the various airlines throughout each year based on estimated rates. Such rates are designed to yield collections from airlines adequate to cover certain operating expenses and required debt service and fund deposits as determined under provisions of the Airport Use Agreement and Facilities Lease (Use Agreement). Incremental amounts due from the airlines arise when amounts assessed, based on the estimated rates used during the year, are less than actual expenses and required deposits for the year. Such incremental amounts due from airlines are included in accrued revenue. Incremental amounts due to the airlines arise when amounts assessed, based on the estimated rates used during the year, exceed actual expenses and required deposits for the year. Such incremental amounts due to airlines are included in deferred revenue. The termination date of the Airport Use Agreement and Facilities Lease is December 31, 2012. It is anticipated that a new Airport Use Agreement and Facilities Lease will be in place by December 31, 2012.

- 13 -
At December 31, 2011, the Airport’s financial position continued to be strong with total assets and deferred outflows of $1,792,224, total liabilities of $1,617,776, and net assets of $174,448. A comparative condensed summary of the Airport’s net assets at December 31, 2011, 2010, and 2009 is as follows:
2011 2010 2009
Current unrestricted assets 78,661$ 78,180$ 66,101$ Restricted and other assets 519,392 533,364 347,045 Capital assets — net 1,152,524 1,151,315 1,168,196 Deferred outflows 35,000 14,896 12,964 Derivatives Instrument 6,647
Total assets and deferred outflows 1,792,224$ 1,777,755$ 1,594,306$
Current liabilities 41,436$ 58,140$ 60,310$ Liabilities payable from restricted assets and noncurrent liabilities 1,576,340 1,548,689 1,328,982
Total liabilities 1,617,776$ 1,606,829$ 1,389,292$
Net assets: Invested in capital assets, net of related debt (deficit) (70,876)$ (39,755)$ (1,936)$ Restricted 208,100 190,641 201,158 Unrestricted 37,224 20,040 5,792
Total net assets 174,448$ 170,926$ 205,014$
Net Assets
2011
Current unrestricted assets increased by $481 (0.6%) primarily due to an increase in cash and cash equivalents. The Airport’s current ratio (current unrestricted assets/current unrestricted liabilities) at December 31, 2011 and 2010 was 1.90:1 and 1.34:1, respectively. Restricted and other assets decreased by $13,972 (2.6%) mainly due to an increase in payment of construction costs and use of capitalized interest and Passenger Facility Charges (PFC) for payments on debt service. Net capital assets increased by $1,209 (0.1%) due principally to increased construction in progress.
The decrease in current liabilities of $16,704 (28.7%) is mainly related to the decrease in accounts payable and accrued liabilities and a decrease in deferred revenue of $4,202 and $13,965 respectively. The decrease in deferred revenue represents primarily the net adjustment for current year activity and current year distributions of deferred revenue related to prior years to the airlines. Liabilities payable from restricted assets and noncurrent liabilities increased by $27,651 (1.8%) in 2011 mainly due to an increase in accounts payable of $22,019 partially offset by a decrease in revenue bonds payable from restricted funds for $7,629 and notes payable of $4,005 and an increase in the fair value of derivative instrument of $14,923.
Net assets may serve, over a period of time, as a useful indicator of the Airport’s financial position. At December 31, 2011, total net assets were $174,448, an increase of $3,522 (2.1%) from 2010. Due to the residual Airport Use Agreement, this increase is mainly due to timing differences between depreciation on property and facilities and cash requirements required for debt service.

- 14 -
2010
Current unrestricted assets increased by $12,079 (18.3%) primarily due to an increase in cash and cash equivalents. The Airport’s current ratio (current unrestricted assets/current unrestricted liabilities) at December 31, 2010 and 2009 was 1.34:1 and 1.10:1, respectively. Restricted and other assets increased by $186,319 (53.7%) mainly due to an increase in deferred noise mitigation costs. Net capital assets decreased by $16,881 (1.4%) due principally to depreciation.
The decrease in current unrestricted liabilities of $2,170 (3.6%) is mainly related to the decrease in advances for terminal and hangar rent and an increase in deferred revenue of $2,190 and $1,475 respectively. The decrease for terminal and hangar rent is due to timing at year-end for receipts related to 2011 and 2010. The increase in deferred revenue represents primarily the net adjustment for current year activity. Liabilities payable from restricted assets and noncurrent liabilities increased by $219,707 (16.5%) in 2010 mainly due to an increase in revenue bond payable of $273,103 partially offset by a decrease in accounts payable for restricted funds for $10,086 and notes payable of $57,355 and an increase in the fair value of derivative instrument of $4,469.
Net assets may serve, over a period of time, as a useful indicator of the Airport’s financial position. At December 31, 2010, total net assets were $170,926, a decrease of $36,732 (17.7%) from 2009. Due to the residual Airport Use Agreement, this decrease is mainly due to timing differences between depreciation on property and facilities and cash requirements required for debt service.
The primary sources of Airport operating revenues are landing fees, terminal area use charges, rents and concession revenues as defined within the Use Agreement and Facilities Lease. These revenues fund Airport operating expenses, fund deposits and net debt service requirements. A comparative condensed summary of the Airport’s changes in net assets for the years ended December 31, 2011, 2010, and 2009 is as follows:

- 15 -
2011 2010 2009
Operating revenues: Landing fees and terminal area uses charges 79,445$ 78,194$ 52,640$ Rents, concessions and other 77,926 70,862 69,661
Total operating revenues 157,371 149,056 122,301
Operating expenses: Salaries and wages 43,554 42,105 39,521 Repairs and maintenance 40,732 31,942 37,967 Professional and engineering 15,650 15,832 6,727 Other operating expenses 10,153 18,457 15,426 Depreciation and amortization 51,067 52,767 47,667
Total operating expenses 161,156 161,103 147,308
Operating loss (3,785) (12,047) (25,007)
Nonoperating revenues 61,262 38,860 45,341 Nonoperating expenses (57,016) (63,362) (59,305) Capital grants 3,061 2,461 Change in net assets 3,522$ (34,088)$ (38,971)$
Changes in Net Assets
2011
Landing fees and terminal area use charges for the years 2011 and 2010 were $79,445 and $78,194, respectively. Rents, concessions and other revenues were $77,926 and $70,862 for 2011 and 2010, respectively. The increase in 2011 operating revenues of $8,315 (5.6%) from 2010 was mainly due to increased landing fees and other rentals and fueling fees of $3,284 and $3,490, respectively. Such changes were due to the residual Airport Use Agreement and Facilities Leases that require airline revenue to be recognized to the extent necessary to pay the Airport’s operating and maintenance expenses, net debt service and fund deposit requirements, reduced by non-airline revenues. Concessions increased $3,574 due primarily to an increase in auto parking of $1,263.
Salaries and wages increased by $1,449 (3.4%) in 2011 compared to 2010. Also, repairs and maintenance expenses increased by $8,790 (27.5%) in 2011 compared to 2010. This increase was due to a lower than usual amount in 2010 that resulted from a contract capitalization. Professional and engineering expenses decreased $182 (1.2%) compared to 2010. Other operating expenses decreased $7,891 (77.3%) in 2011 compared to 2010 due to a decrease in the provision for doubtful accounts.
The 2011 nonoperating revenues of $61,262 are comprised of PFC revenue of $36,850, customer facility charges (CFC) revenue of $6,175, interest income of $17,460 and other nonoperating revenues of $777.
Nonoperating expenses of $57,016 and $63,362 for the years 2011 and 2010, respectively, were comprised of bond interest expense.
Capital grants increased $600 in 2011, mainly as a result of when associated expenditures became eligible for grant reimbursement from the federal government.

- 16 -
2010
Landing fees and terminal area use charges for the years 2010 and 2009 were $78,194 and $52,640, respectively. Rents, concessions and other revenues were $70,862 and $69,661 for 2010 and 2009, respectively. The increase in 2010 operating revenues of $26,755 (21.9%) from 2009 was mainly due to increased landing fees and terminal area use charges of $13,359 and $12,195, respectively. Such changes were due to the residual Airport Use Agreement and Facilities Leases that require airline revenue to be recognized to the extent necessary to pay the Airport’s operating and maintenance expenses, net debt service and fund deposit requirements, reduced by non-airline revenues.
Salaries and wages increased by $2,584 (6.5%) in 2010 compared to 2009. Professional and engineering expenses increased by $9,105 (135.4%) mainly due to a reimbursement of costs in 2009 from a deposit forfeiture of $7,578. Depreciation and amortization expense increased $5,100 (10.7%) as a result of the increased capital assets due to the activities of the ongoing Capital Improvement Program.
The 2010 nonoperating revenues of $38,860 are comprised of PFC revenue $34,909, CFC revenue of $5,856, interest income of $1,539 offset by a loss of fair market adjustment of $4,221 and other nonoperating revenues of $777. During 2010, nonoperating revenues decreased 14.3% due to one time other nonoperating revenues recognized in 2009.
Nonoperating expenses of $63,362 and $59,305 for the years 2010 and 2009, respectively, were comprised of bond interest expense.
Capital grants increased $2,461 in 2010, mainly as a result of when associated expenditures became eligible for grant reimbursement from the federal government.
A comparative summary of the Airport’s cash flows for the years ended December 31, 2011, 2010, and 2009 is as follows:
Cash Flows2011 2010 2009
Cash from activities: Operating 25,607$ 42,484$ 43,665$ Capital and related financing (61,510) 161,297 (51,857) Investing (72,239) (96,425) (90,733)
Net change in cash and cash equivalents (108,142) 107,356 (98,925)
Cash and cash equivalents: Beginning of year 249,788 142,432 241,357
End of year 141,646$ 249,788$ 142,432$ 2011
As of December 31, 2011, the Airport’s available cash and cash equivalents of $141,646 decreased by $108,142 compared to $249,788 at December 31, 2010 due to operating activities of $25,607, offset by capital and related financing activities of $61,510 and investing activities of $72,239. Total cash and cash equivalents at December 31, 2011 were comprised of unrestricted and restricted cash and cash equivalents of $35,366 and $106,280, respectively.

- 17 -
2010
As of December 31, 2010, the Airport’s available cash and cash equivalents of $249,788 increased by $107,356 compared to $142,432 at December 31, 2009 due to operating activities of $42,484, capital and related financing activities of $161,297, offset by investing activities of $96,425. Total cash and cash equivalents at December 31, 2010, were comprised of unrestricted and restricted cash and cash equivalents of $21,552 and $228,236, respectively.
CAPITAL ASSET AND DEBT ADMINISTRATION
At the end of 2011 and 2010, the Airport had $1,152,524 and $1,151,315, respectively, invested in net capital assets. During 2011, the Airport had additions of $43,346 related to capital activities. This included $2,159 for land acquisition and the balance of $41,187 for construction projects relating to terminal improvements, parking and runway improvements.
During 2011, completed projects totaling $9,243 were transferred from construction in progress to applicable buildings and other facilities capital account. These major completed projects were related to terminal improvements, along with runway improvements.
The Airport’s capital assets at December 31, 2011, 2010, and 2009 are summarized as follows:
2011 2010 2009
Capital assets not depreciated: Land 109,446$ 107,287$ 106,918$ Construction in progress 52,173 20,229 36,042
Total capital assets not depreciated 161,619 127,516 142,960
Capital assets depreciated: Buildings and other facilities 1,371,443 1,362,200 1,318,793
Less accumulated depreciation for: Buildings and other facilities (380,538) (338,401) (293,557)
Total capital assets depreciated — net 990,905 1,023,799 1,025,236
Total property and facilities — net 1,152,524$ 1,151,315$ 1,168,196$
Capital Assets at Year-end
The Airport’s capital activities are funded through Airport revenue bonds, federal and state grants, PFC and Airport revenue. Additional information on the Airport’s capital assets is presented in Note 5 of the notes to the basic financial statements.
The Airport issued $4,005 of Commercial Paper Notes during 2010 having an interest rate of 0.29% with a maturity date of January 20, 2011. Note proceeds may be used to finance portions of the costs of authorized airport projects and to repay the expenses of issuing the notes.

- 18 -
The Airport’s outstanding debt at December 31, 2011, 2010, and 2009 is summarized as follows ($ in thousands):
2011 2010 2009Revenue bonds and notes payable 1,461,490$ 1,473,380$ 1,266,515$ Unamortized: Bond (discount) premium (281) 8 (8,812) Deferred loss on refunding (6,291) (6,836) (6,899)
1,454,918 1,466,552 1,250,804 Current bonds payable (22,305) (7,885) (54,650)
Total long-term revenue bonds and notes payable – net 1,432,613$ 1,458,667$ 1,196,154$
Outstanding Debt at Year-end
Additional information on the Airport’s long-term debt is presented in Note 4 of the notes to basic financial statements and in the Statistical Information section of this report.
The Airport’s revenue bonds at December 31, 2011 had credit ratings with each of the three major rating agencies as follows:
Moody’sInvestor Standard FitchServices & Poor’s Ratings
First Lien Chicago Midway Revenue Bonds A2 A ASecond Lien Chicago Midway Revenue Bonds A3 A- A-
At December 31, 2011 and 2010 the Airport believes it was in compliance with the debt covenants as stated within the Master Trust Indentures.
ECONOMIC FACTORS AND NEXT YEAR RATES AND CHARGES
The airlines using Chicago Midway International Airport generally provide low fare, point-to-point origination and destination passenger service. During 2011 and 2010, Southwest Airlines accounted for 86.7 and 85.4%, respectively, of total enplanements at the Airport.
Based on the Airport’s rates and charges for 2012, total budgeted operating and maintenance expenses are projected at $125,512 and total net debt service and fund deposit requirements are projected at $45,976. Additionally, 2012 non-airline and non-signatory revenues are budgeted for $67,279, resulting in a net airline requirement of $104,209 that will be funded through landing fees, terminal area use charges, and fueling system charges.
REQUESTS FOR INFORMATION
This financial report is designed to provide the reader with a general overview of the Airport’s finances. Questions concerning any of the information provided in this report or requests for additional financial information should be addressed to the City of Chicago Comptroller’s Office.

- 19 -
CITY OF CHICAGO, ILLINOISCHICAGO MIDWAY INTERNATIONAL AIRPORT
STATEMENTS OF NET ASSETSAS OF DECEMBER 31, 2011 AND 2010($ in thousands)
2011 2010 2011 2010ASSETS AND DEFERRED OUTFLOWS LIABILITIESCURRENT ASSETS: CURRENT LIABILITIES: Cash and cash equivalents (Note 2) 35,366$ 21,552$ Accounts payable and accrued liabilities 12,443$ 16,645$ Investments (Note 2) 26,709 44,917 Due to other City funds 7,516 6,373 Accounts receivable — net of allowance for doubtful accounts Advances for terminal and hangar rent 2,534 2,214 of approximately $365 in 2011 and $4,275 in 2010 12,211 10,235 Deferred revenue 18,943 32,908 Due from other City funds 2,119 1,051 Prepaid expenses 2,175 299 Total current liabilities 41,436 58,140 Interest receivable 81 126
LIABILITIES PAYABLE FROM RESTRICTED ASSETS (Note 3): Total current assets 78,661 78,180 Current portion of revenue bond payable (Note 4) 22,305 7,885
Interest rate swap premium (Note 4) 13,854 14,631 RESTRICTED ASSETS (Note 3): Accounts payable 35,062 13,043 Cash and cash equivalents (Note 2) 106,280 228,236 Due to other City funds 308 374 Investments (Note 2) 286,015 189,161 Interest payable 28,162 24,604 Due from other governments 2,732 1,857 Due from other City funds 13 Total liabilities payable from restricted assets 99,691 60,537 Accounts receivable (Note 1) 5,169 2,767 Interest receivable 463 457 NONCURRENT LIABILITIES:
Revenue bonds payable — net of discount (Note 4) 1,432,613 1,454,662 Total restricted assets 400,659 422,491 Capital lease 9,036 9,408
Notes payable — commercial papers 4,005 NONCURRENT ASSETS: Derivative instrument 35,000 20,077 Other assets — deferred noise mitigation program costs and financing fees 118,733 110,873 Total non current liabilities 1,476,649 1,488,152
Property and facilities (Note 5): Total liabilities 1,617,776 1,606,829 Land 109,446 107,287 Buildings and other facilities 1,371,443 1,362,200 NET ASSETS (Note 1): Construction in progress 52,173 20,229 Invested in capital assets — net of related debt (70,876) (39,755) Total property and facilities 1,533,062 1,489,716 Restricted net assets:
Debt service 19,976 11,860 Less accumulated depreciation 380,538 338,401 Capital projects 12,661 11,438 Passenger facility charges 5,177 5,437 Property and facilities — net 1,152,524 1,151,315 Airport use agreement 23,943 24,744
Noise mitigation program 110,691 102,429 Deferred outflows 35,000 14,896 Other assets 35,652 34,733 Derivatives instrument 6,647
Total restricted net assets 208,100 190,641 Total non current assets 1,312,904 1,277,084
Unrestricted net assets 37,224 20,040
Total net assets 174,448 170,926
TOTAL 1,792,224$ 1,777,755$ TOTAL 1,792,224$ 1,777,755$
See notes to basic financial statements.

- 20 -
CITY OF CHICAGO, ILLINOISCHICAGO MIDWAY INTERNATIONAL AIRPORT STATEMENTS OF REVENUES, EXPENSES AND CHANGES IN NET ASSETSFOR THE YEARS ENDED DECEMBER 31, 2011 AND 2010($ in thousands)
2011 2010
OPERATING REVENUES: Landing fees and terminal area use charges (Note 1) 79,445$ 78,194$ Rents, concessions and other (Note 6) 77,926 70,862
Total operating revenues 157,371 149,056
OPERATING EXPENSES (Notes 7 and 8): Salaries and wages 43,554 42,105 Repairs and maintenance 40,732 31,942 Professional and engineering services 15,650 15,832 Other operating expenses 10,153 18,457
Total operating expenses before depreciation and amortization 110,089 108,336
Depreciation and amortization 51,067 52,767
Total operating expenses 161,156 161,103
OPERATING LOSS (3,785) (12,047)
NONOPERATING REVENUES (EXPENSES): Passenger facility charges revenues 36,850 34,909 Customer facility charges revenues 6,175 5,856 Interest (loss) income 17,460 (2,682) Interest expense (Note 4) (57,016) (63,362) Other nonoperating revenues 777 777
Total nonoperating revenues (expenses) 4,246 (24,502)
GAIN (LOSS) BEFORE CAPITAL GRANTS 461 (36,549)
CAPITAL GRANTS (Note 1) 3,061 2,461
CHANGE IN NET ASSETS 3,522 (34,088)
TOTAL NET ASSETS — Beginning of year 170,926 205,014
TOTAL NET ASSETS — End of year 174,448$ 170,926$
See notes to basic financial statements.

- 21 -
CITY OF CHICAGO, ILLINOISCHICAGO MIDWAY INTERNATIONAL AIRPORT STATEMENTS OF CASH FLOWSFOR THE YEARS ENDED DECEMBER 31, 2011 AND 2010($ in thousands)
2011 2010
CASH FLOWS FROM OPERATING ACTIVITIES: Landing fees and terminal area use charges 69,436$ 80,559$ Rents, concessions and other 68,428 69,479 Payments to vendors (68,185) (67,484) Payments to employees (35,997) (33,752) Transactions with other City funds — net (8,075) (6,318)
Cash flows provided by operating activities 25,607 42,484
CASH FLOWS FROM CAPITAL AND RELATED FINANCING ACTIVITIES: Proceeds from issuance of bonds 327,015 Proceeds from issuance of notes 4,005 Payments to refund commercial paper (4,005) (61,360) Acquisition and construction of capital assets (15,230) (34,512) Grant receipts 2,186 604 Bond issuance costs (2,041) Principal paid on bonds (7,885) (54,729) Interest paid (60,037) (55,472) Cash paid for noise mitigation program (18,210) (3,049) Principal payments on capital lease obligation (372) (344) Passenger facility charges revenues 34,510 36,744 Customer facility charges revenues 6,113 5,856 Collateral deposit payment 1,420 (1,420)
Cash flows (used in) provided by capital and related financing activities (61,510) 161,297
CASH FLOWS FROM INVESTING ACTIVITIES: Purchases of investments — net (81,418) (97,746) Investment interest 9,179 1,321
Cash flows used in investing activities (72,239) (96,425)
NET CHANGE IN CASH AND CASH EQUIVALENTS (108,142) 107,356
CASH AND CASH EQUIVALENTS — Beginning of year 249,788 142,432
CASH AND CASH EQUIVALENTS — End of year 141,646$ 249,788$
(Continued)

- 22 -
CITY OF CHICAGO, ILLINOISCHICAGO MIDWAY INTERNATIONAL AIRPORT STATEMENTS OF CASH FLOWS FOR THE YEARS ENDED DECEMBER 31, 2011 AND 2010($ in thousands)
2011 2010
RECONCILIATION OF CASH AND CASH EQUIVALENTS REPORTED ON THE STATEMENTS OF NET ASSETS: Unrestricted 35,366$ 21,552$ Restricted 106,280 228,236
TOTAL 141,646$ 249,788$
RECONCILIATION OF OPERATING LOSS TO CASH PROVIDED BY OPERATING ACTIVITIES: Operating loss (3,785)$ (12,047)$ Adjustments to reconcile operating loss to cash flows from operating activities: Depreciation and amortization 51,067 52,767 Provision for uncollectible accounts (3,886) 3,369 Changes in assets and liabilities: Decrease in accounts receivable (136) (1,673) Increase in due from other City funds 76 2,513 Decrease in prepaid expenses (1,876) (277) Decrease in due to other City funds (53) (1,023) (Decrease) increase in deferred revenue (4,218) 1,475 Increase (decrease) in advances for terminal and hangar rent 320 (2,190) Decrease in accounts payable and accrued liabilities (11,902) (430)
CASH FLOWS FROM OPERATING ACTIVITIES 25,607$ 42,484$
SUPPLEMENTAL DISCLOSURE OF NONCASH ITEMS: Property additions in 2011 and 2010 of $30,204 and $24,271, respectively, are included in accounts payable.
The fair market value adjustments gain (loss) to investments for 2011 and 2010 were $288 and $(2,572), respectively.
See notes to basic financial statements. (Concluded)

- 23 -
CITY OF CHICAGO, ILLINOIS CHICAGO MIDWAY INTERNATIONAL AIRPORT
NOTES TO BASIC FINANCIAL STATEMENTS AS OF AND FOR THE YEARS ENDED DECEMBER 31, 2011 AND 2010
1. ORGANIZATION AND SUMMARY OF SIGNIFICANT ACCOUNTING POLICIES
Organization — Chicago Midway International Airport (Airport) is operated by the City of Chicago (City) Department of Aviation. The Airport is included in the City’s reporting entity as an Enterprise Fund. The City is a member of the Chicago-Gary Regional Airport Authority, which was created in 1995 to address the air transportation needs of the Chicago-Northwest Indiana Region. The Airport is subject to the provisions of the Airport Use Agreement and Facilities Lease (Use Agreement) which is a residual use agreement that is scheduled to terminate on December 31, 2012. Airport management anticipates that a new Airport Use Agreement and Facilities Lease will be in place by December 31, 2012.
Basis of Accounting and Measurement Focus — The accounting policies of the Airport are based upon accounting principles generally accepted in the United States of America, as prescribed by the Governmental Accounting Standards Board (GASB). The accounting and financial reporting treatment applied to a fund is determined by its measurement focus. The accounts of the Airport are reported using the flow of economic resources measurement focus.
The Airport uses the accrual basis of accounting, under which revenues are recognized when earned and expenses are recognized when incurred. Enterprise funds may elect to apply Financial Accounting Standards Board (FASB) pronouncements issued after November 30, 1989, provided that such standards are not in conflict with standards issued by the GASB. The Airport has elected not to apply FASB pronouncements issued after November 30, 1989.
Annual Appropriated Budget — The Airport has a legally adopted annual budget, which is not required to be reported.
Management’s Use of Estimates — The preparation of financial statements in conformity with accounting principles generally accepted in the United States of America requires management to make estimates and assumptions that affect the reported amounts of assets and liabilities and the disclosure of contingent assets and liabilities at the date of the basic financial statements, and the reported amounts of revenues and expenses during the reporting period. Actual results could differ from the estimates.
Cash, Cash Equivalents and Investments — Cash, cash equivalents and investments generally are held with the City Treasurer as required by the Municipal Code of Chicago (Code). Interest earned on pooled investments is allocated to participating funds based upon their average combined cash and investment balances. Due to contractual agreements or legal restrictions, the cash and investments of certain funds are segregated and earn and receive interest directly.
The Code permits deposits only to City Council-approved depositories, which must be regularly organized state or national banks and federal and state savings and loan associations, located within the City, whose deposits are federally insured.
Investments authorized by the Code include interest-bearing general obligations of the City, the State of Illinois (State), and the U.S. government; U.S. Treasury bills and other non-interest-bearing general

- 24 -
obligations of the U.S. government purchased in the open market below face value; domestic money market mutual funds regulated by, and in good standing with, the Securities and Exchange Commission and tax anticipation warrants issued by the City. The City is prohibited by ordinance from investing in derivatives, as defined, without City Council approval.
The Airport values its investments at fair value or amortized cost as applicable. U.S. government securities purchased at a price other than par with a maturity of less than one year are reported at amortized cost.
Repurchase agreements can be purchased only from banks and certain other institutions authorized to do business in the State. The City Treasurer requires that securities pledged to secure these agreements have a market value equal to the cost of the repurchase agreements plus accrued interest.
Investments generally may not have a maturity in excess of 10 years from the date of purchase. Certain other investment balances are held in accordance with the specific provisions of applicable bond ordinances.
Cash equivalents include certificates of deposit and other investments with maturities of three months or less when purchased.
Accounts Receivable Allowance — Management has provided an allowance based on amounts recorded at year-end, which may be uncollectible.
Revenues and Expenses — Revenues from landing fees, terminal area use charges, fueling system charges, parking revenue and concessions are reported as operating revenues. Transactions that are related to financing, investing and passenger facility charges (PFCs) are reported as nonoperating revenues. Salaries and wages, repair and maintenance, professional and engineering services and other expenses that relate to Airport operations are reported as operating expenses. Interest expense, PFC expenses and financing costs are reported as nonoperating expenses.
Transactions with the City — The City’s general fund provides services to the Airport. The amounts allocated to the Airport for these services are treated as operating expenses and consist mainly of employee benefits, self-insured risks and administrative expenses.
Other Assets — Funds expended for the Noise Mitigation Program are recorded as other assets and amortized over a 20-year useful life on a straight-line basis. The amounts reflected in restricted net assets only includes amounts previously expended.
Property and Facilities — Property and facilities are recorded at cost or, for donated assets, at market value at the date of acquisition. Expenditures greater than $5,000 for the acquisition, construction or equipping of capital projects, together with related design, architectural and engineering fees, are capitalized. Expenditures for vehicles and other movable equipment are expensed as incurred.
Depreciation and amortization are provided using the straight-line method and begin in the year following the year of acquisition or completion. Estimated useful lives are as follows:
Facilities and structures 40 yearsRunways, aprons, tunnels, taxiways, and paved roads 30 yearsOther 10–30 years
Net Assets — Net Assets comprise the net earnings from operating and nonoperating revenues, expenses and capital grants. Net assets are displayed in three components — invested in capital assets, net of related debt; restricted for debt service, capital projects, PFC, airport use agreement requirements,

- 25 -
noise mitigation program and other assets; and unrestricted. Invested in capital assets, net of related debt consists of all capital assets, net of accumulated depreciation and reduced by outstanding debt net of debt service reserve and unspent proceeds. Restricted net assets consist of net assets for which constraints are placed thereon by external parties (such as lenders and grantors) and laws, regulations and enabling legislation. Unrestricted net assets consist of all other net assets not categorized as either of the above.
Employee Benefits — Employee benefits are granted for vacation and sick leave, workers’ compensation and health care. Unused vacation leave is accrued and may be carried over for one year. Sick leave is accumulated at the rate of one day for each month worked, up to a maximum of 200 days. Severance of employment terminates all rights to receive compensation for any unused sick leave. Sick leave pay is not accrued. Employee benefit claims outstanding, including claims incurred but not reported, are estimated and recorded as liabilities. The Airport maintains insurance from a commercial carrier for workers’ compensation claims. Settlements in each of the past three years have been less than insurance coverage maintained.
Employees are eligible to defer a portion of their salaries until future years under the City’s deferred compensation plan created in accordance with Internal Revenue Code Section 457. The deferred compensation is not available to employees until termination, retirement, death or unforeseeable emergency. The plan is administered by third-party administrators who maintain the investment portfolio. The plan’s assets have been placed in trust accounts with the plan administrators for the exclusive benefit of participants and their beneficiaries and are not considered assets of the City.
The City is subject to the State of Illinois Unemployment Compensation Act and has elected the reimbursing employer option for providing unemployment insurance benefits for eligible former employees. Under this option, the City reimburses the State for claims paid by the State.
Bond Issuance Costs, Bond Discounts and Refunding Transactions — Bond issuance costs and bond discounts are deferred and amortized over the life of the related debt, except in the case of refunding debt transactions where the amortization period is over the term of the refunding or refunded debt, whichever is shorter.
Capitalized Interest — Interest expense and income earned on construction bond proceeds are capitalized during construction on those capital projects paid for from the bond proceeds and are being amortized over the depreciable lives of the related assets on a straight-line basis.
Capital Grants — The Airport reports capital grants as revenue on the statements of revenues, expenses and changes in net assets. Capital grants are on a reimbursement basis and revenues are recognized to the extent of allowable expenditures.
Revenue Recognition — Landing fees and terminal area use charges and fueling system charges are assessed to the various airlines throughout each year based on estimated rates. Such rates are designed to yield collections from airlines adequate to cover certain expenses and required debt service and fund deposits as determined under provisions of the Airport Use Agreement and Facilities Leases (Use Agreement). Incremental amounts due from the airlines arise when amounts assessed, based on the estimated rates used during the year, are less than actual expenses and required deposits for the year. Such incremental amounts due from airlines are included in accrued revenue. Incremental amounts due to the airlines arise when amounts assessed, based on the estimated rates used during the year, exceed actual expenses and required deposits for the year. Such incremental amounts due to airlines are included in deferred revenue.

- 26 -
PFC Revenue — Effective January 1, 2007, the Federal Aviation Administration (FAA) approved PFCs of $4.50 per eligible enplaned passenger, less allowable airline administrative costs of $.11 per eligible enplaned passenger. PFCs are available, subject to FAA regulation and approval, to finance specific eligible capital projects. The City reports PFC revenue as nonoperating.
Customer Facility Charge (CFC) Revenue — The Airport imposed a CFC of $3.75 per contract day on each customer for motor vehicle rentals at the Airport for the years ended December 31, 2011 and 2010. CFCs are available to finance specific eligible capital projects. The City reports CFC revenue as nonoperating revenue and related noncapital expenses as nonoperating expenses in conformity with industry practice.
Adopted Accounting Standards — In June 2008, the Government Accounting Standards Board (GASB) issued GASB Statement No. 53, Accounting and Financial Reporting for Derivatives Instruments. The Airport implemented GASB Statement No. 53 on January 1, 2010. This statement enhances the usefulness and comparability of derivative instrument information reported by state and local governments by providing a comprehensive framework for the recognition, measurement, and disclosure of derivative instrument transactions. Derivative instruments such as interest rate and commodity swaps, interest rate locks, options (caps, floors, and collars), swaptions, forward contracts, and futures contracts are entered into by governments as investments; as hedges of identified financial risks associated with assets or liabilities, or expected transactions (i.e., hedgeable items); to lower the costs of borrowings; to effectively fix cash flows or synthetically fix prices; or to offset the changes in fair value of hedgeable items. A key provision of GASB Statement No. 53 is that certain derivative instruments, with the exception of synthetic guaranteed investment contracts that are fully benefit-responsive, are reported at fair value by governments in their financial statements. GASB Statement No. 53 requires that the provisions of this statement should be applied retroactively by restating financial statements for all periods presented.
2. RESTRICTED AND UNRESTRICTED CASH AND CASH EQUIVALENTS AND INVESTMENTS
Investments —U.S. agencies include investments in government-sponsored enterprises such as Federal National Mortgage Association, Federal Home Loan Banks, and Federal Home Loan Mortgage Corp. The Airport as of December 31, 2011, had the following investments ($ in thousands):
More Investment Type Less Than 1 1–5 6–10 Than 10 Fair Value
U.S. treasuries - $ - $ - $ - $ - $ U.S. agencies 6,502 288,969 6,219 301,690 Commercial paper 22,583 22,583 Corporate bonds 1,898 1,898 Municipal bonds 9,123 9,123 Certificates of deposits and other short-term 140,724 140,724
Subtotal 169,809$ 299,990$ 6,219$ - $ 476,018
Share of City’s pooled funds 15
Total 476,033$
Investment Maturities (in Years)

- 27 -
Investments — U.S. agencies include investments in government-sponsored enterprises such as Federal National Mortgage Association, Federal Home Loan Banks, and Federal Home Loan Mortgage Corp. The Airport as of December 31, 2010, had the following investments ($ in thousands):
More Investment Type Less Than 1 1–5 6–10 Than 10 Fair Value
U.S. treasuries - $ - $ - $ - $ - $ U.S. agencies 85,275 180,826 10,567 276,668 Certificates of deposits and other short-term 219,094 219,094
Subtotal 304,369$ 180,826$ 10,567$ - $ 495,762
Share of City’s pooled funds 11
Total 495,773$
Investment Maturities (in Years)
Interest Rate Risk — As a means of limiting its exposure to fair value losses arising from rising interest rates, the City’s investment policy requires that investments generally may not have a maturity date in excess of 10 years from the date of purchase. Certain other investments are held in accordance with the specific provisions of applicable ordinances.
Credit Risk — The Code limits investments in commercial paper to banks whose senior obligations are rated in the top two rating categories by at least two national rating agencies and who are required to maintain such rating during the term of such investment. The Code also limits investments to domestic money market mutual funds regulated by, and in good standing with, the Securities and Exchange Commission. Certificates of deposit are also limited by the Code to national banks, which provide collateral of at least 105% by marketable U.S. government securities marked to market at least monthly; or secured by a corporate surety bond issued by an insurance company licensed to do business in Illinois and having a claims-paying rating in the top rating category, as rated by a nationally recognized statistical rating organization maintaining such rating during the term of such investment. The Airport’s exposure to credit risk at December 31, 2011 and 2010, is as follows ($ in thousands):
Quality Rating 2011 2010
Aaa/AAA 6,890$ 495,762$ Aa/A 305,821 A/AP1/A1 22,583 Not rated 140,724
Total funds 476,018$ 495,762$ The Airport participates in the City’s pooled cash and investments account, which includes amounts from other City funds and is maintained by the City Treasurer. Individual cash or investments are not specifically identifiable to any participant in the pool. The City Treasurer’s pooled fund is included in the City’s Comprehensive Annual Financial Statements.
Custodial Credit Risk — Cash and Certificates of Deposit — This is the risk that in the event of a bank failure, the City’s deposits may not be returned. The City’s investment policy states that in order to protect the City deposits, depository institutions are to maintain collateral pledges on City deposits

- 28 -
during the term of the deposit of at least 105% of marketable U.S. government, or approved securities or surety bonds, issued by top-rated insurers. Collateral is required as security whenever deposits exceed the insured limits of the Federal Deposit Insurance Corporation. The bank balance of cash and certificates of deposit with the City’s various municipal depositories were $478.9 million and $211.0 million at December 31, 2011 and 2010, respectively. Of the bank balance, $478.9 million and $211.0 million or 100% and 100% at December 31, 2011 and 2010, respectively, were either insured or collateralized.
The investments reported in the basic financial statements at December 31, 2011 and 2010, is summarized as follows ($ in thousands):
2011 2010Per Note 2: Investments — Airport 476,018$ 495,762$ Investments — City Treasurer Pooled Fund 15 11
476,033$ 495,773$ Per basic financial statements: Restricted investments 286,015$ 189,161$ Unrestricted investments 26,709 44,917 Investments included as cash and cash equivalents on the statements of net assets 163,309 261,695
476,033$ 495,773$
3. RESTRICTED ASSETS
There are various limitations and restrictions contained in the Master Indenture of Trust securing the Chicago Midway Airport Revenue Bonds (First Lien Master Indenture) and the Master Indenture of Trust securing the Chicago Midway Airport Second Lien Obligation (Second Lien Master Indenture) and together with the First Lien Master Indenture (Master Indentures), the Use Agreement and federal regulations contain various limitations and restrictions, which, among other things, require the creation and maintenance of separate accounts, certain of which must be held by a trustee and into which required deposits are made by the Airport on a periodic basis to fund construction, debt retirement, operation and maintenance and contingencies.

- 29 -
Restricted cash, cash equivalents and investment balances in accordance with the Master Indenture requirements at December 31, 2011 and 2010, are as follows ($ in thousands):
Account 2011 2010Construction 158,373$ 190,393$ Capitalized interest 4,817 9,334 Debt service 63,778 49,534 Debt service reserve 102,798 102,798 Operation and maintenance reserve 19,651 19,283 Repair and replacement 4,303 5,083 Emergency reserve 385 367 Customer facility charge (CFC) 27,103 25,410 Other 11,087 12,532 Subtotal — Master Indentures and Use Agreement accounts 392,295 414,734 Passenger facility charges (PFC) 2,663 Total 392,295$ 417,397$
December 31
Construction and capitalized interest accounts, which are funded with bond proceeds, are restricted to pay authorized capital improvements and related interest costs during construction.
Required deposits are made by the Airport from revenues collected after funding deposits to an operation and maintenance account in the following priority on a monthly basis:
• The debt service account is restricted to the payment of debt service.
• The operation and maintenance reserve account is restricted to make loans to the operation and maintenance account, as needed, which are to be repaid as the funds become available.
The debt service reserve account requirement was funded upon issuance of the Series 1996 first lien bonds, the Series 1998 first lien bonds, the Series 1998 second lien bonds, the Series 2004 second lien bonds and the Series 2010 second lien bonds with a cash deposit. The debt service reserve account is restricted to the payment of debt service in the event that the balance in the debt service account is insufficient.
The junior lien obligation debt service fund is required to be established to record all transactions associated with junior lien obligations per the First Lien Master Indenture.
The repair and replacement account must be used for paying the cost of maintenance expenditures, such as costs incurred for major repairs, renewals and replacements at the Airport whether caused by normal wear and tear or by unusual and extraordinary occurrences.
The emergency reserve account is restricted to make payments for certain purposes, including terminal area use charges, landing fees and certain other charges that are deemed uncollectible and also for any judgments or settlements against the Airport.

- 30 -
The City has entered into arbitrage agreements under which the City has agreed to comply with certain requirements of the Internal Revenue Code of 1986, as amended, in order to maintain the exclusion of the interest on the bonds from the gross income of the recipients thereof for federal income tax purposes. The rebate account relating to each series of the bonds has been established to account for any liability of the City to make arbitrage rebate payments to the federal government relating to such series of bonds.
The special projects account is restricted to make payments of certain airline-approved capital expenditures.
The CFC is for permitted costs and purposes related to the consolidated rental car facility.
The PFC account is restricted to fund eligible and approved PFC projects.
Other funds include the federal and state grant funds, the security for payment fund and the Airport development fund.
At December 31, 2011 and 2010, the Airport believes it was in compliance with the funding requirements and restrictions as stated in the Master Indentures.

- 31 -
4. LONG-TERM DEBT (BEING REVIEWED BY OUR DEBT MANAGEMENT DIVISION)
Long-term debt at December 31, 2011 and 2010, consisted of the following ($ in thousands):
2011 2010
First lien bonds: $148,820 Series 1996 A Chicago Midway Airport Revenue Bonds, issued November 7, 1996, due through 2029, interest at 4.8%–6.0% 58,420$ 58,420$ $105,220 Series 1996 B Chicago Midway Airport Revenue Bonds, issued November 7, 1996, due through 2029, interest at 4.9%–6.5% 82,115 82,115 $397,715 Series 1998 A, B, and C Chicago Midway Airport Revenue Bonds, issued September 10, 1998, due through 2035, interest at 4.3%–5.5% 376,925 379,070 $295,855 Series 2001 A and B Chicago Midway Airport Revenue Bonds, issued September 13, 2001, due through 2031, interest at 5.0%–5.5% 262,745 263,990
Subtotal — first lien bonds 780,205 783,595
Second lien bonds: $171,000 Series 1998 A and B Chicago Midway Airport Second Lien Revenue Bonds, issued September 16, 1998, due through 2029, variable floating interest rate (.09% at December 31, 2011) 132,525 132,525 $22,000 Series 2002 A Chicago Midway Airport Second Lien Revenue Bonds, issued February 13, 2002, fully refunded on May 6, 2010 $77,565 Series 2004 A and B Chicago Midway Airport Second Lien Revenue Bonds, issued December 14, 2004, due through 2024, interest rate at 3.20%–5.00% 69,595 74,090 $152,150 Series 2004 C and D Chicago Midway Airport Second Lien Revenue Bonds, issued December 14, 2004, due through 2035, interest rate at 4.174% and 4.247% 152,150 152,150 $22,000 Series 2010 A-1 Chicago Midway Airport Second Lien Revenue Bonds, issued May 6, 2010, due through 2021, variable floating interest rate (.10% at December 31, 2011) 22,000 22,000 $58,475 Series 2010 A-2 Chicago Midway Airport Second Lien Revenue Bonds, issued May 6, 2010, due through 2025, variable floating interest rate (.09% at December 31, 2011) 58,475 58,475 $84,000 Series 20010 B Chicago Midway Airport Second Lien Revenue Bonds, issued October 26, 2010, due through 2034, interest rate at 5.00% to 5.34% 84,000 84,000 $63,470 Series 20010 C Chicago Midway Airport Second Lien Revenue Bonds, issued October 26, 2010, due through 2041, interest rate at 3.782%–7.168% 63,470 63,470 $82,610 Series 20010 D-1 Chicago Midway Airport Second Lien Revenue Bonds, issued October 26, 2010, due through 2041, interest rate at 3.532%–5.340% 82,610 82,610 $16,460 Series 20010 D-2 Chicago Midway Airport Second Lien Revenue Bonds, issued October 26, 2010, due through 2041, interest rate at 3.532%–5.340% 16,460 16,460
Subtotal — second lien bonds 681,285 685,780
Commercial paper notes — Series A,B,C, and D 4,005
Total revenue bonds and notes 1,461,490 1,473,380
Unamortized premium (discount) (281) 8 Unamortized deferred loss on bond refunding (6,291) (6,836)
1,454,918 1,466,552
Current portion (22,305) (7,885)
Total long-term revenue bonds payable 1,432,613$ 1,458,667$

- 32 -
Long-term debt during the years ended December 31, 2011 and 2010, changed as follows ($ in thousands):
Balance Balance Due WithinJanuary 1, December 31, One
2011 Additions Reductions 2011 Year
Revenue bonds 1,469,375$ - $ (7,885)$ 1,461,490$ 22,305$ Unamortized premium (discount) 8 (962) 673 (281) Deferred (loss) gain on refunding (6,836) 545 (6,291)
Total revenue bonds 1,462,547 (962) (6,667) 1,454,918 22,305
Commercial paper 4,005 (4,005)
Total long-term debt 1,466,552$ (962)$ (10,672)$ 1,454,918$ 22,305$
Balance Balance Due WithinJanuary 1, December 31, One
2010 Additions Reductions 2010 Year
Revenue bonds 1,205,155$ 327,015$ (62,795)$ 1,469,375$ 7,885$ Unamortized (discount) premium (8,812) (467) 9,287 8 Deferred (loss) gain on refunding (6,899) (470) 533 (6,836)
Total revenue bonds 1,189,444 326,078 (52,975) 1,462,547 7,885
Commercial paper 61,360 4,005 (61,360) 4,005
Total long-term debt 1,250,804$ 330,083$ (114,335)$ 1,466,552$ 7,885$
Interest expense capitalized for 2011 and 2010 totaled $6.83 million and $2.01 million, respectively. Interest income capitalized for 2011 and 2010 totaled $.74 million and $.77 million, respectively. Interest expense includes amortization of the deferred loss on bond refunding for 2011 and 2010 of $.54 million and $.53 million, respectively, and amortization of $.29 million of premium, net and $.28 million of discount, respectively.
Issuance of Debt — In May 2010, the Airport sold $22.0 million of Chicago Midway Airport Second Lien Revenue Refunding Bonds, Series 2010A-1 (Taxable). The bonds have an initial variable interest rate of 0.29%. The Series 2010A-1 Second Lien Bonds are not subject to mandatory sinking fund redemption prior to maturity. The bonds mature in their entirely on January 1, 2021. The net proceeds of $22.0 million were used to refund the outstanding of the Series 2002A Second Lien Bonds ($17.6 million) and to pay a portion of the outstanding Commercial Paper Notes ($4.4 million).
In May 2010, the Airport sold $58.5 million of Chicago Midway Airport Second Lien Revenue Refunding Bonds, Series 2010A-2 (Taxable). The bonds have an initial variable interest rate of 0.29% The Series 2010A-2 Second Lien Bonds are not subject to mandatory sinking fund redemption prior to maturity. The bonds mature in their entirely on January 1, 2025. Certain proceeds of $10.25 million were deposited in an escrow account to defease a portion of the Series 1996 B First Lien Bonds ($2.58 million of principal and $0.07 million of interest), a portion of the Series 1998 A First Lien Bonds ($0.78 million of principal, $0.01 million of premium and $0.02 million of interest), a portion of the Series 1998 B First Lien Bonds ($0.43 million of principal and $0.01 million of interest), a portion of the Series 2001A First Lien Bonds ($5.49 million of principal and $0.27 million of interest) and a portion of the Series 2001 B First Lien Bonds ($0.58 million of principal and $0.03 million of interest); certain proceeds of $43.82 million were used to pay a portion of the outstanding Commercial Paper

- 33 -
Notes; certain proceeds of $0.39 million were used to fund capitalized interest deposit requirement; certain proceeds of $4.0 million were used to fund debt service reserve requirement and certain proceeds of $0.03 million were used to pay the cost of issuance of the bonds. The advance refunding resulted in a difference between the reacquisition price and the net carrying amount of the refunded debt of $0.5 million that will be charged to operation over 16 years using the straight-line method. The advance refunding decreased the Airport’s total debt service payments by $6.6 million and resulted in an economic gain (difference between the present value of the old debt and the new debt service payments) of $0.9 million.
In October 2010, the Airport sold $84.0 million of Chicago Midway Airport Second Lien Revenue Bonds, Series 2010 B (Non-AMT) at a premium of $8.5 million. The bonds have an initial interest rate of 5.0% and have a mandatory tender date on January 1, 2015. Certain proceeds of $69.0 million will be used to finance the costs of the residential sound projects; certain proceeds of $7.4 million were used to pay a portion of the outstanding Commercial Paper Notes; certain proceeds of $8.2 million were used to fund capitalized interest deposit requirement; certain proceeds of $7.1 million were used to fund debt service reserve requirement and certain proceeds of $0.8 million were used to pay the cost of issuance of the bonds.
In October 2010, the Airport sold $63.5 million of Chicago Midway Airport Second Lien Revenue Bonds, Series 2010 C (Taxable). The bonds have interest rates ranging from 3.782% to 7.168% and maturity and mandatory redemption maturity dates ranging from January 1, 2016 to January 1, 2041. Certain Series 2010C Second Lien Revenue Bonds are subject to mandatory sinking fund redemption prior to maturity. Certain proceeds of $62.9 million will be used to finance the costs of the rental car facilities and certain proceeds of $0.6 million were used to pay the cost of issuance of the bonds.
In October 2010, the Airport sold $82.6 million of Chicago Midway Airport Second Lien Revenue Bonds, Series 2010 D-1 (Taxable). The bonds have an initial interest rate of 3.532% and have a mandatory tender date on January 1, 2014. Certain proceeds of $36.9 million will be used to finance the costs of the various airport projects; certain proceeds of $37.3 million were used to pay a portion of the outstanding Commercial Paper Notes; certain proceeds of $1.7 million were used to fund the capitalized interest deposit requirement; certain proceeds of $6.0 million were used to fund the debt service reserve requirement and certain proceeds of $0.7 million were used to pay the cost of issuance of the bonds.
In October 2010, the Airport sold $16.4 million of Chicago Midway Airport Second Lien Revenue Bonds, Series 2010 D-2 (Taxable). The bonds have an initial interest rate of 3.532% and have a mandatory tender date on January 1, 2014. Certain proceeds of $1.2 million were used to fund the debt service reserve requirement; certain proceeds of $12.5 million were used to fund the various debt service reserve accounts requirement; certain proceeds of $2.6 million were used to fund the coverage account deposit requirement and certain proceeds of $0.1 million were used to pay the cost of issuance of the bonds.
Chicago Midway International Airport Commercial Paper Notes, Series A, B, C, and D ($100.0 million maximum aggregated authorized) outstanding at December 31, 2011 and 2010, were $0 and 4.0 million, respectively. Note proceeds may be used to finance portions of the costs of authorized airport projects and to repay the expenses of issuing the notes. An irrevocable letter of credit (LOC) ($111.3 million) provides for the timely payment of principal and interest on the notes until July 12, 2014. Amounts paid by drawing on the LOC shall be reimbursed by the Airport on said day paid; any amounts not reimbursed shall constitute an advance and will bear interest at the greater of the most recent prime rate or the federal funds rate, plus 0.5% (Base Rate). Advances outstanding greater than 180 days will bear interest at the Base Rate, plus 1% beginning on the 180-first day after such advance is made. At December 31, 2011 and 2010, there were no outstanding LOC advances.

- 34 -
Debt Redemption — Following is a schedule of debt service requirements to maturity of the first lien bonds ($ in thousands):
Years EndingDecember 31 Principal Interest Total
2012 13,945$ 40,417$ 54,362$ 2013 14,710 39,633 54,343 2014 15,505 38,819 54,324 2015 16,330 37,946 54,276 2016 17,245 37,024 54,269 2017–2021 101,415 169,537 270,952 2022–2026 165,330 135,384 300,714 2027–2031 249,400 82,217 331,617 2032–2036 186,325 19,533 205,858
Total 780,205$ 600,510$ 1,380,715$
Following is a schedule of debt service requirements to maturity of the second lien bonds. For issues with variable rates, interest is imputed at the percent rate effective at December 31, 2011 ($ in thousands):
Years EndingDecember 31 Principal Interest Total
2012 8,360$ 15,661$ 24,021$ 2013 8,765 15,433 24,198 2014 9,160 16,073 25,233 2015 9,635 16,839 26,474 2016 15,570 16,561 32,131 2017–2021 112,500 73,307 185,807 2022–2026 142,350 56,691 199,041 2027–2031 226,505 41,784 268,289 2032–2036 96,010 23,847 119,857 2037–2041 52,430 8,382 60,812
Total 681,285$ 284,578$ 965,863$
The Airport’s second lien variable rate bonds may bear interest from time to time at a flexible rate, a daily rate, a weekly rate, an adjustable long rate or the fixed rate as determined from time to time by the remarketing agent, in consultation with the City. At December 31, 2011, the Series 1998 A&B bonds, the Series 2010 A-1 and 2010 A-2 bonds were in a daily rate interest mode and the Series 2004 C&D bonds were in a weekly rate interest mode. An irrevocable LOC ($193.2 million) provides for the timely payment of principal and interest on the Series 1998 A&B and the Series 2010A-2 bonds until November 25, 2013. An irrevocable LOC ($176.1 million) provides for the timely payment of principal and interest on the Series 2004 C&D and the Series 2010A-1 bonds until November 25, 2013.
In the event the bonds are put back to the bank and not successfully remarketed, or if the LOC expires without an extension or substitution, the bank bonds will convert to a term loan. There is no principal due on potential term loans within the next fiscal year.

- 35 -
The 1998 A&B Chicago Midway Second Lien Bonds were converted from bank bonds to daily variable rate demand bonds on May 6, 2010. The 2002A Chicago Midway Airport Second Lien Revenue Bonds went into bank bond mode in February 2009, the bonds were refunded by the Series 2010 A-1 Second Lien Bonds on May 6, 2010. The Chicago Midway Airport Series 2004 C&D Second Lien Bonds were converted from auction rate securities to weekly variable rate demand bonds on May 6, 2010.
Hedging Derivatives:
In April 2011, the Airport novated its $60.9 million notional amount swap associated with the Midway Airport Series 2004C&D variable rate bonds with J.P. Morgan to Wells Fargo Bank, N.A. The fixed rate the Airport pays increased from 4.174% to 4.247%, and the Airport signed a one-way credit support agreement (CSA) that no longer requires the Airport to post collateral if the mark-to-market exceeds the threshold, previously defined in the J.P. Morgan agreement. A Goldman Sachs swap covers the 60% balance of the bonds, with a current notional amount of $91.3 million, which does not have a two-way CSA and remains unchanged.
Pay-Fixed, Receive-Variable Interest Rate Swaps:
Objective of the Swaps — In order to protect against the potential of rising interest rates, the Airport has entered into a separate pay-fixed, receive-variable interest rate swap at a cost less than what the Airport would have paid to issue fixed-rate debt ($ in thousands).
Classification Amount Classification Amount Notional
Cash flow hedges: Pay-fixed Interest Deferred outflow Deferred outflow Rate Swaps of resources 20,104$ of resources 35,000$ 152,150$
Fair Value atChanges in Fair Value December 31, 2011
Pay-Fixed, Receive-Variable Interest Rate Swaps — In order to protect against the potential of rising interest rates, the Airport entered into two separate pay-fixed, receive-variable interest rate swaps at a cost less than what the Airport would have paid to issue fixed-rate debt. The swap counterparties are Goldman Sachs and Wells Fargo, with notional amounts of $91.3 million and $60.9 million, respectively.
Terms, Fair Values and Credit Risk — The terms, including the fair value and credit ratings of the outstanding swaps as of December 31, 2011 and 2010, are as follows. The notional amounts of the swaps match the principal amounts of the associated debt. The Airport’s swap agreements contained scheduled reductions to outstanding notional amounts that are expected to approximately follow scheduled or anticipated reductions in the associated “bonds payable” category ($ in thousands).
Fixed Variable Fair Fair Swap CounterpartyAssociated Notional Effective Rate Rate Value Value Termination CreditBond Issue Amounts Date Paid Received 2011 2010 Date Rating
Series 2004 C&D Bonds 91,290$ December 14, 2004 4.174 % SIFMA +.05% (20,564)$ (8,869)$ January 1, 2035 A1/ASeries 2004 C&D Bonds 60,860 December 14, 2004 4.247 SIFMA +.05% (14,436) (6,007) January 1, 2035 Aa1/AA-
Total 152,150$ (35,000)$ (14,876)$

- 36 -
Fair Value — As per industry convention, the fair value of the Airport’s outstanding swaps were estimated using the zero-coupon method. This method calculates the future net settlement payment required by the swap, assuming that the forward rates implied the yield curve correctly anticipate future spot rates. These payments are then discounted using the spot rates implied by the current yield curve for hypothetical zero-coupon bonds due on the date of each future net settlement of the swap. Because interest rates declined subsequent to the date of execution, the Airport’s swaps had negative values.
Credit Risk — The Airport is exposed to credit risk (counterparty risk) through the counterparties with which it enters into agreements. If minimum credit rating requirements are not maintained, the counterparty is required to post collateral to a third party. This protects the Airport by mitigating the credit risk, and therefore the ability to pay a termination payment, inherent in a swap. Collateral on all swaps is to be in the form of cash or Eligible Collateral held by a third-party custodian. Upon credit events, the swaps also allow transfers, credit support and termination if the counterparty is unable to meet the said credit requirements
Basis Risk — Basis risk refers to the mismatch between the variable rate payments received on a swap contract and the interest payment actually owed on the bonds. The two significant components driving this risk are credit and BMA ratios. Credit may create basis risk because the Airport’s bonds may trade differently than the swap index as a result of a credit change in the Airport. BMA ratios (or spreads) may create basis risk if BMA swaps of the Airport’s bonds trade higher than the BMA received on the swap. This can occur due to many factors including, without limitations, changes in marginal tax rates, tax-exempt status of bonds and supply and demand for variable rate bonds. The Airport is exposed to basis risk on the swaps if the rate paid on the bonds is higher than the rate received. The Airport is liable for the difference. The difference would need to be available on the debt service payment date and would add additional underlying cost to the transaction.
Tax Risk — The swap exposes the Airport to tax risk or a permanent mismatch (shortfall) between the floating rate received on the swap and the variable rate paid on the underlying variable-rate bonds due to tax law changes such that the Federal or State tax exception of municipal debt is eliminated or its value reduced. There have been no tax law changes since the execution of this swap agreement.
Termination Risk — The risk that the swap could be terminated as a result of certain events, including a ratings downgrade for the issuer or swap counterparty, covenant violation, bankruptcy, payment default or other defined events of default. Termination of a swap may result in a payment made by the issuer or to the issuer depending upon the market at the time of termination.

- 37 -
Swap Payments and Associated Debt — As of December 31, 2011, debt service requirements for the Airport’s outstanding variable-rate debt and net swap payments, assuming current interest rates remain the same, for their term are as follows ($ in thousands):
InterestYears Ending RateDecember 31 Principal Interest Swaps — Net Total
2012 3,650$ 190$ 6,128$ 9,968$ 2013 3,825 186 5,976 9,987 2014 4,000 181 5,816 9,997 2015 4,200 175 5,649 10,024 2016 4,275 170 5,476 9,921 2017–2021 24,925 760 24,488 50,173 2022–2026 31,050 584 18,814 50,448 2027–2031 38,600 365 11,746 50,711 2032–2036 37,625 98 3,153 40,876
Total 152,150$ 2,709$ 87,246$ 242,105$
Variable-Rate Bonds
Investment Derivatives
Swaptions:
Objective of the Swaptions — Effective October 27, 1999, the Airport entered into an Option on Interest Rate Swap Agreement (the Option) in connection with $397.7 million (the Notional Amount) of Chicago Midway Airport Series Revenue Bonds 1998 A, 1998 B and 1998 C. Pursuant to the Option, the Airport received a premium of $23.5 million that was recorded as a deferred gain. As a synthetic refunding of the bonds, this premium represents the risk-adjusted, present value savings of a refunding, without issuing refunding bonds. The deferred gain is amortized over the term of the agreement (30 years). The buyer may exercise the Option if the daily weighted average of the Municipal Swap Index for the 180 days on the day prior to the exercise date is greater than 7.5%. If the Option is exercised, the Airport will owe interest calculated on a floating rate equal to the Municipal Swap Index plus 25 basis points (the Spread) to the buyer of the swap. In return, the buyer will owe the Airport interest calculated on a fixed rate of 5.1%. The Notional Amount is not exchanged; it is only the basis on which interest payments are calculated. The Airport’s floating rate is capped at 15%. The Airport continues to pay interest to the bondholders at the fixed rate stated in the bonds. However, during the term of the swap agreement, the Airport will effectively pay a variable rate on the bonds. The Option increases the Airport’s exposure to variable interest rates. The debt service requirements to maturity for these bonds (presented in this note) are based on the fixed rate stated in the Bonds. The Airport will be exposed to paying fixed rates if the buyer to the swap defaults or if the swap is terminated. The Airport or the counter-party may terminate the Option if the other party fails to perform under the terms of the agreement. A termination of the swap agreement may result in the Airport making or receiving a termination payment.
In May 2011, the Airport entered into a two-way Credit Support Agreement (CSA) with J.P. Morgan in connection with the $397.7 million original notional amount swaption associated with the Midway Airport Series 1998 A, B, and C fixed rate bonds. The CSA was required because a termination event was triggered due to the insurer’s (MBIA) ratings downgrade. Based on the current second lien ratings at Midway Airport (A3/A-/A- by Moody’s, S&P and Fitch ,respectively), if the mark-to-market on the swap is against the Airport by more than $25 million, the Airport must post collateral for the difference.

- 38 -
To mitigate the risk of posting collateral, the Airport obtained a $25 million LOC from PNC Bank as collateral. The LOC is not expected to be drawn upon as long as there is no event of default by the bank or the Airport. Based on the current second lien ratings at Midway Airport, if the mark-to-market on the swaption is against the Airport by more than the combined $25 million threshold provided in the CSA and the $25 million LOC, for a total of $50 million, the Airport must post collateral for the difference.
As of December 31, 2011, the option had a negative fair market value of $7.2 million. The option was not exercised during 2011. Note that in the statement of net assets the combination of the $6.6 million derivative asset and the interest rate swap premium balance of $13.8 million together represent the total hybrid instrument of $7.2 million.
Classification Amount Classification Amount Notional
Investment derivative instruments: Pay-fixed Interest Investment Outflow of Rate Swaps revenue 12,606$ resources 7,207$ 380,270$
Changes in Fair ValueFair Value at
December 31, 2011
Terms — The terms, including fair values of the swaptions as of December 31, 2010, are as follows (dollars in thousands):
Bond Issue Amounts Date Paid Received Values Date Payment
Chicago Midway Airport Revenue Bonds (Series 1998A (AMT); Series 1998B (Non-AMT); and Refunding Series 1998C (Non-AMT)) 380,270$ October 27, 1999 SIFMA+25bps 6,647$ 7,207$ January 1, 2030 23,500$
Fair Value — As of December 31, 2011 and 2010, the swaptions had a negative fair value of $7.2 million and $19.8 million, respectively. As per industry convention, the fair values of the Airport’s outstanding swaptions were estimated using the zero-coupon method. This method calculates the future net settlement payments required by the swap, assuming that the forward rates implied by the yield curve correctly anticipate future spot rates. These payments are then discounted using the spot rates implied by the current yield curve for hypothetical zero-coupon bonds due on the date of each future net settlement on the swap. Because interest rates are below the fixed rate received, the Airport’s swaptions had negative values. The negative value is also driven by the upfront payment received by the Airport upon execution of the swaption agreement.
Defeased Bonds — Defeased bonds have been removed from the balance sheet because the related assets have been placed in irrevocable trusts, together with interest earned thereon, will provide amount sufficient for payment of all principal and interest. During 2010, the Airport defeased a portion of the Chicago Midway Airport Revenue Bonds, Series 2001 A and Series 2001 B in the amount of $5.5 million and $0.6 million, respectively. As of December 31, 2011, there was $0 outstanding in the escrow.
In May 2010, the Airport entered into a two-way CSA with J.P. Morgan on its swap associated with a 40% portion of the Midway Airport Series 2004C&D variable rate bonds with a current notional amount of $60.9 million. A Goldman Sachs swap covers the 60% balance of the bonds, with a current notional amount of $91.3 million, which does not have a two-way CSA and remains unchanged. The J.P. Morgan CSA was required because a termination event was triggered due to the insurer’s (Ambac) ratings downgrade. Both firms had the right to require a two-way CSA, but only J.P. Morgan exercised the

- 39 -
right. Goldman Sachs waived its right as long as the swap remains unchanged. Based on the current second lien ratings at Midway Airport (A3/A-/A- by Moody’s, S&P and Fitch, respectively), if the mark-to-market on the swap is against the City/Airport by more than $10.0 million, the Airport must post collateral for the difference. In August 2010, the Airport was required to post as much as $1.4 million, funded with proceeds from Midway Commercial Paper, but as of December 31, 2011, no collateral posting was required. The swaps terminate on January 1, 2035.
No-Commitment Debt — Bonds payable on no-commitment debt are not included in the accompanying basic financial statements because the City has no obligation to provide for their repayment, which is the responsibility of the borrowing entities.
5. CHANGES IN CAPITAL ASSETS
During the years ended December 31, 2011 and 2010, capital assets changed as follows ($ in thousands):
Balance Disposals BalanceJanuary 1, and December 31,
2011 Additions Transfers 2011
Capital assets not depreciated: Land 107,287$ 2,159$ - $ 109,446$ Construction in progress 20,229 41,187 (9,243) 52,173
Total capital assets not depreciated 127,516 43,346 (9,243) 161,619
Capital assets depreciated — buildings and other facilities 1,362,200 9,243 1,371,443 Less accumulated depreciation for — buildings and other facilities (338,401) (42,137) (380,538)
Total capital assets depreciated — net 1,023,799 (32,894) - 990,905
Total property and facilities — net 1,151,315$ 10,452$ (9,243)$ 1,152,524$
Includes capitalized interest of $5,860,371
Balance Disposals BalanceJanuary 1, and December 31,
2010 Additions Transfers 2010
Capital assets not depreciated: Land 106,918$ 369$ - $ 107,287$ Construction in progress 36,042 27,594 (43,407) 20,229
Total capital assets not depreciated 142,960 27,963 (43,407) 127,516
Capital assets depreciated — buildings and other facilities 1,318,793 43,407 1,362,200 Less accumulated depreciation for — buildings and other facilities (293,557) (44,844) (338,401)
Total capital assets depreciated — net 1,025,236 43,407 (44,844) 1,023,799
Total property and facilities — net 1,168,196$ 71,370$ (88,251)$ 1,151,315$
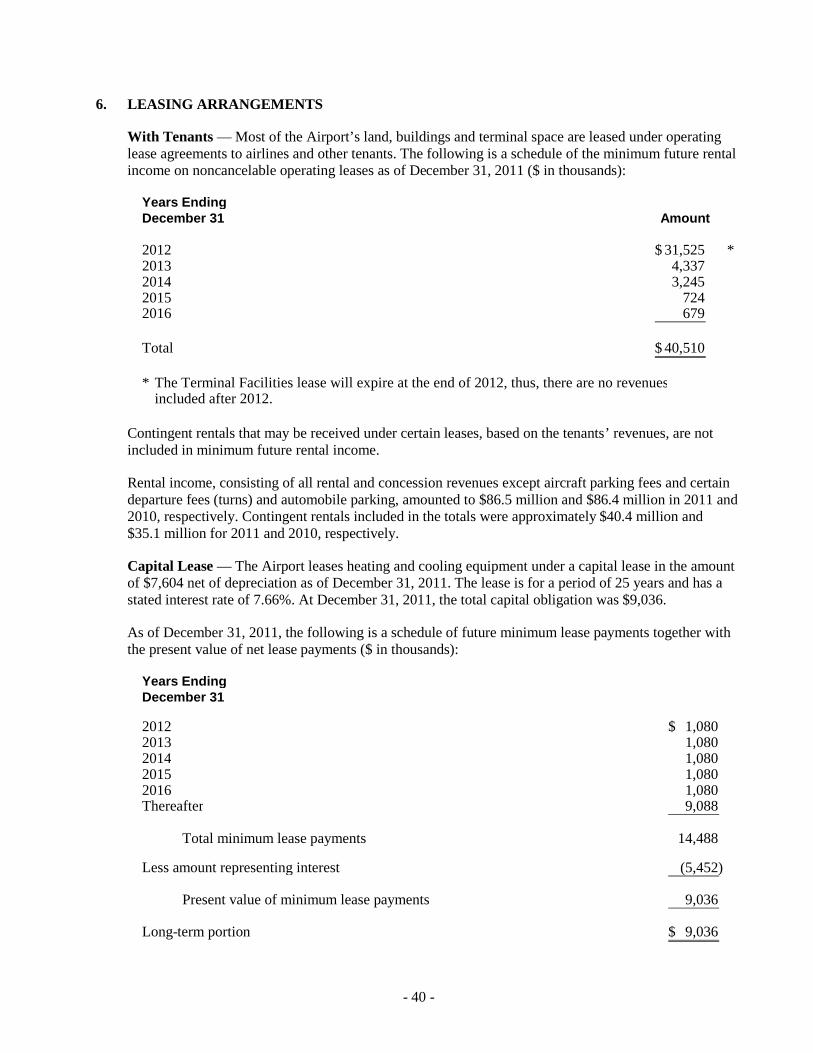
- 40 -
6. LEASING ARRANGEMENTS
With Tenants — Most of the Airport’s land, buildings and terminal space are leased under operating lease agreements to airlines and other tenants. The following is a schedule of the minimum future rental income on noncancelable operating leases as of December 31, 2011 ($ in thousands):
Years EndingDecember 31 Amount
2012 31,525$ *2013 4,337 2014 3,245 2015 724 2016 679
Total 40,510$
* The Terminal Facilities lease will expire at the end of 2012, thus, there are no revenuesincluded after 2012.
Contingent rentals that may be received under certain leases, based on the tenants’ revenues, are not included in minimum future rental income.
Rental income, consisting of all rental and concession revenues except aircraft parking fees and certain departure fees (turns) and automobile parking, amounted to $86.5 million and $86.4 million in 2011 and 2010, respectively. Contingent rentals included in the totals were approximately $40.4 million and $35.1 million for 2011 and 2010, respectively.
Capital Lease — The Airport leases heating and cooling equipment under a capital lease in the amount of $7,604 net of depreciation as of December 31, 2011. The lease is for a period of 25 years and has a stated interest rate of 7.66%. At December 31, 2011, the total capital obligation was $9,036.
As of December 31, 2011, the following is a schedule of future minimum lease payments together with the present value of net lease payments ($ in thousands):
Years EndingDecember 31
2012 1,080$ 2013 1,080 2014 1,080 2015 1,080 2016 1,080 Thereafter 9,088
Total minimum lease payments 14,488
Less amount representing interest (5,452)
Present value of minimum lease payments 9,036
Long-term portion 9,036$

- 41 -
7. PENSION PLANS
Eligible Midway Fund employees participate in one of two of the City’s single-employer defined benefit pension plans. These plans are the Municipal Employees’ and the Laborers’ and Retirement Board Employees’ Annuity and Benefit Funds. These plans are administered by individual retirement boards represented by elected and appointed officials. Each plan issues publicly available financial statements for each of the pension plans, which may be obtained at the respective fund’s office.
The funds provide retirement, death and disability benefits as established by State law. Benefits generally vest after 20 years of credited service. Employees who retire at or after age 55 with at least 10 years of credited service qualify to receive a money purchase annuity and those with more than 20 years of credited service qualify to receive a minimum formula annuity. The annuity is computed by multiplying the final average salary by a minimum of 2.4% per year of credited service. The final average salary is the employee’s highest average annual salary for any four consecutive years within the last 10 years of credited service.
Participating employees contribute 8.5% of their salary to these funds as required by State law. By law, the City’s contributions are based on the amounts contributed by the employees. Financing of the City’s contribution is through a separate property tax levy and the personal property replacement tax. The Midway Fund reimburses the City’s general fund for the estimated pension cost applicable to the covered payroll of Midway Fund employees. These reimbursements, recorded as expenses of the Midway Fund, were $3.2 million in 2011 and $3.0 million in 2010. The annual pension costs are determined using the entry age normal actuarial cost method and the level dollar amortization method.
The funding policy mandated by State law requires City contributions at statutorily, not actuarially, determined rates. The rates are expressed as multiples of employee contributions. These contributions equal employee contributions made in the calendar year two years prior to the year for which the applicable tax is levied, multiplied by the statutory rates. The statutory rates in effect for the City’s contributions made during the years ended December 31, 2011 and 2010 were 1.25 for the Municipal Employees’ and 1.00 for the Laborers’ and Retirement Board Employees’ Annuity and Benefit Funds, respectively. The City has made the required contributions under State law.
The following table as of December 31, 2011 assists users in assessing each fund’s progress in accumulating sufficient assets to pay benefits when due. The three-year historical information for each annuity and benefit fund is as follows ($ in thousands):
Percent of Percent ofAnnual Annual Required Net Pension
Pension Pension Cost Required Contributions (Asset)Cost Contributed Contribution Contributed Obligation
Municipal employees’: 2009 412,575$ 35.9 % 413,509$ 35.8 % 679,736$ 2010 482,421 32.1 483,948 32.0 1,007,406 2011 609,491 24.1 611,756 24.0 1,469,886
Laborers’: 2009 34,025$ 43.0 % 33,517$ 43.6 % (206,361)$ 2010 47,129 32.6 46,665 32.9 (174,585) 2011 57,651 22.2 57,259 22.3 (129,712)

- 42 -
The pension benefits information pertaining expressly to Midway Fund employees is not available as the obligation is the responsibility of the general government. Accordingly, no amounts have been recorded in the accompanying basic financial statements for the net pension assets or liabilities of these plans.
8. OTHER POSTEMPLOYMENT BENEFITS — CITY OBLIGATION
In addition to providing pension benefits, under State law, the City provides certain health benefits to employees who retire from the City based upon their participation in the City’s pension plans. Substantially all employees who qualify as Municipal Employees’ or Laborers’ pension plan participants older than age 55 with at least 20 years of service may become eligible for postemployment benefits if they eventually become annuitants. Health benefits include basic benefits for annuitants and supplemental benefits for Medicare-eligible annuitants. Currently, the City does not segregate benefit payments to annuitants by fund. The cost of health benefits is recognized as claims are reported and are funded on a pay-as-you-go basis. The total cost to the City for providing health benefits to approximately 24,000 annuitants and their dependents was approximately $99.1 million and $107.4 million in 2011 and 2010, respectively.
The annuitants who retired prior to July 1, 2005, received a 55% subsidy from the City and the annuitants who retired on or after July 1, 2005, received a 50%, 45%, 40%, and 0% subsidy from the City based on the annuitant’s length of actual employment with the City for the gross cost of retiree health care under a court approved settlement agreement (the “Settlement Agreement”). During 2011 and 2010 the pension funds contributed $65 for each Medicare eligible annuitant and $95 for each Non-Medicare eligible annuitant to their gross cost. The annuitants contributed a total of $68.3 million in 2011 and $64.1 million in 2010, to the gross cost of their retiree health care pursuant to premium amounts set forth in the above-referenced Settlement Agreement.
The City’s net expense and the annuitants’ contribution indicated above are preliminary and subject to the reconciliation per the Settlement Agreement.
Plan Description Summary — The City is party to a written legal Settlement Agreement outlining the provisions of the retiree health program the Settlement Health Care Plans (the “Plans”) through June 30, 2013. The Settlement Agreement does not require or extend continuation of the Plans after June 30, 2013. Pursuant to the Settlement Agreement, the City administers a single-employer defined benefit healthcare plan (the “Health Plan”), for which the City pays a portion of the costs on a pay-as-you-go method. Under the Settlement Agreement, the City sponsors health benefit plans for employees, former employees, and retired employees. The provisions of the program provide, in general, that the City pay a percentage of the cost (based upon an employee’s service) for hospital and medical coverage to eligible retired employees and their dependents for a specified period, until June 30, 2013.
In addition, Illinois Compiled Statutes authorize the respective Pension Funds to provide a fixed monthly dollar subsidy to each annuitant who has elected coverage under the Health Plan through June 30, 2013. After that date, no supplements are authorized.
The liabilities for the monthly dollar supplements paid to annuitants enrolled in the retiree medical plan by their respective Pension Funds are included in the liabilities and reports of the respective Pension Funds (see Note 6).
Funding Policy — The City’s Health Plan is a single employer plan that operates on a pay as you go funding basis. No assets are accumulated or dedicated to funding the Health Plan benefits.
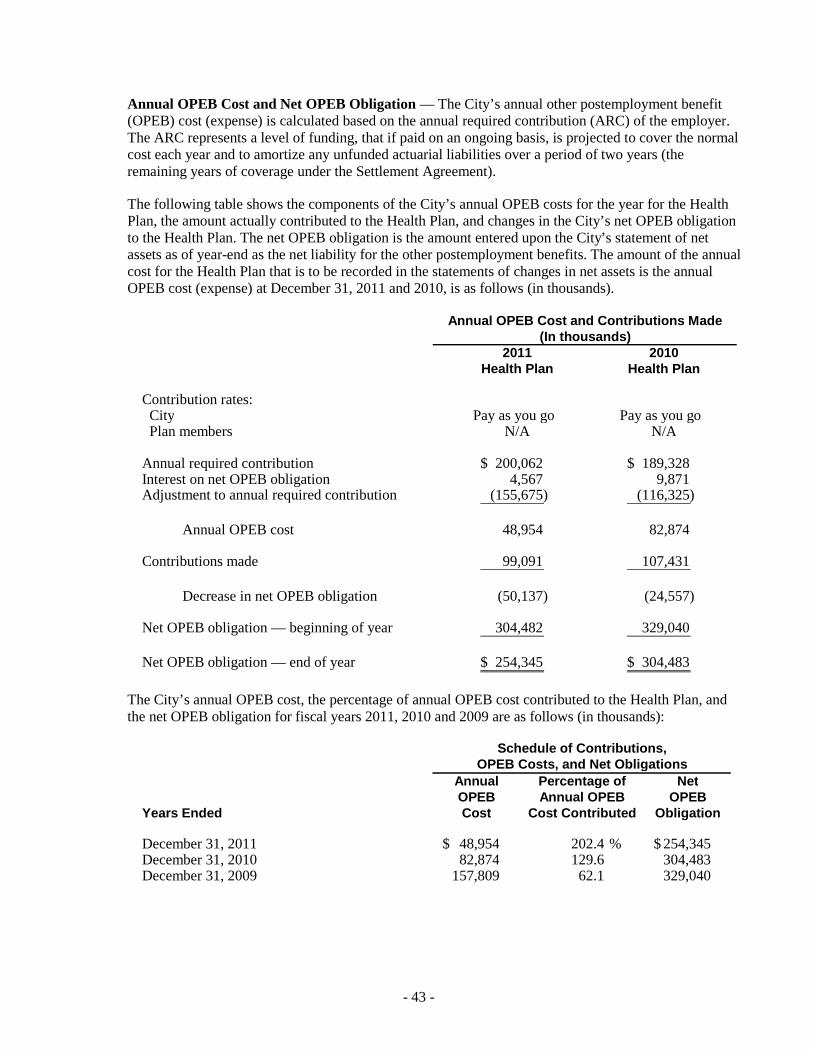
- 43 -
Annual OPEB Cost and Net OPEB Obligation — The City’s annual other postemployment benefit (OPEB) cost (expense) is calculated based on the annual required contribution (ARC) of the employer. The ARC represents a level of funding, that if paid on an ongoing basis, is projected to cover the normal cost each year and to amortize any unfunded actuarial liabilities over a period of two years (the remaining years of coverage under the Settlement Agreement).
The following table shows the components of the City’s annual OPEB costs for the year for the Health Plan, the amount actually contributed to the Health Plan, and changes in the City’s net OPEB obligation to the Health Plan. The net OPEB obligation is the amount entered upon the City’s statement of net assets as of year-end as the net liability for the other postemployment benefits. The amount of the annual cost for the Health Plan that is to be recorded in the statements of changes in net assets is the annual OPEB cost (expense) at December 31, 2011 and 2010, is as follows (in thousands).
2011 2010Health Plan Health Plan
Contribution rates: City Pay as you go Pay as you go Plan members N/A N/A
Annual required contribution 200,062$ 189,328$ Interest on net OPEB obligation 4,567 9,871 Adjustment to annual required contribution (155,675) (116,325)
Annual OPEB cost 48,954 82,874
Contributions made 99,091 107,431
Decrease in net OPEB obligation (50,137) (24,557)
Net OPEB obligation — beginning of year 304,482 329,040
Net OPEB obligation — end of year 254,345$ 304,483$
Annual OPEB Cost and Contributions Made(In thousands)
The City’s annual OPEB cost, the percentage of annual OPEB cost contributed to the Health Plan, and the net OPEB obligation for fiscal years 2011, 2010 and 2009 are as follows (in thousands):
Annual Percentage of NetOPEB Annual OPEB OPEB
Years Ended Cost Cost Contributed Obligation
December 31, 2011 48,954$ 202.4 % 254,345$ December 31, 2010 82,874 129.6 304,483 December 31, 2009 157,809 62.1 329,040
Schedule of Contributions,OPEB Costs, and Net Obligations

- 44 -
Funded Status and Funding Progress — As of December 31, 2010, the most recent actuarial valuation date, the actuarial accrued liability for benefits for all eligible City employees and retirees was $390.6 million, all of which was unfunded. The covered payroll (annual payroll of active employees covered by the Health Plan) was approximately $2,475.1 million, and the ratio of the unfunded actuarial accrued liability to the covered payroll was 15.8%.
Actuarial valuations of an ongoing plan involve estimates of the value of reported amounts and assumptions about the probability of occurrence of events far into the future. Examples include assumptions about future employment, mortality, and the healthcare cost trend. Amounts determined regarding the funded status of the Health Plan and the ARC of the employer are subject to continual revisions as the results are compared with past expectations and new estimates are made about the future. (in thousands)
UnfundedActuarial
Actuarial Actuarial Actuarial AccruedValuation Value of Accrued Liability Funded CoveredDate Assets Liability (AAL) (UAAL) Ratio Payroll
December 31, 2010 - $ 390,611$ 390,611$ - % 2,475,080$ December 31, 2009 533,387 533,387 2,546,961
Actuarial Method and Assumptions — Projections of benefits for financial reporting purposes are based on the substantive plan (the plan understood by the employer and plan members) and included the types of benefits provided at the time of each valuation and the historical pattern of sharing of benefit costs between the employer and plan members to that point. The actuarial method and assumptions used include techniques that are designed to reduce the effects of short-term volatility in actuarial accrued liabilities and the actuarial value of assets, consistent with the long term perspective of the calculations.
For the Health Plan benefits (not provided by the pension funds) in the actuarial valuation for the years ended December 31, 2011 and 2010, the projected unit credit actuarial cost method was used. The actuarial assumptions included an annual healthcare cost trend rate of 11.5% initially, reduced by decrements to an ultimate rate of 10.5%. Both rates included a 3% inflation assumption. The Health Plan has not accumulated assets and does not hold assets in a segregated trust. However, the funds expected to be used to pay benefits are assumed to be invested for durations, which will yield an annual return rate of 1.5%. The Unfunded Accrued Actuarial Liability, as of December 31, 2011, is being amortized as a level dollar amount over two years.
2011 2010Item Health Plan Health Plan
Actuarial valuation date December 31, 2010 December 31, 2009Actuarial cost method Projected unit credit Projected unit creditAmortization method Level dollar Level dollarRemaining amortization period 2 years 3 yearsAsset valuation method Market value Market valueActuarial assumptions: Investment rate of return 1.50% 3.0% Projected salary increases 2.5% 2.5% Healthcare inflation rate 11.5% initial to 10.5% ultimate 12% initial to 10.5% ultimate
Summary of Assumptions and Methods

- 45 -
The OPEB benefit information pertaining expressly to the Midway fund employees is not available as the obligation is the responsibility of the general government. Accordingly, no amounts have been recorded in the accompanying basic financial statements. Amounts for the City are recorded within the City’s government-wide basic financial statements.
9. RELATED-PARTY TRANSACTIONS
Included in operating expenses are reimbursements to the general fund of the City for services provided by other City departments, employee fringe benefits and self-insured risks. Such reimbursements were $16.4 million and $15.0 million in 2011 and 2010, respectively.
10. COMMITMENTS AND CONTINGENCIES
The Airport has certain contingent liabilities resulting from litigation, claims and commitments incident to the ordinary course of business. Management expects that the final resolution of these contingencies will not have a material adverse effect on the financial position or results of operations of the Airport.
The Airport provides employee health benefits under a self-insurance program, administered by the City. Such claims outstanding, including claims incurred but not reported, are estimated and recorded as liabilities in the financial statements.
Uninsured claim expenditures and liabilities are reported when it is probable that a loss has occurred and the amount of that loss can be reasonably estimated. These losses include an estimate of claims that have been incurred but not reported. Changes in the claims liability amount for the years ended December 31, 2011 and 2010, are as follows ($ in thousands):
2011 2010
Beginning balance — January 1 433$ 387$ Total claims incurred 4,160 3,929 Claims paid (4,144) (3,884)
Claims liability — December 31 449$ 432$
The City purchases annuity contracts from commercial insurers to satisfy certain liabilities. The City renewed its property insurance for the City’s Airports, effective December 31, 2010, at a limit of $3.6 billion, which the City’s insurance broker advised was the highest amount commercially available at the time. Claims have not exceeded the purchased insurance coverage in the past 10 years. Property and casualty risks for the Airport are transferred to commercial insurers.
At December 31, 2011 and 2010, the Airport had commitments in the amount of approximately $71.1 million and $13.2 million, respectively, in connection with contracts entered into for construction projects.
11. SUBSEQUENT EVENTS
In January 2012, the City redeemed $3.9 million of Chicago Midway Airport Second Lien Revenue Bonds Series 2010A-2.

- 46 -
In April 2012, the City terminated the swaption transaction with J.P. Morgan in relation to Chicago Midway Airport Senior Lien Series 1998 A, B and C bonds with a notional amount of $397.7 million and a trade date of October 27, 1999. The City paid $8.25 million to terminate the swaption.
In April 2012, $8.3 million of Chicago Midway Airport Commercial Paper Notes Series 2003 were issued. The proceeds will be used to fund the swaption termination payment.
In June 2012, Moody’s Investors Service downgraded 15 banks and securities firms with global capital markets operations. The downgrade impacted certain LOC providers for the City’s various variable rate demand bonds and may potentially cause credit spreads to increase or certain bonds to become bank bonds. The City will monitor its variable rate bond issues and convert or refinance the bonds as necessary. Additionally, the downgrade has impacted certain swap counterparties, however, no action is required by the City.
* * * * * *

- 47 -
CITY OF CHICAGO, ILLINOISCHICAGO MIDWAY INTERNATIONAL AIRPORT ADDITIONAL INFORMATIONCHICAGO MIDWAY AIRPORT REVENUE BONDS DEBT SERVICE COVERAGE CALCULATIONSYEARS ENDED DECEMBER 31, 2011 AND 2010($ in thousands)
2011 2010
REVENUES: Total revenues — as defined 158,849$ 150,009$ Other available moneys (passenger facility charges and letter of intent) 36,849 37,509 Cash balance in Revenue Fund on first day of fiscal year (Note 2) 24,685 14,976
TOTAL REVENUES 220,383$ 202,494$
COVERAGE REQUIREMENT — Required deposits from revenues: Debt Service Fund 54,748$ 44,372$ Operation and maintenance reserve account 1,412 643 Junior Lien Obligation Debt Service Fund 23,468 24,302 Repair and Maintenance Fund 1,025 1,025
TOTAL FUND DEPOSIT REQUIREMENTS 80,653$ 70,342$
AGGREGATE FIRST LIEN DEBT SERVICE FOR THE BOND YEAR 54,749$ 44,374$
LESS AMOUNTS TRANSFERRED FROM CAPITALIZED INTEREST ACCOUNTS
Net aggregate debt service 54,749 44,374
1.25 1.25
NET DEBT SERVICE REQUIRED 68,436$ 55,468$
OPERATION AND MAINTENANCE EXPENSES 110,090$ 108,336$
COVERAGE REQUIRED (Greater of total fund deposit requirements or 125% of aggregate debt service) 80,653 70,342
TOTAL COVERAGE REQUIRED 190,743$ 178,678$
TOTAL REVENUES 220,383$ 202,494$
COVERAGE RATIO 1.16 1.13

- 48 -
CITY OF CHICAGO, ILLINOIS CHICAGO MIDWAY INTERNATIONAL AIRPORT
ADDITIONAL INFORMATION CHICAGO MIDWAY AIRPORT REVENUE BONDS NOTES TO DEBT SERVICE COVERAGE CALCULATIONS YEARS ENDED DECEMBER 31, 2011 AND 2010
1. RATE COVENANT
The Master Indenture of Trust (Master Indenture) securing the Chicago Midway Airport Revenue Bonds (Bonds) requires that revenues, together with other available moneys deposited with the trustee and any cash balance held in the revenue fund on the first day of the calendar year not then required to be deposited in any fund or account, will be at least sufficient (i) to provide for the payment of operation and maintenance expenses for the year, and (ii) to provide for the greater of (a) the amounts, if any, needed to make required deposits into the Debt Service Fund, the Operating and Maintenance Reserve Account, the Working Capital Account, the Debt Service Reserve Fund, the Junior Lien Obligation Debt Service Fund, the Repair and Replacement Fund and the Special Project Fund, and (b) an amount not less than 125% of the aggregate debt service for the Bond year commencing during such fiscal year.
2. REVENUE FUND BALANCE
The revenue fund balance includes all cash, cash equivalents and investments, which were available to the revenue fund to satisfy the coverage requirement under the terms of the Master Indenture.
* * * * * *

- 49 -
CITY OF CHICAGO, ILLINOISCHICAGO MIDWAY INTERNATIONAL AIRPORT
ADDITIONAL INFORMATIONCHICAGO MIDWAY AIRPORT SECOND LIEN REVENUE BONDSDEBT SERVICE COVERAGE CALCULATIONSYEARS ENDED DECEMBER 31, 2011 AND 2010($ in thousands)
2011 2010
REVENUES: Total revenues — as defined 158,849$ 150,009$ Other available moneys (passenger facility charges and letter of intent) 36,849 37,509 Cash balance in Revenue Fund on first day of fiscal year (Note 2) 24,685 14,976
TOTAL REVENUES FOR CALCULATION OF COVERAGE 220,383$ 202,494$
COVERAGE REQUIREMENT — Required deposits from revenues: First Lien Debt Service Fund 54,748$ 44,372$ Operation and maintenance reserve account 1,412 643 Junior Lien Obligation Debt Service Fund 23,468 24,302 Repair and Replacement Fund 1,025 1,025
TOTAL FUND DEPOSIT REQUIREMENTS 80,653$ 70,342$
125% OF AGGREGATE FIRST LIEN DEBT SERVICE FOR THE BOND YEAR: Aggregate First Lien Debt Service 54,749$ 44,374$ Less amounts transferred from First Lien Capitalized Interest Accounts
Net aggregate First Lien Debt Service 54,749 44,374 1.25 1.25
125% OF AGGREGATE FIRST LIEN DEBT SERVICE 68,436$ 55,468$
GREATER OF FUND DEPOSIT REQUIREMENTS OR 125% OF AGGREGATE FIRST LIEN DEBT SERVICE 80,653$ 70,342$
110% OF AGGREGATE FIRST AND SECOND LIEN DEBT SERVICE FOR THE BOND YEAR: Aggregate First Lien Debt Service 54,749$ 44,374$ Aggregate Second Lien Debt Service 36,826 25,069 Less amounts transferred from First Lien Capitalized Interest Accounts Less amounts transferred from Junior Lien Capitalized Interest Accounts (4,943) (1,058)
Net aggregate First and Second Lien Debt Service 86,632 68,385 1.10 1.10
110% OF AGGREGATE FIRST AND SECOND LIEN DEBT SERVICE 95,295$ 75,224$
GREATER OF FUND DEPOSIT REQUIREMENTS OR 110% OF AGGREGATE FIRST AND SECOND LIEN DEBT SERVICE 95,295$ 75,224$
GREATER OF FUND DEPOSIT REQUIREMENTS OR 125% OF FIRST LIEN DEBT OR 110% OF AGGREGATE DEBT SERVICE 95,295$ 75,224$
COVERAGE CALCULATION: Operation and maintenance expenses 110,090$ 108,336$ 110% of aggregate First and Second Lien Debt Service 95,295 75,224 Fund Deposit Requirements
TOTAL COVERAGE REQUIRED 205,385$ 183,560$
TOTAL REVENUES 220,383$ 202,494$
REVENUES IN EXCESS OF COVERAGE REQUIREMENT 14,998$ 18,934$
COVERAGE RATIO 1.07 1.10
See notes to debt service coverage calculations.

- 50 -
CITY OF CHICAGO, ILLINOIS CHICAGO MIDWAY INTERNATIONAL AIRPORT
ADDITIONAL INFORMATION CHICAGO MIDWAY AIRPORT SECOND LIEN REVENUE BONDS NOTES TO DEBT SERVICE COVERAGE CALCULATIONS YEARS ENDED DECEMBER 31, 2011 AND 2010
1. RATE COVENANT
The Master Indenture of Trust (Master Indenture) securing the Chicago Midway Airport Second Lien Revenue Bonds (Bonds) requires that revenues, together with other available moneys deposited with the first lien trustee or the second lien trustee and any cash balance held in the first lien revenue fund or the second lien revenue fund on the first day of the year not then required to be deposited in any fund or account under the first lien indenture or the second lien indenture, will be at least sufficient (a) to provide for the payment of operation and maintenance expenses for the year and (b) to provide for: (i) the greater of the amounts needed to make the deposits required under the first lien indenture during such calendar year into the first lien debt service fund, the Operating and Maintenance (O&M) Reserve Account, the Working Capital Account, the First Lien Debt Service Reserve Fund, the Junior Lien Obligation Debt Service Fund, the Repair and Replacement Fund and the Special Project Fund, or an amount not less than 125% of the Aggregate First Lien Debt Service for the Bond year commencing during such year, reduced by any amount held in any capitalized interest account for disbursement during such Bond year to pay interest on first lien bonds; or (ii) the greater of the amounts needed to make the deposits required under the first lien indenture during such year into the First Lien Debt Service Fund, the O&M Reserve Account, the Working Capital Account, the First Lien Debt Service Reserve Fund, the Junior Lien Obligation Debt Service Fund, the Repair and Replacement Fund and the Special Project Fund, or an amount not less than 110% of the sum of Aggregate First Lien Debt Service and Aggregate Second Lien Debt Service for the Bond year commencing during such year, reduced by (a) any amount held in any capitalized interest account for disbursement during such Bond year to pay interest on any first lien bonds, and (b) any amount held in any capitalized interest account established pursuant to a supplemental indenture for disbursement during such Bond year to pay interest on second lien obligations.
2. REVENUE FUND BALANCE
The revenue fund balance includes all cash, cash equivalents, and investments which were available to the revenue fund to satisfy the coverage requirement under the terms of the Master Indenture.
* * * * * *


- 53 -
CITY OF CHICAGO, ILLINOISCHICAGO MIDWAY INTERNATIONAL AIRPORT
HISTORICAL OPERATING RESULTSEACH OF THE TEN YEARS ENDED DECEMBER 31, 2002–2011 (UNAUDITED)($ in thousands)
2002 2003 2004 2005 2006 2007 2008 2009 2010 2011
OPERATING REVENUES: Landing fees 20,934$ 14,524$ 15,585$ 15,668$ 20,834$ 19,606$ 28,901$ 21,939$ 35,299$ 38,583$
Rental revenues: Terminal area use charges 19,073 12,089 13,714 17,179 21,804 17,308 26,084 30,701 42,895 40,862 Other rentals and fueling system fees 9,837 8,688 11,055 12,942 14,520 17,784 15,683 20,367 21,488 24,978
Subtotal rental revenues 28,910 20,777 24,769 30,121 36,324 35,092 41,767 51,068 64,383 65,840
Concessions: Auto parking 23,443 25,348 25,939 25,675 27,433 29,740 31,561 27,902 27,849 29,112 Auto rentals 8,039 7,808 8,001 8,417 7,698 8,440 8,355 8,505 8,182 8,776 Restaurant 5,249 6,057 6,715 6,879 7,391 8,136 8,099 7,396 8,151 8,875 News and gifts 2,287 2,968 3,272 3,852 3,905 3,876 3,816 3,437 3,488 3,551 Other 996 1,490 1,328 1,616 1,985 2,363 2,486 2,054 1,704 2,634
Subtotal concessions 40,014 43,671 45,254 46,439 48,412 52,555 54,317 49,294 49,374 52,948
Reimbursements
Total operating revenues (1) 89,858 78,972 85,608 92,228 105,570 107,253 124,985 122,301 149,056 157,371
OPERATING AND MAINTENANCE EXPENSES: Salaries and wages (2) 34,036 36,582 32,316 32,259 35,316 39,998 36,931 39,521 42,105 43,554 Repairs and maintenance 24,562 26,770 28,065 31,690 32,762 36,863 37,399 37,967 31,942 40,732 Energy 4,143 3,621 4,869 6,040 5,076 7,495 7,228 8,245 6,724 6,415 Materials and supplies 811 616 663 1,170 437 1,751 2,377 1,252 1,522 1,418 Professional and engineering services 9,536 9,214 10,678 11,274 13,326 14,780 19,775 6,727 15,832 15,650 Other operating expenses 4,467 6,390 4,940 5,794 10,466 10,395 5,942 5,929 10,211 2,320
Total operating and maintenance expenses before depreciation and amortization (3) 77,555 83,193 81,531 88,227 97,383 111,282 109,652 99,641 108,336 110,089
NET OPERATING INCOME BEFORE DEPRECIATION AND AMORTIZATION (4) 12,303$ (4,221)$ 4,077$ 4,001$ 8,187$ (4,029)$ 15,333$ 22,660$ 40,720$ 47,282$
DEBT SERVICE COVERAGE RATIO (5) 1.19 1.05 1.16 1.23 1.23 1.12 1.14 1.08 1.10 1.07
(1) Average annual compound growth rate for 2002–2011 for Total operating revenues is 6.5%.(2) Salaries and wages includes charges for pension, health care and other employee benefits.(3) Average annual compound growth rate for 2002–2011 for Total operating and maintenance expenses before depreciation and amortization is 4.1%.(4) Amount for 2011 may be reconciled to operating loss of $3,785 reported in the 2011 Statement of Revenues, Expenses and Changes in Net Assets by deducting depreciation and amortization of $51,067. Amount for prior years may be reconciled through similar calculations.(5) Represents debt service coverage ratio on first and second lien bonds.
Source: Chicago Midway Airport Audited Financial Statements and City of Chicago Comptroller’s Office.

- 54 -
CITY OF CHICAGO, ILLINOISCHICAGO MIDWAY INTERNATIONAL AIRPORT
DEBT SERVICE SCHEDULE (UNAUDITED)($ in thousands)
The following table sets forth aggregate annual debt service of principal and interest for outstanding Midway Airport Revenue Bonds:Year Debt Service Debt Service Debt Service (First Lien) Debt Service Debt Service Debt Service (Second Lien)
Ending Series 1996 Series 1998 Series 2001 Total Series 1998 Series 2004 Series 2010 Total TotalDecember 31 First Lien Bonds First Lien Bonds First Lien Bonds Debt Service Second Lien Bonds Second Lien Bonds Second Lien Bonds Debt Service (1) Debt Service
2012 10,519$ 22,719$ 21,124$ 54,362$ 119$ 11,868$ 12,034$ 24,021$ 78,383$ 2013 10,529 22,702 21,112 54,343 119 12,041 12,038 24,198 78,541 2014 10,522 22,705 21,097 54,324 119 12,180 12,934 25,233 79,557 2015 10,509 22,684 21,083 54,276 119 12,383 13,972 26,474 80,750 2016 10,504 22,694 21,071 54,269 119 12,448 19,564 32,131 86,400 2017 10,502 22,684 21,058 54,244 119 12,734 19,554 32,407 86,651 2018 10,494 22,674 21,040 54,208 119 12,923 19,543 32,585 86,793 2019 10,488 22,671 21,022 54,181 119 13,128 19,532 32,779 86,960 2020 10,480 22,664 21,029 54,173 119 13,334 19,521 32,974 87,147 2021 10,473 22,658 21,016 54,147 119 13,448 41,494 55,061 109,208 2022 10,467 22,646 21,005 54,118 119 13,761 19,477 33,357 87,475 2023 17,334 22,643 20,981 60,958 119 7,619 19,565 27,303 88,261 2024 17,313 22,632 20,968 60,913 119 7,885 19,448 27,452 88,365 2025 17,294 24,150 20,944 62,388 119 6,581 77,869 84,569 146,957 2026 17,274 24,137 20,926 62,337 119 6,872 19,367 26,358 88,695 2027 17,252 24,126 20,915 62,293 119 7,113 19,346 26,578 88,871 2028 17,230 24,113 20,888 62,231 119 7,454 19,334 26,907 89,138 2029 17,204 24,107 20,868 62,179 132,539 7,769 19,314 159,622 221,801 2030 51,656 20,840 72,496 8,134 19,298 27,432 99,928 2031 51,607 20,810 72,417 8,473 19,280 27,753 100,170 2032 51,550 51,550 8,837 19,256 28,093 79,643 2033 51,494 51,494 9,201 19,236 28,437 79,931 2034 51,439 51,439 9,614 19,211 28,825 80,264 2035 51,375 51,375 10,051 12,235 22,286 73,661 2036 12,215 12,215 12,215 2037 12,206 12,206 12,206 2038 12,179 12,179 12,179 2039 12,165 12,165 12,165 2040 12,143 12,143 12,143 2041 12,120 12,120 12,120 2042
236,388$ 724,530$ 419,797$ 1,380,715$ 134,562$ 245,851$ 585,450$ 965,863$ 2,346,578$
(1) Assumes an interest rate effective at December 31, 2011 on $365,150,000 of Second Lien Bonds that are variable-rate demand obligations.Note: The annual debt service tables in the Official Statements for the above debt were presented with a year ended January 1. The information above is presented with a year ended December 31. The change has been made to facilitate reconciliation to revenue bonds payable at December 31, 2011.Source: City of Chicago Comptroller’s Office.
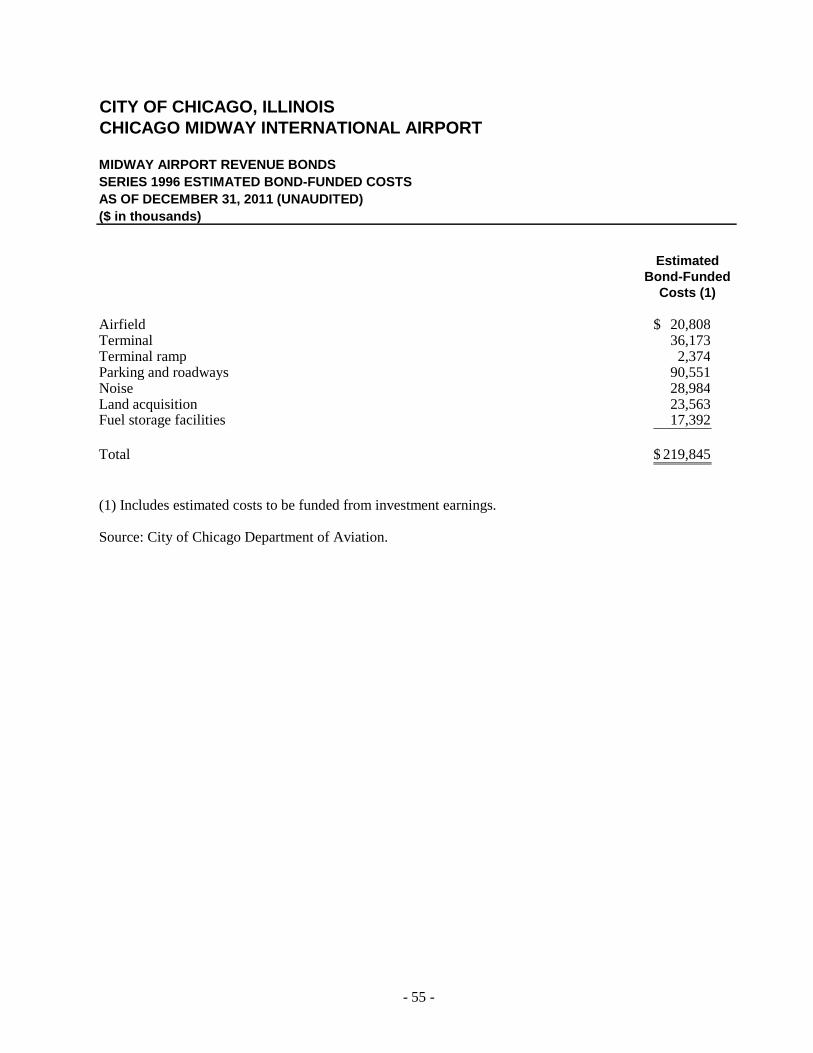
- 55 -
CITY OF CHICAGO, ILLINOISCHICAGO MIDWAY INTERNATIONAL AIRPORT
MIDWAY AIRPORT REVENUE BONDSSERIES 1996 ESTIMATED BOND-FUNDED COSTSAS OF DECEMBER 31, 2011 (UNAUDITED)($ in thousands)
EstimatedBond-Funded
Costs (1)
Airfield 20,808$ Terminal 36,173 Terminal ramp 2,374 Parking and roadways 90,551 Noise 28,984 Land acquisition 23,563 Fuel storage facilities 17,392
Total 219,845$
(1) Includes estimated costs to be funded from investment earnings.
Source: City of Chicago Department of Aviation.

- 56 -
CITY OF CHICAGO, ILLINOISCHICAGO MIDWAY INTERNATIONAL AIRPORT
CAPITAL IMPROVEMENT PROGRAM 2012–2018ESTIMATED SOURCES AND USES OF FUNDSAS OF DECEMBER 31, 2011 (UNAUDITED)($ in thousands)
ESTIMATED SOURCES: AIP — Entitlements 44,905$ Airport development fund Other airport funds 1,689 Series 2004 Bonds 488 Series 2010 Bonds 114,631 Future Bonds 159,742
TOTAL ESTIMATED SOURCES 321,455$
ESTIMATED USES: Terminal area projects (1) 19,570$ Land acquisition 14,939 Airfield projects 69,547 Parking/roadway projects 94,526 Noise projects 88,766 Safety and security 3,607 Implementation 30,500
TOTAL ESTIMATED USES 321,455$
(1) Terminal ramp is a reclassification of projects which were previously included in Airfield and Terminal projects.
Source: City of Chicago Department of Aviation.

- 57 -
CITY OF CHICAGO, ILLINOISCHICAGO MIDWAY INTERNATIONAL AIRPORT
TERMINAL DEVELOPMENT PROGRAMESTIMATED SOURCES AND USES OF FUNDSAS OF DECEMBER 31, 2011 (UNAUDITED)($ in thousands)
ESTIMATED SOURCES: AIP — Entitlements 19,600$ AIP — Discretionary 2,700 Airport development fund 6,200 Federal Highway Grant 6,500 Series 1996 Bonds 156,000 Series 1998 Bonds 359,000 Series 2001 Bonds 68,500 Series 2004 Bonds 40,800
TOTAL ESTIMATED SOURCES (1) 659,300$
ESTIMATED USES: Terminal projects 340,100$ Terminal ramp projects 24,900 Airfield projects 28,600 Parking/roadway projects 149,600 Development of FIS 22,500 Implementation costs 93,600
TOTAL ESTIMATED USES 659,300$
(1) The estimated sources and uses of the Terminal Development Program include approximately $631 million of funds expended through December 31, 2011.
Source: City of Chicago Department of Aviation.

- 58 -
CITY OF CHICAGO, ILLINOISCHICAGO MIDWAY INTERNATIONAL AIRPORT
HISTORICAL ENPLANED PASSENGERSEACH OF THE TEN YEARS ENDED DECEMBER 31, 2002–2011 (UNAUDITED)
Domestic Domestic Total International Total PercentYears Air Carrier Commuter Domestic Enplanements Enplanements Change
2002 7,531,464 561,917 8,093,381 115,131 8,208,512 10.0 %2003 8,228,230 658,478 8,886,708 113,665 9,000,373 9.7 2004 8,815,951 656,468 9,472,419 153,481 9,625,900 7.0 2005 8,501,430 99,991 8,601,421 104,382 8,705,803 (9.6) 2006 9,049,740 57,734 9,107,474 91,058 9,198,532 5.7 2007 9,296,778 56,764 9,353,542 60,639 9,414,181 2.3 2008 8,310,041 31,771 8,341,812 16,475 8,358,287 (11.2) 2009 8,541,786 158 8,541,944 29,903 8,571,847 2.6 2010 8,792,557 14,156 8,806,713 49,312 8,856,025 3.3 2011 9,288,332 50,489 9,338,821 119,989 9,458,810 6.8
2002–2011 2.4 % (23.5)% 1.6 % 0.5 % 1.6 %
Source: City of Chicago Department of Aviation.Note: International traffic was added by Volaris Airline to Mexico in 2011
Average Annual Compound Growth Rates

- 59 -
CITY OF CHICAGO, ILLINOISCHICAGO MIDWAY INTERNATIONAL AIRPORT
ENPLANED COMMERCIAL PASSENGERS BY AIRLINEEACH OF THE TEN YEARS ENDED DECEMBER 31, 2002–2011 (UNAUDITED)
% of % of % of % of % of % of % of % of % of % ofEnplanements Total Enplanements Total Enplanements Total Enplanements Total Enplanements Total Enplanements Total Enplanements Total Enplanements Total Enplanements Total Enplanements Total
Southwest Airlines 3,348,624 40.9 % 3,651,618 40.5 % 3,967,477 41.2 % 5,542,890 63.6 % 6,666,986 72.5 % 7,147,154 75.9 % 6,941,870 83.1 % 7,188,750 83.9 % 7,561,053 85.4 % 8,196,402 86.7 %
American Trans Air (4) 3,032,663 37.0 3,473,581 38.5 3,668,159 38.1 1,714,873 19.6 783,224 8.5 686,065 7.3 54,650 0.7
AirTran 296,909 3.6 248,891 2.8 229,040 2.4 338,057 3.9 681,936 7.4 645,363 7.0 512,429 6.1 487,087 5.7 465,237 5.3 413,717 4.4
Northwest Airlines 329,709 4.0 357,425 4.0 349,161 3.6 290,080 3.3 285,310 3.1 280,911 3.0 237,969 2.8 267,433 3.1 14,726 0.2
Frontier 101,035 1.1 134,593 1.4 154,120 1.8 189,216 2.1 206,675 2.2 207,674 2.5 164,749 1.9 151,440 1.7 158,405 1.7
Shuttle America (Delta Express) 144,539 1.5 223,153 2.7 181,356 2.0 90,544 1.0 8,874 0.1
Atlantic Southeast 99,373 1.1 61,460 0.6 882 3,715 0.1 29,314 0.3
Continental Airlines (1) 148,946 1.8 140,100 1.6 162,823 1.7 63,433 0.7 84,153 0.9 48,478 0.5 6,601 0.1
Continental Express 53,458 0.6 53,363 0.6 37,500 0.4 4,372 0.1
Comair 23,818 0.3 17,655 0.2 5,123 0.1 4,371 0.1 19,264 0.1 21,135 0.1 14,156 0.2
American 116,071 1.4 153,043 1.7 143,211 1.5 113,818 1.3 60,793 0.7 164
Delta (2) 175,323 2.1 163,104 1.8 184,166 1.9 86,621 1.0 144,037 1.7 176,231 2.0 239,357 2.5
United 106,951 1.3 74,520 0.8
American Eagle/Simmons 22,267 0.2 7,599 0.1 27,863 0.3
U.S. Airways (3) 17,644 0.2 25,293 0.3 14,116 0.1
Chicago Express 564,951 6.3 570,580 5.9 41,410 0.5
Mexicana 33,045 0.4 5,786 0.1
All other airlines 709,578 8.6 91,728 1.0 162,652 1.7 187,370 2.2 187,424 2.0 136,608 1.5 147,552 1.8 134,720 1.6 353,324 3.9 442,055 4.6
Total 8,208,512 100.0 % 9,000,373 100.0 % 9,625,900 100.0 % 8,705,803 100.0 % 9,198,532 100.0 % 9,414,181 100.0 % 8,358,287 100.0 % 8,571,847 100.0 % 8,856,025 100.0 % 9,458,810 100.0 %
(1) Continental includes commuter affiliate Continental Express for the years 1999–2004.(2) Delta includes commuter affiliate Comair for the years 1999–2004. Delta commenced scheduled service to Atlanta from Midway in September 2001.(3) U.S. Airways ceased operations at Midway on March 2005.(4) American Trans Air ceased operations at Midway on April 3, 2008.
201120082002 2003 2009 20102006 20072004 2005

- 60 -
CITY OF CHICAGO, ILLINOISCHICAGO MIDWAY INTERNATIONAL AIRPORT
HISTORICAL ENPLANED PASSENGERSCHICAGO REGION AIRPORTSEACH OF THE TEN YEARS ENDED DECEMBER 31, 2002–2011 (UNAUDITED)
Percent PercentTotal of Total Total of Total Total
Years Enplanements Chicago Enplanements Chicago Enplanements
2002 8,208,512 19.9 % 32,938,702 80.1 % 41,147,214 2003 9,000,373 20.7 34,454,921 79.3 43,455,294 2004 9,625,900 20.4 37,464,632 79.6 47,090,532 2005 8,705,803 18.7 37,970,886 81.3 46,676,689 2006 9,198,532 19.6 37,784,336 80.4 46,982,868 2007 9,414,181 19.9 37,779,576 80.1 47,193,757 2008 8,358,287 19.4 34,744,030 80.6 43,102,317 2009 8,571,847 21.1 32,047,097 78.9 40,618,944 2010 8,856,025 21.0 33,232,412 79.0 42,088,437 2011 9,458,810 22.2 33,206,867 78.0 42,665,677
2002–2011 2.7 % .0 % 0.5 %
Source: City of Chicago Department of Aviation.
Average Annual Compound Growth Rates
Chicago MidwayInternational Airport
Chicago O’HareInternational Airport

- 61 -
CITY OF CHICAGO, ILLINOISCHICAGO MIDWAY INTERNATIONAL AIRPORT
HISTORICAL TOTAL ORIGIN AND DESTINATION (O&D) ENPLANEMENTSCHICAGO REGION AIRPORTSEACH OF THE TEN YEARS ENDED DECEMBER 31, 2002–2011 (UNAUDITED)
Total Percent Total Percent TotalO&D of Total O&D of Total O&D
Years Enplanements Chicago Enplanements Chicago Enplanements
2002 5,700,605 27.2 % 15,279,859 72.8 % 20,980,464 2003 6,243,039 28.9 15,331,493 71.1 21,574,532 2004 6,634,138 28.3 16,799,401 71.7 23,433,539 2005 6,431,517 26.8 17,548,038 73.2 23,979,555 2006 6,708,494 27.1 18,058,904 72.9 24,767,398 2007 6,532,362 26.4 18,223,460 73.6 24,755,822 2008 5,910,045 25.0 17,685,020 75.0 23,595,065 2009 5,647,591 26.4 15,708,291 73.6 21,355,882 2010 5,485,191 23.9 17,419,794 76.1 22,904,985
2011 (1) 5,722,804 26.2 16,082,161 73.8 21,804,965
2002–2011 % 0.6 % 0.4 %
(1) Estimated based on eleven months of activity.
Average Annual Compound Growth Rates
International AirportChicago Midway
International AirportChicago O’Hare

- 62 -
CITY OF CHICAGO, ILLINOISCHICAGO MIDWAY INTERNATIONAL AIRPORT
AIRCRAFT OPERATIONSEACH OF THE TEN YEARS ENDED DECEMBER 31, 2002–2011 (UNAUDITED)
Domestic International Total Domestic GeneralYears Air Carrier Air Carrier Air Carrier Commuter Aviation Military Total
2002 161,401 1,965 163,366 48,102 91,880 956 304,304 2003 169,282 1,630 170,912 57,824 99,289 328,025 2004 181,750 2,472 184,222 57,905 97,381 339,508 2005 184,863 1,669 186,532 7,444 95,603 289,579 2006 199,229 1,433 200,662 3,066 94,820 298,548 2007 206,865 1,060 207,925 3,085 93,647 304,657 2008 186,840 557 187,397 1,351 77,593 266,341 2009 180,391 3,354 183,745 7 61,057 244,809 2010 175,812 3,403 179,215 572 65,746 245,533 2011 178,640 4,332 182,972 2,622 69,633 255,227
2002–2011 1.1 % 9.2 % 1.3 % (27.6)% (3.0)% (1.9)%
Source: City of Chicago Department of Aviation.
Aircraft Operations
Average Annual Compound Growth Rates

- 63 -
CITY OF CHICAGO, ILLINOISCHICAGO MIDWAY INTERNATIONAL AIRPORT
NET ASSETS BY COMPONENTEACH OF THE SIX YEARS ENDED DECEMBER 31, 2006–2011 (UNAUDITED)($ in thousands)
2006 2007 2008 2009 2010 2011
Net assets: Invested in capital assets — net of related debt 48,388$ 31,251$ 40,352$ (1,936)$ (39,755)$ (70,876)$ Restricted 215,589 232,344 184,019 201,158 190,641 208,100 Unrestricted 31,561 18,795 19,614 5,792 20,040 37,224
Total net assets 295,538$ 282,390$ 243,985$ 205,014$ 170,926$ 174,448$
Ten year information will be provided prospectively starting with year 2006.

- 64 -
CITY OF CHICAGO, ILLINOISCHICAGO MIDWAY INTERNATIONAL AIRPORT
CHANGE IN NET ASSETSEACH OF THE SIX YEARS ENDED DECEMBER 31, 2006 - 2011 (UNAUDITED)($ in thousands)
2006 2007 2008 2009 2010 2011
Operating revenues 105,570$ 652,763$ 124,985$ 122,301$ 149,056$ 157,371$ Operating expenses 135,276 544,890 155,596 147,308 161,103 161,156
Operating (loss) gain (29,706) 107,873 (30,611) (25,007) (12,047) (3,785)
Nonoperating (expenses) revenues (5,325) 18,363 (14,571) (13,964) (24,502) 4,246
(Loss) gain before capital grants (35,031) 126,236 (45,182) (38,971) (36,549) 461
Capital grants 22,217 48,253 6,777 2,461 3,061
Change in net assets (12,814)$ 174,489$ (38,405)$ (38,971)$ (34,088)$ 3,522$
Ten year information will be provided prospectively starting with year 2006.

- 65 -
CITY OF CHICAGO, ILLINOISCHICAGO MIDWAY INTERNATIONAL AIRPORT
LONG TERM DEBTEACH OF THE SIX YEARS ENDED DECEMBER 31, 2006–2011 (UNAUDITED)($ in thousands)
2006 2007 2008 2009 2010 2011
First lien bonds 849,400$ 835,780$ 821,275$ 806,015$ 783,595$ 780,205$ Second lien bonds 422,715 422,715 422,715 399,140 685,780 681,285 Commercial paper notes 10,269 10,674 10,674 61,360 4,005
Total revenue bonds and notes 1,282,384$ 1,269,169$ 1,254,664$ 1,266,515$ 1,473,380$ 1,461,490$
Ten year information will be provided prospectively starting with year 2006.
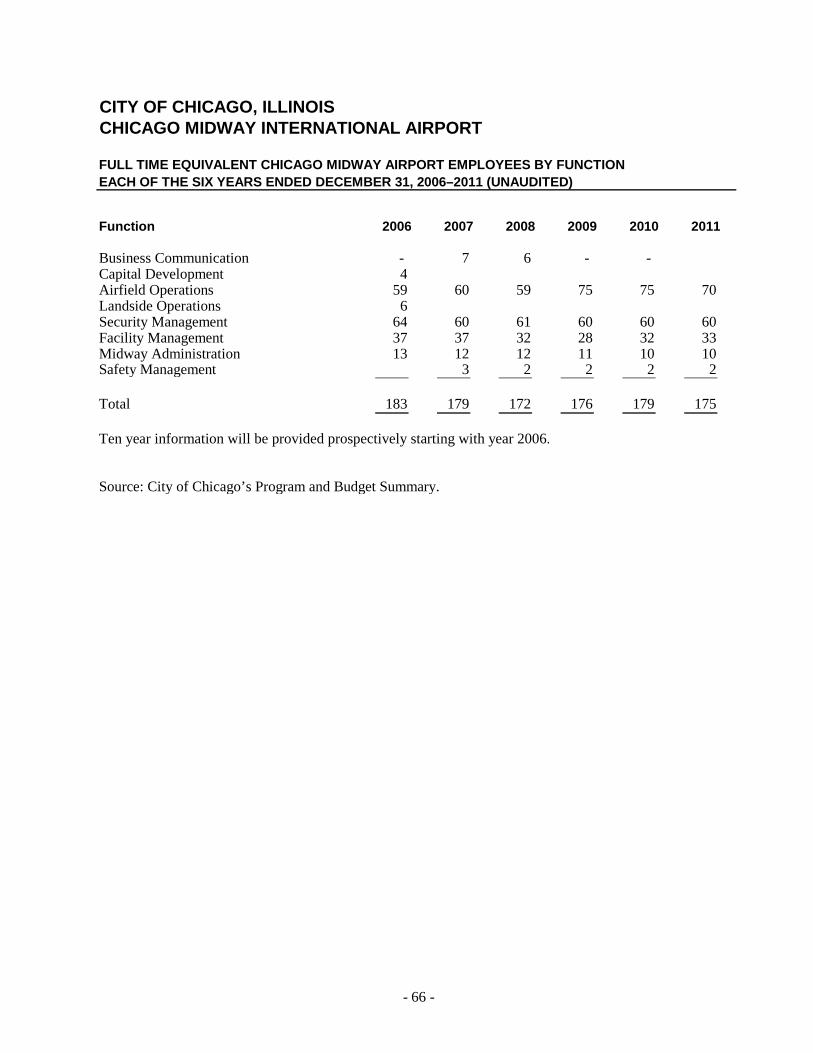
- 66 -
CITY OF CHICAGO, ILLINOISCHICAGO MIDWAY INTERNATIONAL AIRPORT
FULL TIME EQUIVALENT CHICAGO MIDWAY AIRPORT EMPLOYEES BY FUNCTIONEACH OF THE SIX YEARS ENDED DECEMBER 31, 2006–2011 (UNAUDITED)
Function 2006 2007 2008 2009 2010 2011
Business Communication - 7 6 - - Capital Development 4 Airfield Operations 59 60 59 75 75 70 Landside Operations 6 Security Management 64 60 61 60 60 60 Facility Management 37 37 32 28 32 33 Midway Administration 13 12 12 11 10 10 Safety Management 3 2 2 2 2
Total 183 179 172 176 179 175
Ten year information will be provided prospectively starting with year 2006.
Source: City of Chicago’s Program and Budget Summary.

- 67 -
CITY OF CHICAGO, ILLINOISCHICAGO MIDWAY INTERNATIONAL AIRPORT
STATISTICAL DATA PRINCIPAL EMPLOYERS (NONGOVERNMENT)CURRENT YEAR AND NINE YEARS AGO (SEE NOTE AT THE END OF THIS PAGE)(Unaudited)
Percentage Percentageof of
Number of Total City Number of Total CityEmployer Employees Rank Employment Employees Rank Employment
J. P. Morgan Chase (2) 7,993 1 0.77 % 6,320 4 0.57 %United Airlines 6,366 2 0.62 8,656 2 0.79Northern Trust 5,485 3 0.53 5,312 5 0.48Accenture LLP 5,014 4 0.48 4,399 10 0.40Jewel Food Stores, Inc. 4,799 5 0.46 5,249 7 0.48Bank of America NT 4,557 6 0.44Walgreen's Co. 4,429 7 0.43CVS Corporation 4,159 8 0.40ABM Janitorial Midwest, Inc. 3,629 9 0.35Ford Motor Company 3,410 10 0.33 5,269 6 0.48American Airlines 4,666 8 0.42Arthur Andersen, LLP 4,570 9 0.41SBCAmeritech 17,165 1 1.56Exelon Corporation 7,538 3 0.68
(1) Source: City of Chicago, Department of Revenue, Employer’s Expense Tax Returns.(2) J.P. Morgan Chase formerly known as Banc One.(3) Ameritech currently known as SBC/AT&T.
2002 (1)2011 (1)

- 68 -
CITY OF CHICAGO, ILLINOISCHICAGO MIDWAY INTERNATIONAL AIRPORT
STATISTICAL DATA POPULATION AND INCOME STATISTICSEACH OF THE TEN YEARS ENDED DECEMBER 31, 2002-2011(Unaudited)
Median Number of Unemployment Per Capita Total Year Population (1) Age (2) Households(2) Rate (3) Income (4) Income (5)
2002 2,896,016 31.9 1,059,960 8.5 % 35,085 101,606,721,360$ 2003 2,896,016 32.6 1,067,823 8.2 35,464 102,704,311,424 2004 2,896,016 32.6 1,051,018 7.2 37,169 107,642,018,704 2005 2,896,016 33.0 1,045,282 7.0 38,439 111,319,959,024 2006 2,896,016 33.5 1,040,000 5.2 41,887 121,305,422,192 2007 2,896,016 33.7 1,033,328 5.7 43,714 126,596,443,424 2008 2,896,016 34.1 1,032,746 6.4 45,329 131,273,509,264 2009 2,896,016 34.5 1,037,069 10.0 43,727 126,634,091,632 2010 2,695,598 34.8 1,045,666 10.1 45,957 123,881,597,286 2011 2,695,598 33.2 1,048,222 9.3 N/A (5) N/A (5)
Notes:(1) Source: U.S. Census Bureau.(2) Source: World Business Chicago website, Claritas date estimates; Cook County’s website.(3) Source: Bureau of Labor Statistics 2011, Unemployment rate for Chicago-Naperville-Illinois Metropolitan Area.(4) Source: U.S. Department of Commerce, Bureau of Economic Analysis, Per Capita Personal Income for Chicago-Naperville-Illinois Metropolitan Area (in 2010 dollars).

- 69 -
CITY OF CHICAGOCHICAGO MIDWAY INTERNATIONAL AIRPORT
STATISTICAL DATALANDING FEES AND TERMINAL AREA USE CHARGES(Unaudited)
2011
Landing Fees and Terminal Area Use Charges
Signatory Landing Fee (Rate/1000 lbs) 2.79$ Non-Signatory Landing Fee (Rate/1000 lbs) 3.48
Signatory Joint Use Fee (Base Usage/1000 lbs) 1.28 Non-Signatory Joint Use Fee (Base Usage/1000 lbs) 1.60
Signatory Joint Use Fee (Per Capita/Annual) 179,845Non-Signatory Joint Use Fee (Per Capita/Annual) 224,806
Signatory Terminal Rental Rate 109.26 Non-Signatory Terminal Rental Rate 136.58
Terminal Ramp Rate 3.85
Signatory FIS Fee per Deplaned Passenger 16.00 Non-Signatory F/S Fee per Deplaned Passenger 20.00
Cost per Departure Rate (1) 158.44
(1) The cost per departure is for Gates A1, A2, A3, A4A, A4B, A10, A12 and B25
Under the residual Use Agreement, these rates are the estimated rates assessed to airlines as of 12/31/11.