2011 crop budget - amarillo.tamu.edu
TRANSCRIPT

Dr. Steve Amosson, Regents Fellow, District 1 Extension Economist—Management Dr. Lal Almas, Associate Professor, West Texas A&M University
DeDe Jones, Risk Management Specialist II, Texas AgriLife Extension Leon Guerrero, Office Assistant, Texas AgriLife Extension
2011
Texas Crop and Livestock Enterprise Budgets
TEXAS HIGH PLAINS
B-1241 (C1)

INTRODUCTION TO THE TEXAS CROP AND LIVESTOCK ENTERPRISE BUDGETS
TEXAS HIGH PLAINS 2011
Dr. Steve Amosson, Regents Fellow, Professor and Extension Economist Texas AgriLife Extension Center, Amarillo, Texas
Estimating the production costs and returns of agricultural enterprises for planning purposes is a difficult, yet an important, task. Timing and accurate cost of production estimates are necessary: (1) to make input use decisions and arrange for operating capital requirements, (2) for enterprise selection, (3) to estimate the potential profitability of capital investment alternatives, and (4) to develop strategies and assess their impacts on costs and returns.
Budgeting is a tool, which can be used for analysis of problems ranging from day-to-day detailed choices to major questions about the size and type of farm businesses. Budgeting, as a management tool, is the testing and estimation of likely outcomes from decisions before they are implemented. Enterprise budgets are both a product of and the building block for the planning process.
The Texas Crop and Livestock Enterprise Budgets are projected enterprise budgets prepared by the Texas AgriLife Extension Center to assist farmers and ranchers in estimating "real" economic cost and returns of production, in current dollars. The information presented in the budgets is prepared as a management planning guideline correlated to the general agricultural conditions existing in the 22 county area of the Panhandle and, therefore, is not intended to recognize or predict the costs and returns from any particular agricultural production operation. The cost of fertilizer per pound in these budgets is based on a cost per unit of active ingredient. It is suggested that users modify the budgets to fit their individual situations by making changes in yields, input levels, prices and other factors. A five-year average yield and estimates for the major crops as published by the Texas Agricultural Statistics Service for each of the 42 counties of the High Plains are provided following the budgets. This additional information may be valuable in adjusting yields to more closely fit your county. In addition, weekly cash prices for corn, sorghum, soybean and wheat (Amarillo Terminal Prices) and cotton (Lubbock) are depicted graphically for the last four years. Cash prices, futures prices and basis for these commodities are updated weekly and can be found at http://agecoext.tamu.edu/resources/basis-data.
The input and output prices for these budget estimates were submitted November 1, 2010 for the 2011 crop production year. Therefore, these budgets should not be used without updating prices as necessary.

TABLE OF CONTENTS
Alfalfa Establishment, Sprinkler Irrigated (Natural Gas) Fall Seeding Only ....................... 1
Alfalfa, Sprinkler Irrigated (Natural Gas) ............................................................................. 3
Bt Corn (corn borer) for Grain, Furrow Irrigated (Natural Gas) .......................................... 5
Bt Corn (corn borer) for Grain, Sprinkler Irrigated (Natural Gas) ....................................... 7
Bt Corn (corn borer) for Grain, Strip Till ............................................................................. 9
Corn Silage; Sprinkler Irrigated (Natural Gas) ..................................................................... 11
Cotton, Dryland (Roundup Ready Flex) ............................................................................... 13
Cotton, Sprinkler Irrigated (Roundup Ready Flex) .............................................................. 15
Peanuts, Runner, Sprinkler Irrigated ..................................................................................... 17
Rotation: Sorghum-Fallow-Wheat: Minimum Tillage Sorghum Budget ............................. 19
Rotation: Sorghum-Fallow-Wheat: Minimum Tillage Fallow Budget ................................. 21
Rotation: Sorghum-Fallow-Wheat: Minimum Tillage Wheat (w/grazing) .......................... 23
Sorghum, Dryland, Continuous, Minimum Tillage .............................................................. 25
Continuous Sorghum, Furrow Irrigated (Natural Gas) ......................................................... 27
Continuous Sorghum, Sprinkler Irrigated (Natural Gas) ...................................................... 29
Soybeans, Roundup Ready, Furrow Irrigated (Natural Gas) following corn/sorghum ........ 31
Soybeans, Roundup Ready, Sprinkler Irrigated (Natural Gas) ............................................. 33
Oilseed Sunflowers, Dryland, Strip-tillage ........................................................................... 35
Oilseed Sunflowers, Sprinkler Irrigated, Strip-Tillage ......................................................... 37
Confectionary Sunflowers, Sprinkler Irrigated, Strip-Tillage .............................................. 39
Continuous Wheat, Dryland, Grazed .................................................................................... 41
Continuous Wheat, Furrow Irrigated (Natural Gas) ............................................................. 43
Continuous Wheat, Sprinkler Irrigated (Natural Gas) .......................................................... 45
Sorghum-Sudangrass, Dryland – Grazing ............................................................................ 47
Sorghum Sudangrass, Sprinkler Irrigated, (Natural Gas) grazing ........................................ 49
Sorghum Silage, Sprinkler Irrigated ..................................................................................... 51
Roundup Ready Canola, Dryland ......................................................................................... 53
Roundup Ready Canola, Sprinkler Irrigated (Natural Gas) .................................................. 55
Table 1. Parameters ............................................................................................................... 57
Table 2. Self-Propelled Machines ......................................................................................... 58
Table 3. Tractors ................................................................................................................... 59
Table 4. Implements .............................................................................................................. 60
Table 5. Operating Inputs ..................................................................................................... 61

TABLE OF CONTENTS (CONT’D)
Table 6. Other Durable Inputs .............................................................................................. 62
Table 7. Operating Input Categories ..................................................................................... 63
Table 8. Products .................................................................................................................. 64
Table 9. Allocated Cost Items ............................................................................................... 65
Cow-Calf Budget .................................................................................................................. 67
Winter Stocker Calf Budget .................................................................................................. 69
Summer Stocker Calf Budget ............................................................................................... 71
High Plains Cash Prices ........................................................................................................ 73
Weekly Cash Prices, 2005-2009, Amarillo Corn and Sorghum ........................................... 74
Weekly Cash Prices, 2005-2009, Amarillo Soybeans and Wheat ........................................ 75
Weekly Cash Prices, 2005-2009, Lubbock Cotton ............................................................... 76
Texas High Plains Crop Statistics Yields, 2005-2009, Corn, Irrigated ................................ 77
Texas High Plains Crop Acreages, 2005-2009, Corn, Irrigated ........................................... 78
Texas High Plains Crop Statistics Yields, 2005-2009, Cotton Irrigated .............................. 79
Texas High Plains Crop Acreages, 2005-2009, Cotton, Irrigated ........................................ 80
Texas High Plains Crop Statistics Yields, 2005-2009, Cotton, Dryland .............................. 81
Texas High Plains Crop Acreages, 2005-2009, Cotton, Dryland ......................................... 82
Texas High Plains Crop Statistics Yields, 2005-2009, Sorghum, Irrigated.......................... 83
Texas High Plains Crop Acreages, 2005-2009, Sorghum, Irrigated..................................... 84
Texas High Plains Crop Statistics Yields, 2005-2009, Sorghum, Dryland .......................... 85
Texas High Plains Crop Acreages, 2005-2009, Sorghum, Dryland ..................................... 86
Texas High Plains Crop Statistics Yields, 2005-2009, Wheat, Irrigated .............................. 87
Texas High Plains Crop Acreages, 2005-2009, Wheat, Irrigated ......................................... 88
Texas High Plains Crop Statistics Yields, 2005-2009, Wheat, Dryland .............................. 89
Texas High Plains Crop Acreages, 2005-2009, Wheat, Dryland ......................................... 90
Texas High Plains Crop Statistics Yields, 2005-2009, Soybeans, Irrigated ......................... 91
Texas High Plains Crop Acreages, 2005-2009, Soybeans, Irrigated .................................... 91
Texas High Plains Crop Statistics Yields, 2005-2009, Peanuts, Irrigated ............................ 92
Texas High Plains Crop Acreages, 2005-2009, Peanuts, Irrigated ....................................... 92
Texas High Plains Crop Statistics Yields, 2005-2009, Peanuts, Dryland ............................ 92
Texas High Plains Crop Acreages, 2005-2009, Peanuts, Dryland ....................................... 92

B-1241 (C1)Projections for Planning Purposes OnlyNot to be Used without Updating after December 15, 2010
Table 1.A Estimated costs and returns per Acre Alfalfa Est., Sprinkler Irrig. (NG) Fall Seeding Only 2011 Projected Costs and Returns per Acre _______________________________________________________________________ITEM UNIT PRICE QUANTITY AMOUNT YOUR FARM_______________________________________________________________________ dollars dollars INCOME -------- TOTAL INCOME 0.00 _________ DIRECT EXPENSES SEED seed - alfalfa lb. 3.45 18.0000 62.10 _________ HERBICIDE herb&appl-alfalfa acre 26.00 1.0000 26.00 _________ FERTILIZER fert(P) - dry lb. 0.70 80.0000 56.00 _________ CUSTOM fert application acre 5.00 1.0000 5.00 _________ OPERATOR LABOR Implements hour 10.30 0.7110 7.32 _________ Tractors hour 10.30 0.8046 8.28 _________ HAND LABOR Implements hour 10.30 0.2121 2.18 _________ IRRIGATION LABOR Center Pivot hour 10.30 0.3840 3.95 _________ DIESEL FUEL Tractors gal 2.65 3.0917 8.19 _________ GASOLINE Self-Propelled Eq. gal 2.73 2.0100 5.48 _________ NATURAL GAS Center Pivot Mcf 4.75 6.0000 28.50 _________ REPAIR & MAINTENANCE Implements Acre 6.76 1.0000 6.76 _________ Tractors Acre 7.65 1.0000 7.65 _________ Self-Propelled Eq. Acre 0.16 1.0000 0.16 _________ Center Pivot ac-in 2.03 6.0000 12.18 _________ INTEREST ON OP. CAP. Acre 1.43 1.0000 1.43 _________ -------- TOTAL DIRECT EXPENSES 241.23 _________RETURNS ABOVE DIRECT EXPENSES -241.23 _________ FIXED EXPENSES Implements Acre 10.35 1.0000 10.35 _________ Tractors Acre 10.96 1.0000 10.96 _________ Self-Propelled Eq. Acre 0.25 1.0000 0.25 _________ Center Pivot Acre 33.60 1.0000 33.60 _________ -------- TOTAL FIXED EXPENSES 55.17 _________ -------- TOTAL SPECIFIED EXPENSES 296.41 _________RETURNS ABOVE TOTAL SPECIFIED EXPENSES -296.41 _________ ALLOCATED COST ITEMS cash rent - alfalfa acre 110.00 1.0000 110.00 _________RESIDUAL RETURNS -406.41 ________________________________________________________________________________Projections for Planning Purposes Only.
Information presented is prepared solely as a general guide & not intended to recognize or predict the costs & returns from any one operation. Developed by Texas AgriLife Extension Service.
Page 1

B-1241 (C1)Projections for Planning Purposes OnlyNot to be Used without Updating after December 15, 2010
Table 1.B Estimated resource use and costs for field operations, per Acre Alfalfa Est., Sprinkler Irrig. (NG) Fall Seeding Only 2011 Projected Costs and Returns per Acre _____________________________________________________________________________________________________________________________________________ TRACTOR COST EQUIP COST ALLOC LABOR OPERATING INPUT OPERATION/ SIZE/ TRACTOR PERF TIMES -------------- -------------- ------------- ---------------------- TOTAL OPERATING INPUT UNIT SIZE RATE OVER MTH DIRECT FIXED DIRECT FIXED HOURS COST AMOUNT PRICE COST COST _____________________________________________________________________________________________________________________________________________ ------------dollars----------- dollars -------dollars-------- chisel 125 0.099 1.00 Jul 3.35 2.47 0.69 1.15 0.219 2.25 9.93 disc offset 100 0.078 1.00 Aug 2.17 1.64 1.54 2.25 0.173 1.78 9.40 disc tandem 100 0.138 1.00 Aug 3.81 2.87 1.52 2.23 0.303 3.12 13.57 fert application acre 1.00 Aug 1.0000 5.00 5.00 5.00 fert(P) - dry lb. 80.0000 0.70 56.00 56.00 packer 40 0.276 1.00 Aug 3.67 2.24 1.49 2.19 0.607 6.25 15.87 grain drill 40 0.212 1.00 Aug 2.82 1.72 1.50 2.51 0.424 4.36 12.93 seed - alfalfa lb. 18.0000 3.45 62.10 62.10 Center Pivot ac-in 1.00 Sep 13.56 33.60 0.128 1.31 2.0000 48.47 Center Pivot ac-in 1.00 Sep 13.56 0.128 1.31 2.0000 14.87 Pickup Truck 3/4 ton 0.006 20.00 Oct 5.65 0.25 5.90 herb&appl-alfalfa acre 1.00 Oct 1.0000 26.00 26.00 26.00 Center Pivot ac-in 1.00 Nov 13.56 0.128 1.31 2.0000 14.87 ------- ------- ------- ------- ------ ------- ------- ------- TOTALS 15.85 10.96 53.09 44.20 2.111 21.75 149.10 294.97 INTEREST ON OPERATING CAPITAL 1.43 UNALLOCATED LABOR 0.00 TOTAL SPECIFIED COST 296.41 _____________________________________________________________________________________________________________________________________________Projections for Planning Purposes Only.
Information presented is prepared solely as a general guide & not intended to recognize or predict the costs & returns from any one operation. Developed by Texas AgriLife Extension Service.
Page 2

B-1241 (C1)Projections for Planning Purposes OnlyNot to be Used without Updating after December 15, 2010
Table 2.A Estimated costs and returns per Acre Alfalfa, Sprinkler Irrigated, (NG) 2011 Projected Costs and Returns per Acre _______________________________________________________________________ITEM UNIT PRICE QUANTITY AMOUNT YOUR FARM_______________________________________________________________________ dollars dollars INCOME hay - alfalfa ton 175.00 5.5000 962.50 _________ -------- TOTAL INCOME 962.50 _________ DIRECT EXPENSES FERTILIZER fert(P) - liquid lb. 0.71 60.0000 42.60 _________ CUSTOM fert application acre 5.00 1.0000 5.00 _________ insec appl - alfalfa appl 15.40 1.0000 15.40 _________ herb+appl - alfalfa acre 26.00 1.0000 26.00 _________ custom baling ton 25.00 5.5000 137.50 _________ IRRIGATION LABOR Center Pivot hour 10.30 1.5360 15.82 _________ GASOLINE Self-Propelled Eq. gal 2.73 2.0100 5.48 _________ NATURAL GAS Center Pivot Mcf 4.75 24.0000 114.00 _________ REPAIR & MAINTENANCE Self-Propelled Eq. Acre 0.16 1.0000 0.16 _________ Center Pivot ac-in 2.03 24.0000 48.72 _________ INTEREST ON OP. CAP. Acre 5.84 1.0000 5.84 _________ -------- TOTAL DIRECT EXPENSES 416.53 _________RETURNS ABOVE DIRECT EXPENSES 545.96 _________ FIXED EXPENSES Self-Propelled Eq. Acre 0.25 1.0000 0.25 _________ Center Pivot Acre 33.60 1.0000 33.60 _________ -------- TOTAL FIXED EXPENSES 33.85 _________ -------- TOTAL SPECIFIED EXPENSES 450.39 _________RETURNS ABOVE TOTAL SPECIFIED EXPENSES 512.10 _________ ALLOCATED COST ITEMS cash rent - alfalfa acre 110.00 1.0000 110.00 _________RESIDUAL RETURNS 402.10 _________ perennial crop acre 49.89 1.0000 49.89 _________RESIDUAL RETURNS 352.21 ________________________________________________________________________________Projections for Planning Purposes Only.
Information presented is prepared solely as a general guide & not intended to recognize or predict the costs & returns from any one operation. Developed by Texas AgriLife Extension Service.
Page 3

B-1241 (C1)Projections for Planning Purposes OnlyNot to be Used without Updating after December 15, 2010
Table 2.B Estimated resource use and costs for field operations, per Acre Alfalfa, Sprinkler Irrigated, (NG) 2011 Projected Costs and Returns per Acre _____________________________________________________________________________________________________________________________________________ TRACTOR COST EQUIP COST ALLOC LABOR OPERATING INPUT OPERATION/ SIZE/ TRACTOR PERF TIMES -------------- -------------- ------------- ---------------------- TOTAL OPERATING INPUT UNIT SIZE RATE OVER MTH DIRECT FIXED DIRECT FIXED HOURS COST AMOUNT PRICE COST COST _____________________________________________________________________________________________________________________________________________ ------------dollars----------- dollars -------dollars-------- fert application acre 1.00 Mar 1.0000 5.00 5.00 5.00 fert(P) - liquid lb. 60.0000 0.71 42.60 42.60 Center Pivot ac-in 1.00 Mar 20.34 33.60 0.192 1.97 3.0000 55.91 Pickup Truck 3/4 ton 0.006 20.00 Mar 5.65 0.25 5.90 Center Pivot ac-in 1.00 Apr 20.34 0.192 1.97 3.0000 22.31 Center Pivot ac-in 1.00 May 30.51 0.288 2.96 4.5000 33.47 insec appl - alfalfa appl 1.00 May 1.0000 15.40 15.40 15.40 herb+appl - alfalfa acre 1.0000 26.00 26.00 26.00 Center Pivot ac-in 1.00 Jun 30.51 0.288 2.96 4.5000 33.47 Center Pivot ac-in 1.00 Jul 30.51 0.288 2.96 4.5000 33.47 Center Pivot ac-in 1.00 Aug 30.51 0.288 2.96 4.5000 33.47 custom baling ton 1.00 Sep 5.5000 25.00 137.50 137.50 ------- ------- ------- ------- ------ ------- ------- ------- TOTALS 0.00 0.00 168.37 33.85 1.536 15.82 226.50 444.54 INTEREST ON OPERATING CAPITAL 5.84 UNALLOCATED LABOR 0.00 TOTAL SPECIFIED COST 450.39 _____________________________________________________________________________________________________________________________________________Projections for Planning Purposes Only.
Information presented is prepared solely as a general guide & not intended to recognize or predict the costs & returns from any one operation. Developed by Texas AgriLife Extension Service.
Page 4
B-1241 (C1)Projections for Planning Purposes OnlyNot to be Used without Updating after December 15, 2010
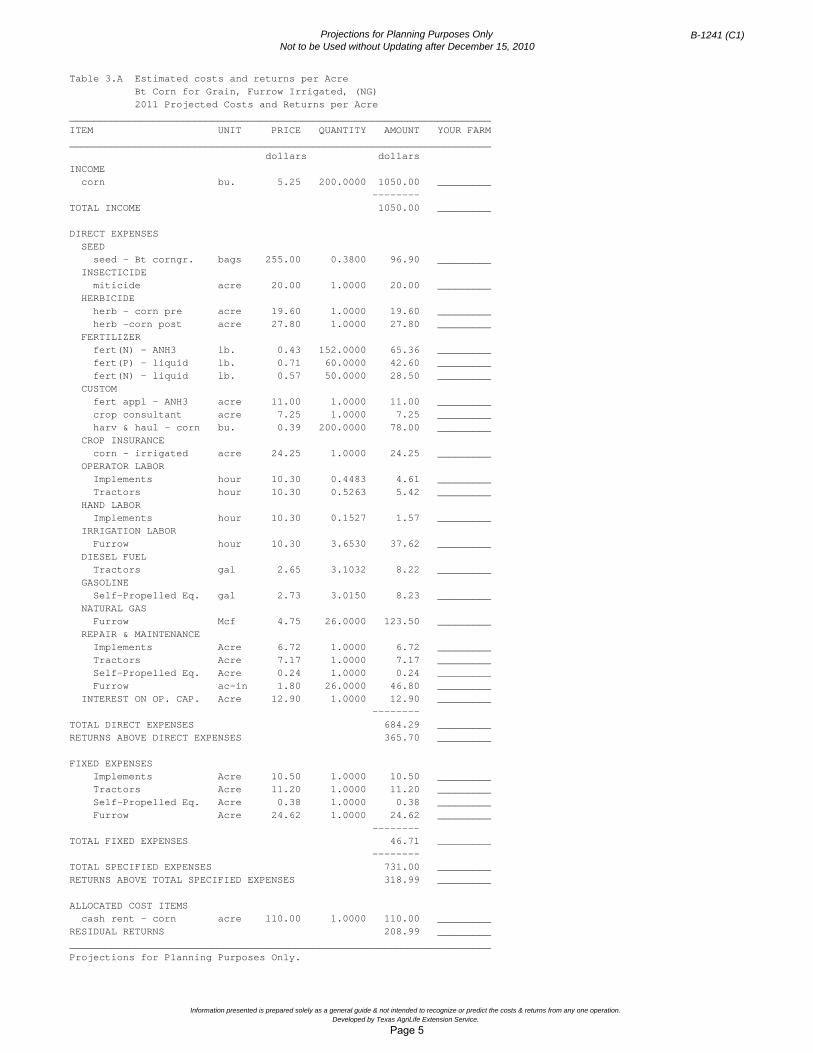
Table 3.A Estimated costs and returns per Acre Bt Corn for Grain, Furrow Irrigated, (NG) 2011 Projected Costs and Returns per Acre _______________________________________________________________________ITEM UNIT PRICE QUANTITY AMOUNT YOUR FARM_______________________________________________________________________ dollars dollars INCOME corn bu. 5.25 200.0000 1050.00 _________ -------- TOTAL INCOME 1050.00 _________ DIRECT EXPENSES SEED seed - Bt corngr. bags 255.00 0.3800 96.90 _________ INSECTICIDE miticide acre 20.00 1.0000 20.00 _________ HERBICIDE herb - corn pre acre 19.60 1.0000 19.60 _________ herb -corn post acre 27.80 1.0000 27.80 _________ FERTILIZER fert(N) - ANH3 lb. 0.43 152.0000 65.36 _________ fert(P) - liquid lb. 0.71 60.0000 42.60 _________ fert(N) - liquid lb. 0.57 50.0000 28.50 _________ CUSTOM fert appl - ANH3 acre 11.00 1.0000 11.00 _________ crop consultant acre 7.25 1.0000 7.25 _________ harv & haul - corn bu. 0.39 200.0000 78.00 _________ CROP INSURANCE corn - irrigated acre 24.25 1.0000 24.25 _________ OPERATOR LABOR Implements hour 10.30 0.4483 4.61 _________ Tractors hour 10.30 0.5263 5.42 _________ HAND LABOR Implements hour 10.30 0.1527 1.57 _________ IRRIGATION LABOR Furrow hour 10.30 3.6530 37.62 _________ DIESEL FUEL Tractors gal 2.65 3.1032 8.22 _________ GASOLINE Self-Propelled Eq. gal 2.73 3.0150 8.23 _________ NATURAL GAS Furrow Mcf 4.75 26.0000 123.50 _________ REPAIR & MAINTENANCE Implements Acre 6.72 1.0000 6.72 _________ Tractors Acre 7.17 1.0000 7.17 _________ Self-Propelled Eq. Acre 0.24 1.0000 0.24 _________ Furrow ac-in 1.80 26.0000 46.80 _________ INTEREST ON OP. CAP. Acre 12.90 1.0000 12.90 _________ -------- TOTAL DIRECT EXPENSES 684.29 _________RETURNS ABOVE DIRECT EXPENSES 365.70 _________ FIXED EXPENSES Implements Acre 10.50 1.0000 10.50 _________ Tractors Acre 11.20 1.0000 11.20 _________ Self-Propelled Eq. Acre 0.38 1.0000 0.38 _________ Furrow Acre 24.62 1.0000 24.62 _________ -------- TOTAL FIXED EXPENSES 46.71 _________ -------- TOTAL SPECIFIED EXPENSES 731.00 _________RETURNS ABOVE TOTAL SPECIFIED EXPENSES 318.99 _________ ALLOCATED COST ITEMS cash rent - corn acre 110.00 1.0000 110.00 _________RESIDUAL RETURNS 208.99 ________________________________________________________________________________Projections for Planning Purposes Only.
Information presented is prepared solely as a general guide & not intended to recognize or predict the costs & returns from any one operation. Developed by Texas AgriLife Extension Service.
Page 5

B-1241 (C1)Projections for Planning Purposes OnlyNot to be Used without Updating after December 15, 2010
Table 3.B Estimated resource use and costs for field operations, per Acre Bt Corn for Grain, Furrow Irrigated, (NG) 2011 Projected Costs and Returns per Acre _____________________________________________________________________________________________________________________________________________ TRACTOR COST EQUIP COST ALLOC LABOR OPERATING INPUT OPERATION/ SIZE/ TRACTOR PERF TIMES -------------- -------------- ------------- ---------------------- TOTAL OPERATING INPUT UNIT SIZE RATE OVER MTH DIRECT FIXED DIRECT FIXED HOURS COST AMOUNT PRICE COST COST _____________________________________________________________________________________________________________________________________________ ------------dollars----------- dollars -------dollars-------- disc offset 100 0.078 1.00 Nov 2.17 1.64 1.54 2.25 0.173 1.78 9.40 chisel 125 0.099 1.00 Dec 3.35 2.47 0.69 1.15 0.219 2.25 9.93 disc tandem 100 0.138 1.00 Feb 3.81 2.87 1.52 2.23 0.303 3.12 13.57 bedder 150 0.057 1.00 Mar 1.82 1.02 0.44 0.64 0.125 1.29 5.22 fert appl - ANH3 acre 1.00 Mar 1.0000 11.00 11.00 11.00 corn - irrigated acre 1.0000 24.25 24.25 24.25 herb - corn pre acre 1.0000 19.60 19.60 19.60 fert(N) - ANH3 lb. 152.0000 0.43 65.36 65.36 Furrow ac-in 1.00 Mar 39.30 24.62 0.843 8.68 6.0000 72.60 planter 100 0.152 1.00 Apr 4.22 3.18 2.51 4.21 0.305 3.14 17.28 seed - Bt corngr. bags 0.3800 255.00 96.90 96.90 fert(P) - liquid lb. 60.0000 0.71 42.60 42.60 Pickup Truck 3/4 ton 0.006 30.00 Apr 8.47 0.38 8.86 herb -corn post acre 1.00 May 1.0000 27.80 27.80 27.80 crop consultant acre 1.0000 7.25 7.25 7.25 Furrow ac-in 2.00 Jun 52.40 1.124 11.57 8.0000 63.97 fert(N) - liquid lb. 50.0000 0.57 28.50 28.50 Furrow ac-in 2.00 Jul 52.40 1.124 11.57 8.0000 63.97 miticide acre 1.00 Aug 1.0000 20.00 20.00 20.00 Furrow ac-in 1.00 Aug 26.20 0.562 5.78 4.0000 31.98 harv & haul - corn bu. 1.00 Sep 200.0000 0.39 78.00 78.00 ------- ------- ------- ------- ------ ------- ------- ------- TOTALS 15.39 11.20 185.50 35.50 4.780 49.23 421.26 718.10 INTEREST ON OPERATING CAPITAL 12.90 UNALLOCATED LABOR 0.00 TOTAL SPECIFIED COST 731.00 _____________________________________________________________________________________________________________________________________________Projections for Planning Purposes Only.
Information presented is prepared solely as a general guide & not intended to recognize or predict the costs & returns from any one operation. Developed by Texas AgriLife Extension Service.
Page 6

B-1241 (C1)Projections for Planning Purposes OnlyNot to be Used without Updating after December 15, 2010
Table 4.A Estimated costs and returns per Acre Bt Corn for Grain, Sprinkler Irrigated, (NG) 2011 Projected Costs and Returns per Acre _______________________________________________________________________ITEM UNIT PRICE QUANTITY AMOUNT YOUR FARM_______________________________________________________________________ dollars dollars INCOME corn bu. 5.25 225.0000 1181.25 _________ -------- TOTAL INCOME 1181.25 _________ DIRECT EXPENSES SEED seed - Bt corngr. bags 255.00 0.3800 96.90 _________ INSECTICIDE miticide acre 20.00 1.0000 20.00 _________ HERBICIDE herb - corn pre acre 19.60 1.0000 19.60 _________ herb -corn post acre 27.80 1.0000 27.80 _________ FERTILIZER fert(N) - ANH3 lb. 0.43 126.0000 54.18 _________ fert(P) - liquid lb. 0.71 60.0000 42.60 _________ fert(N) - liquid lb. 0.57 78.0000 44.46 _________ CUSTOM fert appl - ANH3 acre 11.00 1.0000 11.00 _________ crop consultant acre 7.25 1.0000 7.25 _________ harv & haul - corn bu. 0.39 225.0000 87.75 _________ CROP INSURANCE corn - irrigated acre 24.25 1.0000 24.25 _________ OPERATOR LABOR Implements hour 10.30 0.2925 3.01 _________ Tractors hour 10.30 0.3965 4.08 _________ HAND LABOR Implements hour 10.30 0.1527 1.57 _________ IRRIGATION LABOR Center Pivot hour 10.30 1.4080 14.50 _________ DIESEL FUEL Tractors gal 2.65 2.1861 5.79 _________ GASOLINE Self-Propelled Eq. gal 2.73 2.0100 5.48 _________ NATURAL GAS Center Pivot Mcf 4.75 22.0000 104.50 _________ REPAIR & MAINTENANCE Implements Acre 5.61 1.0000 5.61 _________ Tractors Acre 4.80 1.0000 4.80 _________ Self-Propelled Eq. Acre 0.16 1.0000 0.16 _________ Center Pivot ac-in 2.03 22.0000 44.66 _________ INTEREST ON OP. CAP. Acre 10.27 1.0000 10.27 _________ -------- TOTAL DIRECT EXPENSES 640.26 _________RETURNS ABOVE DIRECT EXPENSES 540.98 _________ FIXED EXPENSES Implements Acre 8.87 1.0000 8.87 _________ Tractors Acre 7.06 1.0000 7.06 _________ Self-Propelled Eq. Acre 0.25 1.0000 0.25 _________ Center Pivot Acre 33.60 1.0000 33.60 _________ -------- TOTAL FIXED EXPENSES 49.79 _________ -------- TOTAL SPECIFIED EXPENSES 690.06 _________RETURNS ABOVE TOTAL SPECIFIED EXPENSES 491.18 _________ ALLOCATED COST ITEMS cash rent - corn acre 110.00 1.0000 110.00 _________RESIDUAL RETURNS 381.18 ________________________________________________________________________________Projections for Planning Purposes Only.
Information presented is prepared solely as a general guide & not intended to recognize or predict the costs & returns from any one operation. Developed by Texas AgriLife Extension Service.
Page 7

B-1241 (C1)Projections for Planning Purposes OnlyNot to be Used without Updating after December 15, 2010
Table 4.B Estimated resource use and costs for field operations, per Acre Bt Corn for Grain, Sprinkler Irrigated, (NG) 2011 Projected Costs and Returns per Acre _____________________________________________________________________________________________________________________________________________ TRACTOR COST EQUIP COST ALLOC LABOR OPERATING INPUT OPERATION/ SIZE/ TRACTOR PERF TIMES -------------- -------------- ------------- ---------------------- TOTAL OPERATING INPUT UNIT SIZE RATE OVER MTH DIRECT FIXED DIRECT FIXED HOURS COST AMOUNT PRICE COST COST _____________________________________________________________________________________________________________________________________________ ------------dollars----------- dollars -------dollars-------- chisel 125 0.099 1.00 Feb 3.35 2.47 0.69 1.15 0.219 2.25 9.93 disc offset 100 0.078 1.00 Mar 2.17 1.64 1.54 2.25 0.173 1.78 9.40 fert appl - ANH3 acre 1.00 Mar 1.0000 11.00 11.00 11.00 fert(N) - ANH3 lb. 126.0000 0.43 54.18 54.18 corn - irrigated acre 1.0000 24.25 24.25 24.25 sweep plow 150 0.065 1.00 Apr 2.08 1.16 0.85 1.25 0.143 1.48 6.84 planter 75 0.152 1.00 May 2.98 1.77 2.51 4.21 0.305 3.14 14.63 seed - Bt corngr. bags 0.3800 255.00 96.90 96.90 crop consultant acre 1.0000 7.25 7.25 7.25 herb - corn pre acre 1.0000 19.60 19.60 19.60 fert(P) - liquid lb. 60.0000 0.71 42.60 42.60 Center Pivot ac-in 2.00 May 20.34 33.60 0.192 1.97 3.0000 55.91 herb -corn post acre 1.00 May 1.0000 27.80 27.80 27.80 Center Pivot ac-in 4.00 Jun 40.68 0.384 3.95 6.0000 44.63 fert(N) - liquid lb. 78.0000 0.57 44.46 44.46 Pickup Truck 3/4 ton 0.006 20.00 Jun 5.65 0.25 5.90 Center Pivot ac-in 4.00 Jul 40.68 0.384 3.95 6.0000 44.63 miticide acre 1.00 Aug 1.0000 20.00 20.00 20.00 Center Pivot ac-in 1.00 Aug 13.56 0.128 1.31 2.0000 14.87 Center Pivot ac-in 1.00 Aug 6.78 0.064 0.65 1.0000 7.43 Center Pivot ac-in 1.00 Aug 13.56 0.128 1.31 2.0000 14.87 Center Pivot ac-in 2.00 Sep 13.56 0.128 1.31 2.0000 14.87 harv & haul - corn bu. 1.00 Sep 225.0000 0.39 87.75 87.75 ------- ------- ------- ------- ------ ------- ------- ------- TOTALS 10.59 7.06 160.42 42.73 2.249 23.17 435.79 679.78 INTEREST ON OPERATING CAPITAL 10.27 UNALLOCATED LABOR 0.00 TOTAL SPECIFIED COST 690.06 _____________________________________________________________________________________________________________________________________________Projections for Planning Purposes Only.
Information presented is prepared solely as a general guide & not intended to recognize or predict the costs & returns from any one operation. Developed by Texas AgriLife Extension Service.
Page 8

B-1241 (C1)Projections for Planning Purposes OnlyNot to be Used without Updating after December 15, 2010
Table 5.A Estimated costs and returns per Acre Bt Corn for Grain, Strip Till 2011 Projected Costs and Returns per Acre _______________________________________________________________________ITEM UNIT PRICE QUANTITY AMOUNT YOUR FARM_______________________________________________________________________ dollars dollars INCOME corn bu. 5.25 225.0000 1181.25 _________ -------- TOTAL INCOME 1181.25 _________ DIRECT EXPENSES SEED seed - Bt corngr. bags 255.00 0.3800 96.90 _________ INSECTICIDE miticide acre 20.00 1.0000 20.00 _________ HERBICIDE burndown herb acre 18.00 1.0000 18.00 _________ herb - corn pre acre 19.60 1.0000 19.60 _________ herb -corn post acre 27.80 1.0000 27.80 _________ FERTILIZER fert(N) - ANH3 lb. 0.43 126.0000 54.18 _________ fert(P) - liquid lb. 0.71 60.0000 42.60 _________ fert(N) - liquid lb. 0.57 78.0000 44.46 _________ CUSTOM strip till acre 14.50 1.0000 14.50 _________ fert appl - ANH3 acre 11.00 1.0000 11.00 _________ crop consultant acre 7.25 1.0000 7.25 _________ harv & haul - corn bu. 0.39 225.0000 87.75 _________ CROP INSURANCE corn - irrigated acre 24.25 1.0000 24.25 _________ OPERATOR LABOR Tractors hour 10.30 0.1527 1.57 _________ HAND LABOR Implements hour 10.30 0.1527 1.57 _________ IRRIGATION LABOR Center Pivot hour 10.30 1.2800 13.18 _________ DIESEL FUEL Tractors gal 2.65 0.5894 1.56 _________ GASOLINE Self-Propelled Eq. gal 2.73 2.0100 5.48 _________ NATURAL GAS Center Pivot Mcf 4.75 20.0000 95.00 _________ REPAIR & MAINTENANCE Implements Acre 2.51 1.0000 2.51 _________ Tractors Acre 1.42 1.0000 1.42 _________ Self-Propelled Eq. Acre 0.16 1.0000 0.16 _________ Center Pivot ac-in 2.03 20.0000 40.60 _________ INTEREST ON OP. CAP. Acre 10.46 1.0000 10.46 _________ -------- TOTAL DIRECT EXPENSES 641.83 _________RETURNS ABOVE DIRECT EXPENSES 539.41 _________ FIXED EXPENSES Implements Acre 4.21 1.0000 4.21 _________ Tractors Acre 1.77 1.0000 1.77 _________ Self-Propelled Eq. Acre 0.25 1.0000 0.25 _________ Center Pivot Acre 33.60 1.0000 33.60 _________ -------- TOTAL FIXED EXPENSES 39.84 _________ -------- TOTAL SPECIFIED EXPENSES 681.68 _________RETURNS ABOVE TOTAL SPECIFIED EXPENSES 499.56 _________ ALLOCATED COST ITEMS cash rent - corn acre 110.00 1.0000 110.00 _________RESIDUAL RETURNS 389.56 ________________________________________________________________________________Projections for Planning Purposes Only.
Information presented is prepared solely as a general guide & not intended to recognize or predict the costs & returns from any one operation. Developed by Texas AgriLife Extension Service.
Page 9

B-1241 (C1)Projections for Planning Purposes OnlyNot to be Used without Updating after December 15, 2010
Table 5.B Estimated resource use and costs for field operations, per Acre Bt Corn for Grain, Strip Till 2011 Projected Costs and Returns per Acre _____________________________________________________________________________________________________________________________________________ TRACTOR COST EQUIP COST ALLOC LABOR OPERATING INPUT OPERATION/ SIZE/ TRACTOR PERF TIMES -------------- -------------- ------------- ---------------------- TOTAL OPERATING INPUT UNIT SIZE RATE OVER MTH DIRECT FIXED DIRECT FIXED HOURS COST AMOUNT PRICE COST COST _____________________________________________________________________________________________________________________________________________ ------------dollars----------- dollars -------dollars-------- strip till acre 1.00 Feb 1.0000 14.50 14.50 14.50 fert appl - ANH3 acre 1.00 Mar 1.0000 11.00 11.00 11.00 fert(N) - ANH3 lb. 126.0000 0.43 54.18 54.18 burndown herb acre 1.0000 18.00 18.00 18.00 corn - irrigated acre 1.0000 24.25 24.25 24.25 planter 75 0.152 1.00 May 2.98 1.77 2.51 4.21 0.305 3.14 14.63 seed - Bt corngr. bags 0.3800 255.00 96.90 96.90 crop consultant acre 1.0000 7.25 7.25 7.25 fert(P) - liquid lb. 60.0000 0.71 42.60 42.60 herb - corn pre acre 1.0000 19.60 19.60 19.60 Center Pivot ac-in 2.00 May 20.34 33.60 0.192 1.97 3.0000 55.91 Center Pivot ac-in 4.00 Jun 40.68 0.384 3.95 6.0000 44.63 fert(N) - liquid lb. 78.0000 0.57 44.46 44.46 herb -corn post acre 1.00 Jun 1.0000 27.80 27.80 27.80 Pickup Truck 3/4 ton 0.006 20.00 Jun 5.65 0.25 5.90 Center Pivot ac-in 4.00 Jul 27.12 0.256 2.63 4.0000 29.75 miticide acre 1.00 Aug 1.0000 20.00 20.00 20.00 Center Pivot ac-in 4.00 Aug 27.12 0.256 2.63 4.0000 29.75 Center Pivot ac-in 2.00 Sep 20.34 0.192 1.97 3.0000 22.31 harv & haul - corn bu. 1.00 Sep 225.0000 0.39 87.75 87.75 ------- ------- ------- ------- ------ ------- ------- ------- TOTALS 2.98 1.77 143.77 38.06 1.585 16.32 468.29 671.21 INTEREST ON OPERATING CAPITAL 10.46 UNALLOCATED LABOR 0.00 TOTAL SPECIFIED COST 681.68 _____________________________________________________________________________________________________________________________________________Projections for Planning Purposes Only.
Information presented is prepared solely as a general guide & not intended to recognize or predict the costs & returns from any one operation. Developed by Texas AgriLife Extension Service.
Page 10

B-1241 (C1)Projections for Planning Purposes OnlyNot to be Used without Updating after December 15, 2010
Table 6.A Estimated costs and returns per Acre Corn Silage, Bt, Sprinkler Irrigated, (NG) 2011 Projected Costs and Returns per Acre _______________________________________________________________________ITEM UNIT PRICE QUANTITY AMOUNT YOUR FARM_______________________________________________________________________ dollars dollars INCOME corn silage ton 48.25 27.0000 1302.75 _________ -------- TOTAL INCOME 1302.75 _________ DIRECT EXPENSES SEED seed - corn silage bags 255.00 0.4000 102.00 _________ INSECTICIDE miticide acre 20.00 1.0000 20.00 _________ HERBICIDE herb - corn pre acre 19.60 1.0000 19.60 _________ herb -corn post acre 27.80 1.0000 27.80 _________ FERTILIZER fert(N) - ANH3 lb. 0.43 126.0000 54.18 _________ fert(P) - liquid lb. 0.71 60.0000 42.60 _________ fert(N) - liquid lb. 0.57 78.0000 44.46 _________ CUSTOM fert appl - ANH3 acre 11.00 1.0000 11.00 _________ insec+appl - cornsi appl 25.40 1.0000 25.40 _________ harv & haul - cornsi ton 6.75 27.0000 182.25 _________ CROP INSURANCE corn sil - irrigated acre 24.25 1.0000 24.25 _________ OPERATOR LABOR Implements hour 10.30 0.4581 4.71 _________ Tractors hour 10.30 0.5345 5.50 _________ HAND LABOR Implements hour 10.30 0.1527 1.57 _________ IRRIGATION LABOR Center Pivot hour 10.30 1.2800 13.18 _________ DIESEL FUEL Tractors gal 2.65 2.9313 7.76 _________ GASOLINE Self-Propelled Eq. gal 2.73 3.0150 8.23 _________ NATURAL GAS Center Pivot Mcf 4.75 20.0000 95.00 _________ REPAIR & MAINTENANCE Implements Acre 7.13 1.0000 7.13 _________ Tractors Acre 6.64 1.0000 6.64 _________ Self-Propelled Eq. Acre 0.24 1.0000 0.24 _________ Center Pivot ac-in 2.03 20.0000 40.60 _________ INTEREST ON OP. CAP. Acre 12.49 1.0000 12.49 _________ -------- TOTAL DIRECT EXPENSES 756.64 _________RETURNS ABOVE DIRECT EXPENSES 546.10 _________ FIXED EXPENSES Implements Acre 11.11 1.0000 11.11 _________ Tractors Acre 9.93 1.0000 9.93 _________ Self-Propelled Eq. Acre 0.38 1.0000 0.38 _________ Center Pivot Acre 33.60 1.0000 33.60 _________ -------- TOTAL FIXED EXPENSES 55.03 _________ -------- TOTAL SPECIFIED EXPENSES 811.68 _________RETURNS ABOVE TOTAL SPECIFIED EXPENSES 491.06 _________ ALLOCATED COST ITEMS cash rent - corn acre 110.00 1.0000 110.00 _________RESIDUAL RETURNS 381.06 ________________________________________________________________________________Projections for Planning Purposes Only.
Information presented is prepared solely as a general guide & not intended to recognize or predict the costs & returns from any one operation. Developed by Texas AgriLife Extension Service.
Page 11

B-1241 (C1)Projections for Planning Purposes OnlyNot to be Used without Updating after December 15, 2010
Table 6.B Estimated resource use and costs for field operations, per Acre Corn Silage, Bt, Sprinkler Irrigated, (NG) 2011 Projected Costs and Returns per Acre _____________________________________________________________________________________________________________________________________________ TRACTOR COST EQUIP COST ALLOC LABOR OPERATING INPUT OPERATION/ SIZE/ TRACTOR PERF TIMES -------------- -------------- ------------- ---------------------- TOTAL OPERATING INPUT UNIT SIZE RATE OVER MTH DIRECT FIXED DIRECT FIXED HOURS COST AMOUNT PRICE COST COST _____________________________________________________________________________________________________________________________________________ ------------dollars----------- dollars -------dollars-------- disc offset 100 0.078 1.00 Nov 2.17 1.64 1.54 2.25 0.173 1.78 9.40 chisel 125 0.099 1.00 Dec 3.35 2.47 0.69 1.15 0.219 2.25 9.93 disc tandem 100 0.138 1.00 Feb 3.81 2.87 1.52 2.23 0.303 3.12 13.57 sweep plow 150 0.065 1.00 Mar 2.08 1.16 0.85 1.25 0.143 1.48 6.84 herb - corn pre acre 1.00 Mar 1.0000 19.60 19.60 19.60 fert(N) - ANH3 lb. 126.0000 0.43 54.18 54.18 fert appl - ANH3 acre 1.0000 11.00 11.00 11.00 corn sil - irrigated acre 1.00 Mar 1.0000 24.25 24.25 24.25 planter 75 0.152 1.00 Apr 2.98 1.77 2.51 4.21 0.305 3.14 14.63 seed - corn silage bags 0.4000 255.00 102.00 102.00 herb -corn post acre 1.0000 27.80 27.80 27.80 fert(P) - liquid lb. 60.0000 0.71 42.60 42.60 Pickup Truck 3/4 ton 0.006 30.00 Apr 8.47 0.38 8.86 Center Pivot ac-in 2.00 May 27.12 33.60 0.256 2.63 4.0000 63.35 fert(N) - liquid lb. 78.0000 0.57 44.46 44.46 Center Pivot ac-in 2.00 Jun 27.12 0.256 2.63 4.0000 29.75 Center Pivot ac-in 1.00 Jun 6.78 0.064 0.65 1.0000 7.43 miticide acre 1.0000 20.00 20.00 20.00 Center Pivot ac-in 4.00 Jul 33.90 0.320 3.29 5.0000 37.19 insec+appl - cornsi appl 1.00 Aug 1.0000 25.40 25.40 25.40 Center Pivot ac-in 2.00 Aug 27.12 0.256 2.63 4.0000 29.75 Center Pivot ac-in 1.00 Aug 13.56 0.128 1.31 2.0000 14.87 harv & haul - cornsi ton 1.00 Sep 27.0000 6.75 182.25 182.25 ------- ------- ------- ------- ------ ------- ------- ------- TOTALS 14.41 9.93 151.21 45.09 2.425 24.98 553.54 799.18 INTEREST ON OPERATING CAPITAL 12.49 UNALLOCATED LABOR 0.00 TOTAL SPECIFIED COST 811.68 _____________________________________________________________________________________________________________________________________________Projections for Planning Purposes Only.
Information presented is prepared solely as a general guide & not intended to recognize or predict the costs & returns from any one operation. Developed by Texas AgriLife Extension Service.
Page 12

B-1241 (C1)Projections for Planning Purposes OnlyNot to be Used without Updating after December 15, 2010
Table 7.A Estimated costs and returns per Acre Cotton, Dryland (Roundup Ready Flex) 2011 Projected Costs and Returns per Acre _______________________________________________________________________ITEM UNIT PRICE QUANTITY AMOUNT YOUR FARM_______________________________________________________________________ dollars dollars INCOME cotton lint lb. 0.83 400.0000 332.00 _________ cottonseed ton 190.00 0.3000 57.00 _________ -------- TOTAL INCOME 389.00 _________ DIRECT EXPENSES SEED seed - cotton dry bag 300.00 0.1800 54.00 _________ FERTILIZER fert(P) - dry lb. 0.70 20.0000 14.00 _________ fert(N) - dry lb. 0.48 30.0000 14.40 _________ CUSTOM preplant herb + appl acre 13.40 1.0000 13.40 _________ fert application acre 5.00 1.0000 5.00 _________ post emer herb+appld acre 11.20 1.0000 11.20 _________ insec+appl - cotton appl 13.40 0.5000 6.70 _________ harvaid appl-cot dry acre 25.00 0.5000 12.50 _________ strip & module-cotto cwt. 8.00 4.0000 32.00 _________ ginning - cotton cwt. 3.00 18.0000 54.00 _________ CROP INSURANCE cotton - dryland acre 21.25 1.0000 21.25 _________ BOLL WEEVIL ASSESS dryland acre 6.00 1.0000 6.00 _________ OPERATOR LABOR Implements hour 10.30 0.5401 5.56 _________ Tractors hour 10.30 0.6143 6.32 _________ HAND LABOR Implements hour 10.30 0.1527 1.57 _________ DIESEL FUEL Tractors gal 2.65 3.0608 8.11 _________ GASOLINE Self-Propelled Eq. gal 2.73 2.0100 5.48 _________ REPAIR & MAINTENANCE Implements Acre 6.94 1.0000 6.94 _________ Tractors Acre 7.38 1.0000 7.38 _________ Self-Propelled Eq. Acre 0.16 1.0000 0.16 _________ INTEREST ON OP. CAP. Acre 6.11 1.0000 6.11 _________ -------- TOTAL DIRECT EXPENSES 292.12 _________RETURNS ABOVE DIRECT EXPENSES 96.87 _________ FIXED EXPENSES Implements Acre 11.02 1.0000 11.02 _________ Tractors Acre 10.64 1.0000 10.64 _________ Self-Propelled Eq. Acre 0.25 1.0000 0.25 _________ -------- TOTAL FIXED EXPENSES 21.92 _________ -------- TOTAL SPECIFIED EXPENSES 314.05 _________RETURNS ABOVE TOTAL SPECIFIED EXPENSES 74.94 _________ ALLOCATED COST ITEMS cash rent - cottond acre 25.00 1.0000 25.00 _________RESIDUAL RETURNS 49.94 ________________________________________________________________________________Projections for Planning Purposes Only.
Information presented is prepared solely as a general guide & not intended to recognize or predict the costs & returns from any one operation. Developed by Texas AgriLife Extension Service.
Page 13

B-1241 (C1)Projections for Planning Purposes OnlyNot to be Used without Updating after December 15, 2010
Table 7.B Estimated resource use and costs for field operations, per Acre Cotton, Dryland (Roundup Ready Flex) 2011 Projected Costs and Returns per Acre _____________________________________________________________________________________________________________________________________________ TRACTOR COST EQUIP COST ALLOC LABOR OPERATING INPUT OPERATION/ SIZE/ TRACTOR PERF TIMES -------------- -------------- ------------- ---------------------- TOTAL OPERATING INPUT UNIT SIZE RATE OVER MTH DIRECT FIXED DIRECT FIXED HOURS COST AMOUNT PRICE COST COST _____________________________________________________________________________________________________________________________________________ ------------dollars----------- dollars -------dollars-------- stalk cutter 125 0.069 1.00 Jan 2.32 1.71 0.72 1.24 0.138 1.42 7.42 chisel 125 0.099 1.00 Jan 3.35 2.47 0.69 1.15 0.219 2.25 9.93 disc tandem 100 0.138 1.00 Mar 3.81 2.87 1.52 2.23 0.303 3.12 13.57 preplant herb + appl acre 1.0000 13.40 13.40 13.40 fert application acre 1.00 Mar 1.0000 5.00 5.00 5.00 fert(P) - dry lb. 20.0000 0.70 14.00 14.00 fert(N) - dry lb. 30.0000 0.48 14.40 14.40 Pickup Truck 3/4 ton 0.006 20.00 Mar 5.65 0.25 5.90 planter 75 0.152 1.00 May 2.98 1.77 2.51 4.21 0.305 3.14 14.63 cotton - dryland acre 1.0000 21.25 21.25 21.25 seed - cotton dry bag 0.1800 300.00 54.00 54.00 rotary hoe 8 row 75 0.077 1.00 May 1.51 0.90 0.74 1.08 0.170 1.75 6.00 post emer herb+appld acre 1.0000 11.20 11.20 11.20 rotary hoe 8 row 75 0.077 1.00 May 1.51 0.90 0.74 1.08 0.170 1.75 6.00 insec+appl - cotton appl 1.00 Jun 0.5000 13.40 6.70 6.70 harvaid appl-cot dry acre 1.00 Oct 0.5000 25.00 12.50 12.50 strip & module-cotto cwt. 1.00 Nov 4.0000 8.00 32.00 32.00 ginning - cotton cwt. 1.00 Nov 18.0000 3.00 54.00 54.00 dryland acre 1.0000 6.00 6.00 6.00 ------- ------- ------- ------- ------ ------- ------- ------- TOTALS 15.50 10.64 12.59 11.27 1.307 13.46 244.45 307.93 INTEREST ON OPERATING CAPITAL 6.11 UNALLOCATED LABOR 0.00 TOTAL SPECIFIED COST 314.05 _____________________________________________________________________________________________________________________________________________Projections for Planning Purposes Only.
Information presented is prepared solely as a general guide & not intended to recognize or predict the costs & returns from any one operation. Developed by Texas AgriLife Extension Service.
Page 14

B-1241 (C1)Projections for Planning Purposes OnlyNot to be Used without Updating after December 15, 2010
Table 8.A Estimated costs and returns per Acre Cotton, Sprinkler Irrigated (Roundup Ready Flex) 2011 Projected Costs and Returns per Acre _______________________________________________________________________ITEM UNIT PRICE QUANTITY AMOUNT YOUR FARM_______________________________________________________________________ dollars dollars INCOME cotton lint lb. 0.83 1100.0000 913.00 _________ cottonseed ton 190.00 0.8300 157.70 _________ -------- TOTAL INCOME 1070.70 _________ DIRECT EXPENSES SEED seed - cotton bag 300.00 0.2200 66.00 _________ FERTILIZER fert(P) - dry lb. 0.70 25.0000 17.50 _________ fert(N) - dry lb. 0.48 100.0000 48.00 _________ CUSTOM fert application acre 5.00 1.0000 5.00 _________ preplant herb + appl acre 13.40 1.0000 13.40 _________ post emerg herb+appl acre 17.90 1.0000 17.90 _________ insec+appl - cotton appl 13.40 1.0000 13.40 _________ harvaid appl-cot irr acre 25.00 0.7500 18.75 _________ strip & module-cotto cwt. 8.00 11.0000 88.00 _________ ginning - cotton cwt. 3.00 40.4800 121.44 _________ CROP INSURANCE cotton - irrigated acre 35.00 1.0000 35.00 _________ BOLL WEEVIL ASSESS Irrigated acre 12.00 1.0000 12.00 _________ OPERATOR LABOR Implements hour 10.30 0.4563 4.70 _________ Tractors hour 10.30 0.5826 6.00 _________ HAND LABOR Implements hour 10.30 0.1908 1.96 _________ IRRIGATION LABOR Center Pivot hour 10.30 0.7680 7.91 _________ DIESEL FUEL Tractors gal 2.65 2.7687 7.33 _________ GASOLINE Self-Propelled Eq. gal 2.73 3.5175 9.60 _________ NATURAL GAS Center Pivot Mcf 4.75 12.0000 57.00 _________ REPAIR & MAINTENANCE Implements Acre 7.63 1.0000 7.63 _________ Tractors Acre 6.64 1.0000 6.64 _________ Self-Propelled Eq. Acre 0.28 1.0000 0.28 _________ Center Pivot ac-in 2.03 12.0000 24.36 _________ INTEREST ON OP. CAP. Acre 10.61 1.0000 10.61 _________ -------- TOTAL DIRECT EXPENSES 600.45 _________RETURNS ABOVE DIRECT EXPENSES 470.24 _________ FIXED EXPENSES Implements Acre 12.15 1.0000 12.15 _________ Tractors Acre 9.25 1.0000 9.25 _________ Self-Propelled Eq. Acre 0.44 1.0000 0.44 _________ Center Pivot Acre 33.60 1.0000 33.60 _________ -------- TOTAL FIXED EXPENSES 55.46 _________ -------- TOTAL SPECIFIED EXPENSES 655.91 _________RETURNS ABOVE TOTAL SPECIFIED EXPENSES 414.78 _________ ALLOCATED COST ITEMS cash rent - cottoni acre 65.00 1.0000 65.00 _________RESIDUAL RETURNS 349.78 ________________________________________________________________________________Projections for Planning Purposes Only.
Information presented is prepared solely as a general guide & not intended to recognize or predict the costs & returns from any one operation. Developed by Texas AgriLife Extension Service.
Page 15

B-1241 (C1)Projections for Planning Purposes OnlyNot to be Used without Updating after December 15, 2010
Table 8.B Estimated resource use and costs for field operations, per Acre Cotton, Sprinkler Irrigated (Roundup Ready Flex) 2011 Projected Costs and Returns per Acre _____________________________________________________________________________________________________________________________________________ TRACTOR COST EQUIP COST ALLOC LABOR OPERATING INPUT OPERATION/ SIZE/ TRACTOR PERF TIMES -------------- -------------- ------------- ---------------------- TOTAL OPERATING INPUT UNIT SIZE RATE OVER MTH DIRECT FIXED DIRECT FIXED HOURS COST AMOUNT PRICE COST COST _____________________________________________________________________________________________________________________________________________ ------------dollars----------- dollars -------dollars-------- chisel 125 0.099 1.00 Jan 3.35 2.47 0.69 1.15 0.219 2.25 9.93 stalk cutter 125 0.069 1.00 Mar 2.32 1.71 0.72 1.24 0.138 1.42 7.42 disc tandem 100 0.138 0.20 Mar 0.76 0.57 0.30 0.44 0.060 0.62 2.71 fert application acre 1.00 Mar 1.0000 5.00 5.00 5.00 fert(P) - dry lb. 25.0000 0.70 17.50 17.50 fert(N) - dry lb. 100.0000 0.48 48.00 48.00 Pickup Truck 3/4 ton 0.006 35.00 Mar 9.89 0.44 10.33 Center Pivot ac-in 1.00 Apr 13.56 33.60 0.128 1.31 2.0000 48.47 preplant herb + appl acre 1.00 May 1.0000 13.40 13.40 13.40 planter 75 0.152 1.00 May 2.98 1.77 2.51 4.21 0.305 3.14 14.63 cotton - irrigated acre 1.0000 35.00 35.00 35.00 seed - cotton bag 0.2200 300.00 66.00 66.00 rotary hoe 8 row 75 0.077 1.00 May 1.51 0.90 0.74 1.08 0.170 1.75 6.00 planter 75 0.152 0.25 May 0.74 0.44 0.62 1.05 0.076 0.78 3.65 Center Pivot ac-in 1.00 Jun 6.78 0.064 0.65 1.0000 7.43 post emerg herb+appl acre 1.00 Jun 1.0000 17.90 17.90 17.90 cultivator 8 row 75 0.118 1.00 Jun 2.30 1.37 2.01 2.95 0.259 2.67 11.33 Center Pivot ac-in 1.00 Jul 6.78 0.064 0.65 1.0000 7.43 insec+appl - cotton appl 1.00 Jul 1.0000 13.40 13.40 13.40 Center Pivot ac-in 1.00 Jul 13.56 0.128 1.31 2.0000 14.87 Center Pivot ac-in 1.00 Aug 13.56 0.128 1.31 2.0000 14.87 Center Pivot ac-in 1.00 Aug 13.56 0.128 1.31 2.0000 14.87 Center Pivot ac-in 1.00 Aug 13.56 0.128 1.31 2.0000 14.87 harvaid appl-cot irr acre 1.00 Oct 0.7500 25.00 18.75 18.75 strip & module-cotto cwt. 1.00 Nov 11.0000 8.00 88.00 88.00 ginning - cotton cwt. 1.00 Nov 40.4800 3.00 121.44 121.44 Irrigated acre 1.0000 12.00 12.00 12.00 ------- ------- ------- ------- ------ ------- ------- ------- TOTALS 13.98 9.25 98.88 46.20 1.997 20.57 456.39 645.30 INTEREST ON OPERATING CAPITAL 10.61 UNALLOCATED LABOR 0.00 TOTAL SPECIFIED COST 655.91 _____________________________________________________________________________________________________________________________________________Projections for Planning Purposes Only.
Information presented is prepared solely as a general guide & not intended to recognize or predict the costs & returns from any one operation. Developed by Texas AgriLife Extension Service.
Page 16

B-1241 (C1)Projections for Planning Purposes OnlyNot to be Used without Updating after December 15, 2010
Table 9.A Estimated costs and returns per Acre Peanuts, Runner, Sprinkler Irrigated 2011 Projected Costs and Returns per Acre _______________________________________________________________________ITEM UNIT PRICE QUANTITY AMOUNT YOUR FARM_______________________________________________________________________ dollars dollars INCOME peanuts - runner ton 400.00 2.2500 900.00 _________ -------- TOTAL INCOME 900.00 _________ DIRECT EXPENSES SEED innoculant peanut acre 6.80 1.0000 6.80 _________ seed - peanut lb. 0.76 100.0000 76.00 _________ HERBICIDE herb.- peanut acre 16.80 1.0000 16.80 _________ FERTILIZER fert(N) - dry lb. 0.48 80.0000 38.40 _________ fert(P) - dry lb. 0.70 50.0000 35.00 _________ CUSTOM fert application acre 5.00 1.0000 5.00 _________ insec+appl - peanut appl 13.40 1.0000 13.40 _________ fung & appl - peanut appl 15.60 3.0000 46.80 _________ hoeing - peanut acre 16.80 1.0000 16.80 _________ dig & shake - peanut acre 21.50 1.0000 21.50 _________ harv&haul - peanuts ton 65.00 2.2500 146.25 _________ drying - peanut ton 36.00 2.2500 81.00 _________ CROP INSURANCE peanuts - irrigated acre 12.00 1.0000 12.00 _________ OPERATOR LABOR Implements hour 10.30 1.4540 14.97 _________ Tractors hour 10.30 1.6798 17.30 _________ HAND LABOR Implements hour 10.30 0.4681 4.82 _________ IRRIGATION LABOR Center Pivot hour 10.30 1.3440 13.84 _________ DIESEL FUEL Tractors gal 2.65 8.9028 23.59 _________ GASOLINE Self-Propelled Eq. gal 2.73 2.0100 5.48 _________ NATURAL GAS Center Pivot Mcf 4.75 21.0000 99.75 _________ REPAIR & MAINTENANCE Implements Acre 19.22 1.0000 19.22 _________ Tractors Acre 21.82 1.0000 21.82 _________ Self-Propelled Eq. Acre 0.16 1.0000 0.16 _________ Center Pivot ac-in 2.03 21.0000 42.63 _________ INTEREST ON OP. CAP. Acre 15.56 1.0000 15.56 _________ -------- TOTAL DIRECT EXPENSES 794.93 _________RETURNS ABOVE DIRECT EXPENSES 105.06 _________ FIXED EXPENSES Implements Acre 27.96 1.0000 27.96 _________ Tractors Acre 33.29 1.0000 33.29 _________ Self-Propelled Eq. Acre 0.25 1.0000 0.25 _________ Center Pivot Acre 33.60 1.0000 33.60 _________ -------- TOTAL FIXED EXPENSES 95.12 _________ -------- TOTAL SPECIFIED EXPENSES 890.05 _________RETURNS ABOVE TOTAL SPECIFIED EXPENSES 9.94 _________ ALLOCATED COST ITEMS cash rent - peanuts acre 110.00 1.0000 110.00 _________RESIDUAL RETURNS -100.05 ________________________________________________________________________________Projections for Planning Purposes Only.
Information presented is prepared solely as a general guide & not intended to recognize or predict the costs & returns from any one operation. Developed by Texas AgriLife Extension Service.
Page 17

B-1241 (C1)Projections for Planning Purposes OnlyNot to be Used without Updating after December 15, 2010
Table 9.B Estimated resource use and costs for field operations, per Acre Peanuts, Runner, Sprinkler Irrigated 2011 Projected Costs and Returns per Acre _____________________________________________________________________________________________________________________________________________ TRACTOR COST EQUIP COST ALLOC LABOR OPERATING INPUT OPERATION/ SIZE/ TRACTOR PERF TIMES -------------- -------------- ------------- ---------------------- TOTAL OPERATING INPUT UNIT SIZE RATE OVER MTH DIRECT FIXED DIRECT FIXED HOURS COST AMOUNT PRICE COST COST _____________________________________________________________________________________________________________________________________________ ------------dollars----------- dollars -------dollars-------- disc tandem 100 0.138 1.00 Dec 3.81 2.87 1.52 2.23 0.303 3.12 13.57 moldboard 125 0.286 0.50 Jan 4.81 3.55 2.24 3.28 0.315 3.24 17.15 chisel 125 0.099 0.50 Jan 1.67 1.23 0.34 0.57 0.109 1.12 4.96 disc tandem 100 0.138 1.00 Feb 3.81 2.87 1.52 2.23 0.303 3.12 13.57 disc tandem 100 0.138 1.00 Mar 3.81 2.87 1.52 2.23 0.303 3.12 13.57 herb.- peanut acre 1.0000 16.80 16.80 16.80 sprayer mounted 100 0.157 1.00 Mar 4.36 3.28 1.68 1.97 0.315 3.24 14.56 fert application acre 1.00 Mar 1.0000 5.00 5.00 5.00 fert(N) - dry lb. 80.0000 0.48 38.40 38.40 fert(P) - dry lb. 50.0000 0.70 35.00 35.00 Pickup Truck 3/4 ton 0.006 20.00 Mar 5.65 0.25 5.90 lister 20 ft 100 0.114 1.00 Apr 3.16 2.38 0.57 0.83 0.251 2.59 9.55 Center Pivot ac-in 1.00 Apr 13.56 33.60 0.128 1.31 2.0000 48.47 rod weeder 8 row 100 0.077 1.00 Apr 2.14 1.61 1.11 1.86 0.170 1.75 8.49 planter 75 0.152 1.00 May 2.98 1.77 2.51 4.21 0.305 3.14 14.63 innoculant peanut acre 1.0000 6.80 6.80 6.80 seed - peanut lb. 100.0000 0.76 76.00 76.00 cultivator rolling 100 0.147 1.00 May 4.07 3.07 1.22 1.79 0.324 3.33 13.49 Center Pivot ac-in 1.00 May 6.78 0.064 0.65 1.0000 7.43 cultivator rolling 100 0.147 1.00 May 4.07 3.07 1.22 1.79 0.324 3.33 13.49 Center Pivot ac-in 1.00 Jun 6.78 0.064 0.65 1.0000 7.43 Center Pivot ac-in 1.00 Jun 6.78 0.064 0.65 1.0000 7.43 Center Pivot ac-in 1.00 Jun 6.78 0.064 0.65 1.0000 7.43 insec+appl - peanut appl 1.0000 13.40 13.40 13.40 fung & appl - peanut appl 1.00 Jun 1.0000 15.60 15.60 15.60 cultivator 8 row 75 0.118 1.00 Jun 2.30 1.37 2.01 2.95 0.259 2.67 11.33 Center Pivot ac-in 1.00 Jul 13.56 0.128 1.31 2.0000 14.87 Center Pivot ac-in 1.00 Jul 13.56 0.128 1.31 2.0000 14.87 fung & appl - peanut appl 1.00 Jul 1.0000 15.60 15.60 15.60 Center Pivot ac-in 1.00 Jul 13.56 0.128 1.31 2.0000 14.87 Center Pivot ac-in 1.00 Aug 13.56 0.128 1.31 2.0000 14.87 fung & appl - peanut appl 1.00 Aug 1.0000 15.60 15.60 15.60 Center Pivot ac-in 1.00 Aug 13.56 0.128 1.31 2.0000 14.87 hoeing - peanut acre 1.0000 16.80 16.80 16.80 sprayer mounted 100 0.157 1.00 Aug 4.36 3.28 1.68 1.97 0.315 3.24 14.56 Center Pivot ac-in 1.00 Aug 13.56 0.128 1.31 2.0000 14.87 Center Pivot ac-in 1.00 Sep 13.56 0.128 1.31 2.0000 14.87 peanuts - irrigated acre 1.0000 12.00 12.00 12.00 Center Pivot ac-in 1.00 Oct 6.78 0.064 0.65 1.0000 7.43 dig & shake - peanut acre 1.00 Oct 1.0000 21.50 21.50 21.50 harv&haul - peanuts ton 1.00 Oct 2.2500 65.00 146.25 146.25 drying - peanut ton 1.00 Nov 2.2500 36.00 81.00 81.00 ------- ------- ------- ------- ------ ------- ------- ------- TOTALS 45.41 33.29 167.25 61.82 4.945 50.94 515.75 874.48 INTEREST ON OPERATING CAPITAL 15.56 UNALLOCATED LABOR 0.00 TOTAL SPECIFIED COST 890.05 _____________________________________________________________________________________________________________________________________________Projections for Planning Purposes Only.
Information presented is prepared solely as a general guide & not intended to recognize or predict the costs & returns from any one operation. Developed by Texas AgriLife Extension Service.
Page 18

B-1241 (C1)Projections for Planning Purposes OnlyNot to be Used without Updating after December 15, 2010
Table 10.A Estimated costs and returns per Acre Rotation: Sorghum-Fallow-Wheat: Min. Till Sorghum 2011 Projected Costs and Returns per Acre _______________________________________________________________________ITEM UNIT PRICE QUANTITY AMOUNT YOUR FARM_______________________________________________________________________ dollars dollars INCOME sorghum cwt 8.25 25.0000 206.25 _________ -------- TOTAL INCOME 206.25 _________ DIRECT EXPENSES SEED seed - sorghum lb. 1.70 2.2500 3.82 _________ FERTILIZER fert(N) - ANH3 lb. 0.43 40.0000 17.20 _________ CUSTOM fert appl - ANH3 acre 11.00 1.0000 11.00 _________ herb+appl - sorghum acre 18.00 1.0000 18.00 _________ insec+appl - sorghum appl 14.50 0.3300 4.78 _________ cust harv-sorgh dry acre 20.00 1.0000 20.00 _________ cust haul-sorgh dry cwt. 0.39 25.0000 9.75 _________ CROP INSURANCE sorghum - dryland acre 25.00 1.0000 25.00 _________ OPERATOR LABOR Implements hour 10.30 0.1569 1.61 _________ Tractors hour 10.30 0.4412 4.54 _________ HAND LABOR Implements hour 10.30 0.3104 3.19 _________ DIESEL FUEL Tractors gal 2.65 2.4507 6.49 _________ GASOLINE Self-Propelled Eq. gal 2.73 2.0100 5.48 _________ REPAIR & MAINTENANCE Implements Acre 5.81 1.0000 5.81 _________ Tractors Acre 5.02 1.0000 5.02 _________ Self-Propelled Eq. Acre 0.16 1.0000 0.16 _________ INTEREST ON OP. CAP. Acre 2.90 1.0000 2.90 _________ -------- TOTAL DIRECT EXPENSES 144.81 _________RETURNS ABOVE DIRECT EXPENSES 61.43 _________ FIXED EXPENSES Implements Acre 8.80 1.0000 8.80 _________ Tractors Acre 7.40 1.0000 7.40 _________ Self-Propelled Eq. Acre 0.25 1.0000 0.25 _________ -------- TOTAL FIXED EXPENSES 16.45 _________ -------- TOTAL SPECIFIED EXPENSES 161.27 _________RETURNS ABOVE TOTAL SPECIFIED EXPENSES 44.97 _________ ALLOCATED COST ITEMS cash rent- sorghum acre 25.00 1.0000 25.00 _________RESIDUAL RETURNS 19.97 ________________________________________________________________________________Projections for Planning Purposes Only.
Information presented is prepared solely as a general guide & not intended to recognize or predict the costs & returns from any one operation. Developed by Texas AgriLife Extension Service.
Page 19

B-1241 (C1)Projections for Planning Purposes OnlyNot to be Used without Updating after December 15, 2010
Table 10.B Estimated resource use and costs for field operations, per Acre Rotation: Sorghum-Fallow-Wheat: Min. Till Sorghum 2011 Projected Costs and Returns per Acre _____________________________________________________________________________________________________________________________________________ TRACTOR COST EQUIP COST ALLOC LABOR OPERATING INPUT OPERATION/ SIZE/ TRACTOR PERF TIMES -------------- -------------- ------------- ---------------------- TOTAL OPERATING INPUT UNIT SIZE RATE OVER MTH DIRECT FIXED DIRECT FIXED HOURS COST AMOUNT PRICE COST COST _____________________________________________________________________________________________________________________________________________ ------------dollars----------- dollars -------dollars-------- sweep plow 150 0.065 1.00 Mar 2.08 1.16 0.85 1.25 0.143 1.48 6.84 sorghum - dryland acre 1.0000 25.00 25.00 25.00 fert(N) - ANH3 lb. 1.00 Apr 40.0000 0.43 17.20 17.20 fert appl - ANH3 acre 1.0000 11.00 11.00 11.00 field cultivator 35 ft 150 0.065 1.00 May 2.08 1.16 0.75 1.36 0.143 1.48 6.85 planter 75 0.152 1.00 Jun 2.98 1.77 2.51 4.21 0.305 3.14 14.63 seed - sorghum lb. 2.2500 1.70 3.82 3.82 sprayer mounted 100 0.157 1.00 Jun 4.36 3.28 1.68 1.97 0.315 3.24 14.56 herb+appl - sorghum acre 1.0000 18.00 18.00 18.00 Pickup Truck 3/4 ton 0.006 20.00 Jun 5.65 0.25 5.90 insec+appl - sorghum appl 1.00 Jul 0.3300 14.50 4.78 4.78 cust harv-sorgh dry acre 1.00 Oct 1.0000 20.00 20.00 20.00 cust haul-sorgh dry cwt. 25.0000 0.39 9.75 9.75 ------- ------- ------- ------- ------ ------- ------- ------- TOTALS 11.51 7.40 11.47 9.05 0.908 9.35 109.56 158.36 INTEREST ON OPERATING CAPITAL 2.90 UNALLOCATED LABOR 0.00 TOTAL SPECIFIED COST 161.27 _____________________________________________________________________________________________________________________________________________Projections for Planning Purposes Only.
Information presented is prepared solely as a general guide & not intended to recognize or predict the costs & returns from any one operation. Developed by Texas AgriLife Extension Service.
Page 20

B-1241 (C1)Projections for Planning Purposes OnlyNot to be Used without Updating after December 15, 2010
Table 11.A Estimated costs and returns per Acre Rotation: Sorghum-Fallow-Wheat: Min. Till Fallow 2011 Projected Costs and Returns per Acre _______________________________________________________________________ITEM UNIT PRICE QUANTITY AMOUNT YOUR FARM_______________________________________________________________________ dollars dollars INCOME -------- TOTAL INCOME 0.00 _________ DIRECT EXPENSES HERBICIDE herb.& appl.-fallow acre 15.00 2.0000 30.00 _________ OPERATOR LABOR Implements hour 10.30 0.1569 1.61 _________ Tractors hour 10.30 0.1308 1.34 _________ DIESEL FUEL Tractors gal 2.65 1.0097 2.67 _________ REPAIR & MAINTENANCE Implements Acre 1.71 1.0000 1.71 _________ Tractors Acre 1.49 1.0000 1.49 _________ INTEREST ON OP. CAP. Acre 0.26 1.0000 0.26 _________ -------- TOTAL DIRECT EXPENSES 39.11 _________RETURNS ABOVE DIRECT EXPENSES -39.11 _________ FIXED EXPENSES Implements Acre 2.50 1.0000 2.50 _________ Tractors Acre 2.33 1.0000 2.33 _________ -------- TOTAL FIXED EXPENSES 4.83 _________ -------- TOTAL SPECIFIED EXPENSES 43.95 _________RETURNS ABOVE TOTAL SPECIFIED EXPENSES -43.95 _________ ALLOCATED COST ITEMS cash rent - wheatd acre 25.00 1.0000 25.00 _________RESIDUAL RETURNS -68.95 ________________________________________________________________________________Projections for Planning Purposes Only.
Information presented is prepared solely as a general guide & not intended to recognize or predict the costs & returns from any one operation. Developed by Texas AgriLife Extension Service.
Page 21
B-1241 (C1)Projections for Planning Purposes OnlyNot to be Used without Updating after December 15, 2010
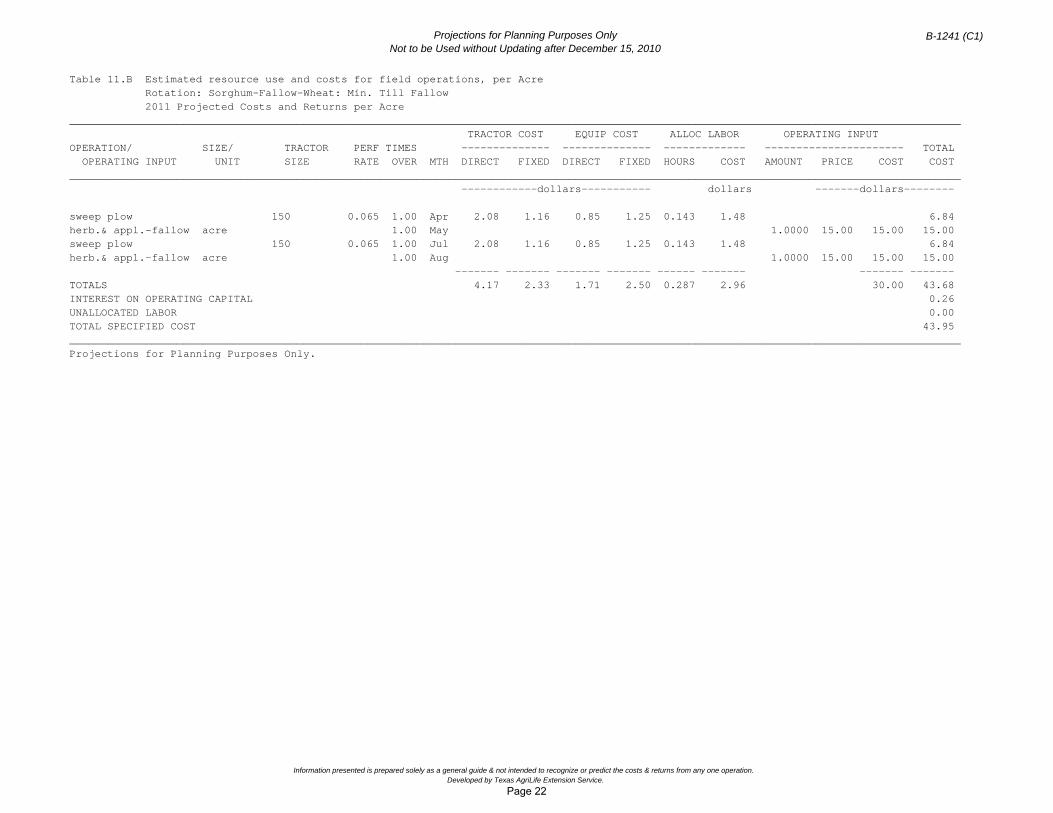
Table 11.B Estimated resource use and costs for field operations, per Acre Rotation: Sorghum-Fallow-Wheat: Min. Till Fallow 2011 Projected Costs and Returns per Acre _____________________________________________________________________________________________________________________________________________ TRACTOR COST EQUIP COST ALLOC LABOR OPERATING INPUT OPERATION/ SIZE/ TRACTOR PERF TIMES -------------- -------------- ------------- ---------------------- TOTAL OPERATING INPUT UNIT SIZE RATE OVER MTH DIRECT FIXED DIRECT FIXED HOURS COST AMOUNT PRICE COST COST _____________________________________________________________________________________________________________________________________________ ------------dollars----------- dollars -------dollars-------- sweep plow 150 0.065 1.00 Apr 2.08 1.16 0.85 1.25 0.143 1.48 6.84 herb.& appl.-fallow acre 1.00 May 1.0000 15.00 15.00 15.00 sweep plow 150 0.065 1.00 Jul 2.08 1.16 0.85 1.25 0.143 1.48 6.84 herb.& appl.-fallow acre 1.00 Aug 1.0000 15.00 15.00 15.00 ------- ------- ------- ------- ------ ------- ------- ------- TOTALS 4.17 2.33 1.71 2.50 0.287 2.96 30.00 43.68 INTEREST ON OPERATING CAPITAL 0.26 UNALLOCATED LABOR 0.00 TOTAL SPECIFIED COST 43.95 _____________________________________________________________________________________________________________________________________________Projections for Planning Purposes Only.
Information presented is prepared solely as a general guide & not intended to recognize or predict the costs & returns from any one operation. Developed by Texas AgriLife Extension Service.
Page 22

B-1241 (C1)Projections for Planning Purposes OnlyNot to be Used without Updating after December 15, 2010
Table 12.A Estimated costs and returns per Acre Rot: Sorghum-Fallow-Wheat: Min Till Wheat (W/ grazing) 2011 Projected Costs and Returns per Acre _______________________________________________________________________ITEM UNIT PRICE QUANTITY AMOUNT YOUR FARM_______________________________________________________________________ dollars dollars INCOME grazing - wheat lbs 0.43 73.0000 31.39 _________ wheat bu. 6.48 26.0000 168.48 _________ -------- TOTAL INCOME 199.87 _________ DIRECT EXPENSES SEED seed- wheat bu. 14.40 1.0000 14.40 _________ FERTILIZER fert(N) - dry lb. 0.48 30.0000 14.40 _________ CUSTOM fert application acre 5.00 1.0000 5.00 _________ cust harv-wheat acre 20.00 1.0000 20.00 _________ cust haul-wheat dry bu. 0.23 26.0000 5.98 _________ OPERATOR LABOR Tractors hour 10.30 0.2121 2.18 _________ HAND LABOR Implements hour 10.30 0.2121 2.18 _________ DIESEL FUEL Tractors gal 2.65 0.5450 1.44 _________ GASOLINE Self-Propelled Eq. gal 2.73 2.0100 5.48 _________ REPAIR & MAINTENANCE Implements Acre 1.50 1.0000 1.50 _________ Tractors Acre 1.38 1.0000 1.38 _________ Self-Propelled Eq. Acre 0.16 1.0000 0.16 _________ INTEREST ON OP. CAP. Acre 1.29 1.0000 1.29 _________ -------- TOTAL DIRECT EXPENSES 75.42 _________RETURNS ABOVE DIRECT EXPENSES 124.44 _________ FIXED EXPENSES Implements Acre 2.51 1.0000 2.51 _________ Tractors Acre 1.72 1.0000 1.72 _________ Self-Propelled Eq. Acre 0.25 1.0000 0.25 _________ -------- TOTAL FIXED EXPENSES 4.49 _________ -------- TOTAL SPECIFIED EXPENSES 79.91 _________RETURNS ABOVE TOTAL SPECIFIED EXPENSES 119.95 _________ ALLOCATED COST ITEMS cash rent - wheatd acre 25.00 1.0000 25.00 _________RESIDUAL RETURNS 94.95 ________________________________________________________________________________Projections for Planning Purposes Only.
Information presented is prepared solely as a general guide & not intended to recognize or predict the costs & returns from any one operation. Developed by Texas AgriLife Extension Service.
Page 23

B-1241 (C1)Projections for Planning Purposes OnlyNot to be Used without Updating after December 15, 2010
Table 12.B Estimated resource use and costs for field operations, per Acre Rot: Sorghum-Fallow-Wheat: Min Till Wheat (W/ grazing) 2011 Projected Costs and Returns per Acre _____________________________________________________________________________________________________________________________________________ TRACTOR COST EQUIP COST ALLOC LABOR OPERATING INPUT OPERATION/ SIZE/ TRACTOR PERF TIMES -------------- -------------- ------------- ---------------------- TOTAL OPERATING INPUT UNIT SIZE RATE OVER MTH DIRECT FIXED DIRECT FIXED HOURS COST AMOUNT PRICE COST COST _____________________________________________________________________________________________________________________________________________ ------------dollars----------- dollars -------dollars-------- grain drill 40 0.212 1.00 Sep 2.82 1.72 1.50 2.51 0.424 4.36 12.93 seed- wheat bu. 1.0000 14.40 14.40 14.40 Pickup Truck 3/4 ton 0.006 20.00 Dec 5.65 0.25 5.90 fert(N) - dry lb. 1.00 Mar 30.0000 0.48 14.40 14.40 fert application acre 1.0000 5.00 5.00 5.00 cust harv-wheat acre 1.00 May 1.0000 20.00 20.00 20.00 cust haul-wheat dry bu. 26.0000 0.23 5.98 5.98 ------- ------- ------- ------- ------ ------- ------- ------- TOTALS 2.82 1.72 7.15 2.76 0.424 4.36 59.78 78.62 INTEREST ON OPERATING CAPITAL 1.29 UNALLOCATED LABOR 0.00 TOTAL SPECIFIED COST 79.91 _____________________________________________________________________________________________________________________________________________Projections for Planning Purposes Only.
Information presented is prepared solely as a general guide & not intended to recognize or predict the costs & returns from any one operation. Developed by Texas AgriLife Extension Service.
Page 24

B-1241 (C1)Projections for Planning Purposes OnlyNot to be Used without Updating after December 15, 2010
Table 13.A Estimated costs and returns per Acre Sorghum, Dryland, Continuous, Minimum Tillage 2011 Projected Costs and Returns per Acre _______________________________________________________________________ITEM UNIT PRICE QUANTITY AMOUNT YOUR FARM_______________________________________________________________________ dollars dollars INCOME sorghum cwt 8.25 25.0000 206.25 _________ -------- TOTAL INCOME 206.25 _________ DIRECT EXPENSES SEED seed - sorghum lb. 1.70 2.2500 3.82 _________ FERTILIZER fert(N) - ANH3 lb. 0.43 30.0000 12.90 _________ CUSTOM fert appl - ANH3 acre 11.00 1.0000 11.00 _________ herb+appl - sorghum acre 18.00 1.0000 18.00 _________ insec+appl - sorghum appl 14.50 0.3300 4.78 _________ cust harv-sorgh dry acre 20.00 1.0000 20.00 _________ cust haul-sorgh dry cwt. 0.39 25.0000 9.75 _________ CROP INSURANCE sorghum - dryland acre 25.00 1.0000 25.00 _________ OPERATOR LABOR Implements hour 10.30 0.1569 1.61 _________ Tractors hour 10.30 0.4412 4.54 _________ HAND LABOR Implements hour 10.30 0.3104 3.19 _________ DIESEL FUEL Tractors gal 2.65 2.4507 6.49 _________ GASOLINE Self-Propelled Eq. gal 2.73 2.0100 5.48 _________ REPAIR & MAINTENANCE Implements Acre 5.81 1.0000 5.81 _________ Tractors Acre 5.02 1.0000 5.02 _________ Self-Propelled Eq. Acre 0.16 1.0000 0.16 _________ INTEREST ON OP. CAP. Acre 2.78 1.0000 2.78 _________ -------- TOTAL DIRECT EXPENSES 140.39 _________RETURNS ABOVE DIRECT EXPENSES 65.85 _________ FIXED EXPENSES Implements Acre 8.80 1.0000 8.80 _________ Tractors Acre 7.40 1.0000 7.40 _________ Self-Propelled Eq. Acre 0.25 1.0000 0.25 _________ -------- TOTAL FIXED EXPENSES 16.45 _________ -------- TOTAL SPECIFIED EXPENSES 156.85 _________RETURNS ABOVE TOTAL SPECIFIED EXPENSES 49.39 _________ ALLOCATED COST ITEMS cash rent- sorghum acre 25.00 1.0000 25.00 _________RESIDUAL RETURNS 24.39 ________________________________________________________________________________Projections for Planning Purposes Only.
Information presented is prepared solely as a general guide & not intended to recognize or predict the costs & returns from any one operation. Developed by Texas AgriLife Extension Service.
Page 25

B-1241 (C1)Projections for Planning Purposes OnlyNot to be Used without Updating after December 15, 2010
Table 13.B Estimated resource use and costs for field operations, per Acre Sorghum, Dryland, Continuous, Minimum Tillage 2011 Projected Costs and Returns per Acre _____________________________________________________________________________________________________________________________________________ TRACTOR COST EQUIP COST ALLOC LABOR OPERATING INPUT OPERATION/ SIZE/ TRACTOR PERF TIMES -------------- -------------- ------------- ---------------------- TOTAL OPERATING INPUT UNIT SIZE RATE OVER MTH DIRECT FIXED DIRECT FIXED HOURS COST AMOUNT PRICE COST COST _____________________________________________________________________________________________________________________________________________ ------------dollars----------- dollars -------dollars-------- sweep plow 150 0.065 1.00 Mar 2.08 1.16 0.85 1.25 0.143 1.48 6.84 sorghum - dryland acre 1.0000 25.00 25.00 25.00 fert(N) - ANH3 lb. 1.00 Apr 30.0000 0.43 12.90 12.90 fert appl - ANH3 acre 1.0000 11.00 11.00 11.00 field cultivator 35 ft 150 0.065 1.00 May 2.08 1.16 0.75 1.36 0.143 1.48 6.85 planter 75 0.152 1.00 Jun 2.98 1.77 2.51 4.21 0.305 3.14 14.63 seed - sorghum lb. 2.2500 1.70 3.82 3.82 sprayer mounted 100 0.157 1.00 Jun 4.36 3.28 1.68 1.97 0.315 3.24 14.56 herb+appl - sorghum acre 1.0000 18.00 18.00 18.00 Pickup Truck 3/4 ton 0.006 20.00 Jun 5.65 0.25 5.90 insec+appl - sorghum appl 1.00 Jul 0.3300 14.50 4.78 4.78 cust harv-sorgh dry acre 1.00 Oct 1.0000 20.00 20.00 20.00 cust haul-sorgh dry cwt. 25.0000 0.39 9.75 9.75 ------- ------- ------- ------- ------ ------- ------- ------- TOTALS 11.51 7.40 11.47 9.05 0.908 9.35 105.26 154.06 INTEREST ON OPERATING CAPITAL 2.78 UNALLOCATED LABOR 0.00 TOTAL SPECIFIED COST 156.85 _____________________________________________________________________________________________________________________________________________Projections for Planning Purposes Only.
Information presented is prepared solely as a general guide & not intended to recognize or predict the costs & returns from any one operation. Developed by Texas AgriLife Extension Service.
Page 26

B-1241 (C1)Projections for Planning Purposes OnlyNot to be Used without Updating after December 15, 2010
Table 14.A Estimated costs and returns per Acre Cont. Sorghum, Furrow Irrigated, (NG) 2011 Projected Costs and Returns per Acre _______________________________________________________________________ITEM UNIT PRICE QUANTITY AMOUNT YOUR FARM_______________________________________________________________________ dollars dollars INCOME sorghum cwt 8.25 65.0000 536.25 _________ -------- TOTAL INCOME 536.25 _________ DIRECT EXPENSES SEED seed - sorghum lb. 1.70 4.5000 7.65 _________ FERTILIZER fert(N) - ANH3 lb. 0.43 100.0000 43.00 _________ fert(P) - dry lb. 0.70 40.0000 28.00 _________ CUSTOM fert appl - ANH3 acre 11.00 1.0000 11.00 _________ fert application acre 5.00 1.0000 5.00 _________ herb&appl-sorghumi acre 23.65 1.0000 23.65 _________ insec+appl - sorghum appl 14.50 0.3300 4.78 _________ harvest & haul - sor cwt. 0.88 65.0000 57.20 _________ CROP INSURANCE sorghum - irrigated acre 26.25 1.0000 26.25 _________ OPERATOR LABOR Implements hour 10.30 0.5978 6.15 _________ Tractors hour 10.30 0.8086 8.32 _________ HAND LABOR Implements hour 10.30 0.3104 3.19 _________ IRRIGATION LABOR Furrow hour 10.30 1.6860 17.36 _________ DIESEL FUEL Tractors gal 2.65 4.5441 12.04 _________ GASOLINE Self-Propelled Eq. gal 2.73 2.0100 5.48 _________ NATURAL GAS Furrow Mcf 4.75 12.0000 57.00 _________ REPAIR & MAINTENANCE Implements Acre 9.24 1.0000 9.24 _________ Tractors Acre 10.19 1.0000 10.19 _________ Self-Propelled Eq. Acre 0.16 1.0000 0.16 _________ Furrow ac-in 1.80 12.0000 21.60 _________ INTEREST ON OP. CAP. Acre 7.72 1.0000 7.72 _________ -------- TOTAL DIRECT EXPENSES 365.05 _________RETURNS ABOVE DIRECT EXPENSES 171.19 _________ FIXED EXPENSES Implements Acre 13.71 1.0000 13.71 _________ Tractors Acre 15.48 1.0000 15.48 _________ Self-Propelled Eq. Acre 0.25 1.0000 0.25 _________ Furrow Acre 24.62 1.0000 24.62 _________ -------- TOTAL FIXED EXPENSES 54.06 _________ -------- TOTAL SPECIFIED EXPENSES 419.12 _________RETURNS ABOVE TOTAL SPECIFIED EXPENSES 117.12 _________ ALLOCATED COST ITEMS cash rent - sorghumf acre 65.00 1.0000 65.00 _________RESIDUAL RETURNS 52.12 ________________________________________________________________________________Projections for Planning Purposes Only.
Information presented is prepared solely as a general guide & not intended to recognize or predict the costs & returns from any one operation. Developed by Texas AgriLife Extension Service.
Page 27

B-1241 (C1)Projections for Planning Purposes OnlyNot to be Used without Updating after December 15, 2010
Table 14.B Estimated resource use and costs for field operations, per Acre Cont. Sorghum, Furrow Irrigated, (NG) 2011 Projected Costs and Returns per Acre _____________________________________________________________________________________________________________________________________________ TRACTOR COST EQUIP COST ALLOC LABOR OPERATING INPUT OPERATION/ SIZE/ TRACTOR PERF TIMES -------------- -------------- ------------- ---------------------- TOTAL OPERATING INPUT UNIT SIZE RATE OVER MTH DIRECT FIXED DIRECT FIXED HOURS COST AMOUNT PRICE COST COST _____________________________________________________________________________________________________________________________________________ ------------dollars----------- dollars -------dollars-------- disc tandem 100 0.138 1.00 Feb 3.81 2.87 1.52 2.23 0.303 3.12 13.57 chisel 125 0.099 1.00 Feb 3.35 2.47 0.69 1.15 0.219 2.25 9.93 fert(N) - ANH3 lb. 1.00 Mar 100.0000 0.43 43.00 43.00 fert(P) - dry lb. 40.0000 0.70 28.00 28.00 fert appl - ANH3 acre 1.0000 11.00 11.00 11.00 fert application acre 1.0000 5.00 5.00 5.00 sorghum - irrigated acre 1.0000 26.25 26.25 26.25 disc tandem 100 0.138 1.00 Mar 3.81 2.87 1.52 2.23 0.303 3.12 13.57 sweep plow 150 0.065 1.00 Apr 2.08 1.16 0.85 1.25 0.143 1.48 6.84 bedder 150 0.057 1.00 Apr 1.82 1.02 0.44 0.64 0.125 1.29 5.22 planter 75 0.152 1.00 May 2.98 1.77 2.51 4.21 0.305 3.14 14.63 seed - sorghum lb. 4.5000 1.70 7.65 7.65 herb&appl-sorghumi acre 1.0000 23.65 23.65 23.65 sprayer mounted 100 0.157 1.00 May 4.36 3.28 1.68 1.97 0.315 3.24 14.56 Pickup Truck 3/4 ton 0.006 20.00 May 5.65 0.25 5.90 Furrow ac-in 1.00 Jun 26.20 24.62 0.562 5.78 4.0000 56.60 Furrow ac-in 1.00 Jul 26.20 0.562 5.78 4.0000 31.98 insec+appl - sorghum appl 1.00 Jul 0.3300 14.50 4.78 4.78 Furrow ac-in 1.00 Aug 26.20 0.562 5.78 4.0000 31.98 harvest & haul - sor cwt. 1.00 Oct 65.0000 0.88 57.20 57.20 ------- ------- ------- ------- ------ ------- ------- ------- TOTALS 22.24 15.48 93.50 38.58 3.402 35.04 206.53 411.39 INTEREST ON OPERATING CAPITAL 7.72 UNALLOCATED LABOR 0.00 TOTAL SPECIFIED COST 419.12 _____________________________________________________________________________________________________________________________________________Projections for Planning Purposes Only.
Information presented is prepared solely as a general guide & not intended to recognize or predict the costs & returns from any one operation. Developed by Texas AgriLife Extension Service.
Page 28

B-1241 (C1)Projections for Planning Purposes OnlyNot to be Used without Updating after December 15, 2010
Table 15.A Estimated costs and returns per Acre Cont. Sorghum, Sprinkler Irrigated, (NG) 2011 Projected Costs and Returns per Acre _______________________________________________________________________ITEM UNIT PRICE QUANTITY AMOUNT YOUR FARM_______________________________________________________________________ dollars dollars INCOME sorghum cwt 8.25 75.0000 618.75 _________ -------- TOTAL INCOME 618.75 _________ DIRECT EXPENSES SEED seed - sorghum lb. 1.70 5.0000 8.50 _________ FERTILIZER fert(N) - ANH3 lb. 0.43 65.0000 27.95 _________ fert(P) - liquid lb. 0.71 50.0000 35.50 _________ fert(N) - liquid lb. 0.57 60.0000 34.20 _________ CUSTOM fert appl - ANH3 acre 11.00 1.0000 11.00 _________ herb&appl-sorghumi acre 23.65 1.0000 23.65 _________ insec+appl - sorghum appl 14.50 0.3300 4.78 _________ harvest & haul - sor cwt. 0.88 75.0000 66.00 _________ CROP INSURANCE sorghum - irrigated acre 26.25 1.0000 26.25 _________ OPERATOR LABOR Implements hour 10.30 0.3225 3.32 _________ Tractors hour 10.30 0.4215 4.34 _________ HAND LABOR Implements hour 10.30 0.1527 1.57 _________ IRRIGATION LABOR Center Pivot hour 10.30 0.8960 9.22 _________ DIESEL FUEL Tractors gal 2.65 2.3443 6.21 _________ GASOLINE Self-Propelled Eq. gal 2.73 2.0100 5.48 _________ NATURAL GAS Center Pivot Mcf 4.75 14.0000 66.50 _________ REPAIR & MAINTENANCE Implements Acre 5.75 1.0000 5.75 _________ Tractors Acre 4.75 1.0000 4.75 _________ Self-Propelled Eq. Acre 0.16 1.0000 0.16 _________ Center Pivot ac-in 2.03 14.0000 28.42 _________ INTEREST ON OP. CAP. Acre 7.28 1.0000 7.28 _________ -------- TOTAL DIRECT EXPENSES 380.88 _________RETURNS ABOVE DIRECT EXPENSES 237.86 _________ FIXED EXPENSES Implements Acre 8.94 1.0000 8.94 _________ Tractors Acre 6.98 1.0000 6.98 _________ Self-Propelled Eq. Acre 0.25 1.0000 0.25 _________ Center Pivot Acre 33.60 1.0000 33.60 _________ -------- TOTAL FIXED EXPENSES 49.79 _________ -------- TOTAL SPECIFIED EXPENSES 430.67 _________RETURNS ABOVE TOTAL SPECIFIED EXPENSES 188.07 _________ ALLOCATED COST ITEMS cash rent - sorghumf acre 65.00 1.0000 65.00 _________RESIDUAL RETURNS 123.07 ________________________________________________________________________________Projections for Planning Purposes Only.
Information presented is prepared solely as a general guide & not intended to recognize or predict the costs & returns from any one operation. Developed by Texas AgriLife Extension Service.
Page 29
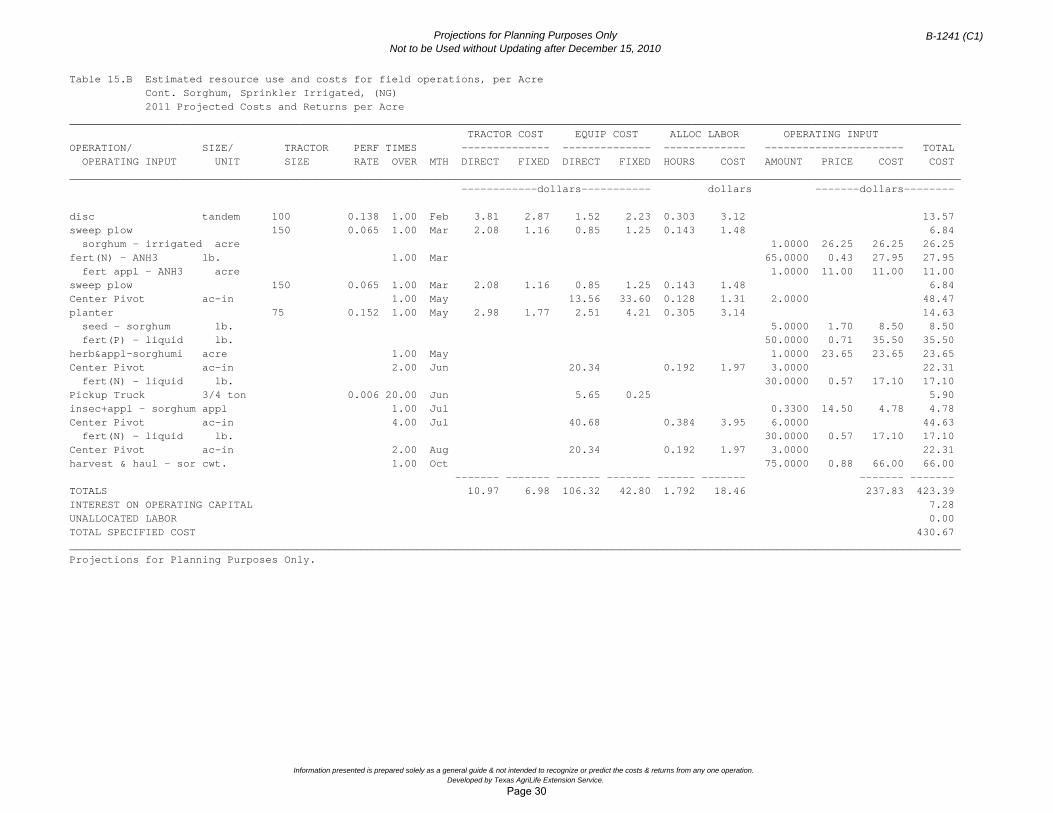
B-1241 (C1)Projections for Planning Purposes OnlyNot to be Used without Updating after December 15, 2010
Table 15.B Estimated resource use and costs for field operations, per Acre Cont. Sorghum, Sprinkler Irrigated, (NG) 2011 Projected Costs and Returns per Acre _____________________________________________________________________________________________________________________________________________ TRACTOR COST EQUIP COST ALLOC LABOR OPERATING INPUT OPERATION/ SIZE/ TRACTOR PERF TIMES -------------- -------------- ------------- ---------------------- TOTAL OPERATING INPUT UNIT SIZE RATE OVER MTH DIRECT FIXED DIRECT FIXED HOURS COST AMOUNT PRICE COST COST _____________________________________________________________________________________________________________________________________________ ------------dollars----------- dollars -------dollars-------- disc tandem 100 0.138 1.00 Feb 3.81 2.87 1.52 2.23 0.303 3.12 13.57 sweep plow 150 0.065 1.00 Mar 2.08 1.16 0.85 1.25 0.143 1.48 6.84 sorghum - irrigated acre 1.0000 26.25 26.25 26.25 fert(N) - ANH3 lb. 1.00 Mar 65.0000 0.43 27.95 27.95 fert appl - ANH3 acre 1.0000 11.00 11.00 11.00 sweep plow 150 0.065 1.00 Mar 2.08 1.16 0.85 1.25 0.143 1.48 6.84 Center Pivot ac-in 1.00 May 13.56 33.60 0.128 1.31 2.0000 48.47 planter 75 0.152 1.00 May 2.98 1.77 2.51 4.21 0.305 3.14 14.63 seed - sorghum lb. 5.0000 1.70 8.50 8.50 fert(P) - liquid lb. 50.0000 0.71 35.50 35.50 herb&appl-sorghumi acre 1.00 May 1.0000 23.65 23.65 23.65 Center Pivot ac-in 2.00 Jun 20.34 0.192 1.97 3.0000 22.31 fert(N) - liquid lb. 30.0000 0.57 17.10 17.10 Pickup Truck 3/4 ton 0.006 20.00 Jun 5.65 0.25 5.90 insec+appl - sorghum appl 1.00 Jul 0.3300 14.50 4.78 4.78 Center Pivot ac-in 4.00 Jul 40.68 0.384 3.95 6.0000 44.63 fert(N) - liquid lb. 30.0000 0.57 17.10 17.10 Center Pivot ac-in 2.00 Aug 20.34 0.192 1.97 3.0000 22.31 harvest & haul - sor cwt. 1.00 Oct 75.0000 0.88 66.00 66.00 ------- ------- ------- ------- ------ ------- ------- ------- TOTALS 10.97 6.98 106.32 42.80 1.792 18.46 237.83 423.39 INTEREST ON OPERATING CAPITAL 7.28 UNALLOCATED LABOR 0.00 TOTAL SPECIFIED COST 430.67 _____________________________________________________________________________________________________________________________________________Projections for Planning Purposes Only.
Information presented is prepared solely as a general guide & not intended to recognize or predict the costs & returns from any one operation. Developed by Texas AgriLife Extension Service.
Page 30

B-1241 (C1)Projections for Planning Purposes OnlyNot to be Used without Updating after December 15, 2010
Table 16.A Estimated costs and returns per Acre Soybeans, RR, Furrow Irr. (NG) following corn/sorghum 2011 Projected Costs and Returns per Acre _______________________________________________________________________ITEM UNIT PRICE QUANTITY AMOUNT YOUR FARM_______________________________________________________________________ dollars dollars INCOME soybeans bu. 10.70 60.0000 642.00 _________ -------- TOTAL INCOME 642.00 _________ DIRECT EXPENSES SEED seed - soybeans bag 60.00 1.0000 60.00 _________ innoculant soybeans acre 7.84 1.0000 7.84 _________ FERTILIZER fert(P) - liquid lb. 0.71 45.0000 31.95 _________ CUSTOM herb+appl-soybeans i acre 15.00 2.0000 30.00 _________ insec+appl-soybeans acre 11.50 0.5000 5.75 _________ harv & haul - soybea bu. 0.50 60.0000 30.00 _________ CROP INSURANCE soybean - furrow irr acre 23.00 1.0000 23.00 _________ OPERATOR LABOR Implements hour 10.30 0.4842 4.98 _________ Tractors hour 10.30 0.5562 5.72 _________ HAND LABOR Implements hour 10.30 0.1527 1.57 _________ IRRIGATION LABOR Furrow hour 10.30 2.2480 23.15 _________ DIESEL FUEL Tractors gal 2.65 3.2044 8.49 _________ GASOLINE Self-Propelled Eq. gal 2.73 2.0100 5.48 _________ NATURAL GAS Furrow Mcf 4.75 16.0000 76.00 _________ REPAIR & MAINTENANCE Implements Acre 7.11 1.0000 7.11 _________ Tractors Acre 6.44 1.0000 6.44 _________ Self-Propelled Eq. Acre 0.16 1.0000 0.16 _________ Furrow ac-in 1.80 16.0000 28.80 _________ INTEREST ON OP. CAP. Acre 5.79 1.0000 5.79 _________ -------- TOTAL DIRECT EXPENSES 362.28 _________RETURNS ABOVE DIRECT EXPENSES 279.71 _________ FIXED EXPENSES Implements Acre 11.67 1.0000 11.67 _________ Tractors Acre 9.62 1.0000 9.62 _________ Self-Propelled Eq. Acre 0.25 1.0000 0.25 _________ Furrow Acre 24.62 1.0000 24.62 _________ -------- TOTAL FIXED EXPENSES 46.17 _________ -------- TOTAL SPECIFIED EXPENSES 408.46 _________RETURNS ABOVE TOTAL SPECIFIED EXPENSES 233.53 _________ ALLOCATED COST ITEMS cash rent- soybeans acre 65.00 1.0000 65.00 _________RESIDUAL RETURNS 168.53 ________________________________________________________________________________Projections for Planning Purposes Only.
Information presented is prepared solely as a general guide & not intended to recognize or predict the costs & returns from any one operation. Developed by Texas AgriLife Extension Service.
Page 31

B-1241 (C1)Projections for Planning Purposes OnlyNot to be Used without Updating after December 15, 2010
Table 16.B Estimated resource use and costs for field operations, per Acre Soybeans, RR, Furrow Irr. (NG) following corn/sorghum 2011 Projected Costs and Returns per Acre _____________________________________________________________________________________________________________________________________________ TRACTOR COST EQUIP COST ALLOC LABOR OPERATING INPUT OPERATION/ SIZE/ TRACTOR PERF TIMES -------------- -------------- ------------- ---------------------- TOTAL OPERATING INPUT UNIT SIZE RATE OVER MTH DIRECT FIXED DIRECT FIXED HOURS COST AMOUNT PRICE COST COST _____________________________________________________________________________________________________________________________________________ ------------dollars----------- dollars -------dollars-------- disc tandem 100 0.138 1.00 Dec 3.81 2.87 1.52 2.23 0.303 3.12 13.57 field cultivator 35 ft 150 0.065 1.00 Jan 2.08 1.16 0.75 1.36 0.143 1.48 6.85 field cultivator 35 ft 150 0.065 1.00 Feb 2.08 1.16 0.75 1.36 0.143 1.48 6.85 bedder 150 0.057 1.00 Mar 1.82 1.02 0.44 0.64 0.125 1.29 5.22 soybean - furrow irr acre 1.0000 23.00 23.00 23.00 rod weeder 8 row 100 0.077 1.00 May 2.14 1.61 1.11 1.86 0.170 1.75 8.49 planter 75 0.152 1.00 May 2.98 1.77 2.51 4.21 0.305 3.14 14.63 seed - soybeans bag 1.0000 60.00 60.00 60.00 fert(P) - liquid lb. 45.0000 0.71 31.95 31.95 innoculant soybeans acre 1.0000 7.84 7.84 7.84 Pickup Truck 3/4 ton 0.006 20.00 Jun 5.65 0.25 5.90 Furrow ac-in 1.00 Jun 26.20 24.62 0.562 5.78 4.0000 56.60 herb+appl-soybeans i acre 1.00 Jun 1.0000 15.00 15.00 15.00 Furrow ac-in 1.00 Jul 26.20 0.562 5.78 4.0000 31.98 herb+appl-soybeans i acre 1.0000 15.00 15.00 15.00 Furrow ac-in 1.00 Jul 26.20 0.562 5.78 4.0000 31.98 insec+appl-soybeans acre 1.00 Aug 0.5000 11.50 5.75 5.75 Furrow ac-in 1.00 Aug 26.20 0.562 5.78 4.0000 31.98 harv & haul - soybea bu. 1.00 Sep 60.0000 0.50 30.00 30.00 ------- ------- ------- ------- ------ ------- ------- ------- TOTALS 14.94 9.62 117.56 36.55 3.441 35.44 188.54 402.66 INTEREST ON OPERATING CAPITAL 5.79 UNALLOCATED LABOR 0.00 TOTAL SPECIFIED COST 408.46 _____________________________________________________________________________________________________________________________________________Projections for Planning Purposes Only.
Information presented is prepared solely as a general guide & not intended to recognize or predict the costs & returns from any one operation. Developed by Texas AgriLife Extension Service.
Page 32

B-1241 (C1)Projections for Planning Purposes OnlyNot to be Used without Updating after December 15, 2010
Table 17.A Estimated costs and returns per Acre Soybeans, Roundup Ready, Sprinkler Irr., (NG) 2011 Projected Costs and Returns per Acre _______________________________________________________________________ITEM UNIT PRICE QUANTITY AMOUNT YOUR FARM_______________________________________________________________________ dollars dollars INCOME soybeans bu. 10.70 60.0000 642.00 _________ -------- TOTAL INCOME 642.00 _________ DIRECT EXPENSES SEED seed - soybeans bag 60.00 1.0000 60.00 _________ innoculant soybeans acre 7.84 1.0000 7.84 _________ FERTILIZER fert(P) - liquid lb. 0.71 45.0000 31.95 _________ CUSTOM herb+appl-soybeans i acre 15.00 2.0000 30.00 _________ insec+appl-soybeans acre 11.50 0.5000 5.75 _________ harv & haul - soybea bu. 0.50 60.0000 30.00 _________ CROP INSURANCE soybeans - irrigated acre 23.00 1.0000 23.00 _________ OPERATOR LABOR Implements hour 10.30 0.3225 3.32 _________ Tractors hour 10.30 0.4215 4.34 _________ HAND LABOR Implements hour 10.30 0.1527 1.57 _________ IRRIGATION LABOR Center Pivot hour 10.30 0.8960 9.22 _________ DIESEL FUEL Tractors gal 2.65 2.3443 6.21 _________ GASOLINE Self-Propelled Eq. gal 2.73 2.0100 5.48 _________ NATURAL GAS Center Pivot Mcf 4.75 14.0000 66.50 _________ REPAIR & MAINTENANCE Implements Acre 5.55 1.0000 5.55 _________ Tractors Acre 4.75 1.0000 4.75 _________ Self-Propelled Eq. Acre 0.16 1.0000 0.16 _________ Center Pivot ac-in 2.03 14.0000 28.42 _________ INTEREST ON OP. CAP. Acre 5.40 1.0000 5.40 _________ -------- TOTAL DIRECT EXPENSES 329.51 _________RETURNS ABOVE DIRECT EXPENSES 312.48 _________ FIXED EXPENSES Implements Acre 9.16 1.0000 9.16 _________ Tractors Acre 6.98 1.0000 6.98 _________ Self-Propelled Eq. Acre 0.25 1.0000 0.25 _________ Center Pivot Acre 33.60 1.0000 33.60 _________ -------- TOTAL FIXED EXPENSES 50.01 _________ -------- TOTAL SPECIFIED EXPENSES 379.52 _________RETURNS ABOVE TOTAL SPECIFIED EXPENSES 262.47 _________ ALLOCATED COST ITEMS cash rent- soybeans acre 65.00 1.0000 65.00 _________RESIDUAL RETURNS 197.47 ________________________________________________________________________________Projections for Planning Purposes Only.
Information presented is prepared solely as a general guide & not intended to recognize or predict the costs & returns from any one operation. Developed by Texas AgriLife Extension Service.
Page 33

B-1241 (C1)Projections for Planning Purposes OnlyNot to be Used without Updating after December 15, 2010
Table 17.B Estimated resource use and costs for field operations, per Acre Soybeans, Roundup Ready, Sprinkler Irr., (NG) 2011 Projected Costs and Returns per Acre _____________________________________________________________________________________________________________________________________________ TRACTOR COST EQUIP COST ALLOC LABOR OPERATING INPUT OPERATION/ SIZE/ TRACTOR PERF TIMES -------------- -------------- ------------- ---------------------- TOTAL OPERATING INPUT UNIT SIZE RATE OVER MTH DIRECT FIXED DIRECT FIXED HOURS COST AMOUNT PRICE COST COST _____________________________________________________________________________________________________________________________________________ ------------dollars----------- dollars -------dollars-------- disc tandem 100 0.138 1.00 Dec 3.81 2.87 1.52 2.23 0.303 3.12 13.57 field cultivator 35 ft 150 0.065 1.00 Jan 2.08 1.16 0.75 1.36 0.143 1.48 6.85 field cultivator 35 ft 150 0.065 1.00 Feb 2.08 1.16 0.75 1.36 0.143 1.48 6.85 soybeans - irrigated acre 1.00 Mar 1.0000 23.00 23.00 23.00 planter 75 0.152 1.00 May 2.98 1.77 2.51 4.21 0.305 3.14 14.63 seed - soybeans bag 1.0000 60.00 60.00 60.00 fert(P) - liquid lb. 45.0000 0.71 31.95 31.95 innoculant soybeans acre 1.0000 7.84 7.84 7.84 Center Pivot ac-in 1.00 May 13.56 33.60 0.128 1.31 2.0000 48.47 Pickup Truck 3/4 ton 0.006 20.00 Jun 5.65 0.25 5.90 Center Pivot ac-in 2.00 Jun 20.34 0.192 1.97 3.0000 22.31 herb+appl-soybeans i acre 1.0000 15.00 15.00 15.00 Center Pivot ac-in 2.00 Jul 20.34 0.192 1.97 3.0000 22.31 herb+appl-soybeans i acre 1.0000 15.00 15.00 15.00 Center Pivot ac-in 1.00 Jul 13.56 0.128 1.31 2.0000 14.87 Center Pivot ac-in 2.00 Aug 27.12 0.256 2.63 4.0000 29.75 insec+appl-soybeans acre 1.00 Aug 0.5000 11.50 5.75 5.75 harv & haul - soybea bu. 1.00 Sep 60.0000 0.50 30.00 30.00 ------- ------- ------- ------- ------ ------- ------- ------- TOTALS 10.97 6.98 106.12 43.02 1.792 18.46 188.54 374.11 INTEREST ON OPERATING CAPITAL 5.40 UNALLOCATED LABOR 0.00 TOTAL SPECIFIED COST 379.52 _____________________________________________________________________________________________________________________________________________Projections for Planning Purposes Only.
Information presented is prepared solely as a general guide & not intended to recognize or predict the costs & returns from any one operation. Developed by Texas AgriLife Extension Service.
Page 34

B-1241 (C1)Projections for Planning Purposes OnlyNot to be Used without Updating after December 15, 2010
Table 18.A Estimated costs and returns per acre Oilseed Sunflowers, Dryland, Strip-tillage 2011 Projected Costs and Returns per Acre _______________________________________________________________________ITEM UNIT PRICE QUANTITY AMOUNT YOUR FARM_______________________________________________________________________ dollars dollars INCOME sunflowers cwt. 20.25 10.0000 202.50 _________ -------- TOTAL INCOME 202.50 _________ DIRECT EXPENSES SEED seed - sunflower acre 15.00 1.0000 15.00 _________ INSECTICIDE seed insect. - sunfl acre 4.48 1.0000 4.48 _________ HERBICIDE glyphosphate acre 4.48 3.0000 13.44 _________ 2-4D acre 1.71 1.0000 1.71 _________ Prowl H2O acre 8.65 1.0000 8.65 _________ FERTILIZER fert(N) - liquid lb. 0.57 40.0000 22.80 _________ CUSTOM herb application acre 5.00 3.0000 15.00 _________ Pesticide appl acre 5.00 1.0000 5.00 _________ cust harv-sunfl acre 26.00 1.0000 26.00 _________ cust haul-sunfl cwt. 0.35 10.0000 3.50 _________ CROP INSURANCE sunflowers - dryland acre 11.00 1.0000 11.00 _________ Pesticide ammo - pest acre 3.51 1.0000 3.51 _________ OPERATOR LABOR Implements hour 10.30 0.1440 1.48 _________ Tractors hour 10.30 0.1772 1.82 _________ HAND LABOR Implements hour 10.30 0.0572 0.58 _________ DIESEL FUEL Tractors gal 2.65 1.5562 4.12 _________ GASOLINE Self-Propelled Eq. gal 2.73 2.0100 5.48 _________ REPAIR & MAINTENANCE Implements acre 2.80 1.0000 2.80 _________ Tractors acre 3.28 1.0000 3.28 _________ Self-Propelled Eq. acre 0.16 1.0000 0.16 _________ INTEREST ON OP. CAP. acre 1.86 1.0000 1.86 _________ -------- TOTAL DIRECT EXPENSES 151.71 _________RETURNS ABOVE DIRECT EXPENSES 50.78 _________ FIXED EXPENSES Implements acre 4.68 1.0000 4.68 _________ Tractors acre 5.12 1.0000 5.12 _________ Self-Propelled Eq. acre 0.25 1.0000 0.25 _________ -------- TOTAL FIXED EXPENSES 10.06 _________ -------- TOTAL SPECIFIED EXPENSES 161.77 _________RETURNS ABOVE TOTAL SPECIFIED EXPENSES 40.72 _________ ALLOCATED COST ITEMS cash rent-sunflowerd acre 25.00 1.0000 25.00 _________RESIDUAL RETURNS 15.72 ________________________________________________________________________________Projections for Planning Purposes Only.
Information presented is prepared solely as a general guide & not intended to recognize or predict the costs & returns from any one operation. Developed by Texas AgriLife Extension Service.
Page 35

B-1241 (C1)Projections for Planning Purposes OnlyNot to be Used without Updating after December 15, 2010
Table 18.B Estimated resource use and costs for field operations, per acre Oilseed Sunflowers, Dryland, Strip-tillage 2011 Projected Costs and Returns per Acre _____________________________________________________________________________________________________________________________________________ TRACTOR COST EQUIP COST ALLOC LABOR OPERATING INPUT OPERATION/ SIZE/ TRACTOR PERF TIMES -------------- -------------- ------------- ---------------------- TOTAL OPERATING INPUT UNIT SIZE RATE OVER MTH DIRECT FIXED DIRECT FIXED HOURS COST AMOUNT PRICE COST COST _____________________________________________________________________________________________________________________________________________ ------------dollars----------- dollars -------dollars-------- herb application acre 1.00 Aug 1.0000 5.00 5.00 5.00 glyphosphate acre 1.0000 4.48 4.48 4.48 Strip Plow 35-40 ft 175 0.120 1.00 Oct 5.48 3.70 0.78 1.30 0.264 2.71 13.99 sunflowers - dryland acre 1.00 Mar 1.0000 11.00 11.00 11.00 herb application acre 1.00 Apr 1.0000 5.00 5.00 5.00 glyphosphate acre 1.0000 4.48 4.48 4.48 2-4D acre 1.0000 1.71 1.71 1.71 Pickup Truck 3/4 ton 0.006 20.00 May 5.65 0.25 5.90 herb application acre 1.00 Jun 1.0000 5.00 5.00 5.00 glyphosphate acre 1.0000 4.48 4.48 4.48 Prowl H2O acre 1.0000 8.65 8.65 8.65 bed planter 125 0.057 1.00 Jun 1.92 1.42 2.02 3.37 0.114 1.17 9.92 seed - sunflower acre 1.0000 15.00 15.00 15.00 seed insect. - sunfl acre 1.0000 4.48 4.48 4.48 fert(N) - liquid lb. 40.0000 0.57 22.80 22.80 Pesticide appl acre 1.00 Aug 1.0000 5.00 5.00 5.00 ammo - pest acre 1.0000 3.51 3.51 3.51 cust harv-sunfl acre 1.00 Oct 1.0000 26.00 26.00 26.00 cust haul-sunfl cwt. 10.0000 0.35 3.50 3.50 ------- ------- ------- ------- ------ ------- ------- ------- TOTALS 7.40 5.12 8.45 4.93 0.378 3.89 130.09 159.91 INTEREST ON OPERATING CAPITAL 1.86 UNALLOCATED LABOR 0.00 TOTAL SPECIFIED COST 161.77 _____________________________________________________________________________________________________________________________________________Projections for Planning Purposes Only.
Information presented is prepared solely as a general guide & not intended to recognize or predict the costs & returns from any one operation. Developed by Texas AgriLife Extension Service.
Page 36

B-1241 (C1)Projections for Planning Purposes OnlyNot to be Used without Updating after December 15, 2010
Table 19.A Estimated costs and returns per Acre Oilseed Sunflowers, Sprinkler Irrigated, Strip-tillage 2011 Projected Costs and Returns per Acre _______________________________________________________________________ITEM UNIT PRICE QUANTITY AMOUNT YOUR FARM_______________________________________________________________________ dollars dollars INCOME Oilseed Sunflo cwt 20.25 20.0000 405.00 _________ -------- TOTAL INCOME 405.00 _________ DIRECT EXPENSES SEED seed - Oilseed sunfl acre 25.00 1.0000 25.00 _________ INSECTICIDE seed insect.-sunfli acre 5.60 1.0000 5.60 _________ HERBICIDE glyphosphate acre 4.48 3.0000 13.44 _________ 2-4D acre 1.71 1.0000 1.71 _________ Prowl H2O acre 8.65 1.0000 8.65 _________ FERTILIZER fert(N) - liquid lb. 0.57 70.0000 39.90 _________ fert(P) - liquid lb. 0.71 24.0000 17.04 _________ CUSTOM herb application acre 5.00 3.0000 15.00 _________ Pesticide appl acre 5.00 1.0000 5.00 _________ cust harv-sunfl acre 26.00 1.0000 26.00 _________ cust haul-sunfl cwt. 0.35 20.0000 7.00 _________ CROP INSURANCE sunflowers - irr. acre 12.00 1.0000 12.00 _________ Pesticide ammo - pest acre 3.51 1.0000 3.51 _________ OPERATOR LABOR Implements hour 10.30 0.1440 1.48 _________ Tractors hour 10.30 0.1772 1.82 _________ HAND LABOR Implements hour 10.30 0.0572 0.58 _________ IRRIGATION LABOR Center Pivot hour 10.30 0.4480 4.61 _________ DIESEL FUEL Tractors gal 2.65 1.5562 4.12 _________ GASOLINE Self-Propelled Eq. gal 2.73 4.5225 12.34 _________ NATURAL GAS Center Pivot Mcf 4.75 7.0000 33.25 _________ REPAIR & MAINTENANCE Implements Acre 2.80 1.0000 2.80 _________ Tractors Acre 3.28 1.0000 3.28 _________ Self-Propelled Eq. Acre 0.37 1.0000 0.37 _________ Center Pivot ac-in 2.03 7.0000 14.21 _________ INTEREST ON OP. CAP. Acre 3.15 1.0000 3.15 _________ -------- TOTAL DIRECT EXPENSES 261.89 _________RETURNS ABOVE DIRECT EXPENSES 143.10 _________ FIXED EXPENSES Implements Acre 4.68 1.0000 4.68 _________ Tractors Acre 5.12 1.0000 5.12 _________ Self-Propelled Eq. Acre 0.57 1.0000 0.57 _________ Center Pivot Acre 33.60 1.0000 33.60 _________ -------- TOTAL FIXED EXPENSES 43.98 _________ -------- TOTAL SPECIFIED EXPENSES 305.88 _________RETURNS ABOVE TOTAL SPECIFIED EXPENSES 99.11 _________ ALLOCATED COST ITEMS cash rent-sunfloweri acre 65.00 1.0000 65.00 _________RESIDUAL RETURNS 34.11 ________________________________________________________________________________Projections for Planning Purposes Only.
Information presented is prepared solely as a general guide & not intended to recognize or predict the costs & returns from any one operation. Developed by Texas AgriLife Extension Service.
Page 37

B-1241 (C1)Projections for Planning Purposes OnlyNot to be Used without Updating after December 15, 2010
Table 19.B Estimated resource use and costs for field operations, per Acre Oilseed Sunflowers, Sprinkler Irrigated, Strip-tillage 2011 Projected Costs and Returns per Acre _____________________________________________________________________________________________________________________________________________ TRACTOR COST EQUIP COST ALLOC LABOR OPERATING INPUT OPERATION/ SIZE/ TRACTOR PERF TIMES -------------- -------------- ------------- ---------------------- TOTAL OPERATING INPUT UNIT SIZE RATE OVER MTH DIRECT FIXED DIRECT FIXED HOURS COST AMOUNT PRICE COST COST _____________________________________________________________________________________________________________________________________________ ------------dollars----------- dollars -------dollars-------- herb application acre 1.00 Aug 1.0000 5.00 5.00 5.00 glyphosphate acre 1.0000 4.48 4.48 4.48 Strip Plow 35-40 ft 175 0.120 1.00 Oct 5.48 3.70 0.78 1.30 0.264 2.71 13.99 fert(N) - liquid lb. 20.0000 0.57 11.40 11.40 fert(P) - liquid lb. 24.0000 0.71 17.04 17.04 sunflowers - irr. acre 1.00 Mar 1.0000 12.00 12.00 12.00 herb application acre 1.00 Apr 1.0000 5.00 5.00 5.00 glyphosphate acre 1.0000 4.48 4.48 4.48 2-4D acre 1.0000 1.71 1.71 1.71 Center Pivot ac-in 1.00 Apr 13.56 33.60 0.128 1.31 2.0000 48.47 Pickup Truck 3/4 ton 0.006 45.00 May 12.71 0.57 13.29 herb application acre 1.00 Jun 1.0000 5.00 5.00 5.00 glyphosphate acre 1.0000 4.48 4.48 4.48 Prowl H2O acre 1.0000 8.65 8.65 8.65 Center Pivot ac-in 1.00 Jun 13.56 0.128 1.31 2.0000 14.87 bed planter 125 0.057 1.00 Jun 1.92 1.42 2.02 3.37 0.114 1.17 9.92 seed - Oilseed sunfl acre 1.0000 25.00 25.00 25.00 seed insect.-sunfli acre 1.0000 5.60 5.60 5.60 fert(N) - liquid lb. 50.0000 0.57 28.50 28.50 Center Pivot ac-in 1.00 Jul 10.17 0.096 0.98 1.5000 11.15 Center Pivot ac-in 1.00 Jul 10.17 0.096 0.98 1.5000 11.15 Pesticide appl acre 1.00 Aug 1.0000 5.00 5.00 5.00 ammo - pest acre 1.0000 3.51 3.51 3.51 cust harv-sunfl acre 1.00 Oct 1.0000 26.00 26.00 26.00 cust haul-sunfl cwt. 20.0000 0.35 7.00 7.00 ------- ------- ------- ------- ------ ------- ------- ------- TOTALS 7.40 5.12 62.97 38.85 0.826 8.51 179.85 302.73 INTEREST ON OPERATING CAPITAL 3.15 UNALLOCATED LABOR 0.00 TOTAL SPECIFIED COST 305.88 _____________________________________________________________________________________________________________________________________________Projections for Planning Purposes Only.
Information presented is prepared solely as a general guide & not intended to recognize or predict the costs & returns from any one operation. Developed by Texas AgriLife Extension Service.
Page 38

B-1241 (C1)Projections for Planning Purposes OnlyNot to be Used without Updating after December 15, 2010
Table 20.A Estimated costs and returns per Acre Confectionary Sunflowers, Sprinkler Irrigated, Strip-ti 2011 Projected Costs and Returns per Acre _______________________________________________________________________ITEM UNIT PRICE QUANTITY AMOUNT YOUR FARM_______________________________________________________________________ dollars dollars INCOME Conf. Sunflowers cwt 26.00 18.0000 468.00 _________ -------- TOTAL INCOME 468.00 _________ DIRECT EXPENSES SEED conf. sunflower seed acre 28.00 1.0000 28.00 _________ INSECTICIDE seed insect.-sunflc acre 6.72 1.0000 6.72 _________ HERBICIDE glyphosphate acre 4.48 3.0000 13.44 _________ 2-4D acre 1.71 1.0000 1.71 _________ Prowl H2O acre 8.65 1.0000 8.65 _________ FERTILIZER fert(N) - liquid lb. 0.57 70.0000 39.90 _________ fert(P) - liquid lb. 0.71 24.0000 17.04 _________ CUSTOM herb application acre 5.00 3.0000 15.00 _________ Pesticide appl acre 5.00 1.0000 5.00 _________ cust harv-sunfl acre 26.00 1.0000 26.00 _________ cust haul-sunfl cwt. 0.35 18.0000 6.30 _________ CROP INSURANCE sunflowers - irr. acre 12.00 1.0000 12.00 _________ Pesticide ammo - pest acre 3.51 1.0000 3.51 _________ OPERATOR LABOR Implements hour 10.30 0.1440 1.48 _________ Tractors hour 10.30 0.1772 1.82 _________ HAND LABOR Implements hour 10.30 0.0572 0.58 _________ IRRIGATION LABOR Center Pivot hour 10.30 0.4480 4.61 _________ DIESEL FUEL Tractors gal 2.65 1.5562 4.12 _________ GASOLINE Self-Propelled Eq. gal 2.73 4.5225 12.34 _________ NATURAL GAS Center Pivot Mcf 4.75 7.0000 33.25 _________ REPAIR & MAINTENANCE Implements Acre 2.80 1.0000 2.80 _________ Tractors Acre 3.28 1.0000 3.28 _________ Self-Propelled Eq. Acre 0.37 1.0000 0.37 _________ Center Pivot ac-in 2.03 7.0000 14.21 _________ INTEREST ON OP. CAP. Acre 3.21 1.0000 3.21 _________ -------- TOTAL DIRECT EXPENSES 265.38 _________RETURNS ABOVE DIRECT EXPENSES 202.61 _________ FIXED EXPENSES Implements Acre 4.68 1.0000 4.68 _________ Tractors Acre 5.12 1.0000 5.12 _________ Self-Propelled Eq. Acre 0.57 1.0000 0.57 _________ Center Pivot Acre 33.60 1.0000 33.60 _________ -------- TOTAL FIXED EXPENSES 43.98 _________ -------- TOTAL SPECIFIED EXPENSES 309.37 _________RETURNS ABOVE TOTAL SPECIFIED EXPENSES 158.62 _________ ALLOCATED COST ITEMS cash rent-sunfloweri acre 65.00 1.0000 65.00 _________RESIDUAL RETURNS 93.62 ________________________________________________________________________________Projections for Planning Purposes Only.
Information presented is prepared solely as a general guide & not intended to recognize or predict the costs & returns from any one operation. Developed by Texas AgriLife Extension Service.
Page 39

B-1241 (C1)Projections for Planning Purposes OnlyNot to be Used without Updating after December 15, 2010
Table 20.B Estimated resource use and costs for field operations, per Acre Confectionary Sunflowers, Sprinkler Irrigated, Strip-ti 2011 Projected Costs and Returns per Acre _____________________________________________________________________________________________________________________________________________ TRACTOR COST EQUIP COST ALLOC LABOR OPERATING INPUT OPERATION/ SIZE/ TRACTOR PERF TIMES -------------- -------------- ------------- ---------------------- TOTAL OPERATING INPUT UNIT SIZE RATE OVER MTH DIRECT FIXED DIRECT FIXED HOURS COST AMOUNT PRICE COST COST _____________________________________________________________________________________________________________________________________________ ------------dollars----------- dollars -------dollars-------- herb application acre 1.00 Aug 1.0000 5.00 5.00 5.00 glyphosphate acre 1.0000 4.48 4.48 4.48 Strip Plow 35-40 ft 175 0.120 1.00 Oct 5.48 3.70 0.78 1.30 0.264 2.71 13.99 fert(N) - liquid lb. 20.0000 0.57 11.40 11.40 fert(P) - liquid lb. 24.0000 0.71 17.04 17.04 sunflowers - irr. acre 1.00 Mar 1.0000 12.00 12.00 12.00 herb application acre 1.00 Apr 1.0000 5.00 5.00 5.00 glyphosphate acre 1.0000 4.48 4.48 4.48 2-4D acre 1.0000 1.71 1.71 1.71 Center Pivot ac-in 1.00 Apr 13.56 33.60 0.128 1.31 2.0000 48.47 Pickup Truck 3/4 ton 0.006 45.00 May 12.71 0.57 13.29 herb application acre 1.00 Jun 1.0000 5.00 5.00 5.00 glyphosphate acre 1.0000 4.48 4.48 4.48 Prowl H2O acre 1.0000 8.65 8.65 8.65 Center Pivot ac-in 1.00 Jun 13.56 0.128 1.31 2.0000 14.87 bed planter 125 0.057 1.00 Jun 1.92 1.42 2.02 3.37 0.114 1.17 9.92 conf. sunflower seed acre 1.0000 28.00 28.00 28.00 seed insect.-sunflc acre 1.0000 6.72 6.72 6.72 fert(N) - liquid lb. 50.0000 0.57 28.50 28.50 Center Pivot ac-in 1.00 Jul 10.17 0.096 0.98 1.5000 11.15 Center Pivot ac-in 1.00 Jul 10.17 0.096 0.98 1.5000 11.15 Pesticide appl acre 1.00 Aug 1.0000 5.00 5.00 5.00 ammo - pest acre 1.0000 3.51 3.51 3.51 cust harv-sunfl acre 1.00 Oct 1.0000 26.00 26.00 26.00 cust haul-sunfl cwt. 18.0000 0.35 6.30 6.30 ------- ------- ------- ------- ------ ------- ------- ------- TOTALS 7.40 5.12 62.97 38.85 0.826 8.51 183.27 306.15 INTEREST ON OPERATING CAPITAL 3.21 UNALLOCATED LABOR 0.00 TOTAL SPECIFIED COST 309.37 _____________________________________________________________________________________________________________________________________________Projections for Planning Purposes Only.
Information presented is prepared solely as a general guide & not intended to recognize or predict the costs & returns from any one operation. Developed by Texas AgriLife Extension Service.
Page 40

B-1241 (C1)Projections for Planning Purposes OnlyNot to be Used without Updating after December 15, 2010
Table 21.A Estimated costs and returns per Acre Continuous Wheat, Dryland, Grazed 2011 Projected Costs and Returns per Acre _______________________________________________________________________ITEM UNIT PRICE QUANTITY AMOUNT YOUR FARM_______________________________________________________________________ dollars dollars INCOME grazing - wheat lbs 0.43 73.0000 31.39 _________ wheat bu. 6.48 20.0000 129.60 _________ -------- TOTAL INCOME 160.99 _________ DIRECT EXPENSES SEED seed- wheat bu. 14.40 1.0000 14.40 _________ FERTILIZER fert(N) - ANH3 lb. 0.43 30.0000 12.90 _________ CUSTOM fert appl - ANH3 acre 11.00 1.0000 11.00 _________ cust harv-wheat acre 20.00 1.0000 20.00 _________ cust haul-wheat dry bu. 0.23 20.0000 4.60 _________ CROP INSURANCE wheat - dryland acre 19.50 1.0000 19.50 _________ OPERATOR LABOR Implements hour 10.30 0.2764 2.84 _________ Tractors hour 10.30 0.4425 4.55 _________ HAND LABOR Implements hour 10.30 0.2121 2.18 _________ DIESEL FUEL Tractors gal 2.65 2.2211 5.88 _________ GASOLINE Self-Propelled Eq. gal 2.73 2.0100 5.48 _________ REPAIR & MAINTENANCE Implements Acre 3.80 1.0000 3.80 _________ Tractors Acre 4.46 1.0000 4.46 _________ Self-Propelled Eq. Acre 0.16 1.0000 0.16 _________ INTEREST ON OP. CAP. Acre 4.42 1.0000 4.42 _________ -------- TOTAL DIRECT EXPENSES 116.22 _________RETURNS ABOVE DIRECT EXPENSES 44.76 _________ FIXED EXPENSES Implements Acre 6.28 1.0000 6.28 _________ Tractors Acre 6.53 1.0000 6.53 _________ Self-Propelled Eq. Acre 0.25 1.0000 0.25 _________ -------- TOTAL FIXED EXPENSES 13.07 _________ -------- TOTAL SPECIFIED EXPENSES 129.30 _________RETURNS ABOVE TOTAL SPECIFIED EXPENSES 31.68 _________ ALLOCATED COST ITEMS cash rent - wheatd acre 25.00 1.0000 25.00 _________RESIDUAL RETURNS 6.68 ________________________________________________________________________________Projections for Planning Purposes Only.
Information presented is prepared solely as a general guide & not intended to recognize or predict the costs & returns from any one operation. Developed by Texas AgriLife Extension Service.
Page 41

B-1241 (C1)Projections for Planning Purposes OnlyNot to be Used without Updating after December 15, 2010
Table 21.B Estimated resource use and costs for field operations, per Acre Continuous Wheat, Dryland, Grazed 2011 Projected Costs and Returns per Acre _____________________________________________________________________________________________________________________________________________ TRACTOR COST EQUIP COST ALLOC LABOR OPERATING INPUT OPERATION/ SIZE/ TRACTOR PERF TIMES -------------- -------------- ------------- ---------------------- TOTAL OPERATING INPUT UNIT SIZE RATE OVER MTH DIRECT FIXED DIRECT FIXED HOURS COST AMOUNT PRICE COST COST _____________________________________________________________________________________________________________________________________________ ------------dollars----------- dollars -------dollars-------- chisel 125 0.099 1.00 Jun 3.35 2.47 0.69 1.15 0.219 2.25 9.93 sweep plow 150 0.065 1.00 Jul 2.08 1.16 0.85 1.25 0.143 1.48 6.84 field cultivator 35 ft 150 0.065 1.00 Aug 2.08 1.16 0.75 1.36 0.143 1.48 6.85 fert(N) - ANH3 lb. 1.00 Aug 30.0000 0.43 12.90 12.90 fert appl - ANH3 acre 1.0000 11.00 11.00 11.00 grain drill 40 0.212 1.00 Sep 2.82 1.72 1.50 2.51 0.424 4.36 12.93 seed- wheat bu. 1.0000 14.40 14.40 14.40 wheat - dryland acre 1.0000 19.50 19.50 19.50 Pickup Truck 3/4 ton 0.006 20.00 Dec 5.65 0.25 5.90 cust harv-wheat acre 1.00 Jun 1.0000 20.00 20.00 20.00 cust haul-wheat dry bu. 20.0000 0.23 4.60 4.60 ------- ------- ------- ------- ------ ------- ------- ------- TOTALS 10.34 6.53 9.45 6.53 0.931 9.59 82.40 124.87 INTEREST ON OPERATING CAPITAL 4.42 UNALLOCATED LABOR 0.00 TOTAL SPECIFIED COST 129.30 _____________________________________________________________________________________________________________________________________________Projections for Planning Purposes Only.
Information presented is prepared solely as a general guide & not intended to recognize or predict the costs & returns from any one operation. Developed by Texas AgriLife Extension Service.
Page 42

B-1241 (C1)Projections for Planning Purposes OnlyNot to be Used without Updating after December 15, 2010
Table 22.A Estimated costs and returns per Acre Continuous Wheat, Furrow Irrigated, (NG) 2011 Projected Costs and Returns per Acre _______________________________________________________________________ITEM UNIT PRICE QUANTITY AMOUNT YOUR FARM_______________________________________________________________________ dollars dollars INCOME grazing - wheat lbs 0.43 136.0000 58.48 _________ wheat bu. 6.48 60.0000 388.80 _________ -------- TOTAL INCOME 447.28 _________ DIRECT EXPENSES SEED seed- wheat bu. 14.40 1.2000 17.28 _________ FERTILIZER fert(N) - ANH3 lb. 0.43 60.0000 25.80 _________ fert(P) - liquid lb. 0.71 40.0000 28.40 _________ fert(N) - liquid lb. 0.57 30.0000 17.10 _________ CUSTOM fert appl - ANH3 acre 11.00 1.0000 11.00 _________ insec+appl - wheat acre 12.30 1.0000 12.30 _________ harv&haul-wheat irr bu. 0.50 60.0000 30.00 _________ CROP INSURANCE wheat - irrigated acre 20.80 1.0000 20.80 _________ OPERATOR LABOR Implements hour 10.30 0.4322 4.45 _________ Tractors hour 10.30 0.5723 5.89 _________ HAND LABOR Implements hour 10.30 0.2121 2.18 _________ IRRIGATION LABOR Furrow hour 10.30 2.4587 25.32 _________ DIESEL FUEL Tractors gal 2.65 2.9030 7.69 _________ GASOLINE Self-Propelled Eq. gal 2.73 2.0100 5.48 _________ NATURAL GAS Furrow Mcf 4.75 17.5000 83.12 _________ REPAIR & MAINTENANCE Implements Acre 4.91 1.0000 4.91 _________ Tractors Acre 6.21 1.0000 6.21 _________ Self-Propelled Eq. Acre 0.16 1.0000 0.16 _________ Furrow ac-in 1.80 17.5000 31.50 _________ INTEREST ON OP. CAP. Acre 10.15 1.0000 10.15 _________ -------- TOTAL DIRECT EXPENSES 349.79 _________RETURNS ABOVE DIRECT EXPENSES 97.48 _________ FIXED EXPENSES Implements Acre 7.90 1.0000 7.90 _________ Tractors Acre 9.26 1.0000 9.26 _________ Self-Propelled Eq. Acre 0.25 1.0000 0.25 _________ Furrow Acre 24.62 1.0000 24.62 _________ -------- TOTAL FIXED EXPENSES 42.05 _________ -------- TOTAL SPECIFIED EXPENSES 391.84 _________RETURNS ABOVE TOTAL SPECIFIED EXPENSES 55.43 _________ ALLOCATED COST ITEMS cash rent - wheati acre 65.00 1.0000 65.00 _________RESIDUAL RETURNS -9.56 ________________________________________________________________________________Projections for Planning Purposes Only.
Information presented is prepared solely as a general guide & not intended to recognize or predict the costs & returns from any one operation. Developed by Texas AgriLife Extension Service.
Page 43

B-1241 (C1)Projections for Planning Purposes OnlyNot to be Used without Updating after December 15, 2010
Table 22.B Estimated resource use and costs for field operations, per Acre Continuous Wheat, Furrow Irrigated, (NG) 2011 Projected Costs and Returns per Acre _____________________________________________________________________________________________________________________________________________ TRACTOR COST EQUIP COST ALLOC LABOR OPERATING INPUT OPERATION/ SIZE/ TRACTOR PERF TIMES -------------- -------------- ------------- ---------------------- TOTAL OPERATING INPUT UNIT SIZE RATE OVER MTH DIRECT FIXED DIRECT FIXED HOURS COST AMOUNT PRICE COST COST _____________________________________________________________________________________________________________________________________________ ------------dollars----------- dollars -------dollars-------- disc tandem 100 0.138 1.00 Jun 3.81 2.87 1.52 2.23 0.303 3.12 13.57 chisel 125 0.099 1.00 Jul 3.35 2.47 0.69 1.15 0.219 2.25 9.93 field cultivator 35 ft 150 0.065 1.00 Jul 2.08 1.16 0.75 1.36 0.143 1.48 6.85 fert(N) - ANH3 lb. 1.00 Aug 60.0000 0.43 25.80 25.80 fert appl - ANH3 acre 1.0000 11.00 11.00 11.00 bedder 150 0.057 1.00 Aug 1.82 1.02 0.44 0.64 0.125 1.29 5.22 grain drill 40 0.212 1.00 Sep 2.82 1.72 1.50 2.51 0.424 4.36 12.93 seed- wheat bu. 1.2000 14.40 17.28 17.28 fert(P) - liquid lb. 40.0000 0.71 28.40 28.40 fert(N) - liquid lb. 30.0000 0.57 17.10 17.10 wheat - irrigated acre 1.0000 20.80 20.80 20.80 Furrow ac-in 1.00 Sep 45.85 24.62 0.983 10.13 7.0000 80.60 Furrow ac-in 1.00 Feb 22.92 0.491 5.06 3.5000 27.99 insec+appl - wheat acre 1.00 Mar 1.0000 12.30 12.30 12.30 Pickup Truck 3/4 ton 0.006 20.00 Mar 5.65 0.25 5.90 Furrow ac-in 1.00 Apr 22.92 0.491 5.06 3.5000 27.99 Furrow ac-in 1.00 May 22.92 0.491 5.06 3.5000 27.99 harv&haul-wheat irr bu. 1.00 Jun 60.0000 0.50 30.00 30.00 ------- ------- ------- ------- ------ ------- ------- ------- TOTALS 13.90 9.26 125.19 32.78 3.675 37.85 162.68 381.68 INTEREST ON OPERATING CAPITAL 10.15 UNALLOCATED LABOR 0.00 TOTAL SPECIFIED COST 391.84 _____________________________________________________________________________________________________________________________________________Projections for Planning Purposes Only.
Information presented is prepared solely as a general guide & not intended to recognize or predict the costs & returns from any one operation. Developed by Texas AgriLife Extension Service.
Page 44

B-1241 (C1)Projections for Planning Purposes OnlyNot to be Used without Updating after December 15, 2010
Table 23.A Estimated costs and returns per Acre Cont. Wheat, Sprinkler Irrigated, (NG) 2011 Projected Costs and Returns per Acre _______________________________________________________________________ITEM UNIT PRICE QUANTITY AMOUNT YOUR FARM_______________________________________________________________________ dollars dollars INCOME grazing - wheat lbs 0.43 136.0000 58.48 _________ wheat bu. 6.48 65.0000 421.20 _________ -------- TOTAL INCOME 479.68 _________ DIRECT EXPENSES SEED seed- wheat bu. 14.40 1.2000 17.28 _________ FERTILIZER fert(N) - ANH3 lb. 0.43 60.0000 25.80 _________ fert(P) - liquid lb. 0.71 40.0000 28.40 _________ fert(N) - liquid lb. 0.57 30.0000 17.10 _________ CUSTOM fert appl - ANH3 acre 11.00 1.0000 11.00 _________ insec+appl - wheat acre 12.30 1.0000 12.30 _________ harv&haul-wheat irr bu. 0.50 65.0000 32.50 _________ CROP INSURANCE wheat - irrigated acre 20.80 1.0000 20.80 _________ OPERATOR LABOR Implements hour 10.30 0.3636 3.74 _________ Tractors hour 10.30 0.5151 5.30 _________ HAND LABOR Implements hour 10.30 0.2121 2.18 _________ IRRIGATION LABOR Center Pivot hour 10.30 0.9600 9.88 _________ DIESEL FUEL Tractors gal 2.65 2.4615 6.52 _________ GASOLINE Self-Propelled Eq. gal 2.73 2.0100 5.48 _________ NATURAL GAS Center Pivot Mcf 4.75 15.0000 71.25 _________ REPAIR & MAINTENANCE Implements Acre 4.47 1.0000 4.47 _________ Tractors Acre 5.55 1.0000 5.55 _________ Self-Propelled Eq. Acre 0.16 1.0000 0.16 _________ Center Pivot ac-in 2.03 15.0000 30.45 _________ INTEREST ON OP. CAP. Acre 9.09 1.0000 9.09 _________ -------- TOTAL DIRECT EXPENSES 319.30 _________RETURNS ABOVE DIRECT EXPENSES 160.37 _________ FIXED EXPENSES Implements Acre 7.26 1.0000 7.26 _________ Tractors Acre 8.24 1.0000 8.24 _________ Self-Propelled Eq. Acre 0.25 1.0000 0.25 _________ Center Pivot Acre 33.60 1.0000 33.60 _________ -------- TOTAL FIXED EXPENSES 49.36 _________ -------- TOTAL SPECIFIED EXPENSES 368.67 _________RETURNS ABOVE TOTAL SPECIFIED EXPENSES 111.00 _________ ALLOCATED COST ITEMS cash rent - wheati acre 65.00 1.0000 65.00 _________RESIDUAL RETURNS 46.00 ________________________________________________________________________________Projections for Planning Purposes Only.
Information presented is prepared solely as a general guide & not intended to recognize or predict the costs & returns from any one operation. Developed by Texas AgriLife Extension Service.
Page 45

B-1241 (C1)Projections for Planning Purposes OnlyNot to be Used without Updating after December 15, 2010
Table 23.B Estimated resource use and costs for field operations, per Acre Cont. Wheat, Sprinkler Irrigated, (NG) 2011 Projected Costs and Returns per Acre _____________________________________________________________________________________________________________________________________________ TRACTOR COST EQUIP COST ALLOC LABOR OPERATING INPUT OPERATION/ SIZE/ TRACTOR PERF TIMES -------------- -------------- ------------- ---------------------- TOTAL OPERATING INPUT UNIT SIZE RATE OVER MTH DIRECT FIXED DIRECT FIXED HOURS COST AMOUNT PRICE COST COST _____________________________________________________________________________________________________________________________________________ ------------dollars----------- dollars -------dollars-------- disc tandem 100 0.138 1.00 Jun 3.81 2.87 1.52 2.23 0.303 3.12 13.57 chisel 125 0.099 1.00 Jul 3.35 2.47 0.69 1.15 0.219 2.25 9.93 fert(N) - ANH3 lb. 1.00 Aug 60.0000 0.43 25.80 25.80 fert appl - ANH3 acre 1.0000 11.00 11.00 11.00 field cultivator 35 ft 150 0.065 1.00 Aug 2.08 1.16 0.75 1.36 0.143 1.48 6.85 grain drill 40 0.212 1.00 Sep 2.82 1.72 1.50 2.51 0.424 4.36 12.93 Center Pivot ac-in 20.34 33.60 0.192 1.97 3.0000 55.91 seed- wheat bu. 1.2000 14.40 17.28 17.28 wheat - irrigated acre 1.0000 20.80 20.80 20.80 fert(P) - liquid lb. 40.0000 0.71 28.40 28.40 Center Pivot ac-in 1.00 Oct 13.56 0.128 1.31 2.0000 14.87 Pickup Truck 3/4 ton 0.006 20.00 Nov 5.65 0.25 5.90 Center Pivot ac-in 1.00 Dec 13.56 0.128 1.31 2.0000 14.87 insec+appl - wheat acre 1.00 Mar 1.0000 12.30 12.30 12.30 Center Pivot ac-in 1.00 Mar 13.56 0.128 1.31 2.0000 14.87 fert(N) - liquid lb. 30.0000 0.57 17.10 17.10 Center Pivot ac-in 2.00 Apr 20.34 0.192 1.97 3.0000 22.31 Center Pivot ac-in 2.00 May 20.34 0.192 1.97 3.0000 22.31 harv&haul-wheat irr bu. 1.00 Jun 65.0000 0.50 32.50 32.50 ------- ------- ------- ------- ------ ------- ------- ------- TOTALS 12.08 8.24 111.82 41.11 2.050 21.12 165.18 359.57 INTEREST ON OPERATING CAPITAL 9.09 UNALLOCATED LABOR 0.00 TOTAL SPECIFIED COST 368.67 _____________________________________________________________________________________________________________________________________________Projections for Planning Purposes Only.
Information presented is prepared solely as a general guide & not intended to recognize or predict the costs & returns from any one operation. Developed by Texas AgriLife Extension Service.
Page 46

B-1241 (C1)Projections for Planning Purposes OnlyNot to be Used without Updating after December 15, 2010
Table 24.A Estimated costs and returns per Acre Sorghum-Sudangrass, Dryland - Grazing 2011 Projected Costs and Returns per Acre _______________________________________________________________________ITEM UNIT PRICE QUANTITY AMOUNT YOUR FARM_______________________________________________________________________ dollars dollars INCOME grazing - sorghum lb. 0.43 336.0000 144.48 _________ -------- TOTAL INCOME 144.48 _________ DIRECT EXPENSES SEED sorghum-sudan lb. 0.53 15.0000 7.95 _________ HERBICIDE Herb + applic - SS lb. 7.20 1.0000 7.20 _________ FERTILIZER fert(N) - ANH3 lb. 0.43 50.0000 21.50 _________ CUSTOM fert appl - ANH3 acre 11.00 1.0000 11.00 _________ CROP INSURANCE sorg-sudan - dryland acre 18.75 1.0000 18.75 _________ OPERATOR LABOR Implements hour 10.30 0.2851 2.93 _________ Tractors hour 10.30 0.4497 4.63 _________ HAND LABOR Implements hour 10.30 0.2121 2.18 _________ DIESEL FUEL Tractors gal 2.65 1.9566 5.18 _________ GASOLINE Self-Propelled Eq. gal 2.73 2.0100 5.48 _________ REPAIR & MAINTENANCE Implements Acre 3.72 1.0000 3.72 _________ Tractors Acre 4.80 1.0000 4.80 _________ Self-Propelled Eq. Acre 0.16 1.0000 0.16 _________ INTEREST ON OP. CAP. Acre 1.09 1.0000 1.09 _________ -------- TOTAL DIRECT EXPENSES 96.61 _________RETURNS ABOVE DIRECT EXPENSES 47.86 _________ FIXED EXPENSES Implements Acre 5.90 1.0000 5.90 _________ Tractors Acre 7.07 1.0000 7.07 _________ Self-Propelled Eq. Acre 0.25 1.0000 0.25 _________ -------- TOTAL FIXED EXPENSES 13.23 _________ -------- TOTAL SPECIFIED EXPENSES 109.84 _________RETURNS ABOVE TOTAL SPECIFIED EXPENSES 34.63 _________ ALLOCATED COST ITEMS cash rent- sorghum acre 25.00 1.0000 25.00 _________RESIDUAL RETURNS 9.63 ________________________________________________________________________________Projections for Planning Purposes Only.
Information presented is prepared solely as a general guide & not intended to recognize or predict the costs & returns from any one operation. Developed by Texas AgriLife Extension Service.
Page 47

B-1241 (C1)Projections for Planning Purposes OnlyNot to be Used without Updating after December 15, 2010
Table 24.B Estimated resource use and costs for field operations, per Acre Sorghum-Sudangrass, Dryland - Grazing 2011 Projected Costs and Returns per Acre _____________________________________________________________________________________________________________________________________________ TRACTOR COST EQUIP COST ALLOC LABOR OPERATING INPUT OPERATION/ SIZE/ TRACTOR PERF TIMES -------------- -------------- ------------- ---------------------- TOTAL OPERATING INPUT UNIT SIZE RATE OVER MTH DIRECT FIXED DIRECT FIXED HOURS COST AMOUNT PRICE COST COST _____________________________________________________________________________________________________________________________________________ ------------dollars----------- dollars -------dollars-------- chisel 125 0.099 1.00 Feb 3.35 2.47 0.69 1.15 0.219 2.25 9.93 sorg-sudan - dryland acre 1.00 Mar 1.0000 18.75 18.75 18.75 fert(N) - ANH3 lb. 1.00 Apr 50.0000 0.43 21.50 21.50 fert appl - ANH3 acre 1.0000 11.00 11.00 11.00 disc tandem 100 0.138 1.00 Apr 3.81 2.87 1.52 2.23 0.303 3.12 13.57 grain drill 40 0.212 1.00 May 2.82 1.72 1.50 2.51 0.424 4.36 12.93 sorghum-sudan lb. 15.0000 0.53 7.95 7.95 Herb + applic - SS lb. 1.00 Jun 1.0000 7.20 7.20 7.20 Pickup Truck 3/4 ton 0.006 20.00 Jun 5.65 0.25 5.90 ------- ------- ------- ------- ------ ------- ------- ------- TOTALS 9.99 7.07 9.37 6.15 0.946 9.75 66.40 108.75 INTEREST ON OPERATING CAPITAL 1.09 UNALLOCATED LABOR 0.00 TOTAL SPECIFIED COST 109.84 _____________________________________________________________________________________________________________________________________________Projections for Planning Purposes Only.
Information presented is prepared solely as a general guide & not intended to recognize or predict the costs & returns from any one operation. Developed by Texas AgriLife Extension Service.
Page 48

B-1241 (C1)Projections for Planning Purposes OnlyNot to be Used without Updating after December 15, 2010
Table 25.A Estimated costs and returns per Acre Sorghum Sudangrass, Sprinkler Irrigated, (NG) grazing 2011 Projected Costs and Returns per Acre _______________________________________________________________________ITEM UNIT PRICE QUANTITY AMOUNT YOUR FARM_______________________________________________________________________ dollars dollars INCOME grazing - sorghum lb. 0.43 800.0000 344.00 _________ -------- TOTAL INCOME 344.00 _________ DIRECT EXPENSES SEED sorghum-sudan lb. 0.53 22.0000 11.66 _________ HERBICIDE Herb + applic - SS lb. 7.20 1.0000 7.20 _________ FERTILIZER fert(N) - ANH3 lb. 0.43 160.0000 68.80 _________ fert(P) - liquid lb. 0.71 50.0000 35.50 _________ CUSTOM fert appl - ANH3 acre 11.00 1.0000 11.00 _________ CROP INSURANCE sorg-sudan - irr. acre 21.25 1.0000 21.25 _________ OPERATOR LABOR Implements hour 10.30 0.3636 3.74 _________ Tractors hour 10.30 0.5151 5.30 _________ HAND LABOR Implements hour 10.30 0.2121 2.18 _________ IRRIGATION LABOR Center Pivot hour 10.30 0.5760 5.93 _________ DIESEL FUEL Tractors gal 2.65 2.4615 6.52 _________ GASOLINE Self-Propelled Eq. gal 2.73 2.0100 5.48 _________ NATURAL GAS Center Pivot Mcf 4.75 9.0000 42.75 _________ REPAIR & MAINTENANCE Implements Acre 4.47 1.0000 4.47 _________ Tractors Acre 5.55 1.0000 5.55 _________ Self-Propelled Eq. Acre 0.16 1.0000 0.16 _________ Center Pivot ac-in 2.03 9.0000 18.27 _________ INTEREST ON OP. CAP. Acre 4.97 1.0000 4.97 _________ -------- TOTAL DIRECT EXPENSES 260.77 _________RETURNS ABOVE DIRECT EXPENSES 83.22 _________ FIXED EXPENSES Implements Acre 7.26 1.0000 7.26 _________ Tractors Acre 8.24 1.0000 8.24 _________ Self-Propelled Eq. Acre 0.25 1.0000 0.25 _________ Center Pivot Acre 33.60 1.0000 33.60 _________ -------- TOTAL FIXED EXPENSES 49.36 _________ -------- TOTAL SPECIFIED EXPENSES 310.14 _________RETURNS ABOVE TOTAL SPECIFIED EXPENSES 33.85 _________ ALLOCATED COST ITEMS cash rent - sorghumf acre 65.00 1.0000 65.00 _________RESIDUAL RETURNS -31.14 ________________________________________________________________________________Projections for Planning Purposes Only.
Information presented is prepared solely as a general guide & not intended to recognize or predict the costs & returns from any one operation. Developed by Texas AgriLife Extension Service.
Page 49
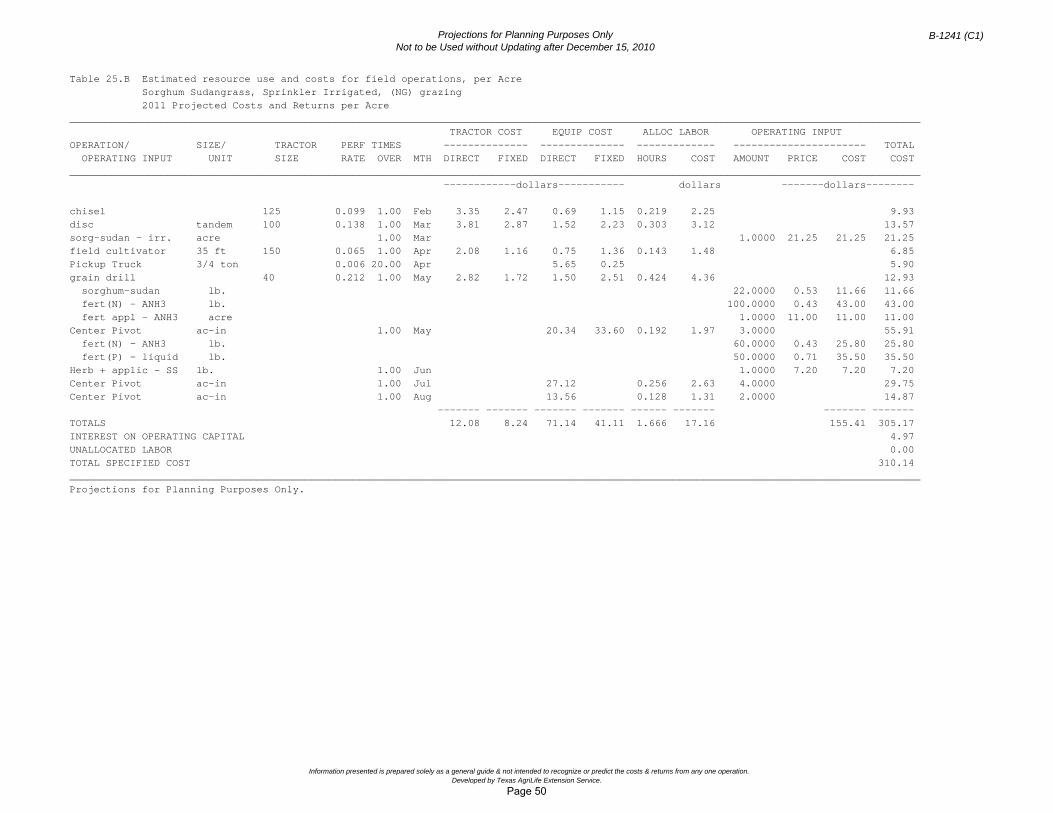
B-1241 (C1)Projections for Planning Purposes OnlyNot to be Used without Updating after December 15, 2010
Table 25.B Estimated resource use and costs for field operations, per Acre Sorghum Sudangrass, Sprinkler Irrigated, (NG) grazing 2011 Projected Costs and Returns per Acre _____________________________________________________________________________________________________________________________________________ TRACTOR COST EQUIP COST ALLOC LABOR OPERATING INPUT OPERATION/ SIZE/ TRACTOR PERF TIMES -------------- -------------- ------------- ---------------------- TOTAL OPERATING INPUT UNIT SIZE RATE OVER MTH DIRECT FIXED DIRECT FIXED HOURS COST AMOUNT PRICE COST COST _____________________________________________________________________________________________________________________________________________ ------------dollars----------- dollars -------dollars-------- chisel 125 0.099 1.00 Feb 3.35 2.47 0.69 1.15 0.219 2.25 9.93 disc tandem 100 0.138 1.00 Mar 3.81 2.87 1.52 2.23 0.303 3.12 13.57 sorg-sudan - irr. acre 1.00 Mar 1.0000 21.25 21.25 21.25 field cultivator 35 ft 150 0.065 1.00 Apr 2.08 1.16 0.75 1.36 0.143 1.48 6.85 Pickup Truck 3/4 ton 0.006 20.00 Apr 5.65 0.25 5.90 grain drill 40 0.212 1.00 May 2.82 1.72 1.50 2.51 0.424 4.36 12.93 sorghum-sudan lb. 22.0000 0.53 11.66 11.66 fert(N) - ANH3 lb. 100.0000 0.43 43.00 43.00 fert appl - ANH3 acre 1.0000 11.00 11.00 11.00 Center Pivot ac-in 1.00 May 20.34 33.60 0.192 1.97 3.0000 55.91 fert(N) - ANH3 lb. 60.0000 0.43 25.80 25.80 fert(P) - liquid lb. 50.0000 0.71 35.50 35.50 Herb + applic - SS lb. 1.00 Jun 1.0000 7.20 7.20 7.20 Center Pivot ac-in 1.00 Jul 27.12 0.256 2.63 4.0000 29.75 Center Pivot ac-in 1.00 Aug 13.56 0.128 1.31 2.0000 14.87 ------- ------- ------- ------- ------ ------- ------- ------- TOTALS 12.08 8.24 71.14 41.11 1.666 17.16 155.41 305.17 INTEREST ON OPERATING CAPITAL 4.97 UNALLOCATED LABOR 0.00 TOTAL SPECIFIED COST 310.14 _____________________________________________________________________________________________________________________________________________Projections for Planning Purposes Only.
Information presented is prepared solely as a general guide & not intended to recognize or predict the costs & returns from any one operation. Developed by Texas AgriLife Extension Service.
Page 50

B-1241 (C1)Projections for Planning Purposes OnlyNot to be Used without Updating after December 15, 2010
Table 26.A Estimated costs and returns per Acre Sorghum Silage, Sprinkler Irrigated 2011 Projected Costs and Returns per Acre _______________________________________________________________________ITEM UNIT PRICE QUANTITY AMOUNT YOUR FARM_______________________________________________________________________ dollars dollars INCOME sorghum silage ton 43.50 21.0000 913.50 _________ -------- TOTAL INCOME 913.50 _________ DIRECT EXPENSES SEED seed - sorghum lb. 1.70 7.0000 11.90 _________ HERBICIDE Herb + applic - SS lb. 7.20 1.0000 7.20 _________ FERTILIZER fert(N) - ANH3 lb. 0.43 174.0000 74.82 _________ fert(P) - dry lb. 0.70 60.0000 42.00 _________ CUSTOM fert appl - ANH3 acre 11.00 1.0000 11.00 _________ fert application acre 5.00 1.0000 5.00 _________ insec+appl - sorghum appl 14.50 0.3300 4.78 _________ harv & haul - sorgh ton 6.75 21.0000 141.75 _________ CROP INSURANCE sorg-silage - irr. acre 21.25 1.0000 21.25 _________ OPERATOR LABOR Implements hour 10.30 0.3796 3.91 _________ Tractors hour 10.30 0.4691 4.83 _________ HAND LABOR Implements hour 10.30 0.1527 1.57 _________ IRRIGATION LABOR Center Pivot hour 10.30 0.8320 8.56 _________ DIESEL FUEL Tractors gal 2.65 2.4264 6.43 _________ GASOLINE Self-Propelled Eq. gal 2.73 3.0150 8.23 _________ NATURAL GAS Center Pivot Mcf 4.75 13.0000 61.75 _________ REPAIR & MAINTENANCE Implements Acre 6.28 1.0000 6.28 _________ Tractors Acre 5.90 1.0000 5.90 _________ Self-Propelled Eq. Acre 0.24 1.0000 0.24 _________ Center Pivot ac-in 2.03 13.0000 26.39 _________ INTEREST ON OP. CAP. Acre 8.19 1.0000 8.19 _________ -------- TOTAL DIRECT EXPENSES 462.01 _________RETURNS ABOVE DIRECT EXPENSES 451.48 _________ FIXED EXPENSES Implements Acre 9.86 1.0000 9.86 _________ Tractors Acre 8.77 1.0000 8.77 _________ Self-Propelled Eq. Acre 0.38 1.0000 0.38 _________ Center Pivot Acre 33.60 1.0000 33.60 _________ -------- TOTAL FIXED EXPENSES 52.61 _________ -------- TOTAL SPECIFIED EXPENSES 514.62 _________RETURNS ABOVE TOTAL SPECIFIED EXPENSES 398.87 _________ ALLOCATED COST ITEMS cash rent - sorghsil acre 65.00 1.0000 65.00 _________RESIDUAL RETURNS 333.87 ________________________________________________________________________________Projections for Planning Purposes Only.
Information presented is prepared solely as a general guide & not intended to recognize or predict the costs & returns from any one operation. Developed by Texas AgriLife Extension Service.
Page 51

B-1241 (C1)Projections for Planning Purposes OnlyNot to be Used without Updating after December 15, 2010
Table 26.B Estimated resource use and costs for field operations, per Acre Sorghum Silage, Sprinkler Irrigated 2011 Projected Costs and Returns per Acre _____________________________________________________________________________________________________________________________________________ TRACTOR COST EQUIP COST ALLOC LABOR OPERATING INPUT OPERATION/ SIZE/ TRACTOR PERF TIMES -------------- -------------- ------------- ---------------------- TOTAL OPERATING INPUT UNIT SIZE RATE OVER MTH DIRECT FIXED DIRECT FIXED HOURS COST AMOUNT PRICE COST COST _____________________________________________________________________________________________________________________________________________ ------------dollars----------- dollars -------dollars-------- disc offset 100 0.078 1.00 Nov 2.17 1.64 1.54 2.25 0.173 1.78 9.40 chisel 125 0.099 1.00 Dec 3.35 2.47 0.69 1.15 0.219 2.25 9.93 disc tandem 100 0.138 1.00 Feb 3.81 2.87 1.52 2.23 0.303 3.12 13.57 sorg-silage - irr. acre 1.00 Mar 1.0000 21.25 21.25 21.25 fert(N) - ANH3 lb. 1.00 Apr 174.0000 0.43 74.82 74.82 fert(P) - dry lb. 60.0000 0.70 42.00 42.00 fert appl - ANH3 acre 1.0000 11.00 11.00 11.00 fert application acre 1.0000 5.00 5.00 5.00 planter 75 0.152 1.00 May 2.98 1.77 2.51 4.21 0.305 3.14 14.63 Center Pivot ac-in 27.12 33.60 0.256 2.63 4.0000 63.35 seed - sorghum lb. 7.0000 1.70 11.90 11.90 Herb + applic - SS lb. 1.0000 7.20 7.20 7.20 Pickup Truck 3/4 ton 0.006 30.00 May 8.47 0.38 8.86 Center Pivot ac-in 1.00 Jun 20.34 0.192 1.97 3.0000 22.31 Center Pivot ac-in 1.00 Jul 20.34 0.192 1.97 3.0000 22.31 insec+appl - sorghum appl 0.3300 14.50 4.78 4.78 Center Pivot ac-in 1.00 Aug 20.34 0.192 1.97 3.0000 22.31 harv & haul - sorgh ton 1.00 Oct 21.0000 6.75 141.75 141.75 ------- ------- ------- ------- ------ ------- ------- ------- TOTALS 12.33 8.77 102.89 43.84 1.833 18.88 319.70 506.43 INTEREST ON OPERATING CAPITAL 8.19 UNALLOCATED LABOR 0.00 TOTAL SPECIFIED COST 514.62 _____________________________________________________________________________________________________________________________________________Projections for Planning Purposes Only.
Information presented is prepared solely as a general guide & not intended to recognize or predict the costs & returns from any one operation. Developed by Texas AgriLife Extension Service.
Page 52

B-1241 (C1)Projections for Planning Purposes OnlyNot to be Used without Updating after December 15, 2010
Table 27.A Estimated costs and returns per Acre Roundup Ready Canola, Dryland 2011 Projected Costs and Returns per Acre _______________________________________________________________________ITEM UNIT PRICE QUANTITY AMOUNT YOUR FARM_______________________________________________________________________ dollars dollars INCOME Canola cwt. 19.55 11.0000 215.05 _________ -------- TOTAL INCOME 215.05 _________ DIRECT EXPENSES SEED RR Canola Seed lbs. 4.83 5.0000 24.15 _________ Seed Treatment - Can acre 6.30 1.0000 6.30 _________ FERTILIZER fert(N) - dry lb. 0.48 35.0000 16.80 _________ CUSTOM fert application acre 5.00 1.0000 5.00 _________ Insect+Appl (Canola) acre 13.40 1.0000 13.40 _________ Herb + appl (Canola) acre 11.35 1.0000 11.35 _________ cust harvest -canola acre 19.00 1.0000 19.00 _________ cust haul - canola cwt. 0.38 11.0000 4.18 _________ OPERATOR LABOR Implements hour 10.30 0.2764 2.84 _________ Tractors hour 10.30 0.4425 4.55 _________ HAND LABOR Implements hour 10.30 0.2121 2.18 _________ DIESEL FUEL Tractors gal 2.65 2.2211 5.88 _________ GASOLINE Self-Propelled Eq. gal 2.73 2.0100 5.48 _________ REPAIR & MAINTENANCE Implements Acre 3.80 1.0000 3.80 _________ Tractors Acre 4.46 1.0000 4.46 _________ Self-Propelled Eq. Acre 0.16 1.0000 0.16 _________ INTEREST ON OP. CAP. Acre 4.44 1.0000 4.44 _________ -------- TOTAL DIRECT EXPENSES 134.02 _________RETURNS ABOVE DIRECT EXPENSES 81.02 _________ FIXED EXPENSES Implements Acre 6.28 1.0000 6.28 _________ Tractors Acre 6.53 1.0000 6.53 _________ Self-Propelled Eq. Acre 0.25 1.0000 0.25 _________ -------- TOTAL FIXED EXPENSES 13.07 _________ -------- TOTAL SPECIFIED EXPENSES 147.10 _________RETURNS ABOVE TOTAL SPECIFIED EXPENSES 67.94 _________ ALLOCATED COST ITEMS cash rent - canola d acre 25.00 1.0000 25.00 _________RESIDUAL RETURNS 42.94 ________________________________________________________________________________Projections for Planning Purposes Only.
Information presented is prepared solely as a general guide & not intended to recognize or predict the costs & returns from any one operation. Developed by Texas AgriLife Extension Service.
Page 53

B-1241 (C1)Projections for Planning Purposes OnlyNot to be Used without Updating after December 15, 2010
Table 27.B Estimated resource use and costs for field operations, per Acre Roundup Ready Canola, Dryland 2011 Projected Costs and Returns per Acre _____________________________________________________________________________________________________________________________________________ TRACTOR COST EQUIP COST ALLOC LABOR OPERATING INPUT OPERATION/ SIZE/ TRACTOR PERF TIMES -------------- -------------- ------------- ---------------------- TOTAL OPERATING INPUT UNIT SIZE RATE OVER MTH DIRECT FIXED DIRECT FIXED HOURS COST AMOUNT PRICE COST COST _____________________________________________________________________________________________________________________________________________ ------------dollars----------- dollars -------dollars-------- chisel 125 0.099 1.00 Jun 3.35 2.47 0.69 1.15 0.219 2.25 9.93 sweep plow 150 0.065 1.00 Jul 2.08 1.16 0.85 1.25 0.143 1.48 6.84 field cultivator 35 ft 150 0.065 1.00 Aug 2.08 1.16 0.75 1.36 0.143 1.48 6.85 fert(N) - dry lb. 1.00 Aug 35.0000 0.48 16.80 16.80 fert application acre 1.0000 5.00 5.00 5.00 grain drill 40 0.212 1.00 Sep 2.82 1.72 1.50 2.51 0.424 4.36 12.93 RR Canola Seed lbs. 5.0000 4.83 24.15 24.15 Seed Treatment - Can acre 1.0000 6.30 6.30 6.30 Pickup Truck 3/4 ton 0.006 20.00 Dec 5.65 0.25 5.90 Insect+Appl (Canola) acre 1.00 Mar 1.0000 13.40 13.40 13.40 Herb + appl (Canola) acre 1.0000 11.35 11.35 11.35 cust harvest -canola acre 1.00 Jun 1.0000 19.00 19.00 19.00 cust haul - canola cwt. 11.0000 0.38 4.18 4.18 ------- ------- ------- ------- ------ ------- ------- ------- TOTALS 10.34 6.53 9.45 6.53 0.931 9.59 100.18 142.65 INTEREST ON OPERATING CAPITAL 4.44 UNALLOCATED LABOR 0.00 TOTAL SPECIFIED COST 147.10 _____________________________________________________________________________________________________________________________________________Projections for Planning Purposes Only.
Information presented is prepared solely as a general guide & not intended to recognize or predict the costs & returns from any one operation. Developed by Texas AgriLife Extension Service.
Page 54

B-1241 (C1)Projections for Planning Purposes OnlyNot to be Used without Updating after December 15, 2010
Table 28.A Estimated costs and returns per Acre Roundup Ready Canola, Sprinkler Irrigated, (NG) 2011 Projected Costs and Returns per Acre _______________________________________________________________________ITEM UNIT PRICE QUANTITY AMOUNT YOUR FARM_______________________________________________________________________ dollars dollars INCOME Canola cwt. 19.55 22.0000 430.10 _________ -------- TOTAL INCOME 430.10 _________ DIRECT EXPENSES SEED RR Canola Seed lbs. 4.83 5.0000 24.15 _________ Seed Treatment - Can acre 6.30 1.0000 6.30 _________ FERTILIZER fert(N) - dry lb. 0.48 30.0000 14.40 _________ fert(N) - liquid lb. 0.57 60.0000 34.20 _________ CUSTOM fert application acre 5.00 1.0000 5.00 _________ insec+appl(canola i) acre 21.85 1.0000 21.85 _________ Herb + appl (Canola) acre 11.35 1.0000 11.35 _________ custom harv- cani acre 23.00 1.0000 23.00 _________ cust haul - canola cwt. 0.38 22.0000 8.36 _________ OPERATOR LABOR Implements hour 10.30 0.3636 3.74 _________ Tractors hour 10.30 0.5151 5.30 _________ HAND LABOR Implements hour 10.30 0.2121 2.18 _________ IRRIGATION LABOR Center Pivot hour 10.30 0.6400 6.59 _________ DIESEL FUEL Tractors gal 2.65 2.4615 6.52 _________ GASOLINE Self-Propelled Eq. gal 2.73 2.0100 5.48 _________ NATURAL GAS Center Pivot Mcf 4.75 10.0000 47.50 _________ REPAIR & MAINTENANCE Implements Acre 4.47 1.0000 4.47 _________ Tractors Acre 5.55 1.0000 5.55 _________ Self-Propelled Eq. Acre 0.16 1.0000 0.16 _________ Center Pivot ac-in 2.03 10.0000 20.30 _________ INTEREST ON OP. CAP. Acre 7.64 1.0000 7.64 _________ -------- TOTAL DIRECT EXPENSES 264.09 _________RETURNS ABOVE DIRECT EXPENSES 166.00 _________ FIXED EXPENSES Implements Acre 7.26 1.0000 7.26 _________ Tractors Acre 8.24 1.0000 8.24 _________ Self-Propelled Eq. Acre 0.25 1.0000 0.25 _________ Center Pivot Acre 33.60 1.0000 33.60 _________ -------- TOTAL FIXED EXPENSES 49.36 _________ -------- TOTAL SPECIFIED EXPENSES 313.45 _________RETURNS ABOVE TOTAL SPECIFIED EXPENSES 116.64 _________ ALLOCATED COST ITEMS cash rent - canola I acre 65.00 1.0000 65.00 _________RESIDUAL RETURNS 51.64 ________________________________________________________________________________Projections for Planning Purposes Only.
Information presented is prepared solely as a general guide & not intended to recognize or predict the costs & returns from any one operation. Developed by Texas AgriLife Extension Service.
Page 55
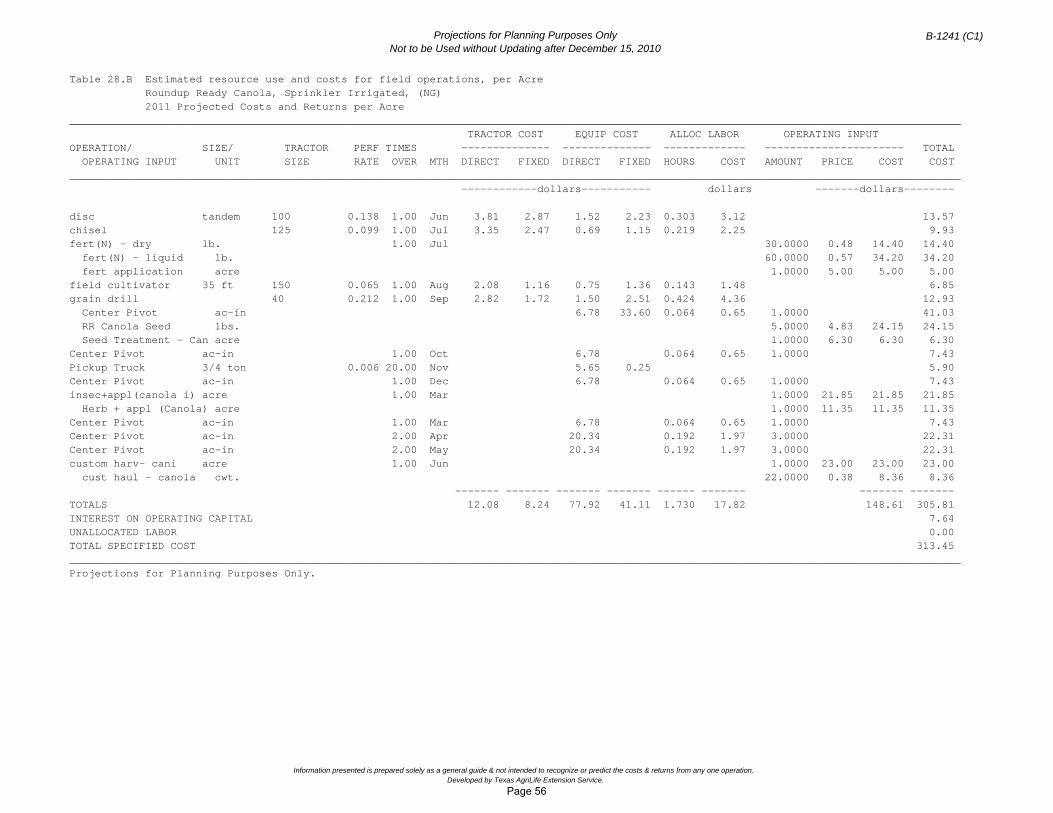
B-1241 (C1)Projections for Planning Purposes OnlyNot to be Used without Updating after December 15, 2010
Table 28.B Estimated resource use and costs for field operations, per Acre Roundup Ready Canola, Sprinkler Irrigated, (NG) 2011 Projected Costs and Returns per Acre _____________________________________________________________________________________________________________________________________________ TRACTOR COST EQUIP COST ALLOC LABOR OPERATING INPUT OPERATION/ SIZE/ TRACTOR PERF TIMES -------------- -------------- ------------- ---------------------- TOTAL OPERATING INPUT UNIT SIZE RATE OVER MTH DIRECT FIXED DIRECT FIXED HOURS COST AMOUNT PRICE COST COST _____________________________________________________________________________________________________________________________________________ ------------dollars----------- dollars -------dollars-------- disc tandem 100 0.138 1.00 Jun 3.81 2.87 1.52 2.23 0.303 3.12 13.57 chisel 125 0.099 1.00 Jul 3.35 2.47 0.69 1.15 0.219 2.25 9.93 fert(N) - dry lb. 1.00 Jul 30.0000 0.48 14.40 14.40 fert(N) - liquid lb. 60.0000 0.57 34.20 34.20 fert application acre 1.0000 5.00 5.00 5.00 field cultivator 35 ft 150 0.065 1.00 Aug 2.08 1.16 0.75 1.36 0.143 1.48 6.85 grain drill 40 0.212 1.00 Sep 2.82 1.72 1.50 2.51 0.424 4.36 12.93 Center Pivot ac-in 6.78 33.60 0.064 0.65 1.0000 41.03 RR Canola Seed lbs. 5.0000 4.83 24.15 24.15 Seed Treatment - Can acre 1.0000 6.30 6.30 6.30 Center Pivot ac-in 1.00 Oct 6.78 0.064 0.65 1.0000 7.43 Pickup Truck 3/4 ton 0.006 20.00 Nov 5.65 0.25 5.90 Center Pivot ac-in 1.00 Dec 6.78 0.064 0.65 1.0000 7.43 insec+appl(canola i) acre 1.00 Mar 1.0000 21.85 21.85 21.85 Herb + appl (Canola) acre 1.0000 11.35 11.35 11.35 Center Pivot ac-in 1.00 Mar 6.78 0.064 0.65 1.0000 7.43 Center Pivot ac-in 2.00 Apr 20.34 0.192 1.97 3.0000 22.31 Center Pivot ac-in 2.00 May 20.34 0.192 1.97 3.0000 22.31 custom harv- cani acre 1.00 Jun 1.0000 23.00 23.00 23.00 cust haul - canola cwt. 22.0000 0.38 8.36 8.36 ------- ------- ------- ------- ------ ------- ------- ------- TOTALS 12.08 8.24 77.92 41.11 1.730 17.82 148.61 305.81 INTEREST ON OPERATING CAPITAL 7.64 UNALLOCATED LABOR 0.00 TOTAL SPECIFIED COST 313.45 _____________________________________________________________________________________________________________________________________________Projections for Planning Purposes Only.
Information presented is prepared solely as a general guide & not intended to recognize or predict the costs & returns from any one operation. Developed by Texas AgriLife Extension Service.
Page 56

B-1241 (C1)Projections for Planning Purposes OnlyNot to be Used without Updating after December 15, 2010
Table 1. Parameters ______________________________________________________________________________ Diesel Fuel (DI) Price . . . . . .($/gal): 2.65 Electricity (EL) Price . . . . . .($/kWh): 0.08 Gasoline (GA) Price. . . . . . . .($/gal): 2.73 LP Gas (LP) Price. . . . . . . . .($/gal): 1.80 Natural Gas (NG) Price . . . . . .($/Mcf): 4.75 Operator Labor (OL) Wage Rate. . . ($/hr): 10.30 Hand Labor (HL) Wage Rate. . . . . ($/hr): 10.30 Irrigation Labor (IL) Wage Rate. . ($/hr): 10.30 Owner Labor (WL) Wage Rate . . . . ($/hr): 10.30 Short-term Interest Rate . . . . . . .(%): 4.75 Intermediate-term Interest Rate. . . .(%): 6.00 Comment at End of Table Titles . . . . . : Comment at End of Tables: Projections for Planning Purposes Only. ______________________________________________________________________________
Information presented is prepared solely as a general guide & not intended to recognize or predict the costs & returns from any one operation. These projections were collected & developed by TCE staff & approved for publication.
Page 57

B-1241 (C1)Projections for Planning Purposes OnlyNot to be Used without Updating after December 15, 2010
Table 2. Self-Propelled Machines _________________________________________________________________________________________________________________________________________ FUEL RECORD PERF FUEL CONS LABOR LABOR PURCHASE SV R&M USEFUL ANNUAL NUM ITEM NAME SIZE RATE TYPE RATE TYPE MULT PRICE RATE RATE LIFE USE _________________________________________________________________________________________________________________________________________ 1 Pickup Truck 3/4 ton 0.0067 GA 15.00 OL 0.00 23110.00 16.00 80.00 10.00 1500.00 _________________________________________________________________________________________________________________________________________
Information presented is prepared solely as a general guide & not intended to recognize or predict the costs & returns from any one operation. These projections were collected & developed by TCE staff & approved for publication.
Page 58

B-1241 (C1)Projections for Planning Purposes OnlyNot to be Used without Updating after December 15, 2010
Table 3. Tractors _____________________________________________________________________________________________________________________________ FUEL RECORD FUEL CONS LABOR LABOR PURCHASE SV R&M USEFUL ANNUAL NUM ITEM NAME SIZE TYPE RATE TYPE MULT PRICE RATE RATE LIFE USE _____________________________________________________________________________________________________________________________ 1 Tractor 100 DI 5.40 OL 1.00 54514.00 38.0 60.00 7.00 350.00 2 Tractor 125 DI 6.69 OL 1.00 74253.00 38.0 60.00 7.00 400.00 3 Tractor 150 DI 7.72 OL 1.00 80073.00 38.0 60.00 7.00 600.00 4 Tractor 175 DI 9.78 OL 1.00 92300.00 38.0 60.00 7.00 400.00 5 Tractor 40 DI 2.57 OL 1.00 21283.00 38.0 75.00 7.00 350.00 6 Tractor 75 DI 3.86 OL 1.00 34748.00 38.0 75.00 7.00 400.00 _____________________________________________________________________________________________________________________________
Information presented is prepared solely as a general guide & not intended to recognize or predict the costs & returns from any one operation. These projections were collected & developed by TCE staff & approved for publication.
Page 59

B-1241 (C1)Projections for Planning Purposes OnlyNot to be Used without Updating after December 15, 2010
Table 4. Implements _________________________________________________________________________________________________________________________________________RECORD PERF TRAC TRAC FUEL LABOR ADD PURCHASE SV R&M USEFUL ANNUAL NUM ITEM NAME SIZE RATE NUM MULT MULT TYPE LABOR PRICE RATE RATE LIFE USE _________________________________________________________________________________________________________________________________________ 1 bed planter 0.0572 2 1.00 1.00 HL 1.00 53000.00 10.00 70.00 7.00 150.00 2 bedder 0.0572 3 1.00 1.00 OL 1.20 13500.00 10.00 80.00 7.00 200.00 3 blade plow 0.0996 3 1.00 1.00 OL 1.20 17745.00 10.00 50.00 7.00 200.00 4 box float 0.3273 5 1.00 1.00 OL 1.20 2175.00 10.00 50.00 7.00 100.00 5 chisel 0.0996 2 1.00 1.00 OL 1.20 13907.00 10.00 70.00 7.00 200.00 6 cultivator 12 row 0.0785 1 1.00 1.00 OL 1.20 19862.00 10.00 80.00 7.00 100.00 7 cultivator 8 row 0.1181 6 1.00 1.00 OL 1.20 14966.00 10.00 80.00 7.00 100.00 8 cultivator rolling 0.1473 1 1.00 1.00 OL 1.20 14537.00 10.00 80.00 7.00 200.00 9 cultivator 12 row rolling 0.0736 2 1.00 1.00 OL 1.20 19226.00 10.00 80.00 7.00 200.00 10 disc offset 0.0788 1 1.00 1.00 OL 1.20 34261.00 10.00 80.00 7.00 200.00 12 disc tandem 0.1380 1 1.00 1.00 OL 1.20 19345.00 10.00 80.00 7.00 200.00 14 field cultivator 35 ft 0.0654 3 1.00 1.00 OL 1.20 24884.00 10.00 65.00 7.00 200.00 15 furrow opener 20 feet 0.1000 6 1.00 1.00 OL 1.20 6750.00 10.00 80.00 7.00 100.00 13 grain drill 0.2121 5 1.00 1.00 HL 1.00 8500.00 10.00 70.00 7.00 120.00 16 lister 20 ft 0.1145 1 1.00 1.00 OL 1.20 8750.00 10.00 80.00 7.00 200.00 17 lister/planter 20 ft 0.1145 6 1.00 1.00 OL 1.20 17500.00 10.00 70.00 7.00 150.00 18 moldboard 0.2864 2 1.00 1.00 OL 1.20 13729.00 10.00 80.00 7.00 100.00 19 packer 0.2761 5 1.00 1.00 OL 1.20 9500.00 10.00 80.00 7.00 200.00 20 planter 0.1527 6 1.00 1.00 HL 1.00 16500.00 10.00 70.00 7.00 100.00 21 planter no-till 0.1527 1 1.00 1.00 HL 1.00 42543.00 10.00 70.00 7.00 100.00 22 rod weeder 8 row 0.0775 1 1.00 1.00 OL 1.20 11500.00 10.00 70.00 7.00 80.00 23 rotary hoe 8 row 0.0775 6 1.00 1.00 OL 1.20 6707.00 10.00 80.00 7.00 80.00 25 shredder 4 row 0.2095 5 1.00 1.00 OL 1.20 8437.00 10.00 40.00 7.00 125.00 26 sprayer mounted 0.1577 1 1.00 1.00 HL 1.00 7500.00 10.00 100.00 7.00 100.00 28 stalk cutter 0.0690 2 1.00 1.00 OL 1.00 23900.00 10.00 70.00 8.00 200.00 29 Strip Plow 35-40 ft 0.1200 4 1.00 1.00 OL 1.20 13000.00 10.00 70.00 7.00 200.00 27 sweep plow 0.0654 3 1.00 1.00 OL 1.20 22884.00 10.00 80.00 7.00 200.00_________________________________________________________________________________________________________________________________________
Information presented is prepared solely as a general guide & not intended to recognize or predict the costs & returns from any one operation. These projections were collected & developed by TCE staff & approved for publication.
Page 60

B-1241 (C1)Projections for Planning Purposes OnlyNot to be Used without Updating after December 15, 2010
Table 5. Operating Inputs ____________________________________________________________________________________________________RECORD COST NUM ITEM NAME UNIT PRICE YIELD? COMMENT ____________________________________________________________________________________________________ BOLL WEEVIL ASSESS 184 dryland acre 6.00 185 Irrigated acre 12.00 CROP INSURANCE 170 corn - irrigated acre 24.25 211 corn sil - irrigated acre 24.25 4 cotton - dryland acre 21.25 5 cotton - irrigated acre 35.00 212 peanuts - irrigated acre 12.00 223 sorg-silage - irr. acre 21.25 221 sorg-sudan - dryland acre 18.75 222 sorg-sudan - irr. acre 21.25 213 sorghum - dryland acre 25.00 214 sorghum - irrigated acre 26.25 215 soybean - furrow irr acre 23.00 216 soybeans - irrigated acre 23.00 217 sunflowers - dryland acre 11.00 218 sunflowers - irr. acre 12.00 219 wheat - dryland acre 19.50 220 wheat - irrigated acre 20.80 CUSTOM 171 crop consultant acre 7.25 92 cust harv-sorgh dry acre 20.00 94 cust harv-sunfl acre 26.00 96 cust harv-wheat acre 20.00 207 cust harvest -canola acre 19.00 208 cust haul - canola cwt. 0.38 100 cust haul-sorgh dry cwt. 0.39 103 cust haul-sunfl cwt. 0.35 191 cust haul-wheat dry bu. 0.23 90 custom baling ton 25.00 209 custom harv- cani acre 23.00 107 dig & shake - peanut acre 21.50 109 drying - peanut ton 36.00 111 fert appl - ANH3 acre 11.00 110 fert application acre 5.00 115 fung & appl - peanut appl 15.60 117 ginning - cotton cwt. 3.00 120 harv & haul - corn bu. 0.39 121 harv & haul - cornsi ton 6.75 167 harv & haul - sorgh ton 6.75 124 harv & haul - soybea bu. 0.50 88 harv&haul - peanuts ton 65.00 125 harv&haul-wheat irr bu. 0.50 126 harvaid appl-cot dry acre 25.00 127 harvaid appl-cot irr acre 25.00 173 harvest & haul - sor cwt. 0.88 205 Herb + appl (Canola) acre 11.35 130 herb application acre 5.00 175 herb&appl-sorghumi acre 23.65 132 herb+appl - alfalfa acre 26.00 136 herb+appl - sorghum acre 18.00 133 herb+appl -corn post acre 15.00 137 herb+appl-soybeans i acre 15.00 139 hoeing - peanut acre 16.80 141 insec appl - alfalfa appl 15.40 142 insec+appl - cornsi appl 25.40 143 insec+appl - cotton appl 13.40 144 insec+appl - peanut appl 13.40 146 insec+appl - sorghum appl 14.50 151 insec+appl - wheat acre 12.30 210 insec+appl(canola i) acre 21.85 147 insec+appl-soybeans acre 11.50 206 Insect+Appl (Canola) acre 13.40 198 Pesticide appl acre 5.00 202 post emer herb+appld acre 11.20 190 post emerg herb+appl acre 17.90 134 preplant herb + appl acre 13.40 154 strip & module-cotto cwt. 8.00 181 strip till acre 14.50 FERTILIZER 14 fert(N) - ANH3 lb. 0.43 15 fert(N) - dry lb. 0.48 16 fert(N) - liquid lb. 0.57 17 fert(P) - dry lb. 0.70 18 fert(P) - liquid lb. 0.71 HERBICIDE 197 2-4D acre 1.71 182 burndown herb acre 18.00 172 burndown&atrazene ap acre 16.24 193 glyphosphate acre 4.48 224 Herb + applic - SS lb. 7.20 162 herb - corn pre acre 19.60 163 herb -corn post acre 27.80 34 herb&appl-alfalfa acre 26.00 174 herb+appl-corns pre acre 23.65 38 herb.& appl.-fallow acre 15.00 27 herb.- peanut acre 16.80 29 herbicide rotation acre 4.80 194 Prowl H2O acre 8.65 INSECTICIDE 157 miticide acre 20.00 195 seed insect. - sunfl acre 4.48 201 seed insect.-sunflc acre 6.72 200 seed insect.-sunfli acre 5.60 IRRIGATION FUEL 168 Irrigation - CP ac-in 4.75 Y Pesticide 196 ammo - pest acre 3.51 SEED 177 conf. sunflower seed acre 28.00 Assume 15,000 seeds/acre 39 innoculant peanut acre 6.80 188 innoculant soybeans acre 7.84 203 RR Canola Seed lbs. 4.83 55 seed - alfalfa lb. 3.45 56 seed - Bt corngr. bags 255.00 57 seed - corn silage bags 255.00 158 seed - cotton bag 300.00 58 seed - cotton dry bag 300.00 179 seed - Oilseed sunfl acre 25.00 Assume 22,000 seeds/acre 59 seed - pasture lb. 1.25 60 seed - peanut lb. 0.76 61 seed - sorghum lb. 1.70 62 seed - soybeans bag 60.00 63 seed - sunflower acre 15.00 204 Seed Treatment - Can acre 6.30 64 seed- wheat bu. 14.40 180 sorghum-sudan lb. 0.53 ____________________________________________________________________________________________________
Information presented is prepared solely as a general guide & not intended to recognize or predict the costs & returns from any one operation. These projections were collected & developed by TCE staff & approved for publication.
Page 61

B-1241 (C1)Projections for Planning Purposes OnlyNot to be Used without Updating after December 15, 2010
Table 6. Other Durable Inputs ________________________________________________________________________________________________________________________________________ FUEL FIXED FIXED RECORD FUEL CONS R&M LABOR LABOR COST COST NUM ITEM NAME UNIT TYPE RATE COST TYPE USE /UNIT /ACRE COMMENT ________________________________________________________________________________________________________________________________________ 6 Center Pivot ac-in NG 1.0000 2.030 IL 0.0640 0.000 33.60 5 Furrow ac-in NG 1.0000 1.800 IL 0.1405 0.000 24.62 ________________________________________________________________________________________________________________________________________
Information presented is prepared solely as a general guide & not intended to recognize or predict the costs & returns from any one operation. These projections were collected & developed by TCE staff & approved for publication.
Page 62

B-1241 (C1)Projections for Planning Purposes OnlyNot to be Used without Updating after December 15, 2010
Table 7. Operating Input Categories _____________________________________RECORD NUM ITEM NAME _____________________________________ 12 BOLL WEEVIL ASSESS 9 CROP INSURANCE 8 CUSTOM 7 FEED 6 FERTILIZER 5 FUNGICIDE 4 HARVEST AID 3 HERBICIDE 2 INSECTICIDE 10 IRRIGATION FUEL 14 Pesticide 1 SEED _____________________________________
Information presented is prepared solely as a general guide & not intended to recognize or predict the costs & returns from any one operation. These projections were collected & developed by TCE staff & approved for publication.
Page 63

B-1241 (C1)Projections for Planning Purposes OnlyNot to be Used without Updating after December 15, 2010
Table 8. Products ________________________________________________________________________________________________________________________________________RECORD ---------------------------PRICES---------------------------- NUM ITEM NAME UNIT BUDGET CONTRACT LOAN FUTURES HIGH AVERAGE LOW COMMENT ________________________________________________________________________________________________________________________________________ 23 Canola cwt. 19.55 0.00 0.00 0.00 0.00 0.00 0.00 21 Conf. Sunflowers cwt 26.00 0.00 0.00 0.00 0.00 0.00 0.00 1 corn bu. 5.25 0.00 0.00 0.00 0.00 0.00 0.00 2 corn silage ton 48.25 0.00 0.00 0.00 0.00 0.00 0.00 3 cotton lint lb. 0.83 0.00 0.00 0.00 0.00 0.00 0.00 4 cottonseed ton 190.00 0.00 0.00 0.00 0.00 0.00 0.00 6 grazing - irrigated lbs 0.43 0.00 0.00 0.00 0.00 0.00 0.00 7 grazing - sorghum lb. 0.43 0.00 0.00 0.00 0.00 0.00 0.00 8 grazing - wheat lbs 0.43 0.00 0.00 0.00 0.00 0.00 0.00 10 hay - alfalfa ton 175.00 0.00 0.00 0.00 0.00 0.00 0.00 11 hay - sorghum ton 90.00 0.00 0.00 0.00 0.00 0.00 0.00 22 Oilseed Sunflo cwt 20.25 0.00 0.00 0.00 0.00 0.00 0.00 12 pasture days 0.84 0.00 0.00 0.00 0.00 0.00 0.00 13 peanuts - runner ton 400.00 0.00 0.00 0.00 0.00 0.00 0.00 16 sorghum cwt 8.25 0.00 0.00 0.00 0.00 0.00 0.00 20 sorghum silage ton 43.50 0.00 0.00 0.00 0.00 0.00 0.00 17 soybeans bu. 10.70 0.00 0.00 0.00 0.00 0.00 0.00 18 sunflowers cwt. 20.25 0.00 0.00 0.00 0.00 0.00 0.00 19 wheat bu. 6.48 0.00 0.00 0.00 0.00 0.00 0.00 ________________________________________________________________________________________________________________________________________
Information presented is prepared solely as a general guide & not intended to recognize or predict the costs & returns from any one operation. These projections were collected & developed by TCE staff & approved for publication.
Page 64
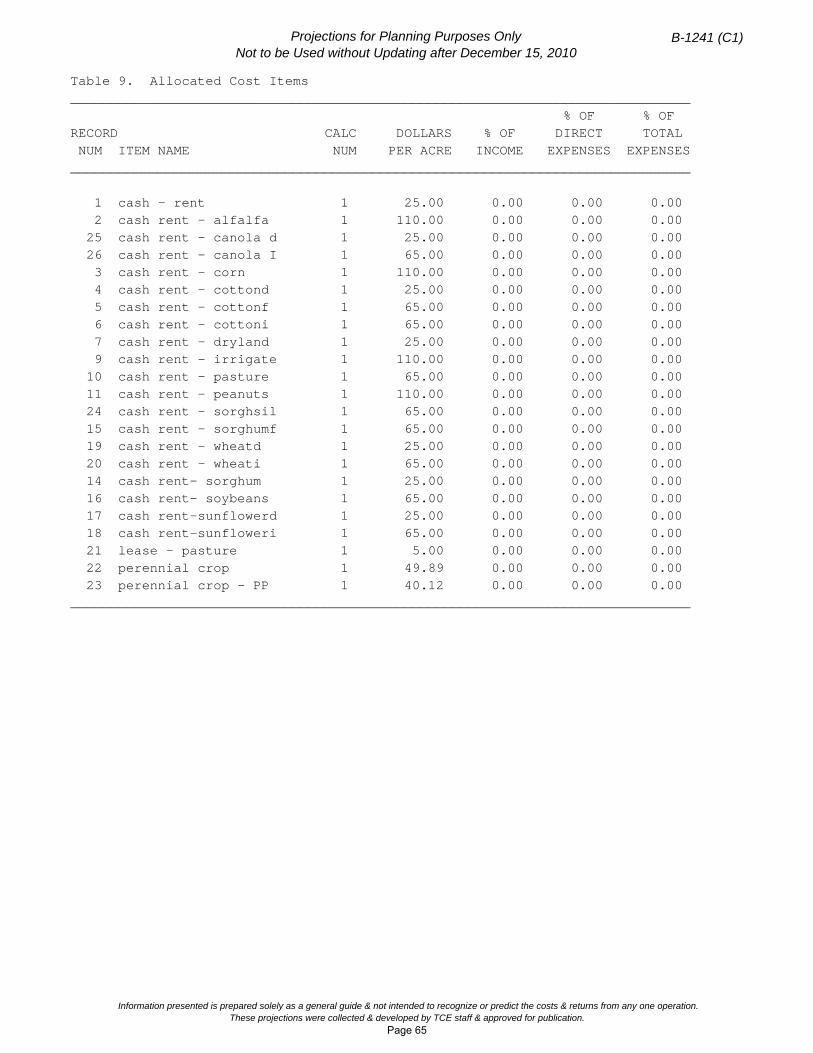
B-1241 (C1)Projections for Planning Purposes OnlyNot to be Used without Updating after December 15, 2010
Table 9. Allocated Cost Items ______________________________________________________________________________ % OF % OF RECORD CALC DOLLARS % OF DIRECT TOTAL NUM ITEM NAME NUM PER ACRE INCOME EXPENSES EXPENSES______________________________________________________________________________ 1 cash - rent 1 25.00 0.00 0.00 0.00 2 cash rent - alfalfa 1 110.00 0.00 0.00 0.00 25 cash rent - canola d 1 25.00 0.00 0.00 0.00 26 cash rent - canola I 1 65.00 0.00 0.00 0.00 3 cash rent - corn 1 110.00 0.00 0.00 0.00 4 cash rent - cottond 1 25.00 0.00 0.00 0.00 5 cash rent - cottonf 1 65.00 0.00 0.00 0.00 6 cash rent - cottoni 1 65.00 0.00 0.00 0.00 7 cash rent - dryland 1 25.00 0.00 0.00 0.00 9 cash rent - irrigate 1 110.00 0.00 0.00 0.00 10 cash rent - pasture 1 65.00 0.00 0.00 0.00 11 cash rent - peanuts 1 110.00 0.00 0.00 0.00 24 cash rent - sorghsil 1 65.00 0.00 0.00 0.00 15 cash rent - sorghumf 1 65.00 0.00 0.00 0.00 19 cash rent - wheatd 1 25.00 0.00 0.00 0.00 20 cash rent - wheati 1 65.00 0.00 0.00 0.00 14 cash rent- sorghum 1 25.00 0.00 0.00 0.00 16 cash rent- soybeans 1 65.00 0.00 0.00 0.00 17 cash rent-sunflowerd 1 25.00 0.00 0.00 0.00 18 cash rent-sunfloweri 1 65.00 0.00 0.00 0.00 21 lease - pasture 1 5.00 0.00 0.00 0.00 22 perennial crop 1 49.89 0.00 0.00 0.00 23 perennial crop - PP 1 40.12 0.00 0.00 0.00 ______________________________________________________________________________
Information presented is prepared solely as a general guide & not intended to recognize or predict the costs & returns from any one operation. These projections were collected & developed by TCE staff & approved for publication.
Page 65

Page 66

B-1241 (C1)Projections for Planning Purposes OnlyNot to be Used without Updating after December 15, 2010
Cow-Calf Budget Texas High Plains 2011 Projected Costs and Returns per Head
============================================================================== PRODUCTION Description Quantity Unit $ / Unit Return CULL COWS 0.12Hd 10.000 cwt. 63.0000 75.60 HEIFER CALVES 0.23Hd 4.750 cwt. 110.0000 120.18 STEER CALVES 0.43Hd 5.250 cwt. 111.0000 250.58 =========== Total GROSS Income 446.36
============================================================================== OPERATING INPUT or CUSTOM OPERATION Description Input Use Unit $ / Unit Cost CORRAL REPAIR 1.000 head 1.550 1.55 FENCE REPAIR 1.000 head 4.000 4.00 HAY 280.000 lb. 0.050 14.00 MARKETING COW-CALF 0.850 head 5.000 4.25 MISCELLANEOUS COW-CALF 1.000 head 3.000 3.00 SALT & MINERALS 50.000 lb. 0.350 17.50 SUPPLEMENT 350.000 lb. 0.160 56.00 VET. MEDICINE 1.000 head 10.000 10.00 WATER FACIL REPR 1.000 head 2.500 2.50 Fuel 5.64 Lube 0.56 Repair 0.68 =========== Total OPERATING INPUT and CUSTOM OPERATION Costs 119.69
============================================================================== Residual returns to capital, ownership labor, land, management, and profit 326.67 ==============================================================================
CAPITAL INVESTMENT Description Quantity Unit Rate of Cost Invested Return Interest - IT Borrowed 711.160 Dol. 0.060 42.67 Interest - OC Borrowed 183.495 Dol. 0.048 8.72 =========== Total CAPITAL INVESTMENT Costs 51.39
============================================================================== Residual returns to ownership, labor, land, management, and profit 275.28 ==============================================================================
OWNERSHIP COST Description (Depreciation, Taxes, and Insurance) Cost Machinery and Equipment 12.89 Livestock 3.04 =========== Total OWNERSHIP Costs 15.93
============================================================================== Residual returns to labor, land, management, and profit 259.36 ==============================================================================
LABOR COST Description Input Use Unit Average Cost Rate Machinery and Equipment 1.181 Hr. 10.589 12.50 Other 6.400 Hr. 10.600 67.84 =========== Total LABOR Costs 80.34
============================================================================== Residual returns to land, management, and profit 179.01 ==============================================================================
LAND COST Description Input Use Unit Rate of Cost Return PASTURE Annual Lease 25.000 Acre 5.500 137.50 =========== Total LAND Costs 137.50
============================================================================== Residual returns to management and profit 41.51 ============================================================================== ============================================================================== Residual returns to profit 41.51 ==============================================================================
Total Projected Cost of Production 404.84
Information presented is prepared solely as a general guide & not intended to recognize or predict the costs & returns from any one operation. These projections were collected & developed by TCE staff & approved for publication.
Page 67
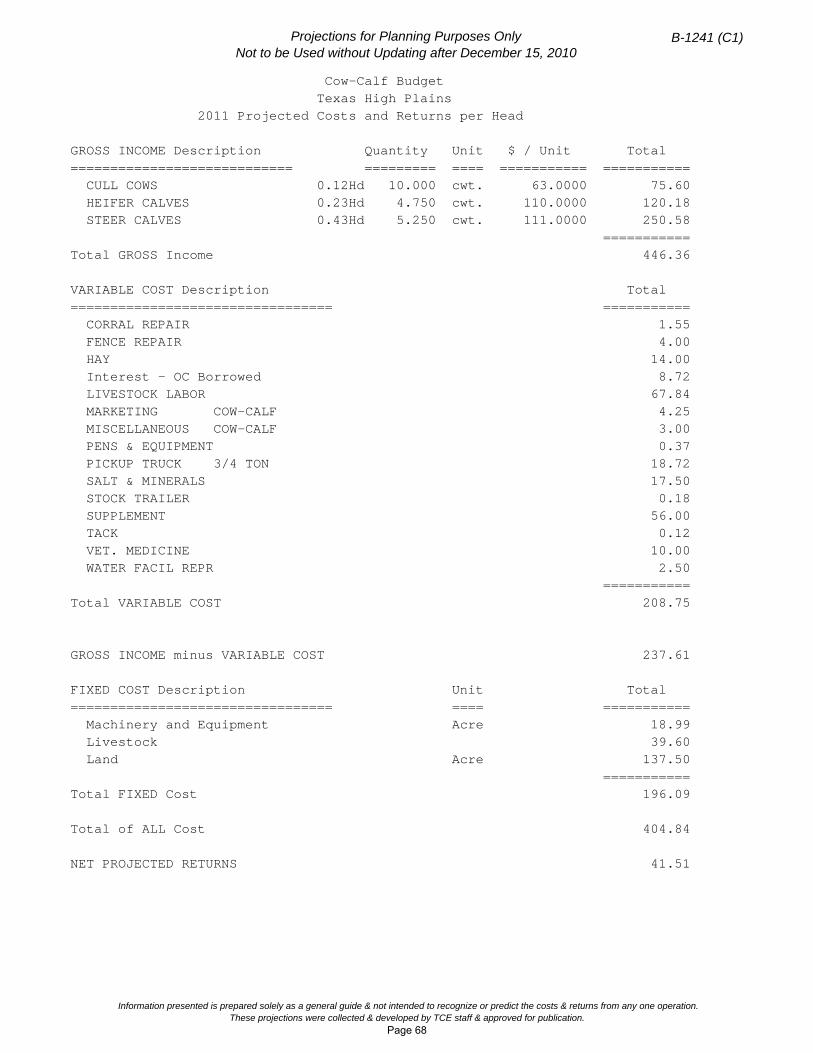
B-1241 (C1)Projections for Planning Purposes OnlyNot to be Used without Updating after December 15, 2010
Cow-Calf Budget Texas High Plains 2011 Projected Costs and Returns per Head
GROSS INCOME Description Quantity Unit $ / Unit Total ============================ ========= ==== =========== =========== CULL COWS 0.12Hd 10.000 cwt. 63.0000 75.60 HEIFER CALVES 0.23Hd 4.750 cwt. 110.0000 120.18 STEER CALVES 0.43Hd 5.250 cwt. 111.0000 250.58 =========== Total GROSS Income 446.36
VARIABLE COST Description Total ================================= =========== CORRAL REPAIR 1.55 FENCE REPAIR 4.00 HAY 14.00 Interest - OC Borrowed 8.72 LIVESTOCK LABOR 67.84 MARKETING COW-CALF 4.25 MISCELLANEOUS COW-CALF 3.00 PENS & EQUIPMENT 0.37 PICKUP TRUCK 3/4 TON 18.72 SALT & MINERALS 17.50 STOCK TRAILER 0.18 SUPPLEMENT 56.00 TACK 0.12 VET. MEDICINE 10.00 WATER FACIL REPR 2.50 =========== Total VARIABLE COST 208.75
GROSS INCOME minus VARIABLE COST 237.61
FIXED COST Description Unit Total ================================= ==== =========== Machinery and Equipment Acre 18.99 Livestock 39.60 Land Acre 137.50 =========== Total FIXED Cost 196.09
Total of ALL Cost 404.84
NET PROJECTED RETURNS 41.51
Information presented is prepared solely as a general guide & not intended to recognize or predict the costs & returns from any one operation. These projections were collected & developed by TCE staff & approved for publication.
Page 68

B-1241 (C1)Projections for Planning Purposes OnlyNot to be Used without Updating after December 15, 2010
Winter Stocker Calf Budget Texas High Plains 2011 Projected Costs and Returns per Head
============================================================================== PRODUCTION Description Quantity Unit $ / Unit Return FEEDER STEERS MARCH 0.97Hd 6.100 cwt. 112.0000 662.70 =========== Total GROSS Income 662.70
============================================================================== OPERATING INPUT or CUSTOM OPERATION Description Input Use Unit $ / Unit Cost DELIVERY STOCKER 1.000 head 5.000 5.00 HAY STOCKER 0.100 ton 100.000 10.00 MISCELLANEOUS STOCKER 1.000 head 1.000 1.00 PRECONDITIONING 1.000 head 30.000 30.00 SALT & MINERALS STOCKERS 15.000 lb. 0.350 5.25 STOCKER STEERS WINTER 4.000 cwt. 122.530 490.12 VET & PROCESSING 1.000 head 15.000 15.00 WHEAT PASTURE 16.000 cwt. 4.500 72.00 =========== Total OPERATING INPUT and CUSTOM OPERATION Costs 628.37
============================================================================== Residual returns to capital, ownership labor, land, management, and profit 34.33 ==============================================================================
CAPITAL INVESTMENT Description Quantity Unit Rate of Cost Invested Return Interest - OC Equity 78.371 Dol. 0.048 3.72 Interest - OC Borrowed 125.718 Dol. 0.048 5.97 =========== Total CAPITAL INVESTMENT Costs 9.69
============================================================================== Residual returns to ownership, labor, land, management, and profit 24.64 ============================================================================== ============================================================================== Residual returns to labor, land, management, and profit 24.64 ==============================================================================
LABOR COST Description Input Use Unit Average Cost Rate Other 1.800 Hr. 10.600 19.08 =========== Total LABOR Costs 19.08
============================================================================== Residual returns to land, management, and profit 5.56 ============================================================================== ============================================================================== Residual returns to management and profit 5.56 ============================================================================== ============================================================================== Residual returns to profit 5.56 ==============================================================================
Total Projected Cost of Production 657.14
Information presented is prepared solely as a general guide & not intended to recognize or predict the costs & returns from any one operation. These projections were collected & developed by TCE staff & approved for publication.
Page 69

B-1241 (C1)Projections for Planning Purposes OnlyNot to be Used without Updating after December 15, 2010
Winter Stocker Calf Budget Texas High Plains 2011 Projected Costs and Returns per Head
GROSS INCOME Description Quantity Unit $ / Unit Total ============================ ========= ==== =========== =========== FEEDER STEERS MARCH 0.97Hd 6.100 cwt. 112.0000 662.70 =========== Total GROSS Income 662.70
VARIABLE COST Description Total ================================= =========== DELIVERY STOCKER 5.00 HAY STOCKER 10.00 Interest - OC Borrowed 5.97 Interest - OC Equity 3.72 LIVESTOCK LABOR 19.08 MISCELLANEOUS STOCKER 1.00 PRECONDITIONING 30.00 SALT & MINERALS STOCKERS 5.25 STOCKER STEERS WINTER 490.12 VET & PROCESSING 15.00 WHEAT PASTURE 72.00 =========== Total VARIABLE COST 657.14
GROSS INCOME minus VARIABLE COST 5.56
FIXED COST Description Unit Total ================================= ==== ===========
Total of ALL Cost 657.14
NET PROJECTED RETURNS 5.56
Information presented is prepared solely as a general guide & not intended to recognize or predict the costs & returns from any one operation. These projections were collected & developed by TCE staff & approved for publication.
Page 70

B-1241 (C1)Projections for Planning Purposes OnlyNot to be Used without Updating after December 15, 2010
Summer Stocker Calf Budget Texas High Plains 2011 Projected Costs and Returns per Head
============================================================================== PRODUCTION Description Quantity Unit $ / Unit Return FEEDER STEERS OCTOBER 0.97Hd 7.250 cwt. 109.0000 766.54 =========== Total GROSS Income 766.54
============================================================================== OPERATING INPUT or CUSTOM OPERATION Description Input Use Unit $ / Unit Cost DELIVERY STOCKER 1.000 head 5.000 5.00 PASTURE 5.000 mo. 15.000 75.00 PRECONDITIONING 1.000 head 30.000 30.00 SALT & MINERALS STOCKERS 15.000 lb. 0.350 5.25 STOCKER STEERS 5.000 cwt. 122.530 612.65 VET & PROCESSING 1.000 head 15.000 15.00 =========== Total OPERATING INPUT and CUSTOM OPERATION Costs 742.90
============================================================================== Residual returns to capital, ownership labor, land, management, and profit 23.64 ==============================================================================
CAPITAL INVESTMENT Description Quantity Unit Rate of Cost Invested Return Interest - OC Equity 82.019 Dol. 0.048 3.90 Interest - OC Borrowed 167.659 Dol. 0.048 7.96 =========== Total CAPITAL INVESTMENT Costs 11.86
============================================================================== Residual returns to ownership, labor, land, management, and profit 11.78 ============================================================================== ============================================================================== Residual returns to labor, land, management, and profit 11.78 ==============================================================================
LABOR COST Description Input Use Unit Average Cost Rate Other 2.400 Hr. 10.600 25.44 =========== Total LABOR Costs 25.44
==============================================================================
Residual returns to land, management, and profit -13.66 ============================================================================== ============================================================================== Residual returns to management and profit -13.66 ============================================================================== ============================================================================== Residual returns to profit -13.66 ==============================================================================
Total Projected Cost of Production 780.20
Information presented is prepared solely as a general guide & not intended to recognize or predict the costs & returns from any one operation. These projections were collected & developed by TCE staff & approved for publication.
Page 71

B-1241 (C1)Projections for Planning Purposes OnlyNot to be Used without Updating after December 15, 2010
Summer Stocker Calf Budget Texas High Plains 2011 Projected Costs and Returns per Head
GROSS INCOME Description Quantity Unit $ / Unit Total ============================ ========= ==== =========== =========== FEEDER STEERS OCTOBER 0.97Hd 7.250 cwt. 109.0000 766.54 =========== Total GROSS Income 766.54
VARIABLE COST Description Total ================================= =========== DELIVERY STOCKER 5.00 Interest - OC Borrowed 7.96 Interest - OC Equity 3.90 LIVESTOCK LABOR 25.44 PASTURE 75.00 PRECONDITIONING 30.00 SALT & MINERALS STOCKERS 5.25 STOCKER STEERS 612.65 VET & PROCESSING 15.00 =========== Total VARIABLE COST 780.20
GROSS INCOME minus VARIABLE COST -13.66
FIXED COST Description Unit Total ================================= ==== ===========
Total of ALL Cost 780.20
NET PROJECTED RETURNS -13.66
Information presented is prepared solely as a general guide & not intended to recognize or predict the costs & returns from any one operation. These projections were collected & developed by TCE staff & approved for publication.
Page 72

HIGH PLAINS CASH PRICES
In this section, weekly cash prices at the Amarillo terminal markets for corn, grain sorghum, soybeans and wheat, as well as, cotton (Lubbock price) are depicted graphically over the last five years. These graphs represent only a small part of the price data that is readily available. Cash prices, futures prices and basis (cash – futures) are collected weekly by Texas AgriLife Extension Agricultural Economics program unit for up to 21 areas (listed below) of Texas depending on the commodity. Each price quote represents a composite of at least three markets within that region. In some regions, several years of data are available.
All price data are available through the basis website at: http://agecoext.tamu.edu/resources/basis-data. In addition to graphs, data are available in a table format. Funding for the development of the website and initial collection of corn and wheat prices was provided by grants from the Texas Corn Producers Board and The Texas Wheat Producers Board.
Markets and Commodities Where Price Data Are Collected Market Commodities
Amarillo Terminals Corn, Sorghum, Soybeans, Wheat Central Rolling Plains Sorghum, Wheat Central Texas Corn, Sorghum Central Texas - North Corn, Sorghum, Wheat Central Texas - South Corn, Sorghum, Wheat Coastal Bend Sorghum Dallas/Fort Worth Corn, Cotton, Sorghum Denton Wheat Eastern Panhandle Corn, Sorghum, Soybeans, Wheat Houston Port Sorghum, Wheat Lubbock Cotton North of the Canadian Corn, Sorghum, Wheat North Texas Corn, Sorghum, Soybeans, Wheat Northern Rolling Plains Wheat Northwest Panhandle Corn, Sorghum, Soybeans, Wheat South of the Line Corn, Sorghum, Wheat Southwest Panhandle Corn, Sorghum, Soybeans, Wheat Southwest Texas - East Sorghum Southwest Texas - West Corn, Sorghum, Wheat Triangle Area Corn, Sorghum, Soybeans, Wheat West Texas Corn, Sorghum, Wheat
Page 73

AMARILLO TERMINAL Counties: Potter and Randall
Page 74
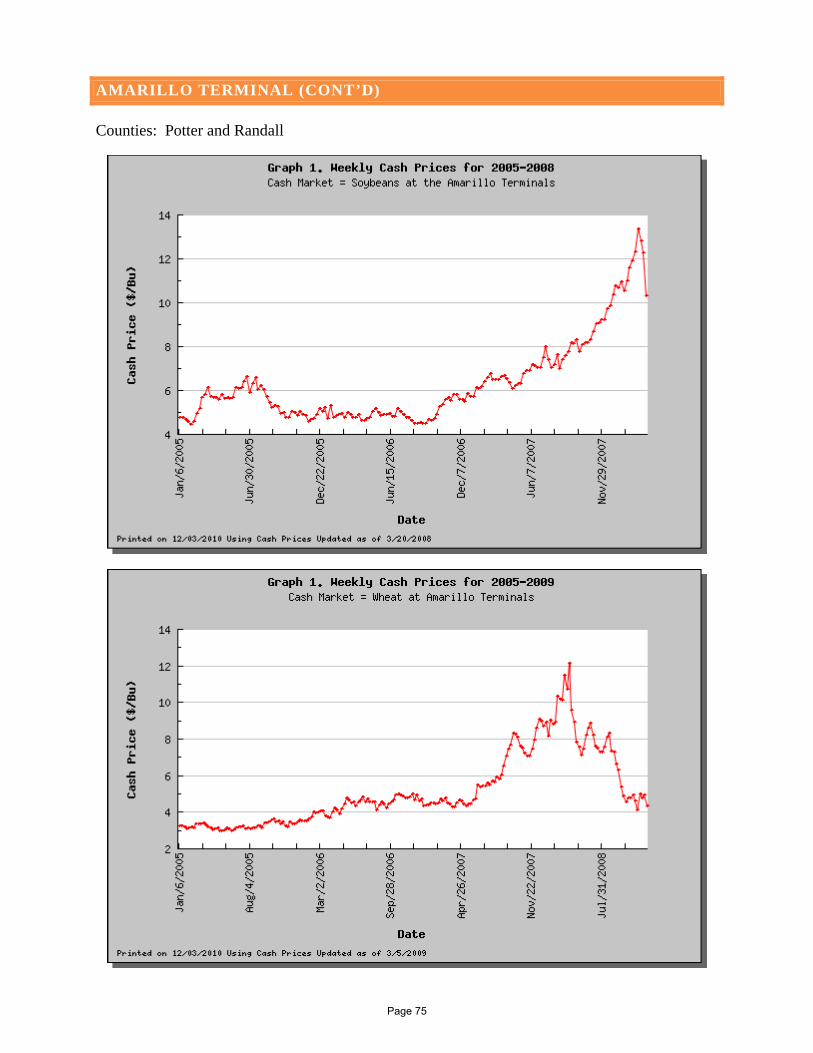
AMARILLO TERMINAL (CONT’D) Counties: Potter and Randall
Page 75

LUBBOCK COTTON 41-34
To view cash prices for other markets or commodities, follow these steps: 1. Go to: http://agecoext.tamu.edu/resources/basis-data. 2. Select “View Corn, Cotton, Sorghum, Soybean and Wheat Basis Information”. 3. Select the Commodity you want to view from the drop-down box and hit the Submit button. 4. Select the radio button for the Market you want to view and hit the Submit button. 5. Select the radio button for “Graph 1. Weekly Cash Price” and hit the Submit button. 6. Select the year(s) you want to view and hit the Submit button.
Page 76

Texas High Plains Crop Statistics, 2005-2009 Acreage Planted, Acreage Harvested and Crop Yields Per Harvested Acre
Irrigated Corn, Yields Per Harvested Acreage, 2005-2009 2005 2006 2007 2008 2009 Average
DIST. COUNTY Bushels
1 ARMSTRONG 194.0 194.0
1 BRISCOE 105.9 189.0 136.0 117.0 137.0
1 CARSON 187.9 171.0 218.0 193.0 190.0 192.0
1 COLLINGSWORTH
1 DALLAM 177.5 182.0 198.0 186.0 208.0 190.3
1 DEAF SMITH 159.9 162.0 196.0 189.0 190.0 179.4
1 DONLEY 141.8 155.0 197.0 164.6
1 GRAY 176.8 174.0 206.0 187.0 186.0
1 HALL
1 HANSFORD 189.9 184.0 196.0 223.0 198.2
1 HARTLEY 196.4 208.0 221.0 210.0 235.0 214.1
1 HEMPHILL
1 HUTCHINSON 208.8 198.0 219.0 202.0 193.0 204.2
1 LIPSCOMB 182.5 179.0 199.0 186.8
1 MOORE 197.1 198.0 223.0 224.0 224.0 213.2
1 OCHILTREE 229.4 193.0 207.0 229.0 213.0 214.3
1 OLDHAM
1 POTTER
1 RANDALL 193.3 193.3
1 ROBERTS 208.4 198.0 203.2
1 SHERMAN 195.4 198.0 221.0 221.0 217.0 210.5
1 WHEELER
2 BAILEY 224.1 166.0 194.0 194.7
2 BORDEN
2 CASTRO 205.4 203.0 215.0 221.0 208.0 210.5
2 COCHRAN 198.5 198.5
2 CROSBY 178.0 178.0
2 DAWSON
2 FLOYD 162.3 124.0 177.0 155.0 154.6
2 GAINES
2 GARZA
2 HALE 178.8 149.0 197.0 175.0 181.0 176.2
2 HOCKLEY
2 LAMB 186.3 166.0 204.0 182.0 193.0 186.3
2 LUBBOCK
2 LYNN
2 MITCHELL
2 PARMER 184.8 188.0 202.0 184.0 217.0 195.2
2 SCURRY
2 SWISHER 186.4 207.0 201.0 171.0 192.0 191.5
2 TERRY 121.0 121.0
2 YOAKUM
Page 77

Irrigated Corn, Crop Acreages, 2005-2009
Dist. COUNTY
Acreage Planted Acreage Harvested
2005 2006 2007 2008 2009 Avg. 2005 2006 2007 2008 2009 Avg.
1,000 acres 1,000 acres
1 ARMSTRONG 1.0 1.0 1.0 1.0
1 BRISCOE 5.0 1.7 1.1 2 2.5 4.6 1.5 1.1 1.4 2.2
1 CARSON 9.5 9.8 21.3 23.3 21.4 17.1 9.4 9.7 21.3 22.3 20.4 16.6
1 COLLINGSWORTH
1 DALLAM 126.5 130.3 131.7 129.3 133.5 130.3 122.0 124.4 129.0 124.6 128.4 125.7
1 DEAF SMITH 32.6 23.2 34.9 41.3 46.9 35.8 26.7 14.2 25.5 25.3 35.7 25.5
1 DONLEY 1.1 1.0 1.5 1.2 1.1 1.0 1.5 1.2
1 GRAY 4.6 4.5 6.9 8 6.0 3.8 4.0 6.9 6.9 5.4
1 HALL
1 HANSFORD 32.0 33.1 51.2 49.4 41.4 28.4 27.9 47.8 45.7 37.5
1 HARTLEY 114.4 110.0 126.4 115.5 122.0 117.7 102.5 96.3 119.1 106.0 117.9 108.4
1 HEMPHILL
1 HUTCHINSON 9.8 11.3 14.7 15.9 17.4 13.8 9.5 10.1 14.2 14.0 17.4 13.0
1 LIPSCOMB 3.6 2.3 4.4 3.4 3.6 2.3 4.4 3.4
1 MOORE 52.5 50.7 63.8 60.2 59.2 57.3 51.3 48.1 61.7 54.3 57.1 54.5
1 OCHILTREE 16.7 14.8 22.6 20.4 24.0 19.7 16.2 14.6 22.6 20.4 23.3 19.4
1 OLDHAM
1 POTTER
1 RANDALL 1.5 1.5 0.3 0.3
1 ROBERTS 1.9 1.7 1.8 1.9 1.7 1.8
1 SHERMAN 69.7 68.4 85.9 84.7 85.1 78.8 64.1 61.4 81.0 75.7 84.4 73.3
1 WHEELER
2 BAILEY 6.8 7.2 16.6 10.2 2.9 2.4 1.8 2.4
2 BORDEN
2 CASTRO 86.7 78.6 125.0 130.8 129.5 110.1 69.9 63.2 110.1 108.8 114.8 93.4
2 COCHRAN
2 CROSBY 2.5 2.5 2.3 2.3
2 DAWSON
2 FLOYD 7.4 6.4 10.7 12.1 9.2 5.2 2.7 7.3 8.7 6.0
2 GAINES
2 GARZA
2 HALE 24.7 17.0 43.7 52.8 60.3 39.7 20.4 178.8 41.3 47.5 55.3 68.7
2 HOCKLEY
2 LAMB 36.6 31.3 62.6 76.5 77.3 56.9 28.2 23.6 53.9 66.5 71.6 48.8
2 LUBBOCK
2 LYNN
2 MITCHELL
2 PARMER 45.2 68.2 82.1 86.6 93.3 75.1 30.3 32.4 62.1 67.3 79.2 54.3
2 SCURRY
2 SWISHER 15.7 11.5 24.4 22.5 26.5 20.1 14.0 10.3 24.1 22.3 25.3 19.2
2 TERRY
2 YOAKUM
Page 78

Irrigated Cotton, Yields Per Harvested Acreage, 2005-2009 2005 2006 2007 2008 2009 Average
DIST. COUNTY Pounds
1 ARMSTRONG 1063.0 980.0 1021.5
1 BRISCOE 896.0 777.0 1263.0 1045.0 995.3
1 CARSON 1007.0 861.0 1355.0 1021.0 1061.0
1 COLLINGSWORTH 1327.0 1230.0 1383.0 1123.0 1265.8
1 DALLAM 704.0 704.0
1 DEAF SMITH 1085.0 964.0 938.0 748.0 933.8
1 DONLEY 1159.0 1224.0 1358.0 1134.0 1218.8
1 GRAY 942.0 968.0 1170.0 1315.0 1098.8
1 HALL 1179.0 1003.0 1364.0 1078.0 1193.0 1163.4
1 HANSFORD 1000.0 1000.0
1 HARTLEY
1 HEMPHILL
1 HUTCHINSON 1248.0 1440.0 1344.0
1 LIPSCOMB
1 MOORE 1112.0 880.0 1294.0 829.0 1016.0 1026.2
1 OCHILTREE 914.0 750.0 751.0 805.0
1 OLDHAM
1 POTTER
1 RANDALL 923.0 909.0 916.0
1 ROBERTS
1 SHERMAN 1265.0 1180.0 1222.5
1 WHEELER 857.0 874.0 1309.0 1063.0 1110.0 1042.6
2 BAILEY 953.0 936.0 892.0 770.0 902.0 890.6
2 BORDEN 1013.0 1040.0 1026.5
2 CASTRO 1098.0 1080.0 1254.0 1058.0 1122.5
2 COCHRAN 991.0 750.0 780.0 882.0 661.0 812.8
2 CROSBY 858.0 798.0 1048.0 787.0 988.0 895.8
2 DAWSON 1136.0 916.0 1217.0 1015.0 1031.0 1063.0
2 FLOYD 965.0 903.0 1229.0 1049.0 1036.5
2 GAINES 1043.0 900.0 1092.0 824.0 892.0 950.2
2 GARZA 927.0 691.0 873.0 949.0 937.0 875.4
2 HALE 982.0 940.0 1133.0 1048.0 984.0 1017.4
2 HOCKLEY 993.0 830.0 1138.0 1021.0 833.0 963.0
2 LAMB 984.0 970.0 1080.0 910.0 937.0 976.2
2 LUBBOCK 954.0 727.0 1086.0 1046.0 953.0 953.2
2 LYNN 895.0 737.0 935.0 801.0 888.0 851.2
2 MITCHELL 884.0 874.0 1108.0 955.3
2 PARMER 1177.0 1363.0 1106.0 1215.3
2 SCURRY 904.0 985.0 1440.0 1064.0 1098.3
2 SWISHER 882.0 895.0 1184.0 899.0 839.0 939.8
2 TERRY 990.0 769.0 1059.0 824.0 817.0 891.8
2 YOAKUM 1058.0 917.0 1040.0 965.0 995.0
Page 79

Irrigated Cotton, Crop Acreages, 2005-2009
Dist. COUNTY
Acreage Planted Harvested
2005 2006 2007 2008 2009 Avg. 2005 2006 2007 2008 2009 Avg.
1,000 acres 1,000 acres
1 ARMSTRONG 1.7 2.4 2.1 1.4 2.4 1.9
1 BRISCOE 22.4 23.2 16.5 19.5 20.4 15.0 21.3 15.2 17 17.1
1 CARSON 23.4 25.5 12.4 16.1 19.4 22.4 23.7 12.4 14.1 18.2
1 COLLINGSWORTH 17.0 23.3 15.3 12.0 16.9 17.0 23.3 15.1 11.8 16.8
1 DALLAM 1.5 1.5 1.5 1.5
1 DEAF SMITH 31.7 27.9 9.8 8.0 19.4 20.8 25.7 8.7 5.9 15.3
1 DONLEY 5.7 6.9 5.3 5.9 6.0 5.3 6.9 5.3 5.8 5.8
1 GRAY 6.0 6.3 3.2 2.4 4.5 5.2 6.3 3.2 2.3 4.3
1 HALL 11.1 19.0 19.0 17.5 18.4 17.0 8.8 18.9 19 15.1 18.3 16.0
1 HANSFORD 1.7 1.7 1.2 1.2
1 HARTLEY
1 HEMPHILL
1 HUTCHINSON 3.5 2.0 2.8 3.5 2 2.8
1 LIPSCOMB
1 MOORE 23.7 31.0 9.4 9.2 7.3 16.1 23.3 29.9 8.9 7.7 6.9 15.3
1 OCHILTREE 3.1 7.1 2.3 4.2 3.1 7.1 2.3 4.2
1 OLDHAM
1 POTTER
1 RANDALL 2.5 1.9 2.2 1.3 1.9 1.6
1 ROBERTS
1 SHERMAN 23.7 13.6 18.7 23.3 12.2 17.8
1 WHEELER 3.4 3.9 3.3 2.9 3.6 3.4 2.8 3.9 3.3 2.8 3.2 3.2
2 BAILEY 34.1 30.6 18.9 17.8 18.4 24.0 28.7 29.5 15.6 11.1 14 19.8
2 BORDEN 1.8 1.8 1.8 1.8 1.8 1.8
2 CASTRO 72.0 78.0 24.5 19.6 48.5 65.6 73.8 22.2 16.7 44.6
2 COCHRAN 69.5 74.1 67.4 57.2 62.0 66.0 62.5 72.4 63.4 21.6 48.1 53.6
2 CROSBY 124.0 114.5 109.7 107.5 103.0 111.7 113.6 111.9 101.7 105.9 102.0 107.0
2 DAWSON 60.0 64.3 58.8 51.5 54.5 57.8 60.0 63.8 58 46.6 54.0 56.5
2 FLOYD 133.0 127.7 105.7 10.5 94.2 85.1 127.0 89.1 10.3 77.9
2 GAINES 168.0 185.8 171.5 142.0 167.5 167.0 167.0 176.4 169.6 90.3 156.0 151.9
2 GARZA 11.1 10.7 11.0 10.2 10.7 10.7 8.8 10.7 11.0 9.0 10.6 10.0
2 HALE 241.0 242.5 184.4 170.0 170.5 201.7 231.6 240.7 154.7 164.0 154.6 189.1
2 HOCKLEY 138.0 135.9 137.4 125.5 129.0 133.2 117.5 134.0 130.7 106.2 121.0 121.9
2 LAMB 154.0 153.5 90.2 78.8 79.0 111.1 129.3 149.5 81.8 69.1 67.7 99.5
2 LUBBOCK 169.0 157.7 155.0 149.5 149.0 156.0 164.5 153.1 144.1 123.9 141.0 145.3
2 LYNN 78.0 76.9 78.7 79.2 75.5 77.7 74.0 737.0 76.0 67.9 73.0 205.6
2 MITCHELL 3.8 3.9 3.9 3.9 3.8 3.9 3.9 3.9
2 PARMER 77.0 22.3 21.5 40.3 62.4 15.5 18.8 32.2
2 SCURRY 1.7 2.2 2.0 2.4 2.1 1.7 2.2 2.0 2.3 2.1
2 SWISHER 72.0 72.6 43.5 49.1 50.3 57.5 58.2 63.0 38.1 47.0 25.4 46.3
2 TERRY 110.0 112.7 103.8 92.4 112.0 106.2 108.6 119.8 101.5 69.9 104.0 100.8
2 YOAKUM 59.0 72.0 60.5 62.0 63.4 59.0 70.9 56.3 60.7 61.7
Page 80

Dryland Cotton Yields Per Harvested Acreage, 2005-2009 2005 2006 2007 2008 2009 Average
DIST. COUNTY Pounds
1 ARMSTRONG 517.0 240.0 378.5
1 BRISCOE 533.0 308.0 554.0 416.0 452.8
1 CARSON 575.0 313.0 728.0 480.0 524.0
1 COLLINGSWORTH 542.0 268.0 604.0 303.0 529.0 449.2
1 DALLAM
1 DEAF SMITH 761.0 549.0 768.0 549.0 656.8
1 DONLEY 451.0 270.0 500.0 320.0 404.0 389.0
1 GRAY 665.0 378.0 738.0 591.0 593.0
1 HALL 494.0 238.0 551.0 350.0 520.0 430.6
1 HANSFORD 505.0 505.0
1 HARTLEY
1 HEMPHILL
1 HUTCHINSON 480.0 480.0
1 LIPSCOMB
1 MOORE 480.0 288.0 758.0 455.0 512.0 498.6
1 OCHILTREE 807.0 702.0 480.0 663.0
1 OLDHAM
1 POTTER
1 RANDALL 533.0 240.0 386.5
1 ROBERTS
1 SHERMAN 267.0 267.0
1 WHEELER 761.0 203.0 545.0 455.0 491.0
2 BAILEY 553.0 326.0 462.0 290.0 243.0 374.8
2 BORDEN 584.0 458.0 521.0
2 CASTRO 920.0 549.0 847.0 772.0
2 COCHRAN 598.0 216.0 523.0 353.0 438.0 425.6
2 CROSBY 510.0 199.0 641.0 301.0 342.0 398.6
2 DAWSON 534.0 256.0 554.0 328.0 365.0 407.4
2 FLOYD 547.0 200.0 828.0 361.0 425.0 472.2
2 GAINES 518.0 264.0 547.0 438.0 306.0 414.6
2 GARZA 486.0 173.0 616.0 280.0 304.0 371.8
2 HALE 614.0 260.0 640.0 346.0 392.0 450.4
2 HOCKLEY 594.0 295.0 591.0 363.0 335.0 435.6
2 LAMB 660.0 414.0 629.0 531.0 424.0 531.6
2 LUBBOCK 720.0 188.0 834.0 468.0 367.0 515.4
2 LYNN 638.0 260.0 659.0 350.0 419.0 465.2
2 MITCHELL 461.0 240.0 744.0 481.7
2 PARMER 857.0 686.0 517.0 686.7
2 SCURRY 597.0 200.0 958.0 334.0 522.3
2 SWISHER 525.0 186.0 697.0 496.0 325.0 445.8
2 TERRY 646.0 344.0 551.0 379.0 237.0 431.4
2 YOAKUM 445.0 253.0 462.0 209.0 342.3
Page 81

Dryland Cotton, Crop Acreages, 2005-2009 Dist
. COUNTY Acreage Planted Harvested
2005 2006 2007 2008 2009 Avg. 2005 2006 2007 2008 2009 Avg.
1,000 acres 1,000 acres
1 ARMSTRONG 2.7 2.7 2.7 1.3 0.6 1.0
1 BRISCOE 13.4 17.9 8.4 8.8 12.1 11.8 6.7 7.8 7.5 8.5
1 CARSON 18.5 20.0 12.6 16.5 16.9 17.6 13.5 12.2 14.0 14.3
1 COLLINGSWORTH 35.6 39.6 30.7 27.3 28.5 32.3 35.4 31.7 30.2 22.5 28.2 29.6
1 DALLAM
1 DEAF SMITH 8.8 5.8 3.3 4.1 5.5 6.5 0.7 2.5 0.7 2.6
1 DONLEY 6.7 7.6 4.8 5.8 3.9 5.8 6.6 1.6 4.8 4.2 3.8 4.2
1 GRAY 13.7 19.0 8.0 8.2 12.2 8.8 11.3 7.8 6.5 8.6
1 HALL 67.5 65.6 61.0 58.5 47.0 59.9 67.0 34.5 61.0 39.8 46.6 49.8
1 HANSFORD 2.3 2.3 1.9 1.9
1 HARTLEY
1 HEMPHILL
1 HUTCHINSON 1.0 1.0 1.0 1.0
1 LIPSCOMB
1 MOORE 3.1 1.4 2.0 2.1 3.2 2.4 3.1 1.0 1.9 1.9 3.0 2.2
1 OCHILTREE 4.7 4.3 3.8 4.3 4.7 4.1 3.0 3.9
1 OLDHAM
1 POTTER
1 RANDALL 1.5 1.8 1.7 0.9 0.2 0.6
1 ROBERTS
1 SHERMAN 2.2 2.2 1.8 1.8
1 WHEELER 7.1 6.7 5.3 6.3 6.4 7.0 5.9 4.4 5.8 5.8
2 BAILEY 52.0 58.8 36.7 44.4 52.0 48.8 47.7 10.9 31.2 11.6 7.7 21.8
2 BORDEN 26.8 28.7 27.8 26.4 8.6 17.5
2 CASTRO 2.7 5.8 2.0 3.5 2.4 0.7 1.7 1.6
2 COCHRAN 58.5 64.1 55.0 53.9 60.0 58.3 53.0 40.0 52.3 11.7 10.2 33.4
2 CROSBY 95.0 99.8 90.5 95.7 91.0 94.4 87.5 69.1 89.8 85.2 77.3 81.8
2 DAWSON 233.0 233.2 224.3 246.0 236.0 234.5 231.7 73.6 213.3 67.4 204.0 158.0
2 FLOYD 60.5 59.5 41.3 49.5 44.5 51.1 51.8 37.0 37.7 44.9 35.0 41.3
2 GAINES 96.0 102.2 92.4 107.0 96.0 98.7 90.8 28.0 88.6 13.7 36.1 51.4
2 GARZA 31.5 31.6 30.4 29.6 31.9 31.0 24.7 16.1 30.4 19.0 12.8 20.6
2 HALE 32.0 39.9 21.0 31.8 31.5 31.2 30.5 21.4 18.0 24.8 24.5 23.8
2 HOCKLEY 119.0 125.1 118.8 119.0 128.0 122.0 111.6 78.0 113.8 71.5 83.0 91.6
2 LAMB 46.3 53.7 39.2 49.5 56.0 48.9 34.2 43.5 35.1 28.9 27.4 33.8
2 LUBBOCK 96.0 109.1 92.1 97.0 107.0 100.2 93.3 40.4 89.8 78.7 68.0 74.0
2 LYNN 225.0 228.0 222.9 233.0 211.0 224.0 218.9 61.0 215.0 115.4 83.7 138.8
2 MITCHELL 48.0 45.9 43.4 45.8 47.9 26.4 43.2 39.2
2 PARMER 3.2 1.5 4.0 2.9 2.8 1.4 1.3 1.8
2 SCURRY 53.5 54.5 52.1 58.3 54.6 53.1 38.9 52.1 51.4 48.9
2 SWISHER 14.0 20.7 10.8 19.5 18.7 16.7 12.8 3.1 10.6 15.0 10.5 10.4
2 TERRY 140.0 149.4 131.1 147.5 148.0 143.2 137.4 31.0 128.1 52.3 42.8 78.3
2 YOAKUM 68.0 73.3 65.0 64.0 67.6 67.9 20.3 62.4 16.1 41.7
Page 82

Irrigated Sorghum, Yields Per Harvested Acreage, 2005-2009 2005 2006 2007 2008 2009 Average
DIST. COUNTY Pounds
1 ARMSTRONG
1 BRISCOE 5545.0 2576.0 3528.0 3976.0 3906.3
1 CARSON 3652.0 4648.0 4872.0 3304.0 5264.0 4348.0
1 COLLINGSWORTH
1 DALLAM 4518.0 2856.0 4200.0 3858.0
1 DEAF SMITH 5024.0 3920.0 5264.0 5208.0 4854.0
1 DONLEY
1 GRAY 5000.0 3752.0 6328.0 5026.7
1 HALL
1 HANSFORD 5096.0 5880.0 3808.0 4928.0
1 HARTLEY 4550.0 5544.0 4872.0 6664.0 5407.5
1 HEMPHILL
1 HUTCHINSON 5550.0 6216.0 5883.0
1 LIPSCOMB 3692.0 3692.0
1 MOORE 5091.0 4872.0 5824.0 5824.0 5402.8
1 OCHILTREE 5629.0 6048.0 6160.0 4144.0 5992.0 5594.6
1 OLDHAM
1 POTTER
1 RANDALL 2963.0 6216.0 4424.0 4984.0 4646.8
1 ROBERTS
1 SHERMAN 4873.0 5152.0 5880.0 6104 5502.3
1 WHEELER
2 BAILEY 5786.0 3360.0 4256.0 4480.0 5208.0 4618.0
2 BORDEN
2 CASTRO 4312.0 4200.0 5656.0 4722.7
2 COCHRAN 3936.0 4816.0 5432.0 3304.0 4372.0
2 CROSBY 3877.0 1400.0 3696.0 4200.0 3293.3
2 DAWSON 3192.0 4032.0 4704.0 3976.0
2 FLOYD 4709.0 3640.0 5544.0 4631.0
2 GAINES 2744.0 2744.0
2 GARZA
2 HALE 5599.0 4480.0 5488.0 4256.0 4704.0 4905.4
2 HOCKLEY 4308.0 4032.0 4170.0
2 LAMB 4760.0 5096.0 5432.0 4536.0 5656.0 5096.0
2 LUBBOCK 3971.0 4200.0 4200.0 4032.0 3976.0 4075.8
2 LYNN 2128.0 4200.0 4368.0 4928.0 3906.0
2 MITCHELL
2 PARMER 5381.0 5208.0 5992.0 4816.0 4536.0 5186.6
2 SCURRY
2 SWISHER 4766.0 2576.0 4200.0 3847.3
2 TERRY 4400.0 2968.0 2968.0 3192.0 3382.0
2 YOAKUM 4480.0 3416.0 1904.0 3266.7
Page 83

Irrigated Sorghum, Crop Acreages, 2005-2009,
Dist COUNTY
Acreage Planted Harvested
2005 2006 2007 2008 2009 Avg. 2005 2006 2007 2008 2009 Avg.
1,000 acres 1,000 acres
1 ARMSTRONG
1 BRISCOE 4.8 1.9 6.9 5.0 4.7 4.4 1.0 6.3 4.0 3.9
1 CARSON 4.6 6.2 7.7 7.8 5.5 6.4 4.6 6.0 7.3 7.1 5.2 6.0
1 COLLINGSWORTH
1 DALLAM 6.5 10.0 6.7 7.7 5.6 8.4 5.9 6.6
1 DEAF SMITH 26.8 32.5 38.6 28.0 31.5 12.6 14.3 16.9 8.0 13.0
1 DONLEY
1 GRAY 1.7 2.0 1.9 1.9 1.1 1.8 1.5 1.5
1 HALL
1 HANSFORD 7.4 10.0 6.1 7.8 7.3 9.3 4.5 7.0
1 HARTLEY 8.0 9.8 11.1 13.0 10.5 8.0 7.5 10.1 3.2 7.2
1 HEMPHILL
1 HUTCHINSON 2.0 1.2 1.6 2.0 1.0 1.5
1 LIPSCOMB 1.3 1.3 1.3 1.3
1 MOORE 13.5 16.3 24.8 24.0 19.7 13.2 15.1 23.9 23.3 18.9
1 OCHILTREE 8.9 8.4 7.7 8.0 7.5 8.1 8.9 8.4 7.3 7.3 6.8 7.7
1 OLDHAM
1 POTTER
1 RANDALL 5.4 5.0 5.6 5.0 5.3 2.7 1.5 1.4 2.2 2.0
1 ROBERTS
1 SHERMAN 9.2 13.8 12.7 15.0 12.7 7.9 10.9 11.7 14.9 11.4
1 WHEELER
2 BAILEY 4.4 5.3 12.4 17.1 6.5 9.1 1.4 3.0 11.3 13.1 5.5 6.9
2 BORDEN
2 CASTRO 20.5 30.0 15.0 21.8 6.3 18.5 8.3 11.0
2 COCHRAN 4.7 1.4 8.4 36.8 12.8 4.7 4.7 8.1 33.0 12.6
2 CROSBY 5.7 1.0 5.8 3.0 3.9 5.7 1.0 5.3 2.8 3.7
2 DAWSON 1.3 5.2 11.4 6.0 1.3 4.9 10.3 5.5
2 FLOYD 33.7 4.0 31.7 23.1 30.2 2.7 29.8 20.9
2 GAINES 48.0 48.0 42.0 42.0
2 GARZA
2 HALE 16.2 10.9 53.9 35.7 31.0 29.5 15.2 10.0 47.5 31.6 25.7 26.0
2 HOCKLEY 6.6 9.1 7.9 6.5 8.9 7.7
2 LAMB 23.0 14.5 48.2 43.6 26.0 31.1 20.0 9.3 42.0 37.1 20.0 25.7
2 LUBBOCK 3.5 2.6 14.9 32.6 11.0 12.9 3.4 2.4 14.3 28.8 10.6 11.9
2 LYNN 2.5 3.1 7.6 4.1 4.3 2.0 2.9 6.9 4.0 4.0
2 MITCHELL
2 PARMER 20.1 19.7 40.4 35.6 15.0 26.2 12.6 11.1 33.8 29.8 10.6 19.6
2 SCURRY
2 SWISHER 13.7 10.8 22.5 15.7 12.4 8.9 20.4 13.9
2 TERRY 2.5 1.9 12.6 7.8 6.2 0.5 0.6 10.6 5.9 4.4
2 YOAKUM 8.9 18.9 7.8 11.9 8.7 15.9 6.7 10.4
Page 84

Dryland Sorghum, Yields Per Harvested Acreage 2005-2009 2005 2006 2007 2008 2009 Average
DIST COUNTY Pounds
1 ARMSTRONG
1 BRISCOE 2404.0 2744.0 2520.0 2240.0 2477.0
1 CARSON 2789.0 2072.0 2912.0 2128.0 2912.0 2562.6
1 COLLINGSWORTH
1 DALLAM 2931.0 1176.0 1960.0 2022.3
1 DEAF SMITH 3436.0 1232.0 2240.0 2632.0 2385.0
1 DONLEY
1 GRAY 3507.0 2016.0 3360.0 2961.0
1 HALL
1 HANSFORD 1698.0 1400.0 2184.0 1760.7
1 HARTLEY 2794.0 2128.0 1344.0 2072.0 2016.0 2070.8
1 HEMPHILL
1 HUTCHINSON 2289.0 1120.0 1704.5
1 LIPSCOMB 2724.0 2724.0
1 MOORE 3298.0 2520.0 2968.0 2744.0 2882.5
1 OCHILTREE 3237.0 2128.0 2856.0 3024.0 72.0 2263.4
1 OLDHAM
1 POTTER
1 RANDALL 3043.0 1512.0 3584.0 1848.0 2496.8
1 ROBERTS
1 SHERMAN 2345.0 1176.0 1064.0 1528.3
1 WHEELER
2 BAILEY 2047.0 1176.0 2184.0 2128.0 1120.0 1731.0
2 BORDEN
2 CASTRO 2072.0 2072.0 1792.0 1978.7
2 COCHRAN 1780.0 1512.0 1960.0 1568.0 1064.0 1576.8
2 CROSBY 2944.0 2944.0 1736.0 1680.0 2326.0
2 DAWSON 1008.0 2072.0 1848.0 1642.7
2 FLOYD 2695.0 2184.0 2856.0 2072.0 2451.8
2 GAINES 1792.0 1792.0
2 GARZA
2 HALE 3178.0 1064.0 2800.0 1568.0 1624.0 2046.8
2 HOCKLEY 2459.0 2520.0 2489.5
2 LAMB 3275.0 1792.0 2520.0 2128.0 1848.0 2312.6
2 LUBBOCK 1950.0 1344.0 2016.0 2240.0 1624.0 1834.8
2 LYNN 1848.0 1792.0 2016.0 1456.0 1778.0
2 MITCHELL 1429.0 1429.0
2 PARMER 2973.0 1400.0 2072.0 2016.0 1960.0 2084.2
2 SCURRY 2520.0 2520.0
2 SWISHER 2664.0 1008.0 2240.0 1970.7
2 TERRY 2170.0 896.0 2240.0 1176.0 1620.5
2 YOAKUM 2464.0 1680.0 1120.0 1754.7
Page 85
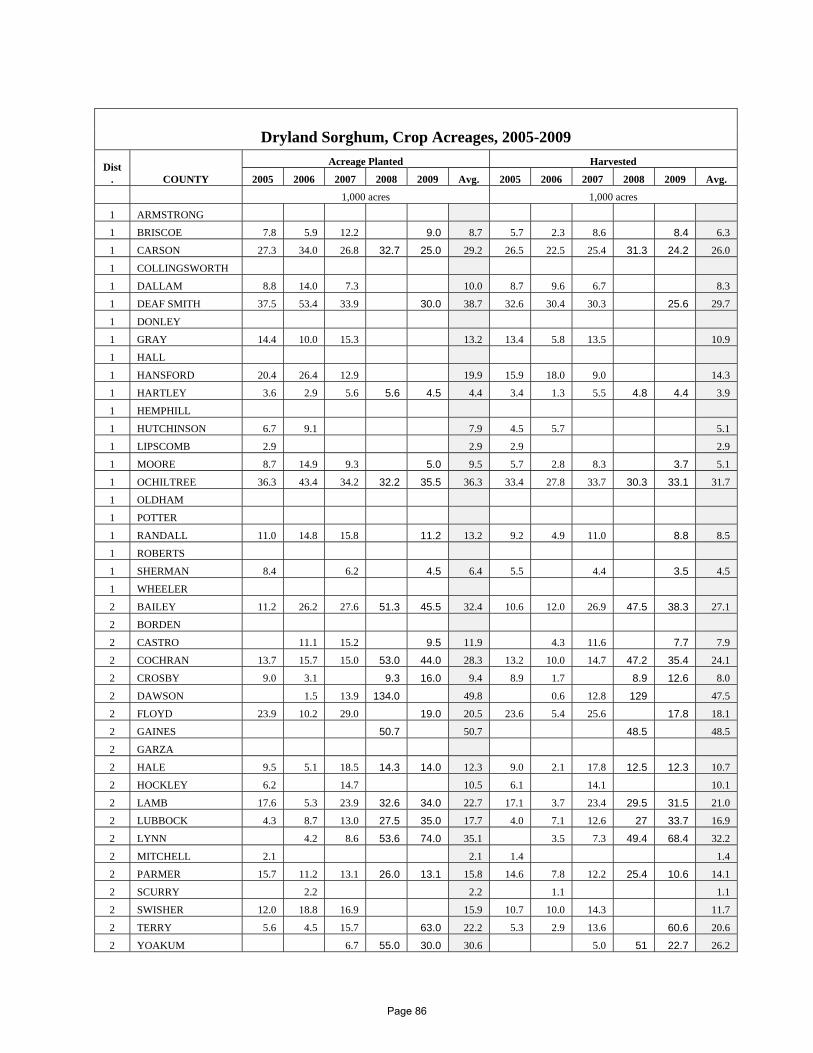
Dryland Sorghum, Crop Acreages, 2005-2009
Dist. COUNTY
Acreage Planted Harvested
2005 2006 2007 2008 2009 Avg. 2005 2006 2007 2008 2009 Avg.
1,000 acres 1,000 acres
1 ARMSTRONG
1 BRISCOE 7.8 5.9 12.2 9.0 8.7 5.7 2.3 8.6 8.4 6.3
1 CARSON 27.3 34.0 26.8 32.7 25.0 29.2 26.5 22.5 25.4 31.3 24.2 26.0
1 COLLINGSWORTH
1 DALLAM 8.8 14.0 7.3 10.0 8.7 9.6 6.7 8.3
1 DEAF SMITH 37.5 53.4 33.9 30.0 38.7 32.6 30.4 30.3 25.6 29.7
1 DONLEY
1 GRAY 14.4 10.0 15.3 13.2 13.4 5.8 13.5 10.9
1 HALL
1 HANSFORD 20.4 26.4 12.9 19.9 15.9 18.0 9.0 14.3
1 HARTLEY 3.6 2.9 5.6 5.6 4.5 4.4 3.4 1.3 5.5 4.8 4.4 3.9
1 HEMPHILL
1 HUTCHINSON 6.7 9.1 7.9 4.5 5.7 5.1
1 LIPSCOMB 2.9 2.9 2.9 2.9
1 MOORE 8.7 14.9 9.3 5.0 9.5 5.7 2.8 8.3 3.7 5.1
1 OCHILTREE 36.3 43.4 34.2 32.2 35.5 36.3 33.4 27.8 33.7 30.3 33.1 31.7
1 OLDHAM
1 POTTER
1 RANDALL 11.0 14.8 15.8 11.2 13.2 9.2 4.9 11.0 8.8 8.5
1 ROBERTS
1 SHERMAN 8.4 6.2 4.5 6.4 5.5 4.4 3.5 4.5
1 WHEELER
2 BAILEY 11.2 26.2 27.6 51.3 45.5 32.4 10.6 12.0 26.9 47.5 38.3 27.1
2 BORDEN
2 CASTRO 11.1 15.2 9.5 11.9 4.3 11.6 7.7 7.9
2 COCHRAN 13.7 15.7 15.0 53.0 44.0 28.3 13.2 10.0 14.7 47.2 35.4 24.1
2 CROSBY 9.0 3.1 9.3 16.0 9.4 8.9 1.7 8.9 12.6 8.0
2 DAWSON 1.5 13.9 134.0 49.8 0.6 12.8 129 47.5
2 FLOYD 23.9 10.2 29.0 19.0 20.5 23.6 5.4 25.6 17.8 18.1
2 GAINES 50.7 50.7 48.5 48.5
2 GARZA
2 HALE 9.5 5.1 18.5 14.3 14.0 12.3 9.0 2.1 17.8 12.5 12.3 10.7
2 HOCKLEY 6.2 14.7 10.5 6.1 14.1 10.1
2 LAMB 17.6 5.3 23.9 32.6 34.0 22.7 17.1 3.7 23.4 29.5 31.5 21.0
2 LUBBOCK 4.3 8.7 13.0 27.5 35.0 17.7 4.0 7.1 12.6 27 33.7 16.9
2 LYNN 4.2 8.6 53.6 74.0 35.1 3.5 7.3 49.4 68.4 32.2
2 MITCHELL 2.1 2.1 1.4 1.4
2 PARMER 15.7 11.2 13.1 26.0 13.1 15.8 14.6 7.8 12.2 25.4 10.6 14.1
2 SCURRY 2.2 2.2 1.1 1.1
2 SWISHER 12.0 18.8 16.9 15.9 10.7 10.0 14.3 11.7
2 TERRY 5.6 4.5 15.7 63.0 22.2 5.3 2.9 13.6 60.6 20.6
2 YOAKUM 6.7 55.0 30.0 30.6 5.0 51 22.7 26.2
Page 86

Irrigated Wheat, Yields Per Harvested Acreage, 2005-2009 2005 2006 2007 2008 2009 Average
DIST. COUNTY Bushels
1 ARMSTRONG 27.3 24 44 31.8
1 BRISCOE 43.5 30 39 30 35.6
1 CARSON 40 30 50 28 37 37.0
1 COLLINGSWORTH 37.6 22 37 53 37.4
1 DALLAM 61.3 39 62 44 51.6
1 DEAF SMITH 46.9 36 58 40 35 43.2
1 DONLEY 38.9 21 39 33.0
1 GRAY 37.3 24 56 33 37.6
1 HALL 45 45.0
1 HANSFORD 43.8 22 56 39 44 41.0
1 HARTLEY 56.8 28 68 51 46 50.0
1 HEMPHILL
1 HUTCHINSON 54.4 35 75 44 45 50.7
1 LIPSCOMB 42.7 43 54 50 47.4
1 MOORE 57.3 33 64 43 42 47.9
1 OCHILTREE 53.9 34 62 51 46 49.4
1 OLDHAM 32.5 44 38.3
1 POTTER 41 20 47 42 37.5
1 RANDALL 30 35 62 29 25 36.2
1 ROBERTS 44.7 58 44 28 43.7
1 SHERMAN 50.7 36 61 50 52 49.9
1 WHEELER 42.9 16 28 45 34 33.2
2 BAILEY 34.2 35 41 36.7
2 BORDEN
2 CASTRO 47.1 50 56 53 56 52.4
2 COCHRAN 31.6 24 27.8
2 CROSBY 30 41 35 22 32.0
2 DAWSON 38.7 43 48 50 44.9
2 FLOYD 44.5 40 46 43.5
2 GAINES 34.8 23 46 33.5 34.3
2 GARZA
2 HALE 35.4 38 52 53.5 44.7
2 HOCKLEY 33 50 30 47 40.0
2 LAMB 48.2 63 66 45 55.6
2 LUBBOCK 28.9 17 42 34 29 30.2
2 LYNN 44 52 31 42.3
2 MITCHELL 35.7 21 30 28.9
2 PARMER 62.4 36 61 41 37 47.5
2 SCURRY
2 SWISHER 41.3 27 64 39 26 39.5
2 TERRY 29.4 31 35 38.5 33.5
2 YOAKUM 31 27 46 48 38.0
Page 87

Irrigated Wheat, Crop Acreages, 2005-2009
Dist. COUNTY
Acreage Planted Harvested
2005 2006 2007 2008 2009 Avg. 2005 2006 2007 2008 2009 Avg.
1,000 acres 1,000 acres
1 ARMSTRONG 3.0 2.2 2.1 2.4 2.2 0.9 1.8 1.6
1 BRISCOE 4.7 3.3 4.5 4.5 4.3 1.7 2.0 2.7 3.6 2.5
1 CARSON 11.0 7.6 10.8 15.7 13 11.6 8.0 3.0 9.2 12.5 12 8.9
1 COLLINGSWORTH 2.8 1.3 3.6 9.2 4.2 1.7 1.0 2.5 7.2 3.1
1 DALLAM 82.0 83.7 76.4 91.2 83.3 62.0 50.0 68.1 80.6 65.2
1 DEAF SMITH 57.0 59.4 71.0 74 72 66.7 32.0 28.0 52.2 43.8 41.9 39.6
1 DONLEY 3.6 1.5 3.8 3.0 2.7 0.8 2.8 2.1
1 GRAY 7.1 4.6 6.3 6.7 6.2 5.9 2.3 4.7 5.6 4.6
1 HALL 1.5 1.5 1 1.0
1 HANSFORD 79.0 68.2 74.2 69.5 62 70.6 69.0 40.7 56.9 50.5 60.1 55.4
1 HARTLEY 55.0 61.8 63.9 65.1 57 60.6 45.0 30.5 42.1 45.1 45.5 41.6
1 HEMPHILL 1.0 1.0
1 HUTCHINSON 16.0 10.5 13.2 18.3 19.7 15.5 9.0 6.7 9.7 12.8 17.4 11.1
1 LIPSCOMB 8.5 6.5 7.7 5.2 7.0 4.1 4.6 3.6 4.7 4.3
1 MOORE 37.0 23.6 42.0 51.1 36 37.9 31.0 14.1 28.6 42.6 32.1 29.7
1 OCHILTREE 25.0 22.8 25.0 28 23.2 24.8 23.0 14.5 22.5 24.6 21 21.1
1 OLDHAM 1.3 1.9 1.6 0.8 1.8 1.3
1 POTTER 1.5 1.1 1.9 2.2 1.7 1.0 0.4 0.6 1 0.8
1 RANDALL 10.5 7.9 9.2 13.2 9 10.0 6.0 4.1 7.5 11.2 6.3 7.0
1 ROBERTS 2.9 1.8 1.3 2.3 2.1 1.9 0.5 0.9 1.6 1.2
1 SHERMAN 77.0 58.2 69.3 73.8 62 68.1 61.0 27.0 51.3 65.7 59.3 52.9
1 WHEELER 1.4 1.7 1.1 1.2 1.7 1.4 0.7 0.8 0.9 0.9 1.1 0.9
2 BAILEY 32.0 34.5 39.7 35.4 5.0 6.2 13.1 8.1
2 BORDEN
2 CASTRO 80.0 81.7 79.0 84.6 82 81.5 34.0 38.0 44.6 49.9 54.2 44.1
2 COCHRAN 4.4 6.4 5.4 1.9 2.7 2.3
2 CROSBY 1.6 2.0 6.7 6.4 4.2 0.4 1.6 5.2 3.2 2.6
2 DAWSON 8.7 6.4 10.0 22.3 11.9 3.1 0.4 4.6 7.7 4.0
2 FLOYD 10.5 7.0 13.1 10.2 6.4 4.6 10.9 7.3
2 GAINES 56.0 25.2 34.1 63.8 44.8 7.5 3.1 17.5 38.1 16.6
2 GARZA
2 HALE 26.0 24.1 31.4 48.1 32.4 12.0 11.4 18.1 38.9 20.1
2 HOCKLEY 1.9 2.0 2.3 5.4 2.9 0.5 0.4 0.9 2.5 1.1
2 LAMB 23.0 29.5 38.1 49 34.9 5.0 5.8 22.2 24 14.3
2 LUBBOCK 4.6 4.6 4.4 9.6 9.4 6.5 0.9 0.3 2.6 6.7 3.9 2.9
2 LYNN 2.5 2 7.5 4.0 1.1 0.5 3.6 1.7
2 MITCHELL 1.3 1.7 1.2 1.4 0.7 1.1 0.4 0.7
2 PARMER 79.0 85.2 81.6 83.5 68 79.5 50.0 33.2 43.9 61.1 37.9 45.2
2 SCURRY
2 SWISHER 26.0 25.2 28.6 30.5 30.6 28.2 16.0 9.9 18.4 26.9 19.5 18.1
2 TERRY 11.0 26.8 34.0 47.6 29.9 8.0 8.5 14.6 33.9 16.3
2 YOAKUM 29.0 20.8 25.4 28.3 25.9 8.3 2.2 7.2 22.6 10.1
Page 88

Dryland Wheat Yields Per Harvested Acreage, 2005-2009 2005 2006 2007 2008 2009 Average
DIST. COUNTY
1 ARMSTRONG 23.1 18.0 41.0 27.4
1 BRISCOE 24.0 10.0 32.0 10.0 19.0
1 CARSON 33.3 14.0 45.0 16.0 21.0 25.9
1 COLLINGSWORTH 20.6 5.0 28.0 13.0 16.7
1 DALLAM 24.2 6.0 26.0 8.0 16.1
1 DEAF SMITH 32.6 8.0 35.0 11.5 12.0 19.8
1 DONLEY 24.9 10.0 20.0 18.3
1 GRAY 29.4 9.0 20.0 17.0 18.9
1 HALL 20.0 20.0
1 HANSFORD 24.8 16.0 41.0 10.0 24.0 23.2
1 HARTLEY 34.8 10.0 29.0 11.0 18.0 20.6
1 HEMPHILL 25.5 25.5
1 HUTCHINSON 24.9 15.0 39.0 8.0 19.0 21.2
1 LIPSCOMB 26.5 19.0 32.0 19.0 24.1
1 MOORE 23.3 6.0 41.0 16.0 16.0 20.5
1 OCHILTREE 33.7 18.0 47.0 19.0 28.0 29.1
1 OLDHAM 27.3 9.0 18.2
1 POTTER 27.9 19.0 31.0 12.0 22.5
1 RANDALL 22.3 11.0 37.0 9.0 11.0 18.1
1 ROBERTS 20.0 9.0 15.0 17.0 15.3
1 SHERMAN 22.7 9.0 34.0 17.0 17.0 19.9
1 WHEELER 22.2 10.0 26.0 19.0 15.0 18.4
2 BAILEY 22.5 13.0 29.0 21.5
2 BORDEN 27.3 27.3
2 CASTRO 38.9 6.0 36.0 18.0 9.0 21.6
2 COCHRAN 16.7 5.0 10.9
2 CROSBY 22.8 6.0 11.0 9.0 12.2
2 DAWSON 15.3 13.0 27.0 18.4
2 FLOYD 22.4 11.0 35.0 12.0 20.1
2 GAINES 17.6 17.0 22.0 14.0 17.7
2 GARZA 15.5 15.5
2 HALE 26.3 17.0 40.0 15.0 15.0 22.7
2 HOCKLEY 24.7 16.0 30.0 19.0 22.4
2 LAMB 35.9 14.0 40.0 7.0 24.2
2 LUBBOCK 19.2 10.0 33.0 13.0 11.0 17.2
2 LYNN 30.0 11.0 18.0 19.7
2 MITCHELL 17.7 15.0 14.0 15.6
2 PARMER 34.4 14.0 38.0 14.0 14.0 22.9
2 SCURRY
2 SWISHER 29.4 13.0 40.0 13.0 9.0 20.9
2 TERRY 20.0 18.0 22.0 17.5 19.4
2 YOAKUM 17.5 18.0 45.0 14.5 23.8
Page 89

Dryland Wheat Crop Acreages, 2005-2009,
Dist COUNTY
Acreage Planted Harvested
2005 2006 2007 2008 2009 Avg. 2005 2006 2007 2008 2009 Avg.
1,000 acres 1,000 acres
1 ARMSTRONG 50.0 52.5 65.6 56.0 32.0 23.1 46.1 33.7
1 BRISCOE 34.0 30.3 43.0 42 37.3 12.5 7.0 26.0 8.6 13.5
1 CARSON 76.0 72.8 90.7 71.8 75.0 77.3 72.0 18.4 77.9 44.6 57.2 54.0
1 COLLINGSWORTH 38.0 30.4 38.6 42 37.3 16.5 2.4 15.9 19.7 13.6
1 DALLAM 47.0 38.7 36.4 36.8 39.7 32.0 8.5 34.0 13.1 21.9
1 DEAF SMITH 137.0 121.3 178.2 125.0 145.0 141.3 102.0 13.7 139.7 36.7 51.2 68.7
1 DONLEY 11.5 9.5 10.7 10.6 4.1 0.3 6.5 3.6
1 GRAY 40.0 33.2 39.9 41.0 38.5 25.0 6.5 31.6 29.7 23.2
1 HALL 26.7 26.7 8 8.0
1 HANSFORD 144.0 154.8 160.2 144.0 154.0 151.4 114.0 13.7 137.2 38.1 131.3 86.9
1 HARTLEY 39.0 26.8 31.5 27.4 28.0 30.5 31.0 9.8 28.7 10.9 18.5 19.8
1 HEMPHILL 15.5 15.5 5.5 5.5
1 HUTCHINSON 58.0 60.5 64.3 56.7 61.0 60.1 39.0 8.7 54.2 18.6 46.9 33.5
1 LIPSCOMB 27.0 27.0 23.5 19.1 24.2 20.0 20.0 14.5 12.3 16.7
1 MOORE 68.0 80.7 92.6 76.4 77.0 78.9 61.0 2.6 75.4 18.3 56.7 42.8
1 OCHILTREE 153.0 157.5 171.8 154.0 145.0 156.3 145.0 52.0 149.7 127.5 124.3 119.7
1 OLDHAM 39.0 40.3 39.7 30.0 7.9 19.0
1 POTTER 15.0 15.3 16.7 13.2 15.1 12.0 0.9 11.6 2.5 6.8
1 RANDALL 97.0 88.9 100.9 93.3 95.0 95.0 43.0 3.1 81.6 24.7 26.1 35.7
1 ROBERTS 10.5 9.8 6.6 8.4 8.8 7.5 2.6 4.3 4.0 4.6
1 SHERMAN 92.0 85.7 93.8 68.7 80.0 84.0 74.0 7.6 71.3 23.4 60.7 47.4
1 WHEELER 28.0 23.4 21.7 20.9 20.1 22.8 6.0 2.1 10.1 10.2 4.3 6.5
2 BAILEY 31.0 31.1 40.9 34.3 17.5 8.8 19.7 15.3
2 BORDEN 11.0 11.0 2.6 2.6
2 CASTRO 83.0 87.5 101.3 78.4 78.0 85.6 40.0 13.8 54.3 11.9 9.0 25.8
2 COCHRAN 16.5 11.8 14.2 6.9 5.4 6.2
2 CROSBY 25.0 21.3 21.9 29.5 24.4 12.0 4.8 8.3 6.1 7.8
2 DAWSON 7.2 5.6 9.9 7.6 1.5 0.3 2.6 1.5
2 FLOYD 72.0 81.8 93.9 85 83.2 27.0 30.4 71.3 39.4 42.0
2 GAINES 17.0 8.9 12.2 10.4 12.1 1.7 0.3 3.9 2.1 2.0
2 GARZA 3.0 3.0 1.0 1.0
2 HALE 31.0 29.5 46.4 34.0 41.0 36.4 13.5 7.7 25.8 9.8 6.4 12.6
2 HOCKLEY 10.5 13.2 18.9 12.7 13.8 1.9 0.9 5.7 1.7 2.6
2 LAMB 29.0 27.0 35.1 27.6 29.7 13.0 5.8 17.2 2.3 9.6
2 LUBBOCK 19.0 15.5 27.9 23.5 22.0 21.6 2.5 0.2 8.9 5.5 4.1 4.2
2 LYNN 10.1 4.5 27.3 14.0 4.0 1.1 12.3 5.8
2 MITCHELL 26.0 26.8 34.7 29.2 2.2 0.2 9.9 4.1
2 PARMER 108.0 102.5 115.9 101.0 115.0 108.5 86.0 14.9 88.3 18.5 12.5 44.0
2 SCURRY
2 SWISHER 131.0 138.0 147.6 127.0 123.0 133.3 66.0 8.0 79.7 25.1 14.0 38.6
2 TERRY 13.5 16.2 21.6 15.3 16.7 1.0 1.9 12.5 4.7 5.0
2 YOAKUM 20.0 10.0 9.4 7.3 11.7 2.4 1.8 1.9 0.9 1.8
Page 90

Irrigated Soybean Crop Yields Per Harvested Acreage, 2005-2009 2005 2006 2007 2008 2009 Average
DIST. COUNTY Bushels
1 OCHILTREE 52 52
2 LAMB 60 60
Irrigated Soybean Crop Acreages, 2005-2009,
Dist. COUNTY
Acreage Planted Harvested
2005 2006 2007 2008 2009 Avg. 2005 2006 2007 2008 2009 Avg.
1,000 acres 1,000 acres
1 OCHILTREE 2.1 2.1 2.1 2.1
2 LAMB 1.5 1.5 1.5 1.5
Page 91

Irrigated Peanut Yields Per Harvested Acre, 2005-2009 2005 2006 2007 2008 2009 Average
DIST. COUNTY Pounds
1 COLLINGSWORTH 3840 3470 3350 3553.3
1 WHEELER 2860 2860.0
2 BAILEY 2950 3000 2975.0
2 DAWSON 4060 4060.0
2 GAINES 4600 4600.0
2 YOAKUM 4040 4040.0
Irrigated Peanuts, Crop Acreages, 2005-2009
Dist. COUNTY
Acreage Planted Harvested
2005 2006 2007 2008 2009 Avg. 2005 2006 2007 2008 2009 Avg.
1,000 acres 1,000 acres
1 COLLINGSWORTH 12.6 6.9 10.8 10.1 12.6 6.8 10.8 10.1
1 WHEELER 201.0 201.
0 2.1 2.1
2 BAILEY 2.9 3.0 3.0 2.9 3.0 3.0
2 DAWSON 9.3 9.3 9.3 9.3
2 GAINES 65.3 65.3 65.2 65.2
2 YOAKUM 25.7 25.7 25.2 25.2
Dryland Peanuts, Yields Per Harvested Acre, 2005-2009 2005 2006 2007 2008 2009 Average
DIST. COUNTY Pounds
1 COLLINGSWORTH 1260 750 1800 1270
1 WHEELER 1020 1020
Dryland Peanuts, Crop Acreages, 2005-2009
Dist. COUNTY
Acreage Planted Harvested
2005 2006 2007 2008 2009 Avg. 2005 2006 2007 2008 2009 Avg.
1,000 acres 1,000 acres
1 COLLINGSWORTH 13.5 6.6 6.5 8.9 11.9 4.9 6.2 7.7
1 WHEELER 1.3 1.3 1.1 1.1
Page 92

Agriculture and Natural Resources • Family and Consumer Sciences • 4-H and Youth Development • Community Development ___________________________________________________________________________________
Educational programs of the Texas AgriLife Extension Service are open to all people without regard to race, color, sex, disability, religion, age, or national origin.
The Texas A&M University System, U.S. Department of Agriculture, and the County Commissioners Courts of Texas Cooperating.
A member of the Texas A&M University System and its statewide Agriculture Program