2011 gr8 places 2 works
TRANSCRIPT

8/4/2019 2011 Gr8 Places 2 Works
http://slidepdf.com/reader/full/2011-gr8-places-2-works 1/45
The Economic Times &
Great Place to Work® Institute India
Presents
‘India’s Best Companies to Work For’ – 2011 Study
Thursday, 23rd June, 2011 - Mumbai

8/4/2019 2011 Gr8 Places 2 Works
http://slidepdf.com/reader/full/2011-gr8-places-2-works 2/45
Welcome to the World’s Largest Study onWorkplace Culture
45 Countries, 5500 Companies, >2.5 Million Employees

8/4/2019 2011 Gr8 Places 2 Works
http://slidepdf.com/reader/full/2011-gr8-places-2-works 3/45
And the Largest Study in India
No. of Registrations: 471
No. of Employees Participating: Over 66,000

8/4/2019 2011 Gr8 Places 2 Works
http://slidepdf.com/reader/full/2011-gr8-places-2-works 4/45
Presenting “India’s Best Companies to WorkFor” – 2011

8/4/2019 2011 Gr8 Places 2 Works
http://slidepdf.com/reader/full/2011-gr8-places-2-works 5/45
What is a Great Place to Work®?
Employee
...have pride in what
you do...
Job
...and enjoy the people you
work with
Other Employees
Trust the people you
work for...
Management
Relationships are the key…..

8/4/2019 2011 Gr8 Places 2 Works
http://slidepdf.com/reader/full/2011-gr8-places-2-works 6/45
Essential elements of a Great Place to Work®
Individuality is valued
Welcoming Atmosphere
Part of something larger
Two way CommunicationManager’s Competence
Integrity – Reliability of Management
Professional Support
Collaboration
Demonstrated Caring
For the Job
About my TeamWith the Organization
Equity
Impartiality
Justice
T
R
U
S
T
Credibility
Respect
Pride
Fairness
Camaraderie

8/4/2019 2011 Gr8 Places 2 Works
http://slidepdf.com/reader/full/2011-gr8-places-2-works 7/45
It is not possible to be a Best Workplacewithout your employees endorsing you
TRUST INDEX (2/3rd WEIGHTAGE)
• Captures Employee Responses through 60 statements
• Contains two open-ended questions on areas of strength and
areas of improvement.
CULTURE AUDIT (1/3rd WEIGHTAGE)
• Through a questionnaire on practices and policies at the
workplace – management’s response.
• Has two parts
• Quantitative and qualitative data

8/4/2019 2011 Gr8 Places 2 Works
http://slidepdf.com/reader/full/2011-gr8-places-2-works 8/45
Two Lenses
Trust Index©
What Employees Feel:
Culture Audit©
What management does:
Credibility
Respect
Pride
Fairness
Camaraderie
T
R U
S
T

8/4/2019 2011 Gr8 Places 2 Works
http://slidepdf.com/reader/full/2011-gr8-places-2-works 9/45
KEY STATISTICS OF2011 STUDY
A

8/4/2019 2011 Gr8 Places 2 Works
http://slidepdf.com/reader/full/2011-gr8-places-2-works 10/45
Employee perceptions have marginallyimproved from 2010 but are still below 2009
8582
72
55
8381
71
53
8784
76
62
50
60
70
80
90
100
India Top 25 India Top 50 All Companies Bottom 25
Study 2011 Study 2010 Study 2009
Score mentioned are the Grand Mean scores which is average of all the statements in the core surveyScore indicates percentage of survey respondents giving positive response to the survey statements

8/4/2019 2011 Gr8 Places 2 Works
http://slidepdf.com/reader/full/2011-gr8-places-2-works 11/45
Participating companies come from 20Industries
8/4/2019 2011 Gr8 Places 2 Works
http://slidepdf.com/reader/full/2011-gr8-places-2-works 12/45
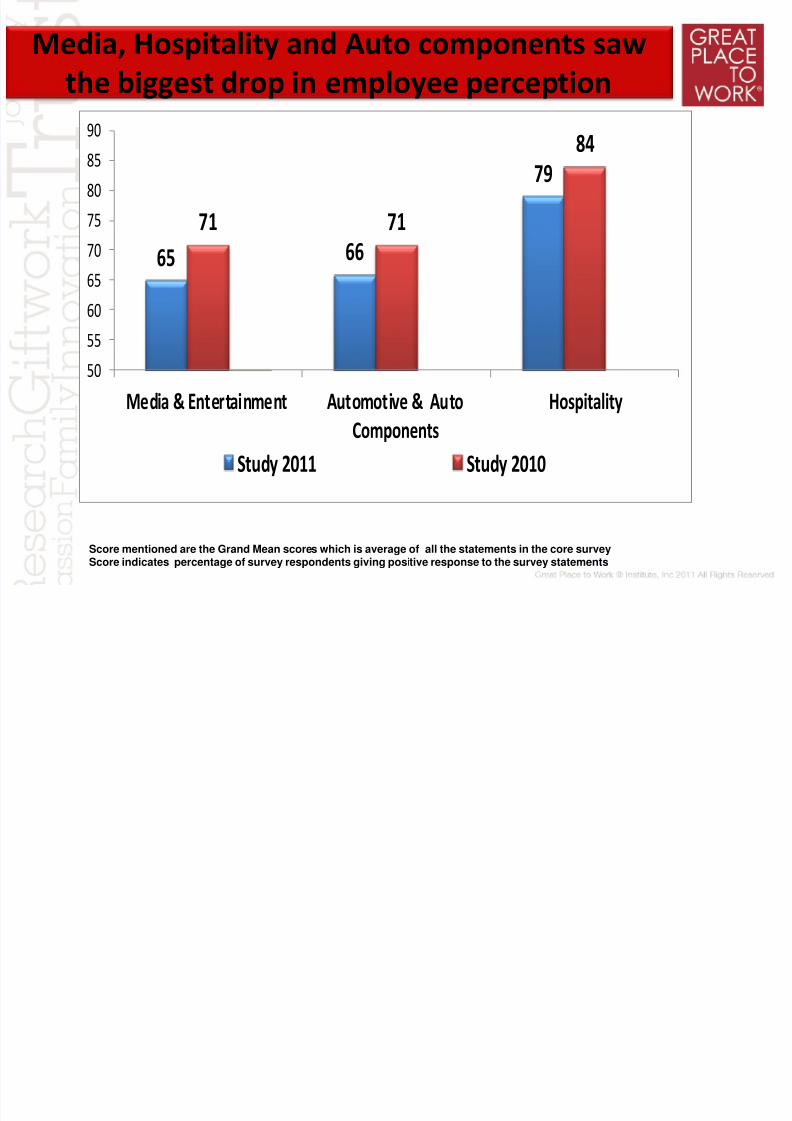
Media, Hospitality and Auto components saw
the biggest drop in employee perception
65 66
79
71 71
84
50
55
60
65
70
75
80
8590
Media & Entertainment Automotive & AutoComponents Hospitality
Study 2011 Study 2010
Score mentioned are the Grand Mean scores which is average of all the statements in the core surveyScore indicates percentage of survey respondents giving positive response to the survey statements
8/4/2019 2011 Gr8 Places 2 Works
http://slidepdf.com/reader/full/2011-gr8-places-2-works 13/45
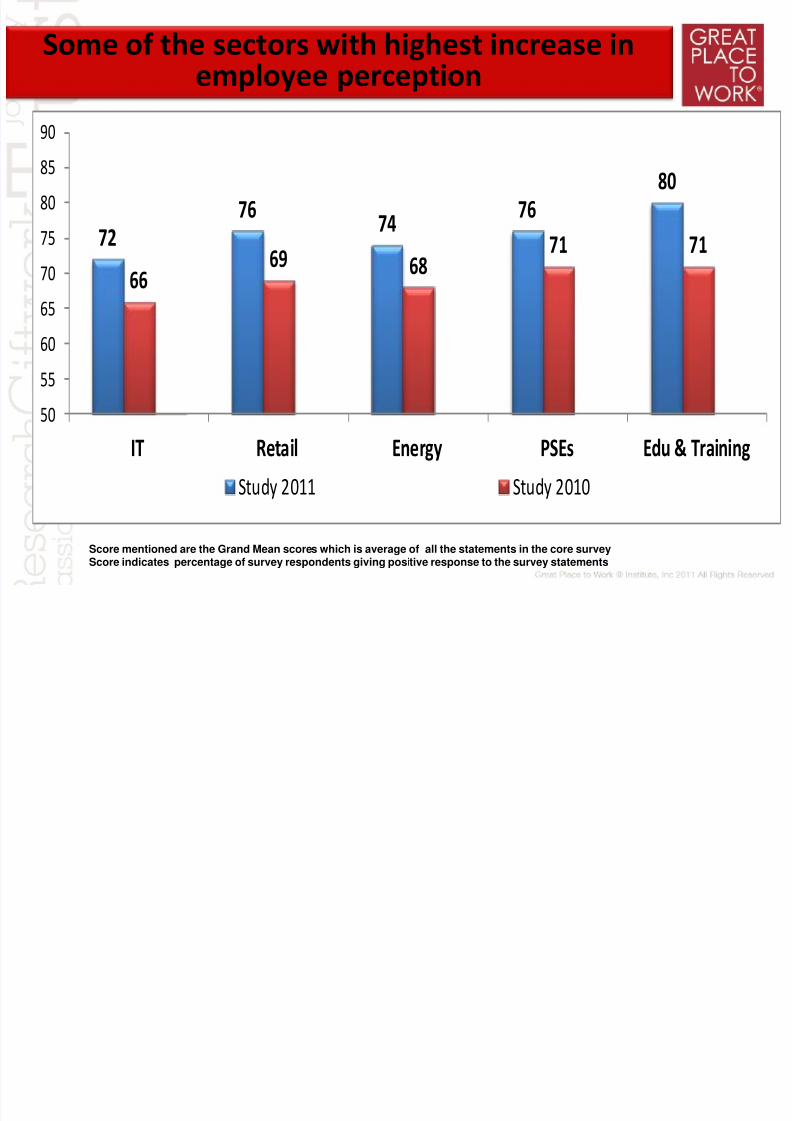
Some of the sectors with highest increase inemployee perception
72
7674
76
80
6669
68
71 71
50
55
60
65
70
75
80
8590
IT Retail Energy PSEs Edu & Training
Study 2011 Study 2010
Score mentioned are the Grand Mean scores which is average of all the statements in the core surveyScore indicates percentage of survey respondents giving positive response to the survey statements
8/4/2019 2011 Gr8 Places 2 Works
http://slidepdf.com/reader/full/2011-gr8-places-2-works 14/45
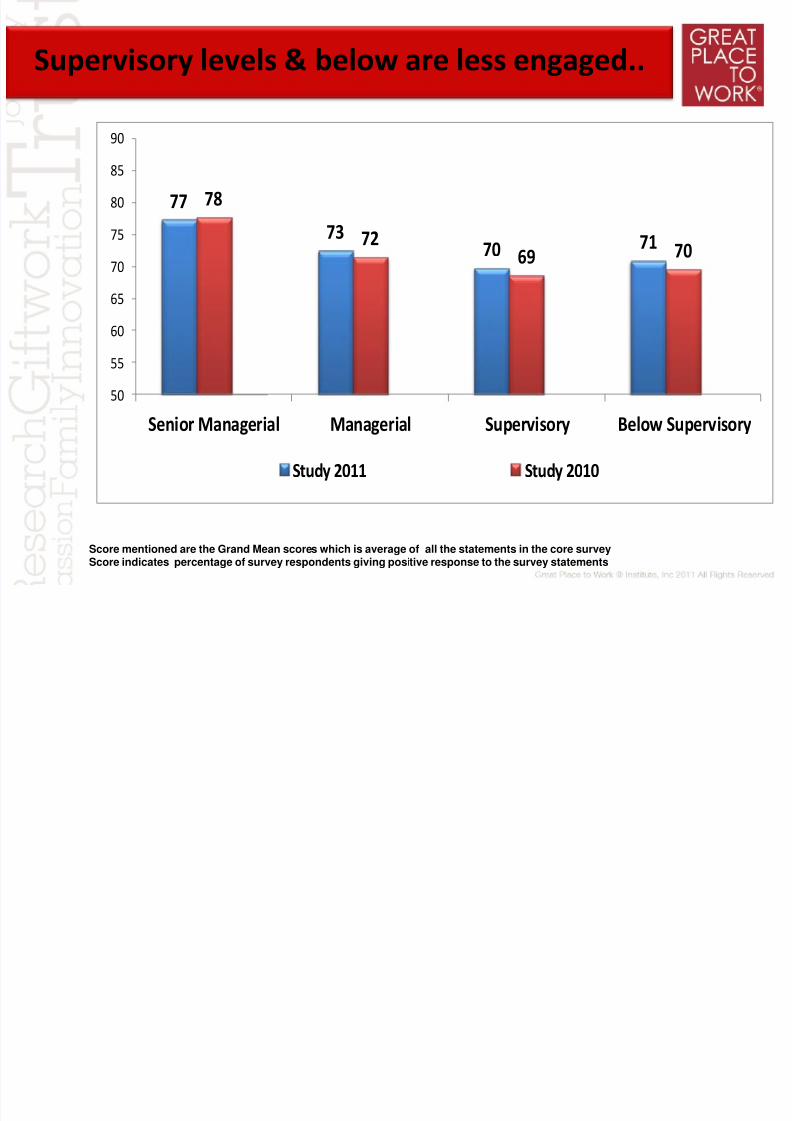
Supervisory levels & below are less engaged..
77
7370 71
78
7269 70
50
55
60
65
70
75
80
85
90
Senior Managerial Managerial Supervisory Below Supervisory
Study 2011 Study 2010
Score mentioned are the Grand Mean scores which is average of all the statements in the core surveyScore indicates percentage of survey respondents giving positive response to the survey statements

8/4/2019 2011 Gr8 Places 2 Works
http://slidepdf.com/reader/full/2011-gr8-places-2-works 15/45
as are employees with 3 – 5 years tenure ..
77
7169
7275 75
7877
7068
74 7476 77
50
55
60
6570
75
80
85
90
Less than 6months
6 months to2 Years
3 years to 5years
6 years to10 years
11 years to15 years
16 years to20 years
Over 20years
Study 2011 Study 2010
Score mentioned are the Grand Mean scores which is average of all the statements in the core surveyScore indicates percentage of survey respondents giving positive response to the survey statements

8/4/2019 2011 Gr8 Places 2 Works
http://slidepdf.com/reader/full/2011-gr8-places-2-works 16/45
and the young are less engaged
7270
7477 77
7169
7477 78
50
55
60
65
70
75
80
85
90
25 years oryounger
26 years to 34years
35 years to 44years
45 years to 54years
55 years or older
Study 2011 Study 2010
Score mentioned are the Grand Mean scores which is average of all the statements in the core surveyScore indicates percentage of survey respondents giving positive response to the survey statements

8/4/2019 2011 Gr8 Places 2 Works
http://slidepdf.com/reader/full/2011-gr8-places-2-works 17/45
KEY TRENDS IN BESTWORKPLACES
A

8/4/2019 2011 Gr8 Places 2 Works
http://slidepdf.com/reader/full/2011-gr8-places-2-works 18/45
Corporate India’s workforce is predominantlyyoung ..
23%
50%
19%
6%2%
0%
20%
40%
60%
25 years or
younger
26 years to 34
years
35 years to 44
years
45 years to 54
years
55 years or
older
Study 2011
Score mentioned are the Grand Mean scores which is average of all the statements in the core surveyScore indicates percentage of survey respondents giving positive response to the survey statements
Note: Data based on classification of survey respondents to a random sample

8/4/2019 2011 Gr8 Places 2 Works
http://slidepdf.com/reader/full/2011-gr8-places-2-works 19/45
12
3631
11
4 2 4
0
20
40
Less than 6months
6 monthsto 2 Years
3 years to5 years
6 years to10 years
11 years to15 years
16 years to20 years
Over 20years
All Companies 2011
Over 75 percent of employees in Corporate Indiais less than 5 years in their organization ..
Score mentioned are the Grand Mean scores which is average of all the statements in the core surveyScore indicates percentage of survey respondents giving positive response to the survey statements
Note: Data based on classification of survey respondents to a random sample

8/4/2019 2011 Gr8 Places 2 Works
http://slidepdf.com/reader/full/2011-gr8-places-2-works 20/45
12
3631
11
4 2 4
11
3230
11
5 48
0
20
40
Less than6 months
6 monthsto 2 Years
3 years to5 years
6 years to10 years
11 years to15 years
16 years to20 years
Over 20years
All Companies 2011 Top 50 2011
but the percentage of tenured employees withmore than 15 years is double in Top 50
Score mentioned are the Grand Mean scores which is average of all the statements in the core surveyScore indicates percentage of survey respondents giving positive response to the survey statements
Note: Data based on classification of survey respondents to a random sample

8/4/2019 2011 Gr8 Places 2 Works
http://slidepdf.com/reader/full/2011-gr8-places-2-works 21/45
It takes time and sustained efforts to be a BestWorkplace
*Source – Best Companies to Work For – 2011 study

8/4/2019 2011 Gr8 Places 2 Works
http://slidepdf.com/reader/full/2011-gr8-places-2-works 22/45
Both small and large organizations can beGreat Workplaces
9988
8072 71
3625
2
5
512
7
9
10
Less than 250 250-500 501-1000 1001-2000 2001-5000 5001-10000 Above 1000
Total Companies Top 50 Companies
2%
6%
6% 17%
10%
25%
40%
However, large companies have better representation in the Top 50 List
*Source – Best Companies to Work For – 2011 study

8/4/2019 2011 Gr8 Places 2 Works
http://slidepdf.com/reader/full/2011-gr8-places-2-works 23/45
Voluntary Turnover in India Top 50
*Source – Best Companies to Work For – 2011 study
18%
6%
14%
14%
13%
21%
13%
19%
21%
17%
0% 5% 10% 15% 20% 25%
Financial Services & Insurance
Manufacturing & Production
Professional Services
Construction & Real Estate
Telecommunications
Overall Industry 2011 India Top 50 2011
Voluntary Turnover: Top 50 Vs. Industry Average

8/4/2019 2011 Gr8 Places 2 Works
http://slidepdf.com/reader/full/2011-gr8-places-2-works 24/45
India & the World
A

8/4/2019 2011 Gr8 Places 2 Works
http://slidepdf.com/reader/full/2011-gr8-places-2-works 25/45
8589
85 86
40
50
60
70
80
90
100
Grand Mean
India Top 25 2011 US Top 25 2011
EU Top 25 2011 Brazil Top 25 2010
The best workplaces in India are comparable tothe best elsewhere
Score mentioned are the Grand Mean scores which is average of all the statements in the core surveyScore indicates percentage of survey respondents giving positive response to the survey statements

8/4/2019 2011 Gr8 Places 2 Works
http://slidepdf.com/reader/full/2011-gr8-places-2-works 26/45
Indeed, India compares favourably in downward
communication and competence of management
89 91
848692
8481
88
7781
89
80
40
50
60
70
80
90
100
Management keeps me
informed about importantissues and changes.
Management is competent at
running the business.
Management does a good job of
assigning and coordinatingpeople.
India Top 25 2011 US Top 25 2011 EU Top 25 2011 Brazil Top 25 2010
Communication Competence

8/4/2019 2011 Gr8 Places 2 Works
http://slidepdf.com/reader/full/2011-gr8-places-2-works 27/45
but significantly lower on some dimensions
7973
8186
81
91
82 80
9087
77
90
40
50
60
70
80
90
100
I can ask management any
reasonable question and get a
straight answer.
People avoid politicking and
backstabbing as ways to get
things done.
When people change jobs or
work units, they are made to
feel right at home.
India Top 25 2011 US Top 25 2011 EU Top 25 2011 Brazil Top 25 2010

8/4/2019 2011 Gr8 Places 2 Works
http://slidepdf.com/reader/full/2011-gr8-places-2-works 28/45
Key Findings of Study 2011
A

8/4/2019 2011 Gr8 Places 2 Works
http://slidepdf.com/reader/full/2011-gr8-places-2-works 29/45
Work life balance & Flexibility have improved the most over
last 8 years in the best workplaces
8085
8184
67
74
40
50
60
70
80
90
100
People are encouraged to balance their
work life and their personal life.
I am able to take time off from
work when I think it's necessary.
Top 25 India-2011 Top 25 India-2010 Top 25 India - 2004

8/4/2019 2011 Gr8 Places 2 Works
http://slidepdf.com/reader/full/2011-gr8-places-2-works 30/45
Many more employees at the best workplaces now agree
that they have “Special and Unique” benefits
8178
69
40
50
60
70
80
90
100
We have special and unique benefits here.
Top 25 India-2011 Top 25 India-2010 Top 25 India - 2004

8/4/2019 2011 Gr8 Places 2 Works
http://slidepdf.com/reader/full/2011-gr8-places-2-works 31/45
The Top 25 score over the rest is in perception about equity
related to fair pay and share of profits
76 747370
61
5458
51
40
50
60
70
80
90
100
People here are paid fairly for
the work they do.
I feel I receive a fair share of the profits
made by this organization.
Top 25 2011 Top 25 2010 All Companies 2011 All Companies 2010
Fairness – Equity
Equity

8/4/2019 2011 Gr8 Places 2 Works
http://slidepdf.com/reader/full/2011-gr8-places-2-works 32/45
Their employees perceive them to be doing a better job of
attracting talent..
83 81
68 67
40
50
60
70
80
90
100
Management does a good job of attracting talent for key positions
Top 25 2011 Top 25 2010 All Companies 2011 All Companies 2010

8/4/2019 2011 Gr8 Places 2 Works
http://slidepdf.com/reader/full/2011-gr8-places-2-works 33/45
And they do a relatively better job of creating an impartial
workplace
69
73
6670
5457
5255
40
50
60
70
80
90
100
Managers avoid playing favourites. People avoid politicking andbackstabbing as ways to get things
done.
Top 25 2011 Top 25 2010 All Companies 2011 All Companies 2010
Fairness - Impartiality
Impartiality

8/4/2019 2011 Gr8 Places 2 Works
http://slidepdf.com/reader/full/2011-gr8-places-2-works 34/45
and they are fun places to work too!
83 81
66 65
40
50
60
70
80
90
100
This is a fun place to work.
Top 25 2011 Top 25 2010 All Companies 2011 All Companies 2010

8/4/2019 2011 Gr8 Places 2 Works
http://slidepdf.com/reader/full/2011-gr8-places-2-works 35/45
Key Findings of Study 2011
What to focus on to become
a “great workplace?”
A

8/4/2019 2011 Gr8 Places 2 Works
http://slidepdf.com/reader/full/2011-gr8-places-2-works 36/45
Differentiating Statements!?
What are “Differentiating Statements?” What is their
significance?
Differentiating Statements are derived comparing The Top 25Best Workplaces with the Average or Bottom 25 Workplaces
Average Positive Scores across all the 59 statements.
These statements represent issues or aspects that are difficultto do very well consistently. They are a “tough ask.”

8/4/2019 2011 Gr8 Places 2 Works
http://slidepdf.com/reader/full/2011-gr8-places-2-works 37/45
What makes the Best Workplaces difficult toreplicate?
1. Equity - Fair share of profits/ Special & Unique
Benefits & Fair pay 2. Reliability- Management’s actions match their words
/ Management delivers on promises 3. Impartiality - People avoid politicking/ favouritism 4. Camaraderie- Fun place to work / when people
change work units they are made to feel welcome

8/4/2019 2011 Gr8 Places 2 Works
http://slidepdf.com/reader/full/2011-gr8-places-2-works 38/45
Key drivers of employee perception
1. Management does a good job of attracting talent forkey positions
2. I am treated as a full member here regardless of my
position 3. This is a fun place to work / friendly place to work
4. Management shows a sincere interest in me as a
person, not just an employee
5. There is a “family” or “team” feeling here

8/4/2019 2011 Gr8 Places 2 Works
http://slidepdf.com/reader/full/2011-gr8-places-2-works 39/45
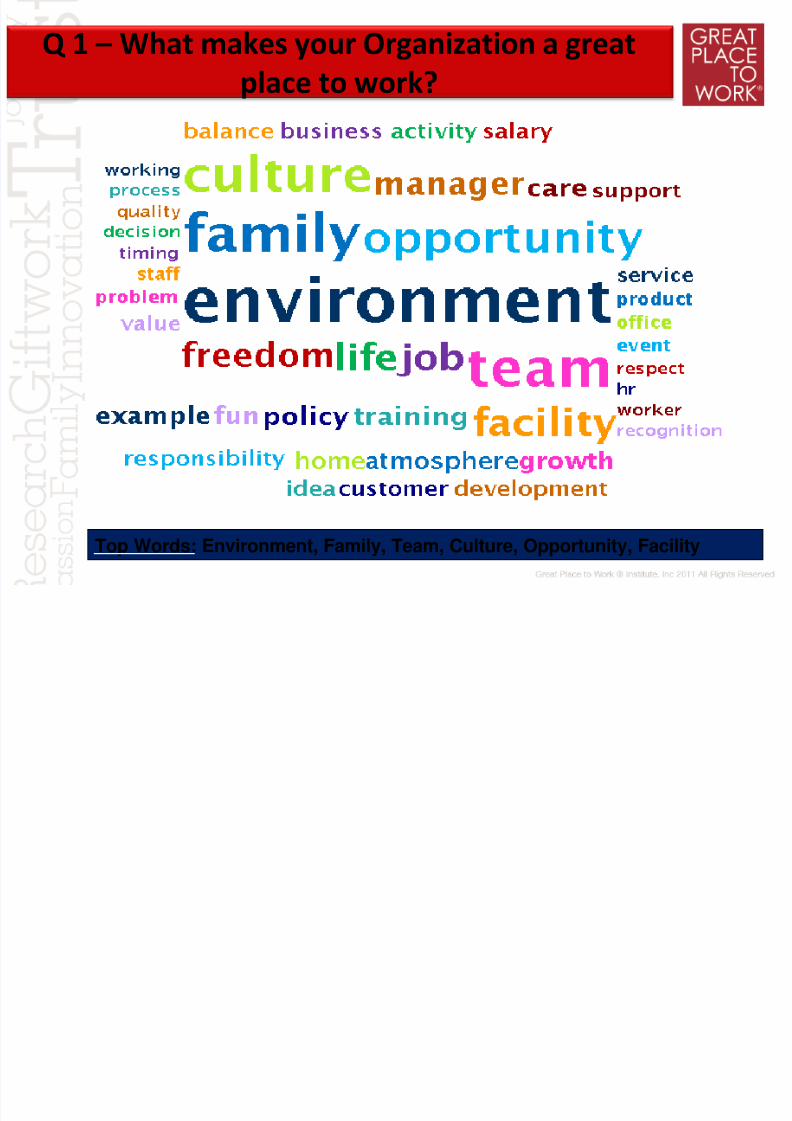
Employee Comments Analysis
Analysis of unstructured employee comments using softwarebased on Artificial Intelligence principles.
BUZZ ANALYSISDetermination and depiction of most frequently used words inemployee comments. (Can be done for any demographic). The bigger thesize, more frequent is the usage of the word
SENTIMENT ANALYSIS
Determines the sentiment expressed in the comments and keeps countand calculates percentages (Positive, Neutral and Negative).
8/4/2019 2011 Gr8 Places 2 Works
http://slidepdf.com/reader/full/2011-gr8-places-2-works 40/45
Q 1 – What makes your Organization a great
place to work?
Top Words: Environment, Family, Team, Culture, Opportunity, Facility

8/4/2019 2011 Gr8 Places 2 Works
http://slidepdf.com/reader/full/2011-gr8-places-2-works 41/45
Q 2 – What will make your Organization a better
place to work?
Top Words: Team, Salary, Facility, Job, Training, Growth, Policy, Environment

8/4/2019 2011 Gr8 Places 2 Works
http://slidepdf.com/reader/full/2011-gr8-places-2-works 42/45
Q1 Q2
Top words in Q1 not prominent in Q2:
Environment, Family, Culture, Freedom
Top words in Q2 not prominent in Q1:
Salary, Promotion
Buzz Comparison Q-1 Vs. Q-2

8/4/2019 2011 Gr8 Places 2 Works
http://slidepdf.com/reader/full/2011-gr8-places-2-works 43/45
Positive Sentiments Negative Sentiments
Sentiment Analysis for the Qn – “ What makes
your Organization a great place to work?”

8/4/2019 2011 Gr8 Places 2 Works
http://slidepdf.com/reader/full/2011-gr8-places-2-works 44/45
Learning from the Best Workplaces
1. Building the foundation - Articulating a People Philosophy
2. Strengthening the foundation – build the differentiators• Equity • Reliability
• Impartiality • Camaraderie
3. Building the pillars- Creating great people managers
4. Putting the roof - Articulating and institutionalizing your
Employer brand• Attracting talent for key positions
• Equity –equal treatment• Creating a fun place to work
Do you have the people practices that will help you to institutionalizethe above? - the best workplaces do.

8/4/2019 2011 Gr8 Places 2 Works
http://slidepdf.com/reader/full/2011-gr8-places-2-works 45/45
Thank You
A