2011 inventory of air emissions - the port of los angeles
TRANSCRIPT


THE PORT OF LOS ANGELES
INVENTORY OF AIR EMISSIONS FOR CALENDAR YEAR 2011
Prepared for:
THE PORT OF LOS ANGELES
July 2012
Prepared by:
Starcrest Consulting Group, LLC Long Beach, CA


Inventory of Air Emissions CY 2011
Port of Los Angeles July 2012
TABLE OF CONTENTS
EXECUTIVE SUMMARY .............................................................................................. ES-1 SECTION 1 INTRODUCTION ............................................................................................ 1
1.1 Scope of Study ...................................................................................................... 2 1.1.1 Pollutants .............................................................................................................................. 2 1.1.2 Emission Sources ................................................................................................................... 4 1.1.3 Geographical Extent .............................................................................................................. 4
1.2 Methodology Comparison ................................................................................... 8 1.3 Report Organization ............................................................................................ 8
SECTION 2 REGULATORY AND SAN PEDRO BAY PORTS CLEAN AIR ACTION PLAN
(CAAP) MEASURES ......................................................................................................... 9 2.1 Ocean-Going Vessels ......................................................................................... 10 2.2 Harbor Craft ...................................................................................................... 16 2.3 Cargo Handling Equipment ............................................................................. 18 2.4 Railroad Locomotives ....................................................................................... 20 2.5 Heavy-Duty Vehicles ......................................................................................... 22 2.6 Greenhouse Gases ............................................................................................. 25 2.7 Draft 2012 Air Quality Management Plan (AQMP) .......................................... 26
SECTION 3 OCEAN-GOING VESSELS ............................................................................. 27
3.1 Source Description ............................................................................................ 27 3.2 Geographical Delineation ................................................................................. 29 3.3 Data and Information Acquisition .................................................................... 31 3.4 Operational Profiles ........................................................................................... 32 3.5 Emission Estimation Methodology .................................................................. 34
3.5.1 Propulsion Engine Maximum Continuous Rated Power ....................................................... 35 3.5.2 Propulsion Engine Load Factor ........................................................................................... 35 3.5.3 Propulsion Engine Activity .................................................................................................. 35 3.5.4 Propulsion Engine Emission Factors .................................................................................... 36 3.5.5 Propulsion Engines Low Load Emission Factors ................................................................. 37 3.5.6 Propulsion Engine Harbor Maneuvering Loads .................................................................... 41 3.5.7 Propulsion Engine Defaults .................................................................................................. 41 3.5.8 Auxiliary Engine Emission Factors ..................................................................................... 42 3.5.9 Auxiliary Engine Load Defaults ......................................................................................... 42 3.5.10 Auxiliary Boilers ............................................................................................................... 44 3.5.11 Fuel Correction Factors ...................................................................................................... 47 3.5.12 Control Factors for Emission Reduction Technologies .......................................................... 48 3.5.13 Improvements to Methodology from Previous Years .............................................................. 48 3.5.14 Future Improvements to Methodology .................................................................................. 49
3.6 Emission Estimates ........................................................................................... 49 3.6.1 Emission Estimates by Engine Type .................................................................................... 52 3.6.2 Emission Estimates by Mode ............................................................................................... 54

Inventory of Air Emissions CY 2011
Port of Los Angeles July 2012
3.7 Facts and Findings ............................................................................................ 56 3.7.1 Flags of Convenience ............................................................................................................. 57 3.7.2 Next and Last Port of Call ................................................................................................. 59 3.7.3 Vessel Characteristics ........................................................................................................... 60 3.7.4 Hotelling Time at Berth and Anchorage ............................................................................... 63 3.7.5 Frequent Callers .................................................................................................................. 65
SECTION 4 HARBOR CRAFT .......................................................................................... 66
4.1 Source Description ............................................................................................ 66 4.2 Geographical Delineation ................................................................................. 67 4.3 Data and Information Acquisition .................................................................... 68 4.4 Operational Profiles ........................................................................................... 69 4.5 Emissions Estimation Methodology................................................................. 72
4.5.1 Emissions Calculation Equations ......................................................................................... 72 4.5.2 Emission Factors, Deterioration Factors and Useful Life ...................................................... 73 4.5.3 Fuel Correction Factors ........................................................................................................ 75 4.5.4 Load Factors ....................................................................................................................... 75 4.5.5 Improvements to Methodology from Previous Year ................................................................. 76 4.5.6 Future Improvements to Methodology .................................................................................... 76
4.6 Emission Estimates ........................................................................................... 77 SECTION 5 CARGO HANDLING EQUIPMENT ................................................................ 80
5.1 Source Description ............................................................................................ 80 5.2 Geographical Delineation ................................................................................. 81 5.3 Data and Information Acquisition .................................................................... 84 5.4 Operational Profiles ........................................................................................... 84 5.5 Emissions Estimation Methodology................................................................. 92
5.5.1 Emission Factors ................................................................................................................. 93 5.5.2 Load Factor and Fuel Correction Factors ............................................................................. 94 5.5.3 Control Factors .................................................................................................................... 96 5.5.4 Improvements to Methodology from Previous Year ................................................................. 96 5.5.5 Future Improvements to Methodology .................................................................................... 97
5.6 Emission Estimates ........................................................................................... 97 SECTION 6 LOCOMOTIVES ........................................................................................... 102
6.1 Source Description ........................................................................................... 102 6.2 Geographical Delineation ................................................................................ 104 6.3 Data and Information Acquisition ................................................................... 105 6.4 Operational Profiles .......................................................................................... 106
6.4.1 Rail System ........................................................................................................................ 106 6.4.2 Locomotives and Trains ...................................................................................................... 110
6.5 Emissions Estimation Methodology................................................................ 112 6.5.1 Switching Emissions ........................................................................................................... 113 6.5.2 Line Haul Locomotive Emissions ...................................................................................... 115 6.5.3 Improvements to Methodology from Previous Years .............................................................. 120
Inventory of Air Emissions CY 2011
Port of Los Angeles July 2012
6.5.4 Future Improvements to Methodology .................................................................................. 121 6.6 Emission Estimates .......................................................................................... 121
SECTION 7 HEAVY-DUTY VEHICLES ........................................................................... 123
7.1 Source Description ........................................................................................... 123 7.2 Geographical Delineation ................................................................................ 124 7.3 Data and Information Acquisition ................................................................... 126
7.3.1 On-Terminal ...................................................................................................................... 126 7.3.2 On-Road ........................................................................................................................... 126
7.4 Operational Profiles .......................................................................................... 127 7.4.1 On-Terminal ...................................................................................................................... 128 7.4.2 On-Road ........................................................................................................................... 130
7.5 Emissions Estimation Methodology................................................................ 131 7.5.1 Overview of the EMFAC2011 Emissions Calculation Methodology .................................. 132 7.5.2 Model Year Distribution .................................................................................................... 134 7.5.3 Speed-Specific Emission Factors ......................................................................................... 136 7.5.4 Improvements to Methodology from Previous Years .............................................................. 138 7.5.5 Future Improvements to Methodology .................................................................................. 138
7.6 Emission Estimates .......................................................................................... 138 SECTION 8 SUMMARY OF 2011 EMISSION RESULTS ...................................................... 141 SECTION 9 COMPARISON OF 2011 AND PREVIOUS YEARS’ FINDINGS AND EMISSION
ESTIMATES .................................................................................................................. 149 9.1 2011 Comparisons ............................................................................................. 149
9.1.1 Ocean-Going Vessels .......................................................................................................... 157 9.1.2 Harbor Craft ..................................................................................................................... 162 9.1.3 Cargo Handling Equipment ............................................................................................... 168 9.1.4 Locomotives ........................................................................................................................ 176 9.1.5 Heavy-Duty Vehicles ......................................................................................................... 179
9.2 CAAP Standards and Progress ......................................................................... 183 SECTION 10 LOOKING FORWARD ................................................................................ 188
10.1 Anticipated Impacts of Control Programs on Emissions in 2012 ................... 188 10.2 Future Improvements to Emissions Inventory Methodologies ..................... 189


Inventory of Air Emissions CY 2011
Port of Los Angeles July 2012
LIST OF FIGURES
Figure ES.1: South Coast Air Basin Boundary ........................................................................ ES-3 Figure ES.2: OGV Inventory Geographical Extent ............................................................... ES-3 Figure ES.3: 2011 Port-related Emissions by Category ......................................................... ES-6 Figure ES.4: 2011 PM10 Emissions in the South Coast Air Basin ........................................ ES-7 Figure ES.5: 2011 PM2.5 Emissions in the South Coast Air Basin ........................................ ES-7 Figure ES.6: 2011 DPM Emissions in the South Coast Air Basin ....................................... ES-8 Figure ES.7: 2011 NOx Emissions in the South Coast Air Basin ......................................... ES-8 Figure ES.8: 2011 SOx Emissions in the South Coast Air Basin .......................................... ES-8 Figure ES.9: Port’s Emission Contribution in the South Coast Air Basin .......................... ES-9 Figure ES.10: DPM Emissions Comparison by Category, tpy ........................................... ES-11 Figure ES.11: NOx Emissions Comparison by Category, tpy ............................................. ES-12 Figure ES.12: SOx Emissions Comparison by Category, tpy .............................................. ES-12 Figure ES.13: Emissions Efficiency Metric Change ............................................................. ES-14 Figure ES.14: DPM Reductions to Date ................................................................................ ES-15 Figure ES.15: NOx Reductions to Date .................................................................................. ES-16 Figure ES.16: SOx Reductions to Date ................................................................................... ES-16 Figure ES.17: Health Risk Reduction Benefits to Date ....................................................... ES-17 Figure 1.1: Port Boundary Area of Study ........................................................................................ 5 Figure 1.2: South Coast Air Basin Boundary .................................................................................. 6 Figure 1.3: OGV Inventory Geographical Extent ......................................................................... 7 Figure 2.1: CARB Marine Fuel Regulation Boundary ................................................................. 13 Figure 3.1: Distribution of Calls by Vessel Type .......................................................................... 28 Figure 3.2: Geographical Extent and Major Shipping Routes .................................................... 29 Figure 3.3: Precautionary Zone ....................................................................................................... 31 Figure 3.4: 2011 Ocean-Going Vessel Emissions by Vessel Type ............................................ 52 Figure 3.5: 2011 Ocean-Going Vessel Emissions by Engine Type ........................................... 53 Figure 3.6: 2011 Ocean-Going Vessel Emissions by Mode ....................................................... 56 Figure 3.7: Container and Cargo Throughput Trend .................................................................. 57 Figure 3.8: Flag of Registry, Discrete Vessels ............................................................................... 58 Figure 3.9: Flag of Registry, Vessel Calls ....................................................................................... 58 Figure 3.10: Next (To) Port ............................................................................................................. 59 Figure 3.11: Last (From) Port ......................................................................................................... 59 Figure 3.12: Average Age of Vessels, years ................................................................................... 61 Figure 3.13: Average Maximum Rated Sea Speed, knots ............................................................ 61 Figure 3.14: Average Deadweight, tons ......................................................................................... 62 Figure 3.15: Average Main Engine Total Installed Power, kilowatts ........................................ 62 Figure 3.16: Average Auxiliary Engine Total Installed Power, kilowatts ................................. 62 Figure 4.1: Distribution of 2011 Commercial Harbor Craft by Vessel Type ........................... 66 Figure 4.2: Geographical Extent of Harbor Craft Inventory ..................................................... 67 Figure 4.3: Distribution of Harbor Craft Engines by Engine Standards .................................. 71 Figure 4.4: 2011 Harbor Craft Emissions Distribution ............................................................... 79 Figure 5.1: 2011 CHE Count Distribution by Equipment Type ............................................... 81
Inventory of Air Emissions CY 2011
Port of Los Angeles July 2012
Figure 5.2: Geographical Boundaries for Cargo Handling Equipment .................................... 83 Figure 5.3: 2011 Distribution of Diesel Equipment by Engine Standards ............................... 92 Figure 5.4: 2011 CHE Emissions by Terminal Type ................................................................... 98 Figure 5.5: 2011 CHE Emissions by Equipment Type ............................................................. 101 Figure 6.1: Typical Line Haul Locomotive ................................................................................. 103 Figure 6.2: PHL Switching Locomotive ...................................................................................... 103 Figure 6.3: Port Area Rail Lines .................................................................................................... 104 Figure 6.4: Air Basin Major Intermodal Rail Routes ................................................................. 105 Figure 6.5: Alameda Corridor ....................................................................................................... 108 Figure 7.1: Truck with Container ................................................................................................. 124 Figure 7.2: Bobtail Truck ............................................................................................................... 124 Figure 7.3: Port and Near-Port Roadways .................................................................................. 125 Figure 7.4: Regional Map ............................................................................................................... 130 Figure 7.5: Engine Model Year Distribution of the Heavy-Duty Truck Fleet ...................... 136 Figure 8.1: 2011 Port-related Emissions by Category ............................................................... 142 Figure 8.2: 2011 PM10 Emissions in the South Coast Air Basin .............................................. 146 Figure 8.3: 2011 PM2.5 Emissions in the South Coast Air Basin .............................................. 146 Figure 8.4: 2011 DPM Emissions in the South Coast Air Basin ............................................. 147 Figure 8.5: 2011 NOx Emissions in the South Coast Air Basin ............................................... 147 Figure 8.6: 2011 SOx Emissions in the South Coast Air Basin ................................................ 147 Figure 8.7: Port’s Emissions in the South Coast Air Basin ...................................................... 148 Figure 9.1: Port-wide Emissions Change .................................................................................... 152 Figure 9.2: DPM Emissions Comparison by Category, tpy ...................................................... 153 Figure 9.3: NOx Emissions Comparison by Category, tpy ....................................................... 153 Figure 9.4: SOx Emissions Comparison by Category, tpy ........................................................ 154 Figure 9.5: Port-wide Changes in Emissions Efficiency Metric ............................................... 156 Figure 9.6: OGV Emissions Efficiency Metric Change ............................................................ 162 Figure 9.7: Harbor Craft Emissions Efficiency Metric Change ............................................... 168 Figure 9.8: CHE Emissions Efficiency Metric Change ............................................................. 176 Figure 9.9: Locomotive Emissions Efficiency Metric Change ................................................. 179 Figure 9.10: HDV Emissions Efficiency Metric Change .......................................................... 182 Figure 9.11: DPM Reductions to Date ........................................................................................ 184 Figure 9.12: NOx Reductions to Date .......................................................................................... 185 Figure 9.13: SOx Reductions to Date ........................................................................................... 186 Figure 9.14: Health Risk Reduction Benefits to Date ............................................................... 187
Inventory of Air Emissions CY 2011
Port of Los Angeles July 2012
LIST OF TABLES
Table ES.1: Container Throughput and Vessel Call Comparison, TEUs, and Calls ......... ES-4 Table ES.2: 2011 Port-related Emissions by Category, tpy ................................................... ES-5 Table ES.3: 2011 Port-related GHG Emissions by Category, tonnes ................................. ES-6 Table ES.4: Port-wide Emissions Comparison, tpy .............................................................. ES-10 Table ES.5: Port-wide GHG Emissions Comparison, tonnes ............................................ ES-10 Table ES.6: Emissions Efficiency Metric Comparison, tons/10,000 TEUs ..................... ES-13 Table ES.7: GHG Emissions Efficiency Metric Comparison, tonnes/10,000 TEUs ..... ES-13 Table 2.1: NOx Limits for Marine Engines, g/kW-hr ................................................................. 11 Table 3.1: Route Distances, nm ...................................................................................................... 30 Table 3.2: Route Distribution of Annual Calls ............................................................................. 30 Table 3.3: Total OGV Movements ................................................................................................ 33 Table 3.4: Precautionary Zone Speed, knots ................................................................................ 36 Table 3.5: Emission Factors for OGV Propulsion Power using Residual Oil, g/kW-hr ..... 37 Table 3.6: GHG Emission Factors for OGV Propulsion Power using Residual Oil, g/kW-hr .............................................................................................................................................................. 37 Table 3.7: Low-Load Emission Factor Regression Equation Variables ................................... 38 Table 3.8: EEAI Emission Factors, g/kW-hr .............................................................................. 39 Table 3.9: Low Load Adjustment Multipliers for Emission Factors ......................................... 40 Table 3.10: Emission Factors for Auxiliary Engines using Residual Oil, g/kW-hr ................ 42 Table 3.11: GHG Emission Factors for Auxiliary Engines using Residual Oil, g/kW-hr.... 42 Table 3.12: Auxiliary Engine Load Defaults, kW ......................................................................... 43 Table 3.13: Diesel Electric Cruise Ship Auxiliary Engine Load Defaults, kW ........................ 44 Table 3.14: Emission Factors for OGV Auxiliary Boilers using Residual Oil, g/kW-hr ...... 44 Table 3.15: GHG Emission Factors for OGV Auxiliary Boilers using Residual Oil, g/kW-hr .............................................................................................................................................................. 45 Table 3.16: Auxiliary Boiler Load Defaults, kW ........................................................................... 46 Table 3.17: Fuel Correction Factors ............................................................................................... 47 Table 3.18: Tanker Classification Changes .................................................................................... 49 Table 3.19: 2011 Ocean-Going Vessel Emissions by Vessel Type, tpy .................................... 50 Table 3.20: 2011 Ocean-Going Vessel GHG Emissions by Vessel Type, tonnes .................. 51 Table 3.21: 2011 Ocean-Going Vessel Emissions by Engine Type, tpy .................................. 52 Table 3.22: 2011 Ocean-Going Vessel GHG Emissions by Engine Type, .............................. 53 tonnes ................................................................................................................................................... 53 Table 3.23: 2011 Ocean-Going Vessel Emissions by Mode, tpy ............................................... 54 Table 3.24: 2011 Ocean-Going Vessel Greenhouse Gas Emissions by Mode, tonnes .......... 55 Table 3.25: Container and Cargo Throughputs and Change ...................................................... 56 Table 3.26: Vessel Type Characteristics ......................................................................................... 60 Table 3.27: Hotelling Times at Berth by Vessel Type, hours ..................................................... 63 Table 3.28: Hotelling Times at Anchorage by Vessel Type, hours ............................................ 64 Table 3.29: Count and Percentage of Frequent Callers ............................................................... 65 Table 4.1: 2011 Summary of Propulsion Engine Data by Vessel Category ............................. 70 Table 4.2: 2011 Summary of Auxiliary Engine Data by Vessel Category ................................. 70 Table 4.3: Engine Deterioration Factors for Harbor Craft Diesel Engines ............................. 74

Inventory of Air Emissions CY 2011
Port of Los Angeles July 2012
Table 4.4: Useful Life by Harbor Craft Type and Engine Type, years ..................................... 74 Table 4.5: Fuel Correction Factors for ULSD .............................................................................. 75 Table 4.6: Load Factors .................................................................................................................... 75 Table 4.7: 2011 Harbor Craft Emissions by Vessel and Engine Type, tpy .............................. 77 Table 4.8: 2011 Harbor Craft GHG Emissions by Vessel and Engine Type, tonnes ............ 78 Table 5.1: 2011 CHE Engine Characteristics for All Terminals ................................................ 85 Table 5.2: 2011 Container Terminal CHE Compared to Total CHE ....................................... 86 Table 5.3: 2011 CHE Engines Characteristics for Container Terminals .................................. 87 Table 5.4: 2011 CHE Engines Characteristics for Break-Bulk Terminals ................................ 88 Table 5.5: 2011 CHE Engines Characteristics for Dry Bulk Terminals ................................... 88 Table 5.6: 2011 CHE Engines Characteristics for Other Facilities ........................................... 89 Table 5.7: 2011 Count of CHE Emission Reduction Technologies ......................................... 90 Table 5.8: 2011 Count of CHE Engine by Fuel Type ................................................................. 90 Table 5.9: 2011 Count of Diesel Equipment by Type and Engine Standards ......................... 91 Table 5.10: CHE Load Factors ....................................................................................................... 94 Table 5.11: Fuel Correction Factors for ULSD............................................................................ 95 Table 5.12: Fuel Correction Factors for Gasoline ....................................................................... 95 Table 5.13: CHE Emission Reduction Percentages..................................................................... 96 Table 5.14: 2011 CHE Emissions by Terminal Type, tpy .......................................................... 97 Table 5.15: 2011 CHE GHG Emissions by Terminal Type, tonnes ........................................ 98 Table 5.16: 2011 CHE Emissions by Equipment and Engine Type, tpy ................................. 99 Table 5.17: 2011 CHE GHG Emissions by Equipment and Engine Type, tonnes ............. 100 Table 6.1: Switching Emission Factors, g/hp-hr ....................................................................... 114 Table 6.2: GHG Switching Emission Factors, g/hp-hr ............................................................ 115 Table 6.3: Emission Factors for Line Haul Locomotives, g/hp-hr ........................................ 116 Table 6.4: GHG Emission Factors for Line Haul Locomotives, g/hp-hr ............................. 116 Table 6.5: On-Port Line Haul Locomotive Activity .................................................................. 117 Table 6.6: Estimated Average Load Factor ................................................................................. 118 Table 6.7: Assumptions for Gross Weight of Trains................................................................. 120 Table 6.8: Train Travel Distance Assumptions .......................................................................... 120 Table 6.9: Gross Ton-Mile, Fuel Use, and Horsepower-hour Estimate ................................. 120 Table 6.10: 2011 Port-Related Locomotive Operations Estimated Emissions, tpy ............. 121 Table 6.11: 2011 GHG Port-Related Locomotive Operations Estimated Emissions, tonnes ............................................................................................................................................................ 121 Table 7.1: On-Road HDV Activity Modeling Results – Example .......................................... 127 Table 7.2: 2011 Summary of Reported Container Terminal Operating Characteristics ....... 128 Table 7.3: 2011 Summary of Reported Non-Container Facility Operating Characteristics 128 Table 7.4: 2011 Estimated VMT and Idling Hours by Terminal ............................................. 129 Table 7.5: Idle Emission Rates, g/hr ........................................................................................... 133 Table 7.6: Speed-Specific Composite Emission Factors, g/hr and grams/mile .................... 137 Table 7.7: Speed-Specific GHG Emission Factors, g/hr and grams/mile ............................ 137 Table 7.8: 2011 HDV Emissions, tpy .......................................................................................... 139 Table 7.9: 2011 HDV GHG Emissions, tonnes ........................................................................ 139 Table 7.10: 2011 HDV Emissions Associated with Container Terminals, tpy ...................... 139 Table 7.11: 2011 HDV GHG Emissions Associated with Container Terminals, tonnes .... 140

Inventory of Air Emissions CY 2011
Port of Los Angeles July 2012
Table 7.12: 2011 HDV Emissions Associated with Other Port Terminals, tpy .................... 140 Table 7.13: 2011 HDV GHG Emissions Associated with Other Port Terminals, tonnes .. 140 Table 8.1: 2011 Port-related Emissions by Category, tpy ......................................................... 141 Table 8.2: 2011 Port-related GHG Emissions by Category, tonnes ....................................... 141 Table 8.3: 2011 DPM Emissions by Category and Percent Contribution, tpy ...................... 143 Table 8.4: 2011 NOx Emissions by Category and Percent Contribution, tpy ........................ 144 Table 8.5: 2011 SOx Emissions by Category and Percent Contribution, tpy ......................... 145 Table 9.1: Container and Cargo Throughputs Change, Calls, and TEUs .............................. 150 Table 9.2: OGV Container Vessel Calls Count by Container Vessel Category ..................... 150 Table 9.3: Port-wide Emissions Comparison, tpy ...................................................................... 151 Table 9.4: Port-wide GHG Emissions Comparison, tonnes .................................................... 155 Table 9.5: Port-wide Emissions Efficiency Metric, tons/10,000 TEUs ................................. 155 Table 9.6: Port-wide GHG Emissions Efficiency Metric, tonnes/10,000 TEUs ................. 157 Table 9.7: OGV Emission Reduction Strategies ........................................................................ 158 Table 9.8: Annual Route Distribution.......................................................................................... 159 Table 9.9: OGV Power Comparison, kW-hr .............................................................................. 159 Table 9.10: OGV Emissions Comparison, tpy ........................................................................... 160 Table 9.11: OGV GHG Emissions Comparison, tonnes ......................................................... 160 Table 9.12: OGV Emissions Efficiency Metric Comparison, tons/10,000 TEUs ............... 161 Table 9.13: Harbor Craft Count Comparison ............................................................................ 163 Table 9.14: Harbor Craft Engine Standards Comparison by Tier ........................................... 163 Table 9.15: Harbor Craft Comparison ......................................................................................... 165 Table 9.16: Harbor Craft Activity Comparison by Type, million kW-hr ............................... 165 Table 9.17: Harbor Craft Emission Comparison, tpy ............................................................... 166 Table 9.18: Harbor Craft GHG Emission Comparison, tonnes ............................................. 167 Table 9.19: Harbor Craft Emissions Efficiency Metric Comparison, tons/10,000 TEUs .. 167 Table 9.20: CHE Count and Activity Comparison .................................................................... 169 Table 9.21: Count of CHE Engine Type..................................................................................... 170 Table 9.22: Count of CHE Diesel Equipment Emissions Control Matrix ............................ 172 Table 9.23: Count of CHE Diesel Engine Tier and On-road Engine .................................... 173 Table 9.24: CHE Emissions Comparison, tpy ............................................................................ 174 Table 9.25: CHE GHG Emissions Comparison, tonnes .......................................................... 174 Table 9.26: CHE Emissions Efficiency Metric Comparison, tons/10,000 TEUs ................ 175 Table 9.27: Throughput Comparison, TEUs .............................................................................. 177 Table 9.28: Locomotive Emission Comparison, tpy ................................................................. 177 Table 9.29: Locomotive GHG Emission Comparison, tonnes ............................................... 178 Table 9.30: Locomotive Emissions Efficiency Metric Comparison, tons/10,000 TEUs .... 178 Table 9.31: HDV Idling Time Comparison, hours .................................................................... 180 Table 9.32: Port-related Fleet Weighted Average Age, years ................................................... 180 Table 9.33: HDV Emissions Comparison, tpy ........................................................................... 181 Table 9.34: HDV GHG Emissions Comparison, tonnes ......................................................... 181 Table 9.35: HDV Emissions Efficiency Metrics Comparison, tons/10,000 TEUs .............. 182 Table 9.36: DPM Emissions by Calendar Year and Source Category, tpy ............................. 184 Table 9.37: NOx Emissions by Calendar Year and Source Category, tpy .............................. 185 Table 9.38: SOx Emissions by Calendar Year and Source Category, tpy ................................ 186

Inventory of Air Emissions CY 2011
Port of Los Angeles July 2012
ACKNOWLEDGEMENTS
The following individuals and their respective companies and organizations assisted with providing the technical and operational information described in this report, or by facilitating the process to obtain this information. This endeavor would not have been possible without their assistance and support. We truly appreciate their time, effort, expertise, and cooperation. The Port of Los Angeles and Starcrest Consulting Group, LLC (Starcrest) would like to recognize all who contributed their knowledge and understanding to the operations of port-related facilities, commercial marine vessels, locomotives, and off-road/ on-road vehicles at the port facilities: Megan Shahnazarian, American Marine Richard Sandell, Vopak Robert Clark, APL Terminal Jametta Barry, WWL Vehicle Services Jim Jacobs, APL Terminal Mark Wheeler, West Basin Container John Ochs, APM Terminals Terminal David Seep, Burlington Northern Santa Fe Linda Frame, Yusen Terminals Lyle Staley, Burlington Northern Santa Fe Phil Lawrence, Yusen Terminals Mark Stehly, Burlington Northern Santa Fe Bob Lively, California Cartage Kevin Elizondo, California United Terminals Greg Bombard, Catalina Express David Scott, Conolly Pacific Javier Montano, Crowley Tommy Taylor, Crescent Warehouse Jerry Allen, Foss Maritime Gene Hester, Jankovich Richard McKenna, Marine Exchange Mario Meyers, Millennium Maritime Wayne Caley, Pacific Tugboat Service Kim Stobie, Pasha Stevedoring & Terminals Andrew Fox, Pacific Harbor Line Greg Peters, Pacific Harbor Line Nancy Felix, SA Recycling Peter Balou, San Pedro Forklift Emile Schiff, Sause Bros. Chuck Davis, Seaway Company Eric Wilson, Seaside Transportation Services Geoffrey Romano, Seaside Transportation Services Mitch McCrae, SSA Jamie Wilson, Spirit Cruises Scott Axelson, TraPac Holly Lewandoski, TraPac Jon Germer, Union Pacific Railroad Lanny Schmid, Union Pacific Railroad Jose Flores, U.S. Water Taxi & Port Services
Inventory of Air Emissions CY 2011
Port of Los Angeles July 2012
ACKNOWLEDGEMENTS (CONT’D)
The Port of Los Angeles and Starcrest would like to thank the following regulatory agency staff who contributed, commented, and coordinated the approach and reporting of the emissions inventory: Nicole Dolney, California Air Resources Board Ed Eckerle, South Coast Air Quality Management District Randall Pasek, South Coast Air Quality Management District Roxanne Johnson, U.S. Environmental Protection Agency Starcrest would like to thank the following Port of Los Angeles staff members for assistance during the development of the emissions inventory: Kevin Maggay Christopher Patton Teresa Gioiello Pisano Lisa Wunder Authors: Archana Agrawal, Principal, Starcrest
Guiselle Aldrete, Consultant, Starcrest Bruce Anderson, Principal, Starcrest Joseph Ray, Principal, Starcrest
Contributors: Steve Ettinger, Principal, Starcrest
Lars Kristiansson, Consultant, Starcrest Rose Muller, Consultant, Starcrest Jill Morgan, Consultant, Starcrest Paula Worley, Consultant, Starcrest
Document Preparation: Denise Anderson, Consultant, Starcrest Cover: Melissa Silva, Principal, Starcrest Third Party Review: Integra Environmental Consulting, Inc.

Inventory of Air Emissions CY 2011
Port of Los Angeles July 2012
ACRONYMS AND ABBREVIATIONS Act Activity AAPA American Association of Port Authorities AMP alternative maritime power APL American Presidents Line AQMP Air Quality Management Plan APM A. P. Moeller-Maersk ATB articulated tug and barge BNSF Burlington Northern Santa Fe Railroad BSFC brake specific fuel consumption BTM body type model (heavy-duty trucks) BW breakwater CAAP Clean Air Action Plan CARB California Air Resources Board CF control factor CH4 methane CHE cargo handling equipment CO carbon monoxide CO2 carbon dioxide CO2e carbon dioxide equivalent CTP Clean Truck Program D distance DB dynamic braking DF deterioration factor DMV Department of Motor Vehicles DOC diesel oxidation catalyst DPF diesel particulate filter DPM diesel particulate matter DR deterioration rate DWT deadweight tonnage E emissions ECA emission control area EEAI Energy and Environmental Analysis, Inc. EF emission factor EI emissions inventory EMFAC CARB’s EMission FACtor model EPA U.S. Environmental Protection Agency
Inventory of Air Emissions CY 2011
Port of Los Angeles July 2012
FCF fuel correction factor g/bhp-hr grams per brake horsepower-hour g/kW-hr grams per kilowatt-hour g/mi grams per mile GHG greenhouse gas GVWR gross vehicle weight rating GWP global warming potential HC hydrocarbons - total HDV heavy-duty vehicle HFO heavy fuel oil hp horsepower hrs hours ICTF Intermodal Container Transfer Facility IFO intermediate fuel oil IMO International Maritime Organization IPCC Intergovernmental Panel on Climate Change ITB integrated tug and barge kW kilowatt kW-hr kilowatt-hours LF load factor LLA low load adjustment Lloyd’s Lloyd’s Register of Ships LNG liquefied natural gas LPG liquefied petroleum gas LSI large spark ignited (engine) MarEx Marine Exchange of Southern California MARPOL International Convention for the Prevention of Pollution from Ships MCR maximum continuous rating MDO marine diesel oil MGO marine gas oil MMGT million gross tons MOU Memorandum of Understanding mph miles per hour MY model year N north nm nautical miles
NOx oxides of nitrogen N2O nitrous oxide

Inventory of Air Emissions CY 2011
Port of Los Angeles July 2012
NYK Nippon Yusen Kaisha NRE National Railway Equipment Co. OBD onboard diagnostics OCR optical character recognition OGV ocean-going vessel PCST Pacific Cruise Ship Terminals PHL Pacific Harbor Line PM particulate matter
PM10 particulate matter less than 10 microns in diameter
PM2.5 particulate matter less than 2.5 microns in diameter POLB Port of Long Beach ppm parts per million PZ precautionary zone Reefer refrigerated vessel RFID radio frequency identification RO residual oil RoRo roll-on roll-off vessel rpm revolutions per minute RSD Regulatory Support Document RTG rubber tired gantry crane S sulfur SCAG Southern California Association of Governments SCAQMD South Coast Air Quality Management District SFC specific fuel consumption
SOx oxides of sulfur SoCAB South Coast Air Basin SPBP San Pedro Bay Ports TWG Technical Working Group TEU twenty-foot equivalent unit tpy tons per year U.S. United States ULSD ultra low sulfur diesel UNFCCC United Nations Framework Connection on Climate Change UP Union Pacific Railroad USCG U.S Coast Guard VBP vessel boarding program VLCC very large crude carrier ULCC ultra large crude carrier

Inventory of Air Emissions CY 2011
Port of Los Angeles July 2012
VDEC verified diesel emission control system VMT vehicle miles of travel VSR vessel speed reduction VSRIP Vessel Speed Reduction Incentive Program W west ZH zero hour ZMR zero mile rate
Inventory of Air Emissions CY 2011
Port of Los Angeles ES-1 July 2012
EXECUTIVE SUMMARY The Port of Los Angeles (the Port) shares San Pedro Bay with the neighboring Port of Long Beach (POLB). Together, the San Pedro Bay Ports comprise a significant regional and national economic engine for California and the United States (U.S.), through which approximately 33% of all U.S. containerized trade flows1. Economic forecasts suggest that the demand for containerized cargo moving through the San Pedro Bay region will increase over the next two decades2. The ability of the San Pedro Bay Ports to accommodate the projected growth in trade will depend upon the ability of the two ports and their tenants to address adverse environmental impacts and, in particular, air quality impacts that result from such trade. In November 2006, the San Pedro Bay Ports adopted the joint San Pedro Bay Ports Clean Air Action Plan (CAAP) which was designed to reduce health risks and emissions associated with port-related operations, while allowing port development to continue. On November 22, 2010, the harbor commissioners of the two ports unanimously approved an update to the CAAP that identifies longer-term goals that build upon the commitments made in the original CAAP3. In order to track CAAP progress, the Port has committed to develop annual inventories of port-related sources starting with the 2005 Inventory of Air Emissions (which served as the CAAP baseline). This study, the 2011 Inventory of Air Emissions, includes emissions estimates based on 2011 activity levels and a comparison with 2005 through 2010 emissions estimates to track CAAP emissions reduction progress. As in previous inventories, the following five source categories are included:
Ocean-going vessels (OGV) Harbor craft Cargo handling equipment (CHE) Locomotives Heavy-duty vehicles (HDV)
1 American Association of Port Authorities (AAPA), North America: Container Port Traffic, 2011. 2 The Tioga Group, Inc., San Pedro Bay Container Forecast Update, July 2009. 3 Ports of Long Beach and Los Angeles, http://www.cleanairactionplan.org/

Inventory of Air Emissions CY 2011
Port of Los Angeles ES-2 July 2012
Exhaust emissions of the following pollutants that can cause local impacts have been estimated: Particulate matter (PM) (10-micron, 2.5-micron) Diesel particulate matter (DPM) Oxides of nitrogen (NOx) Oxides of sulfur (SOx) Hydrocarbons (HC) Carbon monoxide (CO)
This study also includes emission estimates of greenhouse gases (GHGs) from port-related tenant operational sources. The following GHGs have been estimated: Carbon dioxide equivalent (CO2e) Carbon dioxide (CO2) Methane (CH4) Nitrous oxide (N2O)
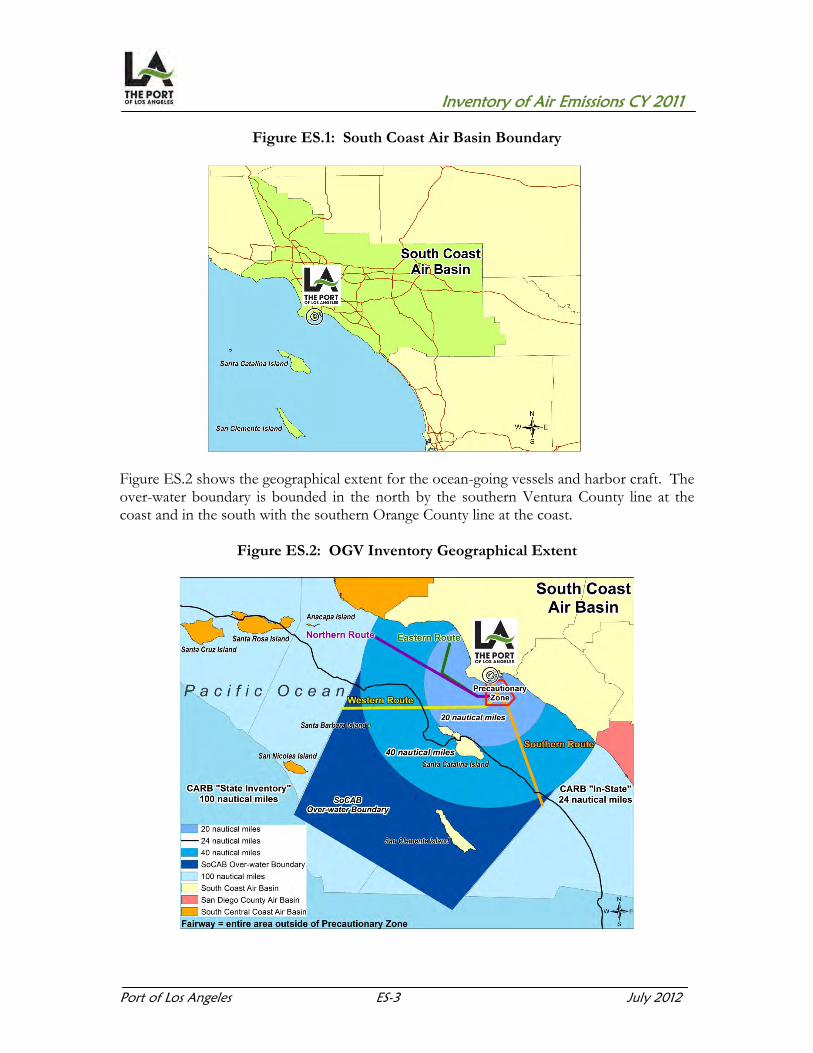
Methodology Overview and Geographical Extent Port tenants and shipping lines play an essential role in the development of an activity-based emissions inventory (EI) by providing the most accurate activity and operational information available. Emissions estimates are developed for each of the various source categories in a manner consistent with the latest estimating methodologies agreed upon by the Port and the participating regulatory agencies. The information gathered, analyzed, and presented in this EI continues to improve the understanding of the nature and magnitude of port-related emission sources. Development of this inventory was coordinated with the U.S. Environmental Protection Agency - Region 9 (EPA), California Air Resources Board (CARB), and the South Coast Air Quality Management District (SCAQMD). The geographical extent of the inventory is described in Section 1 and in each source category section of the report. The geographical extent of the port-related emissions did not change from previous inventories and includes emissions from all source categories within the harbor district; emissions from locomotives and on-road trucks transporting cargo to or from the Port up to the cargo’s first point of rest within the South Coast Air Basin (SoCAB) or up to the basin boundary, whichever comes first; and emissions from commercial marine vessels within the harbor and up to the study area boundary. Figure ES.1 shows the SoCAB boundary.
Inventory of Air Emissions CY 2011
Port of Los Angeles ES-3 July 2012
Figure ES.1: South Coast Air Basin Boundary
Figure ES.2 shows the geographical extent for the ocean-going vessels and harbor craft. The over-water boundary is bounded in the north by the southern Ventura County line at the coast and in the south with the southern Orange County line at the coast.
Figure ES.2: OGV Inventory Geographical Extent

Inventory of Air Emissions CY 2011
Port of Los Angeles ES-4 July 2012
Summary of 2011 Activity Table ES.1 presents the number of vessel calls and the container cargo throughputs for calendar years 2005 through 2011. The average number of twenty-foot equivalent units (TEUs) per containership call was at its highest for 2010 and 2011 calendar years, which means that, on average, more TEUs were handled per vessel call in 2010 and 2011 than in the previous years. Comparing 2011 to the previous year, the number of TEUs increased by 1% and the number of container ship calls increased by 2%, respectively, while the containership-call efficiency remained about the same. Compared to 2005, in 2011 the TEUs increased by 6% and containership calls decreased by 7% while the TEUs/containership-call efficiency improved by 14%.
Table ES.1: Container Throughput and Vessel Call Comparison, TEUs, and Calls
All Containership Container AverageYear Calls Calls Throughput TEUs/Call
(TEUs) 2011 2,072 1,376 7,940,511 5,7712010 2,035 1,355 7,831,902 5,7802009 2,010 1,355 6,748,995 4,9812008 2,239 1,459 7,849,985 5,3802007 2,527 1,573 8,355,038 5,3122006 2,703 1,627 8,469,853 5,2062005 2,501 1,481 7,484,625 5,054Previous Year (2010-2011) 2% 2% 1% 0%CAAP Progress (2005-2011) -17% -7% 6% 14%
There were several changes that impacted port-wide emissions and resulted in lower emissions compared to previous years. Major highlights by source category include: For ocean-going vessels, there was increased vessel speed reduction (VSR)
compliance, which impacts all pollutants, and CARB’s marine fuel regulation was in effect for the entire calendar year, affecting main and auxiliary engines and auxiliary boilers at berth and within 24 nautical miles (nm) from the coast, with significant PM and SOx emission reductions.
For heavy-duty vehicles, implementation of the Port’s Clean Truck Program (CTP) has resulted in significant turn-over of older trucks to newer and cleaner trucks. The second phase of the progressive ban was implemented in January 2010 and all pre-1993 trucks along with un-retrofitted 1994-2003 trucks were banned from the Port. In calendar year 2011, the trend toward more trucks with 2007 or newer engines continued, in advance of the January 2012 CTP requirement that will ban pre-2007 engines.

Inventory of Air Emissions CY 2011
Port of Los Angeles ES-5 July 2012
For harbor craft, implementation of CARB’s Commercial Harbor Craft Regulation along with funding incentives resulted in continued replacement of existing older vessels and engines with cleaner units and lower emissions.
For the cargo handling equipment, implementation of CAAP measures and CARB’s Cargo Handling Equipment Regulation along with funding incentives resulted in continued replacement of existing older equipment with cleaner units, retrofits, and repowers which lead to lower emissions.
For locomotives, the fleet-wide emission rates continued to decrease due to the continued fleet turnover and introduction of cleaner line haul and switcher locomotives. In calendar year 2011, Pacific Harbor Lines (PHL) repowered all of their Tier 2 switch locomotives with Tier 3 engines.
Summary of 2011 Emission Estimates The results for the Port of Los Angeles 2011 Inventory of Air Emissions are presented in this section. Table ES.2 summarizes the 2011 total port-related mobile source emissions of air pollutants in the SoCAB by category in tons per year (tpy).
Table ES.2: 2011 Port-related Emissions by Category, tpy
Category PM10 PM2.5 DPM NOx SOx CO HC
Ocean-going vessels 174 153 148 3,821 1,275 447 220Harbor craft 35 33 35 879 1 382 72Cargo handling equipment 25 23 23 831 2 664 69Locomotives 30 28 30 1,052 6 196 55Heavy-duty vehicles 23 21 22 1,406 4 348 66Total 287 258 258 7,989 1,287 2,037 482
DB ID457
The total port-related mobile source greenhouse gas (GHG) emissions in the SoCAB are summarized in Table ES.3 which presents the GHG emissions in metric tons (tonnes) per year (2,200 lbs/tonne) instead of the short tons per year (2,000 lbs/ton) used for criteria pollutants. Throughout the report, GHG emissions are reported in metric tons per year. The CO2e values are derived by multiplying the GHG emissions estimates for CO2, N2O, and CH4 by their respective global warming potential (GWP)4 values and then adding them together.
4 EPA, Inventory of U.S. Greenhouse Gas Emissions and Sinks: 1990-2010, April 2012.

Inventory of Air Emissions CY 2011
Port of Los Angeles ES-6 July 2012
Table ES.3: 2011 Port-related GHG Emissions by Category, tonnes
Category CO2e
Ocean-going vessels 231,941Harbor craft 51,901Cargo handling equipment 145,409Locomotives 69,505Heavy-duty vehicles 348,555Total 847,311
DB ID457
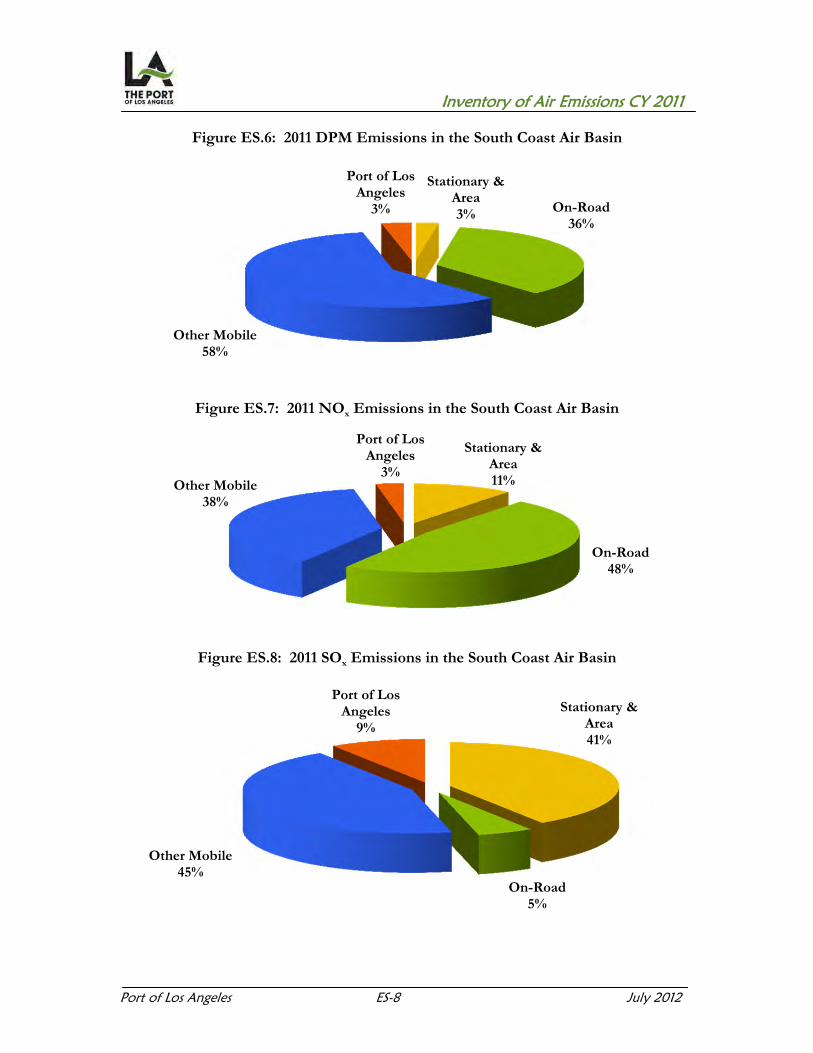
Figure ES.3 shows the distribution of the 2011 total port-related emissions of each pollutant from each source category. OGV (57%), harbor craft (14%) and locomotives (12%) contributed the highest percentage of DPM emissions among the port-related sources. Approximately 99% of the SOx emissions were emitted from ocean-going vessels. OGV (48%) and HDV (18%) accounted for the majority of NOx emissions. CHE (33%), ocean-going vessels (22%), harbor craft (19%) and HDV (17%) accounted for the majority of CO emissions. OGV (46%), harbor craft (15%) and CHE (14%) accounted for the majority of hydrocarbon emissions.
Figure ES.3: 2011 Port-related Emissions by Category

Inventory of Air Emissions CY 2011
Port of Los Angeles ES-7 July 2012
In order to put the port-related emissions into context, the following figures and tables compare the Port’s contributions to the total emissions in the SoCAB by major emission source category. The 2011 SoCAB emissions are based on 2007 AQMP Appendix III.5 For 2011 DPM SoCAB emissions, the values were interpolated between 2010 and 2012 estimates provided by SCAQMD staff. The other mobile source category includes aircraft, trains, ships, commercial boats, recreational boats, offroad recreational vehicles, and offroad equipment. The on-road source category includes light duty vehicles, medium duty trucks, heavy duty trucks, motorcycles, and buses. Due to rounding, the percentages do not add up to 100% in the pie charts shown below.
Figure ES.4: 2011 PM10 Emissions in the South Coast Air Basin
Figure ES.5: 2011 PM2.5 Emissions in the South Coast Air Basin
5 SCAQMD, Final 2007 AQMP Appendix III, Base & Future Year Emissions Inventories, June 2007.
Stationary & Area
84.5%
On-Road 8.6%
Other Mobile <6.7%
Port of Los Angeles<0.3%
Stationary & Area
65.8%
On-Road 17.0%
Other Mobile <16.6%
Port of Los Angeles<0.7%
Inventory of Air Emissions CY 2011
Port of Los Angeles ES-8 July 2012
Figure ES.6: 2011 DPM Emissions in the South Coast Air Basin
Figure ES.7: 2011 NOx Emissions in the South Coast Air Basin
Figure ES.8: 2011 SOx Emissions in the South Coast Air Basin
Stationary & Area3% On-Road
36%
Other Mobile 58%
Port of Los Angeles
3%
Stationary & Area11%
On-Road 48%
Other Mobile 38%
Port of Los Angeles
3%
Stationary & Area41%
On-Road 5%
Other Mobile 45%
Port of Los Angeles
9%
Inventory of Air Emissions CY 2011
Port of Los Angeles ES-9 July 2012
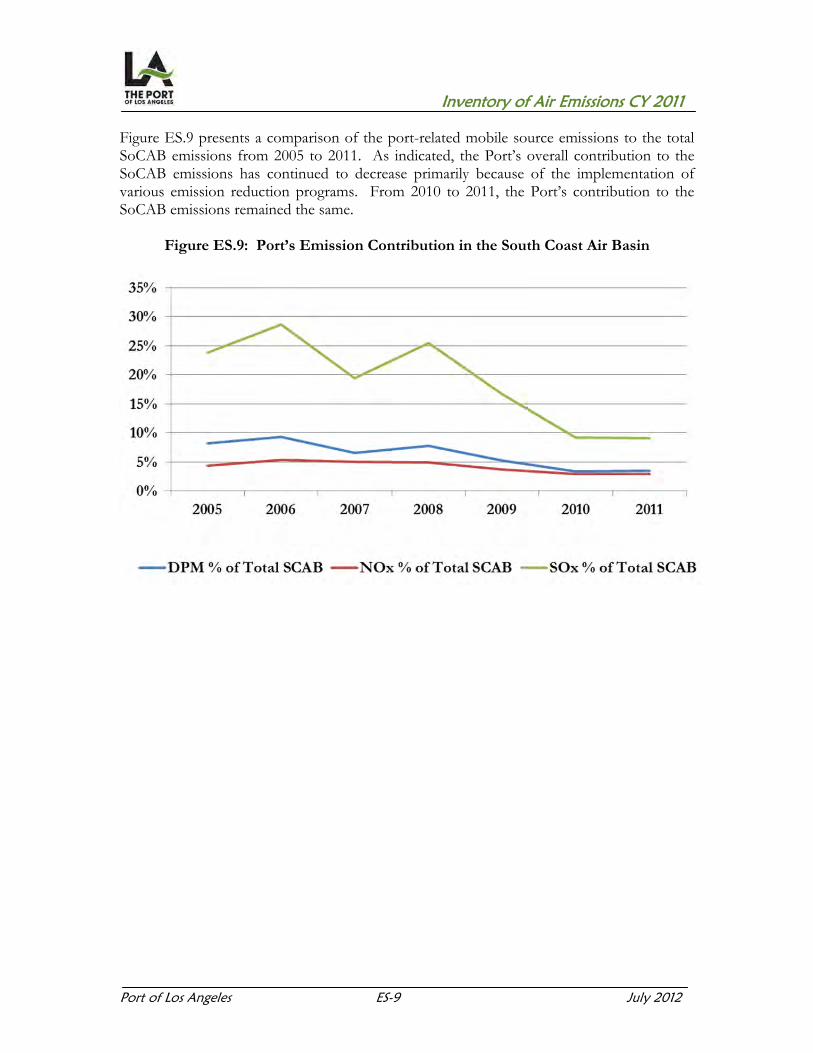
Figure ES.9 presents a comparison of the port-related mobile source emissions to the total SoCAB emissions from 2005 to 2011. As indicated, the Port’s overall contribution to the SoCAB emissions has continued to decrease primarily because of the implementation of various emission reduction programs. From 2010 to 2011, the Port’s contribution to the SoCAB emissions remained the same.
Figure ES.9: Port’s Emission Contribution in the South Coast Air Basin

Inventory of Air Emissions CY 2011
Port of Los Angeles ES-10 July 2012
Table ES.4 presents the total net change in emissions from all source categories in 2011 as compared to previous years. From 2010 to 2011, there was a 1% increase in throughput and emissions changed slightly. The change from the previous year includes emissions of DPM decreased by 7% and NOx decreased by 3%; SOx decreased by 2%; CO increased by 2%; and HC increased by 1%. Between 2005 and 2011 there was a 6% increase in throughput while emissions of DPM decreased by 71%, NOx decreased by 51%, SOx decreased by 76%, CO decreased by 44%, and HC decreased by 37%.
Table ES.4: Port-wide Emissions Comparison, tpy
Year PM10 PM2.5 DPM NOx SOx CO HC
2011 287 258 258 7,989 1,287 2,037 4822010 304 272 276 8,212 1,319 1,995 4762009 491 425 447 10,864 2,435 2,622 5602008 763 655 693 15,024 3,802 3,461 7192007 723 634 627 16,383 3,400 3,659 7782006 1,047 896 947 18,526 5,725 4,185 8662005 980 836 891 16,381 5,325 3,666 770Previous Year (2010-2011) -6% -5% -7% -3% -2% 2% 1%CAAP Progress (2005-2011) -71% -69% -71% -51% -76% -44% -37%
Table ES.5 compares the 2011 port-wide GHG emissions (CO2e) in tonnes to the previous years. GHG emissions have continued to decrease over the years, mainly due to better efficiency and CAAP and regulatory measures that have GHG emission reduction co-benefits.
Table ES.5: Port-wide GHG Emissions Comparison, tonnes
Year CO2e
2011 847,3112010 853,6662009 894,3162008 1,025,1972007 1,095,6802006 1,224,6492005 1,046,434Previous Year (2010-2011) -1%CAAP Progress (2005-2011) -19%

Inventory of Air Emissions CY 2011
Port of Los Angeles ES-11 July 2012
Figures ES.10 through ES.12 show the emission trends for 2005 to 2011 in DPM, NOx and SOx emissions contributions from the ocean-going vessels, harbor craft, cargo handling equipment, locomotives and heavy-duty vehicles emission source categories. As indicated, emissions from all categories have generally decreased over the years, primarily due to the implementation of the Port’s emission reduction programs and the emissions reduction regulations. There are some spikes in emissions due to throughput level changes and changes in regulations and control measures. As shown in Figure ES.10, OGVs contribute the majority of DPM emissions. DPM emissions from all categories have decreased between 2005 and 2011. There was a small increase in locomotive DPM emissions in 2010 and 2011, while DPM emissions from all other source categories decreased in 2010 and 2011. OGV and HDV emissions have significantly decreased in recent years primarily due to the Port’s VSR, CARB’s fuel regulation and the Port’s Clean Truck Program.
Figure ES.10: DPM Emissions Comparison by Category, tpy
Figure ES.11 illustrates that emissions of NOx from HDVs were lowered significantly due to the Clean Truck Program’s second phase implementation in 2010-2011, and OGVs currently dominate the NOx emissions. NOx emissions show a downward trend over the last several years, with a small increase in 2010 and 2011 for locomotives due to an increase in activity (caused by increased throughput) overtaking the decrease in emissions due to fleet turnover and emissions reduction measures implemented in past years.
0
200
400
600
Ocean-goingvessels
Harbor craft Cargohandling
equipment
Locomotives Heavy-dutyvehicles
ton
s p
er y
ear
2005 2006 2007 2008 2009 2010 2011

Inventory of Air Emissions CY 2011
Port of Los Angeles ES-12 July 2012
Figure ES.11: NOx Emissions Comparison by Category, tpy
Figure ES.12 shows that OGVs are by far the largest SOx emissions contributors at the Port. This is because SOx emissions are produced from the sulfur in the fuel burned by engines, and OGV engines typically burn fuels with relatively high sulfur content while the other source categories use fuels that are much lower in sulfur. In 2010 and 2011, the CARB fuel regulation was in place for the whole year and most OGV engines burned marine distillate fuel (with an average of approximately 0.5% sulfur). This resulted in significant reduction in OGV SOx emissions in 2010-2011. The other source categories, with the exception of locomotives, have completely switched to using ultra low sulfur diesel (ULSD) with a sulfur content of 15 parts per million (ppm). The locomotives are also fueled with ULSD when they refuel within California, but the interstate line haul locomotives are carrying a certain amount of out-of-state fuel when they enter the SoCAB, so on average their fuel sulfur content is somewhat higher than 15 ppm.
Figure ES.12: SOx Emissions Comparison by Category, tpy
01,0002,0003,0004,0005,0006,0007,0008,000
Ocean-goingvessels
Harbor craft Cargohandling
equipment
Locomotives Heavy-dutyvehicles
ton
s p
er y
ear
2005 2006 2007 2008 2009 2010 2011
01,0002,0003,0004,0005,0006,000
Ocean-goingvessels
Harbor craft Cargohandling
equipment
Locomotives Heavy-dutyvehicles
ton
s p
er y
ear
2005 2006 2007 2008 2009 2010 2011

Inventory of Air Emissions CY 2011
Port of Los Angeles ES-13 July 2012
To compare emission differences separately from the effects of throughput differences, the Port also calculates emissions on a ton per 10,000 TEU basis, which the Port refers to as emissions efficiency. Emissions efficiency is calculated by dividing the TEU throughput by 10,000, and dividing the result into the number of tons of emissions. Table ES.6 summarizes the annualized emissions efficiencies for all five source categories. The overall port emissions efficiency in 2011 improved for all pollutants as compared to 2005. A positive percentage means an increase in emission efficiency in Table ES.6 and Figure ES.13.
Table ES.6: Emissions Efficiency Metric Comparison, tons/10,000 TEUs
Year PM10 PM2.5 DPM NOx SOx CO HC
2011 0.36 0.32 0.32 10.06 1.62 2.57 0.612010 0.39 0.35 0.35 10.49 1.68 2.55 0.612009 0.73 0.63 0.66 16.10 3.61 3.89 0.832008 0.97 0.83 0.88 19.14 4.84 4.41 0.922007 0.86 0.76 0.75 19.60 4.07 4.38 0.932006 1.24 1.06 1.12 21.87 6.76 4.94 1.022005 1.31 1.12 1.19 21.89 7.11 4.90 1.03Previous Year (2010-2011) 8% 9% 9% 4% 4% -1% 0%CAAP Progress (2005-2011) 73% 71% 73% 54% 77% 48% 41%
Table ES.7 summarizes the annualized emissions efficiencies for the GHG emissions displayed as CO2e. In 2011, the overall port emissions efficiency improved for GHG as compared to 2005 and the previous year.
Table ES.7: GHG Emissions Efficiency Metric Comparison, tonnes/10,000 TEUs
Year CO2e
2011 1,0672010 1,0902009 1,3252008 1,3062007 1,3112006 1,4462005 1,398Previous Year (2010-2011) 2%CAAP Progress (2005-2011) 24%

Inventory of Air Emissions CY 2011
Port of Los Angeles ES-14 July 2012
Figure ES.13 compares emissions efficiency changes between 2011 and 2010 and 2011 and 2005. The purple bar represents TEU throughput change from the previous year (a 1% increase) and the blue bar represents the TEU throughput change when compared with 2005 (a 6% increase). The emissions efficiencies improved for all pollutants (2011-2005 comparison), and for most pollutants (2011-2010 comparison) with the exception of CO and HC.
Figure ES.13: Emissions Efficiency Metric Change
PM10 PM2.5 DPM NOx SOx CO HC TEU
CAAP Standards and Progress One of the main purposes of the annual inventories is to provide a progress update on achieving the CAAP San Pedro Bay Standards. These standards consist of the following reduction goals, compared to the 2005 published inventories Emission Reduction Standard:
o By 2014, reduce emissions by 72% for DPM, 22% for NOx, and 93% for SOx o By 2023, reduce emissions by 77% for DPM, 59% for NOx, and 93% for SOx
Health Risk Reduction Standard: 85% reduction by 2020
0%
25%
50%
75%
100%
8% 9% 9%4% 4%
-1% 0% 1%
73% 71% 73%
54%
77%
48%
41%
6%
Previous Year (2010-2011) CAAP Progress (2005-2011)TEU (2010-2011) TEU (2005-2011)
Inventory of Air Emissions CY 2011
Port of Los Angeles ES-15 July 2012
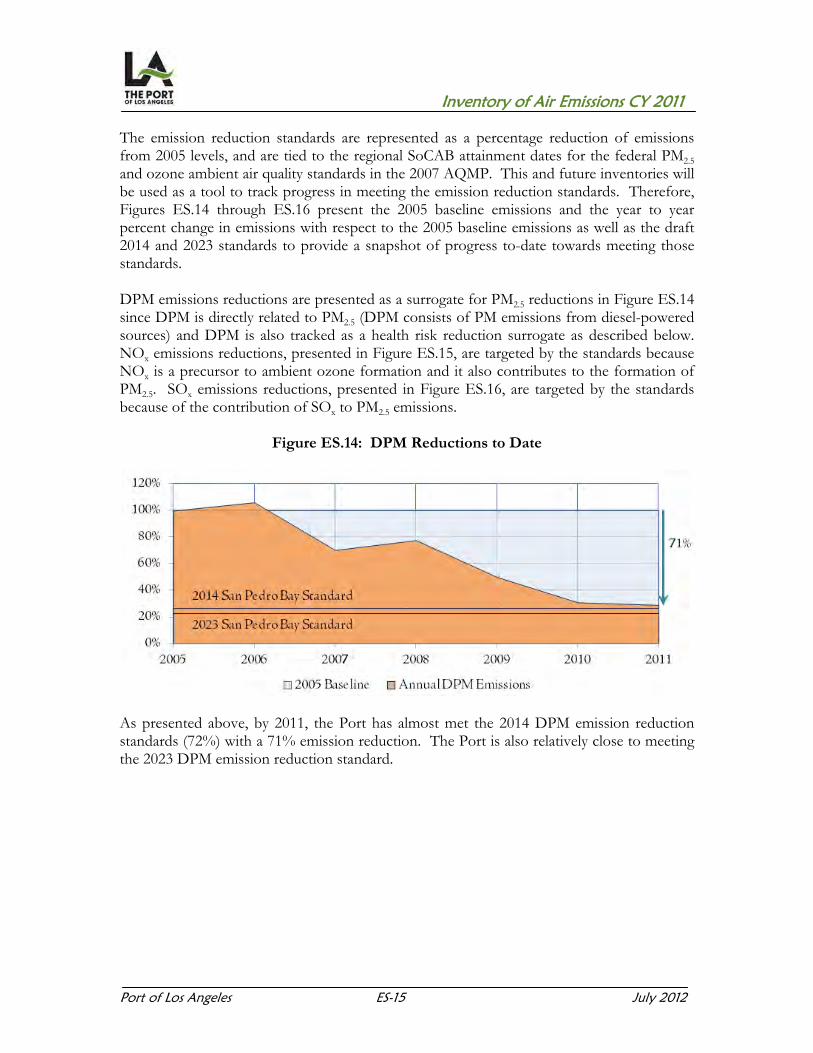
The emission reduction standards are represented as a percentage reduction of emissions from 2005 levels, and are tied to the regional SoCAB attainment dates for the federal PM2.5
and ozone ambient air quality standards in the 2007 AQMP. This and future inventories will be used as a tool to track progress in meeting the emission reduction standards. Therefore, Figures ES.14 through ES.16 present the 2005 baseline emissions and the year to year percent change in emissions with respect to the 2005 baseline emissions as well as the draft 2014 and 2023 standards to provide a snapshot of progress to-date towards meeting those standards. DPM emissions reductions are presented as a surrogate for PM2.5 reductions in Figure ES.14 since DPM is directly related to PM2.5 (DPM consists of PM emissions from diesel-powered sources) and DPM is also tracked as a health risk reduction surrogate as described below. NOx emissions reductions, presented in Figure ES.15, are targeted by the standards because NOx is a precursor to ambient ozone formation and it also contributes to the formation of PM2.5. SOx emissions reductions, presented in Figure ES.16, are targeted by the standards because of the contribution of SOx to PM2.5 emissions.
Figure ES.14: DPM Reductions to Date
As presented above, by 2011, the Port has almost met the 2014 DPM emission reduction standards (72%) with a 71% emission reduction. The Port is also relatively close to meeting the 2023 DPM emission reduction standard.
Inventory of Air Emissions CY 2011
Port of Los Angeles ES-16 July 2012
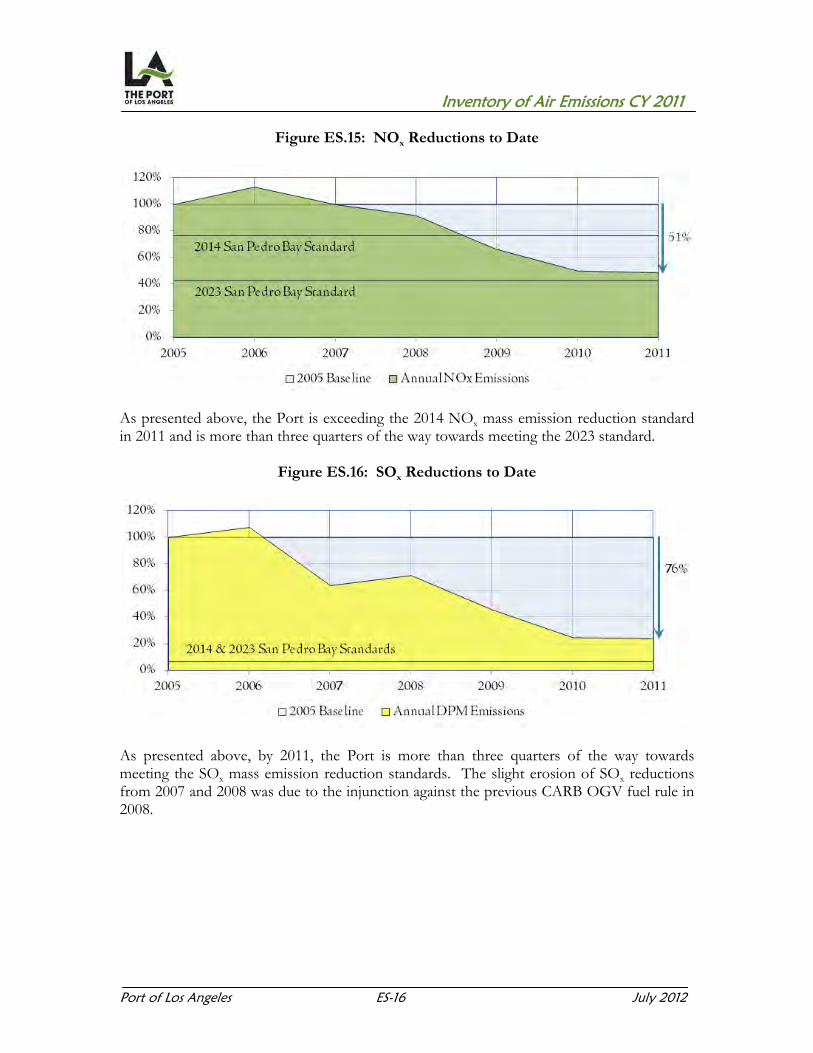
Figure ES.15: NOx Reductions to Date
As presented above, the Port is exceeding the 2014 NOx mass emission reduction standard in 2011 and is more than three quarters of the way towards meeting the 2023 standard.
Figure ES.16: SOx Reductions to Date
As presented above, by 2011, the Port is more than three quarters of the way towards meeting the SOx mass emission reduction standards. The slight erosion of SOx reductions from 2007 and 2008 was due to the injunction against the previous CARB OGV fuel rule in 2008.

Inventory of Air Emissions CY 2011
Port of Los Angeles ES-17 July 2012
Health Risk Reduction Progress As described in the 2010 CAAP Update, the effectiveness of CAAP’s control measures and applicable regulations with respect to the Health Risk Reduction Standard can be tracked by changes in mass emission reductions in DPM from the 2005 baseline. DPM is the predominant contributor to port-related health risk, and the Health Risk Reduction Standard was based on a health risk assessment study that used forecasted reductions in geographically allocated DPM emissions as the key input. Therefore, reductions in DPM mass emissions associated with CAAP measures and applicable regulations are a representative surrogate for health risk reductions. It should be noted that the use of DPM emissions as a surrogate for health risk reductions is to track relative progress. A more detailed health risk assessment will be prepared by the Port outside of this EI. Progress to-date on health risk reduction is determined by comparing the change in DPM mass emissions to the 2005 baseline. Figure ES.17 presents the progress of achieving the standard to date.
Figure ES.17: Health Risk Reduction Benefits to Date
As shown above, by 2011 the Port is over three quarters of the way towards meeting the 2020 Health Risk Reduction Standard


Inventory of Air Emissions CY 2011
Port of Los Angeles 1 July 2012
SECTION 1 INTRODUCTION The Port of Los Angeles (the Port) shares San Pedro Bay with the neighboring Port of Long Beach (POLB). Together, the San Pedro Bay Ports comprise a significant regional and national economic engine for California and the United States (U.S.), through which approximately 33% of all U.S. containerized trade flows6. Economic forecasts suggest that the demand for containerized cargo moving through the San Pedro Bay region will increase over the next two decades7. The economic benefits of the Ports are felt throughout the nation. The ability of the San Pedro Bay Ports to accommodate the projected growth in trade will depend upon the ability of the two ports and their tenants to address adverse environmental impacts and, in particular, air quality impacts that result from such trade. In November 2006, the San Pedro Bay Ports adopted their landmark Clean Air Action Plan (CAAP), designed to reduce health risks and emissions associated with port-related operations while allowing port growth to continue. On November 22, 2010, the harbor commissioners of the two ports unanimously approved an update to the CAAP that identifies longer-term goals that build upon the commitments made in the original CAAP8. In order to track CAAP progress, the Port has committed to develop annual inventories of port-related sources starting with the 2005 Inventory of Air Emissions (which served as the CAAP baseline). The detailed annual activity-based inventory, with associated emissions estimates, is a critical and integral component to the success of the CAAP. Activity-based inventories based on detailed data collected on activities that occurred in a specific time period provide the most detailed inventory of air emissions for port-related sources. Activity-based inventories not only provide a greater understanding of the nature and magnitude of emissions, but also help track progress for the many emission reduction strategies that the Port, a landlord port, and its tenants have undertaken. The Port released its first activity-based emissions inventory in 2004, documenting activity levels in the baseline year of 2001. The 2001 baseline emissions inventory evaluated emissions for all Port terminals from five source categories: ocean-going vessels, harbor craft, off-road cargo handling equipment, railroad locomotives, and on-road heavy-duty vehicles and evaluated operations at all Port terminals. The 2001 inventory provided the basis for the CAAP. In 2007, the Port released the 2005 Inventory of Air Emissions which was the first update to the baseline inventory and also the first of the annual inventories to follow. The Port has subsequently released an annual emissions inventory. These inventory reports are available on the Port’s website9.
6 American Association of Port Authorities (AAPA), North America: Container Port Traffic, 2011. 7 The Tioga Group, Inc., San Pedro Bay Container Forecast Update, Inc., July 2009. 8 Ports of Los Angeles and Long Beach, http://www.cleanairactionplan.org. 9 Port of Los Angeles, http://www.portoflosangeles.org/environment/studies_reports.asp.

Inventory of Air Emissions CY 2011
Port of Los Angeles 2 July 2012
1.1 Scope of Study The scope of the study is described in terms of the year of activity used as the basis of emissions estimates, the pollutants quantified, the included and excluded source categories and the geographical extent. The purpose of the 2011 Inventory of Air Emissions (2011 EI) is to develop emission estimates based on activities that occurred in calendar year 2011. 1.1.1 Pollutants Exhaust emissions of the following pollutants have been estimated:
Particulate matter (PM) (10-micron, 2.5-micron) Diesel particulate matter (DPM) Oxides of nitrogen (NOx) Oxides of sulfur (SOx) Hydrocarbons (HC) Carbon monoxide (CO) Carbon dioxide equivalent (CO2e) Carbon dioxide (CO2) Methane (CH4) Nitrous oxide (N2O)
Particulate matter Particulate matter refers to tiny, discrete solid or aerosol particles in the air. Dust, dirt, soot, and smoke are considered particulate matter. Vehicle exhaust (cars, trucks, buses, among others) are the predominant source of fine particles. Fine particles are a concern because their very tiny size allows them to travel more deeply into lungs, increasing the potential for health risks. Diesel particulate matter Diesel particulate matter is a significant component of PM. Diesel exhaust also includes more than 40 substances that are listed as hazardous pollutants. DPM is considered a surrogate for the effects of both the PM and gaseous component of diesel exhaust. Sources of diesel emissions include diesel-powered trucks, buses, cars (on-road sources); and diesel-powered marine vessels, construction equipment and trains (off-road sources). DPM has been shown to contribute up to 84% of the carcinogenic health risk10 related to the portion of outdoor pollutants classified as “toxics.”
10 AQMD, http://www.aqmd.gov/prdas/matesIII/Final/Document/b-MATESIIIChapter1and2Final92008.pdf’, pages 2-10.

Inventory of Air Emissions CY 2011
Port of Los Angeles 3 July 2012
Oxides of nitrogen Oxides of nitrogen is the generic term for a group of highly reactive gases, all of which contain nitrogen and oxygen in varying amounts. Most oxides of nitrogen are colorless and odorless. NOx forms when fuel is burned at high temperatures, as in a combustion process. Oxides of nitrogen are precursors for ground level ozone formation. Ozone is formed by a reaction involving hydrocarbon and nitrogen oxides in the presence of sunlight. The primary manmade sources of NOx are motor vehicles, electric utilities, and other sources that burn fuels. Exposure to NOx has been connected to a range of respiratory diseases and infections. Exposure to ozone can cause difficulty in breathing, lung damage, and reduced cardiovascular functions. Hydrocarbons Hydrocarbons emissions can be expressed in several ways depending upon measurement techniques and what compounds are included. In general hydrocarbons are a combination of oxygenated (such as alcohols and aldehydes) and non-oxygenated hydrocarbons (such as methane and ethane). Most hydrocarbons serve as fuels for the various sources found at ports. Some examples of hydrocarbon fuels are the components of gasoline, diesel, and natural gas. Hydrocarbon emissions are found in the engine exhaust due to incomplete fuel combustion and also due to fuel evaporation. A number of hydrocarbons are considered toxics which can cause cancer or other health problems. Hydrocarbons are precursor to ground level ozone formation which leads to smog in the atmosphere. Hydrocarbons estimated in this inventory refer to total hydrocarbons. Carbon monoxide Carbon monoxide is a colorless, odorless, toxic gas commonly formed when carbon-containing fuel is not burned completely. Most vehicles are the predominant source of carbon monoxide. CO combines with hemoglobin in red blood cells and decreases the oxygen-carrying capacity of the blood. CO weakens heart contractions, reducing the amount of blood pumped through the body. Greenhouse gases Greenhouse gases (GHG) contribute towards global warming and associated climate change. Global warming is a climate regulating phenomenon which occurs when certain gases in the atmosphere (naturally occurring or due to human activities) trap infrared radiation resulting in an increase in average global temperatures. The first far reaching effort to reduce emissions of GHG was established in the form of the Kyoto Protocol. The Kyoto Protocol is a protocol to the United Nations Framework Connection on Climate Change (UNFCCC) with the goal of reducing emissions of six GHGs. The six GHGs, also referred to as the “six Kyoto gases,” are: CO2, CH4, N2O, SF6, HFCs, PFCs. Guidance to develop national GHG inventories is provided by the Intergovernmental Panel on Climate Change (IPCC), the authoritative scientific body on climate change.

Inventory of Air Emissions CY 2011
Port of Los Angeles 4 July 2012
CO2, CH4, and N2O are emitted naturally or through human activities such as combustion of fossil fuels and deforestation. Sulfur hexafluoride (SF6), hydrofluorocarbons (HFCs) and perfluorocarbons (PFCs) are synthetically produced for industrial purposes. This emissions inventory report includes estimates of CO2, CH4 and N2O from combustion of fuel in cargo handling equipment, harbor craft, on-road heavy-duty trucks, locomotives, and vessel operations associated with port operations. Each GHG differs in its ability to absorb heat in the atmosphere. Estimates of greenhouse gas emissions are often normalized in a single greenhouse gas value known as carbon dioxide equivalents (CO2e), which weights each gas by its global warming potential (GWP) value relative to CO2. To calculate CO2e, the GHG emission estimates are multiplied by its GWP and then summed). The GWP values are as follows:11
CO2 – 1 CH4 – 21 N2O – 310
In this study, the greenhouse gas emissions are shown in metric tons (tonnes) while the criteria pollutant emissions are shown in tons. 1.1.2 Emission Sources The scope of this inventory includes the following five source categories:
Ocean-going vessels (OGV) Harbor craft Cargo handling equipment (CHE) Locomotives Heavy-duty vehicles (HDV)
Examples of the five source categories include the containerships, tankers, and cruise ships that call the Port; the assist tugs and tugboats that assist vessels in the harbor; the cranes and forklifts that may move cargo within the terminals; the locomotives that haul the cargo; and the on-road diesel trucks visiting the terminals that also transport cargo. This inventory does not include stationary sources, as these are included in stationary source permitting programs administered by the South Coast Air Quality Management District (SCAQMD). 1.1.3 Geographical Extent The study includes tenant source category emissions that occur on Port-owned land within the Port boundary/district. An overview of the geographical extent is provided below for each of the source categories.
11 EPA, Inventory of U.S. Greenhouse Gas Emissions and Sinks: 1990-2010, April 2012.
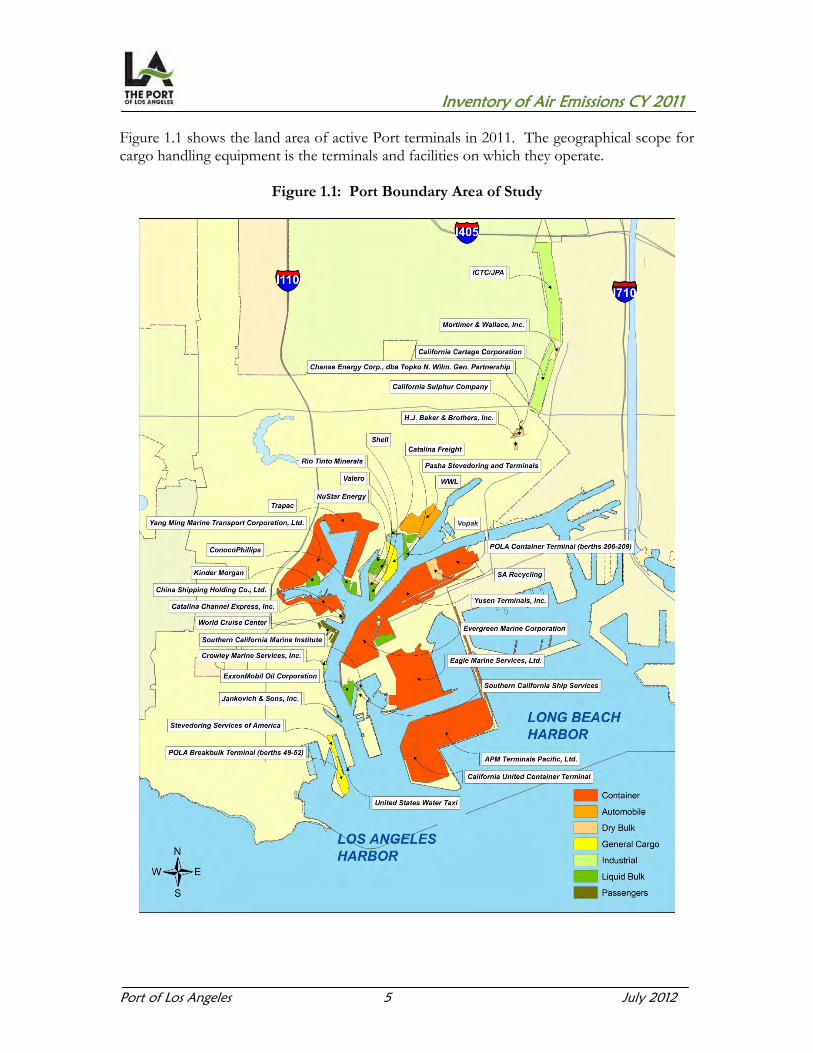
Inventory of Air Emissions CY 2011
Port of Los Angeles 5 July 2012
Figure 1.1 shows the land area of active Port terminals in 2011. The geographical scope for cargo handling equipment is the terminals and facilities on which they operate.
Figure 1.1: Port Boundary Area of Study

Inventory of Air Emissions CY 2011
Port of Los Angeles 6 July 2012
Emissions from switching and line haul railroad locomotives were estimated for on-dock rail yards, off-dock rail yards, intermodal yards, and the rail lines linking these facilities. For heavy-duty trucks related to the hauling of cargo, emissions from queuing at terminal entry gates, from travel and idling within the terminals, and from queuing at the terminal exit gates have been included. In addition to emissions that occur inside the Port facilities, emissions from locomotives and on-road trucks transporting Port cargo have been estimated for port-related activity that occurs within the South Coast Air Basin (SoCAB) boundaries. Emissions are estimated up to first point-of-rest within the SoCAB or up to the basin boundary. Figure 1.2 shows the SoCAB boundary for locomotives and HDV in relation to the location of the Port. Since both the Port and the POLB are interconnected with intermodal transportation linkages, every effort was made to only account for freight movements originating from or having a destination at the Port.
Figure 1.2: South Coast Air Basin Boundary

Inventory of Air Emissions CY 2011
Port of Los Angeles 7 July 2012
For marine vessels (OGVs and commercial harbor craft) the geographical extent of the emissions inventory is based on the same boundary that was used in previous marine vessel inventories developed for the SCAQMD and in the 2001 Baseline EI and subsequent inventories. The northern and southern boundaries are set by the South Coast county boundary which is continued over the water to the California water boundary to the west. The portion of the study area outside the Port’s breakwater is four-sided, and geographically defined by the following coordinates:
Northwest corner: latitude 34-02’-42.4” North (N) by longitude 118-56’-41.2”
West (W) Southwest corner: latitude 33-00’-00.0” N by longitude 119-30’-00.0” W Southeast corner: latitude 32-30’-00.0” N by longitude 118-30’-00.0” W Northeast corner: latitude 33-23’-12.7” N longitude 117-35’-46.4” W
Figure 1.3 shows the geographical extent of the study area for marine vessels (dark blue), the vessel traffic separation zone, and the main arrival and departure vessel flow. The precautionary zone (PZ) is further discussed in Section 3.2. The black line in the figure depicts the 24 nautical miles (nm) of the California coastline subject to the OGV Fuel Regulation. CARB’s State Inventory boundary is depicted by the light blue shading.
Figure 1.3: OGV Inventory Geographical Extent

Inventory of Air Emissions CY 2011
Port of Los Angeles 8 July 2012
1.2 Methodology Comparison In order to make a meaningful comparison between annual emission inventories, the same methodology must be used for estimating emissions for each year. If methodological changes have been implemented for a given source category in 2011 compared with a previous year, then the previous years’ emissions were recalculated using the new 2011 methodology and the previous years' activity data to provide a valid basis for comparison. If there are no changes in methodology, then the emissions estimated for the prior years’ inventory reports were used for the comparison. 1.3 Report Organization This report presents the 2011 emissions and the methodologies used for each category in each of the following sections: Section 2 discusses regulatory and port measures Section 3 discusses ocean-going vessels Section 4 discusses harbor craft Section 5 discusses cargo handling equipment Section 6 discusses locomotives Section 7 discusses heavy-duty vehicles Section 8 discusses findings and results Section 9 compares 2011 emissions to previous years’ emissions Section 10 presents a discussion of anticipated emissions improvements in 2012

Inventory of Air Emissions CY 2011
Port of Los Angeles 9 July 2012
SECTION 2 REGULATORY AND SAN PEDRO BAY PORTS CLEAN AIR ACTION PLAN
(CAAP) MEASURES This section discusses the regulatory initiatives and Port measures related to port activity. Almost all port-related emissions come from five diesel-fueled source categories: OGVs, HDVs, CHE, harbor craft and locomotives. The responsibility for the emissions control of the majority of these sources falls under the jurisdiction of local (South Coast Air Quality Management District (SCAQMD)), state (CARB) or federal (U.S. Environmental Protection Agency (EPA)) agencies. The Ports of Los Angeles and Long Beach adopted the landmark CAAP in November 2006 to curb port-related air pollution from trucks, ships, locomotives, and other equipment. On November 22, 2010, the harbor commissioners of the two ports unanimously approved an update to the CAAP. The 2010 CAAP Update is part of the original pledge to ensure that the CAAP is a "living document" which will be updated as needed to add new emission-control measures. The 2010 CAAP Update sets even more aggressive goals for reducing air pollution and health risks from port operations. A model for seaports around the world, the CAAP, and the 2010 CAAP Update are the boldest air quality initiatives by any seaport, consisting of wide-reaching measures to significantly reduce air emissions and health risks while allowing for the development of much-needed port efficiency projects. San Pedro Bay Standards Included in the 2010 CAAP Update The San Pedro Bay Standards are perhaps the most significant addition to the CAAP and are a statement of the ports’ commitments to significantly reduce the air quality impacts from port operations. Achievement of the standards listed below will require diligent implementation of all of the known CAAP measures and aggressive action to seek out further emissions and health risk reductions from port-related sources from strategies that will emerge over time. Health Risk Reduction Standard To complement the CARB’s Emission Reduction Plan, the Ports of Los Angeles and Long Beach have developed the following standard for reducing overall port-related health risk impacts, relative to 2005 conditions: By 2020, reduce the population-weighted cancer risk of ports-related DPM emissions
by 85% in highly-impacted communities located proximate to port sources and throughout the residential areas in the port region.

Inventory of Air Emissions CY 2011
Port of Los Angeles 10 July 2012
Emission Reduction Standard Consistent with the ports' commitment to meet their fair-share of mass emission reductions of air pollutants, the Ports of Los Angeles and Long Beach have developed the following standards for reducing air pollutant emissions from ports-related activities, relative to 2005 levels: By 2014, reduce emissions of NOx by 22%, of sulfur oxides (SOx) by 93%, and of
DPM by 72% to support attainment of the federal fine particulate matter (PM2.5) standards.
By 2023, reduce emissions of NOx by 59% to support attainment of the federal 8-hour ozone standard. The corresponding SOx and DPM reductions in 2023 are 93% and 77%, respectively.
This section presents a list of regulatory programs and CAAP measures by each major source category that help reduce emissions from the Port. 2.1 Ocean-Going Vessels Emission Standard for Marine Propulsion Engines The International Maritime Organization (IMO) adopted limits for NOx in Annex VI to the International Convention for the Prevention of Pollution from Ships (MARPOL) in 1997. These NOx limits apply to marine engines over 130 kilowatts (kW) installed on vessels built on or after 2000. The current NOx standards vary from 17.0 grams per kilowatt-hour (g/kW-hr) (for < 130 revolutions per minute [rpm]) to 9.8 g/kW-hr (for > 2000 rpm), depending upon the rated engine speed in rpm. The required number of countries ratified the Annex in May 2004 and it went into force for those countries in May of 2005. Engine manufacturers have been certifying engines to the Annex VI NOx limits from 2000 because the standards were retroactive to that year, once Annex VI was ratified. In April 2008, the Marine Environment Protection Committee of the IMO approved a recommendation for new MARPOL Annex VI sulfur limits for fuel and NOx limits for engines. In October 2008, the IMO adopted these amendments to international requirements under MARPOL Annex VI, which place a global limit on marine fuel sulfur content of 3.5% by 2012, reduced from the current 4.5%, which will be further reduced to 0.5% sulfur by 2020, or 2025 at the latest, pending a technical review in 2018.12 In Emissions Control Areas (ECAs), sulfur content will be limited to 1.0% in 2012, and further reduced to 0.1% sulfur in 2015 from the current 1.5% limit. In addition, new engine emission rate limits for NOx for marine diesel engines installed on newly built ships are based on rated engine speed (n) and the year the ship’s keel is laid at the start of construction.
12 EPA, http://www.epa.gov/otaq/regs/nonroad/marine/ci/mepc58-5noxsecretariat.pdf.

Inventory of Air Emissions CY 2011
Port of Los Angeles 11 July 2012
The NOx standards, in grams per kilowatt hour (g/kW-hr), are summarized as follows:
Table 2.1: NOx Limits for Marine Engines, g/kW-hr
Tier Date n < 130
(g/kW-hr)130 < n < 2000
(g/kW-hr)n > 2000
(g/kW-hr)
Tier 1 2000 17.0 45 x n -0.2 9.8 Tier 2 2011 14.4 44 x n -0.23 7.7 Tier 2 2016 3.4 9 x n -0.2 2.0
Finally, existing ships built between 1990 and 2000 would be subject to retrofit requirements of the Tier 1 NOx standard. On July 21, 2008, President George W. Bush signed into law the Maritime Pollution Protection Act of 2008, ratifying MARPOL Annex VI by the United States, and the requirements became enforceable through the Act to Prevent Pollution from Ships (APPS) in January 2009. On March 26, 2010, the IMO officially designated waters within 200 miles of North American coasts as an emission control area (ECA). From the effective date in August 2012 until 2015, fuel used by all vessels operating in this area cannot exceed fuel sulfur content of 1.0%, which will be further reduced to 0.1% beginning in 2015. Also, starting in 2016, NOx after-treatment requirements (Tier 3 standards) will become applicable in this area. EPA’s Final Regulation – Control of Emissions of Air Pollution from Locomotive and Marine Compression Ignited Engines Less than 30 Liters Per Cylinder On March 14, 2008,13 the EPA finalized a three-part program designed to dramatically reduce emissions from marine diesel engines with displacement less than 30 liters per cylinder. These include marine propulsion engines used on vessels and marine auxiliary engines. When fully implemented, this rule will cut PM emissions from these engines by as much as 90 percent and NOx emissions by as much as 80 percent. The regulations introduce two tiers of standards – Tier 3 and Tier 4 – which apply to both new and remanufactured marine diesel engines, as follows: Newly-built engines: Tier 3 standards apply to engines used in commercial, recreational,
and auxiliary power applications (including those below 37 kW that were previously covered by non-road engine standards). The emissions standards for newly-built engines are phasing in, beginning in 2009. Tier 4 standards apply to engines above 600 kW (800 horsepower [hp]) on commercial vessels based on the application of high-efficiency catalytic after-treatment technology, phasing in beginning in 2014.
13 EPA, http://wwww.epa.gov/otaq/regs/nonroad/420f08004.htm#wxhaust.

Inventory of Air Emissions CY 2011
Port of Los Angeles 12 July 2012
Remanufactured engines: The standards apply to commercial marine diesel engines above 600 kW when these engines are remanufactured and will take effect as soon as certified systems are available.
EPA’s Emission Standards for Marine Diesel Engines Above 30 Liters per Cylinder (Category 3 Engines) EPA is pursuing two parallel, related actions for establishing emission standards for Category 3 marine diesel engines: (1) EPA is a member of the U.S. delegation that participated in negotiations at the IMO with regard to amendments to Annex VI that were adopted in October 2008 including additional NOx limits for new engines, additional sulfur content limits for marine fuel, methods to reduce PM emissions, NOx and PM limits for existing engines, and volatile organic compounds limits for tankers. (2) In January 2003, EPA adopted Tier 1 standards for Category 3 marine engines, which went into effect in 2004, establishing NOx standards based upon internationally negotiated emissions rates and readily available emissions-control technology. In December 2009, EPA finalized emission standards for Category 3 marine diesel engines installed on U.S. flagged vessels as well as marine fuel sulfur limits which are equivalent to the amendments recently adopted to MARPOL Annex VI. The final regulation establishes stricter standards for NOx, in addition to standards for HC and CO. The final near-term Tier 2 NOx standards for newly built engines apply beginning in 2011 and will require more efficient use of current engine technologies, including engine timing, engine cooling, and advanced computer controls. The Tier 2 standards will result in a 15 to 25 percent NOx reduction below the current Tier 1 levels. The final long-term Tier 3 standards for newly built engines will apply beginning in 2016 in ECAs and will require the use of high efficiency emission control technology such as selective catalytic reduction to achieve NOx reductions 80 percent below the current levels. These standards are part of EPA’s coordinated strategy for addressing emissions from ocean-going vessels; this strategy also includes implementation of recent amendments to MARPOL Annex VI and designation of U.S. coasts as an ECA. CARB’s Low Sulfur Fuel for Marine Auxiliary Engines, Main Engines, and Auxiliary Boilers On July 24, 2008, CARB adopted low sulfur fuel requirements for marine main engines, auxiliary engines, and auxiliary boilers within 24 nm of the California coastline. The regulation to be implemented in two phases required the use of marine gas oil (MGO) with sulfur content less than 1.5% by weight or marine diesel oil (MDO) with a sulfur content equal to or less than 0.5% by weight. For auxiliary engines, main engines, and boilers, the phase I requirements started July 1, 2009. During Phase II, the use of MGO or MDO with a sulfur content equal to or less than 0.1 % was required in all engines and boilers by January 1, 2012.

Inventory of Air Emissions CY 2011
Port of Los Angeles 13 July 2012
In October 2011, the Office of Administrative Law (OAL) approved CARB’s proposed amendment14 to the low sulfur fuel requirement as follows: Starting in August 2012, sulfur requirement of MGO is reduced from 1.5% to 1.0%
and there is no change in sulfur requirement of MDO. The Phase II requirement has been delayed from January 2012 to January 2014 to
more closely coincide with ECA Phase 2 and meet SCAQMD’s AQMP goals. The regulatory boundary was expanded in Southern California to be consistent with
the Contiguous Zone. This new boundary includes the region 24 nm from the California shoreline, including 24 nm from the shoreline of the Channel Islands. There is also a small region near the north end of the Santa Barbara Channel that was excluded from the regulatory boundary to encourage vessels to use the established shipping lanes in the Channel. Figure below shows the previous and the current (shown as proposed in the figure) traffic route covered by the regulation15.
Figure 2.1: CARB Marine Fuel Regulation Boundary
14 CARB, http://www.arb.ca.gov/regact/2011/ogv11/ogv11.htm. 15 CARB, http://www.arb.ca.gov/regact/2011/ogv11/ogv11appc.pdf.

Inventory of Air Emissions CY 2011
Port of Los Angeles 14 July 2012
CARB’s Regulation to Reduce Emissions from Diesel Auxiliary Engines on Ocean-Going Vessels While at Berth at a California Port16 On December 6, 2007, CARB adopted a regulation to reduce emissions from diesel auxiliary engines on OGVs while at-berth for container, cruise, and refrigerated cargo vessels. The regulation requires that auxiliary diesel engines on OGVs are shut down for specified percentages of fleet’s visits and also the fleet’s at-berth auxiliary engine power generation to be reduced by the same percentages. While the use of shore power is expected to be the primary means of compliance, as an alternative, vessel operators may employ any combination of clean emissions control technologies to achieve equivalent reductions. Specifically, by 2014, vessel operators relying on shore power are required to shut down their auxiliary engines at berth for 50 percent of the fleet’s vessel visits and also reduce their onboard auxiliary engine power generation by 50 percent. The specified percentages will increase to 70 percent in 2017 and 80 percent in 2020. For vessel operators choosing the emission reduction equivalency alternative, the regulation requires a 10% reduction in OGV hotelling emissions starting in 2010, increasing in stringency to an 80% reduction by 2020. CARB Vessel Speed Reduction Program In order to meet the mandates of AB 32, the California Global Warming Solution Act, under CARB’s Scoping Plan, implementation of VSR has been identified as one of the early action plan measures. CARB plans to evaluate the emissions benefit associated with this measure and the best approach to implement it through regulatory or volunteer/incentive-based approach. Since 2009, CARB staff has not engaged in any activity related to this measure. CAAP Measure- San Pedro Bay Ports (SPBP)-OGV1; Vessel Speed Reduction (VSR) Program In May 2001, a Memorandum of Understanding (MOU) between the Port, the Port of Long Beach, EPA Region 9, CARB, SCAQMD, the Pacific Merchant Shipping Association (PMSA), and the Marine Exchange of Southern California was signed. This MOU called for OGVs to voluntarily reduce speed to 12 knots at a distance of 20 nm from Point Fermin. Reduction in speed demands less power from the main engine, which in turn reduces NOx emissions and fuel usage. The term of this MOU expired in 2004; the updated measure OGV1 continues and expands the VSR program by continuing the 12 knot VSR zone between Point Fermin and the 20 nm distance, and expanding it to 40 nm from Point Fermin. There are three primary implementation approaches for this measure: 1) continuation of the voluntary program, 2) incorporation of VSR requirements in new leases, and 3) CARB's VSR strategy. Parallel to the voluntary, incentive based strategies, compliance with the VSR program to 40 nm from Point Fermin will be negotiated into new and re-negotiated lease requirements. In addition, the ports intend to work closely with CARB to facilitate a statewide VSR program and ensure that the programs are aligned.
16 CARB, http://www.arb.ca.gov/regact/2007/shorepwr07/shorepwr07.htm.
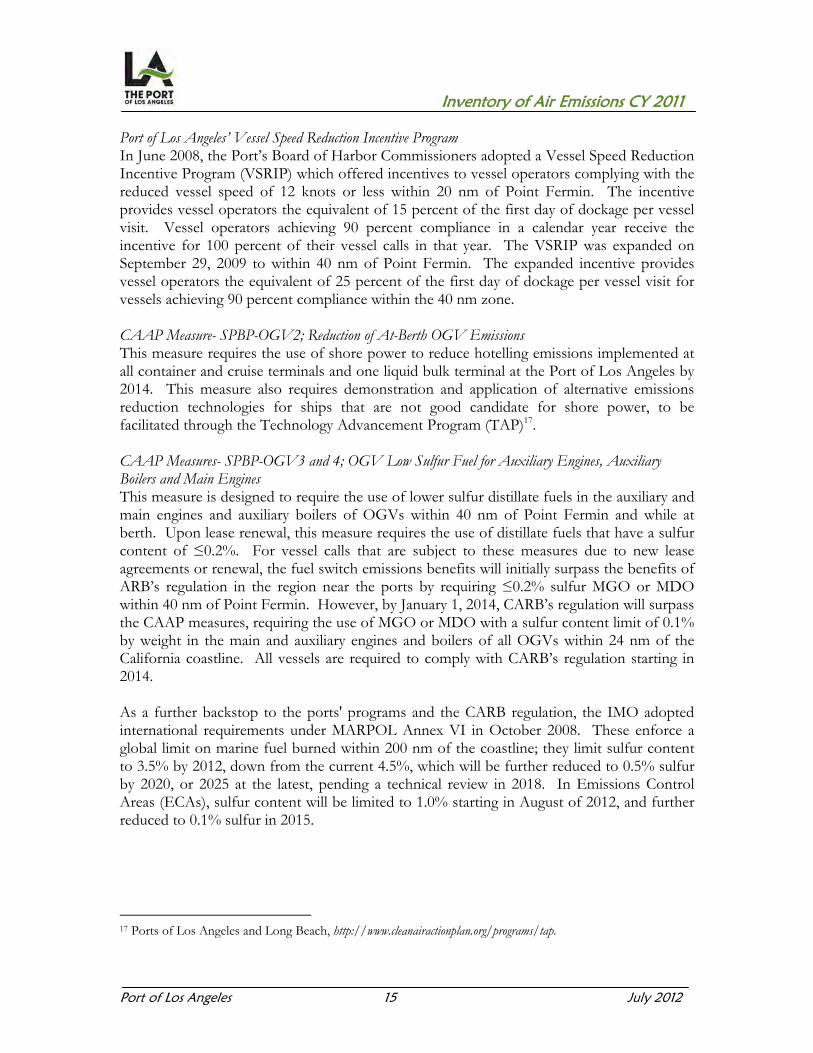
Inventory of Air Emissions CY 2011
Port of Los Angeles 15 July 2012
Port of Los Angeles’ Vessel Speed Reduction Incentive Program In June 2008, the Port’s Board of Harbor Commissioners adopted a Vessel Speed Reduction Incentive Program (VSRIP) which offered incentives to vessel operators complying with the reduced vessel speed of 12 knots or less within 20 nm of Point Fermin. The incentive provides vessel operators the equivalent of 15 percent of the first day of dockage per vessel visit. Vessel operators achieving 90 percent compliance in a calendar year receive the incentive for 100 percent of their vessel calls in that year. The VSRIP was expanded on September 29, 2009 to within 40 nm of Point Fermin. The expanded incentive provides vessel operators the equivalent of 25 percent of the first day of dockage per vessel visit for vessels achieving 90 percent compliance within the 40 nm zone. CAAP Measure- SPBP-OGV2; Reduction of At-Berth OGV Emissions This measure requires the use of shore power to reduce hotelling emissions implemented at all container and cruise terminals and one liquid bulk terminal at the Port of Los Angeles by 2014. This measure also requires demonstration and application of alternative emissions reduction technologies for ships that are not good candidate for shore power, to be facilitated through the Technology Advancement Program (TAP)17. CAAP Measures- SPBP-OGV3 and 4; OGV Low Sulfur Fuel for Auxiliary Engines, Auxiliary Boilers and Main Engines This measure is designed to require the use of lower sulfur distillate fuels in the auxiliary and main engines and auxiliary boilers of OGVs within 40 nm of Point Fermin and while at berth. Upon lease renewal, this measure requires the use of distillate fuels that have a sulfur content of ≤0.2%. For vessel calls that are subject to these measures due to new lease agreements or renewal, the fuel switch emissions benefits will initially surpass the benefits of ARB’s regulation in the region near the ports by requiring ≤0.2% sulfur MGO or MDO within 40 nm of Point Fermin. However, by January 1, 2014, CARB’s regulation will surpass the CAAP measures, requiring the use of MGO or MDO with a sulfur content limit of 0.1% by weight in the main and auxiliary engines and boilers of all OGVs within 24 nm of the California coastline. All vessels are required to comply with CARB’s regulation starting in 2014. As a further backstop to the ports' programs and the CARB regulation, the IMO adopted international requirements under MARPOL Annex VI in October 2008. These enforce a global limit on marine fuel burned within 200 nm of the coastline; they limit sulfur content to 3.5% by 2012, down from the current 4.5%, which will be further reduced to 0.5% sulfur by 2020, or 2025 at the latest, pending a technical review in 2018. In Emissions Control Areas (ECAs), sulfur content will be limited to 1.0% starting in August of 2012, and further reduced to 0.1% sulfur in 2015.
17 Ports of Los Angeles and Long Beach, http://www.cleanairactionplan.org/programs/tap.

Inventory of Air Emissions CY 2011
Port of Los Angeles 16 July 2012
CAAP Measure- SPBP-OGV5 and 6; Cleaner OGV Engines and OGV Engine Emissions Reduction Technology Improvements Measure OGV5 seeks to maximize the early introduction and preferential deployment of vessels to the San Pedro Bay Ports with cleaner/newer engines meeting the new IMO NOx standard for ECAs. Measure OGV6 focuses on reducing DPM and NOx from the legacy fleet through identification and deployment of effective emission reduction technologies. In order to advance the goals of OGV5 and 6, the Port of Los Angeles Board of Harbor Commissioners approved a voluntary Environmental Ship Index (ESI) Program18 in May 2012. This program rewards vessel operators for reducing NOx, SOx and DPM emissions from their ocean going vessels (OGVs) in advance of regulations including CARB’s fuel switch regulation. This program also rewards operators for going beyond compliance by bringing their newest and cleanest vessels to the Port and demonstrating technologies onboard their vessels. After registering with ESI and Los Angeles Harbor Department, the vessel operators are eligible to obtain three types of incentives which are additive. The ESI in incentive amount ranges between $250 per call to $1,250 per call. Under the OGV5 element, vessel operators who bring vessels with IMO rated Tier 2 and Tier 3 main engines will get rewarded with $750 per call for bringing in Tier 2 vessel and $3,250 per call for bringing in Tier 3 vessel. Under OGV6 element, vessel operators that demonstrate main engine DPM and NOx reducing technologies get rewarded with $750 per call. This program is scheduled to start on July, 1, 2012. . CARB’s Regulation Related to Ocean-going Ship Onboard Incineration This regulation was adopted by CARB’s board in 2005 and amended in 2006. As of November 2007, it prohibits all cruise ships and ocean-going vessels of 300 registered gross tons or more from conducting on-board incineration within 3 nm of the California coast. Enactment of this regulation was expected to reduce toxics air contaminants such as dioxins and toxics metals exposure to the public. It was also expected to reduce PM and hydrocarbon emissions generated during incineration. 2.2 Harbor Craft CARB’s Low Sulfur Fuel Requirement for Harbor Craft In 2004, CARB adopted a low sulfur fuel requirement for harbor craft. Starting January 1, 2006 (in SoCAB) harbor craft are required to use on-road diesel fuel (e.g., ultra-low sulfur diesel [ULSD]), which has a sulfur content limit of 15 parts per million (ppm) and a lower aromatic hydrocarbon content. The use of lower sulfur and aromatic fuel has resulted in NOx and DPM reductions. In addition, the use of low sulfur fuel will facilitate retrofitting harbor craft with emissions control devices such as diesel particulate filters (DPFs) that have the potential to reduce PM by an additional 85%. 18 Port of Los Angeles, http://www.portoflosangeles.org/pdf/esi_fact_sheet.pdf.
Inventory of Air Emissions CY 2011
Port of Los Angeles 17 July 2012
EPA’s Emission Standards for Harbor Craft Engines On March 14, 2008, EPA finalized the latest regulation establishing new emission standards for new Category 1 and Category 2 diesel engines rated over 50 horsepower (hp) used for propulsion in most harbor craft. The new Tier 3 engine standards began phasing in starting in 2009. The more stringent Tier 4 engine standards (based on the application of high-efficiency catalytic after treatment technologies) will phase in beginning in 2014 and will apply only to commercial marine diesel engines greater than 800 hp. The regulation also includes requirements for remanufacturing commercial marine diesel engines greater than 800 hp. CARB’s Regulation to Reduce Emissions from Diesel Engines on Commercial Harbor Craft19 As a part of the Diesel Risk Reduction Plan and Goods Movement Plan, in November 2007, CARB adopted a regulation that reduces DPM and NOx emissions from new and in-use commercial harbor craft operating in Regulated California Waters (i.e., internal waters, ports, and coastal waters within 24 nm of the California coastline). Under CARB’s definition, commercial harbor craft include tug boats, tow boats, ferries, excursion vessels, work boats, crew boats, and fishing vessels. This regulation implements stringent emission limits from auxiliary and propulsion engines installed in commercial harbor craft. In 2010, CARB adopted amendments to the regulation which added specific in-use requirements for barges, dredges, and crew/supply vessels. All in-use, newly purchased, or replacement engines must meet EPA’s most stringent emission standards per a compliance schedule set by the CARB for in-use engines and from new engines at the time of purchase. In addition, the propulsion engines on all new ferries, with the capacity of more than 75 passengers, acquired after January 1, 2009, will be required to use control technology that represents the best available control technology in addition to an engine that meets the Tier 2 or Tier 3 EPA marine engine standards, as applicable, in effect at the time of vessel acquisition. For harbor craft with home ports in the SCAQMD, the compliance schedule is accelerated by two years (compared to statewide requirements) in order to achieve the earlier emission benefits required in SCAQMD. The in-use emission limits only apply to ferries, excursion vessels, tug boats, tow boats, and crew boats20. The compliance schedule for in-use engine replacement began in 2009. As of April 2012, CARB received United States Environmental Protection Agency (EPA) authorization to enforce the original Commercial Harbor Craft Regulation, including new and in-use engine emission limits. EPA’s authorization to enforce CARB’s regulation for crew/supply boats is still pending. CAAP Measure- SPBP-HC1- Performance Standards for Harbor Crafts All harbor craft operating in the San Pedro Bay are required to comply with the CARB harbor craft regulation. Besides the implementation of CARB’s In-Use Harbor Craft regulation and the EPA’s recently adopted Tier 3 and 4 standards, the ports are working
19 CARB, http://www.arb.ca.gov/regact/2007/chc07/isor.pdf. 20 CARB, http://www.arb.ca.gov/regact/2010/chc10/harborcraftisor.pdf.

Inventory of Air Emissions CY 2011
Port of Los Angeles 18 July 2012
towards a goal of repowering all harbor craft home based in the San Pedro Bay to Tier 3 levels, within five years after the Tier 3 engines are available and use of shore power at their home port location. Ports plan to accelerate harbor craft emission reductions through emerging technologies such as the hybrid tug, new more-efficient engine configurations, alternative fuels and shore power for tugs at-berth and at the staging areas, through incentives or voluntary measures. 2.3 Cargo Handling Equipment Emission Standards for Non-Road Diesel Powered Equipment The EPA’s and CARB’s Tier 1, Tier 2, Tier 3, and Tier 4 (interim Tier 4 and final) emissions standards for non-road diesel engines require compliance with progressively more stringent standards for hydrocarbon, CO, DPM, and NOx. Tier 4 standards for non-road diesel powered equipment complement the 2007+ on-road heavy-duty engine standards which require 90 percent reductions in DPM and NOx compared to current levels. In order to meet these standards, engine manufacturers will produce new engines with advanced emissions control technologies similar to those already in place for on-road heavy-duty diesel vehicles. These standards for new engines will be phased in starting with smaller engines in 2008 until all but the very largest diesel engines meet NOx and PM standards in 2015. Currently, the interim Tier 4 standards include a 90% reduction in PM and a 60% reduction in NOx. CARB’s Cargo Handling Equipment Regulation In December of 2005 CARB adopted a regulation designed to reduce emissions from (CHE) such as yard tractors and forklifts starting in 2007. The regulation calls for the replacement or retrofit of existing engines with engines that use Best Available Control Technology (BACT). Beginning January 1, 2007 the regulation requires newly purchased, leased, or rented yard tractors to be equipped with a 2007 or later on-road engine or a Final Tier 4 off-road engine. Newly purchased, leased, or rented non-yard tractors must be equipped with a certified on-road or off-road engine meeting the current model year standards in effect at the time the engine is added to the fleet. If the engine is pre-2004, then the highest level available Verified Diesel Emission Control System (VDEC) must be installed within one year. In-use yard tractors are required to meet either 2007 or later certified on-road engine standards, Final Tier 4 off-road engine standards, or install verified controls that will result in equivalent or fewer DPM and NOx emissions than a Final Tier 4 off-road engine. In-use non-yard tractors must either install the highest level available VDEC and/or replace to an on-road or off-road engine meeting the current model year standards. For all CHE, compliance dates are phased in beginning December 31, 2007, based on the age of the engine and number of equipment in each model year group. In September of 2011, CARB’s board adopted amendment21 to the original regulation described above. The amendment provides additional flexibility in the options needed to control CHE emissions.
21 CARB, http://www.arb.ca.gov/regact/2011/cargo11/cargo11.htm.

Inventory of Air Emissions CY 2011
Port of Los Angeles 19 July 2012
As of April 2012, CARB received EPA authorization to enforce the Cargo Handling Equipment Regulation, including new and in-use engine emission limits. New Emission Standards, Test Procedures, and Fleet Requirements for Large Spark Ignition (LSI) Engine Forklifts and Other Industrial Equipment Since 2007, CARB has promulgated more stringent emissions standards for hydrocarbon and oxides of nitrogen combined (HC + NOx), emissions test procedures and fleet average emissions requirements for the existing fleet for LSI engines with horse power rating of 25 horsepower or greater. The regulation also establishes verification procedures for manufacturers of retrofit emission control systems. The fleet requirements only apply to forklifts, sweepers/scrubbers, industrial tow tractors, and ground support equipment. The stringent new engine emission standards and test procedures22 are implemented in two phases. First phase (2.0 g/hp-hr of HC + NOx) was implemented for engines built between January 1, 2007 to December 31, 2009. The second phase (0.6 g/hp-hr of HC + NOx) was implemented for engines built starting with January 1, 2010. The fleet requirements23 for HC + NOx standards are phased in January 1, 2009, January 1, 2011 and January 1, 2013. Depending upon the size of the fleet, the fleet standards vary within the same year of implementation. CAAP Measure- SPBP-CHE1- Performance Standards for CHE This measure calls for CHE emission reductions beyond CARB’s CHE regulation at the time of terminal lease renewal. As of 2007, all CHE purchases must meet the performance standards of the cleanest available NOx alternative-fueled engine meeting 0.01 grams per brake horsepower-hour (g/bhp-hr) PM, available at time of purchase; or cleanest available NOx diesel-fueled engine meeting 0.01 g/bhp-hr PM, available at time of purchase. If there are no engines available that meet 0.01 g/bhp-hr PM, then must purchase cleanest available engine (either fuel type) and install cleanest VDEC available. In addition, as of the end of 2010, all yard tractors operating at the San Pedro Bay Ports are required to meet at a minimum the EPA 2007 on-road or Tier 4 engine standards. By the end of 2012, all pre-2007 on-road or pre Tier 4 off-road top picks, forklifts, reach stackers, rubber tired gantry cranes (RTGs), and straddle carriers <750 hp must meet, at a minimum, the EPA 2007 on-road engine standards or Tier 4 off-road engine standards. By end of 2014, all CHE with engines >750 hp must meet at a minimum the EPA Tier 4 off-road engine standards. Starting in 2007 (until equipment is replaced with Tier 4), all CHE with engines >750 hp will be equipped with the cleanest available VDEC verified by CARB.
22 CARB, http://www.arb.ca.gov/regact/2008/lsi2008/lsi2008.htm. 23 CARB, http://www.arb.ca.gov/regact/2010/offroadlsi10/offroadlsi10.htm.
Inventory of Air Emissions CY 2011
Port of Los Angeles 20 July 2012
2.4 Locomotives EPA’s Emission Standards for New and Remanufactured Locomotives and Locomotive Engines- Latest Regulation24 In March 1998, EPA adopted Tier 0 (1973-2001), Tier 1 (2002-2004), and Tier 2 (2005+) emission standards applicable to newly manufactured and remanufactured locomotives and locomotive engines. These standards require compliance with progressively more stringent standards for emissions of hydrocarbon, CO, NOx, and DPM. Although the most stringent standard, Tier 2, results in over 40% reduction in NOx and 60% reduction in DPM compared to Tier 0, the full potential of these reductions will not be realized in the next five years because of the long life of diesel locomotive engines. In March 2008, EPA adopted its final regulation – “Control of Emissions of Air Pollution from Locomotive and Marine Compression Ignited Engines Less than 30 Liters per Cylinder.”25 When fully implemented, this rule will cut PM emissions from these engines by as much as 90% and NOx emissions by as much as 80%. The regulation introduces two tiers of standards – Tier 3 and Tier 4 – which apply to new locomotives as well as standards for remanufactured locomotives, as follows:
Newly-Manufactured Locomotives: The new Tier 3 emission standards will achieve 50
percent reduction in PM beyond the Tier 2 standard and will become effective in 2012 for line haul engines and 2011 for switching engines. Tier 3 PM standards are 50% lower than Tier 2 PM emission standard. The longer term Tier 4 emission standards which are based on the application of high efficiency catalytic after-treatment technologies for NOx and PM will become effective in 2015 and will achieve about 80 percent reduction in NOx and PM compared to Tier 2 standards.
Remanufactured Locomotives: The regulation also establishes emission standards for remanufactured Tier 0, 1, and 2 locomotives which would achieve 50 to 60 percent reduction in PM and 0 to 20 percent reductions in NOx.
EPA’s Control of Emissions of Air Pollution from Nonroad Diesel Engines and Fuel In 2012, the 15 ppm sulfur cap for locomotive and marine engine diesel fuel will go into effect. This will affect mainly interstate line-haul locomotives since there are stricter fuel regulations already in place in California for intrastate locomotives and marine diesel fuel. CARB’s Low Sulfur Fuel Requirement for Intrastate Locomotives In 2004, CARB adopted a low sulfur fuel requirement for intrastate locomotives. Intrastate locomotives are defined as those locomotives that operate at least 90 percent of the time within the borders of the state, based on hours of operation, miles traveled, or fuel consumption. Mostly applicable to switchers, since January 1, 2007, statewide, intrastate
24 EPA, http://www.epa.gov/otaq/regs/nonroad/420f08004.htm. 25 EPA, Control of Emissions of Air Pollution from Locomotive and Marine Compression Ignited Engines Less than 30 Liters per Cylinder, March 2008.
Inventory of Air Emissions CY 2011
Port of Los Angeles 21 July 2012
locomotives have been required to use CARB off-road diesel fuel which has a sulfur content limit of 15 ppm sulfur and a lower aromatic content26. The use of fuel with lower sulfur and aromatics results in NOx and DPM reductions. In addition, use of low sulfur fuel facilitates retrofitting locomotives with emissions control devices such as DPFs that have potential to reduce DPM by 85%. Statewide 1998 and 2005 Memorandum of Understanding (MOUs) In order to accelerate the implementation of Tier 2 engines in the SoCAB, CARB, and EPA Region 9 entered into an enforceable MOU in 1998 with the two major Class 1 freight railroads operating in California. This MOU requires Union Pacific Railroad (UP) and Burlington Northern Santa Fe Railway Company (BNSF) to concentrate their nation-wide introduction of Tier 2 locomotives preferentially within the SoCAB, which will achieve a 65% reduction in NOx by 2010. In 2005, CARB entered into another MOU with UP and BNSF whereby these two railroads have agreed to phase out non-essential idling and install idling reduction devices, identify, and expeditiously repair locomotives that smoke excessively and maximize the use of 15 ppm sulfur fuel. In addition to the 1998 and 2005 MOUs between CARB and the Class 1 rail operators described above, in June 2010, CARB’s staff proposed, on voluntary basis, railyard-specific commitments27 with Class 1 operators to accelerate further DPM emission and risk reductions at four railyards in the South Coast Air Basin, including the Intermodal Container Transfer Facility (ICTF) located in the port area. The voluntary commitments established reporting and tracking mechanisms and deadlines to accelerate reductions of DPM emissions. The rail commitments required Class 1 operators to reduce DPM emissions by 85 percent by 2020 relative to 2005 emission levels within the fence line of each of the four railyards. These reductions are irrespective of future growth of operations at those railyards. Specific strategies to achieve this level of reduction are up to the discretion of the Class 1 operators, and could include a combination of cleaning up their fleet of cargo handling equipment, drayage trucks, switcher locomotives, or line haul locomotives. In addition to 85% DPM reduction in 2020, there is a commitment for each of the four railyards to achieve certain percentage of emissions reduction in the interim years from 2011 to 2020. At the June 2010 board hearing, CARB’s board adopted a resolution that gave CARB’s executive officer authority to further strengthen and approve the 2010 Commitments after performing additional environmental analysis and meetings with the railroads. As a result, in January 2011, CARB revised the commitment28 to establish enforceable emission caps and other requirements, tracking mechanisms and deadlines to further reduce harmful diesel PM through 2020. The diesel PM emission caps for each railyard have not changed from the June 2010 proposal.
26 CARB, http://www.arb.ca.gov/msprog/offroad/loco/loco.htm#intrastate. 27 CARB, http://www.arb.ca.gov/railyard/commitments/staffreport061710.pdf. 28 CARB, http://www.arb.ca.gov/railyard/commitments/suppcomceqa070511.pdf.

Inventory of Air Emissions CY 2011
Port of Los Angeles 22 July 2012
CAAP Measure- SPBP-RL1- Pacific Harbor Line (PHL) Rail Switch Engine Modernization This measure implements the switch locomotive engine modernization and emission reduction requirements included in the operating agreements between the ports and PHL. In 2010, PHL and the ports entered into a third amendment to their operating agreements which facilitated upgrade of the Tier 2 switcher locomotive fleet to meet “Tier 3-plus” standards. “Tier 3-plus” standards have PM emissions that are exceeding Tier 3 PM emission rates but not meeting Tier 4 standards. By the end of 2011, PHL upgraded all 17 of their Tier 2 switcher locomotives to meet “Tier 3-plus” standards. CAAP Measure- SPBP-RL2- Class 1 Line-haul and Switcher Fleet Modernization The focus of this measure is to identify the emission reductions associated with the CARB Class 1 railroads MOU and the 2008 EPA locomotive engine standards. The ultimate goal of this measure is that by 2023, all Class 1 locomotives entering the ports will meet emissions equivalent to Tier 3 locomotive standards. CAAP Measure- SPBP-RL3- New and Redeveloped Near-Dock Rail Yards This measure focuses on new and redeveloped near-dock rail facilities located on port properties. The goal of this measure is to incorporate the cleanest locomotive, CHE, and HDV technologies into near-dock rail operations. One of the significant goals of this measure is to achieve significant reductions in locomotive emissions through the accelerated turnover of the existing locomotive fleet to newer, lower emitting models. The ports will work with regulatory agencies (EPA, CARB, and SCAQMD) and rail operators toward the goal of achieving a line-haul and switcher locomotive fleet with an emissions equivalent of 95% Tier 4 compliant engines operating within the ports by 2020, and statewide, as expeditiously as possible. 2.5 Heavy-Duty Vehicles Emission Standards for New 2007+ On-Road Heavy-Duty Vehicles In 2001, CARB adopted EPA’s stringent emission standards for 2007+ HDVs, resulting in 90% reductions in emissions of NOx and PM. This regulation required HDV engine manufacturers to meet a 0.01 g/bhp-hr PM standard starting in 2007, which is 90% lower than the 2004 PM standard of 0.1 g/bhp-hr and a phase-in of a 0.2 g/bhp-hr NOx standard between 2007 and 2010. By 2010, all engines were required to meet the 0.2 g/bhp-hr NOx standard, which represents a greater than 90% reduction compared to the 2004 NOx standard of 2.4 g/bhp-hr. Between 2007 and 2010, on average, manufacturers produced HDV engines meeting the PM standard of 0.01 g/bhp-hr and a NOx standard of 1.2 g/bhp-hr. This latter standard is referred to as the 2007 interim standard.
Inventory of Air Emissions CY 2011
Port of Los Angeles 23 July 2012
Heavy-Duty Vehicle On-Board Diagnostics (OBD) Requirement In 2005, CARB adopted a comprehensive HDV OBD regulation, which ensures that the increasingly stringent HDV emissions standards being phased in are maintained during each vehicle’s useful life. The OBD regulation requires manufacturers to install a system in HDVs to monitor virtually every emissions related component of the vehicle. The OBD regulation will be phased in beginning with the 2010 model years with full implementation required by 2016. Ultra-Low Sulfur Diesel (ULSD) Fuel Requirement In 2003, CARB adopted a regulation requiring that diesel fuel produced or offered for sale in California for use in any on-road or non-road vehicular diesel engine (with the exception of locomotive and marine diesel engines) contain no more than 15 ppm of sulfur (S) by weight, beginning June of 2006, statewide. This ultra low sulfur diesel (ULSD) fuel is needed in order for retrofit technologies, such as diesel particulate filters, to work successfully. CARB’s Regulation for Reducing Emissions from On-Road Heavy-Duty Diesel Trucks Dedicated to Goods Movement at California Ports As a part of CARB’s emissions reduction plan for ports and goods movement in California, in December of 2007, CARB adopted a regulation designed to modernize the class 8 (trucks with gross vehicle weight rating greater than 33,000 pounds) drayage truck fleet in use at California’s ports. This objective is to be achieved in two phases:
1) By December 31, 2009, all pre-1994 model year (MY) engines were to be retired or
replaced with 1994 and newer MY engines. Furthermore, all drayage trucks with 1994 – 2003 MY engines were required to achieve an 85 percent PM emission reduction through the use of a CARB approved Level 3 VDEC.
2) By December 31, 2013, all trucks operating at California ports must comply with the 2007+ on-road heavy-duty truck engine standards.
In December 2010, CARB’s Board acted on amendments that staff had proposed to the drayage truck regulation. It specifically included Class 7 drayage trucks (with gross vehicle weight rating greater than 26,000 pounds and less than 33,001 pounds) in the drayage truck regulation as follows: (a) to accelerate the filter requirement to January 1, 2012 for Class 7 drayage trucks in the SoCAB, and (b) to require Class 7 drayage trucks statewide to operate with 2007 or newer emission standard engines by January 1, 2014. In addition, CARB expanded the definition of drayage trucks to include those non-compliant trucks that may not directly come to the ports to pick up or drop off cargo but that engage in moving cargo destined to or originated from port facilities to or from near-port facilities or rail yards. This practice, known as “dray-offs,” reduces the effectiveness of the drayage truck regulation because otherwise non-compliant trucks still operate near the ports and rail yards.

Inventory of Air Emissions CY 2011
Port of Los Angeles 24 July 2012
CARB’s On-Road Heavy-Duty Diesel Vehicles (In-Use) Regulation In December 2008, CARB adopted a regulation that places requirements on in-use HDVs operating throughout the state. Under the regulation, existing HDVs are required to be replaced with HDVs meeting the latest NOx and PM Best Available Control Technology (BACT), or retrofitted to meet these levels. By January 1, 2021, all MY 2007 class 8 drayage trucks are required to meet NOx and PM BACT (i.e. 2010+ EPA engine standards). MY 2008 and MY 2009 must be replaced with 2010+ engines by January 1, 2022 and January 1, 2023 respectively. CARB’s Heavy-Duty Vehicle Greenhouse Gas Emission Reduction Regulation In December 2008, CARB adopted a new regulation to reduce greenhouse gas emissions by improving the fuel efficiency of heavy-duty tractors that pull 53-foot or longer box-type trailers through improvements in tractor and trailer aerodynamics and the use of low rolling resistance tires. All pre-2011 MY tractors, that pull affected trailers, are required to use SmartWay verified low rolling resistance tires beginning January 1, 2012. Pre-2011 MY 53-foot or longer-type box trailers are required to be SmartWay certified or retrofitted with SmartWay verified technologies by December 31, 2012 with the exception of 2003-2008 MY refrigerated-van trailers equipped with 2003 or later transport refrigeration units which will have a compliance phase-in between 2017 and 2019. Drayage tractors and trailers that operate within a 100 mile radius of a port or intermodal rail yard are exempt from this regulation. CAAP Measures- SPBP-HDV1- Performance Standards for On-Road Heavy-Duty Vehicles; Clean Truck Program Per the stated goals of the CAAP, the Ports of Los Angeles and Long Beach approved the Clean Truck Program (CTP) which progressively bans older trucks from operating at the two ports. The ban is implemented in three phases as follows:
1) By 1 October 2008 – All pre-1989 trucks are banned from port services. 2) By January 1, 2010 – All 1989-1993 trucks along with un-retrofitted29 1994-2003
trucks are banned from port services. 3) By January 1, 2012 – All trucks that do not meet 2007and later on-road heavy duty
engine standards are banned from port services.
In January 2011, harbor commissioners from the Ports of Los Angeles and Long Beach adopted a resolution that included Class 7 drayage trucks and banned the “dray-off” practice under the Clean Truck Program. This aligns with CARB’s recent amendments and will result in greater emissions reductions as most of the Class 7 trucks did not meet the emissions standards of the Clean Truck Program.
29 CTP retrofit requirements include CARB Level 3 reduction for PM plus 25% NOx reduction.

Inventory of Air Emissions CY 2011
Port of Los Angeles 25 July 2012
2.6 Greenhouse Gases Assembly Bill 32 (AB 32), the California Global Warming Solutions Act of 2006, establishes a first-in-the-world comprehensive program requiring the CARB to develop regulatory and market mechanisms that will ultimately reduce GHG emissions to 1990 levels by the year 2020 and reduce emissions to 80 percent below 1990 levels by 2050. Mandatory caps will begin in 2012 for significant sources and ratchet down to meet the 2020 goals. In the interim, CARB will begin to measure the GHG emissions of industries determined to be significant sources of GHG emissions. On October 25, 2007, CARB approved several emission reduction strategies to reduce GHG emissions as “early action measures.” Early action measures pertaining to goods movement activities for ships, port drayage trucks, cargo handling equipment, and transport refrigeration units included: Green Ports (Ship Electrification) SmartWay Truck Efficiency Tire Inflation Program Anti-idling Enforcement Refrigerant Tracking, Reporting, and Recovery Program Low Carbon Fuel Standard
In December 2007, CARB approved the 2020 statewide GHG emission limit of 427 million metric tons of carbon dioxide equivalent (MMT CO2e). In December 2008, CARB adopted the Climate Change Scoping Plan to achieve the reductions in GHG emissions mandated in AB 32. The AB 32 Scoping Plan contains the main strategies California will use to reduce the GHGs that cause climate change. Several of these measures are targeted at goods movement30, including ports, and are expected to achieve a combined 3.5 million metric tons of carbon dioxide equivalent. Proposed measures in the Scoping Plan affecting goods movement which have been fully or partially adopted as regulations include: T-5: Ship electrification at ports (previously adopted as regulation in December
2007) T-6: Goods movement efficiency measures (Port Drayage Trucks regulation
adopted in December 2007 and later amended in December 2010 to include class 7 trucks that were not covered under original regulation but found to be engaging in drayage activities at the ports; other measures under development)
T-7: Heavy-Duty Vehicle GHG Emission Reduction (adopted December 2008)
30 CARB, http://www.arb.ca.gov/cc/scopingplan/sp_measures_implementation_timeline.pdf; page 4.

Inventory of Air Emissions CY 2011
Port of Los Angeles 26 July 2012
In addition, the following Scoping Plan’s specific measures are planned for adoption in the next few years with potential impacts on port-related sources:31 Transport Refrigeration Units Cold Storage Prohibition and Energy Efficiency Refrigerant Recovery from Decommissioned Refrigerated Shipping Containers Medium and Heavy-Duty Vehicle Hybridization Cargo Handling Equipment – Anti-Idling, Hybrid, Electrification Commercial Harbor Craft Maintenance and Design efficiency Goods Movement System-Wide Efficiency Improvements Vessel Speed Reduction Clean Ships
2.7 Draft 2012 Air Quality Management Plan (AQMP) Currently, staff of SCAQMD is working in cooperation with CARB and Southern California Association of Governments (SCAG) on the draft 2012 AQMP32 required by the federal legal mandate set in the Federal Clean Air Act requirements to submit the 24-hour PM2.5 State Implementation Plan (SIP) to EPA by December 2012. Attainment of the 24-hour PM2.5 SIP should be demonstrated by 2014 with a 5-year extension option. The AQMP is also mandated by the California Health & Safety Code to demonstrate achieving and maintaining state and federal ambient air quality standards. The 2012 AQMP will be an integrated multi-pollutant plan demonstrating strategy to attain the 24-hour PM2.5 federal standard by 2014 with up to a 5-year extension to 2019; an annual standard PM2.5 SIP update and maintenance plan; and revisions to 8-hour ozone SIP, including an update on “black box” measures for 8-hour ozone standard by 2023 and EPA’s recently adopted final rule for the implementation of 8-hour ozone standard of 75 ppb by 2032. The draft plan (as of June 2012) includes control measures that may impact the mobile sources operated at the ports. SCAQMD is anticipated to take the 2012 AQMP for Board approval in September 2012.
31 CARB, http://www.arb.ca.gov/cc/scopingplan/sp_measures_implementation_timeline.pdf. 32 CARB, http://www.aqmd.gov/gb_comit/boarda.html.

Inventory of Air Emissions CY 2011
Port of Los Angeles 27 July 2012
SECTION 3 OCEAN-GOING VESSELS This section presents emissions estimates for the ocean-going vessels source category, including source description (3.1), geographical delineation (3.2), data and information acquisition (3.3), operational profiles (3.4), emissions estimation methodology (3.5), and the emission estimates (3.6). 3.1 Source Description OGVs calling at the Port in 2011 whether inbound from or outbound to the open ocean or transiting from neighboring POLB are included. OGVs calling only at POLB or bypassing both ports without physically stopping at a Port dock have not been included. Harbor craft, including tugboats, ferries, excursion vessels, work and crew boats and commercial fishing vessels are discussed in Section 4. Ocean-going vessels are categorized by the following main vessel types for purposes of this EI:
Auto carrier Bulk carrier Containership Cruise vessel General cargo Ocean-going tugboat (ATB/ITB) Refrigerated vessel (Reefer) Miscellaneous Tanker
The ocean-going tugboats included in the OGV EI are articulated tug barges (ATB) and integrated tug barges (ITB).
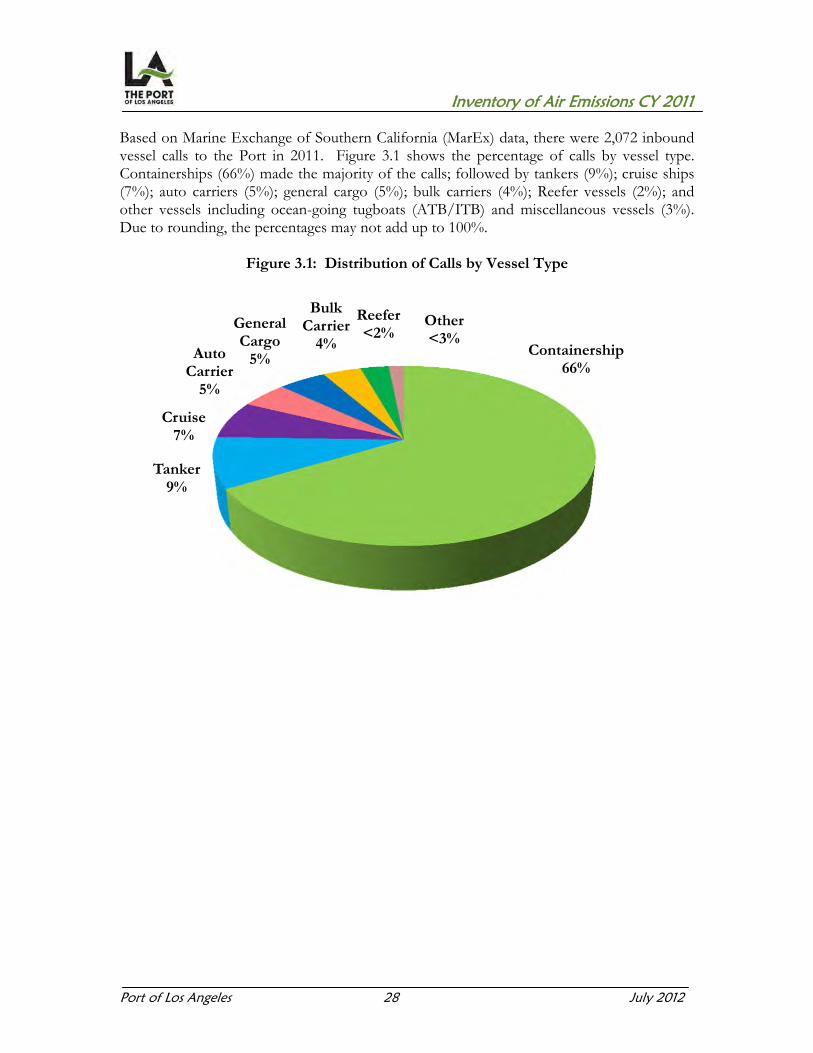
Inventory of Air Emissions CY 2011
Port of Los Angeles 28 July 2012
Based on Marine Exchange of Southern California (MarEx) data, there were 2,072 inbound vessel calls to the Port in 2011. Figure 3.1 shows the percentage of calls by vessel type. Containerships (66%) made the majority of the calls; followed by tankers (9%); cruise ships (7%); auto carriers (5%); general cargo (5%); bulk carriers (4%); Reefer vessels (2%); and other vessels including ocean-going tugboats (ATB/ITB) and miscellaneous vessels (3%). Due to rounding, the percentages may not add up to 100%.
Figure 3.1: Distribution of Calls by Vessel Type
Containership66%
Tanker 9%
Cruise7%
Auto Carrier
5%
General Cargo
5%
Bulk Carrier
4%
Reefer<2%
Other<3%
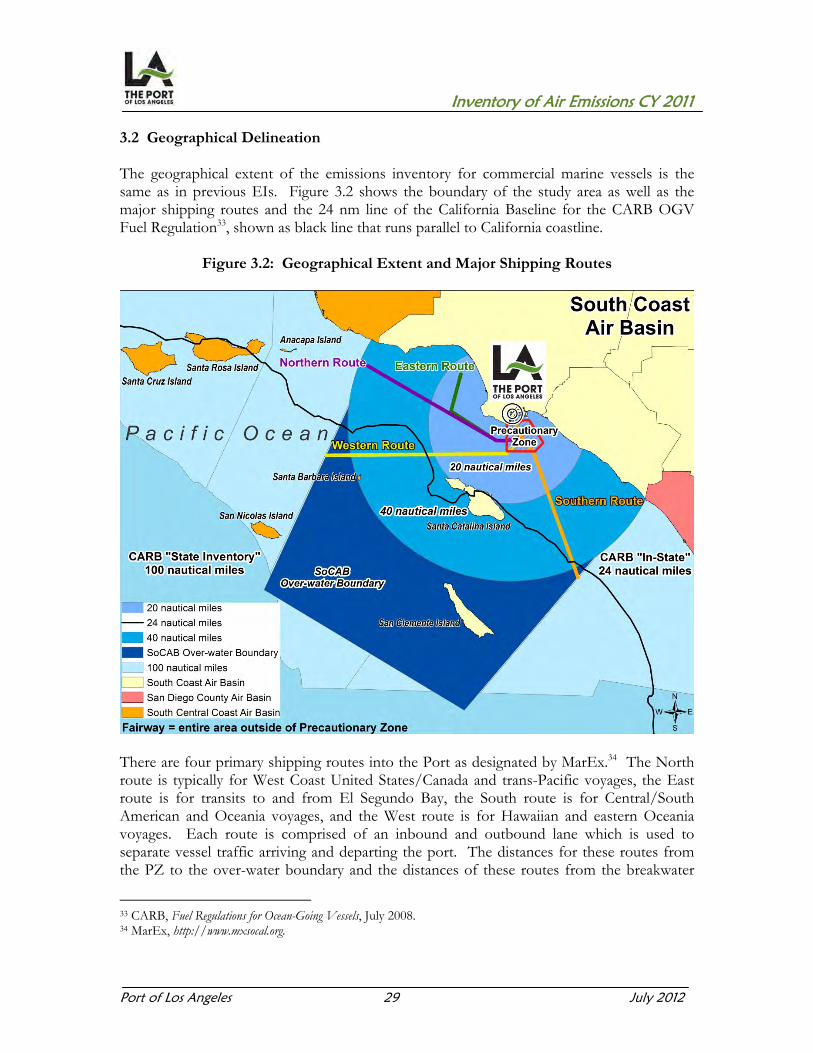
Inventory of Air Emissions CY 2011
Port of Los Angeles 29 July 2012
3.2 Geographical Delineation The geographical extent of the emissions inventory for commercial marine vessels is the same as in previous EIs. Figure 3.2 shows the boundary of the study area as well as the major shipping routes and the 24 nm line of the California Baseline for the CARB OGV Fuel Regulation33, shown as black line that runs parallel to California coastline.
Figure 3.2: Geographical Extent and Major Shipping Routes
There are four primary shipping routes into the Port as designated by MarEx.34 The North route is typically for West Coast United States/Canada and trans-Pacific voyages, the East route is for transits to and from El Segundo Bay, the South route is for Central/South American and Oceania voyages, and the West route is for Hawaiian and eastern Oceania voyages. Each route is comprised of an inbound and outbound lane which is used to separate vessel traffic arriving and departing the port. The distances for these routes from the PZ to the over-water boundary and the distances of these routes from the breakwater
33 CARB, Fuel Regulations for Ocean-Going Vessels, July 2008. 34 MarEx, http://www.mxsocal.org.

Inventory of Air Emissions CY 2011
Port of Los Angeles 30 July 2012
(BW) to the PZ are listed in Table 2.2. These distances represent average distances traveled by ships for each route. The routes are further segmented by two compliance zones based on Clean Air Action Plan emission reduction emission reduction strategies. The 20 nm zone is from the PZ to an arc 20 nm in radius from Point Fermin. The 20 to 40 nm zone is from the 20 nm arc to a 40 nm from Point Fermin, as presented in Table 3.1.
Table 3.1: Route Distances, nm
PZ to Boundary BW to PZ Route Distance, nm Distance, nm Inbound Outbound Inbound Outbound North 43.3 42.4 8.6 7.6 East 25.7 25.7 7.6 7.6 South 31.3 32.5 8.5 7.4 West 40.0 40.0 8.6 8.6
Starting on July 1, 2009, the CARB OGV Fuel Regulation requires ships to use distillate fuels instead of residual fuels when within 24 nm of the California coastline. Prior to the regulation, the North route was the predominant route for trade with Asia and points north of San Pedro Bay. Since the regulation became effective, the West route (west of the Channel Islands) has become the predominant shipping route for ships trading with Asia and points north of San Pedro Bay, presumably to avoid the CARB OGV Fuel Regulation compliance zone. This shift in route selection is highlighted Table 3.2.
Table 3.2: Route Distribution of Annual Calls
Route 2008 2009 2010 2011
North 62% 45% 10% 7%West 6% 23% 58% 61%South 31% 31% 31% 31%East 1% 1% 1% 1%

Inventory of Air Emissions CY 2011
Port of Los Angeles 31 July 2012
Figure 3.3 shows the precautionary zone which is a designated area where ships are preparing to enter or exit a port. In this zone the Los Angeles pilots are picked up or dropped off. The harbor is located within the breakwater and is characterized by the slowest vessel speeds.
Figure 3.3: Precautionary Zone
3.3 Data and Information Acquisition Various sources of data and operational knowledge about the Port’s marine activities were used to compile the data necessary to prepare emission estimates. These sources included: MarEx VSR Program speed data Los Angeles Pilot Service Lloyd’s Register of Ships Port Vessel Boarding Program (VBP) data Terminals Nautical charts and maps

Inventory of Air Emissions CY 2011
Port of Los Angeles 32 July 2012
3.4 Operational Profiles Vessel activity is defined as the number of ship trips by trip type and segment. Trip segments are used for the at-sea portion of the ship trip between the open ocean and the precautionary zone. These trips are then processed so as to define time in mode and geographical segment. The purpose of this step is to estimate power demand for that mode of operation and multiply it by the amount of time spent in that particular mode, which estimates available energy expressed as power times unit of time, e.g., kilowatt-hour (kW-hr). A vessel-by-vessel analysis was conducted. The only need for average power or time-in-mode was for vessels that lacked data for those fields. Vessel activity was drawn from three sources:
MarEx trip tables which define arrivals, departures, and shifts MarEx speed tables which define speeds for the VSR Program at 10, 15, 20, 25, 30,
35, and 40 nm Average transit times for harbor maneuvering
Hotelling Hotelling time is calculated by subtracting departure time from arrival time while at berth or anchorage. Ship movements are tracked by MarEx as to: Arrivals (inbound trip) Departures (outbound trip) Shifts (inter-port, intra-port, and anchorage shifts) Total movements (sum of all the above)
Arrivals For this study, arrivals include inbound trips from the sea to a berth and inbound trips from the sea to an anchorage. An inbound trip from the sea to an anchorage is assigned to the Port if the next port of call after the anchorage is a berth at the Port. Departures For this study, departures include outbound trips from a berth or anchorage to the sea. Shifts While many vessels make only one arrival and departure at a time, some vessels make multiple stops within a port. To assist with preparation of the marine emissions inventory, all shifts were grouped together, since they do not have an “at-sea” component as with arrivals and departures. When a vessel shifts from one berth to another or from an anchorage to a berth, the emissions associated with that shift (transit emissions from/to berth) are allocated to the “to berth” or “arriving berth."

Inventory of Air Emissions CY 2011
Port of Los Angeles 33 July 2012
There are three broad categories of shifts: Intra-port shifts – movements within a port from one berth to another. Inter-port shifts – movements between adjacent ports. This is a common
occurrence in co-located ports such as Los Angeles and Long Beach. Anchorage shifts – movements between a terminal and anchorage. For example, a
vessel receives a partial load, goes to anchorage, and then returns to the terminal to complete loading.
Table 3.3 presents the arrivals, departures, shifts and total movements for vessels at the Port in 2011. Arrivals and departures do not match because the activity is based on a calendar year. Tankers shift more than other vessel types while in port. Roll-on/Roll-off vessels (RoRo) did not call the Port in 2011.
Table 3.3: Total OGV Movements
Vessel Type Arrival Departure Shift Total
Auto Carrier 98 97 14 209 Bulk 77 72 50 199 Bulk - Heavy Load 2 2 2 6 Bulk Wood Chips 1 1 1 3 Container - 1000 78 79 12 169 Container - 2000 192 192 14 398 Container - 3000 6 6 0 12 Container - 4000 318 318 17 653 Container - 5000 312 312 15 639 Container - 6000 263 263 36 562 Container - 7000 5 5 0 10 Container - 8000 147 146 5 298 Container - 9000 55 54 4 113 Cruise 140 139 1 280 General Cargo 99 89 77 265 Ocean Tugboat (ATB/ITB) 57 58 59 174 Miscellaneous 2 1 0 3 Reefer 32 28 49 109 Tanker - Aframax 5 4 7 16 Tanker - Chemical 77 85 133 295 Tanker - Handysize 37 37 51 125 Tanker - Panamax 69 70 141 280 Total 2,072 2,058 688 4,818
DB ID693
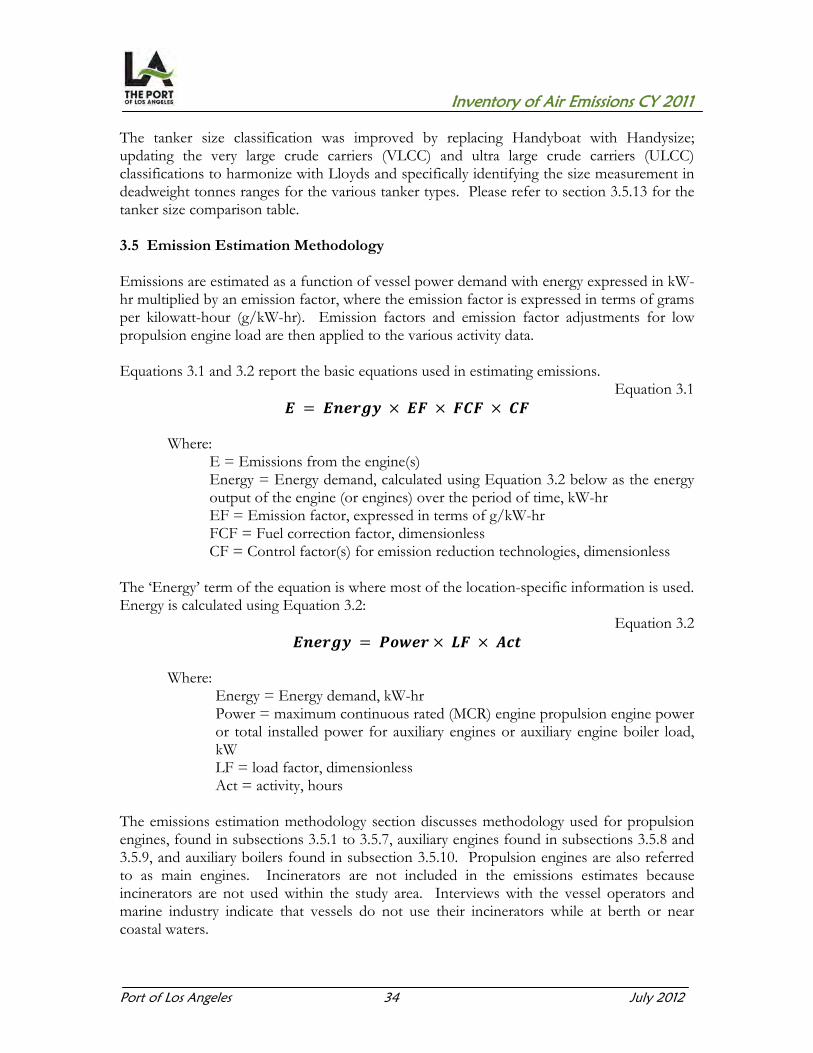
Inventory of Air Emissions CY 2011
Port of Los Angeles 34 July 2012
The tanker size classification was improved by replacing Handyboat with Handysize; updating the very large crude carriers (VLCC) and ultra large crude carriers (ULCC) classifications to harmonize with Lloyds and specifically identifying the size measurement in deadweight tonnes ranges for the various tanker types. Please refer to section 3.5.13 for the tanker size comparison table. 3.5 Emission Estimation Methodology Emissions are estimated as a function of vessel power demand with energy expressed in kW-hr multiplied by an emission factor, where the emission factor is expressed in terms of grams per kilowatt-hour (g/kW-hr). Emission factors and emission factor adjustments for low propulsion engine load are then applied to the various activity data. Equations 3.1 and 3.2 report the basic equations used in estimating emissions.
Equation 3.1 = × × ×
Where: E = Emissions from the engine(s) Energy = Energy demand, calculated using Equation 3.2 below as the energy output of the engine (or engines) over the period of time, kW-hr EF = Emission factor, expressed in terms of g/kW-hr FCF = Fuel correction factor, dimensionless CF = Control factor(s) for emission reduction technologies, dimensionless
The ‘Energy’ term of the equation is where most of the location-specific information is used. Energy is calculated using Equation 3.2:
Equation 3.2 = × ×
Where: Energy = Energy demand, kW-hr Power = maximum continuous rated (MCR) engine propulsion engine power or total installed power for auxiliary engines or auxiliary engine boiler load, kW LF = load factor, dimensionless Act = activity, hours
The emissions estimation methodology section discusses methodology used for propulsion engines, found in subsections 3.5.1 to 3.5.7, auxiliary engines found in subsections 3.5.8 and 3.5.9, and auxiliary boilers found in subsection 3.5.10. Propulsion engines are also referred to as main engines. Incinerators are not included in the emissions estimates because incinerators are not used within the study area. Interviews with the vessel operators and marine industry indicate that vessels do not use their incinerators while at berth or near coastal waters.
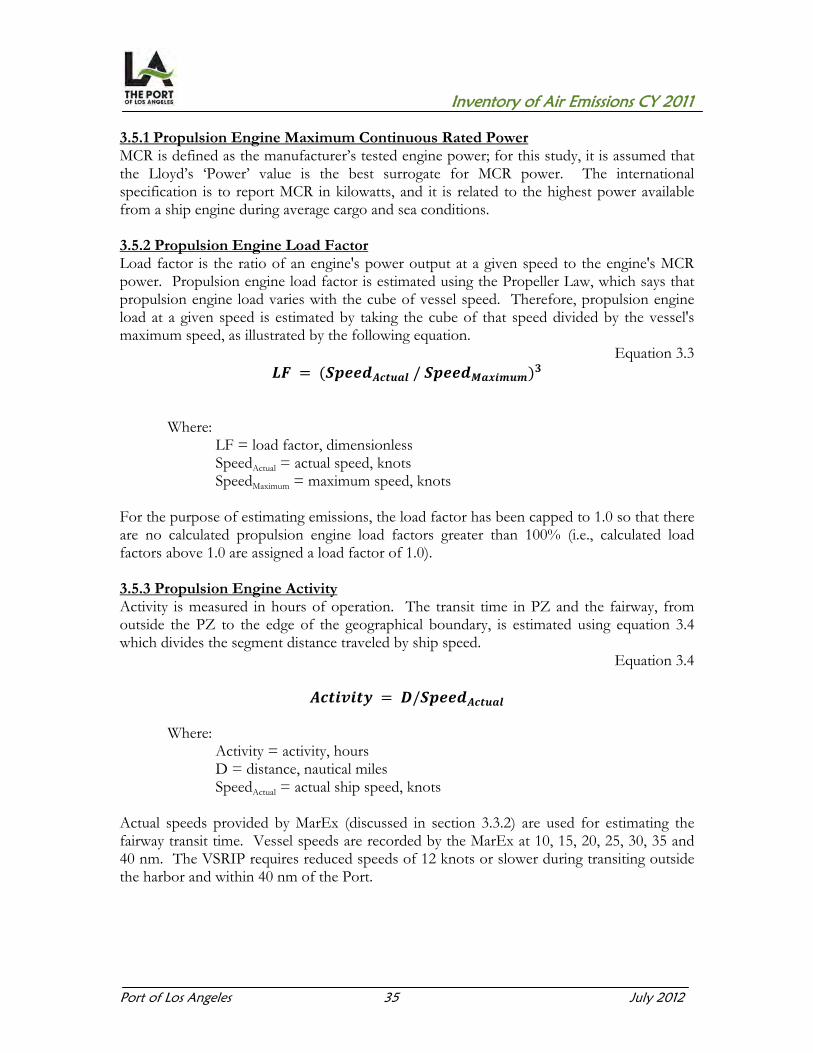
Inventory of Air Emissions CY 2011
Port of Los Angeles 35 July 2012
3.5.1 Propulsion Engine Maximum Continuous Rated Power MCR is defined as the manufacturer’s tested engine power; for this study, it is assumed that the Lloyd’s ‘Power’ value is the best surrogate for MCR power. The international specification is to report MCR in kilowatts, and it is related to the highest power available from a ship engine during average cargo and sea conditions. 3.5.2 Propulsion Engine Load Factor Load factor is the ratio of an engine's power output at a given speed to the engine's MCR power. Propulsion engine load factor is estimated using the Propeller Law, which says that propulsion engine load varies with the cube of vessel speed. Therefore, propulsion engine load at a given speed is estimated by taking the cube of that speed divided by the vessel's maximum speed, as illustrated by the following equation.
Equation 3.3 = ( / )
Where: LF = load factor, dimensionless SpeedActual = actual speed, knots SpeedMaximum = maximum speed, knots
For the purpose of estimating emissions, the load factor has been capped to 1.0 so that there are no calculated propulsion engine load factors greater than 100% (i.e., calculated load factors above 1.0 are assigned a load factor of 1.0). 3.5.3 Propulsion Engine Activity Activity is measured in hours of operation. The transit time in PZ and the fairway, from outside the PZ to the edge of the geographical boundary, is estimated using equation 3.4 which divides the segment distance traveled by ship speed.
Equation 3.4 = /
Where: Activity = activity, hours D = distance, nautical miles SpeedActual = actual ship speed, knots
Actual speeds provided by MarEx (discussed in section 3.3.2) are used for estimating the fairway transit time. Vessel speeds are recorded by the MarEx at 10, 15, 20, 25, 30, 35 and 40 nm. The VSRIP requires reduced speeds of 12 knots or slower during transiting outside the harbor and within 40 nm of the Port.

Inventory of Air Emissions CY 2011
Port of Los Angeles 36 July 2012
The PZ uses assigned speeds based on VBP data, as found in Table 3.4.
Table 3.4: Precautionary Zone Speed, knots
Vessel Type Class Speed Auto Carrier Fast 11.0 Bulk Slow 9.0 Containership Fast 11.0 Cruise Fast 11.0 General Cargo Slow 9.0 Miscellaneous Slow 9.0 Ocean Tugboat (ATB/ITB) Slow 9.0 Reefer Slow 9.0 RoRo Slow 9.0 Tanker Slow 9.0
3.5.4 Propulsion Engine Emission Factors The main engine emission factors used in this study were reported in a 2002 ENTEC study,35 except for PM emission factors. CARB36 provided the PM EF for slow and medium speed diesel engines. IVL 2004 study37 was the source for the PM EF for gas turbine and steamship vessels. The greenhouse gas emission factors for CO2, CH4, and N2O were also reported in the IVL 2004 study. These emissions factors are based on residual oil (RO) which is intermediate fuel oil (IFO 380) or one with similar specifications, with an average sulfur content of 2.7%. The two predominant propulsion engine types are:
Slow speed diesel engines, having maximum engine speeds less than 130 rpm Medium speed diesel engines, having maximum engine speeds over 130 rpm (and
typically greater than 400 rpm).
35 ENTEC, Quantification of Emissions from Ships Associated with Ship Movements between Ports in the European Community, Final Report, July 2002. 36 CARB, A Critical Review of Ocean-Going Vessel Particulate Matter Emission Factors, November 2007. 37 IVL, Methodology for Calculating Emissions from Ships: Update on Emission Factors, 2004. (IVL 2004)
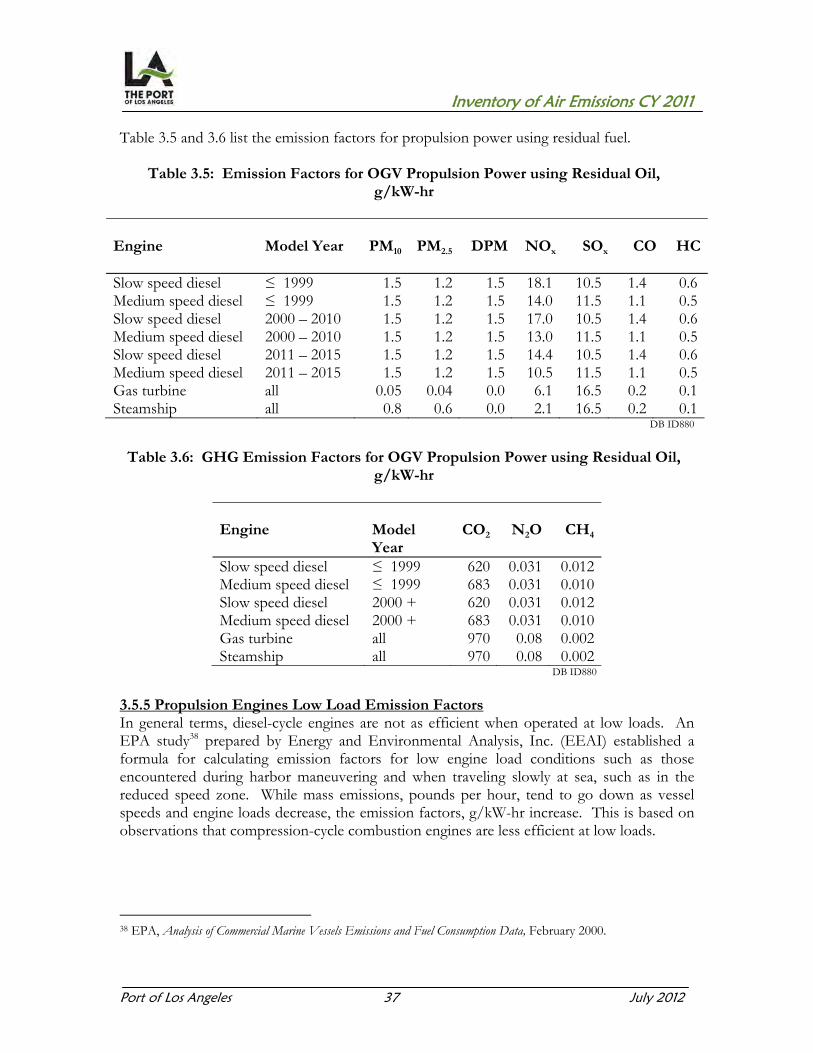
Inventory of Air Emissions CY 2011
Port of Los Angeles 37 July 2012
Table 3.5 and 3.6 list the emission factors for propulsion power using residual fuel.
Table 3.5: Emission Factors for OGV Propulsion Power using Residual Oil, g/kW-hr
Engine
Model Year PM10 PM2.5 DPM NOx
SOx CO HC
Slow speed diesel ≤ 1999 1.5 1.2 1.5 18.1 10.5 1.4 0.6Medium speed diesel ≤ 1999 1.5 1.2 1.5 14.0 11.5 1.1 0.5Slow speed diesel 2000 – 2010 1.5 1.2 1.5 17.0 10.5 1.4 0.6Medium speed diesel 2000 – 2010 1.5 1.2 1.5 13.0 11.5 1.1 0.5Slow speed diesel 2011 – 2015 1.5 1.2 1.5 14.4 10.5 1.4 0.6Medium speed diesel 2011 – 2015 1.5 1.2 1.5 10.5 11.5 1.1 0.5Gas turbine all 0.05 0.04 0.0 6.1 16.5 0.2 0.1Steamship all 0.8 0.6 0.0 2.1 16.5 0.2 0.1
DB ID880
Table 3.6: GHG Emission Factors for OGV Propulsion Power using Residual Oil,
g/kW-hr
Engine
Model Year
CO2 N2O
CH4
Slow speed diesel ≤ 1999 620 0.031 0.012 Medium speed diesel ≤ 1999 683 0.031 0.010 Slow speed diesel 2000 + 620 0.031 0.012 Medium speed diesel 2000 + 683 0.031 0.010 Gas turbine all 970 0.08 0.002 Steamship all 970 0.08 0.002
DB ID880
3.5.5 Propulsion Engines Low Load Emission Factors In general terms, diesel-cycle engines are not as efficient when operated at low loads. An EPA study38 prepared by Energy and Environmental Analysis, Inc. (EEAI) established a formula for calculating emission factors for low engine load conditions such as those encountered during harbor maneuvering and when traveling slowly at sea, such as in the reduced speed zone. While mass emissions, pounds per hour, tend to go down as vessel speeds and engine loads decrease, the emission factors, g/kW-hr increase. This is based on observations that compression-cycle combustion engines are less efficient at low loads.
38 EPA, Analysis of Commercial Marine Vessels Emissions and Fuel Consumption Data, February 2000.

Inventory of Air Emissions CY 2011
Port of Los Angeles 38 July 2012
The following equations describe the low-load effect where emission rates can increase, based on a limited set of data from Lloyd’s Maritime Program and the U.S. Coast Guard (USCG). The low load effect was described in a study conducted for the EPA by ENVIRON.39 Equation 3.5 is the equation developed by EEAI to generate emission factors for the range of load factors from 2% to 20% for each pollutant:
Equation 3.5 = ( ) + Where:
y = emissions, g/kW-hr a = coefficient b = intercept x = exponent (negative) fractional load = propulsion engine load factor (2% - 20%), derived by the Propeller Law, percent (see equation 3.3)
Table 3.7 presents the variables for equation 3.5.
Table 3.7: Low-Load Emission Factor Regression Equation Variables
Pollutant Exponent Intercept (b)
Coefficient (a)
PM 1.5 0.2551 0.0059 NOx 1.5 10.4496 0.1255 CO 1.0 0.1458 0.8378 HC 1.5 0.3859 0.0667
39 EPA, Commercial Marine Inventory Development, July 2002.

Inventory of Air Emissions CY 2011
Port of Los Angeles 39 July 2012
Table 3.8 presents the emission factors based on Equation 3.5 and variables in Table 3.7 at 2% to 20% loads.
Table 3.8: EEAI Emission Factors, g/kW-hr
Load PM NOx CO HC
2% 2.34 54.82 42.04 23.973% 1.39 34.60 28.07 13.224% 0.99 26.14 21.09 8.725% 0.78 21.67 16.90 6.356% 0.66 18.99 14.11 4.927% 0.57 17.23 12.11 3.998% 0.52 16.00 10.62 3.339% 0.47 15.10 9.45 2.8610% 0.44 14.42 8.52 2.5011% 0.42 13.89 7.76 2.2112% 0.40 13.47 7.13 1.9913% 0.38 13.13 6.59 1.8114% 0.37 12.85 6.13 1.6615% 0.36 12.61 5.73 1.5316% 0.35 12.41 5.38 1.4317% 0.34 12.24 5.07 1.3418% 0.33 12.09 4.80 1.2619% 0.33 11.96 4.56 1.19
The low load adjustment (LLA) multipliers that are applied to the propulsion engine g/kW-hr emission factors are then determined by dividing each of the EEAI emission factors by the emission factor at 20% load using Equation 3.6. This result in positive numbers greater than one, since emissions increase as load is decreased. At 20% load, the value is exactly 1.0 since it is divided into itself.
Equation 3.6 ( % ) = ( % )/ ( % ) Where:
LLA = Low load adjustment multiplier x = engine load factor less than or equal to 20% y = emission factor, g/kW-hr from equation 3.5 (See Table 3.8)
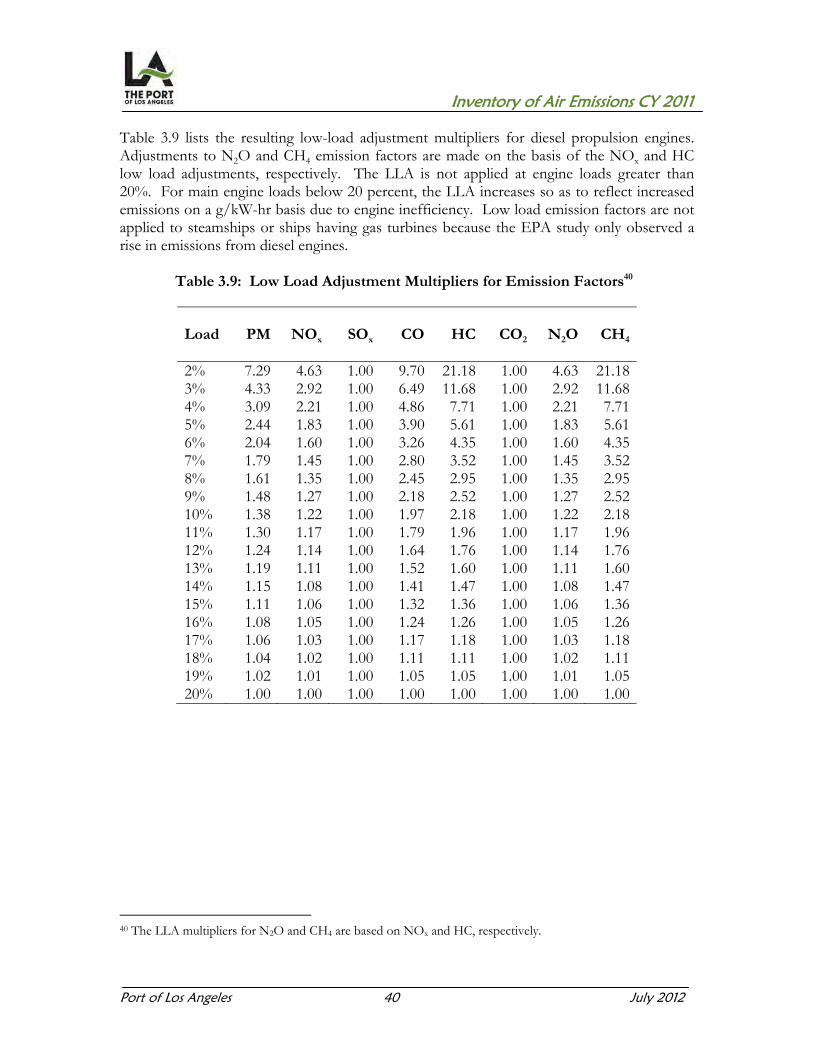
Inventory of Air Emissions CY 2011
Port of Los Angeles 40 July 2012
Table 3.9 lists the resulting low-load adjustment multipliers for diesel propulsion engines. Adjustments to N2O and CH4 emission factors are made on the basis of the NOx and HC low load adjustments, respectively. The LLA is not applied at engine loads greater than 20%. For main engine loads below 20 percent, the LLA increases so as to reflect increased emissions on a g/kW-hr basis due to engine inefficiency. Low load emission factors are not applied to steamships or ships having gas turbines because the EPA study only observed a rise in emissions from diesel engines.
Table 3.9: Low Load Adjustment Multipliers for Emission Factors40
Load
PM
NOx SOx CO HC CO2
N2O
CH4
2% 7.29 4.63 1.00 9.70 21.18 1.00 4.63 21.18 3% 4.33 2.92 1.00 6.49 11.68 1.00 2.92 11.68 4% 3.09 2.21 1.00 4.86 7.71 1.00 2.21 7.71 5% 2.44 1.83 1.00 3.90 5.61 1.00 1.83 5.61 6% 2.04 1.60 1.00 3.26 4.35 1.00 1.60 4.35 7% 1.79 1.45 1.00 2.80 3.52 1.00 1.45 3.52 8% 1.61 1.35 1.00 2.45 2.95 1.00 1.35 2.95 9% 1.48 1.27 1.00 2.18 2.52 1.00 1.27 2.52 10% 1.38 1.22 1.00 1.97 2.18 1.00 1.22 2.18 11% 1.30 1.17 1.00 1.79 1.96 1.00 1.17 1.96 12% 1.24 1.14 1.00 1.64 1.76 1.00 1.14 1.76 13% 1.19 1.11 1.00 1.52 1.60 1.00 1.11 1.60 14% 1.15 1.08 1.00 1.41 1.47 1.00 1.08 1.47 15% 1.11 1.06 1.00 1.32 1.36 1.00 1.06 1.36 16% 1.08 1.05 1.00 1.24 1.26 1.00 1.05 1.26 17% 1.06 1.03 1.00 1.17 1.18 1.00 1.03 1.18 18% 1.04 1.02 1.00 1.11 1.11 1.00 1.02 1.11 19% 1.02 1.01 1.00 1.05 1.05 1.00 1.01 1.05 20% 1.00 1.00 1.00 1.00 1.00 1.00 1.00 1.00
40 The LLA multipliers for N2O and CH4 are based on NOx and HC, respectively.

Inventory of Air Emissions CY 2011
Port of Los Angeles 41 July 2012
The LLA multipliers are applied to the at-sea emission factors for diesel propulsion engines only. The low load emission factor is calculated for each pollutant using Equation 3.7. In keeping with the Port's emission estimating practice of assuming a minimum main engine load of 2%, the table of LLA factors does not include values for 1% load.
Equation 3.7 = × Where:
EF = Resulting low load emission factor Base EF = Emission factor for diesel propulsion engines (see Tables 3.5 and 3.6) LLA = Low load adjustment multiplier (see Table 3.9)
3.5.6 Propulsion Engine Harbor Maneuvering Loads Main engine loads within a harbor tend to be very light, especially on in-bound trips when the main engines are turned off for periods of time as the vessels are being maneuvered to their berths. During docking, when the ship is being positioned against the wharf, the assist tugboats do most of the work and the main engines are off. Main engine maneuvering loads are estimated using the Propeller Law, with the over-riding assumption that the lowest average engine load is 2%. Harbor transit speeds within the breakwater were profiled from VBP information as follows:
Inbound fast ships (auto, container, cruise ships) at 7 knots Inbound slow ships (any other vessel type) at 5 knots Outbound traffic for all vessels at 8 knots
The departure speed, and hence the departure load, is typically higher than on arrival because on departure the engine power is used to accelerate the vessel away from the berth, while on arrival the vessel usually travels slower and spends some time with the main engine off. 3.5.7 Propulsion Engine Defaults All vessels that called the Port were able to be matched for main engine power using the most current Lloyd’s data and VBP information, except for ocean-going tugboats. Therefore, defaults were only used for ocean tugs’ main engine power.

Inventory of Air Emissions CY 2011
Port of Los Angeles 42 July 2012
3.5.8 Auxiliary Engine Emission Factors The ENTEC auxiliary engine emission factors used in this study are presented in Table 3.10.
Table 3.10: Emission Factors for Auxiliary Engines using Residual Oil, g/kW-hr
Model Year PM10 PM2.5 DPM NOX SOx
CO41
HC
≤ 1999 1.5 1.2 1.5 14.7 12.3 1.1 0.4 2000 - 2010 1.5 1.2 1.5 13.0 12.3 1.1 0.4 2011 - 2015 1.5 1.2 1.5 10.5 12.3 1.1 0.4
DB ID456
Table 3.11: GHG Emission Factors for Auxiliary Engines using Residual Oil,
g/kW-hr
Model Year CO2 N2O CH4
all 683 0.031 0.008
DB ID456
3.5.9 Auxiliary Engine Load Defaults Lloyd’s database contains limited auxiliary engine’s installed power information because neither the IMO nor the classification societies require vessel owners to provide this information. Therefore, the auxiliary engine load data for each vessel follows the hierarchy described in section 3.3.5, utilizing the latest VBP data, sister ships, and Port defaults. Defaults for auxiliary engine loads were developed based on the vessel class averages of the installed auxiliary engine power, call-weighted averages by vessel class using Lloyds and VBP data for vessels calls in 2011, multiplied by load factors by vessel class by mode, which were derived from historical VBP data. Since the defaults are based on the vessels that visit the Port that year, defaults will vary slightly from year to year.
41 IVL 2004.
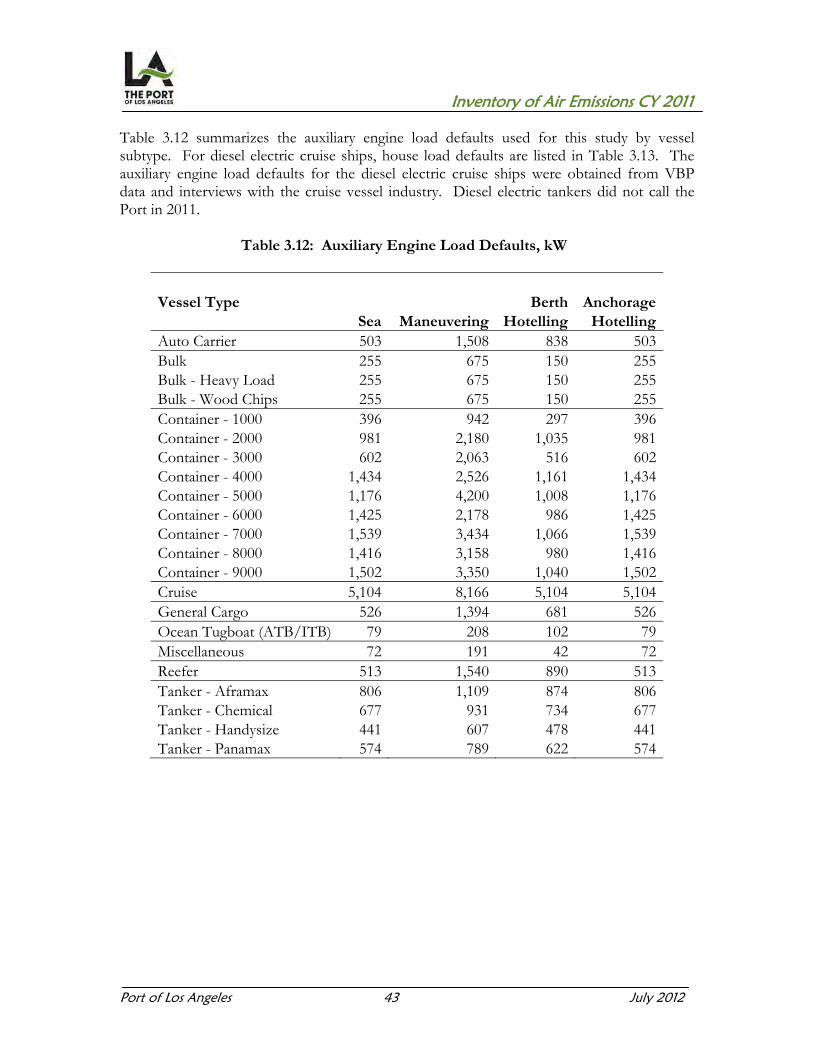
Inventory of Air Emissions CY 2011
Port of Los Angeles 43 July 2012
Table 3.12 summarizes the auxiliary engine load defaults used for this study by vessel subtype. For diesel electric cruise ships, house load defaults are listed in Table 3.13. The auxiliary engine load defaults for the diesel electric cruise ships were obtained from VBP data and interviews with the cruise vessel industry. Diesel electric tankers did not call the Port in 2011.
Table 3.12: Auxiliary Engine Load Defaults, kW
Vessel Type Berth AnchorageSea Maneuvering Hotelling Hotelling
Auto Carrier 503 1,508 838 503Bulk 255 675 150 255Bulk - Heavy Load 255 675 150 255Bulk - Wood Chips 255 675 150 255Container - 1000 396 942 297 396Container - 2000 981 2,180 1,035 981Container - 3000 602 2,063 516 602Container - 4000 1,434 2,526 1,161 1,434Container - 5000 1,176 4,200 1,008 1,176Container - 6000 1,425 2,178 986 1,425Container - 7000 1,539 3,434 1,066 1,539Container - 8000 1,416 3,158 980 1,416Container - 9000 1,502 3,350 1,040 1,502Cruise 5,104 8,166 5,104 5,104General Cargo 526 1,394 681 526Ocean Tugboat (ATB/ITB) 79 208 102 79Miscellaneous 72 191 42 72Reefer 513 1,540 890 513Tanker - Aframax 806 1,109 874 806Tanker - Chemical 677 931 734 677Tanker - Handysize 441 607 478 441Tanker - Panamax 574 789 622 574
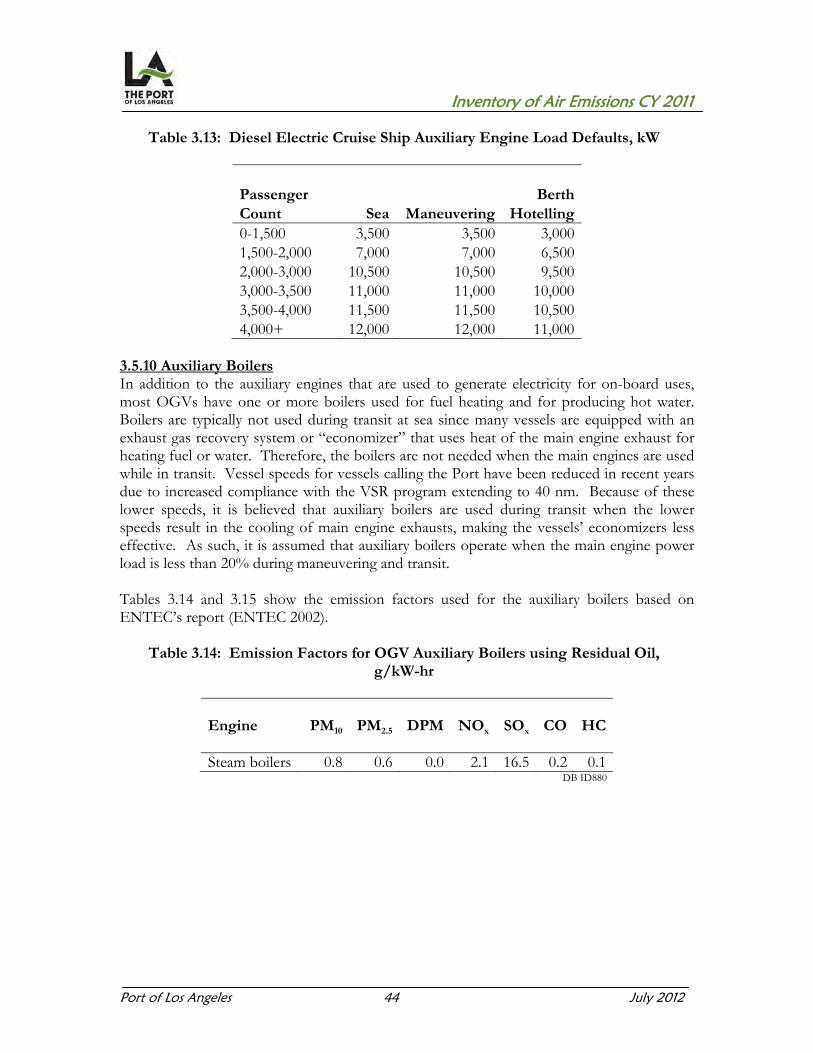
Inventory of Air Emissions CY 2011
Port of Los Angeles 44 July 2012
Table 3.13: Diesel Electric Cruise Ship Auxiliary Engine Load Defaults, kW
Passenger Berth Count Sea Maneuvering Hotelling 0-1,500 3,500 3,500 3,000 1,500-2,000 7,000 7,000 6,500 2,000-3,000 10,500 10,500 9,500 3,000-3,500 11,000 11,000 10,000 3,500-4,000 11,500 11,500 10,500 4,000+ 12,000 12,000 11,000
3.5.10 Auxiliary Boilers In addition to the auxiliary engines that are used to generate electricity for on-board uses, most OGVs have one or more boilers used for fuel heating and for producing hot water. Boilers are typically not used during transit at sea since many vessels are equipped with an exhaust gas recovery system or “economizer” that uses heat of the main engine exhaust for heating fuel or water. Therefore, the boilers are not needed when the main engines are used while in transit. Vessel speeds for vessels calling the Port have been reduced in recent years due to increased compliance with the VSR program extending to 40 nm. Because of these lower speeds, it is believed that auxiliary boilers are used during transit when the lower speeds result in the cooling of main engine exhausts, making the vessels’ economizers less effective. As such, it is assumed that auxiliary boilers operate when the main engine power load is less than 20% during maneuvering and transit. Tables 3.14 and 3.15 show the emission factors used for the auxiliary boilers based on ENTEC’s report (ENTEC 2002).
Table 3.14: Emission Factors for OGV Auxiliary Boilers using Residual Oil,
g/kW-hr
Engine PM10 PM2.5 DPM NOx SOx CO
HC
Steam boilers 0.8 0.6 0.0 2.1 16.5 0.2 0.1
DB ID880
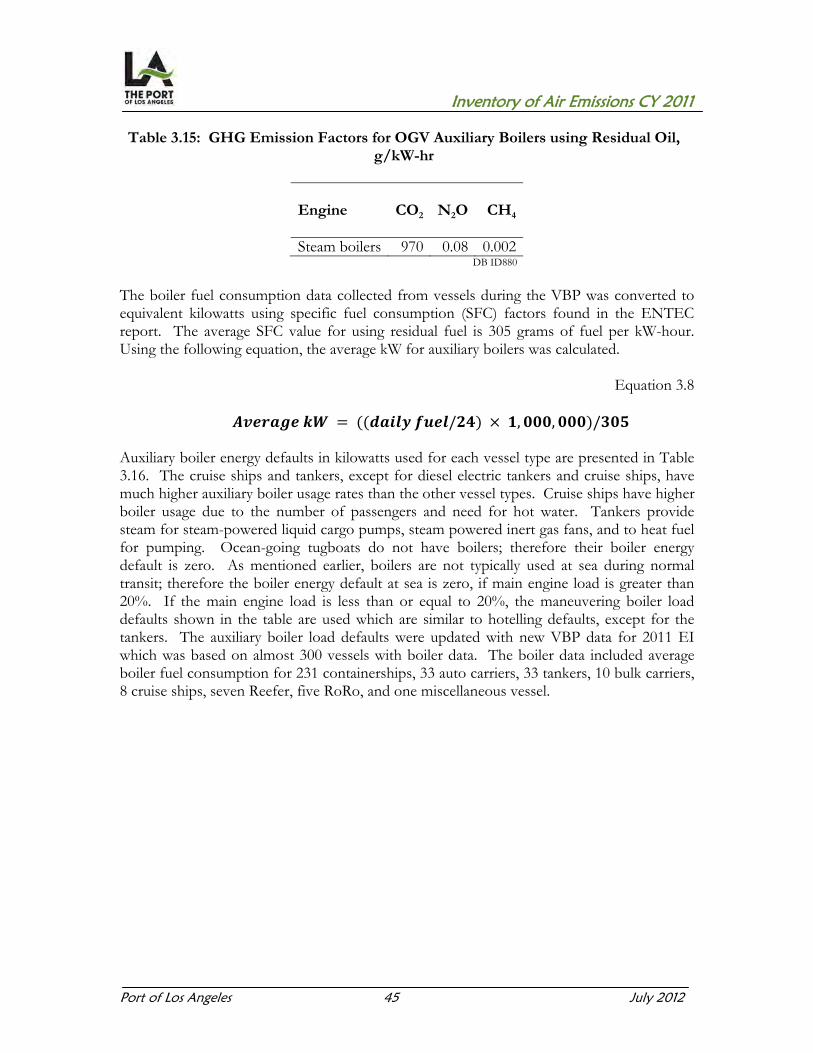
Inventory of Air Emissions CY 2011
Port of Los Angeles 45 July 2012
Table 3.15: GHG Emission Factors for OGV Auxiliary Boilers using Residual Oil, g/kW-hr
Engine CO2 N2O CH4
Steam boilers 970 0.08 0.002DB ID880
The boiler fuel consumption data collected from vessels during the VBP was converted to equivalent kilowatts using specific fuel consumption (SFC) factors found in the ENTEC report. The average SFC value for using residual fuel is 305 grams of fuel per kW-hour. Using the following equation, the average kW for auxiliary boilers was calculated.
Equation 3.8 = (( / ) × , , )/
Auxiliary boiler energy defaults in kilowatts used for each vessel type are presented in Table 3.16. The cruise ships and tankers, except for diesel electric tankers and cruise ships, have much higher auxiliary boiler usage rates than the other vessel types. Cruise ships have higher boiler usage due to the number of passengers and need for hot water. Tankers provide steam for steam-powered liquid cargo pumps, steam powered inert gas fans, and to heat fuel for pumping. Ocean-going tugboats do not have boilers; therefore their boiler energy default is zero. As mentioned earlier, boilers are not typically used at sea during normal transit; therefore the boiler energy default at sea is zero, if main engine load is greater than 20%. If the main engine load is less than or equal to 20%, the maneuvering boiler load defaults shown in the table are used which are similar to hotelling defaults, except for the tankers. The auxiliary boiler load defaults were updated with new VBP data for 2011 EI which was based on almost 300 vessels with boiler data. The boiler data included average boiler fuel consumption for 231 containerships, 33 auto carriers, 33 tankers, 10 bulk carriers, 8 cruise ships, seven Reefer, five RoRo, and one miscellaneous vessel.

Inventory of Air Emissions CY 2011
Port of Los Angeles 46 July 2012
Table 3.16: Auxiliary Boiler Load Defaults, kW
Vessel Type Berth Anchorage Sea Maneuvering Hotelling Hotelling
Auto Carrier 0 253 253 253 Bulk 0 132 132 132 Bulk - Heavy Load 0 132 132 132 Bulk - Wood Chips 0 132 132 132 Container - 1000 0 241 241 241 Container - 2000 0 325 325 325 Container - 3000 0 474 474 474 Container - 4000 0 492 492 492 Container - 5000 0 630 630 630 Container - 6000 0 565 565 565 Container - 7000 0 551 551 551 Container - 8000 0 525 525 525 Container - 9000 0 547 547 547 Cruise 0 1,393 1,393 1,393 General Cargo 0 137 137 137 Ocean Tugboat (ATB/ITB) 0 0 0 0 Miscellaneous 0 137 137 137 Reefer 0 255 255 255 Tanker - Aframax 0 371 3,000 371 Tanker - Chemical 0 371 3,000 371 Tanker - Handysize 0 371 3,000 371 Tanker - Panamax 0 371 3,000 371

Inventory of Air Emissions CY 2011
Port of Los Angeles 47 July 2012
3.5.11 Fuel Correction Factors Fuel correction factors are used when the actual fuel used is different than the fuel used to develop the emission factors. As discussed earlier, main, auxiliary and auxiliary boiler emission factors are based on residual fuel with an average 2.7% sulfur content or marine diesel oil with an average 1.5% sulfur content. Table 3.17 lists the fuel correction factors for fuels with different sulfur content. These dimensionless fuel correction factors are consistent with CARB’s emission estimations methodology for ocean-going vessels.42 Fuel correction factors for three fuel types: heavy fuel oil (HFO), MGO, and MDO are present in the table.
Table 3.17: Fuel Correction Factors
Actual Fuel Sulfur
Content PM NOx SOx CO HC CO2 N2O CH4
HFO 1.5% 0.82 1.00 0.555 1.00 1.00 1.00 1.00 1.00MDO 1.5% 0.47 0.90 0.555 1.00 1.00 1.00 0.90 1.00MGO 0.5% 0.25 0.94 0.185 1.00 1.00 1.00 0.94 1.00MGO 0.41% 0.23 0.94 0.152 1.00 1.00 1.00 0.94 1.00MGO 0.4% 0.23 0.94 0.148 1.00 1.00 1.00 0.94 1.00MGO 0.3% 0.21 0.94 0.111 1.00 1.00 1.00 0.94 1.00MGO 0.2% 0.19 0.94 0.074 1.00 1.00 1.00 0.94 1.00MGO 0.1% 0.17 0.94 0.037 1.00 1.00 1.00 0.94 1.00
Beginning 1 July 2009, CARB’s OGV Fuel Regulation, adopted in July 2008, required vessel operators to use MGO with a sulfur content less than 1.5% by weight or MDO with a sulfur content equal to or less than 0.5% by weight within 24 nm from California coast (and while at berth) in their diesel powered propulsion engines, auxiliary engines and auxiliary boilers. During this period, an average 0.5% sulfur fuel content is assumed for both main and auxiliary engines and auxiliary boilers. For the 2011 calendar year, 100% compliance with CARB’s regulation is assumed, with the exception of the auxiliary boiler exemptions discussed below. The compliance rate and exceptions used in the EI were confirmed by CARB per discussions through the Emissions Inventory Technical Working Group (TWG). CARB issued several Essential Modification Executive Orders exempting individual vessels from the fuel use specifications described in the OGV Fuel Regulation for vessels. Vessels that were exempt, demonstrated that it is not feasible to use the specified fuels in their auxiliary boilers unless essential modifications to the vessels are made and granted the exemption are listed on CARB’s website43. The exemptions for individual vessels are reflected in the calculated OGV emissions. For these particular vessels, if the vessel called the Port in 2011, the fuel switching was not included for the boilers; therefore, the emissions were estimated for the boilers as burning residual fuel. There were 26 tankers that called the Port in 2011 that were exempt for switching fuel for their auxiliary boilers. 42 CARB, http://www.arb.ca.gov/regact/2008/fuelogv08/fuelogv08.htm. 43 CARB, http:/www.arb.ca.gov/ports/marinevess/ogv/ogveos.htm.

Inventory of Air Emissions CY 2011
Port of Los Angeles 48 July 2012
In calendar year 2011, in addition to the CARB OGV Fuel Regulation (average 0.5% S) which was in full effect for the whole year, the OGV emissions included Trapac’s Air Quality lease compliance which states that 30% of the total annual vessel calls to Trapac will use 0.2% S fuel. 3.5.12 Control Factors for Emission Reduction Technologies Control factors are used to take into account the emissions benefits associated with emission reduction technologies installed on vessels. One such technology for marine main engines is the fuel slide valve. This type of fuel valve leads to a better combustion process, less smoke, and lower fuel consumption, which results in reduced overall emissions for NOx, a 30% reduction, and for PM, a 25% reduction. The newer MAN B&W engines on the 2004+ model year vessels are equipped with the fuel slide valves. Some companies are also retrofitting their vessels equipped with MAN B&W main engines with slide valves. Since information on slide valve retrofits has primarily been collected through VBP surveys, the inventory may not have captured all the vessels that have been retrofitted with slide valves. The emission reduction estimates for the slide valves are based on MAN B&W Diesel A/S emission measurements. In order to obtain the latest information on the applicability and control effectiveness of slide valves, the representative from MAN B&W in Denmark was recently contacted. Based on the recent communication with MAN B&W and preliminary information provided, for the 2011 inventory, the current emission reduction benefits, 30% for NOx and 25% for PM, are applied to 2004 and newer vessels equipped with MAN B&W engines as well as to existing engines known to be retrofitted with slide valves. The ports will continue to work with MAN B&W and the TWG to refine the emission benefits for slide valves used in new engines and as retrofits for future EIs to ensure that the latest available information is used. In 2011, slide valves were used in 32% of all vessel calls. In addition, shore side electrical power was used for 88 vessel calls representing about 4% of all vessel calls. At-berth reduction of 95% in all pollutants for auxiliary engines emissions is assumed for ships that used shore side electrical power. This reduction estimate accounts for the time necessary to connect and disconnect the electrical power and start-up the auxiliary engines. 3.5.13 Improvements to Methodology from Previous Years There were improvements to the ocean-going vessels emission calculation methodology in this inventory compared to the 2010 methodology. The PM2.5 conversion factor was changed to .92 for distillate fuel, while a 0.80 PM2.5 conversion factor continues to be used for residual fuel. In previous inventories, a 0.80 PM2.5 conversion factor was used for both distillate and residual fuel.
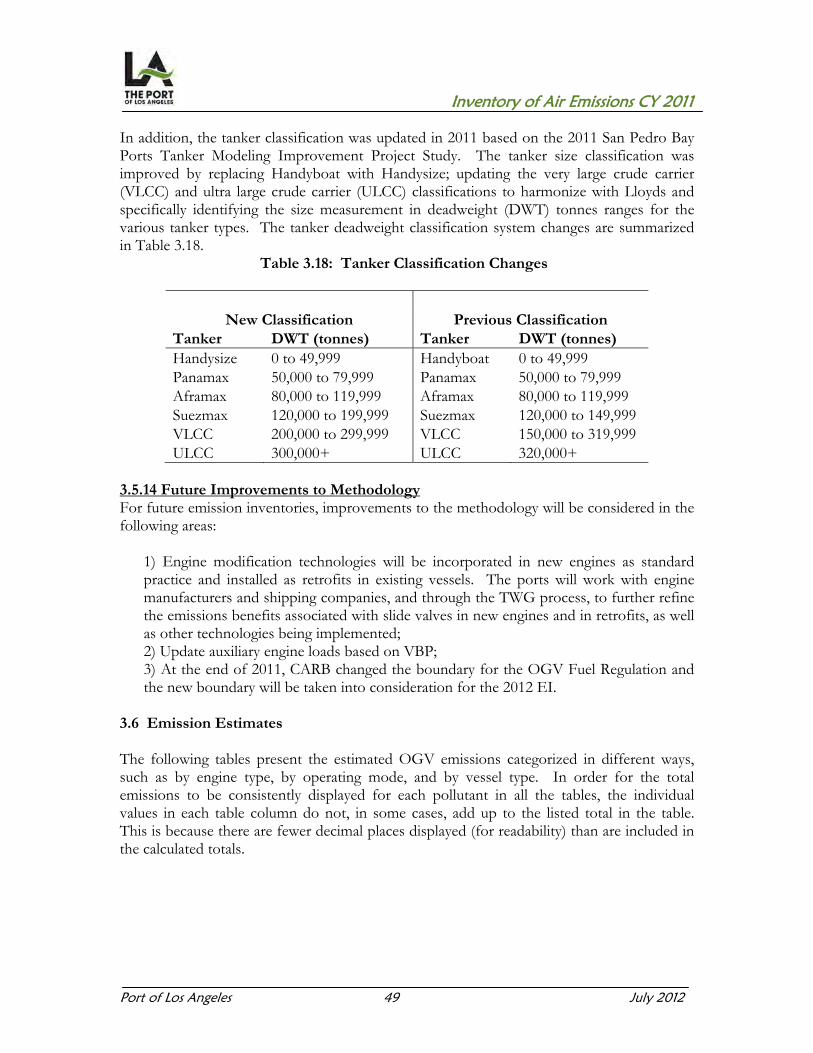
Inventory of Air Emissions CY 2011
Port of Los Angeles 49 July 2012
In addition, the tanker classification was updated in 2011 based on the 2011 San Pedro Bay Ports Tanker Modeling Improvement Project Study. The tanker size classification was improved by replacing Handyboat with Handysize; updating the very large crude carrier (VLCC) and ultra large crude carrier (ULCC) classifications to harmonize with Lloyds and specifically identifying the size measurement in deadweight (DWT) tonnes ranges for the various tanker types. The tanker deadweight classification system changes are summarized in Table 3.18.
Table 3.18: Tanker Classification Changes
New Classification Previous Classification Tanker DWT (tonnes) Tanker DWT (tonnes) Handysize 0 to 49,999 Handyboat 0 to 49,999 Panamax 50,000 to 79,999 Panamax 50,000 to 79,999 Aframax 80,000 to 119,999 Aframax 80,000 to 119,999 Suezmax 120,000 to 199,999 Suezmax 120,000 to 149,999 VLCC 200,000 to 299,999 VLCC 150,000 to 319,999 ULCC 300,000+ ULCC 320,000+
3.5.14 Future Improvements to Methodology For future emission inventories, improvements to the methodology will be considered in the following areas:
1) Engine modification technologies will be incorporated in new engines as standard practice and installed as retrofits in existing vessels. The ports will work with engine manufacturers and shipping companies, and through the TWG process, to further refine the emissions benefits associated with slide valves in new engines and in retrofits, as well as other technologies being implemented; 2) Update auxiliary engine loads based on VBP; 3) At the end of 2011, CARB changed the boundary for the OGV Fuel Regulation and the new boundary will be taken into consideration for the 2012 EI.
3.6 Emission Estimates
The following tables present the estimated OGV emissions categorized in different ways, such as by engine type, by operating mode, and by vessel type. In order for the total emissions to be consistently displayed for each pollutant in all the tables, the individual values in each table column do not, in some cases, add up to the listed total in the table. This is because there are fewer decimal places displayed (for readability) than are included in the calculated totals.

Inventory of Air Emissions CY 2011
Port of Los Angeles 50 July 2012
A summary of the ocean-going vessel emission estimates by vessel type for all pollutants for the year 2011 is presented in Tables 3.19 and 3.20. The criteria pollutant emissions are in tons per year (tpy), while the greenhouse gas emissions are in tonnes.
Table 3.19: 2011 Ocean-Going Vessel Emissions by Vessel Type, tpy
Vessel Type PM10 PM2.5 DPM NOx SOx CO HC
Auto Carrier 3.2 2.8 3.0 82.9 22.0 8.3 3.6Bulk 2.2 1.9 2.0 56.7 16.2 5.6 2.4Bulk - Heavy Load 0.1 0.1 0.1 3.6 0.9 0.3 0.1Bulk - Wood Chips 0.0 0.0 0.0 1.0 0.3 0.1 0.0Container - 1000 1.6 1.5 1.4 49.7 11.4 5.3 2.4Container - 2000 9.8 8.5 7.4 215.7 91.3 21.8 9.5Container - 3000 0.4 0.3 0.3 9.7 2.3 1.0 0.5Container - 4000 23.6 20.8 21.9 575.9 144.0 70.1 35.9Container - 5000 31.3 27.2 28.5 654.0 193.7 84.5 44.8Container - 6000 30.6 26.7 27.5 654.1 188.3 89.3 47.5Container - 7000 0.5 0.4 0.4 7.9 2.6 1.2 0.7Container - 8000 19.3 16.7 17.7 375.1 125.2 51.1 26.4Container - 9000 8.1 7.0 7.5 163.2 51.0 19.4 9.7Cruise 15.3 13.8 15.3 427.5 97.8 37.3 14.6General Cargo 4.3 3.9 4.0 123.9 28.9 11.1 4.6Ocean Tugboat (ATB/ITB) 0.9 0.9 0.9 29.9 5.3 2.7 1.2Miscellaneous 0.0 0.0 0.0 0.3 0.1 0.0 0.0Reefer 1.2 1.1 1.1 41.8 8.0 3.6 1.5Tanker - Aframax 0.5 0.5 0.3 10.3 5.2 1.1 0.5Tanker - Chemical 6.5 5.9 3.7 127.9 70.5 12.7 5.4Tanker - Handysize 3.5 3.1 1.4 58.6 48.6 5.2 2.2Tanker - Panamax 10.9 9.4 3.9 151.3 161.1 15.1 6.5Total 173.8 152.5 148.3 3,821.0 1,274.7 446.8 220.0
DB ID692
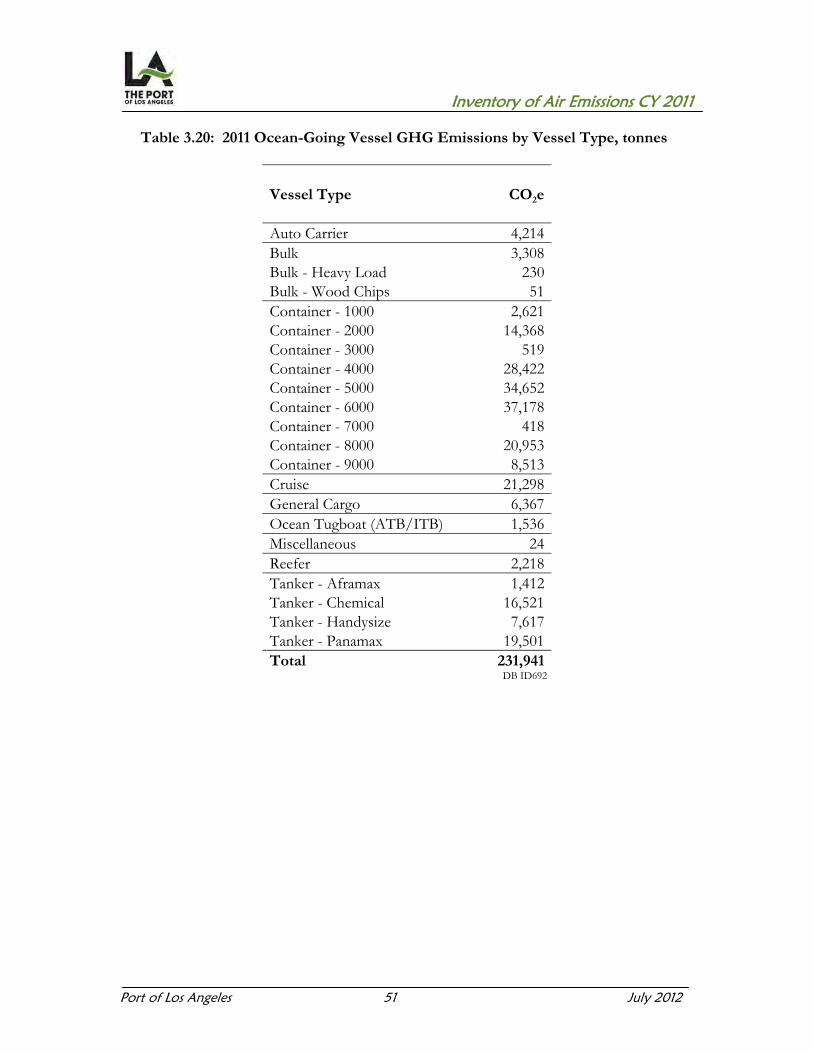
Inventory of Air Emissions CY 2011
Port of Los Angeles 51 July 2012
Table 3.20: 2011 Ocean-Going Vessel GHG Emissions by Vessel Type, tonnes
Vessel Type CO2e
Auto Carrier 4,214Bulk 3,308Bulk - Heavy Load 230Bulk - Wood Chips 51Container - 1000 2,621Container - 2000 14,368Container - 3000 519Container - 4000 28,422Container - 5000 34,652Container - 6000 37,178Container - 7000 418Container - 8000 20,953Container - 9000 8,513Cruise 21,298General Cargo 6,367Ocean Tugboat (ATB/ITB) 1,536Miscellaneous 24Reefer 2,218Tanker - Aframax 1,412Tanker - Chemical 16,521Tanker - Handysize 7,617Tanker - Panamax 19,501Total 231,941
DB ID692

Inventory of Air Emissions CY 2011
Port of Los Angeles 52 July 2012
Figure 3.4 shows percentage of emissions by vessel type for each pollutant. Containerships contributed the highest percentage of the emissions (approximately 64 to 80%), followed by tankers (approximately 7 to 22%), cruise ships (approximately 7 to 12%), general cargo, auto carrier, Reefer, and bulk vessels. The “other” category includes ocean-going tugboats and miscellaneous vessels.
Figure 3.4: 2011 Ocean-Going Vessel Emissions by Vessel Type
3.6.1 Emission Estimates by Engine Type Tables 3.21 and 3.22 present summaries of emission estimates by engine type in tons per year.
Table 3.21: 2011 Ocean-Going Vessel Emissions by Engine Type, tpy
Engine Type PM10 PM2.5 DPM NOx SOx CO HC
Main Engine 87 74 85 1,742 469 263 151 Auxiliary Engine 63 58 63 1,904 403 166 60 Auxiliary Boiler 24 21 0 175 403 18 9 Total 174 153 148 3,821 1,275 447 220
DB ID692
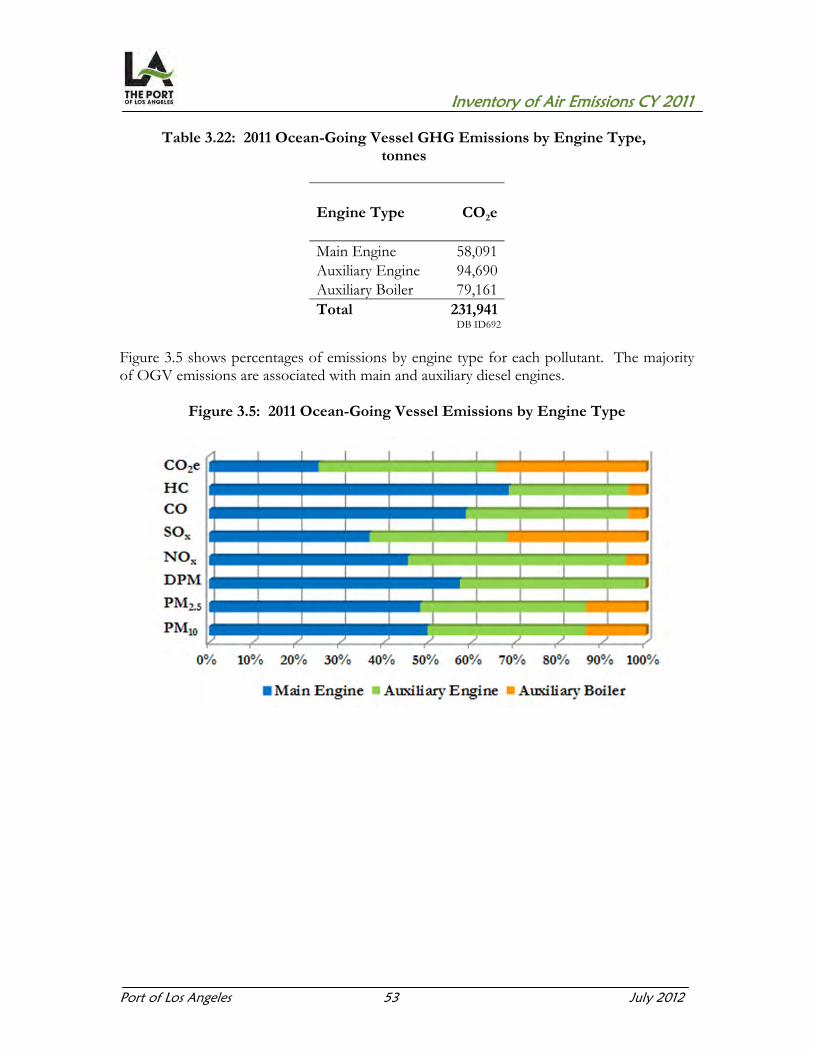
Inventory of Air Emissions CY 2011
Port of Los Angeles 53 July 2012
Table 3.22: 2011 Ocean-Going Vessel GHG Emissions by Engine Type, tonnes
Engine Type CO2e
Main Engine 58,091Auxiliary Engine 94,690Auxiliary Boiler 79,161Total 231,941
DB ID692
Figure 3.5 shows percentages of emissions by engine type for each pollutant. The majority of OGV emissions are associated with main and auxiliary diesel engines.
Figure 3.5: 2011 Ocean-Going Vessel Emissions by Engine Type

Inventory of Air Emissions CY 2011
Port of Los Angeles 54 July 2012
3.6.2 Emission Estimates by Mode Tables 3.23 and 3.24 present summaries of emission estimates by the various modes in tons per year. For each mode, the engine type emissions are also listed. Hotelling at terminal berth and at anchorage are listed separately. Transit and harbor maneuvering emissions include both berth and anchorage calls. Figure 3.6 shows results in percentages of emissions by mode.
Table 3.23: 2011 Ocean-Going Vessel Emissions by Mode, tpy
Mode Engine Type PM10 PM2.5 DPM NOx SOx CO HC Transit Main 78.5 66.3 76.7 1,505.0 457.9 215.0 109.9Transit Aux 18.0 15.4 18.0 369.7 129.0 31.7 11.5Transit Auxiliary Boiler 2.1 1.8 0.0 12.2 38.3 1.2 0.6Total Transit 98.6 83.5 94.7 1,886.9 625.2 247.9 122.0
Maneuvering Main 8.4 7.8 8.4 236.9 11.0 48.5 41.1Maneuvering Aux 4.4 4.1 4.4 148.9 26.4 13.0 4.7Maneuvering Auxiliary Boiler 0.4 0.4 0.0 3.8 6.6 0.4 0.2Total Maneuvering 13.2 12.3 12.8 389.6 44.0 61.9 46.0
Hotelling - Berth Main 0.0 0.0 0.0 0.0 0.0 0.0 0.0Hotelling - Berth Aux 37.7 34.9 37.7 1,271.9 227.0 111.3 40.5Hotelling - Berth Auxiliary Boiler 19.6 17.4 0.0 149.6 330.2 15.1 7.5Total Hotelling - Berth 57.3 52.3 37.7 1,421.5 557.2 126.4 48.0
Hotelling - Anchorage Main 0.0 0.0 0.0 0.0 0.0 0.0 0.0Hotelling - Anchorage Aux 3.4 3.1 3.4 113.9 20.5 9.9 3.6Hotelling - Anchorage Auxiliary Boiler 1.5 1.3 0.0 9.1 27.8 0.9 0.5Total Hotelling - Anchorage 4.9 4.4 3.4 123.0 48.3 10.8 4.1Total 174 153 148 3,821 1,275 447 220
DB ID694
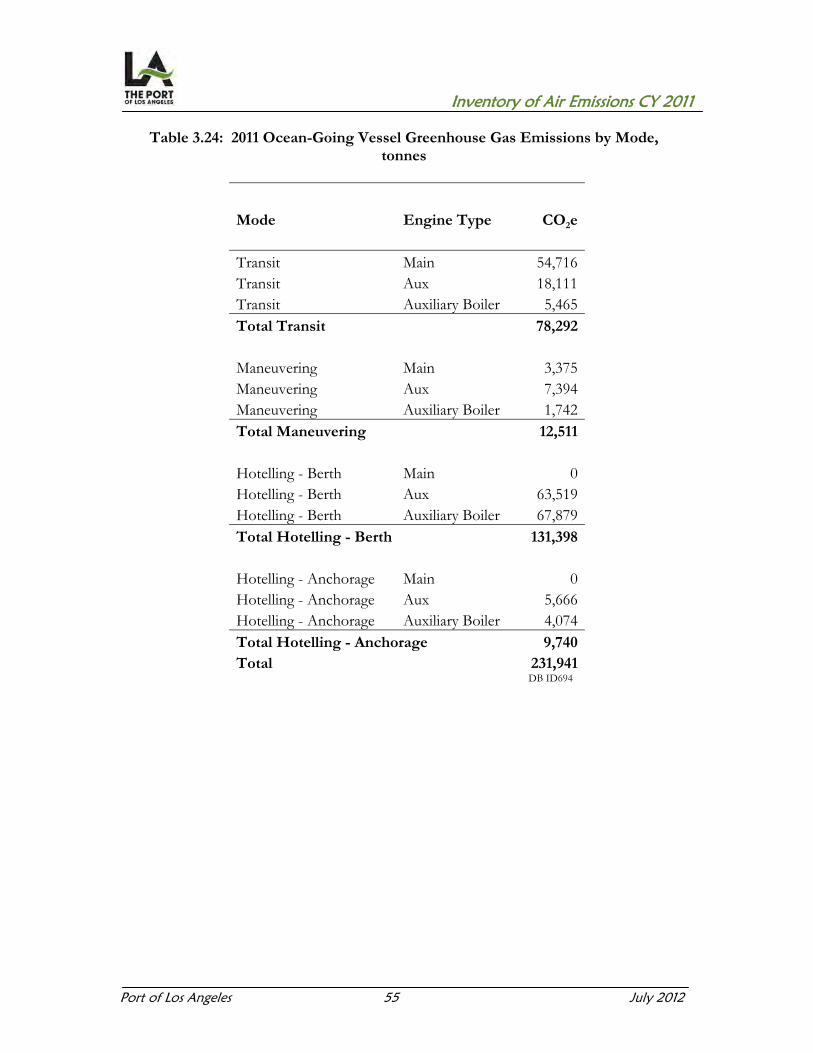
Inventory of Air Emissions CY 2011
Port of Los Angeles 55 July 2012
Table 3.24: 2011 Ocean-Going Vessel Greenhouse Gas Emissions by Mode, tonnes
Mode Engine Type CO2e
Transit Main 54,716 Transit Aux 18,111 Transit Auxiliary Boiler 5,465 Total Transit 78,292
Maneuvering Main 3,375 Maneuvering Aux 7,394 Maneuvering Auxiliary Boiler 1,742 Total Maneuvering 12,511
Hotelling - Berth Main 0 Hotelling - Berth Aux 63,519 Hotelling - Berth Auxiliary Boiler 67,879 Total Hotelling - Berth 131,398
Hotelling - Anchorage Main 0 Hotelling - Anchorage Aux 5,666 Hotelling - Anchorage Auxiliary Boiler 4,074 Total Hotelling - Anchorage 9,740 Total 231,941
DB ID694

Inventory of Air Emissions CY 2011
Port of Los Angeles 56 July 2012
Figure 3.6: 2011 Ocean-Going Vessel Emissions by Mode
3.7 Facts and Findings Table 3.25 presents the number of vessel calls and the container cargo throughputs for calendar years 2005 through 2011. The average number of twenty-foot equivalent units (TEUs) per containership call was at its highest for 2010 and 2011 calendar years, which means that, on average, more TEUs were handled per vessel call in 2010 and 2011 than in the previous years.
Table 3.25: Container and Cargo Throughputs and Change
All Containership AverageYear Calls Calls Throughput TEUs/Call
(TEUs) 2011 2,072 1,376 7,940,511 5,7712010 2,035 1,355 7,831,902 5,7802009 2,010 1,355 6,748,995 4,9812008 2,239 1,459 7,849,985 5,3802007 2,527 1,573 8,355,038 5,3122006 2,703 1,627 8,469,853 5,2062005 2,501 1,481 7,484,625 5,054Previous Year (2011-2010) 2% 2% 1% 0%CAAP Progress (2011-2005) -17% -7% 6% 14%

Inventory of Air Emissions CY 2011
Port of Los Angeles 57 July 2012
Figure 3.7 presents the trends in the total throughput in TEUs, vessel calls and TEUs/call for 2005 to 2011. The TEUs/container call efficiency increased in 2011.
Figure 3.7: Container and Cargo Throughput Trend
3.7.1 Flags of Convenience Most OGVs are foreign flagged ships, whereas harbor craft are almost exclusively domestic. Approximately 93% of the OGVs that visited the Port were registered outside the U.S. Although only 7% of the individual OGVs are registered in the U.S., they comprised 14% of all calls. This is most likely because the U.S. flagged OGVs make shorter, more frequent stops along the west coast. Figures 3.8 and 3.9 show the breakdown of the ships’ registered country (i.e., flag of registry) for discrete vessels and by the number of calls, respectively.
0
2,000
4,000
6,000
8,000
10,000
2005 2006 2007 2008 2009 2010 2011
TEUs/Call All Inbound Calls
Containership Calls 1,000 TEUs
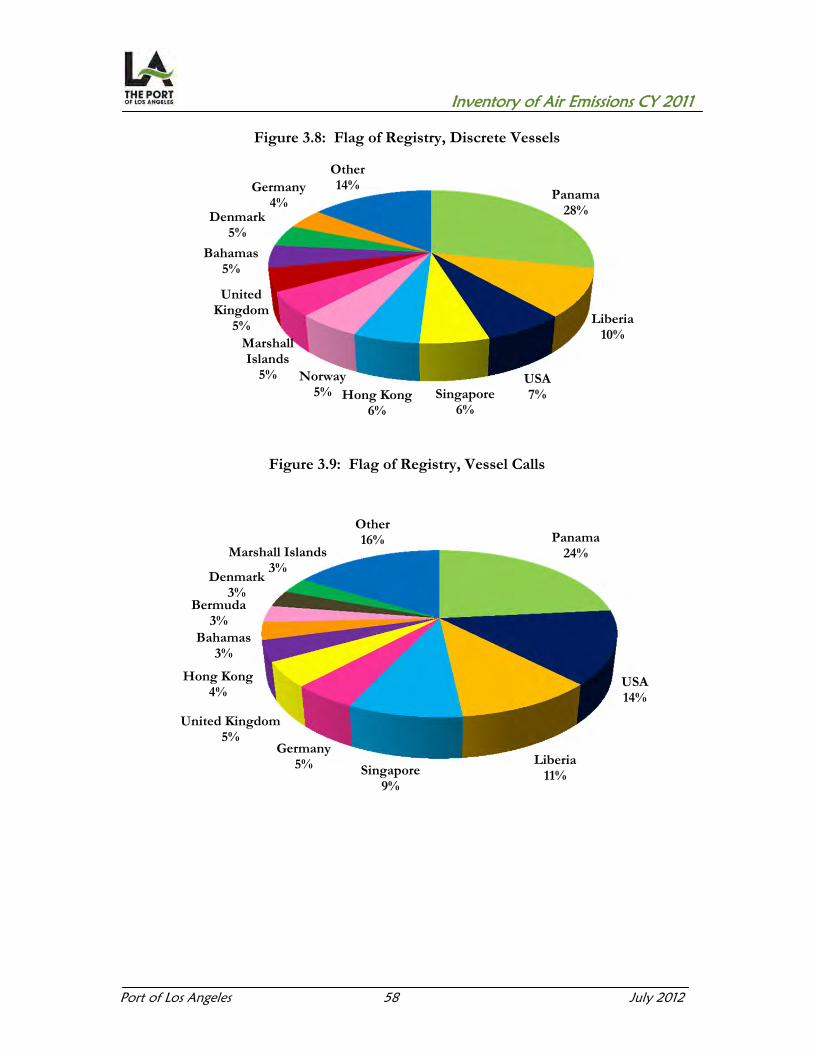
Inventory of Air Emissions CY 2011
Port of Los Angeles 58 July 2012
Figure 3.8: Flag of Registry, Discrete Vessels
Figure 3.9: Flag of Registry, Vessel Calls
Panama28%
Liberia10%
USA7%Singapore
6%Hong Kong
6%
Norway5%
Marshall Islands
5%
Bahamas5%
United Kingdom
5%
Denmark5%
Germany4%
Other14%
Panama24%
USA14%
Liberia11%Singapore
9%
Germany5%
United Kingdom5%
Hong Kong4%
Bahamas3%
Bermuda3%
Denmark3%
Marshall Islands3%
Other16%
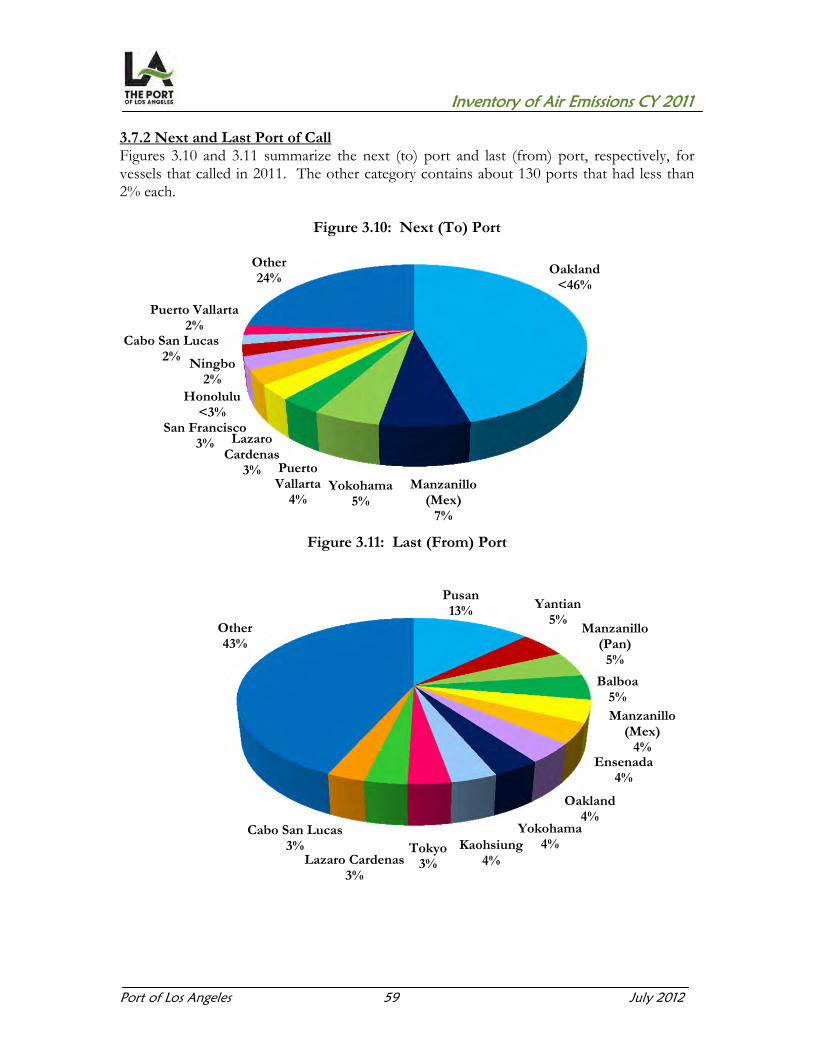
Inventory of Air Emissions CY 2011
Port of Los Angeles 59 July 2012
3.7.2 Next and Last Port of Call Figures 3.10 and 3.11 summarize the next (to) port and last (from) port, respectively, for vessels that called in 2011. The other category contains about 130 ports that had less than 2% each.
Figure 3.10: Next (To) Port
Figure 3.11: Last (From) Port
Oakland <46%
Manzanillo (Mex)
7%
Yokohama5%
Puerto Vallarta
4%
Lazaro Cardenas
3%
San Francisco 3%
Honolulu<3%
Ningbo2%
Cabo San Lucas2%
Puerto Vallarta2%
Other24%
Pusan13% Yantian
5%Manzanillo
(Pan)5%
Balboa 5%Manzanillo
(Mex)4%
Ensenada4%
Oakland4%
Yokohama4%Kaohsiung
4%Tokyo
3%Lazaro Cardenas3%
Cabo San Lucas3%
Other43%

Inventory of Air Emissions CY 2011
Port of Los Angeles 60 July 2012
3.7.3 Vessel Characteristics Table 3.26 summarizes the vessel and engine characteristics by vessel type. The year built, DWT, speed, and main engine power are based on the specific vessels that called at the Port in 2011. Due to the large number of containerships and tankers that call at the Port and their variety, the vessels were divided by vessel types. For some vessel types, there was no data available for certain characteristics and these are labeled “na.”
Table 3.26: Vessel Type Characteristics
Vessel Type Year Age DWT Max Speed Main Eng Aux EngBuilt (years) (tons) (knots) (kW) (kW)
Auto Carrier 2003 8 16,711 19.7 12,870 3,327Bulk 2002 9 46,303 14.4 8,008 1,780Bulk - Heavy Load 1989 22 na 15.1 11,032 2,748Bulk - Wood Chips 1997 14 49,996 14.5 8,252 1,776Container - 1000 2000 11 22,468 19.9 15,160 3,199Container - 2000 2000 11 39,352 21.6 22,308 5,220Container - 3000 1995 16 45,995 22.5 27,694 4,429Container - 4000 2000 11 61,882 23.9 41,105 7,211Container - 5000 2002 9 67,123 25.1 51,482 8,370Container - 6000 2005 6 77,881 25.1 61,092 11,809Container - 7000 2007 4 78,692 25.3 54,942 12,793Container - 8000 2006 5 101,742 25.0 67,039 11,279Container - 9000 2007 4 na 25.1 68,518 11,604Cruise 2002 9 7,105 21.4 47,482 9,931General Cargo 1999 12 43,913 15.5 9,491 2,341Ocean Tugboat (ATB/ITB) 1987 24 23,683 13.5 6,691 naMiscellaneous 1982 29 10,987 15.6 3,383 1,100Reefer 1991 20 13,226 19.3 9,255 3,337Tanker - Aframax 2008 3 105,845 14.9 13,499 2,364Tanker - Chemical 2005 6 31,403 14.8 8,207 2,692Tanker - Handysize 2002 9 45,378 14.8 8,747 2,809Tanker - Panamax 2003 8 68,988 14.8 11,248 2,584
DB ID695
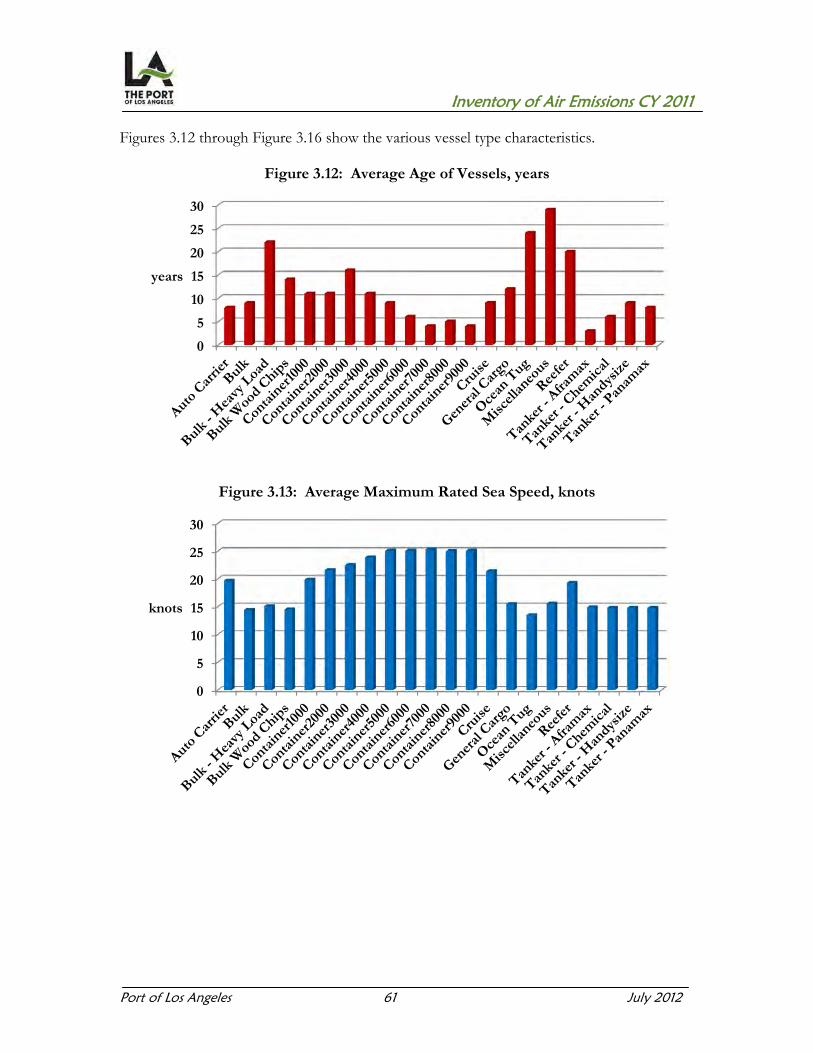
Inventory of Air Emissions CY 2011
Port of Los Angeles 61 July 2012
Figures 3.12 through Figure 3.16 show the various vessel type characteristics.
Figure 3.12: Average Age of Vessels, years
Figure 3.13: Average Maximum Rated Sea Speed, knots
0
5
10
15
20
25
30
years
0
5
10
15
20
25
30
knots

Inventory of Air Emissions CY 2011
Port of Los Angeles 62 July 2012
Figure 3.14: Average Deadweight, tons
Figure 3.15: Average Main Engine Total Installed Power, kilowatts
Figure 3.16: Average Auxiliary Engine Total Installed Power, kilowatts
020,00040,00060,00080,000
100,000120,000
tons
010,00020,00030,00040,00050,00060,00070,000
kW
02,0004,0006,0008,000
10,00012,00014,000
kW
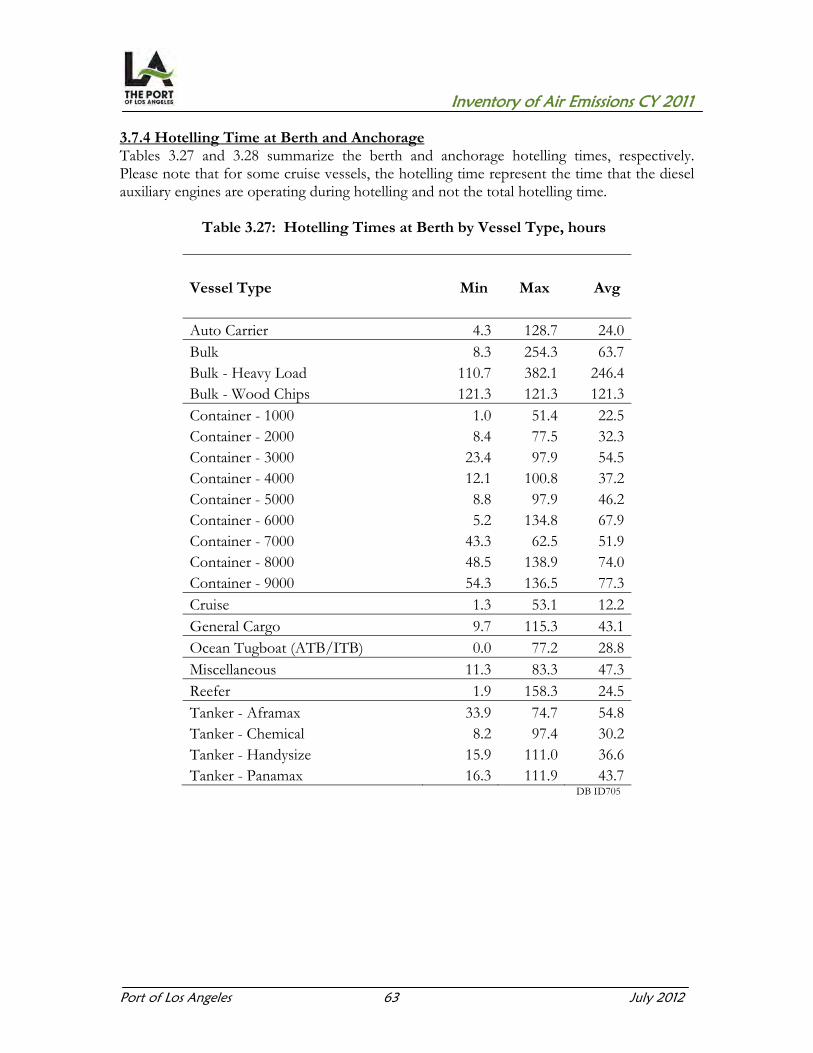
Inventory of Air Emissions CY 2011
Port of Los Angeles 63 July 2012
3.7.4 Hotelling Time at Berth and Anchorage Tables 3.27 and 3.28 summarize the berth and anchorage hotelling times, respectively. Please note that for some cruise vessels, the hotelling time represent the time that the diesel auxiliary engines are operating during hotelling and not the total hotelling time.
Table 3.27: Hotelling Times at Berth by Vessel Type, hours
Vessel Type Min Max Avg
Auto Carrier 4.3 128.7 24.0 Bulk 8.3 254.3 63.7 Bulk - Heavy Load 110.7 382.1 246.4 Bulk - Wood Chips 121.3 121.3 121.3 Container - 1000 1.0 51.4 22.5 Container - 2000 8.4 77.5 32.3 Container - 3000 23.4 97.9 54.5 Container - 4000 12.1 100.8 37.2 Container - 5000 8.8 97.9 46.2 Container - 6000 5.2 134.8 67.9 Container - 7000 43.3 62.5 51.9 Container - 8000 48.5 138.9 74.0 Container - 9000 54.3 136.5 77.3 Cruise 1.3 53.1 12.2 General Cargo 9.7 115.3 43.1 Ocean Tugboat (ATB/ITB) 0.0 77.2 28.8 Miscellaneous 11.3 83.3 47.3 Reefer 1.9 158.3 24.5 Tanker - Aframax 33.9 74.7 54.8 Tanker - Chemical 8.2 97.4 30.2 Tanker - Handysize 15.9 111.0 36.6 Tanker - Panamax 16.3 111.9 43.7
DB ID705
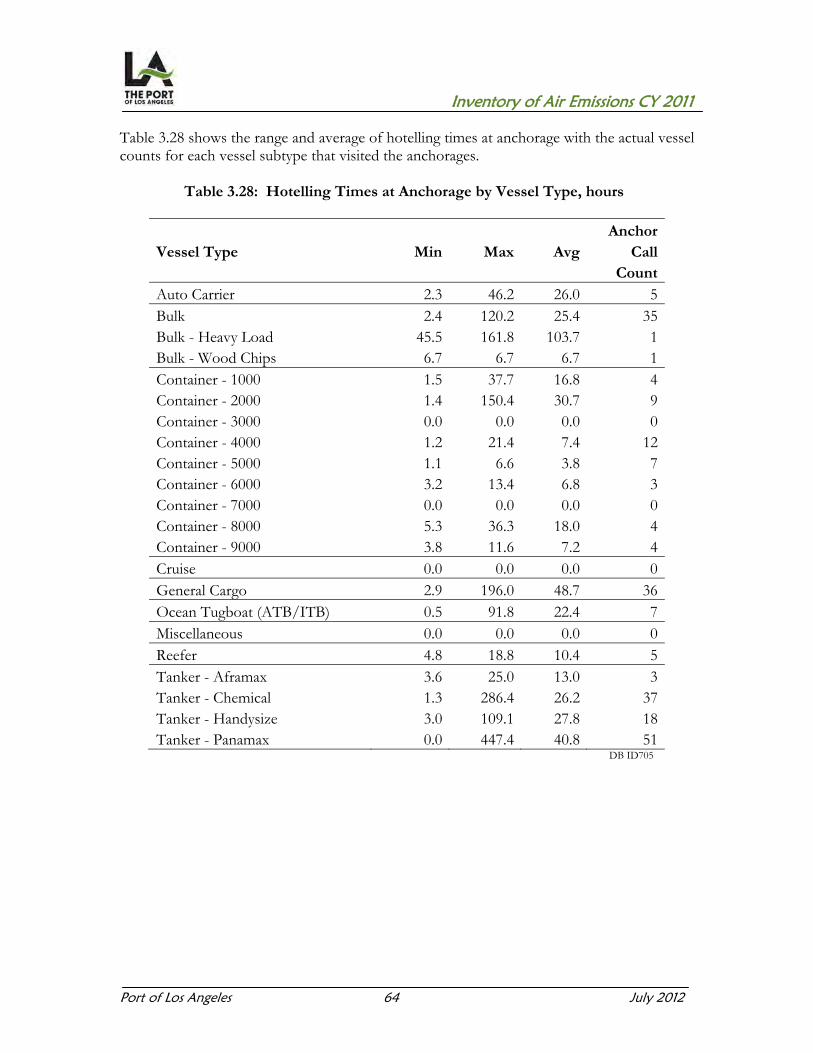
Inventory of Air Emissions CY 2011
Port of Los Angeles 64 July 2012
Table 3.28 shows the range and average of hotelling times at anchorage with the actual vessel counts for each vessel subtype that visited the anchorages.
Table 3.28: Hotelling Times at Anchorage by Vessel Type, hours
Anchor
Vessel Type Min Max Avg CallCount
Auto Carrier 2.3 46.2 26.0 5Bulk 2.4 120.2 25.4 35Bulk - Heavy Load 45.5 161.8 103.7 1Bulk - Wood Chips 6.7 6.7 6.7 1Container - 1000 1.5 37.7 16.8 4Container - 2000 1.4 150.4 30.7 9Container - 3000 0.0 0.0 0.0 0Container - 4000 1.2 21.4 7.4 12Container - 5000 1.1 6.6 3.8 7Container - 6000 3.2 13.4 6.8 3Container - 7000 0.0 0.0 0.0 0Container - 8000 5.3 36.3 18.0 4Container - 9000 3.8 11.6 7.2 4Cruise 0.0 0.0 0.0 0General Cargo 2.9 196.0 48.7 36Ocean Tugboat (ATB/ITB) 0.5 91.8 22.4 7Miscellaneous 0.0 0.0 0.0 0Reefer 4.8 18.8 10.4 5Tanker - Aframax 3.6 25.0 13.0 3Tanker - Chemical 1.3 286.4 26.2 37Tanker - Handysize 3.0 109.1 27.8 18Tanker - Panamax 0.0 447.4 40.8 51
DB ID705
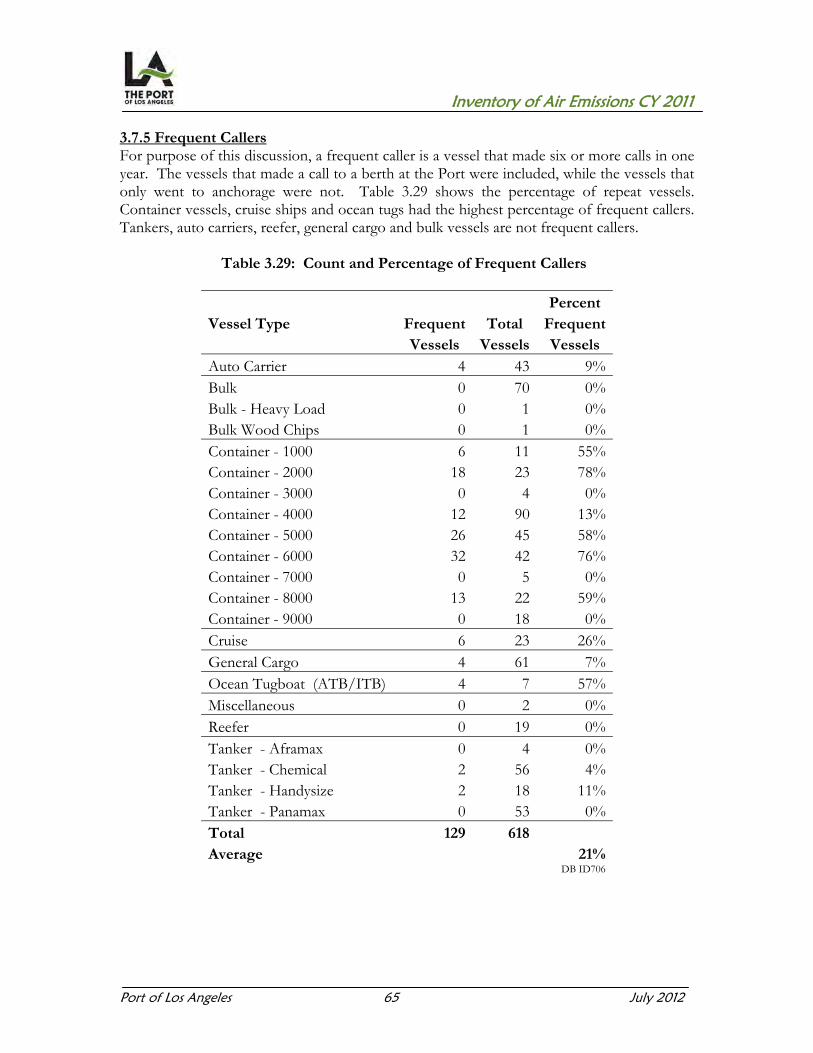
Inventory of Air Emissions CY 2011
Port of Los Angeles 65 July 2012
3.7.5 Frequent Callers For purpose of this discussion, a frequent caller is a vessel that made six or more calls in one year. The vessels that made a call to a berth at the Port were included, while the vessels that only went to anchorage were not. Table 3.29 shows the percentage of repeat vessels. Container vessels, cruise ships and ocean tugs had the highest percentage of frequent callers. Tankers, auto carriers, reefer, general cargo and bulk vessels are not frequent callers.
Table 3.29: Count and Percentage of Frequent Callers
Percent
Vessel Type Frequent Total Frequent Vessels Vessels Vessels
Auto Carrier 4 43 9% Bulk 0 70 0% Bulk - Heavy Load 0 1 0% Bulk Wood Chips 0 1 0% Container - 1000 6 11 55% Container - 2000 18 23 78% Container - 3000 0 4 0% Container - 4000 12 90 13% Container - 5000 26 45 58% Container - 6000 32 42 76% Container - 7000 0 5 0% Container - 8000 13 22 59% Container - 9000 0 18 0% Cruise 6 23 26% General Cargo 4 61 7% Ocean Tugboat (ATB/ITB) 4 7 57% Miscellaneous 0 2 0% Reefer 0 19 0% Tanker - Aframax 0 4 0% Tanker - Chemical 2 56 4% Tanker - Handysize 2 18 11% Tanker - Panamax 0 53 0% Total 129 618Average 21%
DB ID706


Inventory of Air Emissions CY 2011
Port of Los Angeles 66 July 2012
SECTION 4 HARBOR CRAFT This section presents emissions estimates for the commercial harbor craft source category, including source description (4.1), geographical delineation (4.2), data and information acquisition (4.3), operational profiles (4.4), emissions estimation methodology (4.5), and the emission estimates (4.6). 4.1 Source Description Harbor craft are commercial vessels that spend the majority of their time within or near the Port and harbor. The harbor craft emissions inventory consists of the following vessel types: Assist tugboats Commercial fishing vessels Crew boats Ferry vessels Excursion vessels
Government vessels Tugboats Ocean tugs Work boats
Recreational vessels are not considered to be commercial harbor craft; therefore their emissions are not included in this inventory. Figure 4.1 presents the distribution of the 250 commercial harbor craft inventoried for the Port in 2011. Commercial fishing vessels represent 53% of the harbor craft inventoried, followed by the excursion vessels (10%), crew boats (9%), tugboats (7%), assist tugs (6%), government vessels (6%), ferries (4%), work boats (3%), and ocean tugs (2%).
Figure 4.1: Distribution of 2011 Commercial Harbor Craft by Vessel Type
Commercial fishing
53%
Excursion10%
Crew boat9%
Tugboat7%
Assist tug6%
Government6%
Ferry4%
Work boat3%
Ocean tug2%

Inventory of Air Emissions CY 2011
Port of Los Angeles 67 July 2012
Ocean tugs included in this section are different from the integrated tug barge (ITB) and articulated tug barge (ATB) included in the ocean-going section of this report. ITB and ATB are seen as specialized single vessels and are included in the marine exchange data for ocean-going vessels. The ocean tugs in this section are not rigidly connected to the barge and are typically not home-ported at the Port, but may make frequent calls with barges. They are different from harbor tugboats because their engine loads are higher than harbor tugboats which tend to idle more in-between jobs. Tugboats are typically home-ported in San Pedro Bay harbor and primarily operate within the harbor area, but can also operate outside the harbor based on the work assignments. 4.2 Geographical Delineation The geographical extent of the emissions inventory for harbor craft is the boundary for the SoCAB as shown in Figure 4.2 (in dark blue). Most harbor craft operate the majority of the time within the harbor and up to 25 nm from the Port. For those harbor craft that operate outside of the harbor and travel to other ports, vessel operators were asked to provide the estimated percent of operation up to 50 nm from the Port in order to capture the emissions within the SoCAB boundary.
Figure 4.2: Geographical Extent of Harbor Craft Inventory

Inventory of Air Emissions CY 2011
Port of Los Angeles 68 July 2012
4.3 Data and Information Acquisition The following sources were used to collect data for the harbor craft inventory: Vessel owners and/or operators Port Wharfingers data for commercial fishing vessels at Port-owned berths
The operating parameters of interest include the following: Vessel type Number, type and horsepower (or kilowatts) of main propulsion engine(s) Number, type and horsepower (or kilowatts) of auxiliary engines Activity hours Annual fuel consumption Qualitative information regarding how the vessels are used in service Main and auxiliary engine model year Repowered (replaced) engines Emission reduction strategies, if any (e.g., shore power, retrofits with after-treatment
technologies) The following companies were contacted to collect information on their fleet:
Excursion vessels: L.A. Harbor Sportfishing 22nd St. Partners, Sportfishing Los Angeles Harbor Cruise Spirit Cruises Fiesta Harbor Cruises Seahawk Sportfishing
Commercial fishing vessels:
Berth 73 and Fish Harbor, Port-owned marinas Ferry vessels:
Catalina Channel Express Seaway Co. of Catalina
Government vessels:
L.A. Fire Department L.A. Police Department Harbor Department Port of Los Angeles Pilots

Inventory of Air Emissions CY 2011
Port of Los Angeles 69 July 2012
Work boats: Pacific Tugboat Services Jankovich
Crew boats:
U.S. Water Taxi American Marine Corp. Southern California Ship Services
Assist tugboats and harbor tugs:
Crowley Marine Services Foss Maritime Company Millennium Maritime
Harbor and ocean tugs:
Crowley Petroleum Services Sause Brothers Ocean Towing Westoil Marine Services
It should be noted that engine specific information for individual commercial fishing vessels is not readily available due to difficulty in contacting the commercial fishing vessel operators. The Port’s data from the Wharfinger Division were used to identify the commercial fishing vessels that berthed at the Port-owned marinas and to determine the total number of vessels compared to prior years. The engine power and activity hours for these vessels were primarily based on CARB’s commercial harbor craft survey results, with limited information available from some vessel operators. 4.4 Operational Profiles Commercial harbor craft companies were identified and contacted to obtain the operating parameters for their vessels. Tables 4.1 and 4.2 summarize the main and auxiliary engine data, respectively, for each vessel type. The averages by vessel type have been used as defaults for vessels for which the model year, horsepower, or operating hour information is missing. Operational hours for the vessels that were not at the Port the entire year reflect the partial time they operated at the Port during the 2011 calendar year. The engine count includes old and new engines for those vessels that were repowered during the year and provided 2011 activity hours for both old and new engines. This emissions inventory covers harbor craft that operate in the Port of Los Angeles harbor most of the time. There are a number of companies that operate harbor craft in both the Ports of Los Angeles and Long Beach harbors. The activity hours for the vessels that are common to both ports reflect work performed during 2011 for the Port of Los Angeles harbor only.

Inventory of Air Emissions CY 2011
Port of Los Angeles 70 July 2012
Table 4.1: 2011 Summary of Propulsion Engine Data by Vessel Category
DB ID423
Table 4.2: 2011 Summary of Auxiliary Engine Data by Vessel Category
DB ID422
Harbor Vessel Engine Model year Horsepower Annual Operating HoursCraft Type Count Count Minimum Maximum Average Minimum Maximum Average Minimum Maximum AverageAssist tug 15 33 1982 2011 2004 1,500 2,540 2,046 711 3,669 1,522Commercial fishing 132 136 1957 2010 1988 50 615 231 200 1,300 887Crew boat 23 59 1974 2011 2002 180 1,400 518 22 1,650 591Excursion 25 47 1970 2010 1997 150 530 357 275 3,000 1,545Ferry 10 22 2003 2011 2007 600 2,300 1,882 600 1,200 1,068Government 15 26 1988 2009 2002 68 1,800 519 17 1,727 593Ocean tug 6 12 1991 2007 2002 805 2,850 1,702 200 1,500 783Tugboat 16 32 1981 2010 2006 200 1,500 678 0 948 433Work boat 8 15 1979 2011 2001 135 1,000 496 156 2,000 965Total 250 382
Harbor Vessel Engine Model year Horsepower Annual Operating HoursCraft Type Count Count Minimum Maximum Average Minimum Maximum Average Minimum Maximum AverageAssist tug 15 30 1996 2010 2007 60 425 185 462 2,937 1,686Commercial fishing 132 23 1957 2010 1994 10 195 60 100 1,440 807Crew boat 23 21 1974 2010 1999 11 133 54 1 2,037 679Excursion 25 26 1966 2010 1997 7 54 39 256 3,000 1,432Ferry 10 14 2003 2011 2007 18 120 54 300 750 686Government 15 9 2003 2007 2004 50 400 204 20 500 156Ocean tug 6 12 1991 2007 2002 60 150 98 200 750 533Tugboat 16 22 1970 2010 2007 22 89 45 0 707 347Work boat 8 11 1968 2010 1989 27 101 74 0 2,000 626Total 250 168

Inventory of Air Emissions CY 2011
Port of Los Angeles 71 July 2012
The harbor craft engines (propulsion and auxiliary) with known engine year and horsepower are categorized by EPA marine engine standards. Harbor craft engines for which model year and/or horsepower information is not available are classified as “unknown.” Data collected from harbor craft operators does not include EPA certification standards for specific engines; therefore, it has been assumed that all small 2009 and newer engines (25 to 120 hp rating) meet Tier 3 emission standards44. This assumption is consistent with CARB’s harbor craft emission factors which follow the same model year grouping as the EPA emissions standards for marine engines as shown below. Figure 4.3 presents the engine standard distribution of all harbor craft propulsion and auxiliary engines inventoried for 2011. Due to rounding, the pie chart does not add up to 100%. The engine Tier category assumptions for this figure, based on the certification standards, are as follows: Tier 0: 1999 and older model year engines Tier 1: Model years 2000 to 2003 for engines with less than or equal to 750 hp;
model years 2000 to 2006 for engines with greater than 750 hp Tier 2: Model years 2004+ for engines with less than or equal to 750 hp; model years
2007+ for engines greater than 750 hp, with the exception for those that meet the Tier 3 criteria
Tier 3: Model years 2009+ for small engines with 25 to 120 hp rating or <0.9 liter engine displacement
“Unknown”: Engines with missing model year, horsepower or both
Figure 4.3: Distribution of Harbor Craft Engines by Engine Standards
44 Code of Federal Regulation, 40 CFR, subpart 94.8 for Tier 1 and 2 and subpart 1042.101 for Tier 3.
Unknown<23%
Tier 019%
Tier 120%
Tier 232%
Tier 3<7%
Inventory of Air Emissions CY 2011
Port of Los Angeles 72 July 2012
4.5 Emissions Estimation Methodology The emissions calculation parameters, methodologies, and equations are described in this section. Emissions were estimated on a per engine basis, i.e., the main and auxiliary engines emissions were estimated individually. In order to ensure consistency, the Port’s harbor craft emissions calculations methodology is primarily based on CARB’s latest harbor craft emissions calculations methodology with the exceptions noted in this section.45 4.5.1 Emissions Calculation Equations The basic equation used to estimate harbor craft emissions for each engine is:
Equation 4.1 = × × × ×
Where: E = emissions, tons/year Power = rated power of the engine, hp or kW Activity = activity, hours/year LF = load factor (ratio of average power used during normal operations as compared to maximum rated power), dimensionless EF = emission factor, grams of pollutant per unit of work, g/hp-hr or kW/hp-hr FCF = fuel correction factor to reflect changes in fuel properties that have occurred over time, dimensionless
The engine’s emission factor (EF) is a function of the zero hour (ZH) emission rate, deterioration rate and cumulative hours. The deterioration rate reflects the fact that the engine’s base emissions (ZH emission rates) change as the equipment is used, due to wear of various engine parts or reduced efficiency of emission control devices. The cumulative hours reflects the engine’s total operating hours. The emission factor is calculated as:
Equation 4.2 = +( × )
Where: ZH = zero-hour emission rate for a given engine size category and model year when the engine is new and there is no component malfunctioning, g/hp-hr or g/kW-hr DR = deterioration rate (rate of change of emissions as a function of equipment age), g/hp-hr2 or g/kW-hr2 Cumulative hours = total number of hours the engine has been in use and calculated as annual operating hours times age of the engine, hours
45 CARB, Appendix B: Emissions Estimation Methodology for Commercial Harbor Craft Operating in California, 2007.

Inventory of Air Emissions CY 2011
Port of Los Angeles 73 July 2012
The equation for the deterioration rate is: Equation 4.3
= ( × )/
Where: DR = deterioration rate, g/hp-hr2 or g/kW-hr2 DF = deterioration factor, percent increase in emissions at the end of the useful life, % ZH = zero-hour emission rate for a given engine size category and model year when the engine is new and there is no component malfunctioning, g/hp-hr or g/kW-hr Cumulative hours at the end of useful life = annual operating hours times useful life in years, hours
Per CARB, useful life for harbor craft is defined as the age at which 50% of the engines are retired from the fleet. All the engines are assumed to be retired at the age of twice the useful life. 4.5.2 Emission Factors, Deterioration Factors and Useful Life Zero hour emission factors, deterioration factors, and useful life for commercial harbor craft are based on CARB’s latest methodology, with the exception of greenhouse gas emission factors and the SOx emission factor. The SOx emission factor is calculated using the following mass balance equation included in the CARB’s methodology:
Equation 4.4 = × ×
Where: SOx EF = Emission factor for SOx, g/hp-hr ULSD S content = sulfur content of the ULSD fuel, 15 grams of S/1,000,000 g of fuel BSFC = Brake Specific Fuel Consumption, g/hp-hr
Greenhouse gas emissions factors for harbor craft are continuously evolving as more research is conducted and reviewed, so there is some variability in emission factors recommended and used by different groups; for this inventory, emissions factors for CO2, CH4, and N2O are sourced from the 2004 IVL study, and are listed in Appendix B46. The IVL study establishes the CH4 emission factor as 2% of the hydrocarbon emission factor.
46 IVL, 2004.
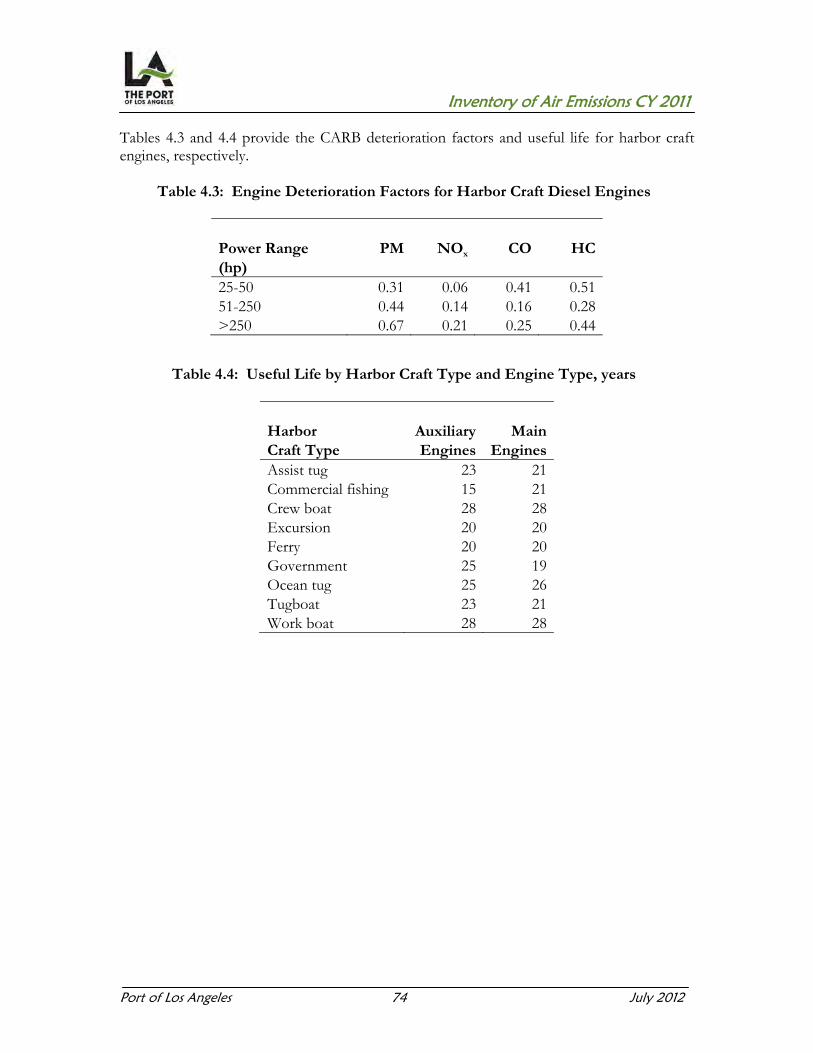
Inventory of Air Emissions CY 2011
Port of Los Angeles 74 July 2012
Tables 4.3 and 4.4 provide the CARB deterioration factors and useful life for harbor craft engines, respectively.
Table 4.3: Engine Deterioration Factors for Harbor Craft Diesel Engines
Power Range PM NOx CO HC (hp) 25-50 0.31 0.06 0.41 0.51 51-250 0.44 0.14 0.16 0.28 >250 0.67 0.21 0.25 0.44
Table 4.4: Useful Life by Harbor Craft Type and Engine Type, years
Harbor Auxiliary MainCraft Type Engines EnginesAssist tug 23 21Commercial fishing 15 21Crew boat 28 28Excursion 20 20Ferry 20 20Government 25 19Ocean tug 25 26Tugboat 23 21Work boat 28 28

Inventory of Air Emissions CY 2011
Port of Los Angeles 75 July 2012
4.5.3 Fuel Correction Factors Fuel correction factors are applied to adjust the emission rates for changes in fuel properties. For this inventory, fuel correction factors were used to take into account the use of ULSD used by all harbor craft. Fuel correction factors used for NOX, HC, and PM take into account the properties of California diesel fuel which is different from EPA diesel fuel. Table 4.5 summarizes the fuel correction factors used for harbor craft. The FCF for SOx reflects the change from diesel fuel with an average sulfur content of 350 ppm to ULSD (15 ppm). Due to the lack of any additional information, it was assumed that fuel correction factor for NOx is also applicable to N2O emissions and fuel correction factor for HC is also applicable to CH4 emissions.
Table 4.5: Fuel Correction Factors for ULSD
Equipment MY PM NOx SOx CO HC CO2 N2O CH4 1995 and older 0.72 0.93 0.04 1.00 0.72 1.00 0.93 0.72 1996 to 2010 0.80 0.948 0.04 1.00 0.72 1.00 0.948 0.72 2011 and newer 0.852 0.948 0.04 1.00 0.72 1.00 0.948 0.72
DB ID446 4.5.4 Load Factors Engine load factor is used in emissions calculations to reflect the fact that, on average, engines are not used at their maximum power rating. Table 4.6 summarizes the average engine load factors that are used in this inventory for the various harbor craft types for their propulsion and auxiliary engines. All of the dimensionless load factors by vessel type and engine type are the same as what was used for the previous inventory, 2010 EI.
Table 4.6: Load Factors
Harbor Auxiliary MainCraft Type Engines EnginesAssist tug 0.43 0.31Commercial fishing 0.43 0.27Crew boat 0.32 0.38Excursion 0.43 0.42Ferry 0.43 0.42Government 0.43 0.51Ocean tug 0.43 0.68Tugboat 0.43 0.31Work boat 0.32 0.38
DB ID426

Inventory of Air Emissions CY 2011
Port of Los Angeles 76 July 2012
The 31% engine load factor for assist tugboats is based on actual vessels’ main engine load readings published in the Port’s 2001 emissions inventory and is not consistent with the 50% engine load used in CARB’s latest methodology.47 CARB uses 43% engine load for most of the auxiliary engines as listed in Table 4.6, except for tugboats, crew boats, and work boats. The Port uses 43% engine load for most auxiliary engines, including assist tugs, except for crew boats and work boats which have been modified to reflect CARB’s recently-revised auxiliary engine load for crew boats and work boats (32% from 43%, respectively)48. 4.5.5 Improvements to Methodology from Previous Year There were no changes in 2011 to the harbor craft methodology. 4.5.6 Future Improvements to Methodology Going forward, the Port will work with CARB to harmonize GHG emission factors for harbor craft. As a part of data collection enhancement, ports will strive to obtain engine emission certification for the recently purchased or repowered engines that may be available at the time of purchase or repower. The Port will also work closely with vessel operators to separate out port-related activity for harbor craft activity.
47 CARB, Emissions Estimation Methodology for Commercial Harbor Craft Operating in California, Appendix B, 2012. 48 CARB, http://www.arb.ca.gove/ports/marinevess/harborcraft/documents/amdendcseidoc050410.xls.
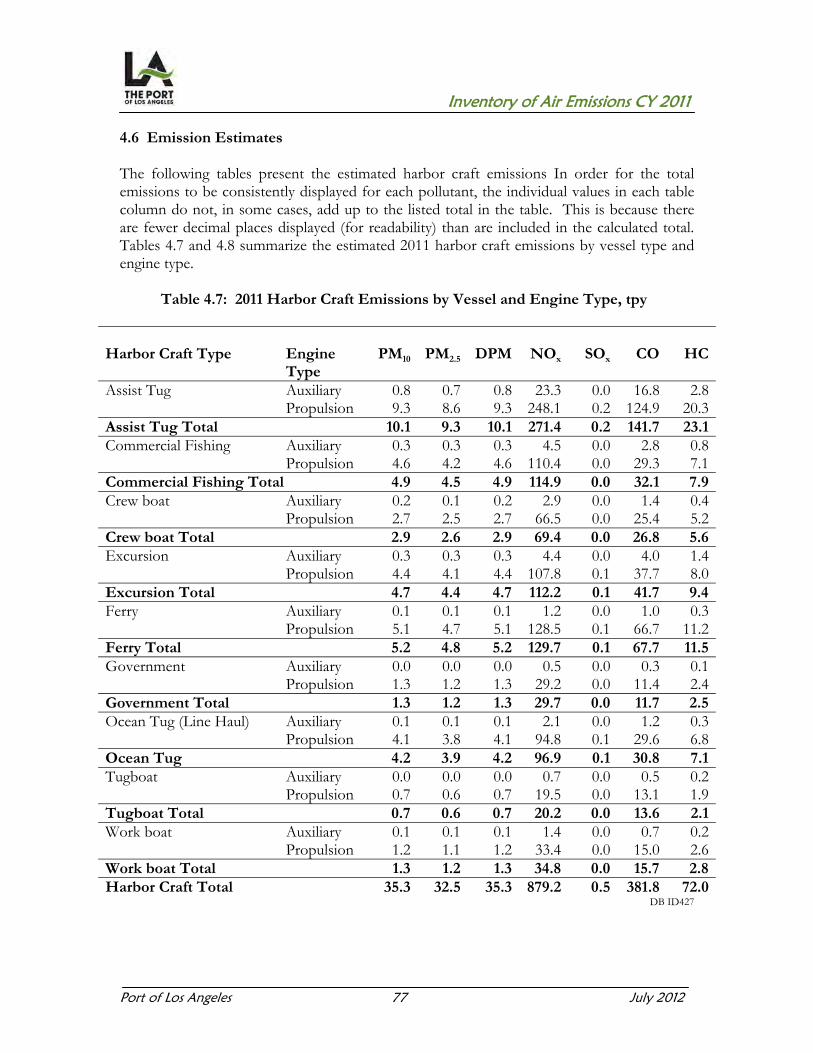
Inventory of Air Emissions CY 2011
Port of Los Angeles 77 July 2012
4.6 Emission Estimates The following tables present the estimated harbor craft emissions In order for the total emissions to be consistently displayed for each pollutant, the individual values in each table column do not, in some cases, add up to the listed total in the table. This is because there are fewer decimal places displayed (for readability) than are included in the calculated total. Tables 4.7 and 4.8 summarize the estimated 2011 harbor craft emissions by vessel type and engine type.
Table 4.7: 2011 Harbor Craft Emissions by Vessel and Engine Type, tpy
Harbor Craft Type Engine PM10 PM2.5 DPM NOx SOx CO HC
Type Assist Tug Auxiliary 0.8 0.7 0.8 23.3 0.0 16.8 2.8
Propulsion 9.3 8.6 9.3 248.1 0.2 124.9 20.3Assist Tug Total 10.1 9.3 10.1 271.4 0.2 141.7 23.1Commercial Fishing Auxiliary 0.3 0.3 0.3 4.5 0.0 2.8 0.8
Propulsion 4.6 4.2 4.6 110.4 0.0 29.3 7.1Commercial Fishing Total 4.9 4.5 4.9 114.9 0.0 32.1 7.9Crew boat Auxiliary 0.2 0.1 0.2 2.9 0.0 1.4 0.4
Propulsion 2.7 2.5 2.7 66.5 0.0 25.4 5.2Crew boat Total 2.9 2.6 2.9 69.4 0.0 26.8 5.6Excursion Auxiliary 0.3 0.3 0.3 4.4 0.0 4.0 1.4
Propulsion 4.4 4.1 4.4 107.8 0.1 37.7 8.0Excursion Total 4.7 4.4 4.7 112.2 0.1 41.7 9.4Ferry Auxiliary 0.1 0.1 0.1 1.2 0.0 1.0 0.3
Propulsion 5.1 4.7 5.1 128.5 0.1 66.7 11.2Ferry Total 5.2 4.8 5.2 129.7 0.1 67.7 11.5Government Auxiliary 0.0 0.0 0.0 0.5 0.0 0.3 0.1
Propulsion 1.3 1.2 1.3 29.2 0.0 11.4 2.4Government Total 1.3 1.2 1.3 29.7 0.0 11.7 2.5Ocean Tug (Line Haul) Auxiliary 0.1 0.1 0.1 2.1 0.0 1.2 0.3
Propulsion 4.1 3.8 4.1 94.8 0.1 29.6 6.8Ocean Tug 4.2 3.9 4.2 96.9 0.1 30.8 7.1Tugboat Auxiliary 0.0 0.0 0.0 0.7 0.0 0.5 0.2
Propulsion 0.7 0.6 0.7 19.5 0.0 13.1 1.9Tugboat Total 0.7 0.6 0.7 20.2 0.0 13.6 2.1Work boat Auxiliary 0.1 0.1 0.1 1.4 0.0 0.7 0.2
Propulsion 1.2 1.1 1.2 33.4 0.0 15.0 2.6Work boat Total 1.3 1.2 1.3 34.8 0.0 15.7 2.8Harbor Craft Total 35.3 32.5 35.3 879.2 0.5 381.8 72.0
DB ID427
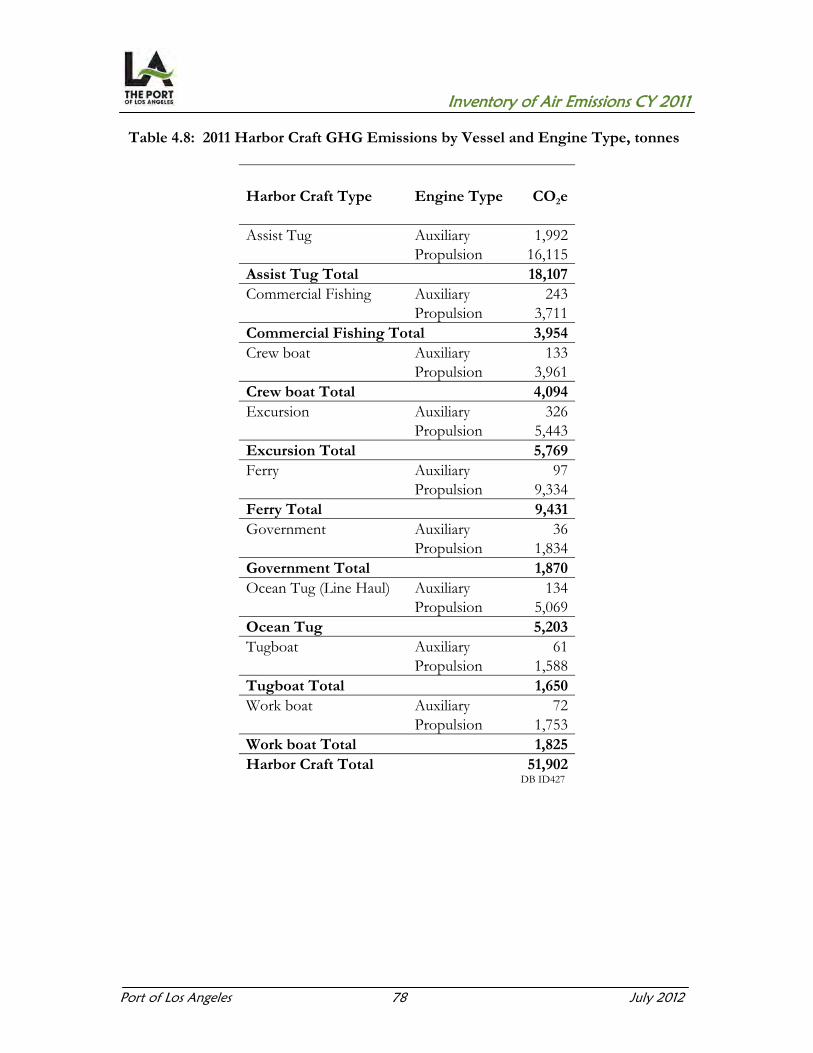
Inventory of Air Emissions CY 2011
Port of Los Angeles 78 July 2012
Table 4.8: 2011 Harbor Craft GHG Emissions by Vessel and Engine Type, tonnes
Harbor Craft Type Engine Type CO2e
Assist Tug Auxiliary 1,992Propulsion 16,115
Assist Tug Total 18,107Commercial Fishing Auxiliary 243
Propulsion 3,711Commercial Fishing Total 3,954Crew boat Auxiliary 133
Propulsion 3,961Crew boat Total 4,094Excursion Auxiliary 326
Propulsion 5,443Excursion Total 5,769Ferry Auxiliary 97
Propulsion 9,334Ferry Total 9,431Government Auxiliary 36
Propulsion 1,834Government Total 1,870Ocean Tug (Line Haul) Auxiliary 134
Propulsion 5,069Ocean Tug 5,203Tugboat Auxiliary 61
Propulsion 1,588Tugboat Total 1,650Work boat Auxiliary 72
Propulsion 1,753Work boat Total 1,825Harbor Craft Total 51,902
DB ID427

Inventory of Air Emissions CY 2011
Port of Los Angeles 79 July 2012
Figure 4.4 shows that approximately 29-37% of the Port’s harbor craft emissions are attributed to assist tugs, 8-14% to commercial fishing, 15-18% to ferries, 11-13% to excursion vessels, 8-12% to ocean tugs, 7-8% to crew boats, 4% to work boats, 2-4% to tugboats, and 3-4% to government vessels.
Figure 4.4: 2011 Harbor Craft Emissions Distribution

Inventory of Air Emissions CY 2011
Port of Los Angeles 80 July 2012
SECTION 5 CARGO HANDLING EQUIPMENT This section presents emissions estimates for the cargo handling equipment (CHE) source category, including source description (5.1), geographical delineation (5.2), data and information acquisition (5.3), operational profiles (5.4), emissions estimation methodology (5.5), and the emission estimates (5.6). 5.1 Source Description The CHE category includes equipment that moves cargo (including containers, general cargo, and bulk cargo) to and from marine vessels, railcars, and on-road trucks. The equipment is typically operated at marine terminals or at rail yards and not on public roadways. This inventory includes cargo handling equipment fueled by diesel, gasoline, propane, liquefied natural gas (LNG), and electricity. Due to the diversity of cargo handled by the Port’s terminals, there is a wide range of equipment types. The majority of cargo handling equipment can be classified into one of the following equipment types: Forklift Rubber tired gantry (RTG) crane Side pick Sweeper Top handler Yard tractor Other
The “Other” category contains the following equipment types: Bulldozer Crane Loader Man lift Material handler Miscellaneous Pallet jack Rail pusher Skid steer loader Trucks (fuel, utility, water, vacuum) Wharf crane

Inventory of Air Emissions CY 2011
Port of Los Angeles 81 July 2012
Figure 5.1 presents the population distribution of the 2,042 pieces of equipment inventoried at the Port for calendar year 2011. The forklift category includes all engine types, including electric forklifts. The 9% for other equipment includes pieces of equipment that are not typical CHE as well as electric equipment.
Figure 5.1: 2011 CHE Count Distribution by Equipment Type
5.2 Geographical Delineation Figure 5.2 presents the geographical delineation for container, dry bulk, break bulk, liquid bulk, auto, and cruise terminals that may operate cargo handling equipment as well as equipment from UP ICTF and smaller facilities located within Port boundaries and covered under the port’s jurisdiction. In 2011, California United Terminals moved from the Port of Long Beach to Pier 400 and this increased the equipment count in 2011 from the previous year. Following is the list of the terminals identified in figure 5.2, by major cargo type, included in the inventory:
Container Terminals: Berth 100: West Basin Container Terminal (China Shipping) Berths 121-131: West Basin Container Terminal (Yang Ming) Berths 136-139: Trans Pacific Container Terminal (Trapac) Berths 212-225: Yusen Container Terminal (YTI) Berths 226-236: Seaside Terminal (Evergreen) Berths 302-305: Global Gateway South (APL) Berths 401-404: Pier 400 (A. P. Moeller-Maersk [APM] Terminals) Berths 405-405: California United Terminals
Yard tractor49%
Forklift27%
Other9%
Top handler7%
RTG crane5%
Side pick2%
Sweeper1%

Inventory of Air Emissions CY 2011
Port of Los Angeles 82 July 2012
Break-Bulk Terminals: Berths 54-55: Stevedore Services of America (SSA) Berths 153-155: Crescent Warehouse Company Berths 174-181: Pasha Stevedoring Terminals Berths 210-211: SA Recycling
Dry Bulk Terminals: California Sulfur LA Grain Berths 165-166: Rio Tinto/Borax
Liquid Terminals: Berths 118-119: Kinder Morgan Berths 148-151: ConocoPhillips Berths 163: NuStar Energy Berth 164: Valero Berths 167-169: Shell Oil Berths 187-191: Vopak Berths 238-240: ExxonMobil
Auto Terminal: Berths 195-199: WWL Vehicle Services Americas
Cruise Terminal: Berths 91-93: Pacific Cruise Ship Terminals (PCST)
Other Facilities: Al Larson California Cartage California Multimodal San Pedro Forklifts Southern California (SoCal) Ship Services Three Rivers Trucking Union Pacific Intermodal Containers Transfer Facility (ICTF)

Inventory of Air Emissions CY 2011
Port of Los Angeles 83 July 2012
Figure 5.2: Geographical Boundaries for Cargo Handling Equipment

Inventory of Air Emissions CY 2011
Port of Los Angeles 84 July 2012
5.3 Data and Information Acquisition For each terminal or facility, the maintenance and/or cargo handling equipment operating staff were contacted either in person, by e-mail or by telephone to obtain count and activity information on the equipment specific to their terminal’s or facility’s operation for calendar year 2011. The information requested is listed below: Equipment type Equipment identification number Equipment make and model Engine make and model Rated horsepower (or kilowatts) Equipment and engine model year Type of fuel used (ULSD, gasoline, propane, or other) Alternative fuel used Annual hours of operation (some terminal operators use hour meters) Emission control technologies installed (e.g., Diesel Oxidation Catalyst, Diesel
Particulate Filter) and date installed On-road engine installed New equipment purchased Equipment retired or removed from service
It should be noted that not all information requested is readily available. When there are data gaps, for the data needed to estimate emissions, such as engine power, activity hours, and model year, averages are used as defaults. Section 5.4 lists the averages by equipment type used for missing data. The terminal operators have started to install various emission control technologies and purchase on-road engines equipped yard tractors in order to comply with CARB’s CHE regulation. This is further discussed in section 5.4.
5.4 Operational Profiles Table 5.1 summarizes the cargo handling equipment data collected from the terminals and facilities for the calendar year 2011. The table includes the count of all equipment as well as the range and the average of horsepower, model year, and annual operating hours by equipment type for equipment with known operating parameters. The averages by CHE engine and fuel type were used as defaults for the missing information. For the propane sweeper with no hp data, the default hp for the diesel sweeper was used in the emissions calculation. The table does not include the count or characteristics of small auxiliary engines (20 kW) for 30 RTGs because the count column is equipment count, not engine count. The main engines for these RTGs are reflected in the table; however, emissions for both main and auxiliary engines are included in the inventory. For the electric-powered equipment shown in the table, “na” denotes “not applicable” for engine size, model year and operating hours.

Inventory of Air Emissions CY 2011
Port of Los Angeles 85 July 2012
Table 5.1: 2011 CHE Engine Characteristics for All Terminals
DB ID228
Equipment Engine Count Power (hp) Model Year Annual Activity HoursType Min Max Average Min Max Average Min Max Average
Bulldozer Diesel 2 165 200 183 1993 2007 2000 324 432 378Crane Diesel 9 130 950 287 1969 2010 1992 46 1,725 772Pallet jack Electric 7 na na na na na na na na naWharf crane Electric 74 na na na na na na 0 3,291 428Forklift Diesel 137 45 350 159 1979 2010 2000 0 3,114 483Forklift Electric 9 na na na na na na na na naForklift Gasoline 7 45 150 90 1991 1996 1994 0 292 189Forklift Propane 389 32 200 74 1975 2011 1998 0 5,581 696Loader Diesel 12 55 430 281 1989 2010 2002 0 4,757 1,354Loader Electric 3 na na na na na na na na naMan lift Diesel 14 48 87 72 1989 2010 2003 0 631 239Man lift Electric 3 na na na na na na na na naMaterial handler Diesel 10 371 475 410 1999 2009 2006 578 3,361 1,992Miscellaneous Diesel 7 37 268 70 2007 2008 2008 736 5,939 3,425Rail pusher Diesel 2 130 200 165 2000 2004 2002 412 879 646RMG cranes Electric 10 na na na na na na 0 1,776 1,152RTG crane Diesel 105 250 685 543 1995 2009 2004 0 4,156 1,257Side pick Diesel 41 115 330 201 1992 2010 2003 28 2,922 1,037Skid steer loader Diesel 9 45 94 64 1994 2007 2003 0 1,077 348Sweeper Diesel 10 37 260 125 1995 2008 2003 0 848 468Sweeper Gasoline 2 205 205 205 2002 2005 2004 703 726 715Sweeper Propane 1 na na na 2001 2001 2001 775 775 775Top handler Diesel 149 250 375 296 1990 2011 2004 0 3,945 2,028Truck Diesel 20 210 540 363 1975 2009 2003 0 3,331 1,059Yard tractor Diesel 813 170 270 218 1995 2011 2006 0 4,528 1,890Yard tractor LNG 17 230 230 230 2009 2010 2010 284 2,470 987Yard tractor Propane 180 174 231 199 2000 2011 2007 0 4,317 1,418Total count 2,042

Inventory of Air Emissions CY 2011
Port of Los Angeles 86 July 2012
Table 5.2 presents the percentage of cargo handling equipment at container terminals (71%) as compared to the total Port equipment.
Table 5.2: 2011 Container Terminal CHE Compared to Total CHE Container Percent
Equipment Total Terminal of TotalCount Count
Forklift 542 128 24%RTG crane 105 97 92%Side pick 41 37 90%Top handler 149 146 98%Yard tractor 1,010 933 92%Sweeper 13 8 62%Other 182 107 59%Total 2,042 1,456 71%
DB ID233
The characteristics of the CHE engines at the Port’s container terminals are summarized in Table 5.3. The auxiliary engines (20 kW) for 30 RTGs are not shown in the table but the main engines for these RTGs are included; however, emissions for both main and auxiliary engines are included in the inventory.

Inventory of Air Emissions CY 2011
Port of Los Angeles 87 July 2012
Table 5.3: 2011 CHE Engines Characteristics for Container Terminals
DB ID229
Equipment Engine Count Power (hp) Model Year Annual Activity Hours
Type Min Max Average Min Max Average Min Max AveragePallet jack Electric 7 na na na na na na na na naWharf crane Electric 74 na na na na na na 0 3,291 428Forklift Diesel 49 45 330 161 1979 2010 2002 0 3,114 601Forklift Electric 1 na na na na na na na na naForklift Propane 78 46 165 105 1985 2011 2002 0 1052 262Man Lift Diesel 5 80 87 86 2000 2006 2004 36 348 157Rail pusher Diesel 1 200 200 200 2000 2000 2000 412 412 412RMG cranes Electric 10 na na na na na na 0 1,776 1,152RTG crane Diesel 97 250 685 543 1999 2007 2004 0 2,786 1,260Side pick Diesel 37 115 330 207 1995 2010 2003 28 2,922 1,091Sweeper Diesel 6 100 240 128 1995 2008 2003 2 726 425Sweeper Gasoline 2 205 205 205 2002 2005 2004 703 726 715Top handler Diesel 146 250 375 295 1990 2011 2004 0 3,945 2,058Truck Diesel 10 235 250 243 1975 2008 2001 108 1,218 770Yard tractor Diesel 753 170 270 221 2003 2011 2006 0 4,346 1,879Yard tractor Propane 180 174 231 199 2000 2011 2007 0 4,317 1,418Total count 1,456

Inventory of Air Emissions CY 2011
Port of Los Angeles 88 July 2012
Table 5.4 presents the characteristics of the CHE engines at the Port’s four break-bulk terminals.
Table 5.4: 2011 CHE Engines Characteristics for Break-Bulk Terminals
DB ID231
Table 5.5 presents the characteristics of the CHE engines at the Port’s three dry bulk terminals.
Table 5.5: 2011 CHE Engines Characteristics for Dry Bulk Terminals
DB ID230
Equipment Engine Count Power (hp) Model Year Annual Activity Hours
Type Min Max Average Min Max Average Min Max AverageBulldozer Diesel 2 165 200 183 1993 2007 2000 324 432 378Crane Diesel 3 205 950 467 1969 2010 1991 46 1,725 810Forklift Diesel 67 59 350 169 1979 2009 2001 0 2,487 322Forklift Electric 1 na na na na na na na na naForklift Gasoline 3 150 150 150 1991 1991 1991 0 292 97Forklift Propane 5 40 122 82 1987 2008 1998 41 521 236Loader Diesel 8 55 430 318 1999 2010 2004 330 4,757 1,911Loader Electric 3 na na na na na na na na naMan lift Diesel 5 49 80 66 1999 2010 2006 56 605 336Man lift Electric 3 na na na na na na na na naMaterial handler Diesel 10 371 475 410 1999 2009 2006 578 3,361 1,992Miscellaneous Diesel 1 268 268 268 2007 2007 2007 736 736 736Rail pusher Diesel 1 130 130 130 2004 2004 2004 879 879 879Side pick Diesel 2 152 152 152 2000 2000 2000 207 211 209Skid steer loader Diesel 5 45 70 60 2003 2007 2006 0 1,077 606Sweeper Diesel 3 96 260 151 2000 2008 2003 524 848 695Top handler Diesel 2 250 375 313 1990 2004 1997 1 210 106Truck Diesel 9 210 540 482 1995 2009 2005 344 3,331 1,498Yard tractor Diesel 14 177 200 191 2000 2009 2005 0 786 368Total count 147
Equipment Engine Count Power (hp) Model Year Annual Activity Hours
Type Min Max Average Min Max Average Min Max AverageForklift Propane 1 na na na na na na 43 43 43Loader Diesel 1 110 110 110 2009 2009 2009 964 964 964Yard tractor Diesel 4 250 250 250 1995 1995 1995 652 1,741 1,126Total count 6
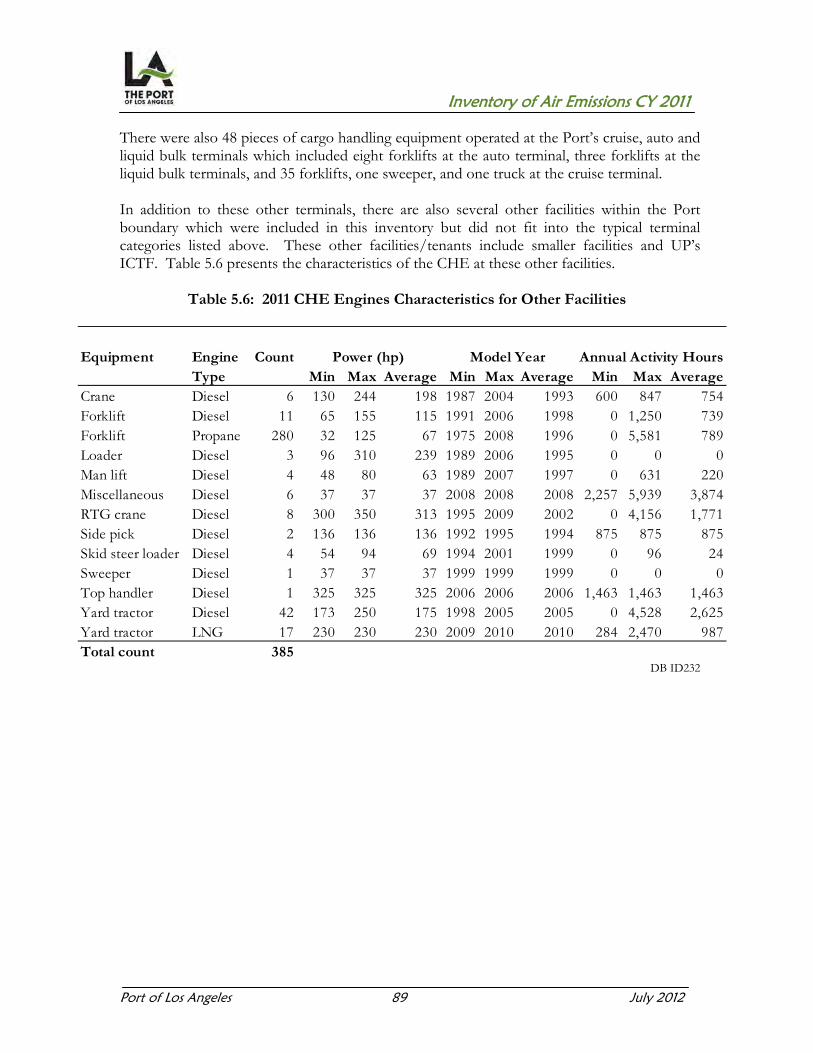
Inventory of Air Emissions CY 2011
Port of Los Angeles 89 July 2012
There were also 48 pieces of cargo handling equipment operated at the Port’s cruise, auto and liquid bulk terminals which included eight forklifts at the auto terminal, three forklifts at the liquid bulk terminals, and 35 forklifts, one sweeper, and one truck at the cruise terminal. In addition to these other terminals, there are also several other facilities within the Port boundary which were included in this inventory but did not fit into the typical terminal categories listed above. These other facilities/tenants include smaller facilities and UP’s ICTF. Table 5.6 presents the characteristics of the CHE at these other facilities.
Table 5.6: 2011 CHE Engines Characteristics for Other Facilities
DB ID232
Equipment Engine Count Power (hp) Model Year Annual Activity Hours
Type Min Max Average Min Max Average Min Max AverageCrane Diesel 6 130 244 198 1987 2004 1993 600 847 754Forklift Diesel 11 65 155 115 1991 2006 1998 0 1,250 739Forklift Propane 280 32 125 67 1975 2008 1996 0 5,581 789Loader Diesel 3 96 310 239 1989 2006 1995 0 0 0Man lift Diesel 4 48 80 63 1989 2007 1997 0 631 220Miscellaneous Diesel 6 37 37 37 2008 2008 2008 2,257 5,939 3,874RTG crane Diesel 8 300 350 313 1995 2009 2002 0 4,156 1,771Side pick Diesel 2 136 136 136 1992 1995 1994 875 875 875Skid steer loader Diesel 4 54 94 69 1994 2001 1999 0 96 24Sweeper Diesel 1 37 37 37 1999 1999 1999 0 0 0Top handler Diesel 1 325 325 325 2006 2006 2006 1,463 1,463 1,463Yard tractor Diesel 42 173 250 175 1998 2005 2005 0 4,528 2,625Yard tractor LNG 17 230 230 230 2009 2010 2010 284 2,470 987Total count 385
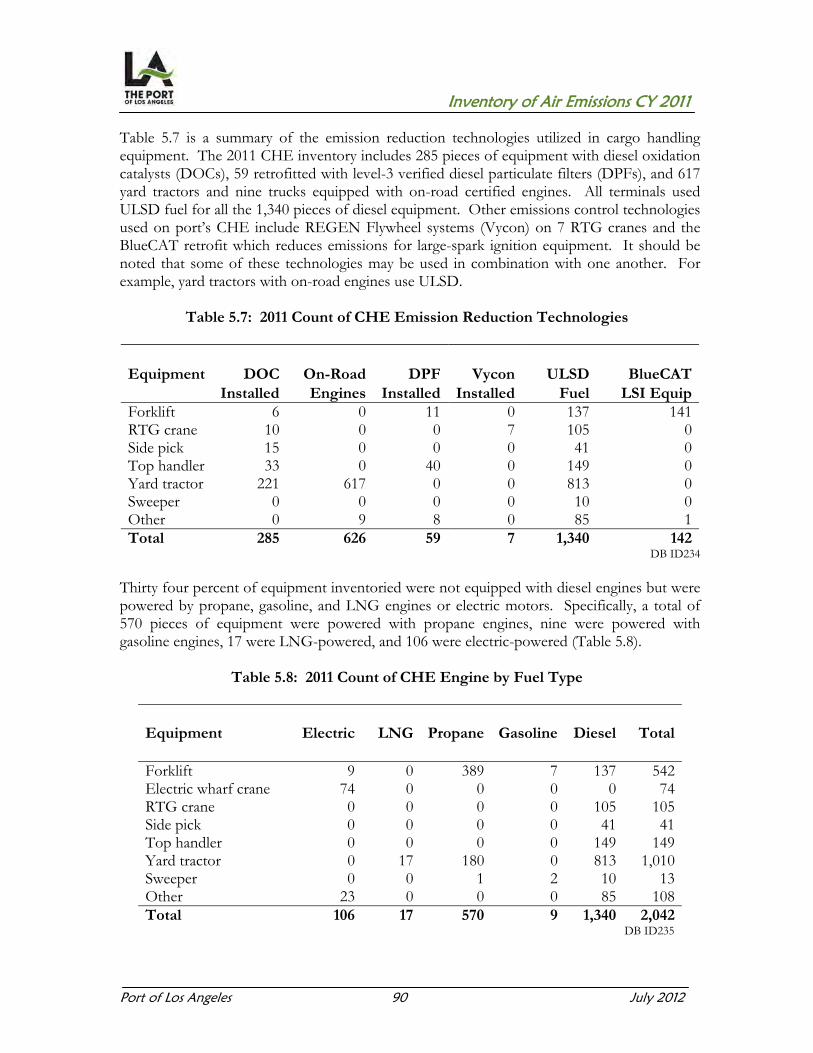
Inventory of Air Emissions CY 2011
Port of Los Angeles 90 July 2012
Table 5.7 is a summary of the emission reduction technologies utilized in cargo handling equipment. The 2011 CHE inventory includes 285 pieces of equipment with diesel oxidation catalysts (DOCs), 59 retrofitted with level-3 verified diesel particulate filters (DPFs), and 617 yard tractors and nine trucks equipped with on-road certified engines. All terminals used ULSD fuel for all the 1,340 pieces of diesel equipment. Other emissions control technologies used on port’s CHE include REGEN Flywheel systems (Vycon) on 7 RTG cranes and the BlueCAT retrofit which reduces emissions for large-spark ignition equipment. It should be noted that some of these technologies may be used in combination with one another. For example, yard tractors with on-road engines use ULSD.
Table 5.7: 2011 Count of CHE Emission Reduction Technologies
Equipment DOC On-Road DPF Vycon ULSD BlueCATInstalled Engines Installed Installed Fuel LSI Equip
Forklift 6 0 11 0 137 141RTG crane 10 0 0 7 105 0Side pick 15 0 0 0 41 0Top handler 33 0 40 0 149 0Yard tractor 221 617 0 0 813 0Sweeper 0 0 0 0 10 0Other 0 9 8 0 85 1Total 285 626 59 7 1,340 142
DB ID234
Thirty four percent of equipment inventoried were not equipped with diesel engines but were powered by propane, gasoline, and LNG engines or electric motors. Specifically, a total of 570 pieces of equipment were powered with propane engines, nine were powered with gasoline engines, 17 were LNG-powered, and 106 were electric-powered (Table 5.8).
Table 5.8: 2011 Count of CHE Engine by Fuel Type
Equipment Electric LNG Propane Gasoline Diesel Total
Forklift 9 0 389 7 137 542Electric wharf crane 74 0 0 0 0 74RTG crane 0 0 0 0 105 105Side pick 0 0 0 0 41 41Top handler 0 0 0 0 149 149Yard tractor 0 17 180 0 813 1,010Sweeper 0 0 1 2 10 13Other 23 0 0 0 85 108Total 106 17 570 9 1,340 2,042 DB ID235
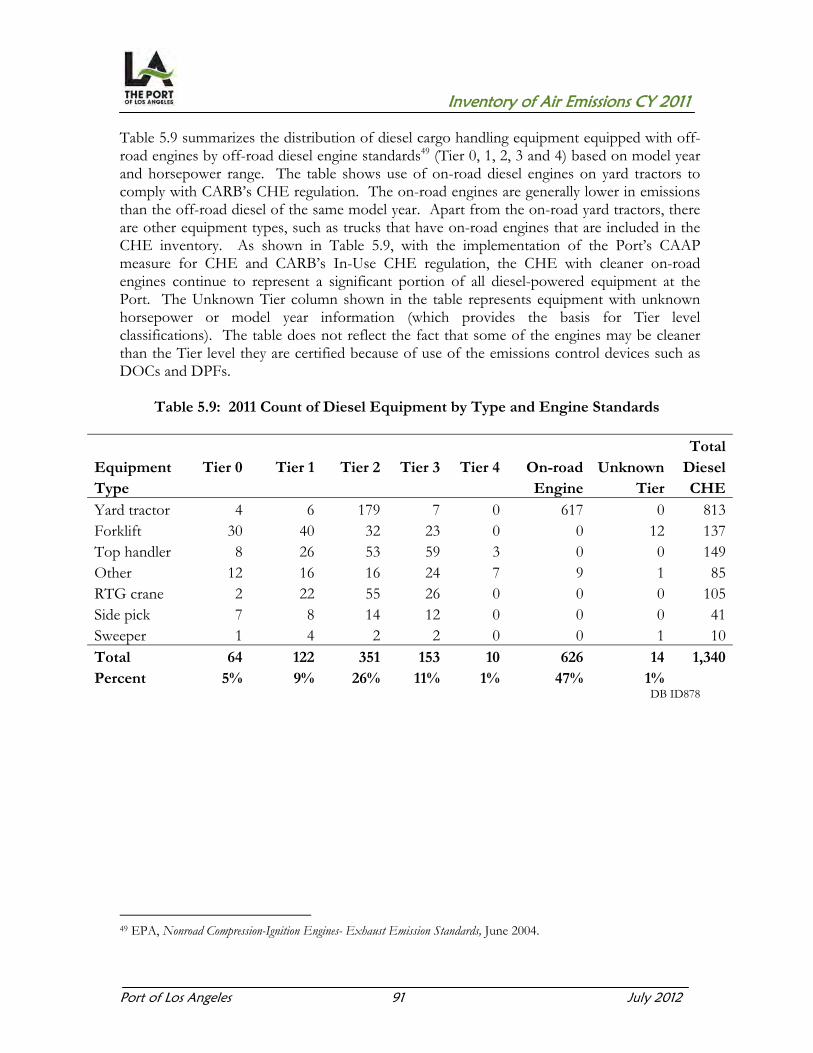
Inventory of Air Emissions CY 2011
Port of Los Angeles 91 July 2012
Table 5.9 summarizes the distribution of diesel cargo handling equipment equipped with off-road engines by off-road diesel engine standards49 (Tier 0, 1, 2, 3 and 4) based on model year and horsepower range. The table shows use of on-road diesel engines on yard tractors to comply with CARB’s CHE regulation. The on-road engines are generally lower in emissions than the off-road diesel of the same model year. Apart from the on-road yard tractors, there are other equipment types, such as trucks that have on-road engines that are included in the CHE inventory. As shown in Table 5.9, with the implementation of the Port’s CAAP measure for CHE and CARB’s In-Use CHE regulation, the CHE with cleaner on-road engines continue to represent a significant portion of all diesel-powered equipment at the Port. The Unknown Tier column shown in the table represents equipment with unknown horsepower or model year information (which provides the basis for Tier level classifications). The table does not reflect the fact that some of the engines may be cleaner than the Tier level they are certified because of use of the emissions control devices such as DOCs and DPFs.
Table 5.9: 2011 Count of Diesel Equipment by Type and Engine Standards
TotalEquipment Tier 0 Tier 1 Tier 2 Tier 3 Tier 4 On-road Unknown DieselType Engine Tier CHEYard tractor 4 6 179 7 0 617 0 813Forklift 30 40 32 23 0 0 12 137Top handler 8 26 53 59 3 0 0 149Other 12 16 16 24 7 9 1 85RTG crane 2 22 55 26 0 0 0 105Side pick 7 8 14 12 0 0 0 41Sweeper 1 4 2 2 0 0 1 10Total 64 122 351 153 10 626 14 1,340 Percent 5% 9% 26% 11% 1% 47% 1%
DB ID878
49 EPA, Nonroad Compression-Ignition Engines- Exhaust Emission Standards, June 2004.

Inventory of Air Emissions CY 2011
Port of Los Angeles 92 July 2012
Figure 5.3 presents the distribution of diesel equipment by off-road and on-road engine standards. Due to rounding, the distribution does not add up to 100%.
Figure 5.3: 2011 Distribution of Diesel Equipment by Engine Standards
5.5 Emissions Estimation Methodology The emissions calculation methodology used to estimate the cargo handling equipment emissions is consistent with CARB’s latest methodology. The basic equation used to estimate emissions for each piece of equipment is as follows.
Equation 5.1 = × × × × ×
Where:
E = emissions, grams/year Power = rated power of the engine, hp or kW Activity = equipment’s engine activity, hr/year LF = load factor (ratio of average load used during normal operations as compared to full load at maximum rated horsepower), dimensionless EF = emission factor, grams of pollutant per unit of work, g/hp-hr or g/kW-hr FCF = fuel correction factor to reflect changes in fuel properties that have occurred over time, dimensionless CF = control factor to reflect changes in emissions due to installation of emission reduction technologies not originally reflected in the emission factors, dimensionless
Tier 05% Tier 1
9%
Tier 226%
Tier 311%
Tier 41%
On-road47%
unknown1%

Inventory of Air Emissions CY 2011
Port of Los Angeles 93 July 2012
The emission factor is a function of the zero hour emission rate by fuel type (diesel, propane or liquefied natural gas), by CHE engine type (off-road or on-road), for the CHE engine model year (in the absence of any malfunction or tampering of engine components that can change emissions), deterioration rate, and cumulative hours. The deterioration rate reflects the fact that the engine’s base emissions (zero hour emission rates) change as the equipment is used, due to wear of various engine parts or reduced efficiency of emission control devices. The cumulative hours reflect the equipment’s total operating hours. The emission factor is calculated as:
Equation 5.2 = + ( × )
Where:
ZH = zero-hour emission rate by fuel type by CHE engine type for a given horsepower category and model year, g/hp-hr or g/kW-hr DR = deterioration rate (rate of change of emissions as a function of CHE engine age), g/hp-hr2 or g/kW-hr2 Cumulative hours = number of hours the CHE engine has been in use and calculated as annual operating hours times age of the CHE engine, hours
5.5.1 Emission Factors The zero hour emission rates and deterioration rates (DR) for cargo handling equipment are updated to be consistent with CARB’s latest emissions calculations methodology and emission rates used to estimate CHE emissions50. CARB’s latest ZH and DR are consistent with OFFROAD 2007. In this update, the following revisions are incorporated: Instead of estimating deterioration rates based on useful life of the equipment, the
deterioration rates provided by CARB are based on average useful life of on-road engines based on engine size (in horsepower).
Since the deterioration rates reflect the increase in emissions due to malfunction of emissions control systems which are most likely corrected at the time of engine rebuild, in CARB’s latest revisions, the emission increases due to the deterioration rate are capped at cumulative hours of 12,000 hours for diesel engines. In other words, once the engine accrues 12,000 hours, there is no increase in emissions.
The ZH and DR are a function of fuel type, model year, and horsepower group as defined in the OFFROAD model. The horsepower groups by which the ZH and DR are categorized are aligned with EPA’s regulations.
50 CARB, Amendments to the Regulation for Mobile Cargo Handling Equipment at Ports and Intermodal Rail Yards, Appendix B, August 2011.
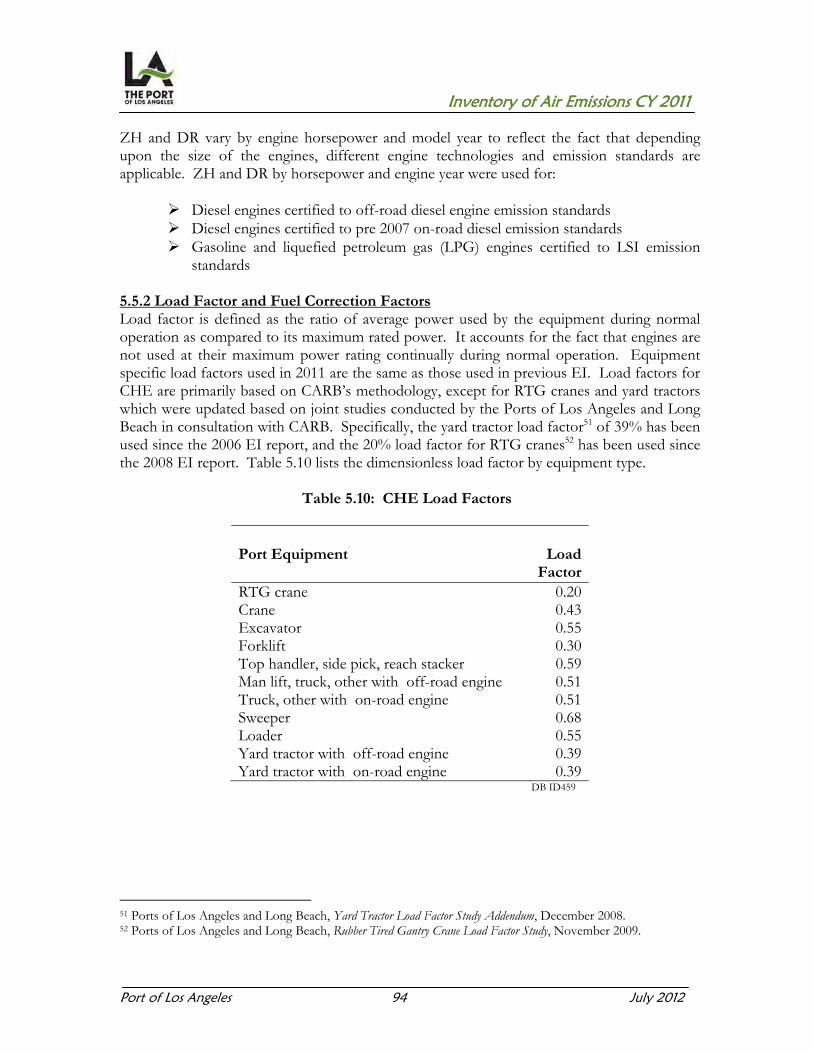
Inventory of Air Emissions CY 2011
Port of Los Angeles 94 July 2012
ZH and DR vary by engine horsepower and model year to reflect the fact that depending upon the size of the engines, different engine technologies and emission standards are applicable. ZH and DR by horsepower and engine year were used for:
Diesel engines certified to off-road diesel engine emission standards Diesel engines certified to pre 2007 on-road diesel emission standards Gasoline and liquefied petroleum gas (LPG) engines certified to LSI emission
standards 5.5.2 Load Factor and Fuel Correction Factors Load factor is defined as the ratio of average power used by the equipment during normal operation as compared to its maximum rated power. It accounts for the fact that engines are not used at their maximum power rating continually during normal operation. Equipment specific load factors used in 2011 are the same as those used in previous EI. Load factors for CHE are primarily based on CARB’s methodology, except for RTG cranes and yard tractors which were updated based on joint studies conducted by the Ports of Los Angeles and Long Beach in consultation with CARB. Specifically, the yard tractor load factor51 of 39% has been used since the 2006 EI report, and the 20% load factor for RTG cranes52 has been used since the 2008 EI report. Table 5.10 lists the dimensionless load factor by equipment type.
Table 5.10: CHE Load Factors
Port Equipment Load Factor RTG crane 0.20 Crane 0.43 Excavator 0.55 Forklift 0.30 Top handler, side pick, reach stacker 0.59 Man lift, truck, other with off-road engine 0.51 Truck, other with on-road engine 0.51 Sweeper 0.68 Loader 0.55 Yard tractor with off-road engine 0.39 Yard tractor with on-road engine 0.39
DB ID459
51 Ports of Los Angeles and Long Beach, Yard Tractor Load Factor Study Addendum, December 2008. 52 Ports of Los Angeles and Long Beach, Rubber Tired Gantry Crane Load Factor Study, November 2009.

Inventory of Air Emissions CY 2011
Port of Los Angeles 95 July 2012
Table 5.11 lists the dimensionless fuel correction factors for ULSD fuel.53 The base emission factors are based on the diesel fuel in use at the time the factors were developed and are adjusted by the following fuel correction factors to reflect the characteristics of ULSD. The FCF for SOx reflects the change from diesel fuel with a sulfur content of 140 ppm to ULSD (15 ppm).
Table 5.11: Fuel Correction Factors for ULSD
Equipment MY PM NOx SOx CO HC CO2 N2O CH4
1995 and older 0.720 0.930 0.110 1.000 0.720 1.000 0.930 0.7201996 to 2010 0.800 0.948 0.110 1.000 0.720 1.000 0.948 0.7202011 and newer 0.852 0.948 0.110 1.000 0.720 1.000 0.948 0.720
DB ID444
Table 5.12 shows the dimensionless fuel correction factors for gasoline engines. LNG and propane engines have no FCF.
Table 5.12: Fuel Correction Factors for Gasoline
Equipment MY PM NOx SOx CO HC CO2 N2O CH4
1997 and older 1.000 0.867 1.000 0.795 0.850 1.000 0.867 0.8501998 and newer 1.000 1.000 1.000 1.000 1.000 1.000 1.000 1.000
53 CARB, http://www.arb.ca.gov/msei/offroad/techmemo/arb_offroad_fuels.pdf.

Inventory of Air Emissions CY 2011
Port of Los Angeles 96 July 2012
5.5.3 Control Factors Control factors were used to reflect the change in emissions due to the use of various emissions reduction technologies. Table 5.13 shows the emission reduction percentages provided by CARB for the various technologies used on port equipment. The control factor is applied to the baseline emissions to estimate the remaining emissions and is one minus the emission reduction in decimal; for example, a 70% reduction has a control factor of 0.3; while a -10% increase in emissions has a control factor of 1.10.
Table 5.13: CHE Emission Reduction Percentages
Technology PM10 PM2.5 DPM NOx SOx CO HC CO2 N2O CH4
Nett BlueCat- LSI 0% 0% 0% 85% na 0% 85% na 0% 0%DOC 30% 30% 30% 0% na 70% 70% na 0% 70%DPF 85% 85% 85% 0% na 0% 0% na 0% 0%Vycon's REGEN 25% 25% 25% 30% 15% 0% 0% 15% 30% 0%
DB ID474
The emissions reductions associated with the various emissions strategies have been either verified or developed in consultation with CARB.
DOC: Provided by CARB in a memorandum to the Port DPF: CARB verified technology54 Vycon: CARB verified technology55 Nett BlueCAT 300TM: CARB verified technology for off-road LSI equipment56
5.5.4 Improvements to Methodology from Previous Year The methodology to calculate emission deterioration rates was changed in this 2011 EI to be consistent with CARB’s latest methodology and is discussed in section 5.5.1. The zero hour (ZH) emission rates and deterioration rates (DR) for cargo handling equipment were updated to be consistent with CARB’s latest emissions calculations methodology and emission rates used to estimate CHE emissions. These revisions resulted in an increase in emissions for all pollutants that utilized DRs to calculate emissions. In addition, the cumulative hours for diesel equipment were capped at 12,000 hours. For comparison of 2011 emissions to previous years’ emissions, refer to Section 9.
54 CARB, http://www.arb.ca.gov/diesel/verdev/vt/cvt.htm. 55 CARB, http://www.arb.ca.gov/diesel/verdev/vt/cvt.htm. 56 CARB, http://www.ar.ca.gov/msprog/offroad/orspark/verdev.htm.

Inventory of Air Emissions CY 2011
Port of Los Angeles 97 July 2012
5.5.5 Future Improvements to Methodology Due to the economic conditions and other factors, the usage (hours per year) of the CHE can vary from year to year. Since the emissions deterioration is a function of cumulative hours and it is calculated by multiplying the hours per year of the calendar year by the age of the engine for that year, a significant high or low usage can artificially increase or decrease the emissions deterioration compared to past years. In order to be consistent from year to year, a methodology to track past calendar year usage should be developed and used for emissions deterioration calculations. The other option is to request tenants, during data collection process, to provide the cumulative hours for each piece of equipment, but this may prove difficult due to data unavailability and additional burden on the tenants’ time. 5.6 Emission Estimates The following tables present the estimated CHE emissions by terminal type, equipment type and engine type. In order for the total emissions to be consistently displayed for each pollutant, the individual values in each table column do not, in some cases, add up to the listed total in the tables. This is because there are fewer decimal places displayed (for readability) than are included in the calculated total. Tables 5.14 and 5.15 provide a summary of cargo handling equipment emissions by terminal type.
Table 5.14: 2011 CHE Emissions by Terminal Type, tpy
Terminal Type PM10 PM2.5 DPM NOx SOx CO HC
Auto 0.0 0.0 0.0 0.2 0.0 1.4 0.1 Break-Bulk 2.5 2.3 2.5 64.2 0.1 20.8 4.2 Container 19.1 17.6 17.7 665.6 1.4 463.4 50.7 Cruise 0.1 0.1 0.0 5.9 0.0 12.3 0.8 Dry Bulk 0.3 0.2 0.3 4.8 0.0 1.9 0.4 Liquid 0.0 0.0 0.0 0.5 0.0 1.1 0.1 Other 3.0 2.8 2.8 89.4 0.1 163.5 12.9 Total 25.0 23.0 23.3 830.6 1.6 664.4 69.2
DB ID237

Inventory of Air Emissions CY 2011
Port of Los Angeles 98 July 2012
Table 5.15: 2011 CHE GHG Emissions by Terminal Type, tonnes
Terminal Type CO2e
Auto 15Break-Bulk 8,146Container 127,971Cruise 388Dry Bulk 286Liquid 73Other 8,530Total 145,409
DB ID237 Figure 5.4 presents the percentage of CHE emissions by terminal type. Container terminals account for roughly 77% of the Port’s cargo handling equipment PM emissions, 80% of the NOx emissions, 89% of the SOx emissions, 70% of the CO, 73% of the HC emissions, and 88% of the GHG emissions are attributed to the container terminals. Break-bulk terminals and other terminals and facilities account for the remainder of the emissions.
Figure 5.4: 2011 CHE Emissions by Terminal Type

Inventory of Air Emissions CY 2011
Port of Los Angeles 99 July 2012
Tables 5.16 and 5.17 present the emissions by cargo handling equipment type and engine type.
Table 5.16: 2011 CHE Emissions by Equipment and Engine Type, tpy
Equipment Engine PM10 PM2.5 DPM NOx SOx CO HC
Bulldozer Diesel 0.0 0.0 0.0 0.4 0.0 0.2 0.0Crane Diesel 0.4 0.4 0.4 8.7 0.0 3.1 0.5Forklift Diesel 0.8 0.7 0.8 18.3 0.0 8.5 1.2Forklift Gasoline 0.0 0.0 0.0 0.3 0.0 1.7 0.1Forklift Propane 0.4 0.4 0.0 33.4 0.0 152.6 6.3Loader Diesel 0.6 0.6 0.6 21.7 0.0 4.1 1.0Man Lift Diesel 0.0 0.0 0.0 0.7 0.0 0.4 0.1Material handler Diesel 0.7 0.6 0.7 17.3 0.0 5.6 1.3Miscellaneous Diesel 0.1 0.1 0.1 3.0 0.0 3.0 0.2Rail Pusher Diesel 0.0 0.0 0.0 0.6 0.0 0.3 0.0
RTG Crane Diesel 2.4 2.2 2.4 68.7 0.1 18.2 4.2
Side pick Diesel 0.8 0.8 0.8 28.1 0.0 6.1 1.3
Skid Steer Loader Diesel 0.0 0.0 0.0 0.6 0.0 0.5 0.0Sweeper Diesel 0.1 0.1 0.1 2.2 0.0 1.2 0.2Sweeper Gasoline 0.0 0.0 0.0 1.3 0.0 5.7 0.2
Sweeper Propane 0.0 0.0 0.0 0.5 0.0 1.7 0.1
Top handler Diesel 7.1 6.6 7.1 252.9 0.4 63.4 15.3Truck Diesel 0.7 0.6 0.7 14.6 0.0 6.1 1.1
Yard tractor Diesel 9.4 8.6 9.4 303.3 1.0 181.5 14.9
Yard tractor LNG 0.0 0.0 0.0 4.4 0.0 0.1 3.6Yard tractor Propane 1.3 1.3 0.0 49.6 0.0 200.7 17.4Total 25.0 23.0 23.3 830.6 1.6 664.4 69.2
DB ID237

Inventory of Air Emissions CY 2011
Port of Los Angeles 100 July 2012
Table 5.17: 2011 CHE GHG Emissions by Equipment and Engine Type, tonnes
Equipment Engine CO2e
Bulldozer Diesel 44Crane Diesel 668Forklift Diesel 1,745Forklift Gasoline 21Forklift Propane 3,637Loader Diesel 1,819Man Lift Diesel 67Material handler Diesel 2,673Miscellaneous Diesel 314Rail Pusher Diesel 58RTG Crane Diesel 8,832Side pick Diesel 3,143Skid Steer Loader Diesel 65Sweeper Diesel 265Sweeper Gasoline 148Sweeper Propane 44Top handler Diesel 30,237Truck Diesel 2,477Yard tractor Diesel 76,054Yard tractor LNG 0Yard tractor Propane 13,096Total 145,409
DB ID237

Inventory of Air Emissions CY 2011
Port of Los Angeles 101 July 2012
Figure 5.5 presents the percentage of cargo handling equipment emissions by equipment type. Yard tractors contribute to roughly 43% of the cargo handling equipment PM emissions, 43% of the NOx emissions, 61% of the SOx emissions, 58% of the CO emissions, 52% of the HC emissions, and 61% of the GHG emissions. Top handlers, forklifts, RTG cranes, side picks and loaders follow in emissions. “Other” equipment refers to bulldozer, crane, man lift, rail pusher, skid steer loader, sweeper, off-road truck, and miscellaneous equipment.
Figure 5.5: 2011 CHE Emissions by Equipment Type

Inventory of Air Emissions CY 2011
Port of Los Angeles 102 July 2012
SECTION 6 LOCOMOTIVES This section presents emissions estimates for the railroad locomotive source category, including source description (6.1), geographical delineation (6.2), data and information acquisition (6.3), operational profiles (6.4), emissions estimation methodology (6.5), and the emission estimates (6.6). 6.1 Source Description Railroad operations are typically described in terms of two different types of operation, line haul and switching. Line haul refers to the movement of cargo over long distances (e.g., cross-country) and occurs within the Port as the initiation or termination of a line haul trip, as cargo is either picked up for transport to destinations across the country or is dropped off for shipment overseas. Switching refers to short movements of rail cars, such as in the assembling and disassembling of trains at various locations in and around the Port, sorting of the cars of inbound cargo trains into contiguous “fragments” for subsequent delivery to terminals, and the short distance hauling of rail cargo within the Port. It is important to recognize that “outbound” rail freight is cargo that has arrived on vessels and is being shipped to locations across the U.S. (also known as eastbound cargo), whereas “inbound” rail freight is destined for shipment out of the Port by vessel (also known as westbound cargo). This is contrary to the usual port terminology of cargo off-loaded from vessels referred to as “inbound” and that loaded onto vessels as “outbound.” The Port is served by three railway companies: Burlington Northern Santa Fe Railway Company (BNSF) Union Pacific Railroad (UP) Pacific Harbor Line (PHL)
These railroads primarily transport intermodal (containerized) freight, with lesser amounts of dry bulk, liquid bulk, and car-load (box car) freight. PHL performs most of the switching operations within the Port, while BNSF and UP provide line haul service to and from the Port and also operate switching services at their off-port locations. The two railroads that provide line haul service to the Port are termed Class 1 railroads, based on their relative size and revenues. Locomotives used for line haul operations are typically large, powerful engines of 3,000 to 4,000 hp or more, while switch engines are smaller, typically having one or more engines totaling 1,200 to 3,000 hp. Figures 6.1 and 6.2 illustrate typical line haul and switching locomotives, respectively, in use at the Port. The locomotives used in switching service at the Port by PHL, and at the near-Port railyard operated by UP, are new, low-emitting locomotives specifically designed for switching duty.

Inventory of Air Emissions CY 2011
Port of Los Angeles 103 July 2012
PHL's previous fleet of older locomotives was replaced by Tier 2 locomotives as part of an agreement among the Ports of Los Angeles and Long Beach and PHL, and that fleet was upgraded during 2011 by repowering with Tier 3-plus engines (which emit lower amounts of PM than the Tier 3 standard requires). Additional locomotives added to the fleet during 2011 were also Tier 3-plus locomotives. UP has reported that they also operate low-emission locomotives at their local near-port railyard as part of an agreement between the railroad and CARB, but this has not been verified by the ports.
Figure 6.1: Typical Line Haul Locomotive
Figure 6.2: PHL Switching Locomotive

Inventory of Air Emissions CY 2011
Port of Los Angeles 104 July 2012
6.2 Geographical Delineation Figure 6.3 illustrates the rail track system serving both ports, and Figure 6.4 presents a broader view of the major rail routes in the SoCAB that are used to move port-related intermodal cargo. The specific activities included in this emissions inventory are movements of cargo within Port boundaries, or directly to or from Port owned properties (such as terminals and on-port rail yards). Rail movements of cargo that occur solely outside the port, such as switching at off-port rail yards, and movements that do not either initiate or end at a Port property (such as east-bound line hauls that initiate in central Los Angeles intermodal yards) are not included.
Figure 6.3: Port Area Rail Lines

Inventory of Air Emissions CY 2011
Port of Los Angeles 105 July 2012
Figure 6.4: Air Basin Major Intermodal Rail Routes
6.3 Data and Information Acquisition The locomotive section of the EI presents an estimate of emissions associated with port-related activities of the locomotives operating within the Port and outside the Port to the boundary of the SoCAB. Information regarding these operations has been obtained from: Input from railroad operators Port cargo statistics Previous emissions studies
PHL provided a record of each of its locomotives including the fuel used per month in each locomotive. The UP railway company operating the ICTF, which is on Port property and operates as a joint powers authority of the Port and POLB, also provided information on their switch engines, including representative fuel usage. Certain information related to line haul locomotive fleets has been obtained from railroad companies’ Internet websites and that of the Surface Transportation Board of the U.S. Department of Transportation.

Inventory of Air Emissions CY 2011
Port of Los Angeles 106 July 2012
Additionally, terminal operators and Port departments have provided information on Port rail operations that provides an additional level of understanding of data and overall line haul rail operations. Throughput information provided by the railroad companies to the ports has been used to estimate on-Port and off-Port rail activity. It should be noted that data collection is particularly difficult with respect to estimating locomotive emissions associated with Port activities. As a result, the rail data for locomotive operations associated with Port activities as presented in this study continues to be somewhat less refined and specific than the data for other emission source categories. The Port continues to work on ways to further enhance the accuracy of the port activity data on which the locomotive emissions inventory is based. 6.4 Operational Profiles 6.4.1 Rail System The rail system is described below in terms of the activities that are undertaken by locomotive operators. Specifically, descriptions are provided for the assembly of outbound trains, the disassembly of inbound trains, and the performance of switching operations, as well as a detailed listing of the activities of line haul and switching operations. Outbound Trains The assembly of outbound trains occurs in one of three ways. Container terminals with sufficient track space build trains on-terminal in on-dock railyards, using flat cars that have either remained on site after the off-loading of inbound containers or have been brought in by one of the railroads. Alternatively, some containers are trucked (drayed) to an off-terminal transfer facility where the containers are transferred from truck chassis to railcars. A third option is for the terminal to store individual railcars (e.g., tank cars, bulk cars, container cars) or build a partial train on-terminal, to be collected later by a railroad (typically PHL) and moved to a rail yard with sufficient track space to build an entire train. Within the Port, complete trains can be built at the terminals servicing the West Basin Container Terminal, the American Presidents Line (APL) terminal, and the APM terminal. In addition, the Terminal Island Container Transfer Facility (TICTF) is shared by Nippon Yusen Kaisha (NYK) and Evergreen as a facility to build trains. Trains are also built outside of the Port at the Watson Yard, the Dolores Yard, and the Manuel Yard, and at locations within the POLB. If containers to be transported by rail are not loaded onto railcars at the Port, they are typically drayed to off-port locations operated by the line haul railroads, as noted above. Inbound Trains In-bound trains carrying cargo (or empty containers) that are all destined for the same terminal are delivered directly to the terminal by the Class 1 railroads if the receiving terminal has the track space to accommodate all of the cars at one time. Trains carrying cargo that are bound for multiple terminals within one or both ports are staged by the Class 1 railroads

Inventory of Air Emissions CY 2011
Port of Los Angeles 107 July 2012
at several locations, where they are broken up, typically by PHL, and delivered to their destination terminals. Inbound trains are also delivered to off-Port locations such as the Watson Yard, the ICTF operated by UP, the Dolores Yard, and the Manuel Yard. Of the off-port locations noted above, only the ICTF is included in the emission estimates presented in this emissions inventory, because of its status as a joint powers authority of the Port and the POLB.
Alameda Corridor The Alameda Corridor is a 20-mile rail line running between the San Pedro Bay area and downtown Los Angeles that is used by intermodal and other trains servicing the San Pedro Bay Ports and other customers in the area. Running largely below grade, the Alameda Corridor provides a more direct route between downtown Los Angeles and the Port than the routes that had previously been used, shortening the travel distance and eliminating many at-grade crossings (reducing traffic congestion).

Inventory of Air Emissions CY 2011
Port of Los Angeles 108 July 2012
Figure 6.5 illustrates the route of the Alameda Corridor and the routes it has replaced.
Figure 6.5: Alameda Corridor
Inventory of Air Emissions CY 2011
Port of Los Angeles 109 July 2012
Switching Switching locomotives deliver and pick up railcars transporting containers, liquid and dry bulk materials, and general cargo to and from terminals at the Port. Switching operations take place around the clock, seven days per week, although weekend activity is generally lower than weekday or weeknight activity. PHL is the primary switching railroad at the Port. PHL operations are organized into scheduled shifts, each shift being dispatched to do specified tasks in shift-specific areas. Other shifts move empty or laden container flat cars to and from container terminals. Much of the work involves rearranging the order of railcars in a train to organize cars bound for the same destinations (inbound or outbound) into contiguous segments of the train, and to ensure proper train dynamics. Train dynamics can include, for example, locating railcars carrying hazardous materials the appropriate minimum distance from the locomotives, and properly distributing the train’s weight. Although there is a defined schedule of shifts that perform the same basic tasks, there is little consistency or predictability to the work performed during a given shift or at a particular time. Specific Rail Activities Locomotive activities of the Class 1 railway companies consist of:
Delivering inbound trains (and/or empty railcars) to terminals or to the nearby
rail yards, using line haul locomotives. Picking up trains from the terminals or nearby rail yards and transporting them
to destinations across the country, using line haul locomotives. Breaking up inbound trains and sorting rail cars into contiguous fragments, and
delivering the fragments to terminals, using PHL switch locomotives.
Locomotive switching activities consist of:
Breaking up inbound trains and sorting railcars into contiguous fragments, and delivering the fragments to terminals.
Delivering empty container railcars to terminals. Delivering railcars to non-container facilities, and removing previously delivered
railcars. (For example, delivering full tank cars to a terminal that ships product and removing empties, or delivering empty tank cars to a terminal that receives product and removing full ones.)
Rearranging full and empty railcars to facilitate loading by a terminal. Picking up outbound containers in less than full train configuration and
transporting them to a yard for assembly into full trains – to be transported out of the Port by one of the line haul railroads.

Inventory of Air Emissions CY 2011
Port of Los Angeles 110 July 2012
6.4.2 Locomotives and Trains Locomotives operate differently from other types of mobile sources with respect to how they transmit power from engine to wheels. While most mobile sources use a physical coupling such as a transmission to transfer power from the engine to the wheels, a locomotive’s engine turns a generator or alternator powering an electric motor that, in turn, powers the locomotive’s wheels. The physical connection of the engine, transmission, and wheels of a typical mobile source means that the engine’s speed varies with the vehicle’s speed through a fixed set of gear ratios, resulting in the highly transient operating conditions (particularly engine speed and load) that characterize mobile source operations. In contrast, the locomotive’s engine and drive system operate more independently, such that the engine can be operated at a particular speed without respect to the speed of the locomotive itself. This allows operation under more steady-state load and speed conditions, and as a result locomotives have been designed to operate in a series of discrete throttle settings called notches, ranging from notch positions one through eight, plus an idle position. Many locomotives also have a feature known as dynamic braking, in which the electric drive motor operates as a generator to help slow the locomotive, with the resistance-generated power being dissipated as heat. While the engine is not generating motive power under dynamic braking, it is generating power to run cooling fans, so this operating condition is somewhat different from idling. Switch engines typically do not utilize dynamic braking. Line Haul Locomotives Line haul locomotives are operated in the Port by BNSF and UP. Because the function of line haul locomotives is to transport freight to and from destinations across the country, there is no readily identifiable “fleet” of line haul locomotives that call on the Port other than the Class 1 railroads’ nation-wide fleets. Both UP and BNSF are party to a Memorandum of Understanding with CARB that came into force in 2010 by which the railroads agreed to meet specified fleet-wide average emission rates from their line haul and switching locomotives operating in the SoCAB, on a weighted average basis (i.e., the average applies to switching as well as line haul locomotives). As part of achieving these fleet average emission rates, the railroads may have diverted a higher percentage of their newer locomotives that meet EPA Tier 2 emission standards to the SoCAB and the Ports, reducing their port-related emissions. Under the MOU the railroads were due to report this information to CARB during the second quarter of 2011, and CARB has reported that their evaluation of this data is on-going and not ready for distribution outside the agency; therefore, the effects of specific fleet modifications made by the Class 1 railroads in meeting the terms of the MOU have not been included in the emission estimates presented below.

Inventory of Air Emissions CY 2011
Port of Los Angeles 111 July 2012
Line haul locomotives are typically operated in groups of two to five units, with three or four units being most common, depending on the power requirements of the specific train being pulled and the horsepower capacities of available locomotives. Thus, two higher-horsepower locomotives may be able to pull a train that would take three units with lower power outputs. Locomotives operated in sets are connected such that every engine in the set can be operated in unison by an engineer in one of the locomotives. Switching Locomotives Most switching within the Port is conducted by PHL. Early in 2006, an agreement was concluded among PHL, the Port, and the POLB whereby the two ports helped fund the replacement of PHL’s locomotives with new locomotives meeting Tier 2 locomotive emission standards. In 2008, the last of the pre-Tier 2 locomotives were retired as the new locomotives were placed into service. PHL supplemented this fleet of 16 Tier 2 locomotives with 6 locomotives that are powered by a set of three relatively small diesel engines and generators rather than one large engine (known as a multi-engine genset switcher). These multi-engine genset units emit less than Tier 2 emission levels of most pollutants. During 2011, PHL replaced the Tier 2 engines in the locomotives that were placed in service during 2007 and 2008 with new Tier 3-plus engines, significantly lowering emissions yet again. The Class 1 railroads also operate switch engines in and around the Port, primarily at their switching yards outside of the Port. Train Configuration Container trains are the most common type of train operating at the Port. While equipment configurations vary, these trains typically consist of up to 26 or more double-stack railcars, each railcar consisting of five platforms capable of carrying up to four TEUs of containerized cargo (e.g., most platforms can carry up to two 40-foot containers). With this configuration, the capacity of a 26-railcar train is 520 TEUs or about 290 containers at an average ratio of 1.8 TEUs/container. As a practical matter, not all platforms carry four TEUs because not all platforms are double stacked with two 40-foot containers; the current capacity or “density” is estimated to be approximately 95% (meaning, for example, a 26-car train would carry 520 TEUs x 95% = 494 TEUs).

Inventory of Air Emissions CY 2011
Port of Los Angeles 112 July 2012
In developing off-port line haul locomotive emission estimates, the following assumptions were made regarding the typical make-up of trains traveling the Alameda Corridor and beyond: 26 double-stack railcars, 95% density, for a capacity of 494 TEUs or 274 containers (average). These assumptions are generally consistent with information developed for the No Net Increase Task Force’s evaluation of 2005 Alameda Corridor locomotive activities,57 with adjustments for changes in train makeup over time. Average train capacity assumptions for on-port emission estimates are lower based on reported container throughput and weekly/annual train information provided by Port terminals. It has been assumed that the length and/or capacity of trains are increased or decreased in the off-port rail yards prior to or after interstate travel to or from the Port (i.e., outbound freight is consolidated into fewer, longer trains and inbound freight is broken up for delivery to terminals), so the number of trains entering and leaving the Port is higher than the number of trains traveling the Alameda Corridor. 6.5 Emissions Estimation Methodology The following section provides a description of the methods used to estimate emissions from switching and line haul locomotives operating within the Port and in the SoCAB.
Emissions have been estimated using the information provided by the railroads and the terminals, and from published information sources such as the EPA’s "Emission Factors for Locomotives"58 and their Regulatory Support Document (RSD),59 both published as background to EPA’s locomotive rule-making processes. For on-Port switching operations, the fuel use information provided by the switching companies has been used along with EPA and manufacturer information on emission rates. Off-Port switching emissions have been estimated using 2005 fuel use data for the ICTF previously provided by UP, scaled to the decrease in facility throughput between 2005 and 2011. For the limited line haul operations in the Port (arrivals and departures), emission estimates have been based on schedule and throughput information provided by the railroads and terminal operators and on EPA operational and emission factors. Off-Port line haul emissions have been estimated using cargo movement information provided by the line haul railroads, and weight and distance information first developed for the 2005 emissions inventory. A detailed explanation of emission calculation methods is presented below. Different calculation methods are required for the different types of locomotive activity because different types of information are used for different activities. However, an attempt has been made to standardize the activity measures used as the basis of calculations in order to develop consistent methodologies and results.
57 Personal communication, Art Goodwin, Alameda Corridor Transportation Authority, with Starcrest Consulting Group, LLC, February 2005. 58 EPA, EPA-420-F-09-025, April 2009. 59 EPA, Locomotive Emission Standards Regulatory Support Document, April 1998, revised.

Inventory of Air Emissions CY 2011
Port of Los Angeles 113 July 2012
6.5.1 Switching Emissions Emissions from PHL’s on-port switching operations have been based on the horsepower-hours of work represented by their reported locomotive fuel use, and emission factors from the EPA documents cited above and from information published by the locomotive manufacturers. The calculations estimate horsepower-hours for each locomotive from fuel consumption in gallons per year and combine the horsepower-hour estimates with emission factors in terms of mass of emissions per horsepower-hour. Fuel usage is converted to horsepower-hours using an average value of 15.2 horsepower-hour per gallon of fuel (from EPA, 2009):
Equation 6.1 × = /
The calculation of emissions from horsepower-hours uses the following equation.
Equation 6.2 = × ( . / × , / ) Where:
E = emissions, tons per year Annual work = annual work, hp-hrs/yr EF = emission factor, grams pollutant per horsepower-hour
With the exception of the Tier 3 PM emission factors, EPA in-use emission factors for Tier 2 and Tier 3 locomotives have been used for the 16 locomotives that were converted over the course of the year (and three additional Tier 3 locomotives that operated at the Port). Emission factors for PM10, PM2.5, and DPM from the Tier 3 locomotive engines have been based on the EPA emission certification level of the engines, which is lower than the Tier 3 standard. The Tier 2 emission factors were used in conjunction with the amounts of fuel used before repowering, and the Tier 3 emission factors were used with the amounts of fuel used after repowering. Manufacturer’s published emission rates have been used for the six genset switchers, which each operate with three diesel engines originally certified to EPA Tier 3 nonroad engine standards. Emission rates published by the locomotives’ manufacturer, National Railway Equipment Co. (NRE) have been used instead of the Tier 3 nonroad standards because differences in duty cycle between nonroad and locomotive operation make the nonroad standards less appropriate. The ICTF switching emissions have been calculated using Tier 2 emission factors.

Inventory of Air Emissions CY 2011
Port of Los Angeles 114 July 2012
The EPA and NRE emission factors cover particulate, NOx, CO, and HC emissions. SO2 emission factors have been developed to reflect the use of 15 ppm ULSD using a mass balance approach which assumes that all of the sulfur in the fuel is converted to SO2 and emitted during the combustion process. While the mass balance approach calculates SO2 specifically, it is used as a reasonable approximation of SOx. The following example shows the calculation of the SOx emission factor.
Equation 6.3 , , × , × × . = . /
In this calculation, 15 ppm S is written as 15 lbs S per million lbs of fuel. The value of 15.2 hp-hr/gallon of fuel is the average BSFC noted in EPA’s technical literature on locomotive emission factors (EPA, 2009). Two grams of SO2 is emitted for each gram of sulfur in the fuel because the atomic weight of sulfur is 32 while the molecular weight of SO2 is 64, meaning that the mass of SO2 is two times that of sulfur. Greenhouse gas emission factors from EPA references60 have been used to estimate emissions of greenhouse gases CO2, CH4, and N2O from locomotives. Additionally, all particulate emissions are assumed to be PM10 and DPM, and PM2.5 emissions have been estimated as 92% of PM10 emissions to be consistent with CARB’s PM2.5 ratio used for offroad diesel equipment. Emission factors for the Tier 2, Tier 3 and genset switching locomotives, including those used for the off-port switching activity (Tier 2), are listed in Tables 6.1 and 6.2.
Table 6.1: Switching Emission Factors, g/hp-hr
Fuel or Locomotive PM10 PM2.5 DPM NOx SOx CO HC Type Tier 2 Locomotives 0.190 0.170 0.190 7.30 0.006 1.83 0.51 Tier 3 Locomotives 0.036 0.033 0.036 4.5 0.006 1.83 0.26 Genset Locomotives 0.050 0.050 0.050 3.37 0.006 1.51 0.04
60 EPA, Inventory of U.S. Greenhouse Gas Emissions and Sinks: 1990-2010, April 2012.

Inventory of Air Emissions CY 2011
Port of Los Angeles 115 July 2012
Table 6.2: GHG Switching Emission Factors, g/hp-hr
Fuel or Locomotive CO2 N2O CH4 Type Tier 2 Locomotives 678 0.017 0.050 Tier 3 Locomotives 678 0.017 0.050 Genset Locomotives 678 0.017 0.050
The activity measure used in the switching emission estimates is total horsepower-hours of activity, derived from the locomotive-specific fuel use data provided by PHL for the on-port switching, and an estimate of off-port switching fuel use derived from information provided earlier by UP for the ICTF rail yard that is located on Port property. For the ICTF, the reported 2005 fuel usage has been multiplied by the ratio of 2011 to 2005 container throughput reported by the railroad using the assumption that switching activity varies linearly with container throughput. PHL operates within both the Port and POLB. While some of the shifts are focused on activities in only one of the ports, other shifts may work in either or both ports depending upon the day’s needs for switching services. Therefore, it is not possible to clearly designate which shifts operate solely within the Port so a method was developed for apportioning emissions between the two ports. To do this, the previous baseline emissions inventory evaluated the work shifts as to whether they are likely to work in either port exclusively or in both ports, resulting in a split of 69% of activity within the Port and 31% within the POLB, which has been maintained for the current inventory. The difference between the two ports’ allocations is so great in part because PHL’s main yard is within the Port, so almost all work shifts involve at least some activity within the Port. Rail cargo from both ports is handled at the off-dock ICTF, and the complexities of the rail system are such that apportionment of activity (and emissions) between the two ports is difficult. The previous baseline emissions inventories used an allocation of 55% POLA and 45% POLB – this allocation has been maintained for the current inventories because it still seems a reasonable assumption, given that the Port’s overall TEU throughput represented about 57% of the two ports’ combined throughput in 2011. Regardless of apportionment, the sum of the two ports’ emissions represents all of the estimated switching emissions from locomotives operated at the ICTF.
6.5.2 Line Haul Locomotive Emissions Emissions from line haul locomotives operating in the Port have been estimated on an activity basis, i.e., estimates of the number and characteristics of locomotives that arrive and depart with cargo and/or empty containers. The information used in developing these estimates has been obtained from the Port and the Port’s terminals.

Inventory of Air Emissions CY 2011
Port of Los Angeles 116 July 2012
The number of locomotive trips in the Port has been estimated by evaluating cargo movements, percentage of cargo transported by rail, and typical number of locomotives per train, using a methodology similar to that first used for the 2001 baseline emissions inventory and also used for the subsequent inventories. Emission factors for most pollutants have been taken from EPA’s recent documentation (EPA-420-F-09-025, cited above) representing EPA’s projected 2011 nationwide fleet of line haul locomotives, as shown in Table 6.3. The emission factors are presented in terms of grams per horsepower-hour (g/hp-hr), converted from the gram-per-gallon factors listed in the EPA documentation using the line haul BSFC of 20.8 hp-hr/gal. The SOx emission factor has been estimated from assumed fuel sulfur content values using the same mass balance equation as the switching locomotives calculation. For line haul locomotives, which enter and leave California to pick up and deliver transcontinental rail cargo and typically refuel while in the SoCAB, the calculations are based on reasonably conservative assumptions derived from information provided by the Class 1 railroads. Inbound trains are assumed to use the fuel they were filled with before entering California, while outbound trains are assumed to refuel with ULSD before departing the SoCAB such that 90% of the outbound fuel is ULSD and 10% is the residual amount of out-of-state fuel. The out-of-state fuel is assumed to contain 234 ppm S, consistent with EPA assumptions,61 while the ULSD limit of 15 ppm is used for the in-state fuel.
Table 6.3: Emission Factors for Line Haul Locomotives, g/hp-hr
PM10 PM2.5 DPM NOx SOx CO HC EF, g/bhp-hr 0.21 0.19 0.21 7.16 0.042 1.28 0.37
The same information sources for greenhouse gases have been used for line haul locomotives as for switching locomotives, described above. Table 6.4 lists the greenhouse gas emission factors derived from the EPA reference.62
Table 6.4: GHG Emission Factors for Line Haul Locomotives, g/hp-hr
CO2 N2O CH4
EF, g/bhp-hr 494 0.013 0.040
61 EPA, Final Regulatory Analysis: Control of Emissions from Nonroad Diesel Engines, May 2004. 62 EPA, Inventory of U.S. Greenhouse Gas Emissions and Sinks: 1990-2010, April 2012.

Inventory of Air Emissions CY 2011
Port of Los Angeles 117 July 2012
On-Port Line Haul Emissions On-port line haul locomotive activity has been estimated through an evaluation of the amount of cargo reported by the terminals to be transported by rail and their reported average or typical number of trains per week or per year. These numbers have been combined with assumptions regarding the number of locomotives, on average, that are involved with on-port line haul railroad moves, and the average duration of incoming and outgoing port trips, in the same approach taken for the previous emissions inventories. The number of trains per year, locomotives per train, and on-port hours per train have been multiplied together to calculate total locomotive hours per year. This activity information is summarized in Table 6.5. While most of the rail cargo, and the basis for these estimates, center on container traffic, the local switching railroad has reported that they prepare an average of one train per day of cargo other than containers for transport out of the San Pedro Bay Ports area. It has been assumed that a similar number of trains are inbound, and that the total number has an even split between both ports. Therefore, the number of trains per year includes an average of one non-container train every other day in each direction (for an annual total of 365 additional trains for each port).
Table 6.5: On-Port Line Haul Locomotive Activity
Activity Measure Inbound Outbound Total
Number of trains/year 4,392 3,519 7,911 Number of locomotives/train 3 3 NA Hours on Port/trip 1.0 2.5 NA Locomotive hours/year 13,176 26,393 39,569
DB ID487
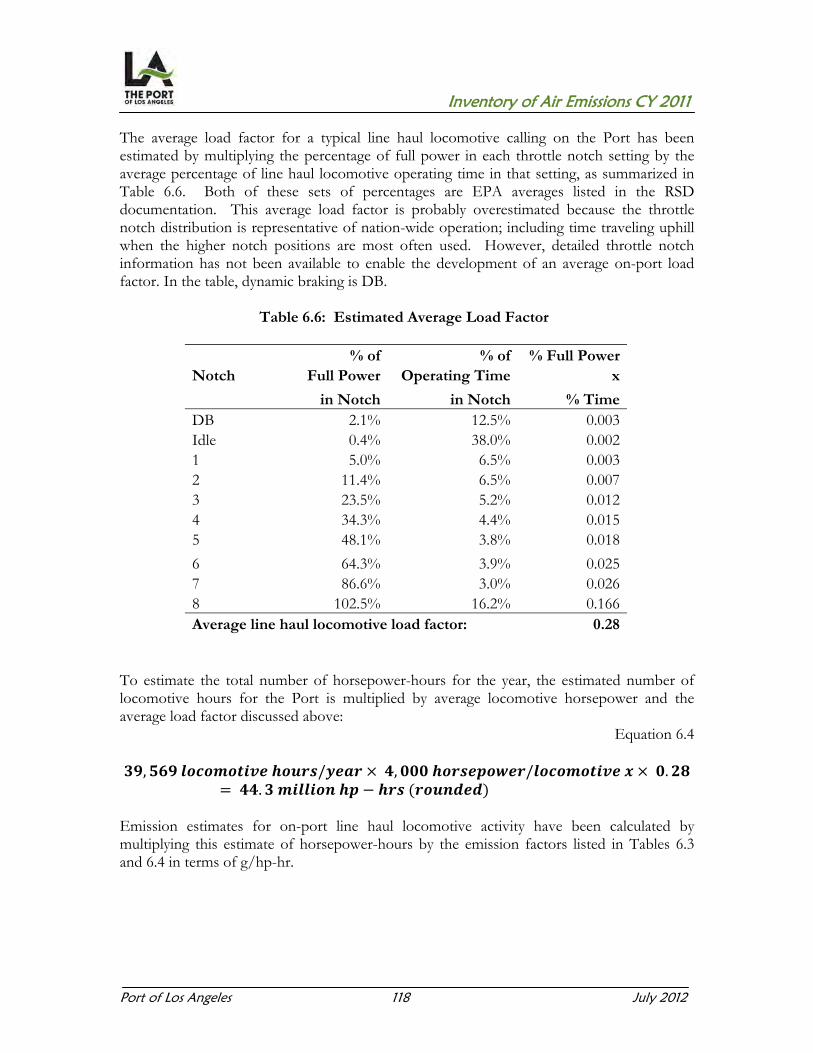
Inventory of Air Emissions CY 2011
Port of Los Angeles 118 July 2012
The average load factor for a typical line haul locomotive calling on the Port has been estimated by multiplying the percentage of full power in each throttle notch setting by the average percentage of line haul locomotive operating time in that setting, as summarized in Table 6.6. Both of these sets of percentages are EPA averages listed in the RSD documentation. This average load factor is probably overestimated because the throttle notch distribution is representative of nation-wide operation; including time traveling uphill when the higher notch positions are most often used. However, detailed throttle notch information has not been available to enable the development of an average on-port load factor. In the table, dynamic braking is DB.
Table 6.6: Estimated Average Load Factor
% of % of % Full Power Notch Full Power Operating Time x
in Notch in Notch % Time DB 2.1% 12.5% 0.003 Idle 0.4% 38.0% 0.002 1 5.0% 6.5% 0.003 2 11.4% 6.5% 0.007 3 23.5% 5.2% 0.012 4 34.3% 4.4% 0.015 5 48.1% 3.8% 0.018
6 64.3% 3.9% 0.025 7 86.6% 3.0% 0.026 8 102.5% 16.2% 0.166 Average line haul locomotive load factor: 0.28
To estimate the total number of horsepower-hours for the year, the estimated number of locomotive hours for the Port is multiplied by average locomotive horsepower and the average load factor discussed above:
Equation 6.4 , / × , / × .= . − ( )
Emission estimates for on-port line haul locomotive activity have been calculated by multiplying this estimate of horsepower-hours by the emission factors listed in Tables 6.3 and 6.4 in terms of g/hp-hr.

Inventory of Air Emissions CY 2011
Port of Los Angeles 119 July 2012
Out-of-Port Line Haul Emissions Line haul locomotive activity between the Port and the SoCAB boundary has been estimated through an evaluation of the amount of Port cargo transported by rail and of average or typical train characteristics such as number of containers and number of gross tons per train. In this way, estimates have been prepared of gross tonnage and fuel usage, similar to the methodology used for the previous Port emissions inventories. Four components of locomotive activity have been estimated to develop the off-port emission estimates: number of trains, average weight of each train, distances traveled within the SoCAB, and amount of fuel used per ton-mile of train activity. Using the average train capacities discussed above (average 274 containers per train) and the two San Pedro Bay Ports’ 2011 intermodal throughputs, the average number of port-related trains is estimated to be approximately 26 per day through the Alameda Corridor63 including non-container trains discussed above. The gross weight (including locomotives, railcars, and freight) of a typical train is estimated to be 6,344 tons, using the assumptions in Table 6.7. The distance assumptions are 21 miles for the Alameda Corridor and 84 miles between the north end of the Alameda Corridor and the SoCAB boundary. The latter distance is a weighted average of the east and south routes taken by UP trains and the east route taken by most BNSF trains, weighted by the approximate percentage distribution of freight reported by the railroads for the 2008/2009 time period (the most recent available), as shown in Table 6.8. Gross ton-miles (in millions) have been calculated by multiplying together the number of trains, the gross weight per train, and the miles traveled, as summarized in Table 6.9. This table also shows the estimated total fuel usage, estimated by multiplying the gross tons by the average fuel consumption for the two line haul railroads. This average has been derived from information reported by the railroads to the U.S. Surface Transportation Board in an annual report known as the “R-1.”64 Among the details in this report are the total gallons of diesel fuel used in freight service and the total freight moved in thousand gross ton-miles. The total fuel reported by both railroads was divided by the total gross ton-miles to derive the average factor of 0.987 gallons of fuel per thousand gross ton-miles. The 2010 annual reports are the latest available so these reported values have been used as the basis of the 2011 fuel consumption factor. Also listed in Table 6.9 is the estimated total of out-of-port horsepower-hours, calculated by multiplying the fuel use by the fuel use conversion factor of 20.8 hp-hr/gal.
63 Overall Alameda Corridor traffic for 2011 was an average of 42 per day. This includes non-port-related traffic; http://www.acta.org/PDF/CorridorTrainCounts.pdf. 64 Union Pacific, Class I Railroad Annual Report R-1 to the Surface Transportation Board for the Year Ending Dec. 31, 2010 and BNSF, Class I Railroad Annual Report R-1 to the Surface Transportation Board for the Year Ending Dec. 31, 2010, http://www.stb.dot.gov/econdata.nsf/FinancialData?OpenView.

Inventory of Air Emissions CY 2011
Port of Los Angeles 120 July 2012
Table 6.7: Assumptions for Gross Weight of Trains
Approximate Number Train Component Weight Weight per train Weight (lbs) (short tons) (short tons)Locomotive 420,000 210 4 840Railcar (per double-stack platform) 40,000 20 130 2,600Container 10.6 274 2,904Total weight per train, gross tons 6,344
Table 6.8: Train Travel Distance Assumptions
Approximate Distance Percentage of Distance x % (miles) Freight (miles)UP - LA east 84 15% 13UP - LA south 91 28% 25BNSF - LA east 82 56% 46Weighted average distance 84
Table 6.9: Gross Ton-Mile, Fuel Use, and Horsepower-hour Estimate
Distance Trains MMGT MMGT-
miles (miles) per year per year per yearAlameda Corridor 21 5,852 37 777Central LA to Air Basin Boundary 84 5,852 37 3,108Million gross ton-miles (MMGT) 3,885Estimated gallons of fuel (millions) 3.83Estimated million horsepower-hours 80
Emission estimates for out-of-port line haul locomotive activity have been calculated by multiplying this estimate of overall horsepower-hours by the emission factors in terms of g/hp-hr. 6.5.3 Improvements to Methodology from Previous Years There were no methodology changes from the 2010 to the 2011 emissions inventory.
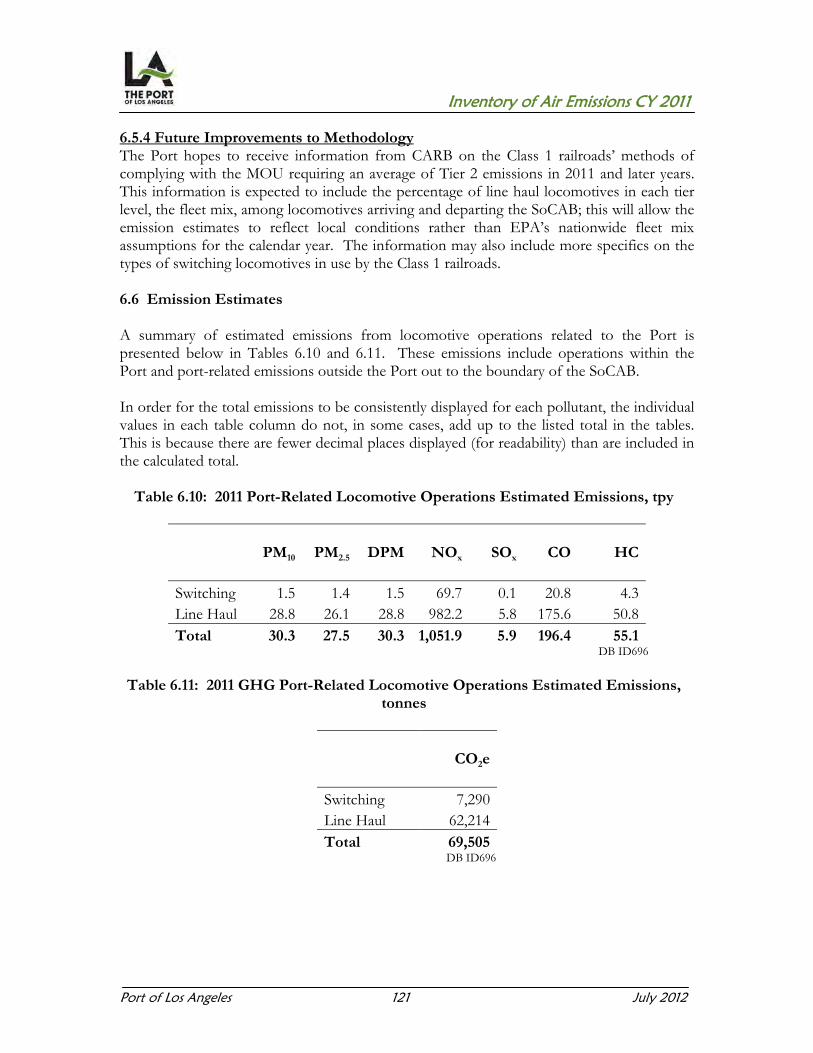
Inventory of Air Emissions CY 2011
Port of Los Angeles 121 July 2012
6.5.4 Future Improvements to Methodology The Port hopes to receive information from CARB on the Class 1 railroads’ methods of complying with the MOU requiring an average of Tier 2 emissions in 2011 and later years. This information is expected to include the percentage of line haul locomotives in each tier level, the fleet mix, among locomotives arriving and departing the SoCAB; this will allow the emission estimates to reflect local conditions rather than EPA’s nationwide fleet mix assumptions for the calendar year. The information may also include more specifics on the types of switching locomotives in use by the Class 1 railroads. 6.6 Emission Estimates A summary of estimated emissions from locomotive operations related to the Port is presented below in Tables 6.10 and 6.11. These emissions include operations within the Port and port-related emissions outside the Port out to the boundary of the SoCAB. In order for the total emissions to be consistently displayed for each pollutant, the individual values in each table column do not, in some cases, add up to the listed total in the tables. This is because there are fewer decimal places displayed (for readability) than are included in the calculated total.
Table 6.10: 2011 Port-Related Locomotive Operations Estimated Emissions, tpy
PM10 PM2.5 DPM NOx SOx CO HC
Switching 1.5 1.4 1.5 69.7 0.1 20.8 4.3 Line Haul 28.8 26.1 28.8 982.2 5.8 175.6 50.8 Total 30.3 27.5 30.3 1,051.9 5.9 196.4 55.1
DB ID696
Table 6.11: 2011 GHG Port-Related Locomotive Operations Estimated Emissions, tonnes
CO2e
Switching 7,290Line Haul 62,214Total 69,505
DB ID696
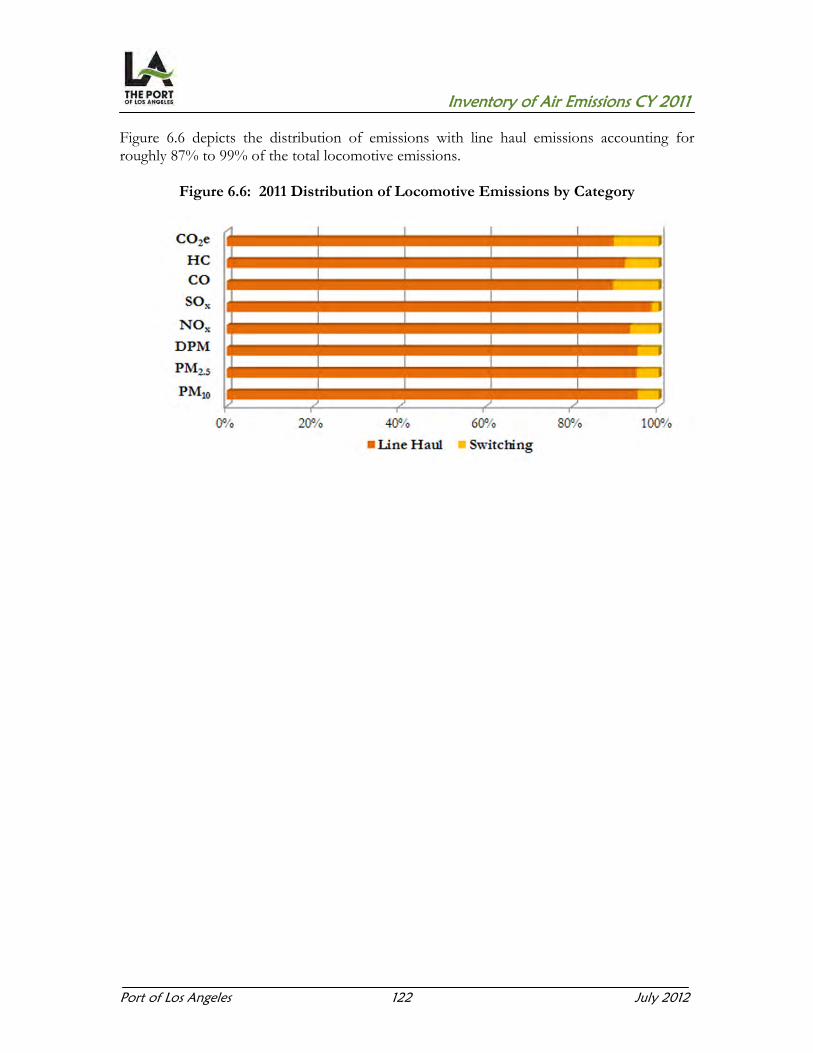
Inventory of Air Emissions CY 2011
Port of Los Angeles 122 July 2012
Figure 6.6 depicts the distribution of emissions with line haul emissions accounting for roughly 87% to 99% of the total locomotive emissions.
Figure 6.6: 2011 Distribution of Locomotive Emissions by Category


Inventory of Air Emissions CY 2011
Port of Los Angeles 123 July 2012
SECTION 7 HEAVY-DUTY VEHICLES This section presents emissions estimates for the heavy-duty vehicles source category, including source description (7.1), geographical delineation (7.2), data and information acquisition (7.3), operational profiles (7.4), emissions estimation methodology (7.5), and the emission estimates (7.6). 7.1 Source Description Trucks are used extensively to move cargo, particularly containerized cargo, to and from the marine terminals that serve as the bridge between land and sea transportation. Trucks deliver cargo to both local and national destinations, and they also transfer containers between terminals and off-port railcar loading facilities, an activity known as draying. In the course of their daily operations, trucks are driven onto and through the terminals, where they deliver and/or pick up cargo. They are also driven on the public roads within the Port boundaries, and on the public roads outside the Port.
The primary focus of this section is diesel-fueled HDVs as the amount of alternatively-fueled counterparts in use in 2011 was relatively small. Alternatively-fueled trucks, primarily those fueled by liquefied natural gas (LNG), made approximately 6.5% of the terminal calls in 2011, based on fuel type information in the Port’s Clean Trucks Program Drayage Truck Registry. Diesel particulate matter is only emitted by trucks that are burning diesel fuel, so the diesel particulate emission estimates presented in this inventory have been adjusted to take the alternatively-fueled trucks into account. The most common configuration of HDV is the articulated tractor-trailer (truck and semi-trailer) having five axles, including the trailer axles. The most common type of trailer in the study area is the container trailer, built to accommodate standard-sized cargo containers. Additional trailer types include tankers, boxes, and flatbeds. A tractor traveling without an attached trailer is called a “bobtail” (no trailer load). A tractor pulling an unloaded container trailer chassis is known simply as a “chassis.” These vehicles are all classified as heavy HDVs regardless of their actual weight because the classification is based on gross vehicle weight rating (GVWR), which is a rating of the vehicle’s total carrying capacity. Therefore, the emission estimates do not distinguish among the different configurations.
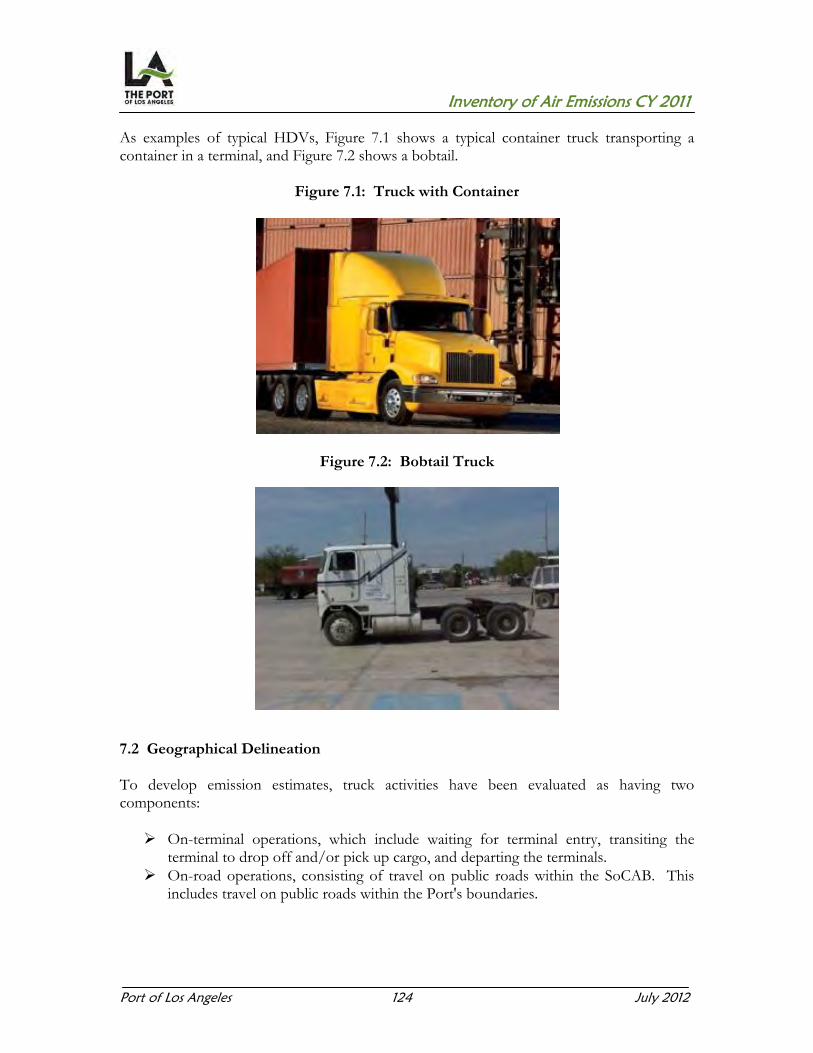
Inventory of Air Emissions CY 2011
Port of Los Angeles 124 July 2012
As examples of typical HDVs, Figure 7.1 shows a typical container truck transporting a container in a terminal, and Figure 7.2 shows a bobtail.
Figure 7.1: Truck with Container
Figure 7.2: Bobtail Truck
7.2 Geographical Delineation To develop emission estimates, truck activities have been evaluated as having two components: On-terminal operations, which include waiting for terminal entry, transiting the
terminal to drop off and/or pick up cargo, and departing the terminals. On-road operations, consisting of travel on public roads within the SoCAB. This
includes travel on public roads within the Port's boundaries.

Inventory of Air Emissions CY 2011
Port of Los Angeles 125 July 2012
Figure 7.3 shows the roadways in and around the Port that the HDVs use in daily operations. The figure presents the scope of a traffic study that evaluated traffic patterns in both the Port of Los Angeles and the Port of Long Beach. That traffic study and its use in developing the HDV emission estimates presented in this report are discussed in more detail in the following subsections.
Figure 7.3: Port and Near-Port Roadways

Inventory of Air Emissions CY 2011
Port of Los Angeles 126 July 2012
7.3 Data and Information Acquisition Data for the HDV emission estimates came from two basic sources: terminal interviews and computer modeling of on-road HDV traffic volumes, distances, and speeds. These information sources are discussed below.
7.3.1 On-Terminal The Port collected information regarding on-terminal truck activity during in-person and telephone interviews with terminal personnel. This information included gate operating schedules, on-terminal speeds, time and distance traveled on terminal while dropping off and/or picking up loads, and time spent idling at the entry and exit gates. Most terminals were able to provide estimates of these activity parameters, although few keep detailed records of information such as gate wait times and on-terminal turn-around time. However, the reported values appear to be reasonable and have been used in estimating on-terminal emissions, except as noted in the following text. 7.3.2 On-Road The Port developed estimates of on-road truck activity inside and outside the Port. To do this, the Port used trip generation and travel demand models that have been used in the previous Port emissions inventories to estimate the volumes (number of trucks) and average speeds on roadway segments between defined intersections. The Port developed the trip generation model in part to forecast the number of truck trips associated with container terminals. The primary input to the trip generation model for the current emissions inventory consists of each container terminal’s average daily container throughput in 2011. The results of the trip generation model were input to a regional travel demand model used for transportation planning by the SCAG, the federally designated Metropolitan Planning Organization for the SoCAB area. The terminal-specific truck travel information from the trip generation model, as well as the results of an origin/destination survey of approximately 3,300 Port-area truck drivers, were input to the Port-area travel demand model to predict truck travel patterns and estimate the number of trucks traveling over roadways in the region. The model estimates the movements of port-related trucks on their way from the Port until they make their first stop, whether for delivery of a container to a customer or to a transloading facility, or to the boundary of the SoCAB.

Inventory of Air Emissions CY 2011
Port of Los Angeles 127 July 2012
The travel demand model produces estimates of the number of trucks and their average speed in each direction over defined roadway segments, along with the length of each roadway segment. A brief example illustrating the data is provided in Table 7.1. The number of trucks and the distances are multiplied for each segment and summed to produce estimates of vehicle miles of travel (VMT). In addition, a VMT-weighted average speed has been calculated that takes into account how many miles were driven at each speed; these VMT and speed estimates have been used with the speed-specific EMFAC emission factors (discussed below) to estimate on-road driving emissions. The speed in the table is in miles per hour (mph).
Table 7.1: On-Road HDV Activity Modeling Results – Example
Distance Volume Dir 1 Volume Dir 2 Speed Dir 1 Speed Dir 2(miles) (# trucks) (# trucks) (mph) (mph)0.71 4 2 50 480.12 19 12 33 320.36 1 3 35 350.01 4 5 40 400.55 1 2 62 601.87 1 3 62 600.45 12 9 47 460.26 12 10 26 25
7.4 Operational Profiles
The activity profiles for on-terminal and on-road truck traffic presented below have been based on the modeling data and terminal information collected as described in the previous subsection.

Inventory of Air Emissions CY 2011
Port of Los Angeles 128 July 2012
7.4.1 On-Terminal Table 7.2 illustrates the range and average of reported container terminal operating characteristics of on-terminal truck activities at Port container terminals, while Table 7.3 shows the same summary data for the non-container terminals and facilities. The total number of trips in 2011 is 3,443,333 for container terminals and 1,091,638 for non-container facilities. The total number of trips in each table is based on the trip generation model described above. Table 7.2: 2011 Summary of Reported Container Terminal Operating Characteristics
Unload/
Speed Distance Gate In Load Gate Out (mph) (miles) (hours) (hours) (hours)
Maximum 15 4.0 0.17 0.52 0.15 Minimum 10 0.9 0.08 0.30 0.00 Average 13 1.7 0.11 0.39 0.04 Total
Table 7.3: 2011 Summary of Reported Non-Container Facility Operating
Characteristics
Unload/Speed Distance Gate In Load Gate Out (mph) (miles) (hours) (hours) (hours)
Maximum 20 1.3 0.08 0.37 0.05 Minimum 0 0.0 0.00 0.00 0.00 Average 7 0.4 0.03 0.09 0.01 Total
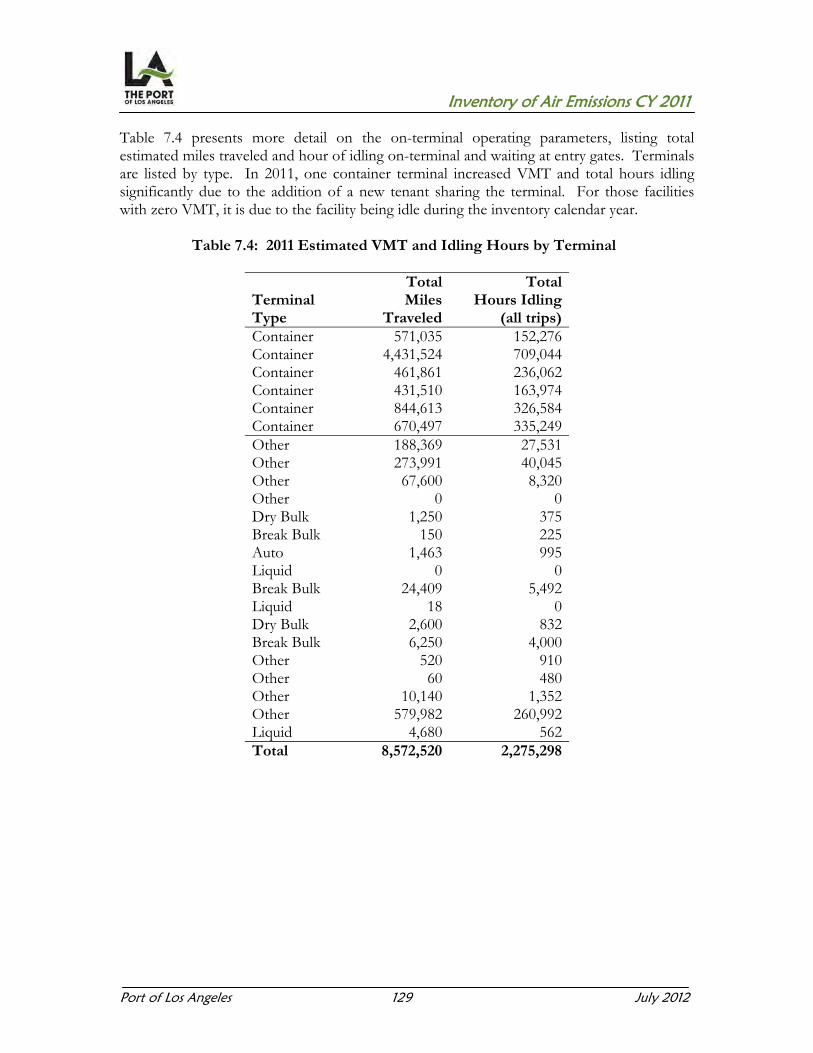
Inventory of Air Emissions CY 2011
Port of Los Angeles 129 July 2012
Table 7.4 presents more detail on the on-terminal operating parameters, listing total estimated miles traveled and hour of idling on-terminal and waiting at entry gates. Terminals are listed by type. In 2011, one container terminal increased VMT and total hours idling significantly due to the addition of a new tenant sharing the terminal. For those facilities with zero VMT, it is due to the facility being idle during the inventory calendar year.
Table 7.4: 2011 Estimated VMT and Idling Hours by Terminal Total Total
Terminal Miles Hours IdlingType Traveled (all trips)Container 571,035 152,276Container 4,431,524 709,044Container 461,861 236,062Container 431,510 163,974Container 844,613 326,584Container 670,497 335,249Other 188,369 27,531Other 273,991 40,045Other 67,600 8,320Other 0 0Dry Bulk 1,250 375Break Bulk 150 225Auto 1,463 995Liquid 0 0Break Bulk 24,409 5,492Liquid 18 0Dry Bulk 2,600 832Break Bulk 6,250 4,000Other 520 910Other 60 480Other 10,140 1,352Other 579,982 260,992Liquid 4,680 562Total 8,572,520 2,275,298

Inventory of Air Emissions CY 2011
Port of Los Angeles 130 July 2012
7.4.2 On-Road Figure 7.4 presents a regional map of the major area roadways. The daily traffic estimates are based on average week-day activity during an average month over these roads and on the regional network of smaller, local roads. The daily activities have been annualized for the emission estimates presented in this inventory on the basis of 300 days of terminal operation per year.
Figure 7.4: Regional Map

Inventory of Air Emissions CY 2011
Port of Los Angeles 131 July 2012
7.5 Emissions Estimation Methodology This section discusses how the emission estimates were developed for HDVs serving the Port. A general equation for estimating the emissions inventory for a fleet of on-road vehicles can be expressed as:
Equation 7.1 = × × ×
Where:
E = Emissions Pop = Population (number of vehicles of a particular model year in the fleet) Act = Activity (average number of miles driven per truck, hours of idle operation) BER = Basic Emission Rate (amount of pollutants emitted per unit of activity for vehicles of that model year), g/mile CorF = Correction Factor (adjustment to BER for specific assumptions of activity and/or atmospheric conditions), dimensionless
The emissions from all model years are summed to complete the fleet emission estimates. In practice the fleet estimates are prepared by combining the base emission rates and correction factors for all model years in such a way as to develop a single set of emission factors that represent the fleet’s distribution of model years. Population and activity are also combined to estimate total fleet activity, and the activity and emission factors are combined to estimate fleet emissions. The process is described in the following paragraphs.

Inventory of Air Emissions CY 2011
Port of Los Angeles 132 July 2012
7.5.1 Overview of the HDV Emissions Calculation Methodology The EMission FACtor version 2011 (EMFAC2011) model developed by CARB has been used to develop the HDV emission factors underlying the emissions inventory. EMFAC2011 is an update to previous versions of the EMFAC series of on-road emission estimating models. EMFAC2011 models the basic emission rate (in grams per mile) as a constant value (over time) with a “zero mile rate” (ZMR) or intercept representing the emissions of the vehicle when new or like-new (well maintained and un-tampered), plus a “deterioration rate” (DR) or slope representing the gradual increase in the emission rate over time as a function of use (the engine's cumulative mileage). For heavy-duty trucks the deterioration rate is expressed as grams per mile traveled per 10,000 accumulated miles (g/mi/10k mi).
Equation 7.2 = + ( × / , )
Where:
BER = Basic Emission Rate (amount of pollutants emitted per unit of
activity for vehicles of that model year), g/mile ZMR = Zero Mile Rate (emissions of the vehicle when new or like-new),
g/mile DR = Deterioration Rate (slope representing the gradual increase in the
emission rate over time as a functions of use), g/mi/10K mi CM = Cumulative Mileage (total miles on the vehicle since new), miles
Emission rates for each model year and speed that are obtained from CARB’s web-based database that has been established as part of the EMFAC2011 update are already adjusted for the correction factors included in equation 7.1 to reflect vehicle specific activity such as speed, type and quality of fuel burned, and specific ambient conditions such as temperature and relative humidity. CARB has published idle emission factors expressed in grams per hour (g/hr) that are used in estimating the idle emissions from drayage trucks. The idle emission factors are multiplied by the activity estimates, which are total hours of idle operation, to derive the ton-per-year emission estimates. CARB has developed “low idle” and “high idle” emission rates to represent emissions from different types of truck idling. The “low idle” rates were used in developing the emissions inventory for the Port because the low idle rates are "indicative of a truck in queue to either pick up or drop off a shipment," whereas the "high idle " rates are intended to "reflect activity associated with truck stops, rest areas, and distribution centers" rather than normal port operations.65 65 CARB, http://www.arb.ca.gov/msei/onroad/latest_revisions.htm#hhddt_idle.

Inventory of Air Emissions CY 2011
Port of Los Angeles 133 July 2012
The low idle emission factors are presented in Table 7.5.
Table 7.5: Idle Emission Rates, g/hr Model Years
HC CO NOx PM CO2
Pre-1987 18.648 28.4 42.501 3.4272 4,2711987-90 10.944 23.4 65.286 1.7136 4,5071991-93 8.712 21.5 72.912 1.2816 4,6101994-97 6.9696 19.8 79.329 0.9576 4,7131998-02 5.2272 17.8 85.653 0.6624 4,8462003-06 4.2984 16.6 88.815 0.5184 4,934
2007-09 4.2984 16.6 27.9 0.0576 4,934
2010+ 4.2984 16.6 27.9 0.0576 4,934
Because the EMFAC model does not produce emission factors for N2O or speed-specific emission factors for SOx, gram-per-mile emission factors for these emissions have been developed using a mass balance approach for SOx and a gram-per-gallon emission factor from CARB for N2O. The following equation has been used to derive the SOx emission factor.
Equation 7.3 = ( / , , ) × ( , / ) × ( / )( . / ) The emission calculations are based on the use of 15 ppm ULSD diesel fuel. The weight of a gallon of diesel fuel is assumed to be 7.1 pounds or 3,220 grams (7.1 lbs x 453.59 g/lb). Based on the EMFAC2011 model, the 2011 fleet average fuel economy of the heavy-heavy duty diesel fleet was calculated to be 5.8 miles per gallon. The N2O emission factor has been calculated using the following equation:
Equation 7.4 ( / ) = ( . / )( . / )

Inventory of Air Emissions CY 2011
Port of Los Angeles 134 July 2012
7.5.2 Model Year Distribution Because vehicle emissions vary according to the vehicle's model year and age, the activity level of trucks in each model year is an important part of developing emission estimates. As a routine component of the annual emissions inventory updates, optical character recognition (OCR) license plate data were collected from container terminal operators over the course of the year to determine the distribution of model years (count of vehicles and number of terminal calls by model year) of trucks calling upon the Port. Most terminals collect this information as part of their terminal operating routine, and those that do collect the information provide the records to the Port, consisting primarily of license plate numbers with date/time stamps. Approximately 4.5 million OCR readings were collected from nine different terminals of the Port and POLB during the period spanning January 1 through December 31, 2011. These readings were processed to eliminate duplicate plate numbers and records that identify vehicles exiting the terminals, to minimize double counting of trips. The records were also screened to remove special characters, state suffixes (i.e., CA, NV, etc.), character strings that were obviously not license plate numbers (e.g., “NO OCR”, “-----", etc.), and records that were less than six characters in length. This process left 62,748 unique license plate numbers for which registration information was sought from the California Department of Motor Vehicles (DMV). The DMV returned a total of 68,701 records; many of these were "no match" returns, meaning the number that was submitted was not a valid license plate number format and/or did not match any numbers in the DMV's database. Additionally, the DMV returned records on license plates that had not been submitted but that were associated with VINs matching submitted license plates. It is believed these represent trucks that have been issued more than one license plate number over their lifetime. Removing these invalid records left 46,549 records with associated vehicle identification numbers (VINs) and vehicle model year information for trucks that called at one or more of the terminals in 2011. The matching DMV files also include a body type model (BTM) field, which was used to distinguish trucks from other types of vehicles captured by the OCR systems, such as passenger cars, motorcycles, and other vehicles that entered the terminals over the course of the year and were picked up by the OCR readers. Vehicles designated with a BTM of DS (diesel tractor truck), TB (tilt cab tractor), TL (tilt tandem tractor), TM (tandem axle tractor), TRAC and TRACTOR (tractors) were included in the analysis. When these were matched back to the OCR call records, a total of 14,516 unique trucks were identified, with a model year range from 1943 to two 2013 model year trucks. The 2013 trucks, which accounted for only three terminal calls, were consolidated with the 2012 model year trucks for emission factor development. Trucks older than model year 1967 were consolidated with the 1967 model year trucks because the emission model (EMFAC, discussed below) does not produce emission factors for years before 1967. This consolidation has a negligible effect on the emission estimates because the pre-1967 trucks were recorded calling only 43 times out of more than 3.5 million calls.

Inventory of Air Emissions CY 2011
Port of Los Angeles 135 July 2012
The valid truck license plate numbers were then matched against the original OCR readings and occurrences of identical plate readings within ten minutes of each other were eliminated. These occurrences were likely duplicate readings related to the same entry event. This matching process resulted in 3.55 million terminal calls matched to known license plate numbers and truck model years. These matched calls were used to develop a call-weighted model year distribution, the percentage of terminal calls made up by each model year. The results show that the over 90% of truck calls were made by trucks with 2007and newer engines. The model year information returned by the DMV relates to the model year of the truck that is issued a license plate. Many trucks are equipped, when new, with engines that are one or more model years older than the truck body, and emission standards for heavy-duty vehicles are applicable based on the model year of the engines. This has implications for the current fleet of trucks calling at the Port because the call distribution includes a large percentage (over 30%) of 2010 and newer model year trucks, and 2010 and newer engines are subject to much lower NOx standards than 2009 and older engines. Two sources of information were used to account for the differences between truck model year and engine model years, the Port Drayage Truck Registry (PDTR) and a survey conducted for the Port that looked at a sample of 2010 and 2011 model year trucks and the engines installed in those trucks.66 These two data sources were used to adjust the truck model year population and call distributions to better reflect the distribution of engine model years in the fleet that called at the Port in 2011.
66 Ports of Los Angeles and Long Beach, 2010 Engine Model Year Analysis, March 2012

Inventory of Air Emissions CY 2011
Port of Los Angeles 136 July 2012
The distribution of truck fleet’s engine model years by calls, which was used to develop the composite emission factors as discussed below, is presented in Figure 7.5. The call weighted average engine age of the port-related fleet is 3 years.
Figure 7.5: Engine Model Year Distribution of the Heavy-Duty Truck Fleet
7.5.3 Speed-Specific Emission Factors The model year and speed specific gram-per-mile emission rates are composited to reflect the distribution of truck calls by engine model year within the fleet of trucks calling at Port terminals, with a single emission factor for each 5-mile-per-hour speed increment representing the distribution of model years using the call-weighted model year distribution discussed in the previous subsection. A single set of pollutant specific gram-per-hour idle emission rates has also been derived using the distribution of truck calls by engine model year. Emissions of SOx and N2O have been estimated as described above; idling emission rates of these substances have been based on an average fuel consumption rate of 0.48 gallons of diesel per hour during idling, derived from an analysis of the idling CO2 emission factor established by CARB. Tables 7.6 and 7.7 summarize the speed-specific emission factors developed as described above and used to estimate emissions. The units are in grams per mile, except for the idle emission factors (0 mph), which are in grams per hour of idling.
0%
5%
10%
15%
20%
25%
30%
35%
40%
45%
Per
cen
t of
Cal
ls
Engine Model year

Inventory of Air Emissions CY 2011
Port of Los Angeles 137 July 2012
Table 7.6: Speed-Specific Composite Emission Factors, g/hr and g/mi
Speed Range PM10 PM2.5 DPM NOx SOx CO HC Units(mph) 0 (Idle) 0.1143 0.1052 0.1075 33.3164 0.0385 16.6936 4.3793 g/hr1 - 5 0.2944 0.2708 0.2767 20.7881 0.0167 7.6945 3.2063 g/mi6 - 10 0.2208 0.2031 0.2076 15.3878 0.0167 4.9583 1.8712 g/mi11 - 15 0.1635 0.1504 0.1537 11.4244 0.0167 3.0246 0.9524 g/mi16 - 20 0.1181 0.1087 0.1110 8.6265 0.0167 1.7478 0.4025 g/mi21 - 25 0.1053 0.0969 0.0990 7.8121 0.0167 1.5971 0.3452 g/mi26 - 30 0.0972 0.0894 0.0914 7.1206 0.0167 1.4791 0.2959 g/mi31 - 35 0.0938 0.0863 0.0882 6.5520 0.0167 1.3937 0.2544 g/mi36 - 40 0.0953 0.0877 0.0896 6.1064 0.0167 1.3410 0.2208 g/mi41 - 45 0.1014 0.0933 0.0953 5.7838 0.0167 1.3209 0.1952 g/mi46 - 50 0.1124 0.1034 0.1057 5.5841 0.0167 1.3335 0.1774 g/mi51 - 55 0.1281 0.1179 0.1204 5.5073 0.0167 1.3787 0.1676 g/mi56 - 60 0.1486 0.1367 0.1397 5.5535 0.0167 1.4566 0.1656 g/mi61 - 65 0.1739 0.1600 0.1635 5.7226 0.0167 1.5671 0.1716 g/mi66 - 70 0.2039 0.1876 0.1917 6.0147 0.0167 1.7103 0.1855 g/mi
Table 7.7: Speed-Specific GHG Emission Factors, g/hr and g/mi
Speed Range CO2 N2O CH4 Units (mph) 0 (Idle) 4,928 0.1592 0.2576 g/hr 1 - 5 4,075 0.0572 0.1886 g/mi 6 - 10 3,366 0.0572 0.1101 g/mi 11 - 15 2,764 0.0572 0.056 g/mi 16 - 20 2,180 0.0572 0.0237 g/mi 21 - 25 2,034 0.0572 0.0203 g/mi 26 - 30 1,910 0.0572 0.0174 g/mi 31 - 35 1,806 0.0572 0.015 g/mi 36 - 40 1,724 0.0572 0.013 g/mi 41 - 45 1,663 0.0572 0.0115 g/mi 46 - 50 1,623 0.0572 0.0104 g/mi 51 - 55 1,604 0.0572 0.0099 g/mi 56 - 60 1,607 0.0572 0.0097 g/mi 61 - 65 1,630 0.0572 0.0101 g/mi 66 - 70 1,675 0.0572 0.0109 g/mi

Inventory of Air Emissions CY 2011
Port of Los Angeles 138 July 2012
The emission factors presented in Tables 7.6 and 7.7 have been multiplied by the on-road and on-terminal VMT and on-terminal idling hours to develop the overall on-road and on-terminal emissions presented below in subsection 7.6, Emission Estimates. 7.5.4 Improvements to Methodology from Previous Years The following improvements to the emissions calculation methodology were made in this inventory compared to the 2010 EI methodology. Refer to Section 9 for a comparison of 2011 emissions with previous years’ emissions.
CARB’s updated EMFAC2011 model was used instead of the previously released
version. The engine model year instead of the truck’ body model year was used in the
model year distribution to better reflect the emission rates by model year.
7.5.5 Future Improvements to Methodology As part of the San Pedro Bay Ports' Clean Truck Programs, the container terminals have been collecting truck entry data using radio frequency identification (RFID) technology. This data is collected and correlated with truck-specific information contained in the Port Drayage Truck Registry (PDTR) that has also been established as part of the truck programs. The RFID/PDTR data may supplement or in some ways replace the OCR/DMV data in evaluating the model year distribution of future port-related fleets. 7.6 Emission Estimates The estimates of 2011 HDV emissions are presented in this section. As discussed above, on-terminal emissions are based on terminal-specific information such as number of trucks passing through the terminal and the distance they travel on-terminal, and the Port-wide totals are the sum of the terminal-specific estimates. The on-road emissions have been estimated for Port trucks using travel demand model results to estimate how many trucks travel along defined roadways in the SoCAB on the way to their first cargo drop-off point. The on-terminal estimates include the sum of driving and idling emissions calculated separately. The on-road estimates include idling emissions as a normal part of the driving cycle. This is a valid approach because the average speeds include estimates of normal traffic idling times and the emission factors are designed to take this into account. In order for the total emissions to be consistently displayed for each pollutant, the individual values in each table column do not, in some cases, add up to the listed total in the tables. This is because there are fewer decimal places displayed (for readability) than are included in the calculated total.

Inventory of Air Emissions CY 2011
Port of Los Angeles 139 July 2012
Emission estimates for HDV activity associated with Port terminals and other facilities are presented in the following tables. Tables 7.8 and 7.9 summarize emissions from HDVs associated with all Port terminals.
Table 7.8: 2011 HDV Emissions, tpy
Activity Location VMT PM10 PM2.5 DPM NOx SOx CO HC
On-Terminal 8,572,520 2.0 1.8 1.9 203.1 0.2 76.2 22.8On-Road 179,618,739 21.0 19.3 19.7 1,202.4 3.4 272.0 42.7Total 188,191,259 23.0 21.1 21.6 1,405.5 3.6 348.2 65.5
Table 7.9: 2011 HDV GHG Emissions, tonnes
Activity Location VMT CO2e On-Terminal 8,572,520 36,729 On-Road 179,618,739 311,826 Total 188,191,259 348,555
Tables 7.10 and 7.11 show emissions associated with container terminal activity separately from emissions associated with other Port terminals and facilities.
Table 7.10: 2011 HDV Emissions Associated with Container Terminals, tpy
Activity Location VMT PM10 PM2.5 DPM NOx SOx CO HC
On-Terminal 7,411,040 1.7 1.6 1.6 171.4 0.1 63.7 18.8On-Road 166,200,078 19.4 17.8 18.2 1,112.9 3.1 251.7 39.5Total 173,611,118 21.1 19.4 19.8 1,284.3 3.3 315.5 58.3
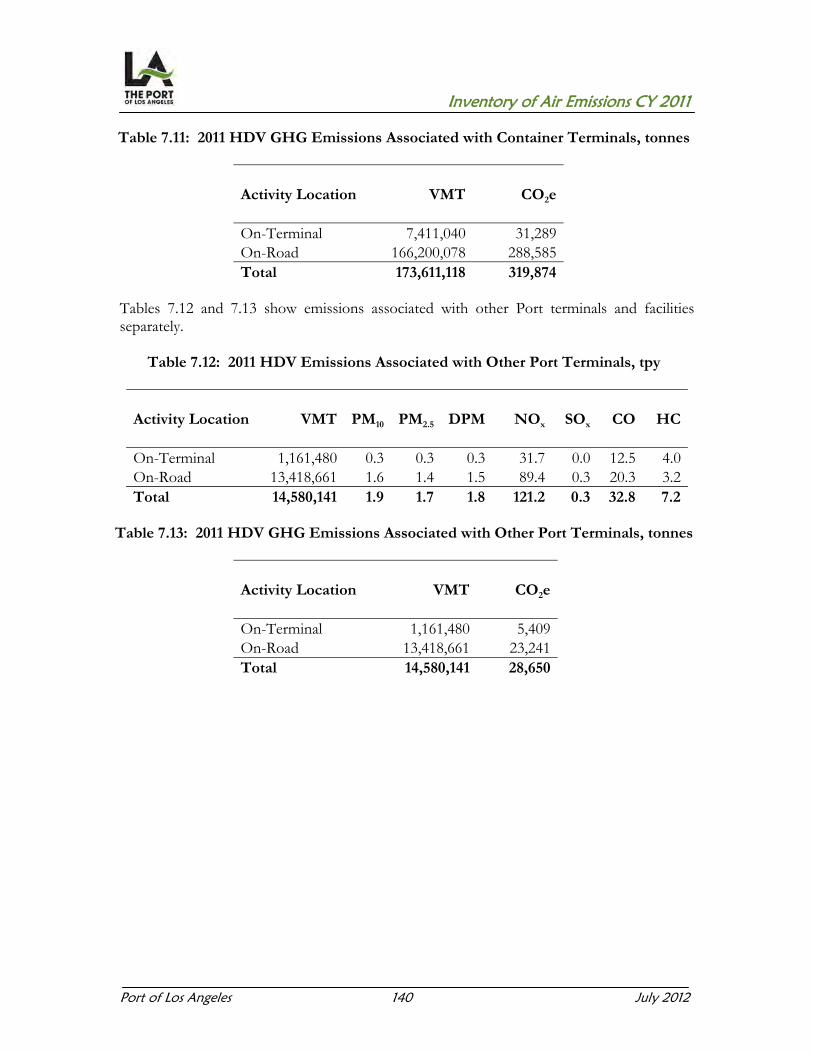
Inventory of Air Emissions CY 2011
Port of Los Angeles 140 July 2012
Table 7.11: 2011 HDV GHG Emissions Associated with Container Terminals, tonnes
Activity Location VMT CO2e On-Terminal 7,411,040 31,289On-Road 166,200,078 288,585Total 173,611,118 319,874
Tables 7.12 and 7.13 show emissions associated with other Port terminals and facilities separately.
Table 7.12: 2011 HDV Emissions Associated with Other Port Terminals, tpy
Activity Location VMT PM10 PM2.5 DPM NOx SOx CO HC
On-Terminal 1,161,480 0.3 0.3 0.3 31.7 0.0 12.5 4.0On-Road 13,418,661 1.6 1.4 1.5 89.4 0.3 20.3 3.2Total 14,580,141 1.9 1.7 1.8 121.2 0.3 32.8 7.2
Table 7.13: 2011 HDV GHG Emissions Associated with Other Port Terminals, tonnes
Activity Location VMT CO2e On-Terminal 1,161,480 5,409On-Road 13,418,661 23,241Total 14,580,141 28,650

Inventory of Air Emissions CY 2011
Port of Los Angeles 141 July 2012
SECTION 8 SUMMARY OF 2011 EMISSION RESULTS The emission results for the Port of Los Angeles 2011 Inventory of Air Emissions are presented in this section. Tables 8.1 and 8.2 summarize the 2011 total port-related emissions in the South Coast Air Basin by category. The individual values in each table column do not, in some cases, add up to the listed total in the tables. This is because there are fewer decimal places displayed (for readability) than are included in the calculated total.
Table 8.1: 2011 Port-related Emissions by Category, tpy
Category PM10 PM2.5 DPM NOx SOx CO HC
Ocean-going vessels 174 153 148 3,821 1,275 447 220Harbor craft 35 33 35 879 1 382 72Cargo handling equipment 25 23 23 831 2 664 69Locomotives 30 28 30 1,052 6 196 55Heavy-duty vehicles 23 21 22 1,406 4 348 66Total 287 258 258 7,989 1,287 2,037 482
DB ID457
The greenhouse gas emissions summarized in Table 8.2 are in metric tons per year (2,200 lbs/ton) instead of the short tons per year (2,000 lbs/ton) used throughout the report for criteria pollutants. The CO2e values are derived by multiplying the GHG emissions estimates by their respective GWP67 values (1 for CO2, 310 for N2O, 21 for CH4) and then adding them together.
Table 8.2: 2011 Port-related GHG Emissions by Category, tonnes
Category CO2e
Ocean-going vessels 231,941Harbor craft 51,901Cargo handling equipment 145,409Locomotives 69,505Heavy-duty vehicles 348,555Total 847,311
DB ID457
67 EPA, Inventory of U.S. Greenhouse Gas Emissions and Sinks: 1990-2010, April 2012.

Inventory of Air Emissions CY 2011
Port of Los Angeles 142 July 2012
Figure 8.1 shows the distribution of the 2011 total port-related emissions of each pollutant from each source category. OGV (57%), harbor craft (14%) and locomotives (12%) contributed the highest percentage of DPM emissions among the port-related sources. Approximately 99% of the SOx emissions were emitted from OGV. OGV (48%) and HDV (18%) accounted for the majority of NOx emissions. CHE (33%), ocean-going vessels (22%), harbor craft (19%) and HDV (17%) accounted for the majority of CO emissions. OGV (46%), harbor craft (15%) and CHE (14%) accounted for the majority of hydrocarbon emissions.
Figure 8.1: 2011 Port-related Emissions by Category
Tables 8.3 through 8.5 present DPM, NOx and SOx emissions in the context of port-wide and air basin-wide emissions by source category and subcategory. For example, Table 8.3 shows that containerships’ DPM emissions were 113 tons per year in 2011, representing 76% of the total OGV emissions (source category), 44% of the total port-related emissions, and 1% of all emissions in the SoCAB (based on SoCAB emissions reported in the 2007 Air Quality Management Plan). In 2011, the OGV source category as a whole contributed 148 tons of DPM representing 57% of the Port’s overall DPM emissions and 2% of SoCAB DPM emissions. The bottom of the table highlighted in grey shows that the Port’s total DPM emissions constituted approximately 3% of the SoCAB DPM emissions. The other two tables similarly present NOx and SOx emissions.

Inventory of Air Emissions CY 2011
Port of Los Angeles 143 July 2012
Table 8.3: 2011 DPM Emissions by Category and Percent Contribution, tpy
Percent DPM of Total Category Subcategory DPM Category Port SoCAB
AQMPOGV Auto carrier 3.0 2% 1% 0.0%OGV Bulk vessel 2.1 1% 1% 0.0%OGV Containership 113.0 76% 44% 1.4%OGV Cruise 15.0 10% 6% 0.2%OGV General cargo 4.0 3% 2% 0.1%OGV Ocean tugboat 0.9 1% 0% 0.0%OGV Miscellaneous 0.0 0% 0% 0.0%OGV Reefer 1.1 1% 0% 0.0%OGV Tanker 9.2 6% 4% 0.1%OGV Subtotal 148.0 100% 58% 1.8%Harbor Craft Assist tug 10.0 29% 4% 0.1%Harbor Craft Harbor tug 0.7 2% 0% 0.0%Harbor Craft Commercial fishing 4.9 14% 2% 0.1%Harbor Craft Ferry 5.2 15% 2% 0.1%Harbor Craft Ocean tugboat 4.2 12% 2% 0.1%Harbor Craft Government 1.3 4% 1% 0.0%Harbor Craft Excursion 4.7 13% 2% 0.1%Harbor Craft Crewboat 2.8 8% 1% 0.0%Harbor Craft Work boat 1.2 3% 0% 0.0%Harbor Craft Subtotal 35.0 100% 14% 0.5%CHE RTG crane 2.4 10% 1% 0.0%CHE Forklift 0.8 3% 0% 0.0%CHE Top handler, side pick 8.0 35% 3% 0.1%CHE Other 2.8 12% 1% 0.0%CHE Yard tractor 9.4 41% 4% 0.1%CHE Subtotal 23.0 102% 9% 0.2%Locomotives Switching 1.5 5% 1% 0.0%Locomotives Line haul 28.8 96% 11% 0.4%Locomotives Subtotal 30.0 101% 12% 0.4%HDV On-Terminal 1.9 9% 1% 0.0%HDV On-Road 19.7 91% 8% 0.3%HDV Subtotal 21.6 100% 9% 0.3%Port Total 258 100% 3%SoCAB AQMP Total 7,823
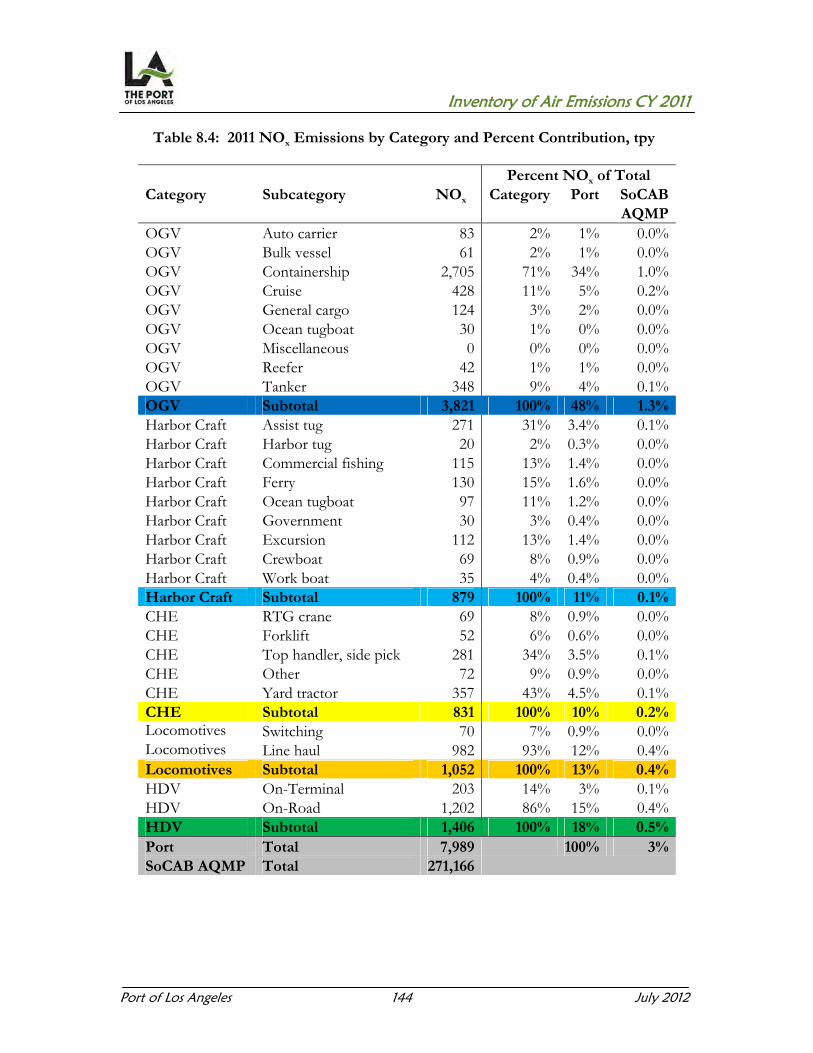
Inventory of Air Emissions CY 2011
Port of Los Angeles 144 July 2012
Table 8.4: 2011 NOx Emissions by Category and Percent Contribution, tpy
Percent NOx of Total Category Subcategory NOx Category Port SoCAB
AQMPOGV Auto carrier 83 2% 1% 0.0%OGV Bulk vessel 61 2% 1% 0.0%OGV Containership 2,705 71% 34% 1.0%OGV Cruise 428 11% 5% 0.2%OGV General cargo 124 3% 2% 0.0%OGV Ocean tugboat 30 1% 0% 0.0%OGV Miscellaneous 0 0% 0% 0.0%OGV Reefer 42 1% 1% 0.0%OGV Tanker 348 9% 4% 0.1%OGV Subtotal 3,821 100% 48% 1.3%Harbor Craft Assist tug 271 31% 3.4% 0.1%Harbor Craft Harbor tug 20 2% 0.3% 0.0%Harbor Craft Commercial fishing 115 13% 1.4% 0.0%Harbor Craft Ferry 130 15% 1.6% 0.0%Harbor Craft Ocean tugboat 97 11% 1.2% 0.0%Harbor Craft Government 30 3% 0.4% 0.0%Harbor Craft Excursion 112 13% 1.4% 0.0%Harbor Craft Crewboat 69 8% 0.9% 0.0%Harbor Craft Work boat 35 4% 0.4% 0.0%Harbor Craft Subtotal 879 100% 11% 0.1%CHE RTG crane 69 8% 0.9% 0.0%CHE Forklift 52 6% 0.6% 0.0%CHE Top handler, side pick 281 34% 3.5% 0.1%CHE Other 72 9% 0.9% 0.0%CHE Yard tractor 357 43% 4.5% 0.1%CHE Subtotal 831 100% 10% 0.2%Locomotives Switching 70 7% 0.9% 0.0%Locomotives Line haul 982 93% 12% 0.4%Locomotives Subtotal 1,052 100% 13% 0.4%HDV On-Terminal 203 14% 3% 0.1%HDV On-Road 1,202 86% 15% 0.4%HDV Subtotal 1,406 100% 18% 0.5%Port Total 7,989 100% 3%SoCAB AQMP Total 271,166

Inventory of Air Emissions CY 2011
Port of Los Angeles 145 July 2012
Table 8.5: 2011 SOx Emissions by Category and Percent Contribution, tpy
Percent SOx of Total Category Subcategory SOx Category Port SoCAB
AQMPOGV Auto carrier 22.0 2% 2% 0%OGV Bulk vessel 17.0 1% 1% 0%OGV Containership 810.0 64% 63% 6%OGV Cruise 98.0 8% 8% 1%OGV General cargo 29.0 2% 2% 0%OGV Ocean tugboat 5.0 0% 0% 0%OGV Miscellaneous 0.1 0% 0% 0%OGV Reefer 8.0 1% 1% 0%OGV Tanker 285.0 22% 22% 2%OGV Subtotal 1,274.0 100% 99% 9%Harbor Craft Assist tug 0.2 34% 0% 0%Harbor Craft Harbor tug 0.0 3% 0% 0%Harbor Craft Commercial fishing 0.0 7% 0% 0%Harbor Craft Ferry 0.1 19% 0% 0%Harbor Craft Ocean tugboat 0.1 10% 0% 0%Harbor Craft Government 0.0 3% 0% 0%Harbor Craft Excursion 0.1 12% 0% 0%Harbor Craft Crewboat 0.1 9% 0% 0%Harbor Craft Work boat 0.0 3% 0% 0%Harbor Craft Subtotal 0.6 100% 0% 0%CHE RTG crane 0.1 6% 0% 0%CHE Forklift 0.0 1% 0% 0%CHE Top handler, side pick 0.4 25% 0% 0%CHE Other 0.1 6% 0% 0%CHE Yard tractor 1.0 61% 0% 0%CHE Subtotal 1.6 100% 0% 0%Locomotives Switching 0.1 2% 0% 0%Locomotives Line haul 5.8 98% 0% 0%Locomotives Subtotal 5.9 100% 0% 0%HDV On-Terminal 0.2 6% 0% 0%HDV On-Road 3.4 94% 0% 0%HDV Subtotal 3.6 100% 0% 0%Port Total 1,287 100% 9%SoCAB AQMP Total 14,604

Inventory of Air Emissions CY 2011
Port of Los Angeles 146 July 2012
In order to put the port-related emissions into context, the following figures and tables compare the Port’s contributions to the total emissions in the South Coast Air Basin by major emission source category. The 2011 SoCAB emissions are based on 2007 AQMP Appendix III.68 For 2011 DPM SoCAB emissions, the values were interpolated between 2010 and 2012 estimates provided by SCAQMD staff. Due to rounding, the percentages may not add up to 100%.
Figure 8.2: 2011 PM10 Emissions in the South Coast Air Basin
Figure 8.3: 2011 PM2.5 Emissions in the South Coast Air Basin
68 SCAQMD, Final 2007 AQMP Appendix III, Base & Future Year Emissions Inventories, June 2007.
Stationary & Area
84.5%
On-Road 8.6%
Other Mobile <6.7%
Port of Los Angeles<0.3%
Stationary & Area
65.8%
On-Road 17.0%
Other Mobile <16.6%
Port of Los Angeles<0.7%
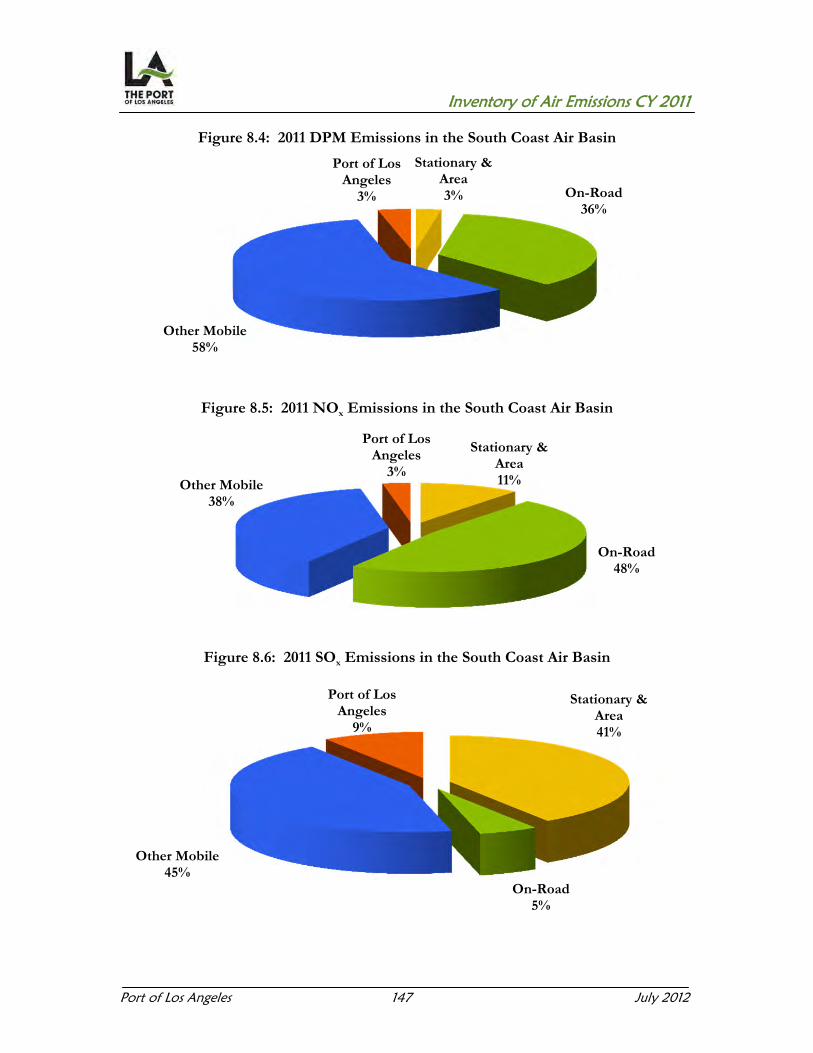
Inventory of Air Emissions CY 2011
Port of Los Angeles 147 July 2012
Figure 8.4: 2011 DPM Emissions in the South Coast Air Basin
Figure 8.5: 2011 NOx Emissions in the South Coast Air Basin
Figure 8.6: 2011 SOx Emissions in the South Coast Air Basin
Stationary & Area3% On-Road
36%
Other Mobile 58%
Port of Los Angeles
3%
Stationary & Area11%
On-Road 48%
Other Mobile 38%
Port of Los Angeles
3%
Stationary & Area41%
On-Road 5%
Other Mobile 45%
Port of Los Angeles
9%
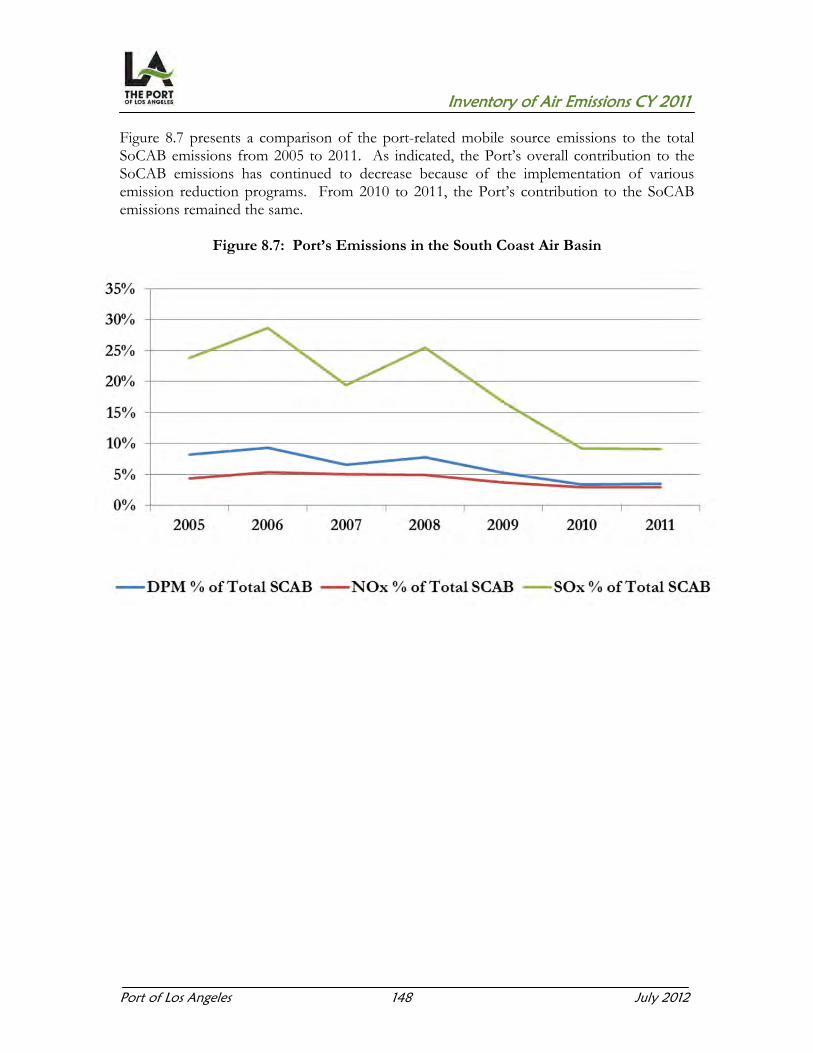
Inventory of Air Emissions CY 2011
Port of Los Angeles 148 July 2012
Figure 8.7 presents a comparison of the port-related mobile source emissions to the total SoCAB emissions from 2005 to 2011. As indicated, the Port’s overall contribution to the SoCAB emissions has continued to decrease because of the implementation of various emission reduction programs. From 2010 to 2011, the Port’s contribution to the SoCAB emissions remained the same.
Figure 8.7: Port’s Emissions in the South Coast Air Basin

Inventory of Air Emissions CY 2011
Port of Los Angeles 149 July 2012
SECTION 9 COMPARISON OF 2011 AND PREVIOUS YEARS’ FINDINGS AND EMISSION
ESTIMATES This section compares emissions during the 2011, 2010, 2009, 2008, 2007, 2006, and 2005 calendar years, overall and for each emission source category. Emission source categories are addressed in separate subsections, containing the emissions comparisons in table and chart formats, which explain the findings and differences in emissions. The tables and charts in this section also summarize the percent change from the previous year (2011-2010) and for the CAAP Progress (2011-2005) using the current methodology for emissions comparison. Calendar year 2005 is considered the baseline year for CAAP for which CAAP progress is tracked. 9.1 2011 Comparisons In preparing the comparisons, the first step is to account for changes in methodology between the current year and any of the previous years. To provide a valid basis for comparison, when methodological changes have been implemented for a source category the previous years’ emissions are recalculated using the new methodology and the previous years' activity data. If there have been no changes in methodology, then the emissions estimated for the prior years’ inventories are used in the comparison. Because of the Port’s process of continual review and improvement of the inventories, the previous years’ emissions presented in this comparison may not exactly match those published in the inventory report for the prior year(s). Methodological differences between 2011 and 2010 Inventory of Air Emissions The methodologies used for developing the 2011 inventory changed from prior year inventories for ocean-going vessels, cargo handling equipment and heavy-duty vehicles, so the prior years’ emissions have been recalculated to reflect the updated methodologies. Sections 9.1.1 through 9.1.5 present the source category comparisons across years (2005 to 2011). Port-wide Overview of Activity and Emissions Changes Table 9.1 presents the number of vessel calls and the container cargo throughputs for calendar years 2005 through 2011. The average number of TEUs per containership call was at its highest for 2010 and 2011 calendar years, which means that, on average, more containers were handled per vessel call in 2010 and 2011 than in the previous years. Comparing 2011 to the previous year, TEU throughput and TEUs/containership-call efficiency remained essentially the same with 1% increase for TEUs and 2% increase in calls. Compared to 2005, in 2011 the number of TEUs increased by 6% and containership calls decreased by 7% while the TEUs/containership-call efficiency improved by 14%.

Inventory of Air Emissions CY 2011
Port of Los Angeles 150 July 2012
Table 9.1: Container and Cargo Throughputs Change, Calls, and TEUs
All Containership AverageYear Calls Calls Throughput TEUs/Call
(TEUs) 2011 2,072 1,376 7,940,511 5,7712010 2,035 1,355 7,831,902 5,7802009 2,010 1,355 6,748,995 4,9812008 2,239 1,459 7,849,985 5,3802007 2,527 1,573 8,355,038 5,3122006 2,703 1,627 8,469,853 5,2062005 2,501 1,481 7,484,625 5,054Previous Year (2010-2011) 2% 2% 1% 0%CAAP Progress (2005-2011) -17% -7% 6% 14%
Table 9.2 presents a comparison of OGV containership calls from 2005 to 2011; this comparison highlights the general trend toward larger vessels.
Table 9.2: OGV Container Vessel Calls Count by Container Vessel Category
Category 2011 2010 2009 2008 2007 2006 2005
Container - 1000 78 116 115 176 237 218 202Container - 2000 192 191 165 96 104 149 184Container - 3000 6 28 89 142 127 201 296Container - 4000 318 302 295 368 537 515 398Container - 5000 312 322 359 341 328 289 215Container - 6000 263 149 138 199 160 181 131Container - 7000 5 91 106 99 80 78 52Container - 8000 147 145 78 30 4 1 0Container - 9000 55 11 10 8 0 0 0
DB ID693
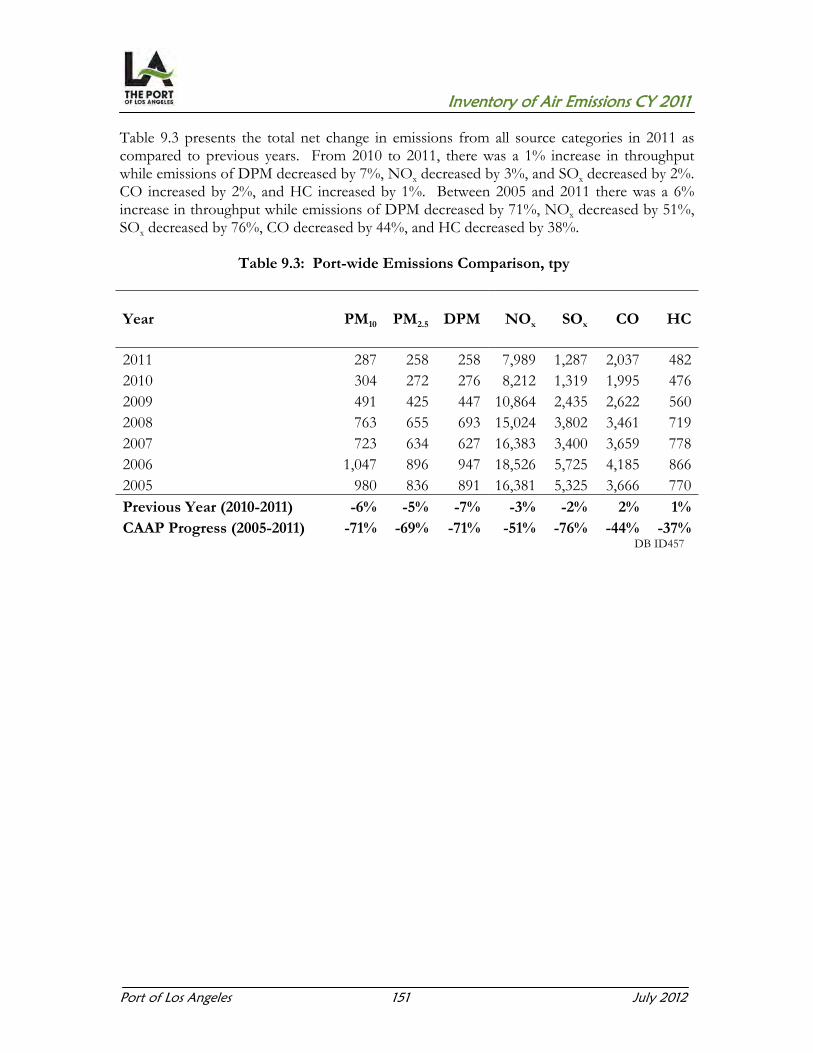
Inventory of Air Emissions CY 2011
Port of Los Angeles 151 July 2012
Table 9.3 presents the total net change in emissions from all source categories in 2011 as compared to previous years. From 2010 to 2011, there was a 1% increase in throughput while emissions of DPM decreased by 7%, NOx decreased by 3%, and SOx decreased by 2%. CO increased by 2%, and HC increased by 1%. Between 2005 and 2011 there was a 6% increase in throughput while emissions of DPM decreased by 71%, NOx decreased by 51%, SOx decreased by 76%, CO decreased by 44%, and HC decreased by 38%.
Table 9.3: Port-wide Emissions Comparison, tpy
Year PM10 PM2.5 DPM NOx SOx CO HC
2011 287 258 258 7,989 1,287 2,037 4822010 304 272 276 8,212 1,319 1,995 4762009 491 425 447 10,864 2,435 2,622 5602008 763 655 693 15,024 3,802 3,461 7192007 723 634 627 16,383 3,400 3,659 7782006 1,047 896 947 18,526 5,725 4,185 8662005 980 836 891 16,381 5,325 3,666 770Previous Year (2010-2011) -6% -5% -7% -3% -2% 2% 1%CAAP Progress (2005-2011) -71% -69% -71% -51% -76% -44% -37%
DB ID457
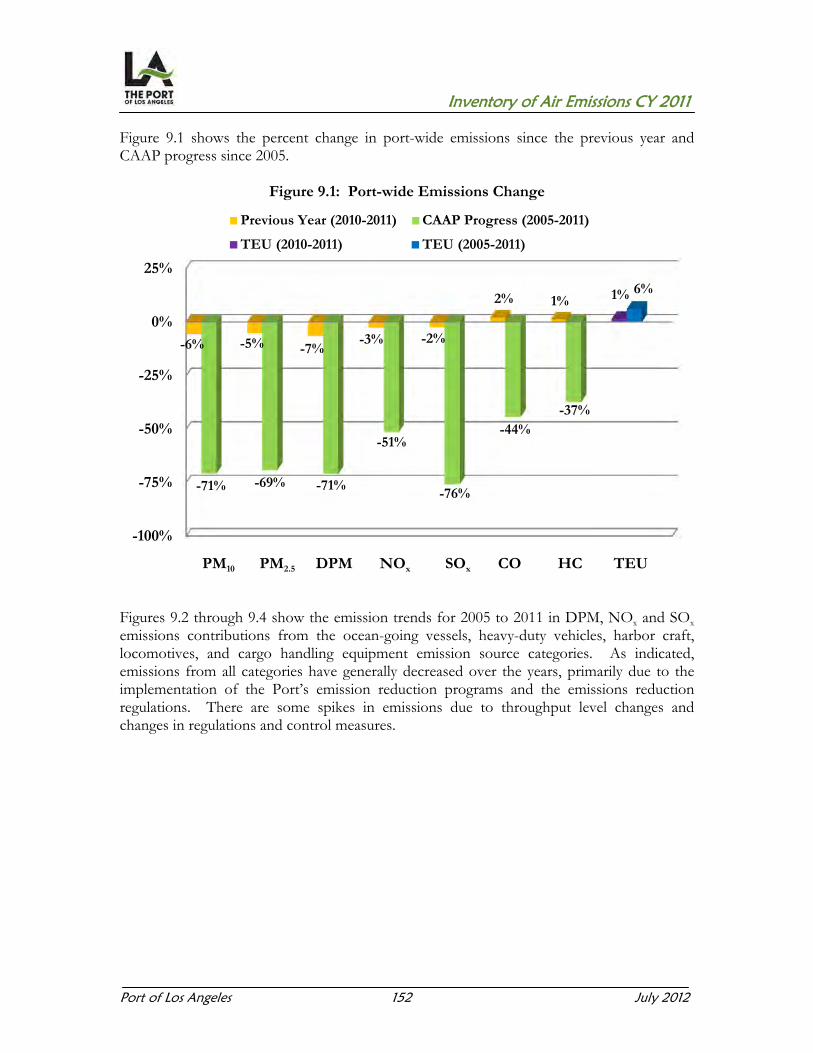
Inventory of Air Emissions CY 2011
Port of Los Angeles 152 July 2012
Figure 9.1 shows the percent change in port-wide emissions since the previous year and CAAP progress since 2005.
Figure 9.1: Port-wide Emissions Change
PM10 PM2.5 DPM NOx SOx CO HC TEU
Figures 9.2 through 9.4 show the emission trends for 2005 to 2011 in DPM, NOx and SOx emissions contributions from the ocean-going vessels, heavy-duty vehicles, harbor craft, locomotives, and cargo handling equipment emission source categories. As indicated, emissions from all categories have generally decreased over the years, primarily due to the implementation of the Port’s emission reduction programs and the emissions reduction regulations. There are some spikes in emissions due to throughput level changes and changes in regulations and control measures.
-100%
-75%
-50%
-25%
0%
25%
-6% -5% -7%-3% -2%
2% 1% 1%
-71% -69% -71%
-51%
-76%
-44%-37%
6%
Previous Year (2010-2011) CAAP Progress (2005-2011)
TEU (2010-2011) TEU (2005-2011)
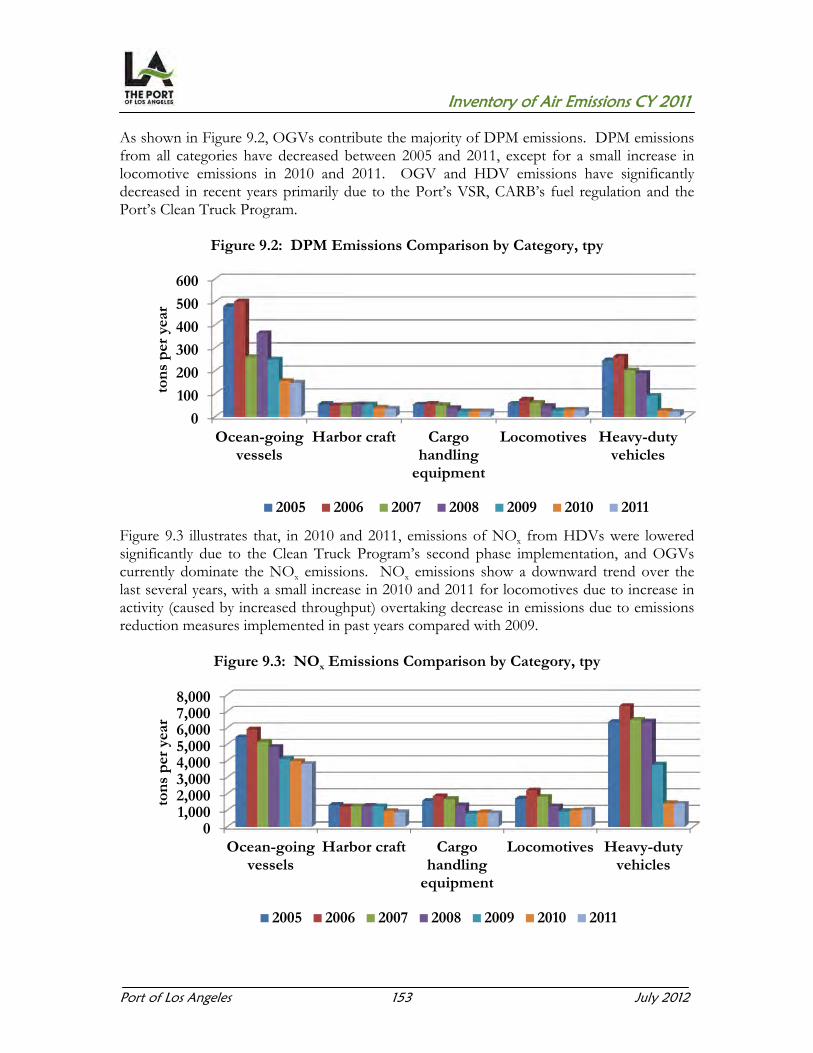
Inventory of Air Emissions CY 2011
Port of Los Angeles 153 July 2012
As shown in Figure 9.2, OGVs contribute the majority of DPM emissions. DPM emissions from all categories have decreased between 2005 and 2011, except for a small increase in locomotive emissions in 2010 and 2011. OGV and HDV emissions have significantly decreased in recent years primarily due to the Port’s VSR, CARB’s fuel regulation and the Port’s Clean Truck Program.
Figure 9.2: DPM Emissions Comparison by Category, tpy
Figure 9.3 illustrates that, in 2010 and 2011, emissions of NOx from HDVs were lowered significantly due to the Clean Truck Program’s second phase implementation, and OGVs currently dominate the NOx emissions. NOx emissions show a downward trend over the last several years, with a small increase in 2010 and 2011 for locomotives due to increase in activity (caused by increased throughput) overtaking decrease in emissions due to emissions reduction measures implemented in past years compared with 2009.
Figure 9.3: NOx Emissions Comparison by Category, tpy
0
100
200
300
400
500
600
Ocean-goingvessels
Harbor craft Cargohandling
equipment
Locomotives Heavy-dutyvehicles
ton
s p
er y
ear
2005 2006 2007 2008 2009 2010 2011
01,0002,0003,0004,0005,0006,0007,0008,000
Ocean-goingvessels
Harbor craft Cargohandling
equipment
Locomotives Heavy-dutyvehicles
ton
s p
er y
ear
2005 2006 2007 2008 2009 2010 2011
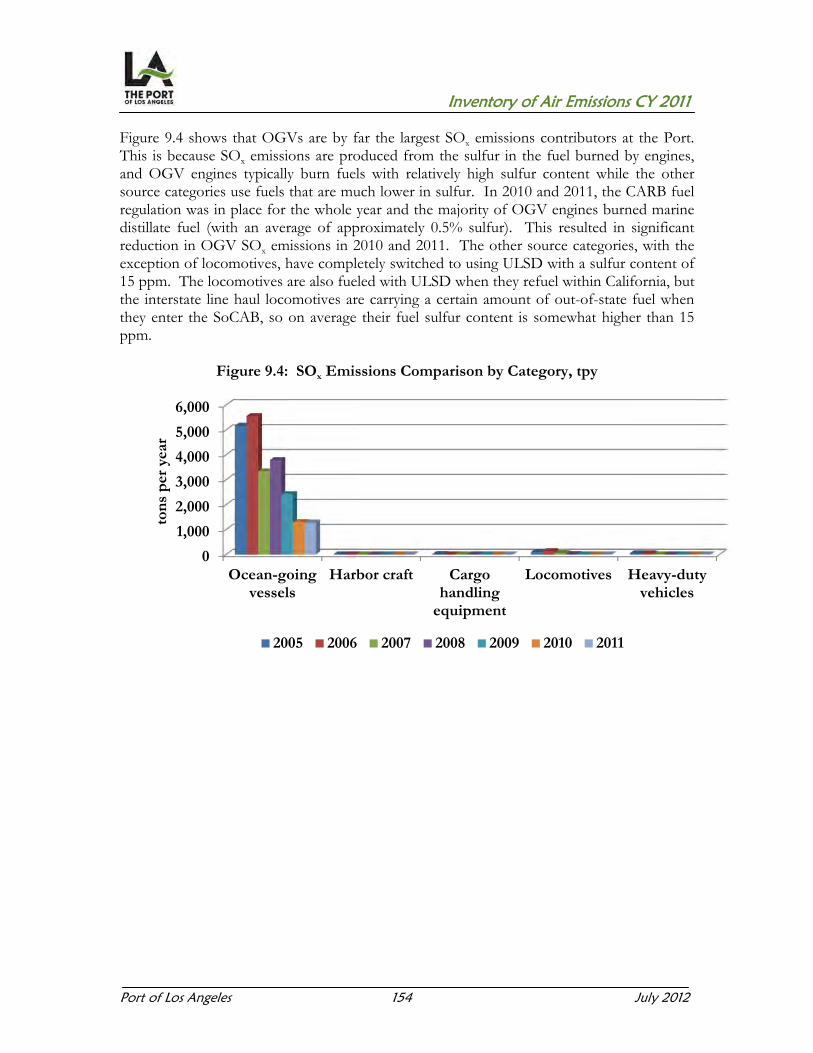
Inventory of Air Emissions CY 2011
Port of Los Angeles 154 July 2012
Figure 9.4 shows that OGVs are by far the largest SOx emissions contributors at the Port. This is because SOx emissions are produced from the sulfur in the fuel burned by engines, and OGV engines typically burn fuels with relatively high sulfur content while the other source categories use fuels that are much lower in sulfur. In 2010 and 2011, the CARB fuel regulation was in place for the whole year and the majority of OGV engines burned marine distillate fuel (with an average of approximately 0.5% sulfur). This resulted in significant reduction in OGV SOx emissions in 2010 and 2011. The other source categories, with the exception of locomotives, have completely switched to using ULSD with a sulfur content of 15 ppm. The locomotives are also fueled with ULSD when they refuel within California, but the interstate line haul locomotives are carrying a certain amount of out-of-state fuel when they enter the SoCAB, so on average their fuel sulfur content is somewhat higher than 15 ppm.
Figure 9.4: SOx Emissions Comparison by Category, tpy
0
1,000
2,000
3,000
4,000
5,000
6,000
Ocean-goingvessels
Harbor craft Cargohandling
equipment
Locomotives Heavy-dutyvehicles
ton
s p
er y
ear
2005 2006 2007 2008 2009 2010 2011

Inventory of Air Emissions CY 2011
Port of Los Angeles 155 July 2012
Table 9.4 compares the 2011 port-wide GHG emissions to the previous years. GHG emissions decreased as compared to 2005, mainly due to better efficiency, CAAP and regulatory measures that have GHG emission reduction co-benefits. As compared to the previous year, GHG emissions decreased 1%.
Table 9.4: Port-wide GHG Emissions Comparison, tonnes
Year CO2e
2011 847,3112010 853,6662009 894,3162008 1,025,1972007 1,095,6802006 1,224,6492005 1,046,434Previous Year (2010-2011) -1%CAAP Progress (2005-2011) -19%
DB ID457
Table 9.5 and Figure 9.5 compare emissions efficiency changes between 2005 and 2011, and show that the efficiency, measured as emissions per 10,000 TEUs, continues to improve over the years. A positive percent change for the emissions efficiency comparison means an improvement in efficiency.
Table 9.5: Port-wide Emissions Efficiency Metric, tons/10,000 TEUs
Year PM10 PM2.5 DPM NOx SOx CO HC
2011 0.36 0.32 0.32 10.06 1.62 2.57 0.612010 0.39 0.35 0.35 10.49 1.68 2.55 0.612009 0.73 0.63 0.66 16.10 3.61 3.89 0.832008 0.97 0.83 0.88 19.14 4.84 4.41 0.922007 0.86 0.76 0.75 19.60 4.07 4.38 0.932006 1.24 1.06 1.12 21.87 6.76 4.94 1.022005 1.31 1.12 1.19 21.89 7.11 4.90 1.03Previous Year (2010-2011) 8% 9% 9% 4% 4% -1% 0%CAAP Progress (2005-2011) 73% 71% 73% 54% 77% 48% 41%
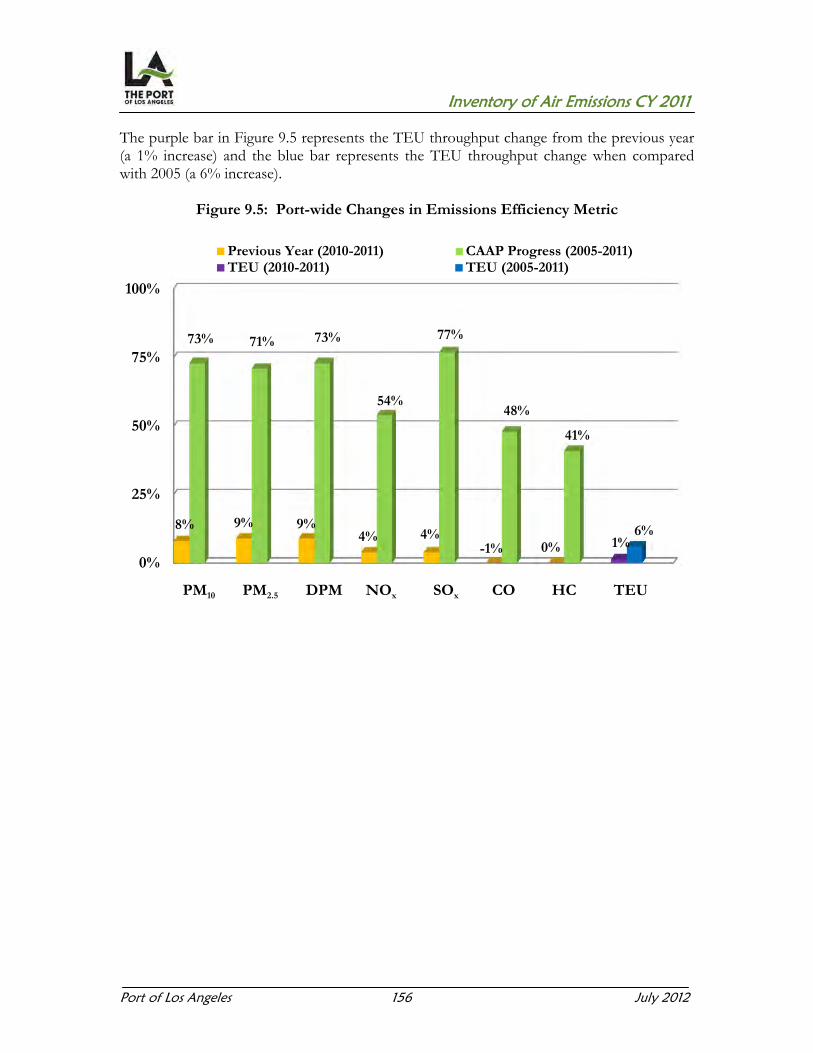
Inventory of Air Emissions CY 2011
Port of Los Angeles 156 July 2012
The purple bar in Figure 9.5 represents the TEU throughput change from the previous year (a 1% increase) and the blue bar represents the TEU throughput change when compared with 2005 (a 6% increase).
Figure 9.5: Port-wide Changes in Emissions Efficiency Metric
PM10 PM2.5 DPM NOx SOx CO HC TEU
0%
25%
50%
75%
100%
8% 9% 9%4% 4%
-1% 0% 1%
73% 71% 73%
54%
77%
48%
41%
6%
Previous Year (2010-2011) CAAP Progress (2005-2011)TEU (2010-2011) TEU (2005-2011)
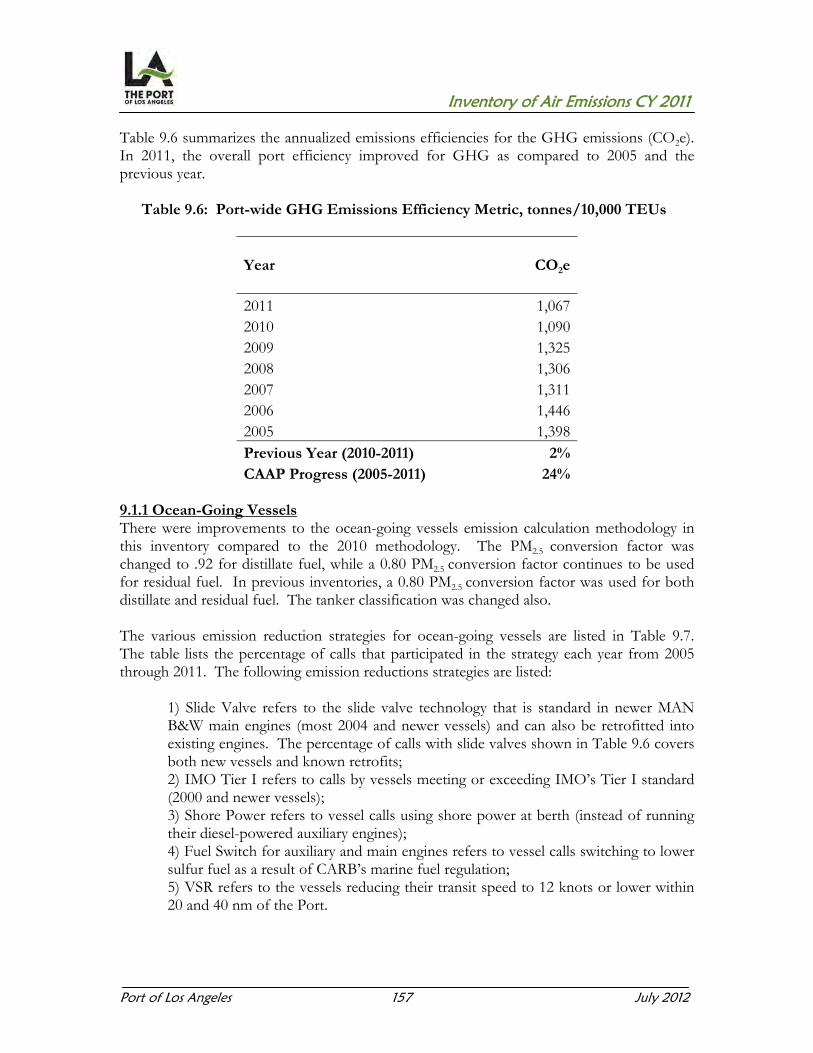
Inventory of Air Emissions CY 2011
Port of Los Angeles 157 July 2012
Table 9.6 summarizes the annualized emissions efficiencies for the GHG emissions (CO2e). In 2011, the overall port efficiency improved for GHG as compared to 2005 and the previous year.
Table 9.6: Port-wide GHG Emissions Efficiency Metric, tonnes/10,000 TEUs
Year CO2e
2011 1,0672010 1,0902009 1,3252008 1,3062007 1,3112006 1,4462005 1,398Previous Year (2010-2011) 2%CAAP Progress (2005-2011) 24%
9.1.1 Ocean-Going Vessels There were improvements to the ocean-going vessels emission calculation methodology in this inventory compared to the 2010 methodology. The PM2.5 conversion factor was changed to .92 for distillate fuel, while a 0.80 PM2.5 conversion factor continues to be used for residual fuel. In previous inventories, a 0.80 PM2.5 conversion factor was used for both distillate and residual fuel. The tanker classification was changed also. The various emission reduction strategies for ocean-going vessels are listed in Table 9.7. The table lists the percentage of calls that participated in the strategy each year from 2005 through 2011. The following emission reductions strategies are listed:
1) Slide Valve refers to the slide valve technology that is standard in newer MAN B&W main engines (most 2004 and newer vessels) and can also be retrofitted into existing engines. The percentage of calls with slide valves shown in Table 9.6 covers both new vessels and known retrofits; 2) IMO Tier I refers to calls by vessels meeting or exceeding IMO’s Tier I standard (2000 and newer vessels); 3) Shore Power refers to vessel calls using shore power at berth (instead of running their diesel-powered auxiliary engines); 4) Fuel Switch for auxiliary and main engines refers to vessel calls switching to lower sulfur fuel as a result of CARB’s marine fuel regulation; 5) VSR refers to the vessels reducing their transit speed to 12 knots or lower within 20 and 40 nm of the Port.

Inventory of Air Emissions CY 2011
Port of Los Angeles 158 July 2012
Table 9.7: OGV Emission Reduction Strategies
Year Slide IMO Shore Fuel Switch Fuel Switch VSR VSRValve Tier I Power Main Eng Aux Eng 20 nm 40 nm
2011 33% 66% 4% 100% 100% 92% 70%2010 31% 66% 3% 100% 100% 91% 63%2009 27% 60% 3% 78% 78% 90% 48%2008 23% 48% 2% 38% 63% 90% 42%2007 22% 48% 3% 24% 100% 85% na2006 17% 46% 2% 13% 33% 73% na2005 11% 34% 2% 7% 27% 65% na
DB ID882
Beginning July 1, 2009, CARB’s OGV Fuel Regulation, adopted in July 2008, required vessel operators to use MGO with a sulfur content less than 1.5% by weight or MDO with a sulfur content equal to or less than 0.5% by weight within 24 nm from the California coast (and while at berth) in their diesel powered propulsion engines, auxiliary engines and auxiliary boilers. During this period, an average 0.5% sulfur fuel content is assumed for both main and auxiliary engines and auxiliary boilers. For the 2011 calendar year, 100% compliance with CARB’s regulation is assumed, with the exception of the auxiliary boiler exemptions discussed in the OGV section. Table 9.7 shows % of calls where the fuel was switched from residual fuel to low sulfur fuel associated with vessel operators’ voluntary actions, CARB auxiliary engine fuel regulation (2010 and 2011), and the Port’s Fuel Incentive Program prior to CARB fuel regulation (2005-2009).

Inventory of Air Emissions CY 2011
Port of Los Angeles 159 July 2012
For 2011, the fuel switch compliance is for vessels that transit within the 24 nm CARB fuel regulation boundary. Prior to the regulation, the North route was the predominant route for trade with Asia and points north of San Pedro Bay. Since the regulation became effective, the West route (west of the Channel Islands) has become the predominant shipping route for ships trading with Asia and points north of San Pedro Bay, presumably to avoid the CARB OGV Fuel Regulation compliance zone. This shift in route selection, highlighted Table 9.8, impacted the SOx and DPM emissions for 2010 and 2011.
Table 9.8: Annual Route Distribution
Route 2008 2009 2010 2011
North 62% 45% 10% 7% West 6% 23% 58% 61% South 31% 31% 31% 31% East 1% 1% 1% 1%
Table 9.9 presents the engine activity in terms of total kW-hrs from 2005 to 2011. In 2011, the total engine activity decreased by 2% compared to 2010 and decreased by 24% compared to 2005.
Table 9.9: OGV Power Comparison, kW-hr
Year All Engines Main Eng Aux Eng BoilerTotal kW-hr Total kW-hr Total kW-hr Total kW-hr
2011 310,234,086 88,707,406 141,850,452 79,676,2282010 316,551,879 94,088,465 147,270,032 75,193,3822009 314,062,580 100,148,756 142,221,642 71,692,1822008 353,673,002 106,069,925 173,205,222 74,397,8552007 409,935,476 102,508,564 202,691,675 104,735,2372006 451,528,154 118,197,606 224,580,902 108,749,6462005 406,262,898 115,822,730 194,529,345 95,910,823Previous Year (2010-2011) -2% -6% -4% 6%CAAP Progress (2005-2011) -24% -23% -27% -17%

Inventory of Air Emissions CY 2011
Port of Los Angeles 160 July 2012
Table 9.10 compares the OGV emissions for calendar years 2005 through 2011 in tons per year and as a percent change in 2011 compared to 2010 and 2005. Table 9.11 compares the 2011 OGV GHG emissions to the previous years.
Table 9.10: OGV Emissions Comparison, tpy
Year PM10 PM2.5 DPM NOx SOx CO HC
2011 174 153 148 3,821 1,275 447 2202010 180 158 156 3,978 1,306 449 2182009 292 242 249 4,108 2,422 440 2112008 433 351 364 4,848 3,786 486 2272007 356 295 261 5,156 3,337 526 2432006 602 485 503 5,910 5,556 566 2552005 569 457 481 5,429 5,170 501 225Previous Year (2010-2011) -3% -3% -5% -4% -2% 0% 1%CAAP Progress (2005-2011) -69% -67% -69% -30% -75% -11% -2%
DB ID692
OGV emissions of all pollutants decreased in 2011 compared to 2005. Reductions in OGV emissions are mainly attributed to the Port’s VSR program (all pollutants) and CARB marine fuel regulation (PM, NOx and SOx) which became effective July 2009 and was enforced throughout all of 2010 and 2011. For previous year comparison, emissions for PM, NOx and SOx decreased slightly, while CO and HC emissions remained almost the same. Table 9.11 compares the 2011 OGV GHG emissions to the previous years.
Table 9.11: OGV GHG Emissions Comparison, tonnes
Year CO2e
2011 231,9412010 234,8012009 232,4192008 261,0912007 306,4782006 338,1512005 301,858Previous Year (2010-2011) -1%CAAP Progress (2005-2011) -23%
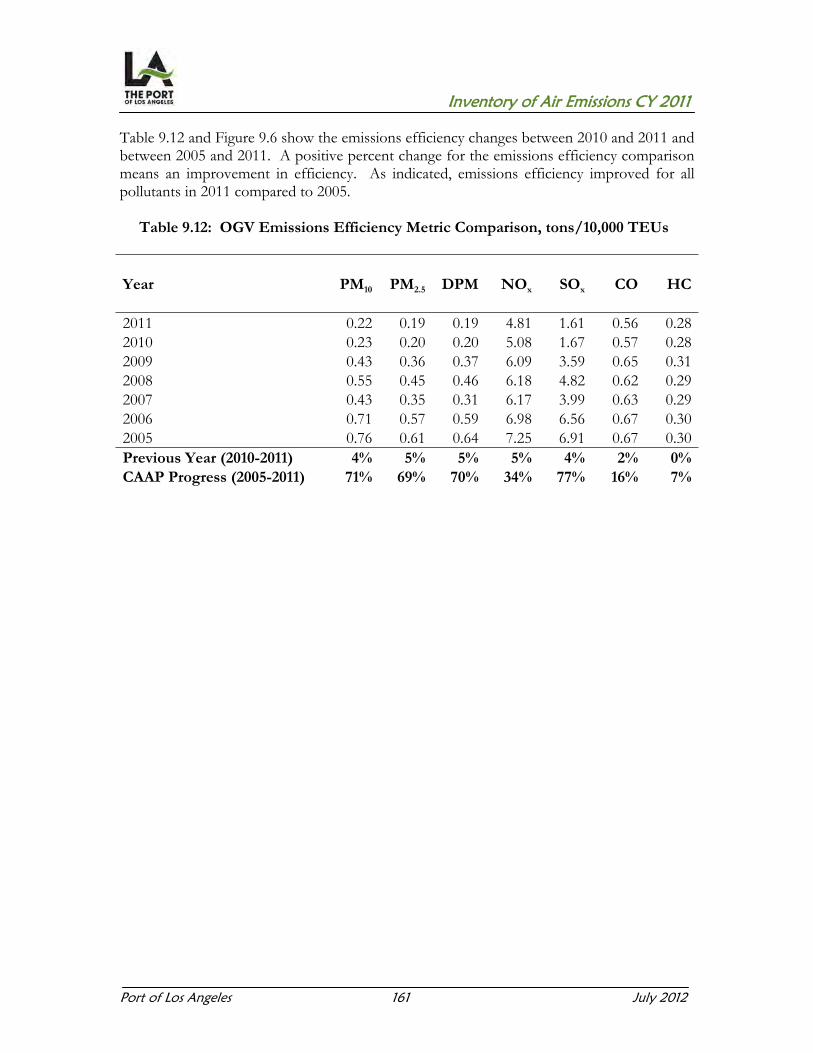
Inventory of Air Emissions CY 2011
Port of Los Angeles 161 July 2012
Table 9.12 and Figure 9.6 show the emissions efficiency changes between 2010 and 2011 and between 2005 and 2011. A positive percent change for the emissions efficiency comparison means an improvement in efficiency. As indicated, emissions efficiency improved for all pollutants in 2011 compared to 2005.
Table 9.12: OGV Emissions Efficiency Metric Comparison, tons/10,000 TEUs
Year PM10 PM2.5 DPM NOx SOx CO HC
2011 0.22 0.19 0.19 4.81 1.61 0.56 0.282010 0.23 0.20 0.20 5.08 1.67 0.57 0.282009 0.43 0.36 0.37 6.09 3.59 0.65 0.312008 0.55 0.45 0.46 6.18 4.82 0.62 0.292007 0.43 0.35 0.31 6.17 3.99 0.63 0.292006 0.71 0.57 0.59 6.98 6.56 0.67 0.302005 0.76 0.61 0.64 7.25 6.91 0.67 0.30Previous Year (2010-2011) 4% 5% 5% 5% 4% 2% 0%CAAP Progress (2005-2011) 71% 69% 70% 34% 77% 16% 7%

Inventory of Air Emissions CY 2011
Port of Los Angeles 162 July 2012
The purple bar in Figure 9.6 represents the TEU throughput change from the previous year (a 1% increase) and the blue bar represents the TEU throughput change when compared to 2005 (a 6% increase).
Figure 9.6: OGV Emissions Efficiency Metric Change
PM10 PM2.5 DPM NOx SOx CO HC TEU
9.1.2 Harbor Craft The methodology used to estimate harbor craft emissions for the 2011 Inventory of Air Emissions did not change from the methodology used in the 2010 inventory.
0%
25%
50%
75%
100%
4% 5% 5% 5% 4% 2% 0% 1%
71%69% 70%
34%
77%
16%
7% 6%
Previous Year (2010-2011) CAAP Progress (2005-2011)TEU (2010-2011) TEU (2005-2011)
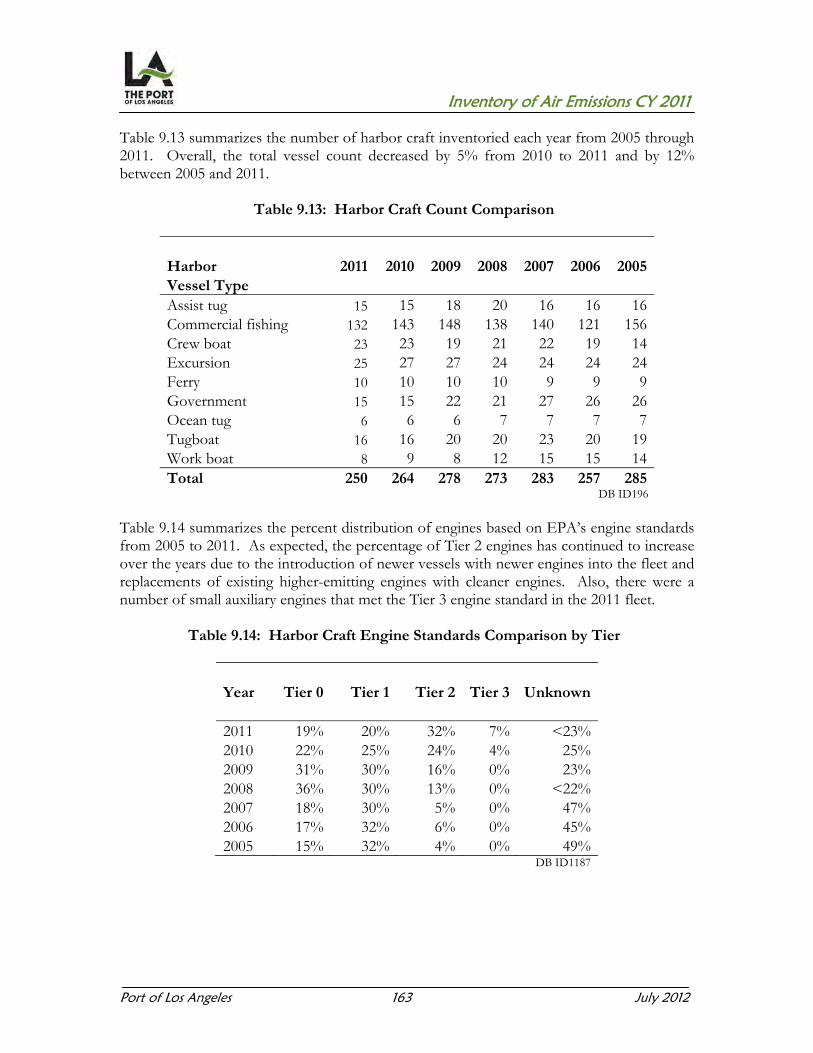
Inventory of Air Emissions CY 2011
Port of Los Angeles 163 July 2012
Table 9.13 summarizes the number of harbor craft inventoried each year from 2005 through 2011. Overall, the total vessel count decreased by 5% from 2010 to 2011 and by 12% between 2005 and 2011.
Table 9.13: Harbor Craft Count Comparison
Harbor 2011 2010 2009 2008 2007 2006 2005 Vessel Type Assist tug 15 15 18 20 16 16 16 Commercial fishing 132 143 148 138 140 121 156 Crew boat 23 23 19 21 22 19 14 Excursion 25 27 27 24 24 24 24 Ferry 10 10 10 10 9 9 9 Government 15 15 22 21 27 26 26 Ocean tug 6 6 6 7 7 7 7 Tugboat 16 16 20 20 23 20 19 Work boat 8 9 8 12 15 15 14 Total 250 264 278 273 283 257 285
DB ID196
Table 9.14 summarizes the percent distribution of engines based on EPA’s engine standards from 2005 to 2011. As expected, the percentage of Tier 2 engines has continued to increase over the years due to the introduction of newer vessels with newer engines into the fleet and replacements of existing higher-emitting engines with cleaner engines. Also, there were a number of small auxiliary engines that met the Tier 3 engine standard in the 2011 fleet.
Table 9.14: Harbor Craft Engine Standards Comparison by Tier
Year Tier 0 Tier 1 Tier 2 Tier 3 Unknown
2011 19% 20% 32% 7% <23% 2010 22% 25% 24% 4% 25% 2009 31% 30% 16% 0% 23% 2008 36% 30% 13% 0% <22% 2007 18% 30% 5% 0% 47% 2006 17% 32% 6% 0% 45% 2005 15% 32% 4% 0% 49%
DB ID1187
Inventory of Air Emissions CY 2011
Port of Los Angeles 164 July 2012
For this comparison, the Tier 1, 2 and 3 categorization of engines for the Port’s harbor craft inventory is based on EPA’s emission standards for marine engines69. Tier 0 engines are unregulated engines built prior to promulgation of the EPA emission standards. The following shows the criteria used to classify engines by EPA’s emission standards. Tier 0: 1999 and older model year engines Tier 1: Model years 2000 to 2003 for engines with less than or equal to 750 hp;
model years 2000 to 2006 for engines with greater than 750 hp Tier 2: Model years 2004+ for engines with less than or equal to 750 hp; model
years 2007+ for engines greater than 750 hp, with the exception for those that meet the Tier 3 criteria
Tier 3: Model years 2009+ for small engines with 25 to 120 hp rating or <0.9 liter engine displacement
“Unknown”: Engines with missing model year, horsepower or both
Several of the engine replacements occurred prior to 2005 under the Carl Moyer Program and Port-funded projects to reduce emissions in the harbor, replacing Tier 0 engines with Tier 1 or 2 engines. Since 2008, a steady increase in Tier 2 engines as shown in Table 9.13 is due to engine replacements in recent past. In 2011, there was an increase in vessel repowers as vessel owners complied with CARB’s Harbor Craft Regulation as well as availability of grant funding from EPA and CARB.
69 Code of Federal Regulation, 40 CFR, subpart 94.8 for Tier 1 and 2 and subpart 1042.101 for Tier 3.
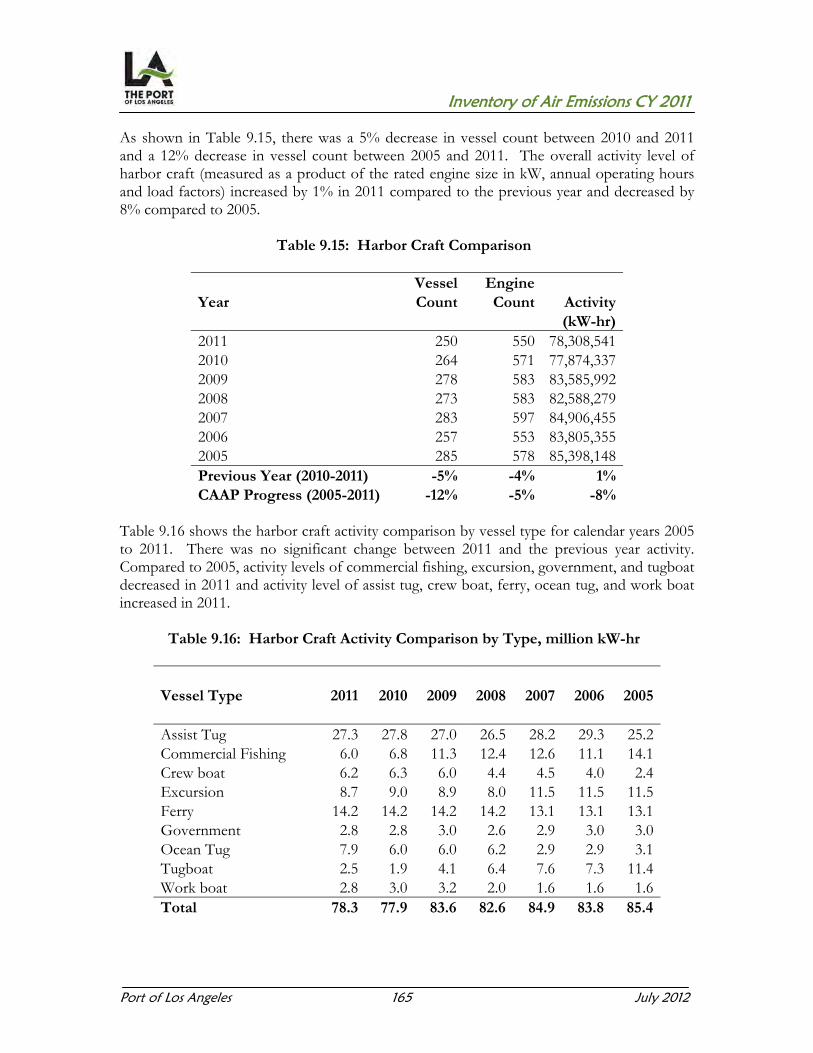
Inventory of Air Emissions CY 2011
Port of Los Angeles 165 July 2012
As shown in Table 9.15, there was a 5% decrease in vessel count between 2010 and 2011 and a 12% decrease in vessel count between 2005 and 2011. The overall activity level of harbor craft (measured as a product of the rated engine size in kW, annual operating hours and load factors) increased by 1% in 2011 compared to the previous year and decreased by 8% compared to 2005.
Table 9.15: Harbor Craft Comparison
Vessel EngineYear Count Count Activity
(kW-hr) 2011 250 550 78,308,541 2010 264 571 77,874,337 2009 278 583 83,585,992 2008 273 583 82,588,279 2007 283 597 84,906,455 2006 257 553 83,805,355 2005 285 578 85,398,148 Previous Year (2010-2011) -5% -4% 1% CAAP Progress (2005-2011) -12% -5% -8%
Table 9.16 shows the harbor craft activity comparison by vessel type for calendar years 2005 to 2011. There was no significant change between 2011 and the previous year activity. Compared to 2005, activity levels of commercial fishing, excursion, government, and tugboat decreased in 2011 and activity level of assist tug, crew boat, ferry, ocean tug, and work boat increased in 2011.
Table 9.16: Harbor Craft Activity Comparison by Type, million kW-hr
Vessel Type 2011 2010 2009 2008 2007 2006 2005
Assist Tug 27.3 27.8 27.0 26.5 28.2 29.3 25.2 Commercial Fishing 6.0 6.8 11.3 12.4 12.6 11.1 14.1 Crew boat 6.2 6.3 6.0 4.4 4.5 4.0 2.4 Excursion 8.7 9.0 8.9 8.0 11.5 11.5 11.5 Ferry 14.2 14.2 14.2 14.2 13.1 13.1 13.1 Government 2.8 2.8 3.0 2.6 2.9 3.0 3.0 Ocean Tug 7.9 6.0 6.0 6.2 2.9 2.9 3.1 Tugboat 2.5 1.9 4.1 6.4 7.6 7.3 11.4 Work boat 2.8 3.0 3.2 2.0 1.6 1.6 1.6 Total 78.3 77.9 83.6 82.6 84.9 83.8 85.4
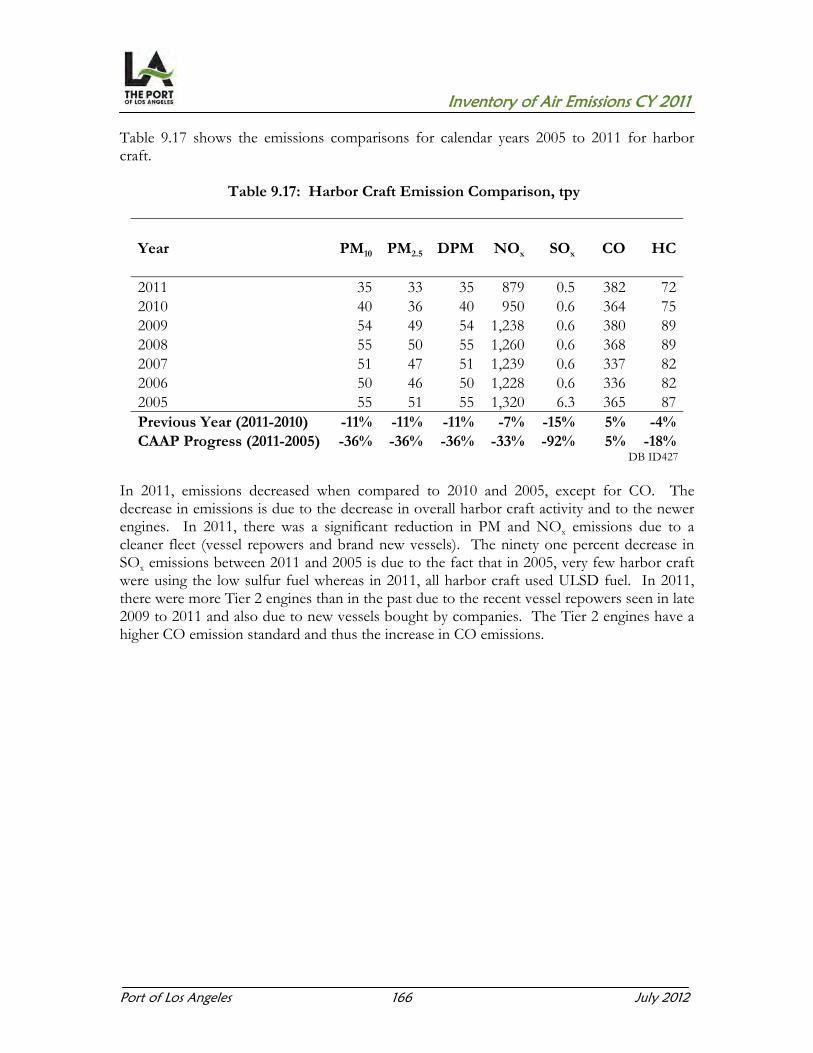
Inventory of Air Emissions CY 2011
Port of Los Angeles 166 July 2012
Table 9.17 shows the emissions comparisons for calendar years 2005 to 2011 for harbor craft.
Table 9.17: Harbor Craft Emission Comparison, tpy
Year PM10 PM2.5 DPM NOx SOx CO HC
2011 35 33 35 879 0.5 382 722010 40 36 40 950 0.6 364 752009 54 49 54 1,238 0.6 380 892008 55 50 55 1,260 0.6 368 892007 51 47 51 1,239 0.6 337 822006 50 46 50 1,228 0.6 336 822005 55 51 55 1,320 6.3 365 87Previous Year (2011-2010) -11% -11% -11% -7% -15% 5% -4%CAAP Progress (2011-2005) -36% -36% -36% -33% -92% 5% -18%
DB ID427
In 2011, emissions decreased when compared to 2010 and 2005, except for CO. The decrease in emissions is due to the decrease in overall harbor craft activity and to the newer engines. In 2011, there was a significant reduction in PM and NOx emissions due to a cleaner fleet (vessel repowers and brand new vessels). The ninety one percent decrease in SOx emissions between 2011 and 2005 is due to the fact that in 2005, very few harbor craft were using the low sulfur fuel whereas in 2011, all harbor craft used ULSD fuel. In 2011, there were more Tier 2 engines than in the past due to the recent vessel repowers seen in late 2009 to 2011 and also due to new vessels bought by companies. The Tier 2 engines have a higher CO emission standard and thus the increase in CO emissions.

Inventory of Air Emissions CY 2011
Port of Los Angeles 167 July 2012
Table 9.18 compares the 2011 harbor craft GHG emissions to the previous years.
Table 9.18: Harbor Craft GHG Emission Comparison, tonnes
Year CO2e
2011 51,9012010 51,6132009 55,3992008 55,0882007 56,8752006 56,1452005 57,199Previous Year (2010-2011) 1%CAAP Progress (2005-2011) -9%
Table 9.19 shows the emissions efficiency changes from 2005 to 2011. It should be noted that total harbor craft emissions were used for this efficiency comparison although emissions from several harbor craft types (e.g., commercial fishing vessels) are not dependent on container throughput. A positive percent for the emissions efficiency comparison means an improvement in efficiency.
Table 9.19: Harbor Craft Emissions Efficiency Metric Comparison, tons/10,000
TEUs
Year PM10 PM2.5 DPM NOx SOx CO HC
2011 0.04 0.04 0.04 1.11 0.00 0.48 0.092010 0.05 0.05 0.05 1.21 0.00 0.47 0.102009 0.08 0.07 0.08 1.83 0.00 0.56 0.132008 0.07 0.06 0.07 1.60 0.00 0.47 0.112007 0.06 0.06 0.06 1.48 0.00 0.40 0.102006 0.06 0.05 0.06 1.45 0.00 0.40 0.102005 0.07 0.07 0.07 1.76 0.01 0.49 0.12Previous Year (2010-2011) 20% 20% 20% 8% 0% -2% 10%CAAP Progress (2005-2011) 43% 43% 43% 37% 93% 2% 25%

Inventory of Air Emissions CY 2011
Port of Los Angeles 168 July 2012
Figure 9.7 shows the harbor craft emissions efficiency comparisons between 2011 and 2010 and between 2011 and 2005 for CAAP progress. The purple bar represents the TEU throughput change from the previous year (a 1% increase) and the blue bar represents the TEU throughput change when compared to 2005 (a 6% increase).
Figure 9.7: Harbor Craft Emissions Efficiency Metric Change
PM10 PM2.5 DPM NOx SOx CO HC TEU
9.1.3 Cargo Handling Equipment The methodology used to estimate CHE emissions for the 2011 Inventory of Air Emissions changed from the methodology used in the 2010 inventory. The deterioration rate calculation methodology changed and the diesel engines’ cumulative hours were capped in order to be consistent with CARB’s latest methodology. In addition, starting with calendar year 2008, due to additional clarification from one terminal operator, about 100 2007+ yard tractors originally classified as on-road diesel were reclassified as propane fueled yard tractors. Therefore, for the emission comparisons the previous years' emissions were re-estimated using the 2011 methodology.
-20%
0%
20%
40%
60%
80%
100%
20% 20% 20%
8%0%
-2%
10%1%
43% 43% 43%37%
93%
2%
25%
6%
Previous Year (2010-2011) CAAP Progress (2005-2011)TEU (2010-2011) TEU (2005-2011)

Inventory of Air Emissions CY 2011
Port of Los Angeles 169 July 2012
Table 9.20 shows there was a 5% increase in the number of units of cargo handling equipment and a 1% increase in the overall activity level (measured as total kW-hrs, the product of the rated engine size in kW, annual operating hours and load factors) in 2011 compared to 2010. The main reason for the 5% increase in total CHE population from the previous year is due to California United Terminals moving to the Port of Los Angeles at the end of 2010. From 2005 to 2011, there was a 15% increase in population and 8% increase in activity level.
Table 9.20: CHE Count and Activity Comparison
Year Count Activity (kW-hr)
2011 2,042 186,936,662 2010 1,949 185,221,606 2009 2,000 165,935,481 2008 2,141 194,502,617 2007 2,014 205,495,143 2006 1,995 220,516,240 2005 1,782 173,169,439 Previous Year (2010-2011) 5% 1% CAAP Progress (2005-2011) 15% 8%
DB ID881

Inventory of Air Emissions CY 2011
Port of Los Angeles 170 July 2012
Table 9.21 summarizes the numbers of pieces of cargo handling equipment using various engine and power types, including electric, liquefied natural gas (LNG), diesel, propane, and gasoline.
Table 9.21: Count of CHE Engine Type
Equipment Electric LNG Propane Gasoline Diesel Total
2011 Forklift 9 0 389 7 137 542Electric wharf crane 74 0 0 0 0 74RTG crane 0 0 0 0 105 105Side pick 0 0 0 0 41 41Top handler 0 0 0 0 149 149Yard tractor 0 17 180 0 813 1,010Sweeper 0 0 1 2 10 13Other 23 0 0 0 85 108Total 106 17 570 9 1,340 2,042
5.2% 0.8% 27.9% 0.4% 65.6% 2010 Forklift 10 0 336 7 163 516Electric wharf crane 70 0 0 0 0 70RTG crane 0 0 0 0 107 107Side pick 0 0 0 0 37 37Top handler 0 0 0 0 140 140Yard tractor 0 5 157 0 789 951Sweeper 0 0 1 2 10 13Other 26 0 1 0 88 115Total 106 5 495 9 1,334 1,949
5.4% 0.3% 25.4% 0.5% 68.4% 2005 Forklift 0 0 263 8 151 422Electric wharf crane 67 0 0 0 0 67RTG crane 0 0 0 0 98 98Side pick 0 0 0 0 41 41Top handler 0 0 0 0 127 127Yard tractor 0 0 53 0 848 901Sweeper 0 0 0 3 8 11Other 12 0 0 0 103 115Total 79 0 316 11 1376 1,782
4.4% 0.0% 17.7% 0.6% 77.2% DB ID235

Inventory of Air Emissions CY 2011
Port of Los Angeles 171 July 2012
Table 9.22 summarizes the number and percentage of diesel powered CHE with various emission controls by equipment type in 2005, 2010 and 2011. The emission controls for CHE include: DOC retrofits, DPF retrofits, on-road engines (CHE equipped with on-road certified engines instead of off-road engines), LNG, use of ULSD with a maximum sulfur content of 15 ppm, and emulsified fuel. Several items to note include: Since some emission controls can be used in combination with others, the number
of units of equipment with controls (shown in Table 9.18) cannot be added across to come up with the total equipment count (counts of equipment with controls are greater than the total equipment counts).
With implementation of the Port’s CAAP measure for CHE and CARB’s CHE regulation, the relative percentage of cargo handling equipment equipped with new on-road engines increased when compared to 2005.
Mainly due to turnover, the DOCs count have decreased since 2005 as older equipment with DOCs were replaced with newer equipment that did not require the use of DOCs.
Emulsified fuel has not been used since 2006 due to supplier unavailability. ULSD has been used by all diesel equipment since 2006. For 2005, ULSD was used
by some diesel equipment, but not all.
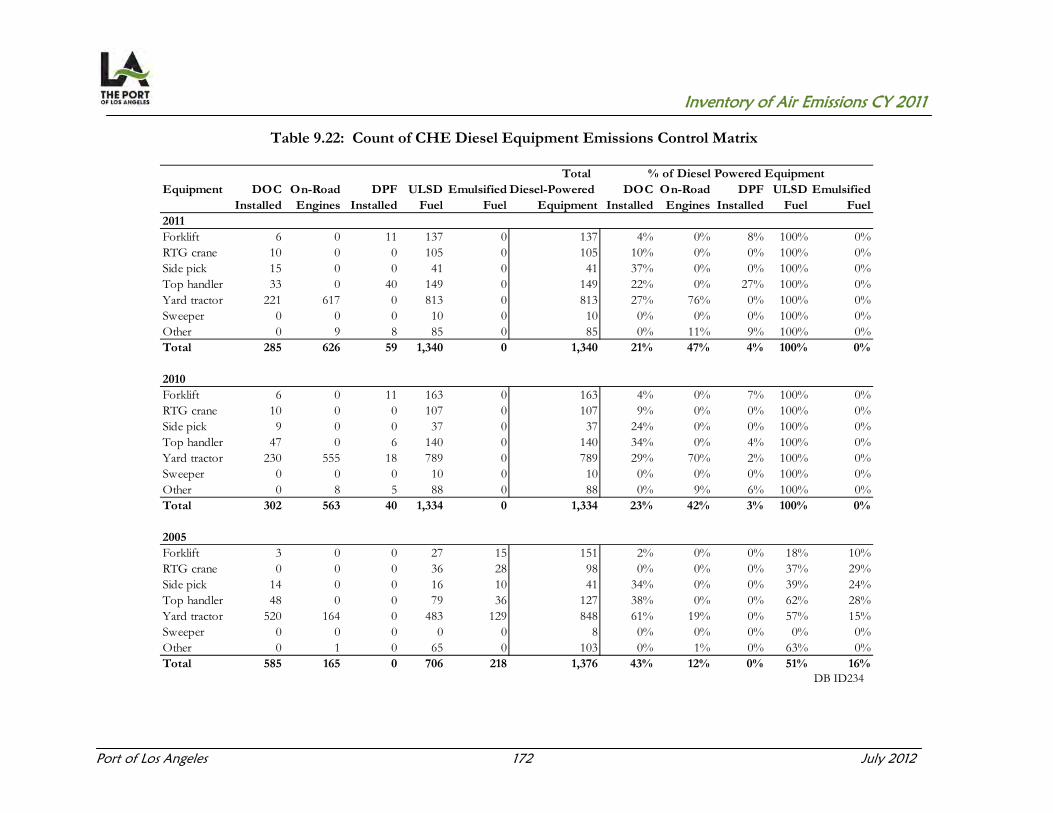
Inventory of Air Emissions CY 2011
Port of Los Angeles 172 July 2012
Table 9.22: Count of CHE Diesel Equipment Emissions Control Matrix
DB ID234
Total Equipment DOC On-Road DPF ULSD Emulsified Diesel-Powered DOC On-Road DPF ULSD Emulsified
Installed Engines Installed Fuel Fuel Equipment Installed Engines Installed Fuel Fuel2011Forklift 6 0 11 137 0 137 4% 0% 8% 100% 0%RTG crane 10 0 0 105 0 105 10% 0% 0% 100% 0%Side pick 15 0 0 41 0 41 37% 0% 0% 100% 0%Top handler 33 0 40 149 0 149 22% 0% 27% 100% 0%Yard tractor 221 617 0 813 0 813 27% 76% 0% 100% 0%Sweeper 0 0 0 10 0 10 0% 0% 0% 100% 0%Other 0 9 8 85 0 85 0% 11% 9% 100% 0%Total 285 626 59 1,340 0 1,340 21% 47% 4% 100% 0%
2010Forklift 6 0 11 163 0 163 4% 0% 7% 100% 0%RTG crane 10 0 0 107 0 107 9% 0% 0% 100% 0%Side pick 9 0 0 37 0 37 24% 0% 0% 100% 0%Top handler 47 0 6 140 0 140 34% 0% 4% 100% 0%Yard tractor 230 555 18 789 0 789 29% 70% 2% 100% 0%Sweeper 0 0 0 10 0 10 0% 0% 0% 100% 0%Other 0 8 5 88 0 88 0% 9% 6% 100% 0%Total 302 563 40 1,334 0 1,334 23% 42% 3% 100% 0%
2005Forklift 3 0 0 27 15 151 2% 0% 0% 18% 10%RTG crane 0 0 0 36 28 98 0% 0% 0% 37% 29%Side pick 14 0 0 16 10 41 34% 0% 0% 39% 24%Top handler 48 0 0 79 36 127 38% 0% 0% 62% 28%Yard tractor 520 164 0 483 129 848 61% 19% 0% 57% 15%Sweeper 0 0 0 0 0 8 0% 0% 0% 0% 0%Other 0 1 0 65 0 103 0% 1% 0% 63% 0%Total 585 165 0 706 218 1,376 43% 12% 0% 51% 16%
% of Diesel Powered Equipment

Inventory of Air Emissions CY 2011
Port of Los Angeles 173 July 2012
Table 9.23 compares the total number of cargo handling equipment units with off-road diesel engines (meeting Tier 0, 1, 2, 3 and 4 off-road diesel engine standards) and those equipped with on-road diesel engines from 2005 to 2011. Since classification of engine standards is based on the engine’s model year and horsepower, equipment with unknown horsepower or model year information are listed separately under the Unknown Tier column in this table. As indicated, over the last five years, implementation of the CAAP’s CHE measure and CARB’s CHE regulation have resulted in a steady increase in the prevalence of newer and cleaner equipment (i.e., primarily Tier 2 and Tier 3 with a few Tier 4) replacing the older and higher-emitting equipment (Tier 0 and Tier 1). In addition, the number of units with on-road engines, which are even cleaner than Tier 3 off-road engines, has significantly increased since 2005.
Table 9.23: Count of CHE Diesel Engine Tier and On-road Engine
Year Tier 0 Tier 1 Tier 2 Tier 3 Tier 4 On-road Unknown TotalEngine Tier Diesel
2011 64 122 351 153 10 626 14 1,3402010 83 163 374 139 7 563 5 1,3342009 114 194 381 120 6 598 6 1,3892008 135 422 401 57 0 499 5 1,5192007 202 578 387 36 0 293 8 1,5042006 227 599 398 29 0 225 4 1,4822005 256 582 360 0 0 165 13 1,3762010-2011 -23% -25% -6% 10% 43% 11% 180% 0%2005-2011 -75% -79% -3% 100% 100% 279% 8% -3%
DB ID878

Inventory of Air Emissions CY 2011
Port of Los Angeles 174 July 2012
Table 9.24 shows the cargo handling equipment emissions comparisons for calendar years 2005 to 2011 in tons per year and as a percent change in 2011 compared to 2010 and 2005 (CAAP progress). As shown, in general the emissions of all pollutants have decreased over the years. Compared to 2010, PM, DPM and NOx emissions decreased slightly due to fleet turnover resulting into higher percent of Tier 3 and Tier 4 engines. However, CO and HC emissions increased slightly due more propane equipment in 2011 which have higher CO and HC emissions. The increase in SOx is directly related to increase in activity and no additional emissions controls for SOx. The 2011 emissions compared to 2005 decreased significantly due to the implementation of the Port’s CHE measure and CARB’s CHE regulation resulting in the introduction of newer equipment with cleaner engines and the installation of emission controls.
Table 9.24: CHE Emissions Comparison, tpy
Year PM10 PM2.5 DPM NOx SOx CO HC
2011 25 23 23 831 2 664 692010 26 24 25 872 2 656 662009 25 23 24 804 1 770 612008 40 37 38 1,289 2 807 692007 52 48 51 1,681 2 953 912006 58 54 57 1,856 2 1,021 1052005 54 50 53 1,566 9 825 87Previous Year (2010-2011) -6% -6% -5% -5% 1% 1% 5%CAAP Progress (2005-2011) -54% -54% -56% -47% -83% -19% -21%
DB ID237
Table 9.25 compares the 2011 CHE GHG emissions to the previous years.
Table 9.25: CHE GHG Emissions Comparison, tonnes
Year CO2e
2011 145,4092010 145,1132009 130,2272008 152,1752007 160,1122006 171,6682005 134,952Previous Year (2010-2011) 0%CAAP Progress (2005-2011) 8%

Inventory of Air Emissions CY 2011
Port of Los Angeles 175 July 2012
Table 9.26 shows the emissions efficiency changes over the last five years. From 2010 to 2011, there was a 1% increase in TEU throughput, and up to 6% improvement in efficiency for DPM and NOx. From 2005 to 2011, there was a 6% increase in TEU throughput, and a 24% to 80% improvement in emissions efficiency, depending on pollutant. A positive percentage change for the emissions efficiency comparison means an improvement in efficiency.
Table 9.26: CHE Emissions Efficiency Metric Comparison, tons/10,000 TEUs
Year PM10 PM2.5 DPM NOx SOx CO HC
2011 0.03 0.03 0.03 1.05 0.00 0.84 0.092010 0.03 0.03 0.03 1.11 0.00 0.84 0.082009 0.04 0.03 0.04 1.19 0.00 1.14 0.092008 0.05 0.05 0.05 1.64 0.00 1.03 0.092007 0.06 0.06 0.06 2.01 0.00 1.14 0.112006 0.07 0.06 0.07 2.19 0.00 1.21 0.122005 0.07 0.07 0.07 2.09 0.01 1.10 0.12Previous Year (2010-2011) 0% 0% 0% 5% 0% 0% -13%CAAP Progress (2005-2011) 57% 57% 57% 50% 85% 24% 25%

Inventory of Air Emissions CY 2011
Port of Los Angeles 176 July 2012
Figure 9.8 shows the CHE emissions efficiency comparisons between 2011 and 2010 and between 2011 and 2005 for the CAAP progress. The purple bar represents the TEU throughput change from the previous year (1% increase) and the blue bar represents the TEU throughput change when compared to 2005 (6% increase).
Figure 9.8: CHE Emissions Efficiency Metric Change
PM10 PM2.5 DPM NOx SOx CO HC TEU
9.1.4 Locomotives The methodology used to estimate locomotive emissions in the 2011 Inventory of Air Emissions is the same as the methodology used in the 2010 inventory.
-25%
0%
25%
50%
75%
100%
0% 0% 0%5%
0% 0%
-13%
1%
57% 57% 57%50%
85%
24% 25%
6%
Previous Year (2010-2011) CAAP Progress (2005-2011)TEU (2010-2011) TEU (2005-2011)
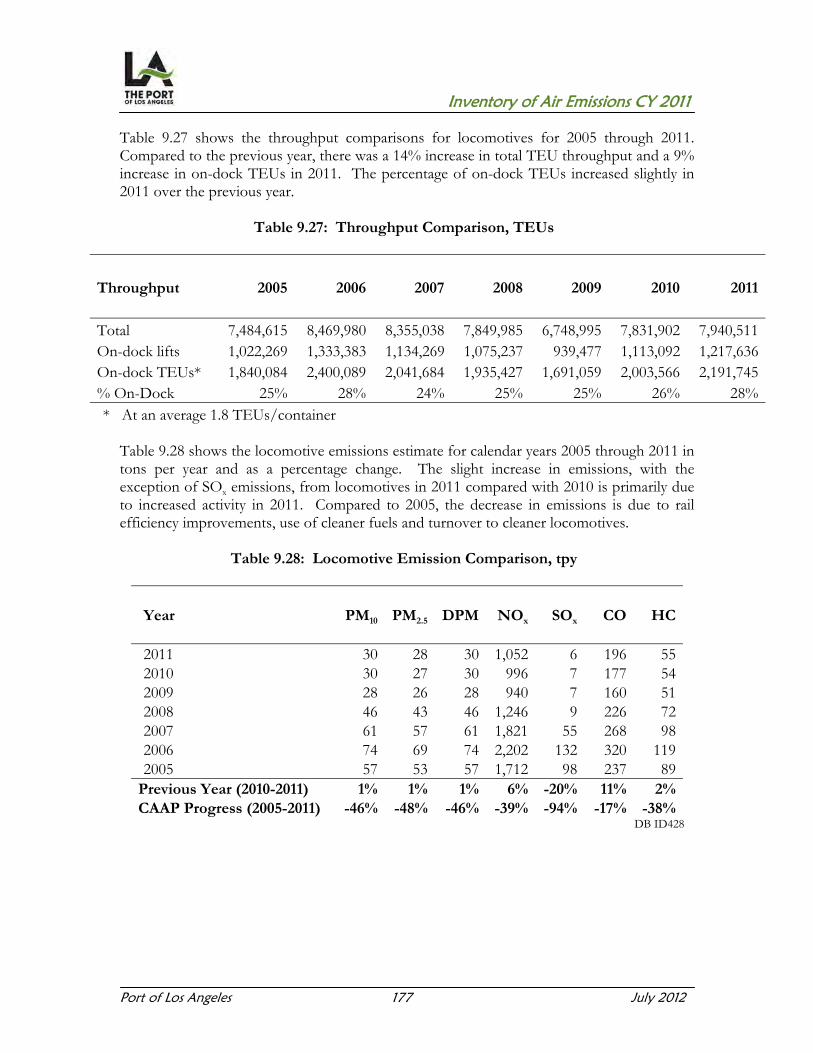
Inventory of Air Emissions CY 2011
Port of Los Angeles 177 July 2012
Table 9.27 shows the throughput comparisons for locomotives for 2005 through 2011. Compared to the previous year, there was a 14% increase in total TEU throughput and a 9% increase in on-dock TEUs in 2011. The percentage of on-dock TEUs increased slightly in 2011 over the previous year.
Table 9.27: Throughput Comparison, TEUs
Throughput 2005 2006 2007 2008 2009 2010 2011 Total 7,484,615 8,469,980 8,355,038 7,849,985 6,748,995 7,831,902 7,940,511On-dock lifts 1,022,269 1,333,383 1,134,269 1,075,237 939,477 1,113,092 1,217,636On-dock TEUs* 1,840,084 2,400,089 2,041,684 1,935,427 1,691,059 2,003,566 2,191,745% On-Dock 25% 28% 24% 25% 25% 26% 28%* At an average 1.8 TEUs/container
Table 9.28 shows the locomotive emissions estimate for calendar years 2005 through 2011 in tons per year and as a percentage change. The slight increase in emissions, with the exception of SOx emissions, from locomotives in 2011 compared with 2010 is primarily due to increased activity in 2011. Compared to 2005, the decrease in emissions is due to rail efficiency improvements, use of cleaner fuels and turnover to cleaner locomotives.
Table 9.28: Locomotive Emission Comparison, tpy
Year PM10 PM2.5 DPM NOx SOx CO HC
2011 30 28 30 1,052 6 196 552010 30 27 30 996 7 177 542009 28 26 28 940 7 160 512008 46 43 46 1,246 9 226 722007 61 57 61 1,821 55 268 982006 74 69 74 2,202 132 320 1192005 57 53 57 1,712 98 237 89
Previous Year (2010-2011) 1% 1% 1% 6% -20% 11% 2%CAAP Progress (2005-2011) -46% -48% -46% -39% -94% -17% -38%
DB ID428

Inventory of Air Emissions CY 2011
Port of Los Angeles 178 July 2012
Table 9.29 compares the 2011 locomotive GHG emissions to the previous years.
Table 9.29: Locomotive GHG Emission Comparison, tonnes
Year CO2e
2011 69,5052010 61,5942009 55,6292008 78,7682007 93,1302006 109,8792005 82,372Previous Year (2010-2011) 13%CAAP Progress (2005-2011) -16%
Table 9.30 and Figure 9.9 show the emissions efficiency changes from 2005 to 2011. A positive percentage for the emissions efficiency comparison means an improvement in efficiency. For the previous year comparison (2011-2010), emission efficiency stayed the same, except for NOx and CO. For the CAAP progress (2011-2005), emission efficiencies have improved for all pollutants. Table 9.30: Locomotive Emissions Efficiency Metric Comparison, tons/10,000 TEUs
Year PM10 PM2.5 DPM NOx SOx CO HC
2011 0.04 0.03 0.04 1.32 0.01 0.25 0.072010 0.04 0.03 0.04 1.27 0.01 0.23 0.072009 0.04 0.04 0.04 1.39 0.01 0.24 0.082008 0.06 0.05 0.06 1.59 0.01 0.29 0.092007 0.07 0.07 0.07 2.18 0.07 0.32 0.122006 0.09 0.08 0.09 2.60 0.16 0.38 0.142005 0.08 0.07 0.08 2.29 0.13 0.32 0.12Previous Year (2010-2011) 0% 0% 0% -4% 0% -9% 0%CAAP Progress (2005-2011) 50% 57% 50% 42% 92% 22% 42%
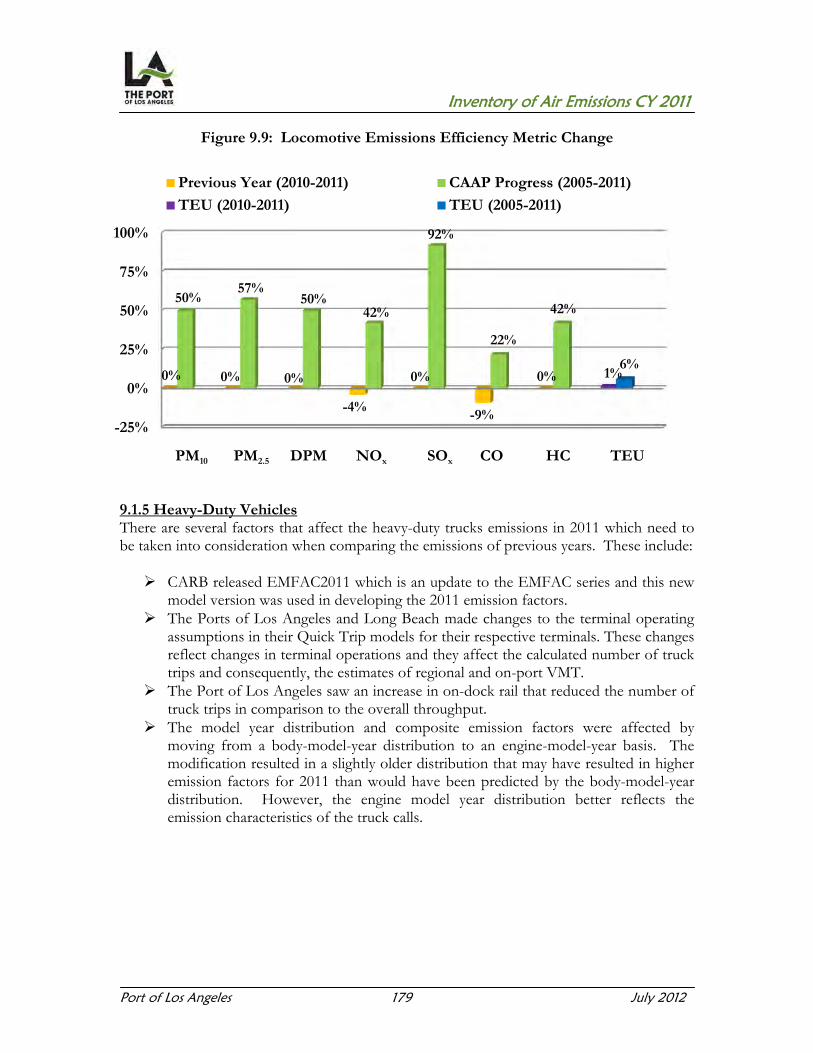
Inventory of Air Emissions CY 2011
Port of Los Angeles 179 July 2012
Figure 9.9: Locomotive Emissions Efficiency Metric Change
PM10 PM2.5 DPM NOx SOx CO HC TEU
9.1.5 Heavy-Duty Vehicles There are several factors that affect the heavy-duty trucks emissions in 2011 which need to be taken into consideration when comparing the emissions of previous years. These include: CARB released EMFAC2011 which is an update to the EMFAC series and this new
model version was used in developing the 2011 emission factors. The Ports of Los Angeles and Long Beach made changes to the terminal operating
assumptions in their Quick Trip models for their respective terminals. These changes reflect changes in terminal operations and they affect the calculated number of truck trips and consequently, the estimates of regional and on-port VMT.
The Port of Los Angeles saw an increase in on-dock rail that reduced the number of truck trips in comparison to the overall throughput.
The model year distribution and composite emission factors were affected by moving from a body-model-year distribution to an engine-model-year basis. The modification resulted in a slightly older distribution that may have resulted in higher emission factors for 2011 than would have been predicted by the body-model-year distribution. However, the engine model year distribution better reflects the emission characteristics of the truck calls.
-25%
0%
25%
50%
75%
100%
0% 0% 0%
-4%
0%
-9%
0% 1%
50%57%
50%42%
92%
22%
42%
6%
Previous Year (2010-2011) CAAP Progress (2005-2011)
TEU (2010-2011) TEU (2005-2011)

Inventory of Air Emissions CY 2011
Port of Los Angeles 180 July 2012
Table 9.31 shows the continuous improvement in total port-wide idling time. The idling time increased from the previous year mainly due to a terminal providing different terminal characteristics for distance traveled inside the terminal and a new tenant, California United Terminals, was added in 2011.
Table 9.31: HDV Idling Time Comparison, hours
TotalYear Idling Time
(hours)2011 2,275,2982010 1,787,7892009 1,830,3712008 2,097,6002007 2,334,5682006 2,962,4632005 3,017,252Previous Year (2010-2011) 27%CAAP Progress (2005-2011) -25%
Table 9.32 summarizes the average age of the port-related fleet from 2005 to 2011. The average engine age of the trucks visiting the Port is 3 years. The previous years’ average age is based on average age of the truck, not the engine. In 2011, the average engine age was used instead of the truck age for the model year distribution.
Table 9.32: Port-related Fleet Weighted Average Age, years
Year Call-Weighted Average Age (years)2011 3 2010 2.22009 6.92008 11.62007 12.42006 11.32005 11.2
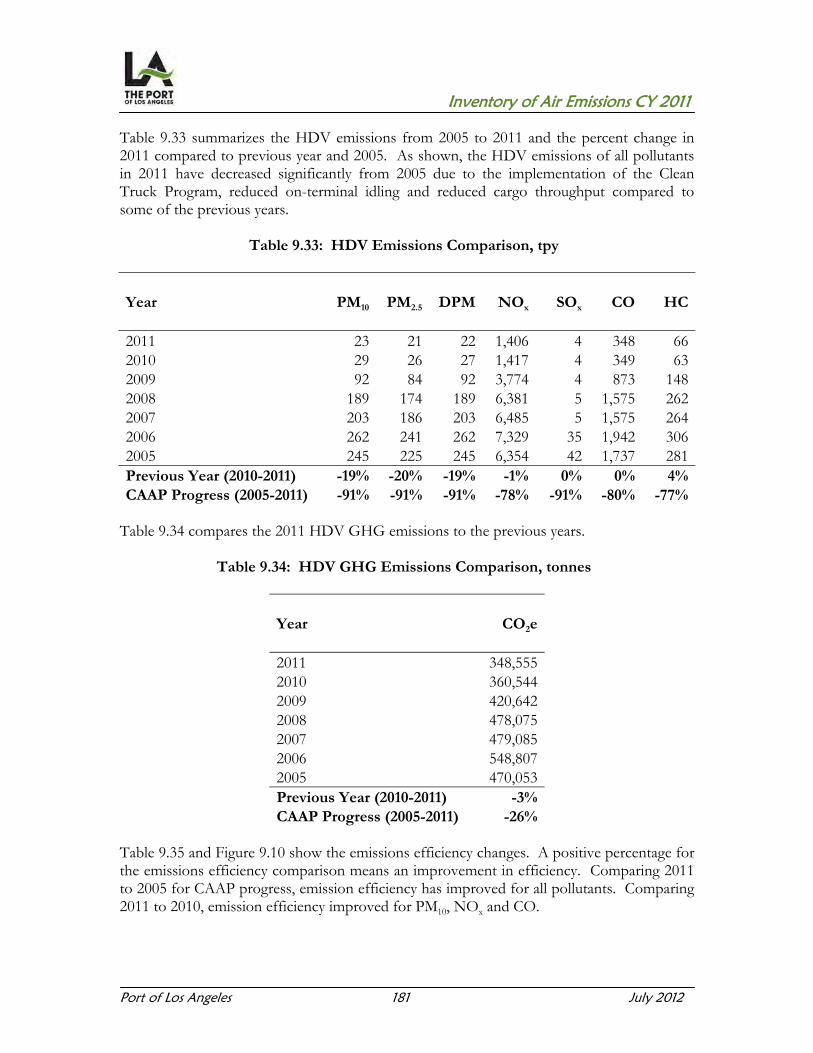
Inventory of Air Emissions CY 2011
Port of Los Angeles 181 July 2012
Table 9.33 summarizes the HDV emissions from 2005 to 2011 and the percent change in 2011 compared to previous year and 2005. As shown, the HDV emissions of all pollutants in 2011 have decreased significantly from 2005 due to the implementation of the Clean Truck Program, reduced on-terminal idling and reduced cargo throughput compared to some of the previous years.
Table 9.33: HDV Emissions Comparison, tpy
Year PM10 PM2.5 DPM NOx SOx CO HC
2011 23 21 22 1,406 4 348 662010 29 26 27 1,417 4 349 632009 92 84 92 3,774 4 873 1482008 189 174 189 6,381 5 1,575 2622007 203 186 203 6,485 5 1,575 2642006 262 241 262 7,329 35 1,942 3062005 245 225 245 6,354 42 1,737 281Previous Year (2010-2011) -19% -20% -19% -1% 0% 0% 4%CAAP Progress (2005-2011) -91% -91% -91% -78% -91% -80% -77%
Table 9.34 compares the 2011 HDV GHG emissions to the previous years.
Table 9.34: HDV GHG Emissions Comparison, tonnes
Year CO2e
2011 348,5552010 360,5442009 420,6422008 478,0752007 479,0852006 548,8072005 470,053Previous Year (2010-2011) -3%CAAP Progress (2005-2011) -26%
Table 9.35 and Figure 9.10 show the emissions efficiency changes. A positive percentage for the emissions efficiency comparison means an improvement in efficiency. Comparing 2011 to 2005 for CAAP progress, emission efficiency has improved for all pollutants. Comparing 2011 to 2010, emission efficiency improved for PM10, NOx and CO.
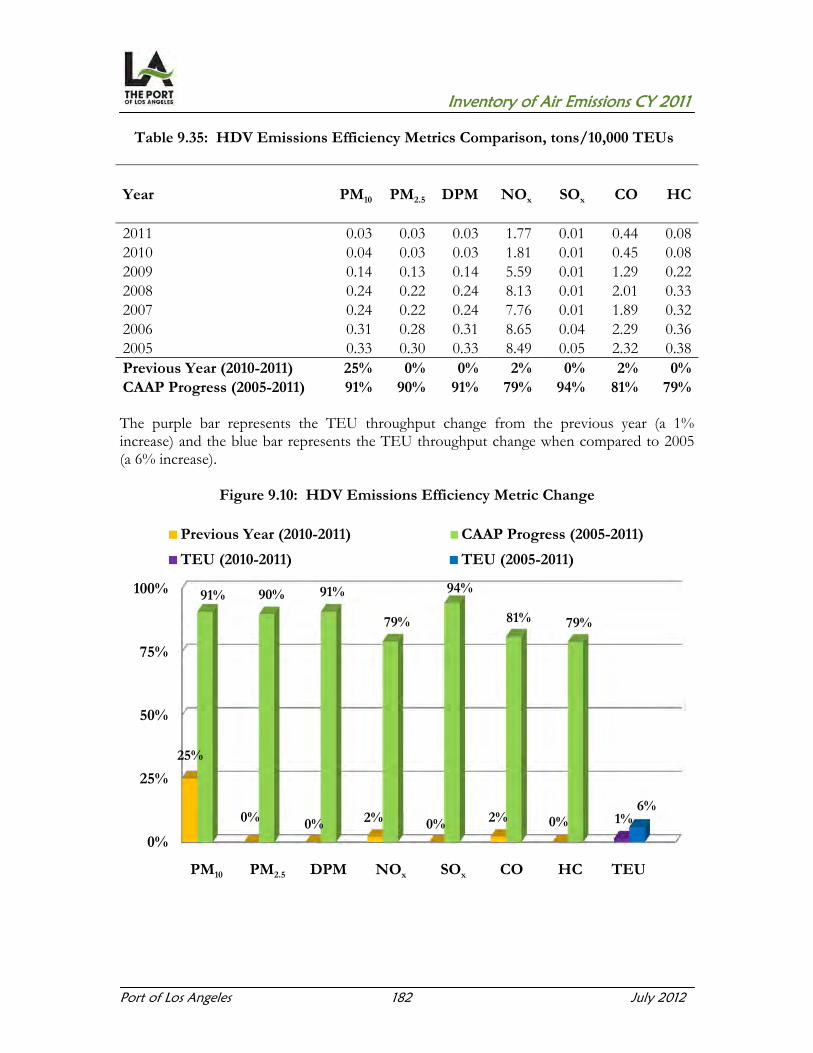
Inventory of Air Emissions CY 2011
Port of Los Angeles 182 July 2012
Table 9.35: HDV Emissions Efficiency Metrics Comparison, tons/10,000 TEUs
Year PM10 PM2.5 DPM NOx SOx CO HC
2011 0.03 0.03 0.03 1.77 0.01 0.44 0.082010 0.04 0.03 0.03 1.81 0.01 0.45 0.082009 0.14 0.13 0.14 5.59 0.01 1.29 0.222008 0.24 0.22 0.24 8.13 0.01 2.01 0.332007 0.24 0.22 0.24 7.76 0.01 1.89 0.322006 0.31 0.28 0.31 8.65 0.04 2.29 0.362005 0.33 0.30 0.33 8.49 0.05 2.32 0.38Previous Year (2010-2011) 25% 0% 0% 2% 0% 2% 0%CAAP Progress (2005-2011) 91% 90% 91% 79% 94% 81% 79% The purple bar represents the TEU throughput change from the previous year (a 1% increase) and the blue bar represents the TEU throughput change when compared to 2005 (a 6% increase).
Figure 9.10: HDV Emissions Efficiency Metric Change
PM10 PM2.5 DPM NOx SOx CO HC TEU
0%
25%
50%
75%
100%
25%
0% 0% 2% 0% 2% 0% 1%
91% 90% 91%
79%
94%
81% 79%
6%
Previous Year (2010-2011) CAAP Progress (2005-2011)
TEU (2010-2011) TEU (2005-2011)

Inventory of Air Emissions CY 2011
Port of Los Angeles 183 July 2012
9.2 CAAP Standards and Progress One of the main purposes of the annual inventories is to provide a progress update on achieving the CAAP’s San Pedro Bay Standards. These standards consist of the following emission reduction goals, compared to the 2005 published inventories: Emission Reduction Standard:
o By 2014, achieve emission reductions of 72% for DPM, 22% for NOx, and 93% for SOx
o By 2023, achieve emission reductions of 77% for DPM, 59% for NOx, and 93% for SOx
Health Risk Reduction Standard: 85% reduction by 2020 The Emission Reduction Standards are represented as a percentage reduction of emissions from 2005 levels, and are tied to the regional SoCAB attainment dates for the federal PM2.5
and ozone ambient air quality standards in the 2007 AQMP. This and future inventories will be used as a tool to track progress in meeting the emission reduction standards. Tables 9.36 to 9.38 show the standardized estimates of emissions by source category for calendar years 2005 through 2011, using current year methodology. Figures 9.11 through 9.13 present the 2005 baseline emissions and the year to year percent change in emissions with respect to the 2005 baseline emissions as well as present the 2014 and 2023 standards to provide a snapshot of progress to-date towards meeting those standards. In Figure 9.11, DPM emissions reductions are presented as a surrogate for PM2.5 reductions since DPM is directly related to PM2.5 emissions (equivalent of PM10 emissions from diesel-powered sources). In Figure 9.12, NOx emissions reductions are presented since NOx is a precursor to the ambient ozone formation and it also contributes to the formation of PM2.5. SOx emissions reductions are presented in Figure 9.13 because of the contribution of SOx to PM2.5
emissions. It is important to note that a portion of the current year’s emission reductions are attributable to lower cargo throughput if compared to some of the previous year emissions such as in 2006 and 2007. As anticipated cargo volumes increase in the upcoming years, the reduction trend may not continue at the same rate experienced over the last few years. However, continued implementation of several significant emission reduction programs, such as the Port’s Clean Truck Program, Vessel Speed Reduction, alternative maritime power (AMP), and CARB’s regulatory strategies for port-related sources, is expected to substantially mitigate the impact of resumed cargo growth.

Inventory of Air Emissions CY 2011
Port of Los Angeles 184 July 2012
Table 9.36: DPM Emissions by Calendar Year and Source Category, tpy
Category 2005 2006 2007 2008 2009 2010 2011
OGV 481 503 261 364 249 156 148Harbor Craft 55 50 51 55 54 40 35CHE 53 57 51 38 24 25 23Locomotives 57 74 61 46 28 30 30HDV 245 262 203 189 92 27 22Total 891 946 627 692 447 278 258% Cumulative Change 6% -30% -22% -50% -69% -71%
Figure 9.11: DPM Reductions to Date
As presented above, by 2011, the Port has almost met the 2014 DPM emission reduction standards (72%) with 71% reduction.

Inventory of Air Emissions CY 2011
Port of Los Angeles 185 July 2012
Table 9.37: NOx Emissions by Calendar Year and Source Category, tpy
Category 2005 2006 2007 2008 2009 2010 2011
OGV 5,429 5,910 5,156 4,848 4,108 3,978 3,821 Harbor Craft 1,320 1,228 1,239 1,260 1,238 950 879 CHE 1,566 1,856 1,681 1,289 804 872 831 Locomotives 1,712 2,202 1,821 1,246 940 996 1,052 HDV 6,354 7,329 6,485 6,381 3,774 1,417 1,406 Total 16,381 18,525 16,382 15,024 10,864 8,213 7,989 % Cumulative Change 13% 0% -8% -34% -50% -51%
Figure 9.12: NOx Reductions to Date
As presented above, the Port is exceeding the 2014 NOx mass emission reduction standard in 2011 and is over 85% of the way towards meeting the 2023 standard.

Inventory of Air Emissions CY 2011
Port of Los Angeles 186 July 2012
Table 9.38: SOx Emissions by Calendar Year and Source Category, tpy
Category 2005 2006 2007 2008 2009 2010 2011
OGV 5,170 5,556 3,337 3,786 2,422 1,306 1,275 Harbor Craft 6 1 1 1 1 1 1 CHE 9 2 2 2 1 2 2 Locomotives 98 132 55 9 7 7 6 HDV 42 35 5 5 4 4 4 Total 5,326 5,725 3,400 3,802 2,435 1,319 1,287 % Cumulative Change 7% -36% -29% -54% -75% -76%
Figure 9.13: SOx Reductions to Date
As presented above, by 2011, the Port is more than three quarters of the way towards meeting the SOx mass emission reduction standards. The slight erosion of SOx reductions from 2007 and 2008 was due to the injunction against the previous CARB OGV fuel rule in 2008.

Inventory of Air Emissions CY 2011
Port of Los Angeles 187 July 2012
Health Risk Reduction Progress As described in Section 2 of the 2010 CAAP Update, the effectiveness of CAAP’s control measures and applicable regulations with respect to the Health Risk Reduction Standard can be tracked by changes in mass emission reductions in DPM from the 2005 baseline. DPM is the predominant contributor to port-related health risk, and the Health Risk Reduction Standard was based on a health risk assessment study that used forecasted reductions in geographically allocated DPM emissions as the key input. Therefore, reductions in DPM mass emissions associated with CAAP measures and applicable regulations are a representative surrogate for health risk reductions. It should be noted that the use of DPM emissions as a surrogate for health risk reductions is to track relative progress. A more detailed health risk assessment will be prepared by the Port outside of this EI. Progress to-date on health risk reduction is determined by comparing the change in DPM mass emissions to the 2005 baseline. Figure 9.14 presents the progress of achieving the standard to date.
Figure 9.14: Health Risk Reduction Benefits to Date
As shown above, by 2011 the Port is over three quarters of the way towards meeting the 2020 Health Risk Reduction Standard.


Inventory of Air Emissions CY 2011
Port of Los Angeles 188 July 2012
SECTION 10 LOOKING FORWARD 10.1 Anticipated Impacts of Control Programs on Emissions in 2012 As presented in this 2011 EI report, the port-related mobile source emissions have continued to decrease over the last several years in part due to the reduced cargo throughput (reflective of global economic conditions) as well as the implementation of the CAAP and regulatory programs affecting these sources. For 2012, the trend in TEU throughput is expected to increase as evidenced by the TEU throughput levels in the first quarter of 2012. Although the anticipated increase in throughput level in 2012 may offset some of the emissions reductions seen in 2011, the implementation of the CAAP measures and regulatory programs will continue to provide emissions benefits in 2012 and later years. The 2012 EI will reflect the Port’s actual throughput level in 2012 and the net emissions benefits associated with these programs and strategies. In addition, consistent with the Port’s EI development process, the latest available emission factors and methods as well as methodological improvements will be incorporated in the 2012 EI. The following is a brief description of the anticipated impacts of control programs and measures in 2012 for each category, which will result in further reduction of emissions from these port-related sources: OGV In 2012, continued implementation of the CAAP measures, including the use of shore power for vessels at berth and the Port’s vessel speed reduction program, will result in significant emission benefits. In addition, CARB’s marine fuel regulation requiring the use of lower sulfur fuel (0.5% sulfur) in main and auxiliary engines and auxiliary boilers within 24 nm of the California coastline, which became effective on July 1, 2009 will continue and the new regulatory boundary will be in effect in 2012. Further, the trend toward newer vessels complying with new IMO standards and incorporating emission reduction technologies is expected to continue offering additional emission benefits in 2012. Harbor Craft Under CARB’s regulation for commercial harbor craft, in-use, newly purchased, or replacement engines in crew boats, commercial fishing vessels, ferries, excursion vessels, tug boats, and tow boats must meet EPA’s most stringent emission standards per a compliance schedule set by CARB for in-use engines and from new engines at the time of purchase. For harbor craft with home ports in the SoCAB, the compliance schedule for in-use engine replacements began in 2010 with the oldest model year engines (1979 and earlier).
Inventory of Air Emissions CY 2011
Port of Los Angeles 189 July 2012
CHE In 2012, the continued implementation of the CAAP measure for CHE and CARB’s in-use CHE regulation will result in emissions benefits due to the replacement of existing older equipment with newer and cleaner equipment powered by on-road engines or the cleanest engine available. Retrofitting equipment with diesel particulate filters and other verified technologies will continue to increase. Locomotives The 1998 MOU among the Class 1 railroads (UP and BNSF), CARB, and EPA requires the accelerated introduction of cleaner locomotives in SoCAB. Specifically, the MOU required BNSF and UP to achieve fleet-wide average emission rates meeting EPA’s Tier 2 line haul emission standards for their locomotives operating in SoCAB by 2010. Additional reductions in subsequent years are anticipated from line haul locomotives due to implementation of the MOU and continued turnover of the locomotives fleet. HDV Under the Port’s Clean Truck Program (CTP), following the first phase of the progressive ban of older trucks operating at the Port (banning pre-1989 trucks from port service) in October 2008, the second phase of the CTP was implemented in 2010. Specifically, as of January 1, 2010, all 1989-1993 model year trucks, as well as the non-retrofitted 1994-2003 model year trucks (i.e., not achieving CARB Level 3 PM reduction plus 25% NOx reduction), were banned from port service. The final ban, which bans all pre-2007 trucks, will come into effect January 1, 2012; will result in significant HDV reductions in 2012. Implementation of the CTP has resulted in significant emissions reductions due to turnover of older trucks with newer. The Port will continue the efforts to increase the population of alternatively-fueled trucks serving the Port. 10.2 Future Improvements to Emissions Inventory Methodologies In an effort to improve the annual air emissions inventories, the methodologies to estimate emissions continue to evolve with the development and discovery of new data and information. This subsection describes potential improvements to methodologies for estimating emissions in future inventories, by category. OGV Improvements to the methodology to estimate OGV emissions will be considered in at least three areas:
1) Engine modification technologies incorporated into new engines as standard practice and installed as retrofits in existing vessels. The ports will continue to work with engine manufacturers and shipping companies, and through the TWG process, to further refine the emissions benefits associated with slide valves (new engines and retrofits) as well as other technologies being implemented;
Inventory of Air Emissions CY 2011
Port of Los Angeles 190 July 2012
2) In an effort to continue to improve the auxiliary engine loads by vessel mode, a new approach will be considered, in consultation with TWG, based on VBP reported auxiliary loads (actual power of the engine used), by vessel class and by mode instead of using the average installed auxiliary engine power adjusted by applying load factor by vessel class and mode. Under the proposed approach, default loads for auxiliary engines by operating mode will be based on the average of loads for each vessel subclass recorded for vessels boarded. Load factors would no longer be used in conjunction with installed power, as load factor is not a scalable variable by vessel owner and class, which may result in potential over/under estimates of auxiliary engine load. Information from CARB surveys, if available, will also be used for filling data gaps; 3) The proposed CARB boundary change for the OGV Fuel Regulation will be taken into consideration.
In discussions about the propulsion engine low load adjustments with MAN B&W and Wärtsilä, two of the major marine propulsion and auxiliary engine manufacturers, the engine manufacturers have indicated that the values are significantly higher than they would expect to see during normal engine operation at low loads. The LLA issue will be evaluated with the engine manufacturers during the next cycle of the EI and adjustments will be made as appropriate. Harbor Craft The Port will work closely with vessel operators who provide activity data for the entire domain to separate out port-related activity, if possible. The Port will also work with CARB to harmonize GHG emission factors for harbor craft. As a part of data collection enhancement, the Port will strive to obtain engine emission certification for the recently purchased or repowered engines that may be available at the time of purchase or repower.
CHE Due to the economic conditions and other factors, the usage (hours per year) of the CHE can vary from year to year. Since the emissions deterioration is a function of cumulative hours and it is calculated by multiplying the hours per year of the calendar year by the age of the engine in that year, an annual usage significantly higher or lower than average can artificially increase or decrease the emissions deterioration compared to past years. In order to be consistent from year to year, a methodology to track past calendar year usage may be developed and used for emissions deterioration calculations. Another option is to request tenants, during data collection process, to provide the cumulative hours for each piece of equipment, but this may prove difficult due to data unavailability and additional burden on the tenants’ time.

Inventory of Air Emissions CY 2011
Port of Los Angeles 191 July 2012
Locomotives The Port expects to receive information from CARB on the Class 1 railroads’ methods of complying with the MOU requiring an average of Tier 2 emissions in 2010 and later years. This information is expected to include the percentage of line haul locomotives in each tier level, the fleet mix, among locomotives arriving and departing the SoCAB; this will allow the emission estimates to reflect local conditions rather than EPA’s nationwide fleet mix assumptions for the calendar year. The information may also include more specifics on the types of switching locomotives in use by the Class 1 railroads. HDV As part of the San Pedro Bay Ports' Clean Trucks Programs, the container terminals have been collecting truck entry data using RFID technology. This data is collected and correlated with truck-specific information contained in the Port Drayage Truck Registry (PDTR) that has also been established as part of the truck programs. The RFID/PDTR may be used in future years in lieu of OCR/DMV data for evaluating the model year distribution of future port-related fleets.