2011 magnaglobal-advertising-forecast
TRANSCRIPT

2011 ADVERTISING FORECAST
2011 ADVERTISING FORECAST

2011 ADVERTISING FORECAST
0.1%
1.7%
4.1%
5.8%
6.1%
6.3%
6.8%
9.1%
11.8%
12.1%
15.2%
19.4%
19.6%
0% 10% 20% 30%
Magazines
Newspapers
Radio
Broadcast Television
Other Internet
Core Media Average
Other Out-Of-Home
Cinema
Paid Search
Pay TV
Digital Out-Of-Home
Mobile
Online Video
As economies started to recover from the collapse of real estate-fueled bubbles in much of the world, 2010 brought a period
of relative stability—and in many instances improvement - compared to the upheavals experienced during 2009. While
painful adjustments to a state of equilibrium will take many years for some economies, especially Greece and Ireland, other
nations such as China and India continued to rocket ahead as if the global financial crisis never occurred. In 2011, countries
posting growth will more than compensate for the relatively small number of laggards.
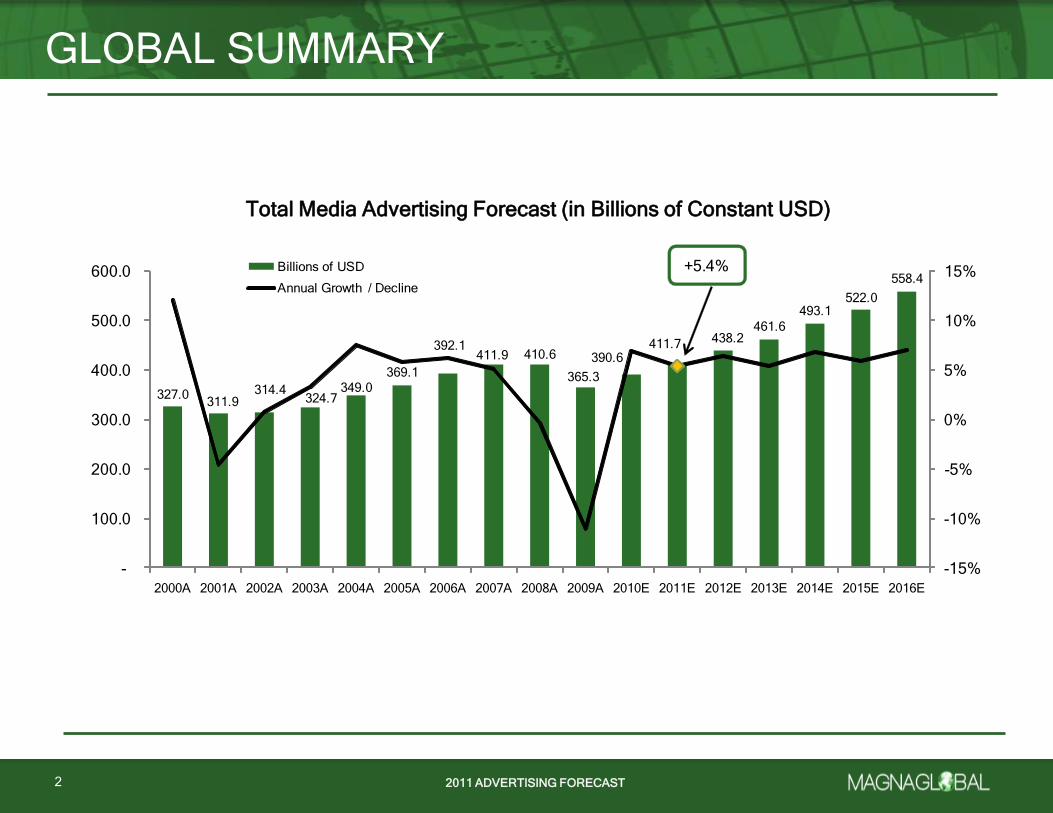
Under these conditions, some sense of normalcy is in place for the ad-supported media economy during 2011. Globally,
and in constant currency terms, we expect growth of 5.4% during 2011, slightly slower than the 6.9% rate we now expect for
2010. These figures compare with our prior expectations for 4.5% and 5.6% we previously published for 2011 and 2010,
respectively. In general, our expectations have improved somewhat - typically by more than a half percent – for all years
going forward. We expect advertising growth to average 6.3% each year.(a)
But assessing the true state of the global advertising economy requires an assessment in dynamic currency terms
(accounting for changes in currencies), as this reflects the growth that will actually be experienced by participants in the
global advertising economy. Because they reflect changes in exchange rates, dynamic currency growth rates arguably
reflect the rate of growth that analysts and advertisers alike should consider when assessing the long-term strength of the
industry. This frame of analysis takes on greater importance in light of volatility in global currency markets. Practices
including Quantitative Easing and other forms of de facto currency management by governments have the effect of
artificially (and perhaps temporarily) altering exchange rates.
In dynamic currency terms (and from a US Dollar perspective) we expect global advertising growth of 9.2% in 2011, in line
with the trend in 2010. Over the following five years we expect growth to average 7.3% in dynamic currency terms through
2016. This assumes that the Euro and Yen depreciate 1.6% and 1.5%, respectively, while the Chinese RMB appreciates
6.5% over the five-year time frame. For purposes of comparability with current conditions and forecasts made by others, all
other figures in this report will be conveyed in constant currency terms, unless otherwise stated. Dynamic currency growth
rates for all countries (and media within each country) are included in the spreadsheet versions of our global forecast
models.
In 2011, we expect the fastest growing markets to include Argentina, China, India, Kazakhstan and Ukraine. Over the years
leading up to 2016, Argentina, China, India, Kazakhstan and Serbia will be the fastest growing countries. The slowest
growing markets in 2011 include Croatia, Greece, Ireland, Portugal, and Spain. And looking further ahead, we expect
France, Ireland, Japan, Portugal and Spain to grow the least between 2012 and 2016.
Not surprisingly, varying growth rates will result in a gradual transition of the rankings of the world’s dominant advertising
economies. The fastest rising large markets – including China and India of course, but also Brazil and Russia – will
increasingly sit alongside the historically dominant US, Japan, Germany, the UK and France as the countries whose
advertising trends and technologies increasingly set the pace for the rest of the world.
INTRODUCTION
(a) Growth rates are expressed in nominal terms, and do not discount for inflation. This is more appropriate than ―real‖ (In flation-adjusted) growth rates because budgets for advertisers and media-owners alike are set, and revenue growth trends are analyzed by analysts in nominal terms in most countries around the world. We recommend analyzing global growth rates through the lens of a home currency, with foreign country figures converted using dynamic currency terms.
Compounded Annual Growth Rates 2011-2016 by Medium
Note: Other Out-Of-Home excludes digital and cinema. Other Internet excludes search, online video, and mobile
1
2011 ADVERTISING FORECAST2011 ADVERTISING FORECAST
GLOBAL SUMMARY
2
All Media Advertising Forecast (in Billions of Constant USD)
327.0311.9
314.4324.7
349.0
369.1
392.1411.9 410.6
365.3
390.6411.7 438.2
461.6
493.1522.0
558.4+5.4%
-15%
-10%
-5%
0%
5%
10%
15%
-
100.0
200.0
300.0
400.0
500.0
600.0
2000A 2001A 2002A 2003A 2004A 2005A 2006A 2007A 2008A 2009A 2010E 2011E 2012E 2013E 2014E 2015E 2016E
Billions of USD
Annual Growth / Decline
Total Media Advertising Forecast (in Billions of Constant USD)

2011 ADVERTISING FORECAST
In our analysis of advertising around the world, we have observed that critical drivers in advertisers’ budget-setting activities
include the competitive intensity (and potential for differentiation that advertising facilitates) in a given category or territory.
We have further identified that industry growth relies upon the creation of new categories which are in turn highly
competitive. In this context, economic growth serves as a proxy for advertising growth because it is possible for an
economy to generate growth without new category formation or increasing competitive intensity inside of categories. Using
this proxy, regions expecting weak economic growth (for example, much of western Europe) will generally see advertising
markets which under-perform global benchmarks, and regions undergoing rapid economic growth will exceed them (for
example, much of Asia and Latin America).
Despite macro-economic change, the media industry itself is structurally rigid in almost every country. This is partly due to
limits on consumers’ capacity for change, and partly because government regulations on the industry are heavily
entrenched. Content creators, producers, packagers, distributors and device manufacturers are all critical to fostering the
sector’s evolution - for consumers and advertisers alike. However, meaningful change generally doesn’t occur unless
incumbent media owners anticipate that they will benefit (or fear stagnation) and take corresponding actions. That does not
mean we won’t see incremental change, and thus we must consider other key factors that may impact ad-supported media.
First, technology can allow a new medium to serve the same function offered by a traditional medium, and offer a wholesale
replacement to a legacy service. For example, in many countries, consumers have swapped the directories advertising they
historically used for search engines. Search could easily eliminate legacy yellow pages publishers because search engines
are able to establish a direct relationship with content producers (effectively, the advertisers) and consumers. Paid search
content requires so little bandwidth that there is no need to negotiate with an internet service provider to ensure the
information reaches the user. Such change cannot easily or quickly be replicated in other media given the inherently more
complicated – and often regulated – elements contained therein.
Second, technology can support the fragmentation of audiences across content as it becomes increasingly more cost-
effective to target niche audiences, allowing for smaller increments of advertising units. Such divisions make it possible for
new advertisers to use a medium because of the enhanced flexibility in terms of cost and targeting (whether by geography,
demography or other factors). The rise of advertising on pay TV programming in countries around the world illustrates this
effect. Pay TV programming usually involves a wide range of narrowly targeted channels, none of which can generate the
audience sizes incumbent free to air broadcasters have historically maintained. So, while some large advertisers use
advertising on pay TV programming to reduce their costs (because Pay TV programmers often offer their inventory at lower
prices) or enhance their targeting, small and mid-sized advertisers who may have otherwise have been priced out of the
medium find themselves with national access and low price points.
INTRODUCTION
3
About MAGNAGLOBAL
MAGNAGLOBAL is the strategic global media unit responsible for forecasts, insights and negotiation strategy across all media channels on behalf of Mediabrands, part of Interpublic Group (NYSE: IPG).
With $26 billion in global media billings according to RECMA, MAGNAGLOBAL exercises serious clout. But MAGNAGLOBAL’s clout is driven by much more than simply buying power.
Our sophisticated approach to managing data and insights delivers actionable intelligence to our affiliated planning and buying teams around the world.
More importantly, our ability to be nimble provides us with flexible scale: through a client-centric approach our negotiations are led by individual client needs, and the highest degree of confidentiality is always maintained. We do not sacrifice individual client objectives for the sake of a consolidated negotiation, but instead negotiate collectively when it is in the interests of each individual client to do so.
This enables us to offer each client maximum value and cost-effectiveness, with local, regional and global media owners.
MAGNAGLOBAL also provides strategic advisory services and analytical tools for assessing the media industry. We specialize in analysis of advertising-supported media sectors, including distribution services (such as cable, satellite and telecom services) as well as related technologies which impact the media economy.
For more information, please contact us at: [email protected]

2011 ADVERTISING FORECAST2011 ADVERTISING FORECAST
Third, technology supports fragmentation of advertising inventory within the same content as illustrated by behavioral
advertising techniques online, whereby anonymous user data or anonymous user profiles are created to segment viewers of
online content. Different advertisements can then be inserted into the same content when viewed by different users. Still-
nascent applications may allow such approaches to be applied to addressable advertising in television on a wider scale in the
future. While many advertisers will continue to orient their marketing activities around content association for their brands,
portions of budgets can be allocated to inventory which connects back to a consumer behavior (such as purchases of goods
offline) or other ―strategic‖ objectives.
Related to the presence of new technologies, operational ―friction‖ strongly influences the pace of change even when all
industry participants want change to occur. New media inventory owners and advertisers must work through issues when
new technologies are developed oblivious to advertisers’ requirements in using new technologies on an operational (distinct
from experimental) basis. For example, new media suppliers must integrate their billing systems with advertisers’ ―book-bill-
pay‖ processes in order to enable the authorization of budgets. As another example, cable operators’ video-on-demand
systems were developed to allow for advertising, but not the ability to change creative units on relatively short notice (also
known as ―dynamic ad insertion‖). Even today, nearly ten years after VOD systems first became widely available to
advertisers in the United States, the absence of dynamic ad insertion capabilities on the vast majority of cable systems limits
the ability of larger advertisers to sponsor content on such platforms.
Factors other than technology influence advertising budget-setting, and are arguably under-appreciated by most industry
observers. Studying the advertiser universe involves understanding that advertisers should be segmented for study much as
we would conventionally think of segmenting consumers for analysis. We establish these segmentations on dimensions of
advertisers’ life cycles and the relative sizes of different groups of advertisers. Assessing these sub-segments allows for a
clearer understanding of underlying trends affecting advertising budgets.
A brand’s progression through its life cycle is illustrated by our observations of decisions made by marketers as their brands
mature. They may no longer focus on mass awareness objectives, naturally leading to other marketing services that support
growth. But if newer advertisers emerge whose objectives are defined in a manner which is similar to older advertisers’
objectives, it may appear that collectively advertisers are still focused on mass awareness (in this illustration, true at the
aggregate level, but untrue at the individual advertiser level). An equally important dimension is the relative presence of large
vs. small advertisers in the overall economy. A range of factors – for example, higher effective tax rates on larger companies,
the availability of high technology at lower prices at smaller scales, the ease of securing national distribution for products
through national retailers and the presence of outsourcing in a manner which allows a small company to produce at costs
previously attainable only by larger companies – favors the relative importance of smaller companies in the economy. As
smaller companies can better assess the impact of certain media (such as paid search, social media and public relations),
and as many will not have started using mass media, a disproportionate share of growth may follow into different advertising-
supported media as a result.
INTRODUCTION
4
MAGNAGLOBAL’s Approach to Media Forecasting
Beginning with our forecasts published during 2009, MAGNA has redefined how to measure the advertising-supported media economy.
Historical approaches focused on benchmarking changes in marketing expenditures in order to benchmark marketers against each other.
Although a valuable endeavor, this approach lacks verifiable data (relatively few marketers publish the size of their marketing expenditures in their annual accounts, and third party ―rate card‖ monitoring services include figures which vary significantly from observed activities) and is subject to a more guesswork than an approach which focuses on media suppliers’ advertising revenues. In many countries, many suppliers publish detailed figures on their advertising revenues, often broken out by medium. Trade associations often aggregate true revenues for benchmarking purposes, and by virtue of the small number of individual members, it is relatively easy to ensure that actual revenues or estimates for all players in a market are included.
Further, our approach is designed to study media suppliers’ behaviors as they follow real revenue growth opportunities. We believe this is the most ―correct‖ way to view the media industry’s advertising activities because a deeper understanding of suppliers’ businesses allows us to foster better business relationships with them on behalf of marketers.
This approach is also more consistent with the figures that investors need to benchmark. Insights we derive from this vantage point help us anticipate suppliers’ corporate strategies and long- term capital allocation choices – again, helping us to better understand the future of the industry on behalf of all of its participants.
2011 ADVERTISING FORECAST
0 100 200 300 400 500 600
IndiaPhilippines
PeruUkraine
KazakhstanIndonesiaMorocco
ChinaRomaniaEcuador
SerbiaColombia
MexicoLithuania
EgyptBulgaria
TurkeyLatvia
LebanonPanamaHungaryThailand
RussiaBrazil
CroatiaPoland
ChileSlovakiaEstonia
South AfricaCosta Rica
TaiwanMalaysia
Czech RepublicArgentina
PortugalSouth Korea
GreeceSlovenia
Hong KongSpainGCCItaly
Puerto RicoDenmark
FranceSwedenBelgium
JapanNetherlands
New ZealandSingapore
CanadaGermany
United KingdomFinlandIrelandAustria
United StatesSwitzerland
AustraliaNorway
INTRODUCTION
5
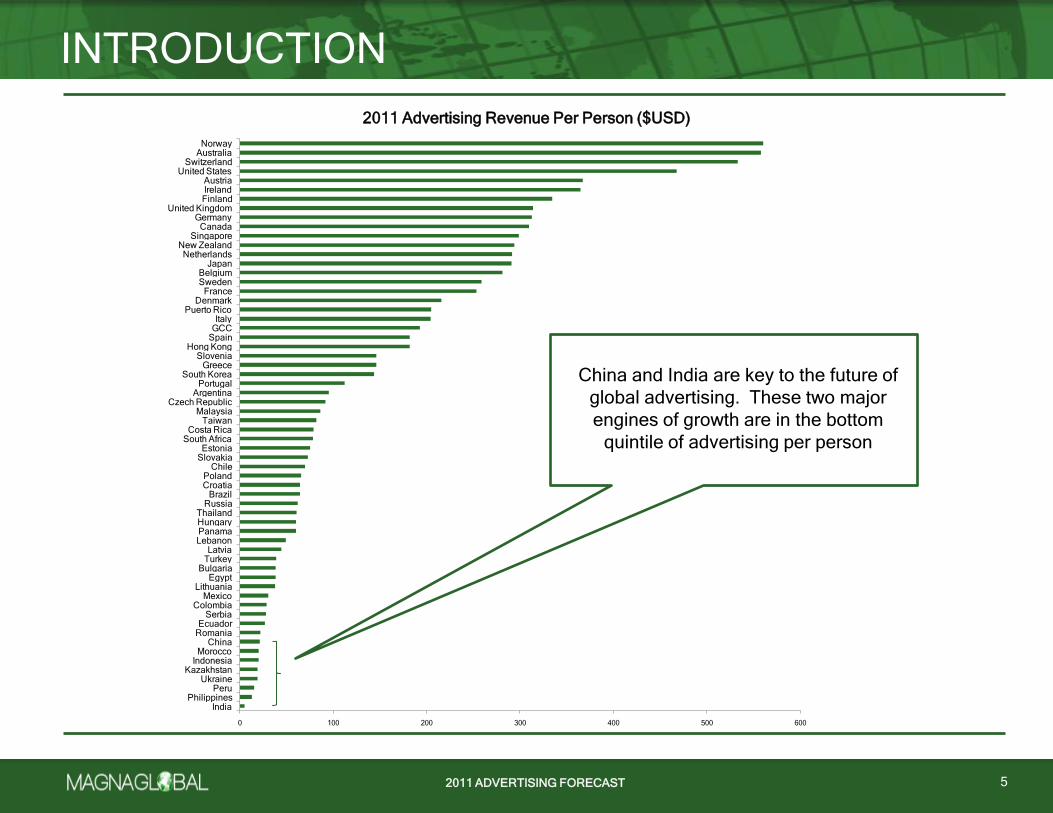
China and India are key to the future of
global advertising. These two major
engines of growth are in the bottom
quintile of advertising per person
2011 Advertising Revenue Per Person ($USD)

2011 ADVERTISING FORECAST2011 ADVERTISING FORECAST
Advertisers’ organization design is our last factor, and arguably the most important one to consider when studying the world’s
largest companies. We have observed that businesses organize themselves in a manner which reflects their highest
priorities, and accept that trade-offs are made, with inferior outcomes for some aspects of their operations. Put simply, it is
impossible to organize a business against all priorities. A company will establish priorities based on what it believes will
optimally satisfy stakeholders (which may include shareholders, employees, governments, unions or other civil society
groups) while maximizing management’s own goals in terms of compensation or other professional objectives.
To illustrate, imagine a large, multi-brand consumer-oriented manufacturer that determines that its highest business priorities
are a) labor union management, b) manufacturing efficiency and c) distributor relationships. Marketing and media are still
important of course, but in this instance not among the top three activities which management believes necessary to
accomplish near-term objectives. It is likely that responsibilities for marketing-related activities will be managed by functional
groups, whose responsibilities cut across business units. These groups will report through different lines into the senior
management team.
Consider further that individuals with responsibilities for distributor relationships and product development fall under different
reporting hierarchies in the organization, both equally distinct from the reporting hierarchy of a centralized marketing and
media management group (who may report through a procurement function to a Chief Operating Officer). While everyone in
the organization may be incentivized to co-operate, and collaboration will be frequent, it will be difficult (to say the least) to
determine whose contribution led to success or failure. Thus individuals focus on the activities whose outcomes they can
best influence. This can mean that media budget-setters may be effectively forced to make decisions to optimize the
decisions they uniquely are held accountable for, such as ―national brand awareness.‖ This, in turn, orients large shares of
budgets around awareness-driving media such as television because reach and frequency are metrics which have been
proven to drive brand awareness, and because television dwarfs all other media on those dimensions in most countries.
Further, the holder of large budgets will generally be unable to distinguish the business impact of the use of a smaller-scale
medium from ―noise‖ against these metrics, because the reliance on traditional media vehicles so vastly overwhelms the
exposures which are possible through newer media vehicles. Similar organizational biases may cause e-commerce
companies to keep their budgets in an online environment when the use of offline media could contribute to superior business
outcomes. None of this is to say there are not large marketers who genuinely want to drive change and capitalize on the
potential of newer media, but it is to say that the best interests of a system can easily overwhelm the best interests of a
system’s underlying components. By contrast, in smaller organizations, the presence of one person responsible for all facets
of marketing, from distribution to product branding to media and creative could yield very different outcomes in terms of
budget allocations.
Optimizing against reach and frequency is not necessarily the best basis for allocating budgets, but its presence is real, and
contributes significantly to understanding why the industry has evolved as it has in the past. Undoubtedly this paradigm will
change in the future, but anticipating when it will change is akin to anticipating when a real estate market will crash. The
distinction between being wrong and being early can be indistinguishable.
INTRODUCTION
6
Contribution to global growth by region from 2011-2016
China and India together account for 26% of total industry growth between 2011 and 2016, when APAC revenues will rise from
$96bn to $151bn
EMEA23.7%
North America26.6%
APAC37.7%
Latin America12.0%
Source: MAGNAGLOBAL
2011 ADVERTISING FORECAST
0.0% 10.0% 20.0% 30.0% 40.0% 50.0% 60.0% 70.0% 80.0% 90.0% 100.0%
South AfricaIndia
IndonesiaEcuador
PhilippinesThailand
Puerto RicoPanama
EgyptMexico
PeruArgentinaMorocco
Costa RicaChile
SerbiaChina
LebanonBrazil
ColombiaRussia
KazakhstanCroatiaGreece
UruguayPortugalRomania
ItalyHong Kong
TurkeyLithuania
UkraineLatvia
HungaryCzech Republic
MalaysiaIreland
BulgariaAustralia
SpainJapan
FranceGulf Countries
TaiwanSloveniaGermany
PolandUnited States
AustriaSwitzerland
United KingdomNew Zealand
CanadaEstonia
South KoreaDenmarkBelgiumFinland
SlovakiaSingapore
NorwaySweden
Netherlands
INTRODUCTION
7
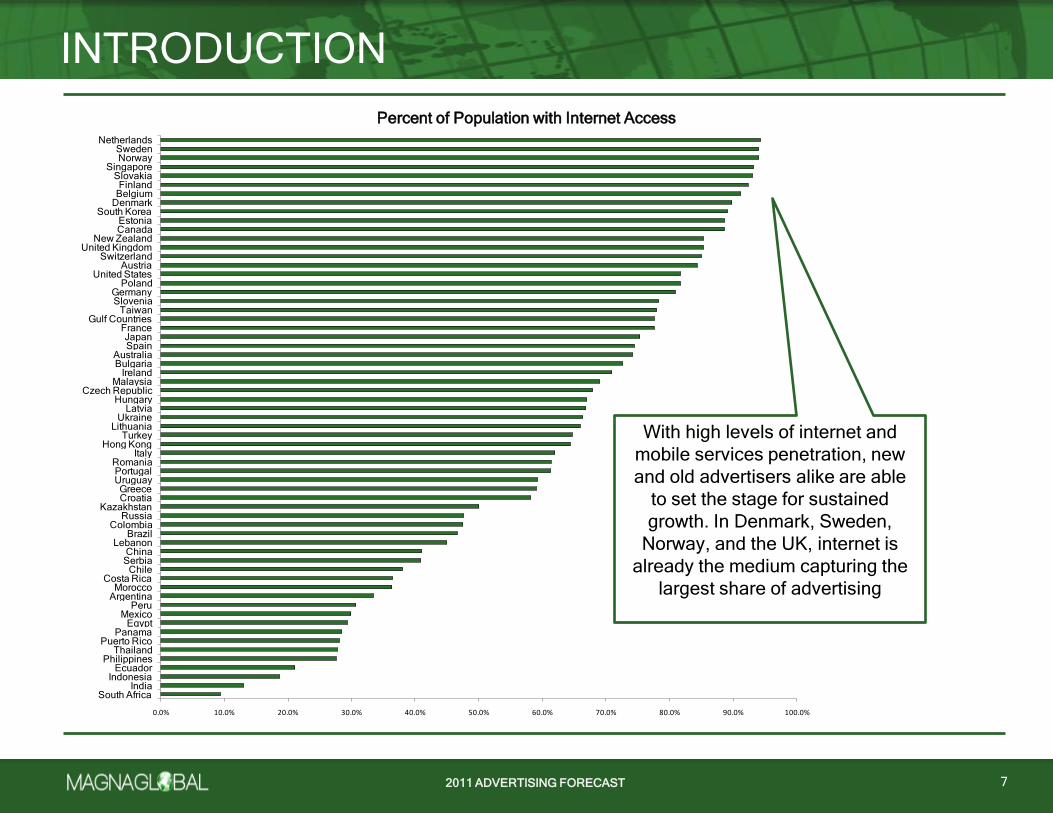
With high levels of internet and
mobile services penetration, new
and old advertisers alike are able
to set the stage for sustained
growth. In Denmark, Sweden,
Norway, and the UK, internet is
already the medium capturing the
largest share of advertising
Percent of Population with Internet Access
2011 ADVERTISING FORECAST2011 ADVERTISING FORECAST
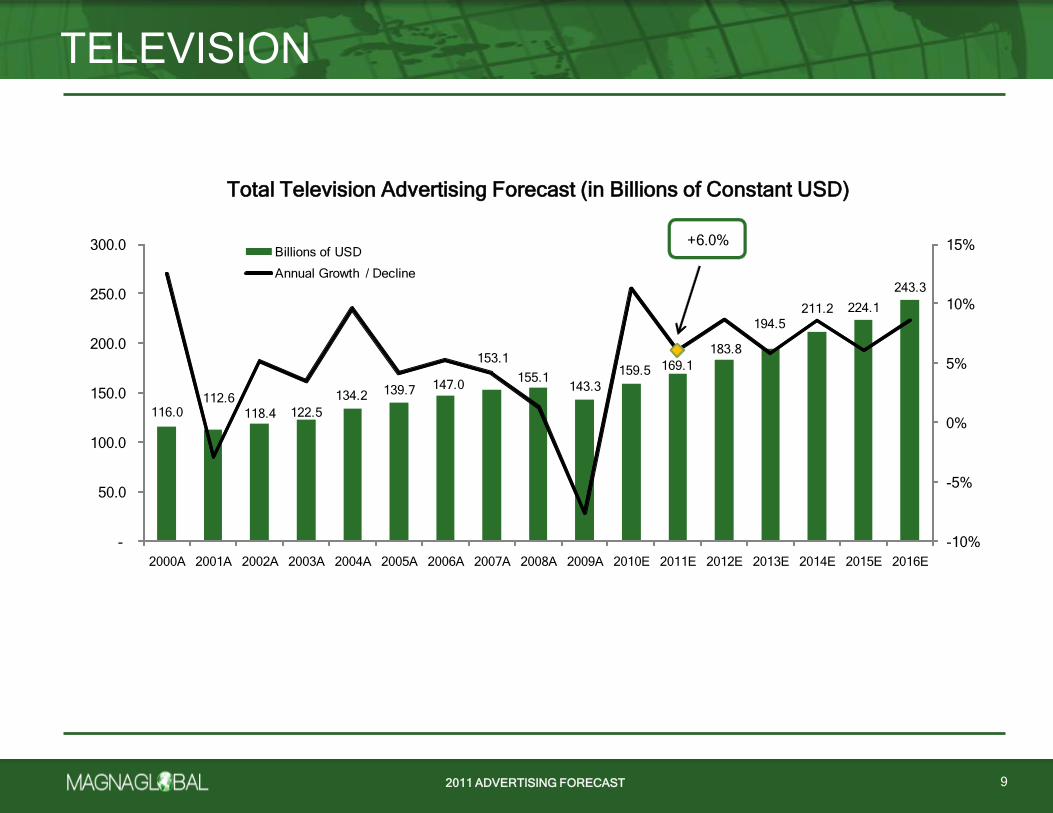
The primary driver of television advertising in markets around the world relates to advertisers’ continued focus on media
vehicles which reach a large share of a region’s population many times over the duration of a marketing campaign. In virtually
every country, consumption – and thus opportunities to reach consumers – of television dwarfs that of every other medium,
and thus serves as the primary media vehicle for many advertisers, especially large ones who differentiate themselves from
competitors on the basis of brand-based attributes. A range of factors should impact the scale of TV consumption mostly in a
manner which extends its lead over others, at least in terms of reach and frequency potential. We expect that advertising on
television will grow by 6.0% globally in 2011 and generate $169 billion in revenue. Over the following five years the industry
should grow at an average rate of 7.5% to total $243 billion by 2016. To illustrate the strength of the medium around the
world, it is noteworthy that total TV advertising totaled only $103 billion in 1999, and that the medium which captures 41% of
global advertising in 2011 will actually rise to capture 44% by 2016. The US, Japan, China, Italy and Brazil are today’s five
largest markets.
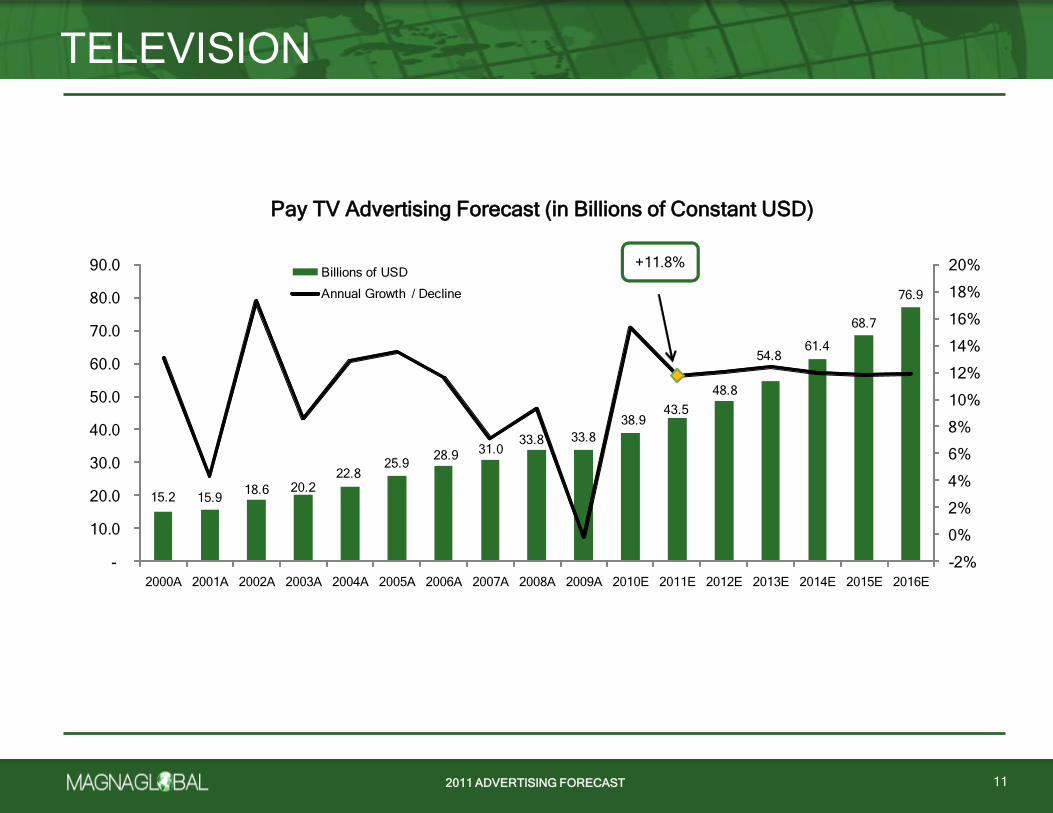
The increasing availability of multichannel TV, whether via Pay TV (via cable, satellite, or telco-delivered IPTV typically) or
through free to air digital terrestrial TV is causing fragmentation in virtually every country around the world. This
fragmentation typically contributes to rising levels of TV viewing among most audiences, reinforcing television’s dominance.
Under our definition of Pay TV advertising (which includes advertising on media outlets which are exclusively available
through distribution technologies which require incremental fees above and beyond the costs to receive costs available to
television sets with conventional analog or digital broadcast receivers), we expect growth of 12.1% on average through 2016,
as Pay TV rises from 26% to 32% of total TV advertising between 2011 and 2016.
Despite these favorable conditions, concerns about the health of TV abound. First among these factors are DVRs (also
known as PVRs), because of the ease with which consumers can skip commercial breaks while watching playback of
recorded TV programming. While penetration rates of the devices are rising off of low bases in most countries, even in
mature markets where penetration is at or around 50% of the population, usage rates are low. In the mature UK and US
markets, consumption of TV using DVRs in the homes which have DVRs accounts for less than 20% of even the most
popular TV programming after more than a decade of availability. Compounded against the minority of the population which
possess DVRs, the cumulative effect is minimal, more than offset by rising population and consumption levels.
New forms of internet-delivered television are also perceived to affect the health of the industry. But again, the impact is
generally small today and limited in the future. Online video – TV consumed over the web on a PC – has become an important
way to catch up on the most popular programming, but accounts for a very small share of video consumption in most
countries. Traditional TV dominates because the vast majority of TV is consumed in a passive, ambient manner, unlike online
video which is primarily ―lean forward‖ by nature, and a typical consumer can only spend so much time ―leaning forward.‖
More practically for advertisers, it is not entirely clear how commercials which are run during such environments differently
impact marketers’ overall objectives, given that so much consumption occurs in a passive manner. Certainly, advertisers
prefer to reach consumers in an active mode, but this preference may be offset by consumers’ lack of interest in commercial
activity at times when they prefer to remain engaged by content they have selected. As an extension of online video, ―over-
the-top‖ video services are viewed by many in the technology industry as real threats to existing pay TV services. However,
in most – but importantly, not all – countries real technological and business model barriers will prevent over-the-top services
from becoming widely adopted over the next five years. Still, countries with widely available ultra-high-speed broadband
networks and low penetration rates of Pay TV services today are more likely to experience fragmentation through over-the-top
services in the future.
TELEVISION
8
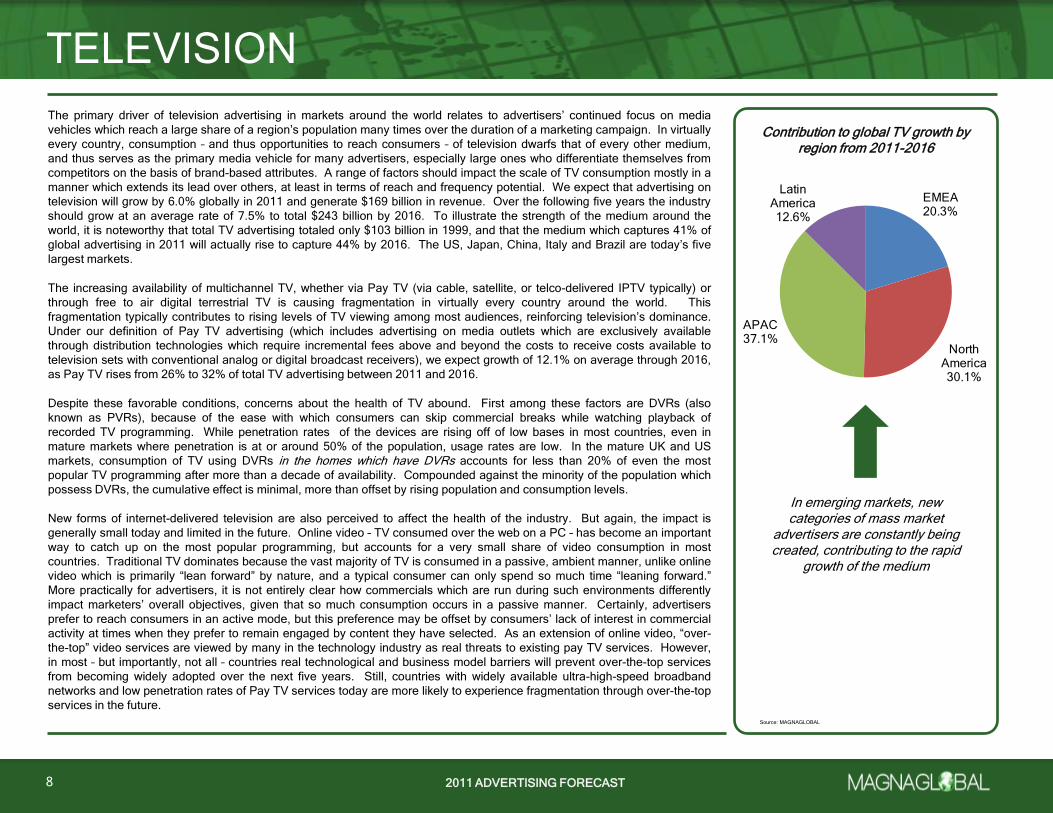
Source: MAGNAGLOBAL
EMEA20.3%
North America30.1%
APAC37.1%
Latin America12.6%
Contribution to global TV growth by region from 2011-2016
In emerging markets, new categories of mass market
advertisers are constantly being created, contributing to the rapid
growth of the medium
2011 ADVERTISING FORECAST
TELEVISION
9
Total Television Advertising Forecast (in Billions of Constant USD)
116.0112.6
118.4 122.5
134.2 139.7 147.0
153.1
155.1143.3
159.5 169.1
183.8
194.5
211.2 224.1
243.3
+6.0%
-10%
-5%
0%
5%
10%
15%
-
50.0
100.0
150.0
200.0
250.0
300.0
2000A 2001A 2002A 2003A 2004A 2005A 2006A 2007A 2008A 2009A 2010E 2011E 2012E 2013E 2014E 2015E 2016E
Billions of USD
Annual Growth / Decline
Total Television Advertising Forecast (in Billions of Constant USD)

2011 ADVERTISING FORECAST2011 ADVERTISING FORECAST
TELEVISION
10
Broadcast Television Advertising Forecast (in Billions of Constant USD)
100.896.7
99.8102.3
111.4113.8 118.1 122.2 121.3
109.5
120.5125.6
135.0139.6
149.8155.4
166.4+4.2%
-15%
-10%
-5%
0%
5%
10%
15%
-
20.0
40.0
60.0
80.0
100.0
120.0
140.0
160.0
180.0
2000A 2001A 2002A 2003A 2004A 2005A 2006A 2007A 2008A 2009A 2010E 2011E 2012E 2013E 2014E 2015E 2016E
Billions of USD
Annual Growth / Decline
Broadcast Television Advertising Forecast (in Billions of Constant USD)
2011 ADVERTISING FORECAST
TELEVISION
11
Pay TV Advertising Forecast (in Billions of Constant USD)
15.2 15.918.6 20.2
22.825.9
28.9 31.033.8 33.8
38.943.5
48.8
54.861.4
68.7
76.9
+11.8%
-2%
0%
2%
4%
6%
8%
10%
12%
14%
16%
18%
20%
-
10.0
20.0
30.0
40.0
50.0
60.0
70.0
80.0
90.0
2000A 2001A 2002A 2003A 2004A 2005A 2006A 2007A 2008A 2009A 2010E 2011E 2012E 2013E 2014E 2015E 2016E
Billions of USD
Annual Growth / Decline
Pay TV Advertising Forecast (in Billions of Constant USD)
2011 ADVERTISING FORECAST2011 ADVERTISING FORECAST
Search56.2%
Online Video14.5%
Mobile8.4%
Other21.0%
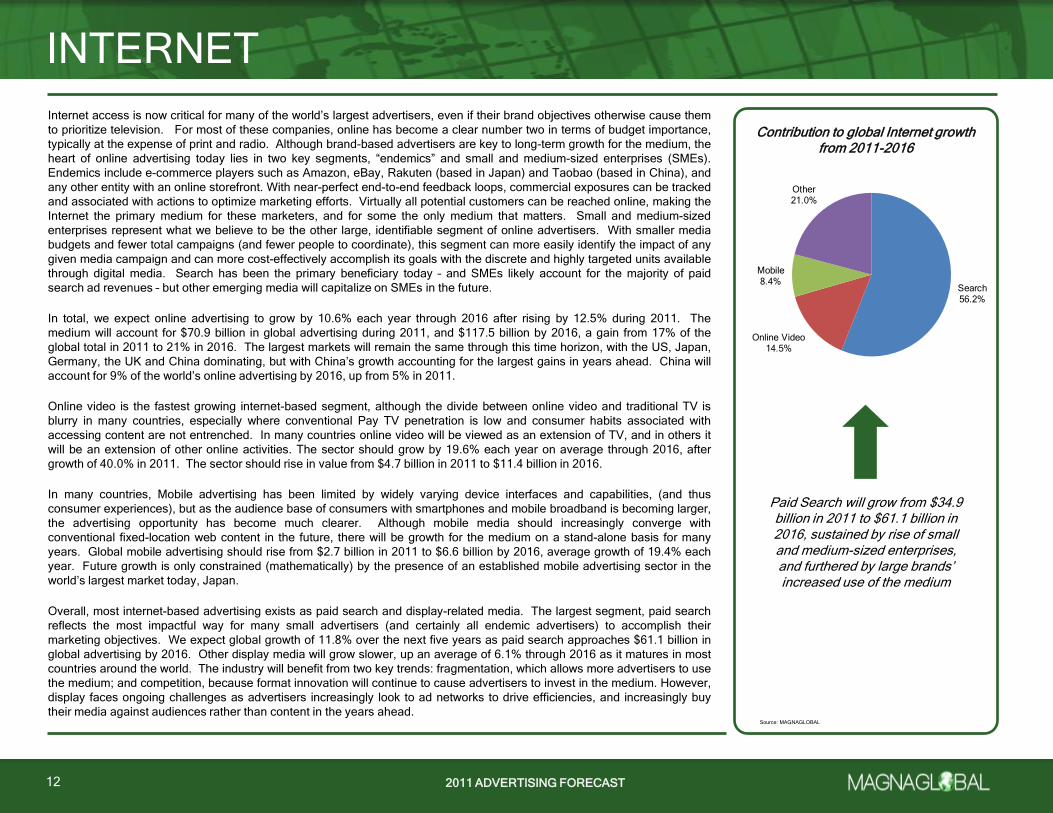
Internet access is now critical for many of the world’s largest advertisers, even if their brand objectives otherwise cause them
to prioritize television. For most of these companies, online has become a clear number two in terms of budget importance,
typically at the expense of print and radio. Although brand-based advertisers are key to long-term growth for the medium, the
heart of online advertising today lies in two key segments, ―endemics‖ and small and medium-sized enterprises (SMEs).
Endemics include e-commerce players such as Amazon, eBay, Rakuten (based in Japan) and Taobao (based in China), and
any other entity with an online storefront. With near-perfect end-to-end feedback loops, commercial exposures can be tracked
and associated with actions to optimize marketing efforts. Virtually all potential customers can be reached online, making the
Internet the primary medium for these marketers, and for some the only medium that matters. Small and medium-sized
enterprises represent what we believe to be the other large, identifiable segment of online advertisers. With smaller media
budgets and fewer total campaigns (and fewer people to coordinate), this segment can more easily identify the impact of any
given media campaign and can more cost-effectively accomplish its goals with the discrete and highly targeted units available
through digital media. Search has been the primary beneficiary today – and SMEs likely account for the majority of paid
search ad revenues – but other emerging media will capitalize on SMEs in the future.
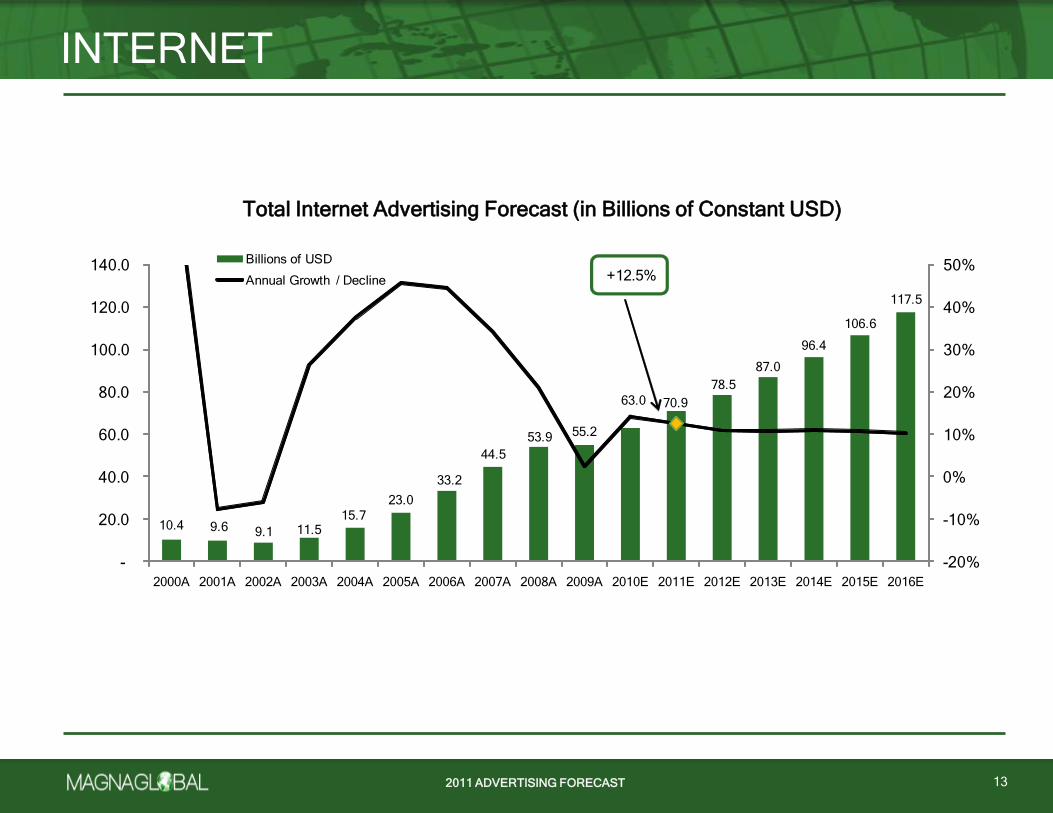
In total, we expect online advertising to grow by 10.6% each year through 2016 after rising by 12.5% during 2011. The
medium will account for $70.9 billion in global advertising during 2011, and $117.5 billion by 2016, a gain from 17% of the
global total in 2011 to 21% in 2016. The largest markets will remain the same through this time horizon, with the US, Japan,
Germany, the UK and China dominating, but with China’s growth accounting for the largest gains in years ahead. China will
account for 9% of the world’s online advertising by 2016, up from 5% in 2011.
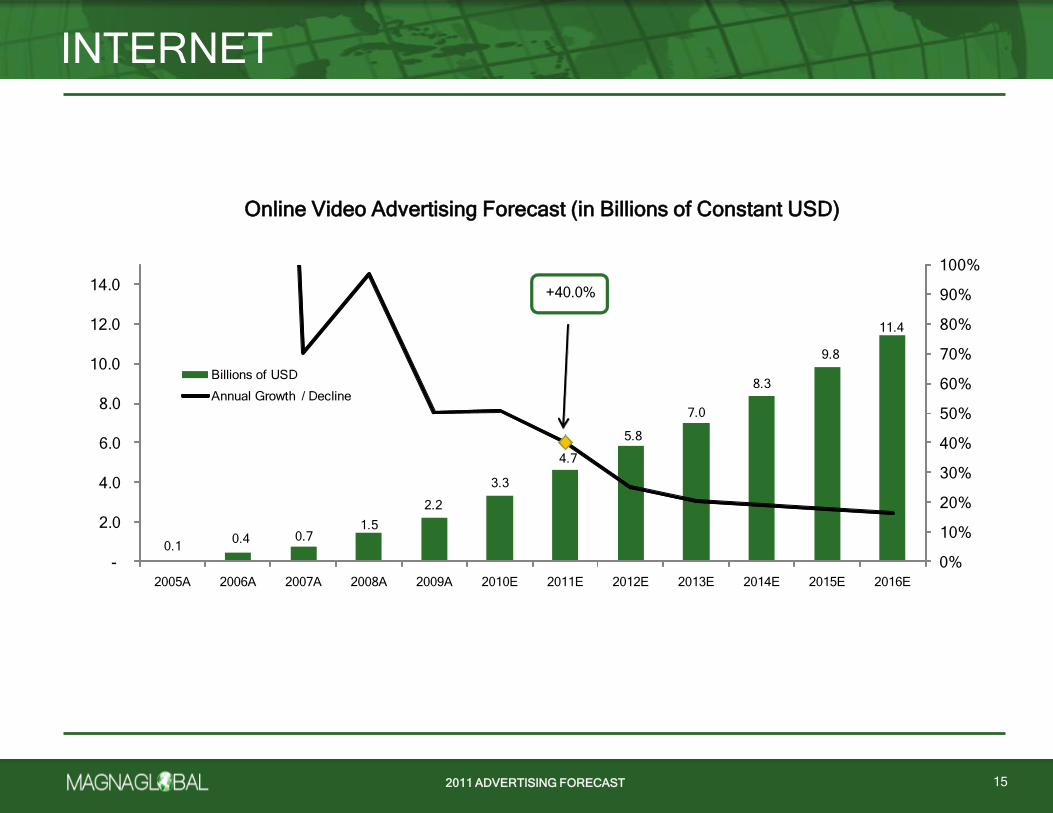
Online video is the fastest growing internet-based segment, although the divide between online video and traditional TV is
blurry in many countries, especially where conventional Pay TV penetration is low and consumer habits associated with
accessing content are not entrenched. In many countries online video will be viewed as an extension of TV, and in others it
will be an extension of other online activities. The sector should grow by 19.6% each year on average through 2016, after
growth of 40.0% in 2011. The sector should rise in value from $4.7 billion in 2011 to $11.4 billion in 2016.
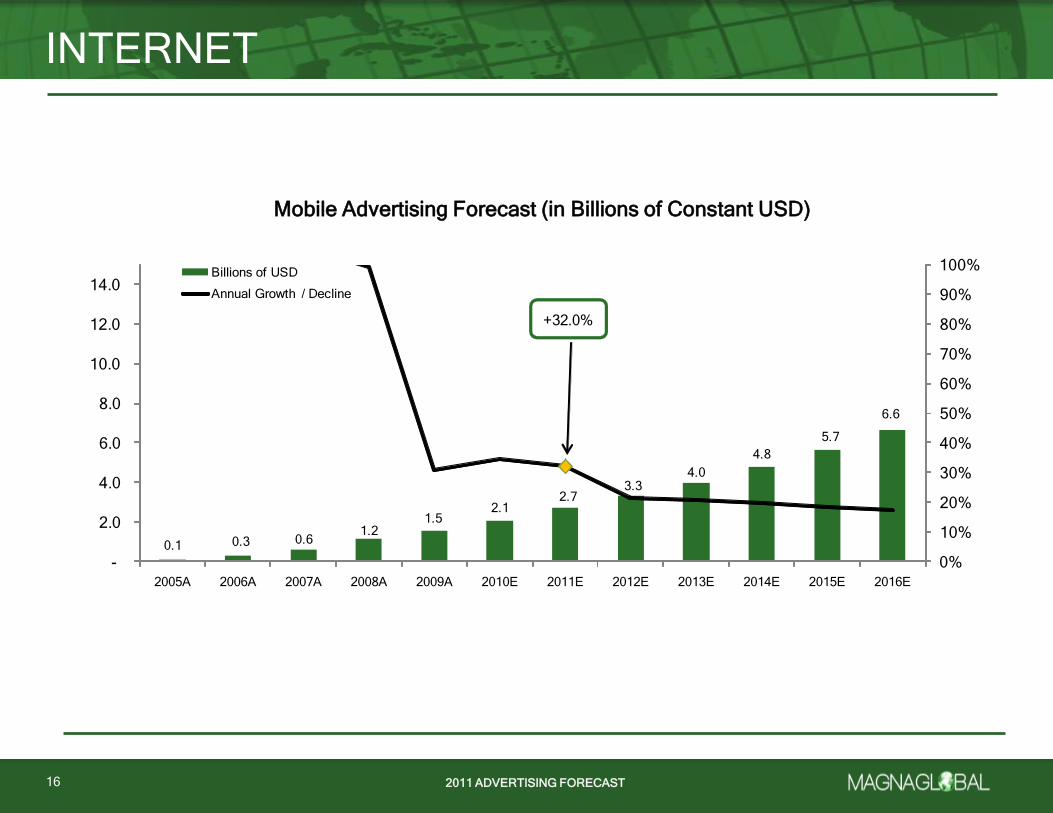
In many countries, Mobile advertising has been limited by widely varying device interfaces and capabilities, (and thus
consumer experiences), but as the audience base of consumers with smartphones and mobile broadband is becoming larger,
the advertising opportunity has become much clearer. Although mobile media should increasingly converge with
conventional fixed-location web content in the future, there will be growth for the medium on a stand-alone basis for many
years. Global mobile advertising should rise from $2.7 billion in 2011 to $6.6 billion by 2016, average growth of 19.4% each
year. Future growth is only constrained (mathematically) by the presence of an established mobile advertising sector in the
world’s largest market today, Japan.
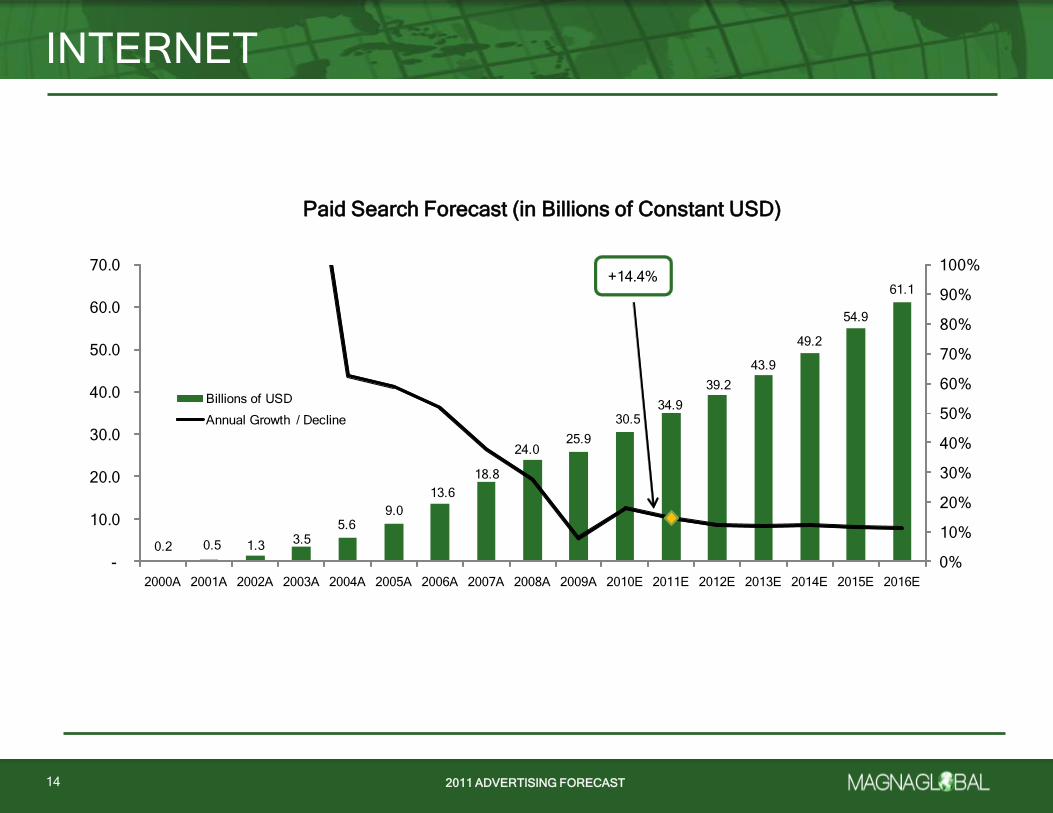
Overall, most internet-based advertising exists as paid search and display-related media. The largest segment, paid search
reflects the most impactful way for many small advertisers (and certainly all endemic advertisers) to accomplish their
marketing objectives. We expect global growth of 11.8% over the next five years as paid search approaches $61.1 billion in
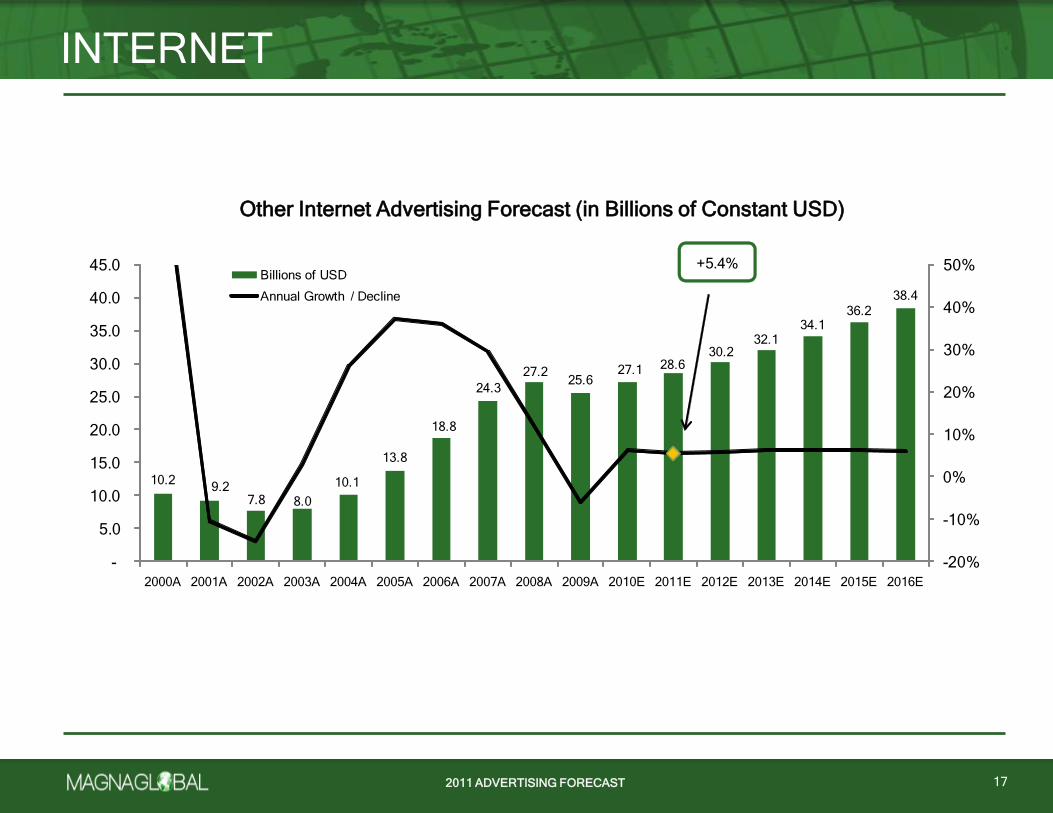
global advertising by 2016. Other display media will grow slower, up an average of 6.1% through 2016 as it matures in most
countries around the world. The industry will benefit from two key trends: fragmentation, which allows more advertisers to use
the medium; and competition, because format innovation will continue to cause advertisers to invest in the medium. However,
display faces ongoing challenges as advertisers increasingly look to ad networks to drive efficiencies, and increasingly buy
their media against audiences rather than content in the years ahead.
INTERNET
12
Paid Search will grow from $34.9 billion in 2011 to $61.1 billion in 2016, sustained by rise of small and medium-sized enterprises, and furthered by large brands’ increased use of the medium
Contribution to global Internet growth from 2011-2016
Source: MAGNAGLOBAL
2011 ADVERTISING FORECAST
INTERNET
13
Total Internet Advertising Forecast (in Billions of Constant USD)
10.4 9.6 9.1 11.515.7
23.0
33.2
44.5
53.9 55.2
63.0 70.9
78.5
87.0
96.4
106.6
117.5
+12.5%
-20%
-10%
0%
10%
20%
30%
40%
50%
-
20.0
40.0
60.0
80.0
100.0
120.0
140.0
2000A 2001A 2002A 2003A 2004A 2005A 2006A 2007A 2008A 2009A 2010E 2011E 2012E 2013E 2014E 2015E 2016E
Billions of USD
Annual Growth / Decline
Total Internet Advertising Forecast (in Billions of Constant USD)
2011 ADVERTISING FORECAST2011 ADVERTISING FORECAST
INTERNET
14
Paid Search Advertising Forecast (in Billions of Constant USD)
0.2 0.5 1.33.5
5.69.0
13.6
18.8
24.025.9
30.534.9
39.2
43.9
49.2
54.9
61.1+14.4%
0%
10%
20%
30%
40%
50%
60%
70%
80%
90%
100%
-
10.0
20.0
30.0
40.0
50.0
60.0
70.0
2000A 2001A 2002A 2003A 2004A 2005A 2006A 2007A 2008A 2009A 2010E 2011E 2012E 2013E 2014E 2015E 2016E
Billions of USD
Annual Growth / Decline
Paid Search Forecast (in Billions of Constant USD)
2011 ADVERTISING FORECAST
INTERNET
15
Online Video Advertising Forecast (in Billions of Constant USD)
0.10.4 0.7
1.5
2.2
3.3
4.7
5.8
7.0
8.3
9.8
11.4
+40.0%
0%
10%
20%
30%
40%
50%
60%
70%
80%
90%
100%
-
2.0
4.0
6.0
8.0
10.0
12.0
14.0
2005A 2006A 2007A 2008A 2009A 2010E 2011E 2012E 2013E 2014E 2015E 2016E
Billions of USD
Annual Growth / Decline
Online Video Advertising Forecast (in Billions of Constant USD)
2011 ADVERTISING FORECAST2011 ADVERTISING FORECAST
INTERNET
16
Mobile Advertising Forecast (in Billions of Constant USD)
0.1 0.3 0.61.2
1.52.1
2.73.3
4.0
4.8
5.7
6.6
+32.0%
0%
10%
20%
30%
40%
50%
60%
70%
80%
90%
100%
-
2.0
4.0
6.0
8.0
10.0
12.0
14.0
2005A 2006A 2007A 2008A 2009A 2010E 2011E 2012E 2013E 2014E 2015E 2016E
Billions of USD
Annual Growth / Decline
Mobile Advertising Forecast (in Billions of Constant USD)
2011 ADVERTISING FORECAST
INTERNET
17
Other Internet Advertising Forecast (in Billions of Constant USD)
10.29.2
7.8 8.0
10.1
13.8
18.8
24.3
27.225.6
27.1 28.630.2
32.134.1
36.2
38.4
+5.4%
-20%
-10%
0%
10%
20%
30%
40%
50%
-
5.0
10.0
15.0
20.0
25.0
30.0
35.0
40.0
45.0
2000A 2001A 2002A 2003A 2004A 2005A 2006A 2007A 2008A 2009A 2010E 2011E 2012E 2013E 2014E 2015E 2016E
Billions of USD
Annual Growth / Decline
Other Internet Advertising Forecast (in Billions of Constant USD)
2011 ADVERTISING FORECAST2011 ADVERTISING FORECAST
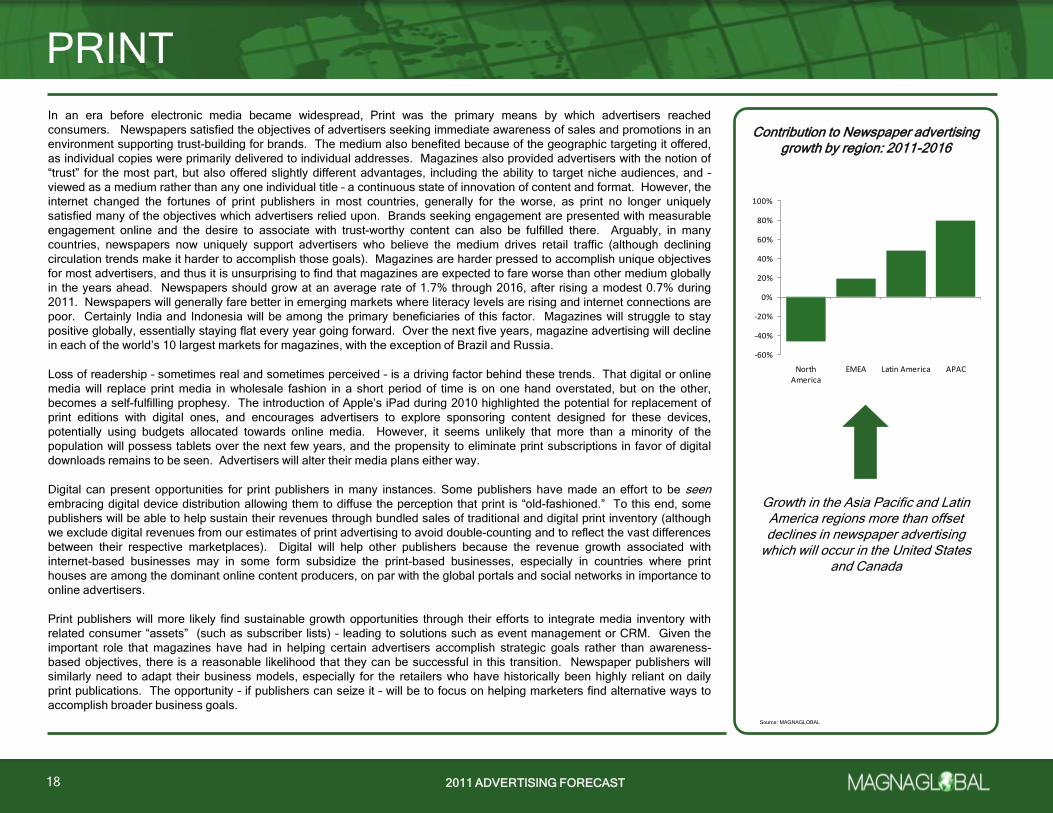
Growth in the Asia Pacific and Latin America regions more than offset declines in newspaper advertising
which will occur in the United States and Canada
In an era before electronic media became widespread, Print was the primary means by which advertisers reached
consumers. Newspapers satisfied the objectives of advertisers seeking immediate awareness of sales and promotions in an
environment supporting trust-building for brands. The medium also benefited because of the geographic targeting it offered,
as individual copies were primarily delivered to individual addresses. Magazines also provided advertisers with the notion of
―trust‖ for the most part, but also offered slightly different advantages, including the ability to target niche audiences, and –
viewed as a medium rather than any one individual title – a continuous state of innovation of content and format. However, the
internet changed the fortunes of print publishers in most countries, generally for the worse, as print no longer uniquely
satisfied many of the objectives which advertisers relied upon. Brands seeking engagement are presented with measurable
engagement online and the desire to associate with trust-worthy content can also be fulfilled there. Arguably, in many
countries, newspapers now uniquely support advertisers who believe the medium drives retail traffic (although declining
circulation trends make it harder to accomplish those goals). Magazines are harder pressed to accomplish unique objectives
for most advertisers, and thus it is unsurprising to find that magazines are expected to fare worse than other medium globally
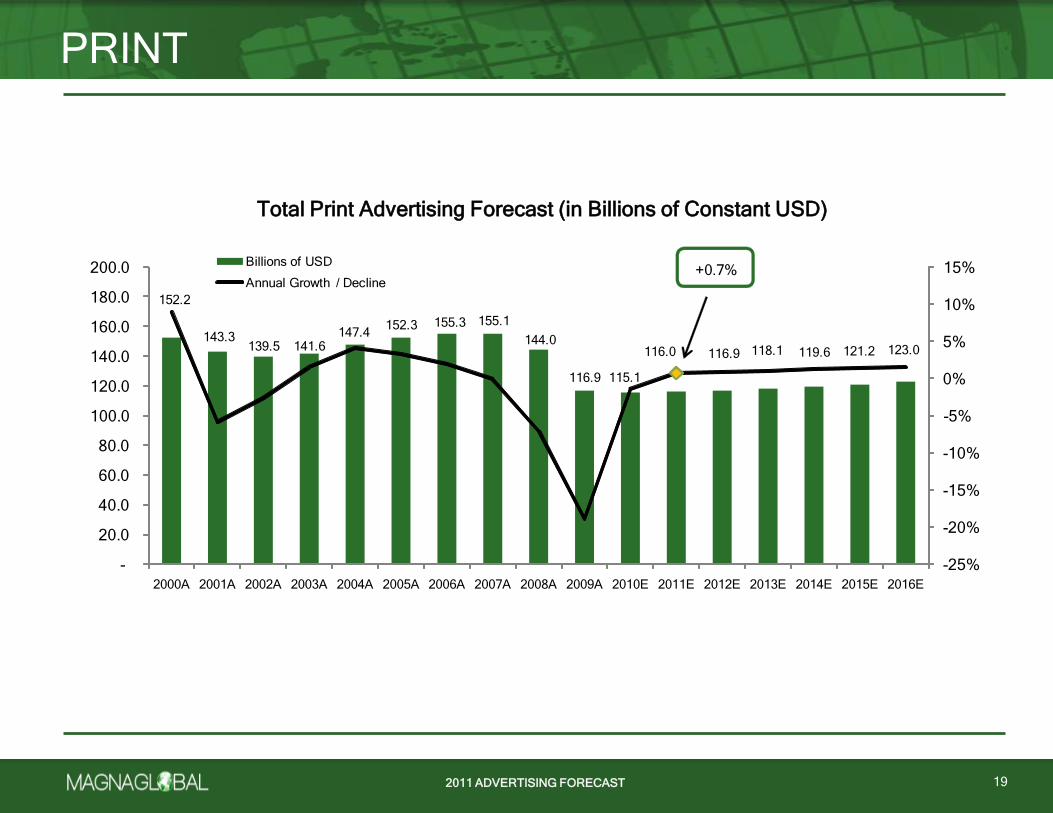
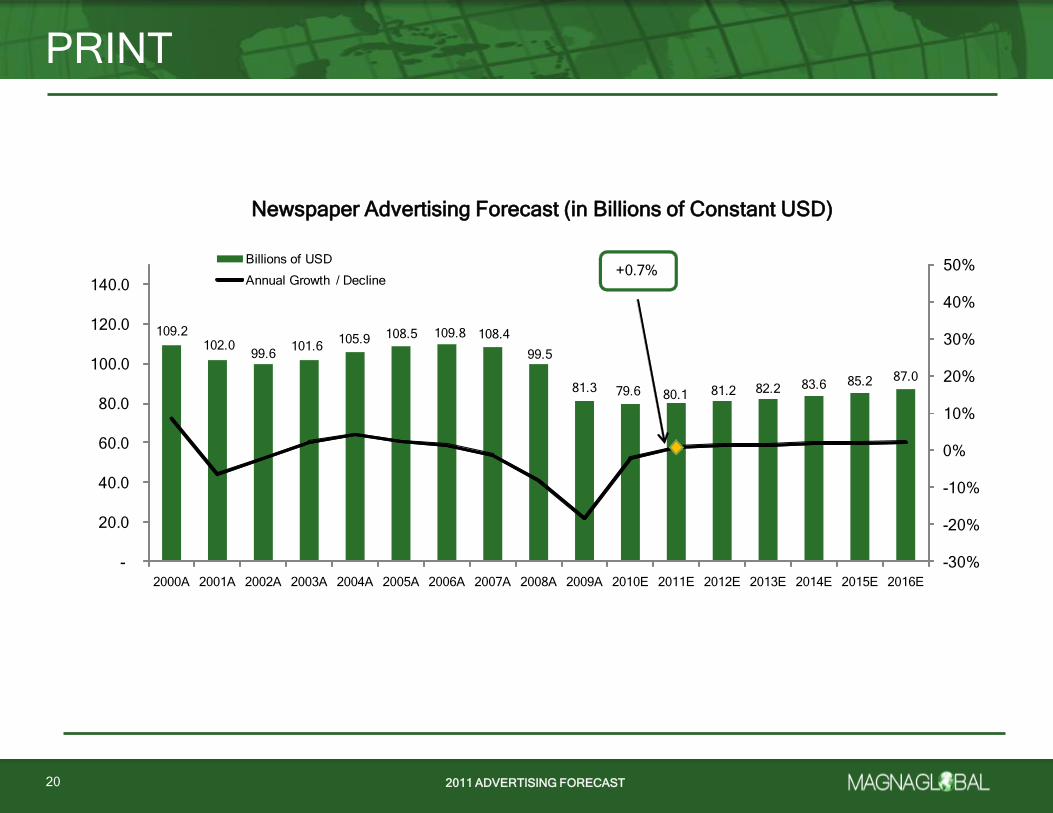
in the years ahead. Newspapers should grow at an average rate of 1.7% through 2016, after rising a modest 0.7% during
2011. Newspapers will generally fare better in emerging markets where literacy levels are rising and internet connections are
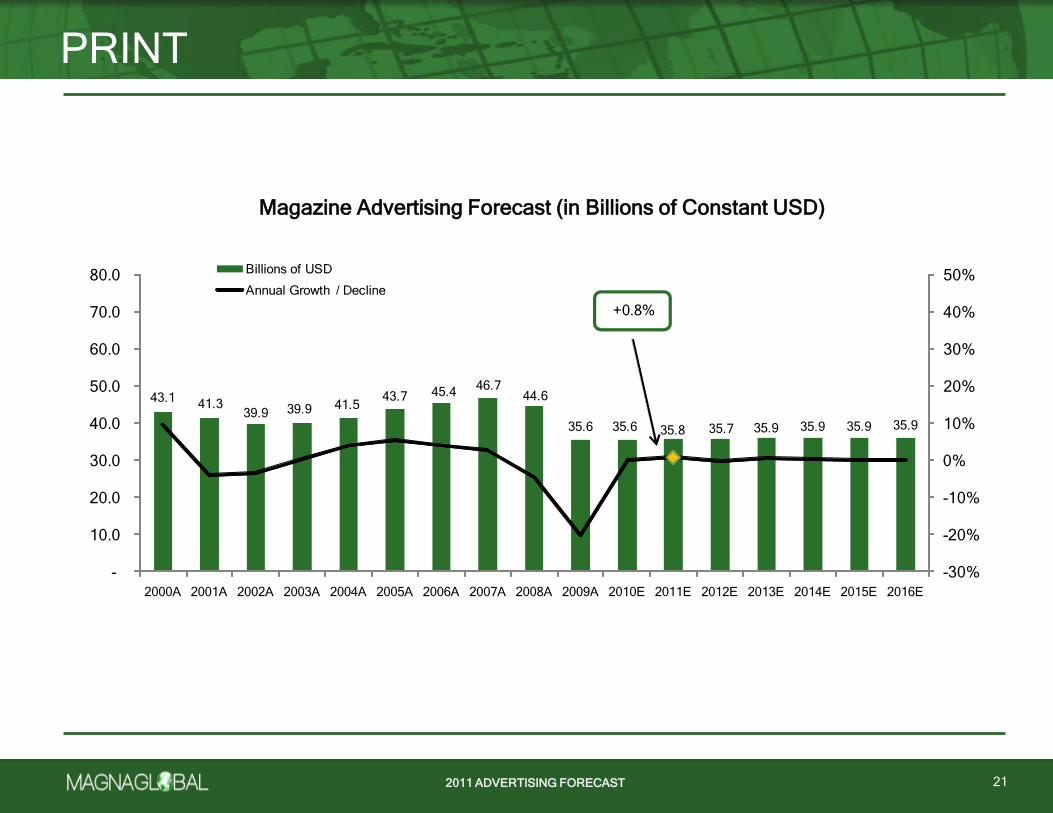
poor. Certainly India and Indonesia will be among the primary beneficiaries of this factor. Magazines will struggle to stay
positive globally, essentially staying flat every year going forward. Over the next five years, magazine advertising will decline
in each of the world’s 10 largest markets for magazines, with the exception of Brazil and Russia.
Loss of readership – sometimes real and sometimes perceived – is a driving factor behind these trends. That digital or online
media will replace print media in wholesale fashion in a short period of time is on one hand overstated, but on the other,
becomes a self-fulfilling prophesy. The introduction of Apple’s iPad during 2010 highlighted the potential for replacement of
print editions with digital ones, and encourages advertisers to explore sponsoring content designed for these devices,
potentially using budgets allocated towards online media. However, it seems unlikely that more than a minority of the
population will possess tablets over the next few years, and the propensity to eliminate print subscriptions in favor of digital
downloads remains to be seen. Advertisers will alter their media plans either way.
Digital can present opportunities for print publishers in many instances. Some publishers have made an effort to be seenembracing digital device distribution allowing them to diffuse the perception that print is ―old-fashioned.‖ To this end, some
publishers will be able to help sustain their revenues through bundled sales of traditional and digital print inventory (although
we exclude digital revenues from our estimates of print advertising to avoid double-counting and to reflect the vast differences
between their respective marketplaces). Digital will help other publishers because the revenue growth associated with
internet-based businesses may in some form subsidize the print-based businesses, especially in countries where print
houses are among the dominant online content producers, on par with the global portals and social networks in importance to
online advertisers.
Print publishers will more likely find sustainable growth opportunities through their efforts to integrate media inventory with
related consumer ―assets‖ (such as subscriber lists) – leading to solutions such as event management or CRM. Given the
important role that magazines have had in helping certain advertisers accomplish strategic goals rather than awareness-
based objectives, there is a reasonable likelihood that they can be successful in this transition. Newspaper publishers will
similarly need to adapt their business models, especially for the retailers who have historically been highly reliant on daily
print publications. The opportunity – if publishers can seize it – will be to focus on helping marketers find alternative ways to
accomplish broader business goals.
18
Contribution to Newspaper advertising growth by region: 2011-2016
-60%
-40%
-20%
0%
20%
40%
60%
80%
100%
North America
EMEA Latin America APAC
Source: MAGNAGLOBAL
2011 ADVERTISING FORECAST
19
Total Print Advertising Forecast (in Billions of Constant USD)
152.2
143.3139.5 141.6
147.4152.3 155.3 155.1
144.0
116.9 115.1
116.0 116.9 118.1 119.6 121.2 123.0
+0.7%
-25%
-20%
-15%
-10%
-5%
0%
5%
10%
15%
-
20.0
40.0
60.0
80.0
100.0
120.0
140.0
160.0
180.0
200.0
2000A 2001A 2002A 2003A 2004A 2005A 2006A 2007A 2008A 2009A 2010E 2011E 2012E 2013E 2014E 2015E 2016E
Billions of USD
Annual Growth / Decline
Total Print Advertising Forecast (in Billions of Constant USD)
2011 ADVERTISING FORECAST2011 ADVERTISING FORECAST
20
Newspapers Advertising Forecast (in Billions of Constant USD)
109.2102.0
99.6101.6
105.9 108.5 109.8 108.4
99.5
81.3 79.6 80.1 81.2 82.2 83.6 85.2 87.0
+0.7%
-30%
-20%
-10%
0%
10%
20%
30%
40%
50%
-
20.0
40.0
60.0
80.0
100.0
120.0
140.0
2000A 2001A 2002A 2003A 2004A 2005A 2006A 2007A 2008A 2009A 2010E 2011E 2012E 2013E 2014E 2015E 2016E
Billions of USD
Annual Growth / Decline
Newspaper Advertising Forecast (in Billions of Constant USD)
2011 ADVERTISING FORECAST
21
Magazines Advertising Forecast (in Billions of Constant USD)
43.141.3
39.9 39.9 41.543.7 45.4
46.744.6
35.6 35.6 35.8 35.7 35.9 35.9 35.9 35.9
+0.8%
-30%
-20%
-10%
0%
10%
20%
30%
40%
50%
-
10.0
20.0
30.0
40.0
50.0
60.0
70.0
80.0
2000A 2001A 2002A 2003A 2004A 2005A 2006A 2007A 2008A 2009A 2010E 2011E 2012E 2013E 2014E 2015E 2016E
Billions of USD
Annual Growth / Decline
Magazine Advertising Forecast (in Billions of Constant USD)

2011 ADVERTISING FORECAST2011 ADVERTISING FORECAST
Radio remains skewed towards North American and European
markets, where large local advertising markets have developed
Radio satisfies a number of underlying needs for consumers – music discovery, local news-gathering, spoken-word content,
and information-sharing – all from a portable, low-cost source with virtually ubiquitous coverage. Consumption trends are well-
positioned in many countries. In its analog form, radio offers a high level of fragmentation and niche programming and this
characteristic is enhanced further with digital broadcasting because of the ease with which stations may offer additional
―channels.‖ Such fragmentation should allow broadcasters to cause consumers to listen to more radio than they otherwise
would with fewer choices. Additionally, in many countries, the percentage of the population using autos for commutes is
rising, and therefore the time those commuters spend in their cars increases as well, adding to aggregate levels of radio
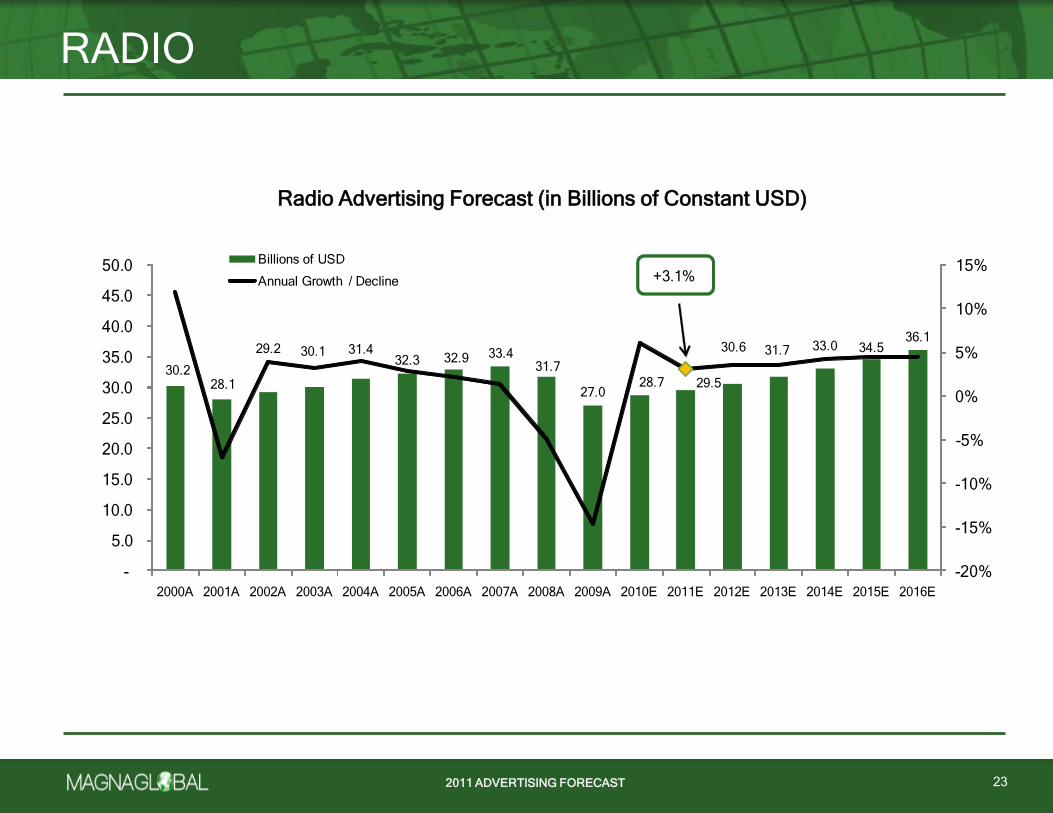
consumption. Despite these favorable characteristics, we expect growth to generally under-perform the broader ad-
supported media economy, with a gain of 3.1% in 2011 and growth averaging 4.1% through 2016, at which point the global
radio industry should generate $35.9 billion in advertising revenue. Radio should account for 6% of the global advertising
industry, a share which will fall in the years ahead. Key markets for growth include India, China and South Africa. Radio
should benefit in markets that are liberalizing (such as India, where FM radio has only recently launched) or licensing new
airwaves (as in Malaysia).
However, flat growth levels and subsequent share declines in larger markets such as the US, Canada, France and Germany
(presently the first, third, fourth and fifth largest advertising economies for radio) meaningfully constrain growth in years
ahead. This trend will largely occur because traditional radio is unfavorably positioned to thrive in a digital age. Consumers
now have greater access to online music sites (and communities), streaming radio and downloadable music. Further, online
media has generally supplanted radio for news bulletins in many countries and GPS-based services will eventually replace
radio as the best source of on-the-go information about traffic. These alternatives are continually gaining traction with
consumers and new technologies integrated with mobile data services may result in even faster growth. Further, prospects
for revenue growth among terrestrial broadcasters will not be determined in the foreseeable future by successful digital
extensions of legacy platforms. Relatively successful online music services such as Pandora (based in the US) and Spotify
(based in Sweden) are able to sell some advertising, but the open question is whether services such as these will ultimately
capture budgets from Radio advertisers or online advertisers.
Another factor constraining growth is the absence of unique positioning versus other media. On the one hand, Radio should
grow in line with the segment of advertisers who finds Radio to be the most appropriate medium for its marketing objectives.
Many of these advertisers will be geographically constrained, especially in countries where television does not sell locally.
Advertisers that distinguish themselves on the basis of reaching consumers in cars (such as drive-through quick service
restaurants) will likely continue to prioritize radio above other media choices. However, there are many other advertisers that
uniquely benefit from radio, which presents a challenge to the industry. Radio becomes a generally tactical medium for some
advertisers, or a vehicle to bring down total costs per contact for others. This fundamental limitation was exhibited during
2009 and 2010 when we saw a ―flight to quality‖ from many advertisers, and radio underperformed all media other than print
(which suffered as much from secular trends as from cyclical ones).
The impact of portable People Meters in some markets, such as the United States, may help mitigate further declines. More
reliable and timely data may provide more information to station managers allowing them to iterate and innovate faster than
with other measurement methods. As an added benefit, improvements in perception of the quality of the medium’s
measurement will be helpful in justifying advertisers’ budget allocations. This in turn may lead to growth in the future.
RADIO
22
Share of global Radio advertising by region: 2011
Source: MAGNAGLOBAL
Latin America
4.2%
APAC14.9%
EMEA23.8%
North America57.0%
2011 ADVERTISING FORECAST
30.228.1
29.2 30.1 31.432.3 32.9 33.4
31.7
27.028.7 29.5
30.6 31.7 33.0 34.536.1
+3.1%
-20%
-15%
-10%
-5%
0%
5%
10%
15%
-
5.0
10.0
15.0
20.0
25.0
30.0
35.0
40.0
45.0
50.0
2000A 2001A 2002A 2003A 2004A 2005A 2006A 2007A 2008A 2009A 2010E 2011E 2012E 2013E 2014E 2015E 2016E
Billions of USD
Annual Growth / Decline
RADIO
23
Radio Advertising Forecast (in Billions of Constant USD)
2011 ADVERTISING FORECAST2011 ADVERTISING FORECAST
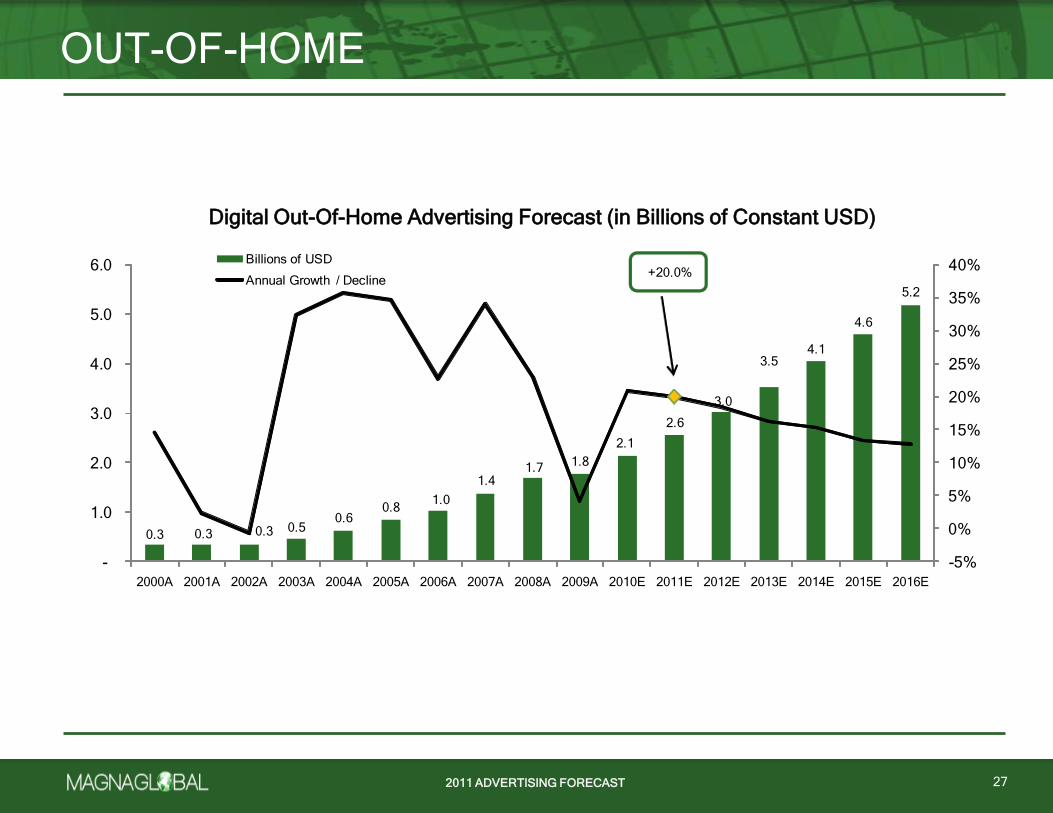
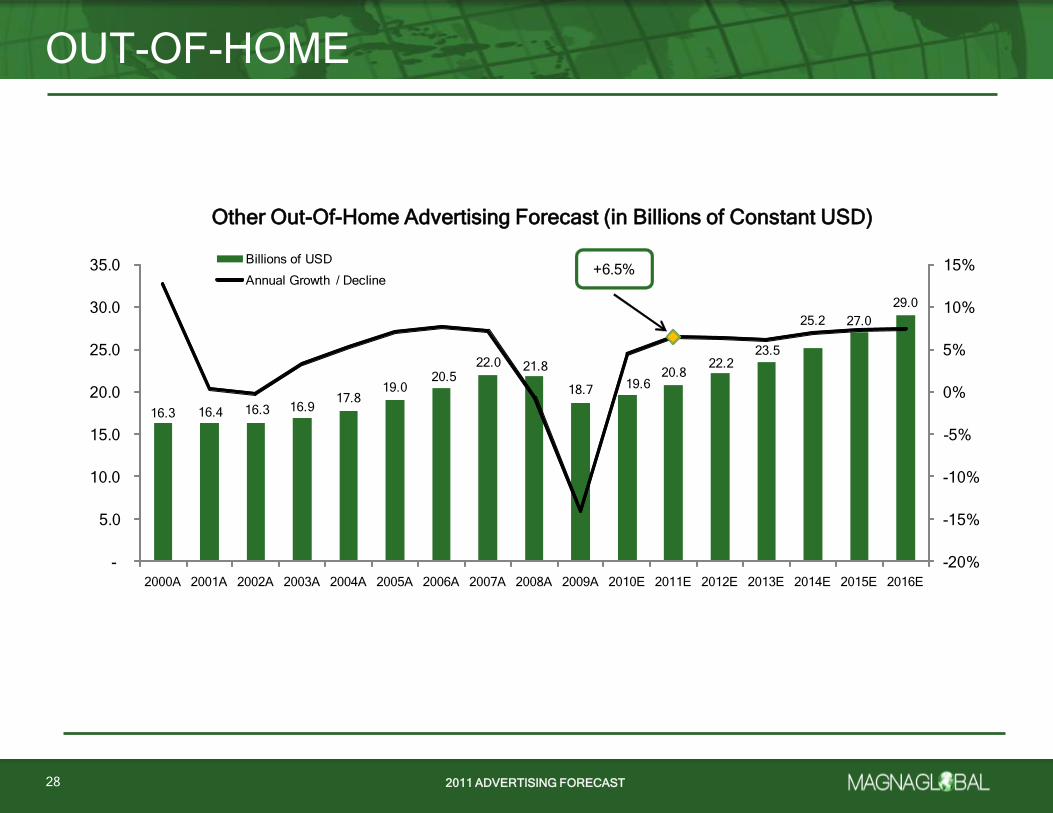
Out-of-home (or ―outdoor‖) media has straddled trends facing new and old media for many years. While conventional poster
faces are arguably the oldest form of advertising, digital billboards and related signage are based on cutting-edge
technologies. But the most important factor supporting outdoor advertising’s growth is the ease with which a range of
solutions can be provided for advertisers of all sizes. Out-of-home advertising grew slightly below trend in 2010, up by 6.4%
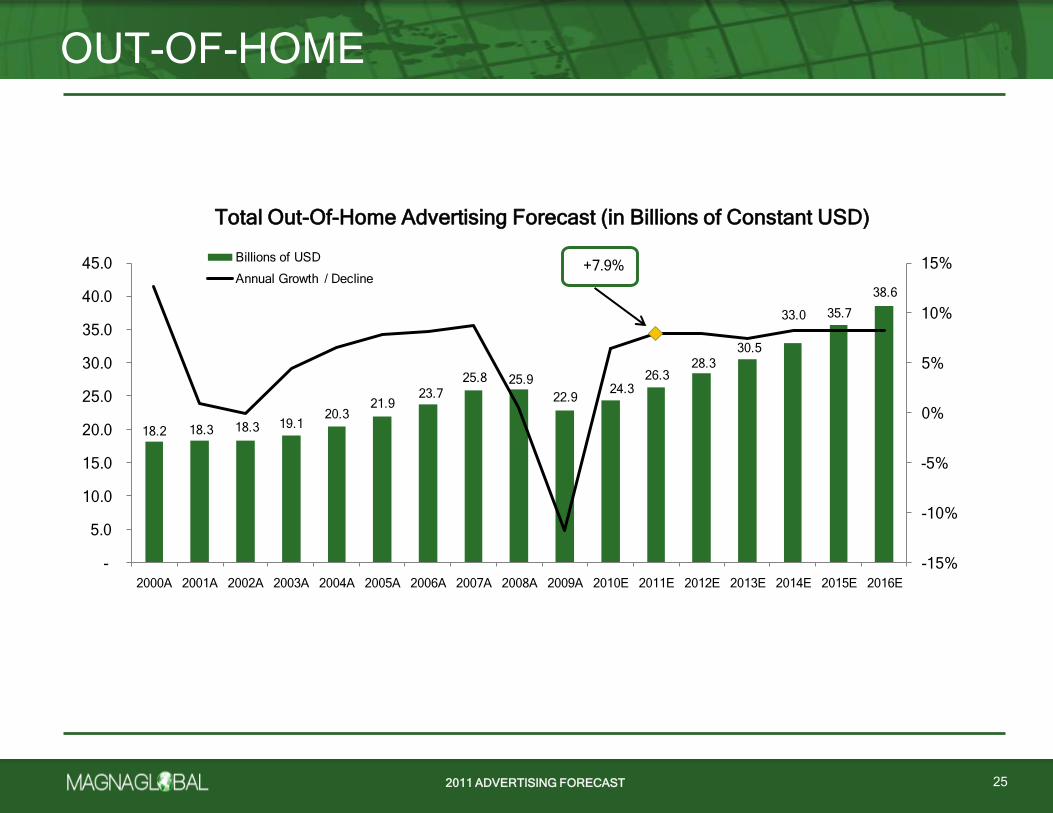
vs. 6.9% for the global economy. In 2011 – when we expect growth of 7.9% - and in years beyond, the sector should grow at
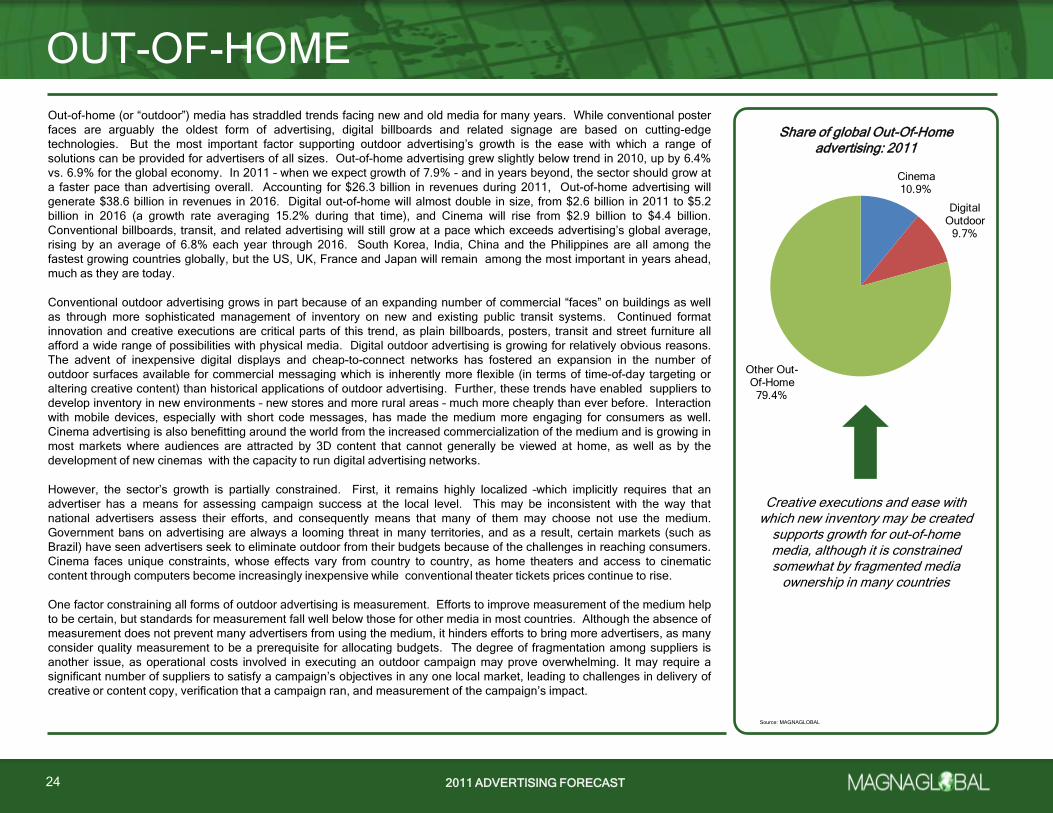
a faster pace than advertising overall. Accounting for $26.3 billion in revenues during 2011, Out-of-home advertising will
generate $38.6 billion in revenues in 2016. Digital out-of-home will almost double in size, from $2.6 billion in 2011 to $5.2
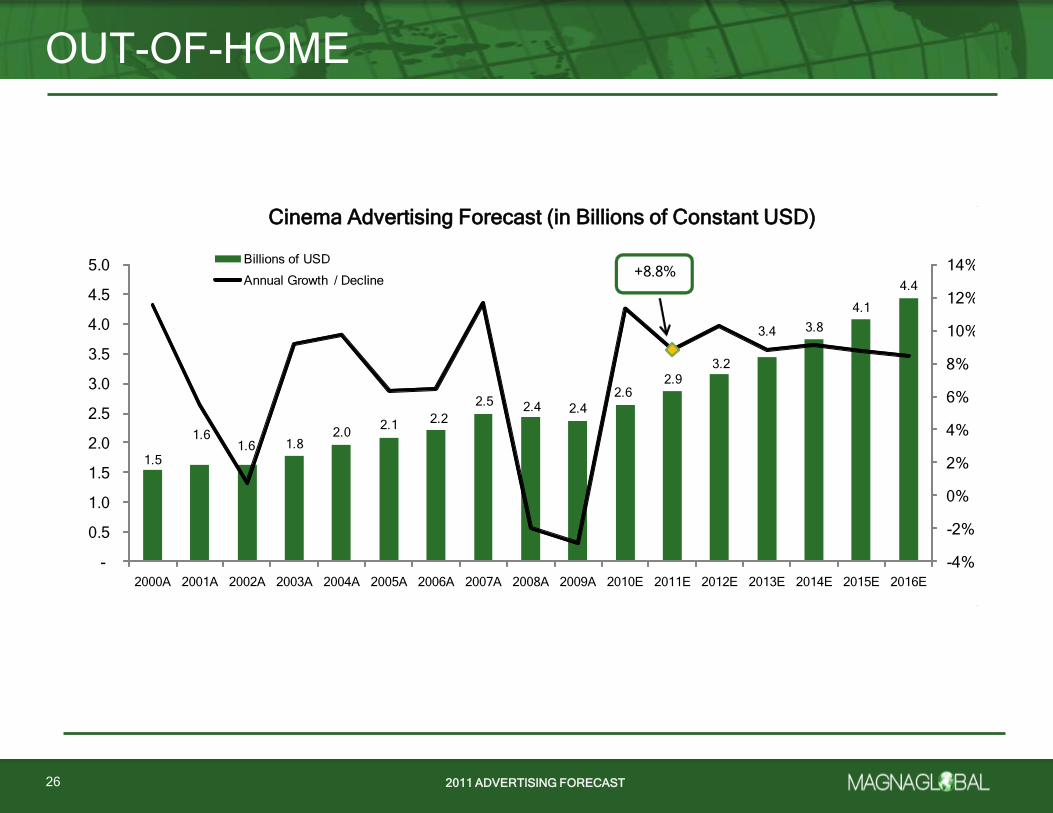
billion in 2016 (a growth rate averaging 15.2% during that time), and Cinema will rise from $2.9 billion to $4.4 billion.
Conventional billboards, transit, and related advertising will still grow at a pace which exceeds advertising’s global average,
rising by an average of 6.8% each year through 2016. South Korea, India, China and the Philippines are all among the
fastest growing countries globally, but the US, UK, France and Japan will remain among the most important in years ahead,
much as they are today.
Conventional outdoor advertising grows in part because of an expanding number of commercial ―faces‖ on buildings as well
as through more sophisticated management of inventory on new and existing public transit systems. Continued format
innovation and creative executions are critical parts of this trend, as plain billboards, posters, transit and street furniture all
afford a wide range of possibilities with physical media. Digital outdoor advertising is growing for relatively obvious reasons.
The advent of inexpensive digital displays and cheap-to-connect networks has fostered an expansion in the number of
outdoor surfaces available for commercial messaging which is inherently more flexible (in terms of time-of-day targeting or
altering creative content) than historical applications of outdoor advertising. Further, these trends have enabled suppliers to
develop inventory in new environments – new stores and more rural areas – much more cheaply than ever before. Interaction
with mobile devices, especially with short code messages, has made the medium more engaging for consumers as well.
Cinema advertising is also benefitting around the world from the increased commercialization of the medium and is growing in
most markets where audiences are attracted by 3D content that cannot generally be viewed at home, as well as by the
development of new cinemas with the capacity to run digital advertising networks.
However, the sector’s growth is partially constrained. First, it remains highly localized –which implicitly requires that an
advertiser has a means for assessing campaign success at the local level. This may be inconsistent with the way that
national advertisers assess their efforts, and consequently means that many of them may choose not use the medium.
Government bans on advertising are always a looming threat in many territories, and as a result, certain markets (such as
Brazil) have seen advertisers seek to eliminate outdoor from their budgets because of the challenges in reaching consumers.
Cinema faces unique constraints, whose effects vary from country to country, as home theaters and access to cinematic
content through computers become increasingly inexpensive while conventional theater tickets prices continue to rise.
One factor constraining all forms of outdoor advertising is measurement. Efforts to improve measurement of the medium help
to be certain, but standards for measurement fall well below those for other media in most countries. Although the absence of
measurement does not prevent many advertisers from using the medium, it hinders efforts to bring more advertisers, as many
consider quality measurement to be a prerequisite for allocating budgets. The degree of fragmentation among suppliers is
another issue, as operational costs involved in executing an outdoor campaign may prove overwhelming. It may require a
significant number of suppliers to satisfy a campaign’s objectives in any one local market, leading to challenges in delivery of
creative or content copy, verification that a campaign ran, and measurement of the campaign’s impact.
OUT-OF-HOME
24
Creative executions and ease with which new inventory may be created
supports growth for out-of-home media, although it is constrained somewhat by fragmented media
ownership in many countries
Share of global Out-Of-Home advertising: 2011
Source: MAGNAGLOBAL
Cinema10.9%
Digital Outdoor
9.7%
Other Out-Of-Home
79.4%
2011 ADVERTISING FORECAST
18.2 18.3 18.3 19.120.3
21.923.7
25.8 25.9
22.924.3
26.328.3
30.5
33.0 35.7
38.6
+7.9%
-15%
-10%
-5%
0%
5%
10%
15%
-
5.0
10.0
15.0
20.0
25.0
30.0
35.0
40.0
45.0
2000A 2001A 2002A 2003A 2004A 2005A 2006A 2007A 2008A 2009A 2010E 2011E 2012E 2013E 2014E 2015E 2016E
Billions of USD
Annual Growth / Decline
OUT-OF-HOME
25
Total Out-Of-Home Advertising Forecast (in Billions of Constant USD)
2011 ADVERTISING FORECAST2011 ADVERTISING FORECAST
OUT-OF-HOME
26
Global Core Media Advert ising Forecast: Cinema (in Billions of Constant USD)
1.5
1.61.6 1.8
2.02.1
2.2
2.5 2.4 2.4
2.62.9
3.2
3.4 3.8
4.1
4.4+8.8%
-4%
-2%
0%
2%
4%
6%
8%
10%
12%
14%
-
0.5
1.0
1.5
2.0
2.5
3.0
3.5
4.0
4.5
5.0
2000A 2001A 2002A 2003A 2004A 2005A 2006A 2007A 2008A 2009A 2010E 2011E 2012E 2013E 2014E 2015E 2016E
Billions of USD
Annual Growth / Decline
Cinema Advertising Forecast (in Billions of Constant USD)
2011 ADVERTISING FORECAST
OUT-OF-HOME
27
Digital OOH Advertising Forecast (in Billions of Constant USD)
0.3 0.3 0.3 0.50.6
0.81.0
1.41.7
1.8
2.1
2.6
3.0
3.54.1
4.6
5.2
+20.0%
-5%
0%
5%
10%
15%
20%
25%
30%
35%
40%
-
1.0
2.0
3.0
4.0
5.0
6.0
2000A 2001A 2002A 2003A 2004A 2005A 2006A 2007A 2008A 2009A 2010E 2011E 2012E 2013E 2014E 2015E 2016E
Billions of USD
Annual Growth / Decline
Digital Out-Of-Home Advertising Forecast (in Billions of Constant USD)
2011 ADVERTISING FORECAST2011 ADVERTISING FORECAST
OUT-OF-HOME
28
Other OOH Advertising Forecast (in Billions of Constant USD)
16.3 16.4 16.3 16.917.8
19.020.5
22.0 21.8
18.7 19.620.8
22.223.5
25.2 27.0
29.0
+6.5%
-20%
-15%
-10%
-5%
0%
5%
10%
15%
-
5.0
10.0
15.0
20.0
25.0
30.0
35.0
2000A 2001A 2002A 2003A 2004A 2005A 2006A 2007A 2008A 2009A 2010E 2011E 2012E 2013E 2014E 2015E 2016E
Billions of USD
Annual Growth / Decline
Other Out-Of-Home Advertising Forecast (in Billions of Constant USD)
2011 ADVERTISING FORECAST
5%
6%
7%
8%
9%
10%
11%
11%
14%
20%
0% 10% 20% 30%
Puerto Rico
Ecuador
Mexico
Chile
Peru
Colombia
Costa Rica
Brazil
Panama
Argentina
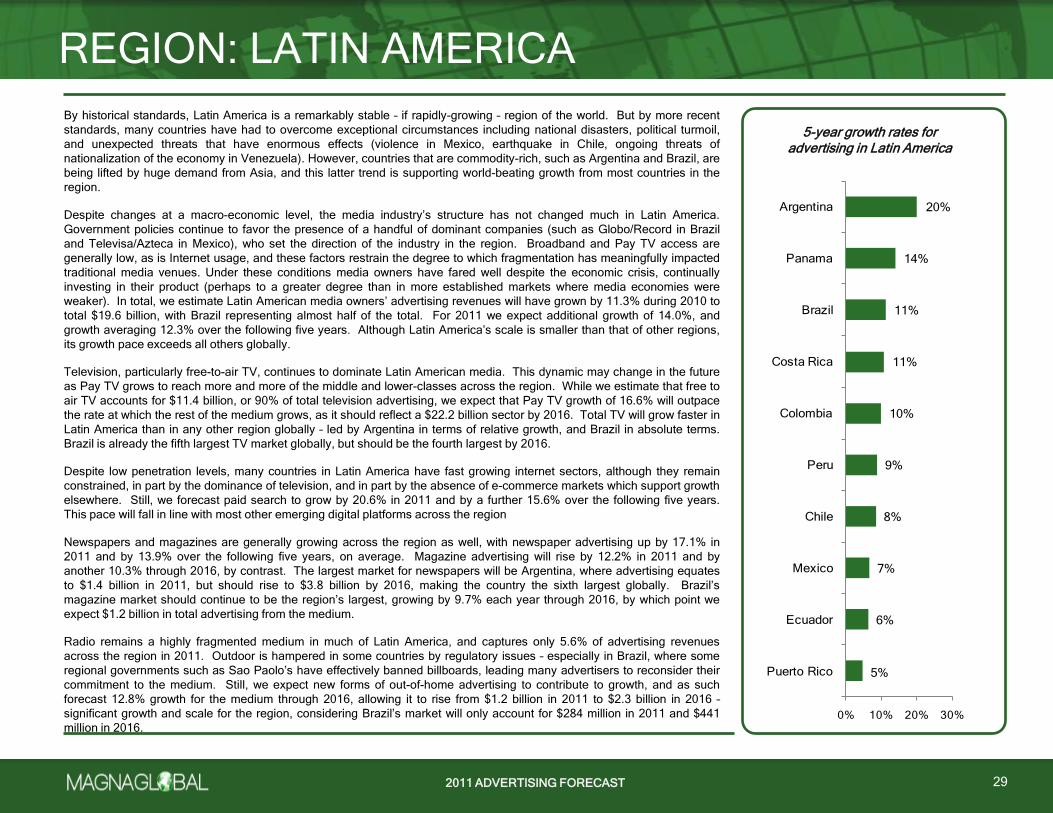
By historical standards, Latin America is a remarkably stable – if rapidly-growing – region of the world. But by more recent
standards, many countries have had to overcome exceptional circumstances including national disasters, political turmoil,
and unexpected threats that have enormous effects (violence in Mexico, earthquake in Chile, ongoing threats of
nationalization of the economy in Venezuela). However, countries that are commodity-rich, such as Argentina and Brazil, are
being lifted by huge demand from Asia, and this latter trend is supporting world-beating growth from most countries in the
region.
Despite changes at a macro-economic level, the media industry’s structure has not changed much in Latin America.
Government policies continue to favor the presence of a handful of dominant companies (such as Globo/Record in Brazil
and Televisa/Azteca in Mexico), who set the direction of the industry in the region. Broadband and Pay TV access are
generally low, as is Internet usage, and these factors restrain the degree to which fragmentation has meaningfully impacted
traditional media venues. Under these conditions media owners have fared well despite the economic crisis, continually
investing in their product (perhaps to a greater degree than in more established markets where media economies were
weaker). In total, we estimate Latin American media owners’ advertising revenues will have grown by 11.3% during 2010 to
total $19.6 billion, with Brazil representing almost half of the total. For 2011 we expect additional growth of 14.0%, and
growth averaging 12.3% over the following five years. Although Latin America’s scale is smaller than that of other regions,
its growth pace exceeds all others globally.
Television, particularly free-to-air TV, continues to dominate Latin American media. This dynamic may change in the future
as Pay TV grows to reach more and more of the middle and lower-classes across the region. While we estimate that free to
air TV accounts for $11.4 billion, or 90% of total television advertising, we expect that Pay TV growth of 16.6% will outpace
the rate at which the rest of the medium grows, as it should reflect a $22.2 billion sector by 2016. Total TV will grow faster in
Latin America than in any other region globally – led by Argentina in terms of relative growth, and Brazil in absolute terms.
Brazil is already the fifth largest TV market globally, but should be the fourth largest by 2016.
Despite low penetration levels, many countries in Latin America have fast growing internet sectors, although they remain
constrained, in part by the dominance of television, and in part by the absence of e-commerce markets which support growth
elsewhere. Still, we forecast paid search to grow by 20.6% in 2011 and by a further 15.6% over the following five years.
This pace will fall in line with most other emerging digital platforms across the region
Newspapers and magazines are generally growing across the region as well, with newspaper advertising up by 17.1% in
2011 and by 13.9% over the following five years, on average. Magazine advertising will rise by 12.2% in 2011 and by
another 10.3% through 2016, by contrast. The largest market for newspapers will be Argentina, where advertising equates
to $1.4 billion in 2011, but should rise to $3.8 billion by 2016, making the country the sixth largest globally. Brazil’s
magazine market should continue to be the region’s largest, growing by 9.7% each year through 2016, by which point we
expect $1.2 billion in total advertising from the medium.
Radio remains a highly fragmented medium in much of Latin America, and captures only 5.6% of advertising revenues
across the region in 2011. Outdoor is hampered in some countries by regulatory issues – especially in Brazil, where some
regional governments such as Sao Paolo’s have effectively banned billboards, leading many advertisers to reconsider their
commitment to the medium. Still, we expect new forms of out-of-home advertising to contribute to growth, and as such
forecast 12.8% growth for the medium through 2016, allowing it to rise from $1.2 billion in 2011 to $2.3 billion in 2016 –
significant growth and scale for the region, considering Brazil’s market will only account for $284 million in 2011 and $441
million in 2016.
REGION: LATIN AMERICA
29
5-year growth rates for advertising in Latin America
2011 ADVERTISING FORECAST2011 ADVERTISING FORECAST
1%1%1%2%2%2%2%3%3%3%3%3%4%4%4%
4%4%5%5%5%6%6%7%7%8%8%8%9%10%10%10%11%11%
14%15%
17%18%
0% 20%
FrancePortugal
IrelandSpain
GermanyNetherlandsSwitzerland
AustriaBelgiumGreece
UKDenmark
ItalySweden
LatviaNorway
SlovakiaCzech Rep.
FinlandEstoniaCroatia
LithuaniaSloveniaHungary
PolandBulgariaLebanonMorocco
RussiaUkraine
Gulf CountriesEgypt
South AfricaRomania
TurkeyKazakhstan
Serbia
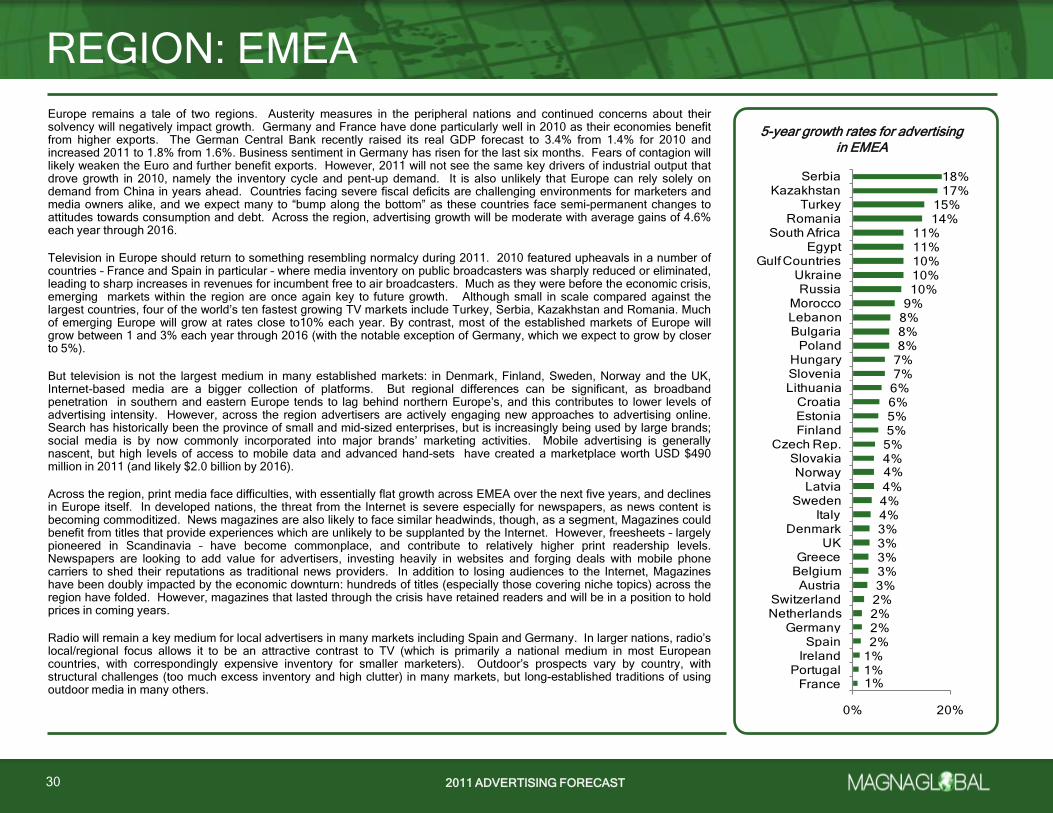
Europe remains a tale of two regions. Austerity measures in the peripheral nations and continued concerns about theirsolvency will negatively impact growth. Germany and France have done particularly well in 2010 as their economies benefitfrom higher exports. The German Central Bank recently raised its real GDP forecast to 3.4% from 1.4% for 2010 andincreased 2011 to 1.8% from 1.6%. Business sentiment in Germany has risen for the last six months. Fears of contagion willlikely weaken the Euro and further benefit exports. However, 2011 will not see the same key drivers of industrial output thatdrove growth in 2010, namely the inventory cycle and pent-up demand. It is also unlikely that Europe can rely solely ondemand from China in years ahead. Countries facing severe fiscal deficits are challenging environments for marketers andmedia owners alike, and we expect many to ―bump along the bottom‖ as these countries face semi-permanent changes toattitudes towards consumption and debt. Across the region, advertising growth will be moderate with average gains of 4.6%each year through 2016.
Television in Europe should return to something resembling normalcy during 2011. 2010 featured upheavals in a number ofcountries – France and Spain in particular – where media inventory on public broadcasters was sharply reduced or eliminated,leading to sharp increases in revenues for incumbent free to air broadcasters. Much as they were before the economic crisis,emerging markets within the region are once again key to future growth. Although small in scale compared against thelargest countries, four of the world’s ten fastest growing TV markets include Turkey, Serbia, Kazakhstan and Romania. Muchof emerging Europe will grow at rates close to10% each year. By contrast, most of the established markets of Europe willgrow between 1 and 3% each year through 2016 (with the notable exception of Germany, which we expect to grow by closerto 5%).
But television is not the largest medium in many established markets: in Denmark, Finland, Sweden, Norway and the UK,Internet-based media are a bigger collection of platforms. But regional differences can be significant, as broadbandpenetration in southern and eastern Europe tends to lag behind northern Europe’s, and this contributes to lower levels ofadvertising intensity. However, across the region advertisers are actively engaging new approaches to advertising online.Search has historically been the province of small and mid-sized enterprises, but is increasingly being used by large brands;social media is by now commonly incorporated into major brands’ marketing activities. Mobile advertising is generallynascent, but high levels of access to mobile data and advanced hand-sets have created a marketplace worth USD $490million in 2011 (and likely $2.0 billion by 2016).
Across the region, print media face difficulties, with essentially flat growth across EMEA over the next five years, and declinesin Europe itself. In developed nations, the threat from the Internet is severe especially for newspapers, as news content isbecoming commoditized. News magazines are also likely to face similar headwinds, though, as a segment, Magazines couldbenefit from titles that provide experiences which are unlikely to be supplanted by the Internet. However, freesheets – largelypioneered in Scandinavia – have become commonplace, and contribute to relatively higher print readership levels.Newspapers are looking to add value for advertisers, investing heavily in websites and forging deals with mobile phonecarriers to shed their reputations as traditional news providers. In addition to losing audiences to the Internet, Magazineshave been doubly impacted by the economic downturn: hundreds of titles (especially those covering niche topics) across theregion have folded. However, magazines that lasted through the crisis have retained readers and will be in a position to holdprices in coming years.
Radio will remain a key medium for local advertisers in many markets including Spain and Germany. In larger nations, radio’slocal/regional focus allows it to be an attractive contrast to TV (which is primarily a national medium in most Europeancountries, with correspondingly expensive inventory for smaller marketers). Outdoor’s prospects vary by country, withstructural challenges (too much excess inventory and high clutter) in many markets, but long-established traditions of usingoutdoor media in many others.
REGION: EMEA
30
5-year growth rates for advertising in EMEA
2011 ADVERTISING FORECAST
1%
5%
6%
7%
7%
8%
8%
9%
10%
10%
14%
17%
19%
0% 10% 20% 30%
Japan
New Zealand
Australia
Taiwan
Hong Kong
South Korea
Thailand
Singapore
Malaysia
Philippines
Indonesia
China
India
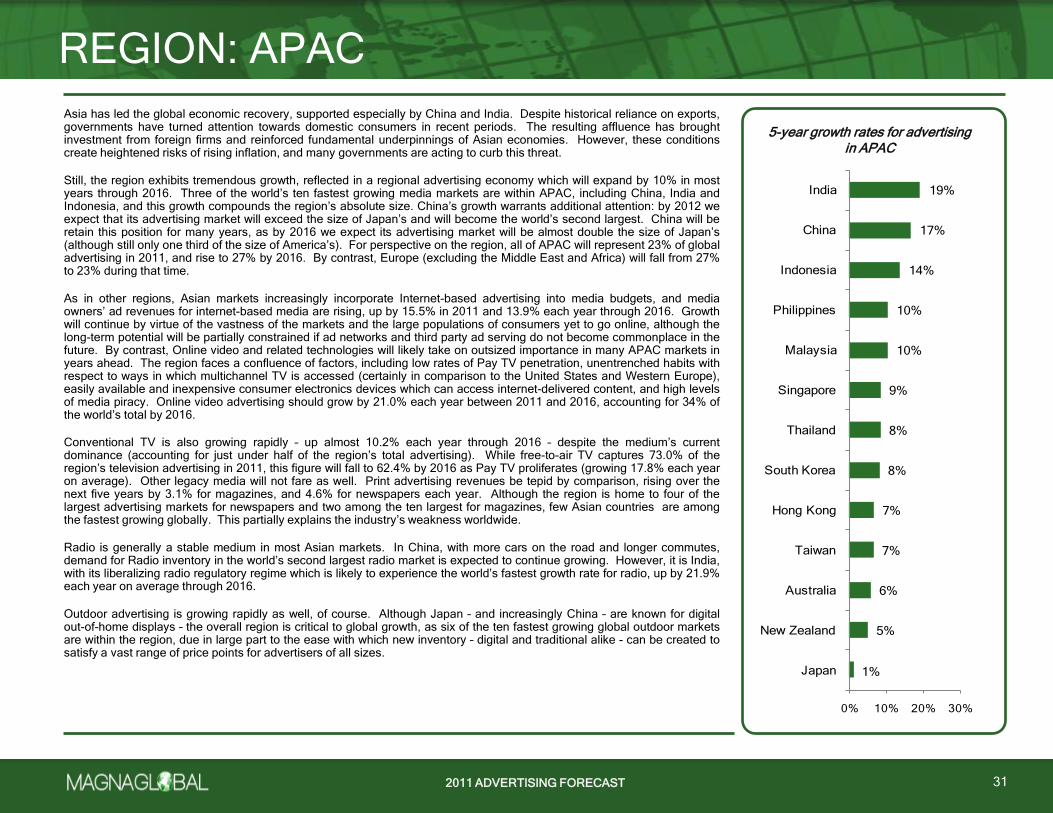
Asia has led the global economic recovery, supported especially by China and India. Despite historical reliance on exports,governments have turned attention towards domestic consumers in recent periods. The resulting affluence has broughtinvestment from foreign firms and reinforced fundamental underpinnings of Asian economies. However, these conditionscreate heightened risks of rising inflation, and many governments are acting to curb this threat.
Still, the region exhibits tremendous growth, reflected in a regional advertising economy which will expand by 10% in mostyears through 2016. Three of the world’s ten fastest growing media markets are within APAC, including China, India andIndonesia, and this growth compounds the region’s absolute size. China’s growth warrants additional attention: by 2012 weexpect that its advertising market will exceed the size of Japan’s and will become the world’s second largest. China will beretain this position for many years, as by 2016 we expect its advertising market will be almost double the size of Japan’s(although still only one third of the size of America’s). For perspective on the region, all of APAC will represent 23% of globaladvertising in 2011, and rise to 27% by 2016. By contrast, Europe (excluding the Middle East and Africa) will fall from 27%to 23% during that time.
As in other regions, Asian markets increasingly incorporate Internet-based advertising into media budgets, and mediaowners’ ad revenues for internet-based media are rising, up by 15.5% in 2011 and 13.9% each year through 2016. Growthwill continue by virtue of the vastness of the markets and the large populations of consumers yet to go online, although thelong-term potential will be partially constrained if ad networks and third party ad serving do not become commonplace in thefuture. By contrast, Online video and related technologies will likely take on outsized importance in many APAC markets inyears ahead. The region faces a confluence of factors, including low rates of Pay TV penetration, unentrenched habits withrespect to ways in which multichannel TV is accessed (certainly in comparison to the United States and Western Europe),easily available and inexpensive consumer electronics devices which can access internet-delivered content, and high levelsof media piracy. Online video advertising should grow by 21.0% each year between 2011 and 2016, accounting for 34% ofthe world’s total by 2016.
Conventional TV is also growing rapidly – up almost 10.2% each year through 2016 – despite the medium’s currentdominance (accounting for just under half of the region’s total advertising). While free-to-air TV captures 73.0% of theregion’s television advertising in 2011, this figure will fall to 62.4% by 2016 as Pay TV proliferates (growing 17.8% each yearon average). Other legacy media will not fare as well. Print advertising revenues be tepid by comparison, rising over thenext five years by 3.1% for magazines, and 4.6% for newspapers each year. Although the region is home to four of thelargest advertising markets for newspapers and two among the ten largest for magazines, few Asian countries are amongthe fastest growing globally. This partially explains the industry’s weakness worldwide.
Radio is generally a stable medium in most Asian markets. In China, with more cars on the road and longer commutes,demand for Radio inventory in the world’s second largest radio market is expected to continue growing. However, it is India,with its liberalizing radio regulatory regime which is likely to experience the world’s fastest growth rate for radio, up by 21.9%each year on average through 2016.
Outdoor advertising is growing rapidly as well, of course. Although Japan – and increasingly China – are known for digitalout-of-home displays – the overall region is critical to global growth, as six of the ten fastest growing global outdoor marketsare within the region, due in large part to the ease with which new inventory – digital and traditional alike - can be created tosatisfy a vast range of price points for advertisers of all sizes.
REGION: APAC
31
5-year growth rates for advertising in APAC
2011 ADVERTISING FORECAST2011 ADVERTISING FORECAST
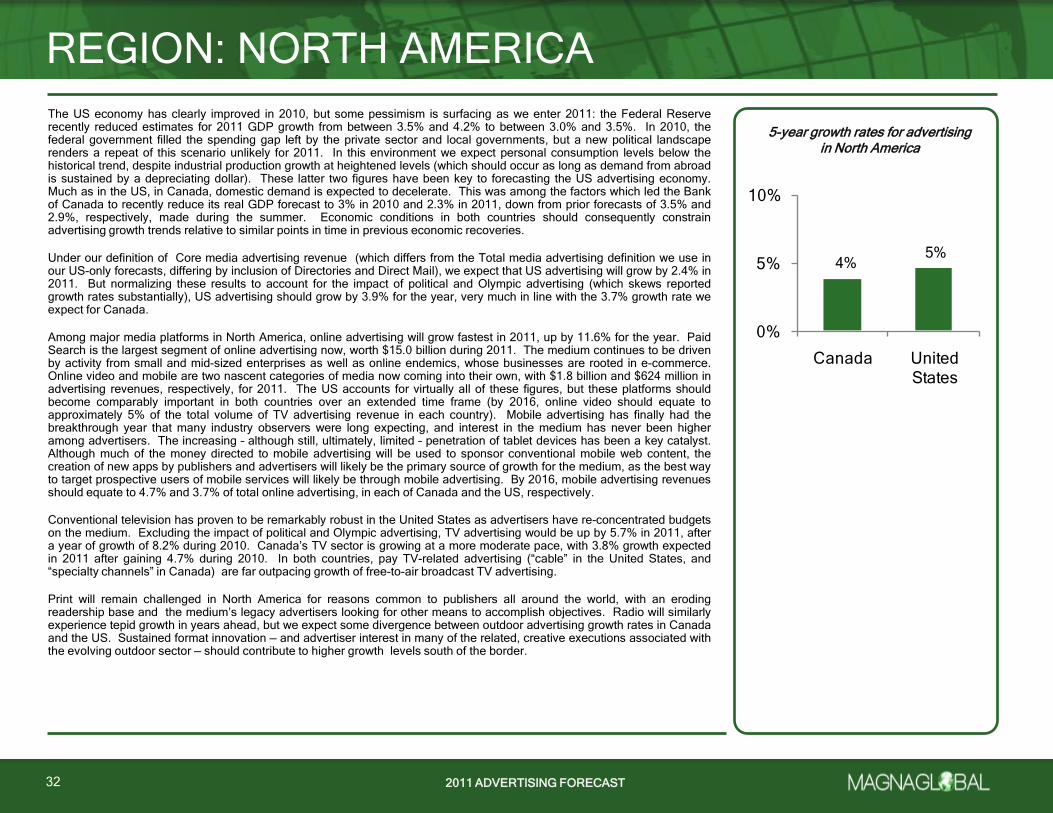
The US economy has clearly improved in 2010, but some pessimism is surfacing as we enter 2011: the Federal Reserverecently reduced estimates for 2011 GDP growth from between 3.5% and 4.2% to between 3.0% and 3.5%. In 2010, thefederal government filled the spending gap left by the private sector and local governments, but a new political landscaperenders a repeat of this scenario unlikely for 2011. In this environment we expect personal consumption levels below thehistorical trend, despite industrial production growth at heightened levels (which should occur as long as demand from abroadis sustained by a depreciating dollar). These latter two figures have been key to forecasting the US advertising economy.Much as in the US, in Canada, domestic demand is expected to decelerate. This was among the factors which led the Bankof Canada to recently reduce its real GDP forecast to 3% in 2010 and 2.3% in 2011, down from prior forecasts of 3.5% and2.9%, respectively, made during the summer. Economic conditions in both countries should consequently constrainadvertising growth trends relative to similar points in time in previous economic recoveries.
Under our definition of Core media advertising revenue (which differs from the Total media advertising definition we use inour US-only forecasts, differing by inclusion of Directories and Direct Mail), we expect that US advertising will grow by 2.4% in2011. But normalizing these results to account for the impact of political and Olympic advertising (which skews reportedgrowth rates substantially), US advertising should grow by 3.9% for the year, very much in line with the 3.7% growth rate weexpect for Canada.
Among major media platforms in North America, online advertising will grow fastest in 2011, up by 11.6% for the year. PaidSearch is the largest segment of online advertising now, worth $15.0 billion during 2011. The medium continues to be drivenby activity from small and mid-sized enterprises as well as online endemics, whose businesses are rooted in e-commerce.Online video and mobile are two nascent categories of media now coming into their own, with $1.8 billion and $624 million inadvertising revenues, respectively, for 2011. The US accounts for virtually all of these figures, but these platforms shouldbecome comparably important in both countries over an extended time frame (by 2016, online video should equate toapproximately 5% of the total volume of TV advertising revenue in each country). Mobile advertising has finally had thebreakthrough year that many industry observers were long expecting, and interest in the medium has never been higheramong advertisers. The increasing – although still, ultimately, limited – penetration of tablet devices has been a key catalyst.Although much of the money directed to mobile advertising will be used to sponsor conventional mobile web content, thecreation of new apps by publishers and advertisers will likely be the primary source of growth for the medium, as the best wayto target prospective users of mobile services will likely be through mobile advertising. By 2016, mobile advertising revenuesshould equate to 4.7% and 3.7% of total online advertising, in each of Canada and the US, respectively.
Conventional television has proven to be remarkably robust in the United States as advertisers have re-concentrated budgetson the medium. Excluding the impact of political and Olympic advertising, TV advertising would be up by 5.7% in 2011, aftera year of growth of 8.2% during 2010. Canada’s TV sector is growing at a more moderate pace, with 3.8% growth expectedin 2011 after gaining 4.7% during 2010. In both countries, pay TV-related advertising (―cable‖ in the United States, and―specialty channels‖ in Canada) are far outpacing growth of free-to-air broadcast TV advertising.
Print will remain challenged in North America for reasons common to publishers all around the world, with an erodingreadership base and the medium’s legacy advertisers looking for other means to accomplish objectives. Radio will similarlyexperience tepid growth in years ahead, but we expect some divergence between outdoor advertising growth rates in Canadaand the US. Sustained format innovation — and advertiser interest in many of the related, creative executions associated withthe evolving outdoor sector — should contribute to higher growth levels south of the border.
REGION: NORTH AMERICA
32
5-year growth rates for advertising in North America
4%5%
0%
5%
10%
Canada United States

2011 ADVERTISING FORECAST2011 ADVERTISING FORECAST2011 ADVERTISING FORECAST
Our updated industry models with country-specific and global data sets are now available. Please contact MAGNAGLOBAL for additional details.
www.magnaglobal.com
MAGNAGLOBAL’s proprietary research may not be reproduced for direct commercial activities without written authorization
33