2011 report on environmental protection effortsambitious targets are to be fixed for 2020. jama...
TRANSCRIPT

2011 REPORT ON ENVIRONMENTAL PROTECTION EFFORTSPromoting Sustainability in Road Transport in Japan
JAPAN AUTOMOBILE MANUFACTURERS ASSOCIATION, Inc.
2011 REPORT ON ENVIRONMENTAL PROTECTION EFFORTS
JAPAN AUTOMOBILE M
ANUFACTURERS ASSOCIATION, Inc.Prom
oting Sustainability in Road Transport in Japan

1
As a major player in a key sector of the global economy, the Japanese automobile industry makes significant contributions to economic and social development around the world. In view of the essential role of motor vehicles in sustaining economic activities and enhancing people’s lives, Japanese automakers continuously strive to meet society’s evolving requirements with respect to automobiles and their use. Today, greater safety and increased environmental protection are the most pressing of these requirements.
With regard to environmental protection, the members of the Japan Automobile Manufacturers Association (JAMA) are addressing a number of global issues, chief among them the problem of climate change. Reducing CO2 emissions in road transport requires, however, an integrated approach involving all the stakeholders concerned, including government (for transport sector policymaking and road infrastructure development) and vehicle users (for improved driving practices). Sharing with many other countries Japan’s experience in applying the integrated approach will, JAMA members believe, help promote the adoption of effective measures for CO2 reduction in global road transport. International discussions are ongoing on post-Kyoto Protocol strategies for addressing climate change for the medium and long term (2020 and 2050). To bolster efforts aimed at CO2 reduction in road transport worldwide, JAMA members will continue to work hard not only to develop and supply highly fuel-efficient conventional vehicles as well as alternative-energy/next-generation vehicles, but also to propose measures promoting smoother traffic flow and the more widespread adoption of ecodriving, among other goals.
Meanwhile, over the last decade Japan’s automakers aggressively introduced into the home market vehicles that met the country’s fuel efficiency targets for 2010, and today the average fuel efficiency of the gasoline-powered passenger cars they produce largely surpasses the 2010 target. Beginning in 2007, the automakers started supplying vehicles that comply with extremely strict standards to be enforced in 2015. JAMA also encourages the government to upgrade the nation’s road transport infrastructure in order to achieve smoother traffic flow, which contributes significantly to increased fuel efficiency and thus to CO2 reduction. Addressing climate change is, however, only one among Japanese automakers’ many environmental protection efforts, which include promoting the widespread use of low-emission vehicles to improve air quality, reducing CO2 and other harmful emissions as well as the volume of waste generated at their production plants, and providing support for the recycling of end-of-life vehicles.
During the first half of 2009, the Japanese automobile industry experienced drastic declines in production, sales, and exports as a result of the economic downturn triggered by the global financial crisis in late 2008. However, owing largely to the Japanese government’s introduction of economic stimulus measures such as tax incentives and subsidy programs for the purchase of environmentally-friendly vehicles, domestic sales were on a solid recovery track up until the massive earthquake and tsunami that hit northeastern Japan on March 11, 2011. The multiple disaster severely impacted Japanese automakers’ supply chains, leading to reduced output or shutdown and thereby affecting auto dealers as well. Thanks to the cooperation of relevant parties, however, Japan’s auto production started to trend upward in September this year.
The current unprecedented overvaluation of the yen, caused by economic and financial uncertainty in Europe and the United States among other factors, has also seriously affected most Japanese industries. Under these difficult circumstances, there is a critical need to invigorate the home market. JAMA and its member automakers are therefore promoting a range of measures, from auto-related tax reform to the organization of motor shows, to stimulate Japan’s vehicle market. This report has been compiled for the purpose of providing our readers with a better understanding of the broad spectrum of environmental protection activities that have been and are being pursued domestically by Japan’s automakers.
Toshiyuki ShigaChairmanJapan Automobile Manufacturers Association, Inc.November 2011
FOREWORD
2
3
7
………………………………………………………………………………………… 7
………………………………………………………………………………………… 11
………………………………………………………………………………………… 13
………………………………………………………………………………………… 15
………………………………………………………………………………………… 19
………………………………………………………………………………………… 20
21
………………………………………………………………………………………… 21
………………………………………………………………………………………………… 23
24
30
………………………………………………………………………………………………… 30
………………………………………………………………………………………………… 34
■ SUMMARY OF ACTIVITIES
■ ENVIRONMENTAL PROTECTION IN VEHICLE
PERFORMANCE
1. Tackling Climate Change through Increased Vehicle
Fuel Efficiency and Related Measures
2. Promoting the Wider Use of Alternative-Energy/Next-
Generation Vehicles
3. Reducing the Hazards of Mobile Air Conditioners
4. Improving Air Quality
5. Restricting the Use of In-Cabin Volatile Organic
Compounds
6. Addressing Noise
■ ENVIRONMENTAL PROTECTION IN VEHICLE
MANUFACTURING AND DISTRIBUTION
1. Reducing CO2 Emissions and Waste in Production
Processes
2. Reducing CO2 Emissions in Logistics
■ END-OF-LIFE VEHICLE RECYCLING
■ ROAD-RELATED ENVIRONMENTAL PROTECTION MEASURES
1. Improving Traffic Flow
2. Promoting Ecodriving
1
2
3
4
5
CONTENTS

20000
1
2
3
4
5
2001 2002 2003 2004 2005 2006 2007
0
3,571,378 unitsTotal:3,484,707 units
0151,027units
3,333,680units
0
2008 2009 2010
☆(2000) ☆☆☆
(2000)
☆☆☆(2005)
☆☆☆☆(2005)
☆☆(2000)
Voluntary Reductions at Production Plants
CO2
Waste
VOCs
2008-2012 average: 25% reduction (to 6.32 mil tons) from 1990 level (8.44 mil tons)
97.1% reduction (to 10,000 tons) from 1990 level (352,000 tons) by 2015Recycling rate: 99%
40% reduction (to 47.8g/㎡) from 2000 level (79.6g/㎡) by 2010
44.6% reduction (to 4.67 mil tons) in 2010
99.8% reduction (to 668 tons) in 2010Recycling rate: 99.9% in 2009
50.0% reduction (to 39.8g/㎡) in 2010
Targets Actual StatusMaterial/Substance Reduced
(JAMA + JABIA)
Reductions in Production Plant-Generated CO2 Emissions(JAMA + JABIA)
(x 1 million tons CO2) (x 1,000 tons CO2 per 1 trillion yen)
CO2 emissions/Production value
0
2
4
6
8
100
200
300
400
500
10
2008-2012 average
(Revised target)Source: JAMA
20032002200120001990 2004 2005 2006 2007 2008 2009 ・・・・
442
256
4.51 4.675.08
6.326.576.596.826.726.806.746.436.80
8.44
2010
Fluorocarbons [destroyed] (million vehicles)Airbags (million vehicles)
Airbag recycling rate (%)
2010 Fiscal Year3.01.91
93.0-100ASR* (million vehicles) 3.69
ASR recycling rate (%) 79.9-87.0
Status of Recovery of Three Designated Items
* Covers all categories of processors, whether for direct disposal or for transfer to other markets.
171819(km/ℓ)
16151413121110
98
2010
14.4
200520001995
14.9 15.114.3
9.2 9.4 9.4 9.5 9.6 9.7 9.9 10.0 10.2
13.813.513.1
12.6
12.4
12.712.5
9.2 9.2 9.1 9.0 9.1 9.1
12.6 12.6 12.7 12.8 12.912.7
13.1 13.3 13.5 13.7 13.8 14.1 14.4 14.7
15.4 15.516.0 16.2
16.918.1
18.7
Source: JAMA
Trends in Average Fuel Efficiency of Domestic Gasoline-Powered Passenger Cars
Source: Industrial Structure Council
* Established assuming, for 2010, the same shipment volume ratios for the different vehicle weight categories as those recorded in 2009.
Source: JAMA
Low-Emission Car Shipments Compared to Total Car Shipments (Domestic)(x 1 million units)
Average certified fuel efficiency of new passenger cars
Average certified fuel efficiency of in-use passenger cars
Average on-road fuel efficiency ofin-use passenger cars
2010 target*
Total number of passenger car shipments
3
Early Achievement of Japan’s Fuel Efficiency Targets (pp. 7-8)
Thanks to JAMA member manufacturers’ continuous efforts to introduce into the market as early as possible vehicles that meet Japan’s fuel efficiency targets, the average fuel efficiency of new gasoline-powered passenger cars has increased yearly, reaching 18.7km/ℓ in 2010 and thus largely surpassing the target value for that year. Fuel efficiency targets for 2015 for heavy-duty vehicles (trucks and buses with GVW>3.5 tons) and for lighter vehicles including passenger cars were established in 2006 and 2007, respectively, and even more ambitious targets are to be fixed for 2020. JAMA members are working hard to ensure compliance.
Environmental Conservation at Production Plants (pp. 21-23)
JAMA member manufacturers have adopted various voluntary measures at their production plants to help curb global warming, conserve resources, and reduce the emission of hazardous substances. Since 2008, their plant CO2 reduction goals are being achieved jointly with the members of the Japan Auto-Body Industries Association (JABIA). With respect to volatile organic compound (VOC) emissions, the automakers’ target of a 40% reduction from the 2000 level by 2010 was in fact surpassed, and further voluntary reduction efforts continue. The automakers also continue to slash the amount of waste generated at their plants, having met the 2010 target (11,000 tons) as early as 2005.
End-of-Life Vehicle Recycling (pp. 24-29)
Supply of Low-Emission Passenger Cars & HDVs Meeting 2010 Emission Standards (pp. 15-17)
In 2010 shipments of low-emission passenger cars whose emissions performance was significantly superior to 2005 regulatory levels (☆☆☆☆ and ☆☆☆) totalled over 3.5 million units, representing 98% of all cars shipped that year. Japan’s Post-New Long-Term Regulations were enforced in 2009, signifying particularly important reductions in NOx and PM emissions from new heavy-duty diesel vehicles. Starting in 2016, furthermore, the NOx regulation for diesel HDVs will be even stricter, and a world-harmonized test protocol will be employed for measuring those vehicles’ exhaust emissions.
Enforced from January 2005, Japan’s End-of-Life Vehicle (ELV) Recycling Law mandates the recycling and appropriate disposal of end-of-life vehicles. The recycling rate of automobile shredder residue (ASR) has now surpassed the stringent 2015 target of 70%. JAMA member manufacturers are also promoting voluntary measures for the recycling and appropriate disposal of motorcycles and commercial vehicle rack equipment, whose recovery is not mandated by the ELV Recycling Law. Another objective has been the elimination of hazardous substances used in vehicle production; the automakers having set strict voluntary targets for their reduction or elimination, those targets were met, by the end of 2002 (mercury), the end of 2005 (lead and cadmium), and by the end of 2007 (hexavalent chromium), in all their new vehicles, excluding motorcycles which have met their own targets.
■ SUMMARY OF ACTIVITIES1

Fig. 1 JAMA’s Environment-Related Committees
Heavy Vehicle Planning Subcommittee
Factory Environment SubcommitteeRecycling & Waste Reduction SubcommitteeGlobal Warming Study GroupPassenger Car Fuel Efficiency Study GroupEnvironmental Issues SubcommitteeChemical Substances Management Subcommittee
Emissions & Fuel Efficiency SubcommitteeFuel & Lubricants SubcommitteeNoise Subcommittee
Distribution Logistics Subcommittee
Traffic Environment Subcommittee
Motorcycle Safety & Environment SubcommitteeMotorcycle Planning Subcommittee
ExecutiveCommittee
EnvironmentCommittee
DistributionCommittee
Traffic AffairsCommittee
Heavy VehicleCommittee
Board ofDirectors
Safety & EnvironmentalTechnology Committee
MotorcycleCommittee
General Committees
Special Vehicle Committees
Fig. 2 Environmental Performance Data for Individual Car Models (sample online screen display)
Dissemination of Information
JAMA promotes the dissemination of information on the environment-related activities of its member automobile manufacturers and on the environmental performance of their products.
JAMA and its member companies disseminate a wide range of information pertinent to environmental protection in news releases, postings on Web sites, and public relations materials. Prospective automobile purchasers who are seeking specific data on automotive environmental performance can obtain this information by visiting JAMA’s Web site and consulting its “Environmental Performance Data for Individual Car Models” section (www.jama.or.jp/eco/eco_car/info/index.html).
To reduce the environmental impact of a product, all the stages of its life cycle—from design and development to manufacture, use and disposal—must be taken into account. Japan’s automakers aim for superior environmental performance in terms of fuel efficiency (CO2 reduction), clean exhaust emissions, noise reduction, resource conservation, and recyclability throughout the life cycle of their products. To promote further advances in environmental performance, JAMA has bolstered its organizational structure and its dissemination of relevant information.
JAMA’s Organizational Provisions for Environmental Protection Activity
An optimal organizational structure enables swift and appropriate environmental action.
In order to respond promptly and effectively to environmental requirements, JAMA’s structure includes an Environment Committee and other environment-related committees whose subcommittees deal with specific issues. The Environment Committee studies and monitors improvements in automotive environmental performance as well as environmental protection efforts at JAMA members’ production plants. When a particularly far-reaching issue arises, a working group that functions laterally across the committees is established to address the matter. In April 2008, JAMA’s Global Warming Study Group was established to examine countermeasures to climate change.
Production
Life Cycle ofAutomobiles
UseRecycling
Basic Stance Design/Development
4

ImprovedTraffic Flow
More EfficientUse of Vehicles
DiversifiedAutomotiveFuel Supply
IncreasedVehicle FuelEfficiency
JAMA’s Recommended Measures in Four Areas
1) Measures to Increase Vehicle Fuel Efficiency(1) Adopting Fuel Efficiency Standards Individual countries or regions should adopt fuel efficiency regulatory criteria for both passenger cars and trucks, based on the compatibility of those criteria with national/regional conditions. Countries or regions that have not yet established fuel efficiency standards for passenger cars and trucks are urged to do so as soon as possible.
(2) Reducing Vehicle Weight Lighter vehicles with consequently higher fuel efficiency should be increasingly introduced into the market on a worldwide basis.
(3) Promoting Alternative-Energy/Next-Generation Vehicles To promote the greater use of alternative-energy/next-generation vehicles, it is critical that technological breakthroughs be achieved as soon as possible through cooperative efforts among industry, government and academia throughout the world. The fuel efficiency performance of automobiles that run on conventional fuels cannot be endlessly improved. Sustainable energy use for
the medium to long term must therefore be ensured by replacing conventional automobiles with alternative-energy and next-generation vehicles.
(4) Promoting the Widespread Use of Fuel-Efficient Vehicles The introduction of tax incentives by governments can effectively promote the shift to fuel-efficient and low-emission vehicles.
2) Measures to Diversify Automotive Fuel Supply The widespread use of low-carbon fuels, including biofuels, should be promoted in line with national requirements. The commercialization of cellulosic ethanol and BTL (biomass-to-liquid) fuels, which have no adverse impacts on food supply and soil quality, is the key to expanding biofuel supply. Coordinated efforts involving the industrial, public and academic sectors are required to advance technological development.
3) Measures to Improve Traffic Flow(1) Alleviating Road Congestion To mitigate road congestion, individual countries should adopt road traffic-related measures that represent the most effective responses to local conditions. Improving traffic flow through road infrastructure development is an especially urgent priority in the major emerging economies, where motorization is expanding at a rapid pace. ITS (Intelligent Transport Systems) technologies are useful tools for that purpose.
(2) Low-Carbon Urban Planning Especially in urban areas where significant population influxes are projected, effective road congestion-mitigation measures, including road network development and ITS applications, should be integrated into city planning initiatives from their earliest stage.
5
To achieve significant reductions in CO2 emissions in global road transport, JAMA advocates the adoption of an integrated approach, requiring that initiatives be taken in four areas: increased vehicle fuel efficiency, diversified automotive fuel supply, improved traffic flow, and more efficient vehicle use. These initiatives involve cooperative efforts on the part of stakeholders throughout the sector, including vehicle manufacturers, energy providers, governments, and vehicle users. In cooperation with the European Automobile Manufacturers Association (ACEA) and the Alliance of Automobile Manufacturers, JAMA held a panel discussion on “CO2 Reduction in the Road Transport Sector through the Integrated Approach” as a side event at COP16* in Cancun, Mexico in December 2010. JAMA will continue to promote the integrated approach in tandem with ACEA and the Alliance.
Recommended Measures for Reducing CO2 Emissions in the Global Road Transport Sector
*The sixteenth session of the Conference of the Parties to the United Nations Framework Conventionon Climate Change

Fig. 1 CO2 Emissions Reduction in the Global Road Transport Sector assuming the implementation of recommended measures
Source: JAMA
CO2 emissions (x 1 million tons)
2005 20152010 2020 2025 2030
10,000
8,000
6,000
4,000
If no CO2 countermeasures taken
Improved traffic flowAdoption of ecodrivingAccelerated replacementwith new models
Increased vehiclefuel efficiency
Use of alternative fuels
Source: Except where otherwise acknowledged, achievement rates are based on JAMA’s own analysis.
Table 1 Anticipated Impacts of JAMA’s Recommended Measures (2010-2030)
Through increasedfuel efficiency(new vehicles)
Through improved traffic flow
Throughecodriving
Through increased use of biofuels
Passenger cars
Commercial vehicles
Passenger cars
Commercial vehicles
OECD Countries Non-OECD Countries
Average (including China) annual rate ofdecrease in CO2 emissions: 2.3%
Average (excluding China) annual rate of decrease in CO2 emissions: 0% to 1%
Potential average rate (approximate) of decrease in CO2 emissions: 10%Ecodrivers as % of world driving population: 0% to 30%
Potential average rate (approximate) of decrease in CO2 emissions: 10%Ecodrivers as % of world driving population: 0% to 70%
Average global rate of use: 1% to 7% (IEA WEO 2006* Alternative Policy Scenario)
Average annual rate of decrease in CO2 emissions: 1.3%
Average annual rate of decrease in CO2 emissions: 0% to 1%
Average gain in on-road vehicle speed: 10km/h(5km/h every 10 years)
Average gain in on-road vehicle speed: 2km/h(1km/h every 10 years)
In and after 2010, all vehicles in use for 12 years or longer to be replaced with new models.Through replacement with new models
*World Energy Outlook 2006, International Energy Agency
6
4) Measures to Promote the More Efficient Use of Vehicles Drivers everywhere should be urged to practice ecodriving to help reduce fuel consumption and CO2 emissions. When adopted by truck fleet operators and their drivers, ecodriving also helps reduce operating costs. The use of onboard equipment such as fuel-efficiency gauges (for passenger cars) and digital tachographs (for trucks) facilitates ecodriving. Anticipated Impacts of JAMA’s Recommended Measures JAMA has carried out a hypothetical study to estimate the potential for CO2 reduction in the global road transport
sector assuming the implementation of the measures recommended above. As shown in Fig. 1 below, global road transport CO2 emissions would be expected to level off around 2025 if the recommended measures are implemented. Increased vehicle fuel efficiency could result in a very significant reduction in CO2; but a similar reduction in CO2 emissions could be achieved through the combined implementation of the other measures required, together with the accelerated replacement of the vehicle fleet with new models. Assuming the implementation of the recommended measures, a potential reduction in global road transport CO2 emissions of about 31% from the current level could be achieved by 2030.

Fig. 2 Adoption Rates in Passenger Cars of Major Fuel Efficiency Improvement Technologies
Source: JAMA
Fig. 3 Trends in Domestic New Passenger Car Compliance with the 2010 Fuel Efficiency Target
Source: JAMA
Compliance rate (%)
Fig. 1 Vehicle Technologies for Increased Fuel Efficiency
Source: JAMA
Certified and on-road vehicle fuel efficiency has increased as a result of gradual but steady technological progress.
Improved engine efficiencyImprovements in thermal efficiency:-Direct injection-Variable mechanisms (variable cylinder activation, VVT&L, etc.)Reduction of friction loss:-Reduction of piston and piston ring friction loss-Low-viscosity lubricating oil
Reduced rolling resistance
Low rolling-resistance tires
Reduced vehicle weight-Expanded use of lightweight materials-Improved body structure
Reduced aerodynamic dragImproved body configuration
Other-Electric power steering-Idling prevention (stop-start)-Hybridization
Improved powertrain performance
-Expansion of lock-up area-Expanded number of transmission gears-Continuously variable transmission
91.4
0
10
20
30
40
50
60
70
80
90
(%)100
2010200520001995
Variable valve timingCVT
(1998 projection)
(1998 projection)
23.2
74.0
71.8
0
20
40
60
80
100
1997 1998 1999 2000 2001 2002 2003 2004 2005 2006 2007 2008 2009 2010
11.3 14.7
24.435.5
53.3
72.4
81.185.0 86.089.6 90.7
95.7 96.387.5
■ ENVIRONMENTAL PROTECTION IN VEHICLE PERFORMANCE2
1.
1) Advanced Technologies for Increasing Fuel Efficiency JAMA member manufacturers continuously strive to increase fuel efficiency in, and thus reduce CO2 emissions from, the vehicles they produce. Numerous technologies have been introduced to increase vehicle fuel efficiency, including technologies for greater engine efficiency, more efficient powertrains, reduced aerodynamic drag, reduced vehicle weight and reduced rolling resistance (see Figs. 1 and 2).
2) Trends in Fuel Efficiency Performance Committed to achieving fuel efficiency targets as early as possible, Japan’s automakers have been steadily introducing into the market vehicles that meet those targets, ahead of their enforcement dates. Of all Japanese-brand gasoline-powered passenger cars (2.5 tons or less) sold domestically in 2010, over 96% (see Fig. 3) met their weight category-based 2010 fuel efficiency targets. Thus the average fuel efficiency of new gasoline-powered passenger cars reached 18.7km/ℓ, largely surpassing the target for 2010 (see Fig. 4). Greater vehicle fuel efficiency contributes significantly to CO2 emissions reduction, and the steady introduction of increasingly fuel-efficient vehicles led the government to project a reduction in the volume of automotive CO2 emissions of between 24.7 and 25.5 million tons by 2010 by means of increased vehicle fuel efficiency (see Fig. 5).
Increased vehicle fuel efficiency is continuously pursued for the reduction of CO2 emissions.
7
Tackling Climate Change through Increased Vehicle Fuel Efficiency and Related Measures

17
18
19
16
15
14
13
12
11
10
9
8
(km/ℓ)
2010
14.4
200520001995
14.9 15.1
14.3
9.2 9.4 9.4 9.5 9.6 9.7 9.9 10.0 10.2
13.813.513.1
12.6
12.4
12.7
12.5
9.2 9.2 9.1 9.0 9.1 9.1
12.6 12.6 12.7 12.8 12.912.7
13.1 13.313.5 13.7 13.8 14.1
14.4 14.7
15.4 15.516.0 16.2
16.9
18.118.7
1990 91 92 93 94 95 96 97 98 99 2000 01 02 03 04 05 06 07 08 09
217
229233
238
250
258263
265 264266 265 267
262260 259
254251
245
235230
2010Projected
200
210
220
230
240
250
260
270
290
300
310
320
280
240-243
—
Source: JAMA* Established assuming, for 2010, the same shipment volume ratios for the different vehicle weight categories as those recorded in 2009.
Year
Total reduction: Down 58.87-60.16million tons
Through other measures: Down 1.86-2.35 million tons
Through increased vehicle fuel efficiency: Down 24.70-25.50million tonsIf no CO2 countermeasures taken
—
Fig. 4 Trends in Average Fuel Efficiency of Domestic Gasoline-Powered Passenger Cars
2010 target*
Fig. 5 Actual & Targeted CO2 Emission Volumes in Japan’s Transport Sector, 1990-2010CO2 emissions (x 1 million tons)
Sources: Kyoto Protocol Target Achievement Plan, etc.
Compliance with vehicle fuel efficiency targets, etc.
Through improved traffic flow: Down 32.31million tons
Average certified fuel efficiency of in-use passenger cars
Average on-road fuel efficiency ofin-use passenger cars
Average certifiedfuel efficiency of new passenger cars
3) The Transport Sector’s CO2 Reduction Target Under the terms of the Kyoto Protocol enforced in 2005, Japan is to reduce its total annual volume of greenhouse gas emissions to 6% below the 1990 level* by 2008-2012. Accordingly, the Japanese government formulated a target achievement plan in April 2005 in line with its commitment under the Protocol. Mindful of a potential increase in CO2 emissions resulting from economic growth, the government’s plan prescribed specific targets and measures for individual sectors. After peaking in 2001, CO2 emissions in Japan’s transport sector have been steadily declining. The original target for
2010 of 250 million tons was consequently revised in March 2008 to a more challenging projection of 240-243 million tons (see Fig. 5). In fact, CO2 emissions in Japan’s transport sector in 2009 totalled 230 million tons, largely surpassing the 2010 projection. This was attributable to the effectiveness of the various CO2-reducing measures adopted, including the application of technologies for increased vehicle fuel efficiency; road congestion mitigation; and the wider practice of ecodriving.
8
*To 6% below the 1995 level for hydrofluorocarbons (HFCs), perfluoro-carbons (PFCs), and sulfur hexafluoride (SF).
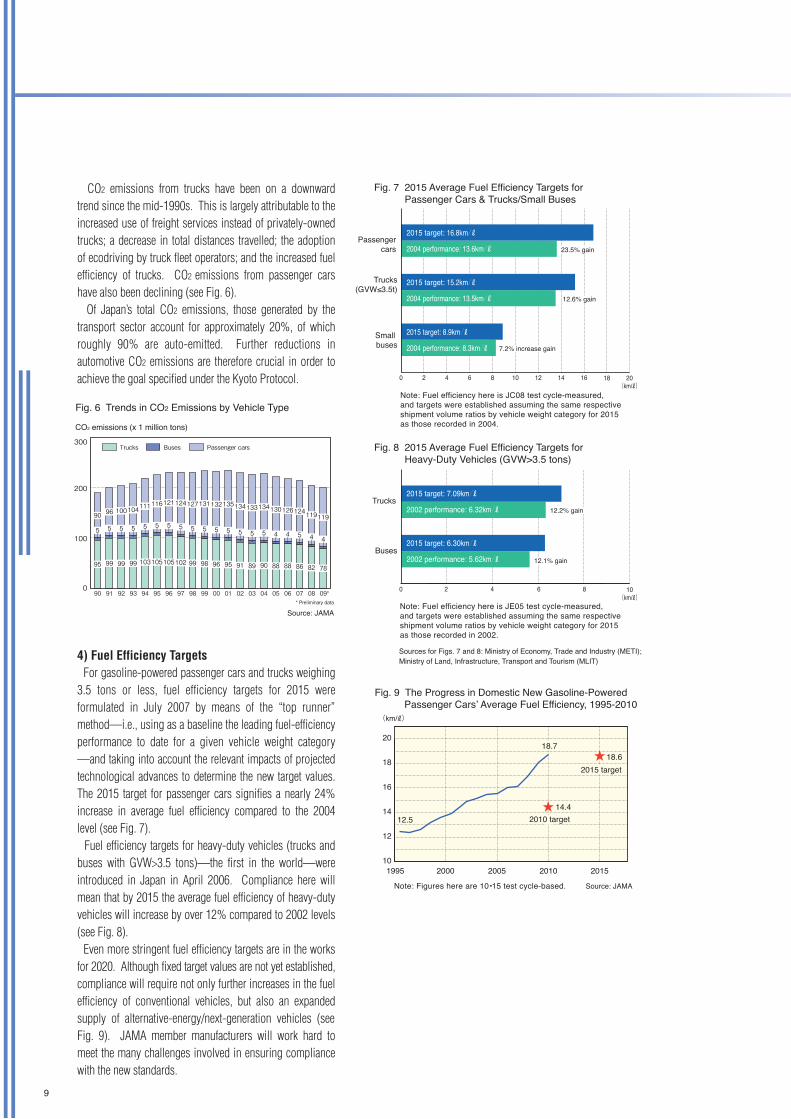
Fig. 6 Trends in CO2 Emissions by Vehicle Type
Fig. 9 The Progress in Domestic New Gasoline-Powered Passenger Cars’ Average Fuel Efficiency, 1995-2010
10(km/ℓ)
0 2 4 6 8
Buses
Trucks2015 target: 7.09km/ℓ
2002 performance: 6.32km/ℓ
2015 target: 6.30km/ℓ
2002 performance: 5.62km/ℓ
Note: Fuel efficiency here is JE05 test cycle-measured, and targets were established assuming the same respective shipment volume ratios by vehicle weight category for 2015 as those recorded in 2002.
0 2 4 6 8 10 12 14 16
Trucks(GVW≤3.5t)
Passengercars 23.5% gain
12.6% gain
18 20(km/ℓ)
2015 target: 16.8km/ℓ
2004 performance: 13.6km/ℓ
2015 target: 15.2km/ℓ
2004 performance: 13.5km/ℓ
Small buses 7.2% increase gain
2015 target: 8.9km/ℓ
2004 performance: 8.3km/ℓ
Note: Fuel efficiency here is JC08 test cycle-measured, and targets were established assuming the same respective shipment volume ratios by vehicle weight category for 2015 as those recorded in 2004.
Sources for Figs. 7 and 8: Ministry of Economy, Trade and Industry (METI); Ministry of Land, Infrastructure, Transport and Tourism (MLIT)
Fig. 7 2015 Average Fuel Efficiency Targets for Passenger Cars & Trucks/Small Buses
12.2% gain
12.1% gain
Fig. 8 2015 Average Fuel Efficiency Targets for Heavy-Duty Vehicles (GVW>3.5 tons)
CO2 emissions (x 1 million tons)
Trucks
0
100
200
300
90
95
90
5|
91
99
96
5|
92
99
100
5|
93
99
104
5|
94
103
111
5|
95
105
116
5|
96
105
121
5|
97
102
124
5|
98
99
127
5|
99
98
131
5|
00
96
132
5|
01
95
135
5|
02
91
134
5|
03
89
133
5|
04
90
134
5|
05
88
130
4|
06
88
126
4|
07
86
124
5|
08 09* * Preliminary data
82
119
4|
78
119
4|
Buses Passenger cars
Source: JAMA
199510
12
14
16
18
20
2000 2005 2010 2015
(km/ℓ)
12.5
18.7
14.4
18.6
2010 target★
Source: JAMA
2015 target★
Note: Figures here are 10•15 test cycle-based.
9
CO2 emissions from trucks have been on a downward trend since the mid-1990s. This is largely attributable to the increased use of freight services instead of privately-owned trucks; a decrease in total distances travelled; the adoption of ecodriving by truck fleet operators; and the increased fuel efficiency of trucks. CO2 emissions from passenger cars have also been declining (see Fig. 6). Of Japan’s total CO2 emissions, those generated by the transport sector account for approximately 20%, of which roughly 90% are auto-emitted. Further reductions in automotive CO2 emissions are therefore crucial in order to achieve the goal specified under the Kyoto Protocol.
4) Fuel Efficiency Targets For gasoline-powered passenger cars and trucks weighing 3.5 tons or less, fuel efficiency targets for 2015 were formulated in July 2007 by means of the “top runner” method—i.e., using as a baseline the leading fuel-efficiency performance to date for a given vehicle weight category—and taking into account the relevant impacts of projected technological advances to determine the new target values. The 2015 target for passenger cars signifies a nearly 24% increase in average fuel efficiency compared to the 2004 level (see Fig. 7). Fuel efficiency targets for heavy-duty vehicles (trucks and buses with GVW>3.5 tons)—the first in the world—were introduced in Japan in April 2006. Compliance here will mean that by 2015 the average fuel efficiency of heavy-duty vehicles will increase by over 12% compared to 2002 levels (see Fig. 8). Even more stringent fuel efficiency targets are in the works for 2020. Although fixed target values are not yet established, compliance will require not only further increases in the fuel efficiency of conventional vehicles, but also an expanded supply of alternative-energy/next-generation vehicles (see Fig. 9). JAMA member manufacturers will work hard to meet the many challenges involved in ensuring compliance with the new standards.

20042002200120000
20
40
60
80
100(%)
2003 2005 2006 2007 20092008 2010
81.6 84.1
72.0
49.8
18.5
80.186.1 88.6 90.4
95.5 96.2
Table 1 Tax Incentives for Fuel-Efficient & Low-Emission Vehicles
100
120
140
160
180
200
180 177 174 172 170 166161 160
154
143 141
130
(gCO2/km)
★
2000 2001 2002 2003 2004 2005 2006 2007 2008 2009 2010 2011 2012
Sources: European Commission for 1995-2009 data; JAMA for 2010 dataNote: The above acquisition and tonnage tax incentives will be in effect for three years, as follows:• From April 1, 2009 through March 31, 2012 for the acquisition tax (imposed once only, at the time of vehicle purchase);• From April 1, 2009 through April 30, 2012 for the tonnage tax (with reductions applicable once only, upon first payment of the tax at the time of the very first mandatory inspection, three years [in the case of passenger cars] after vehicle purchase; for vehicles in use, the tonnage tax reduction will be applied at the time of the first mandatory inspection the vehicle undergoes during the period in which the incentives are in effect).* A 75% reduction for gasoline vehicles complying with 2015 fuel efficiency standards and whose emissions are down by 75% from 2005 standards. Source: MLIT
Fig. 10 Share of Fuel-Efficient & Low-Emission Passenger Cars in Total Car Shipments (Domestic)
Note: Data here pertains to gasoline-powered passenger cars certified fuel-efficient and low-emission as per Japan’s Law Concerning the Rational Use of Energy (or Energy Conservation Law), with emissions compliant with 2000 or 2005 standards.
75%reduction— 75%
reduction
50%reduction— 50%
reduction
Acquisition TaxAutomobile Tax Tonnage Tax
IncentivesEmissionsPerformance
Compliant +25% compared to 2010 fuel efficiency standards Emissions down by 75%
from 2005 standards
Compliant with2009 emission standards
Compliant with 2005 emission standards,
with NOx and/or PM emissions down by 10% from those standards
Compliant +15% compared to2010 fuel efficiency standards
Compliant with2015 fuel efficiency standards
Electric (including fuel cell), plug-in hybrid, clean diesel, hybrid and natural gas vehiclesthat meet certain performance requirements
Fuel Efficiency
50%reduction— 50%
reduction
Alte
rnat
ive-
Ener
gy/
Nex
t-Gen
erat
ion
Vehi
cles
Pas
seng
er C
ars
and
Min
i-Veh
icle
sTr
ucks
and
Bus
es(2
.5t<
GV
W≤
3.5t
)H
eavy
-Dut
yVeh
icle
s (G
VW
>3.5
t)
75%reduction
50%reduction
75%reduction
Exempt50%reduction Exempt
75%reduction— 75%
reductionCompliant with
2015 fuel efficiency standards
[Diesel vehicles:]Compliant with
2009 emission standards
[Gasoline vehicles:]Emissions down by 50%
from 2005 standards 50%reduction*— 50%
reduction
Fig. 11 Trends in Average CO2 Emissions of Japanese- Brand New Passenger Cars in the EU Market
10
5) Environmental Performance Vehicle Certification An environmental performance certification system was introduced in Japan in April 2004, aimed at promoting greater public awareness of and interest in highly fuel-efficient and low-emission vehicles through the affixation of certification stickers to those vehicles. The stickers initially identified vehicles that met fuel efficiency targets or surpassed them by 5%. In April 2008, new stickers were introduced identifying vehicles whose fuel efficiency is superior to the 2010 target by 15% or better or by 25%. Also in application is a “green” tax scheme that provides incentives to purchasers of vehicles whose fuel efficiency and emissions meet stipulated performance levels (see Table 1). This certification system has had a very significant impact on the market, as demonstrated by the fact that more than 96% of all domestic gasoline-powered passenger cars sold in Japan in 2010 were certified as fuel-efficient and low-emission vehicles (see Fig. 10).
JAMA member companies are expanding their production of highly fuel-efficient vehicles that meet the most recent emission standards.
6) CO2 Emissions and Japanese-Brand Passenger Cars in the EU Market Average CO2 emissions from the passenger cars marketed by JAMA member automakers in the European Union have steadily decreased, reaching 141g/km* in 2010, according to JAMA data (see Fig. 11). The automakers are working hard to meet the European Commission's target of 130gCO2/km by 2012 for new passenger cars sold in the European Union, to be met by means of improvements in vehicle engine technologies. (This target is to be comple-mented by additional measures, adopted on the basis of the integrated approach, that are to achieve a further reduction of 10gCO2/km.)
*CO2 emissions are regulated in the EU market on the basis of CO2 grams per kilometer.

Fig. 1 Impact of Government Eco-Friendly Vehicle Purchasing Incentives on Sales of Alternative- Energy/Next-Generation Passenger Cars
Note: Figures for hybrid and electric vehicles are preliminary.
25(%)
Shar
e of
alt-
en/n
ext-g
en v
ehic
les
in
new
pas
seng
er c
ar s
ales
20
15
10
5
0
Duration of tax incentives program
Duration of subsidies program
2008 2009 2010321121110987654321121110987654321121110987654
201187654
Source: JAMA
Source: JAMA
Source: JAMA
Notes: 1. Includes imported cars. 2. Does not include statistics on Toyota’s Kluger hybrid and Nissan’s diesel X-Trail. 3. Subsidies were terminated in September 2010; analysis of their impact is still unavailable.
1995 1996 1997 1998 1999 2000 2001 2002 2003 2004 2005 2006 2007 2008 20090
200,000160,000120,00080,00040,000
400,000360,000320,000280,000240,000
600,000560,000520,000480,000440,000
800,000760,000720,000680,000640,000
1,000,000960,000920,000880,000840,000
1,200,0001,160,0001,120,0001,080,0001,040,000
983,831
5,08038,8611,941
2,731 7,4983,27327,60044,07159,528
87,835108,945
154,210
221,908
284,896
463,898
375,593
575,940
Total: 1,029,713
Fig. 2 Status of Alternative-Energy/Next-Generation Vehicle Use in Japan
Fig. 3 Composition of Japan's Vehicle Fleet, with Breakdown of Alternative-Energy/Next-Generation Vehicle Share (2009 Estimate)
(No. of vehicles in use)
Clean diesel vehiclesNatural gas vehiclesElectric vehiclesHybrid vehicles
Hybrid vehicles983,831Alternative-energy/
Next-generationvehicles
Total: 1.03 million1.4%
Conventional vehicles74.29 million
98.6%
Natural gasvehicles38,861
Electric vehicles1,941
Clean diesel vehicles5,080
1) Government Calls for Wider Use In 2007 the Japanese government announced the “Next-Generation Vehicle and Fuel Initiative” which established diffusion targets for alternative-energy/next-generation vehicles, including hybrid, electric, fuel cell and natural gas vehicles. Other government initiatives—includ-ing the “New National Energy Strategy” (announced in May 2006 and aimed at reducing oil dependency and improving energy efficiency by 20% and 30%, respectively, by 2030); “Cool Earth 50” (announced in January 2008 and aimed at halving CO2 emissions by 2050); the “Action Plan for a Low-Carbon Society” (announced in July 2008 and aimed at slashing GHG emissions by 60-80% by 2050); the “Next-Generation Vehicle Strategy” (announced in April 2010 and aimed at increasing the share of alternative-energy/next-generation vehicles in new vehicle sales in Japan to 50% by 2020); and the most recent medium-to long-term roadmap for GHG emissions reduction—have also called for the wider diffusion of these environmentally-friendly vehicles. Beginning in April 2009, when the government’s tax incentive/subsidy programs for the purchase of eco-friendly vehicles were introduced, the share of alternative-energy/next-generation vehicles in total passenger car sales surged (see Fig. 1). In order to attain the government’s aforemen-tioned goal of “50% [of new vehicle sales] by 2020,” various incentive measures, including subsidies, tax breaks and infrastructure development, must be implemented. Without such government assistance, JAMA estimates that the share of alternative-energy/next-generation vehicles would level off at a little more than 10%.
2. Promoting the Wider Use of Alternative-Energy/Next-Generation Vehicles
JAMA member manufacturers promote the development and wider diffusion of alternative-energy/ next-generation vehicles with low environmental impact that meet the needs of automobile users.
11

Plug-In Hybrid Vehicles
Flex-Fuel Vehicles (gasoline/ethanol)
Electric Vehicles
Fuel Cell Vehicles
Hydrogen Vehicles
Hybrid Vehicles
Natural Gas Vehicles
Clean Diesel Vehicles
Hybrid Small Trucks Hybrid Buses (inductive power transfer-type)
Alternative-Energy/Next-Generation Vehicles
12
2) Current In-Use Status Thanks in great part to the progress made by Japaneseautomakers in the development of alternative-energy/next-generation vehicles, the number of these vehicles in use in Japan—and in particular the number of hybrid vehicles in use—has steadily increased, exceeding one million in 2009 (see Fig. 2). This is still a relatively very small number, however, accounting for only 1.4% of all the motor vehicles in use in Japan today (see Fig. 3).
3) Measures to Promote the Widespread Use of Alternative-Energy/Next-Generation Vehicles Alternative-energy/next-generation vehicles provide an effective means of reducing CO2 emissions. As such, they are highly promising and, as explained above, are now
increasingly in use in Japan. For their full-scale proliferation after 2020, however, various challenges must be met, including lowering costs, improving battery performance, increasing travel range, and developing infrastructure. Accelerating the widespread use of these vehicles will specifically require, among other measures: - Encouraging their purchase/use through tax incentives and subsidies; - Achieving technological breakthroughs (e.g., for next- generation batteries) through research and development; and - Establishing the necessary fuel/energy infrastructures. JAMA members continuously strive to advance the technologies required for superior performance and lowered costs, to enable the supply of more affordable products.

Source: Ministry of the Environment
Table 1 Effects of CO2/CFC-12/HFC-134a/HFO-1234yf on Ozone Layer Depletion and Global Warming
Carbon dioxide(CO2)
CFC-12
HFC-134a
Global WarmingCoefficient
1
10,900
1,430
Ozone Layer DepletionCoefficient
0
1.0
0
HFO-1234yf 40
Substance
* Total HFC amount used in vehicle manufacturing ÷ Number of vehicles manufactured
Table 2 Trends in Amount of Refrigerant Used Per Vehicle
Source: JAMA
2003
582
(83)
2006
536
(77)
2007
524
(75)
2008
520
(74)
2009
495
(71)
2010
498
(71)
2004
553
(79)
2005
548
(78)
2002
588
(84)
2001
603
(86)
2000
615
(88)
1999
650
(93)
1998
700
(100)
1997
700
(100)
1996
700
(100)
1995
700
(100)
Year
Per-vehicle amount* (grams) of refrigerant used
(1995 = 100%)
Source: JAMA
Fig. 1 Reductions in Refrigerant Use
201020052000199519901985198019751970
0.2
0.4
0.6
0.8
1.0
Heat-exchange improvements (Slim-type MACs)
Cooling system improvementsCooling system improvements
CFC12
Shift to HFC-134a (Cooling system improvements)
2010 target
Heat-exchange improvements
Although there has been a decrease in the amount of chlorofluorocarbon substitute used in mobile air conditioners, the substitute refrigerant nevertheless contributes to global warming. To reduce the climate impacts of mobile air conditioning, the Japanese automobile industry will continue to implement measures to further lower the amount of refrigerant used, reduce refrigerant leakage (at charging time and during vehicle use), promote proper disposal methods, and switch to alternative refrigerants, among other aims.
1) CFC Replacement and Refrigerant Recovery & Disposal In 1994 Japan’s automobile industry completed the shift from chlorofluorocarbon (specifically, CFC-12) use to the use of HFC-134a—a substitute that does not deplete the stratospheric ozone layer—in all new vehicle air condi-tioners. Current efforts are focused, under Japan’s End-of-Life Vehicle Recycling Law, on the recovery and disposal (i.e., destruction) of refrigerants (both CFC-12
and HFC-134a) to prevent their leakage from end-of-life vehicles.
2) Reductions in Refrigerant Use Although HFC-134a has only about one-eighth the greenhouse effect of CFC-12 (see Table 1), Japanese automakers have nevertheless been working jointly with mobile air-conditioner manufacturers to reduce the amount of refrigerant used in their products. As a result of improvements in cooling systems and heat-exchange performance, refrigerant use in mobile air conditioners was halved in the 20 years from 1980 to 2000 (see Fig. 1). An additional voluntary target was established by JAMA member companies to reduce the amount of refrigerant used in mobile air conditioners by more than 20% from the 1995 level by 2010. This target was achieved in 2004 and refrigerant use has been steadily reduced further since then (see Table 2).
3. Reducing the Hazards of Mobile Air Conditioners
- The amount of refrigerant used in vehicle air conditioners (also called mobile air conditioners) was reduced by one-half during the period 1980-2000 and has been steadily reduced further since then.- The development of mobile air-conditioning systems using HFO-1234yf, a refrigerant with low global warming potential, will be accelerated. - Fuel consumption by mobile air conditioners will also be reduced, for further reductions in CO2 emissions.
13

Fig. 2 Measures Taken to Reduce the Environmental Impact of Mobile-Air-Conditioner Refrigerant
Refrigerant chargers equipped with a device to recover any gas remaining in the delivery hose
1990
-1980s
1991
1992
1993
1994
1995
1996
1997
1998
1999
2000
2001
2002
2003
RefrigerantUsed
Reductions inAmount Used
Recovery &Disposal Other
2004
2005
2006
2007
2008
2009
2010
CFC-12
HFC-134a
Development of new-generation MACs using less refrigerant; reductions in leakage
Greater efficiency in refrigerant charging process
CFC-12recovery & disposal system introduced (voluntary action)
Oct.
May
Oct.
Jan.
HFC-134arecovery & disposal system introduced(voluntary action)
Reductions in amount used at charging time:Down by 40% from the 1970s level
Reductions in leakage:Down from 50g/yr to 10g/yr
MAC refrigerant recovery & disposal mandated by national legislation
Enforcement of End-of-Life Vehicle Recycling Law
Source: JAMA
3) Preventing Refrigerant Leakage in Vehicle Manufacturing As a result of JAMA member companies having adopted measures to minimize leakage of refrigerant emissions during the vehicle manufacturing process, leakage has been reduced to about 0.8 gram per vehicle. The automakers use cutting-edge technologies to charge mobile air conditioners with refrigerant and are working to achieve further reductions in emissions leakage in future.
4) Preventing Refrigerant Leakage during Vehicle Use Japan’s automakers and mobile air-conditioner manu-facturers work jointly to develop new-generation vehicle air-conditioning systems that minimize refrigerant leakage during vehicle use. Their investigations have shown an average leakage from new-model vehicle air conditioners of less than 10 grams per year, which represents very significant progress compared to the 50 grams per year leaked from vehicles manufactured in the 1970s.
5) Developing Mobile Air Conditioners with Minimal Environmental Impact Automakers and refrigerant and mobile air-conditioner manufacturers are now researching the use of alternatives to the HFC-134a refrigerant. Next-generation refrigerants for mobile air conditioners have to meet a host of criteria in terms of environmental impact, safety, energy efficiency, durability, serviceability, and recyclability. Having a comparatively minute impact on the environ-ment (with a GWP, or global warming potential, of 4), HFO-1234yf is considered the most promising next-generation refrigerant that can be used in current mobile-air-conditioner models without major modifications. Japanese automakers and their partners are therefore promoting evaluation and verification of its performance and durability to ensure its global adaptability. In order to put HFO-1234yf into practical use in the Japanese fleet, however, they have to address a number of challenging issues pertaining to the development of infrastructure to
support the manufacture and servicing of mobile air conditioners using this new refrigerant.
6) Reducing Fuel Consumption in Mobile Air Conditioners Numerous studies have been and continue to be conducted on the multiple issues involved in reducing the fuel consumption of automotive air conditioners, including: - Greater efficiency of air-conditioning systems; - Provision of a power-saving function to prevent excessive cooling; - Air-conditioning control in coordination with engine and transmission use; and - In-cabin heat-reduction strategies to reduce the need for air conditioning. Various energy-saving technologies developed as a result of these studies have already been introduced to the market.
14

Fig. 1 Emission Regulations for Gasoline-Powered Passenger Cars: Japan/U.S.A./EU Comparisons
Source: JAMA
NMHC: Non-methane hydrocarbonsNOx: Nitrogen oxides
2005Regulations
(2005)
1978 Regulations (1978-2000)
2009 Regulations (2009)
2000 Regulations(2000)
U.S.A. (1994-2003)EURO3 (2000-2004)
EURO4 (2005)
U.S.A. (2004)
EURO5 (2009)
0.30NMHC(g/km)
0 0.1 0.2 0.3 0.4NOx(g/km)
0.25
0.20
0.15
0.10
0.05
0.00
4. Improving Air Quality
1) History of Emission Regulations for Gasoline- Powered Passenger Cars Japan’s first exhaust emission regulation was introduced in 1966 to reduce carbon monoxide (CO) emissions from gasoline-powered passenger cars. Hydrocarbons (HC) and nitrogen oxides (NOx) were subsequently targeted in new regulations enforced as of 1973. Vehicle emission regulations targeting these three substances became progressively stricter thereafter.
2) Reducing Emissions from Gasoline-Powered Passenger Cars JAMA member manufacturers have been energetically introducing low-emission vehicles (LEVs) into the domestic market, and LEV-certified passenger cars accounted for 98% (over 3.5 million units) of total passenger car shipments in 2010. More than 90% of these low-emission cars very largely surpassed 2005 emission standards (see ☆☆☆☆ in Fig. 2). Since the introduction of vehicle emission regulations in Japan, JAMA members have developed and advanced numer-
New emission regulations for gasoline vehicles enforced in Japan as of 2005 are very stringent (see Fig. 1). More-over, regulations enforced as of 2009 mandate a uniform maximum value (0.005g/km) for particulate matter (PM) emissions from new gasoline-powered passenger cars and light-duty trucks and buses. All these vehicles must therefore be equipped with direct injection-type engines.
ous technologies to enable compliance. The technologies most commonly in application today for gasoline-powered vehicles are electronically-controlled fuel injection (for more efficient combustion) and the use of catalytic converters, the result of important breakthroughs in technological development. Japan’s low-emission vehicle certification system initially used 2000 emission standards as baseline criteria, whereby passenger cars surpassing those standards by 25%, 50%, or
- The vehicles supplied by JAMA member manufacturers incorporate advanced emissions control technologies.- In addition to vehicle emissions control technologies, automotive fuel quality plays a critical role in improving air quality.
15

Note: Low-emission vehicles (LEVs) are certified on the basis of the following criteria.☆☆☆☆:Emissions down by 75% from 2005 standards☆☆☆: Emissions down by 50% from 2005 standards☆☆☆: Emissions down by 75% from 2000 standards☆☆: Emissions down by 50% from 2000 standards☆:Emissions down by 25% from 2000 standards
Fig. 2 Low-Emission Passenger Car Shipments Compared to Total Passenger Car Shipments (Domestic)
Fig. 3 Heavy-Duty Diesel Vehicle Emission Regulations: Japan/U.S.A./EU Comparisons
Source: JAMA
Long-Term Regulations (1998-1999)
Post-New Long-Term Regulations (2009)
New Short-Term Regulations (2003-2004)
New Long-Term Regulations(2005)
U.S.A. (1998)
EUROⅢ (2000)
EUROⅤ (2008)EUROⅣ (2005)
EUROⅥ (Planned)
U.S.A. (2004)
U.S.A. (2010)
U.S.A. (2007)
0.30PM(g/kWh)
0 1 2 3 4 5 6NOx(g/kWh)
0.25
0.20
0.15
0.10
0.05
0.00
Source: JAMA
20000
1
2
3
4
5(x 1 million units)
2001 2002 2003 2004 2005 2006 2007
0
3,571,378 unitsTotal: 3,484,707 units
0
151,027units
3,333,680units
0
2008
Total number of passenger car shipments
☆(2000) ☆☆☆
(2000)
2009 2010
☆☆☆(2005)
☆☆☆☆(2005)
☆☆(2000)
75% were LEV-certified. With the introduction in 2005 of new emission regulations, the system was expanded to include passenger cars that surpass the 2005 standards by
3) History of Emission Regulations for Heavy-Duty Diesel Vehicles In 1972 Japan introduced its first emission regulation for heavy-duty diesel vehicles for the purpose of controlling black smoke (soot). Carbon monoxide (CO), hydrocarbons (HC) and nitrogen oxides (NOx) were regulated as of 1974. Subsequent regulations for heavy-duty diesel vehicles targeted NOx emissions until 1993, when particulate matter (PM) emissions were regulated for the first time.
50% or 75%. This system has been highly effective in promoting the widespread use in Japan of passenger cars with significantly reduced exhaust emissions.
Japan’s heavy-duty diesel vehicle emission regulations became progressively stricter thereafter. The 2009 Post-New Long-Term Regulations specify emission limit values of 0.7g/kWh for NOx and 0.01g/kWh for PM, making them at the time of their enforcement the most stringent regulations for trucks and buses in the world (see Fig. 3).
16

Table 1 New Regulations on Motorcycle Emissions (g/km)
Source: Ministry of the Environment
MotorcycleCategory
Motor-drivencycles, Class 1
(50cc & under)
Motor-drivencycles, Class 2
(51cc-125cc)
2.0
2.0
Hydro-carbons
(HC)
0.50
0.50
Nitrogenoxides(NOx)
0.15
0.15
Mini-sizedmotorcycles
(126cc-250cc)2.0 0.30 0.15
Small-sizedmotorcycles(Over 250cc)
2.0 0.30 0.15
Enforcement date1) New models2) In-production models/Imports
1) Oct.1, 20062) Sept.1, 2007
1) Oct.1, 20072) Sept.1, 2008
1) Oct.1, 20062) Sept.1, 2007
1) Oct.1, 20072) Sept.1, 2008
Carbonmonoxide
(CO)
4) Reducing Emissions from Diesel Vehicles To achieve emission reductions in diesel vehicles, JAMA member manufacturers focused their efforts initially on delayed fuel-injection technology, upgraded combustion chambers, improved intake/exhaust systems, and increased fuel-injection pressure. Those emission reduction technol-ogies proved unsatisfactory, however, in the effort to meet the severe requirements prescribed for heavy-duty diesel vehicle emissions in the 2005 New Long-Term Regulations and the 2009 Post-New Long-Term Regulations. JAMA members thereafter addressed the diesel emissions problem through the integration of electronically-controlled, high-pressure multi-stage (or “common-rail”) fuel injection; combustion control using sophisticated exhaust gas recirculation (EGR) systems; and aftertreatment systems using diesel particulate filters (DPFs) or NOx selective catalytic reduction (SCR). As a result, JAMA members introduced to the market various technologies that enabled compliance with the 2005 and 2009 regulations, including the aforementioned advanced combustion-control technology; DPFs; SCR systems; and NOx trap catalysts. Moreover, in line with the regulations in force for diesel vehicle operation in the greater Tokyo region, all the automakers now supply oxidation catalysts as PM reduction devices to be mounted on in-use diesel vehicles. Looking ahead, a more stringent NOx emission regulation for heavy-duty diesel vehicles is scheduled to come into force in 2016. Also in 2016, Japan’s current JE05 test cycle for measuring HDV exhaust emissions will be replaced by the World Harmonized Transient Cycle (WHTC), and measurement will be made with a cold start. Furthermore, in order to ensure emissions reduction not just in test conditions but in actual, on-road (i.e., “off-cycle”) driving conditions, off-cycle measures will be adopted and, to monitor real-world performance, On-Board Diagnostic (OBD) systems will be introduced.
5) Reducing Emissions from Motorcycles Motorcycle exhaust emissions were first regulated in 1978, in the United States, and other countries followed suit. Japan’s first motorcycle emission regulations were implemented in 1998. Those regulations have been strengthened over the years, making Japan’s latest regulations in this area the strictest in the world. Compliance with the latest regulations means a 75-85% reduction in motorcycle hydrocarbon (HC) and carbon monoxide (CO) emissions as well as a 50% reduction in NOx emissions compared with previous regulatory levels.
The latest regulations also feature stricter standards with respect to idling, as well as revised requirements for stable emissions performance. To enable compliance, all motor-cycle models are expected to be equipped with catalysts. As in the case of passenger cars, catalyst performance must be cold-start tested. Japan’s motorcycle manufacturers are actively pursuing the adoption of new emissions control technologies for their products, including advanced fuel-injection systems for optimal combustion and high-performance catalysts for the treatment of harmful emissions. Motorcycles are valued for their multiple advantages of being compact and lightweight, offering excellent mobility, and generating fewer emissions than other motor vehicles. Further enhancing motorcycle environmental performance will surely optimize all these attributes.
17

Source: Central Environment Council
20012000 2002 2003 2004 2005 2006 2007 2008 2009 2010 2011
(ppm)
500ppm (0.05wt%)
350ppm (0.035wt%)
50ppm (0.005wt%)
10ppm (0.001wt%)
10ppm
15ppm
←U.S.A.
←EU
← Japan
Joint voluntary action byindustry
Fig. 4 Comparisons of Sulfur Content in Diesel Fuel
Major topics of research include:- Effects of pre- and postnatal exposure to exhaust from advanced diesel engines on the reproductive systems of rats; and- Analysis of roadside ambient air particles’ oxidative activity and chemical components.
Separately, JAMA and Japan’s National Institute for Environmental Studies are also jointly studying how vehicle emissions might affect living organisms.
8) Meeting Japan’s Air Quality Standards The direct impact of motor vehicle exhaust on ambient air quality is monitored around the clock at air-quality monitoring stations sited throughout Japan next to busy roadways, where concentration levels of sulfur dioxide (SO2), carbon monoxide (CO), suspended particulate matter (SPM) and nitrogen dioxide (NO2), in particular, are measured. Air quality at all the monitoring sites has long been found to largely meet the national standards for SO2, CO and SPM, owing to measures taken by the central and local governments and to a continuous increase in the share of low-emission vehicles in Japan’s vehicle fleet. There has also been a steady decline in ambient concentration levels of nitrogen oxides, although compliance with the NO2 standard has proven more difficult to achieve in dense urban areas. Nevertheless, air quality simulations conducted by JATOP in 2008 demonstrated that concentration levels of NO2 at most roadside monitoring sites in Tokyo would be standard-compliant by 2020, because of the large decrease in NOx emissions that would result from the enforcement, beginning in 2009, of new vehicle exhaust emission regulations and the fact that NO2 from non-automotive emitters (e.g., construction machinery) would also be reduced thanks to other enforcement measures. A September 2009 report by the Central Environment Council resulted in the establishment of a new environ-mental standard for PM2.5 which consists not only of primary particles generated directly from their emitters, but also of secondary particles produced in the photochemical process originating from other sources. PM2.5 requires further study precisely because it comes from multiple sources, including overseas sources, and because its movement in the atmosphere is highly complicated. JAMA has commissioned JATOP and JARI to carry out further research on the atmospheric movement of PM2.5 and on the mechanisms of its secondary-particle generation. Results obtained from these studies will be used in the development of advanced vehicle emissions reduction technologies aimed at further improving air quality.
6) Achieving Further Reductions in Vehicle Exhaust Emissions Achieving further reductions in automotive exhaust emissions requires long-term research on fundamental issues such as the mechanisms of emissions generation and the relationship between fuels, lubricants, and vehicle operation. In addition to their own research and development activities, the Japanese automakers have, through JAMA, commissioned the Japan Automobile Research Institute (JARI) to conduct research on these and other pertinent issues. Working jointly with the petroleum industry and with the support of the government, JAMA members were also active in the Japan Clean Air Program (JCAP) which researched methods for improving ambient air quality nationwide.This initiative resulted in the earlier-than-expected supply on the domestic market of low-sulfur automotive fuel (see Fig. 4).
JCAP evolved into the Japan Auto-Oil Program (JATOP) which aims for technological solutions to auto-sector energy conservation and air quality issues, with an eye to addressing climate change and energy security. Launched in 2007, the new five-year program aims specifically to establish technologies for CO2 emissions reduction, fuel diversification, and reduced vehicle emissions. JAMA will continue to carry out research on automotive fuel and air quality in cooperation with Japan’s petroleum industry and the Japanese government.
7) Researching the Impact of Vehicle Emissions on Health JARI (see above) is also charged with conducting research on ambient air quality and the impact of motor vehicle emissions on health—research which includes cell and animal exposure tests—and presenting the results of its research at workshops and seminars.
18

Pre-test conditions
Step 1: Airtight heated cabin (formaldehyde)
Step 2: Engine & AC running (except formaldehyde)
Vehicle Cabin VOC Test Procedures
A Voluntary Approach to Reducing Vehicle Cabin VOCsNew-model passenger cars to be marketed in and after fiscal 2007 and new-model commercial vehicles to be sold in and after fiscal 2008 should meet the target values established by Japan’s Ministry of Health, Labor and Welfare for indoor concentration levels of 13 different substances. Automakers will work to lower vehicle cabin VOC concentration levels even further in future.
Note: The voluntary initiative described above applies only to vehicles that are manufactured and sold in Japan.
All cabin doors and windows are closed and radiation lamps are used to heat the cabin in an airtight state, maintaining cabin temperature at 40℃ (35℃ for buses) for a period of 4.5 hours. Cabin air is then sample-tested over a period of 30 minutes.
After completing Step 1, engine is started and AC turned on. Cabin air is then sample-tested in that state over a period of 15 minutes for passenger cars, 30 minutes for trucks, and 120 minutes for buses.
Cabin doors and windows are open for at least 30 minutes for ventilation.
Table 1 Target Values for Indoor Concentration Levels of 13 Substances (VOCs)
Substance
FormaldehydeTolueneXyleneParadichlorobenzene Ethylbenzene Styrene
Chlorpyrifos
Di-n-butyl phthalate TetradecaneDi-2-ethylhexyl phthalateDiazinonAcetaldehydeFenobucarb
Principal Sources
Adhesives for plywood, wallpaper, etc.Adhesives/paints for interior finishing materials, furniture, etc.Moth repellents, lavatory air freshenersAdhesives/paints for plywood, furniture, etc.Insulation materials, bath units, tatami-mat core materials
Insecticides (esp. ant exterminators)
Paints, pigments, adhesivesKerosene, paintsWallpaper, flooring materials, wire-coating materialsPesticidesAdhesives for construction materials, wallpaper, etc.Insecticides (esp. termite exterminators)
Target Value for Indoor Concentration Level
100μg/m3
260μg/m3
870μg/m3
240μg/m3
3,800μg/m3
220μg/m3
1μg/m3
0.1μg/m3
220μg/m3
330μg/m3
120μg/m3
0.29μg/m3
48μg/m3
33μg/m3
(0.08ppm)(0.07ppm)(0.20ppm)(0.04ppm)(0.88ppm)(0.05ppm)(0.07ppb)(0.007ppb) for children(0.02ppm)(0.04ppm)(7.6ppb)(0.02ppb)(0.03ppm)(3.8ppb)
Note: The above target values were established in 2002 by the Council to Study Sick House Syndrome (indoor air pollution) under Japan's Ministry of Health, Labor and Welfare.
1) Voluntary Actions Taken by JAMA and Its Members JAMA has carried out its own research aimed at making vehicle cabins safer and more comfortable. In February 2005, it announced the voluntary reduction by its member manufacturers of in-cabin volatile organic compounds (VOCs) in passenger cars and the formulation of test methods for measuring in-cabin VOCs. The aim of this initiative was to enable new-model passenger cars sold in and after April 2007 to meet the target values established in 2002 under the Ministry of Health, Labor and Welfare for indoor concentration levels of 13 substances (see Table 1). Similar measures were adopted for trucks, buses and other commercial vehicles in March 2006. As a result, both passenger cars and commercial vehicles marketed after the respective stipulated dates (see inset) comply with those target values.
2) Measuring Vehicle Cabin VOCs Based on the test methods established by the government’s Council to Study Sick House Syndrome for measuring indoor VOC concentration levels, JAMA carried out its own research and established the following test procedures specifically for measuring VOCs in vehicle cabins.
5. Restricting the Use of In-Cabin Volatile Organic Compounds
JAMA member manufacturers are taking voluntary measures to reduce volatile organic compounds in vehicle cabins.
19

Fig. 1 The Progress in Motor Vehicle Noise Reduction (accelerated running noise)
Source: JAMAPre-1975regulation
1976regulation
1979regulation
1985regulation
2001regulation
0
10
20
30
40
50
60
70
80
90
100%
Large-Sized Vehicles
92dB(A)
89dB(A)
86dB(A)
83dB(A)81dB(A)
Pre-1976regulation
1977regulation
1979regulation
1982regulation
1998regulation
0
10
20
30
40
50
60
70
80
90
100%
Passenger Cars
84dB(A)
82dB(A)
81dB(A)
78dB(A)
76dB(A)
Pre-1975regulation
1976regulation
1979regulation
1987regulation
2001regulation
0
10
20
30
40
50
60
70
80
90
100%
Motorcycles (small-sized)
86dB(A)
83dB(A)
78dB(A)
75dB(A)73dB(A)
dB(A)/% (equivalent conversion) dB(A)/% (equivalent conversion) dB(A)/% (equivalent conversion)
Powertrain, etc. TiresCooling systemExhaust systemEngine
Tires, powertrain, etc.Intake systemCooling systemExhaust systemEngine
Tires, etc.PowertrainIntake systemExhaust systemEngine
6. Addressing Noise
1) Progress is the Result of Technological Development Over several decades Japan’s automakers have steadily incorporated new technologies into their products to reduce automobile-emitted noise. As a result of those efforts, the vehicles they manufacture today are extremely quiet. Specifically, compared to the levels in 1971 when regulations in this area were first introduced in Japan, heavy-truck noise has been reduced by about 92%, passenger car noise by about 83%, and motorcycle noise by 95% (see Fig. 1). Road traffic noise comprises a number of factors: vehicle-emitted noise and driving practices; road structure, surface quality and conditions; the status of traffic flow; and factors pertaining to the roadside environment, such as roadside terrain characteristics and the extent of development. Comprehensive measures are required to address the multiple challenges involved in effective road traffic noise reduction. JAMA member manufacturers have made strenuous efforts to achieve compliance with Japan’s vehicle noise regulations. The automobiles they now supply are among the quietest motor vehicles produced in the world. To achieve further reductions in road traffic noise, additional measures must be taken to upgrade road infrastructure and road surface quality (with, for example, porous drainage pavement that enables greater noise reduction), improve the roadside environment, and reduce traffic congestion.
2) New Approaches to Noise Performance The vehicle noise emitted as a result of the use of illegally modified mufflers has increasingly become a public nuisance in Japan. In response to this trend, the Ministry of Land, Infrastructure, Transport and Tourism (MLIT) announced in December 2008 that it would enforce, as of April 2010, strengthened regulations (for vehicles up to 3.5 tons in GVW,1 with occupancy of up to 10 persons) mandating a) that mufflers be tamper-resistant so as to prevent the alteration of their noise-suppression mechanism, and b) that replacement mufflers meet Japan’s accelerated running noise standard through type approval compliance and be ID-marked accordingly. In line with these stricter regulations, JAMA member manufacturers are also identifying as OEM products2 the mufflers with which they equip their new vehicles. JAMA, meanwhile, works to increase public awareness of proper vehicle use and the need for regular vehicle maintenance. More recently, the danger posed by the quietness of electric vehicles and hybrid vehicles running at low speed (i.e., on electricity) emerged as a new problem to be addressed, in view of the expanding share of these vehicles in the national fleet. In response, MLIT established in January 2010 guide-lines which allow vehicles to be equipped with a vehicle alert system. JAMA members are, accordingly, developing and supplying such systems to the market. Meanwhile, the United Nations’ Working Party on Noise (UNECE/WP29/GRB) officially adopted the Japanese guidelines in February 2011 and is now working to create international technical standards based on those guidelines. JAMA will continue to be involved in the international discussions and studies targeting global standardization in this regard.
JAMA member manufacturers produce vehicles with world-class reduced noise performance.
20
1 GVW: Gross vehicle weight 2 OEM: Original equipment manufacturer

0
100
200
300
400(x 1,000 tons)
2010(Target)
・・・・・・2003200220012000199919981990
352
8569
5133 20 18 8
2004 2005
11
2015 (New target)
10
2007212
20066
20081.4
20091.0
20100.7
0
2
4
6
8
100
200
300
400
500
10
2008-2012average
(Revised target)
20032002200120001990 2004 2005 2006 2007 2008 2009 ・・・・
442
256
4.51 4.675.08
6.326.576.596.826.726.806.746.436.80
8.44
2010
Fig. 2 Reductions in Production Plant-Generated Waste
Source: JAMA
Fig. 1 Reductions in Production Plant-Generated CO2 Emissions
Note: CO2 reductions achieved jointly by JAMA and JABIA member companies from 2008.
(x 1 million tons CO2)
Source: JAMA
(x 1,000 tons CO2 per 1 trillion yen)
CO2 emissions/Production value
Automobile manufacturing and distribution activities have a local and global impact on the environment. In their promotion of sustainable mobility, JAMA member manufacturers continuously strive for a more efficient use of resources and reduced environmental impact in the conduct of those activities.
1. Reducing CO2 Emissions and Waste in Production Processes
1) Conserving Energy to Curb Global Warming In order to conserve resources and help combat global warming, Japan’s automakers are taking multiple measures at their production plants to reduce the consumption of energy (electricity, fuel, etc.) and thereby cut emissions of carbon dioxide (CO2), a major greenhouse gas. Since 2008, CO2 reductions are being achieved on a combined basis by JAMA member companies together with the member companies of the Japan Auto-Body Industries Association (JABIA), so as to include the CO2 emissions generated in auto-body manufacturing which is mostly commissioned by JAMA members. At the time of the pooling of their efforts in this regard, the JAMA-JABIA target was to reduce annual plant CO2 emissions to 6.59 million tons, a 22% reduction from the 1990 level. However, taking into account the drop in motor vehicle production triggered by the economic downturn in late 2008, that target was revised in 2009 to 6.32 million tons, or a 25% reduction from the 1990 level. In 2010 the CO2 emitted in automobile and auto-body manufacturing processes totalled 4.67 million tons, repre-senting a 44.6% decrease from the 1990 level (see Fig. 1). Meanwhile, a parallel development has been the steady
decline in the amount of CO2 emitted from plants compared to production value levels, which underscores the success of CO2 reduction measures. JAMA and JABIA member manufacturers will continue to implement the following measures at their plant facilities in order to ensure that the production process generates minimal volumes of CO2 emissions.
Conserving Energy at Plant Facilities- Through greater efficiency in on-site energy supply- Through the use of cutting-edge energy-saving equipment- Through the use of lightweight materials- Through the reorganization of production lines
2) Reducing Waste JAMA member manufacturers continue to work hard to a) reduce the waste generated in the vehicle production process, b) increase recycling rates, and c) cut the volume of waste that ends up as landfill. Efforts pursued to date have resulted in a steady and very significant decline in the total volume of plant-generated waste destined for landfill disposal. In 2010 the total volume of such waste dropped to 668 tons, surpassing by a huge margin the 2010 target of 11,000 tons which represents a 97% reduction from the 1990 level (see Fig. 2). Also as a result of those efforts, a 99.9% recycling rate at plant facilities was achieved several years ago and has been maintained ever since. Further efforts will be made for continued reductions in the volume of waste generated by vehicle manufacturing plants in Japan. Meanwhile, a new, 10,000-ton waste reduction target has been set for 2015, in anticipation of a strong turnaround in production after the prolonged slump in the wake of the global financial crisis in 2008.
- Annual CO2 emissions discharged in the vehicle manufacturing process are to be reduced by an average of 25% from the 1990 level between 2008 and 2012.- Industrial waste destined for landfill disposal is to be reduced by 97.1% from the 1990 level, down to 10,000 tons, by 2015. - In 2009 the automakers surpassed their 2010 target for the reduction of volatile organic compound (VOC) emissions at their production plants and have since continued to reduce VOC emissions voluntarily. - Substances designated by the Pollutant Release and Transfer Register (PRTR) are being reduced on a voluntary basis.
■ ENVIRONMENTAL PROTECTION IN VEHICLE MANUFACTURING AND DISTRIBUTION3
21

Source: JAMA
0
20
40
60
80
100(g/㎡)
200420032000
59.3 (▲40%)61.2
79.6
2005
56.2 53.049.6
2006 2007
47.8
2008
44.0
2009 2010
39.8
2010(Target)
47.8
Fig. 3 VOC Emission Reductions in Production Operations
Japan’s automakers are also reducing the volume of residual materials (including scrap metals and casting sand) produced in vehicle manufacturing in line with legislation governing the efficient use of resources.
Reducing the Volume of Residual Materials- Through increased recycling into cement and paving materials production- Through use in heat generation for the production of steel- Through the reuse of sludge in cement production
3) Curbing Air Pollution(1) Reducing VOC Emissions Although JAMA member companies have long taken a voluntary approach to reducing emissions of volatile organic compounds thought to contribute to photochemical smog, VOC emissions from facilities of a specified scale were regulated in Japan beginning in April 2006, as a result of revisions to the Clean Air Law. In automobile manufacturing operations, VOCs are contained primarily in solvents for vehicle body paints and are emitted during the painting process. In addition to ensuring compliance with regulatory require-ments, JAMA members reviewed their voluntary plans for the reduction of VOC emissions and established a target to reduce those emissions to 30% below the 2000 level by 2010, replacing that target later (in 2008) with a stricter one—to 40% below the 2000 level by 2010. That target was surpassed in 2009 and again in 2010, when VOC emissions in vehicle production operations dropped 50.0% below the 2000 level to 39.8g/㎡ (see Fig. 3). JAMA member manufacturers are continuing their voluntary efforts to reduce VOC emissions, with some setting their own annual reduction targets.
Reducing VOC Emissions in Manufacturing Operations- Through greater efficiency in paint application processes- Through the recovery of solvents- Through the use of water-based paints
(2) Reducing Emissions of Designated Air Pollutants Revisions to Japan’s Clean Air Law in May 1996 resulted in
the (then) Ministry of International Trade and Industry calling for the earliest possible reduction of 12 designated air pollutants, five of which were emitted in automobile manufac-turing operations. Accordingly, JAMA member manufacturers initiated measures to reduce emissions of those five substances. Through the implementation of two voluntary reduction programs (in effect in 1997-1999 and 2001-2003), the automakers were able to significantly reduce emissions of two1 of those five substances and totally eliminate emissions of the other three substances.2 Further reductions will be made on a voluntary, self-monitoring basis in accordance with the provisions of Japan’s Pollutant Release and Transfer Register.
(3) Reducing Dioxin Emissions Dioxin is emitted primarily in waste incineration. Although Japan strengthened its regulation of these emissions in December 2002, JAMA member manufacturers have been aiming for even greater reductions in dioxin emissions at their plant facilities, based on a voluntary standard that is more stringent than the regulatory mandate, by a) reducing the volume of waste destined for incineration, b) upgrading plant incinerators, and c) controlling the incineration process. Furthermore, through the use of different fuels and improved incineration methods, JAMA members have also reduced sulfur oxide (SOx) and nitrogen oxide (NOx) emissions to lower concentration levels than those mandated by government regulations.
4) Restricting the Use of Other Hazardous Substances Based on the Material Safety Data Sheet (MSDS) concept, JAMA has established its own hazard assessment method in regard to the use of chemical substances. This method involves an analysis of the properties and applications of chemical substances prior to utilization so that vehicle manufacturers can reduce, eliminate, or otherwise control their use. Established in 1999 and enforced as of 2001, Japan’s Pollutant Release and Transfer Register (PRTR) initially targeted reductions for 354 designated chemical substances. In 2010 its coverage expanded to 462 substances, with the result that substances to be controlled in the automobile manufacturing process increased from 32 to 38. This expansion of the roster meant that emissions of the auto manufacturing-related substances to be controlled totalled 7,944 tons in 2010, an increase over the 7,758 tons in 2009, prior to the expansion of the roster. The fact is, however, that emissions of the original 32 substances have been steadily declining over the years (see Fig. 4). JAMA member manufacturers will strive to further reduce the use of all 38 of the designated substances. As with VOCs, some of the automakers have established their own annual reduction targets.
22
1 Acetaldehyde and formaldehyde2 Trichloroethylene, tetrachloroethylene, and dichloromethane (cleaning solvents)

Fig. 4 Emissions of PRTR-Designated Substances in Auto Manufacturing Operations
Source: JAMA
0 2000 4000 6000 8000 10000 12000
2010
2009
2008
2007
2006
(tons)
Newly targeted substancesOther1,3,5-TrimethylbenzeneEthylbenzeneTolueneXylene
4,783 4,250 2,085 618
188|
4,611 4,086 2,242 573
185|
3,748 3,288 1,896 496
143|
3,063 2,541 1.631 397
126|
2,556 2,357 1,649 367 838
177|
Three of the designated substances—xylene, toluene, and ethylbenzene—are widely used by the automakers in paint solvents (a total of 2,556 tons, 4,250 tons, and 1,649 tons, respectively, in 2010). Although emissions of these substances have decreased significantly over the past several years, they nevertheless accounted, in 2010, for 83% of the PRTR-designated substances’ total emissions in vehicle production operations, underscoring the need for further reductions in future.
5) Conserving Water Resources The growing scarcity of fresh water resources is a matter of increasing global concern. Japan’s vehicle manufacturers make continuous efforts to reduce water consumption at their production facilities by recycling the water used in various plant operations including painting, cooling, and air conditioning.
6) Protecting Water Quality Wastewater produced in an auto plant consists of water used in manufacturing operations (including painting) and in the general work place (including cafeterias and toilets). The plant’s wastewater is first purified in a treatment facility by such means as active charcoal filtering, and then it is discharged into municipal sewage lines. JAMA member manufacturers have set strict standards in regard to the quality of the wastewater their plants produce. Although voluntary, their standards for nitrogen and phosphorus content as well as for biochemical oxygen demand (BOD) and chemical oxygen demand (COD) values are in fact more stringent than regulatory levels.
Protecting Water Quality- Through advances in wastewater treatment technologies- Through the use of low-nitrogen and low-phosphorus materials in the manufacturing process
7) Preventing Soil and Groundwater Pollution JAMA member manufacturers monitor soil and ground-water quality to verify that neither is contaminated by substances used in the vehicle production process. Monitoring operations include tracking the use of chemical substances as well as the analysis of soil and groundwater samples.
8) Environmental Management Systems JAMA member manufacturers in Japan have all obtained ISO 14001 certification, the international standard for envi-ronmental management systems. They make continuous efforts, focused primarily on their production plants, to upgrade these systems in order to further reduce the environmental impact of their operations. In addition to periodic internal audits, external environmental audits are carried out by independent organizations to verify proper implementation of the environmental management systems. The automakers will continue to upgrade the application of these systems for increased environmental benefit in the years ahead.
2. Reducing CO2 Emissions in Logistics
Automobile and auto parts distribution activities also place burdens on the environment. To address this issue, and specifically to reduce CO2 emissions in logistical operations, JAMA member manufacturers in Japan have adopted wide-ranging measures for greater efficiency in the transport of goods, including freight pooling, the use of alternative transport modes (maritime/rail), and higher freight-loading rates per vehicle. With the enforcement of revisions to Japan’s Energy Conservation Law in April 2006, common carriers and shippers in Japan are now required to take measures to conserve energy. In 2010 the combined total volume of CO2 emitted by JAMA and JABIA member companies in their logistical operations was 716,000 tons—a decrease from 952,000 tons, 807,000 tons, and 718,000 tons in 2007, 2008, and 2009, respectively. They are working hard to achieve further CO2 emissions cuts in those operations, with some companies having set their own annual reduction target in this regard. JAMA members and industry partners are also taking measures to reduce the volume of packaging materials used in auto parts distribution. They are collectively promoting simplified packaging systems and the reduced use of materials by, for example, replacing conventional methods with the use of reusable racks.
23

Fig. 1 The ELV Recycling Flow
Source: JAMA
ELV flow
Information flow
Payment/fundsremittance flow
Delegated Funds Management Entity(Japan Automobile Recycling Promotion Center)
Delegated Information Management Entity(Japan Automobile Recycling Promotion Center)
Automobile Manufacturers/Importers/Delegated Organization(Japan Automobile Recycling Promotion Center)
Shredder ResidueRecycling Facilities
Shredder ResidueRecycling Facilities
Designated Handling Agent
Purchasers of New Vehicles
Purchasers of Used Vehicles
Final Owners
Dismantlers
Fluorocarbon Recovery Operators
ELVCollectors
Inspection & registration verification (MOTAS) Mini-vehicle inspection
Designated Handling Agent
Deliverymanifests
Recoverymanifests
Deliverymanifests
Recoverymanifests
Deliverymanifests
Recoverymanifests
Deliverymanifests
Recoverymanifests
AirbagDisposal Facilities
FluorocarbonDisposal* Facilities
* Fluorocarbons are destroyed.
ELVsELVs
Payment of recycling fee
ELVs
AirbagsPaymentfor recovery
Shredder residue
Fluorocarbons Payment
for recovery
Vehiclecarcasses
Remittance of recycling-fee funds
Press & Shear
Operators
To markets for recyclable parts,
metals, etc.
Shredding & Sorting Operators
Shredder Residue
Processors
Fluorocarbon & airbag disposal managed byJapan Auto Recycling Partnership (JARP)
MOTAS: Japanese-derived acronym for “motor vehicle inspection & registration system.”
Note: The Japan Automobile Recycling Promotion Center assumes the same responsibilities as automobile manufacturers and importers when an ELV has no manufacturer representation under the provisions of the ELV Recycling Law. It also assumes transport-to-mainland costs for ELVs turned in on Japan’s smallest islands.
■ END-OF-LIFE VEHICLE RECYCLING4
End-of-life vehicle (ELV) recycling and the appropriate disposal/elimination of related waste is a critical issue for the automobile industry in its pursuit of sustainable mobility. Thanks to intra-industry efforts and the automakers’ adoption of the “3-R” principle—reduce, reuse, recycle—the rate of ELV recycling (by vehicle weight) stood at 80% in 2004. Japan’s End-of-Life Vehicle Recycling Law came into force in January 2005. Under this law, automobile manufacturers are responsible for recovery, recycling and appropriate disposal with respect to fluorocarbons, airbags, and automobile shredder residue (ASR). As a result of the accelerated efforts made by JAMA’s member companies and all the other players concerned, the ELV recycling rate exceeded 95% in 2010. The ELV Recycling Law does not, however, cover motor-cycles, nor does it cover certain types of commercial vehicle rack equipment or custom equipment. JAMA member manufacturers have therefore implemented voluntary measures both to recycle motorcycles and such commercial
vehicle equipment and to reduce or eliminate the use of hazardous substances in their products.
1) JAMA’s Response to the ELV Recycling Law(1) Establishment and Full-Fledged Operation of an Electronic Information Network-Based System Japan’s automobile recycling infrastructure as mandated by its ELV Recycling Law is the first in the world to administer, on the basis of electronic “manifests” (or compliance checklists), not only (i) the entire process of auto recycling, from ELV recovery to recycling and the final disposal of fluorocarbons, airbags, and shredder residue, but also (ii) the management of funds collected from vehicle owners as recycling fees and (iii) the registration of operators in the ELV recycling chain. JAMA initiated the development of this electronic information network in 2002. It began by establishing 150 categories of relevant data on 100 million in-use and newly registered vehicles. The system has been in full and efficient operation since enforcement of the ELV Recycling Law in January 2005.
JAMA member manufacturers act collectively in providing support for and expanding the rate of Japan’s recycling of end-of-life vehicles and in reducing related waste.
24

Fig. 2 Locations of Fluorocarbon/Airbag Recovery Centers and Recycling/Disposal Facilities
Certified airbag recovery centers (32)** Incl. four facilities that also recycle the recovered airbags
Certified fluorocarbon recovery & disposal facilities (8)
Airbag recycling facilities (6)
Source: Industrial Structure Council
(2) Responsibilities of System Management Entities Implementation of the ELV Recycling Law requires management of (i) the vehicle recycling flow, (ii) the related information flow and (iii) the related funds flow for more or less 3.5 million ELVs annually. Whereas the Japan Automobile Recycling Promotion Center ensures overall system administration and operational efficiency, the Japan Auto Recycling Partnership (JARP) is delegated by automobile manufacturers and importers to oversee the recovery, recycling (where appropriate) and disposal of fluorocarbons and airbags retrieved from ELVs.
(3) Recovery and Disposal of Fluorocarbons In January 1998, JAMA and the Japan Auto Parts Industries Association (JAPIA) jointly launched a system for the recovery and appropriate disposal of chlorofluoro-carbons (CFCs) retrieved from automotive air conditioners. To facilitate optimal functioning of the system, JAMA created within its own organizational structure the CFC Recovery and Disposal Registration Center. In October 2002, legislation mandating the recovery and disposal (through destruction) of the fluorocarbon refrigerants used in automotive air conditioners came into force. Based on their extensive experience with CFC disposal, JAMA member manufacturers continue today to be actively involved in the promotion of fluorocarbon recovery and disposal. In 2010 CFCs were recovered from three million vehicles in Japan and destroyed.
(4) Appropriate Disposal of Airbags The Airbag Recovery and Disposal Registration Center was set up by JAMA in October 1999. Together with JAPIA (see above) and partners in the auto servicing and dismantling sectors, JAMA carried out research and development activities and empirical testing on optimal methods for airbag disposal, including, specifically, the disposal of airbag inflators. Meanwhile, JAMA member manufacturers conducted their own similar research and development. As a result of these various efforts, standard guidelines were formulated for the deployment of airbags prior to disposal. In 2010 some 5.5 million airbags were recovered from 1.91 million vehicles and, after appropriate recycling, were disposed of in conformity with those guidelines.
(5) Recycling of Automobile Shredder Residue (ASR) ASR is what remains of end-of-life vehicles after the post-dismantling recovery of all reusable/recyclable materials, metals, and other resources. For decades it was generally disposed of as landfill. The growing scarcity of landfill sites, however, has underscored the urgent need for greater reductions in the volume of ASR produced. Under the ELV Recycling Law, automakers and vehicle importers are responsible for the collection, recycling and appropriate disposal of ASR and for meeting the ASR recycling rate targets that have been established (see Table 1). JAMA member companies’ activities aimed at compliance with those targets have been conducted as team-based efforts (specifically, by the “ART” and “TH Team” groups*). In 2010 ASR was collected from 3.69 million vehicles in Japan and appropriately recycled, which represented an ASR recycling rate of between 79.9% and 87.0%, and thus an ELV recycling rate (by vehicle weight) significantly exceeding 95%. (Meeting the 2015-targeted ASR recycling rate of 70% meant achieving the ELV recycling rate of 95%.)
25
*“ART” member companies: Ford Japan, Fuji Heavy Industries, Isuzu, Jaguar Land Rover Japan, Mazda, Mercedes-Benz Japan, Mitsubishi, Mitsubishi Fuso Truck & Bus, Nissan, UD Trucks, Suzuki, and Volvo Cars Japan; and the Resource Recycling Board. “TH Team” member companies: Audi Japan, BMW, Daihatsu, Hino, Honda, Peugeot-Citroën Japon, Toyota, and Volkswagen Group Japan.

Recycling facilities (51)Incineration/landfill facilities (33)
Fig. 3 Locations of ASR Recycling and Disposal Facilities
Table 1 Target ASR Recycling Rates
201520102005
70%50%30%Target ASRrecycling rate
Target year
ELVCollectors
FluorocarbonRecoveryOperators
Dismantlers ShredderOperators
54,265 15,585 5,879 1,220
Cumulative Total
At March 31, 2011
76,949
Table 2 Registration Status of ELV Recycling Operators
ELVs recovered(million units)
2005
3.05
2006
3.57
2007
3.71
2008
3.58
2009
3.92
2010
3.65
Source for all chart data on this page: Industrial Structure Council
Table 5 Status of Recovery of Three Designated Items
* Covers all categories of processors, whether for direct disposal or for transfer to other markets.
Fluorocarbons [destroyed] (million vehicles)Airbags (million vehicles)
Airbag recycling rate (%)
2010 Fiscal Year3.0
1.9193.0-100
ASR* (million vehicles) 3.69ASR recycling rate (%) 79.9-87.0
Table 4 Number of ELVs Recovered, 2005-2010
Table 3 Value of Recycling Fees Collected & Number of Vehicles Involved
Vehicles designated foreventual recycling (million units)
Value of recycling feescollected (billion yen)
2005
40380
2006
28280
2007
10100
2008
560
2009
560
2010
550
Sources: “ART” and “TH Team” groups
2) Status of System Operation in 2010(1) Legislation mandates the proper registration of all recycling operators active in the ELV recycling chain. At March 31, 2011 (the close of Japan’s 2010 fiscal year), there were about 80,000 such operators registered in Japan (see Table 2).
(2) Recycling fees initially were collected either upon registration of a new vehicle or, for an in-use vehicle, at the time of that vehicle’s first mandatory inspection after enforcement of the ELV Recycling Law. However, at the end of 2007—i.e., a full three years after the law’s enforcement—recycling fee collection at the time of vehicle inspection was ended because its objective had, by then, been achieved. As a result, the annual total value of recycling fees collected dropped significantly, and it is expected to remain at the 2008 level in the years ahead (see Table 3).
(3) Under the ELV Recycling Law, Japan’s automakers and importers have recovered, recycled and appropriately disposed of more than 3.5 million end-of-life vehicles each year since 2006 (see Table 4).
(4) Automobile manufacturers and importers are responsible for the recovery of three hazardous items: fluorocarbons from automotive air conditioners, airbags, and automobile shredder residue, which are being recycled and disposed of appropriately (see Table 5). The 2015 target ASR recycling rate of 70% was already surpassed in 2007.
3) The Auto Industry’s Application of the “3-R” Principle In addition to the automakers’ efforts, described in this chapter, to comply with Japan’s ELV Recycling Law, the Japanese automobile industry has worked hard to meet the mandates of, as well as integrate the principles embodied in, Japan’s Law for the Promotion of Effective Utilization of Resources (informally referred to as the “3-R” law—for “reduce, reuse, recycle”). It has done so primarily by designing products that are environmentally friendly and easy to recycle, whose manufacturing process produces increasingly less waste (see Chapter 3). Compliance efforts at the product design stage include the adoption of vehicle structures that are easy to dismantle and materials that are easy to recycle, as well as, for example: the use of anti-rust plates (for longer vehicle life), the use of longer-lasting liquids (as in the case of engine oil), reductions in vehicle weight (for increased fuel efficiency), and reductions in the amount of refrigerant used in mobile air conditioners. In the distribution process, JAMA member manufacturers have reduced the amount and increased the recyclability of packaging materials used in the transport of parts, and they furthermore promote the reuse of components recovered from end-of-life vehicles.
26

“Reduce”initiatives
“Reuse”initiatives
“Recycle”initiatives
- Reduction/recycling of designated waste products generated in vehicle manufacturing operations: 1) Scrap metals; 2) Casting sand residue
Actual volume of waste* destined for landfill disposal: 668 tons in 2010(down 99.8% from the 1990 level of 352,000 tons)[New JAMA target: 10,000 tons by 2015]
Recovery & recycling of:1) Fluorocarbons2) Airbags3) ASR
Note: Motorcycles are not covered by the ELV Recycling Law.
End-of-Life Vehicle Recycling LawRecycling of ELVs
Promotion of Effective Utilization of Resources Law (“3-R” Law)Product Design
For designated products:
For designated products:
Waste ManagementFor designated areas of activity:
Table 6 Auto Industry Measures in Line with Japan’s “3-R” Law
- Weight reduction/Downsizing- Longer product life- Reduced use of hazardous substances
- Use of recyclable materials- Ease of dismantling - Ease of sorting - Non-hazardous recycling- Materials identification
Dis
tribu
tion,
Ser
vici
ng a
nd U
se
* Composed of residual materials, including scrap metals and casting sand
Source: Industrial Structure Council
Source: Japan Automobile Recycling Promotion Center
Note: The cost of ELV motorcycle delivery from ELV dealers to certified collection centers is financed by the motorcyclemanufacturers on the basis of the consumer's recycling fee paid at time of motorcycle purchase.
Fig. 4 The Motorcycle Recycling Flow
Delivery of end-of-life motorcycle directlyto a certified collection center
Delivery of end-of-life motorcycle to an ELV motorcycle dealer
End-of-Life Motorcycle Processing(nationwide operations)
Verification of ownership
Verification of recyclingdocumentation
Verification of ownership
Verification of recyclingdocumentation
Certified CollectionCenters (190)
Disposal/RecyclingFacilities(14)
End-of-Life Motorcycle Dealers
Delivery tocert if iedcollect ioncenters
FinalOwners
4) Motorcycle Recycling In October 2004, JAMA’s four motorcycle-manufacturing members (Honda, Kawasaki, Suzuki, and Yamaha) voluntarily launched, along with 12 motorcycle importers, a motorcycle recycling system. Under this system, end-of-life motorcycles are delivered to motorcycle dealers or certified collection centers, which then hand them over to disposal/recycling facilities for appropriate processing (see Fig. 4). In 2010, 1,967 end-of-life motorcycles were recovered and the motor-cycle recycling rate climbed to 87.2% by vehicle weight. An important parallel effort is the conduct of public awareness campaigns to inform the public of the existence of this system and how it works. Local authorities carry out such campaigns within individual municipalities, and motorcyclists themselves are targeted at motorcycling events. In October 2011, the motorcycle recycling fee was eliminated for vehicles sold prior to the introduction of the motorcycle recycling system in October 2004.
5) A Voluntary Initiative for the Appropriate Disposal of Commercial Vehicle Rack Equipment Together with the Japan Auto-Body Industries Association
(JABIA), JAMA is encouraging the recycling and appropriate disposal of commercial vehicle rack equipment, which is not covered by the ELV Recycling Law. Specifically, JAMA promotes the development and use of rack equipment that is easy to dismantle, as well as the reduced use of lead and other hazardous substances in such equipment. In April 2004, JAMA introduced a nationwide cooperative system, in which participation is voluntary, for the recovery and appropriate disposal of the lumber, heat-insulating materials and fiberglass-reinforced plastic contained in rack equipment (information on this system is available on the JABIA Web site at www.jabia.or.jp/kyouryoku/index.html). As a result of the continuous effort to expand recycling operators’ participation in the system, the number of participating operators—165 at the end of June 2011—has doubled since the system’s inception. JAMA also produces and distributes information materials targeting commercial vehicle operators to raise their awareness of the need and infrastructure for the recycling and appropriate disposal of this type of equipment.
27
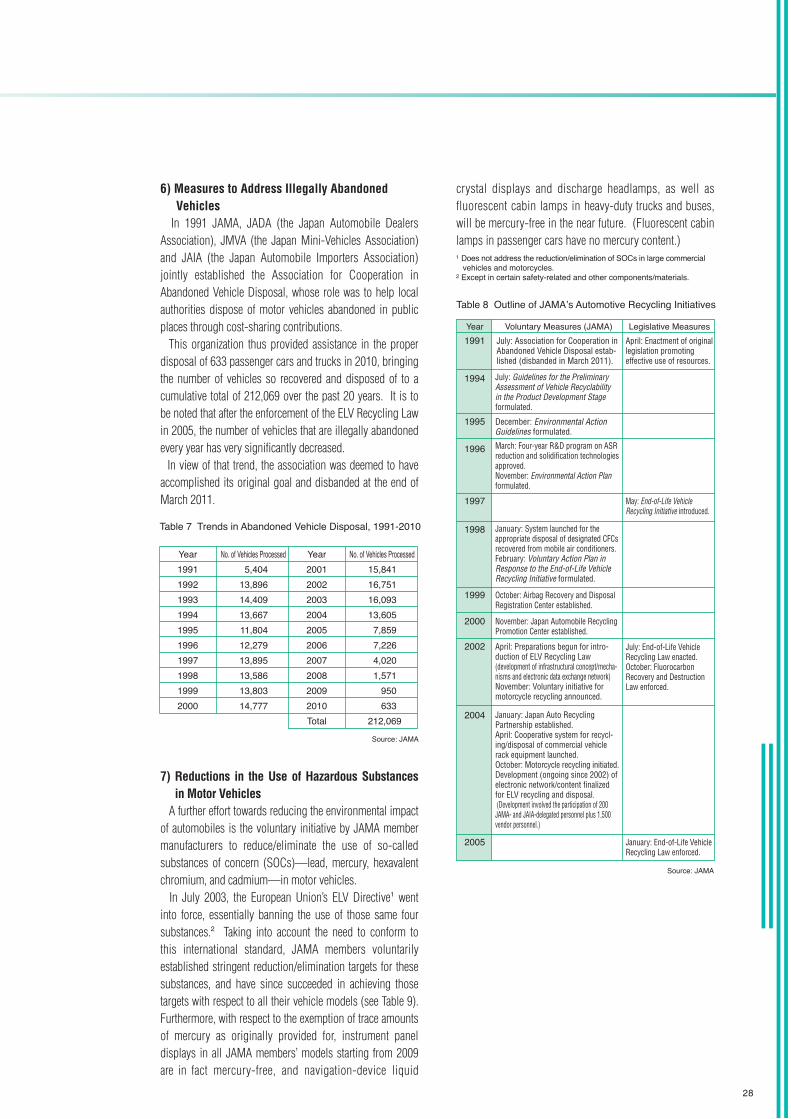
Source: JAMA
Year2001200220032004200520062007200820092010Total
5,40413,89614,40913,66711,80412,27913,89513,58613,80314,777
No. of Vehicles Processed15,84116,75116,09313,6057,8597,2264,0201,571
950633
212,069
No. of Vehicles ProcessedYear1991199219931994199519961997199819992000
July: Association for Cooperation in Abandoned Vehicle Disposal estab- lished (disbanded in March 2011).
April: Enactment of original legislation promoting effective use of resources.
May: End-of-Life Vehicle Recycling Initiative introduced.
July: End-of-Life Vehicle Recycling Law enacted.October: Fluorocarbon Recovery and Destruction Law enforced.
January: End-of-Life Vehicle Recycling Law enforced.
July: Guidelines for the Preliminary Assessment of Vehicle Recyclability in the Product Development Stage formulated.
March: Four-year R&D program on ASR reduction and solidification technologies approved.November: Environmental Action Plan formulated.
January: System launched for the appropriate disposal of designated CFCs recovered from mobile air conditioners.February: Voluntary Action Plan in Response to the End-of-Life Vehicle Recycling Initiative formulated.
April: Preparations begun for intro-duction of ELV Recycling Law (development of infrastructural concept/mecha-nisms and electronic data exchange network)November: Voluntary initiative for motorcycle recycling announced.
January: Japan Auto Recycling Partnership established.April: Cooperative system for recycl-ing/disposal of commercial vehicle rack equipment launched.October: Motorcycle recycling initiated.Development (ongoing since 2002) of electronic network/content finalized for ELV recycling and disposal. (Development involved the participation of 200 JAMA- and JAIA-delegated personnel plus 1,500 vendor personnel.)
October: Airbag Recovery and Disposal Registration Center established.
November: Japan Automobile Recycling Promotion Center established.
December: Environmental Action Guidelines formulated.
Legislative MeasuresVoluntary Measures (JAMA)
Table 8 Outline of JAMA’s Automotive Recycling Initiatives
Source: JAMA
Year1991
1994
1995
1996
1997
1998
1999
2000
2002
2004
2005
Table 7 Trends in Abandoned Vehicle Disposal, 1991-2010
6) Measures to Address Illegally Abandoned Vehicles In 1991 JAMA, JADA (the Japan Automobile Dealers Association), JMVA (the Japan Mini-Vehicles Association) and JAIA (the Japan Automobile Importers Association) jointly established the Association for Cooperation in Abandoned Vehicle Disposal, whose role was to help local authorities dispose of motor vehicles abandoned in public places through cost-sharing contributions. This organization thus provided assistance in the proper disposal of 633 passenger cars and trucks in 2010, bringing the number of vehicles so recovered and disposed of to a cumulative total of 212,069 over the past 20 years. It is to be noted that after the enforcement of the ELV Recycling Law in 2005, the number of vehicles that are illegally abandoned every year has very significantly decreased. In view of that trend, the association was deemed to have accomplished its original goal and disbanded at the end of March 2011.
7) Reductions in the Use of Hazardous Substances in Motor Vehicles A further effort towards reducing the environmental impact of automobiles is the voluntary initiative by JAMA member manufacturers to reduce/eliminate the use of so-called substances of concern (SOCs)—lead, mercury, hexavalent chromium, and cadmium—in motor vehicles. In July 2003, the European Union’s ELV Directive1 went into force, essentially banning the use of those same four substances.2 Taking into account the need to conform to this international standard, JAMA members voluntarily established stringent reduction/elimination targets for these substances, and have since succeeded in achieving those targets with respect to all their vehicle models (see Table 9). Furthermore, with respect to the exemption of trace amounts of mercury as originally provided for, instrument panel displays in all JAMA members’ models starting from 2009 are in fact mercury-free, and navigation-device liquid
crystal displays and discharge headlamps, as well as fluorescent cabin lamps in heavy-duty trucks and buses, will be mercury-free in the near future. (Fluorescent cabin lamps in passenger cars have no mercury content.)
28
1 Does not address the reduction/elimination of SOCs in large commercial vehicles and motorcycles.2 Except in certain safety-related and other components/materials.

Table 9 SOC Reduction/Elimination in New Vehicles
29
Lead
Mercury
Hexavalentchromium
Cadmium
JAMA Member Manufacturers’ Voluntary Initiatives European Union ELV Directive(2010/115/EU)
All Motor Vehicles(excluding motorcycles) Motorcycles Passenger Cars &
Light Commercial Vehicles
Targets: As of January 2006, a 90% decrease from the 1996 level (i.e., down to 185g); a 75% decrease from the 1996 level for large commercial vehicles (GVW>3.5 tons), including buses.Batteries exempt.
All models have complied since January 2006.
Target: As of January 2005 (when Japan’s ELV Recycling Law was enforced), banned except for trace amounts in safety-related components such as:- Instrument panel displays1
- Liquid crystal displays in navigation devices2
- Discharge headlamps2
- Fluorescent cabin lamps3
All models have complied since January 2003.1 Mercury-free in all models since January 20092 To be mercury-free in near future3 See text.
Target: Banned as of January 2008.
All models have complied since January 2008.(Erroneous use in 2010 in a large commercial vehicle model was promptly discontinued.)
Target: Banned as of January 2007.
All models have complied since January 2006.
Target: As of January 2006, a 25% decrease from the 1996 level (e.g., down to 60g for a 210kg motorcycle).Batteries exempt.
All models have complied since January 2006.
Target: As of October 2004 (when motorcycle recycling in Japan was launched), banned except for trace amounts in safety-related components such as:- Instrument panel displays- Liquid crystal displays in navigation devices- Discharge headlamps
All models have complied since October 2004.
Target: Banned as of January 2008.
All models have complied since January 2008.
Target: Banned as of January 2007.
All models have complied since January 2007.
As of July 2003, banned in principle except for use in:[Exemptions without time restrictions]High-melting solder, free-cutting steel, copper alloys, aluminum alloys, batteries, etc.[Exemptions with time restrictions]Printed circuit board solder,window glass solder, etc.
As of July 2003, banned in principle except for use in:- Discharge headlamps- Fluorescent tubes on instrument panels
These exemptions to be continued until July 1, 2012.
As of July 2003, banned in principle except for use in:- Corrosion-resistant paint [exempted until July 1, 2007]- Corrosion-resistant paint for chassis bolts and nuts [exempted until July 1, 2008]- Freezers for caravan vehicles
As of July 2003, banned in principle except for use in:- Batteries for electric vehicles [exempted until end of 2008]

Fig. 1 Impact of Vehicle Speed on Fuel Efficiency
100 9080706050403020100
20
40
60
80
100
120Fuel efficiency
Average vehicle speed (km/h)Fuel efficiency index: 40km/h = 100
Source: Japan Automobile Research Institute
Fig. 2 Impact of Vehicle Speed on NOx Emissions
9080706050403020100
100
200
300
400
500NOx emissions
NOx emissions index: 40km/h = 100Source: Japan Automobile Research Institute
Average vehicle speed (km/h)
■ ROAD-RELATED ENVIRONMENTAL PROTECTION MEASURES5
1. Improving Traffic Flow
1) An Integrated Approach to Addressing the Issue The automobile outshines other modes of transportation in terms of independent and flexible mobility as well as economic efficiency—all very attractive features to its users. Reduced congestion not only enhances those merits but also, as a result of increased fuel efficiency, helps combat global warming through the reduction of CO2 and other vehicle exhaust emissions. At the same time, improved traffic flow and the accompanying establishment of a high-quality road transport environment have a positive impact on society in terms of their contributions to economic and public welfare activity, including disaster prevention operations and operations servicing the needs of a population with a high percentage of elderly people. A study conducted by the Japan Automobile Research Institute (JARI) determined that when average vehicle speed
increases from 10km/h (the average speed in heavily congested traffic) to 20km/h, fuel efficiency improves by nearly 60% (see Fig. 1) and NOx emissions are reduced by more than 35% (see Fig. 2). These and other research results demonstrate that smoother traffic flow helps reduce automotive exhaust emissions, including CO2. Significant reductions in road transport CO2 will be most effectively achieved by means of the integrated approach referred to earlier in these pages—that is, through initiatives taken by the relevant stakeholders in the four areas of increased vehicle fuel efficiency, diversified automotive fuel supply, improved traffic flow, and more efficient vehicle use (including ecodriving). JAMA conducts its own research on road traffic flow, focusing on the combined implementation of multiple measures for optimal effectiveness. On the basis of research results, it works jointly to address this issue with the Japanese government and other relevant authorities, to which it submits proposals for comprehensive and integrated measures to improve traffic flow.
2) Improving Road Infrastructure and the Road Transport Environment Achieving smoother traffic flow in major metropolitan areas requires improving road and road-related infrastructure/operations: for example, improving ring road networks, upgrading intersections, conducting real-time traffic flow data analysis, adopting advanced signal control systems, and providing public parking space for all types of vehicles, including motorcycles and delivery trucks.
(1) Improving Ring Road Networks Ring roads enable motor vehicles to stay off the streets in city centers and thus are crucial to congestion mitigation in major metropolitan areas. Increased fuel efficiency in—and as a result, reduced CO2 emissions from—road traffic can be achieved through the expansion of road networks.
- JAMA aims at the establishment of a high-quality road transport environment beneficial to the global environment through improved traffic flow.- JAMA information campaigns urge the public to adopt ecodriving practices.
30
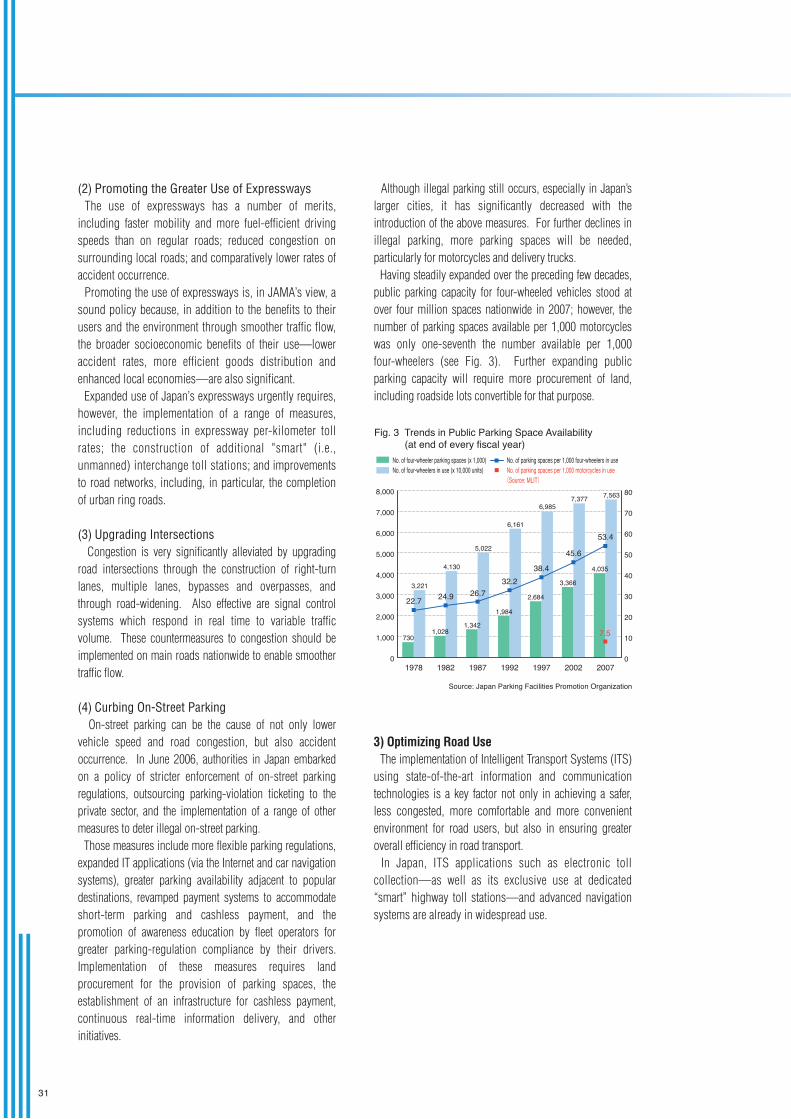
Source: Japan Parking Facilities Promotion Organization
Fig. 3 Trends in Public Parking Space Availability (at end of every fiscal year)
No. of four-wheeler parking spaces (x 1,000)No. of four-wheelers in use (x 10,000 units)
No. of parking spaces per 1,000 four-wheelers in useNo. of parking spaces per 1,000 motorcycles in use(Source: MLIT)
20072002199719921987198219780
10
20
30
40
50
60
70
80
7.5
0
1,000
2,000
3,000
4,000
5,000
6,000
7,000
8,000
22.7 24.9 26.732.2
38.4
45.6
53.4
730
3,221
1,028
4,130
1,342
5,022
1,984
6,161
2,684
6,985
3,366
7,377
4,035
7,563
(2) Promoting the Greater Use of Expressways The use of expressways has a number of merits, including faster mobility and more fuel-efficient driving speeds than on regular roads; reduced congestion on surrounding local roads; and comparatively lower rates of accident occurrence. Promoting the use of expressways is, in JAMA’s view, a sound policy because, in addition to the benefits to their users and the environment through smoother traffic flow, the broader socioeconomic benefits of their use—lower accident rates, more efficient goods distribution and enhanced local economies—are also significant. Expanded use of Japan’s expressways urgently requires, however, the implementation of a range of measures, including reductions in expressway per-kilometer toll rates; the construction of additional "smart" (i.e., unmanned) interchange toll stations; and improvements to road networks, including, in particular, the completion of urban ring roads.
(3) Upgrading Intersections Congestion is very significantly alleviated by upgrading road intersections through the construction of right-turn lanes, multiple lanes, bypasses and overpasses, and through road-widening. Also effective are signal control systems which respond in real time to variable traffic volume. These countermeasures to congestion should be implemented on main roads nationwide to enable smoother traffic flow.
(4) Curbing On-Street Parking On-street parking can be the cause of not only lower vehicle speed and road congestion, but also accident occurrence. In June 2006, authorities in Japan embarked on a policy of stricter enforcement of on-street parking regulations, outsourcing parking-violation ticketing to the private sector, and the implementation of a range of other measures to deter illegal on-street parking. Those measures include more flexible parking regulations, expanded IT applications (via the Internet and car navigation systems), greater parking availability adjacent to popular destinations, revamped payment systems to accommodate short-term parking and cashless payment, and the promotion of awareness education by fleet operators for greater parking-regulation compliance by their drivers. Implementation of these measures requires land procurement for the provision of parking spaces, the establishment of an infrastructure for cashless payment, continuous real-time information delivery, and other initiatives.
Although illegal parking still occurs, especially in Japan’s larger cities, it has significantly decreased with the introduction of the above measures. For further declines in illegal parking, more parking spaces will be needed, particularly for motorcycles and delivery trucks. Having steadily expanded over the preceding few decades, public parking capacity for four-wheeled vehicles stood at over four million spaces nationwide in 2007; however, the number of parking spaces available per 1,000 motorcycles was only one-seventh the number available per 1,000 four-wheelers (see Fig. 3). Further expanding public parking capacity will require more procurement of land, including roadside lots convertible for that purpose.
3) Optimizing Road Use The implementation of Intelligent Transport Systems (ITS) using state-of-the-art information and communication technologies is a key factor not only in achieving a safer, less congested, more comfortable and more convenient environment for road users, but also in ensuring greater overall efficiency in road transport. In Japan, ITS applications such as electronic toll collection—as well as its exclusive use at dedicated “smart” highway toll stations—and advanced navigation systems are already in widespread use.
31

Sept. 16-22, 2011:6.74 mil vehicles/dayUsage rate: 86.1%
After December 2001nationwide promo-tional campaign:0.05 mil vehicles/dayUsage rate: 0.9%
0
1.0
2.0
3.0
4.0
5.0
6.0
7.0
8.0
0
20
40
60
80
100No. of vehicles using ETC (million/day) Usage rate (%)
Usage rateNo. of vehicles using ETC
Source: Road Bureau, MLIT
Fig. 4 Trends in ETC Usage Rates
2009200820072006200520042003Oct.Jul.Apr.Jan.Oct.Jul.Apr. Oct.Jul.Apr.Jan. Oct.Jul.Apr.Jan. Oct.Jul.Apr.Jan. Oct.Jul.Apr.Jan. Oct.Jul.Apr.Jan. Oct.Jul.Apr.Jan. Jul.Apr.Jan.
2010Oct. Jul.Apr.Jan.
2011Oct. Jul.Apr.Jan.
20022001
In May 2010, the Japanese government’s Strategic Headquarters for the Promotion of an Advanced Information and Telecommunications Network Society (or “IT Strategic Headquarters”) formulated a new strategy that calls for the development and introduction of information and communications technology-based safe-driving and cruise-assist systems in order to reduce road accident occurrence. A further goal is to halve the congestion on Japan’s major expressways in the coming decade (i.e., by 2020) through the use of ITS. In March 2011, the ITS Task Force organized under the IT Strategic Headquarters (in September 2010) announced its formulation of a “Green ITS” roadmap for the introduction of eco-friendly, ITS-based systems for passenger and goods transport. Also in March 2011, the Ministry of Land, Infrastructure, Transport and Tourism (MLIT) launched a system, jointly developed by the public and private sectors, which enables about 1,600 ITS beacons installed mainly on expressways to communicate with in-vehicle navigation systems through high-speed, high-capacity road traffic data and image transmission. In July 2011, the operation of a safe-driving support system (or “DSSS”) was launched at a total of eleven sites in Tokyo and Kanagawa Prefecture. Expanded development of this road-to-vehicle intelligent communication system is expected to proceed after verification of its efficiency. JAMA and its member manufacturers will, therefore, continue to promote enhanced active safety and improved traffic flow, a) through the wider implementation of ITS services and the development of next-generation ITS technologies such as automated vehicle platooning; b) through the establishment of the advanced communications infrastructure required; and c) through expanded installation of the requisite onboard systems and features.
(1) Electronic Toll Collection (ETC) Bottlenecks at tollgates are estimated to cause 30% of expressway congestion. The expanded use of ETC tech-nology therefore helps to further mitigate congestion in Japan’s expressway network. Other benefits of ETC use are enhanced driver convenience (because of cashless payment) and reduced operational costs for expressway administrative organizations. From September 16 through 22, 2011, ETC was being used by 6.74 million vehicles daily on Japan’s expressways, or in other words by 86.1% of all vehicles travelling on those roads (see Fig. 4). Steady system penetration is further demonstrated by the fact that at September 30, 2011, a cumulative total of 44.9 million onboard ETC units had been installed by vehicle users.
JAMA member manufacturers promote the widespread use of ETC by optimizing the efficiency and ease of onboard installation and by offering ETC equipment as an option at the time of a new model purchase.
(2) Advanced Navigation Systems Vehicle navigation systems incorporating Japan’s Vehicle Information and Communication System (VICS) provide, through transmitters installed on the roadside and multiplex FM broadcasting, real-time information on traffic conditions including congestion, restricted access, and so on. With a route guidance function, a navigation system can calculate destination arrival time taking real-time traffic conditions into account and, in addition, can indicate optimal alternate routes. At March 31, 2011, a cumulative total of 30.1 million VICS units had been installed onboard automobiles in Japan.
32

Fig. 5 Proposed Data Input/Analysis & Response Formulation Scheme for Improved Traffic Flow
National Police Agency Data:General Statistical Data:
Ministry of Land, Infrastructure, Transport and Tourism Data:
Status Reports on the Impact of:
Road traffic data from sensors
Uplink data from ITS optical beacons
Road transport statistics
Relevant national energy statistics
Odometer data(collected at vehicle inspections)
Road transport surveys
Traffic volume data (via monitoring)
Road congestion monitoring
Use of advanced signal control systems
On-street parking bans
Measures for smoother flow at intersections
Construction of bypass routes
Data Compilation andProcessing
Data Analysis/Evaluation
Response Formulation andImplementation
Table 1 Impact of the Oji Section’s Operation on CO2 Reduction
Source: JAMA
1,730
3,560
AfterOperation
1,780
3,490
Increase/Decrease
50
-70
5,290
Tokyo MetropolitanExpressway
Local roads
Total 5,270 -20
BeforeOperation
CO2 emissions(thousandtons/year)
Note: Vehicle speed and CO2 emissions were calculated on the basis of three established models; the estimated annual CO2 reduction volume varied between 20,000 and 30,000 tons depending on the model used.
4) Establishing a Road Traffic Data Analysis and Response Formulation Scheme In addition to measures targeting road infrastructural provi-sions and vehicle performance, better road traffic management, by means of more effective traffic data analysis and response formulation, can contribute to increased CO2 reduction. Thanks to the application of advanced information and communication technologies, tremendous strides have been made in the processing of road traffic information obtained from continuous monitoring. Through proposals made on multiple occasions to concerned parties, including government agencies and the Tokyo Metropolitan Govern-ment, JAMA has stressed the need to establish, on a joint basis involving all the relevant organizations, a consolidat-ed scheme for road traffic data analysis and response formulation (see Fig. 5), in order not only to evaluate the impact of traffic flow-related measures on CO2 emissions, but also to follow up accordingly.
The Impact of Smoother Traffic Flow on CO2 Reduction: A Tokyo Case StudyJAMA conducted a quantitative assessment of the impact on CO2 emissions of a new, 7.1 kilometer-long segment (the “Oji” section) of the Tokyo Metropolitan Expressway’s inner ring road, based on road traffic data compiled before and after its opening in December 2002. The study showed an annual reduction of 20,000-30,000 tons of CO2 (see Table 1).
The government’s objective of expanding the use of information and communication technologies (as per its new strategy formulated in May 2010; see above) calls for the expanded use of ITS-derived real-time monitoring data to achieve more environmentally-friendly road traffic management overall. When the ITS Task Force announced its creation of a Green ITS roadmap in March 2011 (see above), it concurred with JAMA’s proposals in regard to the following points: a) that traffic flow can be “visualized” by means of road traffic data obtained via sensors and probes; b) that road traffic-related measures should be evaluated; c) that the tracking of CO2 emissions in the road transport sector is necessary; and d) that the public and private sectors should cooperate in road traffic-related information collection, analysis and sharing through technical verification.
33

Ten Tips for Fuel-Conserving Ecodriving 1. Accelerate gently.Start off gently (20km/h in 5 seconds, for an 11% increase in fuel efficiency) and avoid abrupt, heavy accelerations while driving.
2. Maintain a steady speed.Maintain a steady speed for safe and fuel-efficient driving. Tailgating leads to unnecessary acceleration/deceleration,resulting in 2% and 6% less fuel efficiency in urban and suburban areas, respectively. Also, driving in higher gear consumes less fuel than in lower gear at the same speed.
3. Slow down by releasing the accelerator.Releasing the accelerator when recog-nizing the need to slow down stops the fuel supply, resulting in a 2% increase in fuel efficiency. Make maximum use of the engine’s braking function when appropriate.
4. Limit the use of your air conditioner.Control cabin temperature with fresh air intake instead, and don’t set your AC too low when you do use it. AC use when the outdoor temperature is 25℃decreases fuel efficiency by 12%.
5. Don’t idle your engine.Ten minutes of engine idling (in neutral, with the AC off) wastes 130cc of fuel. When waiting or loading/unloading, make a habit of turning your engine off instead of letting it idle.
Note: For drivers stopping engine idling manually, i.e. by turning their vehicle’s ignition off and then back on again, caution is advised as follows: (1) Do not use this method when standing at the head of a line, because airbags and other safety features may fail to activate. (2) Do not use this method while stopped on a gradient. (3) When turning off the ignition, do not apply too much force on the brake pedal, because heavy braking may diminish braking power. (4) A slow restart may result from only intermittent use of this method. (5) Excessive use of this method may drain the batteries, resulting in engine start-up failure. (6) Excessive use of this method may lead to shorter life for certain parts (ignition mechanism, batteries). (7) Directionals (turn signals) and wipers may not work during engine shut-down. (8) Reminder: Electronic devices need a few seconds to restart.
6. Don’t warm up your engine before starting off. Today’s passenger cars don’t require warming up, except in cold climates and after long periods of non-use. Slow running when starting off is enough to warm up the engine.
7. Know your itinerary.If you don’t, then plan the route to your destination using a map or your navigation system before starting off. Avoid congested areas to save time and fuel. Ten minutes of unnecessary driving in a one-hour trip results in a 14% decrease in fuel efficiency.
8. Check your tire pressure regularly.Driving on tires whose air pressure is 50kPa (0.5kg/cm2) lower than it should be decreases fuel efficiency by 2% in urban areas and 4% in suburban areas.
9. Reduce your load.Driving with 100kg of unnecessary onboard weight leads to a 3% decrease in fuel efficiency.
10. Respect parking regulations.Illegal on-street parking causes traffic congestion which leads to increased emissions. A drop in average vehicle speed from 40km/h to 20km/h causes fuel efficiency to decrease by 31%.
(as promoted in Japan)
34
2. Promoting Ecodriving
Driving practices are a significant factor in the difference between certified and on-road fuel efficiency values. By improving their driving habits, drivers can increase fuel efficiency and thus help reduce CO2 emissions. JAMA is therefore actively encouraging greater public awareness of the merits of ecodriving. In addition to conducting nationwide ecodriving information campaigns, JAMA also, for example, dispatches instructors to ecodriving educational workshops
and sponsors ecodriving contests. In vehicle systems and equipment, manufacturers are also expanding the use of technologies and devices that promote ecodriving. While digital tachographs are being used in truck fleet operations in Japan, passenger cars are increasingly being equipped with fuel efficiency gauges and navigator-aided, real-time on-screen displays of fuel efficiency performance.

2011 REPORT ON ENVIRONMENTAL PROTECTION EFFORTS
JAPAN AUTOMOBILE M
ANUFACTURERS ASSOCIATION, Inc.Prom
oting Sustainability in Road Transport in Japan
English edition published November 2011.Japan Automobile Manufacturers Association, Inc.Jidosha Kaikan, 1-30, Shiba Daimon 1-chome, Minato-ku, Tokyo, 105-0012 Japan
Visit us at http://www.jama-english.jp.
© JAMA—No reproduction allowed.