2011-sales eaa cover · 2010 / 2011 national sales ... (eaa) sponsored survey ... sales...
TRANSCRIPT

2010/2011 National Sales Compensation and Practices Survey
Employers Resource Association www.hrxperts.org | 513-679-4120
Published: January 2011 Next Publication: January 2012

2010 / 2011 National Sales Compensation & Practices Survey
An Employer Associations of America (EAA) Sponsored Survey MRA – The Management Association coordinated this survey in cooperation with 17 associations nationwide who are part of the Employer Associations of America (EAA). Published: January 2011 Next Publication: January 2012
Confidential Survey Report This survey is provided with the understanding that the information will:
remain strictly confidential be restricted to authorized personnel only not be used in collective bargaining or grievance proceedings protect, completely, organizational identity
© 2011 Employer Associations of America (EAA): All rights reserved. This survey is provided to the recipient to use as an internal compensation resource. Sharing content or publication in written or electronic form outside your organization is prohibited without the written permission of Employer Associations of America.


© 2011 Employer Associations of America (EAA)
Use of Employers Associations of America (EAA) Surveys
The Employer Associations of America (EAA) conducts and compiles annual surveys solely to assist management in determining relevant wages, salaries, benefits, and practices. The survey results are enhanced when used in conjunction with other sources of information.
Surveys provide a valuable tool for use in determining how an organization’s pay structure relates to those in a given area. Survey users should not use the data as absolute compensation standards. Many factors, such as changes in the mix of participating organizations or the level of employment in the community, can affect the data and the results. Please exercise care when utilizing survey data. Specific results should be examined in the context of overall survey findings and the general economic situation prevailing at the time the data were gathered.
Policy Statement
Association surveys are most effectively used when employed as a guide for management together with other data to determine the organization's position and its alternatives and in advance of actual bargaining and as a reference during bargaining but removed from the actual bargaining sessions. Since this survey is confidential, it is suggested that no direct reference be made to it in bargaining or in discussions with employees. There is little to gain and much to lose by using or referring to this survey data directly in bargaining. Both legal and practical considerations are involved.
All Rights Reserved Copyright 2011 Employer Associations of America
This survey is for the exclusive use of the recipient. Quotation from, or reproduction of, any part of the material contained in this survey, in any form or by any means without prior permission in writing from Employer Associations of America is prohibited. All questions about or requests to reproduce the information in this survey should be directed to: MRA – The Management Association, Survey Department, P.O. Box 911, Pewaukee, WI 53072-0911, (262) 696-3508, e-mail: [email protected]


© 2011 Employer Associations of America (EAA)
Table of Contents Page Participating Employer Associations (EAA) ...................................................... i
Introduction .......................................................................................................... iii Variances in Compensation Strategies and Survey Cycles ........................... iii Profile of Participating Companies ................................................................. iv Industry Breakouts ......................................................................................... v U.S. Region Map ............................................................................................ vi Survey Methodology, Analyzing the Data & Statistical Parameters ............... vii Definitions of Survey Terms ........................................................................... viii National Participant List – Companies ............................................................... x PART I: POSITION SUMMARY REPORTS
Sales Management Positions Job Code
10 Top Sales Executive Combined Compensation Type ....................................... 1 Straight Salary ................................................................. 3 Base Salary + Commission.............................................. 5 Base Salary + Bonus ....................................................... 7 Base Salary + Commission + Bonus ............................... 9 Straight Commission (Insufficient Data) .......................... -
Commission + Bonus (Insufficient Data).......................... - 20 International Sales Manager Combined Compensation Type ....................................... 11 Straight Salary ................................................................. 13 Base Salary + Commission.............................................. 15 Base Salary + Bonus ....................................................... 17 Base Salary + Commission + Bonus ............................... 19 Straight Commission (Insufficient Data) .......................... - Commission + Bonus (Insufficient Data).......................... - 30 General Sales Manager Combined Compensation Type ....................................... 21 Straight Salary ................................................................. 23 Base Salary + Commission.............................................. 25 Base Salary + Bonus ....................................................... 27 Base Salary + Commission + Bonus ............................... 29 Straight Commission (Insufficient Data) .......................... -
Commission + Bonus (Insufficient Data).......................... -
50 Sales Manager Combined Compensation Type ....................................... 31 Straight Salary ................................................................. 33 Base Salary + Commission.............................................. 35 Base Salary + Bonus ....................................................... 37 Base Salary + Commission + Bonus ............................... 39 Straight Commission (Insufficient Data) .......................... -
Commission + Bonus (Insufficient Data).......................... -

© 2011 Employer Associations of America (EAA)
Table of Contents (continued)
Sales Management Positions (cont’d)
Job Code Page 60 District Sales Manager Combined Compensation Type ....................................... 41 Straight Salary ................................................................. 43 Base Salary + Commission.............................................. 45 Base Salary + Bonus ....................................................... 47 Base Salary + Commission + Bonus ............................... 49 Straight Commission (Insufficient Data) .......................... - Commission + Bonus ....................................................... 51 70 Sales Trainer Combined Compensation Type ....................................... 53 Straight Salary ................................................................. 55 Base Salary + Commission.............................................. 57 Base Salary + Bonus ....................................................... 59 Base Salary + Commission + Bonus (Insufficient Data) .. - Straight Commission (Insufficient Data) .......................... - Commission + Bonus (Insufficient Data).......................... -
Outside Sales Positions
100 Field Sales Supervisor Combined Compensation Type ....................................... 61 Straight Salary (Insufficient Data) .................................... - Base Salary + Commission.............................................. 63 Base Salary + Bonus ....................................................... 65 Base Salary + Commission + Bonus ............................... 67 Straight Commission (Insufficient Data) .......................... - Commission + Bonus (Insufficient Data) .......................... - 110 National Accounts Manager Combined Compensation Type ....................................... 69 Straight Salary ................................................................. 71 Base Salary + Commission.............................................. 73 Base Salary + Bonus ....................................................... 75 Base Salary + Commission + Bonus ............................... 77 Straight Commission (Insufficient Data) .......................... - Commission + Bonus (Insufficient Data).......................... - 120 Sales Engineer Combined Compensation Type ....................................... 79 Straight Salary ................................................................. 81 Base Salary + Commission.............................................. 83 Base Salary + Bonus ....................................................... 85 Base Salary + Commission + Bonus ............................... 87 Straight Commission (Insufficient Data) .......................... - Commission + Bonus (Insufficient Data).......................... -
© 2011 Employer Associations of America (EAA)
Table of Contents (continued)
Outside Sales Positions (cont’d)
Job Code Page
130 Sales Representative / Account Executive - Senior Combined Compensation Type ....................................... 89 Straight Salary ................................................................. 91 Base Salary + Commission.............................................. 93 Base Salary + Bonus ....................................................... 95 Base Salary + Commission + Bonus ............................... 97 Straight Commission ........................................................ 99 Commission + Bonus ....................................................... 101 150 Sales Representative / Account Executive Combined Compensation Type ....................................... 103 Straight Salary ................................................................. 105 Base Salary + Commission.............................................. 107 Base Salary + Bonus ....................................................... 109 Base Salary + Commission + Bonus ............................... 111 Straight Commission ........................................................ 113 Commission + Bonus ....................................................... 115 160 Sales Representative – Junior Combined Compensation Type ....................................... 117 Straight Salary ................................................................. 119 Base Salary + Commission.............................................. 121 Base Salary + Bonus ....................................................... 123 Base Salary + Commission + Bonus ............................... 125 Straight Commission (Insufficient Data) .......................... - Commission + Bonus ....................................................... 127 170 Sales Trainee Combined Compensation Type ....................................... 129 Straight Salary ................................................................. 131 Base Salary + Commission (Insufficient Data) ................ - Base Salary + Bonus ....................................................... 133 Base Salary + Commission + Bonus ............................... 135 Straight Commission (Insufficient Data) .......................... - Commission + Bonus (Insufficient Data).......................... -
Inside Sales Positions 200 Telephone Sales Representative / Inside Sales Representative Combined Compensation Type ....................................... 137 Straight Salary ................................................................. 139 Base Salary + Commission.............................................. 141 Base Salary + Bonus ....................................................... 143 Base Salary + Commission + Bonus ............................... 145 Straight Commission (Insufficient Data) .......................... - Commission + Bonus (Insufficient Data).......................... -
© 2011 Employer Associations of America (EAA)
Table of Contents (continued)
Inside Sales Positions (cont’d)
Job Code Page
210 Order Processing Supervisor Combined Compensation Type ....................................... 147 Straight Salary ................................................................. 149 Base Salary + Commission (Insufficient Data) ................ - Base Salary + Bonus ....................................................... 151 Base Salary + Commission + Bonus (Insufficient Data) .. - Straight Commission (Insufficient Data) .......................... - Commission + Bonus (Insufficient Data).......................... - 220 Telephone Order Processing Representative Combined Compensation Type ....................................... 153 Straight Salary ................................................................. 155 Base Salary + Commission.............................................. 157 Base Salary + Bonus ....................................................... 159 Base Salary + Commission + Bonus ............................... 161 Straight Commission (Insufficient Data) .......................... - Commission + Bonus (Insufficient Data).......................... -
Customer Service Positions
300 Customer Service Manager Combined Compensation Type ....................................... 163 Straight Salary ................................................................. 165 Base Salary + Commission.............................................. 167 Base Salary + Bonus ....................................................... 169 Base Salary + Commission + Bonus ............................... 171 Straight Commission (Insufficient Data) .......................... - Commission + Bonus (Insufficient Data).......................... - 310 Customer Service Supervisor Combined Compensation Type ....................................... 173 Straight Salary ................................................................. 175 Base Salary + Commission (Insufficient Data) ................ - Base Salary + Bonus ....................................................... 177 Base Salary + Commission + Bonus ............................... 179 Straight Commission (Insufficient Data) .......................... - Commission + Bonus (Insufficient Data).......................... - 320 Customer Service Representative III (Technical Advisor) Combined Compensation Type ....................................... 181 Straight Salary ................................................................. 183 Base Salary + Commission.............................................. 185 Base Salary + Bonus ....................................................... 187 Base Salary + Commission + Bonus ............................... 189 Straight Commission (Insufficient Data) .......................... - Commission + Bonus (Insufficient Data).......................... -

© 2011 Employer Associations of America (EAA)
Table of Contents (continued)
Customer Service Positions (cont’d)
Job Code Page 330 Customer Service Representative II (Experienced) Combined Compensation Type ....................................... 191 Straight Salary ................................................................. 193 Base Salary + Commission.............................................. 195 Base Salary + Bonus ....................................................... 197 Base Salary + Commission + Bonus ............................... 199 Straight Commission (Insufficient Data) .......................... - Commission + Bonus (Insufficient Data).......................... - 350 Customer Service Representative I (Entry Level) Combined Compensation Type ....................................... 201 Straight Salary ................................................................. 203 Base Salary + Commission.............................................. 205 Base Salary + Bonus ....................................................... 207 Base Salary + Commission + Bonus ............................... 209 Straight Commission (Insufficient Data) .......................... - Commission + Bonus (Insufficient Data).......................... -
PART II: COMMISSION & BONUS PLAN SUMMARIES
Sales Management ........................................................................ 211 Outside Sales ................................................................................. 215 Inside Sales and Customer Service .............................................. 218 PART III: BENEFITS & PRACTICES Motivation and Training – Sales Force ..................................................... 223
Benefits Summary – Outside Sales Force ................................................ 223
Expense Allowance Practices – Sales Management and Outside Sales Vehicles Company Owned or Leased Vehicles ............................................ 224 Sales Personnel Owned or Leased Vehicles ................................. 228 Expenses Cell Phones ................................................................................... 230 Entertainment ................................................................................ 231 Lodging and Meals ........................................................................ 231 Parking and Traffic Violations ......................................................... 231 Incidental Out-of-Pocket Expenses ............................................... 232 Home Office Items .......................................................................... 233 Air Fare and Frequent Flyer Programs .......................................... 233 PART IV: TERRITORY COVERED ................................................................. 234 PART V: INDEPENDENT SALES REPS (selected information) ....................... 234

© 2011 Employer Associations of America (EAA) i
Participating Employer Associations (EAA)
This survey was coordinated and sponsored with the cooperation of the following associations:
American Society of Employers Southfield, MI www.aseonline.org
Kevin [email protected]
248.353.4500
Cascade Employers Association Salem, OR www.cascadeemployers.com
Tina [email protected]
503.585.4320
Employers Assoc. of Florida, Inc. Longwood, FL www.eafinc.org
Christine [email protected]
407.260.6556
Employers Assoc. of the NorthEastAgawam, MA www.eane.org
Mark [email protected]
877.662.6444
Employers Association of West MichiganMuskegon, MI www.eawm.net
Lisa [email protected]
231.759.0916
Employers Resource Association Cincinnati, OH www.hrxperts.org
Douglas [email protected]
513.679.4120
Employers Resource Council (ERC)Mayfield Village, OH www.ercnet.org
Katie [email protected]
440.947.1291
MEA - MidAtlantic Employers' AssociationKing of Prussia, PA www.meainfo.org
Susan [email protected]
800.662.6238
MSEC (Mountain States Employers Council, Inc.) Denver, CO www.msec.org
303.223.5344
Continued next page

© 2011 Employer Associations of America (EAA) ii
Participating Employer Associations (continued)
MRA–The Management AssociationWisconsin Waukesha, WI (Coordinating Association) www.mranet.org
Bonni [email protected]
262.696.3508
MRA–The Management AssociationIowa/Western Illinois Moline, IL www.mranet.org
Laurie [email protected]
309.764.8354
MRA–The Management AssociationNorthern Illinois Palatine, IL www.mranet.org
Nancy [email protected]
847.963.9860
The Employers Association, Inc. Lincoln, RI www.the-employers.org
Paul [email protected]
401.732.6788
The Employers Council - Utah Salt Lake City, UT www.ecutah.org
Kimberly [email protected]
801.364.8479
The Management Association of Illinois Downers Grove, IL www.hrsource.org
Kristy [email protected]
800.448.4584
Trusight (formerly Employers Association, Inc.) Plymouth, MN www.trusightinc.com
George [email protected]
763.253.9100
Washington Employers Seattle, WA www.wa-emp.com
Darlene [email protected]
206.329.1120
Please refer to the association nearest you for additional information regarding this survey.

© 2011 Employer Associations of America (EAA) iii
Introduction
This is the 21st Annual National Sales Compensation & Practices Survey conducted with seventeen employer associations. MRA – The Management Association coordinated the survey. This comprehensive survey contains hard to find, up-to-date compensation, benefits, practices and expense allowance information. 707 U.S. firms submitted data, which includes industry breakouts and incumbent based information with 8,995 rates reported.
Survey Features:
21 positions spanning a full sales force from executive to inside sales and customer service Salary reports show base pay, variable pay, and total compensation Compensation Strategies (6 types of incentive strategies, plus Combined Compensation
which summarizes all six types) Gross Sales Volume (3 breakouts) Commission & Bonus Plan Summaries and Expense Allowance Practices Industry Types (14 breakouts) Regions (6 breakouts) Associations (17 breakouts)
NEW: Combined Compensation Type
For each position, a “Combined Compensation Type” was added. This rolls up the data from the six compensation strategies also shown for each position.
Variances in Compensation Strategies and Survey Cycles
Sales compensation plans may or may not have a cap limiting compensation. Occasionally, the absence of a cap, coupled with one or more significant sales performance events, will push total compensation to high six-figure levels. It is important to note that these high rates of pay do occur in the market. These cases will usually be observed in the p90 measures, but may also impact weighted and unweighted averages. In smaller samples their impact can be pronounced. As data are combined with larger samples, the visible impact decreases in magnitude. We suggest using q1, median, and q3 of total compensation in cases where data are skewed.
When using data in this survey, it is important to note that companies vary significantly in the mix of how they deliver compensation to direct sales staff. Some rely heavily on commissions while others use greater amounts of base or bonus. Thus, the most relevant survey analysis for direct sales staff is focused on total compensation. Total compensation is generally a less volatile measure of the market for direct sales.
Organizations tend to place greater emphasis on base pay for top management and lower
level support jobs. Thus, both base pay and total compensation are important. Jobs with a high base component in the mix are less likely to vary in unexpected ways from one survey cycle to the next.
When making year-to-year comparison, users of the survey may see some changes due to shifts in the demographic profile.

© 2011 Employer Associations of America (EAA) iv
Profile of Participating Companies
The effective date of the data is September 2010, and the publication date is January 2011.
Total Responses (A list of participating companies can be found on pages x - xiv)
707 organizations 21 selected occupations 8,995 employees
Primary Customer Type (To whom the salesperson sells. The number in parentheses represents the number of sales reps,
not companies) Consumer (1,368 sales reps) Distributors / Wholesalers (2,161 sales reps) Retailers (1,241 sales reps) Industry (4,225 sales reps)
Geographic Region (a map of the U.S. regions can be found on page vi)
Great Lakes (496 companies) Pacific (61 companies) Northeast (45 companies) Mountain (47 companies) Southeast (27 companies) Central (31 companies)
Association Breakouts (includes all data for association, regardless of geographic location of respondents)
American Society of Employers (MI) (56 companies) Cascade Employers Association (OR) (15 companies) Employers Association of Florida, Inc. (FL) (5 companies) Employers Association of the NorthEast (CT & MA) (12 companies) Employers Association of West Michigan (MI) (8 companies) Employers Resource Association (OH) (114 companies) ERC (OH) (40 companies) Mid-Atlantic Employers Association (PA) (12 companies) Mountain States Employers Council (CO) (37 companies) MRA – The Management Association (IA/Western IL) (5 companies) MRA – The Management Association (Northern IL) (14 companies) MRA – The Management Association (WI) (184 companies) The Employers Association, Inc. (RI) (1 company) The Employers Council (UT) (6 companies) The Management Association of Illinois (IL) (49 companies) Trusight (formerly Employers Association) (MN) (112 companies) Washington Employers (WA) (37 companies)
Gross Sales Volume
0.0 to 26.9 Million (345 companies) 27.0 to 99.9 Million (240 companies) 100.0 Million + (122 companies)
Industry Breakouts – see next page

© 2011 Employer Associations of America (EAA) v
Industry Breakouts
This list reflects the industry breakouts available for this survey. For reference, the industry category along with the North American Industry Classification System (NAICS) is shown. The two-digit and three-digit sector numbers are broad categories.
Abbreviated NAICS Code
Category Name Number of Companies
Natural Resources and Mining 3 11 Agriculture, Forestry, Fishing, & Hunting 21 Mining 22 Utilities 2 23 Construction 13
Non-Durable Goods Manufacturing 137 311-312 Food and Beverage Manufacturing 313-316 Textile and Apparel Manufacturing
322 Paper Manufacturing 323 Printing and Related Support Activities 324 Petroleum and Coal Products Manufacturing 325 Chemical Manufacturing 326 Plastics and Rubber Products Manufacturing
Durable Goods Manufacturing 300 321 Wood Product Manufacturing 327 Non-Metallic Mineral Product Manufacturing 332 Fabricated Metal Product Manufacturing 333 Machinery Manufacturing 334 Computer and Electronic Product Manufacturing 335 Electrical Equipment, Appliance, and Component Manufacturing 336 Transportation Equipment Manufacturing
337-339 Miscellaneous Manufacturing Wholesale and Retail Trade 106
42 Wholesale Trade 44-45 Retail Trade 48-49 Transportation and Warehousing 8
Information 12 51 Information (communication, publishing, broadcasting)
Financial Activities 18 52 Finance and Insurance 53 Real Estate and Rental and Leasing
Professional and Business Services 37 54 Professional, Scientific, and Technical Services 55 Management of Companies and Enterprises
56 Administrative and Support and Waste Management and Remediation Services
Educational and Health Services 24 61 Educational Services 62 Health Care and Social Assistance
Leisure and Hospitality 5 71 Arts, Entertainment, and Recreation 72 Accommodation and Food Services 81 Other Services (except Public Administration) 42 92 Public Administration 0

© 2011 Employer Associations of America (EAA) vi
U.S. Region Map
Mountain Region
Northeast Region
Great Lakes
Region
Southeast Region
Hawaii
Central Region
Pacific Region

© 2011 Employer Associations of America (EAA) vii
Survey Methodology Online questionnaires were used to gather data for this survey. Telephone and e-mail verifications were made with the participants when data required clarification. Data that cannot be verified or are not a good match are not used. Twenty-one sales occupations were surveyed using job descriptions to ensure the accuracy of reporting. Participants were asked to base their job match on the benchmark job description, not on job title. The company’s position and the benchmark description should be at least 70% similar. Companies were asked to report only on full-time Sales Personnel who work out of a local office, agency or distributor and are on the company’s payroll as follows:
salary data on an annual basis in effect as of September 2010 bonus and commission earnings on an annual basis, using the company’s last fiscal
or calendar year to obtain a full 12-month period
All compensation data are collected for each incumbent (rather than an average for all incumbents in that position). Although only full-time Sales Personnel who are on the company’s payroll were included in the compensation, benefits and practices sections, a special section gathers information on the use of Independent Sales Reps and compensation.
Analyzing the Data As with all things statistical, survey data is subject to both the quality of data inputs and the timing of the survey process. The following points should be considered when analyzing survey data.
Skewing of the data – In all surveys, there can be skewing of the data. By comparing averages to medians, skewing is easy to find. When an average is significantly greater than the corresponding median, the data may be skewed high (or vice versa). In other words, for that particular data breakout, there are data that are significantly above the next higher rate (and vice versa).
Aging survey data – All survey data should be appropriately aged. Data collected for surveys are time-sensitive, reflecting a specific point or date in time. Therefore, to accurately reflect such data, all pay rates should be aged according to relevant adjustment rates.
Statistical Parameters When the following parameters are not met, the data are suppressed:
If there are not at least three companies, the data for both base pay and total compensation are suppressed and not shown.
When there are fewer than than five companies, quartiles and percentiles for both base pay and total compensation are suppressed.
There must be at least 5 companies before the two extreme statistics (10th and 90th percentiles or P10 and P90) can be calculated for base pay and total compensation.

© 2011 Employer Associations of America (EAA) viii
Definitions of Survey Terms for Compensation
These are the definitions for the headings that appear at the top of the Position Summary Reports on pages 1–210. (Job No.) Job Title (1) Job Description (2)
# of Orgs
# of Emp
Base Pay (5) Variable Pay (11)
Total Compensation (15) Bonus (12) Commission
(14)
Un-Wtd Avg
Wtd Avg P25 Median P75 Wtd Annual Avg Wtd Annual Avg
Un-Wtd Avg
Wtd Avg P10 P25 Median P75 P90
(3) (4) (6) (7) (8) (9) (10) (13) (13) (16) (17) (18) (8) (9) (10) (19)
(1) Job Number and Job Title: The position’s number, as grouped
by function, and the title of the occupation. (2) Job Description: Benchmark summary of skill and
responsibility level performed in a job. (3) # of Orgs: Number of organizations reporting on the position
surveyed. (4) # of Emp: Number of incumbents (employees) reported in the
position surveyed. (5) Base Pay: The actual base compensation paid to an individual;
based on salary in effect as of September 2010. (6) Un-Wtd Avg Base: The simple average of the organizations’
straight salary and/or base salary data; calculated as the sum of all straight salaries or base salaries in a category divided by the number of organizations.
(7) Wtd Avg Base: The simple average of the employees’ straight salary and/or base salary data; calculated as the sum of all straight salaries or base salaries in a category divided by the number of employees.
Interquartile Ranges (8, 9, 10): Selected ranges based on pay rates, as rates are individually ranked from lowest to highest by salary reported.
(8) P25: The first quartile; also referred to as the 25th percentile. This is the rate in a ranked order (or distribution) of incumbent rates (low to high) equal to or greater than lowest 25% of the total rates.
(9) Median: The 50th Percentile; the rate at which 50% of rates are above and 50% are below; the middle rate in the distribution of rates (low to high).
(10) P75: The third quartile; also referred to as the 75th percentile. This is the rate in a ranked order (or distribution) of incumbent rates (low to high) equal to or greater than lowest 75% of the total rates.
(11) Variable Pay: Commission or bonus earnings paid to incumbents; summarized on an annual basis; can be reported as paid for the last fiscal or calendar year.
(12) Bonus: A cash bonus arrangement as may be related to overall volume, gross or discretionary margin from sales or other criteria.
(13) Wtd Annual Avg: The annual average of commission or bonus earnings; based on incumbents in the category.
(14) Commission: Earnings related directly to individual sales or revenue.
(15) Total Compensation (TC): Sum of all cash compensation paid including annual salary, annual commission, and annual bonus; commission and bonus compensation based on the company’s last fiscal or calendar year in order to have a full 12-month period.
(16) Un-Wtd Avg TC: Simple average of the organizations’ total cash compensation (including those that did not receive commission and/or bonus compensation) and then dividing by the number of organizations reported in the position.
(17) Wtd Avg TC: The simple average of employees’ total annual cash compensation (including base salary, bonus and/or commission) based on the number of employees in the position.
(18) P10: The 10th percentile; the rate at which 10% of incumbents are at or below and 90% are at or above.
(19) P90: The 90th percentile; the rate at which 90% of incumbents are at or below and 10% are at or above.

© 2011 Employer Associations of America (EAA) ix
Definitions of Survey Terms for Compensation (continued)
These terms can be found in the survey profile and/or compensation data. 1. Compensation Strategies: Participating companies could report their employees in any of
the six pay plans listed below. The data are shown separately for each of the six pay plans and are also shown combined.
Combined Compensation Type (NEW): Total compensation for all pay types combined.
1. Straight Salary: Only straight salary paid (does not include overtime, if paid); no commission or bonus plan pay arrangement
2. Straight Salary Plus Commission: Straight salary plus paid commission based on individual sales or revenue
3. Straight Salary Plus Bonus: Straight salary plus a cash bonus arrangement as may be related to overall volume, gross, or discretionary margin from sales or other criteria
4. Straight Salary Plus Commission Plus Bonus: Straight salary plus paid commission based on individual sales and revenue plus a bonus related to overall volume or other criteria
5. Straight Commission: Earnings related directly to individual sales or revenue; in cases where draws are advanced against commissions, do not consider such amounts as salary
6. Commission Plus Bonus: Earnings related directly to individual sales and revenue plus paid cash bonus as may be related to volume, gross profit, or other criteria
2. Primary Customer Types: Refers to the customer to whom the salesperson primarily sells.
Some companies may have more than one type of customer.
Industry Distributors / Wholesalers Retailers Consumer
3. Gross Sales Volume: Gross sales volume includes sales / revenues or net assets (for
financial and insurance companies) for the last fiscal year, of all units encompassed by the unit for which compensation data were reported
4. Regions: see the US Region Map on page vi.

National Participant List – Companies
© 2011 Employer Associations of America (EAA) x
The EAA’s thank their members that submitted data, making this survey possible. This list is organized alphabetically by company name.
A A. R. Sandri Aaron Equipment Co. AbeTech ABP Induction, LLC AccuVal Associates, Inc. ACI Communications, Inc. Acme Industrial Company Acromag, Inc. ACT Teleconferencing Services,
Inc. Adcare Health Systems Advanced Microscopy Group Advantech Manufacturing, Inc. AGC Chemicals Agie Charmilles AirWay Technologies, Inc. Alaska Marine Lines, Inc. AlcoTec Wire Corporation Algas-SDI International LLC Alloy Bellows & Precision Welding
Inc. Alter Trading Corporation AM Equipment Amer Sports Winter & Outdoor American Cancer Society American Fluorescent Corp. American Furukawa, Inc. American Hose & Fittings, Inc. American Hotel Register Company American Roller Company American TV & Appliance, Inc. Amesbury Group PPi Inc. Amorim Cork Composites Anderson Dahlen, Inc. ANIMART Applied Products Inc. Aptar-Mukwonago Argent International Aris Horticulture, Inc. Arobotech Systems, Inc. ART Technologies, Inc. Art Van Furniture, Inc. Artos Engineering Co. asap promotions inc.
Aseptico, Inc. ASI DataMyte, Inc. ASI Technologies ASQ Asset Marketing Services, Inc. Associated Bag Company Associated Integrated Supply Chain
Solutions ATS/VerifyProtect.com Australis Aquaculture, LLC Avatar Corporation Aveda Corporation Aviation Supplies and Academics,
Inc. B
Badger Color Concentrates, Inc. Badger Land Car Wash Equipment
and Supplies Badger Mining Corporation Balluff, Inc. Banner Stamping Company Batteries Plus Bauer Welding & Metal Fabricators,
Inc. Benda-Lutz Corporation Berkshire Corporation Best Upon Request Beta LaserMike Inc. Bevco Precision Mfg. Bielinski Homes, Inc. Birchwood Laboratories BloodCenter of Wisconsin Blue Cross & Blue Shield of Rhode
Island Blue Sea Systems, Inc. Bock Water Heaters, Inc. Boehringer Laboratories Boehringer-Ingelheim, Roxane, Inc.Bona US Botsford Health Care Bourns Automotive Division Bowman Manufacturing Braaten Health, LLC Bradley Corporation Bridgeview Aerosol, LLC Briohn Building Corp.
Buffalo Industries LLC Bulk Molding Compounds, Inc. Burroughs Payment Systems Business Information Solutions, Inc.Butler Insurance Service , Inc.
C C.H. Dean, Inc. C.TRAC information solutions Cannon Equipment Capital Investment Services of
America, Inc. Capitol Stampings Corp. Carbonair Environmental Systems,
Inc. Carco Industries Inc. CarePoint Partners CarePoint Partners Baton Rouge CarePoint Partners Dallas CarePoint Partners Fairmont CarePoint Partners Jacksonville CarePoint Partners Philadelphia CarePoint Partners Providence CarePoint Partners Scranton CarePoint Partners Youngstown Cargill Kitchen Solutions Car-Part.com Catholic Aid Association CB Manufacturing & Sales Co., Inc.Center for Diagnostic Imaging Chef Craft Corp. Chelsea & Scott, Ltd Chemical Associates of Illinois Chicago Communications, LLC Cincinnati Incorporated Cincinnati USA Convention &
Visitors Bureau Cindus Corporation Circle, Inc. CL&D Graphics, Inc. Clack Corporation Clarity Health Services Clark-Reliance Corp. Clasen Quality Coatings CM Packaging Group, Inc. CMD Corporation

National Participant List – Companies (cont.)
© 2011 Employer Associations of America (EAA) xi
Coating Excellence, Int'l Coilcraft, Inc. Cold Jet, LLC Coleman Natural Foods, LLC Columbus Chemical Industries, Inc. Comprehensive Health Education
Foundation Cone's Repair Service, Inc DBA
Dan Cone Group Conney Safety Products, LLC Consolidated Health Services, Inc. Construction Forms, Inc. Construction Specialties Continental Cooper Lighting Cornwell Quality Tools Company Corporate One Federal Credit Union Cowgirl Tuff Company Cramer Coil & Transformer Co., Inc. Cranston Machinery Crest Healthcare Supply CSG Systems, Inc. Cubic Designs, Inc. Cymbet Corporation
D Dainippon SCREEN Graphics USA,
LLC Dantom Systems, Inc. Dart Chart David C Cook David Michael & Co., Inc. Dayton Rogers Mfg. Co. DCI Marketing Inc. DCI, Inc. Deceuninck N A Dedicated Computing Delta Industrial Services, Inc. DEMCO DENSO International America, Inc. Deringer-Ney Inc. Determan Brownie, Inc. Detroit Medical Center Detroit Stoker Company DHI Corp. Dings Co. Diversatek, Inc. Doig Corporation Domino's Pizza LLC
DORMA Architectural Hardware Downing Displays Dr. Hauschka Skin Care Inc. DRB Systems, Inc. Dynamic Group Dyne Systems, Inc. Dynex/Rivett Inc.
E E & O Tool & Plastics, Inc. E.A. Sween Company Eagle:XM Eastern Oil Company ECA ECM Publishers, Inc. EDCO Products, Inc. eDocument Resources Eggers Industries Inc. Electronic Technologies
International, Inc. Elegant Fare, Inc. Elk River Machine Company Ellsworth Corporation Emerald Home Furnishings Enerco Group Inc. Engineered Plastics Corp. Engis Corporation Entertainment Publications LLC Environmental Systems, Inc. Equus Computer Systems Essential Industries, Inc. Exlar Corporation
F F&M Mafco, Inc. Falcon Packaging, LLC Fall Creek Farm & Nursery, Inc. Far Bank Enterprises Fischer Precise USA Flambeau Inc. Force Control Industries Formica FP International Frabill, Inc. Freeman Mfg. & Supply Fristam Pumps USA Ltd PartnershipFryer Knowles, Inc. Fusion Inc. Fusite
G Galco Industrial Electronics GearGrid Corporation Gehl Foods, Inc. Gemini Incorporated Generac Power Systems, Inc. Genesis Systems Group GETRAG Transmissions
Corporation Ghent Manufacturing, Inc. GJ Pepsi Bottling, Co. of ColumbusGlobe Machine Mfg. GM Nameplate, Inc. GP Parking Inc. Grande Cheese Company Granite Microsystems Great Lakes Educational Loan
Services, Inc. Greater Twin Cities United Way Group Health Cooperative of South
Central Wisconsin Group Publishing, Inc. GS Hydraulics, Inc
H H.O. Bostrom Company, Inc. Hadrian Inc. Hanratty and Associates Harken Inc. Harlow-HRK Sales & Marketing, Inc.Harper Corporation of America Hartung Glass Industries Haumiller Engineering Hawkins, Inc. hc brill Heatbath Corporation Hedberg Aggregates Helvoet Pharma Inc. Hennepin Faculty Associates Herb Pharm Heska Corporation Hilltop Basic Resources, Inc. HiRel Systems Hiwin Corporation HLS One, LLC dba The Buckeye
Corner Hoffmaster Group, Inc. Holland LP Holly Corporation

National Participant List – Companies (cont.)
© 2011 Employer Associations of America (EAA) xii
Holmberg Co. Inc. Home Buyers Warranty Corp. Horizon Retail Construction Horn Packaging Corporation Hoselton Environmental Group, Inc. HR Profile Hubert North America Sales LLC Huf NA Hufcor, Inc. HUI HyQuip, Inc.
I Identification Services Inc. IEWC Ilitch Holdings, Inc. Indeck Power Equipment Co Independent Pharmacy Cooperative Industrial Fabrics Corporation Industrial Revolution, Inc. Industrial Steel & Wire Infosoft Group Inovonics Corporation Intek Plastics Inc. Interior Concepts Corporation International Master Products
Company Intertech Design Services, Inc. IntriCon Corp Invotec Engineering, Inc. ITE LLC
J J. J. Keller & Associates, Inc. Jet, Inc. JIT Manufacturing, Inc. JobServe USA Corporation John Crane Inc. John R. Green Company Johnson & Quin Johnson Health Tech North America Johnsonville Sausage LLC Jones International, Ltd. JULIE, Inc. Junior Library Guild JW Speaker Corporation
K Kadant Black Clawson Inc. Karl Dungs, Inc.
Kaysun Corporation Keir Educational Resources Kelchner Kelle Company Ken Cook Co. Kent Adhesive Products Company Kesslers Diamonds Key Knife, Inc. Kittredge Equipment Company Kleingers & Associates Kolene Corporation Kondex Corporation Kongsberg Automotive Korrect Plumbing Co. Koyo Corporation of USA Kracor, Inc. K-TEC, Inc.
L L.B. White Co. Lake Associates, Inc. Lake Shore Cryotronics, Inc. Lakeside Bottling Company Lakeside Foods Lakeside Manufacturing, Inc. Lakeview Industries Inc. Laminators Incorporated Lamplight Lance Gyldenege Construction Co. Latitude Subrogation Services Lawrence Service Co. LDV, Inc. Leanin' Tree Inc. Lexington Manufacturing, Inc. Lightning Eliminators & Consultants,
Inc. Lion Precision Liphatech Inc. Listen Up, Inc. Littleford Day, Inc. Logic PD LOGICARE Corporation LONG Building Technologies, Inc. Lovejoy, Inc. Lube-Power, Inc. Lucas Milhaupt Lumitex, Inc. Lunde Marine Electronics, Inc.
M Macromatic Controls Magid Glove & Safety Magnetek Mail Handling Inc. Mapes & Sprowl Steel Ltd. Marathon Multimedia Maritime Insurance Group Marketing Displays, Inc. Marshall W. Nelson & Assoc., Inc. Mar-Test Inc. Master Magnetics, Inc. MasterGraphics Inc. MasterTag Mate Precision Tooling Materials Processing Corporation Mathison Metalfab, Inc. Matrix Packaging Machinery Inc. Mayville Products Corporation MBW, Inc. McSwain Manufacturing Means Industries, Inc. Medical Group Management Assn. Meister Media Worldwide Melco Industries Memory Suppliers Metal-Era, Inc. Metalwest, LLC. MGS Machine Corporation Michigan Molecular Institute Michigan Spring & Stamping Mid West Fabricating Co. MidCo Inc. Middletown Tube Works Inc. Mid-States Aluminum Corp. Midway Industrial Supply Co. MII Equipment Inc. Milcut, Inc. Miller-St. Nazianz, Inc. Minco Products Inc. MindLeaders, Inc. Miner Enterprises, Inc. MinnPar LLC Mixer Systems, Inc. MM Solutions Modernistic, Inc. Molded Dimensions

National Participant List – Companies (cont.)
© 2011 Employer Associations of America (EAA) xiii
Morrison Products, Inc. Mortgagebot LLC MTI Distributing, Inc. Mubea, Inc. Multicircuits Inc. Mutual Materials Company
N NACM Oregon, Inc. National Association of College
Stores National Business Furniture National Filter Media National Independent Brokers, Inc. National Jewish Health National Safety Apparel, Inc. Naviant, Inc. Nease Corporation NEC Display Solutions of America,
Inc. NeoMetrics Inc. Neosho Trompler Inc. Neundorfer, Inc. New Gencoat Inc. Nexergy, Inc. Nichols Paper & Supply Nidec-Shimpo America Nilpeter USA, Inc. Nol-Tec Systems, Inc. Norka, Inc. Norma Michigan, Inc. Northshore Power Systems, LLC Nott Company NSL Analytical Services, Inc. NxtGen Emission Controls Inc. Nylok LLC
O O.F. Mossberg and Sons, Inc. Ocean Nutrition Ocular Instruments OEM Fabricators, Inc. Ogura Corporation Ohio Indemnity Company Old Republic Surety Company Olsen Tool & Plastics, Inc. Olympic Hot Tub Company Omega Design Corporation omniFAB, LLC
Oregon Freeze Dry, Inc. Oregon School of Massage OurPet's Company
P Pacific Pure-Aid Company dba
Givaudan Pacific Research Laboratories, Inc. Pacific Steamex Pacor, Inc. Pakor, Inc. Palermo Villa Inc. PaR Systems Inc. Parascript Paratech Inc. Partner Professional Staffing Patch Products PCMS Datafit, Inc. Pearson Candy Company Pennsylvania Machine Works, Inc. PensionTrend Investment Advisers,
LLC Pentax Imaging Company Perio Inc PetroCard, Inc. Pettit Oil Company PIC Wire & Cable Pillar Technologies Pipe Line Development Co. Placon Polyfab Corp. Polyfirst Packaging, Inc. Portal, Inc. Power Electric Distribution, Inc. PRC Medical, LLC Preformed Line Products Company Premix, Inc. Premold Corp. Primera Technology Proctor Sales, Inc. Publication Printers Corp.
Q Q Lab Corporation QStart Labs LLC Quabbin Wire & Cable Co. Inc. Quality Assured Label, Inc. Quality Bicycle Products
R R L Deppmann Racine Metal-Fab, Ltd Radix Wire Company Rainbow Tree Company Ranpak Corp Rayconnect, Inc. Reading Rock, Inc. Reed Switch Developments Corp. Refrigeration Sales Corp. Regal Ware, Inc. Reich Tool & Design Reid Entities Research Products Corporation Ricerca Biosciences, LLC Richards Industries Richardson Electronics RMO, Inc. Robbins Inc. Robert Bosch Packaging
Technology, Inc ROSS Controls Rottler Manufacturing Royal Tire Inc. RS Electronics RSR Group, Inc. Russel Metals Williams Bahcall Inc.
S Sabes Jewish Community Center Sartori Food Corporation Satellite Industries, Inc. SATO Labeling Solutions America,
Inc. Scanner Applications Schiller Grounds Care, Inc. Schroeder Milk Company, Inc. Schwickert's of Mankato Scientific Protein Laboratories Security National Automotive
Acceptance Corporation Sensus LLC Sentry Equipment Corp. SETCO Sales Co. SICO America Inc. Signcaster Corp dba Johnson Plastics Smead Mfg. Co. Solar Plastics, Inc.

National Participant List – Companies (cont.)
© 2011 Employer Associations of America (EAA) xiv
Sparboe Farms Spectralytics SPI Lighting, Inc. SSI Technologies St Anthony Messenger Press ST International Stan Koch & Sons Trucking, Inc. Standard Imaging, Inc. Steep & Brew Stored Energy Systems Storopack, Inc. Strategic Fundraising, Inc. Stylmark, Inc. Summit Business Media
T Tailored Label Products Tallgrass Restoration, LLC Tanis, Inc. Tape Products Co. TCA Financial, Inc. Technoform Teel Plastics, Inc. Teledyne Tekmar Co. Tescom The Adventurous Child The Ahola Corporation The Armor Group, Inc. The Brewer Co. The Buckeye Stamping Co. dba
Buckeye Shapeform The Dental Care Plus Group The Dieringer Research Group, Inc. The Finest Accessories, Inc. The H. P. Manufacturing Company,
Inc. The Hillman Group The James Hotel The Kinetic Co., Inc. The Malish Corporation The Marek Group The Mark Travel Corporation The New York Blower Co.
The Penray Companies, Inc. The Penworthy Company The Shepherd Color Company The US Playing Card Company Thermo-Tech Windows things remembered Thomas Engineering Company TigerStop LLC Timber Products Company TIP Technologies, Inc. Toll Company Tolomatic, Inc. Tone Commander Systems Inc Tonka Equipment Company Tonka Equipment Company Total Quality Logistics Toyobo Kureha America TP Mechanical Contractors Transportation Solutions Group,
LLC TRC Global Solutions, Inc. Trelleborg Sealing Profiles Trico Products TURCK Inc. Twin City Fan Companies, Ltd.
U – V U.S. Axle, Inc. U-Line Corporation Unifund United Air Specialists United Bay Community Credit UnionUnited Hardware Distributing Co Universal Universal Cooperatives, Inc. USP Structural Connectors Value Plastics, Inc. Velvac, Inc. Verifications Inc ViaWest, Inc. Vibro/Dynamics Corp. Viking Eng. & Dev. Inc. Visa Lighting
Vishay Micro-Measurements Inc. Vogel Seed & Fertilizer, Inc.
W Waibel Energy Systems, Inc. Waltco Lift Corp. Warner Manufacturing Co. Washington Air Reps, Inc. Water Pik, Inc. Waterous Company Watersaver Company, Inc. Wauconda Tool & Engineering Waukesha Metal Products Wausau Equipment Company, Inc. Webb Chemical Service
Corporation Weldaloy Products Company WEM Automation Weschler Instruments Wescor, Inc. wetpaint.com, inc. Widen Enterprises, Inc. William Frick & Company Williams Sound Corp. Wilson-Hurd Mfg. Co. Wineman Technology Inc. Winthrop Corporation Wisconsin Oven Corporation Wisconsin Physicians Service
Insurance Corp. Wixon Inc. Wm K Walthers, Inc. Woodmeister Master Builders Woodmill Products, Inc. WTS Paradigm
X – Y – Z Yakima Products, Inc. Yancey's Food Service York Repair, Inc. Young Corporation ZF Services North America LLC Ziegler Inc. Zinpro Corporation

© 2011 Employer Associations of America (EAA) xv
This page intentionally left blank.

Bonus Commission# of Orgs
# of Emp
Un-Wtd Avg
WtdAvg P25 Median P75
Wtd Annual Avg
Wtd Annual Avg
Un-Wtd Avg
WtdAvg P10 P25 Median P75 P90
Total Responses 324 370 - - - - - - - $171,165 $173,360 $104,754 $127,255 $155,102 $200,725 $250,000
Org Sales Volume0.0-26.9 million 140 153 - - - - - - - $151,519 $151,810 $95,880 $113,110 $140,933 $174,923 $225,57527.0-99.9 million 126 142 - - - - - - - $179,181 $184,412 $120,016 $134,904 $164,100 $208,073 $251,540100.0 million+ 58 75 - - - - - - - $201,176 $196,396 $123,867 $139,500 $182,500 $238,000 $282,460
RegionNortheast 20 21 - - - - - - - $157,472 $153,592 $79,720 $98,548 $151,000 $201,737 $247,000Southeast 6 6 - - - - - - - $185,510 $185,510 $124,998 $132,236 $169,388 $229,785 $312,389Great Lakes 242 279 - - - - - - - $169,278 $170,480 $107,775 $127,406 $156,000 $200,001 $248,877Central 7 8 - - - - - - - $165,679 $177,515 $116,354 $130,207 $163,400 $226,530 $280,500Mountain 26 32 - - - - - - - $212,796 $223,226 $125,335 $134,831 $182,669 $236,380 $456,029Pacific 23 24 - - - - - - - $153,797 $153,226 $97,500 $115,051 $144,100 $171,625 $242,300
AssociationAmerican Society of Employers (MI) 25 26 - - - - - - - $145,072 $144,123 $107,860 $119,750 $124,998 $176,800 $191,276Cascade Employers Assoc. (OR) 4 4 - - - - - - - $148,341 $148,341 - - $131,883 - -Employers Assoc. NE (CT & MA) 9 9 - - - - - - - $154,473 $154,473 $77,900 $91,548 $150,000 $230,000 $250,000Trusight (MN) - formerly EA 53 60 - - - - - - - $165,912 $165,696 $115,135 $130,659 $151,771 $184,009 $262,626Employers Assoc. W. Michigan (MI) 6 7 - - - - - - - $175,066 $160,914 $60,000 $92,000 $205,000 $220,000 $220,000Employers Resource Assoc. (OH) 47 52 - - - - - - - $164,440 $165,057 $97,234 $135,236 $160,000 $202,762 $227,383Employers Resource Council (OH) 21 23 - - - - - - - $162,181 $163,185 $103,679 $120,000 $147,000 $201,886 $238,590MidAtlantic Employers Assoc. (PA) 6 6 - - - - - - - $155,588 $155,588 $105,735 $131,434 $152,228 $187,827 $199,350Mtn States Employers Council (CO) 19 23 - - - - - - - $222,043 $240,388 $128,858 $135,346 $189,505 $240,000 $545,690MRA - The Mgmt Assoc. (N. IL) 5 5 - - - - - - - $303,122 $303,122 $142,305 $158,653 $208,000 $495,154 $664,307MRA - The Mgmt Assoc. (WI) 83 104 - - - - - - - $173,811 $178,060 $109,750 $130,000 $162,175 $215,000 $274,180The Employers Council (UT) 5 7 - - - - - - - $185,844 $175,665 $105,000 $134,452 $146,200 $185,000 $341,280The Management Assoc. of Illinois (IL) 23 26 - - - - - - - $170,014 $167,186 $93,820 $125,501 $153,706 $198,698 $264,298
continued
Base Pay Variable Pay
(10) Top Sales ExecutiveCombined Compensation Type
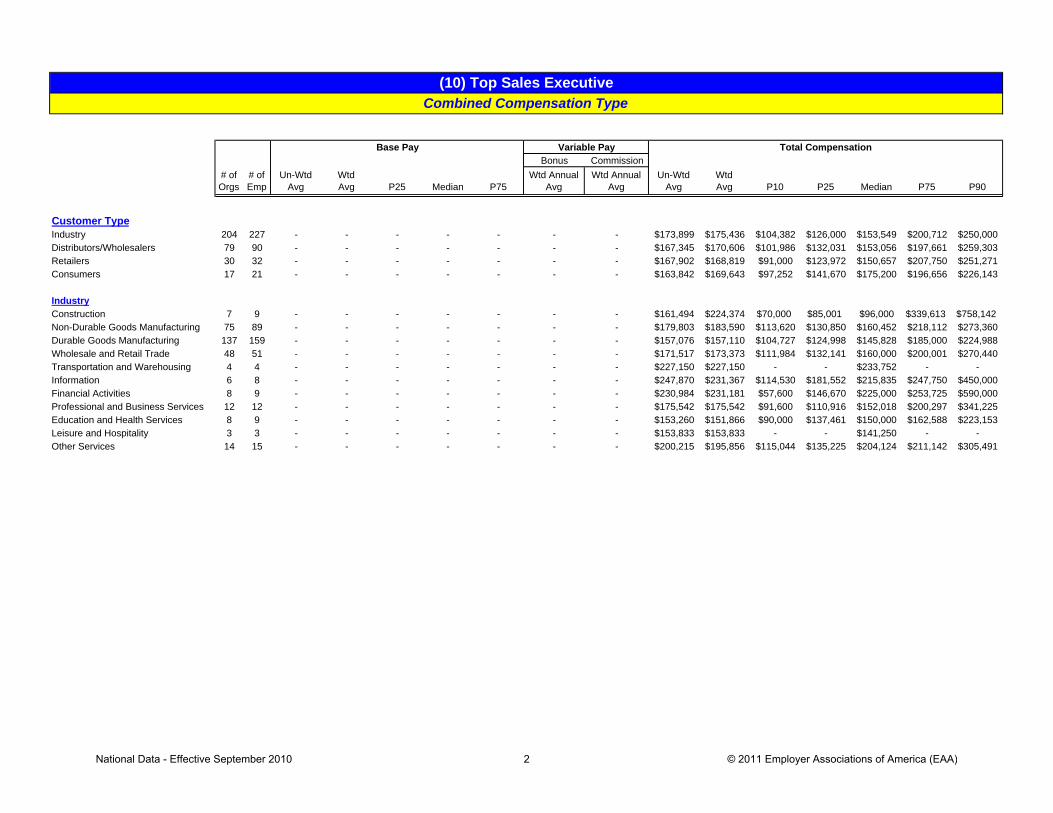
Generally reports to President or Executive V.P. level, may be called Vice President of Sales, Vice President of Sales and Marketing, Director of Sales, etc. Responsible for the overall management and direction of the sales functions and the entire range of sales planning and development, sales promotion and sales activities of the organizational unit. Formulates, recommends and implements policies and programs in the areas of forecasting, sales, pricing, marketing and product or service acceptance research, and related activities. May also have responsibility for marketing programs, customer relations or advertising.
Effective Date:September 2010
Total Compensation
National Data - Effective September 2010 1 © 2011 Employer Associations of America (EAA)
(10) Top Sales ExecutiveCombined Compensation Type
Bonus Commission# of Orgs
# of Emp
Un-Wtd Avg
WtdAvg P25 Median P75
Wtd Annual Avg
Wtd Annual Avg
Un-Wtd Avg
WtdAvg P10 P25 Median P75 P90
Customer TypeIndustry 204 227 - - - - - - - $173,899 $175,436 $104,382 $126,000 $153,549 $200,712 $250,000Distributors/Wholesalers 79 90 - - - - - - - $167,345 $170,606 $101,986 $132,031 $153,056 $197,661 $259,303Retailers 30 32 - - - - - - - $167,902 $168,819 $91,000 $123,972 $150,657 $207,750 $251,271Consumers 17 21 - - - - - - - $163,842 $169,643 $97,252 $141,670 $175,200 $196,656 $226,143
IndustryConstruction 7 9 - - - - - - - $161,494 $224,374 $70,000 $85,001 $96,000 $339,613 $758,142Non-Durable Goods Manufacturing 75 89 - - - - - - - $179,803 $183,590 $113,620 $130,850 $160,452 $218,112 $273,360Durable Goods Manufacturing 137 159 - - - - - - - $157,076 $157,110 $104,727 $124,998 $145,828 $185,000 $224,988Wholesale and Retail Trade 48 51 - - - - - - - $171,517 $173,373 $111,984 $132,141 $160,000 $200,001 $270,440Transportation and Warehousing 4 4 - - - - - - - $227,150 $227,150 - - $233,752 - -Information 6 8 - - - - - - - $247,870 $231,367 $114,530 $181,552 $215,835 $247,750 $450,000Financial Activities 8 9 - - - - - - - $230,984 $231,181 $57,600 $146,670 $225,000 $253,725 $590,000Professional and Business Services 12 12 - - - - - - - $175,542 $175,542 $91,600 $110,916 $152,018 $200,297 $341,225Education and Health Services 8 9 - - - - - - - $153,260 $151,866 $90,000 $137,461 $150,000 $162,588 $223,153Leisure and Hospitality 3 3 - - - - - - - $153,833 $153,833 - - $141,250 - -Other Services 14 15 - - - - - - - $200,215 $195,856 $115,044 $135,225 $204,124 $211,142 $305,491
Base Pay Variable Pay Total Compensation
National Data - Effective September 2010 2 © 2011 Employer Associations of America (EAA)
Bonus Commission# of Orgs
# of Emp
Un-Wtd Avg
WtdAvg P25 Median P75
Wtd Annual Avg
Wtd Annual Avg
Un-Wtd Avg
WtdAvg P10 P25 Median P75 P90
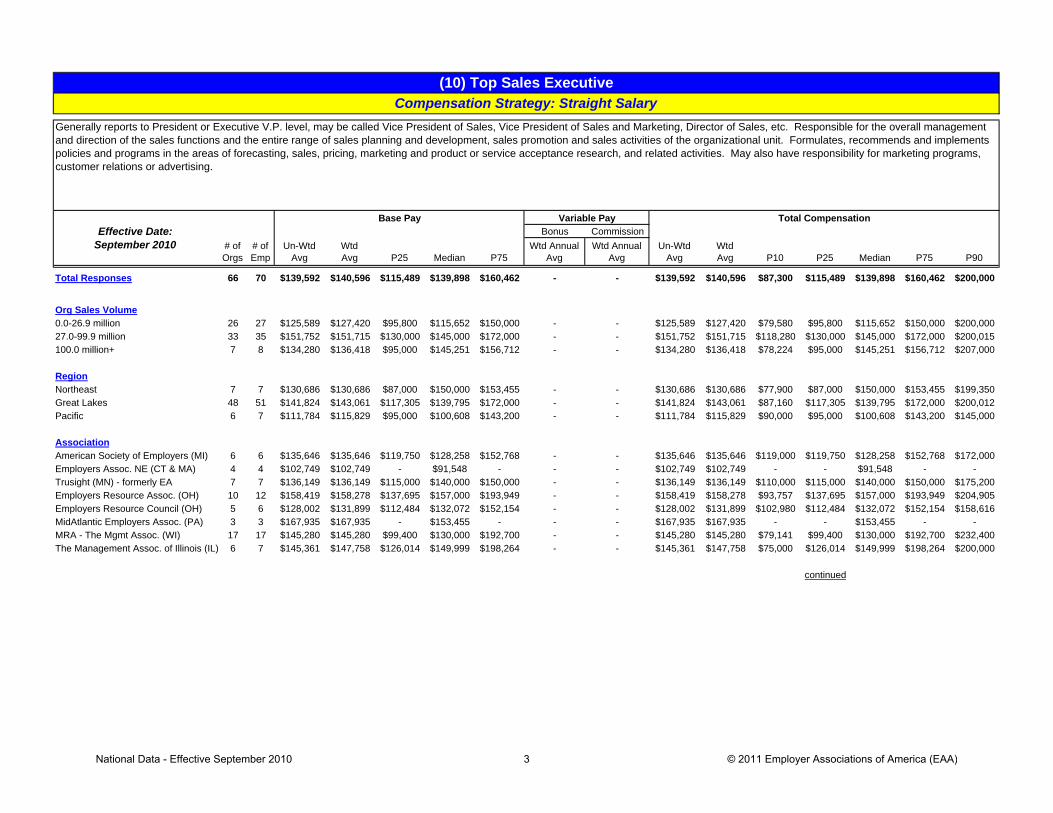
Total Responses 66 70 $139,592 $140,596 $115,489 $139,898 $160,462 - - $139,592 $140,596 $87,300 $115,489 $139,898 $160,462 $200,000
Org Sales Volume0.0-26.9 million 26 27 $125,589 $127,420 $95,800 $115,652 $150,000 - - $125,589 $127,420 $79,580 $95,800 $115,652 $150,000 $200,00027.0-99.9 million 33 35 $151,752 $151,715 $130,000 $145,000 $172,000 - - $151,752 $151,715 $118,280 $130,000 $145,000 $172,000 $200,015100.0 million+ 7 8 $134,280 $136,418 $95,000 $145,251 $156,712 - - $134,280 $136,418 $78,224 $95,000 $145,251 $156,712 $207,000
RegionNortheast 7 7 $130,686 $130,686 $87,000 $150,000 $153,455 - - $130,686 $130,686 $77,900 $87,000 $150,000 $153,455 $199,350Great Lakes 48 51 $141,824 $143,061 $117,305 $139,795 $172,000 - - $141,824 $143,061 $87,160 $117,305 $139,795 $172,000 $200,012Pacific 6 7 $111,784 $115,829 $95,000 $100,608 $143,200 - - $111,784 $115,829 $90,000 $95,000 $100,608 $143,200 $145,000
AssociationAmerican Society of Employers (MI) 6 6 $135,646 $135,646 $119,750 $128,258 $152,768 - - $135,646 $135,646 $119,000 $119,750 $128,258 $152,768 $172,000Employers Assoc. NE (CT & MA) 4 4 $102,749 $102,749 - $91,548 - - - $102,749 $102,749 - - $91,548 - -Trusight (MN) - formerly EA 7 7 $136,149 $136,149 $115,000 $140,000 $150,000 - - $136,149 $136,149 $110,000 $115,000 $140,000 $150,000 $175,200Employers Resource Assoc. (OH) 10 12 $158,419 $158,278 $137,695 $157,000 $193,949 - - $158,419 $158,278 $93,757 $137,695 $157,000 $193,949 $204,905Employers Resource Council (OH) 5 6 $128,002 $131,899 $112,484 $132,072 $152,154 - - $128,002 $131,899 $102,980 $112,484 $132,072 $152,154 $158,616MidAtlantic Employers Assoc. (PA) 3 3 $167,935 $167,935 - $153,455 - - - $167,935 $167,935 - - $153,455 - -MRA - The Mgmt Assoc. (WI) 17 17 $145,280 $145,280 $99,400 $130,000 $192,700 - - $145,280 $145,280 $79,141 $99,400 $130,000 $192,700 $232,400The Management Assoc. of Illinois (IL) 6 7 $145,361 $147,758 $126,014 $149,999 $198,264 - - $145,361 $147,758 $75,000 $126,014 $149,999 $198,264 $200,000
continued
(10) Top Sales ExecutiveCompensation Strategy: Straight Salary
Generally reports to President or Executive V.P. level, may be called Vice President of Sales, Vice President of Sales and Marketing, Director of Sales, etc. Responsible for the overall management and direction of the sales functions and the entire range of sales planning and development, sales promotion and sales activities of the organizational unit. Formulates, recommends and implements policies and programs in the areas of forecasting, sales, pricing, marketing and product or service acceptance research, and related activities. May also have responsibility for marketing programs, customer relations or advertising.
Effective Date:September 2010
Total CompensationBase Pay Variable Pay
National Data - Effective September 2010 3 © 2011 Employer Associations of America (EAA)

(10) Top Sales ExecutiveCompensation Strategy: Straight Salary
Bonus Commission# of Orgs
# of Emp
Un-Wtd Avg
WtdAvg P25 Median P75
Wtd Annual Avg
Wtd Annual Avg
Un-Wtd Avg
WtdAvg P10 P25 Median P75 P90
Customer TypeIndustry 39 42 $144,732 $145,758 $117,500 $144,779 $174,697 - - $144,732 $145,758 $91,500 $117,500 $144,779 $174,697 $200,015Distributors/Wholesalers 18 19 $130,485 $131,584 $115,652 $139,795 $145,000 - - $130,485 $131,584 $96,096 $115,652 $139,795 $145,000 $158,616Retailers 6 6 $127,434 $127,434 $77,351 $102,000 $201,750 - - $127,434 $127,434 $75,705 $77,351 $102,000 $201,750 $207,000Consumers 3 3 $151,733 $151,733 - $150,000 - - - $151,733 $151,733 - - $150,000 - -
IndustryNon-Durable Goods Manufacturing 20 21 $144,738 $144,517 $109,350 $136,995 $175,008 - - $144,738 $144,517 $78,579 $109,350 $136,995 $175,008 $225,600Durable Goods Manufacturing 30 33 $135,663 $138,135 $116,479 $140,850 $162,308 - - $135,663 $138,135 $95,320 $116,479 $140,850 $162,308 $184,040Wholesale and Retail Trade 7 7 $144,244 $144,244 $115,000 $139,795 $200,000 - - $144,244 $144,244 $77,900 $115,000 $139,795 $200,000 $207,000Education and Health Services 3 3 $130,000 $130,000 - $150,000 - - - $130,000 $130,000 - - $150,000 - -
Base Pay Variable Pay Total Compensation
National Data - Effective September 2010 4 © 2011 Employer Associations of America (EAA)

Bonus Commission# of Orgs
# of Emp
Un-Wtd Avg
WtdAvg P25 Median P75
Wtd Annual Avg
Wtd Annual Avg
Un-Wtd Avg
WtdAvg P10 P25 Median P75 P90
Total Responses 28 28 $124,273 $124,273 $99,798 $113,000 $139,344 - $43,674 $167,947 $167,947 $108,044 $127,515 $147,729 $201,500 $262,703
Org Sales Volume0.0-26.9 million 17 17 $113,701 $113,701 $95,835 $110,775 $127,602 - $41,356 $155,057 $155,057 $104,744 $110,665 $141,250 $188,303 $238,00027.0-99.9 million 8 8 $125,508 $125,508 $99,798 $122,350 $153,750 - $37,725 $163,234 $163,234 $126,120 $131,844 $149,887 $187,000 $250,000100.0 million+ 3 3 $180,887 $180,887 - $179,350 - - $72,677 $253,564 $253,564 - - $259,671 - -
RegionNortheast 3 3 $115,245 $115,245 - $105,735 - - $41,667 $156,912 $156,912 - - $140,000 - -Great Lakes 18 18 $121,103 $121,103 $96,068 $113,000 $140,532 - $46,540 $167,643 $167,643 $107,548 $132,132 $159,488 $194,500 $254,000Mountain 3 3 $137,660 $137,660 - $133,900 - - $35,836 $173,497 $173,497 - - $134,700 - -
AssociationTrusight (MN) - formerly EA 4 4 $101,159 $101,159 - $75,000 - - $58,212 $159,371 $159,371 - - $165,065 - -Employers Resource Assoc. (OH) 4 4 $118,075 $118,075 - $113,000 - - $42,125 $160,200 $160,200 - - $141,250 - -Employers Resource Council (OH) 3 3 $109,023 $109,023 - $100,000 - - $12,563 $121,586 $121,586 - - $131,700 - -MRA - The Mgmt Assoc. (WI) 3 3 $139,234 $139,234 - $130,203 - - $47,416 $186,651 $186,651 - - $160,452 - -The Management Assoc. of Illinois (IL) 5 5 $164,532 $164,532 $131,188 $155,000 $202,643 - $63,606 $228,139 $228,139 $175,000 $181,817 $205,000 $286,030 $312,389
continued
Base Pay Variable Pay
(10) Top Sales ExecutiveCompensation Strategy: Salary + Commission
Generally reports to President or Executive V.P. level, may be called Vice President of Sales, Vice President of Sales and Marketing, Director of Sales, etc. Responsible for the overall management and direction of the sales functions and the entire range of sales planning and development, sales promotion and sales activities of the organizational unit. Formulates, recommends and implements policies and programs in the areas of forecasting, sales, pricing, marketing and product or service acceptance research, and related activities. May also have responsibility for marketing programs, customer relations or advertising.
Effective Date:September 2010
Total Compensation
National Data - Effective September 2010 5 © 2011 Employer Associations of America (EAA)

(10) Top Sales ExecutiveCompensation Strategy: Salary + Commission
Bonus Commission# of Orgs
# of Emp
Un-Wtd Avg
WtdAvg P25 Median P75
Wtd Annual Avg
Wtd Annual Avg
Un-Wtd Avg
WtdAvg P10 P25 Median P75 P90
Customer TypeIndustry 18 18 $117,922 $117,922 $91,528 $111,888 $138,032 - $44,019 $161,941 $161,941 $105,240 $114,641 $141,778 $194,500 $254,000Distributors/Wholesalers 7 7 $145,989 $145,989 $100,000 $131,700 $179,350 - $39,384 $185,373 $185,373 $126,120 $131,700 $160,452 $259,671 $312,389
IndustryNon-Durable Goods Manufacturing 5 5 $129,235 $129,235 $112,787 $131,700 $144,450 - $11,292 $140,527 $140,527 $100,782 $116,241 $134,700 $167,726 $175,000Durable Goods Manufacturing 12 12 $130,914 $130,914 $101,232 $117,039 $169,513 - $54,286 $185,200 $185,200 $106,865 $129,590 $155,838 $249,753 $305,672Wholesale and Retail Trade 5 5 $99,841 $99,841 $75,000 $100,000 $124,603 - $44,298 $144,140 $144,140 $111,830 $114,092 $132,276 $180,119 $188,633
Base Pay Variable Pay Total Compensation
National Data - Effective September 2010 6 © 2011 Employer Associations of America (EAA)

Bonus Commission# of Orgs
# of Emp
Un-Wtd Avg
WtdAvg P25 Median P75
Wtd Annual Avg
Wtd Annual Avg
Un-Wtd Avg
WtdAvg P10 P25 Median P75 P90
Total Responses 193 229 $146,978 $146,705 $115,000 $138,760 $172,117 $30,465 - $174,847 $177,170 $110,032 $131,720 $161,973 $206,670 $252,297
Org Sales Volume0.0-26.9 million 74 83 $125,420 $125,929 $105,000 $125,000 $140,000 $20,630 - $146,672 $146,558 $96,200 $116,000 $142,771 $167,535 $199,98727.0-99.9 million 72 83 $153,001 $151,811 $124,998 $150,000 $175,296 $42,404 - $187,695 $194,215 $121,730 $138,760 $176,800 $220,000 $272,444100.0 million+ 47 63 $171,695 $167,350 $127,500 $162,184 $190,550 $27,692 - $199,523 $195,043 $128,601 $139,500 $182,500 $238,000 $275,057
RegionNortheast 8 9 $165,496 $155,552 $108,499 $149,460 $221,500 $14,979 - $182,348 $170,531 $60,000 $108,499 $168,260 $242,500 $267,450Southeast 3 3 $132,802 $132,802 - $134,649 - $0 - $132,802 $132,802 - - $134,649 - -Great Lakes 147 175 $143,650 $144,210 $113,620 $138,549 $170,000 $27,262 - $170,939 $171,472 $109,600 $130,214 $160,000 $202,877 $246,551Central 4 5 $154,466 $159,433 - $171,600 - $34,241 - $177,000 $193,674 - - $176,800 - -Mountain 17 23 $166,836 $160,409 $121,000 $150,000 $194,037 $67,184 - $213,182 $227,593 $112,999 $135,225 $185,000 $240,000 $448,297Pacific 14 14 $148,125 $148,125 $104,929 $135,596 $182,250 $25,313 - $173,438 $173,438 $117,858 $130,355 $162,552 $234,600 $251,100
AssociationAmerican Society of Employers (MI) 16 17 $138,509 $136,621 $104,947 $124,998 $175,500 $6,965 - $145,035 $143,586 $92,320 $120,404 $124,998 $179,650 $203,739Cascade Employers Assoc. (OR) 3 3 $149,255 $149,255 - $139,050 - $16,867 - $166,122 $166,122 - - $139,050 - -Employers Assoc. NE (CT & MA) 3 3 $202,487 $202,487 - $208,000 - $15,267 - $217,753 $217,753 - - $235,000 - -Trusight (MN) - formerly EA 33 39 $149,252 $148,130 $116,323 $142,771 $180,000 $22,002 - $171,264 $170,132 $119,400 $133,339 $156,000 $195,101 $266,137Employers Assoc. W. Michigan (MI) 5 6 $140,702 $129,918 $84,000 $140,000 $173,131 $21,148 - $166,079 $151,066 $60,000 $84,000 $159,694 $216,256 $220,000Employers Resource Assoc. (OH) 27 29 $136,025 $135,065 $106,126 $134,649 $154,248 $21,958 - $156,681 $157,023 $93,460 $126,966 $147,900 $182,576 $221,000Employers Resource Council (OH) 12 13 $147,754 $147,731 $125,000 $141,984 $181,803 $43,991 - $191,359 $191,722 $115,400 $146,000 $201,532 $220,148 $291,577Mtn States Employers Council (CO) 11 15 $168,748 $162,361 $120,000 $156,048 $200,000 $96,304 - $233,625 $258,665 $118,180 $150,313 $200,763 $271,549 $590,792MRA - The Mgmt Assoc. (N. IL) 3 3 $189,667 $189,667 - $160,000 - $46,667 - $236,333 $236,333 - - $208,000 - -MRA - The Mgmt Assoc. (WI) 55 74 $144,161 $147,006 $115,000 $140,073 $170,400 $30,265 - $174,569 $177,271 $114,310 $133,942 $166,268 $211,357 $246,649The Employers Council (UT) 5 7 $170,996 $161,283 $121,000 $132,000 $165,000 $14,382 - $185,844 $175,665 $105,000 $134,452 $146,200 $185,000 $341,280The Management Assoc. of Illinois (IL) 9 9 $116,608 $116,608 $89,300 $110,000 $135,883 $34,492 - $151,101 $151,101 $78,000 $112,281 $143,000 $179,211 $275,094
continued
(10) Top Sales ExecutiveCompensation Strategy: Salary + Bonus
Generally reports to President or Executive V.P. level, may be called Vice President of Sales, Vice President of Sales and Marketing, Director of Sales, etc. Responsible for the overall management and direction of the sales functions and the entire range of sales planning and development, sales promotion and sales activities of the organizational unit. Formulates, recommends and implements policies and programs in the areas of forecasting, sales, pricing, marketing and product or service acceptance research, and related activities. May also have responsibility for marketing programs, customer relations or advertising.
Effective Date:September 2010
Total CompensationBase Pay Variable Pay
National Data - Effective September 2010 7 © 2011 Employer Associations of America (EAA)

(10) Top Sales ExecutiveCompensation Strategy: Salary + Bonus
Bonus Commission# of Orgs
# of Emp
Un-Wtd Avg
WtdAvg P25 Median P75
Wtd Annual Avg
Wtd Annual Avg
Un-Wtd Avg
WtdAvg P10 P25 Median P75 P90
Customer TypeIndustry 117 134 $144,481 $143,454 $113,175 $136,474 $170,000 $33,619 - $174,232 $177,073 $109,500 $126,514 $161,538 $203,408 $266,794Distributors/Wholesalers 47 55 $153,526 $151,722 $120,000 $139,050 $176,000 $25,818 - $177,809 $177,540 $108,873 $135,000 $164,000 $211,142 $260,664Retailers 23 25 $151,220 $151,763 $117,815 $144,222 $177,500 $29,268 - $180,897 $181,031 $122,404 $132,229 $156,000 $216,362 $259,998Consumers 11 15 $138,625 $148,925 $110,000 $165,000 $175,000 $21,318 - $161,496 $170,243 $77,041 $133,339 $179,000 $200,001 $245,779
IndustryConstruction 5 7 $82,800 $88,857 $80,000 $90,002 $96,000 $149,624 - $156,091 $238,481 $70,000 $80,000 $96,000 $479,225 $758,142Non-Durable Goods Manufacturing 44 53 $152,937 $154,155 $122,259 $142,836 $175,000 $34,975 - $185,827 $189,130 $116,671 $133,585 $175,000 $238,245 $277,644Durable Goods Manufacturing 81 100 $139,420 $138,880 $113,800 $134,685 $159,656 $19,353 - $158,652 $158,233 $109,100 $126,201 $146,100 $189,080 $221,000Wholesale and Retail Trade 32 35 $159,377 $161,792 $120,000 $150,000 $187,500 $24,007 - $184,179 $185,799 $117,295 $135,000 $168,549 $208,291 $288,400Transportation and Warehousing 4 4 $153,892 $153,892 - $142,500 - $73,258 - $227,150 $227,150 - - $233,752 - -Information 4 4 $182,750 $182,750 - $170,000 - $98,125 - $280,875 $280,875 - - $245,500 - -Financial Activities 6 7 $144,475 $149,944 $110,000 $161,513 $200,000 $30,860 - $172,145 $180,804 $57,600 $133,339 $181,722 $240,000 $267,450Professional and Business Services 4 4 $153,284 $153,284 - $165,068 - $10,516 - $163,799 $163,799 - - $183,218 - -Education and Health Services 3 4 $130,472 $124,907 - $124,588 - $26,335 - $154,752 $151,243 - - $154,359 - -Other Services 8 9 $160,064 $156,835 $131,000 $150,000 $189,926 $26,882 - $189,826 $183,717 $96,500 $134,839 $205,000 $210,508 $271,610
Base Pay Variable Pay Total Compensation
National Data - Effective September 2010 8 © 2011 Employer Associations of America (EAA)

Bonus Commission# of Orgs
# of Emp
Un-Wtd Avg
WtdAvg P25 Median P75
Wtd Annual Avg
Wtd Annual Avg
Un-Wtd Avg
WtdAvg P10 P25 Median P75 P90
Total Responses 39 43 $133,724 $132,976 $99,476 $120,000 $149,500 $17,335 $59,621 $210,457 $209,932 $110,477 $135,134 $173,500 $227,993 $359,017
Org Sales Volume0.0-26.9 million 23 26 $120,561 $120,294 $94,000 $118,335 $126,250 $20,673 $50,813 $193,808 $191,780 $103,609 $130,848 $170,675 $223,854 $284,28227.0-99.9 million 15 16 $140,488 $140,956 $100,800 $127,378 $173,125 $11,120 $63,597 $210,683 $215,673 $115,466 $141,156 $195,878 $319,109 $362,071
RegionGreat Lakes 31 35 $126,889 $126,751 $99,476 $117,920 $145,000 $19,226 $60,957 $207,208 $206,934 $111,828 $131,995 $170,000 $239,936 $358,116Mountain 4 4 $185,000 $185,000 - $157,500 - $10,626 $80,250 $275,876 $275,876 - - $182,503 - -
AssociationAmerican Society of Employers (MI) 3 3 $148,250 $148,250 - $125,000 - $10,667 $5,204 $164,121 $164,121 - - $171,350 - -Trusight (MN) - formerly EA 9 10 $116,397 $115,757 $99,300 $115,000 $121,528 $6,714 $49,136 $172,341 $171,607 $93,741 $130,848 $144,801 $193,538 $337,365Employers Resource Assoc. (OH) 6 7 $120,183 $124,049 $105,415 $123,431 $145,000 $9,478 $79,207 $212,218 $212,735 $164,302 $203,677 $223,153 $227,993 $239,936Mtn States Employers Council (CO) 4 4 $185,000 $185,000 - $157,500 - $10,626 $80,250 $275,876 $275,876 - - $182,503 - -MRA - The Mgmt Assoc. (WI) 9 10 $152,815 $152,331 $114,240 $145,662 $181,875 $17,311 $67,410 $231,110 $237,052 $120,257 $131,993 $207,772 $357,439 $364,572The Management Assoc. of Illinois (IL) 4 5 $130,119 $123,595 - $99,476 - $1,470 $37,320 $166,010 $162,385 - - $152,384 - -
continued
Base Pay Variable Pay
(10) Top Sales ExecutiveCompensation Strategy: Salary + Commission + Bonus
Generally reports to President or Executive V.P. level, may be called Vice President of Sales, Vice President of Sales and Marketing, Director of Sales, etc. Responsible for the overall management and direction of the sales functions and the entire range of sales planning and development, sales promotion and sales activities of the organizational unit. Formulates, recommends and implements policies and programs in the areas of forecasting, sales, pricing, marketing and product or service acceptance research, and related activities. May also have responsibility for marketing programs, customer relations or advertising.
Effective Date:September 2010
Total Compensation
National Data - Effective September 2010 9 © 2011 Employer Associations of America (EAA)

(10) Top Sales ExecutiveCompensation Strategy: Salary + Commission + Bonus
Bonus Commission# of Orgs
# of Emp
Un-Wtd Avg
WtdAvg P25 Median P75
Wtd Annual Avg
Wtd Annual Avg
Un-Wtd Avg
WtdAvg P10 P25 Median P75 P90
Customer TypeIndustry 30 33 $133,050 $131,704 $97,238 $117,920 $147,250 $19,994 $62,225 $217,691 $213,923 $110,477 $133,565 $171,350 $226,976 $361,518Distributors/Wholesalers 8 9 $136,718 $137,968 $100,200 $125,000 $162,307 $8,626 $52,528 $187,697 $199,122 $90,000 $131,751 $173,500 $260,077 $360,820
IndustryNon-Durable Goods Manufacturing 8 10 $126,746 $127,194 $93,375 $125,662 $165,335 $34,698 $95,921 $265,325 $257,812 $134,034 $158,096 $179,753 $361,863 $634,376Durable Goods Manufacturing 14 14 $115,259 $115,259 $92,125 $104,308 $119,155 $7,222 $47,254 $169,735 $169,735 $102,864 $118,871 $156,401 $229,452 $260,077Wholesale and Retail Trade 4 4 $129,863 $129,863 - $113,600 - $12,933 $9,375 $152,171 $152,171 - - $158,217 - -Professional and Business Services 4 4 $150,625 $150,625 - $146,250 - $6,250 $72,003 $228,878 $228,878 - - $225,625 - -Other Services 4 4 $154,608 $154,608 - $124,216 - $36,453 $23,737 $214,798 $214,798 - - $187,737 - -
Base Pay Variable Pay Total Compensation
National Data - Effective September 2010 10 © 2011 Employer Associations of America (EAA)

Bonus Commission# of Orgs
# of Emp
Un-Wtd Avg
WtdAvg P25 Median P75
Wtd Annual Avg
Wtd Annual Avg
Un-Wtd Avg
WtdAvg P10 P25 Median P75 P90
Total Responses 56 62 - - - - - - - $120,649 $118,750 $81,708 $94,095 $107,147 $133,529 $178,859
Org Sales Volume0.0-26.9 million 25 29 - - - - - - - $119,467 $115,850 $74,105 $86,185 $102,538 $142,500 $182,03527.0-99.9 million 18 19 - - - - - - - $118,875 $119,933 $88,826 $99,787 $114,653 $130,718 $180,000100.0 million+ 13 14 - - - - - - - $125,376 $123,153 $85,142 $94,307 $114,772 $139,522 $207,660
RegionNortheast 4 4 - - - - - - - $106,747 $106,747 - - $103,082 - -Great Lakes 34 40 - - - - - - - $120,180 $117,308 $78,664 $91,720 $103,375 $135,454 $174,706Mountain 6 6 - - - - - - - $124,564 $124,564 $89,523 $97,221 $110,277 $160,529 $185,218Pacific 10 10 - - - - - - - $128,828 $128,828 $53,650 $95,945 $121,579 $150,509 $240,819
AssociationAmerican Society of Employers (MI) 3 3 - - - - - - - $120,087 $120,087 - - $116,000 - -Cascade Employers Assoc. (OR) 5 5 - - - - - - - $113,136 $113,136 $86,500 $92,797 $108,000 $136,043 $140,000Trusight (MN) - formerly EA 5 5 - - - - - - - $135,147 $135,147 $80,179 $85,549 $104,211 $200,212 $239,125Employers Resource Assoc. (OH) 8 8 - - - - - - - $111,229 $111,229 $74,105 $89,881 $108,158 $128,370 $160,872Employers Resource Council (OH) 6 9 - - - - - - - $106,056 $101,740 $75,803 $81,886 $99,811 $101,721 $176,196Mtn States Employers Council (CO) 5 5 - - - - - - - $129,519 $129,519 $89,523 $97,712 $114,653 $168,759 $185,218MRA - The Mgmt Assoc. (WI) 13 16 - - - - - - - $122,947 $120,324 $77,838 $94,186 $109,556 $143,174 $192,000
continued
Base Pay Variable Pay
(20) International Sales ManagerCombined Compensation Type
Reports to top sales executive or directly to President or Executive V.P., may be called International Sales Manager, V.P. of International Sales, etc. Responsible for establishing and maintaining sales outside of the United States. Establishes intercontinental dealer-sales organizations, distribution channels and service arrangements. Formulates sales objectives, policies and advertising programs designed to achieve maximum sales volume and profit goals. Establishes an effective sales organization and develops programs to promote international sales and the company's business image. May prepare sales forecasts and operating budget proposals;approve conditions of sales when not in concert with regularly applied policies.
Effective Date:September 2010
Total Compensation
National Data - Effective September 2010 11 © 2011 Employer Associations of America (EAA)

(20) International Sales ManagerCombined Compensation Type
Bonus Commission# of Orgs
# of Emp
Un-Wtd Avg
WtdAvg P25 Median P75
Wtd Annual Avg
Wtd Annual Avg
Un-Wtd Avg
WtdAvg P10 P25 Median P75 P90
Customer TypeIndustry 32 37 - - - - - - - $116,483 $114,579 $77,957 $95,299 $106,294 $131,402 $160,840Distributors/Wholesalers 22 23 - - - - - - - $127,516 $126,069 $82,217 $90,918 $111,072 $176,196 $206,087
IndustryNon-Durable Goods Manufacturing 9 9 - - - - - - - $134,643 $134,643 $89,523 $105,290 $113,544 $162,609 $239,125Durable Goods Manufacturing 36 40 - - - - - - - $115,121 $113,710 $76,072 $89,146 $101,731 $131,246 $174,664Wholesale and Retail Trade 6 6 - - - - - - - $137,906 $137,906 $85,275 $94,819 $131,429 $175,975 $220,000
Base Pay Variable Pay Total Compensation
National Data - Effective September 2010 12 © 2011 Employer Associations of America (EAA)

Bonus Commission# of Orgs
# of Emp
Un-Wtd Avg
WtdAvg P25 Median P75
Wtd Annual Avg
Wtd Annual Avg
Un-Wtd Avg
WtdAvg P10 P25 Median P75 P90
Total Responses 7 7 $144,889 $144,889 $105,900 $127,300 $180,000 - - $144,889 $144,889 $88,826 $105,900 $127,300 $180,000 $220,000
Org Sales Volume27.0-99.9 million 3 3 $132,042 $132,042 - $127,300 - - - $132,042 $132,042 - - $127,300 - -
RegionGreat Lakes 6 6 $151,387 $151,387 $109,207 $151,748 $190,000 - - $151,387 $151,387 $88,826 $109,207 $151,748 $190,000 $220,000
AssociationMRA - The Mgmt Assoc. (WI) 3 3 $162,942 $162,942 - $180,000 - - - $162,942 $162,942 - - $180,000 - -
continued
(20) International Sales ManagerCompensation Strategy: Straight Salary
Reports to top sales executive or directly to President or Executive V.P., may be called International Sales Manager, V.P. of International Sales, etc. Responsible for establishing and maintaining sales outside of the United States. Establishes intercontinental dealer-sales organizations, distribution channels and service arrangements. Formulates sales objectives, policies and advertising programs designed to achieve maximum sales volume and profit goals. Establishes an effective sales organization and develops programs to promote international sales and the company's business image. May prepare sales forecasts and operating budget proposals;approve conditions of sales when not in concert with regularly applied policies.
Effective Date:September 2010
Total CompensationBase Pay Variable Pay
National Data - Effective September 2010 13 © 2011 Employer Associations of America (EAA)

(20) International Sales ManagerCompensation Strategy: Straight Salary
Bonus Commission# of Orgs
# of Emp
Un-Wtd Avg
WtdAvg P25 Median P75
Wtd Annual Avg
Wtd Annual Avg
Un-Wtd Avg
WtdAvg P10 P25 Median P75 P90
Customer TypeIndustry 3 3 $116,400 $116,400 - $116,000 - - - $116,400 $116,400 - - $116,000 - -Distributors/Wholesalers 4 4 $166,256 $166,256 - $178,098 - - - $166,256 $166,256 - - $178,098 - -
IndustryDurable Goods Manufacturing 5 5 $137,664 $137,664 $102,413 $127,300 $178,098 - - $137,664 $137,664 $88,826 $102,413 $127,300 $178,098 $180,000
Base Pay Variable Pay Total Compensation
National Data - Effective September 2010 14 © 2011 Employer Associations of America (EAA)

Bonus Commission# of Orgs
# of Emp
Un-Wtd Avg
WtdAvg P25 Median P75
Wtd Annual Avg
Wtd Annual Avg
Un-Wtd Avg
WtdAvg P10 P25 Median P75 P90
Total Responses 11 12 $82,327 $80,883 $66,477 $74,988 $85,591 - $29,436 $113,334 $110,319 $76,611 $89,881 $105,253 $125,209 $170,925
Org Sales Volume0.0-26.9 million 7 8 $82,195 $80,045 $65,000 $74,988 $83,524 - $30,660 $115,499 $110,705 $75,803 $82,372 $100,144 $136,256 $182,03527.0-99.9 million 4 4 $82,559 $82,559 - $79,625 - - $26,987 $109,546 $109,546 - - $110,474 - -
RegionGreat Lakes 7 8 $80,583 $78,635 $65,000 $72,079 $82,975 - $25,998 $108,559 $104,633 $75,803 $80,999 $105,253 $124,051 $145,000
AssociationEmployers Resource Assoc. (OH) 5 5 $72,236 $72,236 $60,465 $73,250 $83,500 - $33,274 $105,510 $105,510 $88,508 $91,254 $106,294 $119,375 $128,727
continued
(20) International Sales ManagerCompensation Strategy: Salary + Commission
Reports to top sales executive or directly to President or Executive V.P., may be called International Sales Manager, V.P. of International Sales, etc. Responsible for establishing and maintaining sales outside of the United States. Establishes intercontinental dealer-sales organizations, distribution channels and service arrangements. Formulates sales objectives, policies and advertising programs designed to achieve maximum sales volume and profit goals. Establishes an effective sales organization and develops programs to promote international sales and the company's business image. May prepare sales forecasts and operating budget proposals;approve conditions of sales when not in concert with regularly applied policies.
Effective Date:September 2010
Total CompensationBase Pay Variable Pay
National Data - Effective September 2010 15 © 2011 Employer Associations of America (EAA)

(20) International Sales ManagerCompensation Strategy: Salary + Commission
Bonus Commission# of Orgs
# of Emp
Un-Wtd Avg
WtdAvg P25 Median P75
Wtd Annual Avg
Wtd Annual Avg
Un-Wtd Avg
WtdAvg P10 P25 Median P75 P90
Customer TypeIndustry 7 8 $81,690 $79,604 $65,000 $72,404 $84,750 - $20,688 $103,598 $100,292 $75,803 $80,999 $99,106 $109,090 $145,000Distributors/Wholesalers 4 4 $83,442 $83,442 - $80,221 - - $46,931 $130,373 $130,373 - - $121,690 - -
IndustryDurable Goods Manufacturing 10 11 $85,558 $83,689 $70,908 $76,076 $86,000 - $26,657 $113,665 $110,346 $76,342 $88,508 $104,211 $128,727 $174,628
Base Pay Variable Pay Total Compensation
National Data - Effective September 2010 16 © 2011 Employer Associations of America (EAA)

Bonus Commission# of Orgs
# of Emp
Un-Wtd Avg
WtdAvg P25 Median P75
Wtd Annual Avg
Wtd Annual Avg
Un-Wtd Avg
WtdAvg P10 P25 Median P75 P90
Total Responses 26 28 $99,906 $99,213 $83,704 $91,000 $117,224 $14,183 - $113,149 $113,396 $78,071 $91,720 $105,000 $132,127 $160,879
Org Sales Volume0.0-26.9 million 10 10 $88,001 $88,001 $55,775 $89,118 $113,304 $15,786 - $103,787 $103,787 $50,910 $78,730 $104,731 $134,105 $159,17027.0-99.9 million 6 7 $92,646 $92,689 $84,000 $92,000 $97,689 $22,067 - $110,720 $114,756 $90,918 $99,787 $102,000 $132,085 $160,832100.0 million+ 10 11 $116,166 $113,558 $87,360 $99,093 $137,696 $7,710 - $123,970 $121,267 $82,164 $94,126 $113,544 $137,696 $220,300
RegionGreat Lakes 15 17 $106,956 $104,986 $85,680 $92,000 $128,073 $13,235 - $118,435 $118,221 $75,962 $92,522 $102,000 $141,348 $176,865Pacific 7 7 $90,995 $90,995 $50,000 $99,093 $120,000 $19,346 - $110,341 $110,341 $50,000 $99,093 $111,072 $132,140 $140,000
AssociationCascade Employers Assoc. (OR) 4 4 $108,473 $108,473 - $109,547 - $11,321 - $119,795 $119,795 - - $120,043 - -Trusight (MN) - formerly EA 4 4 $129,076 $129,076 - $118,500 - $13,805 - $142,880 $142,880 - - $126,109 - -MRA - The Mgmt Assoc. (WI) 8 10 $102,497 $100,040 $87,527 $90,356 $123,262 $13,500 - $112,772 $113,540 $62,598 $94,307 $109,556 $139,522 $159,249
continued
(20) International Sales ManagerCompensation Strategy: Salary + Bonus
Reports to top sales executive or directly to President or Executive V.P., may be called International Sales Manager, V.P. of International Sales, etc. Responsible for establishing and maintaining sales outside of the United States. Establishes intercontinental dealer-sales organizations, distribution channels and service arrangements. Formulates sales objectives, policies and advertising programs designed to achieve maximum sales volume and profit goals. Establishes an effective sales organization and develops programs to promote international sales and the company's business image. May prepare sales forecasts and operating budget proposals;approve conditions of sales when not in concert with regularly applied policies.
Effective Date:September 2010
Total CompensationBase Pay Variable Pay
National Data - Effective September 2010 17 © 2011 Employer Associations of America (EAA)

(20) International Sales ManagerCompensation Strategy: Salary + Bonus
Bonus Commission# of Orgs
# of Emp
Un-Wtd Avg
WtdAvg P25 Median P75
Wtd Annual Avg
Wtd Annual Avg
Un-Wtd Avg
WtdAvg P10 P25 Median P75 P90
Customer TypeIndustry 12 13 $112,572 $111,063 $89,118 $97,500 $134,900 $17,483 - $127,677 $128,545 $71,266 $101,010 $117,112 $152,916 $207,995Distributors/Wholesalers 12 13 $88,222 $88,164 $79,090 $87,360 $105,083 $10,337 - $98,856 $98,501 $62,072 $87,690 $94,367 $112,308 $135,474
IndustryNon-Durable Goods Manufacturing 6 6 $122,200 $122,200 $91,799 $115,997 $139,781 $12,210 - $134,409 $134,409 $89,523 $97,799 $118,626 $164,781 $239,125Durable Goods Manufacturing 14 16 $88,934 $89,094 $81,036 $87,896 $96,267 $12,416 - $99,353 $101,510 $56,367 $90,308 $99,440 $114,834 $149,750Wholesale and Retail Trade 3 3 $91,000 $91,000 - $78,000 - $35,238 - $126,238 $126,238 - - $132,140 - -
Base Pay Variable Pay Total Compensation
National Data - Effective September 2010 18 © 2011 Employer Associations of America (EAA)

Bonus Commission# of Orgs
# of Emp
Un-Wtd Avg
WtdAvg P25 Median P75
Wtd Annual Avg
Wtd Annual Avg
Un-Wtd Avg
WtdAvg P10 P25 Median P75 P90
Total Responses 13 15 $84,189 $84,086 $68,105 $75,234 $95,400 $3,704 $35,501 $126,708 $123,291 $81,164 $96,598 $102,538 $152,300 $210,071
Org Sales Volume0.0-26.9 million 7 9 $70,688 $73,518 $66,404 $70,000 $84,983 $2,639 $47,205 $129,726 $123,361 $74,105 $86,185 $100,904 $156,586 $247,35027.0-99.9 million 5 5 $105,927 $105,927 $85,017 $101,988 $128,807 $5,961 $16,336 $128,224 $128,224 $96,598 $103,343 $118,498 $157,968 $185,218
RegionGreat Lakes 7 9 $78,333 $79,464 $69,053 $75,234 $91,883 $3,037 $21,633 $105,004 $104,133 $74,105 $91,234 $99,811 $110,518 $160,872
AssociationMRA - The Mgmt Assoc. (WI) 3 3 $79,281 $79,281 - $75,234 - $3,827 $17,214 $100,322 $100,322 - - $96,598 - -
continued
Base Pay Variable Pay
(20) International Sales ManagerCompensation Strategy: Salary + Commission + Bonus
Reports to top sales executive or directly to President or Executive V.P., may be called International Sales Manager, V.P. of International Sales, etc. Responsible for establishing and maintaining sales outside of the United States. Establishes intercontinental dealer-sales organizations, distribution channels and service arrangements. Formulates sales objectives, policies and advertising programs designed to achieve maximum sales volume and profit goals. Establishes an effective sales organization and develops programs to promote international sales and the company's business image. May prepare sales forecasts and operating budget proposals;approve conditions of sales when not in concert with regularly applied policies.
Effective Date:September 2010
Total Compensation
National Data - Effective September 2010 19 © 2011 Employer Associations of America (EAA)

(20) International Sales ManagerCompensation Strategy: Salary + Commission + Bonus
Bonus Commission# of Orgs
# of Emp
Un-Wtd Avg
WtdAvg P25 Median P75
Wtd Annual Avg
Wtd Annual Avg
Un-Wtd Avg
WtdAvg P10 P25 Median P75 P90
Customer TypeIndustry 11 13 $83,276 $83,298 $69,053 $75,234 $95,100 $2,735 $22,952 $110,421 $108,985 $78,811 $91,549 $100,904 $124,608 $157,443
IndustryDurable Goods Manufacturing 8 8 $72,679 $72,679 $65,702 $69,053 $85,533 $2,571 $52,512 $127,762 $127,762 $74,105 $86,028 $107,548 $158,729 $247,350
Variable Pay Total CompensationBase Pay
National Data - Effective September 2010 20 © 2011 Employer Associations of America (EAA)

Bonus Commission# of Orgs
# of Emp
Un-Wtd Avg
WtdAvg P25 Median P75
Wtd Annual Avg
Wtd Annual Avg
Un-Wtd Avg
WtdAvg P10 P25 Median P75 P90
Total Responses 181 284 - - - - - - - $133,627 $138,057 $87,950 $101,888 $126,222 $160,000 $201,331
Org Sales Volume0.0-26.9 million 66 88 - - - - - - - $117,237 $123,628 $79,309 $90,194 $113,954 $147,782 $180,45027.0-99.9 million 64 92 - - - - - - - $134,706 $137,952 $93,371 $109,993 $127,723 $159,539 $181,685100.0 million+ 51 104 - - - - - - - $153,482 $150,359 $95,588 $114,233 $139,750 $179,604 $227,931
RegionNortheast 10 15 - - - - - - - $157,033 $149,682 $90,033 $117,731 $150,412 $171,626 $228,395Southeast 9 10 - - - - - - - $137,722 $138,038 $88,714 $101,531 $135,298 $171,255 $197,978Great Lakes 127 208 - - - - - - - $128,538 $133,139 $87,800 $100,739 $125,001 $153,750 $185,969Central 5 6 - - - - - - - $125,036 $123,127 $101,850 $108,930 $125,659 $131,818 $147,825Mountain 16 27 - - - - - - - $164,891 $177,819 $83,460 $120,000 $163,086 $215,779 $301,546Pacific 14 18 - - - - - - - $127,776 $130,549 $81,599 $88,879 $117,864 $143,900 $244,928
AssociationAmerican Society of Employers (MI) 16 22 - - - - - - - $126,773 $123,972 $87,612 $96,621 $118,525 $143,528 $164,851Cascade Employers Assoc. (OR) 3 4 - - - - - - - $130,407 $143,353 - - $119,215 - -Trusight (MN) - formerly EA 26 46 - - - - - - - $120,458 $122,513 $82,955 $99,707 $111,722 $126,477 $178,566Employers Resource Assoc. (OH) 26 40 - - - - - - - $129,896 $140,995 $88,676 $105,177 $139,624 $174,157 $190,275Employers Resource Council (OH) 6 9 - - - - - - - $125,721 $130,433 $90,776 $119,764 $128,446 $143,089 $172,378Mtn States Employers Council (CO) 11 19 - - - - - - - $153,335 $172,844 $87,900 $120,000 $169,000 $214,240 $284,597MRA - The Mgmt Assoc. (N. IL) 5 8 - - - - - - - $137,221 $126,390 $83,976 $91,864 $137,585 $156,375 $160,000MRA - The Mgmt Assoc. (WI) 58 98 - - - - - - - $135,672 $139,718 $90,773 $112,337 $135,000 $158,150 $186,980The Employers Council (UT) 4 7 - - - - - - - $198,642 $194,295 - - $163,086 - -The Management Assoc. of Illinois (IL) 11 13 - - - - - - - $134,017 $135,121 $79,213 $99,000 $126,482 $171,585 $223,563
continued
Base Pay Variable Pay
(30) General Sales ManagerCombined Compensation Type
Reports to top sales executive, may be called General Sales Manager, Vice President of Sales, etc. Responsible for management and direction of field sales, sales manager and/or sales supervisory personnel. Generally provides direction, counsel, and guidance for plans in marketing, advertising, sales promotion, sales training, etc. Implements sales policies and ensures communication of new products or services, variations and changes, and sales promotion and activities of a division or unit. May be responsible for creating and implementing sales / marketing programs.
Effective Date:September 2010
Total Compensation
National Data - Effective September 2010 21 © 2011 Employer Associations of America (EAA)

(30) General Sales ManagerCombined Compensation Type
Bonus Commission# of Orgs
# of Emp
Un-Wtd Avg
WtdAvg P25 Median P75
Wtd Annual Avg
Wtd Annual Avg
Un-Wtd Avg
WtdAvg P10 P25 Median P75 P90
Customer TypeIndustry 120 171 - - - - - - - $135,527 $138,528 $90,199 $102,000 $126,482 $158,158 $215,409Distributors/Wholesalers 32 47 - - - - - - - $133,248 $137,474 $81,640 $98,200 $120,750 $154,000 $211,475Retailers 25 36 - - - - - - - $122,661 $130,435 $79,251 $94,970 $125,983 $167,522 $185,969Consumers 14 30 - - - - - - - $134,715 $145,436 $90,399 $110,366 $141,352 $179,571 $194,852
IndustryConstruction 5 8 - - - - - - - $146,658 $177,859 $98,000 $102,498 $123,504 $266,931 $369,341Non-Durable Goods Manufacturing 31 47 - - - - - - - $148,901 $158,377 $94,461 $122,700 $145,142 $181,741 $241,614Durable Goods Manufacturing 81 131 - - - - - - - $124,232 $127,028 $85,840 $100,485 $118,800 $150,000 $175,475Wholesale and Retail Trade 29 47 - - - - - - - $126,226 $132,475 $84,667 $95,853 $139,000 $158,000 $191,105Information 6 8 - - - - - - - $170,854 $161,786 $91,373 $121,826 $143,583 $217,929 $250,000Financial Activities 7 14 - - - - - - - $150,945 $153,365 $85,000 $108,331 $133,975 $190,122 $268,717Professional and Business Services 6 7 - - - - - - - $141,841 $145,326 $72,750 $88,212 $125,000 $207,471 $243,848Other Services 9 14 - - - - - - - $141,333 $142,045 $86,993 $107,613 $134,334 $170,464 $221,284
Base Pay Variable Pay Total Compensation
National Data - Effective September 2010 22 © 2011 Employer Associations of America (EAA)

Bonus Commission# of Orgs
# of Emp
Un-Wtd Avg
WtdAvg P25 Median P75
Wtd Annual Avg
Wtd Annual Avg
Un-Wtd Avg
WtdAvg P10 P25 Median P75 P90
Total Responses 36 43 $102,804 $105,422 $89,200 $100,000 $126,000 - - $102,804 $105,422 $68,092 $89,200 $100,000 $126,000 $141,600
Org Sales Volume0.0-26.9 million 18 20 $90,026 $93,773 $70,512 $93,158 $103,871 - - $90,026 $93,773 $65,730 $70,512 $93,158 $103,871 $119,50027.0-99.9 million 15 18 $118,152 $120,346 $100,000 $126,300 $137,546 - - $118,152 $120,346 $88,111 $100,000 $126,300 $137,546 $151,332100.0 million+ 3 5 $102,731 $98,292 - $94,676 - - - $102,731 $98,292 - - $94,676 - -
RegionGreat Lakes 31 37 $100,239 $102,690 $89,200 $100,000 $120,991 - - $100,239 $102,690 $69,374 $89,200 $100,000 $120,991 $135,040
AssociationAmerican Society of Employers (MI) 3 4 $110,933 $115,775 - $115,800 - - - $110,933 $115,775 - - $115,800 - -Trusight (MN) - formerly EA 9 13 $107,787 $107,069 $89,600 $100,485 $123,050 - - $107,787 $107,069 $83,703 $89,600 $100,485 $123,050 $140,020Employers Resource Assoc. (OH) 9 11 $122,113 $125,374 $100,000 $127,000 $143,200 - - $122,113 $125,374 $73,172 $100,000 $127,000 $143,200 $179,004MRA - The Mgmt Assoc. (WI) 8 8 $82,342 $82,342 $66,203 $81,652 $93,915 - - $82,342 $82,342 $65,000 $66,203 $81,652 $93,915 $110,000
continued
(30) General Sales ManagerCompensation Strategy: Straight Salary
Reports to top sales executive, may be called General Sales Manager, Vice President of Sales, etc. Responsible for management and direction of field sales, sales manager and/or sales supervisory personnel. Generally provides direction, counsel, and guidance for plans in marketing, advertising, sales promotion, sales training, etc. Implements sales policies and ensures communication of new products or services, variations and changes, and sales promotion and activities of a division or unit. May be responsible for creating and implementing sales / marketing programs.
Effective Date:September 2010
Total CompensationBase Pay Variable Pay
National Data - Effective September 2010 23 © 2011 Employer Associations of America (EAA)

(30) General Sales ManagerCompensation Strategy: Straight Salary
Bonus Commission# of Orgs
# of Emp
Un-Wtd Avg
WtdAvg P25 Median P75
Wtd Annual Avg
Wtd Annual Avg
Un-Wtd Avg
WtdAvg P10 P25 Median P75 P90
Customer TypeIndustry 26 29 $103,371 $105,967 $91,040 $100,006 $126,300 - - $103,371 $105,967 $66,810 $91,040 $100,006 $126,300 $143,200Distributors/Wholesalers 6 8 $99,302 $101,070 $82,329 $90,958 $125,275 - - $99,302 $101,070 $71,107 $82,329 $90,958 $125,275 $139,200Retailers 4 5 $105,390 $112,312 - $100,000 - - - $105,390 $112,312 - - $100,000 - -
IndustryNon-Durable Goods Manufacturing 10 12 $115,268 $118,027 $93,869 $123,050 $134,496 - - $115,268 $118,027 $76,826 $93,869 $123,050 $134,496 $165,474Durable Goods Manufacturing 16 17 $90,615 $92,949 $71,554 $90,776 $100,243 - - $90,615 $92,949 $65,800 $71,554 $90,776 $100,243 $136,940Wholesale and Retail Trade 5 8 $113,544 $108,249 $91,025 $107,503 $120,162 - - $113,544 $108,249 $89,200 $91,025 $107,503 $120,162 $139,200
Base Pay Variable Pay Total Compensation
National Data - Effective September 2010 24 © 2011 Employer Associations of America (EAA)

Bonus Commission# of Orgs
# of Emp
Un-Wtd Avg
WtdAvg P25 Median P75
Wtd Annual Avg
Wtd Annual Avg
Un-Wtd Avg
WtdAvg P10 P25 Median P75 P90
Total Responses 26 35 $109,168 $108,818 $81,633 $105,000 $131,164 - $43,308 $155,523 $152,126 $98,351 $118,627 $145,142 $176,866 $244,947
Org Sales Volume0.0-26.9 million 11 12 $88,670 $92,114 $66,990 $97,500 $113,747 - $52,543 $143,146 $144,657 $93,525 $104,751 $146,608 $168,364 $231,06427.0-99.9 million 7 10 $120,404 $119,279 $87,376 $122,500 $138,750 - $34,396 $153,470 $153,674 $117,633 $132,500 $154,056 $168,850 $204,411100.0 million+ 8 13 $127,522 $116,191 $95,001 $113,280 $135,582 - $41,639 $174,338 $157,831 $95,615 $112,039 $131,000 $218,224 $251,075
RegionGreat Lakes 22 31 $104,962 $105,788 $81,633 $102,000 $125,000 - $40,982 $148,594 $146,771 $98,157 $118,627 $144,691 $166,178 $204,282Pacific 3 3 $152,287 $152,287 - $166,860 - - $72,515 $224,802 $224,802 - - $244,922 - -
AssociationTrusight (MN) - formerly EA 3 5 $113,208 $112,517 - $116,663 - - $44,502 $155,039 $157,019 - - $145,142 - -MRA - The Mgmt Assoc. (WI) 12 17 $104,969 $109,044 $100,000 $113,280 $127,733 - $45,079 $155,095 $154,123 $110,333 $121,200 $148,073 $175,675 $251,843The Management Assoc. of Illinois (IL) 3 3 $127,055 $127,055 - $131,164 - - $48,885 $175,940 $175,940 - - $191,525 - -
continued
Base Pay Variable Pay
(30) General Sales ManagerCompensation Strategy: Salary + Commission
Reports to top sales executive, may be called General Sales Manager, Vice President of Sales, etc. Responsible for management and direction of field sales, sales manager and/or sales supervisory personnel. Generally provides direction, counsel, and guidance for plans in marketing, advertising, sales promotion, sales training, etc. Implements sales policies and ensures communication of new products or services, variations and changes, and sales promotion and activities of a division or unit. May be responsible for creating and implementing sales / marketing programs.
Effective Date:September 2010
Total Compensation
National Data - Effective September 2010 25 © 2011 Employer Associations of America (EAA)

(30) General Sales ManagerCompensation Strategy: Salary + Commission
Bonus Commission# of Orgs
# of Emp
Un-Wtd Avg
WtdAvg P25 Median P75
Wtd Annual Avg
Wtd Annual Avg
Un-Wtd Avg
WtdAvg P10 P25 Median P75 P90
Customer TypeIndustry 17 22 $101,888 $105,417 $81,475 $109,140 $126,541 - $41,183 $148,566 $146,600 $99,019 $118,304 $142,997 $168,850 $202,688Distributors/Wholesalers 4 4 $130,754 $130,754 - $130,930 - - $52,378 $183,131 $183,131 - - $184,457 - -Retailers 3 4 $135,554 $134,166 - $130,000 - - $22,759 $155,474 $156,925 - - $154,037 - -
IndustryNon-Durable Goods Manufacturing 4 5 $121,416 $122,533 - $119,000 - - $18,625 $140,828 $141,157 - - $144,691 - -Durable Goods Manufacturing 15 18 $107,163 $107,224 $79,789 $100,000 $125,666 - $45,955 $157,757 $153,179 $99,967 $118,174 $145,652 $168,850 $245,588
Base Pay Variable Pay Total Compensation
National Data - Effective September 2010 26 © 2011 Employer Associations of America (EAA)

Bonus Commission# of Orgs
# of Emp
Un-Wtd Avg
WtdAvg P25 Median P75
Wtd Annual Avg
Wtd Annual Avg
Un-Wtd Avg
WtdAvg P10 P25 Median P75 P90
Total Responses 97 162 $113,116 $116,461 $93,375 $113,784 $133,500 $23,343 - $134,071 $139,804 $88,748 $109,868 $130,116 $163,164 $198,822
Org Sales Volume0.0-26.9 million 29 41 $103,358 $108,819 $84,950 $103,355 $130,000 $16,535 - $116,164 $125,354 $83,981 $90,000 $115,000 $147,705 $195,82527.0-99.9 million 29 40 $106,489 $106,381 $92,125 $109,745 $118,908 $29,343 - $131,829 $135,725 $98,530 $107,366 $126,884 $158,853 $198,375100.0 million+ 39 81 $125,300 $125,307 $100,500 $119,403 $143,225 $23,825 - $149,053 $149,132 $100,681 $116,712 $143,070 $168,708 $204,015
RegionNortheast 4 6 $118,725 $119,046 - $116,877 - $16,528 - $137,362 $135,574 - - $141,497 - -Southeast 5 6 $115,051 $114,570 $100,500 $117,545 $126,582 $39,133 - $156,266 $153,703 $102,000 $114,770 $160,708 $184,831 $200,000Great Lakes 63 117 $114,683 $117,645 $93,750 $112,008 $137,547 $19,934 - $132,497 $137,579 $92,688 $108,078 $129,194 $158,800 $192,015Central 5 6 $102,576 $103,391 $99,083 $102,149 $110,394 $19,737 - $125,036 $123,127 $101,850 $108,930 $125,659 $131,818 $147,825Mountain 10 17 $118,504 $122,411 $87,800 $120,000 $137,293 $56,892 - $167,268 $179,302 $78,961 $126,932 $163,086 $214,087 $316,904Pacific 10 10 $99,920 $99,920 $81,479 $98,036 $117,094 $2,970 - $102,890 $102,890 $79,988 $83,450 $100,536 $117,094 $143,340
AssociationAmerican Society of Employers (MI) 6 6 $137,232 $137,232 $96,225 $129,413 $172,542 $10,638 - $147,870 $147,870 $88,000 $106,000 $140,150 $185,590 $239,203Cascade Employers Assoc. (OR) 3 3 $107,810 $107,810 - $119,026 - $1,667 - $109,476 $109,476 - - $119,026 - -Trusight (MN) - formerly EA 12 21 $104,765 $103,343 $85,927 $100,000 $110,000 $15,756 - $119,258 $119,099 $78,600 $100,990 $109,990 $117,815 $213,000Employers Resource Assoc. (OH) 9 20 $120,144 $135,660 $104,595 $138,755 $152,812 $19,603 - $143,745 $155,263 $97,599 $130,385 $159,500 $182,594 $202,395Employers Resource Council (OH) 3 3 $109,888 $109,888 - $113,963 - $17,782 - $127,670 $127,670 - - $128,446 - -Mtn States Employers Council (CO) 6 11 $107,612 $112,670 $75,600 $120,000 $130,000 $58,734 - $158,815 $171,405 $94,885 $131,038 $169,000 $213,933 $270,526MRA - The Mgmt Assoc. (N. IL) 5 7 $116,072 $106,633 $84,459 $110,100 $133,000 $14,956 - $134,431 $121,589 $83,976 $91,489 $132,100 $148,500 $159,000MRA - The Mgmt Assoc. (WI) 35 68 $111,594 $115,320 $98,700 $115,109 $130,000 $24,315 - $134,076 $139,634 $95,725 $114,263 $135,194 $157,303 $185,969The Employers Council (UT) 3 5 $139,845 $144,354 - $124,263 - $56,781 - $187,593 $201,135 - - $163,086 - -The Management Assoc. of Illinois (IL) 6 8 $108,332 $109,879 $87,000 $108,027 $128,534 $22,327 - $129,210 $132,206 $98,000 $102,750 $129,532 $160,150 $179,775
continued
(30) General Sales ManagerCompensation Strategy: Salary + Bonus
Reports to top sales executive, may be called General Sales Manager, Vice President of Sales, etc. Responsible for management and direction of field sales, sales manager and/or sales supervisory personnel. Generally provides direction, counsel, and guidance for plans in marketing, advertising, sales promotion, sales training, etc. Implements sales policies and ensures communication of new products or services, variations and changes, and sales promotion and activities of a division or unit. May be responsible for creating and implementing sales / marketing programs.
Effective Date:September 2010
Total CompensationBase Pay Variable Pay
National Data - Effective September 2010 27 © 2011 Employer Associations of America (EAA)

(30) General Sales ManagerCompensation Strategy: Salary + Bonus
Bonus Commission# of Orgs
# of Emp
Un-Wtd Avg
WtdAvg P25 Median P75
Wtd Annual Avg
Wtd Annual Avg
Un-Wtd Avg
WtdAvg P10 P25 Median P75 P90
Customer TypeIndustry 55 87 $113,386 $113,561 $94,000 $110,000 $125,000 $26,440 - $137,818 $140,001 $97,353 $111,290 $126,482 $158,000 $214,919Distributors/Wholesalers 21 33 $116,377 $123,865 $96,500 $115,000 $137,547 $16,208 - $131,241 $140,073 $82,670 $104,473 $120,750 $155,700 $200,000Retailers 17 22 $104,234 $110,488 $82,756 $113,700 $141,864 $23,796 - $123,821 $134,284 $78,536 $92,250 $130,273 $177,188 $187,363Consumers 10 20 $115,168 $123,430 $93,944 $132,990 $149,219 $21,144 - $131,633 $144,574 $88,568 $115,257 $149,390 $176,247 $183,849
IndustryConstruction 4 6 $106,500 $107,833 - $110,999 - $51,088 - $148,316 $158,921 - - $123,504 - -Non-Durable Goods Manufacturing 16 28 $131,824 $137,581 $110,616 $131,500 $149,459 $37,569 - $166,198 $175,150 $104,729 $133,980 $160,169 $185,969 $268,000Durable Goods Manufacturing 45 83 $107,048 $108,211 $92,690 $105,000 $120,148 $21,372 - $126,827 $129,583 $92,089 $106,655 $120,750 $150,412 $177,714Wholesale and Retail Trade 18 29 $110,937 $123,625 $89,298 $125,003 $148,793 $14,525 - $125,941 $138,150 $81,000 $95,214 $145,000 $166,360 $200,000Other Services 5 5 $124,835 $124,835 $98,650 $119,225 $153,826 $5,286 - $130,121 $130,121 $80,000 $99,942 $143,070 $153,826 $155,250
Base Pay Variable Pay Total Compensation
National Data - Effective September 2010 28 © 2011 Employer Associations of America (EAA)
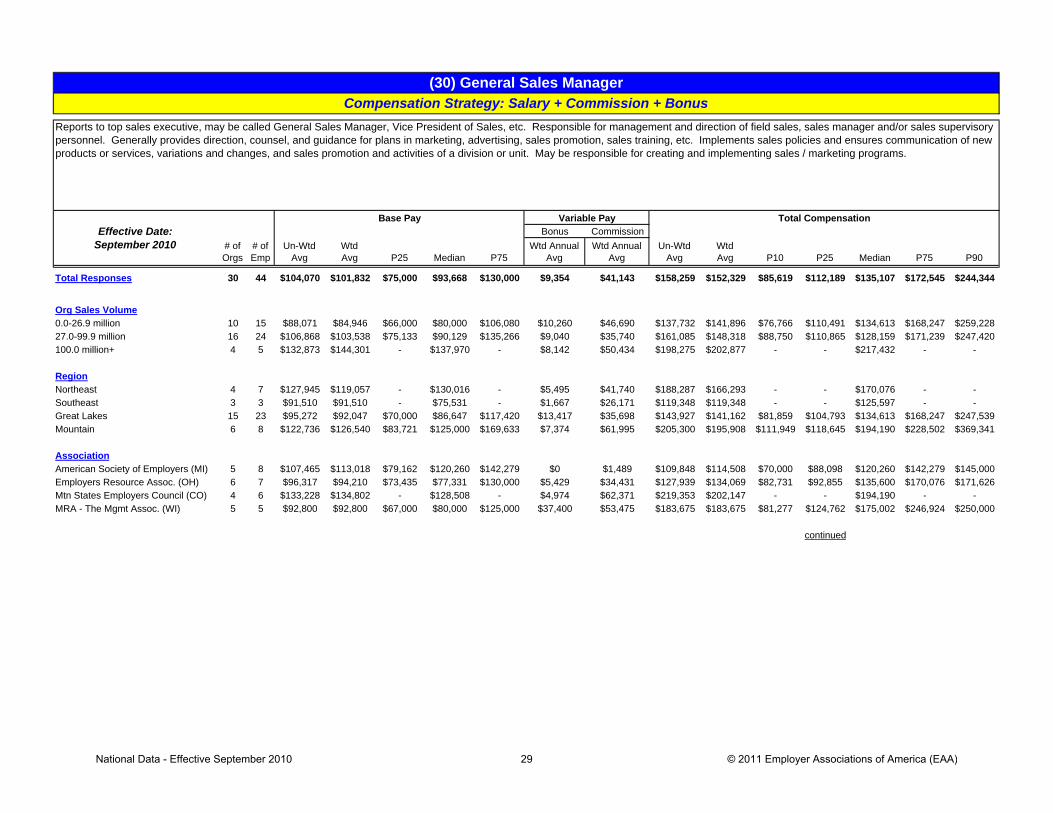
Bonus Commission# of Orgs
# of Emp
Un-Wtd Avg
WtdAvg P25 Median P75
Wtd Annual Avg
Wtd Annual Avg
Un-Wtd Avg
WtdAvg P10 P25 Median P75 P90
Total Responses 30 44 $104,070 $101,832 $75,000 $93,668 $130,000 $9,354 $41,143 $158,259 $152,329 $85,619 $112,189 $135,107 $172,545 $244,344
Org Sales Volume0.0-26.9 million 10 15 $88,071 $84,946 $66,000 $80,000 $106,080 $10,260 $46,690 $137,732 $141,896 $76,766 $110,491 $134,613 $168,247 $259,22827.0-99.9 million 16 24 $106,868 $103,538 $75,133 $90,129 $135,266 $9,040 $35,740 $161,085 $148,318 $88,750 $110,865 $128,159 $171,239 $247,420100.0 million+ 4 5 $132,873 $144,301 - $137,970 - $8,142 $50,434 $198,275 $202,877 - - $217,432 - -
RegionNortheast 4 7 $127,945 $119,057 - $130,016 - $5,495 $41,740 $188,287 $166,293 - - $170,076 - -Southeast 3 3 $91,510 $91,510 - $75,531 - $1,667 $26,171 $119,348 $119,348 - - $125,597 - -Great Lakes 15 23 $95,272 $92,047 $70,000 $86,647 $117,420 $13,417 $35,698 $143,927 $141,162 $81,859 $104,793 $134,613 $168,247 $247,539Mountain 6 8 $122,736 $126,540 $83,721 $125,000 $169,633 $7,374 $61,995 $205,300 $195,908 $111,949 $118,645 $194,190 $228,502 $369,341
AssociationAmerican Society of Employers (MI) 5 8 $107,465 $113,018 $79,162 $120,260 $142,279 $0 $1,489 $109,848 $114,508 $70,000 $88,098 $120,260 $142,279 $145,000Employers Resource Assoc. (OH) 6 7 $96,317 $94,210 $73,435 $77,331 $130,000 $5,429 $34,431 $127,939 $134,069 $82,731 $92,855 $135,600 $170,076 $171,626Mtn States Employers Council (CO) 4 6 $133,228 $134,802 - $128,508 - $4,974 $62,371 $219,353 $202,147 - - $194,190 - -MRA - The Mgmt Assoc. (WI) 5 5 $92,800 $92,800 $67,000 $80,000 $125,000 $37,400 $53,475 $183,675 $183,675 $81,277 $124,762 $175,002 $246,924 $250,000
continued
Base Pay Variable Pay
(30) General Sales ManagerCompensation Strategy: Salary + Commission + Bonus
Reports to top sales executive, may be called General Sales Manager, Vice President of Sales, etc. Responsible for management and direction of field sales, sales manager and/or sales supervisory personnel. Generally provides direction, counsel, and guidance for plans in marketing, advertising, sales promotion, sales training, etc. Implements sales policies and ensures communication of new products or services, variations and changes, and sales promotion and activities of a division or unit. May be responsible for creating and implementing sales / marketing programs.
Effective Date:September 2010
Total Compensation
National Data - Effective September 2010 29 © 2011 Employer Associations of America (EAA)

(30) General Sales ManagerCompensation Strategy: Salary + Commission + Bonus
Bonus Commission# of Orgs
# of Emp
Un-Wtd Avg
WtdAvg P25 Median P75
Wtd Annual Avg
Wtd Annual Avg
Un-Wtd Avg
WtdAvg P10 P25 Median P75 P90
Customer TypeIndustry 25 33 $109,499 $111,046 $76,431 $110,504 $137,493 $9,541 $37,290 $162,453 $157,877 $84,617 $115,642 $143,037 $195,390 $244,443Retailers 3 5 $79,647 $81,339 - $81,561 - $3,198 $25,894 $114,075 $110,430 - - $111,949 - -
IndustryDurable Goods Manufacturing 9 13 $87,291 $85,558 $75,000 $80,000 $90,092 $5,063 $28,449 $122,590 $119,071 $83,156 $90,151 $114,861 $143,152 $170,726Wholesale and Retail Trade 4 7 $114,949 $118,088 - $130,016 - $286 $1,611 $118,268 $119,985 - - $130,016 - -Information 4 6 $123,205 $118,077 - $121,210 - $29,167 $22,492 $187,313 $169,736 - - $143,583 - -Financial Activities 3 6 $89,084 $74,182 - $59,591 - $12,811 $68,014 $149,362 $155,007 - - $124,910 - -Other Services 4 6 $99,772 $111,779 - $81,604 - $4,524 $56,227 $160,761 $172,530 - - $170,851 - -
Base Pay Variable Pay Total Compensation
National Data - Effective September 2010 30 © 2011 Employer Associations of America (EAA)

Bonus Commission# of Orgs
# of Emp
Un-Wtd Avg
WtdAvg P25 Median P75
Wtd Annual Avg
Wtd Annual Avg
Un-Wtd Avg
WtdAvg P10 P25 Median P75 P90
Total Responses 291 776 - - - - - - - $100,923 $102,076 $65,000 $78,316 $96,339 $116,581 $141,826
Org Sales Volume0.0-26.9 million 124 268 - - - - - - - $88,649 $89,027 $61,900 $70,462 $84,000 $101,603 $124,49027.0-99.9 million 99 267 - - - - - - - $105,071 $105,571 $68,640 $82,134 $101,951 $121,984 $142,953100.0 million+ 68 241 - - - - - - - $117,266 $112,716 $68,894 $85,000 $103,601 $126,871 $159,953
RegionNortheast 20 38 - - - - - - - $112,165 $114,208 $61,900 $68,900 $99,839 $141,305 $197,580Southeast 10 34 - - - - - - - $110,190 $108,414 $70,829 $84,886 $96,195 $128,282 $155,991Great Lakes 208 595 - - - - - - - $98,935 $100,063 $64,843 $78,206 $95,076 $113,791 $139,077Central 11 21 - - - - - - - $114,011 $131,016 $82,829 $108,169 $124,750 $153,764 $182,797Mountain 22 52 - - - - - - - $107,228 $107,060 $64,837 $75,751 $102,529 $129,729 $158,363Pacific 20 36 - - - - - - - $91,588 $92,477 $68,655 $76,088 $91,341 $107,569 $119,172
AssociationAmerican Society of Employers (MI) 20 62 - - - - - - - $98,724 $98,327 $72,673 $83,167 $95,503 $110,825 $133,156Cascade Employers Assoc. (OR) 4 5 - - - - - - - $81,241 $87,493 - - $89,500 - -Employers Assoc. NE (CT & MA) 6 11 - - - - - - - $99,992 $101,816 $61,900 $64,735 $97,000 $128,500 $141,093Trusight (MN) - formerly EA 45 124 - - - - - - - $106,086 $108,083 $65,806 $76,530 $92,999 $128,396 $166,895Employers Assoc. of Florida, Inc (FL) 3 3 - - - - - - - $89,973 $89,973 - - $84,165 - -Employers Resource Assoc. (OH) 35 119 - - - - - - - $97,297 $104,997 $69,500 $80,625 $98,693 $124,539 $145,382Employers Resource Council (OH) 23 65 - - - - - - - $88,229 $91,417 $64,968 $74,877 $89,800 $106,553 $119,770MidAtlantic Employers Assoc. (PA) 5 12 - - - - - - - $110,469 $100,987 $68,429 $78,400 $84,556 $110,770 $201,814Mtn States Employers Council (CO) 18 42 - - - - - - - $110,295 $107,892 $64,864 $76,894 $100,000 $128,046 $158,363MRA - The Mgmt Assoc. (N. IL) 5 11 - - - - - - - $104,466 $103,365 $63,036 $75,000 $106,000 $117,272 $155,941MRA - The Mgmt Assoc. (WI) 83 225 - - - - - - - $97,229 $97,108 $63,492 $77,587 $95,352 $112,567 $131,903The Employers Council (UT) 6 11 - - - - - - - $100,878 $107,240 $65,038 $65,805 $109,000 $138,651 $164,815The Management Assoc. of Illinois (IL) 23 55 - - - - - - - $127,835 $126,921 $70,408 $97,000 $114,000 $137,523 $220,076
continued
(50) Sales ManagerCombined Compensation Type
Reports to second level sales manager or top sales executive, may be called Regional Sales Manager, Territory Sales Manager, Product or Brand Sales Manager, etc. Responsible for management and direction of a large segment of the overall sales volume. Direct staffing, training, and performance evaluations of Sales Reps, Inside Sales Reps, or Manufacturing Reps to develop and control sales program. Coordinates sales distribution by establishing sales territories, quotas, and goals, and advises dealers and distributors concerning sales and advertising techniques. Analyzes sales statistics to formulate policy and promote sales. Reviews market analyses to determine customer needs, volume potential, price schedules and discount rates.
Effective Date:September 2010
Total CompensationBase Pay Variable Pay
National Data - Effective September 2010 31 © 2011 Employer Associations of America (EAA)

(50) Sales ManagerCombined Compensation Type
Bonus Commission# of Orgs
# of Emp
Un-Wtd Avg
WtdAvg P25 Median P75
Wtd Annual Avg
Wtd Annual Avg
Un-Wtd Avg
WtdAvg P10 P25 Median P75 P90
Customer TypeIndustry 177 422 - - - - - - - $103,448 $105,379 $68,966 $80,000 $98,060 $118,492 $147,035Distributors/Wholesalers 78 220 - - - - - - - $100,498 $99,449 $62,538 $79,457 $96,112 $112,457 $131,705Retailers 33 59 - - - - - - - $96,083 $95,951 $61,900 $68,615 $85,681 $112,347 $145,874Consumers 22 75 - - - - - - - $95,050 $96,018 $59,857 $72,380 $92,673 $124,750 $134,344
IndustryConstruction 3 5 - - - - - - - $95,315 $111,391 - - $80,400 - -Non-Durable Goods Manufacturing 62 183 - - - - - - - $104,262 $102,100 $66,246 $81,484 $100,000 $117,557 $140,214Durable Goods Manufacturing 132 365 - - - - - - - $98,653 $97,359 $65,000 $77,194 $92,959 $112,155 $134,760Wholesale and Retail Trade 49 105 - - - - - - - $100,876 $111,417 $63,411 $84,052 $99,600 $126,871 $162,612Transportation and Warehousing 4 9 - - - - - - - $138,685 $110,386 - - $93,740 - -Information 3 5 - - - - - - - $84,922 $88,866 - - $69,858 - -Financial Activities 4 9 - - - - - - - $97,289 $94,917 - - $69,000 - -Professional and Business Services 12 19 - - - - - - - $95,003 $100,457 $66,430 $77,682 $88,000 $107,250 $165,000Education and Health Services 3 4 - - - - - - - $83,808 $86,240 - - $81,289 - -Other Services 17 67 - - - - - - - $112,734 $116,917 $68,565 $83,902 $101,000 $137,523 $197,561
Base Pay Variable Pay Total Compensation
National Data - Effective September 2010 32 © 2011 Employer Associations of America (EAA)

Bonus Commission# of Orgs
# of Emp
Un-Wtd Avg
WtdAvg P25 Median P75
Wtd Annual Avg
Wtd Annual Avg
Un-Wtd Avg
WtdAvg P10 P25 Median P75 P90
Total Responses 43 95 $81,015 $85,394 $70,000 $83,928 $98,235 - - $81,015 $85,394 $58,555 $70,000 $83,928 $98,235 $115,937
Org Sales Volume0.0-26.9 million 22 34 $77,571 $78,251 $64,176 $76,000 $89,625 - - $77,571 $78,251 $52,500 $64,176 $76,000 $89,625 $103,46927.0-99.9 million 16 49 $84,697 $88,738 $70,361 $84,300 $101,312 - - $84,697 $88,738 $58,853 $70,361 $84,300 $101,312 $126,585100.0 million+ 5 12 $84,386 $91,980 $82,092 $88,915 $105,627 - - $84,386 $91,980 $70,675 $82,092 $88,915 $105,627 $116,491
RegionNortheast 3 7 $67,344 $62,294 - $61,900 - - - $67,344 $62,294 - - $61,900 - -Great Lakes 32 77 $82,005 $87,855 $71,500 $84,300 $100,494 - - $82,005 $87,855 $59,771 $71,500 $84,300 $100,494 $118,400Pacific 7 10 $77,163 $79,430 $71,291 $80,480 $90,560 - - $77,163 $79,430 $56,296 $71,291 $80,480 $90,560 $95,982
AssociationAmerican Society of Employers (MI) 3 6 $88,715 $91,236 - $91,459 - - - $88,715 $91,236 - - $91,459 - -Cascade Employers Assoc. (OR) 3 3 $70,821 $70,821 - $67,964 - - - $70,821 $70,821 - - $67,964 - -Trusight (MN) - formerly EA 4 13 $93,684 $100,188 - $82,000 - - - $93,684 $100,188 - - $82,000 - -Employers Resource Assoc. (OH) 5 13 $88,976 $93,457 $84,114 $92,712 $101,550 - - $88,976 $93,457 $64,405 $84,114 $92,712 $101,550 $124,500Employers Resource Council (OH) 3 11 $74,004 $83,987 - $85,008 - - - $74,004 $83,987 - - $85,008 - -MRA - The Mgmt Assoc. (WI) 15 28 $74,337 $75,586 $61,900 $72,250 $88,955 - - $74,337 $75,586 $54,817 $61,900 $72,250 $88,955 $100,595
continued
Base Pay Variable Pay
(50) Sales ManagerCompensation Strategy: Straight Salary
Reports to second level sales manager or top sales executive, may be called Regional Sales Manager, Territory Sales Manager, Product or Brand Sales Manager, etc. Responsible for management and direction of a large segment of the overall sales volume. Direct staffing, training, and performance evaluations of Sales Reps, Inside Sales Reps, or Manufacturing Reps to develop and control sales program. Coordinates sales distribution by establishing sales territories, quotas, and goals, and advises dealers and distributors concerning sales and advertising techniques. Analyzes sales statistics to formulate policy and promote sales. Reviews market analyses to determine customer needs, volume potential, price schedules and discount rates.
Effective Date:September 2010
Total Compensation
National Data - Effective September 2010 33 © 2011 Employer Associations of America (EAA)
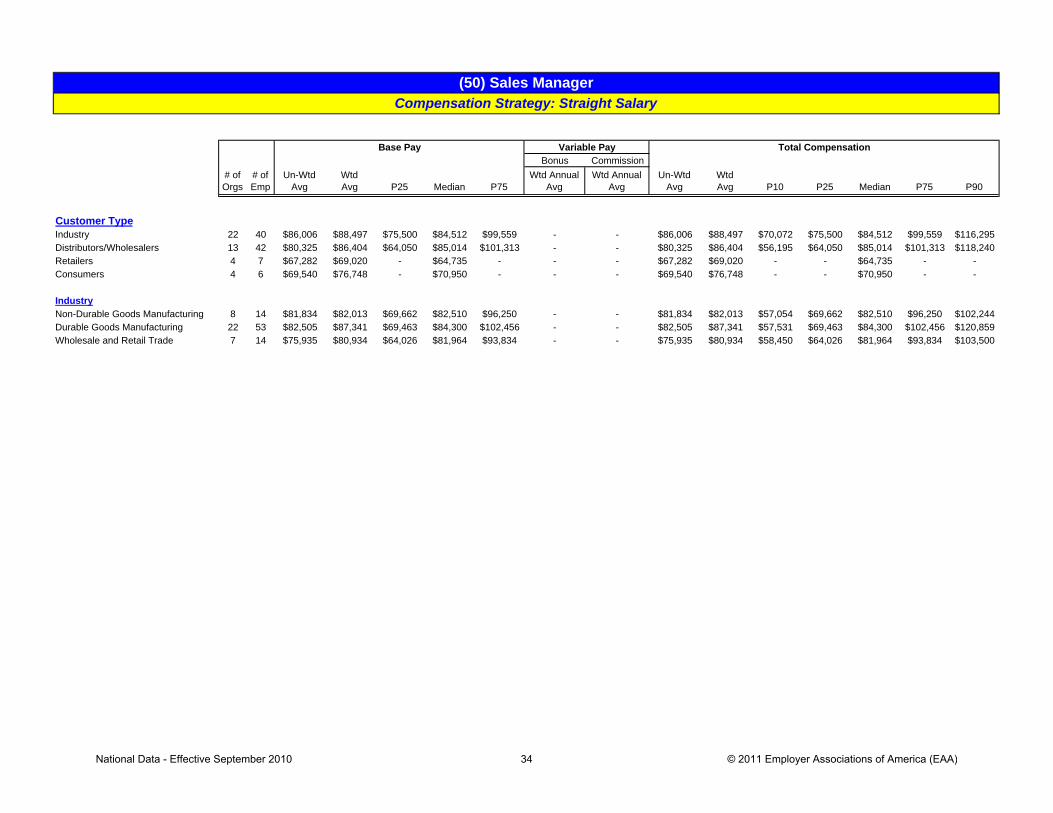
(50) Sales ManagerCompensation Strategy: Straight Salary
Bonus Commission# of Orgs
# of Emp
Un-Wtd Avg
WtdAvg P25 Median P75
Wtd Annual Avg
Wtd Annual Avg
Un-Wtd Avg
WtdAvg P10 P25 Median P75 P90
Customer TypeIndustry 22 40 $86,006 $88,497 $75,500 $84,512 $99,559 - - $86,006 $88,497 $70,072 $75,500 $84,512 $99,559 $116,295Distributors/Wholesalers 13 42 $80,325 $86,404 $64,050 $85,014 $101,313 - - $80,325 $86,404 $56,195 $64,050 $85,014 $101,313 $118,240Retailers 4 7 $67,282 $69,020 - $64,735 - - - $67,282 $69,020 - - $64,735 - -Consumers 4 6 $69,540 $76,748 - $70,950 - - - $69,540 $76,748 - - $70,950 - -
IndustryNon-Durable Goods Manufacturing 8 14 $81,834 $82,013 $69,662 $82,510 $96,250 - - $81,834 $82,013 $57,054 $69,662 $82,510 $96,250 $102,244Durable Goods Manufacturing 22 53 $82,505 $87,341 $69,463 $84,300 $102,456 - - $82,505 $87,341 $57,531 $69,463 $84,300 $102,456 $120,859Wholesale and Retail Trade 7 14 $75,935 $80,934 $64,026 $81,964 $93,834 - - $75,935 $80,934 $58,450 $64,026 $81,964 $93,834 $103,500
Base Pay Variable Pay Total Compensation
National Data - Effective September 2010 34 © 2011 Employer Associations of America (EAA)

Bonus Commission# of Orgs
# of Emp
Un-Wtd Avg
WtdAvg P25 Median P75
Wtd Annual Avg
Wtd Annual Avg
Un-Wtd Avg
WtdAvg P10 P25 Median P75 P90
Total Responses 73 182 $78,744 $77,806 $53,968 $73,332 $96,700 - $33,218 $111,131 $111,024 $64,717 $79,110 $106,430 $126,386 $163,585
Org Sales Volume0.0-26.9 million 26 59 $71,654 $66,946 $50,000 $62,700 $75,290 - $24,048 $94,664 $90,994 $57,441 $70,948 $83,939 $108,800 $133,00027.0-99.9 million 27 58 $75,575 $75,916 $51,950 $73,384 $97,830 - $28,721 $106,784 $104,637 $60,135 $81,073 $109,066 $124,062 $132,574100.0 million+ 20 65 $92,239 $89,350 $68,847 $83,200 $105,000 - $45,554 $138,405 $134,904 $72,804 $100,764 $113,856 $150,210 $221,648
RegionNortheast 7 12 $98,097 $99,202 $74,306 $101,344 $121,125 - $20,661 $124,862 $119,863 $76,500 $84,963 $111,209 $138,250 $203,474Southeast 5 7 $72,797 $67,817 $40,000 $51,700 $76,037 - $40,660 $113,809 $108,477 $56,668 $60,900 $78,561 $132,539 $261,187Great Lakes 46 125 $78,368 $78,231 $58,173 $74,000 $96,967 - $30,093 $108,146 $108,324 $64,225 $79,573 $107,087 $124,637 $140,807Central 3 12 $80,087 $77,076 - $77,000 - - $71,406 $144,036 $148,482 - - $130,132 - -Mountain 8 22 $76,346 $70,460 $47,233 $65,509 $80,019 - $35,260 $112,754 $105,720 $59,850 $67,460 $84,492 $119,517 $209,610Pacific 4 4 $60,416 $60,416 - $62,500 - - $29,730 $90,146 $90,146 - - $89,654 - -
AssociationAmerican Society of Employers (MI) 6 11 $41,475 $43,322 $38,000 $40,000 $47,210 - $29,712 $75,162 $73,034 $45,739 $56,668 $75,000 $82,585 $112,527Trusight (MN) - formerly EA 6 17 $75,718 $93,152 $58,125 $88,208 $114,425 - $62,878 $120,034 $156,030 $68,294 $92,015 $129,000 $179,091 $368,951Employers Resource Assoc. (OH) 9 18 $67,565 $63,109 $47,900 $64,170 $75,368 - $42,170 $102,783 $105,279 $65,490 $80,469 $103,342 $126,407 $144,792Employers Resource Council (OH) 6 13 $82,521 $81,614 $70,325 $75,000 $90,750 - $22,951 $101,158 $104,564 $73,586 $83,075 $110,000 $123,343 $128,400Mtn States Employers Council (CO) 7 20 $81,824 $73,706 $50,509 $69,443 $82,140 - $33,827 $116,349 $107,533 $61,408 $70,081 $84,492 $125,809 $215,825MRA - The Mgmt Assoc. (WI) 19 59 $79,834 $78,994 $62,675 $77,286 $96,433 - $23,857 $108,295 $102,851 $66,124 $81,324 $107,087 $120,000 $130,375The Management Assoc. of Illinois (IL) 13 29 $102,138 $93,982 $63,676 $84,000 $121,498 - $42,799 $144,302 $136,781 $79,146 $102,652 $128,440 $152,071 $225,722
continued
(50) Sales ManagerCompensation Strategy: Salary + Commission
Reports to second level sales manager or top sales executive, may be called Regional Sales Manager, Territory Sales Manager, Product or Brand Sales Manager, etc. Responsible for management and direction of a large segment of the overall sales volume. Direct staffing, training, and performance evaluations of Sales Reps, Inside Sales Reps, or Manufacturing Reps to develop and control sales program. Coordinates sales distribution by establishing sales territories, quotas, and goals, and advises dealers and distributors concerning sales and advertising techniques. Analyzes sales statistics to formulate policy and promote sales. Reviews market analyses to determine customer needs, volume potential, price schedules and discount rates.
Effective Date:September 2010
Total CompensationBase Pay Variable Pay
National Data - Effective September 2010 35 © 2011 Employer Associations of America (EAA)
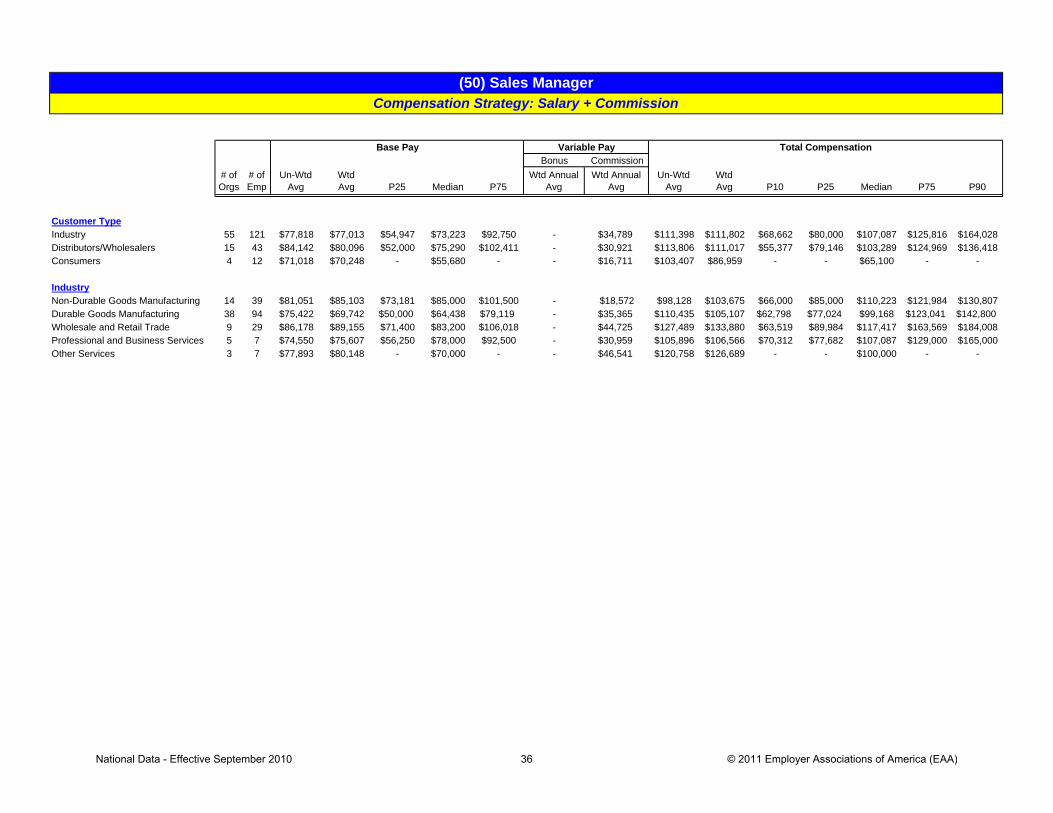
(50) Sales ManagerCompensation Strategy: Salary + Commission
Bonus Commission# of Orgs
# of Emp
Un-Wtd Avg
WtdAvg P25 Median P75
Wtd Annual Avg
Wtd Annual Avg
Un-Wtd Avg
WtdAvg P10 P25 Median P75 P90
Customer TypeIndustry 55 121 $77,818 $77,013 $54,947 $73,223 $92,750 - $34,789 $111,398 $111,802 $68,662 $80,000 $107,087 $125,816 $164,028Distributors/Wholesalers 15 43 $84,142 $80,096 $52,000 $75,290 $102,411 - $30,921 $113,806 $111,017 $55,377 $79,146 $103,289 $124,969 $136,418Consumers 4 12 $71,018 $70,248 - $55,680 - - $16,711 $103,407 $86,959 - - $65,100 - -
IndustryNon-Durable Goods Manufacturing 14 39 $81,051 $85,103 $73,181 $85,000 $101,500 - $18,572 $98,128 $103,675 $66,000 $85,000 $110,223 $121,984 $130,807Durable Goods Manufacturing 38 94 $75,422 $69,742 $50,000 $64,438 $79,119 - $35,365 $110,435 $105,107 $62,798 $77,024 $99,168 $123,041 $142,800Wholesale and Retail Trade 9 29 $86,178 $89,155 $71,400 $83,200 $106,018 - $44,725 $127,489 $133,880 $63,519 $89,984 $117,417 $163,569 $184,008Professional and Business Services 5 7 $74,550 $75,607 $56,250 $78,000 $92,500 - $30,959 $105,896 $106,566 $70,312 $77,682 $107,087 $129,000 $165,000Other Services 3 7 $77,893 $80,148 - $70,000 - - $46,541 $120,758 $126,689 - - $100,000 - -
Base Pay Variable Pay Total Compensation
National Data - Effective September 2010 36 © 2011 Employer Associations of America (EAA)

Bonus Commission# of Orgs
# of Emp
Un-Wtd Avg
WtdAvg P25 Median P75
Wtd Annual Avg
Wtd Annual Avg
Un-Wtd Avg
WtdAvg P10 P25 Median P75 P90
Total Responses 139 395 $89,103 $88,420 $72,982 $86,000 $99,900 $10,529 - $100,203 $98,949 $66,090 $80,097 $95,305 $111,893 $139,626
Org Sales Volume0.0-26.9 million 56 139 $82,497 $84,735 $72,540 $81,484 $95,000 $5,640 - $88,887 $90,375 $63,398 $76,024 $86,226 $101,808 $117,00027.0-99.9 million 41 102 $86,962 $87,160 $73,558 $88,000 $98,190 $13,076 - $100,843 $100,237 $68,697 $85,843 $98,193 $113,351 $133,498100.0 million+ 42 154 $100,001 $92,580 $73,307 $88,254 $110,585 $13,254 - $114,667 $105,834 $69,061 $84,921 $99,950 $123,522 $148,713
RegionNortheast 5 6 $90,840 $95,447 $79,204 $89,100 $117,722 $15,063 - $106,665 $110,510 $77,867 $89,260 $111,339 $132,360 $139,463Southeast 3 20 $94,103 $93,667 - $87,430 - $14,307 - $109,510 $107,974 - - $96,770 - -Great Lakes 108 330 $88,306 $87,374 $71,188 $85,134 $98,552 $10,361 - $99,072 $97,735 $65,914 $78,198 $95,000 $110,331 $137,258Central 5 5 $110,690 $110,690 $94,987 $110,000 $126,740 $10,659 - $121,349 $121,349 $82,767 $96,384 $124,750 $144,614 $147,385Mountain 11 16 $83,011 $85,785 $61,961 $84,050 $112,000 $14,974 - $96,527 $100,759 $63,317 $66,079 $98,090 $131,269 $159,706Pacific 7 18 $92,164 $95,581 $84,844 $96,380 $110,790 $3,912 - $99,722 $99,492 $73,995 $84,844 $98,800 $115,040 $125,918
AssociationAmerican Society of Employers (MI) 10 43 $106,599 $97,700 $83,520 $90,012 $113,534 $8,012 - $115,245 $105,712 $78,910 $87,853 $99,074 $123,113 $141,979Trusight (MN) - formerly EA 31 85 $91,709 $86,040 $65,534 $78,992 $97,450 $11,923 - $104,026 $97,963 $64,754 $75,014 $88,999 $108,766 $145,802Employers Resource Assoc. (OH) 12 62 $81,090 $89,094 $74,681 $85,426 $98,552 $12,541 - $94,328 $101,635 $73,640 $79,891 $96,459 $114,370 $140,390Employers Resource Council (OH) 12 32 $81,910 $84,983 $75,000 $87,260 $95,000 $8,216 - $90,448 $93,199 $67,381 $77,810 $94,885 $104,690 $114,637Mtn States Employers Council (CO) 7 9 $84,064 $80,406 $48,171 $92,800 $101,225 $17,394 - $100,957 $97,800 $59,390 $67,224 $98,177 $112,808 $156,250MRA - The Mgmt Assoc. (WI) 43 116 $88,391 $86,864 $70,779 $87,113 $99,807 $10,036 - $98,686 $96,900 $63,971 $81,406 $94,772 $110,810 $134,488The Employers Council (UT) 4 7 $81,167 $92,702 - $75,300 - $11,862 - $88,774 $104,564 - - $78,283 - -The Management Assoc. of Illinois (IL) 8 15 $86,616 $79,525 $56,250 $80,000 $95,000 $15,480 - $104,255 $95,005 $58,462 $60,494 $98,100 $114,000 $136,949
continued
(50) Sales ManagerCompensation Strategy: Salary + Bonus
Reports to second level sales manager or top sales executive, may be called Regional Sales Manager, Territory Sales Manager, Product or Brand Sales Manager, etc. Responsible for management and direction of a large segment of the overall sales volume. Direct staffing, training, and performance evaluations of Sales Reps, Inside Sales Reps, or Manufacturing Reps to develop and control sales program. Coordinates sales distribution by establishing sales territories, quotas, and goals, and advises dealers and distributors concerning sales and advertising techniques. Analyzes sales statistics to formulate policy and promote sales. Reviews market analyses to determine customer needs, volume potential, price schedules and discount rates.
Effective Date:September 2010
Total CompensationBase Pay Variable Pay
National Data - Effective September 2010 37 © 2011 Employer Associations of America (EAA)

(50) Sales ManagerCompensation Strategy: Salary + Bonus
Bonus Commission# of Orgs
# of Emp
Un-Wtd Avg
WtdAvg P25 Median P75
Wtd Annual Avg
Wtd Annual Avg
Un-Wtd Avg
WtdAvg P10 P25 Median P75 P90
Customer TypeIndustry 73 188 $90,711 $91,480 $74,100 $87,913 $103,036 $9,262 - $100,828 $100,742 $68,886 $80,322 $95,886 $113,463 $144,306Distributors/Wholesalers 42 110 $89,166 $87,639 $75,015 $86,174 $98,552 $10,259 - $100,070 $97,897 $65,080 $83,164 $95,673 $106,712 $129,641Retailers 24 41 $85,929 $83,008 $67,243 $79,973 $97,502 $9,476 - $97,279 $92,484 $62,722 $69,673 $85,681 $107,390 $140,789Consumers 14 56 $88,206 $83,642 $64,617 $81,889 $100,596 $16,085 - $103,212 $99,727 $65,087 $77,048 $97,565 $124,313 $134,076
IndustryConstruction 3 3 $67,977 $67,977 - $70,040 - $1,967 - $69,943 $69,943 - - $70,040 - -Non-Durable Goods Manufacturing 31 101 $93,210 $90,616 $74,400 $88,769 $101,500 $10,821 - $106,183 $101,437 $65,160 $79,829 $95,994 $115,713 $145,545Durable Goods Manufacturing 63 191 $88,105 $87,446 $72,880 $85,426 $99,450 $8,977 - $98,329 $96,423 $66,242 $78,283 $93,994 $109,404 $134,721Wholesale and Retail Trade 27 52 $95,315 $97,053 $80,487 $90,362 $110,000 $13,143 - $105,864 $110,196 $73,167 $91,286 $102,923 $125,388 $152,381Professional and Business Services 3 3 $70,500 $70,500 - $74,000 - $2,933 - $73,433 $73,433 - - $76,300 - -Other Services 6 33 $81,109 $84,527 $67,781 $84,700 $99,920 $11,335 - $88,012 $95,862 $71,616 $83,671 $95,000 $105,954 $123,305
Base Pay Variable Pay Total Compensation
National Data - Effective September 2010 38 © 2011 Employer Associations of America (EAA)

Bonus Commission# of Orgs
# of Emp
Un-Wtd Avg
WtdAvg P25 Median P75
Wtd Annual Avg
Wtd Annual Avg
Un-Wtd Avg
WtdAvg P10 P25 Median P75 P90
Total Responses 52 102 $75,303 $76,255 $60,000 $73,163 $90,243 $5,529 $30,742 $106,963 $112,526 $68,585 $82,280 $103,745 $137,204 $164,980
Org Sales Volume0.0-26.9 million 24 34 $66,246 $64,617 $50,000 $65,000 $75,593 $4,208 $17,586 $88,507 $86,410 $58,152 $68,559 $81,985 $95,865 $134,43327.0-99.9 million 21 58 $87,794 $83,631 $61,426 $83,825 $94,250 $6,799 $39,677 $128,644 $130,107 $85,565 $100,532 $120,651 $143,746 $196,530100.0 million+ 7 10 $68,884 $73,045 $57,008 $68,800 $88,750 $2,657 $23,646 $105,198 $99,348 $62,930 $68,900 $83,621 $116,413 $193,054
RegionNortheast 5 13 $97,024 $93,747 $61,150 $70,339 $128,854 $5,500 $39,401 $126,780 $138,648 $63,462 $68,800 $141,240 $195,153 $243,207Southeast 3 7 $56,575 $63,926 - $61,205 - $7,429 $38,255 $91,862 $109,609 - - $116,663 - -Great Lakes 31 61 $74,689 $73,662 $60,000 $74,760 $89,960 $5,031 $30,321 $105,717 $109,014 $67,007 $81,871 $98,361 $134,489 $165,585Central 3 3 $52,491 $52,491 - $56,791 - $1,100 $28,246 $81,837 $81,837 - - $83,077 - -Mountain 7 14 $80,599 $84,230 $69,070 $86,842 $98,388 $8,248 $23,890 $116,564 $116,368 $83,355 $102,967 $113,726 $134,737 $149,022Pacific 3 4 $74,629 $70,444 - $72,540 - $3,704 $21,712 $104,641 $95,860 - - $91,360 - -
AssociationTrusight (MN) - formerly EA 5 8 $58,162 $58,476 $48,006 $57,750 $76,627 $1,264 $53,448 $123,300 $113,188 $78,921 $87,357 $98,115 $131,808 $199,099Employers Resource Assoc. (OH) 10 26 $70,854 $78,850 $59,250 $72,670 $92,917 $7,018 $32,719 $97,480 $118,587 $64,828 $80,483 $116,498 $143,746 $195,014Employers Resource Council (OH) 4 9 $68,525 $68,599 - $69,464 - $1,577 $4,996 $75,580 $75,172 - - $80,000 - -Mtn States Employers Council (CO) 7 13 $75,485 $79,110 $65,283 $83,636 $91,250 $7,938 $28,385 $115,892 $115,433 $88,246 $96,347 $107,120 $132,600 $151,071MRA - The Mgmt Assoc. (WI) 11 21 $87,738 $86,717 $77,945 $85,491 $97,465 $5,437 $17,814 $109,691 $109,968 $73,299 $94,271 $103,674 $136,356 $149,271The Employers Council (UT) 3 4 $75,528 $85,396 - $80,791 - $6,354 $20,174 $107,956 $111,923 - - $113,726 - -
continued
Base Pay Variable Pay
(50) Sales ManagerCompensation Strategy: Salary + Commission + Bonus
Reports to second level sales manager or top sales executive, may be called Regional Sales Manager, Territory Sales Manager, Product or Brand Sales Manager, etc. Responsible for management and direction of a large segment of the overall sales volume. Direct staffing, training, and performance evaluations of Sales Reps, Inside Sales Reps, or Manufacturing Reps to develop and control sales program. Coordinates sales distribution by establishing sales territories, quotas, and goals, and advises dealers and distributors concerning sales and advertising techniques. Analyzes sales statistics to formulate policy and promote sales. Reviews market analyses to determine customer needs, volume potential, price schedules and discount rates.
Effective Date:September 2010
Total Compensation
National Data - Effective September 2010 39 © 2011 Employer Associations of America (EAA)

(50) Sales ManagerCompensation Strategy: Salary + Commission + Bonus
Bonus Commission# of Orgs
# of Emp
Un-Wtd Avg
WtdAvg P25 Median P75
Wtd Annual Avg
Wtd Annual Avg
Un-Wtd Avg
WtdAvg P10 P25 Median P75 P90
Customer TypeIndustry 38 72 $77,509 $75,400 $59,250 $67,550 $87,205 $5,451 $33,698 $107,096 $114,550 $68,585 $80,110 $98,297 $138,744 $190,245Distributors/Wholesalers 9 24 $71,557 $80,539 $77,400 $84,507 $94,000 $5,610 $21,862 $110,313 $108,011 $55,130 $95,023 $106,007 $126,117 $139,605Retailers 4 5 $58,852 $65,053 - $61,583 - $6,433 $33,544 $96,748 $105,030 - - $84,165 - -
IndustryNon-Durable Goods Manufacturing 13 29 $79,244 $76,921 $55,396 $75,000 $87,775 $7,862 $27,203 $116,237 $111,986 $68,578 $93,698 $107,120 $130,336 $140,411Durable Goods Manufacturing 14 26 $73,568 $76,684 $59,250 $78,490 $90,986 $3,849 $15,435 $95,080 $95,967 $69,335 $77,961 $95,069 $106,283 $137,279Wholesale and Retail Trade 8 10 $56,299 $59,102 $42,635 $50,769 $86,661 $4,252 $31,943 $95,228 $95,296 $50,132 $55,695 $91,083 $134,722 $142,540Information 3 5 $76,633 $79,960 - $66,000 - $3,890 $5,016 $84,922 $88,866 - - $69,858 - -Professional and Business Services 3 3 $78,933 $78,933 - $75,000 - $2,000 $8,945 $89,879 $89,879 - - $85,000 - -Other Services 8 24 $85,363 $80,709 $60,000 $67,670 $92,829 $6,994 $58,535 $126,083 $146,238 $81,850 $96,304 $140,252 $191,005 $238,382
Base Pay Variable Pay Total Compensation
National Data - Effective September 2010 40 © 2011 Employer Associations of America (EAA)

Bonus Commission# of Orgs
# of Emp
Un-Wtd Avg
WtdAvg P25 Median P75
Wtd Annual Avg
Wtd Annual Avg
Un-Wtd Avg
WtdAvg P10 P25 Median P75 P90
Total Responses 96 361 - - - - - - - $97,323 $93,740 $59,099 $71,880 $86,670 $113,225 $134,860
Org Sales Volume0.0-26.9 million 24 51 - - - - - - - $89,876 $91,760 $60,000 $66,027 $88,474 $114,865 $132,12727.0-99.9 million 36 131 - - - - - - - $98,223 $95,125 $62,208 $75,182 $87,915 $110,000 $127,500100.0 million+ 36 179 - - - - - - - $101,387 $93,291 $57,070 $70,000 $86,298 $114,768 $142,702
RegionNortheast 8 16 - - - - - - - $120,648 $103,602 $60,156 $72,742 $97,729 $120,366 $180,219Southeast 5 10 - - - - - - - $102,484 $92,162 $50,994 $67,284 $78,885 $123,204 $171,732Great Lakes 62 289 - - - - - - - $94,303 $92,779 $58,305 $71,185 $85,823 $112,985 $133,269Central 4 11 - - - - - - - $94,412 $92,212 - - $92,106 - -Mountain 9 20 - - - - - - - $96,276 $100,830 $62,359 $74,967 $91,216 $117,883 $162,939Pacific 8 15 - - - - - - - $96,806 $94,465 $52,548 $70,500 $98,276 $121,024 $138,772
AssociationAmerican Society of Employers (MI) 7 15 - - - - - - - $83,085 $80,877 $57,257 $70,000 $77,241 $98,711 $108,547Cascade Employers Assoc. (OR) 3 5 - - - - - - - $92,157 $98,083 - - $99,000 - -Trusight (MN) - formerly EA 10 60 - - - - - - - $97,102 $103,194 $57,318 $70,500 $100,223 $133,562 $145,889Employers Resource Assoc. (OH) 18 62 - - - - - - - $98,176 $91,248 $54,860 $67,151 $83,870 $118,260 $130,068Employers Resource Council (OH) 6 56 - - - - - - - $98,738 $100,366 $70,148 $78,694 $88,826 $111,724 $131,391Mtn States Employers Council (CO) 5 10 - - - - - - - $73,500 $76,301 $58,652 $67,878 $76,245 $83,100 $98,171MRA - The Mgmt Assoc. (WI) 27 112 - - - - - - - $94,233 $84,904 $57,021 $70,038 $83,083 $95,668 $118,887The Management Assoc. of Illinois (IL) 10 17 - - - - - - - $113,621 $108,750 $59,501 $77,097 $116,750 $133,981 $171,110
continued
Base Pay Variable Pay
(60) District Sales ManagerCombined Compensation Type
Reports to second level sales manager or regional sales manager. Responsible for managing the sale of products and/or services in a district. Directs staffing, training, and performance evaluations of assigned sales reps, inside sales reps, manufacturing reps and/or administrative office personnel. Develops relationships with local dealers or other distributors. Analyzes sales volume and monitors competitor activities in the district.
Effective Date:September 2010
Total Compensation
National Data - Effective September 2010 41 © 2011 Employer Associations of America (EAA)

(60) District Sales ManagerCombined Compensation Type
Bonus Commission# of Orgs
# of Emp
Un-Wtd Avg
WtdAvg P25 Median P75
Wtd Annual Avg
Wtd Annual Avg
Un-Wtd Avg
WtdAvg P10 P25 Median P75 P90
Customer TypeIndustry 50 141 - - - - - - - $106,572 $102,882 $62,040 $75,583 $101,785 $127,500 $143,228Distributors/Wholesalers 22 133 - - - - - - - $94,974 $95,850 $71,160 $79,547 $87,236 $101,662 $126,464Retailers 17 66 - - - - - - - $88,979 $75,652 $44,510 $59,196 $68,820 $87,945 $121,052Consumers 9 21 - - - - - - - $73,510 $75,844 $52,655 $55,565 $73,946 $93,351 $103,176
IndustryNon-Durable Goods Manufacturing 25 108 - - - - - - - $102,546 $100,576 $70,135 $81,871 $93,909 $117,303 $137,290Durable Goods Manufacturing 38 103 - - - - - - - $100,797 $95,687 $59,378 $69,730 $91,700 $118,060 $138,552Wholesale and Retail Trade 15 116 - - - - - - - $81,377 $84,384 $55,150 $65,139 $78,271 $94,185 $116,005Information 3 7 - - - - - - - $74,628 $64,762 - - $54,282 - -Professional and Business Services 3 5 - - - - - - - $92,761 $91,923 - - $88,513 - -Education and Health Services 3 6 - - - - - - - $94,729 $100,222 - - $107,394 - -Other Services 6 13 - - - - - - - $112,933 $119,623 $68,076 $101,250 $120,000 $134,943 $167,525
Base Pay Variable Pay Total Compensation
National Data - Effective September 2010 42 © 2011 Employer Associations of America (EAA)
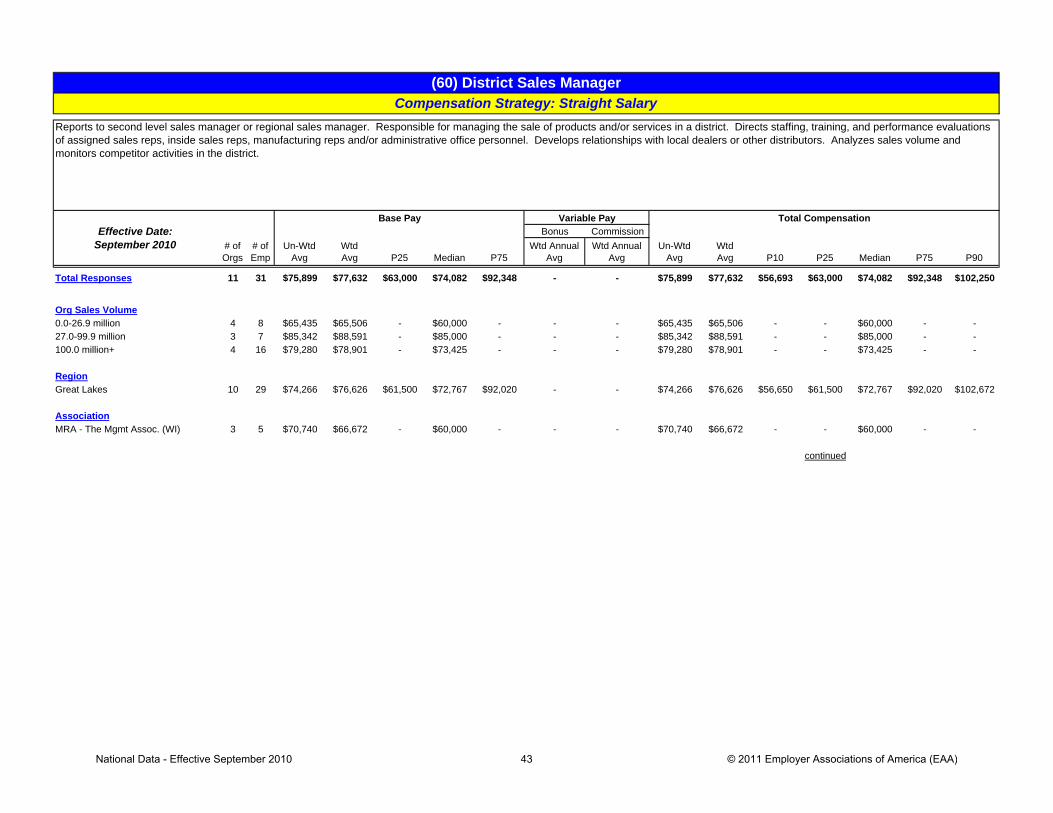
Bonus Commission# of Orgs
# of Emp
Un-Wtd Avg
WtdAvg P25 Median P75
Wtd Annual Avg
Wtd Annual Avg
Un-Wtd Avg
WtdAvg P10 P25 Median P75 P90
Total Responses 11 31 $75,899 $77,632 $63,000 $74,082 $92,348 - - $75,899 $77,632 $56,693 $63,000 $74,082 $92,348 $102,250
Org Sales Volume0.0-26.9 million 4 8 $65,435 $65,506 - $60,000 - - - $65,435 $65,506 - - $60,000 - -27.0-99.9 million 3 7 $85,342 $88,591 - $85,000 - - - $85,342 $88,591 - - $85,000 - -100.0 million+ 4 16 $79,280 $78,901 - $73,425 - - - $79,280 $78,901 - - $73,425 - -
RegionGreat Lakes 10 29 $74,266 $76,626 $61,500 $72,767 $92,020 - - $74,266 $76,626 $56,650 $61,500 $72,767 $92,020 $102,672
AssociationMRA - The Mgmt Assoc. (WI) 3 5 $70,740 $66,672 - $60,000 - - - $70,740 $66,672 - - $60,000 - -
continued
(60) District Sales ManagerCompensation Strategy: Straight Salary
Reports to second level sales manager or regional sales manager. Responsible for managing the sale of products and/or services in a district. Directs staffing, training, and performance evaluations of assigned sales reps, inside sales reps, manufacturing reps and/or administrative office personnel. Develops relationships with local dealers or other distributors. Analyzes sales volume and monitors competitor activities in the district.
Effective Date:September 2010
Total CompensationBase Pay Variable Pay
National Data - Effective September 2010 43 © 2011 Employer Associations of America (EAA)

(60) District Sales ManagerCompensation Strategy: Straight Salary
Bonus Commission# of Orgs
# of Emp
Un-Wtd Avg
WtdAvg P25 Median P75
Wtd Annual Avg
Wtd Annual Avg
Un-Wtd Avg
WtdAvg P10 P25 Median P75 P90
Customer TypeIndustry 5 12 $86,265 $84,067 $66,464 $88,270 $92,462 - - $86,265 $84,067 $59,097 $66,464 $88,270 $92,462 $110,225Retailers 3 12 $59,099 $64,423 - $66,055 - - - $59,099 $64,423 - - $66,055 - -
IndustryDurable Goods Manufacturing 3 8 $95,615 $97,192 - $96,826 - - - $95,615 $97,192 - - $96,826 - -Wholesale and Retail Trade 3 15 $73,127 $75,355 - $72,767 - - - $73,127 $75,355 - - $72,767 - -
Base Pay Variable Pay Total Compensation
National Data - Effective September 2010 44 © 2011 Employer Associations of America (EAA)

Bonus Commission# of Orgs
# of Emp
Un-Wtd Avg
WtdAvg P25 Median P75
Wtd Annual Avg
Wtd Annual Avg
Un-Wtd Avg
WtdAvg P10 P25 Median P75 P90
Total Responses 33 161 $75,087 $67,925 $48,000 $63,000 $79,649 - $23,419 $100,319 $91,344 $57,157 $74,620 $84,005 $105,944 $129,620
Org Sales Volume0.0-26.9 million 9 18 $67,991 $74,471 $52,250 $63,782 $93,916 - $21,461 $94,783 $95,932 $62,700 $67,638 $94,903 $123,750 $133,25227.0-99.9 million 12 70 $66,731 $58,294 $48,000 $48,000 $57,125 - $38,440 $93,614 $96,734 $60,500 $77,714 $87,053 $111,453 $127,402100.0 million+ 12 73 $88,765 $75,546 $63,450 $76,367 $84,147 - $9,498 $111,178 $85,044 $53,580 $67,980 $82,084 $93,191 $131,241
RegionGreat Lakes 24 144 $73,901 $67,195 $48,000 $62,400 $78,679 - $24,087 $99,465 $91,282 $56,708 $75,732 $84,835 $105,454 $127,799Mountain 3 4 $66,136 $61,705 - $50,361 - - $23,196 $91,196 $84,900 - - $76,639 - -
AssociationTrusight (MN) - formerly EA 3 7 $88,459 $88,000 - $83,000 - - $5,709 $98,761 $93,709 - - $99,102 - -Employers Resource Assoc. (OH) 6 24 $64,506 $62,214 $52,750 $54,000 $68,090 - $33,589 $94,097 $95,803 $52,000 $67,492 $96,038 $117,497 $143,890Employers Resource Council (OH) 4 48 $84,346 $59,824 - $48,000 - - $40,286 $111,393 $100,110 - - $85,110 - -MRA - The Mgmt Assoc. (WI) 9 67 $68,885 $70,965 $61,800 $75,000 $79,838 - $9,518 $96,117 $80,483 $50,940 $66,960 $82,084 $89,378 $109,023The Management Assoc. of Illinois (IL) 8 11 $87,723 $89,622 $60,705 $100,000 $112,731 - $25,144 $114,248 $114,765 $58,004 $65,000 $126,000 $143,090 $174,625
continued
Base Pay Variable Pay
(60) District Sales ManagerCompensation Strategy: Salary + Commission
Reports to second level sales manager or regional sales manager. Responsible for managing the sale of products and/or services in a district. Directs staffing, training, and performance evaluations of assigned sales reps, inside sales reps, manufacturing reps and/or administrative office personnel. Develops relationships with local dealers or other distributors. Analyzes sales volume and monitors competitor activities in the district.
Effective Date:September 2010
Total Compensation
National Data - Effective September 2010 45 © 2011 Employer Associations of America (EAA)

(60) District Sales ManagerCompensation Strategy: Salary + Commission
Bonus Commission# of Orgs
# of Emp
Un-Wtd Avg
WtdAvg P25 Median P75
Wtd Annual Avg
Wtd Annual Avg
Un-Wtd Avg
WtdAvg P10 P25 Median P75 P90
Customer TypeIndustry 25 71 $79,586 $76,133 $54,000 $66,960 $100,000 - $21,927 $107,012 $98,061 $59,200 $68,175 $88,513 $126,000 $142,311Distributors/Wholesalers 6 76 $70,032 $63,190 $48,000 $48,000 $78,047 - $27,649 $93,925 $90,839 $74,910 $79,527 $84,719 $93,686 $108,705
IndustryNon-Durable Goods Manufacturing 3 36 $90,402 $82,011 - $79,140 - - $7,126 $97,986 $89,137 - - $86,767 - -Durable Goods Manufacturing 19 57 $76,617 $70,773 $54,000 $63,271 $78,558 - $24,872 $107,130 $95,646 $57,467 $65,733 $84,005 $124,500 $150,218Wholesale and Retail Trade 6 58 $64,001 $51,664 $48,000 $48,000 $48,000 - $32,828 $81,380 $84,492 $41,488 $69,981 $80,566 $91,849 $112,062
Base Pay Variable Pay Total Compensation
National Data - Effective September 2010 46 © 2011 Employer Associations of America (EAA)

Bonus Commission# of Orgs
# of Emp
Un-Wtd Avg
WtdAvg P25 Median P75
Wtd Annual Avg
Wtd Annual Avg
Un-Wtd Avg
WtdAvg P10 P25 Median P75 P90
Total Responses 39 122 $83,798 $84,476 $63,613 $80,095 $102,975 $13,165 - $97,637 $97,641 $62,108 $71,940 $95,216 $119,279 $136,689
Org Sales Volume0.0-26.9 million 6 15 $77,135 $81,762 $60,000 $78,780 $96,420 $11,860 - $87,688 $93,622 $63,089 $80,190 $93,744 $114,171 $126,26727.0-99.9 million 12 31 $84,507 $82,268 $68,670 $79,422 $102,500 $13,069 - $99,387 $95,337 $67,624 $71,760 $95,000 $113,142 $129,180100.0 million+ 21 76 $85,297 $85,912 $61,916 $82,958 $109,122 $13,461 - $99,480 $99,373 $59,137 $71,092 $97,570 $124,396 $142,870
RegionNortheast 4 8 $91,598 $86,083 - $87,000 - $15,537 - $107,936 $101,620 - - $100,250 - -Great Lakes 22 81 $83,053 $84,216 $60,791 $80,000 $105,250 $12,268 - $95,546 $96,484 $62,107 $71,034 $94,073 $120,347 $136,703Mountain 4 13 $92,836 $92,798 - $87,000 - $19,803 - $113,888 $112,601 - - $103,184 - -Pacific 6 13 $80,782 $84,020 $57,240 $82,000 $105,210 $6,899 - $89,901 $90,918 $52,032 $62,490 $89,070 $118,472 $137,096
AssociationAmerican Society of Employers (MI) 4 7 $85,863 $82,504 - $72,000 - $2,148 - $88,776 $84,652 - - $74,035 - -Cascade Employers Assoc. (OR) 3 5 $80,406 $87,930 - $82,400 - $10,153 - $92,157 $98,083 - - $99,000 - -Trusight (MN) - formerly EA 4 33 $91,374 $92,142 - $95,149 - $12,600 - $109,624 $104,741 - - $113,095 - -Employers Resource Assoc. (OH) 7 18 $76,172 $74,165 $58,077 $65,415 $95,625 $12,998 - $91,125 $87,163 $64,710 $67,302 $71,835 $120,000 $127,710MRA - The Mgmt Assoc. (WI) 11 32 $78,411 $77,517 $65,125 $78,376 $88,952 $17,377 - $96,588 $94,894 $67,820 $76,394 $93,351 $114,356 $120,556
continued
(60) District Sales ManagerCompensation Strategy: Salary + Bonus
Reports to second level sales manager or regional sales manager. Responsible for managing the sale of products and/or services in a district. Directs staffing, training, and performance evaluations of assigned sales reps, inside sales reps, manufacturing reps and/or administrative office personnel. Develops relationships with local dealers or other distributors. Analyzes sales volume and monitors competitor activities in the district.
Effective Date:September 2010
Total CompensationBase Pay Variable Pay
National Data - Effective September 2010 47 © 2011 Employer Associations of America (EAA)

(60) District Sales ManagerCompensation Strategy: Salary + Bonus
Bonus Commission# of Orgs
# of Emp
Un-Wtd Avg
WtdAvg P25 Median P75
Wtd Annual Avg
Wtd Annual Avg
Un-Wtd Avg
WtdAvg P10 P25 Median P75 P90
Customer TypeIndustry 12 40 $98,156 $104,025 $88,216 $108,852 $117,602 $11,757 - $108,276 $115,782 $72,819 $99,753 $118,030 $133,562 $143,207Distributors/Wholesalers 9 26 $82,717 $83,903 $66,394 $78,198 $96,651 $16,320 - $98,093 $100,223 $66,575 $78,940 $94,588 $114,233 $160,403Retailers 13 41 $78,225 $70,901 $57,899 $65,500 $86,250 $12,994 - $95,258 $83,895 $58,542 $63,857 $74,947 $102,804 $125,023Consumers 6 15 $68,367 $70,444 $55,000 $70,144 $84,223 $11,916 - $80,795 $82,360 $52,548 $65,000 $85,600 $96,063 $107,851
IndustryNon-Durable Goods Manufacturing 18 65 $85,325 $91,536 $73,375 $87,800 $111,505 $16,219 - $102,654 $107,754 $72,186 $85,293 $103,195 $128,766 $143,764Durable Goods Manufacturing 11 24 $87,463 $84,054 $59,728 $85,275 $107,250 $13,172 - $99,712 $97,226 $54,030 $69,194 $98,608 $124,015 $130,629Wholesale and Retail Trade 5 24 $70,833 $63,962 $56,153 $58,678 $70,866 $5,628 - $75,979 $69,590 $56,266 $60,233 $67,278 $75,195 $91,529
Base Pay Variable Pay Total Compensation
National Data - Effective September 2010 48 © 2011 Employer Associations of America (EAA)

Bonus Commission# of Orgs
# of Emp
Un-Wtd Avg
WtdAvg P25 Median P75
Wtd Annual Avg
Wtd Annual Avg
Un-Wtd Avg
WtdAvg P10 P25 Median P75 P90
Total Responses 16 35 $70,921 $66,951 $44,000 $65,000 $80,004 $5,001 $23,274 $102,802 $95,226 $58,850 $72,875 $86,437 $113,308 $141,121
Org Sales Volume0.0-26.9 million 4 7 $68,822 $67,939 - $67,039 - $10,760 $28,818 $106,362 $107,517 - - $101,798 - -27.0-99.9 million 11 22 $72,341 $67,522 $42,886 $59,552 $91,075 $4,261 $21,862 $102,973 $93,645 $55,241 $67,675 $79,633 $108,755 $152,289
RegionGreat Lakes 9 23 $69,927 $65,817 $40,000 $67,039 $94,300 $6,606 $21,005 $96,679 $93,428 $54,819 $75,000 $91,700 $114,043 $126,822
AssociationAmerican Society of Employers (MI) 3 7 $60,862 $65,239 - $59,944 - $0 $12,063 $69,206 $77,302 - - $77,241 - -Employers Resource Assoc. (OH) 4 9 $70,521 $77,358 - $75,000 - $12,444 $29,767 $129,053 $119,570 - - $119,788 - -MRA - The Mgmt Assoc. (WI) 3 5 $81,167 $64,700 - $40,000 - $8,420 $21,882 $104,625 $95,002 - - $91,700 - -
continued
Base Pay Variable Pay
(60) District Sales ManagerCompensation Strategy: Salary + Commission + Bonus
Reports to second level sales manager or regional sales manager. Responsible for managing the sale of products and/or services in a district. Directs staffing, training, and performance evaluations of assigned sales reps, inside sales reps, manufacturing reps and/or administrative office personnel. Develops relationships with local dealers or other distributors. Analyzes sales volume and monitors competitor activities in the district.
Effective Date:September 2010
Total Compensation
National Data - Effective September 2010 49 © 2011 Employer Associations of America (EAA)

(60) District Sales ManagerCompensation Strategy: Salary + Commission + Bonus
Bonus Commission# of Orgs
# of Emp
Un-Wtd Avg
WtdAvg P25 Median P75
Wtd Annual Avg
Wtd Annual Avg
Un-Wtd Avg
WtdAvg P10 P25 Median P75 P90
Customer TypeIndustry 9 15 $73,762 $71,559 $55,000 $63,333 $90,000 $6,950 $30,291 $115,130 $108,800 $58,196 $77,241 $100,241 $122,668 $186,287Distributors/Wholesalers 6 17 $72,498 $68,363 $40,000 $69,730 $87,152 $3,944 $16,780 $91,089 $89,088 $59,397 $75,000 $86,437 $103,107 $117,153
IndustryNon-Durable Goods Manufacturing 3 3 $101,823 $101,823 - $103,500 - $3,461 $27,220 $132,504 $132,504 - - $113,308 - -Durable Goods Manufacturing 6 14 $66,797 $67,319 $43,000 $68,385 $83,575 $4,536 $20,501 $92,081 $92,356 $64,837 $74,469 $85,250 $103,158 $144,003Wholesale and Retail Trade 3 11 $60,484 $64,473 - $65,000 - $545 $19,667 $76,488 $84,685 - - $85,823 - -
Base Pay Variable Pay Total Compensation
National Data - Effective September 2010 50 © 2011 Employer Associations of America (EAA)

Bonus Commission# of Orgs
# of Emp
Un-Wtd Avg
WtdAvg P25 Median P75
Wtd Annual Avg
Wtd Annual Avg
Un-Wtd Avg
WtdAvg P10 P25 Median P75 P90
Total Responses 3 12 - - - - - $1,708 $121,811 $96,481 $123,519 - - $141,620 - -
Org Sales Volume
RegionGreat Lakes 3 12 - - - - - $1,708 $121,811 $96,481 $123,519 - - $141,620 - -
Association
continued
(60) District Sales ManagerCompensation Strategy: Commission + Bonus
Reports to second level sales manager or regional sales manager. Responsible for managing the sale of products and/or services in a district. Directs staffing, training, and performance evaluations of assigned sales reps, inside sales reps, manufacturing reps and/or administrative office personnel. Develops relationships with local dealers or other distributors. Analyzes sales volume and monitors competitor activities in the district.
Effective Date:September 2006
Total CompensationBase Pay Variable Pay
Insufficient Data
Insufficient Data
National Data - Effective September 2010 51 © 2011 Employer Associations of America (EAA)

(60) District Sales ManagerCompensation Strategy: Commission + Bonus
Bonus Commission# of Orgs
# of Emp
Un-Wtd Avg
WtdAvg P25 Median P75
Wtd Annual Avg
Wtd Annual Avg
Un-Wtd Avg
WtdAvg P10 P25 Median P75 P90
Customer Type
Industry
Insufficient Data
Insufficient Data
Base Pay Variable Pay Total Compensation
National Data - Effective September 2010 52 © 2011 Employer Associations of America (EAA)

Bonus Commission# of Orgs
# of Emp
Un-Wtd Avg
WtdAvg P25 Median P75
Wtd Annual Avg
Wtd Annual Avg
Un-Wtd Avg
WtdAvg P10 P25 Median P75 P90
Total Responses 16 29 - - - - - - - $73,368 $66,949 $50,500 $54,342 $62,219 $73,807 $90,450
Org Sales Volume0.0-26.9 million 5 6 - - - - - - - $78,091 $75,977 $60,000 $61,664 $65,410 $90,081 $124,07527.0-99.9 million 4 6 - - - - - - - $83,230 $79,473 - - $76,536 - -100.0 million+ 7 17 - - - - - - - $64,360 $59,342 $44,624 $52,961 $55,399 $64,054 $79,552
RegionGreat Lakes 9 18 - - - - - - - $72,035 $64,339 $49,818 $54,556 $59,976 $65,749 $93,813Mountain 4 7 - - - - - - - $83,332 $77,522 - - $70,786 - -
AssociationTrusight (MN) - formerly EA 3 3 - - - - - - - $91,508 $91,508 - - $90,450 - -Mtn States Employers Council (CO) 4 7 - - - - - - - $83,332 $77,522 - - $70,786 - -MRA - The Mgmt Assoc. (WI) 4 12 - - - - - - - $56,627 $55,944 - - $54,864 - -
continued
Base Pay Variable Pay
(70) Sales TrainerCombined Compensation Type
Develops and administers sales training programs to the organization’s sales trainees and sales personnel. Presents established and effective sales training methods, techniques, and ideas. Schedules and introduces presentations by internal or outside lecturers, motivational speakers, and sales or product specialists. Reports on progress of sales trainees and sales personnel. Assists in developing new training courses associated with the introduction of new products or services.
Effective Date:September 2010
Total Compensation
National Data - Effective September 2010 53 © 2011 Employer Associations of America (EAA)

(70) Sales TrainerCombined Compensation Type
Bonus Commission# of Orgs
# of Emp
Un-Wtd Avg
WtdAvg P25 Median P75
Wtd Annual Avg
Wtd Annual Avg
Un-Wtd Avg
WtdAvg P10 P25 Median P75 P90
Customer TypeDistributors/Wholesalers 4 4 - - - - - - - $66,492 $66,492 - - $63,610 - -Consumers 9 15 - - - - - - - $74,306 $67,793 $44,388 $52,147 $63,108 $82,287 $103,900
IndustryWholesale and Retail Trade 7 12 - - - - - - - $61,514 $59,279 $44,034 $52,803 $60,763 $65,000 $75,524
Base Pay Variable Pay Total Compensation
National Data - Effective September 2010 54 © 2011 Employer Associations of America (EAA)

Bonus Commission# of Orgs
# of Emp
Un-Wtd Avg
WtdAvg P25 Median P75
Wtd Annual Avg
Wtd Annual Avg
Un-Wtd Avg
WtdAvg P10 P25 Median P75 P90
Total Responses 6 11 $61,914 $59,294 $52,147 $61,526 $65,000 - - $61,914 $59,294 $43,916 $52,147 $61,526 $65,000 $76,599
Org Sales Volume100.0 million+ 4 9 $56,934 $56,498 - $55,399 - - - $56,934 $56,498 - - $55,399 - -
RegionGreat Lakes 3 7 $59,744 $58,783 - $61,526 - - - $59,744 $58,783 - - $61,526 - -
AssociationMRA - The Mgmt Assoc. (WI) 3 6 $57,000 $56,380 - $55,085 - - - $57,000 $56,380 - - $55,085 - -
continued
(70) Sales TrainerCompensation Strategy: Straight Salary
Develops and administers sales training programs to the organization’s sales trainees and sales personnel. Presents established and effective sales training methods, techniques, and ideas. Schedules and introduces presentations by internal or outside lecturers, motivational speakers, and sales or product specialists. Reports on progress of sales trainees and sales personnel. Assists in developing new training courses associated with the introduction of new products or services.
Effective Date:September 2010
Total CompensationBase Pay Variable Pay
National Data - Effective September 2010 55 © 2011 Employer Associations of America (EAA)

(70) Sales TrainerCompensation Strategy: Straight Salary
Bonus Commission# of Orgs
# of Emp
Un-Wtd Avg
WtdAvg P25 Median P75
Wtd Annual Avg
Wtd Annual Avg
Un-Wtd Avg
WtdAvg P10 P25 Median P75 P90
Customer TypeConsumers 4 9 $56,934 $56,498 - $55,399 - - - $56,934 $56,498 - - $55,399 - -
IndustryWholesale and Retail Trade 5 10 $61,675 $58,913 $50,325 $58,463 $65,749 - - $61,675 $58,913 $43,798 $50,325 $58,463 $65,749 $77,675
Base Pay Variable Pay Total Compensation
National Data - Effective September 2010 56 © 2011 Employer Associations of America (EAA)

Bonus Commission# of Orgs
# of Emp
Un-Wtd Avg
WtdAvg P25 Median P75
Wtd Annual Avg
Wtd Annual Avg
Un-Wtd Avg
WtdAvg P10 P25 Median P75 P90
Total Responses 3 6 $61,879 $59,489 - $60,535 - - $3,400 $67,479 $62,889 - - $61,385 - -
Org Sales Volume
Region
Association
continued
Insufficient Data
Insufficient Data
Insufficient Data
(70) Sales TrainerCompensation Strategy: Salary Plus Commission
Develops and administers sales training programs to the organization’s sales trainees and sales personnel. Presents established and effective sales training methods, techniques, and ideas. Schedules and introduces presentations by internal or outside lecturers, motivational speakers, and sales or product specialists. Reports on progress of sales trainees and sales personnel. Assists in developing new training courses associated with the introduction of new products or services.
Effective Date:September 2010
Base Pay Variable Pay Total Compensation
National Data - Effective September 2010 57 © 2011 Employer Associations of America (EAA)

(70) Sales TrainerCompensation Strategy: Salary Plus Commission
Bonus Commission# of Orgs
# of Emp
Un-Wtd Avg
WtdAvg P25 Median P75
Wtd Annual Avg
Wtd Annual Avg
Un-Wtd Avg
WtdAvg P10 P25 Median P75 P90
Customer Type
Industry
Insufficient Data
Insufficient Data
Base Pay Variable Pay Total Compensation
National Data - Effective September 2010 58 © 2011 Employer Associations of America (EAA)

Bonus Commission# of Orgs
# of Emp
Un-Wtd Avg
WtdAvg P25 Median P75
Wtd Annual Avg
Wtd Annual Avg
Un-Wtd Avg
WtdAvg P10 P25 Median P75 P90
Total Responses 7 10 $63,002 $59,836 $50,310 $56,453 $69,832 $12,729 - $77,960 $72,565 $51,379 $54,696 $65,393 $85,363 $120,645
Org Sales Volume27.0-99.9 million 3 4 $65,083 $61,427 - $57,371 - $20,960 - $87,389 $82,388 - - $77,226 - -100.0 million+ 3 5 $65,923 $60,931 - $57,120 - $6,289 - $74,517 $67,220 - - $59,952 - -
RegionGreat Lakes 4 6 $61,442 $58,776 - $54,623 - $7,241 - $70,888 $66,017 - - $59,976 - -Mountain 3 4 $65,083 $61,427 - $57,371 - $20,960 - $87,389 $82,388 - - $77,226 - -
AssociationMtn States Employers Council (CO) 3 4 $65,083 $61,427 - $57,371 - $20,960 - $87,389 $82,388 - - $77,226 - -
continued
(70) Sales TrainerCompensation Strategy: Salary + Bonus
Develops and administers sales training programs to the organization’s sales trainees and sales personnel. Presents established and effective sales training methods, techniques, and ideas. Schedules and introduces presentations by internal or outside lecturers, motivational speakers, and sales or product specialists. Reports on progress of sales trainees and sales personnel. Assists in developing new training courses associated with the introduction of new products or services.
Effective Date:September 2010
Total CompensationBase Pay Variable Pay
National Data - Effective September 2010 59 © 2011 Employer Associations of America (EAA)

(70) Sales TrainerCompensation Strategy: Salary + Bonus
Bonus Commission# of Orgs
# of Emp
Un-Wtd Avg
WtdAvg P25 Median P75
Wtd Annual Avg
Wtd Annual Avg
Un-Wtd Avg
WtdAvg P10 P25 Median P75 P90
Customer TypeConsumers 3 4 $64,930 $61,313 - $63,229 - $14,198 - $78,220 $75,511 - - $80,248 - -
Industry
Base Pay Variable Pay Total Compensation
Insufficient Data
National Data - Effective September 2010 60 © 2011 Employer Associations of America (EAA)

Bonus Commission# of Orgs
# of Emp
Un-Wtd Avg
WtdAvg P25 Median P75
Wtd Annual Avg
Wtd Annual Avg
Un-Wtd Avg
WtdAvg P10 P25 Median P75 P90
Total Responses *17 87 - - - - - - - $89,519 $70,234 $46,180 $49,511 $58,000 $87,755 $115,510
Org Sales Volume0.0-26.9 million 5 13 - - - - - - - $93,318 $97,485 $76,005 $84,000 $91,194 $107,636 $137,24227.0-99.9 million *5 21 - - - - - - - $86,223 $87,618 $48,572 $58,358 $80,361 $110,367 $146,000100.0 million+ *7 53 - - - - - - - $89,158 $56,662 $44,520 $48,746 $51,121 $58,588 $78,835
RegionGreat Lakes *11 71 - - - - - - - $87,400 $65,652 $45,669 $48,994 $52,878 $81,000 $104,595Pacific *3 4 - - - - - - - $85,642 $80,191 - - $71,830 - -
AssociationTrusight (MN) - formerly EA *3 50 - - - - - - - $70,140 $53,789 - - $50,682 - -MRA - The Mgmt Assoc. (WI) 6 14 - - - - - - - $97,093 $81,500 $47,786 $51,703 $88,940 $96,459 $125,263
continued
Total Compensation
(100) Field Sales SupervisorCombined Compensation Type
Supervises the training and assignments of the field sales personnel in one or more territories. Directs sales campaigns in new territories, new industries or with new products or services. Provides assistance to Sales Representatives in the promotion of new major accounts. Coordinates and assists with the technical engineering services to determine customers' needs. Supervises the development of quotations, installations, warranty service obligations and various details to ensure conformance with company marketing policies. Investigates major account warranty claims and ensure appropriate services and resolution of complaints. Conducts sales staff meetings to ensure current knowledge of sales promotion and advertising programs, newproducts or services, marketing polices, etc. Evaluates orders, sales activity reports, expense accounts, etc., and develops recommendations relative to sales techniques, programs, etc.
Effective Date:September 2010
Base Pay Variable Pay
National Data - Effective September 2010 61 © 2011 Employer Associations of America (EAA)

(100) Field Sales SupervisorCombined Compensation Type
Bonus Commission# of Orgs
# of Emp
Un-Wtd Avg
WtdAvg P25 Median P75
Wtd Annual Avg
Wtd Annual Avg
Un-Wtd Avg
WtdAvg P10 P25 Median P75 P90
Customer TypeIndustry 8 18 - - - - - - - $105,781 $103,527 $76,839 $85,500 $92,724 $127,341 $151,000Distributors/Wholesalers 5 13 - - - - - - - $89,961 $95,681 $61,185 $71,830 $98,166 $111,971 $137,242Consumers *3 9 - - - - - - - $63,684 $62,155 - - $58,000 - -
IndustryDurable Goods Manufacturing 7 12 - - - - - - - $101,672 $101,858 $61,920 $82,500 $102,184 $118,750 $144,331Wholesale and Retail Trade *3 8 - - - - - - - $71,919 $62,235 - - $55,731 - -
* More than 30% of sample supplied by one organization.
Base Pay Variable Pay Total Compensation
National Data - Effective September 2010 62 © 2011 Employer Associations of America (EAA)

Bonus Commission# of Orgs
# of Emp
Un-Wtd Avg
WtdAvg P25 Median P75
Wtd Annual Avg
Wtd Annual Avg
Un-Wtd Avg
WtdAvg P10 P25 Median P75 P90
Total Responses 6 13 $62,612 $66,985 $59,953 $66,000 $75,000 - $23,205 $88,527 $90,189 $72,996 $80,555 $89,054 $97,028 $110,655
Org Sales Volume0.0-26.9 million 3 7 $62,565 $69,406 - $74,000 - - $18,541 $87,225 $87,948 - - $89,054 - -
RegionGreat Lakes 3 7 $62,179 $69,241 - $74,000 - - $20,418 $91,218 $89,659 - - $89,054 - -
Association
continued
Insufficient Data
(100) Field Sales SupervisorCompensation Strategy: Salary + Commission
Supervises the training and assignments of the field sales personnel in one or more territories. Directs sales campaigns in new territories, new industries or with new products or services. Provides assistance to Sales Representatives in the promotion of new major accounts. Coordinates and assists with the technical engineering services to determine customers' needs. Supervises the development of quotations, installations, warranty service obligations and various details to ensure conformance with company marketing policies. Investigates major account warranty claims and ensure appropriate services and resolution of complaints. Conducts sales staff meetings to ensure current knowledge of sales promotion and advertising programs, newproducts or services, marketing polices, etc. Evaluates orders, sales activity reports, expense accounts, etc., and develops recommendations relative to sales techniques, programs, etc.
Effective Date:September 2010
Base Pay Variable Pay Total Compensation
National Data - Effective September 2010 63 © 2011 Employer Associations of America (EAA)

(100) Field Sales SupervisorCompensation Strategy: Salary + Commission
Bonus Commission# of Orgs
# of Emp
Un-Wtd Avg
WtdAvg P25 Median P75
Wtd Annual Avg
Wtd Annual Avg
Un-Wtd Avg
WtdAvg P10 P25 Median P75 P90
Customer TypeDistributors/Wholesalers 3 5 $59,719 $62,231 - $66,000 - - $35,317 $92,679 $97,548 - - $98,166 - -
Industry Insufficient Data
Base Pay Variable Pay Total Compensation
National Data - Effective September 2010 64 © 2011 Employer Associations of America (EAA)

Bonus Commission# of Orgs
# of Emp
Un-Wtd Avg
WtdAvg P25 Median P75
Wtd Annual Avg
Wtd Annual Avg
Un-Wtd Avg
WtdAvg P10 P25 Median P75 P90
Total Responses *8 62 $71,467 $57,807 $48,501 $50,678 $58,460 $2,030 - $82,858 $59,837 $45,176 $48,636 $51,642 $58,942 $87,529
Org Sales Volume27.0-99.9 million 5 13 $76,389 $79,630 $48,572 $66,000 $106,378 $6,974 - $92,835 $86,604 $47,629 $50,659 $70,283 $128,227 $156,000
RegionGreat Lakes *6 59 $73,649 $57,464 $48,289 $50,060 $57,244 $1,108 - $78,762 $58,572 $45,000 $48,572 $51,121 $58,267 $87,000
Association
continued
(100) Field Sales SupervisorCompensation Strategy: Salary + Bonus
Supervises the training and assignments of the field sales personnel in one or more territories. Directs sales campaigns in new territories, new industries or with new products or services. Provides assistance to Sales Representatives in the promotion of new major accounts. Coordinates and assists with the technical engineering services to determine customers' needs. Supervises the development of quotations, installations, warranty service obligations and various details to ensure conformance with company marketing policies. Investigates major account warranty claims and ensure appropriate services and resolution of complaints. Conducts sales staff meetings to ensure current knowledge of sales promotion and advertising programs, newproducts or services, marketing polices, etc. Evaluates orders, sales activity reports, expense accounts, etc., and develops recommendations relative to sales techniques, programs, etc.
Effective Date:September 2010
Base Pay Variable Pay Total Compensation
Insufficient Data
National Data - Effective September 2010 65 © 2011 Employer Associations of America (EAA)

(100) Field Sales SupervisorCompensation Strategy: Salary + Bonus
Bonus Commission# of Orgs
# of Emp
Un-Wtd Avg
WtdAvg P25 Median P75
Wtd Annual Avg
Wtd Annual Avg
Un-Wtd Avg
WtdAvg P10 P25 Median P75 P90
Customer TypeIndustry 3 6 $94,944 $107,833 - $100,500 - $14,576 - $119,040 $122,409 - - $128,227 - -Consumers 3 9 $57,537 $59,911 - $52,746 - $2,245 - $63,684 $62,155 - - $58,000 - -
Industry
* More than 30% of sample supplied by one organization
Insufficient Data
Base Pay Variable Pay Total Compensation
National Data - Effective September 2010 66 © 2011 Employer Associations of America (EAA)
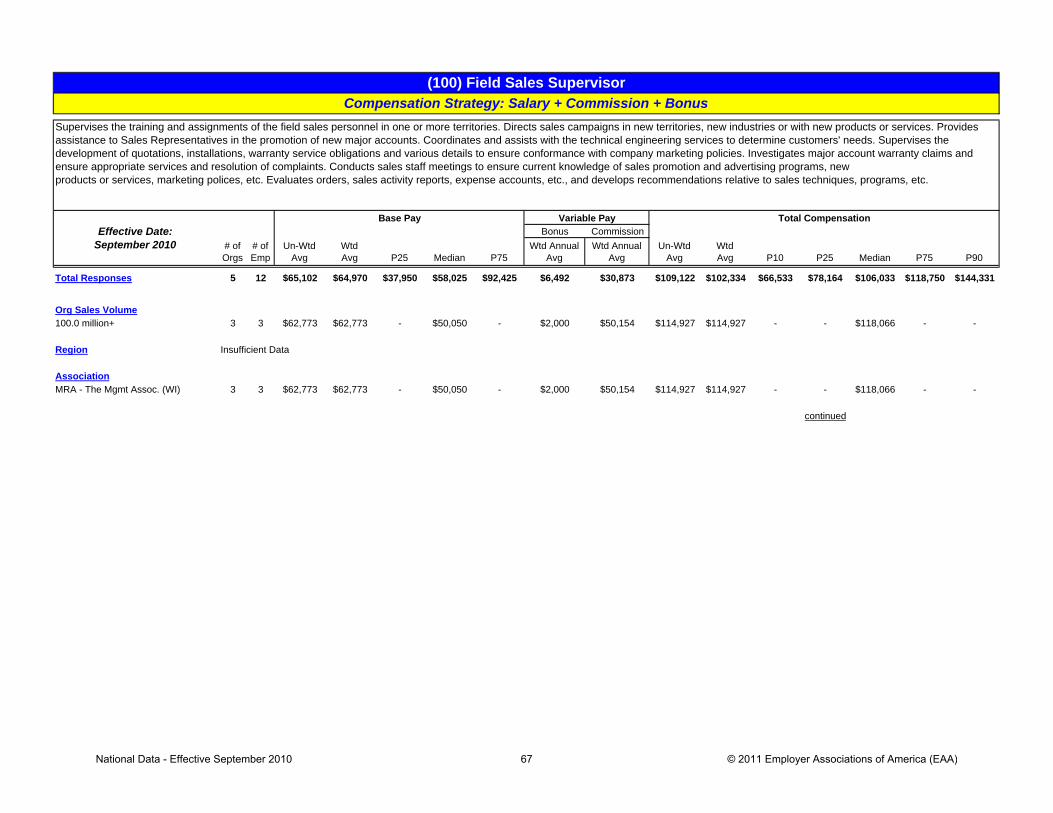
Bonus Commission# of Orgs
# of Emp
Un-Wtd Avg
WtdAvg P25 Median P75
Wtd Annual Avg
Wtd Annual Avg
Un-Wtd Avg
WtdAvg P10 P25 Median P75 P90
Total Responses 5 12 $65,102 $64,970 $37,950 $58,025 $92,425 $6,492 $30,873 $109,122 $102,334 $66,533 $78,164 $106,033 $118,750 $144,331
Org Sales Volume100.0 million+ 3 3 $62,773 $62,773 - $50,050 - $2,000 $50,154 $114,927 $114,927 - - $118,066 - -
Region
AssociationMRA - The Mgmt Assoc. (WI) 3 3 $62,773 $62,773 - $50,050 - $2,000 $50,154 $114,927 $114,927 - - $118,066 - -
continued
Insufficient Data
(100) Field Sales SupervisorCompensation Strategy: Salary + Commission + Bonus
Supervises the training and assignments of the field sales personnel in one or more territories. Directs sales campaigns in new territories, new industries or with new products or services. Provides assistance to Sales Representatives in the promotion of new major accounts. Coordinates and assists with the technical engineering services to determine customers' needs. Supervises the development of quotations, installations, warranty service obligations and various details to ensure conformance with company marketing policies. Investigates major account warranty claims and ensure appropriate services and resolution of complaints. Conducts sales staff meetings to ensure current knowledge of sales promotion and advertising programs, newproducts or services, marketing polices, etc. Evaluates orders, sales activity reports, expense accounts, etc., and develops recommendations relative to sales techniques, programs, etc.
Effective Date:September 2010
Base Pay Variable Pay Total Compensation
National Data - Effective September 2010 67 © 2011 Employer Associations of America (EAA)

(100) Field Sales SupervisorCompensation Strategy: Salary + Commission + Bonus
Bonus Commission# of Orgs
# of Emp
Un-Wtd Avg
WtdAvg P25 Median P75
Wtd Annual Avg
Wtd Annual Avg
Un-Wtd Avg
WtdAvg P10 P25 Median P75 P90
Customer TypeIndustry 4 6 $59,396 $56,020 - $49,075 - $10,249 $33,661 $107,428 $99,930 - - $100,059 - -
IndustryDurable Goods Manufacturing 4 7 $70,737 $80,977 - $90,168 - $1,762 $35,611 $116,424 $118,350 - - $118,066 - -
Base Pay Variable Pay Total Compensation
National Data - Effective September 2010 68 © 2011 Employer Associations of America (EAA)

Bonus Commission# of Orgs
# of Emp
Un-Wtd Avg
WtdAvg P25 Median P75
Wtd Annual Avg
Wtd Annual Avg
Un-Wtd Avg
WtdAvg P10 P25 Median P75 P90
Total Responses 119 257 - - - - - - - $120,376 $117,951 $71,191 $89,997 $110,000 $136,962 $174,835
Org Sales Volume0.0-26.9 million 32 43 - - - - - - - $111,187 $104,618 $58,107 $70,878 $92,123 $123,377 $179,23227.0-99.9 million 52 101 - - - - - - - $122,806 $119,100 $78,363 $90,005 $108,000 $136,480 $182,212100.0 million+ 35 113 - - - - - - - $125,166 $121,998 $81,230 $99,110 $115,585 $141,176 $170,286
RegionNortheast 4 5 - - - - - - - $130,740 $135,365 - - $133,348 - -Southeast 3 34 - - - - - - - $140,570 $107,574 - - $105,617 - -Great Lakes 92 181 - - - - - - - $120,451 $117,899 $71,548 $91,377 $110,000 $133,916 $176,077Central 3 3 - - - - - - - $143,168 $143,168 - - $156,000 - -Mountain 12 27 - - - - - - - $117,083 $129,524 $88,072 $100,000 $127,331 $148,792 $166,947Pacific 5 7 - - - - - - - $92,808 $101,825 $49,000 $68,000 $84,700 $148,875 $190,604
AssociationAmerican Society of Employers (MI) 8 48 - - - - - - - $94,519 $97,028 $66,915 $84,092 $97,471 $110,663 $122,801Trusight (MN) - formerly EA 14 26 - - - - - - - $105,589 $110,353 $66,516 $78,610 $103,008 $130,210 $183,940Employers Resource Assoc. (OH) 19 30 - - - - - - - $129,079 $127,139 $84,550 $96,000 $116,165 $155,700 $183,600Employers Resource Council (OH) 7 11 - - - - - - - $116,308 $109,090 $64,674 $80,000 $107,520 $127,152 $176,000Mtn States Employers Council (CO) 8 19 - - - - - - - $104,385 $118,527 $84,869 $90,010 $124,155 $147,431 $152,784MRA - The Mgmt Assoc. (N. IL) 6 11 - - - - - - - $120,951 $128,333 $106,660 $114,600 $129,740 $131,715 $157,254MRA - The Mgmt Assoc. (WI) 34 73 - - - - - - - $125,312 $119,744 $68,800 $91,577 $111,597 $143,728 $173,495The Employers Council (UT) 3 6 - - - - - - - $143,108 $160,660 - - $135,288 - -The Management Assoc. of Illinois (IL) 13 25 - - - - - - - $146,820 $146,425 $91,000 $116,503 $134,082 $178,546 $209,098
continued
Base Pay Variable Pay
(110) National Accounts ManagerCombined Compensation Type
Reports to top sales executive or second level sales manager. Develops and implements national sales strategies for increasing sales and profits through national customers. Manages only national or major (key) accounts. Calls on national accounts, presents sales material and follows up on sales service.
Effective Date:September 2010
Total Compensation
National Data - Effective September 2010 69 © 2011 Employer Associations of America (EAA)

(110) National Accounts ManagerCombined Compensation Type
Bonus Commission# of Orgs
# of Emp
Un-Wtd Avg
WtdAvg P25 Median P75
Wtd Annual Avg
Wtd Annual Avg
Un-Wtd Avg
WtdAvg P10 P25 Median P75 P90
Customer TypeIndustry 67 121 - - - - - - - $123,906 $119,424 $73,807 $89,812 $109,317 $138,000 $186,720Distributors/Wholesalers 32 85 - - - - - - - $124,388 $116,161 $67,600 $89,997 $107,087 $132,875 $165,317Retailers 24 43 - - - - - - - $112,022 $117,422 $63,607 $89,673 $114,000 $147,431 $165,974Consumers 4 8 - - - - - - - $103,477 $117,545 - - $130,550 - -
IndustryNon-Durable Goods Manufacturing 40 114 - - - - - - - $132,662 $122,051 $75,150 $94,625 $111,928 $138,541 $175,582Durable Goods Manufacturing 48 98 - - - - - - - $115,426 $114,194 $77,680 $89,593 $108,263 $133,448 $162,043Wholesale and Retail Trade 11 13 - - - - - - - $97,751 $95,117 $52,937 $65,439 $100,033 $116,165 $138,200Information 3 6 - - - - - - - $76,920 $74,368 - - $70,655 - -Professional and Business Services 3 4 - - - - - - - $115,040 $105,632 - - $77,407 - -Education and Health Services 4 4 - - - - - - - $120,883 $120,883 - - $128,500 - -Other Services 6 9 - - - - - - - $147,200 $163,467 $80,984 $107,449 $176,659 $221,817 $244,328
Base Pay Variable Pay Total Compensation
National Data - Effective September 2010 70 © 2011 Employer Associations of America (EAA)

Bonus Commission# of Orgs
# of Emp
Un-Wtd Avg
WtdAvg P25 Median P75
Wtd Annual Avg
Wtd Annual Avg
Un-Wtd Avg
WtdAvg P10 P25 Median P75 P90
Total Responses 27 52 $107,073 $104,821 $84,775 $101,000 $117,000 - - $107,073 $104,821 $67,048 $84,775 $101,000 $117,000 $152,550
Org Sales Volume0.0-26.9 million 9 11 $98,475 $90,752 $55,950 $82,000 $110,000 - - $98,475 $90,752 $48,400 $55,950 $82,000 $110,000 $170,31927.0-99.9 million 15 33 $111,642 $107,941 $86,500 $100,000 $125,304 - - $111,642 $107,941 $67,496 $86,500 $100,000 $125,304 $172,560100.0 million+ 3 8 $110,025 $111,297 - $110,760 - - - $110,025 $111,297 - - $110,760 - -
RegionGreat Lakes 22 46 $106,215 $103,068 $84,925 $100,000 $113,475 - - $106,215 $103,068 $67,112 $84,925 $100,000 $113,475 $134,350
AssociationAmerican Society of Employers (MI) 4 16 $97,558 $96,734 - $93,600 - - - $97,558 $96,734 - - $93,600 - -Trusight (MN) - formerly EA 4 5 $86,806 $85,290 - $91,290 - - - $86,806 $85,290 - - $91,290 - -Employers Resource Assoc. (OH) 6 9 $136,289 $137,915 $112,900 $127,007 $169,800 - - $136,289 $137,915 $108,225 $112,900 $127,007 $169,800 $183,600Employers Resource Council (OH) 3 4 $138,089 $132,901 - $119,541 - - - $138,089 $132,901 - - $119,541 - -MRA - The Mgmt Assoc. (WI) 6 14 $104,095 $100,478 $69,500 $100,000 $114,900 - - $104,095 $100,478 $49,000 $69,500 $100,000 $114,900 $172,250
continued
(110) National Accounts ManagerCompensation Strategy: Straight Salary
Reports to top sales executive or second level sales manager. Develops and implements national sales strategies for increasing sales and profits through national customers. Manages only national or major (key) accounts. Calls on national accounts, presents sales material and follows up on sales service.
Effective Date:September 2010
Total CompensationBase Pay Variable Pay
National Data - Effective September 2010 71 © 2011 Employer Associations of America (EAA)

(110) National Accounts ManagerCompensation Strategy: Straight Salary
Bonus Commission# of Orgs
# of Emp
Un-Wtd Avg
WtdAvg P25 Median P75
Wtd Annual Avg
Wtd Annual Avg
Un-Wtd Avg
WtdAvg P10 P25 Median P75 P90
Customer TypeIndustry 16 36 $100,830 $100,352 $75,200 $93,600 $112,375 - - $100,830 $100,352 $55,365 $75,200 $93,600 $112,375 $164,280Distributors/Wholesalers 5 6 $108,873 $110,283 $104,015 $110,798 $115,736 - - $108,873 $110,283 $93,500 $104,015 $110,798 $115,736 $127,152Retailers 5 9 $120,668 $116,256 $95,850 $114,000 $126,800 - - $120,668 $116,256 $82,000 $95,850 $114,000 $126,800 $185,000
IndustryNon-Durable Goods Manufacturing 10 19 $120,630 $119,277 $91,290 $111,597 $144,500 - - $120,630 $119,277 $68,000 $91,290 $111,597 $144,500 $183,600Durable Goods Manufacturing 13 27 $106,594 $102,721 $88,200 $104,000 $113,300 - - $106,594 $102,721 $71,400 $88,200 $104,000 $113,300 $127,722
Base Pay Variable Pay Total Compensation
National Data - Effective September 2010 72 © 2011 Employer Associations of America (EAA)

Bonus Commission# of Orgs
# of Emp
Un-Wtd Avg
WtdAvg P25 Median P75
Wtd Annual Avg
Wtd Annual Avg
Un-Wtd Avg
WtdAvg P10 P25 Median P75 P90
Total Responses 32 61 $87,566 $86,758 $65,575 $87,035 $100,314 - $43,982 $134,521 $130,740 $73,282 $90,005 $117,199 $158,073 $219,840
Org Sales Volume0.0-26.9 million 11 17 $73,802 $69,848 $56,111 $71,250 $88,000 - $43,315 $123,322 $113,162 $64,534 $74,049 $95,496 $126,571 $247,74127.0-99.9 million 11 24 $100,864 $98,092 $69,654 $94,044 $118,000 - $35,186 $142,449 $133,278 $77,407 $90,430 $114,600 $147,288 $232,385100.0 million+ 10 20 $88,080 $87,531 $64,309 $89,696 $100,570 - $55,105 $138,119 $142,636 $62,098 $109,652 $141,125 $179,325 $204,652
RegionGreat Lakes 25 46 $86,704 $85,728 $61,800 $86,655 $100,157 - $43,742 $133,639 $129,470 $70,753 $89,343 $109,988 $149,125 $228,371
AssociationTrusight (MN) - formerly EA 3 6 $75,361 $72,542 - $73,125 - - $11,063 $87,452 $83,604 - - $81,057 - -Employers Resource Assoc. (OH) 3 5 $59,567 $61,480 - $62,400 - - $56,592 $110,650 $118,072 - - $93,000 - -MRA - The Mgmt Assoc. (WI) 11 23 $90,391 $91,515 $66,150 $92,000 $100,629 - $42,662 $146,119 $134,177 $61,068 $99,700 $117,199 $152,000 $245,776The Management Assoc. of Illinois (IL) 10 19 $99,183 $96,483 $85,711 $94,471 $117,701 - $64,335 $161,633 $160,818 $107,007 $132,733 $148,875 $190,604 $214,068
continued
(110) National Accounts ManagerCompensation Strategy: Salary + Commission
Reports to top sales executive or second level sales manager. Develops and implements national sales strategies for increasing sales and profits through national customers. Manages only national or major (key) accounts. Calls on national accounts, presents sales material and follows up on sales service.
Effective Date:September 2010
Total CompensationBase Pay Variable Pay
National Data - Effective September 2010 73 © 2011 Employer Associations of America (EAA)

(110) National Accounts ManagerCompensation Strategy: Salary + Commission
Bonus Commission# of Orgs
# of Emp
Un-Wtd Avg
WtdAvg P25 Median P75
Wtd Annual Avg
Wtd Annual Avg
Un-Wtd Avg
WtdAvg P10 P25 Median P75 P90
Customer TypeIndustry 23 38 $89,175 $89,833 $67,797 $89,696 $110,500 - $47,322 $139,230 $137,155 $79,332 $103,418 $124,688 $167,274 $221,390Distributors/Wholesalers 10 16 $97,769 $92,306 $67,964 $89,345 $99,768 - $37,605 $142,110 $129,912 $67,100 $86,152 $112,838 $168,003 $224,585Retailers 3 6 $54,075 $54,075 - $53,611 - - $46,538 $100,612 $100,612 - - $67,944 - -
IndustryNon-Durable Goods Manufacturing 11 21 $99,769 $95,636 $77,625 $90,900 $105,314 - $39,627 $155,050 $135,263 $84,939 $104,840 $117,199 $139,655 $257,598Durable Goods Manufacturing 11 21 $86,696 $86,528 $67,721 $87,847 $99,140 - $42,636 $129,243 $129,165 $69,044 $89,436 $132,733 $169,262 $193,691Other Services 3 6 $89,078 $97,872 - $110,000 - - $77,164 $154,073 $175,037 - - $198,971 - -
Base Pay Variable Pay Total Compensation
National Data - Effective September 2010 74 © 2011 Employer Associations of America (EAA)

Bonus Commission# of Orgs
# of Emp
Un-Wtd Avg
WtdAvg P25 Median P75
Wtd Annual Avg
Wtd Annual Avg
Un-Wtd Avg
WtdAvg P10 P25 Median P75 P90
Total Responses 49 128 $100,880 $101,610 $82,907 $95,895 $119,767 $15,788 - $117,410 $117,398 $74,447 $91,758 $112,225 $137,966 $158,447
Org Sales Volume0.0-26.9 million 6 7 $88,696 $86,046 $60,300 $80,000 $120,000 $2,581 - $90,939 $88,627 $49,000 $65,012 $84,500 $120,000 $140,00027.0-99.9 million 22 37 $98,584 $97,802 $79,000 $92,725 $122,078 $24,032 - $121,906 $121,833 $79,600 $99,017 $117,329 $149,356 $169,750100.0 million+ 21 84 $106,767 $104,584 $85,000 $101,244 $117,675 $13,258 - $120,264 $117,842 $78,198 $95,150 $112,943 $137,123 $155,899
RegionGreat Lakes 36 75 $101,469 $103,226 $85,000 $101,650 $120,000 $17,820 - $120,109 $121,045 $79,200 $99,219 $119,593 $142,400 $163,166Mountain 7 19 $114,879 $123,561 $93,756 $124,155 $139,203 $18,085 - $130,791 $141,645 $95,600 $111,300 $136,639 $152,784 $187,500Pacific 3 3 $71,100 $71,100 - $81,600 - $667 - $71,767 $71,767 - - $81,600 - -
AssociationTrusight (MN) - formerly EA 6 14 $107,131 $120,752 $89,544 $118,600 $159,152 $8,345 - $122,486 $129,097 $68,161 $101,919 $122,887 $171,746 $188,500Employers Resource Assoc. (OH) 7 10 $96,743 $85,715 $50,500 $89,750 $110,311 $36,123 - $119,537 $121,838 $89,550 $99,000 $116,165 $145,700 $171,935Mtn States Employers Council (CO) 4 13 $107,497 $117,451 - $124,155 - $15,418 - $121,553 $132,869 - - $136,639 - -MRA - The Mgmt Assoc. (N. IL) 5 10 $101,659 $109,778 $94,200 $112,541 $121,895 $18,412 - $119,188 $128,190 $106,455 $113,025 $129,670 $135,537 $158,535MRA - The Mgmt Assoc. (WI) 14 31 $94,028 $97,726 $83,400 $100,000 $116,644 $19,956 - $115,353 $117,683 $71,974 $91,782 $119,593 $143,456 $155,166The Employers Council (UT) 3 6 $124,723 $136,798 - $120,443 - $23,862 - $143,108 $160,660 - - $135,288 - -
continued
(110) National Accounts ManagerCompensation Strategy: Salary + Bonus
Reports to top sales executive or second level sales manager. Develops and implements national sales strategies for increasing sales and profits through national customers. Manages only national or major (key) accounts. Calls on national accounts, presents sales material and follows up on sales service.
Effective Date:September 2010
Total CompensationBase Pay Variable Pay
National Data - Effective September 2010 75 © 2011 Employer Associations of America (EAA)

(110) National Accounts ManagerCompensation Strategy: Salary + Bonus
Bonus Commission# of Orgs
# of Emp
Un-Wtd Avg
WtdAvg P25 Median P75
Wtd Annual Avg
Wtd Annual Avg
Un-Wtd Avg
WtdAvg P10 P25 Median P75 P90
Customer TypeIndustry 20 35 $105,888 $105,234 $88,000 $100,000 $119,600 $16,961 - $125,857 $122,196 $84,066 $102,000 $120,000 $138,303 $163,166Distributors/Wholesalers 16 61 $97,981 $96,772 $77,226 $91,052 $108,855 $15,778 - $115,749 $112,550 $67,000 $86,520 $106,404 $129,400 $156,082Retailers 14 26 $98,177 $107,994 $90,100 $112,593 $128,565 $13,359 - $109,954 $121,353 $69,118 $97,443 $121,874 $150,529 $163,891
IndustryNon-Durable Goods Manufacturing 18 73 $112,139 $105,804 $83,438 $101,650 $121,000 $13,470 - $127,479 $119,274 $67,000 $90,732 $112,200 $139,028 $164,840Durable Goods Manufacturing 19 40 $96,361 $97,335 $80,400 $92,788 $119,900 $20,735 - $117,658 $118,070 $80,160 $93,336 $115,012 $141,524 $155,599Wholesale and Retail Trade 7 7 $90,504 $90,504 $64,023 $93,756 $115,000 $7,780 - $98,284 $98,284 $49,000 $70,878 $106,250 $117,329 $129,500
Base Pay Variable Pay Total Compensation
National Data - Effective September 2010 76 © 2011 Employer Associations of America (EAA)
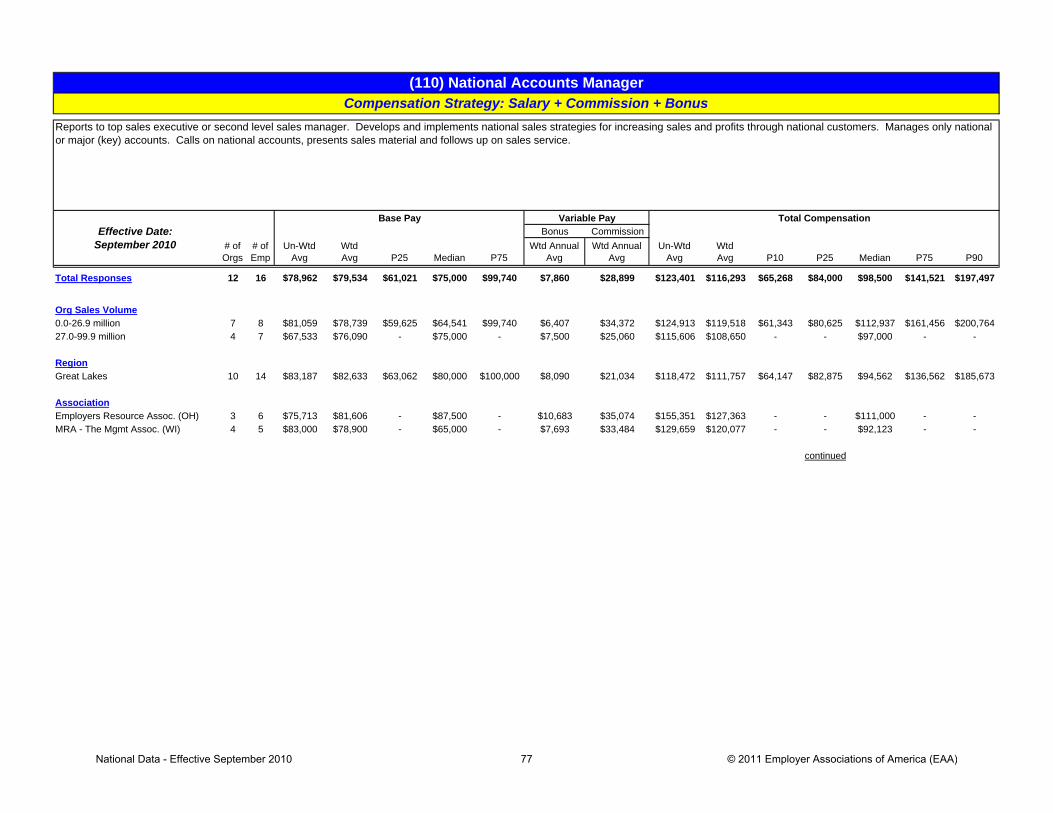
Bonus Commission# of Orgs
# of Emp
Un-Wtd Avg
WtdAvg P25 Median P75
Wtd Annual Avg
Wtd Annual Avg
Un-Wtd Avg
WtdAvg P10 P25 Median P75 P90
Total Responses 12 16 $78,962 $79,534 $61,021 $75,000 $99,740 $7,860 $28,899 $123,401 $116,293 $65,268 $84,000 $98,500 $141,521 $197,497
Org Sales Volume0.0-26.9 million 7 8 $81,059 $78,739 $59,625 $64,541 $99,740 $6,407 $34,372 $124,913 $119,518 $61,343 $80,625 $112,937 $161,456 $200,76427.0-99.9 million 4 7 $67,533 $76,090 - $75,000 - $7,500 $25,060 $115,606 $108,650 - - $97,000 - -
RegionGreat Lakes 10 14 $83,187 $82,633 $63,062 $80,000 $100,000 $8,090 $21,034 $118,472 $111,757 $64,147 $82,875 $94,562 $136,562 $185,673
AssociationEmployers Resource Assoc. (OH) 3 6 $75,713 $81,606 - $87,500 - $10,683 $35,074 $155,351 $127,363 - - $111,000 - -MRA - The Mgmt Assoc. (WI) 4 5 $83,000 $78,900 - $65,000 - $7,693 $33,484 $129,659 $120,077 - - $92,123 - -
continued
Base Pay Variable Pay
(110) National Accounts ManagerCompensation Strategy: Salary + Commission + Bonus
Reports to top sales executive or second level sales manager. Develops and implements national sales strategies for increasing sales and profits through national customers. Manages only national or major (key) accounts. Calls on national accounts, presents sales material and follows up on sales service.
Effective Date:September 2010
Total Compensation
National Data - Effective September 2010 77 © 2011 Employer Associations of America (EAA)

(110) National Accounts ManagerCompensation Strategy: Salary + Commission + Bonus
Bonus Commission# of Orgs
# of Emp
Un-Wtd Avg
WtdAvg P25 Median P75
Wtd Annual Avg
Wtd Annual Avg
Un-Wtd Avg
WtdAvg P10 P25 Median P75 P90
Customer TypeIndustry 8 12 $71,683 $74,872 $59,625 $70,975 $96,719 $7,000 $30,533 $121,123 $112,405 $63,025 $80,625 $91,812 $159,186 $199,364
IndustryDurable Goods Manufacturing 6 10 $75,993 $78,096 $59,875 $70,000 $92,500 $6,866 $13,268 $100,404 $98,230 $63,159 $82,875 $91,812 $127,188 $134,049
Base Pay Variable Pay Total Compensation
National Data - Effective September 2010 78 © 2011 Employer Associations of America (EAA)

Bonus Commission# of Orgs
# of Emp
Un-Wtd Avg
WtdAvg P25 Median P75
Wtd Annual Avg
Wtd Annual Avg
Un-Wtd Avg
WtdAvg P10 P25 Median P75 P90
Total Responses 88 329 - - - - - - - $88,302 $101,297 $57,915 $68,259 $85,000 $105,594 $144,084
Org Sales Volume0.0-26.9 million 35 71 - - - - - - - $83,189 $84,600 $53,760 $62,882 $75,500 $90,638 $108,49027.0-99.9 million 34 154 - - - - - - - $87,165 $106,425 $57,435 $66,442 $80,959 $113,764 $161,236100.0 million+ *19 104 - - - - - - - $99,754 $105,103 $63,000 $76,980 $96,430 $110,750 $153,508
RegionNortheast *3 11 - - - - - - - $102,143 $91,701 - - $87,148 - -Southeast 4 8 - - - - - - - $83,649 $81,192 - - $80,646 - -Great Lakes 71 245 - - - - - - - $87,108 $91,081 $57,313 $66,373 $80,000 $100,142 $128,083Central *3 19 - - - - - - - $99,429 $136,224 - - $102,156 - -Mountain *4 43 - - - - - - - $109,685 $152,502 - - $106,627 - -Pacific 3 3 - - - - - - - $69,265 $69,265 - - $59,100 - -
AssociationAmerican Society of Employers (MI) 11 21 - - - - - - - $76,826 $79,417 $59,757 $70,171 $75,000 $87,889 $112,791Trusight (MN) - formerly EA 19 88 - - - - - - - $82,377 $85,308 $52,552 $58,533 $68,259 $86,471 $139,473Employers Resource Assoc. (OH) *8 21 - - - - - - - $90,278 $93,402 $64,098 $73,847 $87,441 $110,853 $140,878Employers Resource Council (OH) *7 14 - - - - - - - $77,178 $81,223 $52,100 $69,006 $79,644 $91,305 $115,923MRA - The Mgmt Assoc. (WI) *21 99 - - - - - - - $95,741 $106,638 $63,600 $74,600 $91,081 $111,000 $169,484The Management Assoc. of Illinois (IL) 14 37 - - - - - - - $98,134 $94,341 $62,274 $82,353 $96,472 $102,636 $117,386
continued
Base Pay Variable Pay
(120) Sales EngineerCombined Compensation Type
Promotes the sale of company products or services requiring knowledge of engineering principles. Serves as liaison between the customer and the company on engineering matters regarding product application, sales, installation and services. Examines and analyze customers' needs, prepares specifications, design modifications, recommendations, etc. pertinent to the proposed installation. May take charge of installation and servicing of products where engineering is required.
Effective Date:September 2010
Total Compensation
National Data - Effective September 2010 79 © 2011 Employer Associations of America (EAA)

(120) Sales EngineerCombined Compensation Type
Bonus Commission# of Orgs
# of Emp
Un-Wtd Avg
WtdAvg P25 Median P75
Wtd Annual Avg
Wtd Annual Avg
Un-Wtd Avg
WtdAvg P10 P25 Median P75 P90
Customer TypeIndustry 74 268 - - - - - - - $88,960 $102,229 $60,482 $71,127 $85,552 $107,038 $140,434Distributors/Wholesalers 15 36 - - - - - - - $85,694 $87,967 $50,002 $57,791 $74,053 $89,808 $135,532
IndustryNon-Durable Goods Manufacturing *13 45 - - - - - - - $89,443 $85,775 $61,195 $63,946 $72,100 $82,682 $109,090Durable Goods Manufacturing 57 139 - - - - - - - $83,985 $83,898 $57,120 $66,827 $80,787 $98,272 $115,000Wholesale and Retail Trade *9 89 - - - - - - - $110,054 $117,391 $66,522 $77,474 $98,000 $130,250 $228,884Professional and Business Services 3 4 - - - - - - - $86,883 $83,350 - - $81,750 - -
* More than 30% of sample supplied by one organization.
Base Pay Variable Pay Total Compensation
National Data - Effective September 2010 80 © 2011 Employer Associations of America (EAA)

Bonus Commission# of Orgs
# of Emp
Un-Wtd Avg
WtdAvg P25 Median P75
Wtd Annual Avg
Wtd Annual Avg
Un-Wtd Avg
WtdAvg P10 P25 Median P75 P90
Total Responses 27 49 $73,956 $72,998 $59,750 $73,229 $84,000 - - $73,956 $72,998 $52,000 $59,750 $73,229 $84,000 $94,560
Org Sales Volume0.0-26.9 million 12 21 $71,636 $71,998 $59,750 $75,000 $85,000 - - $71,636 $71,998 $49,840 $59,750 $75,000 $85,000 $91,44127.0-99.9 million 13 24 $77,177 $74,526 $57,871 $72,614 $84,500 - - $77,177 $74,526 $51,000 $57,871 $72,614 $84,500 $103,598
RegionGreat Lakes 25 46 $74,643 $73,775 $60,800 $73,763 $85,000 - - $74,643 $73,775 $52,840 $60,800 $73,763 $85,000 $94,692
AssociationAmerican Society of Employers (MI) 5 7 $69,723 $71,898 $64,000 $70,342 $79,000 - - $69,723 $71,898 $58,700 $64,000 $70,342 $79,000 $83,000Trusight (MN) - formerly EA 5 13 $69,613 $69,167 $57,992 $65,481 $75,500 - - $69,613 $69,167 $54,768 $57,992 $65,481 $75,500 $94,824Employers Resource Assoc. (OH) 3 5 $79,256 $82,573 - $85,000 - - - $79,256 $82,573 - - $85,000 - -MRA - The Mgmt Assoc. (WI) 8 15 $77,066 $72,830 $54,222 $75,000 $85,000 - - $77,066 $72,830 $50,000 $54,222 $75,000 $85,000 $97,078The Management Assoc. of Illinois (IL) 3 5 $89,313 $87,747 - $90,126 - - - $89,313 $87,747 - - $90,126 - -
continued
(120) Sales EngineerCompensation Strategy: Straight Salary
Promotes the sale of company products or services requiring knowledge of engineering principles. Serves as liaison between the customer and the company on engineering matters regarding product application, sales, installation and services. Examines and analyze customers' needs, prepares specifications, design modifications, recommendations, etc. pertinent to the proposed installation. May take charge of installation and servicing of products where engineering is required.
Effective Date:September 2010
Total CompensationBase Pay Variable Pay
National Data - Effective September 2010 81 © 2011 Employer Associations of America (EAA)

(120) Sales EngineerCompensation Strategy: Straight Salary
Bonus Commission# of Orgs
# of Emp
Un-Wtd Avg
WtdAvg P25 Median P75
Wtd Annual Avg
Wtd Annual Avg
Un-Wtd Avg
WtdAvg P10 P25 Median P75 P90
Customer TypeIndustry 23 40 $74,949 $73,984 $61,267 $74,649 $84,500 - - $74,949 $73,984 $53,480 $61,267 $74,649 $84,500 $91,606Distributors/Wholesalers 4 9 $68,248 $68,616 - $62,541 - - - $68,248 $68,616 - - $62,541 - -
IndustryDurable Goods Manufacturing 24 44 $74,354 $73,210 $59,225 $72,614 $84,500 - - $74,354 $73,210 $52,600 $59,225 $72,614 $84,500 $94,780
Base Pay Variable Pay Total Compensation
National Data - Effective September 2010 82 © 2011 Employer Associations of America (EAA)

Bonus Commission# of Orgs
# of Emp
Un-Wtd Avg
WtdAvg P25 Median P75
Wtd Annual Avg
Wtd Annual Avg
Un-Wtd Avg
WtdAvg P10 P25 Median P75 P90
Total Responses 22 125 $73,531 $67,265 $51,000 $60,000 $79,500 - $45,779 $108,244 $113,045 $65,313 $73,846 $97,000 $127,937 $191,887
Org Sales Volume0.0-26.9 million 7 10 $78,412 $87,367 $55,675 $65,882 $79,750 - $31,020 $106,983 $118,387 $51,969 $72,166 $95,446 $119,219 $336,97827.0-99.9 million 10 60 $60,805 $57,907 $51,000 $54,500 $64,500 - $43,554 $95,676 $101,461 $62,373 $66,721 $78,790 $113,157 $171,450100.0 million+ 5 55 $92,147 $73,820 $60,000 $70,000 $90,000 - $50,891 $135,146 $124,711 $74,900 $87,031 $103,365 $133,424 $219,954
RegionGreat Lakes 16 91 $76,489 $67,644 $51,000 $62,000 $79,000 - $42,766 $111,594 $110,411 $66,679 $73,692 $95,000 $117,000 $171,231
AssociationTrusight (MN) - formerly EA 6 35 $71,705 $65,787 $51,000 $51,000 $82,000 - $39,597 $96,903 $105,384 $63,327 $67,349 $82,000 $133,424 $201,305MRA - The Mgmt Assoc. (WI) 5 52 $86,900 $70,923 $53,125 $63,300 $80,000 - $58,078 $152,537 $129,001 $72,370 $82,000 $102,000 $139,990 $248,177The Management Assoc. of Illinois (IL) 3 6 $85,214 $86,615 - $88,570 - - $19,933 $104,800 $106,548 - - $107,971 - -
continued
Base Pay Variable Pay
(120) Sales EngineerCompensation Strategy: Salary + Commission
Promotes the sale of company products or services requiring knowledge of engineering principles. Serves as liaison between the customer and the company on engineering matters regarding product application, sales, installation and services. Examines and analyze customers' needs, prepares specifications, design modifications, recommendations, etc. pertinent to the proposed installation. May take charge of installation and servicing of products where engineering is required.
Effective Date:September 2010
Total Compensation
National Data - Effective September 2010 83 © 2011 Employer Associations of America (EAA)

(120) Sales EngineerCompensation Strategy: Salary + Commission
Bonus Commission# of Orgs
# of Emp
Un-Wtd Avg
WtdAvg P25 Median P75
Wtd Annual Avg
Wtd Annual Avg
Un-Wtd Avg
WtdAvg P10 P25 Median P75 P90
Customer TypeIndustry 18 107 $74,051 $65,223 $51,000 $60,000 $70,200 - $41,800 $108,743 $107,023 $65,557 $73,000 $94,000 $116,732 $163,497Distributors/Wholesalers 4 5 $73,002 $77,381 - $59,800 - - $43,471 $104,166 $120,852 - - $81,363 - -
IndustryNon-Durable Goods Manufacturing 8 34 $70,881 $62,000 $51,000 $51,000 $63,500 - $28,806 $102,009 $90,806 $61,911 $65,399 $72,550 $84,325 $138,491Durable Goods Manufacturing 6 14 $76,999 $69,442 $57,579 $66,762 $73,750 - $31,459 $102,653 $100,901 $69,421 $73,924 $90,217 $123,446 $153,808Wholesale and Retail Trade 6 63 $79,099 $70,563 $52,500 $70,000 $86,000 - $59,546 $132,157 $130,109 $74,600 $94,000 $105,071 $144,084 $243,279
Base Pay Variable Pay Total Compensation
National Data - Effective September 2010 84 © 2011 Employer Associations of America (EAA)

Bonus Commission# of Orgs
# of Emp
Un-Wtd Avg
WtdAvg P25 Median P75
Wtd Annual Avg
Wtd Annual Avg
Un-Wtd Avg
WtdAvg P10 P25 Median P75 P90
Total Responses 39 105 $80,699 $75,445 $63,142 $74,644 $84,513 $11,230 - $92,370 $86,675 $55,950 $64,409 $82,000 $98,628 $113,865
Org Sales Volume0.0-26.9 million 13 23 $74,670 $74,268 $63,416 $73,950 $82,000 $1,609 - $76,841 $75,876 $59,460 $63,416 $74,500 $85,000 $100,31827.0-99.9 million 13 41 $87,013 $76,322 $61,434 $70,767 $83,215 $19,854 - $110,750 $96,176 $47,414 $65,354 $82,347 $111,425 $132,093100.0 million+ 13 41 $80,413 $75,228 $62,892 $76,053 $87,493 $8,003 - $89,519 $83,231 $55,306 $63,657 $86,170 $98,628 $104,751
RegionSoutheast 4 7 $79,032 $77,292 - $75,499 - $4,322 - $83,199 $81,613 - - $83,049 - -Great Lakes 28 83 $80,167 $73,507 $60,000 $70,008 $83,271 $7,507 - $86,586 $81,014 $54,863 $61,207 $78,500 $96,472 $114,001Mountain 3 4 $91,478 $97,359 - $83,718 - $107,487 - $169,668 $204,845 - - $101,862 - -
AssociationAmerican Society of Employers (MI) 5 10 $73,267 $72,871 $64,654 $72,322 $82,333 $5,740 - $76,747 $78,611 $64,873 $74,092 $74,939 $85,944 $95,545Trusight (MN) - formerly EA 8 31 $71,091 $62,861 $53,430 $58,989 $75,000 $3,598 - $76,807 $66,459 $45,329 $54,831 $60,000 $75,500 $97,483Employers Resource Assoc. (OH) 3 7 $87,100 $85,437 - $75,499 - $4,054 - $90,697 $89,491 - - $83,049 - -Employers Resource Council (OH) 3 9 $72,367 $74,585 - $72,672 - $8,854 - $77,679 $83,439 - - $80,787 - -MRA - The Mgmt Assoc. (WI) 8 21 $79,121 $75,653 $64,953 $75,000 $83,187 $13,612 - $88,039 $89,265 $60,418 $71,635 $85,988 $109,308 $113,288The Management Assoc. of Illinois (IL) 7 20 $93,383 $85,445 $75,980 $85,353 $93,619 $9,063 - $101,950 $94,508 $73,142 $85,746 $97,518 $101,907 $114,404
continued
(120) Sales EngineerCompensation Strategy: Salary + Bonus
Promotes the sale of company products or services requiring knowledge of engineering principles. Serves as liaison between the customer and the company on engineering matters regarding product application, sales, installation and services. Examines and analyze customers' needs, prepares specifications, design modifications, recommendations, etc. pertinent to the proposed installation. May take charge of installation and servicing of products where engineering is required.
Effective Date:September 2010
Total CompensationBase Pay Variable Pay
National Data - Effective September 2010 85 © 2011 Employer Associations of America (EAA)
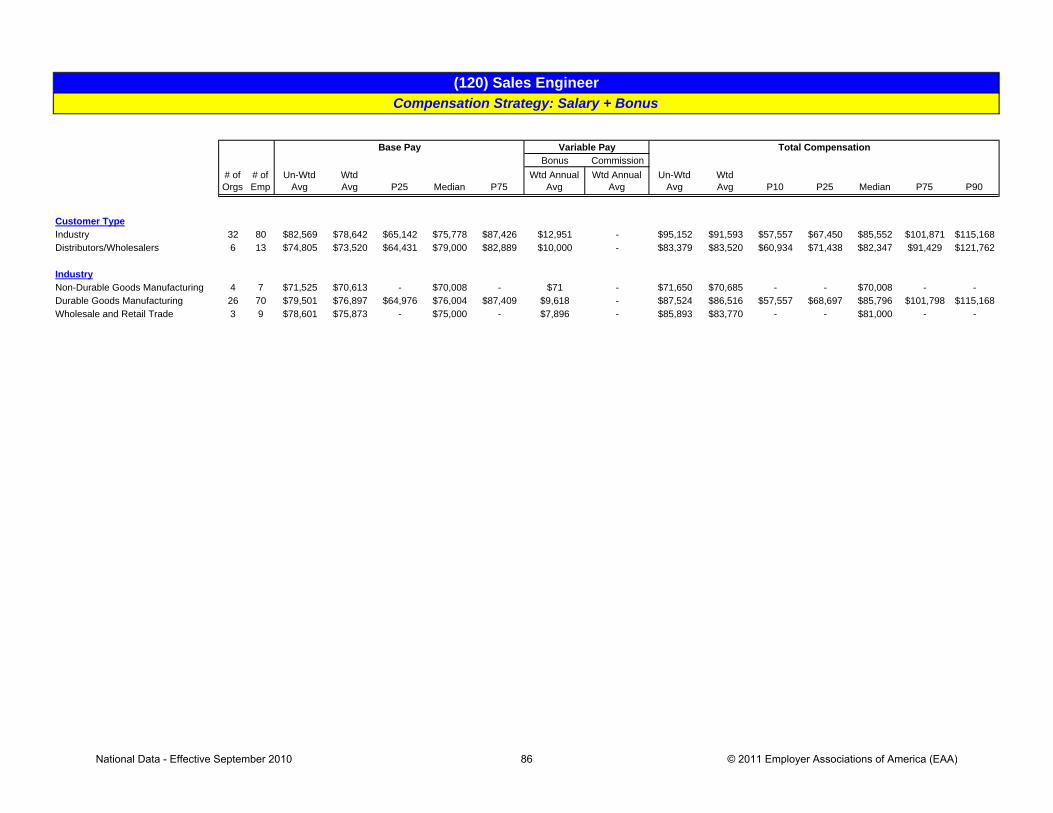
(120) Sales EngineerCompensation Strategy: Salary + Bonus
Bonus Commission# of Orgs
# of Emp
Un-Wtd Avg
WtdAvg P25 Median P75
Wtd Annual Avg
Wtd Annual Avg
Un-Wtd Avg
WtdAvg P10 P25 Median P75 P90
Customer TypeIndustry 32 80 $82,569 $78,642 $65,142 $75,778 $87,426 $12,951 - $95,152 $91,593 $57,557 $67,450 $85,552 $101,871 $115,168Distributors/Wholesalers 6 13 $74,805 $73,520 $64,431 $79,000 $82,889 $10,000 - $83,379 $83,520 $60,934 $71,438 $82,347 $91,429 $121,762
IndustryNon-Durable Goods Manufacturing 4 7 $71,525 $70,613 - $70,008 - $71 - $71,650 $70,685 - - $70,008 - -Durable Goods Manufacturing 26 70 $79,501 $76,897 $64,976 $76,004 $87,409 $9,618 - $87,524 $86,516 $57,557 $68,697 $85,796 $101,798 $115,168Wholesale and Retail Trade 3 9 $78,601 $75,873 - $75,000 - $7,896 - $85,893 $83,770 - - $81,000 - -
Base Pay Variable Pay Total Compensation
National Data - Effective September 2010 86 © 2011 Employer Associations of America (EAA)

Bonus Commission# of Orgs
# of Emp
Un-Wtd Avg
WtdAvg P25 Median P75
Wtd Annual Avg
Wtd Annual Avg
Un-Wtd Avg
WtdAvg P10 P25 Median P75 P90
Total Responses *10 30 $65,606 $55,705 $39,495 $52,573 $64,937 $10,385 $22,308 $87,894 $88,398 $53,560 $63,421 $77,624 $96,858 $102,747
Org Sales Volume0.0-26.9 million *5 17 $65,677 $49,042 $34,920 $41,200 $57,790 $15,730 $27,323 $93,736 $92,095 $49,505 $60,399 $74,877 $94,026 $170,73327.0-99.9 million 4 9 $65,781 $64,361 - $57,772 - $984 $12,820 $78,639 $78,165 - - $77,523 - -
RegionGreat Lakes *8 24 $64,376 $52,498 $38,991 $50,226 $58,918 $11,484 $23,822 $87,791 $87,804 $52,768 $63,062 $76,151 $91,939 $113,159
AssociationMRA - The Mgmt Assoc. (WI) *4 11 $54,964 $56,070 - $54,000 - $4,476 $19,646 $77,684 $80,192 - - $77,523 - -
continued
Base Pay Variable Pay
(120) Sales EngineerCompensation Strategy: Salary + Commission + Bonus
Promotes the sale of company products or services requiring knowledge of engineering principles. Serves as liaison between the customer and the company on engineering matters regarding product application, sales, installation and services. Examines and analyze customers' needs, prepares specifications, design modifications, recommendations, etc. pertinent to the proposed installation. May take charge of installation and servicing of products where engineering is required.
Effective Date:September 2010
Total Compensation
National Data - Effective September 2010 87 © 2011 Employer Associations of America (EAA)

(120) Sales EngineerCompensation Strategy: Salary + Commission + Bonus
Bonus Commission# of Orgs
# of Emp
Un-Wtd Avg
WtdAvg P25 Median P75
Wtd Annual Avg
Wtd Annual Avg
Un-Wtd Avg
WtdAvg P10 P25 Median P75 P90
Customer TypeIndustry 9 21 $68,937 $64,312 $50,799 $59,300 $72,480 $4,987 $16,067 $87,052 $85,366 $60,983 $72,704 $86,653 $99,842 $102,643
IndustryDurable Goods Manufacturing 5 11 $75,415 $67,253 $54,000 $64,087 $76,632 $4,984 $16,117 $93,241 $88,353 $62,720 $73,839 $86,653 $101,516 $119,344Wholesale and Retail Trade *3 16 $53,761 $46,074 - $40,710 - $15,854 $28,987 $89,410 $90,915 - - $76,151 - -
* More than 30% of sample supplied by one organization.
Base Pay Variable Pay Total Compensation
National Data - Effective September 2010 88 © 2011 Employer Associations of America (EAA)

Bonus Commission# of Orgs
# of Emp
Un-Wtd Avg
WtdAvg P25 Median P75
Wtd Annual Avg
Wtd Annual Avg
Un-Wtd Avg
WtdAvg P10 P25 Median P75 P90
Total Responses 272 1103 - - - - - - - $105,414 $101,610 $50,816 $69,912 $90,790 $115,311 $144,968
Org Sales Volume0.0-26.9 million 108 256 - - - - - - - $104,509 $102,208 $50,129 $70,138 $87,911 $114,133 $150,49427.0-99.9 million 107 380 - - - - - - - $107,467 $117,088 $61,129 $75,951 $98,111 $123,293 $161,374100.0 million+ 57 467 - - - - - - - $103,274 $88,687 $45,102 $64,730 $86,209 $109,256 $131,888
RegionNortheast 20 56 - - - - - - - $115,260 $111,038 $78,416 $88,411 $104,224 $128,977 $149,211Southeast *15 104 - - - - - - - $106,261 $91,606 $65,098 $73,915 $87,880 $104,167 $122,333Great Lakes 181 711 - - - - - - - $104,577 $96,749 $46,073 $65,537 $90,000 $113,403 $145,430Central *16 95 - - - - - - - $97,912 $95,372 $57,426 $74,038 $88,023 $110,159 $136,326Mountain 20 65 - - - - - - - $101,067 $106,344 $55,146 $79,886 $102,500 $131,963 $154,544Pacific 20 72 - - - - - - - $112,853 $160,684 $57,558 $72,482 $87,904 $119,957 $482,748
AssociationAmerican Society of Employers (MI) *30 187 - - - - - - - $98,823 $90,240 $63,837 $70,232 $85,111 $99,956 $120,363Cascade Employers Assoc. (OR) *5 16 - - - - - - - $87,755 $85,997 $64,250 $74,134 $85,060 $94,023 $114,539Employers Assoc. NE (CT & MA) 4 8 - - - - - - - $125,645 $125,104 - - $121,000 - -Trusight (MN) - formerly EA 50 283 - - - - - - - $100,904 $102,588 $55,159 $70,102 $92,146 $118,499 $149,683Employers Assoc. W. Michigan (MI) *3 14 - - - - - - - $94,814 $103,851 - - $102,000 - -Employers Resource Assoc. (OH) *40 183 - - - - - - - $97,502 $75,324 $36,402 $43,442 $67,944 $98,221 $128,414Employers Resource Council (OH) 13 63 - - - - - - - $89,154 $91,590 $66,747 $72,827 $82,500 $102,202 $123,723MidAtlantic Employers Assoc. (PA) *7 17 - - - - - - - $116,189 $119,838 $75,144 $100,302 $117,000 $144,461 $162,703Mtn States Employers Council (CO) 14 46 - - - - - - - $95,618 $99,804 $51,557 $61,502 $90,000 $123,950 $155,733MRA - The Mgmt Assoc. (N. IL) *4 7 - - - - - - - $117,576 $120,777 - - $111,307 - -MRA - The Mgmt Assoc. (WI) 60 157 - - - - - - - $115,057 $112,000 $63,018 $79,964 $99,448 $122,250 $163,256The Employers Council (UT) *3 14 - - - - - - - $128,943 $132,009 - - $133,257 - -The Management Assoc. of Illinois (IL) 23 47 - - - - - - - $107,483 $107,438 $53,600 $72,104 $98,793 $134,941 $165,286
continued
(130) Sales Representative/Account Executive - Senior (Outside sales)Combined Compensation Type
Performs field promotional work to sell and develop new business. May include work with current major accounts, development of new territories, new industries, or with customers where the full market potential or product acceptance has not been established. Demonstrates products / services and provides assistance in the best application to the product. Coordinates Company technical engineering services to determine customers' needs. Prepare price quotations, terms of sales, delivery dates, etc., and writes orders subject to company policy. Investigates product / service warranty claims and ensures resolution of customer complaints following marketing policies. Develops data relative to marketing trends, competitive products and pricing, and submits marketing reports to management. As required, prepares and submits reports on sales and marketing activities. Trains, instructs and orients new personnel and trainees.
Effective Date:September 2010
Total CompensationBase Pay Variable Pay
National Data - Effective September 2010 89 © 2011 Employer Associations of America (EAA)

(130) Sales Representative/Account Executive - Senior (Outside sales)Combined Compensation Type
Bonus Commission# of Orgs
# of Emp
Un-Wtd Avg
WtdAvg P25 Median P75
Wtd Annual Avg
Wtd Annual Avg
Un-Wtd Avg
WtdAvg P10 P25 Median P75 P90
Customer TypeIndustry 175 493 - - - - - - - $109,193 $110,591 $63,994 $81,501 $101,316 $124,923 $160,942Distributors/Wholesalers 65 254 - - - - - - - $99,067 $95,875 $64,477 $73,533 $92,006 $111,298 $135,371Retailers *22 202 - - - - - - - $115,227 $97,717 $36,654 $45,399 $61,770 $97,512 $137,021Consumers 26 154 - - - - - - - $82,596 $87,424 $47,766 $67,779 $80,248 $95,050 $117,963
IndustryNatural Resources and Mining *3 7 - - - - - - - $90,659 $91,571 - - $85,434 - -Non-Durable Goods Manufacturing 49 219 - - - - - - - $124,463 $105,041 $63,942 $72,675 $94,929 $120,888 $148,779Durable Goods Manufacturing 110 300 - - - - - - - $98,571 $101,673 $67,078 $80,908 $97,303 $117,001 $141,446Wholesale and Retail Trade 49 355 - - - - - - - $102,635 $98,178 $40,982 $52,798 $78,855 $104,259 $136,646Transportation and Warehousing *4 23 - - - - - - - $88,315 $90,988 - - $91,900 - -Information *5 16 - - - - - - - $125,727 $114,108 $72,071 $90,000 $106,160 $127,978 $183,299Financial Activities *11 68 - - - - - - - $128,203 $110,348 $34,463 $52,083 $79,964 $123,411 $192,897Professional and Business Services 13 22 - - - - - - - $92,786 $99,931 $63,830 $74,757 $100,650 $112,804 $151,686Education and Health Services *8 21 - - - - - - - $111,461 $122,529 $71,521 $97,670 $115,000 $138,748 $175,890Other Services *17 66 - - - - - - - $99,086 $95,834 $58,431 $67,913 $87,704 $117,800 $149,237
* More than 30% of sample supplied by one organization.
Base Pay Variable Pay Total Compensation
National Data - Effective September 2010 90 © 2011 Employer Associations of America (EAA)

Bonus Commission# of Orgs
# of Emp
Un-Wtd Avg
WtdAvg P25 Median P75
Wtd Annual Avg
Wtd Annual Avg
Un-Wtd Avg
WtdAvg P10 P25 Median P75 P90
Total Responses 43 83 $86,675 $83,564 $67,000 $80,000 $100,000 - - $86,675 $83,564 $55,040 $67,000 $80,000 $100,000 $114,785
Org Sales Volume0.0-26.9 million 17 22 $86,255 $83,648 $59,475 $80,452 $106,017 - - $86,255 $83,648 $52,900 $59,475 $80,452 $106,017 $122,89327.0-99.9 million 22 55 $87,111 $82,768 $67,000 $80,000 $98,000 - - $87,111 $82,768 $54,660 $67,000 $80,000 $98,000 $103,014100.0 million+ 4 6 $86,065 $90,543 - $75,979 - - - $86,065 $90,543 - - $75,979 - -
RegionNortheast 3 4 $119,201 $121,151 - $120,000 - - - $119,201 $121,151 - - $120,000 - -Great Lakes 34 70 $82,042 $79,872 $65,047 $75,896 $93,889 - - $82,042 $79,872 $54,100 $65,047 $75,896 $93,889 $102,133Pacific 3 5 $93,303 $91,012 - $87,144 - - - $93,303 $91,012 - - $87,144 - -
AssociationAmerican Society of Employers (MI) 3 4 $86,347 $89,010 - $90,000 - - - $86,347 $89,010 - - $90,000 - -Trusight (MN) - formerly EA 10 23 $77,419 $78,103 $67,500 $75,630 $85,000 - - $77,419 $78,103 $64,675 $67,500 $75,630 $85,000 $101,815Employers Resource Assoc. (OH) 9 18 $95,674 $86,124 $57,650 $85,150 $100,000 - - $95,674 $86,124 $50,360 $57,650 $85,150 $100,000 $135,288MRA - The Mgmt Assoc. (WI) 9 19 $89,495 $85,540 $63,600 $88,000 $100,000 - - $89,495 $85,540 $56,304 $63,600 $88,000 $100,000 $117,997The Management Assoc. of Illinois (IL) 3 5 $52,157 $52,282 - $52,000 - - - $52,157 $52,282 - - $52,000 - -
continued
(130) Sales Representative/Account Executive - Senior (Outside sales)Compensation Strategy: Straight Salary
Performs field promotional work to sell and develop new business. May include work with current major accounts, development of new territories, new industries, or with customers where the full market potential or product acceptance has not been established. Demonstrates products / services and provides assistance in the best application to the product. Coordinates Company technical engineering services to determine customers' needs. Prepare price quotations, terms of sales, delivery dates, etc., and writes orders subject to company policy. Investigates product / service warranty claims and ensures resolution of customer complaints following marketing policies. Develops data relative to marketing trends, competitive products and pricing, and submits marketing reports to management. As required, prepares and submits reports on sales and marketing activities. Trains, instructs and orients new personnel and trainees.
Effective Date:September 2010
Total CompensationBase Pay Variable Pay
National Data - Effective September 2010 91 © 2011 Employer Associations of America (EAA)

(130) Sales Representative/Account Executive - Senior (Outside sales)Compensation Strategy: Straight Salary
Bonus Commission# of Orgs
# of Emp
Un-Wtd Avg
WtdAvg P25 Median P75
Wtd Annual Avg
Wtd Annual Avg
Un-Wtd Avg
WtdAvg P10 P25 Median P75 P90
Customer TypeIndustry 27 47 $86,051 $86,835 $67,500 $88,000 $100,000 - - $86,051 $86,835 $58,061 $67,500 $88,000 $100,000 $111,595Distributors/Wholesalers 8 19 $88,021 $80,916 $64,250 $75,750 $93,852 - - $88,021 $80,916 $50,400 $64,250 $75,750 $93,852 $117,997Consumers 8 16 $86,567 $77,605 $61,752 $75,000 $83,495 - - $86,567 $77,605 $51,455 $61,752 $75,000 $83,495 $126,500
IndustryNon-Durable Goods Manufacturing 6 11 $96,231 $94,785 $80,000 $97,500 $104,760 - - $96,231 $94,785 $54,200 $80,000 $97,500 $104,760 $135,288Durable Goods Manufacturing 18 35 $85,011 $87,448 $70,000 $88,000 $101,316 - - $85,011 $87,448 $62,550 $70,000 $88,000 $101,316 $113,190Wholesale and Retail Trade 6 15 $81,200 $69,395 $55,100 $63,600 $75,458 - - $81,200 $69,395 $50,240 $55,100 $63,600 $75,458 $105,000Financial Activities 3 3 $110,000 $110,000 - $125,000 - - - $110,000 $110,000 - - $125,000 - -Education and Health Services 3 3 $85,047 $85,047 - $95,340 - - - $85,047 $85,047 - - $95,340 - -Other Services 4 11 $72,454 $69,481 - $72,830 - - - $72,454 $69,481 - - $72,830 - -
Base Pay Variable Pay Total Compensation
National Data - Effective September 2010 92 © 2011 Employer Associations of America (EAA)

Bonus Commission# of Orgs
# of Emp
Un-Wtd Avg
WtdAvg P25 Median P75
Wtd Annual Avg
Wtd Annual Avg
Un-Wtd Avg
WtdAvg P10 P25 Median P75 P90
Total Responses 100 447 $67,303 $58,398 $35,004 $55,000 $79,430 - $39,210 $114,855 $97,608 $45,716 $65,226 $88,164 $117,000 $147,169
Org Sales Volume0.0-26.9 million 37 80 $69,830 $68,574 $55,214 $67,061 $80,000 - $45,030 $114,167 $113,604 $68,398 $78,459 $95,552 $127,974 $182,72527.0-99.9 million 41 125 $62,578 $66,414 $53,000 $63,118 $85,000 - $43,584 $114,479 $109,998 $65,420 $78,404 $93,832 $116,997 $150,523100.0 million+ 22 242 $71,860 $50,893 $28,600 $36,200 $70,000 - $35,027 $116,714 $85,920 $38,912 $51,642 $76,642 $111,795 $143,572
RegionNortheast 9 17 $75,287 $75,576 $46,772 $68,949 $101,500 - $44,490 $119,100 $120,066 $85,424 $97,500 $116,992 $131,652 $172,610Southeast 5 7 $63,833 $68,874 $47,509 $65,700 $97,737 - $59,070 $126,189 $127,944 $89,291 $90,075 $132,510 $155,704 $181,999Great Lakes 68 332 $68,517 $61,691 $39,656 $60,000 $80,000 - $30,942 $109,853 $92,633 $41,694 $62,810 $85,402 $114,725 $144,982Central 7 73 $61,236 $38,754 $25,000 $36,000 $38,000 - $58,644 $105,503 $97,398 $58,075 $71,501 $88,023 $117,637 $142,654Mountain 4 7 $41,980 $33,766 - $25,000 - - $36,744 $81,058 $70,510 - - $60,609 - -Pacific *7 11 $68,266 $71,821 $65,000 $79,900 $86,000 - $140,559 $178,558 $212,380 $72,683 $76,877 $88,000 $165,285 $760,810
AssociationAmerican Society of Employers (MI) 4 34 $58,672 $54,603 - $53,210 - - $41,688 $125,764 $96,291 - - $76,098 - -Trusight (MN) - formerly EA 15 113 $70,917 $53,321 $25,000 $36,000 $79,000 - $52,553 $114,373 $105,874 $61,609 $76,393 $97,914 $125,423 $163,146Employers Resource Assoc. (OH) 19 113 $60,577 $42,486 $28,600 $32,500 $54,538 - $24,420 $97,187 $66,906 $34,444 $40,241 $52,105 $89,278 $116,428Employers Resource Council (OH) 9 49 $67,355 $71,513 $60,000 $68,590 $79,868 - $14,527 $81,427 $86,041 $65,500 $72,414 $80,054 $95,307 $113,771MRA - The Mgmt Assoc. (WI) 24 75 $68,952 $73,754 $52,665 $73,112 $90,000 - $36,523 $116,869 $110,277 $59,875 $74,000 $99,000 $123,886 $159,632The Management Assoc. of Illinois (IL) 17 33 $67,987 $65,992 $44,590 $55,000 $88,767 - $55,766 $121,075 $121,758 $74,243 $91,010 $120,186 $150,362 $166,900
continued
(130) Sales Representative/Account Executive - Senior (Outside sales)Compensation Strategy: Salary + Commission
Performs field promotional work to sell and develop new business. May include work with current major accounts, development of new territories, new industries, or with customers where the full market potential or product acceptance has not been established. Demonstrates products / services and provides assistance in the best application to the product. Coordinates Company technical engineering services to determine customers' needs. Prepare price quotations, terms of sales, delivery dates, etc., and writes orders subject to company policy. Investigates product / service warranty claims and ensures resolution of customer complaints following marketing policies. Develops data relative to marketing trends, competitive products and pricing, and submits marketing reports to management. As required, prepares and submits reports on sales and marketing activities. Trains, instructs and orients new personnel and trainees.
Effective Date:September 2010
Total CompensationBase Pay Variable Pay
National Data - Effective September 2010 93 © 2011 Employer Associations of America (EAA)

(130) Sales Representative/Account Executive - Senior (Outside sales)Compensation Strategy: Salary + Commission
Bonus Commission# of Orgs
# of Emp
Un-Wtd Avg
WtdAvg P25 Median P75
Wtd Annual Avg
Wtd Annual Avg
Un-Wtd Avg
WtdAvg P10 P25 Median P75 P90
Customer TypeIndustry 70 191 $69,092 $72,380 $55,000 $70,464 $90,000 - $42,787 $115,630 $115,167 $72,862 $87,750 $104,000 $128,500 $170,793Distributors/Wholesalers 27 69 $71,845 $75,335 $58,000 $68,949 $94,340 - $25,688 $102,230 $101,023 $68,387 $75,000 $94,304 $120,269 $151,039Retailers *5 143 $44,962 $32,974 $26,000 $30,000 $36,000 - $42,764 $200,278 $75,738 $35,755 $42,485 $55,057 $80,313 $120,219Consumers 6 44 $51,904 $53,772 $46,091 $50,001 $62,250 - $33,334 $84,736 $87,106 $63,558 $67,703 $77,422 $98,459 $127,301
IndustryNon-Durable Goods Manufacturing 22 81 $73,726 $78,623 $61,587 $72,243 $97,245 - $27,457 $120,649 $106,080 $63,451 $72,000 $97,914 $124,445 $174,026Durable Goods Manufacturing 44 121 $69,117 $70,428 $54,163 $67,000 $89,020 - $34,244 $103,671 $104,673 $73,386 $81,501 $98,303 $123,553 $146,222Wholesale and Retail Trade *11 165 $57,941 $38,725 $26,825 $31,877 $38,420 - $46,662 $163,791 $85,388 $36,517 $44,949 $63,158 $100,229 $142,193Financial Activities 5 21 $59,896 $54,346 $50,000 $50,001 $55,000 - $81,906 $151,569 $136,251 $54,978 $85,628 $98,765 $170,624 $275,949Professional and Business Services 6 7 $59,544 $58,038 $48,000 $51,015 $75,000 - $25,877 $80,262 $83,915 $58,181 $65,500 $82,000 $105,270 $106,398Other Services 5 32 $64,400 $55,791 $41,967 $53,791 $68,528 - $30,654 $111,065 $86,445 $63,128 $66,345 $70,714 $101,851 $127,232
* Rates are skewed.
Base Pay Variable Pay Total Compensation
National Data - Effective September 2010 94 © 2011 Employer Associations of America (EAA)

Bonus Commission# of Orgs
# of Emp
Un-Wtd Avg
WtdAvg P25 Median P75
Wtd Annual Avg
Wtd Annual Avg
Un-Wtd Avg
WtdAvg P10 P25 Median P75 P90
Total Responses 78 288 $83,922 $80,785 $66,950 $78,407 $92,614 $11,318 - $94,286 $92,104 $63,025 $75,029 $88,350 $104,871 $122,900
Org Sales Volume0.0-26.9 million 28 58 $78,700 $78,709 $64,773 $76,765 $89,400 $11,913 - $87,380 $90,622 $58,223 $71,586 $86,488 $100,317 $113,18727.0-99.9 million 19 50 $91,056 $85,513 $64,850 $87,000 $99,210 $17,643 - $107,611 $103,156 $63,076 $76,950 $102,000 $127,425 $141,046100.0 million+ 31 180 $84,265 $80,141 $66,956 $77,241 $89,507 $9,370 - $92,356 $89,511 $64,685 $74,888 $87,749 $100,043 $120,270
RegionNortheast 6 18 $93,462 $87,274 $75,941 $82,553 $99,710 $6,715 - $98,687 $93,989 $71,024 $81,692 $90,550 $104,717 $122,035Southeast 6 85 $87,615 $75,722 $66,633 $70,000 $85,000 $11,511 - $95,274 $87,233 $65,117 $73,022 $84,332 $98,673 $117,038Great Lakes 46 109 $83,626 $83,654 $69,373 $85,000 $94,889 $13,084 - $94,968 $96,738 $62,929 $75,939 $93,708 $110,235 $130,893Central 7 16 $87,464 $86,680 $75,585 $82,118 $99,375 $9,585 - $96,151 $96,266 $73,564 $82,198 $92,539 $109,270 $128,318Mountain 8 28 $80,526 $87,266 $71,250 $85,010 $119,753 $14,506 - $95,641 $101,773 $51,531 $85,897 $92,041 $133,698 $148,955Pacific 5 32 $71,236 $72,197 $61,083 $72,000 $78,380 $5,458 - $76,762 $77,655 $53,442 $63,111 $79,807 $89,060 $105,355
AssociationAmerican Society of Employers (MI) 11 108 $83,594 $76,353 $66,950 $74,800 $83,972 $11,167 - $92,483 $87,520 $65,856 $75,771 $85,852 $96,529 $110,517Cascade Employers Assoc. (OR) 4 15 $86,162 $85,455 - $84,077 - $0 - $86,162 $85,455 - - $84,077 - -Trusight (MN) - formerly EA 13 30 $81,531 $84,584 $74,653 $85,720 $95,835 $12,818 - $93,126 $97,403 $64,674 $80,844 $98,857 $111,090 $128,250Employers Resource Assoc. (OH) 9 24 $69,874 $66,514 $52,125 $68,090 $83,379 $9,066 - $76,979 $75,580 $39,265 $64,125 $75,939 $91,277 $108,850MidAtlantic Employers Assoc. (PA) 3 5 $93,569 $87,875 - $80,105 - $4,637 - $100,485 $92,512 - - $82,357 - -Mtn States Employers Council (CO) 6 18 $73,089 $73,398 $44,565 $75,000 $87,571 $16,762 - $89,867 $90,160 $49,221 $60,349 $89,250 $108,099 $140,879MRA - The Mgmt Assoc. (N. IL) 3 5 $93,993 $96,756 - $92,978 - $18,466 - $111,880 $115,221 - - $111,200 - -MRA - The Mgmt Assoc. (WI) 20 40 $90,555 $92,408 $78,500 $90,000 $105,623 $15,598 - $102,957 $108,007 $75,018 $84,714 $100,000 $115,056 $131,552
continued
(130) Sales Representative/Account Executive - Senior (Outside sales)Compensation Strategy: Salary + Bonus
Performs field promotional work to sell and develop new business. May include work with current major accounts, development of new territories, new industries, or with customers where the full market potential or product acceptance has not been established. Demonstrates products / services and provides assistance in the best application to the product. Coordinates Company technical engineering services to determine customers' needs. Prepare price quotations, terms of sales, delivery dates, etc., and writes orders subject to company policy. Investigates product / service warranty claims and ensures resolution of customer complaints following marketing policies. Develops data relative to marketing trends, competitive products and pricing, and submits marketing reports to management. As required, prepares and submits reports on sales and marketing activities. Trains, instructs and orients new personnel and trainees.
Effective Date:September 2010
Total CompensationBase Pay Variable Pay
National Data - Effective September 2010 95 © 2011 Employer Associations of America (EAA)

(130) Sales Representative/Account Executive - Senior (Outside sales)Compensation Strategy: Salary + Bonus
Bonus Commission# of Orgs
# of Emp
Un-Wtd Avg
WtdAvg P25 Median P75
Wtd Annual Avg
Wtd Annual Avg
Un-Wtd Avg
WtdAvg P10 P25 Median P75 P90
Customer TypeIndustry 41 91 $87,911 $85,626 $72,000 $85,363 $97,000 $13,581 - $99,292 $99,207 $58,243 $80,307 $94,307 $111,307 $138,602Distributors/Wholesalers 20 112 $85,036 $80,745 $66,950 $73,479 $92,622 $9,905 - $91,544 $90,650 $65,000 $73,727 $85,241 $104,167 $122,133Retailers 14 32 $79,476 $74,625 $57,100 $75,000 $93,132 $11,021 - $88,979 $85,646 $41,530 $59,783 $85,080 $112,713 $128,047Consumers 8 53 $70,946 $76,280 $70,000 $76,650 $85,000 $10,600 - $81,238 $86,879 $71,883 $79,081 $86,500 $93,142 $106,778
IndustryNon-Durable Goods Manufacturing 12 86 $85,302 $79,071 $66,873 $70,145 $92,762 $12,914 - $98,526 $91,985 $62,279 $75,566 $86,965 $107,380 $129,088Durable Goods Manufacturing 37 96 $85,409 $84,613 $71,640 $85,720 $96,904 $10,785 - $95,339 $95,399 $61,001 $75,029 $93,377 $110,353 $129,300Wholesale and Retail Trade 18 78 $78,017 $76,850 $69,580 $76,192 $85,000 $9,292 - $87,639 $86,142 $64,294 $72,686 $85,856 $93,142 $114,147Transportation and Warehousing 3 13 $82,042 $78,390 - $72,000 - $10,193 - $89,877 $88,583 - - $92,147 - -Financial Activities 3 9 $86,361 $81,912 - $72,500 - $24,338 - $104,699 $106,250 - - $80,000 - -Other Services 3 4 $91,052 $103,289 - $115,000 - $5,301 - $95,869 $108,590 - - $118,875 - -
Base Pay Variable Pay Total Compensation
National Data - Effective September 2010 96 © 2011 Employer Associations of America (EAA)

Bonus Commission# of Orgs
# of Emp
Un-Wtd Avg
WtdAvg P25 Median P75
Wtd Annual Avg
Wtd Annual Avg
Un-Wtd Avg
WtdAvg P10 P25 Median P75 P90
Total Responses 59 196 $66,421 $69,749 $50,000 $66,362 $81,750 $7,589 $46,730 $136,815 $124,068 $64,885 $86,998 $107,984 $134,948 $181,811
Org Sales Volume0.0-26.9 million 24 48 $59,440 $57,722 $47,167 $55,586 $72,514 $11,653 $50,444 $125,743 $119,818 $64,316 $74,698 $103,481 $132,996 $237,60027.0-99.9 million 28 109 $73,267 $77,387 $56,722 $74,160 $92,451 $7,773 $48,756 $155,467 $133,916 $65,121 $96,844 $110,792 $148,933 $191,501100.0 million+ 7 39 $62,972 $63,207 $50,000 $64,200 $80,000 $2,071 $36,495 $100,173 $101,773 $52,798 $83,901 $100,583 $125,358 $141,217
RegionNortheast 5 17 $77,989 $91,351 $66,335 $90,912 $108,487 $4,047 $22,283 $133,112 $117,681 $73,944 $89,126 $119,164 $146,789 $162,703Southeast 4 11 $65,952 $70,791 - $67,500 - $1,439 $26,074 $105,739 $98,304 - - $102,008 - -Great Lakes 39 133 $65,913 $66,644 $50,000 $63,544 $79,004 $5,837 $50,281 $126,670 $122,762 $66,169 $86,159 $105,385 $135,371 $183,351Mountain 4 14 $78,402 $77,599 - $76,304 - $42,155 $19,911 $138,101 $139,665 - - $126,701 - -Pacific 6 17 $55,142 $69,949 $48,521 $70,000 $90,500 $2,133 $89,839 $240,169 $161,921 $46,471 $90,227 $107,397 $145,779 $359,403
AssociationAmerican Society of Employers (MI) 12 41 $65,512 $75,362 $53,021 $75,000 $94,969 $2,402 $14,740 $98,773 $92,505 $42,320 $64,117 $82,094 $105,174 $132,600Trusight (MN) - formerly EA 12 58 $71,372 $70,168 $53,625 $67,450 $80,000 $9,023 $45,303 $113,725 $124,494 $69,459 $91,413 $107,885 $144,433 $169,762Employers Resource Assoc. (OH) 10 23 $62,232 $55,507 $40,000 $60,000 $67,500 $3,002 $56,202 $123,626 $114,711 $44,501 $85,434 $113,236 $137,757 $178,849Employers Resource Council (OH) 3 11 $48,145 $51,211 - $50,000 - $3,982 $64,921 $119,453 $120,113 - - $120,020 - -Mtn States Employers Council (CO) 3 11 $75,647 $75,126 - $75,358 - $50,718 $21,658 $147,157 $147,501 - - $128,523 - -MRA - The Mgmt Assoc. (WI) 7 21 $71,199 $73,485 $50,000 $63,000 $91,500 $1,823 $76,238 $180,037 $151,546 $75,997 $93,767 $120,223 $180,475 $318,105The Management Assoc. of Illinois (IL) 3 7 $61,152 $60,676 - $60,000 - $3,029 $30,903 $99,622 $94,609 - - $91,650 - -
continued
Base Pay Variable Pay
(130) Sales Representative/Account Executive - Senior (Outside sales)Compensation Strategy: Salary + Commission + Bonus
Performs field promotional work to sell and develop new business. May include work with current major accounts, development of new territories, new industries, or with customers where the full market potential or product acceptance has not been established. Demonstrates products / services and provides assistance in the best application to the product. Coordinates Company technical engineering services to determine customers' needs. Prepare price quotations, terms of sales, delivery dates, etc., and writes orders subject to company policy. Investigates product / service warranty claims and ensures resolution of customer complaints following marketing policies. Develops data relative to marketing trends, competitive products and pricing, and submits marketing reports to management. As required, prepares and submits reports on sales and marketing activities. Trains, instructs and orients new personnel and trainees.
Effective Date:September 2010
Total Compensation
National Data - Effective September 2010 97 © 2011 Employer Associations of America (EAA)

(130) Sales Representative/Account Executive - Senior (Outside sales)Compensation Strategy: Salary + Commission + Bonus
Bonus Commission# of Orgs
# of Emp
Un-Wtd Avg
WtdAvg P25 Median P75
Wtd Annual Avg
Wtd Annual Avg
Un-Wtd Avg
WtdAvg P10 P25 Median P75 P90
Customer TypeIndustry 41 145 $71,974 $74,440 $55,086 $70,720 $88,161 $9,041 $40,379 $126,622 $123,860 $65,342 $85,880 $110,190 $144,461 $186,242Distributors/Wholesalers 11 36 $62,112 $61,022 $50,000 $56,000 $74,502 $3,472 $47,123 $120,972 $111,617 $72,101 $91,704 $101,464 $120,740 $143,486Retailers 5 13 $41,877 $46,536 $24,700 $47,081 $70,000 $3,899 $118,671 $281,791 $169,106 $38,934 $49,894 $109,327 $141,877 $668,031
IndustryNon-Durable Goods Manufacturing 10 31 $64,133 $66,235 $47,424 $60,000 $82,000 $13,038 $67,577 $180,875 $146,851 $64,743 $75,290 $122,425 $160,000 $307,213Durable Goods Manufacturing 13 43 $65,546 $65,907 $54,000 $68,000 $78,103 $4,321 $46,351 $108,814 $116,579 $84,702 $97,131 $104,983 $126,192 $166,458Wholesale and Retail Trade 16 62 $62,916 $69,848 $47,058 $65,043 $83,823 $7,681 $42,287 $147,775 $119,815 $43,564 $64,591 $99,492 $123,499 $182,437Information 3 5 $77,222 $81,000 - $80,000 - $7,455 $44,984 $148,443 $133,439 - - $124,879 - -Professional and Business Services 4 11 $89,375 $91,364 - $90,000 - $591 $19,616 $111,463 $111,571 - - $109,558 - -Education and Health Services 3 15 $54,699 $69,917 - $77,200 - $22,372 $38,649 $134,031 $130,938 - - $125,868 - -Other Services 7 18 $65,880 $71,242 $50,000 $50,000 $85,750 $1,657 $56,553 $124,866 $129,453 $92,081 $110,598 $122,114 $149,176 $185,616
Base Pay Variable Pay Total Compensation
National Data - Effective September 2010 98 © 2011 Employer Associations of America (EAA)

Bonus Commission# of Orgs
# of Emp
Un-Wtd Avg
WtdAvg P25 Median P75
Wtd Annual Avg
Wtd Annual Avg
Un-Wtd Avg
WtdAvg P10 P25 Median P75 P90
Total Responses *9 42 - - - - - - $149,440 $116,264 $149,440 $43,727 $55,409 $82,234 $127,243 $482,748
Org Sales Volume0.0-26.9 million 4 5 - - - - - - $78,900 $76,022 $78,900 - - $57,133 - -27.0-99.9 million *5 37 - - - - - - $158,972 $148,458 $158,972 $45,209 $56,583 $83,605 $128,644 $575,513
Region
Great Lakes *6 25 - - - - - - $73,212 $69,096 $73,212 $39,869 $48,872 $63,889 $91,633 $128,262
Association
continued
(130) Sales Representative/Account Executive - Senior (Outside sales)Compensation Strategy: Commission Only
Performs field promotional work to sell and develop new business. May include work with current major accounts, development of new territories, new industries, or with customers where the full market potential or product acceptance has not been established. Demonstrates products / services and provides assistance in the best application to the product. Coordinates Company technical engineering services to determine customers' needs. Prepare price quotations, terms of sales, delivery dates, etc., and writes orders subject to company policy. Investigates product / service warranty claims and ensures resolution of customer complaints following marketing policies. Develops data relative to marketing trends, competitive products and pricing, and submits marketing reports to management. As required, prepares and submits reports on sales and marketing activities. Trains, instructs and orients new personnel and trainees.
Effective Date:September 2010
Total CompensationBase Pay Variable Pay
Insufficient Data
National Data - Effective September 2010 99 © 2011 Employer Associations of America (EAA)

(130) Sales Representative/Account Executive - Senior (Outside sales)Compensation Strategy: Commission Only
Bonus Commission# of Orgs
# of Emp
Un-Wtd Avg
WtdAvg P25 Median P75
Wtd Annual Avg
Wtd Annual Avg
Un-Wtd Avg
WtdAvg P10 P25 Median P75 P90
Customer TypeIndustry *6 19 - - - - - - $76,604 $66,656 $76,604 $30,000 $52,649 $71,248 $97,641 $135,119
IndustryWholesale and Retail Trade *5 30 - - - - - - $176,358 $168,071 $176,358 $45,938 $55,409 $86,416 $132,363 $592,514
* More than 30% of sample supplied by one organization.
Base Pay Variable Pay Total Compensation
National Data - Effective September 2010 100 © 2011 Employer Associations of America (EAA)

Bonus Commission# of Orgs
# of Emp
Un-Wtd Avg
WtdAvg P25 Median P75
Wtd Annual Avg
Wtd Annual Avg
Un-Wtd Avg
WtdAvg P10 P25 Median P75 P90
Total Responses *5 47 - - - - - $2,794 $90,595 $93,204 $93,390 $28,258 $41,013 $72,184 $93,676 $139,060
Org Sales Volume0.0-26.9 million *4 43 - - - - - $3,054 $86,125 $81,842 $89,179 - - $65,485 - -
RegionGreat Lakes *3 42 - - - - - $3,103 $85,969 $77,897 $89,072 - - $60,076 - -
Association
continued
Insufficient Data
(130) Sales Representative/Account Executive - Senior (Outside sales)Compensation Strategy: Commission + Bonus
Performs field promotional work to sell and develop new business. May include work with current major accounts, development of new territories, new industries, or with customers where the full market potential or product acceptance has not been established. Demonstrates products / services and provides assistance in the best application to the product. Coordinates Company technical engineering services to determine customers' needs. Prepare price quotations, terms of sales, delivery dates, etc., and writes orders subject to company policy. Investigates product / service warranty claims and ensures resolution of customer complaints following marketing policies. Develops data relative to marketing trends, competitive products and pricing, and submits marketing reports to management. As required, prepares and submits reports on sales and marketing activities. Trains, instructs and orients new personnel and trainees.
Effective Date:September 2010
Total CompensationBase Pay Variable Pay
National Data - Effective September 2010 101 © 2011 Employer Associations of America (EAA)
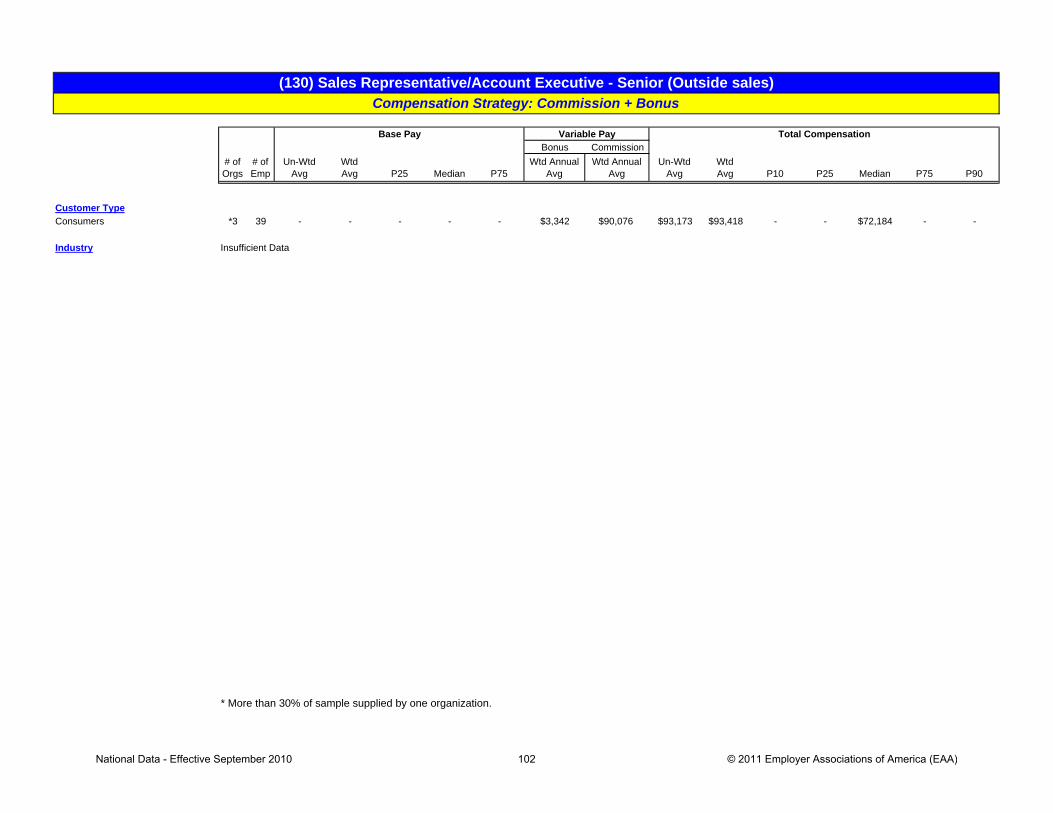
(130) Sales Representative/Account Executive - Senior (Outside sales)Compensation Strategy: Commission + Bonus
Bonus Commission# of Orgs
# of Emp
Un-Wtd Avg
WtdAvg P25 Median P75
Wtd Annual Avg
Wtd Annual Avg
Un-Wtd Avg
WtdAvg P10 P25 Median P75 P90
Customer TypeConsumers *3 39 - - - - - $3,342 $90,076 $93,173 $93,418 - - $72,184 - -
Industry
* More than 30% of sample supplied by one organization.
Base Pay Variable Pay Total Compensation
Insufficient Data
National Data - Effective September 2010 102 © 2011 Employer Associations of America (EAA)

Bonus Commission# of Orgs
# of Emp
Un-Wtd Avg
WtdAvg P25 Median P75
Wtd Annual Avg
Wtd Annual Avg
Un-Wtd Avg
WtdAvg P10 P25 Median P75 P90
Total Responses 272 1,718 - - - - - - - $70,109 $67,811 $40,823 $50,000 $63,643 $79,254 $97,071
Org Sales Volume0.0-26.9 million 117 376 - - - - - - - $67,410 $69,547 $45,839 $53,000 $65,822 $79,826 $100,00027.0-99.9 million 93 572 - - - - - - - $69,978 $66,643 $42,819 $50,327 $64,638 $80,000 $91,414100.0 million+ 62 770 - - - - - - - $75,396 $67,831 $39,026 $47,059 $61,547 $78,541 $101,322
RegionNortheast 24 89 - - - - - - - $77,429 $76,764 $45,463 $55,314 $70,748 $95,085 $122,257Southeast *12 51 - - - - - - - $69,040 $73,820 $48,440 $56,913 $72,800 $90,000 $101,819Great Lakes 179 1,307 - - - - - - - $70,066 $67,161 $40,000 $49,501 $62,590 $78,518 $94,863Central *13 48 - - - - - - - $63,789 $78,867 $49,841 $56,641 $69,834 $90,415 $129,989Mountain *18 121 - - - - - - - $69,996 $65,142 $43,845 $50,715 $63,324 $76,800 $87,408Pacific 26 102 - - - - - - - $67,376 $63,296 $41,868 $47,633 $60,534 $73,665 $90,308
AssociationAmerican Society of Employers (MI) *18 254 - - - - - - - $73,518 $62,990 $46,444 $50,706 $59,919 $69,725 $83,500Cascade Employers Assoc. (OR) 6 8 - - - - - - - $60,645 $60,314 $47,478 $51,075 $62,866 $66,500 $73,000Employers Assoc. NE (CT & MA) *7 29 - - - - - - - $77,405 $74,177 $48,598 $52,930 $71,000 $90,500 $105,834Trusight (MN) - formerly EA 38 281 - - - - - - - $68,681 $78,188 $46,361 $56,038 $70,000 $87,703 $116,819Employers Resource Assoc. (OH) *47 392 - - - - - - - $65,003 $57,548 $37,000 $40,577 $51,656 $71,348 $85,384Employers Resource Council (OH) 14 41 - - - - - - - $63,764 $65,265 $50,000 $54,004 $62,480 $74,148 $82,780MidAtlantic Employers Assoc. (PA) *6 16 - - - - - - - $71,990 $79,902 $45,052 $55,904 $73,057 $100,076 $133,252Mtn States Employers Council (CO) *18 119 - - - - - - - $64,080 $61,886 $42,855 $48,932 $59,400 $73,238 $83,000MRA - The Mgmt Assoc. (N. IL) *7 23 - - - - - - - $85,457 $82,124 $55,260 $62,063 $77,936 $95,070 $130,106MRA - The Mgmt Assoc. (WI) 67 297 - - - - - - - $71,623 $67,917 $40,079 $50,000 $66,574 $80,187 $91,719The Management Assoc. of Illinois (IL) 21 144 - - - - - - - $79,465 $81,710 $53,325 $66,081 $80,148 $96,315 $116,480
continued
Base Pay Variable Pay
(150) Sales Representative/Account Executive (Outside sales)Combined Compensation Type
Performs field promotional work to sell and develop new business accounts. Usually assigned to established territories or industries where company product lines are accepted. Demonstrates products / services and provides assistance in the best application of the product. May coordinate company technical engineering services to determine customers' needs. Subject to company approval, quotes prices, terms of sales, delivery dates, etc. Investigates product / service warranty claims and ensures resolution of customer complaints following marketing policies. As required, inform the company relative to marketing trends, competitive products and pricing. Completes required activity and expense reports.
Effective Date:September 2010
Total Compensation
National Data - Effective September 2010 103 © 2011 Employer Associations of America (EAA)

(150) Sales Representative/Account Executive (Outside sales)Combined Compensation Type
Bonus Commission# of Orgs
# of Emp
Un-Wtd Avg
WtdAvg P25 Median P75
Wtd Annual Avg
Wtd Annual Avg
Un-Wtd Avg
WtdAvg P10 P25 Median P75 P90
Customer TypeIndustry 184 836 - - - - - - - $71,743 $72,153 $45,526 $53,789 $68,142 $85,000 $103,111Distributors/Wholesalers 59 371 - - - - - - - $69,838 $75,751 $44,511 $55,008 $71,300 $83,981 $105,728Retailers *21 271 - - - - - - - $63,870 $49,544 $36,351 $38,519 $45,425 $56,080 $72,864Consumers *26 240 - - - - - - - $63,319 $61,043 $43,819 $51,711 $61,508 $69,625 $76,440
IndustryConstruction 5 11 - - - - - - - $65,165 $59,791 $43,013 $43,798 $55,051 $73,200 $88,248Non-Durable Goods Manufacturing 55 291 - - - - - - - $71,640 $72,610 $40,406 $52,640 $73,167 $85,000 $101,795Durable Goods Manufacturing 90 363 - - - - - - - $71,750 $71,219 $46,867 $55,126 $69,790 $81,567 $97,772Wholesale and Retail Trade 46 460 - - - - - - - $68,447 $64,939 $38,229 $42,222 $56,239 $76,414 $95,091Transportation and Warehousing *5 33 - - - - - - - $57,883 $63,024 $44,018 $50,444 $60,002 $69,609 $97,360Information *8 46 - - - - - - - $61,596 $54,395 $31,438 $38,623 $49,736 $66,081 $86,789Financial Activities *9 80 - - - - - - - $77,306 $65,846 $44,048 $48,041 $56,939 $71,102 $111,364Professional and Business Services 16 40 - - - - - - - $71,305 $72,244 $54,650 $60,000 $70,727 $84,433 $94,750Education and Health Services 14 87 - - - - - - - $73,047 $78,542 $52,679 $59,500 $72,800 $93,113 $114,372Leisure and Hospitality *3 9 - - - - - - - $52,069 $55,425 - - $56,080 - -Other Services *19 282 - - - - - - - $66,692 $63,548 $46,673 $50,671 $59,974 $71,321 $85,435
* More than 30% of sample supplied by one organization.
Base Pay Variable Pay Total Compensation
National Data - Effective September 2010 104 © 2011 Employer Associations of America (EAA)
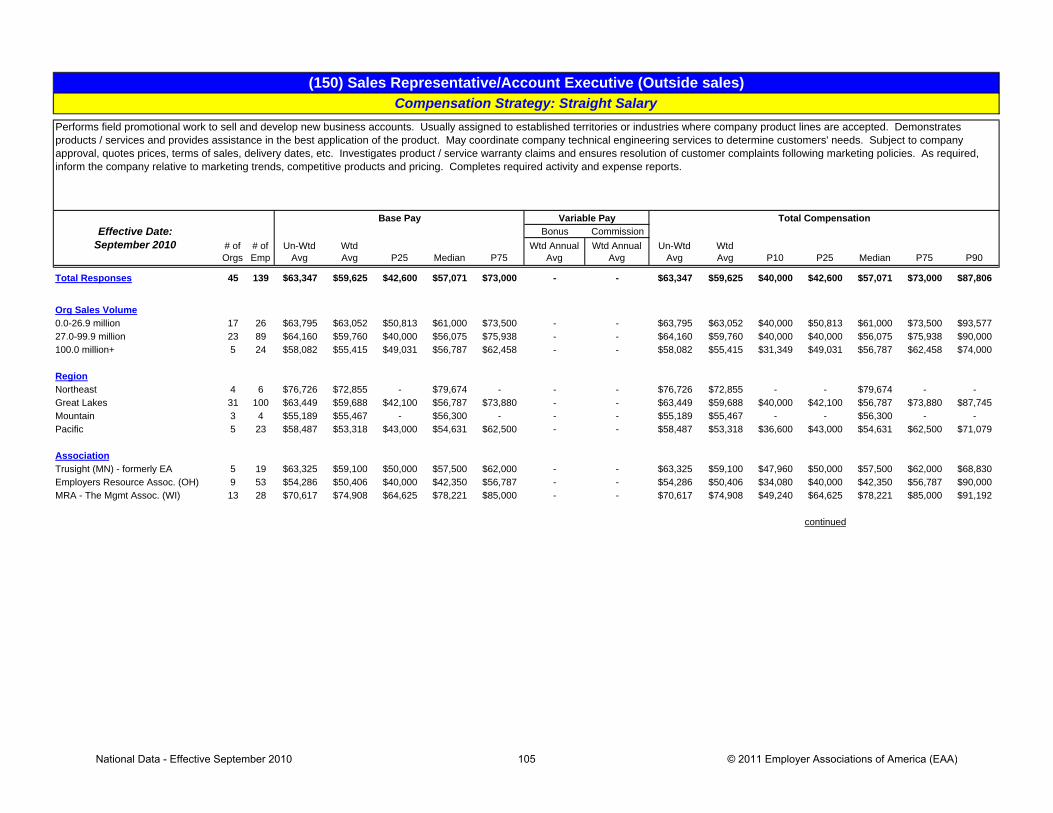
Bonus Commission# of Orgs
# of Emp
Un-Wtd Avg
WtdAvg P25 Median P75
Wtd Annual Avg
Wtd Annual Avg
Un-Wtd Avg
WtdAvg P10 P25 Median P75 P90
Total Responses 45 139 $63,347 $59,625 $42,600 $57,071 $73,000 - - $63,347 $59,625 $40,000 $42,600 $57,071 $73,000 $87,806
Org Sales Volume0.0-26.9 million 17 26 $63,795 $63,052 $50,813 $61,000 $73,500 - - $63,795 $63,052 $40,000 $50,813 $61,000 $73,500 $93,57727.0-99.9 million 23 89 $64,160 $59,760 $40,000 $56,075 $75,938 - - $64,160 $59,760 $40,000 $40,000 $56,075 $75,938 $90,000100.0 million+ 5 24 $58,082 $55,415 $49,031 $56,787 $62,458 - - $58,082 $55,415 $31,349 $49,031 $56,787 $62,458 $74,000
RegionNortheast 4 6 $76,726 $72,855 - $79,674 - - - $76,726 $72,855 - - $79,674 - -Great Lakes 31 100 $63,449 $59,688 $42,100 $56,787 $73,880 - - $63,449 $59,688 $40,000 $42,100 $56,787 $73,880 $87,745Mountain 3 4 $55,189 $55,467 - $56,300 - - - $55,189 $55,467 - - $56,300 - -Pacific 5 23 $58,487 $53,318 $43,000 $54,631 $62,500 - - $58,487 $53,318 $36,600 $43,000 $54,631 $62,500 $71,079
AssociationTrusight (MN) - formerly EA 5 19 $63,325 $59,100 $50,000 $57,500 $62,000 - - $63,325 $59,100 $47,960 $50,000 $57,500 $62,000 $68,830Employers Resource Assoc. (OH) 9 53 $54,286 $50,406 $40,000 $42,350 $56,787 - - $54,286 $50,406 $34,080 $40,000 $42,350 $56,787 $90,000MRA - The Mgmt Assoc. (WI) 13 28 $70,617 $74,908 $64,625 $78,221 $85,000 - - $70,617 $74,908 $49,240 $64,625 $78,221 $85,000 $91,192
continued
(150) Sales Representative/Account Executive (Outside sales)Compensation Strategy: Straight Salary
Performs field promotional work to sell and develop new business accounts. Usually assigned to established territories or industries where company product lines are accepted. Demonstrates products / services and provides assistance in the best application of the product. May coordinate company technical engineering services to determine customers' needs. Subject to company approval, quotes prices, terms of sales, delivery dates, etc. Investigates product / service warranty claims and ensures resolution of customer complaints following marketing policies. As required, inform the company relative to marketing trends, competitive products and pricing. Completes required activity and expense reports.
Effective Date:September 2010
Total CompensationBase Pay Variable Pay
National Data - Effective September 2010 105 © 2011 Employer Associations of America (EAA)

(150) Sales Representative/Account Executive (Outside sales)Compensation Strategy: Straight Salary
Bonus Commission# of Orgs
# of Emp
Un-Wtd Avg
WtdAvg P25 Median P75
Wtd Annual Avg
Wtd Annual Avg
Un-Wtd Avg
WtdAvg P10 P25 Median P75 P90
Customer TypeIndustry 27 64 $63,397 $65,672 $51,219 $61,767 $84,921 - - $63,397 $65,672 $39,600 $51,219 $61,767 $84,921 $93,248Distributors/Wholesalers 10 47 $63,773 $54,282 $40,000 $54,631 $62,844 - - $63,773 $54,282 $40,000 $40,000 $54,631 $62,844 $77,994Retailers 4 15 $58,052 $52,260 - $56,540 - - - $58,052 $52,260 - - $56,540 - -Consumers 5 13 $65,760 $57,675 $47,605 $56,075 $66,915 - - $65,760 $57,675 $41,920 $47,605 $56,075 $66,915 $84,907
IndustryNon-Durable Goods Manufacturing 13 39 $63,099 $66,926 $50,000 $65,000 $85,000 - - $63,099 $66,926 $39,600 $50,000 $65,000 $85,000 $93,248Durable Goods Manufacturing 15 27 $72,353 $68,819 $55,650 $68,000 $77,000 - - $72,353 $68,819 $50,771 $55,650 $68,000 $77,000 $88,445Wholesale and Retail Trade 6 44 $55,529 $49,860 $40,000 $41,200 $58,501 - - $55,529 $49,860 $32,773 $40,000 $41,200 $58,501 $72,571Professional and Business Services 3 4 $59,167 $60,000 - $62,500 - - - $59,167 $60,000 - - $62,500 - -Other Services 3 11 $44,922 $50,522 - $48,745 - - - $44,922 $50,522 - - $48,745 - -
Base Pay Variable Pay Total Compensation
National Data - Effective September 2010 106 © 2011 Employer Associations of America (EAA)

Bonus Commission# of Orgs
# of Emp
Un-Wtd Avg
WtdAvg P25 Median P75
Wtd Annual Avg
Wtd Annual Avg
Un-Wtd Avg
WtdAvg P10 P25 Median P75 P90
Total Responses 112 746 $51,944 $46,870 $39,001 $44,906 $53,169 - $20,091 $71,414 $66,961 $44,476 $52,092 $63,256 $77,536 $92,625
Org Sales Volume0.0-26.9 million 47 145 $49,265 $50,188 $40,000 $50,000 $57,267 - $19,155 $69,929 $69,343 $47,244 $53,818 $62,386 $79,539 $100,60227.0-99.9 million 39 200 $53,271 $47,747 $35,921 $48,000 $60,750 - $20,401 $69,309 $68,148 $45,000 $54,919 $65,758 $80,400 $90,004100.0 million+ 26 401 $54,796 $45,233 $38,700 $42,516 $47,775 - $20,275 $77,256 $65,508 $43,041 $50,272 $62,587 $75,950 $92,297
RegionNortheast 9 37 $55,473 $50,120 $39,386 $50,000 $60,500 - $22,639 $78,526 $72,759 $40,800 $55,500 $68,000 $90,750 $112,555Southeast 6 24 $53,539 $45,980 $38,190 $41,201 $54,075 - $38,947 $81,146 $84,927 $62,721 $73,013 $84,093 $98,390 $112,000Great Lakes 80 579 $52,384 $48,338 $40,000 $45,000 $54,000 - $17,064 $71,197 $65,401 $44,420 $51,333 $62,284 $76,081 $89,429Central 6 31 $52,908 $44,884 $38,208 $42,000 $50,000 - $42,852 $67,921 $87,736 $50,400 $60,689 $83,262 $115,868 $134,572Mountain 5 48 $43,873 $33,848 $20,000 $35,000 $42,813 - $23,487 $60,448 $57,335 $42,326 $45,610 $53,879 $66,588 $78,096Pacific 6 27 $44,953 $37,169 $24,000 $36,000 $43,605 - $32,589 $66,539 $69,757 $44,647 $53,000 $66,243 $84,590 $103,112
AssociationAmerican Society of Employers (MI) 7 223 $48,804 $44,664 $40,000 $43,742 $48,000 - $17,461 $85,041 $62,125 $46,803 $50,714 $59,317 $68,573 $78,094Trusight (MN) - formerly EA 13 78 $53,563 $52,876 $40,750 $51,414 $63,466 - $13,235 $65,017 $66,111 $47,400 $54,747 $62,463 $78,484 $89,451Employers Resource Assoc. (OH) 24 82 $52,937 $52,047 $44,859 $51,359 $57,765 - $14,172 $67,071 $66,219 $48,324 $55,311 $61,880 $73,504 $89,340Employers Resource Council (OH) 9 23 $55,996 $56,478 $48,960 $57,000 $63,240 - $12,908 $65,999 $69,386 $50,275 $57,857 $63,688 $80,788 $101,607Mtn States Employers Council (CO) 4 47 $46,092 $33,823 - $35,000 - - $23,535 $61,499 $57,358 - - $53,850 - -MRA - The Mgmt Assoc. (N. IL) 4 14 $54,205 $56,722 - $55,423 - - $18,443 $76,135 $75,165 - - $76,536 - -MRA - The Mgmt Assoc. (WI) 25 115 $50,807 $47,003 $38,519 $43,160 $50,103 - $13,985 $71,960 $60,987 $37,415 $41,469 $54,227 $76,000 $90,180The Management Assoc. of Illinois (IL) 19 138 $54,260 $47,126 $37,746 $42,664 $53,475 - $35,113 $81,347 $82,239 $53,965 $66,836 $80,312 $96,002 $117,103
continued
Base Pay Variable Pay
(150) Sales Representative/Account Executive (Outside sales)Compensation Strategy: Salary + Commission
Performs field promotional work to sell and develop new business accounts. Usually assigned to established territories or industries where company product lines are accepted. Demonstrates products / services and provides assistance in the best application of the product. May coordinate company technical engineering services to determine customers' needs. Subject to company approval, quotes prices, terms of sales, delivery dates, etc. Investigates product / service warranty claims and ensures resolution of customer complaints following marketing policies. As required, inform the company relative to marketing trends, competitive products and pricing. Completes required activity and expense reports.
Effective Date:September 2010
Total Compensation
National Data - Effective September 2010 107 © 2011 Employer Associations of America (EAA)

(150) Sales Representative/Account Executive (Outside sales)Compensation Strategy: Salary + Commission
Bonus Commission# of Orgs
# of Emp
Un-Wtd Avg
WtdAvg P25 Median P75
Wtd Annual Avg
Wtd Annual Avg
Un-Wtd Avg
WtdAvg P10 P25 Median P75 P90
Customer TypeIndustry 85 427 $52,850 $46,248 $38,615 $43,160 $54,000 - $23,316 $73,165 $69,564 $45,500 $52,266 $63,912 $80,951 $101,538Distributors/Wholesalers 19 112 $51,838 $53,765 $41,285 $52,900 $67,500 - $19,669 $72,723 $73,435 $52,685 $62,084 $74,634 $83,211 $91,244Retailers 7 57 $41,200 $40,916 $36,462 $38,978 $44,354 - $4,666 $56,097 $45,582 $36,400 $37,980 $41,891 $48,408 $60,689Consumers 7 150 $42,147 $45,754 $41,498 $45,388 $50,000 - $17,088 $56,407 $62,842 $48,158 $55,347 $62,531 $68,936 $76,901
IndustryNon-Durable Goods Manufacturing 21 130 $54,455 $54,397 $40,000 $52,610 $67,503 - $15,874 $79,555 $70,271 $37,830 $45,039 $71,333 $83,250 $98,628Durable Goods Manufacturing 34 143 $54,470 $47,492 $38,000 $43,000 $54,186 - $30,208 $73,423 $77,700 $50,000 $61,000 $74,670 $90,337 $111,136Wholesale and Retail Trade 15 100 $47,554 $47,279 $40,000 $45,000 $52,456 - $17,482 $67,881 $64,761 $41,100 $52,679 $61,307 $78,210 $86,455Transportation and Warehousing 3 22 $29,458 $27,432 - $24,000 - - $37,555 $58,421 $64,987 - - $61,627 - -Information 3 16 $43,833 $45,312 - $45,000 - - $18,938 $57,961 $64,251 - - $60,374 - -Financial Activities 5 34 $46,917 $31,032 $20,000 $20,000 $35,000 - $32,215 $74,500 $63,247 $42,594 $45,242 $53,363 $70,000 $105,950Professional and Business Services 9 24 $57,195 $52,929 $42,000 $50,000 $60,000 - $16,156 $67,403 $69,085 $53,650 $58,376 $66,500 $79,217 $89,790Education and Health Services 10 41 $57,112 $53,635 $48,000 $53,539 $59,150 - $10,879 $71,823 $64,514 $48,957 $56,810 $61,880 $71,495 $80,800Other Services 7 218 $48,667 $44,596 $40,000 $43,564 $47,888 - $16,243 $67,600 $60,839 $46,569 $50,615 $59,037 $67,799 $77,043
Base Pay Variable Pay Total Compensation
National Data - Effective September 2010 108 © 2011 Employer Associations of America (EAA)
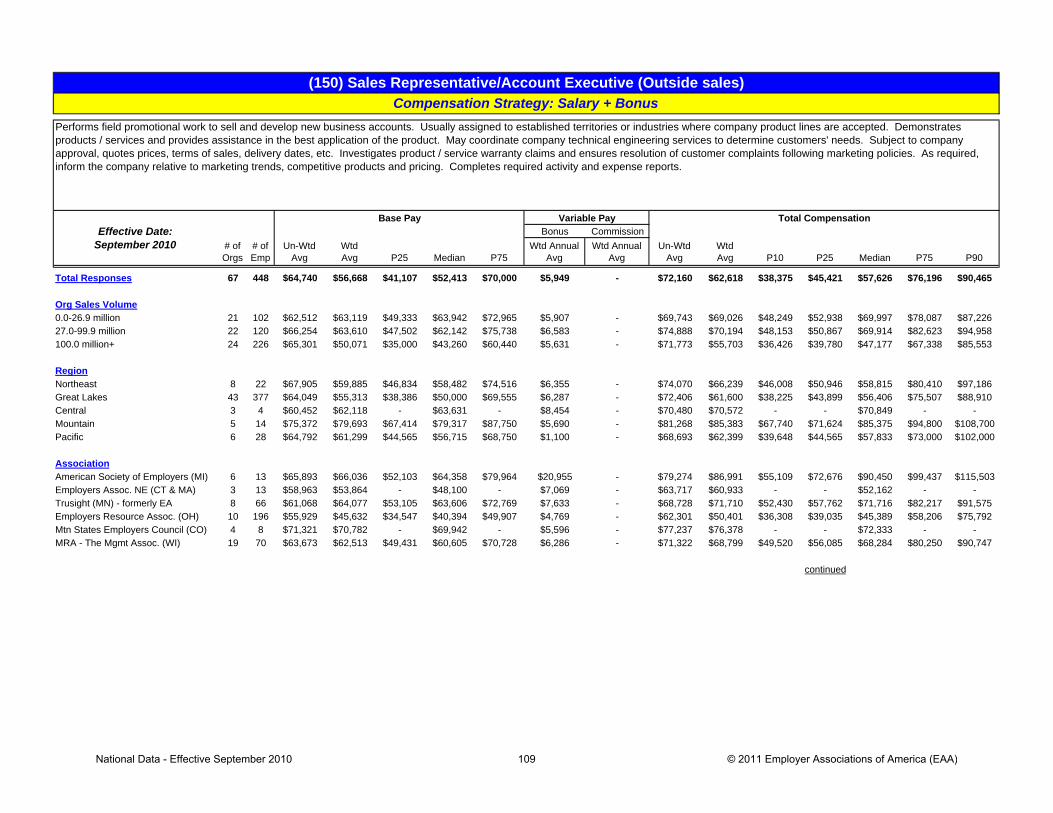
Bonus Commission# of Orgs
# of Emp
Un-Wtd Avg
WtdAvg P25 Median P75
Wtd Annual Avg
Wtd Annual Avg
Un-Wtd Avg
WtdAvg P10 P25 Median P75 P90
Total Responses 67 448 $64,740 $56,668 $41,107 $52,413 $70,000 $5,949 - $72,160 $62,618 $38,375 $45,421 $57,626 $76,196 $90,465
Org Sales Volume0.0-26.9 million 21 102 $62,512 $63,119 $49,333 $63,942 $72,965 $5,907 - $69,743 $69,026 $48,249 $52,938 $69,997 $78,087 $87,22627.0-99.9 million 22 120 $66,254 $63,610 $47,502 $62,142 $75,738 $6,583 - $74,888 $70,194 $48,153 $50,867 $69,914 $82,623 $94,958100.0 million+ 24 226 $65,301 $50,071 $35,000 $43,260 $60,440 $5,631 - $71,773 $55,703 $36,426 $39,780 $47,177 $67,338 $85,553
RegionNortheast 8 22 $67,905 $59,885 $46,834 $58,482 $74,516 $6,355 - $74,070 $66,239 $46,008 $50,946 $58,815 $80,410 $97,186Great Lakes 43 377 $64,049 $55,313 $38,386 $50,000 $69,555 $6,287 - $72,406 $61,600 $38,225 $43,899 $56,406 $75,507 $88,910Central 3 4 $60,452 $62,118 - $63,631 - $8,454 - $70,480 $70,572 - - $70,849 - -Mountain 5 14 $75,372 $79,693 $67,414 $79,317 $87,750 $5,690 - $81,268 $85,383 $67,740 $71,624 $85,375 $94,800 $108,700Pacific 6 28 $64,792 $61,299 $44,565 $56,715 $68,750 $1,100 - $68,693 $62,399 $39,648 $44,565 $57,833 $73,000 $102,000
AssociationAmerican Society of Employers (MI) 6 13 $65,893 $66,036 $52,103 $64,358 $79,964 $20,955 - $79,274 $86,991 $55,109 $72,676 $90,450 $99,437 $115,503Employers Assoc. NE (CT & MA) 3 13 $58,963 $53,864 - $48,100 - $7,069 - $63,717 $60,933 - - $52,162 - -Trusight (MN) - formerly EA 8 66 $61,068 $64,077 $53,105 $63,606 $72,769 $7,633 - $68,728 $71,710 $52,430 $57,762 $71,716 $82,217 $91,575Employers Resource Assoc. (OH) 10 196 $55,929 $45,632 $34,547 $40,394 $49,907 $4,769 - $62,301 $50,401 $36,308 $39,035 $45,389 $58,206 $75,792Mtn States Employers Council (CO) 4 8 $71,321 $70,782 - $69,942 - $5,596 - $77,237 $76,378 - - $72,333 - -MRA - The Mgmt Assoc. (WI) 19 70 $63,673 $62,513 $49,431 $60,605 $70,728 $6,286 - $71,322 $68,799 $49,520 $56,085 $68,284 $80,250 $90,747
continued
(150) Sales Representative/Account Executive (Outside sales)Compensation Strategy: Salary + Bonus
Performs field promotional work to sell and develop new business accounts. Usually assigned to established territories or industries where company product lines are accepted. Demonstrates products / services and provides assistance in the best application of the product. May coordinate company technical engineering services to determine customers' needs. Subject to company approval, quotes prices, terms of sales, delivery dates, etc. Investigates product / service warranty claims and ensures resolution of customer complaints following marketing policies. As required, inform the company relative to marketing trends, competitive products and pricing. Completes required activity and expense reports.
Effective Date:September 2010
Total CompensationBase Pay Variable Pay
National Data - Effective September 2010 109 © 2011 Employer Associations of America (EAA)

(150) Sales Representative/Account Executive (Outside sales)Compensation Strategy: Salary + Bonus
Bonus Commission# of Orgs
# of Emp
Un-Wtd Avg
WtdAvg P25 Median P75
Wtd Annual Avg
Wtd Annual Avg
Un-Wtd Avg
WtdAvg P10 P25 Median P75 P90
Customer TypeIndustry 36 152 $66,550 $66,279 $50,938 $63,857 $76,682 $7,544 - $75,188 $73,823 $47,282 $56,397 $72,233 $85,069 $101,220Distributors/Wholesalers 24 107 $66,533 $65,477 $50,001 $65,000 $76,569 $4,760 - $71,465 $70,237 $47,800 $54,462 $70,000 $83,143 $95,988Retailers 8 171 $56,211 $42,493 $33,990 $36,880 $47,674 $4,747 - $62,870 $47,240 $36,102 $38,433 $43,591 $51,929 $66,830Consumers 9 18 $60,397 $57,825 $47,412 $59,142 $66,900 $10,971 - $70,200 $68,796 $50,146 $64,500 $70,746 $74,375 $77,895
IndustryNon-Durable Goods Manufacturing 10 67 $67,217 $69,168 $52,021 $67,759 $80,000 $8,511 - $75,657 $77,679 $51,925 $60,002 $78,945 $88,502 $105,185Durable Goods Manufacturing 30 148 $66,041 $61,482 $46,948 $60,591 $72,554 $5,319 - $73,478 $66,801 $45,691 $50,327 $69,120 $77,670 $87,541Wholesale and Retail Trade 15 182 $59,596 $45,422 $34,239 $37,640 $51,438 $4,787 - $64,901 $50,209 $36,148 $38,632 $43,896 $55,655 $73,950Financial Activities 3 13 $55,507 $53,312 - $48,500 - $12,396 - $68,213 $65,707 - - $70,010 - -Other Services 5 33 $72,715 $71,488 $52,103 $67,000 $87,750 $7,889 - $84,782 $79,377 $49,819 $58,159 $79,996 $95,400 $113,241
Base Pay Variable Pay Total Compensation
National Data - Effective September 2010 110 © 2011 Employer Associations of America (EAA)

Bonus Commission# of Orgs
# of Emp
Un-Wtd Avg
WtdAvg P25 Median P75
Wtd Annual Avg
Wtd Annual Avg
Un-Wtd Avg
WtdAvg P10 P25 Median P75 P90
Total Responses 68 307 $48,349 $45,863 $32,423 $45,000 $56,020 $2,868 $24,115 $70,680 $72,846 $45,506 $54,566 $68,988 $84,231 $103,950
Org Sales Volume0.0-26.9 million 32 80 $46,443 $43,523 $32,490 $39,230 $48,017 $2,752 $28,095 $67,979 $74,370 $44,215 $52,677 $71,291 $92,986 $105,66527.0-99.9 million 22 148 $50,014 $43,056 $30,000 $38,917 $52,966 $2,509 $21,699 $73,396 $67,264 $42,792 $51,083 $67,157 $79,064 $92,929100.0 million+ 14 79 $50,089 $53,491 $49,242 $52,950 $60,200 $3,659 $24,612 $72,584 $81,762 $51,648 $63,821 $76,756 $95,243 $125,941
RegionNortheast 6 24 $54,784 $58,063 $42,046 $56,587 $67,950 $6,173 $29,326 $83,155 $93,562 $50,939 $66,561 $95,165 $126,278 $132,185Southeast 4 19 $37,026 $40,738 - $40,000 - $3,144 $18,499 $59,956 $62,381 - - $57,446 - -Great Lakes 37 175 $49,400 $45,597 $33,250 $45,000 $54,855 $2,442 $26,461 $71,129 $74,500 $45,815 $55,000 $73,792 $89,019 $105,652Central 4 12 $47,860 $51,156 - $50,000 - $1,227 $9,579 $56,907 $61,961 - - $61,391 - -Mountain 7 53 $49,937 $43,839 $30,000 $32,423 $61,586 $3,936 $19,258 $71,206 $67,033 $44,451 $51,214 $67,320 $77,400 $89,864Pacific 10 24 $44,213 $41,482 $36,360 $40,000 $48,011 $916 $24,237 $70,963 $66,635 $43,418 $51,805 $64,438 $81,673 $89,233
AssociationAmerican Society of Employers (MI) 5 13 $54,303 $50,833 $45,000 $50,000 $55,000 $660 $6,180 $60,397 $57,673 $45,445 $46,306 $59,892 $65,913 $77,234Trusight (MN) - formerly EA 11 61 $50,569 $45,985 $30,497 $50,000 $59,413 $1,788 $27,132 $69,260 $74,906 $33,164 $54,603 $75,037 $93,021 $110,978Employers Resource Assoc. (OH) 10 54 $41,625 $40,303 $30,908 $35,742 $45,197 $3,516 $33,065 $68,614 $76,883 $48,834 $60,551 $74,891 $93,506 $104,423Mtn States Employers Council (CO) 11 61 $43,254 $41,958 $30,000 $36,000 $56,306 $3,700 $17,796 $60,060 $63,454 $42,606 $48,792 $63,324 $75,031 $83,804MRA - The Mgmt Assoc. (WI) 17 75 $54,492 $50,110 $39,000 $50,000 $55,000 $2,578 $21,148 $78,275 $73,835 $49,600 $56,006 $69,449 $82,408 $102,237
continued
Base Pay Variable Pay
(150) Sales Representative/Account Executive (Outside sales)Compensation Strategy: Salary + Commission + Bonus
Performs field promotional work to sell and develop new business accounts. Usually assigned to established territories or industries where company product lines are accepted. Demonstrates products / services and provides assistance in the best application of the product. May coordinate company technical engineering services to determine customers' needs. Subject to company approval, quotes prices, terms of sales, delivery dates, etc. Investigates product / service warranty claims and ensures resolution of customer complaints following marketing policies. As required, inform the company relative to marketing trends, competitive products and pricing. Completes required activity and expense reports.
Effective Date:September 2010
Total Compensation
National Data - Effective September 2010 111 © 2011 Employer Associations of America (EAA)

(150) Sales Representative/Account Executive (Outside sales)Compensation Strategy: Salary + Commission + Bonus
Bonus Commission# of Orgs
# of Emp
Un-Wtd Avg
WtdAvg P25 Median P75
Wtd Annual Avg
Wtd Annual Avg
Un-Wtd Avg
WtdAvg P10 P25 Median P75 P90
Customer TypeIndustry 47 183 $50,473 $49,123 $36,000 $48,022 $58,195 $3,196 $26,509 $71,683 $78,828 $46,395 $57,396 $75,366 $95,000 $119,310Distributors/Wholesalers 12 59 $47,967 $44,962 $30,000 $50,000 $56,581 $1,944 $19,674 $71,103 $66,580 $47,497 $54,414 $66,224 $78,000 $84,500Retailers 5 27 $40,110 $38,377 $29,536 $37,752 $44,070 $1,909 $31,362 $73,271 $71,648 $49,155 $64,474 $67,819 $80,527 $93,160Consumers 6 38 $38,445 $36,880 $25,740 $35,000 $49,297 $3,404 $14,333 $59,238 $54,617 $31,690 $40,313 $52,289 $67,249 $76,706
IndustryNon-Durable Goods Manufacturing 14 55 $47,673 $54,317 $40,000 $53,500 $65,000 $4,309 $17,368 $68,350 $75,994 $45,357 $57,446 $75,001 $84,004 $106,075Durable Goods Manufacturing 14 40 $53,270 $49,313 $40,000 $49,507 $57,426 $1,843 $15,838 $70,899 $66,994 $40,789 $51,213 $65,426 $74,883 $97,188Wholesale and Retail Trade 17 82 $43,428 $42,365 $35,000 $41,582 $50,000 $2,457 $24,520 $69,791 $69,342 $49,898 $58,971 $67,752 $79,031 $86,511Information 5 22 $46,766 $33,673 $20,150 $28,590 $40,800 $295 $17,218 $63,773 $51,186 $30,940 $32,573 $44,759 $59,673 $95,968Professional and Business Services 4 11 $56,250 $42,727 - $25,000 - $0 $38,337 $82,922 $81,065 - - $80,000 - -Education and Health Services 3 41 $46,234 $52,318 - $56,020 - $4,366 $37,389 $79,540 $94,073 - - $93,113 - -Other Services 7 20 $49,226 $50,001 $33,673 $49,011 $50,000 $1,338 $22,787 $68,492 $74,125 $47,782 $53,717 $70,719 $81,020 $130,474
Base Pay Variable Pay Total Compensation
National Data - Effective September 2010 112 © 2011 Employer Associations of America (EAA)
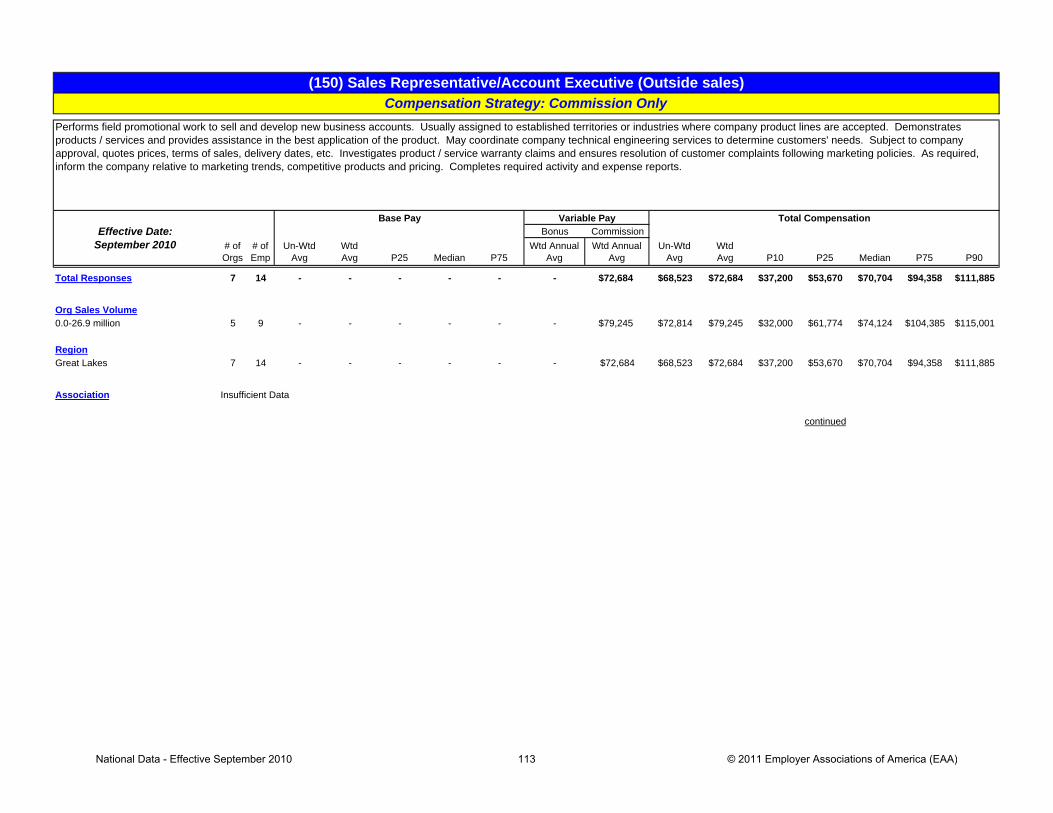
Bonus Commission# of Orgs
# of Emp
Un-Wtd Avg
WtdAvg P25 Median P75
Wtd Annual Avg
Wtd Annual Avg
Un-Wtd Avg
WtdAvg P10 P25 Median P75 P90
Total Responses 7 14 - - - - - - $72,684 $68,523 $72,684 $37,200 $53,670 $70,704 $94,358 $111,885
Org Sales Volume0.0-26.9 million 5 9 - - - - - - $79,245 $72,814 $79,245 $32,000 $61,774 $74,124 $104,385 $115,001
RegionGreat Lakes 7 14 - - - - - - $72,684 $68,523 $72,684 $37,200 $53,670 $70,704 $94,358 $111,885
Association
continued
Insufficient Data
(150) Sales Representative/Account Executive (Outside sales)Compensation Strategy: Commission Only
Performs field promotional work to sell and develop new business accounts. Usually assigned to established territories or industries where company product lines are accepted. Demonstrates products / services and provides assistance in the best application of the product. May coordinate company technical engineering services to determine customers' needs. Subject to company approval, quotes prices, terms of sales, delivery dates, etc. Investigates product / service warranty claims and ensures resolution of customer complaints following marketing policies. As required, inform the company relative to marketing trends, competitive products and pricing. Completes required activity and expense reports.
Effective Date:September 2010
Total CompensationBase Pay Variable Pay
National Data - Effective September 2010 113 © 2011 Employer Associations of America (EAA)

(150) Sales Representative/Account Executive (Outside sales)Compensation Strategy: Commission Only
Bonus Commission# of Orgs
# of Emp
Un-Wtd Avg
WtdAvg P25 Median P75
Wtd Annual Avg
Wtd Annual Avg
Un-Wtd Avg
WtdAvg P10 P25 Median P75 P90
Customer TypeIndustry 5 10 - - - - - - $76,600 $74,894 $76,600 $42,400 $53,670 $70,704 $102,193 $114,378
IndustryWholesale and Retail Trade 3 9 - - - - - - $76,305 $70,395 $76,305 - - $75,746 - -
Base Pay Variable Pay Total Compensation
National Data - Effective September 2010 114 © 2011 Employer Associations of America (EAA)

Bonus Commission# of Orgs
# of Emp
Un-Wtd Avg
WtdAvg P25 Median P75
Wtd Annual Avg
Wtd Annual Avg
Un-Wtd Avg
WtdAvg P10 P25 Median P75 P90
Total Responses *8 64 - - - - - $849 $105,789 $69,003 $106,638 $39,085 $56,950 $91,957 $145,994 $191,588
Org Sales Volume27.0-99.9 million *3 10 - - - - - $1,710 $47,202 $58,073 $48,912 - - $41,890 - -100.0 million+ *3 40 - - - - - $640 $138,949 $97,749 $139,588 - - $127,650 - -
Region
Great Lakes *7 62 - - - - - $877 $106,618 $67,420 $107,495 $38,912 $56,215 $93,456 $150,819 $192,930
AssociationTrusight (MN) - formerly EA *3 55 - - - - - $669 $113,234 $81,472 $113,903 - - $100,043 - -
continued
Base Pay Variable Pay
(150) Sales Representative/Account Executive (Outside sales)Compensation Strategy: Commission + Bonus
Performs field promotional work to sell and develop new business accounts. Usually assigned to established territories or industries where company product lines are accepted. Demonstrates products / services and provides assistance in the best application of the product. May coordinate company technical engineering services to determine customers' needs. Subject to company approval, quotes prices, terms of sales, delivery dates, etc. Investigates product / service warranty claims and ensures resolution of customer complaints following marketing policies. As required, inform the company relative to marketing trends, competitive products and pricing. Completes required activity and expense reports.
Effective Date:September 2010
Total Compensation
National Data - Effective September 2010 115 © 2011 Employer Associations of America (EAA)

(150) Sales Representative/Account Executive (Outside sales)Compensation Strategy: Commission + Bonus
Bonus Commission# of Orgs
# of Emp
Un-Wtd Avg
WtdAvg P25 Median P75
Wtd Annual Avg
Wtd Annual Avg
Un-Wtd Avg
WtdAvg P10 P25 Median P75 P90
Customer TypeDistributors/Wholesalers *5 43 - - - - - $682 $131,047 $72,228 $131,728 $56,176 $91,703 $124,917 $179,506 $205,407Consumers *4 21 - - - - - $1,193 $54,070 $61,203 $55,263 - - $54,150 - -
IndustryWholesale and Retail Trade *5 43 - - - - - $828 $131,522 $74,899 $132,350 $65,057 $91,703 $124,917 $179,506 $205,407
* More than 30% of sample supplied by one organization.
Base Pay Variable Pay Total Compensation
National Data - Effective September 2010 116 © 2011 Employer Associations of America (EAA)

Bonus Commission# of Orgs
# of Emp
Un-Wtd Avg
WtdAvg P25 Median P75
Wtd Annual Avg
Wtd Annual Avg
Un-Wtd Avg
WtdAvg P10 P25 Median P75 P90
Total Responses 95 300 - - - - - - - $48,095 $47,196 $30,000 $35,000 $42,754 $59,869 $68,598
Org Sales Volume0.0-26.9 million 36 69 - - - - - - - $45,950 $43,628 $31,200 $35,848 $40,700 $52,320 $62,00127.0-99.9 million 40 144 - - - - - - - $49,149 $50,373 $29,361 $35,000 $51,207 $66,165 $70,002100.0 million+ 19 87 - - - - - - - $49,938 $44,766 $29,999 $33,867 $41,200 $52,564 $64,534
RegionNortheast 6 8 - - - - - - - $50,092 $46,340 $25,000 $35,113 $40,927 $57,999 $75,775Southeast 7 19 - - - - - - - $47,788 $50,232 $25,650 $40,000 $52,564 $63,924 $65,300Great Lakes 63 210 - - - - - - - $47,176 $43,950 $29,828 $33,574 $40,000 $52,422 $66,027Central 3 3 - - - - - - - $47,674 $47,674 - - $49,821 - -Mountain 10 54 - - - - - - - $48,969 $57,998 $34,405 $44,013 $65,000 $67,926 $70,595Pacific 6 6
AssociationAmerican Society of Employers (MI) 8 38 - - - - - - - $48,541 $48,789 $34,887 $37,974 $41,356 $63,214 $69,235Trusight (MN) - formerly EA 12 40 - - - - - - - $44,510 $42,921 $29,649 $35,396 $40,018 $49,096 $59,577Employers Resource Assoc. (OH) 20 93 - - - - - - - $42,956 $38,953 $28,734 $31,308 $35,400 $44,022 $56,300Mtn States Employers Council (CO) 8 48 - - - - - - - $50,350 $58,975 $35,656 $45,519 $65,000 $68,374 $70,279MRA - The Mgmt Assoc. (N. IL) 3 4 - - - - - - - $62,223 $65,555 - - $74,260 - -MRA - The Mgmt Assoc. (WI) 26 52 - - - - - - - $47,942 $49,586 $26,612 $36,674 $50,629 $60,980 $71,310The Management Assoc. of Illinois (IL) 5 6 - - - - - - - $56,560 $56,169 $36,000 $41,625 $53,910 $68,451 $87,645
continued
(160) Sales Representative - Junior (Outside sales)Combined Compensation Type
Under the supervision of the Sales Supervisor or Sales Representative - Senior, performs field promotional work to obtain sales in an assigned territory where the company and product line are established. May canvas out prospective new accounts. Demonstrates products / services and assists in the selection of products / services most applicable to customers' needs. Demonstrates and familiarizes established accounts with new products / services and developments. Quotes prices, terms, delivery dates, etc. on new or repeat orders subject to the approval of company sales supervisor. May investigate and report on warranty claims and complaints. Prepares periodic activity and expense reports.
Effective Date:September 2010
Total CompensationBase Pay Variable Pay
National Data - Effective September 2010 117 © 2011 Employer Associations of America (EAA)
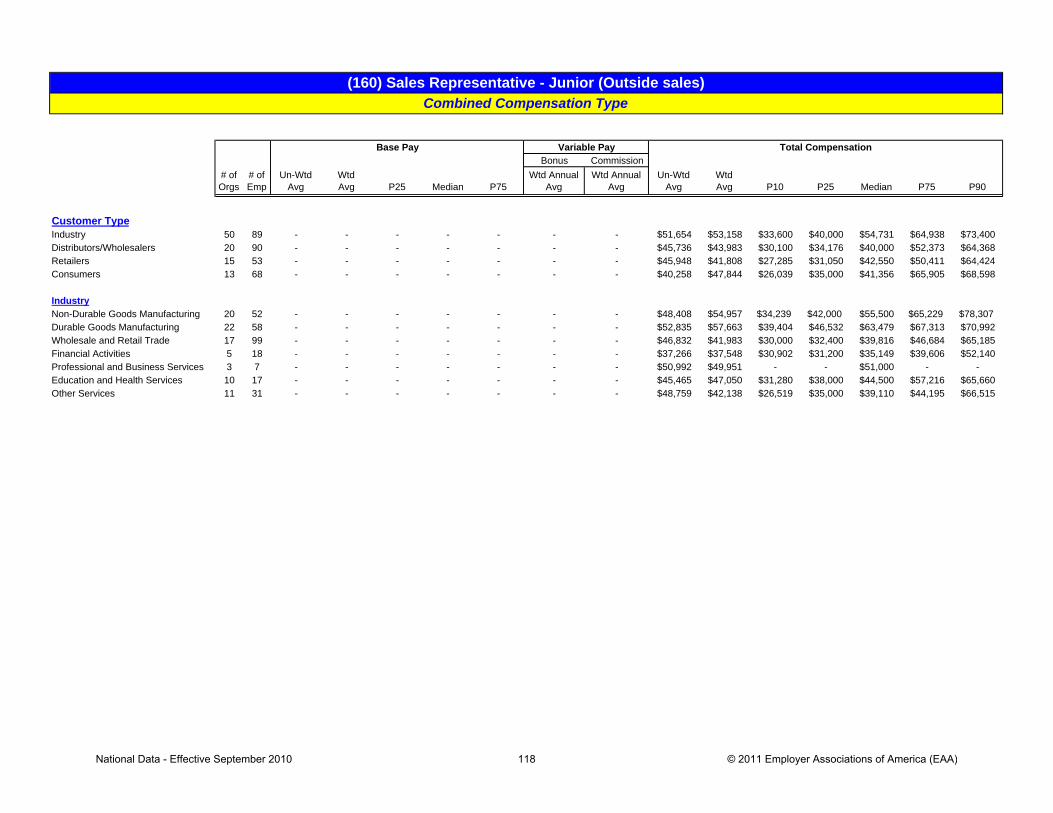
(160) Sales Representative - Junior (Outside sales)Combined Compensation Type
Bonus Commission# of Orgs
# of Emp
Un-Wtd Avg
WtdAvg P25 Median P75
Wtd Annual Avg
Wtd Annual Avg
Un-Wtd Avg
WtdAvg P10 P25 Median P75 P90
Customer TypeIndustry 50 89 - - - - - - - $51,654 $53,158 $33,600 $40,000 $54,731 $64,938 $73,400Distributors/Wholesalers 20 90 - - - - - - - $45,736 $43,983 $30,100 $34,176 $40,000 $52,373 $64,368Retailers 15 53 - - - - - - - $45,948 $41,808 $27,285 $31,050 $42,550 $50,411 $64,424Consumers 13 68 - - - - - - - $40,258 $47,844 $26,039 $35,000 $41,356 $65,905 $68,598
IndustryNon-Durable Goods Manufacturing 20 52 - - - - - - - $48,408 $54,957 $34,239 $42,000 $55,500 $65,229 $78,307Durable Goods Manufacturing 22 58 - - - - - - - $52,835 $57,663 $39,404 $46,532 $63,479 $67,313 $70,992Wholesale and Retail Trade 17 99 - - - - - - - $46,832 $41,983 $30,000 $32,400 $39,816 $46,684 $65,185Financial Activities 5 18 - - - - - - - $37,266 $37,548 $30,902 $31,200 $35,149 $39,606 $52,140Professional and Business Services 3 7 - - - - - - - $50,992 $49,951 - - $51,000 - -Education and Health Services 10 17 - - - - - - - $45,465 $47,050 $31,280 $38,000 $44,500 $57,216 $65,660Other Services 11 31 - - - - - - - $48,759 $42,138 $26,519 $35,000 $39,110 $44,195 $66,515
Base Pay Variable Pay Total Compensation
National Data - Effective September 2010 118 © 2011 Employer Associations of America (EAA)

Bonus Commission# of Orgs
# of Emp
Un-Wtd Avg
WtdAvg P25 Median P75
Wtd Annual Avg
Wtd Annual Avg
Un-Wtd Avg
WtdAvg P10 P25 Median P75 P90
Total Responses 19 80 $42,147 $37,527 $31,254 $35,700 $41,200 - - $42,147 $37,527 $29,829 $31,254 $35,700 $41,200 $51,620
Org Sales Volume0.0-26.9 million 10 28 $44,143 $43,766 $39,603 $41,600 $47,425 - - $44,143 $43,766 $36,000 $39,603 $41,600 $47,425 $56,72027.0-99.9 million 8 29 $40,652 $34,179 $30,600 $33,460 $35,700 - - $40,652 $34,179 $25,000 $30,600 $33,460 $35,700 $40,000
RegionGreat Lakes 13 73 $42,641 $37,348 $31,200 $35,026 $41,200 - - $42,641 $37,348 $29,886 $31,200 $35,026 $41,200 $52,280
AssociationEmployers Resource Assoc. (OH) 6 63 $36,562 $35,789 $30,900 $33,484 $40,000 - - $36,562 $35,789 $28,734 $30,900 $33,484 $40,000 $44,678MRA - The Mgmt Assoc. (WI) 5 8 $48,113 $45,821 $42,000 $42,000 $54,250 - - $48,113 $45,821 $36,566 $42,000 $42,000 $54,250 $55,000
continued
(160) Sales Representative - Junior (Outside sales)Compensation Strategy: Straight Salary
Under the supervision of the Sales Supervisor or Sales Representative - Senior, performs field promotional work to obtain sales in an assigned territory where the company and product line are established. May canvas out prospective new accounts. Demonstrates products / services and assists in the selection of products / services most applicable to customers' needs. Demonstrates and familiarizes established accounts with new products / services and developments. Quotes prices, terms, delivery dates, etc. on new or repeat orders subject to the approval of company sales supervisor. May investigate and report on warranty claims and complaints. Prepares periodic activity and expense reports.
Effective Date:September 2010
Total CompensationBase Pay Variable Pay
National Data - Effective September 2010 119 © 2011 Employer Associations of America (EAA)

(160) Sales Representative - Junior (Outside sales)Compensation Strategy: Straight Salary
Bonus Commission# of Orgs
# of Emp
Un-Wtd Avg
WtdAvg P25 Median P75
Wtd Annual Avg
Wtd Annual Avg
Un-Wtd Avg
WtdAvg P10 P25 Median P75 P90
Customer TypeIndustry 12 17 $43,384 $42,109 $39,760 $41,200 $43,250 - - $43,384 $42,109 $31,787 $39,760 $41,200 $43,250 $55,628Distributors/Wholesalers 4 38 $41,136 $37,349 - $35,000 - - - $41,136 $37,349 - - $35,000 - -
IndustryNon-Durable Goods Manufacturing 6 11 $37,968 $38,459 $36,566 $40,000 $42,000 - - $37,968 $38,459 $26,697 $36,566 $40,000 $42,000 $42,000Durable Goods Manufacturing 6 6 $49,277 $49,277 $38,640 $53,500 $55,785 - - $49,277 $49,277 $36,000 $38,640 $53,500 $55,785 $58,141Wholesale and Retail Trade 3 59 $36,711 $35,868 - $33,460 - - - $36,711 $35,868 - - $33,460 - -
Base Pay Variable Pay Total Compensation
National Data - Effective September 2010 120 © 2011 Employer Associations of America (EAA)

Bonus Commission# of Orgs
# of Emp
Un-Wtd Avg
WtdAvg P25 Median P75
Wtd Annual Avg
Wtd Annual Avg
Un-Wtd Avg
WtdAvg P10 P25 Median P75 P90
Total Responses 24 90 $37,191 $32,258 $26,000 $31,200 $38,131 - $16,641 $49,245 $48,899 $31,200 $35,066 $42,729 $65,000 $68,598
Org Sales Volume0.0-26.9 million 10 19 $39,199 $35,546 $26,000 $35,000 $42,105 - $5,947 $45,926 $41,493 $31,200 $32,864 $36,000 $46,383 $62,05327.0-99.9 million 9 49 $34,279 $29,077 $26,000 $27,206 $33,006 - $26,218 $50,902 $55,295 $29,245 $39,749 $64,576 $66,546 $69,805100.0 million+ 5 22 $38,419 $36,503 $34,117 $35,500 $40,000 - $4,547 $52,902 $41,050 $22,355 $34,717 $37,949 $40,540 $75,777
RegionGreat Lakes 20 60 $37,926 $34,004 $26,000 $35,000 $40,000 - $7,844 $48,777 $41,848 $26,314 $33,667 $38,000 $47,815 $61,991
AssociationTrusight (MN) - formerly EA 5 14 $45,988 $37,347 $26,000 $32,600 $41,635 - $7,421 $55,225 $44,768 $31,200 $32,724 $38,908 $51,734 $79,623Employers Resource Assoc. (OH) 4 8 $32,500 $32,500 - $35,000 - - $6,813 $39,313 $39,313 - - $36,500 - -MRA - The Mgmt Assoc. (WI) 6 14 $33,369 $26,378 $16,000 $16,790 $41,000 - $12,166 $43,829 $38,544 $15,905 $23,664 $31,423 $60,235 $68,256The Management Assoc. of Illinois (IL) 3 4 $45,058 $44,463 - $44,425 - - $19,917 $67,766 $64,379 - - $61,745 - -
continued
(160) Sales Representative - Junior (Outside sales)Compensation Strategy: Salary + Commission
Under the supervision of the Sales Supervisor or Sales Representative - Senior, performs field promotional work to obtain sales in an assigned territory where the company and product line are established. May canvas out prospective new accounts. Demonstrates products / services and assists in the selection of products / services most applicable to customers' needs. Demonstrates and familiarizes established accounts with new products / services and developments. Quotes prices, terms, delivery dates, etc. on new or repeat orders subject to the approval of company sales supervisor. May investigate and report on warranty claims and complaints. Prepares periodic activity and expense reports.
Effective Date:September 2010
Total CompensationBase Pay Variable Pay
National Data - Effective September 2010 121 © 2011 Employer Associations of America (EAA)

(160) Sales Representative - Junior (Outside sales)Compensation Strategy: Salary + Commission
Bonus Commission# of Orgs
# of Emp
Un-Wtd Avg
WtdAvg P25 Median P75
Wtd Annual Avg
Wtd Annual Avg
Un-Wtd Avg
WtdAvg P10 P25 Median P75 P90
Customer TypeIndustry 12 21 $40,099 $36,763 $26,000 $37,000 $43,250 - $12,254 $51,816 $49,017 $32,938 $35,044 $50,500 $61,303 $69,558Distributors/Wholesalers 6 12 $41,295 $36,555 $23,125 $38,261 $43,168 - $13,502 $57,151 $50,057 $36,108 $39,145 $41,950 $52,372 $88,204Retailers 3 4 $25,635 $23,202 - $21,790 - - $3,000 $29,635 $26,202 - - $26,290 - -Consumers 5 53 $29,545 $30,183 $27,206 $30,805 $35,000 - $20,120 $40,178 $50,303 $30,027 $35,000 $47,000 $66,206 $68,598
IndustryNon-Durable Goods Manufacturing 4 5 $42,277 $37,003 - $42,105 - - $7,546 $51,709 $44,549 - - $58,694 - -Durable Goods Manufacturing 4 28 $37,537 $29,906 - $27,206 - - $36,361 $62,035 $66,266 - - $66,206 - -Wholesale and Retail Trade 4 10 $42,860 $36,716 - $36,261 - - $10,169 $53,855 $46,885 - - $41,950 - -Financial Activities 3 9 $29,411 $29,122 - $31,200 - - $5,785 $35,196 $34,907 - - $35,000 - -Other Services 3 20 $40,052 $37,011 - $35,500 - - $2,323 $44,581 $39,334 - - $37,949 - -
Base Pay Variable Pay Total Compensation
National Data - Effective September 2010 122 © 2011 Employer Associations of America (EAA)

Bonus Commission# of Orgs
# of Emp
Un-Wtd Avg
WtdAvg P25 Median P75
Wtd Annual Avg
Wtd Annual Avg
Un-Wtd Avg
WtdAvg P10 P25 Median P75 P90
Total Responses 37 72 $47,494 $49,609 $40,700 $49,500 $57,405 $4,814 - $51,971 $54,422 $38,763 $43,944 $53,391 $65,139 $71,645
Org Sales Volume0.0-26.9 million 9 9 $45,195 $45,195 $36,600 $42,500 $56,160 $5,582 - $50,777 $50,777 $30,000 $37,850 $50,000 $64,896 $70,00027.0-99.9 million 16 35 $47,910 $49,326 $40,600 $48,900 $56,185 $5,029 - $51,685 $54,355 $39,202 $43,700 $53,037 $66,602 $71,489100.0 million+ 12 28 $48,662 $51,381 $42,675 $50,211 $59,642 $4,297 - $53,250 $55,678 $39,768 $48,241 $54,061 $64,294 $75,336
RegionNortheast 3 4 $55,522 $51,517 - $46,707 - $1,869 - $57,539 $53,386 - - $48,457 - -Southeast 5 13 $47,790 $50,563 $42,300 $49,500 $58,308 $2,755 - $50,074 $53,317 $34,760 $45,250 $54,500 $64,171 $66,260Great Lakes 22 43 $45,183 $47,934 $40,000 $45,052 $57,120 $5,535 - $50,125 $53,470 $36,944 $43,429 $52,484 $66,120 $72,178Mountain 3 8 $50,506 $55,134 - $56,000 - $5,332 - $56,132 $60,466 - - $61,936 - -Pacific 3 3 $55,067 $55,067 - $55,200 - $4,600 - $59,667 $59,667 - - $59,000 - -
AssociationAmerican Society of Employers (MI) 4 17 $52,314 $55,078 - $55,995 - $5,408 - $56,316 $60,486 - - $63,924 - -Trusight (MN) - formerly EA 3 5 $45,068 $43,394 - $37,200 - $3,375 - $49,498 $46,769 - - $39,763 - -Employers Resource Assoc. (OH) 8 16 $45,691 $45,196 $40,150 $42,365 $50,416 $4,025 - $49,220 $49,221 $36,380 $43,756 $50,532 $55,275 $60,030MRA - The Mgmt Assoc. (N. IL) 3 4 $56,733 $60,450 - $65,850 - $5,105 - $62,223 $65,555 - - $74,260 - -MRA - The Mgmt Assoc. (WI) 12 18 $40,559 $42,982 $38,934 $42,450 $47,840 $5,244 - $45,465 $48,226 $29,788 $40,750 $48,821 $54,178 $68,464
continued
(160) Sales Representative - Junior (Outside sales)Compensation Strategy: Salary + Bonus
Under the supervision of the Sales Supervisor or Sales Representative - Senior, performs field promotional work to obtain sales in an assigned territory where the company and product line are established. May canvas out prospective new accounts. Demonstrates products / services and assists in the selection of products / services most applicable to customers' needs. Demonstrates and familiarizes established accounts with new products / services and developments. Quotes prices, terms, delivery dates, etc. on new or repeat orders subject to the approval of company sales supervisor. May investigate and report on warranty claims and complaints. Prepares periodic activity and expense reports.
Effective Date:September 2010
Total CompensationBase Pay Variable Pay
National Data - Effective September 2010 123 © 2011 Employer Associations of America (EAA)

(160) Sales Representative - Junior (Outside sales)Compensation Strategy: Salary + Bonus
Bonus Commission# of Orgs
# of Emp
Un-Wtd Avg
WtdAvg P25 Median P75
Wtd Annual Avg
Wtd Annual Avg
Un-Wtd Avg
WtdAvg P10 P25 Median P75 P90
Customer TypeIndustry 20 26 $49,375 $49,556 $36,875 $51,157 $60,002 $4,259 - $53,889 $53,814 $31,820 $39,413 $55,957 $67,854 $75,317Distributors/Wholesalers 7 20 $47,635 $54,197 $49,500 $55,449 $61,865 $4,196 - $50,213 $58,393 $39,830 $50,641 $61,876 $65,139 $72,366Retailers 8 20 $45,785 $47,355 $41,731 $46,383 $52,373 $5,485 - $51,809 $52,840 $43,479 $45,411 $51,524 $55,379 $68,139Consumers 3 6 $43,140 $42,053 - $41,300 - $7,043 - $49,194 $49,096 - - $51,050 - -
IndustryNon-Durable Goods Manufacturing 8 20 $44,817 $50,917 $41,625 $50,211 $59,642 $4,789 - $49,576 $55,706 $36,655 $49,580 $55,175 $64,294 $69,695Durable Goods Manufacturing 9 19 $50,800 $49,218 $41,565 $45,052 $53,000 $3,977 - $56,439 $53,195 $39,763 $43,925 $50,258 $63,671 $75,775Wholesale and Retail Trade 7 16 $47,073 $52,161 $42,805 $54,989 $59,623 $6,148 - $50,863 $58,308 $40,508 $43,250 $64,081 $68,623 $71,989Education and Health Services 5 7 $47,473 $46,531 $35,000 $45,000 $56,000 $2,057 - $49,573 $48,588 $32,600 $38,000 $46,800 $56,000 $67,100Other Services 4 4 $48,148 $48,148 - $50,000 - $5,630 - $53,778 $53,778 - - $55,000 - -
Base Pay Variable Pay Total Compensation
National Data - Effective September 2010 124 © 2011 Employer Associations of America (EAA)

Bonus Commission# of Orgs
# of Emp
Un-Wtd Avg
WtdAvg P25 Median P75
Wtd Annual Avg
Wtd Annual Avg
Un-Wtd Avg
WtdAvg P10 P25 Median P75 P90
Total Responses 16 51 $34,378 $38,599 $23,478 $37,000 $49,815 $1,785 $10,330 $49,651 $50,715 $25,720 $36,560 $46,684 $64,185 $77,577
Org Sales Volume0.0-26.9 million 6 10 $25,826 $20,701 $10,035 $17,807 $26,625 $1,139 $21,091 $45,029 $42,930 $24,296 $25,913 $42,798 $56,480 $66,50027.0-99.9 million 8 29 $39,722 $45,223 $29,502 $45,900 $56,750 $2,533 $7,561 $53,675 $55,317 $25,421 $35,036 $56,792 $67,908 $87,999
RegionGreat Lakes 9 30 $38,563 $44,007 $25,500 $43,600 $57,750 $430 $6,520 $48,533 $50,958 $25,478 $39,250 $46,684 $60,840 $85,588Mountain 4 15 $24,869 $33,163 - $30,000 - $4,507 $13,550 $46,301 $51,220 - - $48,578 - -
AssociationTrusight (MN) - formerly EA 3 16 $31,468 $32,405 - $35,900 - $442 $8,024 $40,027 $40,871 - - $41,969 - -Employers Resource Assoc. (OH) 3 6 $31,925 $23,862 - $19,546 - $1,540 $18,911 $49,627 $44,312 - - $44,389 - -Mtn States Employers Council (CO) 4 15 $24,869 $33,163 - $30,000 - $4,507 $13,550 $46,301 $51,220 - - $48,578 - -MRA - The Mgmt Assoc. (WI) 4 12 $50,797 $62,689 - $60,875 - $486 $3,843 $61,533 $67,018 - - $64,567 - -
continued
Base Pay Variable Pay
(160) Sales Representative - Junior (Outside sales)Compensation Strategy: Salary + Commission + Bonus
Under the supervision of the Sales Supervisor or Sales Representative - Senior, performs field promotional work to obtain sales in an assigned territory where the company and product line are established. May canvas out prospective new accounts. Demonstrates products / services and assists in the selection of products / services most applicable to customers' needs. Demonstrates and familiarizes established accounts with new products / services and developments. Quotes prices, terms, delivery dates, etc. on new or repeat orders subject to the approval of company sales supervisor. May investigate and report on warranty claims and complaints. Prepares periodic activity and expense reports.
Effective Date:September 2010
Total Compensation
National Data - Effective September 2010 125 © 2011 Employer Associations of America (EAA)

(160) Sales Representative - Junior (Outside sales)Compensation Strategy: Salary + Commission + Bonus
Bonus Commission# of Orgs
# of Emp
Un-Wtd Avg
WtdAvg P25 Median P75
Wtd Annual Avg
Wtd Annual Avg
Un-Wtd Avg
WtdAvg P10 P25 Median P75 P90
Customer TypeIndustry 8 25 $46,100 $53,051 $43,700 $49,815 $60,875 $3,047 $7,368 $58,926 $63,467 $39,640 $54,685 $62,133 $70,295 $88,363Retailers 3 6 $23,492 $19,645 - $19,546 - $1,506 $23,631 $50,564 $44,781 - - $44,389 - -Consumers 3 7 $15,918 $14,814 - $12,480 - $446 $14,920 $31,128 $30,180 - - $26,000 - -
IndustryWholesale and Retail Trade 4 12 $23,638 $28,809 - $33,000 - $521 $16,019 $49,558 $45,349 - - $44,562 - -Education and Health Services 3 6 $41,531 $41,813 - $43,700 - $833 $6,859 $47,578 $49,505 - - $55,417 - -
Base Pay Variable Pay Total Compensation
National Data - Effective September 2010 126 © 2011 Employer Associations of America (EAA)

Bonus Commission# of Orgs
# of Emp
Un-Wtd Avg
WtdAvg P25 Median P75
Wtd Annual Avg
Wtd Annual Avg
Un-Wtd Avg
WtdAvg P10 P25 Median P75 P90
Total Responses 3 6 - - - - - $702 $34,429 $35,131 $35,131 - - $35,105 - -
Org Sales Volume
Region
Association
continued
Insufficient Data
Insufficient Data
Insufficient Data
(160) Sales Representative - Junior (Outside sales)Compensation Strategy: Commission + Bonus
Under the supervision of the Sales Supervisor or Sales Representative - Senior, performs field promotional work to obtain sales in an assigned territory where the company and product line are established. May canvas out prospective new accounts. Demonstrates products / services and assists in the selection of products / services most applicable to customers' needs. Demonstrates and familiarizes established accounts with new products / services and developments. Quotes prices, terms, delivery dates, etc. on new or repeat orders subject to the approval of company sales supervisor. May investigate and report on warranty claims and complaints. Prepares periodic activity and expense reports.
Effective Date:September 2010
Total CompensationBase Pay Variable Pay
National Data - Effective September 2010 127 © 2011 Employer Associations of America (EAA)

(160) Sales Representative - Junior (Outside sales)Compensation Strategy: Commission + Bonus
Bonus Commission# of Orgs
# of Emp
Un-Wtd Avg
WtdAvg P25 Median P75
Wtd Annual Avg
Wtd Annual Avg
Un-Wtd Avg
WtdAvg P10 P25 Median P75 P90
Customer TypeDistributors/Wholesalers 3 6 - - - - - $702 $34,429 $35,131 $35,131 - - $35,105 - -
Industry Insufficient Data
Base Pay Variable Pay Total Compensation
National Data - Effective September 2010 128 © 2011 Employer Associations of America (EAA)

Bonus Commission# of Orgs
# of Emp
Un-Wtd Avg
WtdAvg P25 Median P75
Wtd Annual Avg
Wtd Annual Avg
Un-Wtd Avg
WtdAvg P10 P25 Median P75 P90
Total Responses *10 86 - - - - - - - $39,881 $32,368 $25,000 $28,225 $30,600 $35,306 $45,000
Org Sales Volume0.0-26.9 million *5 73 - - - - - - - $37,939 $30,959 $24,976 $27,463 $29,700 $33,150 $39,08127.0-99.9 million 3 3 - - - - - - - $42,676 $42,676 - - $42,700 - -
RegionGreat Lakes *7 79 - - - - - - - $41,661 $31,833 $25,000 $28,000 $30,400 $35,000 $39,950
AssociationEmployers Resource Assoc. (OH) *3 70 - - - - - - - $32,816 $30,432 - - $29,550 - -
continued
(170) Sales Trainee (Outside sales)Combined Compensation Type
Attends company training sessions to learn product promotional and selling techniques, the company's marketing and sales policies and to become familiar with the company's product / service lines as they relate to the purpose, basic design, models, etc. Upon successful completion of the training program, usually assigned to a Senior Sales Representative or Sales Supervisor as a Junior Sales Representative to acquire actual field selling experience before assignment to a sales area or territory.
Effective Date:September 2010
Base Pay Variable Pay Total Compensation
National Data - Effective September 2010 129 © 2011 Employer Associations of America (EAA)

(170) Sales Trainee (Outside sales)Combined Compensation Type
Bonus Commission# of Orgs
# of Emp
Un-Wtd Avg
WtdAvg P25 Median P75
Wtd Annual Avg
Wtd Annual Avg
Un-Wtd Avg
WtdAvg P10 P25 Median P75 P90
Customer TypeIndustry 6 9 - - - - - - - $42,393 $40,337 $35,000 $35,025 $36,400 $45,164 $59,046Distributors/Wholesalers 3 74 - - - - - - - $37,352 $31,449 - - $29,850 - -
IndustryNon-Durable Goods Manufacturing 3 7 - - - - - - - $47,662 $45,401 - - $45,000 - -Wholesale and Retail Trade 3 74 - - - - - - - $38,793 $31,096 - - $29,850 - -
* More than 30% of sample supplied by one organization.
Base Pay Variable Pay Total Compensation
National Data - Effective September 2010 130 © 2011 Employer Associations of America (EAA)

Bonus Commission# of Orgs
# of Emp
Un-Wtd Avg
WtdAvg P25 Median P75
Wtd Annual Avg
Wtd Annual Avg
Un-Wtd Avg
WtdAvg P10 P25 Median P75 P90
Total Responses *3 70 $34,634 $30,698 - $29,650 - - - $34,634 $30,698 - - $29,650 - -
Org Sales Volume
RegionGreat Lakes *3 70 $34,634 $30,698 - $29,650 - - - $34,634 $30,698 - - $29,650 - -
Association
continued
Insufficient Data
(170) Sales Trainee (Outside sales)Compensation Strategy: Straight Salary
Attends company training sessions to learn product promotional and selling techniques, the company's marketing and sales policies and to become familiar with the company's product / service lines as they relate to the purpose, basic design, models, etc. Upon successful completion of the training program, usually assigned to a Senior Sales Representative or Sales Supervisor as a Junior Sales Representative to acquire actual field selling experience before assignment to a sales area or territory.
Effective Date:September 2010
Base Pay Variable Pay Total Compensation
Insufficient Data
National Data - Effective September 2010 131 © 2011 Employer Associations of America (EAA)

(170) Sales Trainee (Outside sales)Compensation Strategy: Straight Salary
Bonus Commission# of Orgs
# of Emp
Un-Wtd Avg
WtdAvg P25 Median P75
Wtd Annual Avg
Wtd Annual Avg
Un-Wtd Avg
WtdAvg P10 P25 Median P75 P90
Customer Type
Industry
* More than 30% of sample supplied by one organization.
Total Compensation
Insufficient Data
Insufficient Data
Base Pay Variable Pay
National Data - Effective September 2010 132 © 2011 Employer Associations of America (EAA)

Bonus Commission# of Orgs
# of Emp
Un-Wtd Avg
WtdAvg P25 Median P75
Wtd Annual Avg
Wtd Annual Avg
Un-Wtd Avg
WtdAvg P10 P25 Median P75 P90
Total Responses 5 8 $44,986 $44,991 $41,102 $45,000 $46,445 $1,714 - $47,463 $46,705 $39,802 $43,275 $45,000 $49,436 $59,046
Org Sales Volume
RegionGreat Lakes 3 3 $46,709 $46,709 - $46,927 - $3,982 - $50,691 $50,691 - - $50,327 - -
Association
continued
Insufficient Data
Insufficient Data
(170) Sales Trainee (Outside sales)Compensation Strategy: Salary + Bonus
Attends company training sessions to learn product promotional and selling techniques, the company's marketing and sales policies and to become familiar with the company's product / service lines as they relate to the purpose, basic design, models, etc. Upon successful completion of the training program, usually assigned to a Senior Sales Representative or Sales Supervisor as a Junior Sales Representative to acquire actual field selling experience before assignment to a sales area or territory.
Effective Date:September 2010
Base Pay Variable Pay Total Compensation
National Data - Effective September 2010 133 © 2011 Employer Associations of America (EAA)

(170) Sales Trainee (Outside sales)Compensation Strategy: Salary + Bonus
Bonus Commission# of Orgs
# of Emp
Un-Wtd Avg
WtdAvg P25 Median P75
Wtd Annual Avg
Wtd Annual Avg
Un-Wtd Avg
WtdAvg P10 P25 Median P75 P90
Customer Type
Industry
Total Compensation
Insufficient Data
Insufficient Data
Base Pay Variable Pay
National Data - Effective September 2010 134 © 2011 Employer Associations of America (EAA)

Bonus Commission# of Orgs
# of Emp
Un-Wtd Avg
WtdAvg P25 Median P75
Wtd Annual Avg
Wtd Annual Avg
Un-Wtd Avg
WtdAvg P10 P25 Median P75 P90
Total Responses 3 7 $22,163 $29,841 - $35,000 - $329 $2,143 $27,690 $32,313 - - $35,125 - -
Org Sales Volume
Region
Association
continued
Insufficient Data
Insufficient Data
Insufficient Data
(170) Sales Trainee (Outside sales)Compensation Strategy: Salary + Commission + Bonus
Attends company training sessions to learn product promotional and selling techniques, the company's marketing and sales policies and to become familiar with the company's product / service lines as they relate to the purpose, basic design, models, etc. Upon successful completion of the training program, usually assigned to a Senior Sales Representative or Sales Supervisor as a Junior Sales Representative to acquire actual field selling experience before assignment to a sales area or territory.
Effective Date:September 2010
Base Pay Variable Pay Total Compensation
National Data - Effective September 2010 135 © 2011 Employer Associations of America (EAA)

(170) Sales Trainee (Outside sales)Compensation Strategy: Salary + Commission + Bonus
Bonus Commission# of Orgs
# of Emp
Un-Wtd Avg
WtdAvg P25 Median P75
Wtd Annual Avg
Wtd Annual Avg
Un-Wtd Avg
WtdAvg P10 P25 Median P75 P90
Customer Type
Industry
Base Pay Variable Pay Total Compensation
Insufficient Data
Insufficient Data
National Data - Effective September 2010 136 © 2011 Employer Associations of America (EAA)

Bonus Commission# of Orgs
# of Emp
Un-Wtd Avg
WtdAvg P25 Median P75
Wtd Annual Avg
Wtd Annual Avg
Un-Wtd Avg
WtdAvg P10 P25 Median P75 P90
Total Responses 195 1,135 - - - - - - - $52,215 $51,653 $33,735 $39,328 $47,047 $58,000 $72,108
Org Sales Volume0.0-26.9 million 87 253 - - - - - - - $51,956 $54,790 $34,968 $41,875 $52,250 $65,127 $73,90527.0-99.9 million 66 419 - - - - - - - $53,283 $52,632 $32,700 $38,002 $45,865 $57,773 $76,514100.0 million+ *42 463 - - - - - - - $51,070 $49,053 $34,900 $39,790 $45,996 $54,961 $67,756
RegionNortheast 8 38 - - - - - - - $53,267 $55,743 $32,219 $42,754 $50,666 $70,877 $82,639Southeast *5 63 - - - - - - - $59,217 $59,749 $38,531 $42,577 $51,185 $69,874 $92,568Great Lakes 141 841 - - - - - - - $51,992 $49,579 $33,514 $38,372 $45,723 $54,580 $68,100Central 7 31 - - - - - - - $52,783 $61,870 $37,752 $47,613 $58,917 $77,029 $93,333Mountain 17 116 - - - - - - - $53,226 $56,414 $36,324 $43,792 $56,028 $64,152 $74,357Pacific 17 46 - - - - - - - $50,261 $56,223 $29,976 $39,972 $47,715 $66,890 $94,314
AssociationAmerican Society of Employers (MI) 12 96 - - - - - - - $47,090 $46,370 $31,329 $39,225 $43,998 $51,709 $66,847Cascade Employers Assoc. (OR) 4 5 - - - - - - - $42,469 $42,551 - - $44,500 - -Employers Assoc. NE (CT & MA) 3 8 - - - - - - - $37,498 $39,343 - - $39,214 - -Trusight (MN) - formerly EA 34 98 - - - - - - - $51,827 $51,276 $33,490 $38,703 $47,269 $56,250 $78,321Employers Assoc. of Florida, Inc (FL) *5 38 - - - - - - - $73,266 $73,622 $49,299 $57,241 $65,937 $81,583 $109,662Employers Resource Assoc. (OH) 29 135 - - - - - - - $52,804 $53,146 $33,352 $40,093 $47,199 $62,423 $78,482Employers Resource Council (OH) 14 62 - - - - - - - $43,498 $43,643 $32,332 $37,801 $42,145 $49,076 $54,772Mtn States Employers Council (CO) 14 106 - - - - - - - $50,598 $53,770 $34,981 $42,475 $54,185 $61,891 $73,513MRA - The Mgmt Assoc. (N. IL) 3 4 - - - - - - - $68,750 $72,875 - - $72,500 - -MRA - The Mgmt Assoc. (WI) *52 476 - - - - - - - $49,908 $46,753 $33,643 $37,851 $44,249 $52,542 $64,526The Management Assoc. of Illinois (IL) *7 50 - - - - - - - $85,626 $85,852 $46,604 $52,960 $63,968 $94,582 $168,751
continued
(200) Telephone Sales Representative/Inside Sales RepresentativeCombined Compensation Type
Experienced telephone sales representative sometimes called In-house Sales Representative. Incumbents are required to have strong communications skills and product/service knowledge. Duties include selling product or services to existing and new accounts using the telephone, e-mail, or mail as the primary media for contact and negotiation. Incumbents may partner with outside sales staff to serve larger accounts.
Effective Date:September 2010
Total CompensationBase Pay Variable Pay
National Data - Effective September 2010 137 © 2011 Employer Associations of America (EAA)

(200) Telephone Sales Representative/Inside Sales RepresentativeCombined Compensation Type
Bonus Commission# of Orgs
# of Emp
Un-Wtd Avg
WtdAvg P25 Median P75
Wtd Annual Avg
Wtd Annual Avg
Un-Wtd Avg
WtdAvg P10 P25 Median P75 P90
Customer TypeIndustry *110 598 - - - - - - - $53,290 $52,728 $35,073 $40,639 $48,290 $56,979 $71,943Distributors/Wholesalers 43 214 - - - - - - - $50,134 $46,616 $32,006 $37,533 $43,917 $52,280 $67,047Retailers 29 203 - - - - - - - $53,581 $56,640 $34,963 $41,800 $50,312 $66,949 $81,704Consumers 27 120 - - - - - - - $45,899 $46,842 $27,014 $37,222 $45,000 $57,337 $69,480
IndustryConstruction *3 23 - - - - - - - $41,944 $48,386 - - $44,730 - -Non-Durable Goods Manufacturing *22 289 - - - - - - - $48,558 $48,513 $36,420 $41,208 $47,005 $54,537 $61,740Durable Goods Manufacturing 80 277 - - - - - - - $52,861 $48,366 $33,067 $37,500 $44,500 $53,941 $72,217Wholesale and Retail Trade 51 394 - - - - - - - $51,706 $54,463 $33,749 $39,667 $48,982 $64,761 $78,887Information 5 10 - - - - - - - $53,629 $47,023 $25,426 $29,343 $53,188 $61,244 $65,133Financial Activities *5 20 - - - - - - - $52,119 $60,040 $40,752 $45,682 $59,891 $71,171 $79,731Professional and Business Services *11 32 - - - - - - - $52,020 $49,050 $33,934 $39,550 $47,643 $53,668 $74,645Other Services *13 80 - - - - - - - $59,371 $60,453 $26,539 $38,480 $46,228 $59,759 $94,285
* More than 30% of sample supplied by one organization.
Base Pay Variable Pay Total Compensation
National Data - Effective September 2010 138 © 2011 Employer Associations of America (EAA)
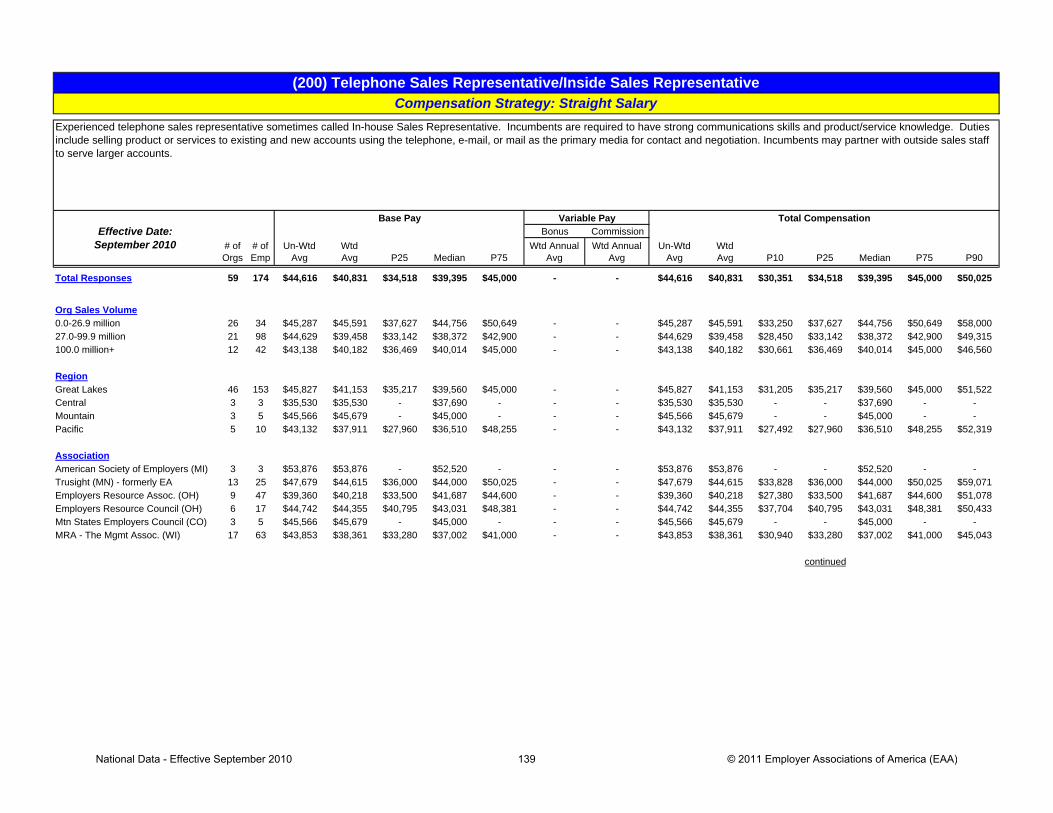
Bonus Commission# of Orgs
# of Emp
Un-Wtd Avg
WtdAvg P25 Median P75
Wtd Annual Avg
Wtd Annual Avg
Un-Wtd Avg
WtdAvg P10 P25 Median P75 P90
Total Responses 59 174 $44,616 $40,831 $34,518 $39,395 $45,000 - - $44,616 $40,831 $30,351 $34,518 $39,395 $45,000 $50,025
Org Sales Volume0.0-26.9 million 26 34 $45,287 $45,591 $37,627 $44,756 $50,649 - - $45,287 $45,591 $33,250 $37,627 $44,756 $50,649 $58,00027.0-99.9 million 21 98 $44,629 $39,458 $33,142 $38,372 $42,900 - - $44,629 $39,458 $28,450 $33,142 $38,372 $42,900 $49,315100.0 million+ 12 42 $43,138 $40,182 $36,469 $40,014 $45,000 - - $43,138 $40,182 $30,661 $36,469 $40,014 $45,000 $46,560
RegionGreat Lakes 46 153 $45,827 $41,153 $35,217 $39,560 $45,000 - - $45,827 $41,153 $31,205 $35,217 $39,560 $45,000 $51,522Central 3 3 $35,530 $35,530 - $37,690 - - - $35,530 $35,530 - - $37,690 - -Mountain 3 5 $45,566 $45,679 - $45,000 - - - $45,566 $45,679 - - $45,000 - -Pacific 5 10 $43,132 $37,911 $27,960 $36,510 $48,255 - - $43,132 $37,911 $27,492 $27,960 $36,510 $48,255 $52,319
AssociationAmerican Society of Employers (MI) 3 3 $53,876 $53,876 - $52,520 - - - $53,876 $53,876 - - $52,520 - -Trusight (MN) - formerly EA 13 25 $47,679 $44,615 $36,000 $44,000 $50,025 - - $47,679 $44,615 $33,828 $36,000 $44,000 $50,025 $59,071Employers Resource Assoc. (OH) 9 47 $39,360 $40,218 $33,500 $41,687 $44,600 - - $39,360 $40,218 $27,380 $33,500 $41,687 $44,600 $51,078Employers Resource Council (OH) 6 17 $44,742 $44,355 $40,795 $43,031 $48,381 - - $44,742 $44,355 $37,704 $40,795 $43,031 $48,381 $50,433Mtn States Employers Council (CO) 3 5 $45,566 $45,679 - $45,000 - - - $45,566 $45,679 - - $45,000 - -MRA - The Mgmt Assoc. (WI) 17 63 $43,853 $38,361 $33,280 $37,002 $41,000 - - $43,853 $38,361 $30,940 $33,280 $37,002 $41,000 $45,043
continued
(200) Telephone Sales Representative/Inside Sales RepresentativeCompensation Strategy: Straight Salary
Experienced telephone sales representative sometimes called In-house Sales Representative. Incumbents are required to have strong communications skills and product/service knowledge. Duties include selling product or services to existing and new accounts using the telephone, e-mail, or mail as the primary media for contact and negotiation. Incumbents may partner with outside sales staff to serve larger accounts.
Effective Date:September 2010
Total CompensationBase Pay Variable Pay
National Data - Effective September 2010 139 © 2011 Employer Associations of America (EAA)

(200) Telephone Sales Representative/Inside Sales RepresentativeCompensation Strategy: Straight Salary
Bonus Commission# of Orgs
# of Emp
Un-Wtd Avg
WtdAvg P25 Median P75
Wtd Annual Avg
Wtd Annual Avg
Un-Wtd Avg
WtdAvg P10 P25 Median P75 P90
Customer TypeIndustry 36 74 $45,182 $42,798 $36,300 $42,215 $48,000 - - $45,182 $42,798 $32,605 $36,300 $42,215 $48,000 $54,372Distributors/Wholesalers 19 58 $45,255 $38,559 $31,980 $36,620 $41,687 - - $45,255 $38,559 $28,000 $31,980 $36,620 $41,687 $49,090Retailers 4 30 $42,682 $43,323 - $41,832 - - - $42,682 $43,323 - - $41,832 - -Consumers 6 12 $36,801 $33,454 $27,700 $31,090 $38,714 - - $36,801 $33,454 $25,600 $27,700 $31,090 $38,714 $47,155
IndustryNon-Durable Goods Manufacturing 6 11 $49,600 $45,444 $37,096 $43,031 $49,302 - - $49,600 $45,444 $27,864 $37,096 $43,031 $49,302 $78,143Durable Goods Manufacturing 35 103 $46,239 $41,258 $35,000 $38,500 $45,000 - - $46,239 $41,258 $31,824 $35,000 $38,500 $45,000 $52,852Wholesale and Retail Trade 11 51 $39,547 $39,038 $32,000 $38,844 $43,260 - - $39,547 $39,038 $25,400 $32,000 $38,844 $43,260 $49,338
Base Pay Variable Pay Total Compensation
National Data - Effective September 2010 140 © 2011 Employer Associations of America (EAA)

Bonus Commission# of Orgs
# of Emp
Un-Wtd Avg
WtdAvg P25 Median P75
Wtd Annual Avg
Wtd Annual Avg
Un-Wtd Avg
WtdAvg P10 P25 Median P75 P90
Total Responses *52 443 $39,964 $38,145 $30,620 $36,300 $42,104 - $14,507 $55,884 $52,652 $36,000 $41,255 $49,345 $59,700 $71,827
Org Sales Volume0.0-26.9 million 25 75 $40,125 $42,686 $34,014 $40,000 $45,000 - $16,712 $54,259 $59,398 $38,939 $46,260 $55,547 $67,536 $85,40027.0-99.9 million 19 110 $39,856 $37,155 $30,857 $36,000 $42,000 - $19,510 $58,000 $56,665 $36,000 $40,456 $52,481 $65,339 $87,609100.0 million+ *8 258 $39,715 $37,247 $30,024 $36,202 $41,955 - $11,733 $55,936 $48,980 $35,250 $40,808 $47,370 $55,509 $67,601
RegionNortheast *3 8 $41,478 $42,310 - $41,677 - - $23,484 $60,442 $65,794 - - $71,110 - -Great Lakes *37 355 $39,283 $37,115 $30,620 $36,000 $41,480 - $12,611 $54,515 $49,726 $36,000 $41,000 $48,075 $55,800 $67,662Mountain *5 31 $35,137 $35,670 $27,795 $39,879 $40,000 - $12,780 $44,434 $48,449 $29,938 $37,307 $51,049 $59,647 $66,327Pacific *3 14 $39,004 $34,145 - $32,008 - - $44,682 $68,543 $78,827 - - $68,946 - -
AssociationTrusight (MN) - formerly EA 10 28 $40,280 $43,900 $36,394 $40,480 $53,905 - $19,023 $57,251 $62,923 $42,748 $48,145 $58,371 $76,351 $87,537Employers Resource Assoc. (OH) 9 51 $40,358 $41,809 $28,962 $36,500 $49,156 - $24,835 $62,914 $66,644 $42,366 $53,378 $63,403 $73,000 $95,740Employers Resource Council (OH) *5 16 $38,750 $37,025 $32,187 $34,919 $40,523 - $5,596 $43,223 $42,621 $35,965 $37,994 $40,879 $48,098 $52,411Mtn States Employers Council (CO) *5 31 $35,137 $35,670 $27,795 $39,879 $40,000 - $12,780 $44,434 $48,449 $29,938 $37,307 $51,049 $59,647 $66,327MRA - The Mgmt Assoc. (WI) *10 233 $41,630 $36,171 $30,115 $36,000 $40,213 - $11,017 $56,354 $47,188 $35,970 $40,475 $46,250 $52,994 $59,044The Management Assoc. of Illinois (IL) *5 37 $48,524 $48,931 $41,490 $46,883 $55,871 - $9,631 $58,860 $58,562 $43,792 $47,961 $57,201 $68,000 $75,226
continued
(200) Telephone Sales Representative/Inside Sales RepresentativeCompensation Strategy: Salary + Commission
Experienced telephone sales representative sometimes called In-house Sales Representative. Incumbents are required to have strong communications skills and product/service knowledge. Duties include selling product or services to existing and new accounts using the telephone, e-mail, or mail as the primary media for contact and negotiation. Incumbents may partner with outside sales staff to serve larger accounts.
Effective Date:September 2010
Total CompensationBase Pay Variable Pay
National Data - Effective September 2010 141 © 2011 Employer Associations of America (EAA)
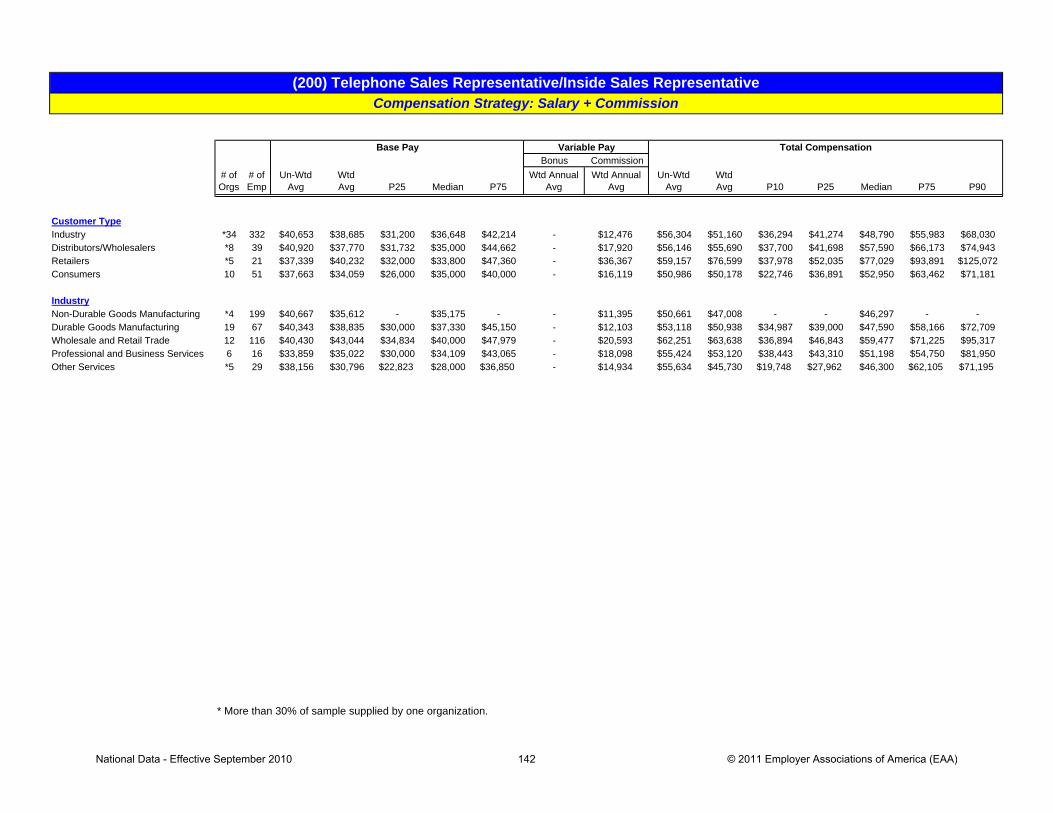
(200) Telephone Sales Representative/Inside Sales RepresentativeCompensation Strategy: Salary + Commission
Bonus Commission# of Orgs
# of Emp
Un-Wtd Avg
WtdAvg P25 Median P75
Wtd Annual Avg
Wtd Annual Avg
Un-Wtd Avg
WtdAvg P10 P25 Median P75 P90
Customer TypeIndustry *34 332 $40,653 $38,685 $31,200 $36,648 $42,214 - $12,476 $56,304 $51,160 $36,294 $41,274 $48,790 $55,983 $68,030Distributors/Wholesalers *8 39 $40,920 $37,770 $31,732 $35,000 $44,662 - $17,920 $56,146 $55,690 $37,700 $41,698 $57,590 $66,173 $74,943Retailers *5 21 $37,339 $40,232 $32,000 $33,800 $47,360 - $36,367 $59,157 $76,599 $37,978 $52,035 $77,029 $93,891 $125,072Consumers 10 51 $37,663 $34,059 $26,000 $35,000 $40,000 - $16,119 $50,986 $50,178 $22,746 $36,891 $52,950 $63,462 $71,181
IndustryNon-Durable Goods Manufacturing *4 199 $40,667 $35,612 - $35,175 - - $11,395 $50,661 $47,008 - - $46,297 - -Durable Goods Manufacturing 19 67 $40,343 $38,835 $30,000 $37,330 $45,150 - $12,103 $53,118 $50,938 $34,987 $39,000 $47,590 $58,166 $72,709Wholesale and Retail Trade 12 116 $40,430 $43,044 $34,834 $40,000 $47,979 - $20,593 $62,251 $63,638 $36,894 $46,843 $59,477 $71,225 $95,317Professional and Business Services 6 16 $33,859 $35,022 $30,000 $34,109 $43,065 - $18,098 $55,424 $53,120 $38,443 $43,310 $51,198 $54,750 $81,950Other Services *5 29 $38,156 $30,796 $22,823 $28,000 $36,850 - $14,934 $55,634 $45,730 $19,748 $27,962 $46,300 $62,105 $71,195
* More than 30% of sample supplied by one organization.
Base Pay Variable Pay Total Compensation
National Data - Effective September 2010 142 © 2011 Employer Associations of America (EAA)

Bonus Commission# of Orgs
# of Emp
Un-Wtd Avg
WtdAvg P25 Median P75
Wtd Annual Avg
Wtd Annual Avg
Un-Wtd Avg
WtdAvg P10 P25 Median P75 P90
Total Responses 64 299 $45,853 $42,872 $35,700 $40,711 $47,008 $5,253 - $50,703 $48,126 $33,736 $39,328 $44,500 $53,007 $67,318
Org Sales Volume0.0-26.9 million 28 45 $50,219 $50,720 $39,750 $50,000 $59,080 $4,999 - $54,229 $55,720 $37,149 $43,370 $52,380 $67,488 $73,72527.0-99.9 million 20 139 $41,594 $40,987 $33,072 $39,520 $45,500 $7,521 - $49,074 $48,508 $32,700 $39,500 $44,841 $53,560 $70,723100.0 million+ 16 115 $43,535 $42,081 $37,260 $40,078 $46,980 $2,611 - $46,567 $44,691 $34,374 $38,480 $43,700 $48,276 $56,466
RegionNortheast 3 12 $49,351 $55,644 - $46,904 - $3,398 - $52,735 $59,042 - - $50,666 - -Great Lakes 47 208 $46,606 $43,164 $35,625 $42,300 $47,006 $3,645 - $51,521 $46,809 $33,418 $38,071 $44,243 $50,244 $65,978Mountain 6 42 $43,744 $38,593 $28,177 $36,570 $44,746 $15,409 - $52,105 $54,002 $33,896 $41,790 $53,810 $66,049 $73,889Pacific 6 8 $43,134 $44,673 $38,710 $43,240 $55,035 $3,063 - $45,718 $47,735 $29,500 $39,003 $45,740 $55,035 $73,700
AssociationAmerican Society of Employers (MI) 7 41 $47,050 $43,471 $37,709 $40,078 $48,965 $3,147 - $49,082 $46,618 $34,600 $40,773 $43,860 $51,562 $64,782Trusight (MN) - formerly EA 10 40 $45,746 $42,498 $37,580 $43,625 $46,061 $6,082 - $53,366 $48,580 $32,426 $39,385 $47,064 $51,190 $72,297Employers Resource Assoc. (OH) 9 13 $44,949 $42,105 $32,890 $38,000 $41,250 $7,119 - $50,916 $49,224 $33,453 $38,210 $41,800 $51,039 $95,327Mtn States Employers Council (CO) 5 41 $44,893 $38,607 $28,177 $35,700 $45,084 $15,757 - $54,694 $54,364 $33,881 $42,290 $54,059 $66,349 $73,908MRA - The Mgmt Assoc. (WI) 21 124 $45,369 $42,331 $35,625 $41,912 $46,650 $2,649 - $49,183 $44,980 $33,804 $38,001 $43,671 $48,127 $59,400
continued
(200) Telephone Sales Representative/Inside Sales RepresentativeCompensation Strategy: Salary + Bonus
Experienced telephone sales representative sometimes called In-house Sales Representative. Incumbents are required to have strong communications skills and product/service knowledge. Duties include selling product or services to existing and new accounts using the telephone, e-mail, or mail as the primary media for contact and negotiation. Incumbents may partner with outside sales staff to serve larger accounts.
Effective Date:September 2010
Total CompensationBase Pay Variable Pay
National Data - Effective September 2010 143 © 2011 Employer Associations of America (EAA)

(200) Telephone Sales Representative/Inside Sales RepresentativeCompensation Strategy: Salary + Bonus
Bonus Commission# of Orgs
# of Emp
Un-Wtd Avg
WtdAvg P25 Median P75
Wtd Annual Avg
Wtd Annual Avg
Un-Wtd Avg
WtdAvg P10 P25 Median P75 P90
Customer TypeIndustry 27 93 $47,144 $45,444 $35,650 $42,640 $53,010 $5,859 - $52,424 $51,303 $33,351 $39,950 $48,450 $59,400 $73,737Distributors/Wholesalers 18 99 $47,169 $44,700 $38,001 $42,025 $48,051 $2,503 - $51,161 $47,204 $37,000 $40,019 $44,381 $49,899 $66,813Retailers 14 73 $41,533 $37,540 $32,000 $37,000 $44,171 $9,729 - $47,037 $47,269 $33,298 $37,813 $44,841 $53,211 $66,468Consumers 8 34 $44,776 $41,966 $36,735 $42,300 $45,079 $1,991 - $48,177 $43,957 $31,237 $39,415 $42,885 $46,888 $50,536
IndustryNon-Durable Goods Manufacturing 12 61 $43,214 $39,413 $32,719 $38,059 $45,711 $11,795 - $48,554 $51,208 $37,291 $40,993 $46,000 $61,464 $70,674Durable Goods Manufacturing 27 99 $52,028 $47,317 $38,160 $44,032 $53,000 $4,427 - $57,704 $51,745 $33,280 $41,500 $47,064 $57,907 $78,000Wholesale and Retail Trade 17 80 $40,456 $40,323 $33,306 $38,809 $45,079 $3,691 - $44,240 $44,014 $33,122 $36,499 $42,366 $48,232 $53,904Other Services 4 33 $40,797 $43,336 - $44,200 - $242 - $42,793 $43,578 - - $44,200 - -
Base Pay Variable Pay Total Compensation
National Data - Effective September 2010 144 © 2011 Employer Associations of America (EAA)

Bonus Commission# of Orgs
# of Emp
Un-Wtd Avg
WtdAvg P25 Median P75
Wtd Annual Avg
Wtd Annual Avg
Un-Wtd Avg
WtdAvg P10 P25 Median P75 P90
Total Responses 32 206 $35,954 $29,943 $16,640 $26,597 $37,339 $3,333 $30,992 $63,355 $64,268 $35,058 $45,670 $57,371 $70,000 $89,442
Org Sales Volume0.0-26.9 million 12 86 $36,681 $26,249 $16,640 $20,912 $32,329 $3,213 $26,133 $55,458 $55,594 $29,674 $39,700 $55,591 $68,276 $77,32227.0-99.9 million 12 72 $42,971 $40,583 $30,132 $36,015 $46,875 $4,836 $26,946 $70,418 $72,365 $38,492 $47,303 $55,941 $75,721 $117,863100.0 million+ 8 48 $24,338 $20,601 $15,141 $15,425 $21,642 $1,293 $45,767 $64,605 $67,661 $42,908 $50,615 $61,804 $70,883 $97,036
RegionGreat Lakes 18 112 $41,524 $32,572 $16,950 $26,285 $43,260 $4,514 $29,361 $64,399 $66,446 $33,574 $40,246 $57,415 $72,265 $106,220Mountain 5 38 $33,150 $29,170 $20,800 $29,930 $36,013 $3,150 $34,669 $69,303 $66,990 $50,175 $54,580 $61,506 $69,923 $80,182Pacific 3 14 $31,142 $28,166 - $31,200 - $1,655 $21,728 $52,945 $51,549 - - $46,018 - -
AssociationAmerican Society of Employers (MI) 3 27 $36,065 $36,052 - $36,004 - $250 $7,205 $43,671 $43,507 - - $44,484 - -Employers Assoc. of Florida, Inc (FL) 5 38 $16,609 $16,548 $14,998 $15,365 $15,454 $1,032 $56,042 $73,266 $73,622 $49,299 $57,241 $65,937 $81,583 $109,662Employers Resource Assoc. (OH) 5 24 $41,466 $25,096 $16,640 $16,640 $26,703 $1,530 $25,282 $59,968 $51,908 $35,115 $39,996 $50,514 $60,523 $74,175Mtn States Employers Council (CO) 3 29 $36,394 $32,499 - $30,616 - $3,346 $24,166 $63,066 $60,010 - - $57,439 - -MRA - The Mgmt Assoc. (WI) 5 43 $44,777 $26,784 $18,918 $20,408 $35,000 $4,921 $31,013 $63,827 $62,719 $28,336 $54,462 $65,437 $73,350 $79,358
continued
Base Pay Variable Pay
(200) Telephone Sales Representative/Inside Sales RepresentativeCompensation Strategy: Salary + Commission + Bonus
Experienced telephone sales representative sometimes called In-house Sales Representative. Incumbents are required to have strong communications skills and product/service knowledge. Duties include selling product or services to existing and new accounts using the telephone, e-mail, or mail as the primary media for contact and negotiation. Incumbents may partner with outside sales staff to serve larger accounts.
Effective Date:September 2010
Total Compensation
National Data - Effective September 2010 145 © 2011 Employer Associations of America (EAA)

(200) Telephone Sales Representative/Inside Sales RepresentativeCompensation Strategy: Salary + Commission + Bonus
Bonus Commission# of Orgs
# of Emp
Un-Wtd Avg
WtdAvg P25 Median P75
Wtd Annual Avg
Wtd Annual Avg
Un-Wtd Avg
WtdAvg P10 P25 Median P75 P90
Customer TypeIndustry 18 86 $42,395 $42,390 $32,071 $37,720 $48,034 $3,637 $24,202 $66,346 $70,229 $35,502 $44,418 $54,456 $74,300 $115,006Distributors/Wholesalers 3 18 $46,632 $21,639 - $16,640 - $966 $27,085 $60,980 $49,689 - - $46,249 - -Retailers 8 79 $21,820 $19,919 $15,187 $16,422 $20,868 $3,259 $41,874 $64,259 $65,052 $42,748 $53,156 $64,104 $71,538 $85,107Consumers 4 23 $25,970 $24,332 - $24,000 - $4,302 $22,060 $42,561 $50,694 - - $47,910 - -
IndustryDurable Goods Manufacturing 3 8 $51,254 $47,101 - $43,260 - $3,003 $26,421 $73,502 $76,525 - - $76,662 - -Wholesale and Retail Trade 15 134 $26,109 $23,560 $15,433 $19,290 $31,200 $2,392 $33,719 $59,901 $59,671 $35,043 $44,217 $57,415 $69,620 $82,007Professional and Business Services 3 14 $47,605 $42,010 - $37,500 - $150 $3,425 $52,726 $45,585 - - $43,674 - -Other Services 5 18 $42,591 $53,530 $27,169 $49,069 $77,558 $12,677 $48,904 $76,092 $115,111 $26,240 $44,149 $74,944 $180,188 $281,131
Base Pay Variable Pay Total Compensation
National Data - Effective September 2010 146 © 2011 Employer Associations of America (EAA)

Bonus Commission# of Orgs
# of Emp
Un-Wtd Avg
WtdAvg P25 Median P75
Wtd Annual Avg
Wtd Annual Avg
Un-Wtd Avg
WtdAvg P10 P25 Median P75 P90
Total Responses 25 27 - - - - - - - $47,385 $48,592 $34,573 $37,482 $48,000 $55,760 $63,522
Org Sales Volume0.0-26.9 million 9 9 - - - - - - - $44,292 $44,292 $32,255 $36,226 $44,500 $50,000 $61,12827.0-99.9 million 11 13 - - - - - - - $47,240 $49,770 $35,909 $37,920 $51,500 $55,720 $69,672100.0 million+ 5 5 - - - - - - - $53,270 $53,270 $27,499 $38,956 $58,100 $65,170 $67,916
RegionGreat Lakes 19 19 - - - - - - - $46,179 $46,179 $35,152 $37,482 $47,521 $55,000 $58,100Mountain 5 7 - - - - - - - $54,992 $57,475 $36,435 $44,500 $60,467 $67,916 $75,809
AssociationTrusight (MN) - formerly EA 6 6 - - - - - - - $51,506 $51,506 $38,358 $40,167 $55,340 $58,857 $61,128Employers Resource Assoc. (OH) 5 5 - - - - - - - $42,045 $42,045 $32,255 $33,704 $35,559 $53,630 $55,760Mtn States Employers Council (CO) 3 5 - - - - - - - $56,012 $59,080 - - $60,467 - -MRA - The Mgmt Assoc. (WI) 5 5 - - - - - - - $45,087 $45,087 $27,499 $37,510 $48,000 $51,207 $52,000
continued
Base Pay Variable Pay
(210) Order Processing SupervisorCombined Compensation Type
Supervisor in charge of order processing, typically requiring a two year degree in business and 3+ years of order processing experience, or equivalent. Responsible for managing non-exempt order processing staff. Specific tasks preformed in the department include receiving orders by mail, telephone, fax, internet, city desk or direct sales staff and processing orders to the point of authorizing order fulfillment. Verifies credit, records payment receipts, processes credit card payments, quotes prices, and verifies product availability. Forwards processed orders to the proper department or vendor for fulfillment to a designated client and address.
Effective Date:September 2010
Total Compensation
National Data - Effective September 2010 147 © 2011 Employer Associations of America (EAA)

(210) Order Processing SupervisorCombined Compensation Type
Bonus Commission# of Orgs
# of Emp
Un-Wtd Avg
WtdAvg P25 Median P75
Wtd Annual Avg
Wtd Annual Avg
Un-Wtd Avg
WtdAvg P10 P25 Median P75 P90
Customer TypeIndustry 17 17 - - - - - - - $49,420 $49,420 $36,952 $42,635 $50,413 $55,720 $61,387Distributors/Wholesalers 3 3 - - - - - - - $43,522 $43,522 - - $35,152 - -Retailers 3 3 - - - - - - - $37,933 $37,933 - - $38,358 - -
IndustryDurable Goods Manufacturing 17 17 - - - - - - - $47,542 $47,542 $33,621 $36,868 $48,000 $55,720 $62,486Wholesale and Retail Trade 4 4 - - - - - - - $41,637 $41,637 - - $40,772 - -
Base Pay Variable Pay Total Compensation
National Data - Effective September 2010 148 © 2011 Employer Associations of America (EAA)

Bonus Commission# of Orgs
# of Emp
Un-Wtd Avg
WtdAvg P25 Median P75
Wtd Annual Avg
Wtd Annual Avg
Un-Wtd Avg
WtdAvg P10 P25 Median P75 P90
Total Responses 13 13 $44,540 $44,540 $36,959 $47,000 $51,750 - - $44,540 $44,540 $30,560 $36,959 $47,000 $51,750 $55,408
Org Sales Volume0.0-26.9 million 4 4 $44,913 $44,913 - $46,250 - - - $44,913 $44,913 - - $46,250 - -27.0-99.9 million 7 7 $45,922 $45,922 $37,482 $47,000 $55,000 - - $45,922 $45,922 $36,435 $37,482 $47,000 $55,000 $55,680
RegionGreat Lakes 11 11 $45,280 $45,280 $37,482 $48,000 $52,000 - - $45,280 $45,280 $29,030 $37,482 $48,000 $52,000 $55,544
AssociationTrusight (MN) - formerly EA 3 3 $49,679 $49,679 - $55,000 - - - $49,679 $49,679 - - $55,000 - -MRA - The Mgmt Assoc. (WI) 4 4 $44,478 $44,478 - $49,207 - - - $44,478 $44,478 - - $49,207 - -
continued
Base Pay Variable Pay
(210) Order Processing SupervisorCompensation Strategy: Straight Salary
Supervisor in charge of order processing, typically requiring a two year degree in business and 3+ years of order processing experience, or equivalent. Responsible for managing non-exempt order processing staff. Specific tasks preformed in the department include receiving orders by mail, telephone, fax, internet, city desk or direct sales staff and processing orders to the point of authorizing order fulfillment. Verifies credit, records payment receipts, processes credit card payments, quotes prices, and verifies product availability. Forwards processed orders to the proper department or vendor for fulfillment to a designated client and address.
Effective Date:September 2010
Total Compensation
National Data - Effective September 2010 149 © 2011 Employer Associations of America (EAA)

(210) Order Processing SupervisorCompensation Strategy: Straight Salary
Bonus Commission# of Orgs
# of Emp
Un-Wtd Avg
WtdAvg P25 Median P75
Wtd Annual Avg
Wtd Annual Avg
Un-Wtd Avg
WtdAvg P10 P25 Median P75 P90
Customer TypeIndustry 9 9 $49,064 $49,064 $45,750 $50,413 $53,500 - - $49,064 $49,064 $37,482 $45,750 $50,413 $53,500 $55,680
IndustryDurable Goods Manufacturing 10 10 $45,168 $45,168 $36,114 $47,500 $52,750 - - $45,168 $45,168 $28,264 $36,114 $47,500 $52,750 $55,612
Total CompensationBase Pay Variable Pay
National Data - Effective September 2010 150 © 2011 Employer Associations of America (EAA)

Bonus Commission# of Orgs
# of Emp
Un-Wtd Avg
WtdAvg P25 Median P75
Wtd Annual Avg
Wtd Annual Avg
Un-Wtd Avg
WtdAvg P10 P25 Median P75 P90
Total Responses 8 8 $45,873 $45,873 $37,253 $42,709 $57,080 $2,376 - $48,249 $48,249 $35,559 $38,168 $45,354 $60,371 $62,423
Org Sales Volume0.0-26.9 million 4 4 $44,145 $44,145 - $40,775 - $2,535 - $46,680 $46,680 - - $44,146 - -
RegionGreat Lakes 7 7 $44,251 $44,251 $36,900 $42,181 $56,650 $1,972 - $46,224 $46,224 $35,559 $37,300 $43,187 $58,100 $61,128
AssociationTrusight (MN) - formerly EA 3 3 $51,031 $51,031 - $56,650 - $2,302 - $53,333 $53,333 - - $58,100 - -
continued
Base Pay Variable Pay
(210) Order Processing SupervisorCompensation Strategy: Salary + Bonus
Supervisor in charge of order processing, typically requiring a two year degree in business and 3+ years of order processing experience, or equivalent. Responsible for managing non-exempt order processing staff. Specific tasks preformed in the department include receiving orders by mail, telephone, fax, internet, city desk or direct sales staff and processing orders to the point of authorizing order fulfillment. Verifies credit, records payment receipts, processes credit card payments, quotes prices, and verifies product availability. Forwards processed orders to the proper department or vendor for fulfillment to a designated client and address.
Effective Date:September 2010
Total Compensation
National Data - Effective September 2010 151 © 2011 Employer Associations of America (EAA)

(210) Order Processing SupervisorCompensation Strategy: Salary + Bonus
Bonus Commission# of Orgs
# of Emp
Un-Wtd Avg
WtdAvg P25 Median P75
Wtd Annual Avg
Wtd Annual Avg
Un-Wtd Avg
WtdAvg P10 P25 Median P75 P90
Customer TypeIndustry 7 7 $46,400 $46,400 $36,900 $43,237 $57,223 $2,572 - $48,972 $48,972 $35,559 $37,300 $47,521 $61,128 $62,423
IndustryDurable Goods Manufacturing 5 5 $44,868 $44,868 $35,625 $38,314 $57,389 $1,703 - $46,572 $46,572 $35,559 $36,430 $40,771 $59,614 $61,128
Base Pay Variable Pay Total Compensation
National Data - Effective September 2010 152 © 2011 Employer Associations of America (EAA)

Bonus Commission# of Orgs
# of Emp
Un-Wtd Avg
WtdAvg P25 Median P75
Wtd Annual Avg
Wtd Annual Avg
Un-Wtd Avg
WtdAvg P10 P25 Median P75 P90
Total Responses 50 189 - - - - - - - $36,197 $33,908 $18,304 $28,080 $33,211 $40,116 $48,450
Org Sales Volume0.0-26.9 million 21 36 - - - - - - - $37,188 $37,065 $27,158 $30,952 $37,298 $42,010 $48,52527.0-99.9 million 25 116 - - - - - - - $35,944 $36,785 $27,942 $30,329 $34,064 $41,447 $49,796100.0 million+ *4 37 - - - - - - - $32,570 $21,814 - - $18,304 - -
RegionGreat Lakes 37 145 - - - - - - - $35,748 $31,352 $17,654 $27,612 $31,600 $36,269 $41,712Mountain *5 27 - - - - - - - $33,670 $42,751 $24,759 $30,277 $43,771 $50,599 $60,273Pacific *3 5 - - - - - - - $42,165 $40,577 - - $38,800 - -
AssociationAmerican Society of Employers (MI) 3 3 - - - - - - - $42,941 $42,941 - - $42,037 - -Trusight (MN) - formerly EA 9 21 - - - - - - - $33,749 $33,127 $26,778 $29,907 $33,280 $37,217 $39,715Employers Resource Assoc. (OH) *5 33 - - - - - - - $37,720 $33,087 $27,927 $29,415 $31,525 $35,871 $40,356Employers Resource Council (OH) *4 32 - - - - - - - $29,337 $20,439 - - $17,836 - -Mtn States Employers Council (CO) *4 26 - - - - - - - $35,837 $43,434 - - $45,243 - -MRA - The Mgmt Assoc. (WI) 14 56 - - - - - - - $36,077 $35,174 $27,979 $29,888 $33,340 $39,793 $46,248
continued
(220) Telephone Order Processing RepresentativeCombined Compensation Type
Inbound order taker requiring good verbal skills and the ability to accurately enter order information in the order management system. Typically requires a high school education or GED and less than one year of related experience, or equivalent. Incumbents may inform callers of product availability and pricing. Generally callers are predisposed to making a purchase or issuing an order when they call.
Effective Date:September 2010
Total CompensationBase Pay Variable Pay
National Data - Effective September 2010 153 © 2011 Employer Associations of America (EAA)
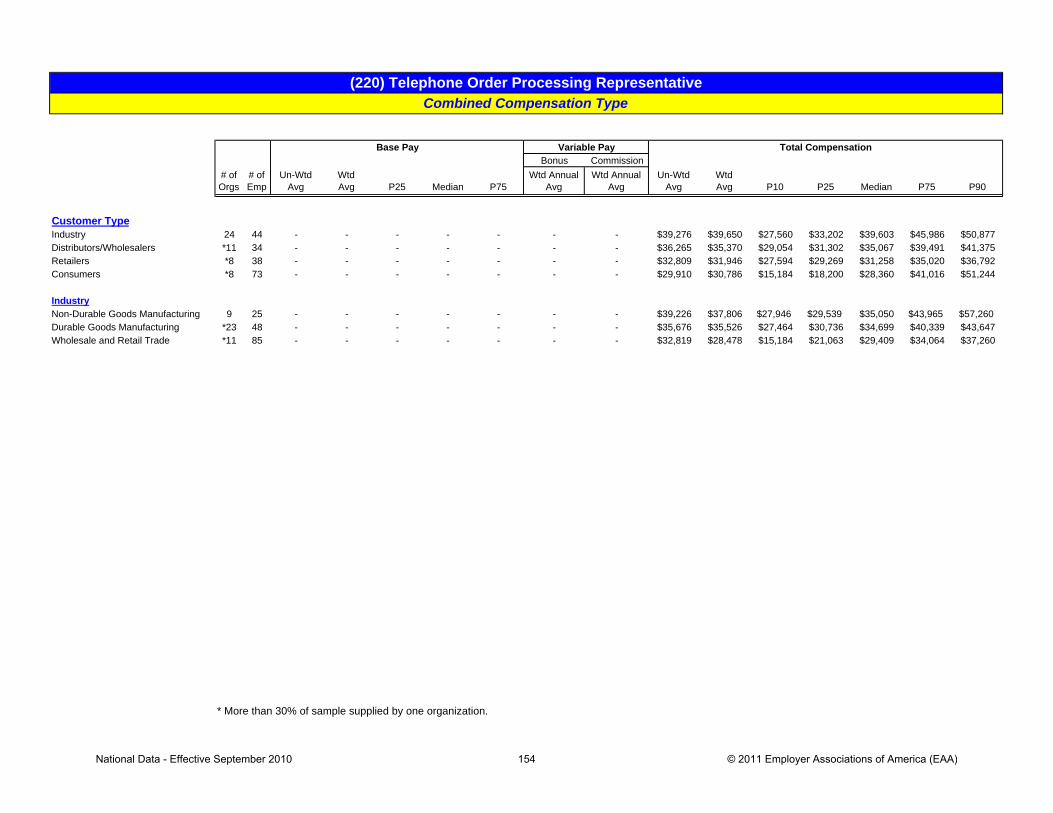
(220) Telephone Order Processing RepresentativeCombined Compensation Type
Bonus Commission# of Orgs
# of Emp
Un-Wtd Avg
WtdAvg P25 Median P75
Wtd Annual Avg
Wtd Annual Avg
Un-Wtd Avg
WtdAvg P10 P25 Median P75 P90
Customer TypeIndustry 24 44 - - - - - - - $39,276 $39,650 $27,560 $33,202 $39,603 $45,986 $50,877Distributors/Wholesalers *11 34 - - - - - - - $36,265 $35,370 $29,054 $31,302 $35,067 $39,491 $41,375Retailers *8 38 - - - - - - - $32,809 $31,946 $27,594 $29,269 $31,258 $35,020 $36,792Consumers *8 73 - - - - - - - $29,910 $30,786 $15,184 $18,200 $28,360 $41,016 $51,244
IndustryNon-Durable Goods Manufacturing 9 25 - - - - - - - $39,226 $37,806 $27,946 $29,539 $35,050 $43,965 $57,260Durable Goods Manufacturing *23 48 - - - - - - - $35,676 $35,526 $27,464 $30,736 $34,699 $40,339 $43,647Wholesale and Retail Trade *11 85 - - - - - - - $32,819 $28,478 $15,184 $21,063 $29,409 $34,064 $37,260
* More than 30% of sample supplied by one organization.
Base Pay Variable Pay Total Compensation
National Data - Effective September 2010 154 © 2011 Employer Associations of America (EAA)

Bonus Commission# of Orgs
# of Emp
Un-Wtd Avg
WtdAvg P25 Median P75
Wtd Annual Avg
Wtd Annual Avg
Un-Wtd Avg
WtdAvg P10 P25 Median P75 P90
Total Responses *28 86 $34,268 $29,224 $20,612 $30,053 $36,074 - - $34,268 $29,224 $15,184 $20,612 $30,053 $36,074 $41,227
Org Sales Volume0.0-26.9 million 11 17 $35,844 $34,845 $27,830 $34,320 $40,560 - - $35,844 $34,845 $26,133 $27,830 $34,320 $40,560 $46,65527.0-99.9 million *15 40 $33,645 $33,990 $30,281 $33,521 $38,272 - - $33,645 $33,990 $26,647 $30,281 $33,521 $38,272 $41,192
RegionGreat Lakes 21 76 $34,215 $28,502 $18,720 $28,818 $35,845 - - $34,215 $28,502 $15,184 $18,720 $28,818 $35,845 $40,386Mountain 4 4 $30,883 $30,883 - $28,652 - - - $30,883 $30,883 - - $28,652 - -
AssociationTrusight (MN) - formerly EA 5 13 $34,653 $32,673 $28,017 $31,387 $38,589 - - $34,653 $32,673 $26,329 $28,017 $31,387 $38,589 $39,536Employers Resource Assoc. (OH) 3 4 $37,783 $36,674 - $36,680 - - - $37,783 $36,674 - - $36,680 - -Mtn States Employers Council (CO) 3 3 $32,845 $32,845 - $31,200 - - - $32,845 $32,845 - - $31,200 - -MRA - The Mgmt Assoc. (WI) *8 28 $33,677 $34,329 $30,013 $33,370 $38,810 - - $33,677 $34,329 $27,526 $30,013 $33,370 $38,810 $42,357
continued
(220) Telephone Order Processing RepresentativeCompensation Strategy: Straight Salary
Inbound order taker requiring good verbal skills and the ability to accurately enter order information in the order management system. Typically requires a high school education or GED and less than one year of related experience, or equivalent. Incumbents may inform callers of product availability and pricing. Generally callers are predisposed to making a purchase or issuing an order when they call.
Effective Date:September 2010
Total CompensationBase Pay Variable Pay
National Data - Effective September 2010 155 © 2011 Employer Associations of America (EAA)

(220) Telephone Order Processing RepresentativeCompensation Strategy: Straight Salary
Bonus Commission# of Orgs
# of Emp
Un-Wtd Avg
WtdAvg P25 Median P75
Wtd Annual Avg
Wtd Annual Avg
Un-Wtd Avg
WtdAvg P10 P25 Median P75 P90
Customer TypeIndustry 13 20 $37,431 $36,028 $29,609 $34,840 $41,807 - - $37,431 $36,028 $26,478 $29,609 $34,840 $41,807 $45,994Distributors/Wholesalers 8 28 $35,358 $34,977 $30,844 $34,699 $39,255 - - $35,358 $34,977 $28,510 $30,844 $34,699 $39,255 $41,330Retailers 3 6 $30,967 $30,335 - $31,294 - - - $30,967 $30,335 - - $31,294 - -Consumers 5 32 $26,118 $19,730 $15,184 $17,836 $22,074 - - $26,118 $19,730 $15,184 $15,184 $17,836 $22,074 $27,543
IndustryNon-Durable Goods Manufacturing *4 6 $39,203 $36,651 - $38,295 - - - $39,203 $36,651 - - $38,295 - -Durable Goods Manufacturing *14 36 $33,736 $34,263 $30,013 $33,521 $39,255 - - $33,736 $34,263 $26,322 $30,013 $33,521 $39,255 $41,527Wholesale and Retail Trade *5 37 $29,832 $21,684 $15,184 $18,304 $27,030 - - $29,832 $21,684 $15,184 $15,184 $18,304 $27,030 $32,044
* More than 30% of sample supplied by one organization.
Base Pay Variable Pay Total Compensation
National Data - Effective September 2010 156 © 2011 Employer Associations of America (EAA)

Bonus Commission# of Orgs
# of Emp
Un-Wtd Avg
WtdAvg P25 Median P75
Wtd Annual Avg
Wtd Annual Avg
Un-Wtd Avg
WtdAvg P10 P25 Median P75 P90
Total Responses *3 31 $33,227 $27,205 - $27,352 - - $5,432 $36,177 $32,637 - - $31,525 - -
Org Sales Volume
Region
Association
continued
Base Pay Variable Pay
Insufficient Data
Insufficient Data
Insufficient Data
(220) Telephone Order Processing RepresentativeCompensation Strategy: Salary + Commission
Inbound order taker requiring good verbal skills and the ability to accurately enter order information in the order management system. Typically requires a high school education or GED and less than one year of related experience, or equivalent. Incumbents may inform callers of product availability and pricing. Generally callers are predisposed to making a purchase or issuing an order when they call.
Effective Date:September 2010
Total Compensation
National Data - Effective September 2010 157 © 2011 Employer Associations of America (EAA)

(220) Telephone Order Processing RepresentativeCompensation Strategy: Salary + Commission
Bonus Commission# of Orgs
# of Emp
Un-Wtd Avg
WtdAvg P25 Median P75
Wtd Annual Avg
Wtd Annual Avg
Un-Wtd Avg
WtdAvg P10 P25 Median P75 P90
Customer Type
Industry
* More than 30% of sample supplied by one organization.
Insufficient Data
Insufficient Data
Base Pay Variable Pay Total Compensation
National Data - Effective September 2010 158 © 2011 Employer Associations of America (EAA)

Bonus Commission# of Orgs
# of Emp
Un-Wtd Avg
WtdAvg P25 Median P75
Wtd Annual Avg
Wtd Annual Avg
Un-Wtd Avg
WtdAvg P10 P25 Median P75 P90
Total Responses 15 45 $37,238 $35,657 $29,169 $32,905 $40,079 $1,949 - $38,885 $37,606 $28,550 $31,168 $33,894 $42,022 $52,352
Org Sales Volume0.0-26.9 million 8 16 $36,235 $36,437 $30,265 $35,659 $43,476 $2,077 - $38,049 $38,514 $28,886 $31,825 $37,954 $45,750 $49,76627.0-99.9 million 5 21 $39,982 $37,161 $29,432 $33,093 $46,485 $2,375 - $41,829 $39,536 $29,459 $32,905 $33,894 $47,546 $57,619
RegionGreat Lakes 12 37 $36,811 $33,858 $29,058 $30,368 $38,355 $2,178 - $38,681 $36,036 $28,339 $30,365 $33,876 $40,561 $48,800
AssociationTrusight (MN) - formerly EA 3 6 $30,932 $32,079 - $30,743 - $1,983 - $32,399 $34,062 - - $32,900 - -MRA - The Mgmt Assoc. (WI) 5 26 $35,612 $32,859 $28,333 $29,927 $37,633 $2,332 - $37,775 $35,190 $28,100 $29,108 $32,960 $39,514 $49,591
continued
(220) Telephone Order Processing RepresentativeCompensation Strategy: Salary + Bonus
Inbound order taker requiring good verbal skills and the ability to accurately enter order information in the order management system. Typically requires a high school education or GED and less than one year of related experience, or equivalent. Incumbents may inform callers of product availability and pricing. Generally callers are predisposed to making a purchase or issuing an order when they call.
Effective Date:September 2010
Total CompensationBase Pay Variable Pay
National Data - Effective September 2010 159 © 2011 Employer Associations of America (EAA)

(220) Telephone Order Processing RepresentativeCompensation Strategy: Salary + Bonus
Bonus Commission# of Orgs
# of Emp
Un-Wtd Avg
WtdAvg P25 Median P75
Wtd Annual Avg
Wtd Annual Avg
Un-Wtd Avg
WtdAvg P10 P25 Median P75 P90
Customer TypeIndustry 7 17 $41,623 $42,342 $34,364 $44,595 $48,391 $1,709 - $43,481 $44,051 $30,914 $35,823 $45,892 $50,727 $58,052Retailers 4 5 $33,670 $33,950 - $33,093 - $790 - $34,445 $34,740 - - $33,894 - -
IndustryNon-Durable Goods Manufacturing 5 19 $37,971 $37,107 $28,360 $32,905 $45,692 $1,064 - $39,244 $38,171 $27,744 $29,217 $33,105 $46,825 $57,798Durable Goods Manufacturing 5 5 $35,850 $35,850 $29,786 $39,520 $40,079 $1,331 - $37,181 $37,181 $30,736 $30,736 $40,390 $42,022 $42,524Wholesale and Retail Trade 4 20 $35,546 $33,651 - $31,034 - $2,945 - $37,986 $36,597 - - $33,885 - -
Base Pay Variable Pay Total Compensation
National Data - Effective September 2010 160 © 2011 Employer Associations of America (EAA)

Bonus Commission# of Orgs
# of Emp
Un-Wtd Avg
WtdAvg P25 Median P75
Wtd Annual Avg
Wtd Annual Avg
Un-Wtd Avg
WtdAvg P10 P25 Median P75 P90
Total Responses *4 27 $28,809 $21,118 - $19,760 - $6,251 $16,751 $39,630 $44,120 - - $46,716 - -
Org Sales Volume27.0-99.9 million *3 26 $27,745 $20,699 - $19,500 - $6,369 $17,257 $39,906 $44,325 - - $46,940 - -
Region
Association
continued
(220) Telephone Order Processing RepresentativeCompensation Strategy: Salary + Commission + Bonus
Inbound order taker requiring good verbal skills and the ability to accurately enter order information in the order management system. Typically requires a high school education or GED and less than one year of related experience, or equivalent. Incumbents may inform callers of product availability and pricing. Generally callers are predisposed to making a purchase or issuing an order when they call.
Effective Date:September 2010
Base Pay Variable Pay Total Compensation
Insufficient Data
Insufficient Data
National Data - Effective September 2010 161 © 2011 Employer Associations of America (EAA)

(220) Telephone Order Processing RepresentativeCompensation Strategy: Salary + Commission + Bonus
Bonus Commission# of Orgs
# of Emp
Un-Wtd Avg
WtdAvg P25 Median P75
Wtd Annual Avg
Wtd Annual Avg
Un-Wtd Avg
WtdAvg P10 P25 Median P75 P90
Customer Type
Industry
* More than 30% of sample supplied by one organization.
Insufficient Data
Insufficient Data
Base Pay Variable Pay Total Compensation
National Data - Effective September 2010 162 © 2011 Employer Associations of America (EAA)

Bonus Commission# of Orgs
# of Emp
Un-Wtd Avg
WtdAvg P25 Median P75
Wtd Annual Avg
Wtd Annual Avg
Un-Wtd Avg
WtdAvg P10 P25 Median P75 P90
Total Responses 139 179 - - - - - - - $72,582 $74,829 $52,900 $59,970 $69,600 $82,740 $106,496
Org Sales Volume0.0-26.9 million 45 46 - - - - - - - $63,510 $63,601 $45,184 $57,744 $64,209 $70,648 $80,32827.0-99.9 million 66 79 - - - - - - - $74,416 $74,643 $53,755 $61,474 $68,845 $80,116 $105,011100.0 million+ 28 54 - - - - - - - $82,840 $84,666 $56,250 $67,389 $80,810 $91,157 $133,580
RegionNortheast 4 6 - - - - - - - $66,185 $67,673 - - $63,030 - -Southeast 3 3 - - - - - - - $61,599 $61,599 - - $59,358 - -Great Lakes 116 152 - - - - - - - $73,907 $76,100 $53,262 $61,119 $70,000 $83,330 $108,760Mountain 8 8 - - - - - - - $73,926 $73,926 $52,808 $57,175 $74,500 $86,964 $101,800Pacific 6 6 - - - - - - - $53,793 $53,793 $41,300 $44,075 $55,878 $61,939 $63,179
AssociationAmerican Society of Employers (MI) 5 6 - - - - - - - $83,470 $79,384 $50,575 $60,569 $68,986 $92,940 $149,910Trusight (MN) - formerly EA 38 59 - - - - - - - $75,687 $81,018 $54,108 $65,135 $72,781 $87,910 $130,159Employers Assoc. W. Michigan (MI) 3 3 - - - - - - - $70,057 $70,057 - - $71,000 - -Employers Resource Assoc. (OH) 20 25 - - - - - - - $72,689 $72,996 $51,513 $58,615 $68,845 $81,418 $105,605Employers Resource Council (OH) 7 8 - - - - - - - $79,521 $82,205 $61,575 $72,187 $74,464 $97,816 $110,729MidAtlantic Employers Assoc. (PA) 3 4 - - - - - - - $60,616 $60,579 - - $60,468 - -Mtn States Employers Council (CO) 7 7 - - - - - - - $71,776 $71,776 $52,808 $55,400 $70,000 $80,927 $101,800MRA - The Mgmt Assoc. (N. IL) 7 8 - - - - - - - $77,091 $75,918 $60,000 $66,130 $69,350 $83,200 $114,200MRA - The Mgmt Assoc. (WI) 35 42 - - - - - - - $70,280 $71,602 $49,720 $59,189 $65,975 $80,336 $106,047The Management Assoc. of Illinois (IL) 6 8 - - - - - - - $66,088 $63,816 $44,000 $52,277 $65,419 $70,516 $87,300
continued
Base Pay Variable Pay
(300) Customer Service ManagerCombined Compensation Type
Manager of customer service function, typically requiring a bachelor's degree with 5+ years of experience, or equivalent. Develops and recommends customer service policies and procedures and seeks senior management approval when needed. Applies experience and judgment in the interpretations and application of direction established by senior management. Issues of major impact or technical complexity are researched and presented to upper management or referred to the appropriate internal experts for resolution. Typical customer questions are focused on account status, technical product application, service information, pricing or adjustments. Manages department staff and budget.
Effective Date:September 2010
Total Compensation
National Data - Effective September 2010 163 © 2011 Employer Associations of America (EAA)

(300) Customer Service ManagerCombined Compensation Type
Bonus Commission# of Orgs
# of Emp
Un-Wtd Avg
WtdAvg P25 Median P75
Wtd Annual Avg
Wtd Annual Avg
Un-Wtd Avg
WtdAvg P10 P25 Median P75 P90
Customer TypeIndustry 70 81 - - - - - - - $73,693 $73,886 $57,852 $61,526 $69,000 $79,284 $104,800Distributors/Wholesalers 43 58 - - - - - - - $70,613 $76,191 $46,376 $56,994 $69,388 $83,908 $130,910Retailers 12 18 - - - - - - - $80,857 $79,309 $59,855 $70,262 $80,298 $85,647 $91,889Consumers 16 22 - - - - - - - $69,610 $71,048 $50,778 $57,860 $67,312 $84,627 $101,805
IndustryNon-Durable Goods Manufacturing 27 32 - - - - - - - $71,053 $70,874 $47,912 $57,861 $68,596 $73,547 $103,006Durable Goods Manufacturing 60 69 - - - - - - - $75,333 $76,761 $56,975 $61,173 $69,145 $90,000 $110,000Wholesale and Retail Trade 32 41 - - - - - - - $70,369 $70,565 $46,967 $60,322 $72,173 $79,858 $86,345Financial Activities 3 4 - - - - - - - $64,970 $68,935 - - $68,404 - -Other Services 11 16 - - - - - - - $65,835 $67,620 $48,981 $55,909 $65,258 $78,496 $94,232
Base Pay Variable Pay Total Compensation
National Data - Effective September 2010 164 © 2011 Employer Associations of America (EAA)

Bonus Commission# of Orgs
# of Emp
Un-Wtd Avg
WtdAvg P25 Median P75
Wtd Annual Avg
Wtd Annual Avg
Un-Wtd Avg
WtdAvg P10 P25 Median P75 P90
Total Responses 46 53 $66,626 $67,327 $59,185 $66,000 $75,868 - - $66,626 $67,327 $50,281 $59,185 $66,000 $75,868 $83,281
Org Sales Volume0.0-26.9 million 14 14 $64,025 $64,025 $56,702 $64,210 $71,610 - - $64,025 $64,025 $44,417 $56,702 $64,210 $71,610 $81,32127.0-99.9 million 26 29 $67,589 $68,596 $60,468 $66,000 $75,148 - - $67,589 $68,596 $51,250 $60,468 $66,000 $75,148 $90,000100.0 million+ 6 10 $68,520 $68,271 $55,250 $71,406 $81,311 - - $68,520 $68,271 $44,600 $55,250 $71,406 $81,311 $85,426
RegionNortheast 3 4 $61,303 $61,094 - $60,468 - - - $61,303 $61,094 - - $60,468 - -Great Lakes 34 40 $68,214 $69,059 $59,400 $69,392 $78,500 - - $68,214 $69,059 $50,070 $59,400 $69,392 $78,500 $85,516Mountain 3 3 $67,269 $67,269 - $70,000 - - - $67,269 $67,269 - - $70,000 - -Pacific 4 4 $56,001 $56,001 - $59,763 - - - $56,001 $56,001 - - $59,763 - -
AssociationTrusight (MN) - formerly EA 12 13 $68,810 $68,440 $57,450 $68,783 $79,300 - - $68,810 $68,440 $49,800 $57,450 $68,783 $79,300 $84,891Employers Resource Assoc. (OH) 6 8 $71,868 $73,600 $69,837 $76,784 $82,264 - - $71,868 $73,600 $40,000 $69,837 $76,784 $82,264 $90,000MidAtlantic Employers Assoc. (PA) 3 4 $60,616 $60,579 - $60,468 - - - $60,616 $60,579 - - $60,468 - -Mtn States Employers Council (CO) 3 3 $67,269 $67,269 - $70,000 - - - $67,269 $67,269 - - $70,000 - -MRA - The Mgmt Assoc. (N. IL) 3 3 $65,313 $65,313 - $65,940 - - - $65,313 $65,313 - - $65,940 - -MRA - The Mgmt Assoc. (WI) 9 10 $68,997 $72,847 $60,550 $64,725 $84,000 - - $68,997 $72,847 $50,920 $60,550 $64,725 $84,000 $109,500The Management Assoc. of Illinois (IL) 3 5 $57,901 $57,541 - $57,000 - - - $57,901 $57,541 - - $57,000 - -
continued
(300) Customer Service ManagerCompensation Strategy: Straight Salary
Manager of customer service function, typically requiring a bachelor's degree with 5+ years of experience, or equivalent. Develops and recommends customer service policies and procedures and seeks senior management approval when needed. Applies experience and judgment in the interpretations and application of direction established by senior management. Issues of major impact or technical complexity are researched and presented to upper management or referred to the appropriate internal experts for resolution. Typical customer questions are focused on account status, technical product application, service information, pricing or adjustments. Manages department staff and budget.
Effective Date:September 2010
Total CompensationBase Pay Variable Pay
National Data - Effective September 2010 165 © 2011 Employer Associations of America (EAA)

(300) Customer Service ManagerCompensation Strategy: Straight Salary
Bonus Commission# of Orgs
# of Emp
Un-Wtd Avg
WtdAvg P25 Median P75
Wtd Annual Avg
Wtd Annual Avg
Un-Wtd Avg
WtdAvg P10 P25 Median P75 P90
Customer TypeIndustry 25 28 $70,889 $71,578 $61,645 $69,423 $76,860 - - $70,889 $71,578 $59,197 $61,645 $69,423 $76,860 $91,500Distributors/Wholesalers 13 15 $60,978 $60,448 $50,000 $58,200 $70,000 - - $60,978 $60,448 $42,920 $50,000 $58,200 $70,000 $79,240Retailers 3 5 $74,840 $76,422 - $80,835 - - - $74,840 $76,422 - - $80,835 - -Consumers 5 5 $55,066 $55,066 $45,625 $52,900 $65,591 - - $55,066 $55,066 $40,000 $45,625 $52,900 $65,591 $65,940
IndustryNon-Durable Goods Manufacturing 6 8 $62,885 $61,414 $53,856 $61,750 $70,000 - - $62,885 $61,414 $44,000 $53,856 $61,750 $70,000 $74,000Durable Goods Manufacturing 20 23 $67,724 $68,976 $60,000 $66,000 $75,296 - - $67,724 $68,976 $51,582 $60,000 $66,000 $75,296 $99,000Wholesale and Retail Trade 14 16 $66,028 $67,624 $58,293 $73,079 $78,950 - - $66,028 $67,624 $40,910 $58,293 $73,079 $78,950 $83,635
Base Pay Variable Pay Total Compensation
National Data - Effective September 2010 166 © 2011 Employer Associations of America (EAA)

Bonus Commission# of Orgs
# of Emp
Un-Wtd Avg
WtdAvg P25 Median P75
Wtd Annual Avg
Wtd Annual Avg
Un-Wtd Avg
WtdAvg P10 P25 Median P75 P90
Total Responses 6 9 $59,686 $61,536 $55,869 $59,436 $69,193 - $7,476 $65,331 $69,012 $50,575 $58,088 $67,336 $83,923 $87,402
Org Sales Volume
RegionGreat Lakes 4 5 $57,479 $56,273 - $58,198 - - $5,027 $61,886 $61,300 - - $59,970 - -
Association
continued
(300) Customer Service ManagerCompensation Strategy: Salary + Commission
Manager of customer service function, typically requiring a bachelor's degree with 5+ years of experience, or equivalent. Develops and recommends customer service policies and procedures and seeks senior management approval when needed. Applies experience and judgment in the interpretations and application of direction established by senior management. Issues of major impact or technical complexity are researched and presented to upper management or referred to the appropriate internal experts for resolution. Typical customer questions are focused on account status, technical product application, service information, pricing or adjustments. Manages department staff and budget.
Effective Date:September 2010
Total CompensationBase Pay Variable Pay
Insufficient Data
Insufficient Data
National Data - Effective September 2010 167 © 2011 Employer Associations of America (EAA)

(300) Customer Service ManagerCompensation Strategy: Salary + Commission
Bonus Commission# of Orgs
# of Emp
Un-Wtd Avg
WtdAvg P25 Median P75
Wtd Annual Avg
Wtd Annual Avg
Un-Wtd Avg
WtdAvg P10 P25 Median P75 P90
Customer TypeDistributors/Wholesalers 3 3 $59,489 $59,489 - $58,198 - - $3,374 $62,863 $62,863 - - $59,970 - -
IndustryDurable Goods Manufacturing 3 3 $59,623 $59,623 - $58,198 - - $4,087 $63,709 $63,709 - - $59,970 - -
Base Pay Variable Pay Total Compensation
National Data - Effective September 2010 168 © 2011 Employer Associations of America (EAA)

Bonus Commission# of Orgs
# of Emp
Un-Wtd Avg
WtdAvg P25 Median P75
Wtd Annual Avg
Wtd Annual Avg
Un-Wtd Avg
WtdAvg P10 P25 Median P75 P90
Total Responses 78 108 $68,124 $68,827 $57,993 $67,070 $77,492 $10,032 - $76,204 $78,859 $55,490 $61,581 $71,250 $87,758 $111,259
Org Sales Volume0.0-26.9 million 25 26 $59,952 $60,223 $53,629 $58,578 $69,502 $3,589 - $63,657 $63,812 $45,184 $57,744 $64,369 $71,049 $84,58827.0-99.9 million 33 43 $68,307 $68,318 $59,718 $65,910 $76,000 $9,391 - $78,428 $77,709 $54,413 $61,575 $71,500 $86,000 $106,386100.0 million+ 20 39 $78,037 $75,123 $60,685 $74,184 $83,554 $15,034 - $88,218 $90,156 $57,990 $69,000 $83,044 $109,250 $137,665
RegionGreat Lakes 70 99 $68,293 $68,907 $58,000 $66,851 $77,010 $10,555 - $76,782 $79,462 $56,975 $61,600 $71,000 $87,910 $114,200Mountain 5 5 $71,531 $71,531 $54,000 $73,202 $88,227 $6,390 - $77,921 $77,921 $55,400 $58,950 $80,927 $95,388 $101,800
AssociationAmerican Society of Employers (MI) 4 4 $61,913 $61,913 - $62,420 - $27,686 - $89,599 $89,599 - - $72,292 - -Trusight (MN) - formerly EA 22 40 $68,576 $69,416 $59,885 $67,633 $77,500 $14,767 - $77,161 $84,183 $58,053 $65,161 $72,477 $100,841 $136,914Employers Resource Assoc. (OH) 8 11 $71,842 $70,591 $52,832 $60,393 $80,000 $7,183 - $80,249 $77,774 $47,346 $56,975 $63,714 $86,000 $143,902Employers Resource Council (OH) 4 5 $72,950 $74,318 - $74,376 - $13,181 - $84,125 $87,499 - - $91,263 - -Mtn States Employers Council (CO) 4 4 $68,526 $68,526 - $66,601 - $6,631 - $75,157 $75,157 - - $71,714 - -MRA - The Mgmt Assoc. (N. IL) 4 5 $76,175 $74,340 - $70,000 - $7,940 - $85,925 $82,280 - - $76,300 - -MRA - The Mgmt Assoc. (WI) 23 29 $66,012 $67,002 $56,000 $60,900 $77,331 $4,128 - $70,555 $71,130 $49,600 $58,573 $69,000 $80,556 $91,416The Management Assoc. of Illinois (IL) 3 3 $67,899 $67,899 - $69,989 - $6,376 - $74,275 $74,275 - - $70,688 - -
continued
(300) Customer Service ManagerCompensation Strategy: Salary + Bonus
Manager of customer service function, typically requiring a bachelor's degree with 5+ years of experience, or equivalent. Develops and recommends customer service policies and procedures and seeks senior management approval when needed. Applies experience and judgment in the interpretations and application of direction established by senior management. Issues of major impact or technical complexity are researched and presented to upper management or referred to the appropriate internal experts for resolution. Typical customer questions are focused on account status, technical product application, service information, pricing or adjustments. Manages department staff and budget.
Effective Date:September 2010
Total CompensationBase Pay Variable Pay
National Data - Effective September 2010 169 © 2011 Employer Associations of America (EAA)

(300) Customer Service ManagerCompensation Strategy: Salary + Bonus
Bonus Commission# of Orgs
# of Emp
Un-Wtd Avg
WtdAvg P25 Median P75
Wtd Annual Avg
Wtd Annual Avg
Un-Wtd Avg
WtdAvg P10 P25 Median P75 P90
Customer TypeIndustry 38 46 $69,914 $69,636 $57,504 $65,500 $76,500 $6,206 - $76,170 $75,841 $55,626 $61,056 $69,373 $84,069 $107,768Distributors/Wholesalers 25 38 $65,011 $67,424 $56,363 $65,329 $79,250 $16,795 - $77,264 $84,218 $47,220 $58,961 $73,145 $102,974 $147,854Retailers 7 9 $70,521 $68,490 $59,197 $68,262 $75,255 $4,613 - $75,487 $73,103 $58,549 $64,357 $72,173 $82,630 $87,290Consumers 10 15 $69,682 $70,102 $65,000 $70,088 $77,652 $7,885 - $77,948 $77,987 $57,368 $65,000 $78,128 $88,437 $108,082
IndustryNon-Durable Goods Manufacturing 19 22 $67,579 $68,180 $56,500 $62,420 $72,676 $7,102 - $74,771 $75,282 $47,912 $58,866 $69,560 $82,520 $128,675Durable Goods Manufacturing 31 37 $72,186 $73,169 $58,563 $73,500 $82,600 $8,713 - $80,161 $81,882 $58,822 $63,322 $79,760 $95,708 $111,586Wholesale and Retail Trade 16 21 $63,595 $62,487 $57,853 $60,391 $69,506 $7,859 - $72,730 $70,346 $48,300 $60,012 $65,241 $76,050 $87,132Financial Activities 3 4 $58,414 $63,396 - $62,420 - $5,540 - $64,970 $68,935 - - $68,404 - -Other Services 7 11 $65,900 $69,098 $57,990 $69,989 $80,995 $2,992 - $70,601 $72,089 $47,346 $57,990 $70,688 $87,910 $102,992
Base Pay Variable Pay Total Compensation
National Data - Effective September 2010 170 © 2011 Employer Associations of America (EAA)

Bonus Commission# of Orgs
# of Emp
Un-Wtd Avg
WtdAvg P25 Median P75
Wtd Annual Avg
Wtd Annual Avg
Un-Wtd Avg
WtdAvg P10 P25 Median P75 P90
Total Responses 8 8 $69,479 $69,479 $58,895 $64,325 $82,434 $3,966 $6,986 $80,431 $80,431 $56,595 $63,867 $70,068 $100,378 $132,271
Org Sales Volume0.0-26.9 million 3 3 $65,402 $65,402 - $63,017 - $1,908 $2,424 $69,734 $69,734 - - $66,017 - -27.0-99.9 million 5 5 $71,925 $71,925 $55,149 $65,000 $92,165 $5,201 $9,723 $86,850 $86,850 $56,595 $60,123 $74,119 $119,943 $132,271
RegionGreat Lakes 7 7 $72,741 $72,741 $63,017 $65,000 $84,690 $4,318 $6,777 $83,837 $83,837 $63,650 $64,517 $74,119 $107,615 $132,271
AssociationEmployers Resource Assoc. (OH) 4 4 $58,046 $58,046 - $60,269 - $1,306 $5,960 $65,312 $65,312 - - $65,267 - -
continued
(300) Customer Service ManagerCompensation Strategy: Salary + Commission + Bonus
Manager of customer service function, typically requiring a bachelor's degree with 5+ years of experience, or equivalent. Develops and recommends customer service policies and procedures and seeks senior management approval when needed. Applies experience and judgment in the interpretations and application of direction established by senior management. Issues of major impact or technical complexity are researched and presented to upper management or referred to the appropriate internal experts for resolution. Typical customer questions are focused on account status, technical product application, service information, pricing or adjustments. Manages department staff and budget.
Effective Date:September 2010
Total CompensationBase Pay Variable Pay
National Data - Effective September 2010 171 © 2011 Employer Associations of America (EAA)

(300) Customer Service ManagerCompensation Strategy: Salary + Commission + Bonus
Bonus Commission# of Orgs
# of Emp
Un-Wtd Avg
WtdAvg P25 Median P75
Wtd Annual Avg
Wtd Annual Avg
Un-Wtd Avg
WtdAvg P10 P25 Median P75 P90
Customer TypeIndustry 6 6 $63,421 $63,421 $54,803 $63,334 $69,923 $1,309 $7,355 $72,085 $72,085 $56,595 $61,886 $65,267 $82,493 $107,615
IndustryDurable Goods Manufacturing 5 5 $73,974 $73,974 $60,269 $65,000 $92,165 $5,446 $9,488 $88,908 $88,908 $64,517 $65,267 $74,119 $119,943 $132,271
Base Pay Variable Pay Total Compensation
National Data - Effective September 2010 172 © 2011 Employer Associations of America (EAA)

Bonus Commission# of Orgs
# of Emp
Un-Wtd Avg
WtdAvg P25 Median P75
Wtd Annual Avg
Wtd Annual Avg
Un-Wtd Avg
WtdAvg P10 P25 Median P75 P90
Total Responses 82 134 - - - - - - - $52,136 $52,447 $38,000 $43,962 $50,790 $58,822 $67,258
Org Sales Volume0.0-26.9 million - - - - - - - $49,257 $49,118 $36,465 $41,600 $46,480 $54,188 $64,63127.0-99.9 million 27 40 - - - - - - - $54,211 $54,147 $38,165 $44,140 $53,280 $59,829 $72,593100.0 million+ 22 59 - - - - - - - $53,910 $53,269 $40,656 $44,741 $50,859 $59,740 $66,015
RegionNortheast 5 8 - - - - - - - $52,012 $52,903 $44,000 $48,962 $52,176 $56,312 $64,818Southeast 3 14 - - - - - - - $58,810 $58,691 - - $53,901 - -Great Lakes 58 83 - - - - - - - $52,182 $52,426 $37,564 $43,426 $51,400 $59,150 $69,446Central 3 8 - - - - - - - $54,450 $52,364 - - $52,735 - -Mountain 8 14 - - - - - - - $48,566 $47,022 $37,427 $39,168 $46,426 $56,596 $58,372Pacific 5 7 - - - - - - - $52,049 $50,627 $37,000 $40,000 $44,399 $58,789 $84,700
AssociationAmerican Society of Employers (MI) 9 26 - - - - - - - $57,030 $56,982 $45,685 $48,655 $55,072 $62,384 $72,328Trusight (MN) - formerly EA 9 14 - - - - - - - $51,949 $53,271 $34,836 $42,421 $54,654 $62,378 $68,539Employers Resource Assoc. (OH) 12 16 - - - - - - - $47,956 $50,553 $34,540 $38,664 $45,412 $60,433 $77,615Employers Resource Council (OH) 6 6 - - - - - - - $58,552 $58,552 $46,075 $50,723 $57,144 $66,123 $75,768Mtn States Employers Council (CO) 6 10 - - - - - - - $48,188 $45,951 $37,247 $37,705 $42,336 $56,596 $58,834MRA - The Mgmt Assoc. (N. IL) 5 5 - - - - - - - $50,380 $50,380 $38,000 $40,435 $55,510 $57,761 $57,922MRA - The Mgmt Assoc. (WI) 22 41 - - - - - - - $51,186 $50,714 $40,300 $43,388 $49,109 $56,250 $64,130The Management Assoc. of Illinois (IL) 4 5 - - - - - - - $58,229 $57,270 - - $55,013 - -
continued
(310) Customer Service SupervisorCombined Compensation Type
Supervisor of a customer service function, typically requiring an associate's degree with 5+ years of experience, or equivalent. The incumbent fields the most technical or complex service questions from customers and applies experience and judgment in the interpretation and application of guidelines established by senior management. Issues of major impact or technical complexity are researched and presented to upper management or referred to the appropriate internal experts for resolution. Typical customer questions are focused on account status, technical product application, service information, pricing or adjustments. Assists with employee selection and reviews employee performance.
Effective Date:September 2010
Total CompensationBase Pay Variable Pay
National Data - Effective September 2010 173 © 2011 Employer Associations of America (EAA)

(310) Customer Service SupervisorCombined Compensation Type
Bonus Commission# of Orgs
# of Emp
Un-Wtd Avg
WtdAvg P25 Median P75
Wtd Annual Avg
Wtd Annual Avg
Un-Wtd Avg
WtdAvg P10 P25 Median P75 P90
Customer TypeIndustry 34 47 - - - - - - - $53,663 $54,014 $38,000 $46,000 $55,013 $59,740 $69,376Distributors/Wholesalers 22 26 - - - - - - - $54,630 $55,324 $36,684 $43,500 $52,610 $64,060 $79,005Retailers 16 32 - - - - - - - $51,833 $53,375 $42,100 $46,526 $51,005 $57,363 $64,558Consumers 13 29 - - - - - - - $44,318 $46,302 $35,000 $39,000 $44,404 $52,376 $58,919
IndustryNon-Durable Goods Manufacturing 18 29 - - - - - - - $53,101 $54,226 $39,650 $49,600 $54,188 $61,736 $64,170Durable Goods Manufacturing 30 39 - - - - - - - $55,015 $54,777 $38,000 $43,600 $51,855 $60,564 $76,564Wholesale and Retail Trade 22 50 - - - - - - - $48,980 $51,188 $41,510 $43,931 $48,655 $56,650 $64,732Financial Activities 3 5 - - - - - - - $43,319 $41,975 - - $38,000 - -Other Services 4 6 - - - - - - - $54,703 $51,182 - - $52,779 - -
Base Pay Variable Pay Total Compensation
National Data - Effective September 2010 174 © 2011 Employer Associations of America (EAA)

Bonus Commission# of Orgs
# of Emp
Un-Wtd Avg
WtdAvg P25 Median P75
Wtd Annual Avg
Wtd Annual Avg
Un-Wtd Avg
WtdAvg P10 P25 Median P75 P90
Total Responses 36 47 $50,567 $51,096 $41,600 $50,000 $59,015 - - $50,567 $51,096 $36,732 $41,600 $50,000 $59,015 $73,302
Org Sales Volume0.0-26.9 million 18 19 $46,141 $45,976 $37,000 $42,600 $52,069 - - $46,141 $45,976 $35,000 $37,000 $42,600 $52,069 $62,00027.0-99.9 million 13 19 $54,288 $55,631 $49,749 $54,288 $60,100 - - $54,288 $55,631 $42,869 $49,749 $54,288 $60,100 $75,600100.0 million+ 5 9 $56,823 $52,332 $42,003 $49,000 $64,120 - - $56,823 $52,332 $38,000 $42,003 $49,000 $64,120 $75,768
RegionGreat Lakes 28 37 $51,453 $51,991 $42,100 $51,000 $59,920 - - $51,453 $51,991 $35,529 $42,100 $51,000 $59,920 $75,120Mountain 3 3 $48,913 $48,913 - $50,000 - - - $48,913 $48,913 - - $50,000 - -
AssociationEmployers Resource Assoc. (OH) 7 11 $46,904 $51,064 $35,662 $43,264 $72,878 - - $46,904 $51,064 $33,774 $35,662 $43,264 $72,878 $80,973Mtn States Employers Council (CO) 3 3 $48,913 $48,913 - $50,000 - - - $48,913 $48,913 - - $50,000 - -MRA - The Mgmt Assoc. (WI) 11 16 $47,379 $48,280 $42,788 $49,731 $51,875 - - $47,379 $48,280 $35,822 $42,788 $49,731 $51,875 $59,987The Management Assoc. of Illinois (IL) 3 4 $62,145 $59,967 - $56,507 - - - $62,145 $59,967 - - $56,507 - -
continued
(310) Customer Service SupervisorCompensation Strategy: Straight Salary
Supervisor of a customer service function, typically requiring an associate's degree with 5+ years of experience, or equivalent. The incumbent fields the most technical or complex service questions from customers and applies experience and judgment in the interpretation and application of guidelines established by senior management. Issues of major impact or technical complexity are researched and presented to upper management or referred to the appropriate internal experts for resolution. Typical customer questions are focused on account status, technical product application, service information, pricing or adjustments. Assists with employee selection and reviews employee performance.
Effective Date:September 2010
Total CompensationBase Pay Variable Pay
National Data - Effective September 2010 175 © 2011 Employer Associations of America (EAA)

(310) Customer Service SupervisorCompensation Strategy: Straight Salary
Bonus Commission# of Orgs
# of Emp
Un-Wtd Avg
WtdAvg P25 Median P75
Wtd Annual Avg
Wtd Annual Avg
Un-Wtd Avg
WtdAvg P10 P25 Median P75 P90
Customer TypeIndustry 22 31 $52,757 $52,994 $43,264 $51,000 $59,740 - - $52,757 $52,994 $37,778 $43,264 $51,000 $59,740 $74,576Distributors/Wholesalers 8 9 $50,114 $50,674 $39,300 $49,749 $60,332 - - $50,114 $50,674 $33,467 $39,300 $49,749 $60,332 $75,768Consumers 4 4 $40,735 $40,735 - $38,935 - - - $40,735 $40,735 - - $38,935 - -
IndustryNon-Durable Goods Manufacturing 10 12 $52,949 $52,632 $49,000 $51,785 $58,262 - - $52,949 $52,632 $36,280 $49,000 $51,785 $58,262 $71,520Durable Goods Manufacturing 17 25 $51,356 $52,331 $41,300 $49,749 $60,332 - - $51,356 $52,331 $37,000 $41,300 $49,749 $60,332 $75,307Wholesale and Retail Trade 6 7 $41,226 $41,596 $35,000 $41,600 $46,977 - - $41,226 $41,596 $33,072 $35,000 $41,600 $46,977 $51,000
Base Pay Variable Pay Total Compensation
National Data - Effective September 2010 176 © 2011 Employer Associations of America (EAA)

Bonus Commission# of Orgs
# of Emp
Un-Wtd Avg
WtdAvg P25 Median P75
Wtd Annual Avg
Wtd Annual Avg
Un-Wtd Avg
WtdAvg P10 P25 Median P75 P90
Total Responses 41 82 $49,650 $49,559 $43,000 $47,675 $55,237 $3,264 - $52,681 $52,823 $39,755 $44,657 $51,005 $58,822 $64,960
Org Sales Volume0.0-26.9 million 12 13 $50,749 $49,864 $41,076 $46,200 $54,461 $3,554 - $53,650 $53,419 $42,854 $45,438 $50,708 $57,211 $78,25127.0-99.9 million 12 19 $48,102 $47,560 $38,000 $47,075 $56,163 $3,238 - $51,186 $50,798 $37,651 $39,650 $51,400 $58,606 $65,021100.0 million+ 17 50 $49,968 $50,239 $44,361 $49,055 $55,087 $3,198 - $53,053 $53,437 $41,513 $44,779 $51,152 $59,420 $64,754
RegionSoutheast 3 14 $54,005 $53,930 - $49,001 - $4,761 - $58,810 $58,691 - - $53,901 - -Great Lakes 27 43 $48,942 $49,079 $42,860 $48,000 $56,163 $2,884 - $51,577 $51,962 $38,800 $44,136 $51,400 $58,919 $64,681Mountain 5 11 $44,419 $42,942 $38,000 $41,000 $50,000 $3,564 - $48,358 $46,506 $37,292 $39,650 $45,022 $56,394 $57,623
AssociationAmerican Society of Employers (MI) 7 24 $51,616 $52,290 $45,123 $49,381 $58,262 $4,332 - $55,811 $56,622 $45,225 $48,655 $52,323 $63,067 $76,537Trusight (MN) - formerly EA 7 12 $46,186 $47,563 $35,669 $50,295 $54,900 $4,539 - $49,567 $52,102 $34,392 $38,990 $54,319 $61,758 $67,256Employers Resource Assoc. (OH) 4 4 $45,836 $45,836 - $43,912 - $2,043 - $47,879 $47,879 - - $45,742 - -Employers Resource Council (OH) 4 4 $51,090 $51,090 - $49,500 - $2,771 - $53,861 $53,861 - - $53,230 - -Mtn States Employers Council (CO) 3 7 $42,723 $40,644 - $38,000 - $4,037 - $47,463 $44,681 - - $39,650 - -MRA - The Mgmt Assoc. (N. IL) 3 3 $55,007 $55,007 - $55,100 - $2,003 - $57,011 $57,011 - - $57,600 - -MRA - The Mgmt Assoc. (WI) 9 23 $49,480 $48,918 $41,632 $44,791 $56,163 $1,912 - $51,914 $50,830 $41,553 $43,426 $46,482 $58,606 $68,023
continued
(310) Customer Service SupervisorCompensation Strategy: Salary + Bonus
Supervisor of a customer service function, typically requiring an associate's degree with 5+ years of experience, or equivalent. The incumbent fields the most technical or complex service questions from customers and applies experience and judgment in the interpretation and application of guidelines established by senior management. Issues of major impact or technical complexity are researched and presented to upper management or referred to the appropriate internal experts for resolution. Typical customer questions are focused on account status, technical product application, service information, pricing or adjustments. Assists with employee selection and reviews employee performance.
Effective Date:September 2010
Total CompensationBase Pay Variable Pay
National Data - Effective September 2010 177 © 2011 Employer Associations of America (EAA)

(310) Customer Service SupervisorCompensation Strategy: Salary + Bonus
Bonus Commission# of Orgs
# of Emp
Un-Wtd Avg
WtdAvg P25 Median P75
Wtd Annual Avg
Wtd Annual Avg
Un-Wtd Avg
WtdAvg P10 P25 Median P75 P90
Customer TypeIndustry 9 13 $52,098 $51,509 $46,076 $52,000 $57,399 $4,912 - $55,723 $56,421 $44,402 $53,109 $57,238 $61,907 $63,665Distributors/Wholesalers 13 16 $51,686 $52,319 $43,139 $48,600 $59,726 $3,572 - $54,834 $55,891 $38,539 $46,176 $52,794 $65,364 $79,005Retailers 14 29 $49,342 $50,503 $44,518 $48,000 $54,378 $3,576 - $52,388 $54,080 $43,500 $47,102 $51,152 $58,195 $64,818Consumers 8 24 $43,768 $45,521 $39,267 $44,573 $54,067 $1,788 - $46,100 $47,309 $37,238 $40,408 $44,766 $54,978 $61,970
IndustryNon-Durable Goods Manufacturing 7 16 $48,993 $50,632 $45,668 $51,769 $55,460 $4,606 - $52,740 $55,239 $39,650 $50,497 $56,816 $61,977 $64,724Durable Goods Manufacturing 11 12 $55,263 $53,929 $42,328 $52,904 $65,914 $3,599 - $58,153 $57,528 $43,761 $45,119 $57,050 $66,221 $82,259Wholesale and Retail Trade 15 42 $49,631 $50,320 $44,231 $46,788 $54,997 $2,628 - $52,386 $52,949 $42,081 $44,779 $50,014 $58,652 $64,960Other Services 3 5 $47,578 $44,989 - $47,350 - $2,729 - $50,104 $47,718 - - $47,830 - -
Base Pay Variable Pay Total Compensation
National Data - Effective September 2010 178 © 2011 Employer Associations of America (EAA)
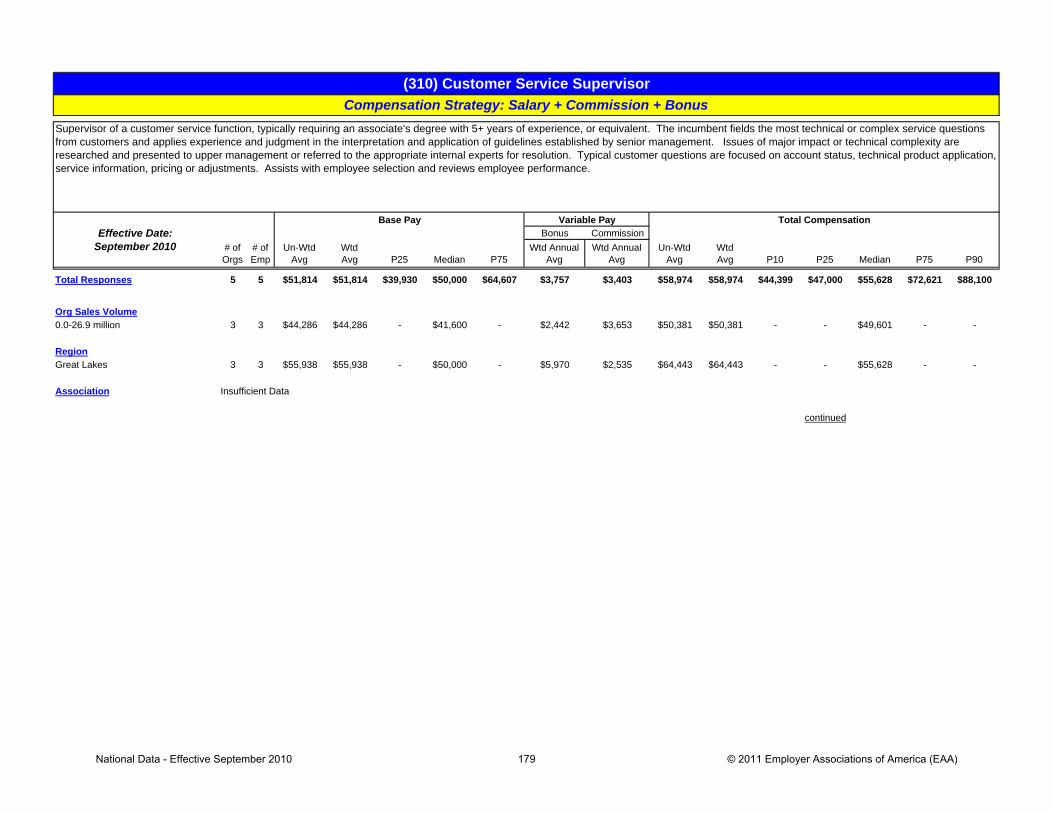
Bonus Commission# of Orgs
# of Emp
Un-Wtd Avg
WtdAvg P25 Median P75
Wtd Annual Avg
Wtd Annual Avg
Un-Wtd Avg
WtdAvg P10 P25 Median P75 P90
Total Responses 5 5 $51,814 $51,814 $39,930 $50,000 $64,607 $3,757 $3,403 $58,974 $58,974 $44,399 $47,000 $55,628 $72,621 $88,100
Org Sales Volume0.0-26.9 million 3 3 $44,286 $44,286 - $41,600 - $2,442 $3,653 $50,381 $50,381 - - $49,601 - -
RegionGreat Lakes 3 3 $55,938 $55,938 - $50,000 - $5,970 $2,535 $64,443 $64,443 - - $55,628 - -
Association
continued
Variable Pay Total Compensation
Insufficient Data
(310) Customer Service SupervisorCompensation Strategy: Salary + Commission + Bonus
Supervisor of a customer service function, typically requiring an associate's degree with 5+ years of experience, or equivalent. The incumbent fields the most technical or complex service questions from customers and applies experience and judgment in the interpretation and application of guidelines established by senior management. Issues of major impact or technical complexity are researched and presented to upper management or referred to the appropriate internal experts for resolution. Typical customer questions are focused on account status, technical product application, service information, pricing or adjustments. Assists with employee selection and reviews employee performance.
Effective Date:September 2010
Base Pay
National Data - Effective September 2010 179 © 2011 Employer Associations of America (EAA)

(310) Customer Service SupervisorCompensation Strategy: Salary + Commission + Bonus
Bonus Commission# of Orgs
# of Emp
Un-Wtd Avg
WtdAvg P25 Median P75
Wtd Annual Avg
Wtd Annual Avg
Un-Wtd Avg
WtdAvg P10 P25 Median P75 P90
Customer TypeIndustry 3 3 $48,200 $48,200 - $50,000 - $3,837 $2,087 $54,124 $54,124 - - $55,628 - -
Industry
Base Pay Variable Pay Total Compensation
Insufficient Data
National Data - Effective September 2010 180 © 2011 Employer Associations of America (EAA)

Bonus Commission# of Orgs
# of Emp
Un-Wtd Avg
WtdAvg P25 Median P75
Wtd Annual Avg
Wtd Annual Avg
Un-Wtd Avg
WtdAvg P10 P25 Median P75 P90
Total Responses 106 265 - - - - - - - $49,496 $48,415 $34,906 $40,652 $47,388 $53,985 $63,179
Org Sales Volume0.0-26.9 million 44 115 - - - - - - - $51,064 $49,429 $35,393 $42,432 $48,000 $56,872 $63,46227.0-99.9 million 50 115 - - - - - - - $48,455 $47,177 $33,463 $37,518 $44,200 $53,600 $63,533100.0 million+ 12 35 - - - - - - - $48,088 $49,150 $35,470 $39,839 $47,508 $56,013 $63,789
RegionNortheast 4 7 - - - - - - - $63,195 $63,333 - - $64,728 - -Southeast 3 6 - - - - - - - $36,767 $41,006 - - $40,768 - -Great Lakes 77 186 - - - - - - - $49,595 $48,317 $35,264 $40,531 $47,502 $54,341 $62,416Mountain 11 36 - - - - - - - $49,712 $46,594 $33,503 $35,622 $44,169 $52,555 $65,638Pacific 11 30 - - - - - - - $47,078 $49,212 $36,197 $41,420 $46,500 $51,645 $67,330
AssociationAmerican Society of Employers (MI) 6 20 - - - - - - - $45,860 $46,056 $35,741 $40,707 $45,923 $49,310 $63,619Cascade Employers Assoc. (OR) 3 4 - - - - - - - $35,376 $35,526 - - $35,742 - -Trusight (MN) - formerly EA 21 71 - - - - - - - $52,846 $49,490 $35,304 $42,000 $47,553 $57,953 $65,236Employers Resource Assoc. (OH) 15 34 - - - - - - - $50,594 $51,046 $35,131 $38,196 $52,067 $61,074 $68,737Employers Resource Council (OH) 4 4 - - - - - - - $44,542 $44,542 - - $42,070 - -MidAtlantic Employers Assoc. (PA) 3 4 - - - - - - - $61,494 $59,608 - - $59,761 - -Mtn States Employers Council (CO) 9 34 - - - - - - - $48,738 $46,153 $33,489 $34,991 $43,203 $50,466 $65,764MRA - The Mgmt Assoc. (N. IL) 4 9 - - - - - - - $51,126 $50,877 - - $51,100 - -MRA - The Mgmt Assoc. (WI) 27 51 - - - - - - - $48,520 $46,978 $33,217 $37,202 $47,504 $52,014 $59,482The Management Assoc. of Illinois (IL) 3 4 - - - - - - - $42,117 $41,582 - - $41,925 - -
continued
Base Pay Variable Pay
(320) Customer Service Representative III (Technical Advisor)Combined Compensation Type
Advanced level of customer service work, typically requiring a bachelor's degree with 2+ years of experience, or equivalent. Handles the more technical or complex service questions from customers and applies judgment in resolving service, warranty or technical problems falling within established limits of authority and knowledge. Issues of greater impact or technical complexity are researched and presented to management or referred to the appropriate internal experts for resolution. Typical customer questions are focused on account status, technical product application, or service information, pricing or adjustments. May provide work direction to others.
Effective Date:September 2010
Total Compensation
National Data - Effective September 2010 181 © 2011 Employer Associations of America (EAA)
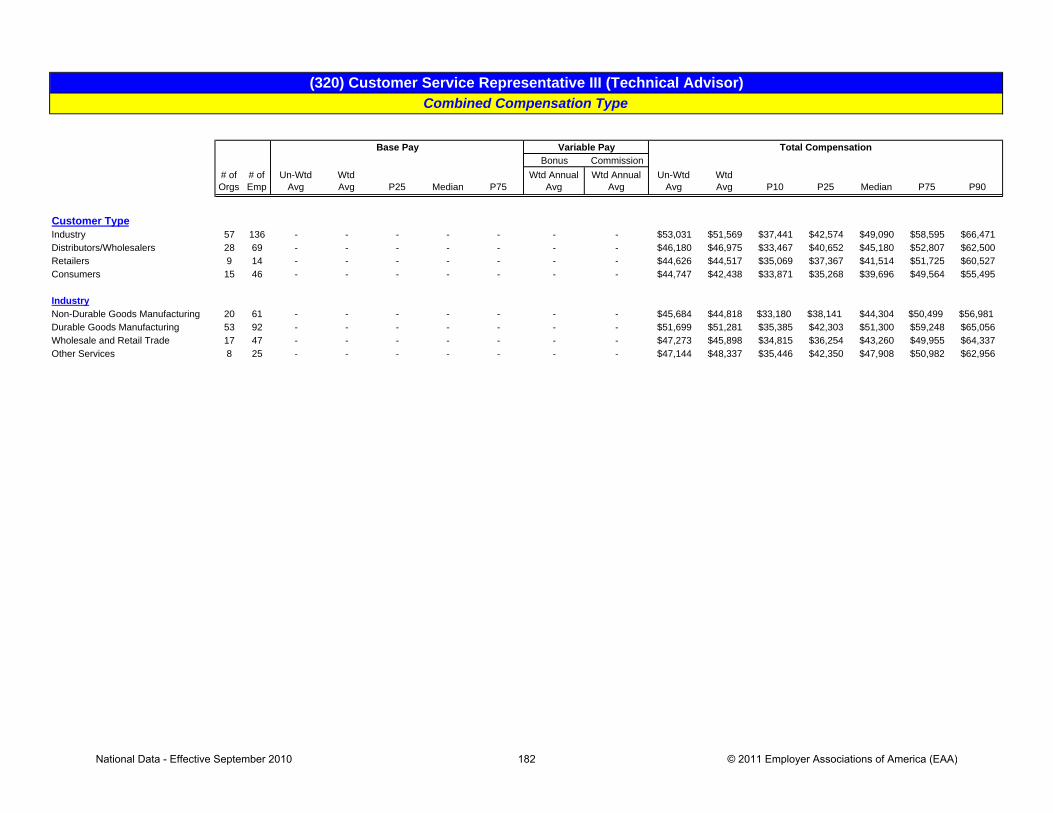
(320) Customer Service Representative III (Technical Advisor)Combined Compensation Type
Bonus Commission# of Orgs
# of Emp
Un-Wtd Avg
WtdAvg P25 Median P75
Wtd Annual Avg
Wtd Annual Avg
Un-Wtd Avg
WtdAvg P10 P25 Median P75 P90
Customer TypeIndustry 57 136 - - - - - - - $53,031 $51,569 $37,441 $42,574 $49,090 $58,595 $66,471Distributors/Wholesalers 28 69 - - - - - - - $46,180 $46,975 $33,467 $40,652 $45,180 $52,807 $62,500Retailers 9 14 - - - - - - - $44,626 $44,517 $35,069 $37,367 $41,514 $51,725 $60,527Consumers 15 46 - - - - - - - $44,747 $42,438 $33,871 $35,268 $39,696 $49,564 $55,495
IndustryNon-Durable Goods Manufacturing 20 61 - - - - - - - $45,684 $44,818 $33,180 $38,141 $44,304 $50,499 $56,981Durable Goods Manufacturing 53 92 - - - - - - - $51,699 $51,281 $35,385 $42,303 $51,300 $59,248 $65,056Wholesale and Retail Trade 17 47 - - - - - - - $47,273 $45,898 $34,815 $36,254 $43,260 $49,955 $64,337Other Services 8 25 - - - - - - - $47,144 $48,337 $35,446 $42,350 $47,908 $50,982 $62,956
Base Pay Variable Pay Total Compensation
National Data - Effective September 2010 182 © 2011 Employer Associations of America (EAA)

Bonus Commission# of Orgs
# of Emp
Un-Wtd Avg
WtdAvg P25 Median P75
Wtd Annual Avg
Wtd Annual Avg
Un-Wtd Avg
WtdAvg P10 P25 Median P75 P90
Total Responses 56 105 $48,779 $47,559 $41,363 $47,388 $53,076 - - $48,779 $47,559 $34,862 $41,363 $47,388 $53,076 $62,629
Org Sales Volume0.0-26.9 million 23 49 $50,763 $48,957 $43,298 $47,504 $53,356 - - $50,763 $48,957 $36,400 $43,298 $47,504 $53,356 $64,15027.0-99.9 million 30 47 $47,935 $46,935 $38,306 $44,304 $53,600 - - $47,935 $46,935 $33,465 $38,306 $44,304 $53,600 $62,921100.0 million+ 3 9 $42,002 $43,202 - $42,328 - - - $42,002 $43,202 - - $42,328 - -
RegionNortheast 3 4 $61,494 $59,608 - $59,761 - - - $61,494 $59,608 - - $59,761 - -Great Lakes 42 80 $49,844 $48,462 $42,354 $47,502 $53,600 - - $49,844 $48,462 $35,368 $42,354 $47,502 $53,600 $62,941Mountain 5 12 $38,915 $40,286 $34,216 $38,564 $44,364 - - $38,915 $40,286 $33,367 $34,216 $38,564 $44,364 $52,220Pacific 4 4 $45,197 $45,197 - $46,280 - - - $45,197 $45,197 - - $46,280 - -
AssociationAmerican Society of Employers (MI) 3 4 $48,058 $52,655 - $54,877 - - - $48,058 $52,655 - - $54,877 - -Trusight (MN) - formerly EA 11 27 $54,424 $49,238 $43,260 $47,500 $53,000 - - $54,424 $49,238 $36,180 $43,260 $47,500 $53,000 $68,530Employers Resource Assoc. (OH) 8 17 $49,661 $48,047 $37,606 $47,840 $57,364 - - $49,661 $48,047 $34,703 $37,606 $47,840 $57,364 $62,943MidAtlantic Employers Assoc. (PA) 3 4 $61,494 $59,608 - $59,761 - - - $61,494 $59,608 - - $59,761 - -Mtn States Employers Council (CO) 5 12 $38,915 $40,286 $34,216 $38,564 $44,364 - - $38,915 $40,286 $33,367 $34,216 $38,564 $44,364 $52,220MRA - The Mgmt Assoc. (WI) 16 26 $47,730 $46,647 $41,510 $46,252 $52,131 - - $47,730 $46,647 $34,463 $41,510 $46,252 $52,131 $59,958
continued
(320) Customer Service Representative III (Technical Advisor)Compensation Strategy: Straight Salary
Advanced level of customer service work, typically requiring a bachelor's degree with 2+ years of experience, or equivalent. Handles the more technical or complex service questions from customers and applies judgment in resolving service, warranty or technical problems falling within established limits of authority and knowledge. Issues of greater impact or technical complexity are researched and presented to management or referred to the appropriate internal experts for resolution. Typical customer questions are focused on account status, technical product application, or service information, pricing or adjustments. May provide work direction to others.
Effective Date:September 2010
Total CompensationBase Pay Variable Pay
National Data - Effective September 2010 183 © 2011 Employer Associations of America (EAA)

(320) Customer Service Representative III (Technical Advisor)Compensation Strategy: Straight Salary
Bonus Commission# of Orgs
# of Emp
Un-Wtd Avg
WtdAvg P25 Median P75
Wtd Annual Avg
Wtd Annual Avg
Un-Wtd Avg
WtdAvg P10 P25 Median P75 P90
Customer TypeIndustry 29 52 $52,298 $50,049 $41,720 $48,490 $56,535 - - $52,298 $50,049 $36,712 $41,720 $48,490 $56,535 $64,977Distributors/Wholesalers 15 34 $44,412 $45,031 $42,390 $44,291 $49,071 - - $44,412 $45,031 $33,852 $42,390 $44,291 $49,071 $53,636Retailers 4 7 $47,739 $45,703 - $42,328 - - - $47,739 $45,703 - - $42,328 - -Consumers 9 12 $46,061 $45,011 $35,600 $43,725 $51,017 - - $46,061 $45,011 $33,771 $35,600 $43,725 $51,017 $63,073
IndustryNon-Durable Goods Manufacturing 9 25 $44,377 $44,099 $38,564 $44,138 $47,752 - - $44,377 $44,099 $33,803 $38,564 $44,138 $47,752 $52,959Durable Goods Manufacturing 31 47 $50,187 $49,728 $41,538 $51,023 $55,140 - - $50,187 $49,728 $34,813 $41,538 $51,023 $55,140 $63,348Wholesale and Retail Trade 11 22 $48,578 $47,643 $40,580 $44,729 $50,316 - - $48,578 $47,643 $33,865 $40,580 $44,729 $50,316 $66,991
Base Pay Variable Pay Total Compensation
National Data - Effective September 2010 184 © 2011 Employer Associations of America (EAA)
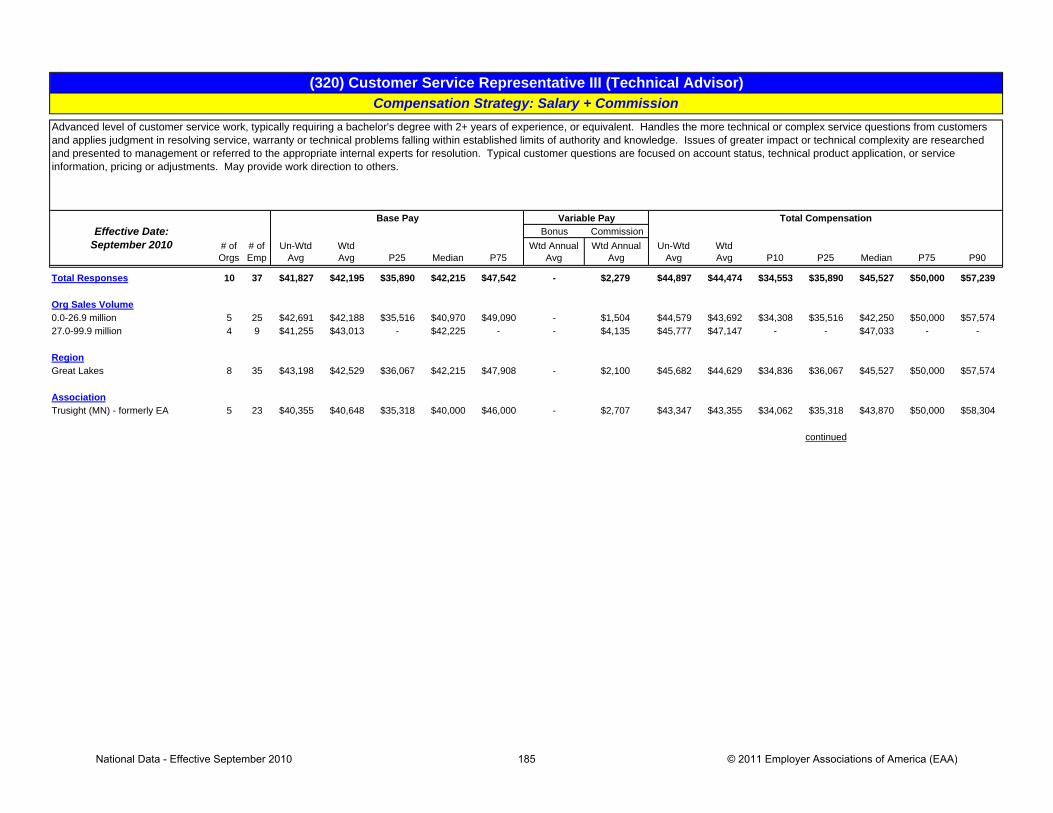
Bonus Commission# of Orgs
# of Emp
Un-Wtd Avg
WtdAvg P25 Median P75
Wtd Annual Avg
Wtd Annual Avg
Un-Wtd Avg
WtdAvg P10 P25 Median P75 P90
Total Responses 10 37 $41,827 $42,195 $35,890 $42,215 $47,542 - $2,279 $44,897 $44,474 $34,553 $35,890 $45,527 $50,000 $57,239
Org Sales Volume0.0-26.9 million 5 25 $42,691 $42,188 $35,516 $40,970 $49,090 - $1,504 $44,579 $43,692 $34,308 $35,516 $42,250 $50,000 $57,57427.0-99.9 million 4 9 $41,255 $43,013 - $42,225 - - $4,135 $45,777 $47,147 - - $47,033 - -
RegionGreat Lakes 8 35 $43,198 $42,529 $36,067 $42,215 $47,908 - $2,100 $45,682 $44,629 $34,836 $36,067 $45,527 $50,000 $57,574
AssociationTrusight (MN) - formerly EA 5 23 $40,355 $40,648 $35,318 $40,000 $46,000 - $2,707 $43,347 $43,355 $34,062 $35,318 $43,870 $50,000 $58,304
continued
Base Pay Variable Pay
(320) Customer Service Representative III (Technical Advisor)Compensation Strategy: Salary + Commission
Advanced level of customer service work, typically requiring a bachelor's degree with 2+ years of experience, or equivalent. Handles the more technical or complex service questions from customers and applies judgment in resolving service, warranty or technical problems falling within established limits of authority and knowledge. Issues of greater impact or technical complexity are researched and presented to management or referred to the appropriate internal experts for resolution. Typical customer questions are focused on account status, technical product application, or service information, pricing or adjustments. May provide work direction to others.
Effective Date:September 2010
Total Compensation
National Data - Effective September 2010 185 © 2011 Employer Associations of America (EAA)

(320) Customer Service Representative III (Technical Advisor)Compensation Strategy: Salary + Commission
Bonus Commission# of Orgs
# of Emp
Un-Wtd Avg
WtdAvg P25 Median P75
Wtd Annual Avg
Wtd Annual Avg
Un-Wtd Avg
WtdAvg P10 P25 Median P75 P90
Customer TypeIndustry 7 20 $43,980 $44,950 $41,103 $44,392 $49,108 - $2,419 $47,487 $47,369 $40,748 $43,903 $47,542 $50,446 $57,874
IndustryDurable Goods Manufacturing 3 8 $49,722 $46,408 - $44,392 - - $3,516 $52,724 $49,924 - - $48,338 - -Other Services 4 13 $39,915 $43,805 - $45,659 - - $1,564 $43,414 $45,369 - - $47,908 - -
Base Pay Variable Pay Total Compensation
National Data - Effective September 2010 186 © 2011 Employer Associations of America (EAA)
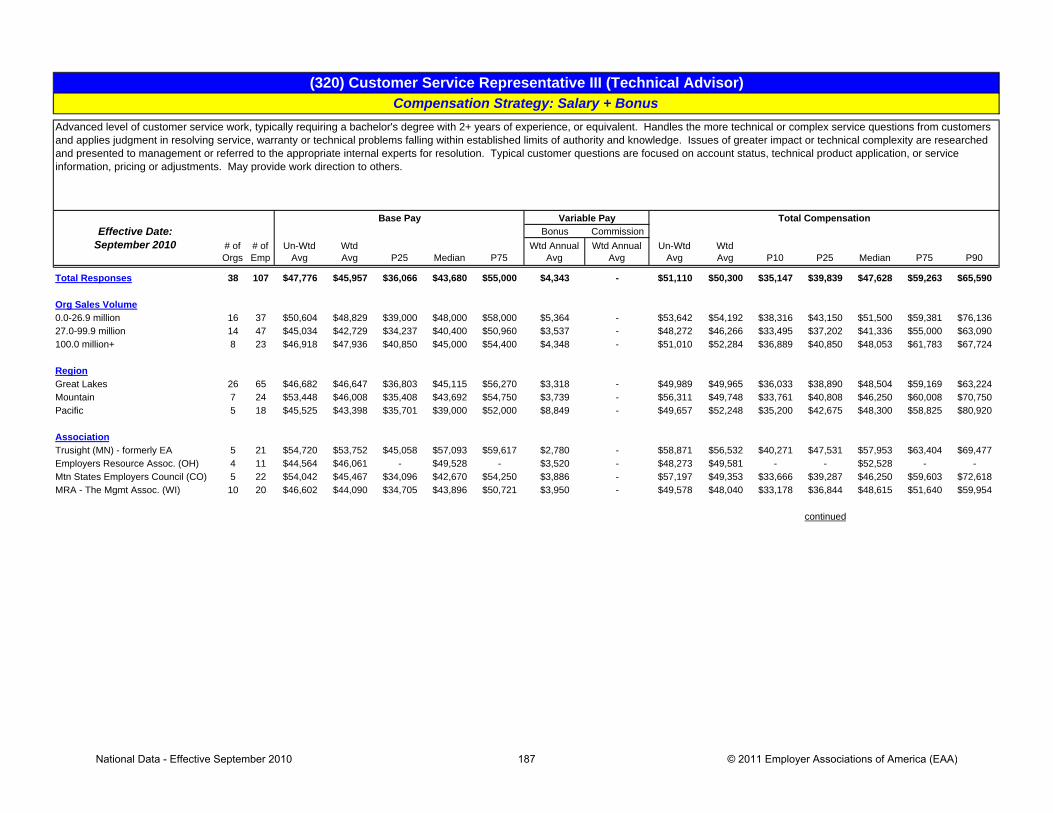
Bonus Commission# of Orgs
# of Emp
Un-Wtd Avg
WtdAvg P25 Median P75
Wtd Annual Avg
Wtd Annual Avg
Un-Wtd Avg
WtdAvg P10 P25 Median P75 P90
Total Responses 38 107 $47,776 $45,957 $36,066 $43,680 $55,000 $4,343 - $51,110 $50,300 $35,147 $39,839 $47,628 $59,263 $65,590
Org Sales Volume0.0-26.9 million 16 37 $50,604 $48,829 $39,000 $48,000 $58,000 $5,364 - $53,642 $54,192 $38,316 $43,150 $51,500 $59,381 $76,13627.0-99.9 million 14 47 $45,034 $42,729 $34,237 $40,400 $50,960 $3,537 - $48,272 $46,266 $33,495 $37,202 $41,336 $55,000 $63,090100.0 million+ 8 23 $46,918 $47,936 $40,850 $45,000 $54,400 $4,348 - $51,010 $52,284 $36,889 $40,850 $48,053 $61,783 $67,724
RegionGreat Lakes 26 65 $46,682 $46,647 $36,803 $45,115 $56,270 $3,318 - $49,989 $49,965 $36,033 $38,890 $48,504 $59,169 $63,224Mountain 7 24 $53,448 $46,008 $35,408 $43,692 $54,750 $3,739 - $56,311 $49,748 $33,761 $40,808 $46,250 $60,008 $70,750Pacific 5 18 $45,525 $43,398 $35,701 $39,000 $52,000 $8,849 - $49,657 $52,248 $35,200 $42,675 $48,300 $58,825 $80,920
AssociationTrusight (MN) - formerly EA 5 21 $54,720 $53,752 $45,058 $57,093 $59,617 $2,780 - $58,871 $56,532 $40,271 $47,531 $57,953 $63,404 $69,477Employers Resource Assoc. (OH) 4 11 $44,564 $46,061 - $49,528 - $3,520 - $48,273 $49,581 - - $52,528 - -Mtn States Employers Council (CO) 5 22 $54,042 $45,467 $34,096 $42,670 $54,250 $3,886 - $57,197 $49,353 $33,666 $39,287 $46,250 $59,603 $72,618MRA - The Mgmt Assoc. (WI) 10 20 $46,602 $44,090 $34,705 $43,896 $50,721 $3,950 - $49,578 $48,040 $33,178 $36,844 $48,615 $51,640 $59,954
continued
(320) Customer Service Representative III (Technical Advisor)Compensation Strategy: Salary + Bonus
Advanced level of customer service work, typically requiring a bachelor's degree with 2+ years of experience, or equivalent. Handles the more technical or complex service questions from customers and applies judgment in resolving service, warranty or technical problems falling within established limits of authority and knowledge. Issues of greater impact or technical complexity are researched and presented to management or referred to the appropriate internal experts for resolution. Typical customer questions are focused on account status, technical product application, or service information, pricing or adjustments. May provide work direction to others.
Effective Date:September 2010
Total CompensationBase Pay Variable Pay
National Data - Effective September 2010 187 © 2011 Employer Associations of America (EAA)

(320) Customer Service Representative III (Technical Advisor)Compensation Strategy: Salary + Bonus
Bonus Commission# of Orgs
# of Emp
Un-Wtd Avg
WtdAvg P25 Median P75
Wtd Annual Avg
Wtd Annual Avg
Un-Wtd Avg
WtdAvg P10 P25 Median P75 P90
Customer TypeIndustry 18 48 $51,885 $49,639 $39,000 $48,092 $58,725 $5,669 - $55,606 $55,307 $38,897 $43,825 $53,564 $59,885 $79,101Distributors/Wholesalers 13 34 $46,122 $45,916 $34,133 $45,115 $55,375 $3,468 - $49,583 $49,383 $33,570 $38,807 $47,803 $61,196 $63,876Retailers 4 5 $39,905 $40,814 - $40,400 - $679 - $40,688 $41,493 - - $40,700 - -Consumers 4 20 $40,020 $38,479 - $36,803 - $3,566 - $43,372 $42,045 - - $39,696 - -
IndustryNon-Durable Goods Manufacturing 10 27 $45,854 $43,217 $36,566 $43,680 $48,185 $3,214 - $48,728 $46,430 $33,192 $37,976 $47,500 $51,852 $59,674Durable Goods Manufacturing 17 31 $51,159 $51,620 $40,800 $55,000 $58,966 $2,498 - $53,888 $54,118 $35,591 $42,633 $57,093 $61,222 $68,037Wholesale and Retail Trade 4 10 $39,683 $41,018 - $35,819 - $6,867 - $45,522 $47,885 - - $39,928 - -
Base Pay Variable Pay Total Compensation
National Data - Effective September 2010 188 © 2011 Employer Associations of America (EAA)

Bonus Commission# of Orgs
# of Emp
Un-Wtd Avg
WtdAvg P25 Median P75
Wtd Annual Avg
Wtd Annual Avg
Un-Wtd Avg
WtdAvg P10 P25 Median P75 P90
Total Responses 5 16 $39,069 $37,446 $27,156 $37,100 $44,223 $736 $12,358 $54,925 $50,541 $32,427 $41,029 $46,798 $53,827 $81,789
Org Sales Volume27.0-99.9 million 4 12 $42,647 $41,676 - $40,000 - $982 $9,062 $56,906 $51,720 - - $44,553 - -
Region
Association
continued
(320) Customer Service Representative III (Technical Advisor)Compensation Strategy: Salary + Commission + Bonus
Advanced level of customer service work, typically requiring a bachelor's degree with 2+ years of experience, or equivalent. Handles the more technical or complex service questions from customers and applies judgment in resolving service, warranty or technical problems falling within established limits of authority and knowledge. Issues of greater impact or technical complexity are researched and presented to management or referred to the appropriate internal experts for resolution. Typical customer questions are focused on account status, technical product application, or service information, pricing or adjustments. May provide work direction to others.
Effective Date:September 2010
Total CompensationBase Pay Variable Pay
Insufficient Data
Insufficient Data
National Data - Effective September 2010 189 © 2011 Employer Associations of America (EAA)

(320) Customer Service Representative III (Technical Advisor)Compensation Strategy: Salary + Commission + Bonus
Bonus Commission# of Orgs
# of Emp
Un-Wtd Avg
WtdAvg P25 Median P75
Wtd Annual Avg
Wtd Annual Avg
Un-Wtd Avg
WtdAvg P10 P25 Median P75 P90
Customer TypeIndustry 5 16 $39,069 $37,446 $27,156 $37,100 $44,223 $736 $12,358 $54,925 $50,541 $32,427 $41,029 $46,798 $53,827 $81,789
Industry Insufficient Data
Base Pay Variable Pay Total Compensation
National Data - Effective September 2010 190 © 2011 Employer Associations of America (EAA)
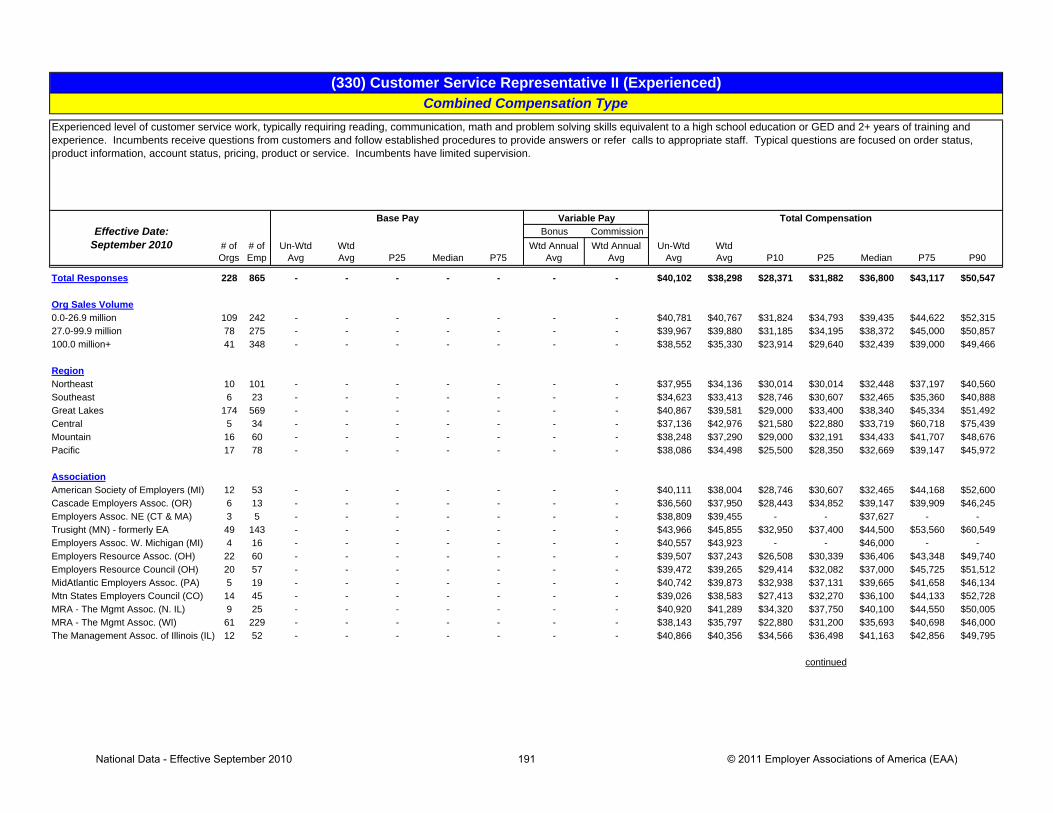
Bonus Commission# of Orgs
# of Emp
Un-Wtd Avg
WtdAvg P25 Median P75
Wtd Annual Avg
Wtd Annual Avg
Un-Wtd Avg
WtdAvg P10 P25 Median P75 P90
Total Responses 228 865 - - - - - - - $40,102 $38,298 $28,371 $31,882 $36,800 $43,117 $50,547
Org Sales Volume0.0-26.9 million 109 242 - - - - - - - $40,781 $40,767 $31,824 $34,793 $39,435 $44,622 $52,31527.0-99.9 million 78 275 - - - - - - - $39,967 $39,880 $31,185 $34,195 $38,372 $45,000 $50,857100.0 million+ 41 348 - - - - - - - $38,552 $35,330 $23,914 $29,640 $32,439 $39,000 $49,466
RegionNortheast 10 101 - - - - - - - $37,955 $34,136 $30,014 $30,014 $32,448 $37,197 $40,560Southeast 6 23 - - - - - - - $34,623 $33,413 $28,746 $30,607 $32,465 $35,360 $40,888Great Lakes 174 569 - - - - - - - $40,867 $39,581 $29,000 $33,400 $38,340 $45,334 $51,492Central 5 34 - - - - - - - $37,136 $42,976 $21,580 $22,880 $33,719 $60,718 $75,439Mountain 16 60 - - - - - - - $38,248 $37,290 $29,000 $32,191 $34,433 $41,707 $48,676Pacific 17 78 - - - - - - - $38,086 $34,498 $25,500 $28,350 $32,669 $39,147 $45,972
AssociationAmerican Society of Employers (MI) 12 53 - - - - - - - $40,111 $38,004 $28,746 $30,607 $32,465 $44,168 $52,600Cascade Employers Assoc. (OR) 6 13 - - - - - - - $36,560 $37,950 $28,443 $34,852 $39,147 $39,909 $46,245Employers Assoc. NE (CT & MA) 3 5 - - - - - - - $38,809 $39,455 - - $37,627 - -Trusight (MN) - formerly EA 49 143 - - - - - - - $43,966 $45,855 $32,950 $37,400 $44,500 $53,560 $60,549Employers Assoc. W. Michigan (MI) 4 16 - - - - - - - $40,557 $43,923 - - $46,000 - -Employers Resource Assoc. (OH) 22 60 - - - - - - - $39,507 $37,243 $26,508 $30,339 $36,406 $43,348 $49,740Employers Resource Council (OH) 20 57 - - - - - - - $39,472 $39,265 $29,414 $32,082 $37,000 $45,725 $51,512MidAtlantic Employers Assoc. (PA) 5 19 - - - - - - - $40,742 $39,873 $32,938 $37,131 $39,665 $41,658 $46,134Mtn States Employers Council (CO) 14 45 - - - - - - - $39,026 $38,583 $27,413 $32,270 $36,100 $44,133 $52,728MRA - The Mgmt Assoc. (N. IL) 9 25 - - - - - - - $40,920 $41,289 $34,320 $37,750 $40,100 $44,550 $50,005MRA - The Mgmt Assoc. (WI) 61 229 - - - - - - - $38,143 $35,797 $22,880 $31,200 $35,693 $40,698 $46,000The Management Assoc. of Illinois (IL) 12 52 - - - - - - - $40,866 $40,356 $34,566 $36,498 $41,163 $42,856 $49,795
continued
(330) Customer Service Representative II (Experienced)Combined Compensation Type
Experienced level of customer service work, typically requiring reading, communication, math and problem solving skills equivalent to a high school education or GED and 2+ years of training and experience. Incumbents receive questions from customers and follow established procedures to provide answers or refer calls to appropriate staff. Typical questions are focused on order status, product information, account status, pricing, product or service. Incumbents have limited supervision.
Effective Date:September 2010
Total CompensationBase Pay Variable Pay
National Data - Effective September 2010 191 © 2011 Employer Associations of America (EAA)
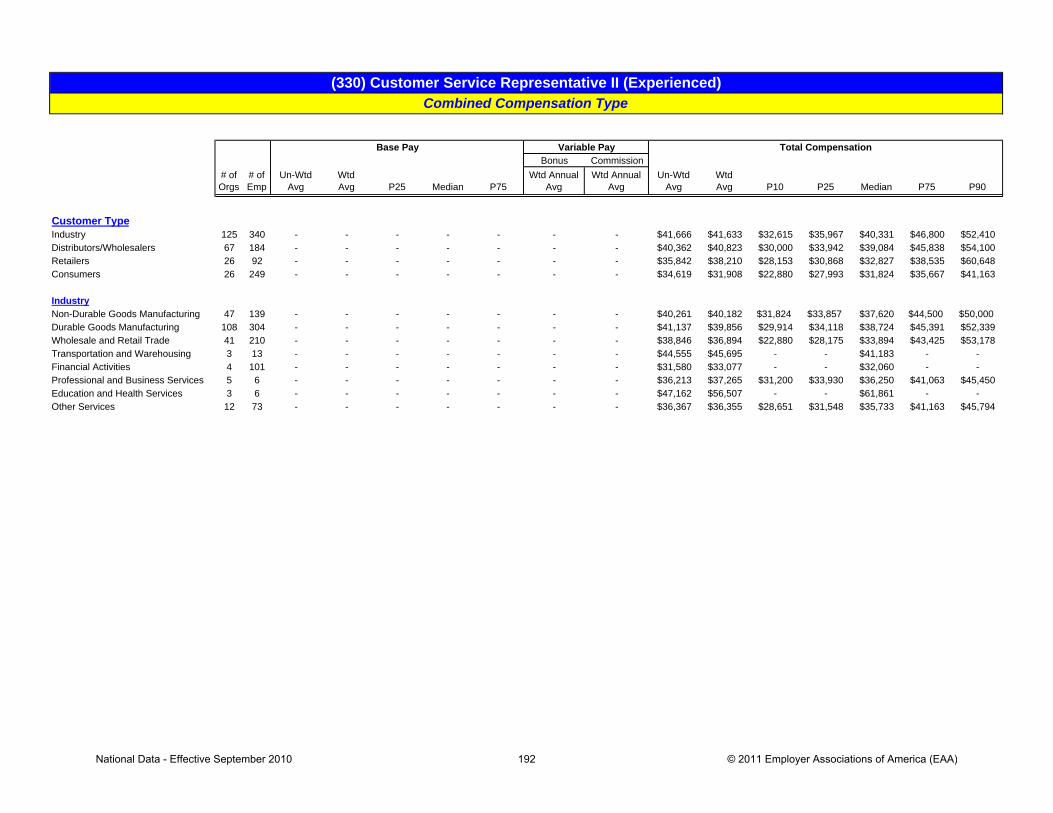
(330) Customer Service Representative II (Experienced)Combined Compensation Type
Bonus Commission# of Orgs
# of Emp
Un-Wtd Avg
WtdAvg P25 Median P75
Wtd Annual Avg
Wtd Annual Avg
Un-Wtd Avg
WtdAvg P10 P25 Median P75 P90
Customer TypeIndustry 125 340 - - - - - - - $41,666 $41,633 $32,615 $35,967 $40,331 $46,800 $52,410Distributors/Wholesalers 67 184 - - - - - - - $40,362 $40,823 $30,000 $33,942 $39,084 $45,838 $54,100Retailers 26 92 - - - - - - - $35,842 $38,210 $28,153 $30,868 $32,827 $38,535 $60,648Consumers 26 249 - - - - - - - $34,619 $31,908 $22,880 $27,993 $31,824 $35,667 $41,163
IndustryNon-Durable Goods Manufacturing 47 139 - - - - - - - $40,261 $40,182 $31,824 $33,857 $37,620 $44,500 $50,000Durable Goods Manufacturing 108 304 - - - - - - - $41,137 $39,856 $29,914 $34,118 $38,724 $45,391 $52,339Wholesale and Retail Trade 41 210 - - - - - - - $38,846 $36,894 $22,880 $28,175 $33,894 $43,425 $53,178Transportation and Warehousing 3 13 - - - - - - - $44,555 $45,695 - - $41,183 - -Financial Activities 4 101 - - - - - - - $31,580 $33,077 - - $32,060 - -Professional and Business Services 5 6 - - - - - - - $36,213 $37,265 $31,200 $33,930 $36,250 $41,063 $45,450Education and Health Services 3 6 - - - - - - - $47,162 $56,507 - - $61,861 - -Other Services 12 73 - - - - - - - $36,367 $36,355 $28,651 $31,548 $35,733 $41,163 $45,794
Base Pay Variable Pay Total Compensation
National Data - Effective September 2010 192 © 2011 Employer Associations of America (EAA)

Bonus Commission# of Orgs
# of Emp
Un-Wtd Avg
WtdAvg P25 Median P75
Wtd Annual Avg
Wtd Annual Avg
Un-Wtd Avg
WtdAvg P10 P25 Median P75 P90
Total Responses 120 423 $38,954 $36,548 $30,854 $36,050 $41,600 - - $38,954 $36,548 $24,924 $30,854 $36,050 $41,600 $48,026
Org Sales Volume0.0-26.9 million 58 133 $38,487 $38,094 $33,675 $37,000 $41,182 - - $38,487 $38,094 $31,200 $33,675 $37,000 $41,182 $47,37227.0-99.9 million 48 162 $40,099 $39,520 $34,004 $37,918 $44,967 - - $40,099 $39,520 $29,996 $34,004 $37,918 $44,967 $52,300100.0 million+ 14 128 $36,961 $31,179 $23,830 $28,620 $35,944 - - $36,961 $31,179 $22,267 $23,830 $28,620 $35,944 $46,080
RegionNortheast 6 16 $37,642 $37,863 $35,520 $37,658 $39,681 - - $37,642 $37,863 $31,482 $35,520 $37,658 $39,681 $45,309Great Lakes 92 305 $39,526 $37,507 $31,658 $36,608 $42,765 - - $39,526 $37,507 $26,333 $31,658 $36,608 $42,765 $49,176Mountain 7 19 $35,362 $36,815 $32,616 $35,500 $42,000 - - $35,362 $36,815 $29,000 $32,616 $35,500 $42,000 $47,630Pacific 12 66 $39,037 $34,119 $27,285 $32,669 $39,088 - - $39,037 $34,119 $24,960 $27,285 $32,669 $39,088 $46,188
AssociationAmerican Society of Employers (MI) 3 10 $47,579 $47,871 - $48,500 - - - $47,579 $47,871 - - $48,500 - -Trusight (MN) - formerly EA 24 64 $42,619 $43,254 $36,452 $42,377 $47,656 - - $42,619 $43,254 $32,188 $36,452 $42,377 $47,656 $56,284Employers Resource Assoc. (OH) 11 34 $39,084 $35,112 $27,739 $33,405 $41,066 - - $39,084 $35,112 $26,291 $27,739 $33,405 $41,066 $47,495Employers Resource Council (OH) 11 32 $37,532 $36,089 $31,623 $34,034 $39,674 - - $37,532 $36,089 $28,085 $31,623 $34,034 $39,674 $48,977MidAtlantic Employers Assoc. (PA) 4 17 $40,788 $39,792 - $39,198 - - - $40,788 $39,792 - - $39,198 - -Mtn States Employers Council (CO) 7 19 $35,362 $36,815 $32,616 $35,500 $42,000 - - $35,362 $36,815 $29,000 $32,616 $35,500 $42,000 $47,630MRA - The Mgmt Assoc. (N. IL) 3 8 $38,240 $38,468 - $38,750 - - - $38,240 $38,468 - - $38,750 - -MRA - The Mgmt Assoc. (WI) 36 138 $37,041 $33,134 $24,700 $33,166 $37,655 - - $37,041 $33,134 $22,614 $24,700 $33,166 $37,655 $45,000The Management Assoc. of Illinois (IL) 8 39 $40,219 $40,095 $36,358 $41,163 $43,680 - - $40,219 $40,095 $31,980 $36,358 $41,163 $43,680 $48,922
continued
(330) Customer Service Representative II (Experienced)Compensation Strategy: Straight Salary
Experienced level of customer service work, typically requiring reading, communication, math and problem solving skills equivalent to a high school education or GED and 2+ years of training and experience. Incumbents receive questions from customers and follow established procedures to provide answers or refer calls to appropriate staff. Typical questions are focused on order status, product information, account status, pricing, product or service. Incumbents have limited supervision.
Effective Date:September 2010
Total CompensationBase Pay Variable Pay
National Data - Effective September 2010 193 © 2011 Employer Associations of America (EAA)

(330) Customer Service Representative II (Experienced)Compensation Strategy: Straight Salary
Bonus Commission# of Orgs
# of Emp
Un-Wtd Avg
WtdAvg P25 Median P75
Wtd Annual Avg
Wtd Annual Avg
Un-Wtd Avg
WtdAvg P10 P25 Median P75 P90
Customer TypeIndustry 72 190 $41,025 $40,105 $34,320 $38,262 $46,000 - - $41,025 $40,105 $32,146 $34,320 $38,262 $46,000 $50,153Distributors/Wholesalers 34 101 $37,817 $38,126 $31,990 $37,000 $42,846 - - $37,817 $38,126 $28,996 $31,990 $37,000 $42,846 $49,286Retailers 8 22 $36,522 $34,431 $26,931 $31,377 $38,662 - - $36,522 $34,431 $26,524 $26,931 $31,377 $38,662 $50,350Consumers 15 110 $32,353 $29,378 $23,618 $27,859 $34,940 - - $32,353 $29,378 $21,873 $23,618 $27,859 $34,940 $41,163
IndustryNon-Durable Goods Manufacturing 23 62 $37,508 $37,057 $32,900 $34,950 $41,700 - - $37,508 $37,057 $30,528 $32,900 $34,950 $41,700 $48,031Durable Goods Manufacturing 62 178 $40,614 $38,237 $32,164 $37,000 $43,019 - - $40,614 $38,237 $28,032 $32,164 $37,000 $43,019 $51,944Wholesale and Retail Trade 20 116 $36,985 $32,700 $23,702 $31,086 $39,092 - - $36,985 $32,700 $22,073 $23,702 $31,086 $39,092 $48,451Financial Activities 3 21 $31,124 $33,565 - $32,240 - - - $31,124 $33,565 - - $32,240 - -Professional and Business Services 3 3 $34,567 $34,567 - $35,500 - - - $34,567 $34,567 - - $35,500 - -Other Services 5 32 $40,046 $41,145 $36,607 $41,163 $43,680 - - $40,046 $41,145 $34,652 $36,607 $41,163 $43,680 $46,800
Base Pay Variable Pay Total Compensation
National Data - Effective September 2010 194 © 2011 Employer Associations of America (EAA)

Bonus Commission# of Orgs
# of Emp
Un-Wtd Avg
WtdAvg P25 Median P75
Wtd Annual Avg
Wtd Annual Avg
Un-Wtd Avg
WtdAvg P10 P25 Median P75 P90
Total Responses 15 63 $37,340 $35,332 $29,120 $31,075 $40,706 - $10,798 $44,727 $46,131 $27,368 $31,473 $42,591 $59,420 $69,874
Org Sales Volume0.0-26.9 million 11 28 $38,925 $39,683 $32,095 $38,824 $47,000 - $6,386 $45,775 $46,069 $24,468 $39,793 $44,294 $57,500 $67,544
RegionGreat Lakes 9 37 $38,104 $35,878 $28,132 $31,827 $40,133 - $4,755 $43,368 $40,633 $28,515 $30,809 $38,667 $46,767 $65,436Mountain 4 10 $37,356 $35,758 - $40,020 - - $4,841 $45,419 $40,599 - - $43,016 - -
AssociationTrusight (MN) - formerly EA 3 19 $40,737 $36,626 - $30,000 - - $25,712 $55,376 $62,338 - - $60,895 - -Employers Resource Assoc. (OH) 3 6 $30,807 $30,960 - $32,822 - - $1,305 $31,958 $32,265 - - $34,150 - -Mtn States Employers Council (CO) 4 10 $37,356 $35,758 - $40,020 - - $4,841 $45,419 $40,599 - - $43,016 - -MRA - The Mgmt Assoc. (WI) 3 11 $42,797 $43,548 - $37,516 - - $8,353 $51,222 $51,901 - - $47,846 - -
continued
(330) Customer Service Representative II (Experienced)Compensation Strategy: Salary + Commission
Experienced level of customer service work, typically requiring reading, communication, math and problem solving skills equivalent to a high school education or GED and 2+ years of training and experience. Incumbents receive questions from customers and follow established procedures to provide answers or refer calls to appropriate staff. Typical questions are focused on order status, product information, account status, pricing, product or service. Incumbents have limited supervision.
Effective Date:September 2010
Total CompensationBase Pay Variable Pay
National Data - Effective September 2010 195 © 2011 Employer Associations of America (EAA)
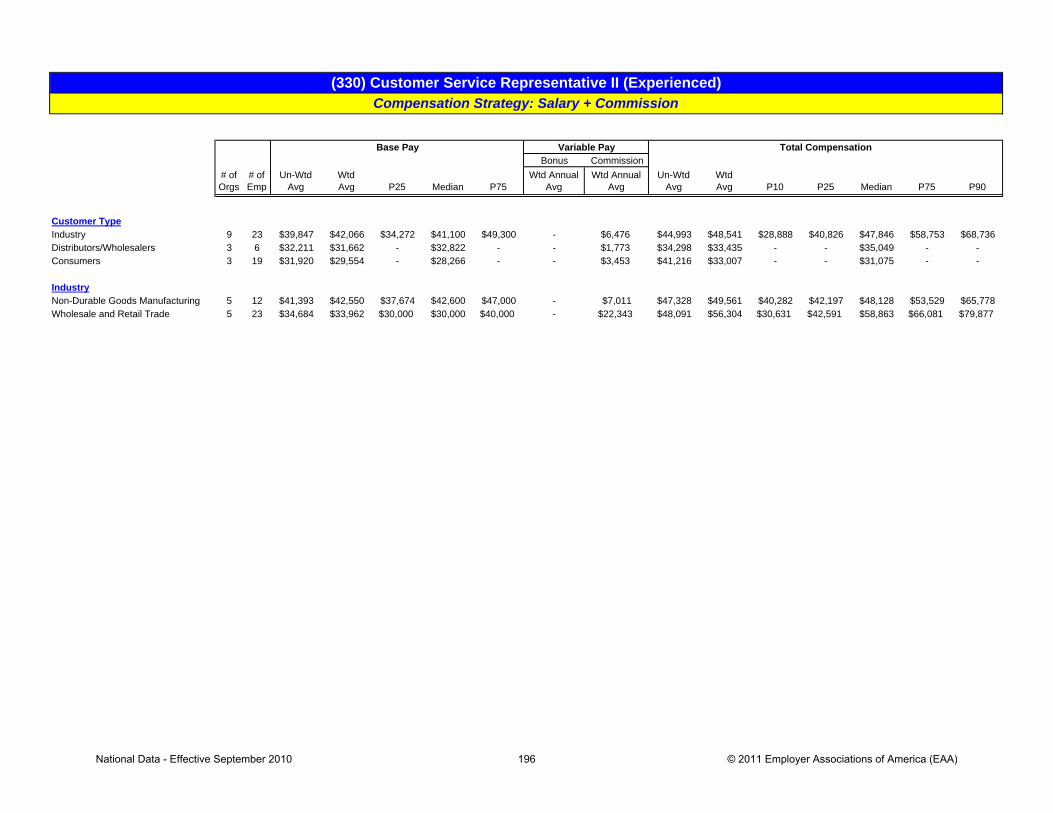
(330) Customer Service Representative II (Experienced)Compensation Strategy: Salary + Commission
Bonus Commission# of Orgs
# of Emp
Un-Wtd Avg
WtdAvg P25 Median P75
Wtd Annual Avg
Wtd Annual Avg
Un-Wtd Avg
WtdAvg P10 P25 Median P75 P90
Customer TypeIndustry 9 23 $39,847 $42,066 $34,272 $41,100 $49,300 - $6,476 $44,993 $48,541 $28,888 $40,826 $47,846 $58,753 $68,736Distributors/Wholesalers 3 6 $32,211 $31,662 - $32,822 - - $1,773 $34,298 $33,435 - - $35,049 - -Consumers 3 19 $31,920 $29,554 - $28,266 - - $3,453 $41,216 $33,007 - - $31,075 - -
IndustryNon-Durable Goods Manufacturing 5 12 $41,393 $42,550 $37,674 $42,600 $47,000 - $7,011 $47,328 $49,561 $40,282 $42,197 $48,128 $53,529 $65,778Wholesale and Retail Trade 5 23 $34,684 $33,962 $30,000 $30,000 $40,000 - $22,343 $48,091 $56,304 $30,631 $42,591 $58,863 $66,081 $79,877
Base Pay Variable Pay Total Compensation
National Data - Effective September 2010 196 © 2011 Employer Associations of America (EAA)
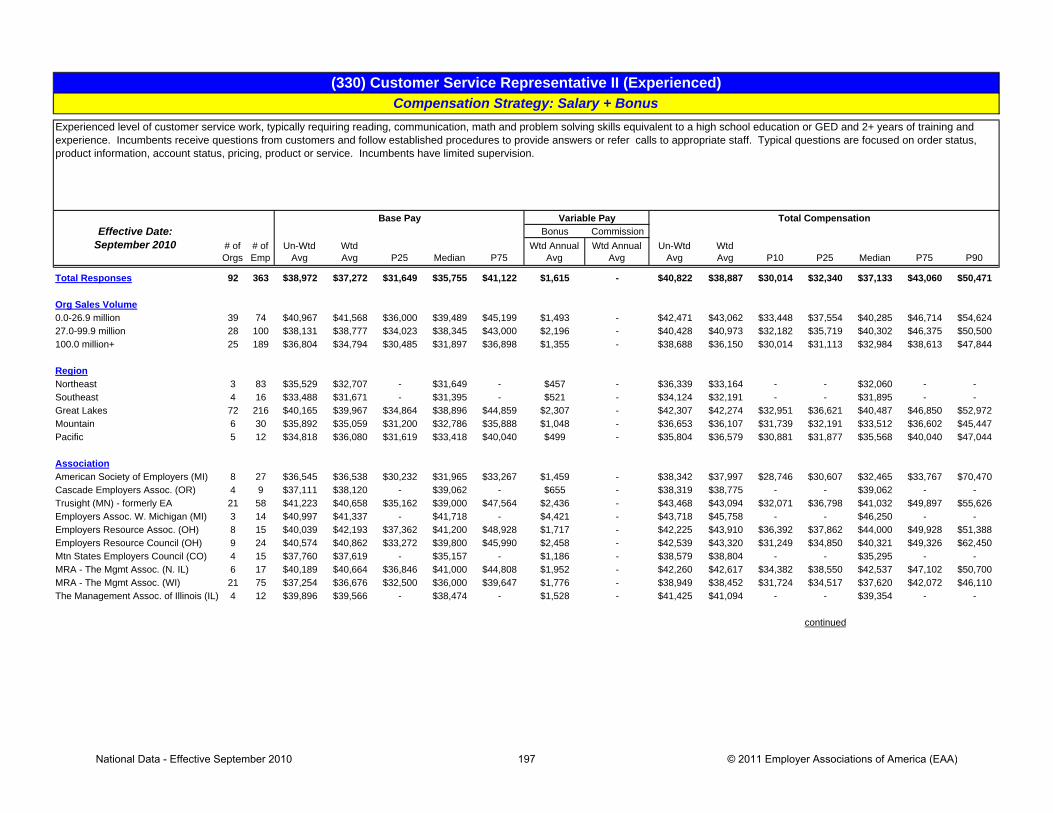
Bonus Commission# of Orgs
# of Emp
Un-Wtd Avg
WtdAvg P25 Median P75
Wtd Annual Avg
Wtd Annual Avg
Un-Wtd Avg
WtdAvg P10 P25 Median P75 P90
Total Responses 92 363 $38,972 $37,272 $31,649 $35,755 $41,122 $1,615 - $40,822 $38,887 $30,014 $32,340 $37,133 $43,060 $50,471
Org Sales Volume0.0-26.9 million 39 74 $40,967 $41,568 $36,000 $39,489 $45,199 $1,493 - $42,471 $43,062 $33,448 $37,554 $40,285 $46,714 $54,62427.0-99.9 million 28 100 $38,131 $38,777 $34,023 $38,345 $43,000 $2,196 - $40,428 $40,973 $32,182 $35,719 $40,302 $46,375 $50,500100.0 million+ 25 189 $36,804 $34,794 $30,485 $31,897 $36,898 $1,355 - $38,688 $36,150 $30,014 $31,113 $32,984 $38,613 $47,844
RegionNortheast 3 83 $35,529 $32,707 - $31,649 - $457 - $36,339 $33,164 - - $32,060 - -Southeast 4 16 $33,488 $31,671 - $31,395 - $521 - $34,124 $32,191 - - $31,895 - -Great Lakes 72 216 $40,165 $39,967 $34,864 $38,896 $44,859 $2,307 - $42,307 $42,274 $32,951 $36,621 $40,487 $46,850 $52,972Mountain 6 30 $35,892 $35,059 $31,200 $32,786 $35,888 $1,048 - $36,653 $36,107 $31,739 $32,191 $33,512 $36,602 $45,447Pacific 5 12 $34,818 $36,080 $31,619 $33,418 $40,040 $499 - $35,804 $36,579 $30,881 $31,877 $35,568 $40,040 $47,044
AssociationAmerican Society of Employers (MI) 8 27 $36,545 $36,538 $30,232 $31,965 $33,267 $1,459 - $38,342 $37,997 $28,746 $30,607 $32,465 $33,767 $70,470Cascade Employers Assoc. (OR) 4 9 $37,111 $38,120 - $39,062 - $655 - $38,319 $38,775 - - $39,062 - -Trusight (MN) - formerly EA 21 58 $41,223 $40,658 $35,162 $39,000 $47,564 $2,436 - $43,468 $43,094 $32,071 $36,798 $41,032 $49,897 $55,626Employers Assoc. W. Michigan (MI) 3 14 $40,997 $41,337 - $41,718 - $4,421 - $43,718 $45,758 - - $46,250 - -Employers Resource Assoc. (OH) 8 15 $40,039 $42,193 $37,362 $41,200 $48,928 $1,717 - $42,225 $43,910 $36,392 $37,862 $44,000 $49,928 $51,388Employers Resource Council (OH) 9 24 $40,574 $40,862 $33,272 $39,800 $45,990 $2,458 - $42,539 $43,320 $31,249 $34,850 $40,321 $49,326 $62,450Mtn States Employers Council (CO) 4 15 $37,760 $37,619 - $35,157 - $1,186 - $38,579 $38,804 - - $35,295 - -MRA - The Mgmt Assoc. (N. IL) 6 17 $40,189 $40,664 $36,846 $41,000 $44,808 $1,952 - $42,260 $42,617 $34,382 $38,550 $42,537 $47,102 $50,700MRA - The Mgmt Assoc. (WI) 21 75 $37,254 $36,676 $32,500 $36,000 $39,647 $1,776 - $38,949 $38,452 $31,724 $34,517 $37,620 $42,072 $46,110The Management Assoc. of Illinois (IL) 4 12 $39,896 $39,566 - $38,474 - $1,528 - $41,425 $41,094 - - $39,354 - -
continued
(330) Customer Service Representative II (Experienced)Compensation Strategy: Salary + Bonus
Experienced level of customer service work, typically requiring reading, communication, math and problem solving skills equivalent to a high school education or GED and 2+ years of training and experience. Incumbents receive questions from customers and follow established procedures to provide answers or refer calls to appropriate staff. Typical questions are focused on order status, product information, account status, pricing, product or service. Incumbents have limited supervision.
Effective Date:September 2010
Total CompensationBase Pay Variable Pay
National Data - Effective September 2010 197 © 2011 Employer Associations of America (EAA)

(330) Customer Service Representative II (Experienced)Compensation Strategy: Salary + Bonus
Bonus Commission# of Orgs
# of Emp
Un-Wtd Avg
WtdAvg P25 Median P75
Wtd Annual Avg
Wtd Annual Avg
Un-Wtd Avg
WtdAvg P10 P25 Median P75 P90
Customer TypeIndustry 44 117 $40,528 $40,887 $36,350 $40,000 $45,000 $1,960 - $42,259 $42,847 $35,494 $37,769 $41,194 $47,454 $52,752Distributors/Wholesalers 29 71 $40,840 $42,468 $35,157 $40,664 $47,352 $2,894 - $43,569 $45,362 $32,508 $37,174 $42,300 $49,440 $63,954Retailers 17 55 $33,162 $31,915 $30,285 $31,200 $32,927 $736 - $33,857 $32,651 $29,640 $30,994 $32,191 $33,448 $36,583Consumers 8 120 $34,823 $33,130 $30,014 $31,711 $35,114 $924 - $36,395 $34,054 $30,014 $30,014 $32,648 $36,623 $41,049
IndustryNon-Durable Goods Manufacturing 19 58 $39,751 $39,238 $33,459 $36,317 $41,050 $2,495 - $42,080 $41,734 $32,288 $35,957 $37,804 $42,752 $57,066Durable Goods Manufacturing 42 117 $40,682 $40,860 $36,194 $40,000 $45,000 $2,063 - $42,480 $42,923 $33,438 $37,664 $41,194 $47,842 $53,000Wholesale and Retail Trade 18 69 $36,344 $35,766 $30,826 $33,267 $41,009 $1,255 - $37,928 $37,021 $29,640 $31,337 $34,000 $42,797 $47,332Other Services 5 22 $32,754 $31,838 $30,805 $32,677 $35,838 $1,483 - $34,558 $33,322 $24,461 $31,851 $33,646 $36,819 $40,807
Base Pay Variable Pay Total Compensation
National Data - Effective September 2010 198 © 2011 Employer Associations of America (EAA)

Bonus Commission# of Orgs
# of Emp
Un-Wtd Avg
WtdAvg P25 Median P75
Wtd Annual Avg
Wtd Annual Avg
Un-Wtd Avg
WtdAvg P10 P25 Median P75 P90
Total Responses 8 16 $37,488 $36,741 $29,952 $38,426 $41,821 $1,482 $2,113 $41,456 $40,336 $29,715 $33,191 $42,105 $44,734 $51,627
Org Sales Volume0.0-26.9 million 5 7 $40,636 $41,844 $39,852 $41,600 $44,933 $1,450 $2,771 $45,048 $46,065 $35,720 $43,600 $44,790 $48,706 $58,44327.0-99.9 million 3 9 $32,241 $32,772 - $32,756 - $1,506 $1,601 $35,469 $35,880 - - $35,665 - -
RegionGreat Lakes 5 11 $38,374 $37,608 $29,953 $37,000 $42,500 $1,932 $1,141 $41,671 $40,681 $30,608 $35,665 $41,108 $44,488 $56,081
Association
continued
Base Pay Variable Pay
Insufficient Data
(330) Customer Service Representative II (Experienced)Compensation Strategy: Salary + Commission + Bonus
Experienced level of customer service work, typically requiring reading, communication, math and problem solving skills equivalent to a high school education or GED and 2+ years of training and experience. Incumbents receive questions from customers and follow established procedures to provide answers or refer calls to appropriate staff. Typical questions are focused on order status, product information, account status, pricing, product or service. Incumbents have limited supervision.
Effective Date:September 2010
Total Compensation
National Data - Effective September 2010 199 © 2011 Employer Associations of America (EAA)

(330) Customer Service Representative II (Experienced)Compensation Strategy: Salary + Commission + Bonus
Bonus Commission# of Orgs
# of Emp
Un-Wtd Avg
WtdAvg P25 Median P75
Wtd Annual Avg
Wtd Annual Avg
Un-Wtd Avg
WtdAvg P10 P25 Median P75 P90
Customer TypeIndustry 6 10 $36,570 $36,522 $29,039 $39,926 $41,674 $1,356 $2,712 $40,919 $40,590 $28,907 $34,580 $43,351 $44,622 $48,314
IndustryNon-Durable Goods Manufacturing 3 7 $37,603 $35,056 - $33,080 - $1,121 $2,746 $42,328 $38,923 - - $36,201 - -
Base Pay Variable Pay Total Compensation
National Data - Effective September 2010 200 © 2011 Employer Associations of America (EAA)

Bonus Commission# of Orgs
# of Emp
Un-Wtd Avg
WtdAvg P25 Median P75
Wtd Annual Avg
Wtd Annual Avg
Un-Wtd Avg
WtdAvg P10 P25 Median P75 P90
Total Responses 84 439 - - - - - - - $31,950 $31,224 $21,840 $26,790 $31,200 $36,358 $39,594
Org Sales Volume0.0-26.9 million 35 97 - - - - - - - $32,117 $33,126 $26,000 $29,380 $34,798 $36,358 $36,63427.0-99.9 million 29 163 - - - - - - - $31,667 $30,100 $23,920 $27,000 $29,328 $32,263 $38,017100.0 million+ 20 179 - - - - - - - $32,068 $31,216 $19,240 $22,364 $32,014 $36,400 $42,874
RegionGreat Lakes 63 361 - - - - - - - $32,325 $32,185 $23,149 $28,068 $32,014 $36,358 $40,078Mountain 6 18 - - - - - - - $32,211 $29,872 $22,326 $27,537 $29,110 $31,721 $38,615Pacific 9 12 - - - - - - - $30,290 $29,364 $24,972 $25,282 $28,494 $32,732 $37,085
AssociationTrusight (MN) - formerly EA 18 142 - - - - - - - $34,127 $34,382 $24,440 $29,521 $33,409 $39,506 $44,251Employers Resource Assoc. (OH) 8 56 - - - - - - - $30,106 $30,093 $23,920 $25,982 $29,986 $33,000 $37,368Employers Resource Council (OH) 10 23 - - - - - - - $34,781 $33,521 $25,324 $29,120 $32,004 $38,088 $44,107Mtn States Employers Council (CO) 6 18 - - - - - - - $32,211 $29,872 $22,326 $27,537 $29,110 $31,721 $38,615MRA - The Mgmt Assoc. (N. IL) 4 30 - - - - - - - $35,302 $30,342 - - $29,380 - -MRA - The Mgmt Assoc. (WI) 20 100 - - - - - - - $29,487 $25,985 $18,398 $19,900 $23,867 $31,275 $35,218The Management Assoc. of Illinois (IL) 5 51 - - - - - - - $31,584 $34,595 $27,165 $34,798 $36,358 $36,358 $36,358
continued
Base Pay Variable Pay
(350) Customer Service Representative I (Entry Level)Combined Compensation Type
First level of customer service work, typically requiring reading, communication, math and problem solving skills equivalent to a high school education or GED and no previous experience. Incumbents receive questions from customer and follow established procedures to provide answers or refer calls to appropriate staff. Typical questions are focused on order status, product information, account status, pricing, product or service. Incumbents follow established procedures and have readily available supervision.
Effective Date:September 2010
Total Compensation
National Data - Effective September 2010 201 © 2011 Employer Associations of America (EAA)

(350) Customer Service Representative I (Entry Level)Combined Compensation Type
Bonus Commission# of Orgs
# of Emp
Un-Wtd Avg
WtdAvg P25 Median P75
Wtd Annual Avg
Wtd Annual Avg
Un-Wtd Avg
WtdAvg P10 P25 Median P75 P90
Customer TypeIndustry 41 123 - - - - - - - $32,074 $31,449 $23,952 $27,248 $30,900 $35,054 $39,703Distributors/Wholesalers 26 133 - - - - - - - $33,317 $34,453 $23,394 $30,042 $33,388 $37,995 $45,196Retailers 7 13 - - - - - - - $31,890 $29,938 $21,898 $24,814 $29,220 $35,911 $39,921Consumers 13 170 - - - - - - - $28,886 $28,633 $19,240 $23,239 $29,120 $34,798 $36,358
IndustryNon-Durable Goods Manufacturing 14 48 - - - - - - - $33,795 $33,402 $27,576 $31,048 $32,771 $36,459 $39,997Durable Goods Manufacturing 36 97 - - - - - - - $32,728 $31,786 $23,014 $27,265 $31,220 $35,078 $41,623Wholesale and Retail Trade 19 112 - - - - - - - $31,336 $27,622 $19,240 $20,140 $28,340 $31,743 $38,485Transportation and Warehousing 3 51 - - - - - - - $32,011 $38,051 - - $36,400 - -Other Services 4 50 - - - - - - - $29,645 $34,065 - - $36,358 - -
Base Pay Variable Pay Total Compensation
National Data - Effective September 2010 202 © 2011 Employer Associations of America (EAA)

Bonus Commission# of Orgs
# of Emp
Un-Wtd Avg
WtdAvg P25 Median P75
Wtd Annual Avg
Wtd Annual Avg
Un-Wtd Avg
WtdAvg P10 P25 Median P75 P90
Total Responses 44 239 $30,347 $28,582 $23,169 $28,621 $34,798 - - $30,347 $28,582 $19,635 $23,169 $28,621 $34,798 $36,358
Org Sales Volume0.0-26.9 million 14 63 $29,253 $33,311 $31,200 $36,358 $36,358 - - $29,253 $33,311 $26,416 $31,200 $36,358 $36,358 $36,35827.0-99.9 million 20 103 $31,625 $28,903 $26,125 $28,683 $30,472 - - $31,625 $28,903 $22,942 $26,125 $28,683 $30,472 $35,877100.0 million+ 10 73 $29,324 $24,050 $19,240 $21,840 $24,866 - - $29,324 $24,050 $17,680 $19,240 $21,840 $24,866 $35,860
RegionGreat Lakes 32 178 $30,578 $29,629 $24,266 $29,443 $36,358 - - $30,578 $29,629 $20,800 $24,266 $29,443 $36,358 $36,358Pacific 5 6 $31,603 $30,503 $25,022 $30,713 $34,451 - - $31,603 $30,503 $24,960 $25,022 $30,713 $34,451 $38,480
AssociationTrusight (MN) - formerly EA 7 38 $34,138 $29,679 $24,310 $27,851 $34,877 - - $34,138 $29,679 $22,277 $24,310 $27,851 $34,877 $38,395Employers Resource Assoc. (OH) 5 22 $28,130 $28,491 $23,920 $25,012 $33,462 - - $28,130 $28,491 $22,298 $23,920 $25,012 $33,462 $40,970Employers Resource Council (OH) 5 11 $35,668 $33,346 $29,120 $32,004 $38,511 - - $35,668 $33,346 $25,142 $29,120 $32,004 $38,511 $43,306MRA - The Mgmt Assoc. (WI) 13 74 $27,088 $23,206 $19,240 $21,840 $26,161 - - $27,088 $23,206 $17,680 $19,240 $21,840 $26,161 $31,050The Management Assoc. of Illinois (IL) 3 49 $31,547 $34,715 - $36,358 - - - $31,547 $34,715 - - $36,358 - -
continued
(350) Customer Service Representative I (Entry Level)Compensation Strategy: Straight Salary
First level of customer service work, typically requiring reading, communication, math and problem solving skills equivalent to a high school education or GED and no previous experience. Incumbents receive questions from customer and follow established procedures to provide answers or refer calls to appropriate staff. Typical questions are focused on order status, product information, account status, pricing, product or service. Incumbents follow established procedures and have readily available supervision.
Effective Date:September 2010
Total CompensationBase Pay Variable Pay
National Data - Effective September 2010 203 © 2011 Employer Associations of America (EAA)

(350) Customer Service Representative I (Entry Level)Compensation Strategy: Straight Salary
Bonus Commission# of Orgs
# of Emp
Un-Wtd Avg
WtdAvg P25 Median P75
Wtd Annual Avg
Wtd Annual Avg
Un-Wtd Avg
WtdAvg P10 P25 Median P75 P90
Customer TypeIndustry 21 60 $31,301 $29,110 $26,031 $27,851 $31,201 - - $31,301 $29,110 $22,343 $26,031 $27,851 $31,201 $38,290Distributors/Wholesalers 12 45 $31,368 $29,878 $23,169 $31,220 $35,088 - - $31,368 $29,878 $21,840 $23,169 $31,220 $35,088 $39,187Retailers 3 7 $28,900 $26,068 - $24,960 - - - $28,900 $26,068 - - $24,960 - -Consumers 8 127 $26,854 $28,013 $21,382 $28,642 $36,358 - - $26,854 $28,013 $19,240 $21,382 $28,642 $36,358 $36,358
IndustryNon-Durable Goods Manufacturing 5 9 $31,510 $31,813 $25,522 $31,750 $37,850 - - $31,510 $31,813 $24,960 $25,522 $31,750 $37,850 $39,963Durable Goods Manufacturing 18 48 $30,860 $29,326 $23,225 $29,834 $32,886 - - $30,860 $29,326 $21,840 $23,225 $29,834 $32,886 $38,732Wholesale and Retail Trade 14 95 $29,964 $26,001 $19,635 $26,936 $29,656 - - $29,964 $26,001 $18,054 $19,635 $26,936 $29,656 $35,320
Base Pay Variable Pay Total Compensation
National Data - Effective September 2010 204 © 2011 Employer Associations of America (EAA)

Bonus Commission# of Orgs
# of Emp
Un-Wtd Avg
WtdAvg P25 Median P75
Wtd Annual Avg
Wtd Annual Avg
Un-Wtd Avg
WtdAvg P10 P25 Median P75 P90
Total Responses 3 6 $29,156 $28,361 - $28,839 - - $3,642 $35,289 $32,003 - - $30,003 - -
Org Sales Volume
Region
Association
continued
Insufficient Data
Insufficient Data
Insufficient Data
(350) Customer Service Representative I (Entry Level)Compensation Strategy: Salary + Commission
First level of customer service work, typically requiring reading, communication, math and problem solving skills equivalent to a high school education or GED and no previous experience. Incumbents receive questions from customer and follow established procedures to provide answers or refer calls to appropriate staff. Typical questions are focused on order status, product information, account status, pricing, product or service. Incumbents follow established procedures and have readily available supervision.
Effective Date:September 2010
Total CompensationBase Pay Variable Pay
National Data - Effective September 2010 205 © 2011 Employer Associations of America (EAA)

(350) Customer Service Representative I (Entry Level)Compensation Strategy: Salary + Commission
Bonus Commission# of Orgs
# of Emp
Un-Wtd Avg
WtdAvg P25 Median P75
Wtd Annual Avg
Wtd Annual Avg
Un-Wtd Avg
WtdAvg P10 P25 Median P75 P90
Customer Type
Industry
Variable Pay
Insufficient Data
Insufficient Data
Base Pay Total Compensation
National Data - Effective September 2010 206 © 2011 Employer Associations of America (EAA)

Bonus Commission# of Orgs
# of Emp
Un-Wtd Avg
WtdAvg P25 Median P75
Wtd Annual Avg
Wtd Annual Avg
Un-Wtd Avg
WtdAvg P10 P25 Median P75 P90
Total Responses 34 190 $32,182 $33,059 $29,120 $31,970 $36,416 $1,447 - $33,608 $34,506 $27,769 $30,150 $33,374 $37,524 $43,091
Org Sales Volume0.0-26.9 million 16 26 $32,732 $32,097 $29,120 $31,200 $35,176 $974 - $34,119 $33,071 $25,700 $29,120 $32,130 $36,678 $40,25527.0-99.9 million 8 58 $29,959 $30,903 $27,451 $29,661 $34,034 $1,240 - $31,081 $32,143 $26,431 $29,081 $31,152 $35,421 $39,612100.0 million+ 10 106 $33,080 $34,475 $31,200 $33,332 $37,497 $1,677 - $34,812 $36,152 $29,199 $31,559 $34,586 $39,581 $46,798
RegionGreat Lakes 28 176 $33,232 $33,417 $30,066 $32,594 $36,962 $1,499 - $34,723 $34,916 $28,408 $31,137 $33,460 $37,615 $43,615Mountain 3 9 $29,439 $30,006 - $29,120 - $608 - $29,895 $30,614 - - $29,270 - -Pacific 3 5 $25,125 $25,950 - $26,754 - $1,155 - $26,921 $27,105 - - $27,142 - -
AssociationTrusight (MN) - formerly EA 10 99 $32,788 $34,703 $31,200 $33,384 $38,868 $1,744 - $34,323 $36,448 $28,080 $31,500 $35,054 $40,398 $46,745Employers Resource Assoc. (OH) 3 34 $32,142 $29,701 - $29,422 - $1,429 - $33,398 $31,129 - - $30,351 - -Employers Resource Council (OH) 4 11 $34,853 $33,431 - $30,600 - $1,160 - $36,448 $34,591 - - $32,130 - -Mtn States Employers Council (CO) 3 9 $29,439 $30,006 - $29,120 - $608 - $29,895 $30,614 - - $29,270 - -MRA - The Mgmt Assoc. (N. IL) 3 5 $35,870 $35,767 - $35,114 - $904 - $37,377 $36,671 - - $35,114 - -MRA - The Mgmt Assoc. (WI) 7 26 $32,270 $32,927 $28,975 $33,772 $35,001 $969 - $33,944 $33,896 $29,092 $30,942 $34,630 $35,547 $38,150
continued
(350) Customer Service Representative I (Entry Level)Compensation Strategy: Salary + Bonus
First level of customer service work, typically requiring reading, communication, math and problem solving skills equivalent to a high school education or GED and no previous experience. Incumbents receive questions from customer and follow established procedures to provide answers or refer calls to appropriate staff. Typical questions are focused on order status, product information, account status, pricing, product or service. Incumbents follow established procedures and have readily available supervision.
Effective Date:September 2010
Total CompensationBase Pay Variable Pay
National Data - Effective September 2010 207 © 2011 Employer Associations of America (EAA)

(350) Customer Service Representative I (Entry Level)Compensation Strategy: Salary + Bonus
Bonus Commission# of Orgs
# of Emp
Un-Wtd Avg
WtdAvg P25 Median P75
Wtd Annual Avg
Wtd Annual Avg
Un-Wtd Avg
WtdAvg P10 P25 Median P75 P90
Customer TypeIndustry 15 55 $31,963 $32,957 $30,035 $32,136 $36,961 $1,183 - $33,331 $34,140 $27,509 $30,641 $33,496 $37,753 $41,089Distributors/Wholesalers 14 88 $33,349 $35,093 $30,867 $34,496 $38,399 $1,699 - $34,987 $36,792 $29,266 $31,200 $35,006 $40,325 $48,391Retailers 4 6 $33,390 $33,911 - $32,313 - $541 - $34,132 $34,452 - - $33,240 - -Consumers 4 41 $26,869 $28,705 - $28,621 - $1,395 - $28,141 $30,099 - - $30,012 - -
IndustryNon-Durable Goods Manufacturing 8 38 $32,915 $32,286 $30,207 $31,970 $34,490 $1,311 - $34,409 $33,597 $29,265 $31,300 $33,040 $36,145 $39,689Durable Goods Manufacturing 15 43 $34,027 $33,821 $30,180 $33,966 $36,962 $962 - $35,266 $34,783 $28,596 $30,641 $34,601 $37,519 $43,803Wholesale and Retail Trade 4 16 $31,542 $35,053 - $36,760 - $1,044 - $32,484 $36,097 - - $37,851 - -
Base Pay Variable Pay Total Compensation
National Data - Effective September 2010 208 © 2011 Employer Associations of America (EAA)

Bonus Commission# of Orgs
# of Emp
Un-Wtd Avg
WtdAvg P25 Median P75
Wtd Annual Avg
Wtd Annual Avg
Un-Wtd Avg
WtdAvg P10 P25 Median P75 P90
Total Responses 4 4 $31,450 $31,450 - $31,500 - $110 $393 $31,952 $31,952 - - $31,915 - -
Org Sales Volume0.0-26.9 million 3 3 $30,933 $30,933 - $30,000 - $100 $293 $31,327 $31,327 - - $30,000 - -
Region
Association
continued
(350) Customer Service Representative I (Entry Level)Compensation Strategy: Salary + Commission + Bonus
First level of customer service work, typically requiring reading, communication, math and problem solving skills equivalent to a high school education or GED and no previous experience. Incumbents receive questions from customer and follow established procedures to provide answers or refer calls to appropriate staff. Typical questions are focused on order status, product information, account status, pricing, product or service. Incumbents follow established procedures and have readily available supervision.
Effective Date:September 2010
Total CompensationBase Pay Variable Pay
Insufficient Data
Insufficient Data
National Data - Effective September 2010 209 © 2011 Employer Associations of America (EAA)

(350) Customer Service Representative I (Entry Level)Compensation Strategy: Salary + Commission + Bonus
Bonus Commission# of Orgs
# of Emp
Un-Wtd Avg
WtdAvg P25 Median P75
Wtd Annual Avg
Wtd Annual Avg
Un-Wtd Avg
WtdAvg P10 P25 Median P75 P90
Customer TypeIndustry 3 3 $31,933 $31,933 - $33,000 - $146 $524 $32,603 $32,603 - - $33,830 - -
Industry Insufficient Data
Base Pay Variable Pay Total Compensation
National Data - Effective September 2010 210 © 2011 Employer Associations of America (EAA)

Frequency Percent
Determined from gross sales dollars only: 46 20%Based on gross margin rather than gross sales, or both: 18 8%Based on net margin: 10 4%Based on reaching various goals rather than on individual sales dollars or a combination of goals and sales dollars: 70 30%Combination of any of the above : 86 37%
Determined from gross sales dollars only: 14 26%Based on gross margin rather than gross sales, or both: 5 9%Based on net margin: 0 0%Based on reaching various goals rather than on individual sales dollars or a combination of goals and sales dollars: 18 33%Combination of any of the above : 18 33%
Determined from gross sales dollars only: 23 17%Based on gross margin rather than gross sales, or both: 11 8%Based on net margin: 5 4%Based on reaching various goals rather than on individual sales dollars or a combination of goals and sales dollars: 37 27%Combination of any of the above : 59 44%
Determined from gross sales dollars only: 47 20%Based on gross margin rather than gross sales, or both: 24 10%Based on net margin: 10 4%Based on reaching various goals rather than on individual sales dollars or a combination of goals and sales dollars: 63 27%Combination of any of the above : 93 39%
Determined from gross sales dollars only: 24 23%Based on gross margin rather than gross sales, or both: 10 10%Based on net margin: 2 2%Based on reaching various goals rather than on individual sales dollars or a combination of goals and sales dollars: 22 21%Combination of any of the above : 45 44%
Determined from gross sales dollars only: 7 35%Based on gross margin rather than gross sales, or both: 2 10%Based on net margin: 0 0%Based on reaching various goals rather than on individual sales dollars or a combination of goals and sales dollars: 5 25%Combination of any of the above : 6 30%
PART II: COMMISSION & BONUS PLAN SUMMARIES
COMMISSION & BONUS PLAN SUMMARY - SALES MANAGEMENT
SALES MANAGEMENT: Basis of determining bonus and/or commissionTop Sales Executive
Int'l. Sales Manager
Sales Trainer
General Sales Manager
Sales Manager
District Sales Manager
National Data - Effective September 2010 211 © 2011 Employer Associations of America (EAA)

Frequency Percent
Incentive pay is determined only after reaching a minimum quota or goal: 72 51%Commission is a straight percentage of sales: 16 11%Different commission percentages or bonuses are paid for various products or services: 21 15%Graduated or Variable commission plan: 15 11%Incentive plan has a cap on earnings for this individual.: 16 11%
Incentive pay is determined only after reaching a minimum quota or goal: 17 41%Commission is a straight percentage of sales: 8 19%Different commission percentages or bonuses are paid for various products or services: 10 24%Graduated or Variable commission plan: 5 12%Incentive plan has a cap on earnings for this individual.: 2 5%
Incentive pay is determined only after reaching a minimum quota or goal: 48 43%Commission is a straight percentage of sales: 14 13%Different commission percentages or bonuses are paid for various products or services: 30 27%Graduated or Variable commission plan: 10 9%Incentive plan has a cap on earnings for this individual.: 9 8%
Incentive pay is determined only after reaching a minimum quota or goal: 66 35%Commission is a straight percentage of sales: 25 13%Different commission percentages or bonuses are paid for various products or services: 51 27%Graduated or Variable commission plan: 34 18%Incentive plan has a cap on earnings for this individual.: 11 6%
Incentive pay is determined only after reaching a minimum quota or goal: 32 40%Commission is a straight percentage of sales: 19 24%Different commission percentages or bonuses are paid for various products or services: 15 19%Graduated or Variable commission plan: 9 11%Incentive plan has a cap on earnings for this individual.: 5 6%
Incentive pay is determined only after reaching a minimum quota or goal: 6 38%Commission is a straight percentage of sales: 5 31%Different commission percentages or bonuses are paid for various products or services: 4 25%Graduated or Variable commission plan: 1 6%Incentive plan has a cap on earnings for this individual.: 0 0%
COMMISSION & BONUS PLAN SUMMARY - SALES MANAGEMENT
SALES MANAGEMENT: General sales compensation information
Int'l. Sales Manager
General Sales Manager
Sales Manager
District Sales Manager
Sales Trainer
Top Sales Executive
National Data - Effective September 2010 212 © 2011 Employer Associations of America (EAA)

Frequency Percent
At time of order: 10 7%When shipped: 44 33%When customer is invoiced: 31 23%When customer pays: 23 17%Combination of any of the above : 26 19%
At time of order: 2 5%When shipped: 9 23%When customer is invoiced: 11 28%When customer pays: 12 30%Combination of any of the above : 6 15%
At time of order: 3 3%When shipped: 33 31%When customer is invoiced: 26 24%When customer pays: 23 21%Combination of any of the above : 23 21%
At time of order: 14 8%When shipped: 57 31%When customer is invoiced: 49 27%When customer pays: 30 16%Combination of any of the above : 35 19%
At time of order: 7 9%When shipped: 23 31%When customer is invoiced: 13 17%When customer pays: 15 20%Combination of any of the above : 17 23%
At time of order: 2 11%When shipped: 6 33%When customer is invoiced: 4 22%When customer pays: 4 22%Combination of any of the above : 2 11%
SALES MANAGEMENT: For Commission, incentive or pay purposes, this person is credited with sale:
COMMISSION & BONUS PLAN SUMMARY - SALES MANAGEMENT
Top Sales Executive
Sales Manager
District Sales Manager
Int'l. Sales Manager
General Sales Manager
Sales Trainer
National Data - Effective September 2010 213 © 2011 Employer Associations of America (EAA)

Frequency Percent
Sales of salespersons and/or manufacturing or dealers/distributors reporting to this position: 44 31%Profits on sales of salespersons and/or manufacturing or dealers/distributors reporting to this position: 16 11%Personal sales of the incumbent: 13 9%Combination of any of the above : 70 49%
Sales of salespersons and/or manufacturing or dealers/distributors reporting to this position: 12 29%Profits on sales of salespersons and/or manufacturing or dealers/distributors reporting to this position: 3 7%Personal sales of the incumbent: 7 17%Combination of any of the above : 19 46%
Sales of salespersons and/or manufacturing or dealers/distributors reporting to this position: 32 32%Profits on sales of salespersons and/or manufacturing or dealers/distributors reporting to this position: 12 12%Personal sales of the incumbent: 10 10%Combination of any of the above : 47 47%
Sales of salespersons and/or manufacturing or dealers/distributors reporting to this position: 47 27%Profits on sales of salespersons and/or manufacturing or dealers/distributors reporting to this position: 28 16%Personal sales of the incumbent: 19 11%Combination of any of the above : 79 46%
Sales of salespersons and/or manufacturing or dealers/distributors reporting to this position: 23 34%Profits on sales of salespersons and/or manufacturing or dealers/distributors reporting to this position: 4 6%Personal sales of the incumbent: 11 16%Combination of any of the above : 29 43%
Sales of salespersons and/or manufacturing or dealers/distributors reporting to this position: 2 18%Profits on sales of salespersons and/or manufacturing or dealers/distributors reporting to this position: 3 27%Personal sales of the incumbent: 4 36%Combination of any of the above : 2 18%
COMMISSION & BONUS PLAN SUMMARY - SALES MANAGEMENT
General Sales Manager
Sales Manager
Int'l. Sales Manager
District Sales Manager
SALES MANAGEMENT: What are incentive earnings based solely on?Top Sales Executive
Sales Trainer
National Data - Effective September 2010 214 © 2011 Employer Associations of America (EAA)

Frequency Percent
Determined from gross sales dollars only: 10 20%Based on gross margin rather than gross sales, or both: 3 6%Based on net margin: 2 4%Based on reaching various goals rather than on individual sales dollars or a combination of goals and sales dollars: 8 16%Combination of any of the above : 27 54%
Determined from gross sales dollars only: 41 32%Based on gross margin rather than gross sales, or both: 13 10%Based on net margin: 1 1%Based on reaching various goals rather than on individual sales dollars or a combination of goals and sales dollars: 23 18%Combination of any of the above : 49 39%
Determined from gross sales dollars only: 22 31%Based on gross margin rather than gross sales, or both: 13 19%Based on net margin: 1 1%Based on reaching various goals rather than on individual sales dollars or a combination of goals and sales dollars: 12 17%Combination of any of the above : 22 31%
Determined from gross sales dollars only: 56 29%Based on gross margin rather than gross sales, or both: 33 17%Based on net margin: 9 5%Based on reaching various goals rather than on individual sales dollars or a combination of goals and sales dollars: 41 21%Combination of any of the above : 57 29%
Determined from gross sales dollars only: 66 28%Based on gross margin rather than gross sales, or both: 29 12%Based on net margin: 9 4%Based on reaching various goals rather than on individual sales dollars or a combination of goals and sales dollars: 54 23%Combination of any of the above : 79 33%
Determined from gross sales dollars only: 9 15%Based on gross margin rather than gross sales, or both: 10 16%Based on net margin: 2 3%Based on reaching various goals rather than on individual sales dollars or a combination of goals and sales dollars: 14 23%Combination of any of the above : 26 43%
Determined from gross sales dollars only: 3 18%Based on gross margin rather than gross sales, or both: 3 18%Based on net margin: 0 0%Based on reaching various goals rather than on individual sales dollars or a combination of goals and sales dollars: 6 35%Combination of any of the above : 5 29%
Nat'l Accounts Mgr.
Sales Engineer
Field Sales Supv. OUTSIDE SALES: Basis of determining bonus and/or commission
COMMISSION & BONUS PLAN SUMMARY - OUTSIDE SALES
Sales Rep/Acct Rep, Sr.
Sales Rep/Acct Rep
Sales Rep, Jr.
Sales Trainee
National Data - Effective September 2010 215 © 2011 Employer Associations of America (EAA)

Frequency Percent
Incentive pay is determined only after reaching a minimum quota or goal: 16 47%Commission is a straight percentage of sales: 5 15%Different commission percentages or bonuses are paid for various products or services: 7 21%Graduated or Variable commission plan: 5 15%Incentive plan has a cap on earnings for this individual: 1 3%
Incentive pay is determined only after reaching a minimum quota or goal: 38 37%Commission is a straight percentage of sales: 20 19%Different commission percentages or bonuses are paid for various products or services: 18 17%Graduated or Variable commission plan: 21 20%Incentive plan has a cap on earnings for this individual: 7 7%
Incentive pay is determined only after reaching a minimum quota or goal: 16 30%Commission is a straight percentage of sales: 17 32%Different commission percentages or bonuses are paid for various products or services: 10 19%Graduated or Variable commission plan: 6 11%Incentive plan has a cap on earnings for this individual: 4 8%
Incentive pay is determined only after reaching a minimum quota or goal: 51 29%Commission is a straight percentage of sales: 38 21%Different commission percentages or bonuses are paid for various products or services: 52 29%Graduated or Variable commission plan: 31 17%Incentive plan has a cap on earnings for this individual: 6 3%
Incentive pay is determined only after reaching a minimum quota or goal: 60 28%Commission is a straight percentage of sales: 60 28%Different commission percentages or bonuses are paid for various products or services: 62 29%Graduated or Variable commission plan: 31 14%Incentive plan has a cap on earnings for this individual: 4 2%
Incentive pay is determined only after reaching a minimum quota or goal: 19 37%Commission is a straight percentage of sales: 6 12%Different commission percentages or bonuses are paid for various products or services: 16 31%Graduated or Variable commission plan: 7 14%Incentive plan has a cap on earnings for this individual: 3 6%
Incentive pay is determined only after reaching a minimum quota or goal: 0 0%Commission is a straight percentage of sales: 2 20%Different commission percentages or bonuses are paid for various products or services: 6 60%Graduated or Variable commission plan: 1 10%Incentive plan has a cap on earnings for this individual: 1 10%
Nat'l Accounts Mgr.
Field Sales Supv. OUTSIDE SALES: General sales compensation information
COMMISSION & BONUS PLAN SUMMARY - OUTSIDE SALES
Sales Engineer
Sales Rep/Acct Rep, Sr.
Sales Rep/Acct Rep
Sales Trainee
Sales Rep, Jr.
National Data - Effective September 2010 216 © 2011 Employer Associations of America (EAA)

Frequency Percent
At time of order: 1 3%When shipped: 5 14%When customer is invoiced: 7 20%When customer pays: 7 20%Combination of any of the above : 15 43%
At time of order: 10 9%When shipped: 32 30%When customer is invoiced: 27 26%When customer pays: 21 20%Combination of any of the above : 16 15%
At time of order: 9 15%When shipped: 11 18%When customer is invoiced: 15 25%When customer pays: 13 21%Combination of any of the above : 13 21%
At time of order: 21 12%When shipped: 44 25%When customer is invoiced: 48 27%When customer pays: 33 18%Combination of any of the above : 33 18%
At time of order: 22 10%When shipped: 49 23%When customer is invoiced: 72 34%When customer pays: 33 15%Combination of any of the above : 38 18%
At time of order: 0 0%When shipped: 24 44%When customer is invoiced: 16 30%When customer pays: 6 11%Combination of any of the above : 8 15%
At time of order: 0 0%When shipped: 1 7%When customer is invoiced: 7 47%When customer pays: 2 13%Combination of any of the above : 5 33%
Field Sales Supv.
OUTSIDE SALES: For commission, incentive or pay purposes, this person is credited with sale:
COMMISSION & BONUS PLAN SUMMARY - OUTSIDE SALES
Sales Trainee
Nat'l Accounts Mgr.
Sales Engineer
Sales Rep/Acct Rep, Sr.
Sales Rep/Acct Rep
Sales Rep, Jr.
National Data - Effective September 2010 217 © 2011 Employer Associations of America (EAA)

Frequency Percent
Determined from gross sales dollars only: 24 20%Based on gross margin rather than gross sales, or both: 22 18%Based on net margin: 4 3%Based on reaching various goals rather than on individual sales dollars or a combination of goals and sales dollars: 34 28%Combination of any of the above : 37 31%
Determined from gross sales dollars only: 3 18%Based on gross margin rather than gross sales, or both: 1 6%Based on net margin: 0 0%Based on reaching various goals rather than on individual sales dollars or a combination of goals and sales dollars: 7 41%Combination of any of the above : 6 35%
Determined from gross sales dollars only: 3 19%Based on gross margin rather than gross sales, or both: 1 6%Based on net margin: 0 0%Based on reaching various goals rather than on individual sales dollars or a combination of goals and sales dollars: 6 38%Combination of any of the above : 6 38%
Determined from gross sales dollars only: 8 11%Based on gross margin rather than gross sales, or both: 3 4%Based on net margin: 2 3%Based on reaching various goals rather than on individual sales dollars or a combination of goals and sales dollars: 37 50%Combination of any of the above : 24 32%
Determined from gross sales dollars only: 5 13%Based on gross margin rather than gross sales, or both: 4 10%Based on net margin: 2 5%Based on reaching various goals rather than on individual sales dollars or a combination of goals and sales dollars: 19 49%Combination of any of the above : 9 23%
Determined from gross sales dollars only: 7 15%Based on gross margin rather than gross sales, or both: 5 11%Based on net margin: 2 4%Based on reaching various goals rather than on individual sales dollars or a combination of goals and sales dollars: 18 39%Combination of any of the above : 14 30%
Determined from gross sales dollars only: 12 15%Based on gross margin rather than gross sales, or both: 6 7%Based on net margin: 2 2%Based on reaching various goals rather than on individual sales dollars or a combination of goals and sales dollars: 31 38%Combination of any of the above : 30 37%
COMMISSION & BONUS PLAN SUMMARY - INSIDE SALES AND CUSTOMER SERVICE
Cust. Svc Mgr.
Cust. Svc Rep III (Tech. Advisor)
Cust. Svc Rep II (Exper)
Cust. Svc Supv.
INSIDE SALES AND CUSTOMER SERVICE: Basis of determining bonus and/or commissionTele. Sls Rep/ Inside Sls Rep
Order Proc. Supv
Tele. Order Proc.
National Data - Effective September 2010 218 © 2011 Employer Associations of America (EAA)

Determined from gross sales dollars only: 8 19%Based on gross margin rather than gross sales, or both: 3 7%Based on net margin: 3 7%Based on reaching various goals rather than on individual sales dollars or a combination of goals and sales dollars: 16 37%Combination of any of the above : 13 30%
Cust. Svc Rep I (Entry Level)
COMMISSION & BONUS PLAN SUMMARY - INSIDE SALES AND CUSTOMER SERVICE
National Data - Effective September 2010 219 © 2011 Employer Associations of America (EAA)

Frequency Percent
Incentive pay is determined only after reaching a minimum quota or goal: 28 28%Commission is a straight percentage of sales: 29 29%Different commission percentages or bonuses are paid for various products or services: 24 24%Graduated or Variable commission plan: 15 15%Incentive plan has a cap on earnings for this individual: 5 5%
Incentive pay is determined only after reaching a minimum quota or goal: 4 33%Commission is a straight percentage of sales: 0 0%Different commission percentages or bonuses are paid for various products or services: 4 33%Graduated or Variable commission plan: 1 8%Incentive plan has a cap on earnings for this individual: 3 25%
Incentive pay is determined only after reaching a minimum quota or goal: 1 10%Commission is a straight percentage of sales: 3 30%Different commission percentages or bonuses are paid for various products or services: 2 20%Graduated or Variable commission plan: 1 10%Incentive plan has a cap on earnings for this individual: 3 30%
Incentive pay is determined only after reaching a minimum quota or goal: 20 51%Commission is a straight percentage of sales: 3 8%Different commission percentages or bonuses are paid for various products or services: 5 13%Graduated or Variable commission plan: 3 8%Incentive plan has a cap on earnings for this individual: 8 21%
Incentive pay is determined only after reaching a minimum quota or goal: 8 40%Commission is a straight percentage of sales: 2 10%Different commission percentages or bonuses are paid for various products or services: 3 15%Graduated or Variable commission plan: 2 10%Incentive plan has a cap on earnings for this individual: 5 25%
Incentive pay is determined only after reaching a minimum quota or goal: 11 48%Commission is a straight percentage of sales: 5 22%Different commission percentages or bonuses are paid for various products or services: 3 13%Graduated or Variable commission plan: 1 4%Incentive plan has a cap on earnings for this individual: 3 13%
Incentive pay is determined only after reaching a minimum quota or goal: 24 51%Commission is a straight percentage of sales: 9 19%Different commission percentages or bonuses are paid for various products or services: 5 11%Graduated or Variable commission plan: 4 9%Incentive plan has a cap on earnings for this individual: 5 11%
COMMISSION & BONUS PLAN SUMMARY - INSIDE SALES AND CUSTOMER SERVICE
INSIDE SALES AND CUSTOMER SERVICE: General sales compensation information
Order Proc. Supv
Tele. Order Proc.
Tele. Sls Rep/ Inside Sls Rep
Cust. Svc Mgr.
Cust. Svc Supv.
Cust. Svc Rep III (Tech. Advisor)
Cust. Svc Rep II (Exper)
National Data - Effective September 2010 220 © 2011 Employer Associations of America (EAA)

Incentive pay is determined only after reaching a minimum quota or goal: 15 60%Commission is a straight percentage of sales: 1 4%Different commission percentages or bonuses are paid for various products or services: 4 16%Graduated or Variable commission plan: 1 4%Incentive plan has a cap on earnings for this individual: 4 16%
COMMISSION & BONUS PLAN SUMMARY - INSIDE SALES AND CUSTOMER SERVICE
Cust. Svc Rep I (Entry Level)
National Data - Effective September 2010 221 © 2011 Employer Associations of America (EAA)

Frequency Percent
At time of order: 15 15%When shipped: 21 21%When customer is invoiced: 35 35%When customer pays: 10 10%Combination of any of the above : 19 19%
At time of order: 1 8%When shipped: 3 25%When customer is invoiced: 3 25%When customer pays: 4 33%Combination of any of the above : 1 8%
At time of order: 2 18%When shipped: 2 18%When customer is invoiced: 3 27%When customer pays: 2 18%Combination of any of the above : 2 18%
At time of order: 1 3%When shipped: 2 6%When customer is invoiced: 9 28%When customer pays: 5 16%Combination of any of the above : 15 47%
At time of order: 1 7%When shipped: 2 13%When customer is invoiced: 4 27%When customer pays: 2 13%Combination of any of the above : 6 40%
At time of order: 2 10%When shipped: 2 10%When customer is invoiced: 12 57%When customer pays: 3 14%Combination of any of the above : 2 10%
At time of order: 6 13%When shipped: 5 11%When customer is invoiced: 15 33%When customer pays: 3 7%Combination of any of the above : 16 36%
At time of order: 2 8%When shipped: 4 17%When customer is invoiced: 7 29%When customer pays: 5 21%Combination of any of the above : 6 25%
Cust. Svc Rep I (Entry Level)
COMMISSION & BONUS PLAN SUMMARY - INSIDE SALES AND CUSTOMER SERVICE
Cust. Svc Mgr.
Cust. Svc Supv.
Cust. Svc Rep III (Tech. Advisor)
Cust. Svc Rep II (Exper)
Order Proc. Supv
INSIDE SALES AND CUSTOMER SERVICE: For Commission, incentive or pay purposes, this person is credited with sale:Tele. Sls Rep/ Inside Sls Rep
Tele. Order Proc.
National Data - Effective September 2010 222 © 2011 Employer Associations of America (EAA)
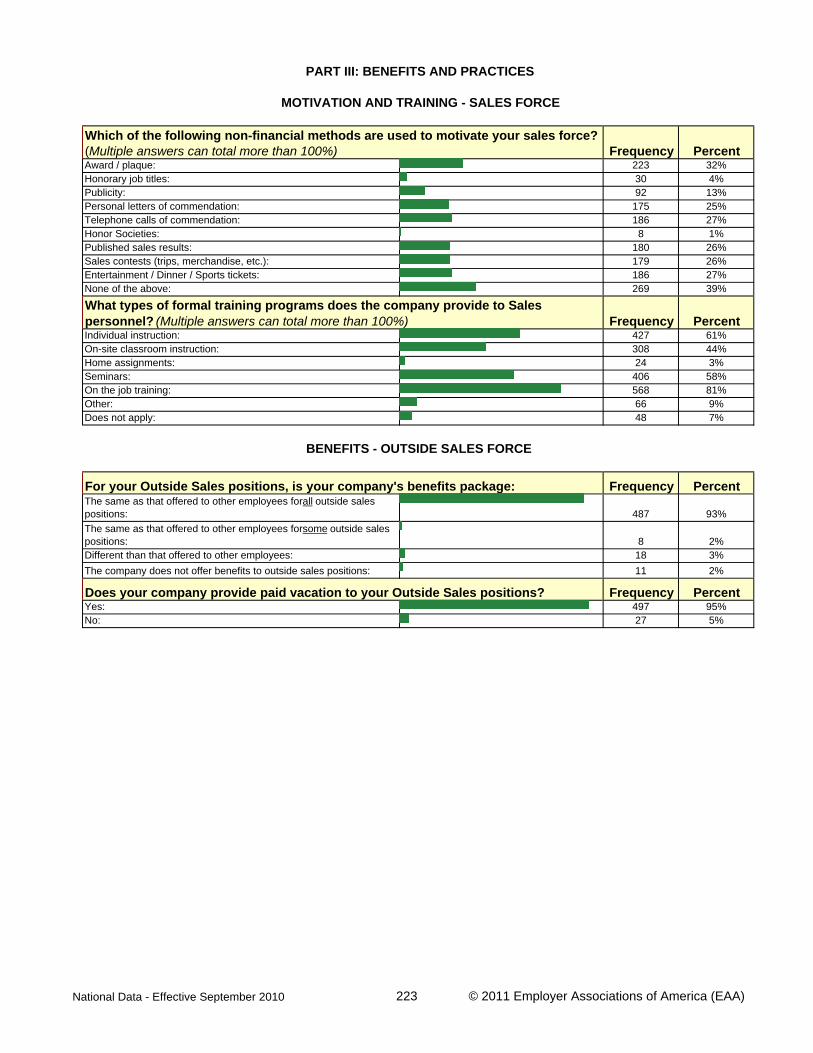
Frequency PercentAward / plaque: 223 32%Honorary job titles: 30 4%Publicity: 92 13%Personal letters of commendation: 175 25%Telephone calls of commendation: 186 27%Honor Societies: 8 1%Published sales results: 180 26%Sales contests (trips, merchandise, etc.): 179 26%Entertainment / Dinner / Sports tickets: 186 27%None of the above: 269 39%
Frequency PercentIndividual instruction: 427 61%On-site classroom instruction: 308 44%Home assignments: 24 3%Seminars: 406 58%On the job training: 568 81%Other: 66 9%Does not apply: 48 7%
Frequency PercentThe same as that offered to other employees for all outside sales positions: 487 93%The same as that offered to other employees for some outside sales positions: 8 2%Different than that offered to other employees: 18 3%The company does not offer benefits to outside sales positions: 11 2%
Frequency PercentYes: 497 95%No: 27 5%
BENEFITS - OUTSIDE SALES FORCE
Does your company provide paid vacation to your Outside Sales positions?
For your Outside Sales positions, is your company's benefits package:
MOTIVATION AND TRAINING - SALES FORCE
What types of formal training programs does the company provide to Sales personnel? (Multiple answers can total more than 100%)
PART III: BENEFITS AND PRACTICES
Which of the following non-financial methods are used to motivate your sales force? (Multiple answers can total more than 100%)
National Data - Effective September 2010 223 © 2011 Employer Associations of America (EAA)

Frequency PercentYes: 205 30%No: 482 70%
Frequency Percent
All Company owned: 45 26%All Company leased: 89 51%All Sales personnel owned/leased: 11 6%A combination of plans: 28 16%
All Company owned: 35 22%All Company leased: 67 42%All Sales personnel owned/leased: 15 9%A combination of plans: 41 26%
Frequency Percent
Yes: 146 81%No: 35 19%
Yes: 123 75%No: 42 26%
Frequency Percent
Straight cents per mile: 9 6%IRS Limit (currently 50 cents per mile): 18 13%Flat amount: Less than $40 per month: 1 1%Flat amount: $41 to $60 per month: 1 1%Flat amount: $61 to $125 per month: 4 3%Flat amount: More than $126 per month: 9 6%Other basis than listed: 25 18%Reimbursement not required: 72 52%
Straight cents per mile: 9 8%IRS Limit (currently 50 cents per mile): 18 15%Flat amount: Less than $40 per month: 3 2%Flat amount: $41 to $60 per month: 1 1%Flat amount: $61 to $125 per month: 4 3%Flat amount: More than $126 per month: 7 6%Other basis than listed: 22 18%Reimbursement not required: 56 47%
Frequency Percent
Yes: 129 72%No: 51 28%
Yes: 102 63%No: 61 37%
Sales Mgmt. Positions:
Outside Sales Positions:
Outside Sales Positions:
Is the company vehicle considered part of the total compensation package?Sales Mgmt. Positions:
Nat'l Accounts, Field Sales Supv, Sales Engineer, Outside Sales Reps (all levels), Sales Trainees or their equivalents.
Sales Management:Top Sales Executive, Int'l Manager, General Manager, Sales Manager, District Manager, Sales Trainer or their equivalents.
Outside Sales Positions:
EXPENSE ALLOWANCE PRACTICES - VEHICLES (CO. OWNED OR LEASED)
Outside Sales Positions:
How do the sales position(s) listed below reimburse the company for personal use of the company vehicle?
Are Sales Management and/or Outside Sales positions provided with company vehicles?
Vehicles used by sales position(s) listed below are:
Are the sales position(s) listed below allowed to use company vehicles for personal use?Sales Mgmt. Positions:
National Data - Effective September 2010 224 © 2011 Employer Associations of America (EAA)

Frequency Percent
Less than $4,999 per year: 18 11%$5,000 to $7,999 per year: 42 26%$8,000 to $10,999 per year: 49 30%$11,000 to $13,999 per year: 28 17%$14,000 or more per year: 25 15%
Less than $4,999 per year: 26 18%$5,000 to $7,999 per year: 44 31%$8,000 to $10,999 per year: 34 24%$11,000 to $13,999 per year: 22 16%$14,000 or more per year: 16 11%
Frequency Percent
Compact auto : 3 2%Midsize auto : 59 35%Elite auto : 11 7%Full-size auto : 48 29%Luxury auto : 23 14%Compact van or pickup : 2 1%Mid size van or pickup : 17 10%Full size van or pickup : 12 7%Sport / Utility: 58 35%
Compact auto : 6 4%Midsize auto : 76 51%Elite auto : 5 3%Full-size auto : 41 28%Luxury auto : 7 5%Compact van or pickup : 6 4%Mid size van or pickup : 21 14%Full size van or pickup : 21 14%Sport / Utility: 33 22%
Frequency Percent
Based on years alone: 23 14%Based on mileage alone: 20 12%Combination of years and mileage: 127 75%
Based on years alone: 10 7%Based on mileage alone: 22 15%Combination of years and mileage: 116 78%
What is the annual value of the vehicle from the company's viewpoint?
How does the company determine when to replace vehicles?Sales Mgmt. Positions:
Sales Mgmt. Positions:
Outside Sales Positions:
Outside Sales Positions:
What type of vehicles are provided to Sales personnel? (Multiple answers can total more than 100%)Sales Mgmt. Positions:
Outside Sales Positions:
EXPENSE ALLOWANCE PRACTICES - VEHICLES (CO. OWNED OR LEASED)
National Data - Effective September 2010 225 © 2011 Employer Associations of America (EAA)

Frequency Percent
Every year: 0 0%Every 2 years: 5 4%Every 3 years: 26 21%Every 4 years: 4 3%Every 5 years or longer: 5 4%Does not apply: 83 68%
Every year: 0 0%Every 2 years: 12 11%Every 3 years: 11 10%Every 4 years: 4 4%Every 5 years or longer: 4 4%Does not apply: 78 72%
Frequency Percent
Between 0-60,000 miles : 6 5%Between 60,001-100,000 miles : 16 12%Between 100,001-150,000 miles : 8 6%More than 150,000 miles : 6 5%Does not apply: 96 73%
Between 0-60,000 miles : 7 6%Between 60,001-100,000 miles : 15 13%Between 100,001-150,000 miles : 9 8%More than 150,000 miles : 7 6%Does not apply: 82 68%
Frequency Percent
2 Years and less than 70,000 miles: 5 3%2 Years and 70,000 to 89,999 miles: 4 3%2 Years and 90,000 miles or more: 2 1%3 Years and less than 60,000 miles: 4 3%3 Years and 60,000 to 74,999 miles: 13 8%3 Years and 75,000 to 89,999 miles: 11 7%3 Years and 90,000 to 149,999 miles: 17 11%3 Years and 150,000 miles or more: 4 3%4 Years or more and less than 100,000 miles: 6 4%4 Years or more and 100,000 miles or more: 47 31%Does not apply: 41 27%
2 Years and less than 70,000 miles: 5 4%2 Years and 70,000 to 89,999 miles: 11 8%2 Years and 90,000 miles or more: 1 1%3 Years and less than 60,000 miles: 1 1%3 Years and 60,000 to 74,999 miles: 7 5%3 Years and 75,000 to 89,999 miles: 12 8%3 Years and 90,000 to 149,999 miles: 13 9%3 Years and 150,000 miles or more: 4 3%4 Years or more and less than 100,000 miles: 7 5%4 Years or more and 100,000 miles or more: 47 33%Does not apply: 34 24%
Outside Sales Positions:
If based on combination of years and mileage, after what combination does the company replace the vehicle?Sales Mgmt. Positions:
If based on age alone, after how many years does the company replace the vehicle?Sales Mgmt. Positions:
Outside Sales Positions:
Outside Sales Positions:
If based on mileage alone, after how many miles does the company replace the vehicle?
EXPENSE ALLOWANCE PRACTICES - VEHICLES (CO. OWNED OR LEASED)
Sales Mgmt. Positions:
National Data - Effective September 2010 226 © 2011 Employer Associations of America (EAA)

Frequency Percent
Company pays 100% of vehicle insurance: 159 90%Company pays difference between personal and business use: 2 1%Company pays for specific coverage only: 6 3%Sales personnel pay deductible in case of accident: 2 1%Does not apply: 11 6%
Company pays 100% of vehicle insurance: 138 86%Company pays difference between personal and business use: 1 1%Company pays for specific coverage only: 3 2%Sales personnel pay deductible in case of accident: 3 2%Does not apply: 19 12%
Outside Sales Positions:
Sales Mgmt. Positions:
EXPENSE ALLOWANCE PRACTICES - VEHICLES (CO. OWNED OR LEASED)
For vehicle insurance on company owned or leased vehicles
National Data - Effective September 2010 227 © 2011 Employer Associations of America (EAA)

Frequency PercentYes: 576 84%No: 111 16%
Frequency PercentStraight cents per mile: 327 69%Flat amount per month: 97 20%Combination of cents per mile and a flat amount per month: 52 11%
Frequency PercentMore than 50 cents per mile: 4 1%The current IRS allowance of 50 cents per mile: 256 78%46 cents to 49.5 cents per mile: 17 5%36 cents to 45.5 cents per mile: 39 12%Less than 36 cents per mile: 11 3%
Frequency PercentLess than $301 per month: 3 3%$301 to $500 per month: 34 40%$501 to $800 per month: 40 47%More than $800 per month: 9 11%
Frequency PercentStraight cents per mile: 272 65%Flat amount per month: 90 22%Combination of cents per mile and a flat amount per month: 54 13%
Frequency PercentMore than 50 cents per mile: 1 0%The current IRS allowance of 50 cents per mile: 205 75%46 cents to 49.5 cents per mile: 27 10%36 cents to 45.5 cents per mile: 26 10%Less than 36 cents per mile: 13 5%
Frequency PercentLess than $301 per month: 5 6%$301 to $500 per month: 32 39%$501 to $800 per month: 41 49%More than $800 per month: 5 6%
Flat amount per month
EXPENSE ALLOWANCE PRACTICES - VEHICLES (PERSONAL VEHICLES)
What is the flat amount per month the company reimburses Sales Mgmt. Positions for business use of their own vehicle?
What is the combination of cents per mile and flat amount per month the company reimburses Sales Mgmt. Positions for business use of their own vehicle?
What is the straight cents per mile the company reimburses Sales Mgmt. Positions for business use of their own vehicle?
Straight cents per mile
What is the flat amount per month the company reimburses Outside Sales Positions for business use of their own vehicle?
How does the company reimburse Outside Sales Positions for business use of their own vehicle?
What is the straight cents per mile the company reimburses Outside Sales Positions for business use of their own vehicle?
Median: $500
N = 49
Does the company reimburse Sales Management and/or Outside Sales positions for business use of their personal vehicle?
How does the company reimburse Sales Mgmt. Positions for business use of their own vehicle?
Statistics Min: $0.07 Max: $0.51 Mean: $0.32 Median: $0.24
Min: $185 Max: $1300 Mean: $517
N = 49
National Data - Effective September 2010 228 © 2011 Employer Associations of America (EAA)
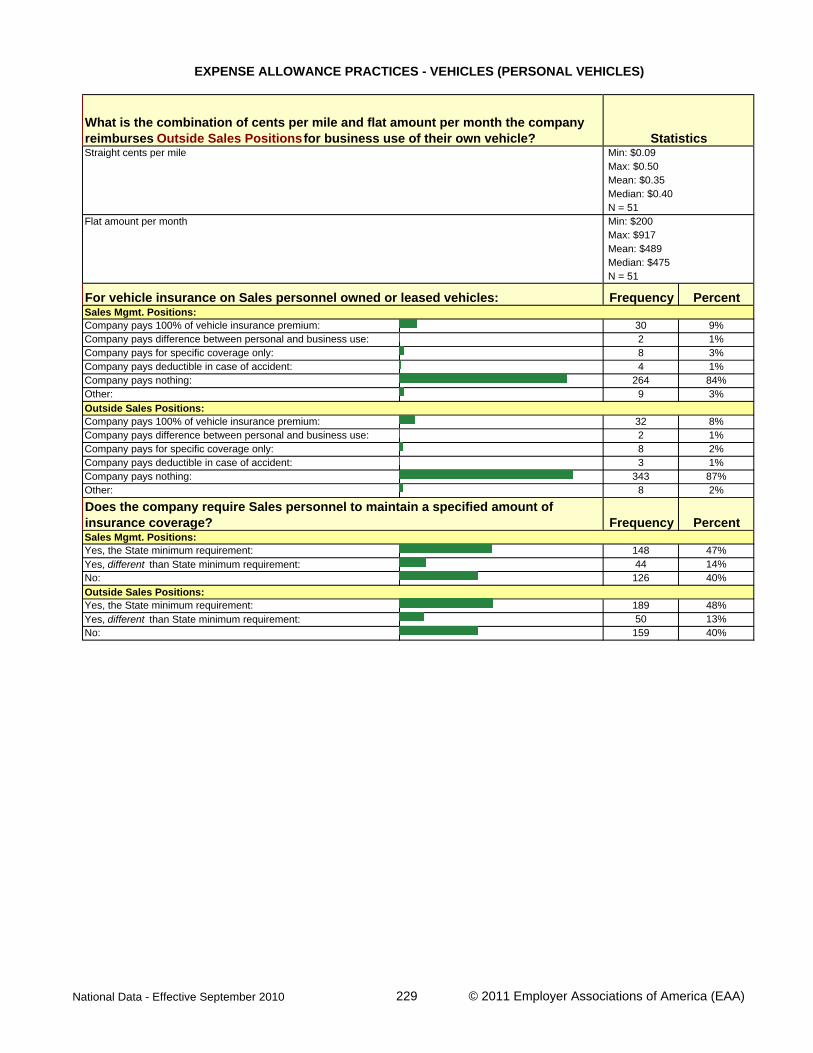
Frequency Percent
Company pays 100% of vehicle insurance premium: 30 9%Company pays difference between personal and business use: 2 1%Company pays for specific coverage only: 8 3%Company pays deductible in case of accident: 4 1%Company pays nothing: 264 84%Other: 9 3%
Company pays 100% of vehicle insurance premium: 32 8%Company pays difference between personal and business use: 2 1%Company pays for specific coverage only: 8 2%Company pays deductible in case of accident: 3 1%Company pays nothing: 343 87%Other: 8 2%
Frequency Percent
Yes, the State minimum requirement: 148 47%Yes, different than State minimum requirement: 44 14%No: 126 40%
Yes, the State minimum requirement: 189 48%Yes, different than State minimum requirement: 50 13%No: 159 40%
Straight cents per mile
Flat amount per month
For vehicle insurance on Sales personnel owned or leased vehicles:
Outside Sales Positions:
Does the company require Sales personnel to maintain a specified amount of insurance coverage?Sales Mgmt. Positions:
N = 51 Min: $200
What is the combination of cents per mile and flat amount per month the company reimburses Outside Sales Positions for business use of their own vehicle?
EXPENSE ALLOWANCE PRACTICES - VEHICLES (PERSONAL VEHICLES)
Outside Sales Positions:
Sales Mgmt. Positions:
N = 51
Median: $0.40
Median: $475
Statistics
Max: $917 Mean: $489
Min: $0.09 Max: $0.50 Mean: $0.35
National Data - Effective September 2010 229 © 2011 Employer Associations of America (EAA)

Frequency PercentYes: 440 64%No: 247 36%
Frequency PercentYes: 329 86%No: 52 14%
Frequency PercentLess than $51 per month: 3 1%$51 to $150 per month: 32 10%More than $150 per month: 7 2%Less than 80% per month: 2 1%80% to 89% per month: 1 0%90% to 99% per month: 2 1%100% per month: 275 85%
Frequency PercentNone: 182 50%Less than $50 per month: 9 2%$50 to $74 per month: 11 3%$75 or more per month: 19 5%All business related expenses, with a cap: 24 7%All business related expenses, with no cap: 57 16%Business use plus a percent of the base fee: 1 0%Total expense: 52 14%Percent of total expense: 8 2%
Frequency PercentYes: 289 79%No: 75 21%
Frequency PercentLess than $51 per month: 5 2%$51 to $150 per month: 25 9%More than $150 per month: 12 4%Less than 80% per month: 2 1%80% to 89% per month: 0 0%90% to 99% per month: 3 1%100% per month: 238 84%
Frequency PercentNone: 177 51%Less than $50 per month: 13 4%$50 to $74 per month: 12 3%$75 or more per month: 15 4%All business related expenses, with a cap: 19 5%All business related expenses, with no cap: 53 15%Business use plus a percent of the base fee: 1 0%Total expense: 51 15%Percent of total expense: 8 2%
What portion of the monthly expense of business use of Sales Management's personal cell phone is reimbursed by the company, if any?
Does the company provide a cell phone to Outside Sales positions?
How much of the monthly expense for company-owned cell phones is assumed by thecompany for Outside Sales positions?
What portion of the monthly expense of business use of Outside Sales's personal cell phone is reimbursed by the company, if any?
How much of the monthly expense for company-owned cell phones is assumed by thecompany for Sales Management positions?
Does the Company have a formal cell phone policy for Sales Management and/or Outside Sales positions?
Does the company provide a cell phone to Sales Management positions?
EXPENSE ALLOWANCE PRACTICES - CELL PHONES
National Data - Effective September 2010 230 © 2011 Employer Associations of America (EAA)
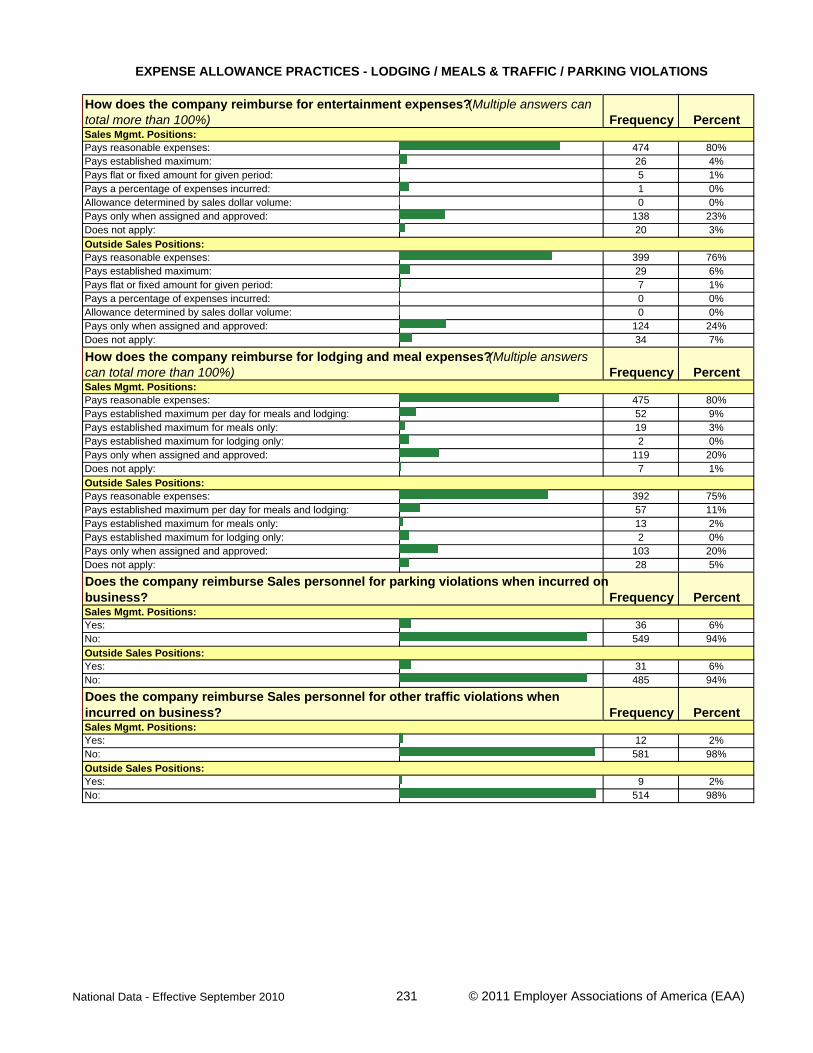
Frequency Percent
Pays reasonable expenses: 474 80%Pays established maximum: 26 4%Pays flat or fixed amount for given period: 5 1%Pays a percentage of expenses incurred: 1 0%Allowance determined by sales dollar volume: 0 0%Pays only when assigned and approved: 138 23%Does not apply: 20 3%
Pays reasonable expenses: 399 76%Pays established maximum: 29 6%Pays flat or fixed amount for given period: 7 1%Pays a percentage of expenses incurred: 0 0%Allowance determined by sales dollar volume: 0 0%Pays only when assigned and approved: 124 24%Does not apply: 34 7%
Frequency Percent
Pays reasonable expenses: 475 80%Pays established maximum per day for meals and lodging: 52 9%Pays established maximum for meals only: 19 3%Pays established maximum for lodging only: 2 0%Pays only when assigned and approved: 119 20%Does not apply: 7 1%
Pays reasonable expenses: 392 75%Pays established maximum per day for meals and lodging: 57 11%Pays established maximum for meals only: 13 2%Pays established maximum for lodging only: 2 0%Pays only when assigned and approved: 103 20%Does not apply: 28 5%
Frequency Percent
Yes: 36 6%No: 549 94%
Yes: 31 6%No: 485 94%
Frequency Percent
Yes: 12 2%No: 581 98%
Yes: 9 2%No: 514 98%
EXPENSE ALLOWANCE PRACTICES - LODGING / MEALS & TRAFFIC / PARKING VIOLATIONS
Outside Sales Positions:
Outside Sales Positions:
How does the company reimburse for entertainment expenses? (Multiple answers can total more than 100%)Sales Mgmt. Positions:
Sales Mgmt. Positions:
Does the company reimburse Sales personnel for parking violations when incurred on business?
Sales Mgmt. Positions:
Outside Sales Positions:
How does the company reimburse for lodging and meal expenses? (Multiple answers can total more than 100%)Sales Mgmt. Positions:
Outside Sales Positions:
Does the company reimburse Sales personnel for other traffic violations when incurred on business?
National Data - Effective September 2010 231 © 2011 Employer Associations of America (EAA)

Frequency Percent
Bus and cab fares: 534 90%Car rental fees: 561 95%Parking fees: 569 96%Highway toll fees: 546 92%Laundry, dry cleaning, valet services (unlimited): 30 5%Laundry, dry cleaning, valet services (limited): 125 21%Gratuities: 490 83%Other incidental expenses: 336 57%Company does not reimburse / does not apply: 10 2%
Bus and cab fares: 438 84%Car rental fees: 466 89%Parking fees: 472 91%Highway toll fees: 461 89%Laundry, dry cleaning, valet services (unlimited): 17 3%Laundry, dry cleaning, valet services (limited): 92 18%Gratuities: 390 75%Other incidental expenses: 277 53%Company does not reimburse / does not apply: 33 6%
Frequency Percent
Limited to reasonable expenses: 286 49%Only when assigned and approved: 81 14%Receipts required for all reimbursed expenses: 343 59%Receipts required only for reimbursements over $25: 96 16%Company does not reimburse / does not apply: 10 2%
Limited to reasonable expenses: 224 44%Only when assigned and approved: 76 15%Receipts required for all reimbursed expenses: 298 58%Receipts required only for reimbursements over $25: 83 16%Company does not reimburse / does not apply: 30 6%
Outside Sales Positions:
Which of the following policies/requirements apply for miscellaneous fees or expenses reimbursed by the company? (Multiple answers can total more than 100%)Sales Mgmt. Positions:
Outside Sales Positions:
Sales Mgmt. Positions:
EXPENSE ALLOWANCE PRACTICES - INCIDENTAL OUT-OF-POCKET
Which of the following miscellaneous fees or expenses does the company reimburse?(Multiple answers can total more than 100%)
National Data - Effective September 2010 232 © 2011 Employer Associations of America (EAA)

Frequency Percent
Total expense of a computer: 240 41%Partial expense of a computer: 9 2%Total expense of a fax machine: 153 26%Partial expense of a fax machine: 2 0%Total expense of a photocopier: 117 20%Partial expense of a photocopier : 4 1%No reimbursement / Does not apply: 328 56%
Total expense of a computer: 244 47%Partial expense of a computer: 8 2%Total expense of a fax machine: 159 31%Partial expense of a fax machine: 4 1%Total expense of a photocopier: 123 24%Partial expense of a photocopier : 6 1%No reimbursement / Does not apply: 249 48%
Frequency Percent
Company pays most economical fare: 484 82%Company pays business class: 77 13%Company pays first class, when determined by Company policy: 13 2%
Company has different policy for domestic vs. international flights: 50 8%No reimbursement / Does not apply: 17 3%
Company pays most economical fare: 413 79%Company pays business class: 57 11%Company pays first class, when determined by Company policy: 8 2%
Company has different policy for domestic vs. international flights: 46 9%No reimbursement / Does not apply: 37 7%
Frequency Percent
Yes: 39 7%Yes, partial: 10 2%No: 537 92%
Yes: 33 6%Yes, partial: 9 2%No: 473 92%
EXPENSE ALLOWANCE PRACTICES - HOME OFFICE
What home office equipment does the company reimburse for? (Multiple answers can total more than 100%)
Outside Sales Positions:
Sales Mgmt. Positions:
AIR FARE AND FREQUENT FLYER PROGRAMS
Outside Sales Positions:
What is the company policy for reimbursement of air fare expenses?Sales Mgmt. Positions:
Does the company require that trips earned from frequent flyer programs be returned to the company?Sales Mgmt. Positions:
Outside Sales Positions:
National Data - Effective September 2010 233 © 2011 Employer Associations of America (EAA)

Frequency Percent
Local: 134 23%State-wide: 126 22%Regional: 283 48%National: 255 43%North America (includes Canada and Mexico): 164 28%International: 173 30%
Local: 148 29%State-wide: 130 25%Regional: 315 61%National: 155 30%North America (includes Canada and Mexico): 84 16%International: 65 13%
Frequency PercentYes: 203 29%No: 504 71%
Frequency Percent00.1% to 10.0% of sales force: 84 41%10.1% to 40.0% of sales force: 42 21%40.1% to 90.0% of sales force: 45 22%90.1% to 100.0% of sales force: 32 16%
Frequency PercentOn a commission basis : 191 94%On some other basis: 12 6%
Frequency Percent1.0% to 4.0% commission: 53 28%4.1% to 9.0% commission: 73 39%9.1% to 15.0% commission: 45 24%15.1% to 50.0% commission: 13 7%50.1% to 100.0% commission: 4 2%
What territory is covered by each of your sales positions? (Multiple answers can total more than 100%)
How does the company compensate Independent Sales Reps?
Do you use Independent Sales Representatives at your company?
Outside Sales Positions:
What percent of the company's total sales force are Independent Sales Reps?
PART IV: TERRITORY COVERED
Sales Mgmt. Positions:
PART V: INDEPENDENT SALES REPRESENTATIVES
What is the average commission as a percent of sales for Independent Sales Reps compensated on a commission basis?
National Data - Effective September 2010 234 © 2011 Employer Associations of America (EAA)