2011 value of tourism final - destination bc corp
TRANSCRIPT
Measuring the value of tourism in B.C. |1999 to 2009
Ministry of Jobs, Tourism and Innovation May 2012
Trends from 2000 to 2010
The Value of Tourism in British Columbia

Measuring the value of tourism in British Columbia |2000 to 2010 1
MAP OF BRITISH COLUMBIA TOURISM REGIONS

Measuring the value of tourism in British Columbia |2000 to 2010 2
TABLE OF CONTENTS
Map of British Columbia Tourism Regions ............ 1
1. Overview .............................................. 3
2. Contributions to the economy ...................... 5
TOURISM REVENUES ............................................... 5
Total revenue .................................................................... 5 Revenue by tourism sector ................................................ 6 Accommodation room revenue ......................................... 8 Tax revenues..................................................................... 8 Export revenues ................................................................ 9
GROSS DOMESTIC PRODUCT (GDP) ............................. 11
GDP by tourism sectors .................................................. 11 Industry comparisons ...................................................... 12
3. Business and people ................................. 14
TOURISM BUSINESSES ............................................. 14
Total establishments ....................................................... 14 Tourism businesses by region ......................................... 15 Tourism businesses by sector ......................................... 16
TOURISM EMPLOYMENT .......................................... 17
Direct employment .......................................................... 17 Employment by sector ..................................................... 17 Employment by region ..................................................... 19 Wages and salaries ......................................................... 20
4. Market origin ......................................... 22
Overall visitor volume ...................................................... 23 Domestic market ............................................................. 23 International markets ....................................................... 24
Measuring the value of tourism in British Columbia |2000 to 2010 3
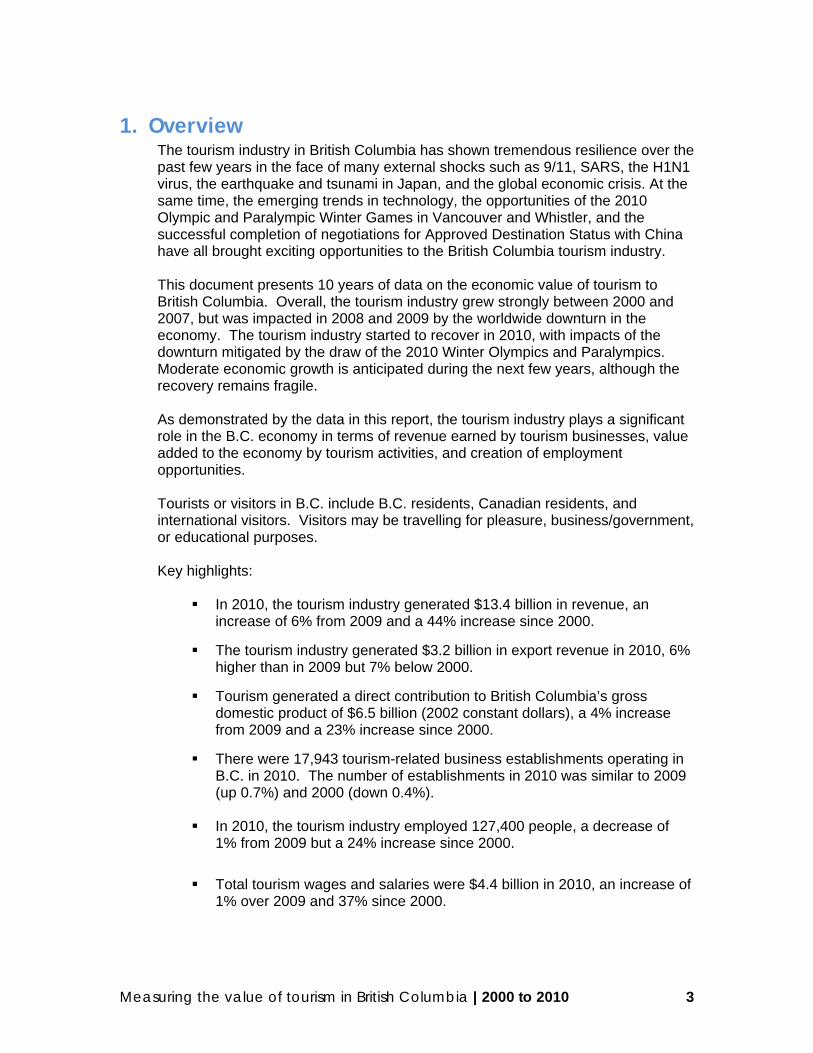
1. Overview The tourism industry in British Columbia has shown tremendous resilience over the past few years in the face of many external shocks such as 9/11, SARS, the H1N1 virus, the earthquake and tsunami in Japan, and the global economic crisis. At the same time, the emerging trends in technology, the opportunities of the 2010 Olympic and Paralympic Winter Games in Vancouver and Whistler, and the successful completion of negotiations for Approved Destination Status with China have all brought exciting opportunities to the British Columbia tourism industry. This document presents 10 years of data on the economic value of tourism to British Columbia. Overall, the tourism industry grew strongly between 2000 and 2007, but was impacted in 2008 and 2009 by the worldwide downturn in the economy. The tourism industry started to recover in 2010, with impacts of the downturn mitigated by the draw of the 2010 Winter Olympics and Paralympics. Moderate economic growth is anticipated during the next few years, although the recovery remains fragile. As demonstrated by the data in this report, the tourism industry plays a significant role in the B.C. economy in terms of revenue earned by tourism businesses, value added to the economy by tourism activities, and creation of employment opportunities. Tourists or visitors in B.C. include B.C. residents, Canadian residents, and international visitors. Visitors may be travelling for pleasure, business/government, or educational purposes. Key highlights:
In 2010, the tourism industry generated $13.4 billion in revenue, an increase of 6% from 2009 and a 44% increase since 2000.
The tourism industry generated $3.2 billion in export revenue in 2010, 6% higher than in 2009 but 7% below 2000.
Tourism generated a direct contribution to British Columbia’s gross domestic product of $6.5 billion (2002 constant dollars), a 4% increase from 2009 and a 23% increase since 2000.
There were 17,943 tourism-related business establishments operating in B.C. in 2010. The number of establishments in 2010 was similar to 2009 (up 0.7%) and 2000 (down 0.4%).
In 2010, the tourism industry employed 127,400 people, a decrease of 1% from 2009 but a 24% increase since 2000.
Total tourism wages and salaries were $4.4 billion in 2010, an increase of 1% over 2009 and 37% since 2000.

Measuring the value of tourism in British Columbia |2000 to 2010 4
SUMMARY OF ECONOMIC INDICATORS OF TOURISM INDUSTRY IN B.C.
2010 % Change
from 2009
% Change
from 2000
Tourism Revenue $13.4B +6.2% +44.0%
Provincial Tax Revenue $1.02B +14.9% +33.7%
Export Revenue $3.2B +6.3% -6.7%
Gross Domestic Product
(GDP; 2002 constant dollars)
$6.5B +4.3% +22.6%
Tourism-Related Businesses 17,943 +0.7% -0.4%
Tourism Employment 127,400 -1.0% +24.4%
Tourism Wages & Salaries $4.4B +0.6% +37.2%
Key highlights (continued):
There were 15.7 million overnight visitors to B.C. in 2010. More than11 million (72%) were from Canada while over 4 million (28%) were from other countries. B.C. residents made up the largest share of overnight visitor volume (74%) and expenditures (54%) of those travellers from Canada. International visitors accounted for 41% of total visitor expenditures, despite their smaller share of overnight visitor volume.
The number of overnight visitors to British Columbia from Canada (including B.C. residents) increased by 7% in 2010 compared with 2009, while international visitor volume increased by 5% in 2010 from 2009. International visitors spent 6% more in 2010 than in 2009; Canadian visitors spent 1% less.
SUMMARY OF VISITOR VOLUME AND EXPENDITURES OF TOURISM INDUSTRY IN B.C.
2010 % Change
from 2009
% Change
from 2006
Overnight Visitor Volume (Total) 15.7M +6.0% +7.9%
Canadian Visitors 11.4M +6.6% +18.1%
International Visitors 4.4M +4.5% -11.9%
Overnight Visitor Expenditures (Total) $7.9B +1.7% +5.1%
Canadian Expenditures $4.6B -1.3% +12.7%
International Expenditures $3.2B +6.3% -4.0%

Measuring the value of tourism in British Columbia |2000 to 2010 5
2. Contributions to the economy There are two principal ways of measuring the tourism industry’s contribution to the B.C. economy:
Tourism revenue measures the money received by businesses, individuals, and governments due to tourism activities.
Gross domestic product (GDP) measures the value added to the economy from tourism activities. The costs of supplies and services used to produce goods or services are subtracted from total revenues. This measure highlights the specific contribution the tourism industry makes to the B.C. economy.
Estimating tourism revenues accurately is difficult because the tourism industry draws from parts of several industries: accommodation and food services, retail services, transportation services and other services.
In the past, estimates of tourism revenue were based on spending reported by visitors through surveys – a demand-side approach. Many tourism and statistical agencies have recognized the challenges of relying on visitor surveys to estimate tourism revenue and have adopted a supply-side approach to estimating tourism revenue by developing tourism satellite accounts (TSA1). Statistics Canada and the Canadian Tourism Commission have been leaders in developing a national TSA, which is the source of estimates of tourism revenue for Canada as a whole.
In 2009, the B.C. provincial statistical agency (BC Stats) and Tourism British Columbia adopted a supply-side approach for estimating tourism industry revenues for B.C.. The total revenue for each tourism-related industry is calculated directly from annual and monthly data collected from businesses. Then, a specific tourism proportion is applied to the revenue for each tourism-related industry to determine the total revenue due to the tourism industry. This approach is similar to the methodology that was already in place for estimating tourism GDP. BC Stats has developed tourism revenue estimates back to 1998.
This chapter summarizes total tourism revenues and the tourism industry’s GDP between 2000 and 2010. The chapter also includes a discussion of accommodation room revenue, tax revenues, and export revenues. Detailed tables are available in Appendix A.
TOURISM REVENUES
Total revenue The tourism industry generated $13.4 billion in 20102, an increase of 6% from 2009 (Figure 1). Since 2000, total tourism revenues have grown 44%. Tourism revenues grew every year between 2000 and 2008, but growth varied considerably, between a high of 9% and a low of about 1%. A decline of tourism revenues in 2009 was caused by several factors, including the global economic recession, economic uncertainty in the United States, and the appreciation of the Canadian dollar. 1 A tourism satellite account is a system of measuring the impact of tourism on the economy; it is a framework that accounts for the impacts across all industries which, in turn, reveals the total direct impact on the economy.
2 Source: BC Stats.

Measuring the value of tourism in British Columbia |2000 to 2010 6
FIGURE 1: OVERALL TOURISM REVENUE AND YEAR-OVER-YEAR CHANGE (2000 TO 2010)
Tourism revenue estimates provided by BC Stats summarize the overall picture for British Columbia. Regional breakouts are not available, and a supply-side approach does not permit the breakout of revenue by market of origin.
However, for business planning purposes, it is important to understand the relative importance of different markets of origin in generating revenue for the tourism industry. It is also important to have information on the extent to which growth rates differ by market of origin – as well as data on visitor and trip behaviour and characteristics – to target marketing and development investments efficiently. This information is captured through visitor surveys and is presented in Section 4.0 of this report.
Revenue by tourism sector In 2010, transportation, accommodation and food services generated two-thirds of total tourism revenues, while retail services accounted for another quarter of revenues (Figure 2).
Other tourism-related services – which include vehicle rentals, tourism-related recreation and entertainment, and vacation homes – accounted for less than 10% of total revenues.
-15%
-10%
-5%
0%
5%
10%
15%
$0
$5,000
$10,000
$15,000
2000 2001 2002 2003 2004 2005 2006 2007 2008 2009 2010
Percent change
Millions ($) Tourism revenue Year-over-year change
SA
RS
9/11
Glo
bal
eco
no
mic
pre
ssu
res
Glo
bal
eco
no
mic
pre
ssu
res
35%
30%
27%
8% Accommodation & food servicesTransportation
Retail services
Other services
FIGURE 2: SHARE OF TOURISM REVENUE (2010)

Measuring the value of tourism in British Columbia |2000 to 2010 7
Since 2000, transportation, accommodation and food services have grown by between 30% and 40%, while retail services and other tourism services saw even stronger growth over the 10-year period (54% and 68%, respectively). While the share of total revenue generated by each sector3 has remained relatively constant from 2000 to 2010, annual growth rates have fluctuated considerably (Figure 3). For most sectors, 2009 was a year of decrease due to the economic recession, with levels returning to those of previous years in 2010. The transportation services sector lost ground in 2001 and 2002, but recovered to an average 6% annual growth from 2004 to 2008. Revenues from transportation services fell 5% in 2009, but grew 6% in 2010. Accommodation and food services contracted in 2003, rebounded with 12% growth in 2004, slid between 2006 and 2009, and returned to the 2006 level in 2010. Retail services grew 21% in 2000 and averaged 7% growth from 2004 to 2008. Revenues for retail services were up by 5% in 2010. The rise and fall of other tourism-related services has varied over the years, with a large decline in 2004 and 2005. From 2009 to 2010, revenues for other tourism-related services remained largely unchanged, with a 2% increase in 2010.
FIGURE 3: REVENUE GROWTH RATES BY TOURISM SECTOR (2000 TO 2010)
3 Two terms are used to refer to industries in this document. “Retail services industry,” for example, encompasses the entire retail services industry while the tourism-related component of the industry is referred to as the “retail services sector” in this report.
-10%
-5%
0%
5%
10%
15%
20%
25%
2000 2001 2002 2003 2004 2005 2006 2007 2008 2009 2010
Percent change Accommodation & food services Transportation
Retail services Other services
Measuring the value of tourism in British Columbia |2000 to 2010 8
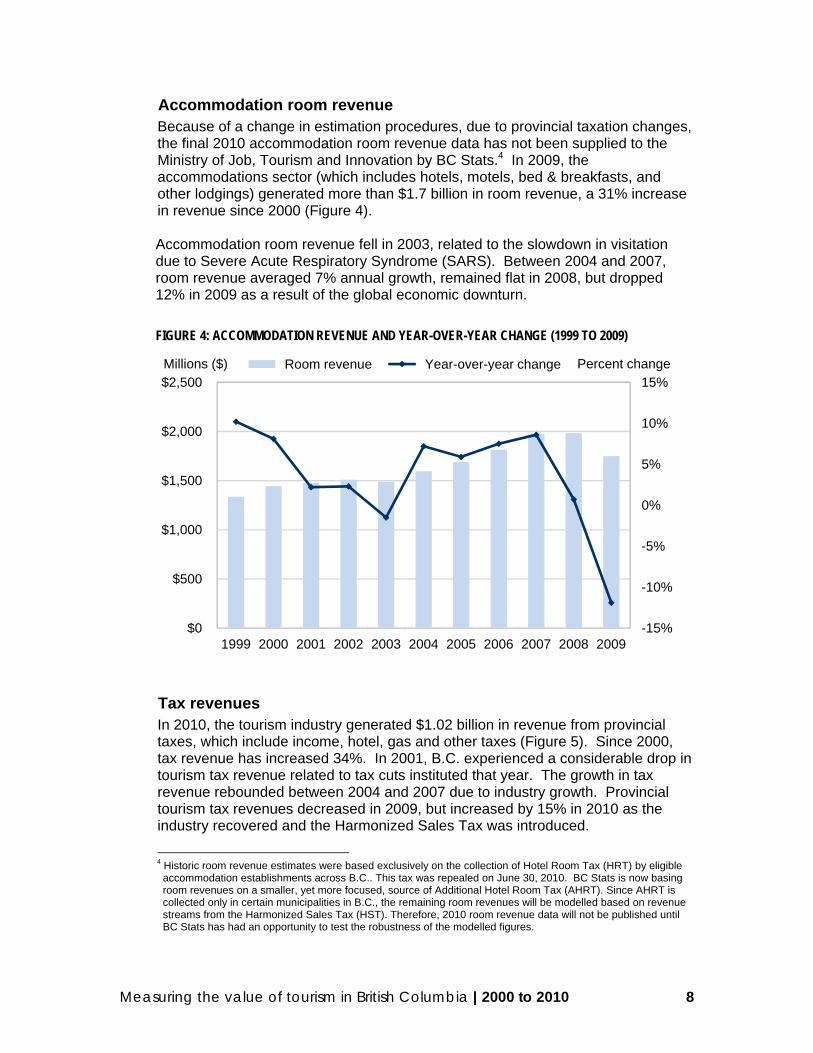
Accommodation room revenue Because of a change in estimation procedures, due to provincial taxation changes, the final 2010 accommodation room revenue data has not been supplied to the Ministry of Job, Tourism and Innovation by BC Stats.4 In 2009, the accommodations sector (which includes hotels, motels, bed & breakfasts, and other lodgings) generated more than $1.7 billion in room revenue, a 31% increase in revenue since 2000 (Figure 4). Accommodation room revenue fell in 2003, related to the slowdown in visitation due to Severe Acute Respiratory Syndrome (SARS). Between 2004 and 2007, room revenue averaged 7% annual growth, remained flat in 2008, but dropped 12% in 2009 as a result of the global economic downturn.
FIGURE 4: ACCOMMODATION REVENUE AND YEAR-OVER-YEAR CHANGE (1999 TO 2009)
Tax revenues In 2010, the tourism industry generated $1.02 billion in revenue from provincial taxes, which include income, hotel, gas and other taxes (Figure 5). Since 2000, tax revenue has increased 34%. In 2001, B.C. experienced a considerable drop in tourism tax revenue related to tax cuts instituted that year. The growth in tax revenue rebounded between 2004 and 2007 due to industry growth. Provincial tourism tax revenues decreased in 2009, but increased by 15% in 2010 as the industry recovered and the Harmonized Sales Tax was introduced.
4 Historic room revenue estimates were based exclusively on the collection of Hotel Room Tax (HRT) by eligible accommodation establishments across B.C.. This tax was repealed on June 30, 2010. BC Stats is now basing room revenues on a smaller, yet more focused, source of Additional Hotel Room Tax (AHRT). Since AHRT is collected only in certain municipalities in B.C., the remaining room revenues will be modelled based on revenue streams from the Harmonized Sales Tax (HST). Therefore, 2010 room revenue data will not be published until BC Stats has had an opportunity to test the robustness of the modelled figures.
-15%
-10%
-5%
0%
5%
10%
15%
$0
$500
$1,000
$1,500
$2,000
$2,500
1999 2000 2001 2002 2003 2004 2005 2006 2007 2008 2009
Percent changeMillions ($) Room revenue Year-over-year change

Measuring the value of tourism in British Columbia |2000 to 2010 9
FIGURE 5: TOURISM-RELATED TAX REVENUE AND YEAR-OVER-YEAR CHANGE (2000 TO 2010).
Export revenues The tourism industry generated $3.2 billion in export revenue in 2010, an increase of 6% from 2009 (Figure 6).5 Export revenue is generated from the sale of tourism products and services to international visitors. Tourism export revenue varied considerably between 2000 and 2010, but decreased by 7% between 2000 and 2010.
FIGURE 6: TOURISM EXPORT REVENUES (2000 TO 2010).
5 Pre-2000 export data for the tourism industry consistent with the current data series were not available at the time of publication.
-15%
-10%
-5%
0%
5%
10%
15%
20%
$0
$250
$500
$750
$1,000
$1,250
$1,500
2000 2001 2002 2003 2004 2005 2006 2007 2008 2009 2010
Percent changeMillions ($)Tax revenue Year-over-year change
-15%
-10%
-5%
0%
5%
10%
15%
$0
$1,000
$2,000
$3,000
$4,000
2000 2001 2002 2003 2004 2005 2006 2007 2008 2009 2010
Percent changeMillions ($) Export revenue Year-over-year change

Measuring the value of tourism in British Columbia |2000 to 2010 10
Between 2000 and 2010, the tourism industry’s export revenue was similar to that of agriculture and fish products, and mineral products (Figure 7). While agricultural exports have remained relatively steady, mineral exports rose nearly 17% and tourism exports dropped by 5% since 2005. Forest products generated the largest export revenues, but fell 35% between 2005 and 2010 (down 45% between 2000 and 2010) due to the weakening housing market, low timber prices, softwood lumber duties and the weakening pulp market.6 On the other hand, energy exports have increased 3% since 2005 (up 31% since 2000), as energy demand increased over the last decade.
FIGURE 7: EXPORT REVENUES FROM B.C.’S PRIMARY RESOURCE COMMODITIES (2000 TO 2010).
6 Ministry of Forests and Range, 2009/10-2011/12 Service Plan Update
$0
$5,000
$10,000
$15,000
$20,000
2000 2001 2002 2003 2004 2005 2006 2007 2008 2009 2010
Millions ($) Agriculture & fish EnergyForest products MineralsTourism
Measuring the value of tourism in British Columbia |2000 to 2010 11
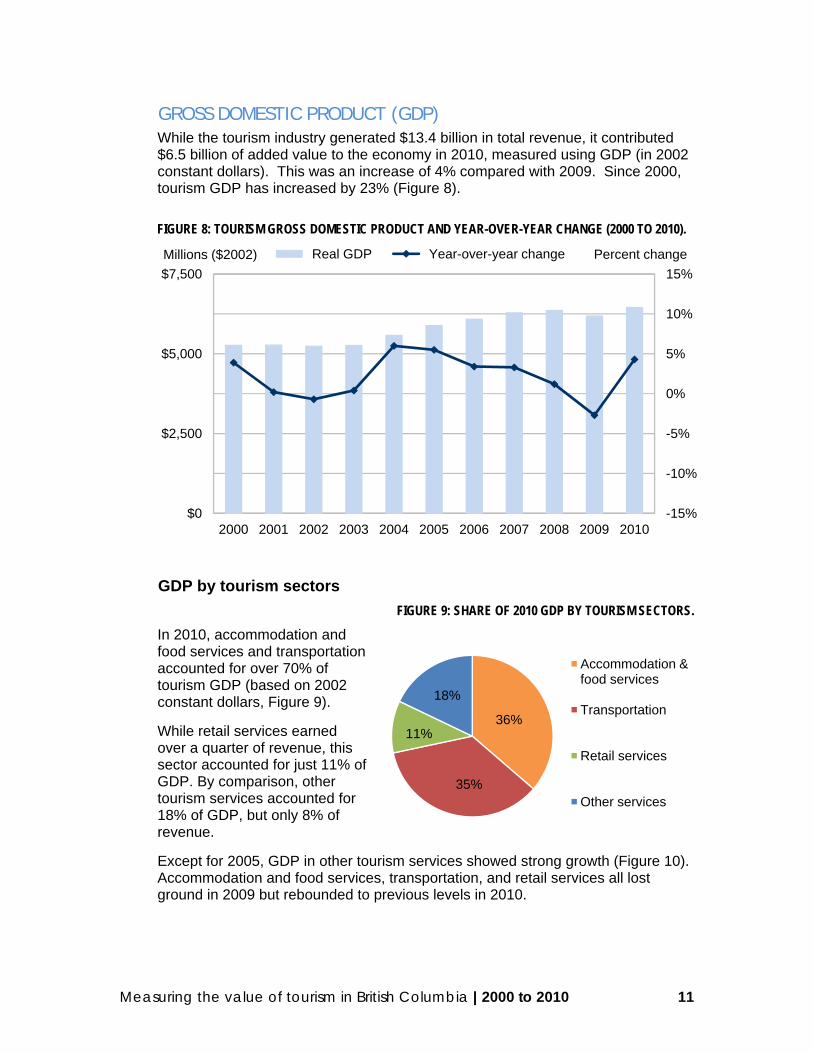
GROSS DOMESTIC PRODUCT (GDP) While the tourism industry generated $13.4 billion in total revenue, it contributed $6.5 billion of added value to the economy in 2010, measured using GDP (in 2002 constant dollars). This was an increase of 4% compared with 2009. Since 2000, tourism GDP has increased by 23% (Figure 8).
FIGURE 8: TOURISM GROSS DOMESTIC PRODUCT AND YEAR-OVER-YEAR CHANGE (2000 TO 2010).
GDP by tourism sectors
FIGURE 9: SHARE OF 2010 GDP BY TOURISM SECTORS.
In 2010, accommodation and food services and transportation accounted for over 70% of tourism GDP (based on 2002 constant dollars, Figure 9).
While retail services earned over a quarter of revenue, this sector accounted for just 11% of GDP. By comparison, other tourism services accounted for 18% of GDP, but only 8% of revenue.
Except for 2005, GDP in other tourism services showed strong growth (Figure 10). Accommodation and food services, transportation, and retail services all lost ground in 2009 but rebounded to previous levels in 2010.
-15%
-10%
-5%
0%
5%
10%
15%
$0
$2,500
$5,000
$7,500
2000 2001 2002 2003 2004 2005 2006 2007 2008 2009 2010
Percent changeMillions ($2002) Real GDP Year-over-year change
36%
35%
11%
18%
Accommodation & food services
Transportation
Retail services
Other services

Measuring the value of tourism in British Columbia |2000 to 2010 12
FIGURE 10: COMPARING REAL GDP FOR TOURISM SECTORS (2000 TO 2010).
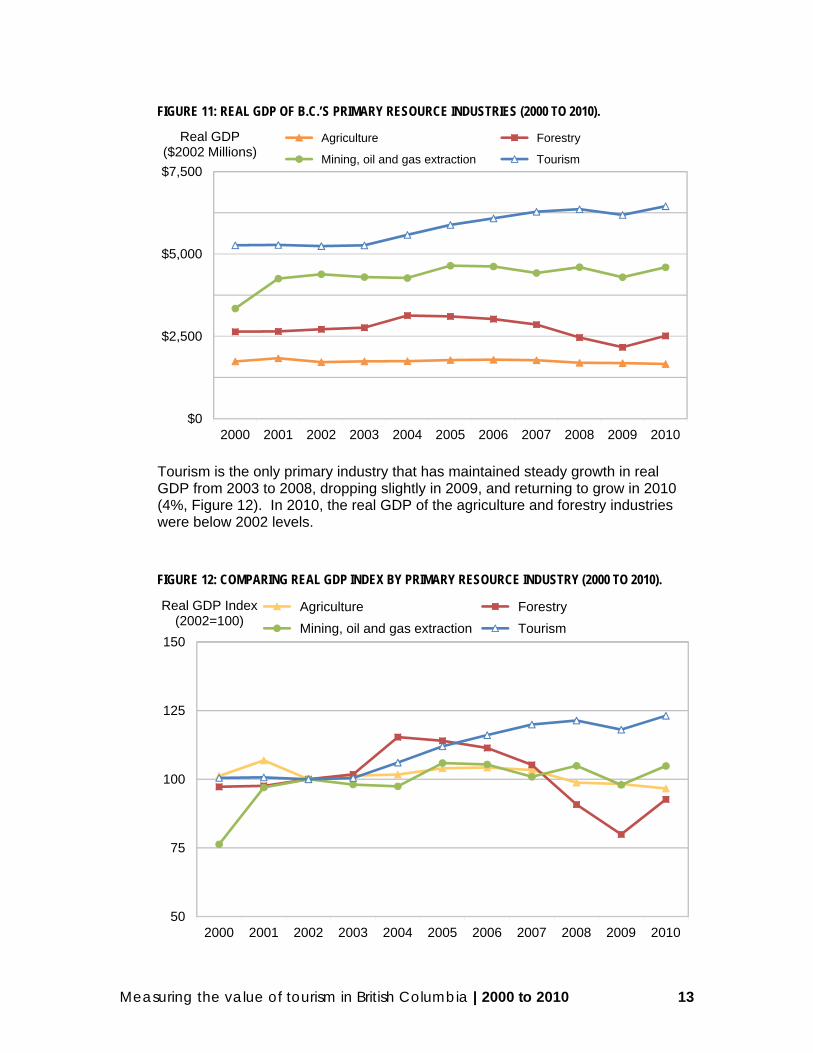
Industry comparisons The tourism industry makes a significant contribution to the B.C. economy compared with other primary resource industries, including forestry, agriculture7, and mining and oil & gas extraction (Figure 11). From 2000 to 2010, GDP of the tourism, and mining and oil & gas extraction industries have both increased (23% and 37%, respectively), while agriculture and forestry dropped by 5%.
7 The agriculture industry includes crop and animal production, agricultural support services, and fishing, trapping and hunting.
50
75
100
125
150
2000 2001 2002 2003 2004 2005 2006 2007 2008 2009 2010
Real GDP Index (2002=100)
Accommodation & food servicesTransportationRetail servicesOther services
Measuring the value of tourism in British Columbia |2000 to 2010 13
FIGURE 11: REAL GDP OF B.C.’S PRIMARY RESOURCE INDUSTRIES (2000 TO 2010).
Tourism is the only primary industry that has maintained steady growth in real GDP from 2003 to 2008, dropping slightly in 2009, and returning to grow in 2010 (4%, Figure 12). In 2010, the real GDP of the agriculture and forestry industries were below 2002 levels.
FIGURE 12: COMPARING REAL GDP INDEX BY PRIMARY RESOURCE INDUSTRY (2000 TO 2010).
$0
$2,500
$5,000
$7,500
2000 2001 2002 2003 2004 2005 2006 2007 2008 2009 2010
Real GDP ($2002 Millions)
Agriculture Forestry
Mining, oil and gas extraction Tourism
50
75
100
125
150
2000 2001 2002 2003 2004 2005 2006 2007 2008 2009 2010
Real GDP Index (2002=100)
Agriculture Forestry
Mining, oil and gas extraction Tourism
Measuring the value of tourism in British Columbia |2000 to 2010 14
3. Business and people In addition to the revenues and gross domestic product that the tourism industry contributes to the B.C. economy, the industry supports a wide range of small, medium and large businesses, and provides jobs across the province. This chapter summarizes the number of tourism establishments (businesses) in B.C. and provides statistics on tourism employment. Detailed tables are available in Appendix A.
TOURISM BUSINESSES
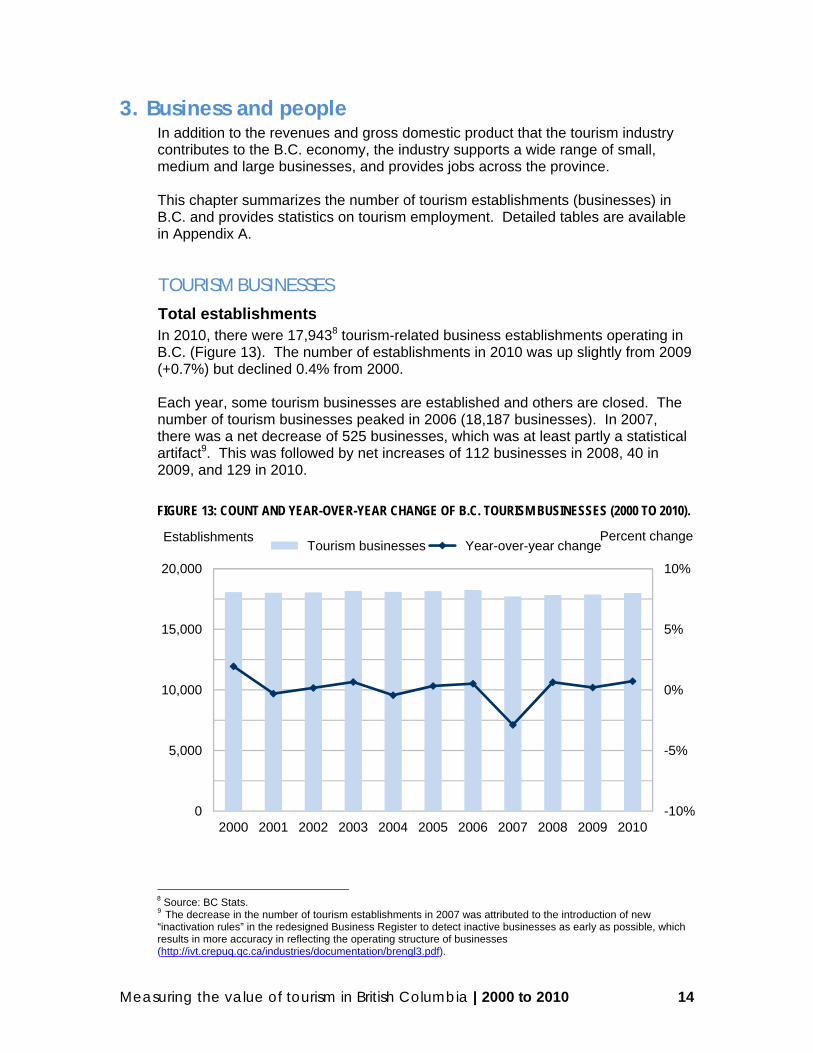
Total establishments In 2010, there were 17,9438 tourism-related business establishments operating in B.C. (Figure 13). The number of establishments in 2010 was up slightly from 2009 (+0.7%) but declined 0.4% from 2000. Each year, some tourism businesses are established and others are closed. The number of tourism businesses peaked in 2006 (18,187 businesses). In 2007, there was a net decrease of 525 businesses, which was at least partly a statistical artifact9. This was followed by net increases of 112 businesses in 2008, 40 in 2009, and 129 in 2010.
FIGURE 13: COUNT AND YEAR-OVER-YEAR CHANGE OF B.C. TOURISM BUSINESSES (2000 TO 2010).
8 Source: BC Stats. 9 The decrease in the number of tourism establishments in 2007 was attributed to the introduction of new “inactivation rules” in the redesigned Business Register to detect inactive businesses as early as possible, which results in more accuracy in reflecting the operating structure of businesses (http://ivt.crepuq.qc.ca/industries/documentation/brengl3.pdf).
-10%
-5%
0%
5%
10%
0
5,000
10,000
15,000
20,000
2000 2001 2002 2003 2004 2005 2006 2007 2008 2009 2010
Percent changeEstablishmentsTourism businesses Year-over-year change

Measuring the value of tourism in British Columbia |2000 to 2010 15
The 2007 decrease in the number of tourism establishments occurred primarily among very small businesses (one to four employees), which accounted for a third of all tourism establishments. The number of very small businesses shrank by 2,077, a 25% decrease from the previous year10 (Figure 14). However, the number of slightly larger businesses (five to nine and 10 to 19 employees) grew by 1,317, a 22% increase in 2007. While some very small businesses were inactive or closed in 2007, others may have grown larger to meet customer demands, before the effects of the 2008 economic slowdown were felt. The number of tourism businesses of all sizes was similar from 2007 to 2010.
FIGURE 14: COUNT OF TOURISM BUSINESSES BY SIZE (NUMBER OF EMPLOYEES) (2000 TO 2010).
Tourism businesses by region
FIGURE 15: TOURISM BUSINESSES BY REGION (2010)
More than half of B.C.’s tourism-related establishments are located in the Vancouver, Coast and Mountains region, and the three largest regions (Vancouver, Coast and Mountains, Vancouver Island and the Thompson Okanagan) account for 87% of tourism businesses (Figure 15). Since 2000, the number of tourism establishments has increased by 23% in the Vancouver Island
10 Ibid.
0
2,500
5,000
7,500
10,000
2000 2001 2002 2003 2004 2005 2006 2007 2008 2009 2010
Establishments1 to 4 5 to 9 10 to 19 20 to 49 50+
17%
57%
13%
5%
2%
6% Vancouver Island
Vancouver, Coast & Mtns
Thompson Okanagan
Kootenay Rockies
Cariboo Chilcotin Coast
Northern BC

Measuring the value of tourism in British Columbia |2000 to 2010 16
region, 4% in the Vancouver Coast and Mountains and 8% in the Thompson Okanagan. The Cariboo Chilcotin Coast region saw a 60% net increase in the number of tourism businesses11. The number of tourism businesses grew 14% in the Kootenay Rockies and 8% in Northern BC.
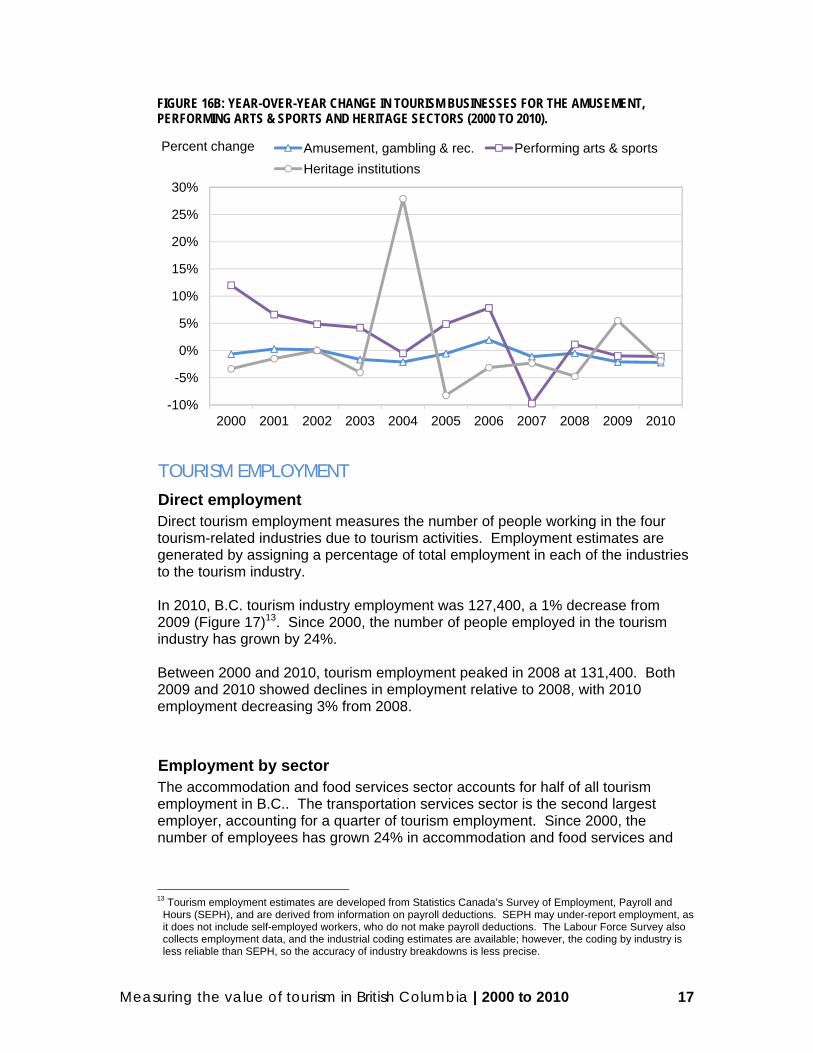
Tourism businesses by sector In 2010, the accommodation and food services sector accounted for 55% of tourism-related establishments in B.C. and the transportation sector accounted for nearly 18%.12 Within the accommodation and food services industry group, the split was 84% food and beverage businesses and 16% accommodation businesses. In 2007, all tourism sectors experienced a net decrease in the number of businesses, but the impact was less pronounced in the food and beverage sector, amusement, gambling and recreation sector, and among heritage institutions (Figure 16A/16B). The number of heritage institutions leapt 28% in 2004, most likely due to the provincial government devolving the management of 28 heritage properties. The accommodation and food services sector experienced a net increase of 133 businesses in 2008, and the performing arts and sports sector saw an increase of 11 businesses. Numbers were down slightly for the other sectors. In 2010, the food and beverage sector grew by 3% from 2009, whereas other sectors experienced minimal growth (accommodation (0.4%)) or decreases compared to 2009 (transportation (-3.8%), amusement, gambling & rec. (-2.2%) heritage institutions (-1.9%), and performing arts & sports (-1.1%)).
FIGURE 16A: YEAR-OVER-YEAR CHANGE IN TOURISM BUSINESSES FOR THE FOOD & BEVERAGE, ACCOMMODATION AND TRANSPORTATION SECTORS (2000 TO 2010).
11 Most of this increase occurred between 2002 and 2003 and is probably, at least in part, a statistical artifact. 12 The data on tourism-related establishments is based on the Statistics Canada Business Register. This register uses slightly different coding for sectors, compared with the revenue and GDP data.
-10%
-5%
0%
5%
10%
2000 2001 2002 2003 2004 2005 2006 2007 2008 2009 2010
Percent change Food & beverage Accommodation Transportation
Measuring the value of tourism in British Columbia |2000 to 2010 17
FIGURE 16B: YEAR-OVER-YEAR CHANGE IN TOURISM BUSINESSES FOR THE AMUSEMENT, PERFORMING ARTS & SPORTS AND HERITAGE SECTORS (2000 TO 2010).
TOURISM EMPLOYMENT
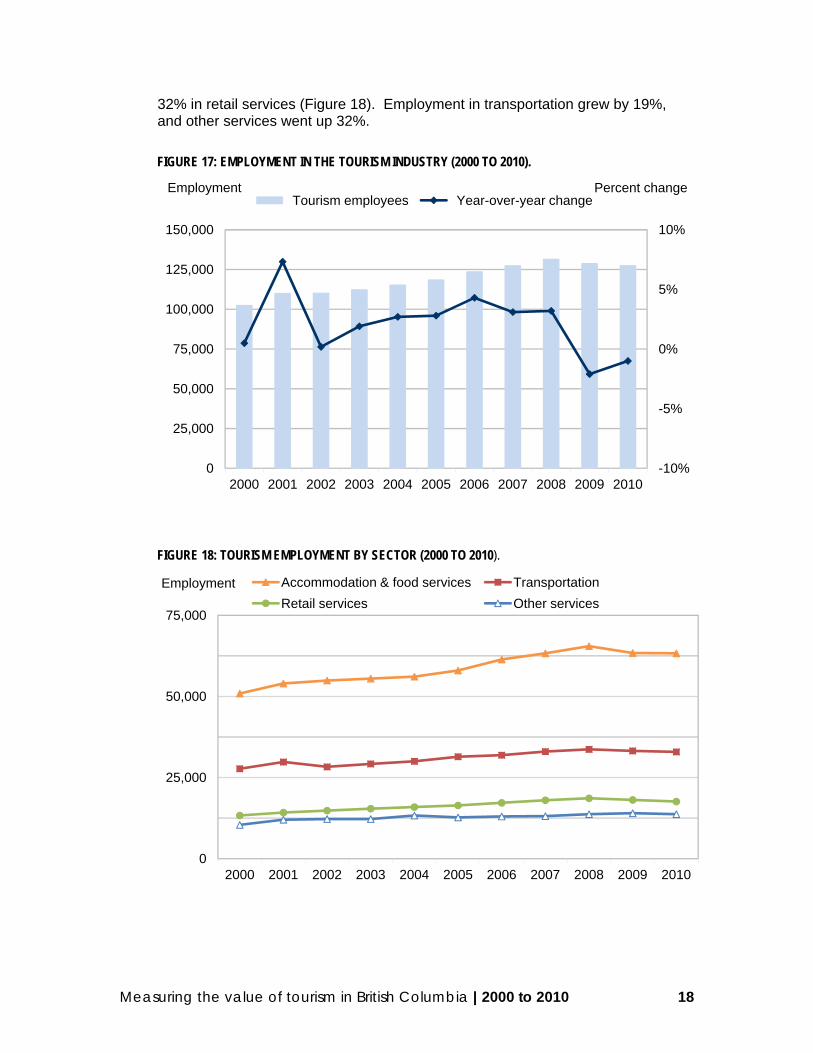
Direct employment Direct tourism employment measures the number of people working in the four tourism-related industries due to tourism activities. Employment estimates are generated by assigning a percentage of total employment in each of the industries to the tourism industry. In 2010, B.C. tourism industry employment was 127,400, a 1% decrease from 2009 (Figure 17)13. Since 2000, the number of people employed in the tourism industry has grown by 24%. Between 2000 and 2010, tourism employment peaked in 2008 at 131,400. Both 2009 and 2010 showed declines in employment relative to 2008, with 2010 employment decreasing 3% from 2008.
Employment by sector The accommodation and food services sector accounts for half of all tourism employment in B.C.. The transportation services sector is the second largest employer, accounting for a quarter of tourism employment. Since 2000, the number of employees has grown 24% in accommodation and food services and
13 Tourism employment estimates are developed from Statistics Canada’s Survey of Employment, Payroll and Hours (SEPH), and are derived from information on payroll deductions. SEPH may under-report employment, as it does not include self-employed workers, who do not make payroll deductions. The Labour Force Survey also collects employment data, and the industrial coding estimates are available; however, the coding by industry is less reliable than SEPH, so the accuracy of industry breakdowns is less precise.
-10%
-5%
0%
5%
10%
15%
20%
25%
30%
2000 2001 2002 2003 2004 2005 2006 2007 2008 2009 2010
Percent change Amusement, gambling & rec. Performing arts & sports
Heritage institutions
Measuring the value of tourism in British Columbia |2000 to 2010 18
32% in retail services (Figure 18). Employment in transportation grew by 19%, and other services went up 32%.
FIGURE 17: EMPLOYMENT IN THE TOURISM INDUSTRY (2000 TO 2010).
FIGURE 18: TOURISM EMPLOYMENT BY SECTOR (2000 TO 2010).
-10%
-5%
0%
5%
10%
0
25,000
50,000
75,000
100,000
125,000
150,000
2000 2001 2002 2003 2004 2005 2006 2007 2008 2009 2010
Percent changeEmploymentTourism employees Year-over-year change
0
25,000
50,000
75,000
2000 2001 2002 2003 2004 2005 2006 2007 2008 2009 2010
Employment Accommodation & food services Transportation
Retail services Other services

Measuring the value of tourism in British Columbia |2000 to 2010 19
Employment by region Similar to other measures, in 2010 the Vancouver, Coast and Mountain region had the largest share of tourism employment in the province (64%), followed by Vancouver Island (15%), and the Thompson Okanagan (11%). Combined, these three tourism regions account for 90% of the province’s tourism employment. In 2010, tourism employment in Vancouver Island and Northern BC both experienced declines of 9% and 8% respectively, while the employment in Thompson Okanagan, Kootenay Rockies and Vancouver, Coast and Mountains increased by 4%, 2% and 1%, respectively (Figure 19). Employment in the Cariboo Chilcotin Coast remained similar to previous years. The growth rates of tourism employment in each region have fluctuated considerably since 2000, but when comparing 2000 to 2010, all tourism regions in the province experienced increases in employment. Between 2000 and 2010, the Vancouver, Coast and Mountains (27%), Thompson Okanagan (29%), and Kootenay Rockies (24%) tourism regions experienced significant increases in employment. Employment increased by 15% in the Vancouver Island region, 14% in Northern BC, and 7% in the Cariboo Chilcotin Coast.
FIGURE 19: TOURISM EMPLOYMENT BY REGION (2000 TO 2010).
0
25,000
50,000
75,000
100,000
2000 2001 2002 2003 2004 2005 2006 2007 2008 2009 2010
Vancouver Island Vancouver, Coast & Mountains
Thompson Okanagan Kootenay Rockies
Cariboo Chilcotin Coast Northern BC

Measuring the value of tourism in British Columbia |2000 to 2010 20
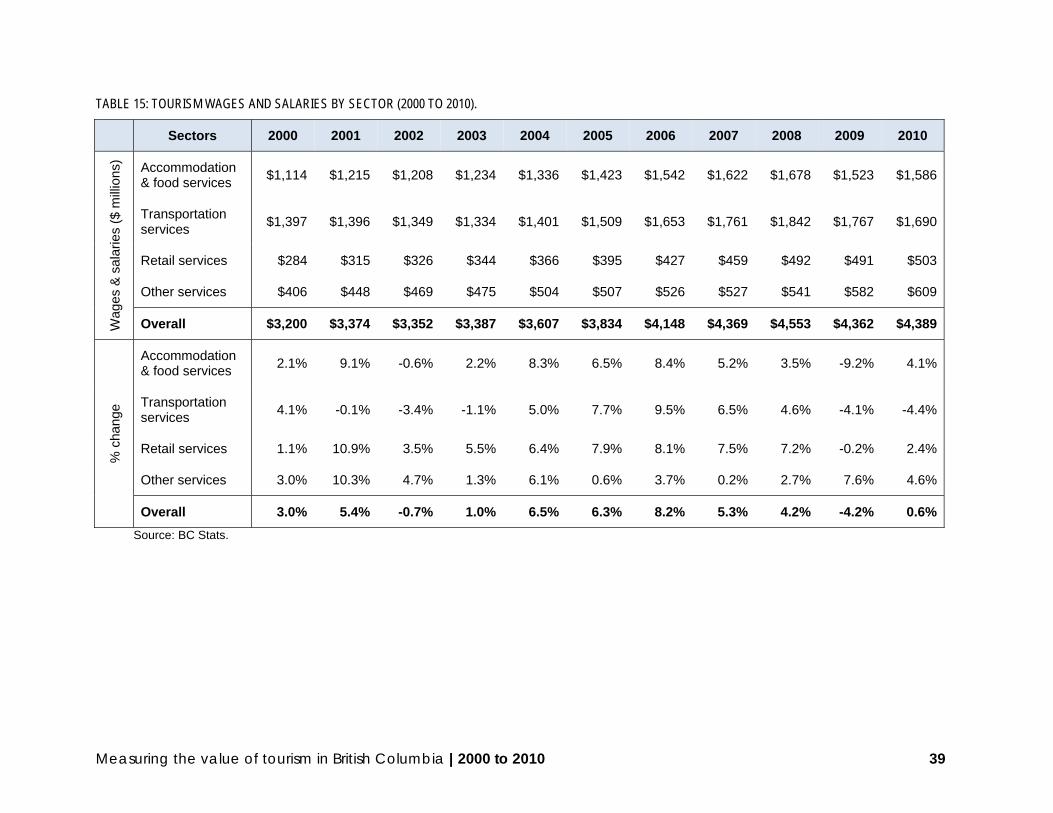
Wages and salaries The tourism industry paid $4.4 billion in wages and salaries in 2010. Although the number of people employed dropped by 1% from 2009, earnings increased by 1% in 2010 (Figure 20). While tourism wages and salaries posted an increase of 37% since 2000, the growth rates in compensation have not been steady. Salaries and wages dropped after 2001 but rebounded quickly in 2003 and 2004. From 2005 to 2008, wages and salaries averaged 6% annual growth, decreasing by 4% in 2009.
FIGURE 20: WAGES AND SALARIES PAID IN THE TOURISM INDUSTRY (2000 TO 2010).
Accommodation and food services account for half of employment, but only 36% of total wages and salaries, whereas transportation services account for one quarter of employment but 39% of tourism wages and salaries (Figure 21).
FIGURE 21: SHARE OF TOURISM EMPLOYMENT AND SALARIES BY SECTOR (2010).
-15%
-10%
-5%
0%
5%
10%
15%
$0
$2,500
$5,000
2000 2001 2002 2003 2004 2005 2006 2007 2008 2009 2010
Percent change$ MillionsWages and salaries Year-over-year change
36%
39%
12%
14%
WAGES & SALARIES
50%
26%
14%
11%
EMPLOYMENT
Accommodation & food services
Transportation
Retail services
Other services

Measuring the value of tourism in British Columbia |2000 to 2010 21
While the average compensation per employee in all tourism sectors has increased between 2% and 34% since 2000, the average compensation within transportation has been more than double the figure for accommodation and food, and retail services (Figure 22). Compensation in transportation dropped and flattened between 2000 and 2004, rose by an average of 4% per year from 2006 to 2008, then declined to an average of 3% between 2009 and 2010. Wages in accommodation and food have risen 2% per year in 2006 and 2007, flattened in 2008, and dropped significantly by 6% in 2009. In retail services, average wages increased by 4% each year from 2006.
FIGURE 22: AVERAGE COMPENSATION PER EMPLOYEE (2000 TO 2010).
$0
$25,000
$50,000
$75,000
2000 2001 2002 2003 2004 2005 2006 2007 2008 2009 2010
Accommodation & food services Transportation
Retail services Other services
Measuring the value of tourism in British Columbia |2000 to 2010 22
4. Market origin Market origin data is captured through visitor surveys. Tourism British Columbia relies on two surveys conducted by Statistics Canada:
International Travel Survey (ITS): an exit survey for some international visitors and an entry and mail return survey for others14
Travel Survey of Residents of Canada (TSRC): a monthly telephone survey of Canadian households15
These surveys ask respondents to report the number of trips, destinations and trip length, and to estimate overall trip expenditures. There are limitations in the reliability of visitor surveys, as the surveys depend on respondents’ ability to recall and report data accurately. Also, differences in survey methodologies (different survey modes, differences in trip or traveller definitions) may affect visitor volume or expenditure/revenue16 estimates. There are also differences in estimates of tourism expenditures/revenues between Statistics Canada (demand-side estimates) and the BC Stats methodology (supply-side estimates), which can be attributed to several factors:
Same-day travellers to B.C. are not included in the analysis of Statistics Canada surveys (only overnight travellers to B.C. are included).
Some overnight tourism trips are considered “out of scope” for the ITS and TSRC, and thus not captured in these surveys.
Travel by residents of the territories is not captured by the TSRC. Trips by Canadians that include a component in B.C. but have a
destination outside Canada are not included in the TSRC. Pre-trip expenditures on durable goods for tourism purposes are not
included in the TSRC. Respondents to telephone surveys, such as the TSRC, may under-report
the number of trips and trip expenditures to reduce interview times or may fail to recall trips or trip details.
These factors mean that data presented here on market origin should be interpreted with caution. This section summarizes visitor volume of overnight travellers to British Columbia (i.e., one or more nights were spent in B.C.) by international, domestic and all travellers to B.C.. This section also reports tourism expenditures by origin from the visitor surveys to provide a more complete picture of B.C.’s tourism markets.
14 Please visit Statistics Canada’s website for more information on the ITS Frontier counts and the ITS mail-back questionnaires and air exit surveys.
15 Please visit Statistics Canada’s website for more information on the TSRC questionnaire. 16 Trip expenditures (from the visitor’s perspective) are the flip side of tourism revenues (from the B.C. economy’s perspective).

Measuring the value of tourism in British Columbia |2000 to 2010 23
Overall visitor volume In 2010, there were 15.7 million overnight visitors in B.C., an increase of 6% over 2009.17 Over half of the visitors were B.C. residents (Figure 23). Visitors from other parts of Canada accounted for 19%, while international visitors accounted for the remaining 28% of overall visitor volume. However, international visitors accounted for 41% of visitor expenditures, while Canadian and B.C. residents accounted for about 30% each.
FIGURE 23: VISITOR VOLUME (OVERNIGHT) AND EXPENDITURES BY MARKET ORIGIN (2010).
Domestic market Overnight visitors from Canada accounted for over 11 million travellers in 2010, a 7% increase from 2009. Of travellers from Canada, B.C. residents made up the largest share of visitor volume (74%) and expenditures (54%) in 2010 (Figure 24). Alberta was the second largest domestic market of overnight visitors to B.C., representing one-fifth of the Canadian visitor volume (19%) and 26% of expenditures. Overall, visitors from Canada spent about 1% less in 2010 than in 2009.
FIGURE 24: SHARE OF DOMESTIC VISITOR VOLUME AND EXPENDITURES (2010).
17
Source: Statistics Canada, Travel Survey of Residents of Canada (includes travellers who spent one or more nights in B.C.). Migration from the Canadian Travel Survey (pre 2005) to the Travel Survey of Residents of Canada, which started in 2005, does not allow comparisons with previous years.
53%
19%
19%
4%4% 1%
VOLUME (15.7M)
British Columbia
Other Canada
United States
Asia/Pacific
Europe
Other Overseas
32%
27%
19%
11%
10%
1%
EXPENDITURES ($7.9B)
74%
19%
4%1% 2% 0.3%
VOLUME
British Columbia
Alberta
Ontario
Quebec
Prairies
Atlantic
54%26%
12%
2%5% 1%
EXPENDITURES
Measuring the value of tourism in British Columbia |2000 to 2010 24
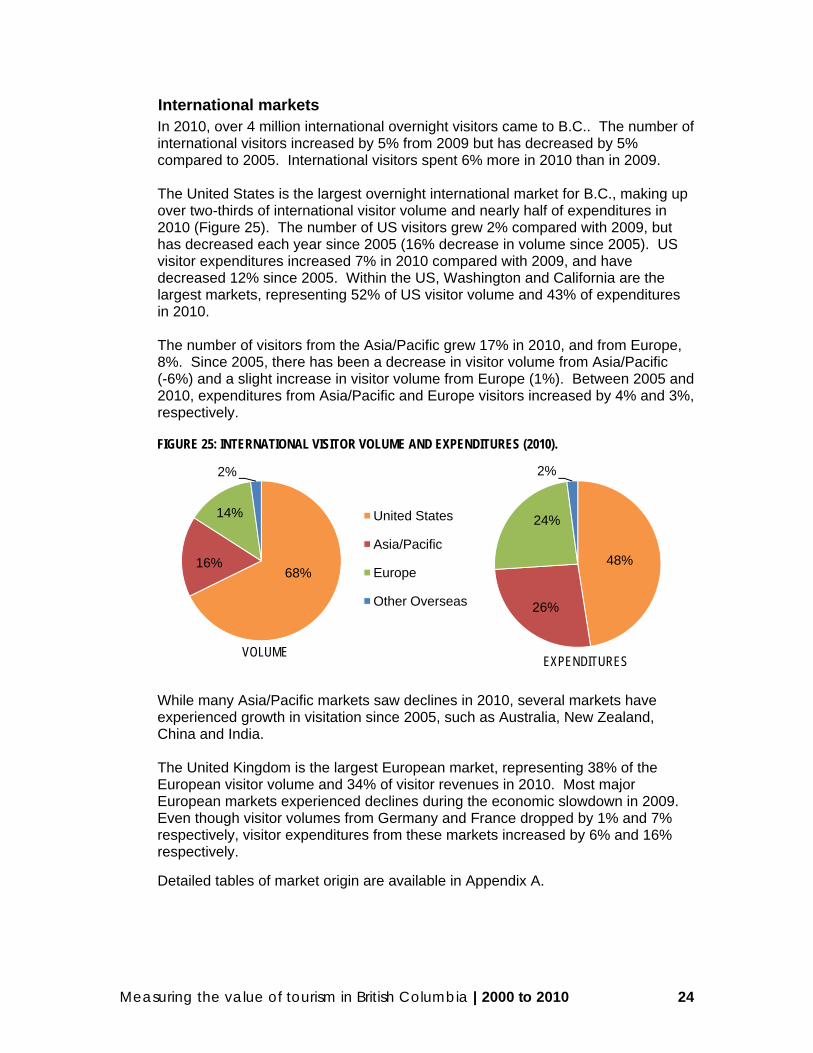
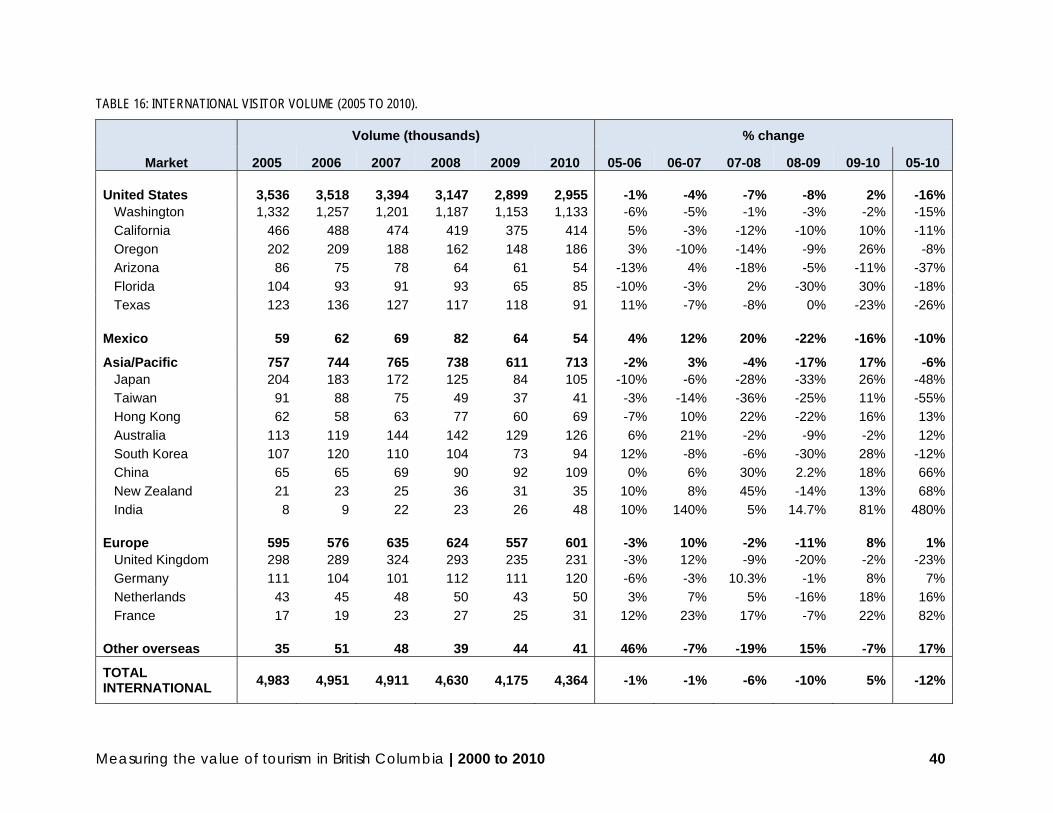
International markets In 2010, over 4 million international overnight visitors came to B.C.. The number of international visitors increased by 5% from 2009 but has decreased by 5% compared to 2005. International visitors spent 6% more in 2010 than in 2009. The United States is the largest overnight international market for B.C., making up over two-thirds of international visitor volume and nearly half of expenditures in 2010 (Figure 25). The number of US visitors grew 2% compared with 2009, but has decreased each year since 2005 (16% decrease in volume since 2005). US visitor expenditures increased 7% in 2010 compared with 2009, and have decreased 12% since 2005. Within the US, Washington and California are the largest markets, representing 52% of US visitor volume and 43% of expenditures in 2010. The number of visitors from the Asia/Pacific grew 17% in 2010, and from Europe, 8%. Since 2005, there has been a decrease in visitor volume from Asia/Pacific (-6%) and a slight increase in visitor volume from Europe (1%). Between 2005 and 2010, expenditures from Asia/Pacific and Europe visitors increased by 4% and 3%, respectively.
FIGURE 25: INTERNATIONAL VISITOR VOLUME AND EXPENDITURES (2010).
While many Asia/Pacific markets saw declines in 2010, several markets have experienced growth in visitation since 2005, such as Australia, New Zealand, China and India. The United Kingdom is the largest European market, representing 38% of the European visitor volume and 34% of visitor revenues in 2010. Most major European markets experienced declines during the economic slowdown in 2009. Even though visitor volumes from Germany and France dropped by 1% and 7% respectively, visitor expenditures from these markets increased by 6% and 16% respectively.
Detailed tables of market origin are available in Appendix A.
68%16%
14%
2%
VOLUME
United States
Asia/Pacific
Europe
Other Overseas
48%
26%
24%
2%
EXPENDITURES

Measuring the value of tourism in British Columbia |2000 to 2010 25
APPENDIX A
Detailed tables
Measuring the value of tourism in British Columbia |2000 to 2010 26
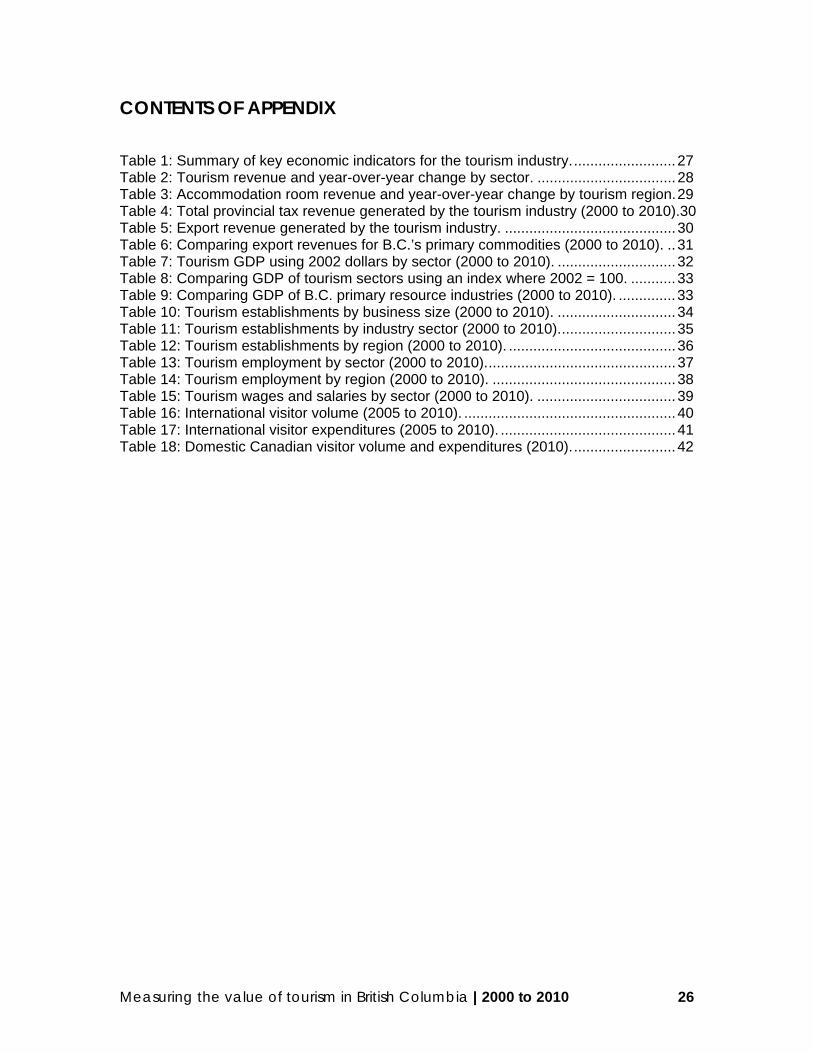
CONTENTS OF APPENDIX Table 1: Summary of key economic indicators for the tourism industry. ......................... 27 Table 2: Tourism revenue and year-over-year change by sector. .................................. 28 Table 3: Accommodation room revenue and year-over-year change by tourism region. 29 Table 4: Total provincial tax revenue generated by the tourism industry (2000 to 2010).30 Table 5: Export revenue generated by the tourism industry. .......................................... 30 Table 6: Comparing export revenues for B.C.’s primary commodities (2000 to 2010). .. 31 Table 7: Tourism GDP using 2002 dollars by sector (2000 to 2010). ............................. 32 Table 8: Comparing GDP of tourism sectors using an index where 2002 = 100. ........... 33 Table 9: Comparing GDP of B.C. primary resource industries (2000 to 2010). .............. 33 Table 10: Tourism establishments by business size (2000 to 2010). ............................. 34 Table 11: Tourism establishments by industry sector (2000 to 2010). ............................ 35 Table 12: Tourism establishments by region (2000 to 2010). ......................................... 36 Table 13: Tourism employment by sector (2000 to 2010). .............................................. 37 Table 14: Tourism employment by region (2000 to 2010). ............................................. 38 Table 15: Tourism wages and salaries by sector (2000 to 2010). .................................. 39 Table 16: International visitor volume (2005 to 2010). .................................................... 40 Table 17: International visitor expenditures (2005 to 2010). ........................................... 41 Table 18: Domestic Canadian visitor volume and expenditures (2010). ......................... 42

Measuring the value of tourism in British Columbia |2000 to 2010 27
TABLE 1: SUMMARY OF KEY ECONOMIC INDICATORS FOR THE TOURISM INDUSTRY.
2000 2001 2002 2003 2004 2005 2006 2007 2008 2009 2010
Total revenue ($ millions)
$9,339 $9,582 $9,720 $9,799 $10,717 $11,465 $12,208 $12,911 $13,332 $12,661 $13,446
% change 8.7% 2.6% 1.4% 0.8% 9.4% 7.0% 6.5% 5.8% 3.3% -5.0% 6.2%
Accommodation room revenue ($ millions)18
$1,437 $1,469 $1,503 $1,481 $1,587 $1,682 $1,808 $1,964 $1,977 $1,743 -
% change 8.1% 2.2% 2.3% -1.5% 7.2% 5.9% 7.5% 8.6% 0.7% -11.9% -
Tax revenues $763 $697 $685 $700 $764 $814 $884 $923 $917 $888 $1,020
% change 4.4% -8.7% -1.7% 2.2% 9.1% 6.5% 8.6% 4.4% -0.7% -3.2% 14.9%
Export revenue $3,471 $3,650 $3,664 $3,213 $3,568 $3,399 $3,376 $3,466 $3,414 $3,049 $3,240
% change . 5.2% 0.4% -12.3% 11.0% -4.7% -0.7% 2.7% -1.5% -10.7% 6.3%
Gross Domestic Product (GDP; $2002 millions)
$5,263 $5,273 $5,238 $5,261 $5,579 $5,883 $6,080 $6,282 $6,359 $6,185 $6,450
% change 3.9% 0.2% -0.7% 0.4% 6.0% 5.5% 3.4% 3.3% 1.2% -2.7% 4.3%
Total establishments 18,021 17,966 17,996 18,114 18,035 18,094 18,187 17,662 17,774 17,814 17,943
% change 1.9% -0.3% 0.2% 0.7% -0.4% 0.3% 0.5% -2.9% 0.6% 0.2% 0.7%
Tourism employment(‘000 102.4 109.9 110.1 112.2 115.2 118.4 123.5 127.3 131.4 128.7 127.4
% change 0.5% 7.3% 0.2% 1.9% 2.7% 2.8% 4.3% 3.1% 3.2% -2.1% -1.0%
Wages and salaries ($ millions)
$3,200 $3,374 $3,352 $3,387 $3,607 $3,834 $4,148 $4,369 $4,553 $4,362 $4,389
% change 3.0% 5.4% -0.7% 1.0% 6.5% 6.3% 8.2% 5.3% 4.2% -4.2% 0.6%
International visitors (‘000)
5,305 5,307 5,345 4,844 5,149 4,983 4,951 4,911 4,629 4,175 4,364
% change . 0.04% 0.7%. -9.4% 6.3% -3.2% -0.6% -0.8% -5.7% -9.8% 4.5%
18 2010 room revenue data not yet available from BC Stats.

Measuring the value of tourism in British Columbia |2000 to 2010 28
TABLE 2: TOURISM REVENUE AND YEAR-OVER-YEAR CHANGE BY SECTOR.
Sectors 2000 2001 2002 2003 2004 2005 2006 2007 2008 2009 2010
Rev
enue
($
mill
ions
)
Accommodation & food services
$3,276 $3,434 $3,510 $3,422 $3,815 $4,155 $4,452 $4,692 $4,684 $4,363 $4,706
Transportation services
$3,087 $3,031 $2,967 $3,004 $3,212 $3,507 $3,718 $3,880 $4,011 $3,815 $4,054
Retail services $2,326 $2,437 $2,487 $2,568 $2,751 $2,920 $3,132 $3,390 $3,572 $3,409 $3,593
Other services $649 $680 $756 $805 $940 $883 $907 $949 $1,066 $1,073 $1,093
Overall $9,339 $9,582 $9,720 $9,799 $10,717 $11,465 $12,208 $12,911 $13,332 $12,661 $13,446
% c
hang
e
Accommodation & food services
2.9% 4.8% 2.2% -2.5% 11.5% 8.9% 7.1% 5.4% -0.2% -6.9% 7.9%
Transportation services
8.2% -1.8% -2.1% 1.2% 6.9% 9.2% 6.0% 4.4% 3.4% -4.9% 6.3%
Retail services 21.3% 4.8% 2.1% 3.3% 7.1% 6.1% 7.3% 8.2% 5.4% -4.6% 5.4%
Other services 1.4% 4.8% 11.2% 6.5% 16.8% -6.1% 2.7% 4.6% 12.3% 0.7% 1.9%
Overall 8.7% 2.6% 1.4% 0.8% 9.4% 7.0% 6.5% 5.8% 3.3% -5.0% 6.2%
Source: BC Stats.

Measuring the value of tourism in British Columbia |2000 to 2010 29
TABLE 3: ACCOMMODATION ROOM REVENUE AND YEAR-OVER-YEAR CHANGE BY TOURISM REGION.
Region 1999 2000 2001 2002 2003 2004 2005 2006 2007 2008 2009
Roo
m r
even
ue (
$ m
illio
ns)
Vancouver Island $234 $239 $251 $263 $267 $288 $303 $318 $345 $333 $303
Vancouver, Coast & Mtns
$780 $857 $864 $860 $820 $876 $914 $979 $1,050 $1,062 $923
Thompson Okanagan
$148 $158 $164 $179 $185 $201 $220 $238 $267 $273 $243
Kootenay Rockies
$75 $82 $83 $92 $91 $98 $100 $113 $135 $133 $119
Cariboo Chilcotin Coast
$20 $21 $21 $21 $21 $21 $23 $24 $26 $27 $24
Northern BC $73 $80 $85 $88 $96 $103 $121 $136 $141 $149 $130
Overall $1,329 $1,437 $1,469 $1,503 $1,481 $1,587 $1,682 $1,808 $1,964 $1,977 $1743
% c
hang
e
Vancouver Island 8.5% 2.0% 5.3% 4.4% 1.7% 7.8% 5.4% 4.7% 8.6% -3.4% -9.2%
Vancouver, Coast & Mtns
13.3% 9.9% 0.9% -0.5% -4.6% 6.7% 4.4% 7.1% 7.3% 1.1% -13.1%
Thompson Okanagan
7.1% 7.3% 3.9% 8.5% 3.7% 8.6% 9.5% 8.1% 12.3% 2.1% -10.8%
Kootenay Rockies
11.6% 9.0% 1.6% 10.0% -0.3% 7.5% 2.3% 12.4% 19.4% -1.2% -10.4%
Cariboo Chilcotin Coast
-1.3% 9.0% -2.0% 2.5% -1.8% 1.7% 5.2% 8.1% 5.8% 3.7% -9.6%
Northern BC -4.9% 9.0% 6.1% 3.9% 8.5% 7.7% 17.0% 12.4% 3.9% 6.0% -12.6%
Overall 10.2% 8.1% 2.2% 2.3% -1.5% 7.2% 5.9% 7.5% 8.6% 0.7% -11.9%
Source: BC Stats.

Measuring the value of tourism in British Columbia |2000 to 2010 30
TABLE 4: TOTAL PROVINCIAL TAX REVENUE GENERATED BY THE TOURISM INDUSTRY (2000 TO 2010).
2000 2001 2002 2003 2004 2005 2006 2007 2008 2009 2010
Total provincial taxes A
($ millions) $763 $697 $685 $700 $764 $814 $884 $923 $917 $888 $1,020
% change 4.4% -8.7% -1.7% 2.2% 9.1% 6.5% 8.6% 4.4% -0.7% -3.2% 14.9%
A Provincial taxes include income, hotel, gas, and other taxes.
Source: BC Stats.
TABLE 5: EXPORT REVENUE GENERATED BY THE TOURISM INDUSTRY.
2000 2001 2002 2003 2004 2005 2006 2007 2008 2009 2010
Tourism export revenue ($ millions)
$3,471 $3,650 $3,664 $3,213 $3,568 $3,399 $3,376 $3,466 $3,414 $3,049 $3,240
% change 5.2% 0.4% -12.3% 11.0% -4.7% -0.7% 2.7% -1.5% -10.7% 6.3%
Tourism export revenue data is not available prior to 2000.

Measuring the value of tourism in British Columbia |2000 to 2010 31
TABLE 6: COMPARING EXPORT REVENUES FOR B.C.’S PRIMARY COMMODITIES (2000 TO 2010).
2000 2001 2002 2003 2004 2005 2006 2007 2008 2009 2010
Forest industry $16,591 $14,940 $14,353 $12,997 $15,081 $14,134 $13,560 $12,282 $10,107 $7,602 $9,143 Wood products $9,652 $9,374 $9,284 $8,239 $10,062 $9,485 $8,776 $7,164 $5,408 $4,127 $5,106 Pulp and paper products
$6,939 $5,566 $5,069 $4,758 $5,019 $4,649 $4,784 $5,118 $4,699 $3,475 $4,037
Agriculture and fish $2,125 $2,350 $2,420 $2,371 $2,416 $2,371 $2,421 $2,332 $2,484 $2,424 $2,697 Agriculture and food $1,230 $1,385 $1,406 $1,390 $1,442 $1,386 $1,443 $1,435 $1,585 $1,555 $1,752 Fish products $895 $965 $1,014 $981 $974 $985 $978 $897 $899 $869 $945
Metallic mineral products
$1,836 $1,336 $1,420 $1,535 $2,089 $2,705 $3,581 $3,430 $3,336 $2,491 $3,163
Energy products $6,130 $6,366 $3,713 $4,847 $4,549 $7,801 $6,455 $6,196 $9,623 $6,738 $8,032
Tourism industry $3,471 $3,650 $3,664 $3,213 $3,568 $3,399 $3,376 $3,466 $3,414 $3,049 $3,240
Source: BC Stats.

Measuring the value of tourism in British Columbia |2000 to 2010 32
TABLE 7: TOURISM GDP USING 2002 DOLLARS BY SECTOR (2000 TO 2010).
Sectors 2000 2001 2002 2003 2004 2005 2006 2007 2008 2009 2010
GD
P (
$ m
illio
ns)
Accommodation & food services
$1,926 $1,908 $1,955 $1,943 $2,079 $2,162 $2,211 $2,286 $2,303 $2,205 $2,343
Transportation services
$1,988 $1,950 $1,831 $1,785 $1,905 $2,109 $2,171 $2,229 $2,270 $2,197 $2,279
Retail services $489 $514 $508 $540 $565 $586 $639 $672 $677 $658 $673
Other services $864 $907 $945 $993 $1,030 $1,026 $1,059 $1,095 $1,109 $1,125 $1,154
Overall $5,263 $5,273 $5,238 $5,261 $5,579 $5,883 $6,080 $6,282 $6,359 $6,185 $6,450
% c
hang
e
Accommodation & food services
-0.6% -0.9% 2.5% -0.6% 7.0% 4.0% 2.3% 3.4% 0.7% -4.3% 6.3%
Transportation services
7.3% -1.9% -6.1% -2.5% 6.7% 10.7% 2.9% 2.7% 1.8% -3.2% 3.7%
Retail services 8.7% 5.1% -1.2% 6.3% 4.6% 3.7% 9.0% 5.2% 0.7% -2.8% 2.3%
Other services 3.5% 5.0% 4.2% 5.1% 3.7% -0.4% 3.2% 3.4% 1.3% 1.4% 2.6%
Overall 3.9% 0.2% -0.7% 0.4% 6.0% 5.5% 3.4% 3.3% 1.2 % -2.7% 4.3%
Source: BC Stats.

Measuring the value of tourism in British Columbia |2000 to 2010 33
TABLE 8: COMPARING GDP OF TOURISM SECTORS USING AN INDEX WHERE 2002 = 100.
Sectors 2000 2001 2002 2003 2004 2005 2006 2007 2008 2009 2010
Accommodation & food services
99 98 100 99 106 111 113 117 118 113 120
Transportation services 109 106 100 97 104 115 119 122 124 120 124
Retail services 96 101 100 106 111 115 126 132 133 130 132
Other services 91 96 100 105 109 109 112 116 117 119 122
Tourism industry 100 101 100 100 107 112 116 120 121 118 123
Source: BC Stats.
TABLE 9: COMPARING GDP OF B.C. PRIMARY RESOURCE INDUSTRIES (2000 TO 2010).
Industries 2000 2001 2002 2003 2004 2005 2006 2007 2008 2009 2010
GD
P (
$ m
illio
ns) Agriculture $1,736 $1,834 $1,716 $1,739 $1,745 $1,777 $1,789 $1,774 $1,695 $1,686 $1,658
Forestry $2,638 $2,647 $2,713 $2,761 $3,129 $3,102 $3,022 $2,855 $2,463 $2,168 $2,514
Mining, oil and gas extraction
$3,344 $4,252 $4,383 $4,298 $4,270 $4,643 $4,619 $4,422 $4,598 $4,293 $4,595
Tourism $5,263 $5,273 $5,238 $5,261 $5,579 $5,883 $6,080 $6,282 $6,359 $6,185 $6,450
Inde
x (2
002
= 1
00) Agriculture 101 107 100 101 102 104 104 103 99 98 97
Forestry 97 98 100 102 115 114 111 105 91 80 93
Mining, oil and gas extraction
76 97 100 98 97 106 105 101 105 98 105
Tourism 100 101 100 100 106 112 116 120 121 118 123
Source: BC Stats http://www.bcstats.gov.bc.ca/data/bus_stat/bcea/BCEAchnd.asp

Measuring the value of tourism in British Columbia |2000 to 2010 34
TABLE 10: TOURISM ESTABLISHMENTS BY BUSINESS SIZE (2000 TO 2010).
Business size 2000 2001 2002 2003 2004 2005 2006 2007 2008 2009 2010
Est
ablis
hmen
ts
1 to 4 employees 7,723 7,842 7,737 8,302 7,995 8,177 8,256 6,179 6,121 6,177 6,208
5 to 9 employees 3,182 3,259 3,260 3,234 3,266 3,133 3,170 3,886 3,816 3,823 3,830
10 to 19 employees 2,991 2,974 2,991 3,038 3,007 2,980 2,937 3,538 3,687 3,684 3,576
20 to 49 employees 2,645 2,490 2,563 2,235 2,408 2,454 2,438 2,691 2,744 2,744 2,949
50 to 199 employees 1,349 1,270 1,316 1,178 1,221 1,204 1,220 1,230 1,248 1,230 1,226
200 or more employees 131 131 129 127 138 146 166 138 158 156 154
Overall 18,021 17,966 17,996 18,114 18,035 18,094 18,187 17,662 17,774 17,814 17,943
% c
hang
e
1 to 4 employees -1.0% 1.5% -1.3% 7.3% -3.7% 2.3% 1.0% -25.2% -0.9% 0.9% 0.5%
5 to 9 employees 0.7% 2.4% 0.0% -0.8% 1.0% -4.1% 1.2% 22.6% -1.8% 0.2% 0.2%
10 to 19 employees 4.1% -0.6% 0.6% 1.6% -1.0% -0.9% -1.4% 20.5% 4.2% -0.1% -2.9%
20 to 49 employees 0.0% -5.9% 2.9% -12.8% 7.7% 1.9% -0.7% 10.4% 2.0% 0.0% 7.5%
50 to 199 employees 24.1% -5.9% 3.6% -10.5% 3.7% -1.4% 1.3% 0.8% 1.5% -1.4% -0.3%
200 or more employees 15.9% 0.0% -1.5% -1.6% 8.7% 5.8% 13.7% -16.9% 14.5% -1.3% -1.3%
Overall 1.9% -0.3% 0.2% 0.7% -0.4% 0.3% 0.5% -2.9% 0.6% 0.2% 0.7%
Note: The decrease in the number of tourism establishments with one to four employees in 2007 is attributed to the introduction of new “inactivation rules” in the redesigned Business Register to detect inactive businesses as early as possible, which results in more accuracy in reflecting the operating structure of businesses (http://ivt.crepuq.qc.ca/industries/documentation/brengl3.pdf). Source: BC Stats.

Measuring the value of tourism in British Columbia |2000 to 2010 35
TABLE 11: TOURISM ESTABLISHMENTS BY INDUSTRY SECTOR (2000 TO 2010).
Sectors 2000 2001 2002 2003 2004 2005 2006 2007 2008 2009 2010
Est
ablis
hmen
ts
Food & beverage 9,525 9,450 9,491 9,636 9,586 9,603 9,511 9,412 9,545 9,609 9,913
Accommodation 2,122 2,108 2,071 2,032 2,015 2,027 2,028 1,927 1,927 1,906 1,913
Transportation 3,525 3,502 3,483 3,494 3,472 3,485 3,563 3,369 3,356 3,389 3,260
Amusement, gambling & recreation
1,817 1,822 1,824 1,794 1,756 1,746 1,780 1,760 1,751 1,714 1,676
Performing arts & sports
831 886 929 968 963 1,010 1,089 983 994 984 973
Heritage institutions
201 198 198 190 243 223 216 211 201 212 208
Overall 18,021 17,966 17,996 18,114 18,035 18,094 18,187 17,662 17,774 17,814 17,943
% c
hang
e
Food & beverage 2.0% -0.8% 0.4% 1.5% -0.5% 0.2% -1.0% -1.0% 1.4% 0.7% 3.2%
Accommodation 0.6% -0.7% -1.8% -1.9% -0.8% 0.6% 0.0% -5.0% 0.0% -1.1% 0.4%
Transportation 2.1% -0.7% -0.5% 0.3% -0.6% 0.4% 2.2% -5.4% -0.4% 1.0% -3.8%
Amusement, gambling & recreation
-0.7% 0.3% 0.1% -1.6% -2.1% -0.6% 1.9% -1.1% -0.5% -2.1% -2.2%
Performing arts & sports
12.0% 6.6% 4.9% 4.2% -0.5% 4.9% 7.8% -9.7% 1.1% -1.0% -1.1%
Heritage institutions
-3.4% -1.5% 0.0% -4.0% 27.9% -8.2% -3.1% -2.3% -4.7% 5.5% -1.9%
Overall 1.9% -0.3% 0.2% 0.7% -0.4% 0.3% 0.5% -2.9% 0.6% 0.2% 0.7%
Source: BC Stats.

Measuring the value of tourism in British Columbia |2000 to 2010 36
TABLE 12: TOURISM ESTABLISHMENTS BY REGION (2000 TO 2010).
Region 2000 2001 2002 2003 2004 2005 2006 2007 2008 2009 2010
Vancouver Island 2,511 2,460 2,421 2,991 2,994 2,994 3,014 2,933 2,998 3,014 3,091
Vancouver, Coast & Mtns
9,743 9,767 9,847 10,190 10,169 10,323 10,346 9,964 10,014 10,122 10,167
Thompson Okanagan 2,048 2,046 2,037 2,343 2,329 2,302 2,339 2,168 2,231 2,200 2,206
Kootenay Rockies 755 744 733 940 903 884 882 854 873 862 860
Cariboo Chilcotin Coast 219 208 197 368 369 355 365 360 376 357 351
Northern BC 1,050 1,033 1,020 1,259 1,234 1,202 1,201 1,144 1,132 1,131 1,137
Standard geographic coding not available
1,695 1,708 1,741 23 37 34 40 239 150 128 131
Total establishments 18,021 17,966 17,996 18,114 18,035 18,094 18,187 17,662 17,774 17,814 17,943
% change 1.9% -0.3% 0.2% 0.7% -0.4% 0.3% 0.5% -2.9% 0.6% 0.2% 0.7%
Note: The year-over-year change by region is not shown. The number of businesses without geocoding decreased dramatically in 2003, creating spurious growth in number of establishments by region compared with 2002. Source: BC Stats.

Measuring the value of tourism in British Columbia |2000 to 2010 37
TABLE 13: TOURISM EMPLOYMENT BY SECTOR (2000 TO 2010).
Sectors 2000 2001 2002 2003 2004 2005 2006 2007 2008 2009 2010
Em
ploy
men
t
Accommodation & food services
50,900 54,000 54,900 55,500 56,100 58,000 61,400 63,300 65,500 63,400 63,300
Transportation services
27,700 29,800 28,300 29,200 30,000 31,400 31,900 33,000 33,700 33,200 32,900
Retail services 13,300 14,200 14,800 15,400 15,900 16,400 17,200 18,000 18,600 18,100 17,600
Other services 10,400 12,000 12,200 12,200 13,300 12,700 13,000 13,100 13,700 14,000 13,700
Overall 102,400 109,900 110,100 112,200 115,200 118,400 123,500 127,300 131,400 128,700 127,400
% c
hang
e
Accommodation & food services
1.0% 6.1% 1.7% 1.1% 1.1% 3.4% 5.9% 3.1% 3.5% -3.2% -0.2%
Transportation services
-0.7% 7.6% -5.0% 3.2% 2.7% 4.7% 1.6% 3.4% 2.1% -1.5% -0.9%
Retail services 0.8% 6.8% 4.2% 4.1% 3.2% 3.1% 4.9% 4.7% 3.3% -2.7% -2.8%
Other services 0.0% 15.4% 1.7% 0.0% 9.0% -4.5% 2.4% 0.8% 4.6% 2.2% -2.1%
Overall 0.5% 7.3% 0.2% 1.9% 2.7% 2.8% 4.3% 3.1% 3.2% -2.1% -1.0%
Source: BC Stats.
Measuring the value of tourism in British Columbia |2000 to 2010 38
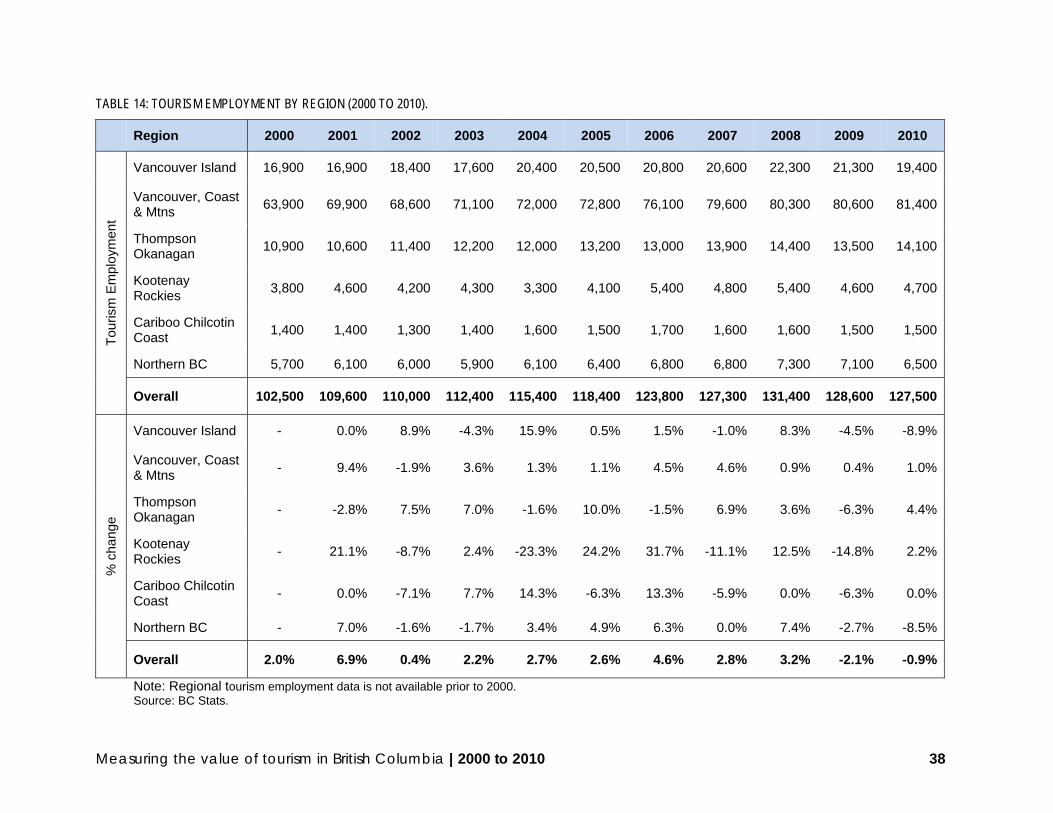
TABLE 14: TOURISM EMPLOYMENT BY REGION (2000 TO 2010).
Region 2000 2001 2002 2003 2004 2005 2006 2007 2008 2009 2010
Tou
rism
Em
ploy
men
t
Vancouver Island 16,900 16,900 18,400 17,600 20,400 20,500 20,800 20,600 22,300 21,300 19,400
Vancouver, Coast & Mtns
63,900 69,900 68,600 71,100 72,000 72,800 76,100 79,600 80,300 80,600 81,400
Thompson Okanagan
10,900 10,600 11,400 12,200 12,000 13,200 13,000 13,900 14,400 13,500 14,100
Kootenay Rockies
3,800 4,600 4,200 4,300 3,300 4,100 5,400 4,800 5,400 4,600 4,700
Cariboo Chilcotin Coast
1,400 1,400 1,300 1,400 1,600 1,500 1,700 1,600 1,600 1,500 1,500
Northern BC 5,700 6,100 6,000 5,900 6,100 6,400 6,800 6,800 7,300 7,100 6,500
Overall 102,500 109,600 110,000 112,400 115,400 118,400 123,800 127,300 131,400 128,600 127,500
% c
hang
e
Vancouver Island - 0.0% 8.9% -4.3% 15.9% 0.5% 1.5% -1.0% 8.3% -4.5% -8.9%
Vancouver, Coast & Mtns
- 9.4% -1.9% 3.6% 1.3% 1.1% 4.5% 4.6% 0.9% 0.4% 1.0%
Thompson Okanagan
- -2.8% 7.5% 7.0% -1.6% 10.0% -1.5% 6.9% 3.6% -6.3% 4.4%
Kootenay Rockies
- 21.1% -8.7% 2.4% -23.3% 24.2% 31.7% -11.1% 12.5% -14.8% 2.2%
Cariboo Chilcotin Coast
- 0.0% -7.1% 7.7% 14.3% -6.3% 13.3% -5.9% 0.0% -6.3% 0.0%
Northern BC - 7.0% -1.6% -1.7% 3.4% 4.9% 6.3% 0.0% 7.4% -2.7% -8.5%
Overall 2.0% 6.9% 0.4% 2.2% 2.7% 2.6% 4.6% 2.8% 3.2% -2.1% -0.9%
Note: Regional tourism employment data is not available prior to 2000. Source: BC Stats.
Measuring the value of tourism in British Columbia |2000 to 2010 39
TABLE 15: TOURISM WAGES AND SALARIES BY SECTOR (2000 TO 2010).
Sectors 2000 2001 2002 2003 2004 2005 2006 2007 2008 2009 2010
Wag
es &
sal
arie
s ($
mill
ions
)
Accommodation & food services
$1,114 $1,215 $1,208 $1,234 $1,336 $1,423 $1,542 $1,622 $1,678 $1,523 $1,586
Transportation services
$1,397 $1,396 $1,349 $1,334 $1,401 $1,509 $1,653 $1,761 $1,842 $1,767 $1,690
Retail services $284 $315 $326 $344 $366 $395 $427 $459 $492 $491 $503
Other services $406 $448 $469 $475 $504 $507 $526 $527 $541 $582 $609
Overall $3,200 $3,374 $3,352 $3,387 $3,607 $3,834 $4,148 $4,369 $4,553 $4,362 $4,389
% c
hang
e
Accommodation & food services
2.1% 9.1% -0.6% 2.2% 8.3% 6.5% 8.4% 5.2% 3.5% -9.2% 4.1%
Transportation services
4.1% -0.1% -3.4% -1.1% 5.0% 7.7% 9.5% 6.5% 4.6% -4.1% -4.4%
Retail services 1.1% 10.9% 3.5% 5.5% 6.4% 7.9% 8.1% 7.5% 7.2% -0.2% 2.4%
Other services 3.0% 10.3% 4.7% 1.3% 6.1% 0.6% 3.7% 0.2% 2.7% 7.6% 4.6%
Overall 3.0% 5.4% -0.7% 1.0% 6.5% 6.3% 8.2% 5.3% 4.2% -4.2% 0.6%
Source: BC Stats.
Measuring the value of tourism in British Columbia |2000 to 2010 40
TABLE 16: INTERNATIONAL VISITOR VOLUME (2005 TO 2010).
Volume (thousands) % change
Market 2005 2006 2007 2008 2009 2010 05-06 06-07 07-08 08-09 09-10 05-10
United States 3,536 3,518 3,394 3,147 2,899 2,955 -1% -4% -7% -8% 2% -16% Washington 1,332 1,257 1,201 1,187 1,153 1,133 -6% -5% -1% -3% -2% -15%
California 466 488 474 419 375 414 5% -3% -12% -10% 10% -11%
Oregon 202 209 188 162 148 186 3% -10% -14% -9% 26% -8%
Arizona 86 75 78 64 61 54 -13% 4% -18% -5% -11% -37%
Florida 104 93 91 93 65 85 -10% -3% 2% -30% 30% -18%
Texas 123 136 127 117 118 91 11% -7% -8% 0% -23% -26%
Mexico 59 62 69 82 64 54 4% 12% 20% -22% -16% -10%
Asia/Pacific 757 744 765 738 611 713 -2% 3% -4% -17% 17% -6% Japan 204 183 172 125 84 105 -10% -6% -28% -33% 26% -48%
Taiwan 91 88 75 49 37 41 -3% -14% -36% -25% 11% -55%
Hong Kong 62 58 63 77 60 69 -7% 10% 22% -22% 16% 13%
Australia 113 119 144 142 129 126 6% 21% -2% -9% -2% 12%
South Korea 107 120 110 104 73 94 12% -8% -6% -30% 28% -12%
China 65 65 69 90 92 109 0% 6% 30% 2.2% 18% 66%
New Zealand 21 23 25 36 31 35 10% 8% 45% -14% 13% 68%
India 8 9 22 23 26 48 10% 140% 5% 14.7% 81% 480%
Europe 595 576 635 624 557 601 -3% 10% -2% -11% 8% 1% United Kingdom 298 289 324 293 235 231 -3% 12% -9% -20% -2% -23%
Germany 111 104 101 112 111 120 -6% -3% 10.3% -1% 8% 7%
Netherlands 43 45 48 50 43 50 3% 7% 5% -16% 18% 16%
France 17 19 23 27 25 31 12% 23% 17% -7% 22% 82%
Other overseas 35 51 48 39 44 41 46% -7% -19% 15% -7% 17%
TOTAL INTERNATIONAL
4,983 4,951 4,911 4,630 4,175 4,364 -1% -1% -6% -10% 5% -12%

Measuring the value of tourism in British Columbia |2000 to 2010 41
TABLE 17: INTERNATIONAL VISITOR EXPENDITURES (2005 TO 2010).
Expenditures ($ millions) % change
Market 2005 2006 2007 2008 2009 2010 05-06 06-07 07-08 08-09 09-10 05-10
United States $1,722 $1,727 $1,671 $1,567 $1,424 $1,519 0% -3% -6% -9% 7% -12% Washington $402 $371 $369 $365 $364 $384 -8% -1% -1% 0% 6% -4%
California $289 $329 $323 $290 $246 $261 14% -2% -10% -15% 7% -10%
Oregon $90 $88 $94 $95 $91 $97 -3% 7% 2% -5% 8% 8%
Arizona $60 $49 $47 $38 $36 $39 -18% -4% -19% -6% 8% -35%
Florida $72 $54 $46 $42 $36 $55 -25% -14% -10% -13% 50% -24%
Texas $88 $92 $80 $83 $77 $72 5% -13% 4% -8% -6% -18%
Mexico $74 $79 $83 $96 $89 $67 7% 6% 16% -7% -25% -10%
Asia/Pacific $815 $824 $844 $898 $786 $845 1% 2% 6% -12% 8% 4% Japan $236 $194 $164 $138 $111 $126 -18% -16% -16% -20% 14% -47% Taiwan $75 $75 $71 $49 $44 $42 0% -5% -31% -10% -4% -43%
Hong Kong $68 $53 $58 $70 $59 $64 -22% 10% 20% -15% 8% -6%
Australia $128 $144 $177 $191 $172 $166 13% 23% 8% -10% -4% 30% South Korea $124 $162 $138 $165 $117 $150 31% -15% 20% -28% 28% 21%
China $68 $75 $101 $121 $135 $132 11% 34% 20% 12% -3% 94%
New Zealand $10 $19 $22 $48 $49 $42 95% 17% 114% 2% -15% 325% India $2 $3 $11 $16 $18 $37 38% 249% 42% 10% 111% 1485%
Europe $744 $687 $808 $807 $698 $764 -8% 18% -0.1% -14% 10% 3% United Kingdom $384 $338 $392 $369 $268 $263 -12% 16% -6% -27% -2% -32% Germany $143 $126 $113 $147 $156 $163 -12% -11% 31% 6% 5% 14%
Netherlands $42 $50 $54 $67 $57 $61 20% 6% 24% -14% 8% 47%
France $22 $26 $37 $26 $30 $44 18% 43% -30% 16% 43% 97%
Other overseas $43 $60 $59 $46 $53 $45 37% -1% -22% 15% -15% 4%
TOTAL INTERNATIONAL
$3,399 $3,376 $3,466 $3,414 $3,049 $3,240 -1% 3% -2% -11% 6% -5%

Measuring the value of tourism in British Columbia |2000 to 2010 42
TABLE 18: DOMESTIC CANADIAN VISITOR VOLUME AND EXPENDITURES (2010).
Region Visitor volume
(thousands)
Expenditures ($millions)
British Columbia 8,414 $2,505
Alberta 2,095 $1,234
Ontario 468 $548
Quebec 86 $77
Prairies 263 $216
Atlantic 38 $62
Total 11,365 $4,643