2012 - pma · 4-7 government debt structure, 2008-2012 28 4-8 government debt as a percent of gdp,...
TRANSCRIPT
Financial Stability Assessment
2012FINANCIAL STABILITY REPORT
Research and Monetary Policy Department
September, 2013

Financial Stability Assessment
Financial Stability Assessment
© September, 2013All Rights Reserved.
In the case of quotation, please refer to this publication as follows:Palestine Monetary Authority (PMA), 2013. Finanical Stabilty Report 2012: September Ramallah – Palestine
All Correspondence shall be directed to:Palestine Monetary Authority (PMA)P. O. Box 452, Ramallah, Palestine
Tel.: (+ 970) 2-2409920Fax: (+ 970) 2-2409922E-mail: [email protected] Page : www.pma.ps

III
ForewordFinancial stability alongside monetary stability has acquired increased attention after becoming the primary target of a number of central banks. The great emphasis central banks and international financial institutions have given to financial stability reflects the state of the financial sector and its ability to cope with risks, and carry out its functions of supporting economic growth and realizing sustainable development efficiently and effectively.
Given that the banking sector is the backbone of the Palestinian financial system, it is the most vulnerable to risks, especially since other non-banking financial institutions are still in the developmental and founding stages. However, some of these institutions have witnessed significant progress, particularly in the stock market and the field of insurance.
The Palestine Monetary Authority (PMA) views financial stability as the state which allows smooth flowing of funds between households, firms, and the government and between residents and the rest of the world. This requires the operation of sound financial intermediaries and well-functioning financial markets on the one hand. On the other hand, financial stability requires that financial corporation’s be resilient to adverse macroeconomic shocks, to credit risk, to liquidity shocks and to contagion risk. It also requires sufficient liquidity, and a good measure of confidence in the operation of the financial markets.
As such, financial instability can manifest itself through bank failures, excessive leverage and credit growth either in the aggregate or in some sectors or debtor categories , poor quality of debt and loans, asset price bubbles, drying up of liquidity, and fading confidence in the financial system.
The PMA’s mission is to ensure the maintenance of price stability and to contribute to financial stability both in the interest of balanced and sustainable economic growth. The PMA’s analysis of financial stability and the publication of a Financial Stability Report (FSR) is directly connected to its mandate as the sole institution that is authorized to oversee the payment service providers and the safety and efficacy of the payment systems to ensure financial stability.
The FSR describes the PMA’s assessment of the risks and potential threats to the financial intermediaries and to the financial system and evaluates the system’s resilience in the face of these risks and threats. By publishing this report, the PMA wishes to communicate the results of its assessments and stimulate debate on the pertinent issues. In these reports and on the basis of its assessments, the PMA makes recommendations to enhance financial stability and, whenever necessary, to avoid and overcome potential risks and threats.
GovernorDr. Jihad Khalil Alwazir

IV
Contents
Chapter one: Financial Stability Assessment
1Overview
11- Underlying risks in the Palestinian financial system
22- Risks facing the banking sector
43- risks linked with non-banking financial institutions
44- Infrastructure development of the financial system
Chapter Two: Global and Local Economic Developments
5Overview
51- Global economy
62- Israeli economy
73- Jordanian economy
74- Local economy
Chapter Three: Infrastructure and Development Indicators in The Financial System
13Overview
131- Legal and regulatory framework
142- Developments and updates of the banking system
163- Development indicators in the financial system
Chapter Four: Credit Risks in The Banking Sector
21Overview
211- Risks associated with credits granted to public and private sectors
222- Risks associated with credits granted to households and corporate sector
233- Risks associated with credits granted according to residency
244- Risks associated with credits granted to mortgage and housing
255- Risks associated with NPLs
266- Risks associated with public finance
Contents

V
Contents
Chapter Five: Financial Soundness Indicators of The Banking Sector
31Overview
311- Capital indicators
332- Asset quality indicators
343- Profitability indicators
354- Liquidity Indicators
Chapter Six: Development In Non-Banking Financial Institutions
37Overview
371- Money changers
382- Specialized lending Institutions
383- Securities sector
394- Insurance sector
415- Mortgage sector
426- Financial leasing sector
Chapter Seven: Financial Pressure “Stress Testing”: A Future Outlook
43Overview
431- Macroeconomic stress testing
452- Interbanking stress testing
Tables17Financial services developments, 2008-20123-1
18Number of accounts and values in banks operating in Palestine, 2008-20123-2
22Sectoral distribution of credit according to banks nationality, 2008-2012 4-1
22Credit distribution according to bank nationality, 2008-20124-2
23Credit distribution according to residency and bank nationality, 2008-20124-3
24Housing and mortgage credit portfolio according to bank nationality, 2008-20124-4
36Soundness indicators of banks operating in Palestine, 2008-2012 5-1
37Money changers in Palestine, 2010-20116-1
39Financial operational indicators of insurance companies, 20126-2
41Performing indicators for mortgage sector, 2008-20126-3
44 Change in provisions forecasts according to different scenarios7-1
45Capital adequacy ratio for banks operating in Palestine after the shock, 20127-2

VI
Contents
Figures
6Bank of Israel interest rate (monthly), 20122-1
8Real GDP growth rate in Palestine comparing with other regions, 2008-20122-2
8USD exchange rate fluctuations against NIS (annual, period average), 2008-20122-3
8USD/NIS exchange margins (period average), 2008-20122-4
9Total deposits at banks operating in Palestine by currency, 2008-20122-5
9Credit portfolio by currency, 2008-20122-6
9Deposit and lending rates in Palestine by currency, 2008-20122-7
16Branches of banks operation in Palestine, 2008-20123-1
16Herfindahl index, 2008-20123-2
19Credits as a percent of GDP in Palestine and some neighboring countries, 2008-20123-3
19Private sector credits as a percent of total credits in Palestine and some neighboring countries, 2008-2012
3-4
19Private sector deposits as a percent of customer deposits in Palestine and some neighboring countries, 2008-2012
3-5
20Credit to deposit ratio in Palestine and some neighboring countries, 2008-20123-6
20PEX market capitalization as a percent of GDP in Palestine and some neighboring countries,2008-2012
3-7
21Distribution of credit portfolio between private and public sector, 2008-20124-1
25NPLs structure in local banks, 2008-20124-2
26NPLs structure in foreign banks, 2008-20124-3
27Public finance weakness and its potential impacts on financial stability, 20124-4
28Government revenue structure, 2008-20124-5
28Government revenue as a percent of current expenditures, 2008-20124-6
28Government debt structure, 2008-20124-7
29Government debt as a percent of GDP, 2008-20124-8
32Capital adequacy ratio, 2008-20125-1
32(NPLs-provisions) as a percent of core capital, 2008-20125-2

VII
Contents
33Core capital as a percent of total assets, 2008-20125-3
33Large-expousures as a percent of core capital, 2008-20125-4
34NPLs as a percent of total credits, 2008-20125-5
34Total credits as a percent of total assets, 2008-20125-6
35Return on average assets (ROAA), 2008-20125-7
35Return on average core capital, 2008-20125-8
35Liquid assets as a percent of total assets, 2008-20125-9
36Liquid assets as a percent of short-term liabilities, 2008-20125-10
40Linkages between insurance and banking sector, 2008-20126-1
42Housing and mortgage loans, 20126-2
42NPLs according to subsectors, 2011-20126-3
45Capital adequacy ratio for banks operating in Palestine before and after the shock, 20127-2
10Arab safety net and the shortage of liquidity in Palestine1
15Foreign account tax compliance act (FATCA)2
Boxes


1
Financial Stability Assessment1. Underlying risks to the Palestinian Financial System
The analysis of risks to which the Palestinian financial system may be vulnerable requires first the identification of the institutions in this system. It also calls for the analysis of relations and channels of impact transmission between institutions (banking and non-banking) in order to determine the substantial risk pits, and potential financial contagion between the institutions embraced by the Palestinian financial system. This would ensure clarity of vision for those in charge of managing and controlling the system, and would assist them in making policy, and in taking suitable measures to face risks and their possible consequences. Analysis shows the conditions of financial stability in Palestine to be sensitive to three main sources of risks.
Chapter One Financial Stability Assessment
Overview
The risks which the Palestinian financial system with all its banking and non-banking institutions faces emanate from several sources. Perhaps the most prominent and dangerous of these are found in the continued Israeli occupation, and the dependency of the Palestinian economy on the Israeli counterpart, the internal political schism, and the consequent adverse repercussions felt in all other areas. Other underlying risks to the financial system reflect the financial difficulties that the government faces, and the risks arising from structural problems caused by the failure to complete the legislative framework and governance measures for non-banking financial institutions. Legal challenges associated with compliance with the American tax law “The Foreign Account Tax Compliance Act-FATCA”, are also a source of concern. In addition, there are dangers which may be transmitted to the Palestinian financial system from neighboring countries, especially those which suffer from a lack of political and economic stability, and other risks that may pose a threat to financial stability.
In spite of these risks, financial soundness indicators for 2012 reflected the ability of banking system to withstand risks, supported by the continued development in infrastructure, which include laws, regulations and procedures governing the operations of these entities.

2
Financial Stability Assessment
First: the continued Israeli occupation and control of crossings, hampering communication between Palestinian cities and their isolation, and the Palestinian economy’s forced reliance on the Israeli economy. Palestine is therefore greatly affected by the dependency on, and the effects of Israeli economic and monetary policies. This is especially so considering the country’s monetary dependency and the use of the Israeli Shekel (NIS) as the most widely circulated currency within Palestine. Although essentially external, this risk needs to be dealt with as an inevitable reality; this requires specially adaptive policy in order to withstand possible consequences. These consequences are not limited to the Palestinian financial system, but in fact extend to all aspects of Palestinian life whether economic, social, political or security-related.
Second: the Palestinian government’s increasing dependency on the banking system to finance budget deficits due to the lack of other alternatives and financial instruments available to the government, such as bonds and bills. This increase coincides with the vast decline in the amount of foreign aid and occasional delays in clearance revenue transfers from Israeli authorities. Obviously, the funds derived from both sources are not subject to the direct control of the Palestinian government, but rather to political and economic developments, adding a sense of irregularity and vulnerability to government revenues. These sources (foreign aid and clearance revenues) are considered as the main channels of risks which the Palestinian banking system may be exposed to.
Third: the continued internal political schism and the subsequent multiplicity and in some cases conflicts of policies, laws and decisions, especially those related to the economy. This may cause significant distortions and abnormalities in the structure of the economy in general, and the financial system in particular. The situation is aggravated by the fact that some banks in Gaza were licensed and opened without the supervision of the PMA, the only legal body authorized to license and supervise banks, foreign exchange companies and specialized lending institutions. In addition, some financial companies and institutions in the field of insurance were opened without obtaining the required licenses from the Palestine Capital Market Authority (PCMA). This unhealthy work environment helped the informal sector to prosper, and consequently undermined the safety of the Palestinian economy in general and the financial sector in particular. The essential step to face these risks is only the quick completion of the reconciliation process. If there are any delays in this process, it will only deepen the problems from which the Palestinian economy already suffers.
2. Risks facing the Banking SystemAnalysis of the risks and developments which the banking sector witnessed in 2012 reveal that the substantial risk which this system faces is not in its systems and internal management as much as in its exposure to the financial crisis of the government. There are three implications of this risk:
i. The first is the substantial increase in government’s recourse to borrowing from banks, most notably as a result of the decrease in foreign aid, and the continous deficit in the overall budget’s balance, especially in recent years. The outstanding debt owed to banks by the Palestinian government reached around US Dollars (USD) 1.4 billion (around 55.8 percent of the government’s public debt) at the end of 2012, in comparison to the USD 0.5 billion in 2008.
ii. Second is the mounting credit facilities granted to public sector employees and the risk of default. This may be manifested in either the inability of the government to pay the wages or irregularity in these payments.
iii. Third are the facilities extended by banks to private sector institutions that deal with the government and the occasional inability of government to repay their dues to these institutions, which leads to the default of these institutions to repay their debts to the banks.
The potential risks and fears in public finance stem from the inveterate dependency on foreign aid, which formed around 29.5 percent of revenues and grants in the year 2012. It is a known fact that this aid is linked with

3
Financial Stability Assessment
economic and political conditions that prevail in donor countries or in Palestine. As a consequence, such source is not characterized by continuity and consistency, but rather fluctuates greatly, creating a source of risk to the government’s ability to meet its obligations. This is in addition to the fact that foreign aid received by the Palestine Authority (PA) is in currencies other than the main currency of expenditure (NIS), subjecting proceeds to further fluctuations due to changes in exchange rates. Such conditions prompted the Palestinian government to depend increasingly on banks operating in Palestine in order to finance public spending.
The continued recourse of the government to borrowing from the banking sector has led to a state of uncertainty in fiscal sustainability on the one hand, and crowding out the private sector from obtaining financing, on the other. This situation may lead to the incapacity of the private sector to support growth as a result of insufficient funding or a rise in costs. It is worth mentioning that the ratio of credit extended to the government has increased from about 29.1 percent in 2008 to 33.5 percent of total credit granted in 2012.
As for the performance of the banking system, the financial soundness indicators reflected a good measure of stability, and the capacity to endure risks. The capital adequacy ratio for all banks operating in Palestine reached 20.3 percent at the end of 2012, in comparison to 21.1 percent in the previous year. Likewise, non-performing loans (NPLs) minus provisions relative to capital increased from 3.8 percent in the year 2011, to 4.9 percent in 2012. This may have affected capital’s ability to face the most prominent banking risks i.e., credit default. Even though NPLs increased to 3.1 percent of total loans, in comparison to 2.8 percent in 2011, this ratio remains generally low in comparison to those in other countries, and it does not pose a serious threat to financial stability.
With regard to profitability indicators, the Return on Average Assets (ROAA) remained almost stable in 2012 at 1.8 percent in comparison to 1.9 percent in the previous year. Furthermore, the Return on Core Capital fell to 16.3 percent in 2012, compared to 17 percent in 2011. As for liquidity, the liquid assets to short-terms liabilities was 49.3 percent in 2012 as opposed to 49 percent in the previous year.
Financial depth indicators have also improved as credit facilities increased to 40.2 percent of GDP in 2012, while it was 35 percent in the previous year. However, this ratio seems low compared to neighboring countries, reflecting a relative weakness in the strength of interaction between the banking system and real economic sectors. It is noteworthy that the PMA aims to increase domestic credit and strengthen relations between the banking sector and the real economy by reducing the level of banks’ placements abroad .
The previous indicators mirror the extent of progress and improvement made in the financial intermediation process in Palestine, whereby the ratio of loans to customer deposits increased from 50.9 percent in 2011 to 56.1 percent in 2012. This ratio is moderate compared to neighboring countries, where it was 71.4 percent in Jordan, 49.5 percent in Egypt and 54 percent in Lebanon in 2012.
On another side, and in the framework of enhancing and deepening the analysis of risks which banks operating in Palestine may be exposed to, the PMA conducted financial stress tests under specific scenarios. Two tests were completed: the first measures the flexibility of banks operating in the Palestinian economy to withstand adverse shocks on the macroeconomic level. Loan provisions were used as a measure of financial default. A number of variables were chosen on the macro-economic level in order to measure its effects on these provisions, such as: growth rate, inflation rate, interest rate on loans and deposits on currencies circulated in the Palestinian economy, and the exchange rates of the U.S dollar and the JD against the IsraeliNIS.
The tests were carried out according to two scenarios: the baseline scenario and the pessimistic scenario. The results showed that according to the baseline scenario, the net loan provisions will increase by about USD 1.7 million in 2013. On the contrary, according to the pessimistic scenario, these will plunge by USD 9.2 million in the same time frame. The second test examines the resilience of banks to the collapse of any one of the banks operating in Palestine. The results illustrated bank immunity in terms of capital adequacy and the limited contagion effects on the rest of the

4
Financial Stability Assessment
banks in the hypothetical event of one of them failing.
3. Risks linked with Non-banking Financial InstitutionsRisk analysis results in regard to other non-banking financial institutions, specially the specialized lending institutions, revealed that these institutions do not pose a substantial risk to the stability of the Palestinian financial system due to the small size of their operations compared to banks. Loans granted by specialized lending institutions did not exceed 2.5 percent of the loans offered by the banks, and did not exceed 1 percent of GDP. Accordingly, the limited relationship of these institutions with banks reduces the possibility of risk transmission. In spite of this, there are some risks inherent in these institutions which are found in weak governance practices-a result of multiplicity in the legal form of these institutions, the nature of their work, the financial and administrative systems inherited from many years and the subjugation to more than one regulatory and supervision authority. It should be noted that the PMA has begun to address the causes of weak governance in these institutions and have also begun developing their systems and consolidating their conditions especially since the licensing and supervision of specialized lending institutions system was issued in 2011.
With regards to Palestine Exchange (PEX), and with the aim to increase efficiency of the financial market, toughen governance and transparency, and increase PEX’s investment attractiveness both domestically and internationally, the listing system in the stock exchange was adjusted and divided into two markets. Based on certain conditions, large companies were listed in the first market and relatively small companies were listed in the second market. In the same context, a joint cooperation agreement was signed between the PMA and the Palestine Securities Exchange (PEX) to implement cash settlement procedures for trade transactions in the stock market, using the PMA’s BURAQ system. This agreement may reduce risks in the settlement of trade transactions.
With regards to the insurance sector, the analysis results of the channels transmission of effect between the insurance sector and the banking sector shows that the degree of risk that the banking sector poses to the insurance sector is clearly larger than the banking sector’s exposure to risks arising in the insurance sector. Deposits of insurance companies in banks formed about 14.5 percent of total assets of these companies and 27 percent of their total investments at the end of 2012, while these deposits accounted for only 0.6 percent of total deposits in the banking sector. This is to be expected, especially since the banking sector still carries the largest weight in the financial system in comparison to other financial institutions, which are still in a developing stage.
4. Infrastructure Development of the Financial SystemThe previous risk analyses show the importance of strengthening the financial system’s infrastructure (including legal and supervisory systems and frameworks) as it is the main requisite to achieve financial stability. In this regard, both the PCMA and the PMA persevered to achieve a number of accomplishments in 2012. The PMA issued the “National Payments System”, which demonstrates the importance of using electronic payment systems. The PMA also obtained membership in the International Association of Deposit Insurers (IADA) for its efforts to establish a deposit insurance corporation, which is an essential component of the financial safety net in Palestine. The PCMA Board of Directors also approved the mortgage draft law, in order to facilitate its approval and ratification by the Council of Ministers.
It is noteworthy that the emergence of legal and supervisory challenges facing banks in Palestine could mean the emergence of new risks that may affect the degree of financial stability. One challenge is posed by the new U.S tax bill, FATCA, under which the disclosure of financial account details of individuals possessing U.S citizenships and their subsequent submission to the Internal Revenue Service (IRS), are incumbent upon all financial institutions operating out of the USA (including banks operating in Palestine). Sanctions will be applied to non-cooperating banks by a 30 percent discount from the offending bank accounts in U.S banks. This means that non-cooperative banks will be exposed to both operational and reputational risks. Work is still underway to determine which options are most suitable to comply with this law; consultations as well as internal and regional communications with Arab financial institutions, such as the Union of Arab Banks and the Arab Monetary Fund, are being conducted.
55
Local and International Economic D
evelopments
Chapter Two Local and International Economic Developments
Overview
A range of financial and economic conditions in neighboring countries, in addition to some international financial and economic developments, play a crucial role in influencing the degree of stability in the Palestinian financial sector. Palestine’s forced economic reliance upon the Israeli economy, for example, poses a number of risks that include mainly the Israeli control of clearance revenue which is one of the main pillars of the Palestinian budget, along with the impact generated by fluctuations versus other currencies in the exchange rate of the NIS, the main currency circulating in the Palestinian economy.
Risks from the international environment are associated mainly with foreign aid, which is the other major pillar of the Palestinian economy in general, and the government’s budget in particular. The fluctuations in the value and regularity of such aid constitute one source of instability in the Palestinian financial sector. In addition, the Palestinian external sector (balance of payments) suffers from a structural imbalance due to structural imbalances in the economy, reflecting mainly high imports and a weak export base, exacerbating the current account deficit.
1. Global Economy In 2012, global economic developments indicate a relative improvement on the previous year. This improvement was visible in the mitigation of the financial crises in the euro-area as a direct result of pledges made by countries in the region, and reduced uncertainty due to financial safety nets1. This is to be added to aid contribution by some international institutions such as the International Monetary Fund (IMF), to countries such as Greece, suffering from deep financial problems.
In the U.S, the economic and capital market complications led to the adoption of conflicting policies in some instances. On the one hand, there was an increase in taxes and on the other, a decrease in public expenditure, all in order to reduce budget deficits. However, the Federal Reserve (Fed) continued to inject more money into the economy so as to stimulate growth and activities against the backdrop of still high but declining unemployment rates, and a limited capacity to create sufficient new jobs.
1 Represented by the European Financial Stability Facility (EFSF), the European Financial Stabilization Mechanism (EFSM) and the European Stability Mechanism (ESM).

66
Local and International Economic D
evelopments
The economies of developed countries are extremely vital as they are a key source of aid and support for developing countries. However, the economic and financial problems in the former countries made the flow of aid to the latter countries vulnerable to the risk of rationing or cancellation as a result of priority changes in donor countries. According to the UN’s Annual Economic Stability Report, there has been a decrease in aid to developing countries from developed countries over the past few years, especially those following the global financial crisis, and that this aid remained below commitments by the more affluent countries.
Foreign aid is considered to be one of the most important sources of funding for the Palestinian economy and a key pillar for its sustainability, especially by way of supporting the Palestinian government budget and covering some of its various expenditures. There is no doubt that through this channel the economic and financial risks which developed countries may be vulnerable to will directly impact the Palestinian economy. Furthermore, the U.S dollar is one of the most widely used currency in the Palestinian market; and since a number of assets are valued in the dollar, any changes in the value of the dollar against other currencies will have a direct effect on the value of these assets.
At the regional level, the reliance of the Palestinian economy on the Israeli economy as well as the close link with Jordan, particularly in the banking sector, make developments in these two economies especially important for the Palestinian economy.
2. Israeli EconomyThe Israeli economy demonstrated a slowdown in its performance in 2012, whereby GDP grew by about 3.3 percent in comparison to 4.4 percent in the previous year. With regard to monetary policy, Bank of Israel reduced the interest rate to settle at 2 percent at the end of 2012 as opposed to a 2.75 percent at the beginning of the year. It should be noted that Bank of Israel seeks to maintain price stability and to keep inflation within 1-3 percent band. In order to achieve this goal, monetary policies are monitored and adjusted.
As mentioned above, the Palestinian economy is heavily dependent upon its Israeli counterpart. Thus in addition to the large volume of trade between the two economies and the wide use of theNIS in the Palestinian market, there is also substantial clearance activity between the two economies resulting from the Israeli control of Palestinian external outlets. Finally, there is the significant Palestinian employment in Israel.
These linkages between the two parties make developments in the Israeli economy of huge importance to the Palestinian economy, but not vice versa. This is due to the smallness of the Palestinian economy in all aspects compared to the Israeli economy.
Figure 2-1: Bank of Israel interest rate (monthly), 2012
Perc
ent
Month

77
Local and International Economic D
evelopments
3. Jordanian EconomyThe Jordanian economy recorded a growth of 2.7 percent in 2012, which is very close to the rate of 2011. The inflation rate, however, rose to almost 4.8 percent, reflecting the persistent rise in prices overall, which increased pressures on the jordanian dinar (JD). At the same time, the Central Bank of Jordan’s (CBJ) balances of foreign currencies continued to fall, reaching approximately USD 6.6 billion at the end of 2012, with a recorded decrease of 37 percent compared with the previous year. Likewise, fiscal deficit recorded around 8.2 percent of GDP as opposed to 6.8 percent in the previous year.
Bank interaction between Palestine and Jordan is considered a key determinant of the economic relationship between the two countries. This interaction is manifested in the existence of several Jordanian banks holding a large market share in the banking activities of Palestine, whether in terms of deposits or facilities. This is in addition to the use of the JD, alongside the NIS and the U.S dollar.
There is no doubt that the developments in the Jordanian economy increase pressures on the Jordanian currency, and so, any additional risks that this currency may be exposed to will directly affect the Palestinian economy. Likewise, Jordanian banks’ branches and offices operating in Palestine are another channel of transmission of risk from the Jordanian financial sector to its Palestinian counterpart.
4. Local Economy Palestinian real GDP recorded a growth of 5.9 percent in 2012, compared with 12.2 percent in the previous year, while the global economy has grown by 3.2 percent in 2012, compared to 4 percent in 2011. Likewise, the group of developing countries achieved a growth of 5.1 percent in 2012, versus 6.4 percent in the previous year.
Although the Palestinian economy’s performance is not immune to the direct or indirect impact of global economic performance and the like, it is still governed by a set of exceptional factors, such as the continued Israeli occupation and control of crossings, and the internal political schism, etc. All these directly affect the Palestinian Economy in general and the financial sector in particular. It is possible to consider the latter factors as the main channels of transmission of potential risk to the Palestinian financial system.
• Exchange RatesThe Palestinian multi-currency economy has become exposed to the risk of exchange fluctuations in the aforementioned three currencies. Historical exchange rate data of currencies used in the Palestinian market, specifically the U.S dollar and the IsraeliNIS indicate instability in the exchange rate between these two currencies.
The exchange rate fluctuations in these two currencies are reflected almost entirely in the exchange rate between theNIS and the dinar as a result of the fixed exchange rate between the dollar and the dinar. Figure 2-3 shows clearly the fluctuations in the exchange rates between the dollar and theNIS. Although the source of these fluctuations is external, they still affect the Palestinian economy in terms of prices, the value of assets and other vital economic
Figure 2-2: Real GDP growth rate in Palestine comparing with other regions, 2008-2012
Perc
ent
Plestine WorldEmerging countries

88
Local and International Economic D
evelopments
and financial indicators. In contrast, it is unlikely for the Palestinian economy to have any effects on the two currencies, as it is a small economy compared to that of Israel.
On the other side, figure 2-4 demonstrates that the exchange market in Palestine was not exposed to any disturbances as a result of instability in exchange rates between the two currencies.
The margin between the buying and selling rates remained stable at 0.1 NIS per dollar on average between the years 2008-2012. This reflects the lack of speculation in the currency exchange market and the invulnerability to panic which usually arises from speculations and exaggerated expectations.
The changes in exchange rates produced fundamental changes in the pattern of deposits over time as the shares of the dollar and the dinar declined in favor of the NIS (figure 2-5). Between 2008-2012, the dollar and the dinar shares fell by 13.1 percent, and 16.3 percent respectively, as opposed to the increase in the share of the NIS by 53 percent in the same period. This transformation in deposit behavior reflects the extent of change in customer sentiment towards the stability of various exchange rates. Specifically the tendency of the public to deposit the NIS over other currencies consist with changes in the respective exchange rates.
Direct credit facilities granted in NIS also witnessed a rise in share by 5.5 percent between 2008 and 2012. Also, there was an increase in the share of the dinar facility by 5.3 percent, compared with a decrease in the dollar share by about 10.7 percent in the same period (figure 2-6). However, it is difficult to link these changes with exchange rates alone as interest rates on various currencies may be a main determinant of facilities’ portfolio fluctuations. Nevertheless, the relative stability of interest rates compared to exchange rate fluctuations makes the connection of facilities portfolio with exchange rates the most accurate.
• Interest RatesAnnual interest rates on deposits and lending of different currencies used by banks operating in Palestine indicate some changes in 2012 compared
NIS
per
USD
BidAsk
Figure 2-4: USD/NIS exchange margins (period average), 2008-2012
Figure 2-5: Total deposits at banks operating in Palestine by currency, 2008-2012
Perc
ent
USD JD NIS Others
Figure 2-3: USD exchange rate fluctuations against NIS (period average), 2008-2012
Perc
ent

99
Local and International Economic D
evelopments
to 2011. The interest rate on the dinar increased by about 52 basis points (bps) for deposits, and 48 bps for lending, bringing the interest rate of dinar facilities to 8.11 percent, and of dinar deposits to 1.70 percent.
In comparison, interest rate on dollar facilities increased by about 18 bps, while dollar deposits rate increased by 13 bps, making the interest rate 6.97 percent for facilities, and 0.46 percent for deposits.
In contrast, interest on NIS facilities decreased by 43 bps in 2012, as opposed to arise in interest rate on NIS deposits by around 21 bps. This reduced the interest rate of NIS facilities to 11.26 percent while interest on deposits rose to 1.22 percent.
The widening margin between the deposit and lending rates on these currencies can be linked to several reasons, including the margin in the interset in country of origin, where interest on the NIS, for example is considered high in Israel in comparison to the dollar and the dinar. Likewise, security and political conditions make the Palestinian economy a highly risky environment compared to other countries, which affects interest rates level and tendency to rise.
• Palestinian External SectorThe importance of Palestine’s external position from a financial stability perspective emanates from its being a channel of potential risks to the stability of vital sectors in the local economy in general and the banking and financial sector in particular. This is largely through exchange rates, interest rates and foreign aid. Palestinian balance of payments (BoP) data at end 2012 indicate continued deterioration in current account deficit which amounted to USD 2,814.7 million, a rise by 28.4 percent over the previous year. This increased the deficit to GDP ratio to 27.4 percent, a rise by 5 percentage points compared to the year before.
Israel remains of prevailing dominance in trade relations with Palestine considering that 84 percent of exports and 70 percent of imports are made with it, evidently demonstrating the importance of the NIS as the main currency in Palestinian-Israeli trade relations. As a consequence, any developments in the NIS value will be reflected in the Palestinian economy through prices of goods, and both the volume and value of imports and exports. Theoretically, however, this may also apply to the JD, but with a much less importance, since the value of trade between Palestine and Jordan remains low, amounting to just 6 percent and 2 percent of imports and exports respectively.
Figure 2-7: Deposit and lending rates in Palestine by currency, 2008-2012
Deposit USD Deposit JD Deposit NIS
Lending USD Lending JD Lending NIS
Figure 2-6: Credit portfolio by currency, 2008-2012
Perc
ent
USD JD NIS Others

1010
Local and International Economic D
evelopments
Box (1): Arab safety net and the shortage of liquidity in PalestineThe Palestinian government suffered from severe financial difficulties, especially during the past two years, which led to its failure to cover main public expenditure items (such as wages and salaries) on a regular basis, hence, pushing it to constantly resort to borrowing from banks in order to carry out its functions. With the purpose of limiting the negative impact of these difficulties, the Arab fraternity expressed their readiness, at the 2012 Arab Summit held in Baghdad, to provide a financial safety net with a value of USD 100 million per month to the Palestinian government. This aid would assist in facing the difficulties that may arise from Israeli threats following Palestine’s initiative to go to the UN in the same year. The fraternity also committed to continue support of the Al Aqsa and the Al Quds Intifada funds*. This is in addition to providing urgent support, as of 1/4/2012 according to the 2002 Beirut summit**,apart from the financial safety net. These funds are non-refundable and contributions are mandatory upon all member states calculated according to their shares in the Arab League secretariat’s general budget.
Arab donations for Palestinian budget support, 2009-2012(USD million)
2012201120102009Country
26.652.726.326.0Algeria
3.31.78.1--Egypt
99.5221.7128.540.7Saudi Arabia
85.00.015.2230.7United Arab Emirates
30.110.252.7164.3Qatar
25.2------Iraq
269.7286.2230.8461.7Total
34.735.420.334.3As a percent of total budget support (%)Source: Palestinian Ministry of Finance, monthly reports.
Wages and non-wages arrears, 2009-2012
Non-wagesWages & SalariesYear
Percent (%)Value (USD million)Percent (%)Value (USD million)
20288.6453.52009
670.6349.62010
18258.76106.52011
19272.112213.02012Source: Palestinian Ministry of Finance, monthly reports.
* These two funds have been established in accordance with the decisions of the Cairo Summit 2000. The first fund was named “Al Quds Intifada Fund” in order to support the martyrs and wounded families with a capital of USD 200 million, and the second was named the Al Aqsa Fund, to aid the Palestinian economy with a capital of USD 800 million.
** Urgent support of USD 55 million for 6 months, subject to automatic renewal for a further 6 months as long as the Palestinian government is in need of this support.
Despite aid transfers by the Arab fraternity to support the budget, such aid remains insufficient to finance the deficit. In fact, the disbursements were much less than the commitments pledged by the Arab countries for both the financial safety net, approved at the 2012 Baghdad summit (a

1111
Local and International Economic D
evelopments
total of USD 1,395 million), and the urgent support pledged at the 2002 Beirut summit. Overall, the percentage disbursed reached only 19.3 percent of the commitments in 2012.
There is no doubt that if the Arab support had pledges materialized in full, they would have reduced the overall budget deficits to a minimum, alleviated the difficulties of liquidity, and toughened Palestine’s political position in coping with Israeli pressures with respect to clearance transfers. This in turn would not only have led to closing the financing gap without the need of borrowing from banks, but would also have reduced government debt. This would requires the activation of the decisions made at the Arab summits in this regards.
• Foreign AidThe Palestinian government largely relies on foreign aid2, which is hugely interlinked with the political and economic conditions prevailing in the donor countries and as well as in Palestine, making the flow of aid inconsistent and greatly prone to fluctuations. This constitutes a source of risk to the government, making it unable to fulfill its obligations. An additional related risk is the fact that the aid receipts are denominated in a different currency than the main currency of expenditure (NIS), making them vulnerable to exchange rate fluctuations.
In order to alleviate Israeli pressures exerted upon the Palestinian government in terms of blocking customs tax revenue, it was agreed that the Arab countries will provide Palestine with a financial safety net valued at USD 100 million per month in order to face the difficulties arising from Israel’s withholding of clearance revenues.
2 Despite the government’s efforts over the past few years to reduce their dependency on foreign aid, it still accounts for a high proportion of total revenues (volumes reaching USD 0.9 billion in 2012, or 29.5 percent of revenues and grants compared to 31 percent in 2011).

1212

13
Infrastructure and Developm
ent Indicators in the Financial Sector
Chapter Three Infrastructure and Development Indicators in the Financial Sector
Overview
The infrastructure of the financial sector, with all its legal and supervisory frameworks and systems, is considered to be a key factor in achieving financial stability. Starting with the PMA’s responsibility of maintaining financial stability and ensuring that bank management is in compliance with the highest international standards and practices, the development of this infrastructure has continued, enhancing its efficiency in various aspects and related frameworks. A number of crucial accomplishments were achieved in 2012, whether in legislations, instructions and supervisory systems or in completing several major projects and updating supervisory systems. Moreover, financial and banking inclusion were enhanced, in addition to remarkable progress in the implementation of the recommendations of the Basel Committee on banking supervision. This all served to gradually fulfill the requirements of transforming into a modern, full-fledged central bank.
1. Legal and Regulatory FrameworkThe National Payments System Law was passed on 23/11/2012, under the resolution of law No. (17) of 2012. This law represents an integral step towards the implementation of electronic payment methods. Likewise, it also facilitates electronic and final settlement for bank accounts and the financial transactions resulting thereof. Furthermore, It also allows the installation of electronic clearing systems between banks via the scanning feature.
It is also expected that the establishment of the Palestine Deposit Insurance Corporation (PDIC) will strengthen the financial safety net, protect depositors, and maintain financial stability. It will ensure customers’ deposits in the Palestinian banking system, covering approximately 93 percent of bank depositors in the West Bank and Gaza. The establishment of the PDIC is expected to result in increased deposits, thus enhancing the vital role played by banks in promoting economic and financial development in Palestine. In the same context, the PMA has obtained membership in the IADI as an associate member. This membership came prior to the issuance of the Deposit Insurance Corporation Law3 to allow taking advantage of the practical experiences of members in the IADI, which includes 132 deposit insurance corporations worldwide.
3 At a post report date, the Palestine Deposit Insurance Corporation’s Law has been issued as a Resolution Act on 29/05/2013.

14
Infrastructure and Developm
ent Indicators in the Financial Sector
In light of the Banking Law No (9) of 2010, the PMA embarked in 2012 upon a comprehensive review of all previously issued supervisory instructions to achieve more consistency with the amendments and additions made to this law. Moreover, the PMA issued new supervisory instructions which regulate and control banking activities in view of the national and international legal and supervisory developments. In this respect, the PMA issued instructions covering a number of areas: rules for granting bonuses and incentives, the required reserve base, and the “primary bank account” for each citizen. These instructions come under the PMA’s policy of increasing banking sector participation in promoting financial inclusion in all segments of society, thus enabling participants to take advantage of the banking services available. The PMA furthermore issued several instructions which address the following: ATM services, regulating the work of the external auditors, managing money changer accounts, updating the BURAQ system, requirements of opening accounts for cooperatives and charitable institutions and civil society bodies, launching of the reporting system for lost and suspended checks, and finally, appointments, transfers, disciplinary actions and resignations, and counterfeit currency.
Additionally, the PMA issued several circulars governing routine procedures and updates in the banking business. For example, circular No. (7/2012) prohibits foreign banks from granting credit to an applicant if it makes the exposure exceed 10 percent of the core capital of foreign bank branches, without a prior approval from the PMA. This is also the case with circular No. (103/2012),which requires banks to modify their systems and customer account numbers in accordance with the International Bank Account Number-IBAN code given to Palestine.
It is expected that with the start of the year 2014, the legal and regulatory challenges facing banks operating in Palestine would be new, and as such, they may directly and indirectly impact financial stability. These challenges emanate mainly from the FATCA law, under which all the financial institutions outside the U.S, including those operating in Palestine, are obligated to disclose the financial account details of individuals possessing U.S citizenships; these would have to be submitted to the IRS for tax collections and combating tax evasion. Various consultations and internal and regional communications with Arab financial institutions, especially the Arab Bank Union and the Arab Monetary Fund, have been conducted regarding this issue. It is important to note that work is still underway via the aforementioned channels to determine the appropriate option to comply with this law.
2. Developments and Updates of Baking System The PMA relentlessly pressed forward to develop modern banking systems in accordance with the highest international standards and practices, all within the framework of building a robust and comprehensive banking infrastructure. This infrastructure reduces risks that threaten the banking system in particular and the financial system in general. As such, in 2012 the PMA completed further developmental procedures in some of the banking system that have been initiated in previous years. It also began the implementation of new projects expected to be completed in the next two years.
Some of the projects which were completed (or are underway) are the following: implementing Standards II &III of the Basel Committee, the IBAN, establishing an electronic national switch for electronic payment instruments, settlement of net transactions in the financial market via BURAQ system4, creating a supervisory position for key payment systems, the Mobile Banking Project and launch of the Lost and Suspended Checks System5. These are in addition to preparing for the launch of the Unified Query System which aims to provide disclosure and allow public access to information regarding the ratings of clients listed on the Bounced Checks System, Updates on the Credit Scoring System, and the PMA’s Business Continuity Project. These are intended to ensure sustainability by delivering different banking services in times of crises and emergency.
4 Though this project was listed in the 2012 plan, it was only completed in February 2013 due to delays in the adoption of the Palestinian Payment Law until end of 2012.
5 This system was launched under instruction number (10/2012) on 19/09/2012.

15
Infrastructure and Developm
ent Indicators in the Financial Sector
Box (2): Foreign Account Tax Compliance Act (FATCA)Banks worldwide are preparing to examine their U.S citizen customer account statements in compliance with FATCA, which the American congress passed on 18th March 2012. This act was enforced in order to fill the legislative vacuum in the field of taxation and to combat tax evasion by U.S citizens who own properties and deposits abroad.
Based on this act, the U.S government, as of mid-2014, will request all foreign financial institutions to submit names and statement details of customers subject to the U.S levy. According to U.S legislations, citizens as well as their alien residents are subject to this levy. Under this act, all the financial institutions, including Arab banks, are obligated to identify the concerned parties holding U.S citizenship or to disclose their identity should their assets exceed USD 50,000.
In line with the regulations of FATCA, there are two possible options that foreign banks can adhere to: the first requires the local government- and not the banks- to apply the law themselves, and furthermore, to sign agreements cooperating with the U.S government. Conversely, the second will be applied in the event that the government fails to sign the designated agreements directly with the U.S. Consequently, the banks will be required to intercede in direct agreements with the U.S tax administration within the deadlines of the law.
Based on this, dealing with this law presents two alternatives: The first is that it is incumbent upon designated institutions to enter into agreement, named “Conveyance of reporting and income tax information agreement”, with the U.S internal tax services office/ Internal Revenue Service (IRS). These institutions will be labeled thereof “cooperating banks”. As for the second, in the event if non-cooperation, the law allows the IRS to deduct 30 percent from the offending accounts at U.S banks. This means that non-cooperating banks will be exposed to operational risks (deduction of 30 percent tax) and reputational risks (U.S banks may stop dealing with non-cooperating banks).
Obviously, compliance with this law may entail many operational costs arising from the amendment procedures: opening new accounts and their follow-ups, monitoring and auditing. Moreover, there are also costs related to finding systems for processing transactions, identification procedures of clients who use foreign banks, efforts to raise awareness and establishing a special union for those complying with this law and employing qualified personnel. These are to be added to the reputational risk which was previously mentioned.
It should be noted that the U.S has reached FATCA agreements with more than 80 countries and judicial authorities. These include Germany, Spain, Norway, Switzerland, Iceland, Mexico, Denmark and Great Britain. Similar agreement negotiations are currently underway with a dozen other countries. On the other hand, the group of 8 nations (G8) agreed to the automatic exchange of data, which means exchanging customer account information among these countries.

16
Infrastructure and Developm
ent Indicators in the Financial Sector
3. Development Indicators in the Banking System
• Branching Policy and ConcentrationAt the end of 2012, bank mergers and restructuring operations resulted in a decrease in the number of banks operating in Palestine to 17 banks, 7 of which are domestic and 10 are foreign (8 Jordanian Banks,1 Egyptian, and 1 foreign bank). This came following the successful merger between the National Bank6 and the Arab Palestinian Investment Bank on 1/1/2012.
These banks operate through a network of branches and offices spread over various areas in Palestine. They number 232 branches and offices; 121 are domestic, and 111 are foreign. In 2012, 6 new branches and offices were opened: a branch and an office for Bank of Palestine, a branch for Al-Quds Bank, a branch for the National Bank, two branches for the Arab Bank, and a branch for Bank of Jordan.
By licensing new branches and offices, the PMA aims at delivering banking services to all Palestinian cities and villages, prioritizing rural communities and remote regions in order to facilitate the commercial and economic activities of citizens, as well as different financial transactions. This trend was reinforced in the PMA’s branching policy adopted in 2007. Through this policy, the PMA seeks to reduce the ratio of persons per branch in order to raise the efficiency of services provided, as well as to remain consistent with internationally recognized rates (10,000 persons per branch). With this increase in branches, the ratio of persons per branch has decreased to about 16,800 persons per branch by the end of 2012, suggesting in theory, room for more bank branching opportunities.
In 2012, an improvement was recorded in market concentration in the banking sector, as measured by the Herfindahl index7, whether in terms of deposits or facilities compared to the previous year.
Herfindahl index of banks’ market shares in private sector deposits dropped to 1,738 points in 2012, in comparison to 1,796 points in 2011, which is below the internationally recognized critical limit (which is 1800 points). A decrease was also registered in 2012 under concentration indicators in banks’ market shares of total direct credit facilities, reaching 1,716 points, against 1,735 points in the previous year, also below the critical limit of concentration.
Accordingly, it is possible to say that the banking sector entered into competition on both sides of the financial intermediation process (attracting savings and granting facilities). It is well known that the increase in market concentration will reduce the possible benefits that can be achieved by a competitive market, not to mention,
6 Al-Rafah Microfinance Bank underwent name change to become the National Bank. This was based on the decision of the board of directors and the approval of the general assembly. The name change was completed by the Companies Controller registering the company in Nov. 2012, and then in Dec. 2012, the bank completed the acquisition of the Arab Palestinian Investment Bank.
7 The formula for the Herfindahl Index is: =(MS1)2H=
ni , where (H) is the value of the Herfindahl index, (MS1) is the bank share (i) of the
total desired variable to calculate the concentration accordingly, such as total bank assets or total deposits and so on. The inverse Herfindahl index indicates the number of banks dominating the banking market to any specific value for this index, calculated as follows: N= 1
H, where N is the number of equal-sized-banks that the banking market can contain to any specific value (H). The index can range between 0-10,000 points (if its value is 10,000, it implies complete monopoly). The relationship between the index value and the degree of competition is inversed. This means that the higher the index value, the lower the degree of bank concentration and the higher the degree of inequality between banks and weakness in competitiveness and vice versa. Concentration is considered high if the index value is greater than 1,800 points (this limit is approved by the U.S).
No.
of b
ranc
hes
Popu
lati
on p
er b
ranc
h
No. of branches (lift) Population per branche (right)
Figure 3-1: Branches of banks operating in Palestine, 2008-2012

17
Infrastructure and Developm
ent Indicators in the Financial Sector
that banking instability increases risks, thus directly impinging on financial stability at large.
The previous developments in the banking sector (whether legal and supervisory or in the field of developmental systems and legislations and branching policy) contributed vastly to boosting the volume and quality of financial services offered to the public. As a result, the number of ATMs increased by 16.2 percent annually between the years 2008-2012, corresponding with the increase in the number of cards and transactions executed through this device. It is worth noting that the instructions which the PMA issued in 2012, assigning ATMS services and the development of electronic banking products, includes the minimum requirements for ATM operations, the conditions necessary to provide them, the foundations of security and protection, as well as the feeding and maintenance of these devices.
Similarly, electronic Points of Sale (POS) were also developed in the same time period. Their average increased by 34.5 percent per annum, numbering 3,952 POS in 2012, alongside an increase in the number of electronic cards (debit and credit cards). This consequently raised the value of transactions executed through them up by an average of 22.3 percent for debit cards and 53.2 percent for credit cards annually.
This clearly indicates the increasing tendency towards the use of electronic payments systems, which contributes to increasing the velocity of cash circulation and to stimulation of growth in the economy.
Table (3-1): Financial services developments, 2008-2012(values in USD million)
Average growth rate (%)20122011201020092008Financial Services
ATMs
16.2435378335305240 Number of machines
19.3122,379101,72871,68468,18562,180 Number of cards
28.44,879,2125,554,97011,318,4164,613,0433,515,116 Number of transactions
3.9946.41264.41256.6866.9909.8 Values
34.53,9253,658231417451248 Number of PoS
Debit Crards
15.2410,536354,352308,962285,228233,795 Number of cards
28.43,374,4973,016,5012,519,0032,133,3361,302,489 Number of transactions
22.3749.6721.3610.1544.4351.5 Values
Credit cards
34.256,83547,04637,37429,08218,017 Number of cards
76.51,162,135858,263641,474244,101140,295 Number of transactions
53.2117.198.210239.928.2 Values
Figure 3-2: Herfindahl index, 2008-2012
Poin
t
Private sector desposits Credit facilities

18
Infrastructure and Developm
ent Indicators in the Financial Sector
• Development of Bank Accounts (Deposits and Borrowing)The previous developments in the banking sector, mainly in enhancing the use of electronic banking services, have positively affected indicators of financial intermediation and success of the latter in performing its assigned role. The number of bank accounts increased on average by 8.8 percent during 2008-2012, reaching around 2.7 million accounts or 63.3 accounts per 100 people in Palestine. Similarly, depositors numbered 1.5 million (representing 34 percent of population) and an average of 6.6 percent growth in the year 2012. Meanwhile, the number of borrowers increased, reaching almost a quarter of a million (253,441 borrowers), an average of 18.8 percent growth, and the number of loans which they obtained amounted to approximately 343,466 loans in 2012.
Despite the tangible progress in the indicators of intermediation, a relative weakness continues to exist regarding small and medium enterprises’ shares in banking services (as opposed to clear concentration on part of individuals). The number of deposit accounts for these companies did not exceed 1.2 percent of the total depositors, and the value of their deposits was approximately 2.5 percent of total customer deposits in 2012. The case is similar with respect to borrowers, where the ratio of small and medium enterprises borrowing from the banking sector reached 1.7 percent of total borrowers, and the value of their loans were around 6.2 percent of gross credit in 2012.
Table (3-2): Number of Accounts and values in banks operating in Palestine, 2008-2012 (values in USD million)
Average growth rate (%)20122011201020092008Financial Services
8.82,715,3542,543,3472,185,7792,011,2421,947,265Number of banking accounts
6.61,463,9781,416,4901,414,2381,216,398-Number of depositors
27.016,96013,91412,0328,383- Of which: SMEs
6.21,406,0261,385,1621,382,9701,182,928- Individuals
6.47484.26972.56802.46296.85846.9Value of customer deposits
-3.3186.6239.1286.1222.5- Of which: SMEs
4.55457.65308.14990.14782.3- Individuals
12.2343,466332,297246,460234,947222,216Number of loans
18.8253,441226,245180,339151,750-Number of creditors
26.14,3032,9932,0312,328- Of which: SMEs
16.9233,328213,156172,951146,667- Individuals
23.24199.13550.72885.92234.21828.2Total Credits
24.0259.6210.8181.0136.6- Of which: SMEs
30.71628.61315.11023.2733.0- Individuals
• Financial Depth IndicatorsGenerally, the indicators of financial depth strengthened as credit (facilities) to nominal GDP ratio increased to 40.2 percent in 2012, as opposed to 35 percent in the previous year. However, this ratio seems low compared to neighboring countries where the ratio was 80.1 percent in both Egypt and Jordan and 166.8 percent in Lebanon. It is important to note that PMA is aiming to increase local credit through the reduction of bank placements abroad

19
Infrastructure and Developm
ent Indicators in the Financial Sector
in order to deepen the relationship between the banking sector and various economic sectors.
Despite the importance of the development in the credit ratio to GDP, limiting fluctuations in this ratio is still necessary. Empirical evidence has shown that this fluctuation should not exceed 20 percent, as its increase was one of the common denominators of the financial crises which struck the banking sector in many countries8. Note that this ratio (the fluctuation in the ratio of credit facilities to GDP) ranged between 3.3 percent and 8 percent in the period between 2008-2012- a moderate rate, well below the 20 percent mark.
Other ratios of financial dpth, such as the ratio of credit extended to the private sector out of total credit, fell to 66.5 percent in 2012 compared to 69 percent in the previous year (this ratio formed an average of 70.7 percent between 2008-2012). Note that this ratio was 91.1 percent in Jordan, 85.4 percent in Egypt and 54.9 percent in Lebanon in 2012.
Among the ratios of financial depth which measure the propensity of the public towards savings, is the ratio of customer deposits to GDP, which slightly escalated from 71.3 percent in 2011 to 73.0 percent in 2012. This is a moderate ratio in comparison to neighboring countries where it hits 112.3 percent in Jordan during the same time period.
This is not so different from the private sector’s propensity for savings, where the ratio of the private sector deposits out of total customer deposits reached 91.7 percent in Palestine in 2012, as opposed to 93.2 percent in Jordan, 85.5 percent in Egypt and 97.9 percent in Lebanon during the same year.
In general, the role of financial intermediation in Palestine improved and developed over time, where the loans to customer deposits ratio increased from 50.9 percent in 2011 to 56.1 percent in 2012. It seems that this ratio is moderate when compared with some neighboring countries, where it was 71.4 percent in Jordan, 49.5 percent in Egypt, and 54 percent in Lebanon.
8 The session of economic and financial stability policies, which was convened by the Arab Monetary Fund between the 10th and 21st of June 2012.
Perc
ent
Palestine Jordan Egypt Lebanon
Figure 3-3: Credits as a percent of GDP in Palestine and some neighboring countries, 2008-2012
Perc
ent
Figure 3-4: Private sector credits as a percent of total credits in Palestine and some neighboring countries, 2008-2012
Palestine Jordan Egypt Lebanon
Figure 3-5: Private sector deposits as a percent of customer deposits in Palestine and some neighboring
countries, 2008-2012
Perc
ent
Palestine Jordan Egypt Lebanon

20
Infrastructure and Developm
ent Indicators in the Financial Sector
Perc
ent
Palestine Jordan Egypt Lebanon
Figure 3-6: Credit to deposits ratio in Palestine and some neighboring countries, 2008-2012
Perc
ent
Palestine Jordan Egypt Lebanon
Figure 3-7: PEX market capitalization as a percent of GDP in Palestine and neighboring countries, 2008-2012
On the other hand, and despite the decline in the market value of the traded shares in PEX as a percent of GDP from 28.5 percent in 2011 to 27.9 percent in 2012, this ratio remains moderate compared to neighboring countries, where it was 86.1 percent in Jordan, 24 percent in Egypt and 27.4 percent in Lebanon.

21
Credit Risks in the Banking Sector
Chapter Four Credit Risks in the Banking Sector
Overview
Credit risks are considered to be some of the systemic financial risks and the most prominent type of risk which exposes banks to potential losses, and hence, affects its capital and profits. Against this background, this chapter deals with the analysis of credit portfolio for both foreign and local banks, and granted to both the public and private sectors. Furthermore, it analyzes risks associated with public finance, especially in light of the continued financial difficulties which the Palestinian government suffers from, in addition to an examination of mortgage and housing lending portfolios. This comes in the framework of the volume of risk which financial stability may be vulnerable to in Palestine and the various trends of these risks. This chapter also addresses the most vital measures and control instructions which guarantee that the extent of these risks is as low as possible, including maintaining the sustainability of financial stability in general.
Figure 4-1: Distribution of credit portfolio between private and public sectors, 2008-2012
Public sector Private sector
Perc
ent
1. Risks associated with credits granted to Public and Private SectorFigure 1-4 demonstrates an increase in the public sector’s share of total credit granted by banks operating in Palestine over time. Particularly in 2012, we see this ratio rising to 33.5 percent, in comparison to 31 percent in the previous year, mainly due to the severity of the financial difficulties that the government faces. This indicates an increase in the risks that banks are exposed to, as the credit granted to the government has exceeded the ownership equity of all banks. As a precautionary measure to limit these risks, the PMA called upon banks to proceed with extreme caution when dealing with credit offered to the government.
22
Credit Risks in the Banking Sector
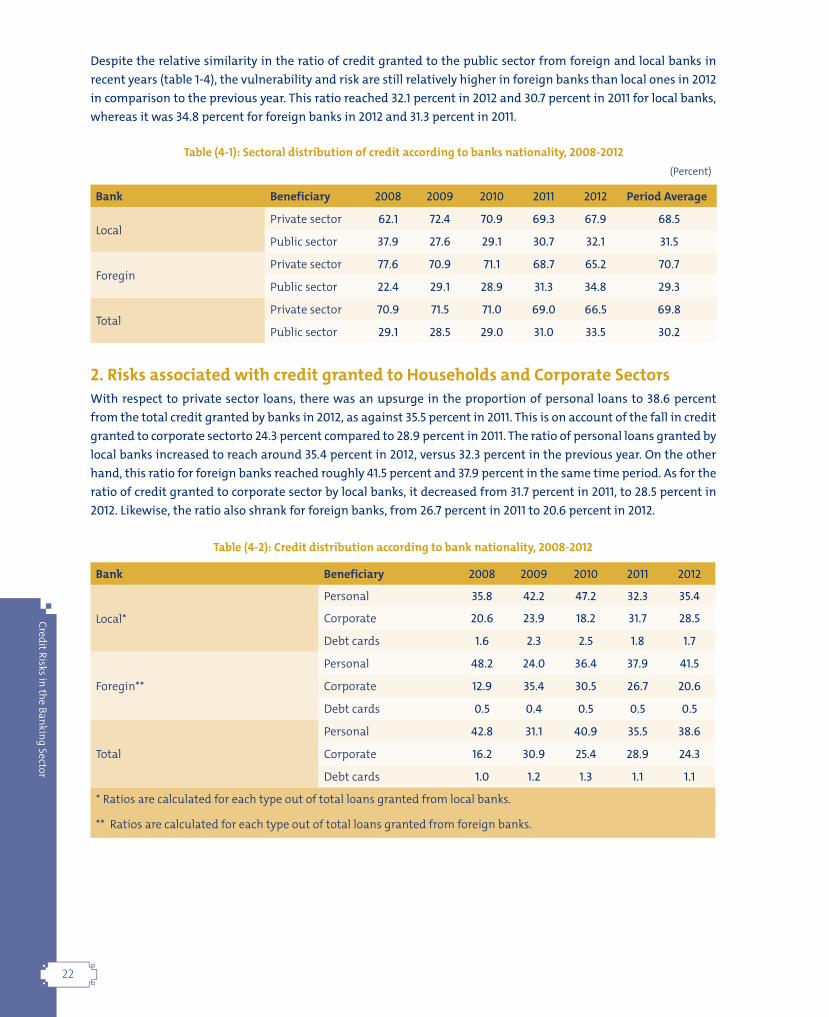
Despite the relative similarity in the ratio of credit granted to the public sector from foreign and local banks in recent years (table 1-4), the vulnerability and risk are still relatively higher in foreign banks than local ones in 2012 in comparison to the previous year. This ratio reached 32.1 percent in 2012 and 30.7 percent in 2011 for local banks, whereas it was 34.8 percent for foreign banks in 2012 and 31.3 percent in 2011.
Table (4-1): Sectoral distribution of credit according to banks nationality, 2008-2012(Percent)
Bank Beneficiary 2008 2009 2010 2011 2012 Period Average
LocalPrivate sector 62.1 72.4 70.9 69.3 67.9 68.5
Public sector 37.9 27.6 29.1 30.7 32.1 31.5
ForeginPrivate sector 77.6 70.9 71.1 68.7 65.2 70.7
Public sector 22.4 29.1 28.9 31.3 34.8 29.3
TotalPrivate sector 70.9 71.5 71.0 69.0 66.5 69.8
Public sector 29.1 28.5 29.0 31.0 33.5 30.2
2. Risks associated with credit granted to Households and Corporate SectorsWith respect to private sector loans, there was an upsurge in the proportion of personal loans to 38.6 percent from the total credit granted by banks in 2012, as against 35.5 percent in 2011. This is on account of the fall in credit granted to corporate sectorto 24.3 percent compared to 28.9 percent in 2011. The ratio of personal loans granted by local banks increased to reach around 35.4 percent in 2012, versus 32.3 percent in the previous year. On the other hand, this ratio for foreign banks reached roughly 41.5 percent and 37.9 percent in the same time period. As for the ratio of credit granted to corporate sector by local banks, it decreased from 31.7 percent in 2011, to 28.5 percent in 2012. Likewise, the ratio also shrank for foreign banks, from 26.7 percent in 2011 to 20.6 percent in 2012.
Table (4-2): Credit distribution according to bank nationality, 2008-2012
Bank Beneficiary 2008 2009 2010 2011 2012
Local*
Personal 35.8 42.2 47.2 32.3 35.4
Corporate 20.6 23.9 18.2 31.7 28.5
Debt cards 1.6 2.3 2.5 1.8 1.7
Foregin**
Personal 48.2 24.0 36.4 37.9 41.5
Corporate 12.9 35.4 30.5 26.7 20.6
Debt cards 0.5 0.4 0.5 0.5 0.5
Total
Personal 42.8 31.1 40.9 35.5 38.6
Corporate 16.2 30.9 25.4 28.9 24.3
Debt cards 1.0 1.2 1.3 1.1 1.1
* Ratios are calculated for each type out of total loans granted from local banks.
** Ratios are calculated for each type out of total loans granted from foreign banks.

23
Credit Risks in the Banking Sector
Personal loans include loans guaranteed by mortgages, car loans, educational loans and other consumption loans. These loans are granted against multiple collaterals that reduce potential risks. Meanwhile, credit extended to the corporate sector include investment loans and short-term loans (overdrafts), with the latter constituting around 20.1 percent of gross credit extended to corporations in local banks, and 22 percent in foreign banks. It should be noted that overdrafts are riddled with relatively higher risks than loan risks. Because of this, the PMA took certain control measures for overdraft facilities so that their balance does not exceed 30 percent of the total credit of banks9.
Credit cards, especially those granted to individuals or corporations, account for a limited ratio, which amounted to 1.1 percent of the total credit granted to banks in both 2011 and 2012. In terms of nationality, the ratio of credit extended to credit cards was higher in local banks (1.7 percent in 2012 and 1.8 percent in 2011) compared to foreign banks, where the ratio of total credit granted remained stable at 0.5 percent. Based on this, it is clear that credit granted by the banking sector in the form of credit cards is limited and consequently the risks associated with it do not pose a large threat to financial stability.
3. Risks associated with credit granted according to residencyIt is noticed from table (4-3) that the majority of credit extended by banks is to residents, with a ratio of 96.4 percent of gross credit during the period 2008-2012. This is in contrast to the credit granted to non-residents, which did not exceed 3.6 percent during the same time period. Likewise, in 2012, it is also noticed that there were equal ratios granted to non-residents by local and foreign banks at about 1.1 percent. The value of credit granted to non-residents by local banks amounted to USD 21.1 million in 2012, versus USD 24 million by foreign banks.
Accordingly, the risk associated with credits to non-residents is limited and inconsequential. It does not pose a source of great worry to financial stability in Palestine, especially since there are control measures governing the mechanism of granting credits to non-residents.
Table (4-3): Credit distribution according to residency and bank nationality, 2008-2012(Percent)
Bank Beneficiary 2008 2009 2010 2011 2012 Period average (%)
LocalResident 97.8 97.5 98.4 98.7 98.9 98.9
Non-resident 2.2 2.5 1.6 1.3 1.1 1.7
ForeginResident 89.2 90.7 97.7 98.2 98.9 94.9
Non-resident 10.8 9.3 2.3 1.8 1.1 5.1
TotalResident 92.9 93.4 98.0 98.4 98.9 96.4
Non-resident 7.13 6.6 2.0 1.1 1.1 3.6
Based on instruction number (5/2008), the most distinctive of these controls are: (i) limiting the exploitation of these credits to Palestine exclusively, (ii) consisting with a plan to encourage investment, and (ii) enjoying sufficient and provisioned collaterals “if in a cash form” or registered under the name of the bank “if in the form of physical collaterals”. Apart from these conditions, it is mandatory to obtain written pre-approval from the PMA.
9 Overdrafts granted to the government and public sector institutions are excluded from the overdraft value for the purpose of calculating this ratio. Likewise, it also excludes those granted as cash guarantee.
24
Credit Risks in the Banking Sector
4. Risks associated with credits granted to Mortgage and Housing10
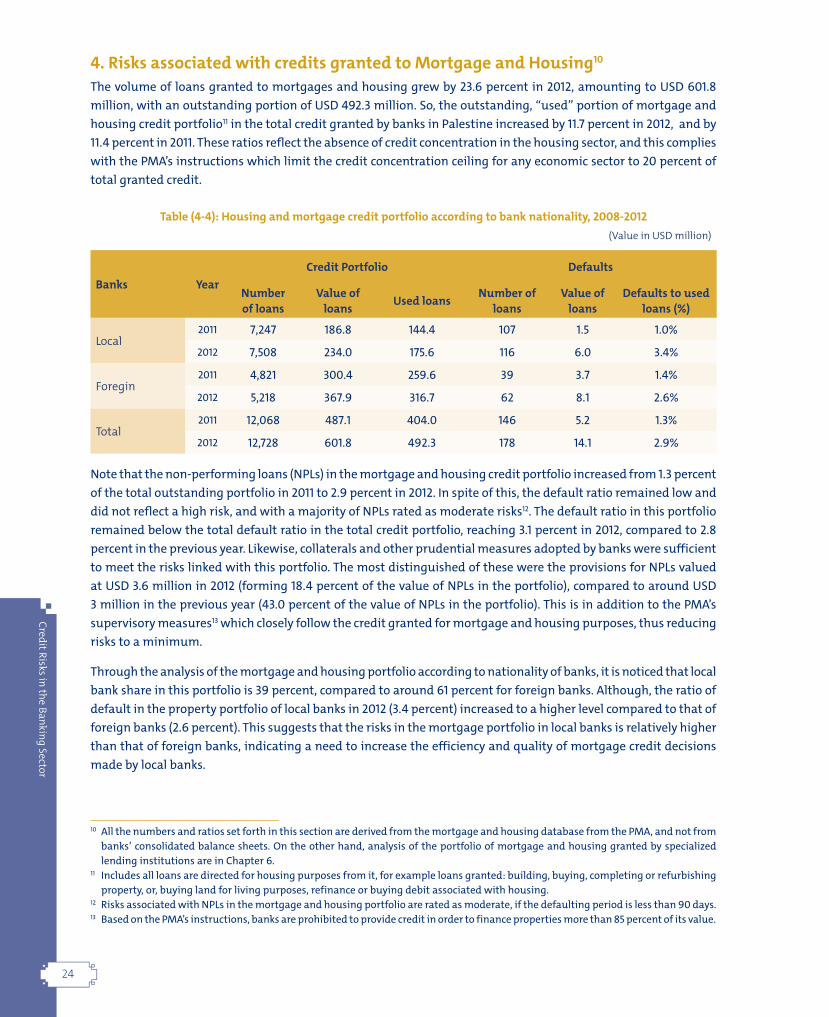
The volume of loans granted to mortgages and housing grew by 23.6 percent in 2012, amounting to USD 601.8 million, with an outstanding portion of USD 492.3 million. So, the outstanding, “used” portion of mortgage and housing credit portfolio11 in the total credit granted by banks in Palestine increased by 11.7 percent in 2012, and by 11.4 percent in 2011. These ratios reflect the absence of credit concentration in the housing sector, and this complies with the PMA’s instructions which limit the credit concentration ceiling for any economic sector to 20 percent of total granted credit.
Table (4-4): Housing and mortgage credit portfolio according to bank nationality, 2008-2012(Value in USD million)
Banks YearCredit Portfolio Defaults
Number of loans
Value of loans Used loans Number of
loansValue of
loansDefaults to used
loans (%)
Local2011 7,247 186.8 144.4 107 1.5 1.0%
2012 7,508 234.0 175.6 116 6.0 3.4%
Foregin2011 4,821 300.4 259.6 39 3.7 1.4%
2012 5,218 367.9 316.7 62 8.1 2.6%
Total2011 12,068 487.1 404.0 146 5.2 1.3%
2012 12,728 601.8 492.3 178 14.1 2.9%
Note that the non-performing loans (NPLs) in the mortgage and housing credit portfolio increased from 1.3 percent of the total outstanding portfolio in 2011 to 2.9 percent in 2012. In spite of this, the default ratio remained low and did not reflect a high risk, and with a majority of NPLs rated as moderate risks12. The default ratio in this portfolio remained below the total default ratio in the total credit portfolio, reaching 3.1 percent in 2012, compared to 2.8 percent in the previous year. Likewise, collaterals and other prudential measures adopted by banks were sufficient to meet the risks linked with this portfolio. The most distinguished of these were the provisions for NPLs valued at USD 3.6 million in 2012 (forming 18.4 percent of the value of NPLs in the portfolio), compared to around USD 3 million in the previous year (43.0 percent of the value of NPLs in the portfolio). This is in addition to the PMA’s supervisory measures13 which closely follow the credit granted for mortgage and housing purposes, thus reducing risks to a minimum.
Through the analysis of the mortgage and housing portfolio according to nationality of banks, it is noticed that local bank share in this portfolio is 39 percent, compared to around 61 percent for foreign banks. Although, the ratio of default in the property portfolio of local banks in 2012 (3.4 percent) increased to a higher level compared to that of foreign banks (2.6 percent). This suggests that the risks in the mortgage portfolio in local banks is relatively higher than that of foreign banks, indicating a need to increase the efficiency and quality of mortgage credit decisions made by local banks.
10 All the numbers and ratios set forth in this section are derived from the mortgage and housing database from the PMA, and not from banks’ consolidated balance sheets. On the other hand, analysis of the portfolio of mortgage and housing granted by specialized lending institutions are in Chapter 6.
11 Includes all loans are directed for housing purposes from it, for example loans granted: building, buying, completing or refurbishing property, or, buying land for living purposes, refinance or buying debit associated with housing.
12 Risks associated with NPLs in the mortgage and housing portfolio are rated as moderate, if the defaulting period is less than 90 days.13 Based on the PMA’s instructions, banks are prohibited to provide credit in order to finance properties more than 85 percent of its value.

25
Credit Risks in the Banking Sector
It is important to note that though the mortgage and housing loans granted to individuals of the public account for large share of the total portfolio-especially in local banks (with a ratio of 42.7 percent in numbers and 27.1 percent in value in 2012) or foreign banks (45.2 percent in numbers and 30.8 percent value14 of the total portfolio)- the ratio of default in the mortgage and housing portfolio of loans granted to companies recorded a higher average in foreign banks. The ratio was 35.8 percent of total NPLs in 2012. In second place are loans granted to institutions and associations with a ratio of 31.3 percent, as the NPLs of corporations are in the second rank in local banks with 72.1 percent of total NPLs in the portfolio. This shows the quality of collaterals provided against loans granted for each category of borrowers. The loans granted to individuals of the public are usually guaranteed by wages of liable employees, and thus ensuring repayment. However, these loans remain exposed, and contain risks arising from the government’s financial difficulties and the ability of the Palestinian government to continue paying employees’ wages regularly.
5. Risks associated with NPLsNPLs rose in 2012 to 3.1 percent of total credits compared to 2.8 percent in the year before. The default ratio in foreign banks was higher than that in local banks, as it increased to 3.7 percent of total credit of foreign banks in 2012, compared to 2.8 percent in 2011. In contrast, the ratio slightly dropped for local banks, from 2.7 percent to 2.4 percent over the same period. This indicates a relative increase in the extent of credit risk in foreign banks in this year. In spite of this, default ratios generally remained low and do not project a serious threat to financial stability, compared to those in other countries.
The analysis of default periods in banks shows that credits classified as losses15 acquired 75.1 percent of total NPLs for all banks in 2012, as against 70.9 percent in 2011. It seems that there is a change in the structure of the NPLs portfolio, as the ratio of credits classified as losses increased in local banks from 55.1 percent in 2011 to 67.1 percent in 2012, compared to a drop from 82.6 percent to 79.9 percent for foreign banks in the same period.
On the other hand, the entry of some credits “under surveillance16” into the actual defaulting category contributed to the increase in credits classified as substandard17 in local banks from 14 percent to 17.4 percent in 2012. As for foreign banks, this ratio dipped from 9.2 percent to 6.1 percent in the same time period, deepening the extent of default, as the ratio of doubtful facilities18 increased from 8.2 percent to 14 percent in 2012.
14 Mortgage and housing loans granted by foreign banks occupy the first place for number and second for value, mainly in 2011 or 2012 where the value of loans granted to individuals of the private sector occupied first place (33.2 percent of the total mortgage and housing loan value in 2011 and 34.5 percent in 2012)
15 Overdue by more than 360 days, and according to the PMA’s instruction no (1/2008), these credits are requiring provisions of 100 percent of its values.
16 Credits which are 30 to 90 days overdue and require special attention without a need for provisions17 Credits which are 91 to 180 days overdue, requiring provisions of 20 percent of its value. 18 Credits which are 181 to 360 days overdue, requiring provisions of 50 percent of its value.
Figure 4-2: NPLs structure in local banks, 2008-2012
Perc
ent
Underwatch LossesDoubtful

26
Credit Risks in the Banking Sector
More generally, the changes which the NPLs have witnessed, whether in local or foreign banks, suggest the need for more caution in order to increase efficiency in credit decisions, and limit the effects of external circumstances to a minimum. This is what credit risk management instruction No. (6/2011) calls for by stipulating specific procedures and controls for granting credit. This instruction also mentioned the relative departments and bodies which ensure sound and prudent management of credit, based on measurement procedures and continuous follow-ups of credit portfolio19.
6. Risks associated with public financeThe decline in foreign aid and the continued deficit in the overall budget balance, in addition to the accumulation of budget arrears20, led to a clear increase in the pace of government borrowing from banks, especially in recent years. The standing debt owed by the Palestinian government to the banks at the end of 2012 stood at around USD 1.4 billion (about 55.8 percent of government public debt), compared to USD 0.5 billion in 2008.
The government’s continued recourse to borrowing from the banking sector may lead to a state of uncertainty regarding sustainability of public finance, in turn leading to higher interest rates in the medium and long term, and consequently resulting in increases in cost of public debt service. Also, the government’s habitual reliance on banks to finance public expenditures could eventually lead to crowding out the private sector from acquiring the necessary funds to finance investment and development, especially if the liquidity available to the banking sector drops further. This factor may increase costs to both the government and in the private sector alike, in addition to weakening the private sector’s ability to drive growth as a result of low funds or high costs. Note that the ratio of credit granted to public sector had increased from 29.1 percent in 2008 to 33.5 percent of total credit granted in 2012.
Additionally, there will be a negative impact on investment and production from the increase of interest rate in the medium and long term, and likewise, on consumption and aggregate demand. This would aggravate the economic recession and decrease growth rates, and subsequently, raise unemployment rates. Therefore, any attempt to assess the risks inherent in the budget performance to financial stability requires the study of the impact on these variables. This issue will be treated in chapter 7 based on the standard assessment results of banks’ resilience to the negative shocks that the economy as a whole may be exposed to.
Based on that, it is necessary to shed light upon the public finance stance and the potential risks that it may be exposed to due to increasing government’s recourse to borrowing from banks to overcome their financial difficulties. This matter does not only pertain to the government, but the risks also extend to loans granted to employees in the public sector as well. Since the inability of government to fully pay salaries and wages may lead to a surge in the banks’ default ratio, another source of risk which threatens financial and banking stability. This impact also extends to the private sector due to government’s delay in debt repayment to this sector. Instability in public finance performance poses potential risks to the financial sector from two viewpoints:
19 In addition to this, instructions (1/2013) and (3/2013) were issued, pertaining to risk reserves (reserves to face non-specific risks) in order to raise its composition rates contained in instruction no (5/2008) to become 2 percent instead of 1.5 percent of net direct facilities, and 0.5 percent of net indirect facilities, as of 1/1/20013. This promotes measures in limiting credit risks in the Palestinian banking sector.
20 Total arrears accumulated by the Palestinian government in 2012 reached around USD 581 million, rising by 6.8 percent since 2011.
Figure 4-3: NPLs structure in foreign banks,2008-2012
Perc
ent
Underwatch LossesDoubtful
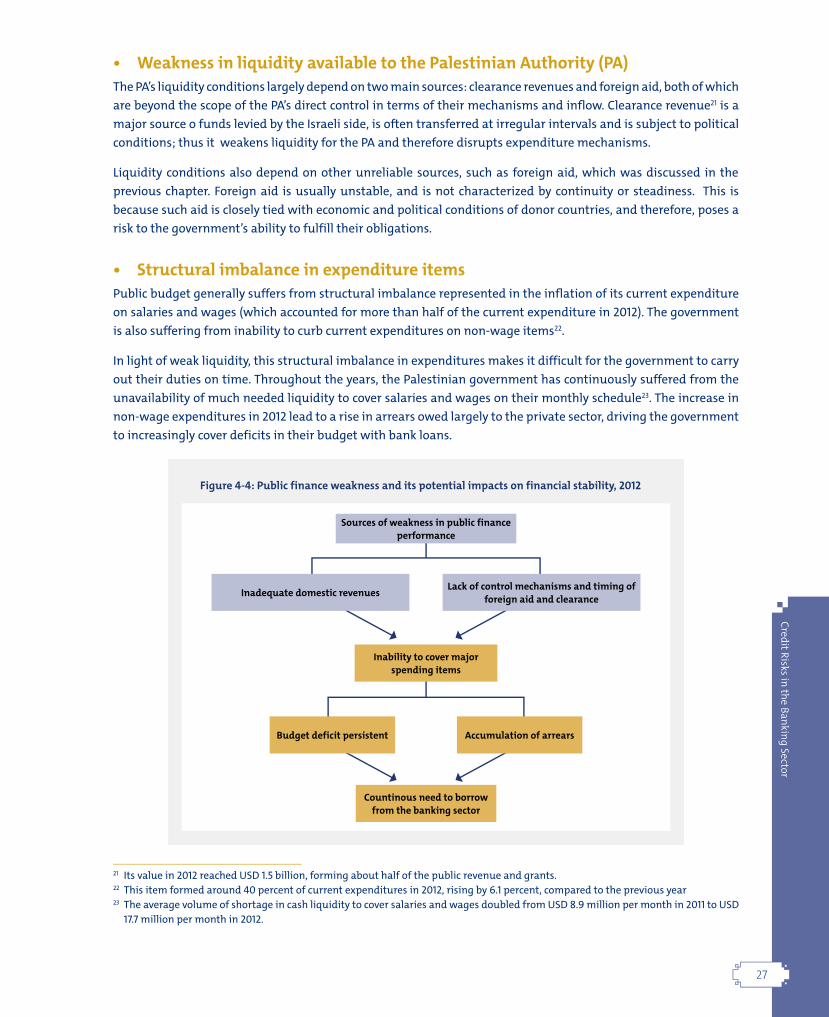
27
Credit Risks in the Banking Sector
• Weakness in liquidity available to the Palestinian Authority (PA)The PA’s liquidity conditions largely depend on two main sources: clearance revenues and foreign aid, both of which are beyond the scope of the PA’s direct control in terms of their mechanisms and inflow. Clearance revenue21 is a major source o funds levied by the Israeli side, is often transferred at irregular intervals and is subject to political conditions; thus it weakens liquidity for the PA and therefore disrupts expenditure mechanisms.
Liquidity conditions also depend on other unreliable sources, such as foreign aid, which was discussed in the previous chapter. Foreign aid is usually unstable, and is not characterized by continuity or steadiness. This is because such aid is closely tied with economic and political conditions of donor countries, and therefore, poses a risk to the government’s ability to fulfill their obligations.
• Structural imbalance in expenditure itemsPublic budget generally suffers from structural imbalance represented in the inflation of its current expenditure on salaries and wages (which accounted for more than half of the current expenditure in 2012). The government is also suffering from inability to curb current expenditures on non-wage items22.
In light of weak liquidity, this structural imbalance in expenditures makes it difficult for the government to carry out their duties on time. Throughout the years, the Palestinian government has continuously suffered from the unavailability of much needed liquidity to cover salaries and wages on their monthly schedule23. The increase in non-wage expenditures in 2012 lead to a rise in arrears owed largely to the private sector, driving the government to increasingly cover deficits in their budget with bank loans.
21 Its value in 2012 reached USD 1.5 billion, forming about half of the public revenue and grants.22 This item formed around 40 percent of current expenditures in 2012, rising by 6.1 percent, compared to the previous year23 The average volume of shortage in cash liquidity to cover salaries and wages doubled from USD 8.9 million per month in 2011 to USD
17.7 million per month in 2012.
Figure 4-4: Public finance weakness and its potential impacts on financial stability, 2012
Sources of weakness in public finance performance
Lack of control mechanisms and timing of foreign aid and clearanceInadequate domestic revenues
Inability to cover major spending items
Accumulation of arrearsBudget deficit persistent
Countinous need to borrow from the banking sector

28
Credit Risks in the Banking Sector
In order to mitigate the risks associated with public finance, the Palestinian government resorted to a number of measures related to revenue and expenditure. With regard to revenue and grants, between the years 2008 and 2012, the government was able to lift up tax revenues and reduce tax evasion, thereby achieving a greater degree of progressive reliance on alternative, local sources. In this respect, the government increased fees imposed on cigarettes duties and reappraised large sections of regulatory zones under the PA. This contributed to raising proceeds from properties under public administration, leading to the amendment of the Income Tax Law, to be enforced at the start of 2012. This revised law includes the broadening of the tax base by cancelling large segments of exemptions granted under the previous law, thus raising income tax revenues.
With regard to clearance, a set of administrative measures were taken in coordination with the Israelis since 2011 in order to increase collection24. However, as the mechanism of collection and transfer of clearance revenue remained the same, i.e., fully subject to Israeli control, uncertainty in the transfer of clearance revenues and persistence of Israeli control continued.
Additionally, the Palestinian government began to rely increasingly on local alternatives and gradually decreased reliance on foreign aid between 2008 and 2012, whereby the relative importance of net domestic revenues in total revenues and grants increased by about 23.3 percentage points in 2012 compared to 2008. In contrast, the relative importance of foreign aid declined roughly by the same ratio within the same time period.
Steady annual decline in foreign aid was reflected in its ability to cover current expenditure items and net lending, especially in the part devoted to budget support, which plummeted by 28.4 percentage points compared to 2008. The government partially substituted this shortage through local financing alternatives.
The share of net domestic revenue in covering current expenditure and net lending rose by 20 percentage points, reaching around 74 percent in 2012 compared to 54 percent in 2008.
As to current expenditure and net lending, government continued to suffer from great difficulties in curbing their increase. Thus this expenditure increased compared to the previous year by 14 percent, after neutralizing the effects of exchange rates, to reach around NIS 11,730 million25.
24 These measures included a set of understandings, stating that: Clearing is estimated according to the Israeli database on trade between Israel and the West Bank and Gaza (WBG). Furthermore, settlement of electrical bills owed to the Israeli Electrical Company with the Palestinian Ministry of Finance is made directly and is not deducted automatically from clearance except after returning to the Palestinian Ministry of Finance.
25 The impact of exchange rate on the NIS, given current expenditure developments, has been specified based on a commitment basis according to the data given by the Ministry of Finance
Figure 4-5: Government revenue structure, 2008-2012
Perc
ent
Domestic revenues Foreign aid
Figure 4-6: Government revenues as a percent of current expenditures, 2008-2012
Perc
ent
Domestic revenues Budget support

29
Credit Risks in the Banking Sector
The increase was inclusive of all current expenditure items, especially salaries and wages and non-wage items. To alleviate this problem, government needs to carry out a comprehensive review of expenditure policies, including revisiting employment policies as well as rationing expenditure on non-wage items (second main component). This can be done by adopting a series of austerity measures, such as rationing social expenditure to ensure the support of families which meet the eligibility criteria and reviewing operational expenditures to dispense with spending on non-priority items and the phasing out of electricity subsidies.
The government must also press with controlling its current expenditure on net lending items, which doubled in 2012 when compared to 2011. This can be done by providing incentives for municipalities that help to improve their collections and eventually eliminate this item altogether.
The previous measures led to a drop in current deficit as a percent of GDP to around 8 percent in 2012,versus around 25.6 percent in 2008. Nevertheless, the current balance continues to suffer from insufficient domestic revenues because of the burden of wages, in addition to liquidity difficulties as a result of Israeli control of clearance revenues. This in turn led to a great need for closing the financial gap by borrowing from the banking sector, in light of the lack of other financing instruments, such as bonds and bills. This increased public debt owed to banks (internal debt).
It is important to indicate that in 2012, the ratio of government public debt to nominal GDP (around 24.2 percent) remained below the maximum limit according to article (30) of the Palestinian Public Debt Act (40 percent of nominal GDP). This rate was also lowest compared to other foreign countries such as Jordan, Egypt and Lebanon26. However, the substantial increase in the volume of domestic debt had exceeded expectations of the 2012 budget. To this are added other risks arising from government’s inability to pay in the event of a cease of foreign aid or of Israeli transfer of clearance revenues.
26 Despite the low ratio of Palestinian public debt to GDP comparing with what mentioned in the debt law, as well as compared with neighboring countries, still the ability of the government to repay is more limited than in such courtiers, due to the absence of a Palestinian national currency that may allow the government to fill part of this debt by issuing process.
Figure 4-7: Government debt structure, 2008-2012
Perc
ent
External debt Domestic debt
Figure 4-8: Government debt as a percent of GDP, 2012
Perc
ent
Palestine
External debt Domestic debt
Jordan Egypt Lebanon

30

31
Financial Soundness Indicators of the Banking Sector
1. Capital Indicators
These indicators are based on a set of key items under assets and liabilities of banks. They reflect the readiness of banks through their capital to withstand some of the expected and unexpected risks that may arise, or risks that may face the banking industry at large, especially that capital represents the first line of defense in such situations.
• Regulatory Capital to Risk Weighted Assets (Capital Adequacy Ratio)This ratio is regarded as one of the curtail ratios of capital adequacy indicators. While provisions are the first line of defense against expected risks, capital is the first line of defense against all risks, expected and non-expected, that banks may encounter. Hence, this ratio demonstrates the extent of relationship between sources of bank capital and the risks surrounding their assets or other operations. It is an instrument used to measure bank solvency and their ability to pay its obligations and face any loss that may occur in the future.
The capital adequacy to risk-weighted assets ratio for all banks operating in Palestine at the end of 2012 reached
Chapter Five Financial Soundness Indicators of the Banking Sector
Overview
In light of financial market liberalization and the consequent increase in systematic risks arising from weakness in the financial system, decision makers have shown considerable interest in the soundness and stability of the financial system. Financial soundness Indicators are regarded as of the most acknowledged international methods to examine financial positions of banks, test their ability to withstand various risks and to have sufficient liquidity, and assess their profits and losses. These indicators can be prepared for banks as a whole, or individually for each bank.
PMA conducts and analyzes financial soundness indicators, concludes results and adopts suitable measures, all consistent with the best international practices and standards.

32
Financial Soundness Indicators of the Banking Sector
around 20.3 percent compared to 21.1 percent at the end of 2011. This is against the backdrop of some changes in risk weighted assets and capital base. The PMA gives special attention to strengthening bank capital and building reserves, such as the counter-cyclical reserve, with the aims to boost the ability to cope with various risks. In this regard, a minimum of USD 50 million was set for the capital of any bank operating in Palestine.
Disparity is noticed in capital adequacy ratio between foreign and local banks, where this ratio reached 18.8 percent for local banks, as against 21.5 percent for foreign banks. In spite of this, the ratios achieved, whether for all banks or local and foreign banks, remain higher than the ratio recommended by the Basel Comitee at 8 percent, and than the minimum ratio specified by PMA at 12 percent.
• Non-performing Loans- Provisions to Core CapitalThis ratio is specific to bank capital adequacy against risks arising from bank credit. This ratio reached around 4.9 percent at the end of 2012 for all banks operating in Palestine, a significant rise compared to 3.8 percent recorded in 2011.
An increase in this ratio is considered a negative indicator of bank performance as it reflects inefficiency in collecting debts, or a cut in capital or both. This ratio is also linked with progress made in other economic sectors and their ability to fulfill their obligations towards banks.
There is a disparity in this ratio between local and foreign banks, with 6.2 percent for local banks and 3.8 percent for foreign banks. The reasons for this go back to foreign banks adopting more conservative policies in extending credit, in addition to a clear disparity in the value of core capital that local and foreign banks possess.
• Core Capital to Total AssetsThis ratio is regarded as a leverage ratio and shows the extent of coverage by core capital of total assets of the bank, which was specified by Basel standard requirements at 3 percent. As banks’ capital continued to rise, this ratio rose accordingly. However, this ratio shows some fluctuations from year to year for banks operating in Palestine. This is due to the persistent rises in capital items as a result of the PMA’s policy to strengthen banks’ capital. Likewise, it is also a result of the changes which bank assets witness, especially in credit items which tend to rise from one period to another.
In 2012, the ratio of core capital to total assets of all banks in Palestine reached 10.6 percent compared to 10.9 percent
Figure 5-1: Capital adequacy ratio, 2008-2012
Perc
ent
All banks
Foreign banks
Local banks
Figure 5-2: (NPLs-provisions) as a percent of core capital, 2008-2012
Perc
ent
Foreign banks
All banks
Local banks

33
Financial Soundness Indicators of the Banking Sector
in the previous year. As to local versus foreign banks, the ratio reached 11 percent for local banks and 10.2 percent for foreign banks.
2. Asset Quality Indicators
• Large exposures to Core Capital The financial conditions of a bank play a key role in determining the ratio of their large exposures (credit concentration risk). The PMA classifies major borrowers on the basis of loan amount (USD 100,000 and above), and have requested banks to disclose any loans which reach or exceed this amount. On the other hand, PMA instructions state that it is not acceptable that the value of a single loan exceeds 10 percent of the bank’s capital without pre-approval from the PMA27.This complies with article (16) of Banking Law (9) for the year 2010.
The ratio of large exposures to the core capital for banks operating in Palestine reached about 266.6 percent at the end of 2012, compared to 236.3 percent in 2011. The increase in this ratio reflects a rise in credit concentration, or the upsurge in the number of loans which exceed USD 100,000 per loan. This adds to the possibility of default in case of emergency.
• Non-Performing Loans to Total Loans
This ratio reflects the quality of loans given by banks and how far borrowers are committed to serving their loans. It is one of the key ratios expressing the quality of bank assets.
It is clear from data collected from banks operating in Palestine that there is a continued decline in the ratio of NPLs to total loans between the years 2008-2011. However, at the end of 2012 this ratio increased slightly to reach 3.1 percent, compared to 2.8 percent in the previous year. In spite of this, the rate of default generally remained low and does
27 According to banking law number (9) for the year 2010, credit concentration is the total exposure per individual or a group of individuals working together and brought together by a common interest or kingship to the second degree. The exposure is defined as all forms of direct and indirect credit granted per person, along with bonds and debt instruments issued by the same person and purchased by the bank. This is in addition to the bank’s investments in this person, whether in the form of equity or any other investments. Instructions No. (5/2008) identifies the conditions for granting credit and credit concentrations
Figure 5-3: Core capital as a percent of total assets, 2008-2012
Perc
ent
Local banks
All banks
Foreign banks
Figure 5-4: Large-exposures as a percent of core capital, 2008-2012
Perc
ent
Figure 5-5: NPLs as a percent of total loans, 2008-2012
All banks
Foreign banks
Local banks
Perc
ent

34
Financial Soundness Indicators of the Banking Sector
not reflect a grave risk to financial stability, compared to other countries, where the ratio reached 8.4 percent in Jordan, 9.9 percent in Egypt and 3.8 percent in Lebanon in 2012. In 2012, the non-performing loans to total loans ratio reached around 2.4 percent for local banks, versus 3.7 percent for foreign banks.
• Total Credits to Total Assets This ratio is an indication of the activation of banks’ main role as a financial intermediary between economic sectors with surplus funds and those with a deficit. This ratio has improved notably over the past years in the wake of PMA’s efforts to increase the volume of credit extended domestically in order to stimulate the economy. As a result, this ratio at the end of 2012, was around 41.8 percent compared to 38.0 percent in the year before. As for local versus foreign banks, this ratio stood at 46.3 percent for local banks and 38.5 percent for foreign banks at the end of 2012.
3. Profitability IndicatorsProfitability ratios in the banking sector illustrate the twin impact of the efficiency and productivity on asset profitability, and returns on ownership equity through power of financial leverage for increasing this return.
During 2012, banks operating in Palestine achieved a net income of USD 124.2 million, falling back by 3.6 percent from the level of 2011 (USD 128.9 million). However, a closer look reveals that net interest (interest received - interest paid) rose by 10.5 percent (USD 29.1 million) in 2012.
• Return on Average Assets28 (ROAA)This ratio reflects the efficiency in cost monitoring, and use of assets, or both. The increase in ROAA is usually a result of cost monitoring and reduction or more efficient and effective use of banks’ assets.
Data indicate that ROAA has slightly declined during 2012 to 1.8 percent, compared to 1.9 percent in 2011, as a result of the fall in profits by 3.6 percent during the same period. This might indicate a slight drop in efficiency of asset usage.
There is no doubt that there are disparities among banks in their method of risk distribution, market shares and other, which are indicators that play a role in determining the return on assets ratio. This is reflected in the slight discrepancy between local banks as against foreign banks in terms of this return. This ratio reached 1.9 percent in 2012 for local banks and 1.8 percent for foreign banks.
28 The Return represents the net profit before the taxed and unusual profit and loss.
Figure 5-6: Total credits as a percent of total assets, 2008-2012
Local banks
All banks
Foreign banks
Perc
ent
Figure 5-7: Return on average assets (ROAA), 2008-2012
Perc
ent
Local banks
All banks Foreign banks

35
Financial Soundness Indicators of the Banking Sector
• Return on Core CapitalReturn on average core capital is closely associated with return on average assets, as the change in return on average assets leads to a change in return on core capital. The difference between the two returns is attributed to the impact of financial leverage, which makes the return on core capital more or less than the return on assets.
It is noted that the return on average core capital for banks operating in Palestine has decreased in 2012 to 16.3 percent, compared with 17 percent in the previous year, due to the drop in banks’ profits in addition to the increase in banks’ capital. As to local banks, this ratio reached about 15.2 percent, as against 17.1 percent for foreign banks in 2012.
4. Liquidity IndicatorsLiquidity is one of the factors necessary for the survival of banks as it increases depositors’ and creditors’ confidence, and protects banks against unnecessary liquidation of assets. It also prevents resorting to financial markets and incurring extra costs to finance a shortfall, If it materializes. In addition there are numerous risks banks could face in case of liquidity shortages.
It is possible to measure banks’ liquidity through a number of ratios such as liquid assets to total asset, liquid asset to short term liabilities, or to total deposits and others. Regardless of the ratio used, all provide guidance as to the liquidity position in banks, and banks’ ability to resist expected risks which may arise from liquidity shortages for any reason.
The following are some of the liquidity ratios which are used by banks operating in Palestine:
• Liquid Assets to Total Assets Liquid asset to total assets for all banks operating in Palestine was around 37.5 percent in 2012, compared to 38.2 percent in the previous year. This is an indication of the increasing investment in illquid assets such as direct credit facilities.
As is clearly illustrated by the figure, local banks often maintain liquidity ratios less than those of foreign banks overtime with approximate convergence in recent years, indicating a rise in the level of liquid assets in local banks compared to foreign banks. This ratio reached 37.7 percent for local banks, and 37.3 percent for foreign banks at the end of 2012. The reason for this may be due to the availability of more investment windows for foreign banks compared to local banks since there are no local bank branches outside Palestine.
Figure 5-8: Return on average core capital, 2008-2012
Local banks
Foreign banks
All banks
Perc
ent
Figure 5-9: Liquid assets as a percent of total assets, 2008-2012
Perc
ent
All banksForeign banks
Local banks

36
Financial Soundness Indicators of the Banking Sector
• Liquid Assets to Short-term Liabilities
This ratio shows the extent of coverage for banks’ liquid assets to liabilities set for drawl at any time without prior consent by holders of these liabilities. A rise in this ratio is a good indicator in terms of risk, as it reflects the bank’s ability to face any unexpected short-term withdrawals; however, it negatively affects the return and profitability ratios, as it implies the existence of assets unnecessarily held and unutilized to generate profit. In this case, banks incur additional management and maintenance expenses.
This ratio is also associated with general economic conditions; it rises during economic and political tensions and drops at relative calm. By the end of 2012, the liquid assets to short-term liabilities ratio was 49.3 percent, compared to 49.2 in the previous year; it was 52.9 percent for local banks and 46.9 percent for foreign banks.
Figure 5-10: Liquid assets as a percent of short-term liabilities, 2008-2012
All banks
Foreign banks
Local banks
Table (5-1): Soundness indicators of banks operating in Palestine, 2008-2012(Percent)
201220112010200092008Indicator
Capital Indicators
20.321.121.420.319.2Capital adequacy ratio
4.93.82.92.16.2NPLs to core capital
12.411.210.79.711.5Core capital to total assets
Assets quality indicators
266.6236.3225.2215.9209.7Large-exposures to core capital
3.12.83.14.18.1NPLs to total loans
Profitability indicators
1.81.92.11.81.6 Return on average
16.317.021.120.321.4Return on core capital
Liquidity indicators
37.538.240.343.3N.ALiquid assets to total assets
49.349.251.755.1N.ALiquid assets to short-term liabilities

37
Developm
ents in Non-Banking Financial Institutions
Chapter Six Developments in Non-Banking Financial Institutions
Overview
The non-banking financial institutions are subject to the control and supervision of Palestine
Capital Market Authority (PCMA), with the exception of the specialized lending institutions and
money exchange institutions which are subject to the control and supervision of the PMA. These
institutions, in general, have witnessed a number of financial and legislative developments
during 2012 which consist with the general economic conditions in Palestine.
Table (6-1): Money changers in Palestine,2010-2012
Item 2010 2011 2012
Corporate 95 154 173
Individual 165 130 103
Total 260 284 276
1. Money ChangersThe Money Changers Licensing & Supervision Decree No. (13) for the year 2008 forms the legislative and legal framework which governs money exchange activities in Palestine. In light of this system, the PMA issued a set of instructions and decisions to organize this sector. The most important of these are the instructions relating to the following: the minimum capital, quick transfers agencies, working capital and cash insurance, counterfeit money, and finally, accounting system reports (which money exchange institutions have been required to implement based on certain criteria and specifications). The latter instruction was issued to ensure transparency, accuracy and soundness of the financial system in Palestine.
At the end of 2012, the number of money changers licensed to practice that profession was 276, of which 234 were in the West Bank, and 42 in Gaza. In terms of legal form, there were 173 money changers who practice their profession as corporate and 103 changers as single proprietorships.

38
Developm
ents in Non-Banking Financial Institutions
On the other hand, by the end of 2012, the value of the working capital for money changers amounted to USD 44.2 million, of which USD 26.2 million was for private money changing corporations, and USD 18 million for ordinary non-corporate changers. Meanwhile, total guarantees and deposits of money changers came to USD 1.54 million, distributed between deposits at 51 percent with a value of USD 0.78 million and banking guarantees at 49 percent with a value of USD 0.76 million.
The largest potential risk in money changing activity to financial stability relates to money changers who practice their profession illegally, i.e., without the direct supervision of the PMA. Illegal practice provides money changers with the opportunity to engage in certain acts which are barred by the PMA, such as accepting deposits and granting facilities and so on.
2. Specialized Lending InstitutionsThe work of these institutions focuses on small enterprises and development projects. They mainly depend on grants and external support in addition to internal borrowing from banks. From a financial stability perspective, these institutions do not constitute a significant risk to the stability of the Palestinian financial system given that their work is on a small scale compared to that of banks. As such, the value of credit granted by these institutions does not exceed 2.5 percent of facilities extended by banks, or about 1 percent of GDP. Thus, the limited relationship of these institutions with banks lessens the potential channels for risk transfer. Despite that, there are potential risks for these institutions which lie in weak governance practices caused by multiplicity of both legal form and authorities charged with oversight on these institutions (prior to the issuance of the Specialized Lending Institutions regulations), the nature of their work, and their long inherited administrative and financial systems.
After issuing the Specialized Lending Institutions Licensing and Supervision regulations no. 132 for the year 2011, the PMA began addressing the causes of weak governance in lending institutions, developing their systems, and controlling and supervising their operations to ensure their contribution to economic development, the financial system and financial stability. Thereafter, instructions were issued clarifying the licensing mechanism for these institutions, and their good management and governance. Furthermore, the instructions also specified permitted and prohibited activities, such as the inadmissibility of performing business or any banking activities other than lending, or establishing investment or trading funds. They were also barred from functioning as financial intermediary firms in the Palestinian market for securities, or in the global financial market, and from engaging in investments and trading securities for their own accounts. In contrast, they were permitted to extend funding, open accounts, invest funds in banks, accept collaterals and grants, and issue internal and external remittances to customers solely for the purpose of financing. It is worth noting that these institutions have been included in the PMA’s Credit Bureau, which will help them exclude customers with bad credit rating, thus raising the repayment ratio.
3. Securities SectorAt the end of 2012, 48 companies were listed in the stock exchange, with a market value of around USD 2.9 billion, distributed between 5 sectors: banks and financial services, insurance, investment, manufacturing and services.
In order to enhance links between various institutions of the financial systems, mainly between the stock exchange and the banking sector, a cooperation agreement was signed between the PMA and the Palestine Stock Exchange in March 2012. This was in order to settle net transactions in the financial market via BURAQ system, after adopted the clearing, depository and settlement center (CDS) as a cash settlement agent. The agreement would also reduce the settlement-risks from trading operations in addition to providing the stock market an opportunity to devise future plans to increase the speed of cash circulation from trade processes.

39
Developm
ents in Non-Banking Financial Institutions
The analysis of stock ownership by nationality shows that in 2012, the ratio of Palestinian investors accounted for around 59.1 percent of the share values and 63.5 percent of the number of stocks. Meanwhile, Jordanian investors constituted about 12.1 percent of stock value, followed by investors from Liberia, Saudi Arabia, Luxemburg, United Kingdom, Bahrain, Kuwait and other nationalities. There is no doubt that the increase in foreign investment in the stock exchange may constitute a channel of risk to financial stability as it may force owners of these investments to withdraw their investments in the event of political or economic disturbances.
As for risks related to the banking sector, credit granted by banks to invest in stocks accounted for around 1.5 percent of bank credit, and their value reached USD 61.3 million at the end of 2012. The meagerness of this percentage could not present a source of risk or threat to financial stability in Palestine in the event of default on these credits.
4. Insurance SectorIn 2012, the PCMA issued a series of instructions, decisions and circulars with the aim to maintain soundness and stability in the insurance market, all set forth to reinforce transparency and corporate governance in insurance companies. The most important of these instructions calls for the appointment of financial and technical actuarial specialists in insurance companies, so as to test the extent of fairness in technical reserves, loss ratios and pricing policies. These would enhance the quality of reserve estimation for accident claims, and book reserves based on global actuarial standards. They would also improve financial stability of insurance companies and avert fluctuations in the size of reserve allocations and actual payments. The PCMA also issued instructions on anti-money laundering operations, and permitted insurance companies to use the approved electronic seals of banks in order to seal insurance documents, provided the institute measures to control their use.
At the end of 2012, there were 10 insurance companies operating in Palestine, functioning through 111 branches distributed in various areas. These companies run their businesses and offer insurance services through 229 agents and 1035 employees distributed in the companies’ main centers and their branches.
With respect to the financial activities of these companies, assets rose by 5.1 percent compared to 2011, amounting USD 340 million at the end of 2012. Likewise, equity rights increased by 7.6 percent, valued at USD 108.8 million, as did the paid-up capital by 6.5 percent to reach USD 67.2 million. This was positively reflected in the net operation results of these companies. They achieved a net profit of USD 7.3 million after taxes.
Insurance company assets were mainly distributed in investments at 54 percent of total assets, with a value of USD 184.6 million (64 percent were internal investments and 35.3 percent external), indicating a growth rate of 2.2 percent in comparison to 2011. Accounts receivable were 18.6 percent of total assets, their value reaching USD 63.4 million, followed by insurance contract assets at 9.5 percent of total assets. Cash in banks and funds accounted for 3.5 percent of total assets and their value was USD 11.9 million.
Table (6-2): Financial indicators of insurance sector, 2012
PercentIndicator
132.8 Total insurance premiums- to-shareholder’sequity
111.9 Insurance premiums (net)-to-shareholder’sequity
13.8Change in shareholder’s equity
84.3Holding premiums
10.8Total expenses-to-total assets
15.7Reinsurer’s share of premiums
15.4Reinsurer’s share of paid up claims
70.5Average losses
67.9Shareholder’s equity-to-technical provisions
181.3Technical provisions-to-paid up claims
25.5Average administrative cost
6.7Return on shareholder’s equity
2.1Return on assets
3.3Assets-to-GDP
1.8Investment-to-GDP
199Solvency margin

40
Developm
ents in Non-Banking Financial Institutions
External investments for insurance companies were distributed between properties at 28.0 percent, bank deposits at 26.9 percent, shares at 25.1 percent, bonds at 18.8 percent and the rest (1.2 percent) for related loans and allied companies.
As to financial soundness indicators of the insurance sector in 2012, the total insurance premiums to total shareholder’s equity witnessed a slowdown by about 24.6 percentage points against the previous year, to reach 132.8 percent. The net insurance premiums to total shareholder’s equity reached about 112 percent. This ratio reflected the net insurance premiums and the corresponding capital and reserves. It therefore reflects the risks which the insurance sector is vulnerable to, after deducting the risk transfers to reinsurers; whenever these ratios increased, so did the risk to capital.
The ratio of holding premiums, which mirrors the extent of dependency on reinsurance, reached around 84.3 percent29. The loss rate of the sector (compensation/acquired or earned premiums30) was approximately 70.5 percent, whereas administrative costs ratio31 reached 25.5 percent. This ratio shows a company’s efficiency in rationing its general expenses. It is also noticed that shareholders’ equity cover around 67.9 percent of technical provisions, whereas technical provisions covered almost double the compensations paid in 2012.
With respect to profit rates of the insurance sector, return on shareholders’ equity was 6.7 percent, whereas the return on assets was only 2.1 percent.
On the other hand, the PCMA calculated the solvency margin ratio32 for all insurance companies in order to cope with the risks that these companies are vulnerable to as a result of inadequate technical reserve allocations or default in company assets. Note that the solvency margin for insurance companies was a minimum of 100 percent at the end of 2008, and has been gradually raised by the PCMA over the years to reach 150 percent at the end of 2011 when the actual value of the solvency margin was 181 percent, compared to 199 percent in 2012. The PCMA seeks to raise this ratio given its importance in limiting risk impact on insurance companies.
In the context of analyzing the links and channels of impact between the insurance sector and the banking sector, it is noticed that the degree of the insurance sector’s exposure to risks pertaining to the banking sector is clearly greater than the banking sector’s exposure to risks posed by insurance sector. At the end of 2012, deposits of the insurance sector in banks accounted for around 14.5 percent of the total assets of these companies, and 27 percent of their total investments, whereas these deposits accounted for only 0.6 percent of total deposits in the banking sector.
29 This ratio is represented in the result of dividing the net insurance premiums (total insurance premiums after excluding reinsurer shares) over total insurance premiums.
30 The acquired installments are an expression of the insurance premiums after deducting reinsurer shares from the insurance premiums, and deducting the value of change in reserves in force and mathematical reserve.
31 This is calculated by dividing total administrative with total premiums.32 The amount of excess company assets over its requirements, allowing it to carry out its obligations, pay compensations immediately
when due without leading to the insolvency of the company.
Figure 6-1: Linkages between insurance and banking sectors, 2008-2012
Insurance sector deposits as a percent of total deposits in banks
Banks balances with insurance as a percent of of total insurance liabilities
Perc
ent

41
Developm
ents in Non-Banking Financial Institutions
Table (6-3): Performing indicators for mortgage sector, 2008-2012
20122011201020092008Item
37.537.138.737.940Assets (USD million)
21.52121.721.122.8Equity (USD million)
0.450.350.340.440.53Profit of the year (USD million)
57.356.656.155.757.0Equity-to- Assets (%)
1.20.90.81.21.3Return on assets (%)
2.11.71.62.12.3Return on equity (%)
0.91.11.41.72.3Assets-to-Credit (net, %)
In contrast, bank balances at insurance companies accounted for 0.7 percent of total insurance companies’ liabilities. In addition, internal banks’ investments in financial companies as a whole33 (subsidiaries, affiliated companies and minority rights) did not exceed 11 percent of total bank investments. These ratios clearly reflect the extent of the insurance sector’s exposure to risks in the banking sector, given that the latter carries by far the greatest weight in the Palestinian financial system, compared to other financial systems which are still in the development stage.
5. Mortgage SectorThe mortgage sector has only recently been established. Activities in this sector are practiced by one company- “Palestine Mortgage Leasing Company”, and its subsidiary “Palestinian Mortgage Leasing Company”. It is important to note that the Palestinian government terminated its contribution to the Palestine Mortgage Leasing Company in 2012 and a new board of directors was elected from the private sector. The company was transformed into a company 100 percent fully owned by the private sector after 15 years of partnership with the government. Two banks operating in Palestine (The National Bank and Arab Bank) are the main contributors to this company. Overall, this contribution strengthens the links between institutions in the Palestinian financial sector.
By the end of 2012, the company’s profit recorded a growth rate of 28.6 percent compared with the previous year, reaching USD 52 thousand. Likewise, its assets grew by 1.1 percent, valued at USD 37.5 million.
On the other hand, the year 2012 witnessed the launching of the legislative and legal system regulating the mortgage leasing sector. In 2012, the PCMA’s board of directors approved the Palestinian Leasing Draft Law in preparation for its approval and ratification by the counci l of ministers. Similarly, the general directorate of mortgage and financial leasing in the PCMA issued a set of instructions to organize this sector. The most fundamental of these instructions pertain to mortgage licensing, intermediation and real estate appraisers, in addition to instructions specifying capital adequacy for such companies. These were to guarantee these companies’ stability and development, with a view to become an efficient component in the Palestinian financial system. In addition,10 new appraisers were licensed, raising the total to 41 appraisers licensed by the PCMA at the end of 2012.
Despite the limitations and newness of the mortgage sector, lending activity in the field of mortgage and housing witnessed a significant growth, whether by banks (refer to chapter 4) or by specialized lending institutions. Data indicate that the number of mortgage and housing loans granted by specialized lending institutions reached 5,478 loans with a value of USD 32.8 million at the end of 2012, a rise by about 54.1 percent in terms of number and 36.1 percent in terms of value compared to the year before.
Note that personal crafts and related professions acquired the highest share of mortgage loans in 2012, with a ratio of 35.1 percent of the number of loans granted and 33 percent of total loans extended.
33 Data on bank investments in insurance companies as an independent sector are not available.

42
Developm
ents in Non-Banking Financial Institutions
Analysis of the portfolio of mortgage loans granted by specialized lending institutions shows a drop in the number of non-performing loans from 6.5 percent of the total number of loans granted by the housing and mortgage sector in 2011 to 4.4 percent in 2012. As for value, non-performing loans also decreased from 3.3 percent to 1.4 percent over the same period. This shows a tangible improvement in the mortgage loan portfolio and a decrease in the volume of risks associated with it and its repercussions on the financial positions of specialized lending institutions, thus enhancing financial stability in general.
Looking at the borrower type, borrowers in personal crafts and related occupations have the largest rate of default. This is due to their irregular monthly income and the latter’s fluctuations from one period to the next. This issue calls for analysis of risks arising from these loans and mechanisms for their reduction, and for preventing their contagion to other sectors so as to limit their impact on financial stability.
It is noteworthy that since 2011, the PMA has begun initial experimentation with the operation of a database devised exclusively for mortgage and housing loans in Palestine. This database aims to reduce risks and avert any future crises that may arise, similar to the housing crisis that occurred in the U.S in 2008.
6. Financial Leasing SectorFinancial leasing is considered one of the more recent financing methods that has been introduced to the Palestinian market in the past few years. With the issuance of the Leasing Law in 2011, the legal framework of this sector began to be updated and developed. The law defined leasing activity as an act of investment or a commercial activity practiced by the lessor. It involves the lessor’s purchase of a specific property34 based on certain agreed conditions with the tenant or lessee, and includes the possession status of the lessee along with its use in accordance with the agreement terms with the lessor. The public administration of mortgages and financial leasing in the PCMA works to develop this sector in order to contribute efficiently to the growth of the Palestinian economy.
At the end of 2012, there were 8 companies practicing financial leasing, all of which work in the field of vehicle finance. The PMA considers it important for these companies to join the credit bureau which PMA supervises, so as to guarantee growth and stability of these companies as a financing tool and an important part of the financial system.
34 Leased premises are all capital that unable to depreciate and includes factories, immovable capital, capital goods and equipment manufactured specially for the project. This definition does not include cash or securities and the definition of money does not pertain to only it being a joint portion to the property or incorporated to an immovable object.
Figure 6-2: Housing and mortgage loans, 2012
Perc
ent
No. of loans Value of loans
OthersPersonal crafts & related professions
AssociationsPrivate sector employees
Public sector employees
Public entities
Corporates
Figure 6-3: NPLs according to subsectors, 2011-2012
Perc
ent
OthersPersonal crafts & related professions
AssociationsPrivate sector employees
Public sector employees
Public entities
Corporates

43
Financial Pressure “Stress Testing”: A Future Outlook
Chapter Seven Financial Pressure “Stress Testing”:A Future Outlook
Overview
Financial stress testing has become one of the most crucial tools in risk management as a part of the overall risks management, whether for banks or supervisory authorities. These tests provide a view of the bank’s condition under certain circumstances.
Given the huge importance of this application and its implementation by banks and regulatory authorities in advanced countries, the PMA has also begun to conduct stress tests in order to identify the consequences of various risks in Palestine under specific scenarios. This allows the PMA as well as the banks to install prudential (hedging) policies that enable banks to overcome the risks arising from these scenarios, should they occur.
1. Macroeconomic Stress TestingThe real economy and its developments are regarded a source of risks that financial stability may be vulnerable to in any country. Just as risks and crises that the financial sector experiences impact various economic sectors, the risks and fluctuations which macroeconomic indicators are subject to impact directly and indirectly the performance of banking institutions in particular and financial institutions in general. This is particularly valid in developing countries- including Palestine- given that the banking sector in these countries represents the core of the financial system, and has close relations with other economic sectors. Hence, analysis of financial stability situation requires examination and forecast of potential impact of macroeconomic developments on the financial sector.
In this context, tests were conducted for the ability of banks operating in Palestine to endure negative shocks on the macroeconomic level, based on the Vector Autoregressive Model (VAR). Net loan provisions were used as a measure for financial fragility. Given that data was available quarterly and for a sufficient time period, the model in question could be used. In addition, income statements of banks, were available, providing a direct relationship with net profits.

44
Financial Pressure “Stress Testing”: A Future Outlook
The model aims to carry-out a prototype of the relationship between banks’ financial fragility and any shocks that are linked with macroeconomic variables. In order to carry out this test, a number of macroeconomic variables are chosen to measure their impact on loan provisions which hedge banks against default on loans granted. These variables include: growth rate, lending and deposit rate of the three currencies circulating in the Palestinian economy, exchange rate for each of the USD, JD and the NIS, real effective exchange rate (REEF) and finally the inflation rate.
The test was carried out according to two scenarios- the baseline scenario and the pessimistic scenario. These scenarios are derived from scenarios which were prepared in the PMA’s Annual Report for 2012. According to the baseline scenario, it is expected that the Palestinian economy will experience growth by 5.3 percent and 5.2 percent in 2013 and 2014 respectively, assuming that no changes will occur in the political arena and a continuation of the stalemate in the peace process. Likewise, the scenario assumes the continuation of economic conditions of 2012, no change in e restrictions imposed on the movement of individuals and domestic trade, the prevalence of obstacles and barriers to imports and exports in the WB, and the continuation of closing all border crossings in Gaza at the same rate of closure as in the previous year.
In contrast, under the pessimistic scenario, it is expected that the growth in GDP will in fact record a dip by 2.1 percent in 2013, and a slight growth of 0.3 percent in 2014. This is in the event that the next two years experience negative shocks, such as a deterioration in the political situation dramatically, with repercussions on economic activity, such as cuts in the number of Palestinian workers in Israel by 30 percent, the tightening of restrictions on the movement of individuals and goods, and a rise in the number of closing trade days by 25 percent. Furthermore, the negative shocks may arise from an increase in export and import barriers, Israeli stopping the transfer of clearance revenues, along with a decrease in foreign aid by 40 percent.
After assessment of the model based on VAR from the third quarter of 2003 to the fourth quarter of 2012, the following conclusions were drawn:
• There is an inverse relationship- between unexpected negative shocks in real GDP and loan provisions. This impact is particularly significant statistically with a four-quarter lag.
• There is a positive relationship between changes in lending rate in the U.S dollar and loan provisions (the increase in interest rate is expected to lead to defaults). This impact is also statistically significant with a four-quarter lag. This means that in the case of an unexpected increase in interest rates, there will be an increase in loan provisions by banks. However, the maximum impact of this shock will be after four quarters from the date the shock occurs.
When using the VAR model to deduce loan provision forecasts based on the two aforementioned scenarios, the results as clearly illustrated in table (7-1), indicate that according to the baseline scenario, the net loan provisions will increase by USD 1.7 million in 2013, whereas they will shoot up by USD 9.2 million based on the pessimistic scenario for the same year. By taking the time lag into account, the maximum effect of this shock will be in the third and fourth quarter of 2013, recording an increase in loan provisions with a value of USD 10.7 million and USD 12.2 million for the two quarters respectively, based on the pessimistic scenario. Thus, this shock’s impact on loan provisions will be concentrated in the second half of the year with an increase to USD 23 million.
Table (7-1): Change in provisions forecasts according to different scenarios
Optimistic ScenarioPessimistic Scenario
PeriodChange in loans provisions
(USD million)
Real GDP growth rate (%)
Change in loans provisions
(USD million)
Real GDP growth rate (%)
+9.2-2.1+1.75.32013
-7.52.9-7.55.11st Quarter
-6.5-4.7-6.84.22nd Quarter
+10.7-2.5+8.17.33rd Quarter
+12.2-3.8+7.94.74th Quarter

45
Financial Pressure “Stress Testing”: A Future Outlook
2. Interbanking stress testingThe test for banks’ resilience (represented by capital adequacy ratio) to the collapse of one of the banks operating in Palestine is based on the inter-banks data matrix. Supposing that one of these banks collapses, whether foreign or local, the result (represented by the impact on capital adequacy) on the rest banks will be as follows:
• All local banks will have adequate liquidity, well capitalized and are able to absorb the collapse of any bank operating in Palestine, with a capital adequacy ratio for each bank remaining higher than 12 percent after the collapse, which is higher than the minimum ratio specified by the PMA. Note that the minimum ratio according to the Basel standard is 8 percent. The decline in capital adequacy ratio for local banks range only from 0-8 percentage points. Note that the capital adequacy ratio of all local banks remains higher than 12 percent as stated above.
• Foreign banks also will have adequate liquidity and are able to withstand the collapse of any bank operating in Palestine, where the capital adequacy ratio remain higher than 12 percent, except for bank (B11) where it will decrease below 12 percent If any of the banks (B2, B3 or B17) collapses. The decline in capital adequacy ratios for foreign banks range from 0– 26.5 percentage points. Note that the capital adequacy ratio of foreign banks remains higher than 12 percent, apart from bank B11.
In general, the previous results portray the immunity of banks operating in Palestine in terms of capital adequacy in the event of a bank’s failure or collapse. The tests prove limited contagion on banks survival in the event of a hypothetical failure of one bank. It is possible to overcome the limited impact represented by a decline of capital adequacy ratio of bank B11 below the 12 percent mark by strengthening the capital of this bank. Note that the capital adequacy of this bank will remain higher than the recommended 8 percent after the shock.
Table (7-2): Capital adequacy ratio for banks operating in Palestine after the shock, 2012
Capital Adequacy ratio after
shock
Foreign banks(code)
Capital Adequacy ratio after
shock
Local banks(code)
50.3B824.5B1
148.7B931.6B2
41.7B1020.5B3
11.1B1122.2B4
94.2B1213.2B5
78.9B1321.5B6
16.4B1429.7B7
83.8B15
18.0B16
24.2B17
Figure 7-1: Capital adequacy ratio for banks operating in Palestine before & after the shock, 2012
Perc
ent
All Banks before the shock Collapse of bank B2 Collapse of bank B3Collapse of bank B17

