2012 · affiliated persons for 2012 and assessed it favourably without reservations. the...
TRANSCRIPT

ŠKODA AUTO a.s.
2012ŠKODA Annual Report

Contents 4 Foreword
Management Report
8 ŠKODAAUTOGroupProfile
9 Corporate Governance 9 Report of the Supervisory Board 10 ŠKODA AUTO bodies 12 Declaration of Compliance with the Code of Corporate
Governance
13 Business Operations 13 Strategy 14 Product Portfolio 15 Overview of developments on the automobile markets 16 Financial situation 18 Technical development 19 Purchasing 20 Production and logistics 23 Sales and marketing 27 Human resources management 29 Sustainability
32 Risk Report 32 Risk management system
34 Outlook 34 Short-term and long-term outlook 36 Milestones of the year 2012
FinancialSection
42 Auditor‘s report on the annual report and the report on relations 44 Auditor’sreportontheconsolidatedfinancial statements 46 Consolidatedfinancialstatementsfortheyearended 31 December 2012 51 Notestotheconsolidatedfinancialstatements2012 106 Auditor’sreportontheseparatefinancialstatements 108 Separatefinancialstatementsfortheyearended 31 December 2012 112 Notestotheseparatefinancialstatements2012 168 Report on relations 173 Glossary of terms and abbreviations 175 List of non-consolidated capital holdings of ŠKODA AUTO 176 Persons responsible for the annual report and post-balance sheet events 177 Keyfiguresandfinancialresultsataglance

3Annual Report 2012
Company Overview
ŠKODA AUTO, based in Mladá Boleslav in the Czech Republic, is
one of the world’s longest-standing automobile manufacturers.
The tradition of the Company dates back to 1895, when Václav
Laurin and Václav Klement formed a partnership that laid the
foundation for over 100 years of Czech expertise in automotive
engineering.
The ŠKODA brand has been a Volkswagen Group brand for
more than 20 years. During this time, the ŠKODA AUTO Group’s
sales have increased substantially and its product portfolio has
expanded significantly. Today, ŠKODA AUTO employs more than
26,400 people worldwide.
The ŠKODA AUTO Group has production facilities in the Czech
Republic and India. Furthermore, ŠKODA cars are produced in
China, Russia, Slovakia, the Ukraine and Kazakhstan.
This international presence will form the basis for the Group’s
planned growth over the next few years. The conditions for this
are already in place: impressive automobiles, a strong brand, a
motivated and capable team and the ability to turn innovations
into Simply Clever customer benefits.

4 Annual Report 2012
Prof. Dr. h.c. Winfried VahlandChairman of the Board of Management
The year 2012 was another year of new records for us. The rigorous pursuit of our growth strategy is clearly having an impact. With 939,202 vehicles delivered to customers, we ex-ceeded the previous year’s record and increased the number of vehicles delivered to customers by 6.8%. Positive sales development and successful measures to boost efficiency ensured that our financial performance re-mained largely stable, despite difficult conditions worldwide. Sales revenue in the amount of CZK 262.6 billion increased by 4.0% year-on-year and, at CZK 17.9 billion, operating profit almost matched the previous year’s high figure. This gives us the strength to keep ŠKODA AUTO on a steady growth course.Our strategic goal remains unchanged: We aim to sell at least 1.5 million ŠKODA automobiles per year worldwide by 2018. Our model offensive will generate the necessary momen-tum for this. Over the next few years, we will be introducing a new or substantially-revised vehicle onto the market every six months on average. We started out with the ŠKODA Citigo and followed it with the ŠKODA Rapid. The new ŠKODA Octavia also made its world premiere in December 2012.In December, we also launched a cooperative project with Volks wagen and the Russian manufacturer GAZ Group to build the ŠKODA Yeti at the Nizhny Novgorod plant. This move will strengthen our position in the important Russian market. To secure our future growth, we made substantial invest-ments in many areas. Mladá Boleslav was one of the main focal points: Production capacity was increased at the plant
Foreword

5Annual Report 2012
itself, the parts centre expanded, a new high-performance ul-tra-energy-efficientITcentreputintooperationandthenew“Lean Centre” opened. After extensive remodelling, moderni-sation and expansion, the Vrchlabí plant also began produc-tion of the advanced DQ 200 seven-speed dual clutch trans-mission,whileinČesana,constructionofanewenginetestingcentre got underway.With a view to our internationalisation and growth strategy, we also invested in employee training programmes. A successful as-signment abroad depends on professional expertise and a will-ingness to adapt to new and often unexpected challenges. Our wide range of programmes prepares our employees for working abroad and supports them while away and on their return. AlthoughŠKODAAUTOhasitseyesfirmlyfixedonthefuture,the Company is understandably proud of its 117-year history. Reason enough for a complete redesign of the ŠKODA Muze-um in Mladá Boleslav – enabling the Company’s history to be presented in a new and contemporary way. The strength of tradition is not only evident at the new ŠKODA Muzeum, but also in the impressive track record of our motor-sports team. After its successes in 2010 and 2011, ŠKODA Mo-torsports found a higher gear and went on to make 2012 the most successful year so far in the 111-year history of ŠKODA Motorsport.We will continue to use the strength of our brand to convince people of our vehicles’ qualities in impressive new models in the future. ŠKODA automobiles make everyday driving more
reliable and practical for our customers with lots of smart and useful “Simply Clever” details. “Simply Clever” not only applies toourvehiclesthesedays,butalsodefinesourthoughtsandactions throughout the entire company. We made the important issue of sustainability a priority in 2012 and established the ambitious “GreenFuture” environmental project toentrenchsustainabilityevenmorefirmly through-out the Company. We also improved the transparency of our reporting, and our recently published 2011/2012 Sustainability Report meets the criteria of the Global Reporting Initiative for thefirsttime.Our work continues. Once again, we have ambitious plans for 2013. We will pursue our model offensive and expand our global presence. We will adhere to our chosen path. We will work hard to ensure that the ŠKODA AUTO success story continues. This fascinatingcompanywithitsfinehistoryiswortheveryeffort.
Yours
Prof.Dr.h.c.WinfriedVahlandChairman of the Board of Management

6 Annual Report 2012

7Annual Report 2012
Management Report
8 ŠKODAAUTOGroupProfile
9 Corporate Governance 9 Report of the Supervisory Board 10 ŠKODA AUTO bodies 12 Declaration of Compliance with the Code of Corporate Governance
13 Business Operations 13 Strategy 14 Product Portfolio 15 Overview of developments on the automobile markets 16 Financial situation 18 Technical development 19 Purchasing 20 Production and logistics 23 Sales and marketing 27 Human resources management 29 Sustainability
32 Risk Report 32 Risk management system
34 Outlook 34 Short-term and long-term outlook 36 Milestones of the year 2012

8 Annual Report 2012
ŠKODA AUTO Group Profile
ŠKODA AUTO Group profile
The ŠKODA AUTO Group ("the Group") is one of the leading corporate groups in the Czech Republic. It comprises the parent company ŠKODA AUTO a.s., its fully consolidated subsidiaries ŠKODA AUTO Deutschland GmbH, ŠKODA AUTO Slovensko, s.r.o., Skoda Auto India Private Ltd., and associates.
ŠKODA AUTO a.s.The parent company, ŠKODA AUTO a.s. ("the Company"), is a Czech company with a tradition of automotive manufactur-ing dating back more than a century, making ŠKODA one of the world’s oldest automotive brands. The Company’s prin-cipal business is the development, manufacture and sale of ŠKODA-brand automobiles, components and genuine parts and accessories and the provision of maintenance services. The sole shareholder of the parent company, ŠKODA AUTO a.s., is the company Volkswagen International Finance N.V., with its registered office in Amsterdam, the Netherlands. Volkswagen International Finance N.V. is an indirect 100% subsidiary of VOLKSWAGEN AG.
ŠKODA AUTO Deutschland GmbHŠKODA AUTO Deutschland GmbH was established in 1991 and has been a subsidiary of ŠKODA AUTO a.s. since 1995. The company’s principal business is the purchase and sale of vehi-cles, genuine parts and accessories.
ŠKODA AUTO Slovensko, s.r.o.ŠKODA AUTO Slovensko, s.r.o. was established in 1993 as a subsidiary of ŠKODA AUTO a.s. Its principal business is the purchase and sale of vehicles, genuine parts and accessories.
Skoda Auto India Private Ltd.This company was established as a subsidiary of ŠKODA AUTO a.s. in 1999 and began assembling vehicles in 2001. Its princi-pal business is the purchase, manufacture and sale of vehi-cles, genuine parts, accessories and other goods.
OOO VOLKSWAGEN Group RusThe company’s principal business is the purchase, manu-facture and sale of vehicles, genuine parts and accessories. ŠKODA AUTO a.s. holds a minority interest in this company.
In addition to OOO VOLKSWAGEN Group Rus, the ŠKODA AUTO a.s. company also has substantial interests in other as-sociated companies. However, their impact on the consolidat-ed corporation’s results is insignificant
ŠKODA AUTO a.s. registered office: Mladá Boleslav, Czech Republic
ŠKODA AUTO Deutschland GmbH
ŠKODA AUTO Slovensko, s.r.o.
Skoda AutoIndia Private Ltd.
OOO VOLKSWAGEN Group Rus
registered office: Weiterstadt, Germany 100% holding of ŠKODA AUTO
registered office: Bratislava, Slovakia 100% holding of ŠKODA AUTO
registered office: Aurangabad, India 100% holding of ŠKODA AUTO
registered office: Kaluga, Russia 16.8% holding of ŠKODA AUTO

9Annual Report 2012
Corporate Governance
In the past fiscal year, the Supervisory Board was regularly and extensively informed by the Board of Management of the operations of ŠKODA AUTO a.s. and its subsidiaries within the consolidated group, their financial performance, and their business policies. Business processes which, due to legal regulations or the Articles of Association, require the Supervisory Board’s ap-proval or briefing, or which were of extraordinary importance, were discussed in detail at meetings of the Supervisory Board. Based on written and oral reports from the Board of Manage-ment, the Supervisory Board was able to continuously oversee the activities of the ŠKODA AUTO a.s. management as well as that of the entire consolidated group, thus duly executing its powers entrusted to it under the law.Under its resolution of 23 March 2012, Volkswagen Interna-tional Finance N.V., as the sole shareholder of ŠKODA AUTO a.s., approved a proposal for commissioning Pricewaterhouse- Coopers Audit, s.r.o., Prague, to carry out an audit of the finan-cial statements for the 2012 accounting period.The auditor, reviewing separate financial statements of the ŠKODA AUTO a.s. pursuant to IFRS, the consolidated group fi-
nancial statements pursuant to IFRS as at 31 December 2012, and the report on relations between affiliated persons for 2012 issued an unqualified opinion. At its meeting on 1 March 2013, the Supervisory Board discussed the financial results and favourably assessed a proposal of the Board of Manage-ment for distribution of the ŠKODA AUTO a.s. profits based on the annual financial statements pursuant to IFRS. The Super-visory Board also reviewed the report on relations between affiliated persons for 2012 and assessed it favourably without reservations. The Supervisory Board authorised the Board of Management to submit the annual financial statements for 2012 and the proposal for the distribution of profits to the sole shareholder, Volkswagen International Finance N.V., Amster-dam, for approval.
ReportoftheSupervisoryBoard
ChristianKlinglerChairman of the Supervisory Board

10 Annual Report 2012
Corporate Governance
Supervisory BoardChristianKlingler(*1968)Chairman of the Supervisory Board since 22 June 2012(Member of the Supervisory Board since 6 November 2010)Member of the Board of Management for Sales and Marketing,VOLKSWAGEN AG
Prof.Dr.rer.nat.MartinWinterkorn(*1947)Member of the Supervisory Board since 1 January 2010Chairman of the Board of Management, VOLKSWAGEN AG
Dr.h.c.MichaelMacht(*1960)Member of the Supervisory Board since 6 November 2010Member of the Board of Management for Production, VOLKSWAGEN AG
Ing.MartinJahn(*1970)Member of the Supervisory Board since 1 April 2009Head of International Fleet Sales, VOLKSWAGEN AG
JaroslavPovšík(*1955)Member of the Supervisory Board since 16 April 1993Chairman of the basic organisation of OS KOVO ŠKODA AUTO
Ing.JanMiller(*1948)Member of the Supervisory Board since 16 April 1993Secretary of the basic organisation of OS KOVO ŠKODA AUTO
Board of ManagementProf.Dr.h.c.WinfriedVahland(*1957)Chairman of the Board of Management since 1 September2010, Central ManagementPrevious positions:– President and CEO, Volkswagen China Investment Company Ltd. (2005–2010) and Global Vice President, VOLKSWAGEN AG (since 2006)– Member of the Board of Management for Commercial Affairs, ŠKODA AUTO (2002–2005) and Vice-Chairman of the Board of Management, ŠKODA AUTO (2003-2005)
Dipl.-Kfm.WinfriedKrause(*1962)Member of the Board of Management since 1 April 2010, Commercial AffairsPrevious position:Head of Group Controlling, VOLKSWAGEN AG (2006–2010)
WernerEichhorn(*1963)Member of the Board of Management since 1 September 2012, Sales and MarketingPrevious positions:Head of Sales and Marketing Germany, VOLKSWAGEN AG (2008–2012)
Dipl.-Ing.MichaelOeljeklaus(*1963)Member of the Board of Management since 1 August 2010, Production and LogisticsPrevious position:Member of the Board of Management for Production and Technical Development, Shanghai Volkswagen Automotive Company Limited (2005–2010)
Dr.-Ing.FrankWelsch(*1964)Member of the Board of Management since 1 September 2012, Technical DevelopmentPrevious position:Head of Engineering Exterior, Interior and Vehicle Safety, Volkswagen Passenger Cars (2011–2012)
Dipl.-Ing.KarlheinzHell(*1963)Member of the Board of Management since 1 January 2010, PurchasingPrevious position:Head of Purchasing, Volkswagen of South Africa (Pty.) Ltd. (2007–2009)
Ing.BohdanWojnar(*1960)Member of the Board of Management since 1 January 2011, Human Resources ManagementPrevious position:Member of the Board of Management for Human Resources,Volkswagen Slovakia, a.s. (2009–2010)
ŠKODAAUTObodies

11Annual Report 2012
Corporate Governance
Audit CommitteeMartinMahlke(*1962)Audit Committee Chairman since 27 April 2010(Audit Committee member since 1 April 2010)Head of Group Controlling, VOLKSWAGEN AG
Dr.Ingrun-UllaBartölke(*1967)Audit Committee Member since 1 January 2010Head of Group Accounting and External Reporting,VOLKSWAGEN AG
BerndRumpel(*1959)Audit Committee Member since 1 January 2010Head of the ŠKODA Liaison Office, VOLKSWAGEN AG
ChangesintheSupervisoryBoard, BoardofManagementandAuditCommittee
Appointed as Chairman to the Supervisory Board: Christian Klingler – Chairman since 22 June 2012
Appointed to the Board of Management: Werner Eichhorn – Member since 1 September 2012Frank Welsch – Member since 1 September 2012
Resigned from the Board of Management:Jürgen Stackmann - Member from 1 September 2010 to 31 August 2012Eckhard Scholz - Member from 1 April 2007 to 31 August 2012

12 Annual Report 2012
Corporate Governance
ŠKODA AUTO is aware of its outstanding position in the Czech business environment and its respect within the Volkswagen Group and among competing manufacturers in the automotive sector. Therefore, it is fundamentally important that ŠKODA AUTO be perceived – by its employees, business part ners and all customers, and by the general public – as a success-ful, transparent and open company. ŠKODA AUTO is conscious of its tradition and reputation built over many years, which is considered of key significance for the further successful development of the Company’s business activities.In light of these facts, ŠKODA AUTO has been committed since 2007 to abiding by the relevant recommendations and rules set forth in the Code of Corporate Governance based on the OECD principles (hereinafter referred to as the “Code”) in the form in which it was updated in 2004 under the patronage of the Securities Commission. Through an unceasing improve-ment of its internal processes and procedures in accordance with the Code, the Company’s aim is to further promote trans-parency and ethical business practices in the Czech Republic.
DegreeofcompliancewiththerecommendationsoftheCodeofCorporateGovernanceIn line with best practice employed at the Volkswagen Group, a predominant part of the internal processes of the Company’s corporate governance has, over the long run, been estab-lished in accordance with the relevant rules of the Code. Given the shareholding structure of the Company (a sole sharehold-er – Volkswagen International Finance N.V.), the Volkswagen Group’s organisational structure (see the website of VOLKS-WAGEN AG) and the fact that the Company’s shares are not listed on any stock exchange, some of the recommendations contained in the Code are not relevant, or are transferred, to the appropriate degree, to the Volkswagen Group level to achieve efficiency and synergies.At the same time, the Company’s policies are derived from the Code of Conduct adopted by the ŠKODA AUTO Group, as part
of the Volkswagen Group. These adopted principles of con-duct are based on the application of generally recognised so-cial values. The document "Principles of Conduct of the ŠKODA AUTO Group, part of the Volkswagen Group" was distributed to all employees in September 2012.The Company is not in full compliance with the recommenda-tions of the Code pursuant to Chapter VI-E-2 (in conjunction with article 18 of the Commentary on the Code), according to which it should establish committees in charge of remunera-tion and nomination. In view of the Company’s specific share-holding structure, the activities associated with the commit-tees are in synergy and to the effective degree transferred to the corresponding Group level. The activities of the remu-neration and nomination committees are undertaken by the personnel committee of the Board of Management of VOLKS-WAGEN AG. Moreover, the Company is not in full compliance with the recommendations of the Code pursuant to Chapter VI-E-1 (in conjunction with article 5 of the Commentary on the Code), according to which the Board of Management and/or the Supervisory Board should have a sufficient number of members who are not employed by the company and who are not in a close relationship with the company or its manage-ment through significant economic, family or other ties.Nevertheless, the aforementioned non-compliance with re-spective Code requirements does not represent non-fulfil-ment of the mandatory requirements of the law of the Czech Republic nor does it constitute a legal risk for the Company.
ComplianceThe division responsible for Governance, Risk and Compli-ance was established at ŠKODA AUTO in 2011. The division's responsibilities include advising the Board of Management on all matters related to Compliance and implementation of pre-ventive measures for management and monitoring of compli-ance with legislation and internal regulations.
DeclarationofCompliancewiththeCodeofCorporateGovernance

13Annual Report 2012
ŠKODAgrowthstrategycontinuesThe implementation of the ŠKODA growth strategy began in 2010, showing the first results by 2011. This development con-tinued throughout the 2012 fiscal year: Sales reached 939,202 deliveries to customers, which was a new record. ŠKODA AUTO continued its product offensive with the European launches of the ŠKODA Citigo and an all-new compact limousine, the ŠKODA Rapid. Also, the third generation of the new ŠKODA Octavia was presented to the media at the end of 2012.Thanks to its business performance in 2012, the Group is in a good position for the years to come. Our long-term goal is to
increase annual deliveries to customers to over 1.5 million cars by 2018. This will involve a substantial expansion of the model line-up. Our model offensive is well under way: In the years to come, a new or updated ŠKODA model will be released every six months on average. The focus is on spacious, high-practi-cality cars that offer excellent value for money.The Group’s increasing internationalization is another key ele-ment of its growth strategy, and leveraging additional poten-tials in growth markets such as China, Russia and India is a priority. In 2013, ŠKODA AUTO will strengthen its product portfolio through two new models in China: The ŠKODA Yeti will be manufactured locally, and the production of the ŠKODA Rapid for China is already under way. ŠKODA AUTO is investing in the market development in Russia: production of the ŠKODA Yeti started at the GAZ Group production site in Nizhny Novgorod in December, 2012. GAZ is a corporation partner of VOLKS-WAGEN Group Rus and provides ŠKODA AUTO with additional capacity. In the near future, the new ŠKODA Octavia will also be produced there, and a localized version of the ŠKODA Rapid will be manufactured in Russia at a later date, too. The growth strategy is accompanied by extensive activities to boost profitability and by investments in the Group’s growth, especially in its home country, the Czech Republic. Major in-vestments are planned or have already been started in all three Czech production sites and also in future development, services and employee training. ŠKODA AUTO aims to become a more attractive employer at an international level.
“SimplyClever”–thecompany’smissionAll Group activities are defined by the motto “Simply Clever”. These two words are the core of the brand. They capture the essence of the mission and shape both of our products and processes. For our customers, “Simply Clever” stands for prac-tical, sophisticated and smart solutions.
Business Operations
Strategy
Profitability and financial
strength
Top employer
with globaltalent pool
Strategic “spearhead”focused onprice/value, practicality
and spacious - ness
Sales > 1.5 mil-lion vehicles
by 2018, focus on EU and
RIC-markets

14 Annual Report 2012
ProductPortfolio
ŠKODA CitigoSmall ŠKODA with a big future: With its modern design, the smallest ŠKODA brand car, introduced onto the market in 2011, has won the hearts of city dwellers, mainly due to its fuel economy, efficiency and safety. Thanks to many surprising details, the ŠKODA Citigo embodies the concept of a modern automobile for urban use, which is also fun to drive.
ŠKODAFabiaandŠKODAFabiaCombiŠKODA Fabia and ŠKODA Fabia Combi: both models, which offer fuel efficiency and effective use of space, have been among the best sellers in the ŠKODA brand portfolio for sev-eral years. Reliability, efficient engines, a reasonable price and the benefits available make the ŠKODA Fabia an excel-lent choice for anyone looking for an attractively-priced car for everyday use.
ŠKODA RoomsterThe ŠKODA Roomster is a remarkably spacious car from the ŠKODA brand. It was designed and named for space, and has been successful with customers for the same reason. It is clearly recognisable by its clean design and versatile interior. Since its introduction onto the market in 2006, the ŠKODA brand has also been successful in the compact multi-purpose vehicle segment.
ŠKODA YetiIn 2009, ŠKODA entered a new market segment with the ŠKODA Yeti. As one of the first models in the compact SUV segment, the ŠKODA Yeti has attracted attention in many
markets – and not only in Europe. This model has also been successful in the market of Russia. Its all-wheel drive system, available upon request, also makes it ideal for off-road use.
ŠKODARapidThe ŠKODA Rapid, a family automobile introduced onto the market in the autumn of 2012, is the first model that uses ma-jor elements of the new ŠKODA brand design: purity, preci-sion, timelessness and elegance. The interior excels due to its numerous smart details and abundant space. With specific versions for India and China, the ŠKODA Rapid is a key model in the ŠKODA growth strategy.
ŠKODAOctaviaandŠKODAOctaviaCombiThe ŠKODA Octavia and ŠKODA Octavia Combi are the core products of the ŠKODA brand. No other model series in the history of the brand has been more successful. Since 1996, the ŠKODA Octavia has impressed buyers with its top design, ample space and high functionality. This entirely new model, which ŠKODA AUTO introduced onto the market at the end of 2012, continues along the path blazed by previous generations of the ŠKODA Octavia series.
ŠKODASuperbandŠKODASuperbCombiThe ŠKODA Superb offers extraordinary quality for an unbeat-able price in the upper middle class. Its spaciousness is exem-plary, as are its technical sophistication and attractive prices for customers. The body styles are also sporty and elegant. It is rare for an automobile to combine common sense and feel-ing to such an extent.
Business Operations

15Annual Report 2012
OverviewofdevelopmentsontheautomobilemarketsPositivedevelopmentsontheglobalautomobilemarketThe recovery that had begun in 2011 on the global automobile markets continued in 2012. This trend was mainly driven by the positive developments in markets as India, China and the USA. Other markets were rather stable in the first two quar-ters. However, in the second half of the year the demand for new cars in Europe weakened. One of the few exceptions was the UK, which recorded single-digit growth. The Russian auto-mobile market also grew significantly. Thanks to the positive development in China, India and the U.S., total global automo-bile sales increased by 6.3% year-on-year up to the volume of approximately 78.0 million, of which some 66.6 million were passenger cars.
CentralEuropeThe Central European market dropped by 2.1%. The develop-ment of the Czech market in 2012 was stable. Year-on-year gains reached 0.4%, representing 174,009 vehicles sold. The Hungarian (+ 6.7%) and Slovak (+ 2.0%) markets also record-ed growth. On the other hand, Croatia (- 22.1%) and Slovenia (- 16.8%) displayed the least positive development in all of Central Europe. A total of 31,596 vehicles were sold in Croatia and 46,891 in Slovenia. A decrease in sales by 0.4% was re-ported in Poland with 270,587 cars sold.
WesternEuropeCompared to other regions in the European area, Western Europe was most seriously hit by the unfavourable economic development. The number of new vehicles sold dropped in year-on-year comparison by as much as 8.2%. The dynamics of this negative trend in the passenger car market became even more pronounced in the second half of the year. The only growing markets in the region were the UK (+ 5.3%) and Swit-zerland (+ 1.9%). Germany, the strongest economy and major market in Western Europe, suffered a decline of 2.9%.
Other markets with previously robust sales also dropped. The Benelux countries and France contracted significantly, in par-ticular France (- 14.1%), Belgium (-14.9%) and the Netherlands (- 9.6%). The Southern European markets have been in recession for four consecutive years. The economic development here is quite understandably reflected in the entire car manufactur-ing industry. Dramatic declines in sales were recorded in Spain (- 13.4%) and Italy (- 19.9%). The passenger car markets in Greece and Portugal were still under the spell of the economic crisis, resulting in yet another remarkable decrease of 40.2%, or 38.0% for all brands.
EasternEuropeThe Eastern European automobile market showed an unex-pectedly positive development in 2012, with growth of 7.7%. The driving force was Russia in particular, which also plays an important part in the ŠKODA growth strategy. Compared to 2011, the automobile market growth here was 10.9%. The market in Romania, however, showed a negative trend, with a decrease of 25.6%. Ukraine, another important market for ŠKODA, fell by 1.5%.
Overseas/AsiaThe Asian growth markets once again provided the main im-petus for the global automobile market with an increase in sales of 13.3% overall in 2012.The Chinese economy has been on the rise for a number of years. The same applies to the automotive industry, proven by the year-on-year growth in the number of vehicles sold of 9.3%.In India, negative exchange rate trends and increased price of petrol prevented even higher growth. And yet India recorded an increase by 11.1%. Overall, positive development was seen in other countries in the Overseas/Asia region, with a total growth of 12.6%.
Business Operations

16 Annual Report 2012
Business Operations
Financialsituation
ŠKODA AUTO Group’s consolidated financial statements are reported in accordance with the IAS/IFRS methodology. The consolidated financial statements include financial results of the parent company ŠKODA AUTO, financial results of the sub-sidiaries ŠKODA AUTO Deutschland, ŠKODA AUTO Slovensko, Skoda Auto India, and a share in financial performance of the associates.
ŠKODA AUTO GroupAs a result of rising automobile sales and successful imple-mentation of measures to boost efficiency, ŠKODA AUTO Group was able to maintain its financial performance at a sta-ble level in 2012.Group sales revenues rose by 4.0% year-on-year to CZK 262.6 billion, the highest in the Group’s history. Operating profit reached CZK 17.9 billion. The Group’s profit after income tax declined by 4.5% to CZK 15.4 billion.
GroupbusinessperformanceIn 2012, ŠKODA AUTO Group delivered a total of 939,202 auto-mobiles to customers worldwide. This is an increase of 6.8% over the previous year and also a new record. Group sales revenues reflected the trend in sales and reached CZK 262.6 billion. Automobile sales accounted for 84.7% of total Group revenues in the year under review (2011: 84.3%). The best-selling models were the ŠKODA Octavia and the ŠKODA Fabia. Positive development was also reported for the ŠKODA Yeti, followed by the ŠKODA Octavia and the new ŠKODA Citigo and ŠKODA Rapid models. Sales of genuine parts and accessories also performed well, with a share of 7.3% of total Group reve-nues (2011: 7.1%). Income from the sale of parts to other Volks-wagen Group companies, plus other revenues, accounted for the remaining 8.0% (2011: 8.6%).The cost of sales rose by 2.7% year-on-year to CZK 221.8 bil-lion – although the rate of increase was slower than growth in revenues. Material costs (costs of raw materials, production material and purchased goods), which comprised more than three quarters of the Group’s total costs, accounted for most of the increase. Distribution expenses rose by 9.3% year-on-year to CZK 19.2 billion. This was due, on the one hand, to the increase in sales; on the other, to rising marketing and adver-tising costs. Administrative expenses for 2012 totalled CZK 6.9 billion – an increase of 12.0% over the previous year. Other operating profit reached CZK 3.1 billion.Gross profit was 11.7% higher than the previous year at CZK 40.9 billion. The gross profit margin (gross profit/revenues ra-tio) climbed to 15.6% and was therefore 1.1 percentage points
higher than in 2011. This was essentially due to favourable trends in genuine parts and accessories and further product cost optimisation. Group operating profit decreased by 1.9% in the reporting period to CZK 17.9 billion. The financial result showed a loss of CZK 1.3 billion, due in particular to valuation differences in financial instruments. The Group’s profit before income tax declined by 7.0% to CZK 17.9 billion, while profit after tax was CZK 721 million lower (-4.5%) at CZK 15.4 billion. The return on sales before tax was 6.8% in 2012.
GroupcashflowsCash flows from Group operating activities reached CZK 23.4 billion in 2012. Net liquidity dropped by 26.3 year-on-year to reach CZK 34.9 billion as at 31 December 2012.
GroupassetandcapitalstructureThe Group’s balance sheet total grew by CZK 6.4 billion, at a rate of 4.2% year-on-year, to reach CZK 160.0 billion as at 31 December 2012. This growth stemmed primarily from an in-crease in non-current assets. As of the date of final balance sheet, the non-current assets represented CZK 83.5 billion, which means by 29.1% more than the value recorded as at 31 December 2011. There was exceptional year-on-year in-crease of the tangible assets (lands, buildings and facilities) by CZK 10.0 billion (+21.7%).The Group’s capital structure, as defined by the relative amounts of equity and liabilities, shifted slightly from the pre-vious year. Group equity rose by CZK 9.7 billion to CZK 90.9 bil-lion over the course of the year. Profit for the year boosted eq-uity by CZK 15.4 billion, and dividends withdrew CZK 7.1 billion.The Group’s current liabilities were reduced by CZK 1.1 billion (-2.1%) during the reporting period and non-current liabilities decreased by CZK 2.2 billion, resulting in a 10.2% decrease compared to the previous year’s balance sheet. Investments (less development costs) reached a total of CZK 21.1 billion in 2012 and were therefore CZK 6.9 billion higher than in 2011. The bulk of spending went into product investments in connection with new models, engines and transmissions.

17Annual Report 2012
Business Operations
DevelopmentofGroupfinancing(CZKmillion)
2012 2011 2012/2011
Cashandcashequivalentsasat1January2012 31,251 35,986 –13.2%
Cashflowsfromoperatingactivities 23,443 28,251 –17.0%
Cashflowsfrominvestingactivities –7,032 –28,225 –75.1%
Cashflowsfromfinancingactivities –7,177 –4,854 47.9%
Grossliquidity* 40,467 52,791 -23.3%
Balance of financial liabilities** –5,577 –5,443 2.5%
Netliquidity 34,890 47,348 -26.3%
* Gross liquidity consists of closing balance of cash and cash equivalents in the amount of CZK 40,467 million (2011: CZK 31,251 million) and closing balance of other short-term loans in the amount of CZK 0 million (2011: CZK 21,540 million).
** The position Balance of financial liabilities contains in addition to financial liabilities also liabilities to a factoring company within the Volkswagen Group in the amount of CZK 2,470 million (2011: CZK 2,302 million).
Consolidatedbalancesheet(CZKmillion)
31.12.2012 31.12.2011 2012/2011
Non-current assets 83,493 64,686 29.1%
Current assets 76,493 88,871 –13.9%
of which: deposits* 38,131 49,088 –22.3%
Totalassets 159,986 153,557 4.2%
Equity** 90,906 81,211 11.9%
Non-current liabilities 19,176 21,347 –10.2%
Current liabilities 49,904 50,999 –2.1%
Totalliabilities 159,986 153,557 4.2%
* interest included ** non-controlling interests included
Consolidatedprofitandlossaccount(CZKmillion)
2012 2011 2012/2011
Salesrevenue 262,649 252,562 4.0%
Costs of sales 221,751 215,956 2.7%
Grossprofit 40,898 36,606 11.7%
Distribution expenses 19,179 17,549 9.3%
Administrative expenses 6,855 6,123 12.0%
Other operating income 10,122 10,040 0.8%
Other operating expenses 7,069 4,717 49.9%
Operatingprofit 17,917 18,257 –1.9%
Financial result –1,255 791 > 100%
Profitbeforeincometax 17,934 19,275 –7.0%
Income tax expense/income 2,580 3,200 –19.4%
Profitafterincometax* 15,354 16,075 –4.5%
* non-controlling interests included

18 Annual Report 2012
Business Operations
Technicaldevelopment
In 2012, ŠKODA AUTO invested a total of CZK 11 billion in tech-nical development, a year-on-year increase of 17.0%. The 1766 specialists of Technical development cooperate within the Volkswagen Group and expand their professional com-petence. The acquired skills are applied not only during the development of ŠKODA models, but they also open up other opportunities for external orders. Work for other brands within the Group rose by CZK 347 million year-on-year to reach a total of CZK 894 million, which represents a 63.4% increase.
ŠKODARapid–thenewclassofŠKODAAt the Paris Motor Show in 2012, the seventh product series in the ŠKODA portfolio, the ŠKODA Rapid model, had its world premiere. It is the first series vehicle featuring the new design: Perfect proportions, cleanly modelled surfaces and sharp, pre-cision-managed lines, which create a timeless and elegant ap-pearance. In the front, the new brand logo is proudly displayed, the typical mask of the cooler with vertical lamellas directly complements the headlights and, together with the fog lights, symbolises a four-leaf shape. The side-view creates a distinc-tive coupé-like silhouette with the precise and sharp tornado line. The rear group lights have a typical design in the shape of the letter C, this time in a new form with a crystalline finish. The ŠKODA Rapid was developed to meet the highest de-mands for functionality, quality and safety. It meets the needs of customers seeking a family vehicle at a reasonable price and raises the bar in its class. Despite the compact exterior dimensions of the vehicle, a record amount of luggage space of up to 550 litres has been created. The quality of the vehicle is confirmed by the five stars it earned in the Euro NCAP inde-pendent safety test and the Auto Trophy award for the best-priced automobile of 2012. From 2013 on, the ŠKODA Rapid will also be produced and sold in China. ŠKODA AUTO will there-fore be able to fulfil its ambitions on the global market. Development of “Simply Clever” practical solutions has con-tinued for the ŠKODA Rapid model. The developers' sense for clever ness is evident in the integrated ice scraper covering the fuel tank and the reflective vests located under the driver's seat. The holder for multi-media devices and the beverage holder can secure a mobile phone and other items. Another new feature is the double-sided rug on the floor of the luggage space. One side has the same appearance as the other upholstery, while the other side has a rubber surface that protects the floor of the luggage space from water damage and contamination.
ThenewŠKODAOctavia–aclassofitsownA significant share of the Company's development activities in 2012 have been focused on the successor to the ŠKODA brand’s key product, the ŠKODA Octavia, taking into account
trends and customers' wishes. The new design direction has been further pursued, and the ŠKODA Octavia has acquired greater elegance and dynamics. The most state-of-the-art platform in the Volkswagen Group is the basis for the devel-opment of the model’s recognised values. The focal point has been to achieve the greatest utility, func-tionality and safety, while at the same time enhancing quality and maintaining an affordable price. A major reduction in the weight of the vehicle, combined with state-of-the-art engines contributes to a significant reduction in fuel consumption and CO2 emissions. For the first time in ŠKODA brand vehicles, a series of innovative assistance systems has been developed, such as adaptive cruise control, automatic activation of remote lights and a system for maintaining the vehicle in the lane. To-gether with new information technology, vehicle comfort has been advanced to a level usually found only in superior classes.
EnvironmentfirstŠKODA AUTO is continuing to reduce emissions by developing alternative fuels. The ŠKODA Citigo CNG model is the brand’s first model on the market to run on pressurised natural gas. This efficient engine with an output of 50 kW emits only 79g of CO2 per km. That is 20% less than vehicles with petrol en-gines. The emission-free fleet of ŠKODA Octavia Green E Line electric vehicles has already driven more than 250,000 kilo-metres since 2011. Since May 2012, they have also been used by external partners, such as energy companies and govern-ment bodies, as well as families. The evaluation of test opera-tions has become an important source of information for the further development of electric vehicles.
NewtestingcentreforaggregatesA major milestone in the expansion of technical development was the decision to build a testing centre for aggregates. The building, the foundation stone of which was laid in Septem-ber 2012, is one of the largest investments in development currently being undertaken in the Czech Republic. 15 testing facilities will test new generations of engines series produc-tion for ŠKODA AUTO and for customers within the Group, and perform dynamic tests of factory engines with outputs of up to 400 kW for ŠKODA Motorsport. Due to constantly growing demands for global use of engines, the new centre will also be able to test aggregates for various types of fuel, including CNG and ethanol for different markets all over the world.
HistoricalsuccessesinmotorsportsThe technical competence and advanced quality of the ŠKODA brand is demonstrated by its successes in competitive racing. In the 2012 rally season, the ŠKODA Motorsport fac-

19Annual Report 2012
Business Operations
Ensuring the smooth progress of the ŠKODA Rapid and the new generation of the ŠKODA Octavia was the main purchas-ing objective for ŠKODA AUTO in 2012, in accordance with the ŠKODA growth strategy. In cooperation with the purchasing division of the Volkswagen Group, a continuous supply of pur-chased parts was guaranteed. The Company used a modular transverse toolkit (MQB) for the first time in the ŠKODA Oc-tavia. This modular platforms project within the Volkswagen Group is designed to establish the material cost competitive-ness on a solid basis for the future.
InternationalisationofpurchasingŠKODA AUTO has continued to expand and build its portfolio of suppliers in Europe and Asia. The increased production in the regions and ensuing localization of purchasing helped to use qualified suppliers from those countries. In China, an important and dynamic market for ŠKODA, the Company has strengthened cooperation with local Chinese purchasing organisations and established additional collabo-ration.In 2012, ŠKODA AUTO launched its campaign to promote the new company design. General purchasing started a world-wide sourcing process for the necessary corporate identity el-ements to ensure the global roll-out activities starting in 2013.
NewproductsandprojectsŠKODA AUTO has ensured the progress of new models, not only with the help of purchased parts, but also through new machines and equipment. Besides expansion and reconstruc-tion of the line for the ŠKODA Octavia and ŠKODA Rapid mod-els, the Company ensured general purchasing of materials for construction of the new Lean Centre and IT Centre at the Mladá Boleslav plant and was also involved in the reconstruc-tion of the ŠKODA Museum in Mladá Boleslav.
The purchasing division also made a significant contribution to the launch of production for the double-clutch transmission DQ 200 in Vrchlabí.Securing production capacities at the GAZ plant in Nizhny Novgorod in Russia was the most important activity abroad for purchasing in 2012. The implementation of successful lo-calisation strategies was supported by local purchasing or-ganisations. The Group ensured purchasing of materials and manufacturing resources for this project, as well as realisation of construction work. In 2012, the manufacture of ŠKODA Yeti vehicles at this plant shifted to a higher knock-down level.
SituationontherawmaterialsmarketThe difficult situation on the raw materials market continued in 2012. Despite stagnating or even declining economic growth in many countries, mainly in Western Europe, raw materials prices remained unstable and at a high level. In conjunction with the purchasing divisions of the Volkswagen Group, it was possible to minimise the effects of the situation on the Group.
SupplyofmaterialsIn 2012, ŠKODA AUTO invested a total of CZK 131.6 billion in purchasing of production materials. This corresponds to a year-on-year increase of CZK 3.7 billion. A large proportion of this volume originates in the Czech Republic (over 54.5%), fol-lowed by Germany, which accounts for approximately a quar-ter (26.0%) of the volume of production materials. Deliveries from so-called low-cost countries comprised more than 7.3% and grew year-on-year by 7.7%. The total volume of general purchasing reached CZK 26.5 bil-lion, which is a year-on-year decrease of 7.0%. The main con-tributing factor to this development was the launch of the new models which had been the subject of investments in the previous year.
Purchasing
tory team earned its third consecutive title in the manufactur-ers’ championship of the IRC (Intercontinental Rally Challenge) international series with its ŠKODA Fabia Super 2000 vehicles. With 27 stage victories ŠKODA has become the most success-ful brand in IRC history. The factory team earned the title of
European Champion and the ŠKODA Fabia Super 2000 vehicles won six national championship titles. With its first victory in the manufacturers’ ranking of the APRC Asia-Pacific championship, ŠKODA also achieved an excellent result on a continent that has major importance for the future of the ŠKODA brand.

20 Annual Report 2012
Business Operations
Expansionofproductioncapacitiesforworld-widegrowthThe ŠKODA growth strategy was implemented worldwide in 2010. In order to meet the growing demand for ŠKODA auto-mobiles, the main focus in 2012 was the internationalisation of ŠKODA AUTO standards in the various production sites, par-ticularly in partner plants in Russia and China.
TheŠKODAgrowthstrategyinRussia, IndiaandChinaThe production capacities in the Russian GAZ plant in Nizhny Novgorod were expanded in 2012. At the beginning of Decem-ber, full production of the ŠKODA Yeti for the Russian market began at the site. Prior to CKD (completely knocked down) pro-duction, the ŠKODA Yeti has been produced here as SKD (semi knocked down). In Nizhny Novgorod, 117 cars were produced as CKD in 2012.Preparations for the production of the new ŠKODA Octavia in the Group's assembly plant in Aurangabad started in 2012. The first sets of pre-series vehicles have already been sent to the Indian facility. At the same time, a number of measures opti-mising production and logistic costs in order to improve profit-ability were implemented at both Indian plants (Aurangabad and partner plant in Pune).The ŠKODA growth strategy is successful in China, too. The first ŠKODA Rapid cars left the Chinese Yizheng factory in 2012 already. In total, more than 226,000 ŠKODA vehicles were pro-duced in China in 2012.
NewmodelsforgrowthŠKODA AUTO began its announced model offensive, involving the production of the ŠKODA Rapid, positioned between the ŠKODA Fabia and ŠKODA Octavia models, in the second half of 2012. In late 2012, production of the new version of the ŠKODA Octavia began in Mladá Boleslav, while full production of the ŠKODA Yeti began in Nizhny Novgorod, Russia.
MladáBoleslav–Parentplantwithaperspectivefor the futureThe Mladá Boleslav plant has a key position in the produc-tion of ŠKODA brand vehicles. With the implementation of the growth strategy, significant changes were made to Mladá Boleslav’s production floor in 2012. Production capacity was
extended, and the production facilities were modified. Invest-ment reached record levels.To achieve the extension of vehicle production capacity in plant Mladá Boleslav in assembly hall MBI from 800 to 1,200 vehicles per day, many adaptions were implemented and new production facilities were built while production was on-going. The ultimate completion, tests and final adjustments were successfully achieved during the plant holiday.
Capacityextensionalsoincomponentproduction19 July 2012 was an important anniversary for the powertrain production of ŠKODA AUTO: on this day, the 750,000th unit left the factory since production of the EA 111 1.2 TSI engines began in 2009. In total, about 485,894 engines were produced in 2012, of which 301,665 units were of the EA 111 1.2 TSI en-gine model, 183,825 units of the EA 111 1.2 HTP model and 404 units of the EA 211 TSI model.The NSF (“New Small Family”) vehicle generation was given a new gearbox variant in 2012. In Mladá Boleslav, production of the MQ 100 gearbox expanded by the production of the SQ 100 variant. In total, Mladá Boleslav has the capacity to produce 1,200 units of the MQ/SQ 100 gearboxes per day. In addition to the MQ 100 gearboxes, Mladá Boleslav can pro-duce 2,200 units of the MQ 200 gearboxes daily. Furthermore, the Vrchlabí plant began production of the modern DQ 200 dual-clutch gearbox in October 2012, the third plant in the Volks wagen Group to do so. By the end of the year, 10,328 DQ 200 units had been completed. In total, more than 629,329 gearboxes were manufactured by ŠKODA AUTO in 2012.ŠKODA AUTO does not only produce powertrains for its own needs, but for other brands of the Group as well. This year, more than 311,750 engines and 386,625 gearboxes were pro-duced for other Group brands worldwide.As a result of the production start of the ŠKODA Rapid and the new ŠKODA Octavia, the production of the axles had to be expended as well. Due to an additional assembly the pre-sent production capacity adds up to 5,100 axles daily. In total, approx. 1.4 million axles for ŠKODA vehicles were produced in 2012.
Productionandlogistics

21Annual Report 2012
Business Operations
Vehicle production of the ŠKODA brand
A total of 944,432 ŠKODA vehicles were manufactured world-wide in 2012. This represents a 4.9% increase compared with the previous year. Production of the ŠKODA Rapid and ŠKODA Octavia began in Mladá Boleslav in 2012. In addition, the production of the SEAT Toledo with a total of 5,000 vehicles began.The increase in production volume did not occur only in Eu-rope, but also in Russia, India and China. In Aurangabad, India, production of Volkswagen and Audi brand vehicles was also increased. In total, 12,591 of those vehicles were produced there. In the Chinese partner plants, a total of 226,653 ŠKODA Octavia, Fabia, Superb and Rapid vehicles was produced in the given period. Overall, this is an increase in production of 1.6%.
ŠKODAFabiaŠKODA Fabia production suffered fluctuations in 2012, but the model remains popular in its class. A total of 231,930 ŠKODA Fabia vehicles were produced worldwide – 11.2% fewer than the previous year (2011: 261,107 ŠKODA Fabia vehicles).
ŠKODA RoomsterŠKODA Roomster production at the Vrchlabí plant saw an in-crease in 2012. In total, 39,249 ŠKODA Roomster cars were built, an increase of 7.7% compared to 2011 (2011: 36,427 ŠKODA Roomster vehicles).
ŠKODA OctaviaThe ŠKODA Octavia was the best-selling model of ŠKODA AUTO once more in 2012. A total of 406,397 vehicles were produced worldwide. The ŠKODA Octavia therefore accounted for the largest share of ŠKODA AUTO production in 2012 with 43,0% (2011: 402,462 ŠKODA Octavia vehicles, 44.7% of total ŠKODA AUTO production).
ŠKODA YetiThe ŠKODA Yeti, too, recorded rising production numbers. The total volume grew by 17.6% reaching 90,882 vehicles (2011: 77,312 ŠKODA Yeti vehicles).
ŠKODASuperbIn its class, the ŠKODA Superb saw a slight downturn in sales. Overall, 106,847 vehicles were built in 2012, which is a de-crease of 10.8% compared to 2011.
Portfolioofmodelsmanufacturedworldwide(asat31December2012)
Cit
igo
Fabia
Rapid
Ro
om
ste
r
Oct
avia
Yeti
Superb
SeatToledo
VWJetta
VWPassat
AudiA6
AudiA4
AudiQ5
AudiQ7
Mladá Boleslav (Czech Republic)
Vrchlabí (Czech Republic)
Kvasiny (Czech Republic)
Bratislava (Slovakia)
Kaluga (Russia)
Nizhny Novgorod (Russia)
Aurangabad (India)
Pune (India)
Shanghai (China)
Yizheng (China)

22 Annual Report 2012
Business Operations
ŠKODAproductionworldwide 2012 2011 2012/2011
ProductionofŠKODAcars
Fabia* 118,129 142,115 – 16.9%
Fabia Combi 59,870 73,023 – 18.0%
Fabiatotal 177,999 215,138 –17.3%
Rapid 8,128 – –
Roomster 36,756 33,414 10.0%
Roomster Praktik 2,493 3,013 – 17.3%
Roomstertotal 39,249 36,427 7.7%
Octavia* 141,727 142,289 – 0.4%
Octavia Combi 127,831 131,953 – 3.1%
Octaviatotal** 269,558 274,242 –1.7%
Yeti* 90,882 77,312 17.6%
Superb 26,125 26,009 0.4%
Superb Combi 39,809 44,882 – 11.3%
Superbtotal 65,934 70,891 –7.0%
TotalŠKODAbrand 651,750 674,010 –3.3%
ŠKODAbrandproductionworldwide
ProductionofŠKODAcarsinPune
Rapid 24,148 2,561 > 100%
Fabia 5,194 – –
TotalŠKODAPune 29,342 2,561 >100%
ProductionofŠKODAcarsinBratislava
Citigo 36,687 1,027 > 100%
TotalŠKODABratislava 36,687 1,027 >100%
ProductionofŠKODAcarsinChina
Fabia 48,737 45,969 6.0%
Octavia 136,839 128,220 6.7%
Superb 40,913 48,841 – 16.2%
Rapid 164 – –
TotalŠKODAChina 226,653 223,030 1.6%
TotalŠKODAworldwide 944,432 900,628 4.9%
ProductionofotherVolkswagenGroupbrands
Seat Toledo 5,000 – –
VW Passat 1,704 1,338 27.4%
VW Jetta 4,101 1,858 > 100%
Audi A6 2,556 1,254 > 100%
Audi A4 2,904 2,328 24.7%
Audi Q5 1,302 1,092 19.2%
Audi Q7 24 – –
TotalotherVolkswagenGroupbrands 17,591 7,870 >100%
TotalŠKODAAUTOGroup 669,341 681,880 –1.8%
TotalŠKODAworldwideincl.SEATandSAIPL 962,023 908,498 5.9%
* including disassembled vehicle kits distributed to production plants outside ŠKODA AUTO Group ** includes Octavia and Octavia Tour

23Annual Report 2012
Business Operations
Salesandmarketing
Newrecordindeliveriestocustomersin2012The ŠKODA AUTO Group ended 2012 with a new record of 939,202 vehicles delivered to customers worldwide – an in-crease of 6.8% year-on-year. As regards the total number of cars delivered, Central and Eastern Europe recorded positive trends, while deliveries in Western Europe went down by 0.9% compared to the previous year. However, all regions increased their year-on-year market share statistics. Thus, the ŠKODA growth strategy manifested its viability in the second year of implementation, and its readiness to face the impacts of eco-nomic problems in the Eurozone.
CentralEuropeIn Central Europe, ŠKODA AUTO Group was able to boost de-liveries and gain valuable new market share. A total of 124,012 vehicles were delivered to customers – an increase of 0.7%. In the Czech Republic, ŠKODA maintained its undisputed po-sition as the leading automobile brand. The number of vehi-cles delivered to customers increased to 59,674. Outside the Czech Republic, growing deliveries were recorded in Slovakia (+ 4.7%) as well as Hungary (+ 20.0%). The ŠKODA brand took
the first place in Slovakia with 15,902 vehicles delivered, and the second place in Hungary with 6,899 vehicles delivered. In Poland, the ŠKODA AUTO Group succeeded in delivering 36,307 vehicles and confirmed its position as the market leader.
EasternEuropeThe deliveries of ŠKODA vehicles in Eastern Europe continued to grow. A total of 137,057 vehicles were delivered to custom-ers – a year-on-year increase of 26.4%.ŠKODA has been very successful in recent years in Russia, and this market is one of the keys to the ŠKODA growth strate-gy. The Russian market became a major driver of deliveries in 2012. With the total number of vehicles delivered to custom-ers of 99,062, growth reached 33.7%. ŠKODA AUTO has been increasing the deliveries in Ukraine for three years. 14,393 cars were delivered to customers here – an increase of 31.9%. (2011: +42.6%). Even in the shrinking Romanian automobile market ŠKODA AUTO was able to increase its share and confirm its po-sition as the second-strongest importer with 6,833 deliveries to the customers.
Deliveriestocustomers–largestmarkets
Deliveriestocustomers(vehicles) Changein% %shareofpassengercarmarket**
2012 2011 2012/2011 2012 2011
TotalŠKODAbrand 939,202 879,184 6.8% 1.4% 1.4%
China 235,674 220,089 7.1% 1.7% 1.8%
Germany 132,580 128,011 3.6% 4.3% 4.0%
Russia 99,062 74,074 33.7% 3.7% 3.0%
Czech Republic 59,674 58,202 2.5% 34.1% 33.4%
United Kingdom 53,249 45,282 17.6% 2.6% 2.3%
Poland 36,307 38,116 –4.7% 13.4% 12.7%
India 34,265 30,005 14.2% 1.3% 1.3%
Austria 22,300 21,208 5.1% 6.6% 5.9%
France 22,022 22,356 –1.5% 1.2% 1.0%
Switzerland 17,830 16,298 9.4% 5.5% 5.1%
Belgium 17,530 18,900 –7.2% 3.6% 3.3%
Netherlands 16,455 20,879 –21.2% 3.3% 3.8%
Slovakia 15,902 15,182 4.7% 22.7% 22.1%
Ukraine 14,393 10,909 31.9% 6.6% 4.9%
Spain* 13,026 15,873 –17.9% 1.9% 2.1%
* excl. Canary Islands ** total markets

24 Annual Report 2012
Business Operations
WesternEuropeDespite the difficult economic situation in some countries of the Eurozone, a total of 358,439 vehicles was delivered in this region – minus 0.9% year-on-year. Despite the massive overall decline in deliveries of vehicles in this region, ŠKODA managed to strengthen its market position in Western Eu-rope in 2012.ŠKODA has further increased its market share in Germany. With 132,580 vehicles delivered to the customers (+ 3.6%), Germany remains the second most important market for ŠKODA AUTO. Good results were achieved in other major Western European markets in 2012 as well. Deliveries to customers in the chal-lenging French market came to 22,022 vehicles, resulting in a year-on-year decrease by 1.5%. Because of the overall de-cline in the passenger car market the ŠKODA brand managed to improve its market position. In the UK, ŠKODA AUTO de-livered 53,249 vehicles (+ 17.6%), and thus recorded the best sales result there ever while also increasing its market share. Other records were established in Austria with 22,300 vehi-cles (+ 5.1%) and Denmark with 10,364 vehicles (+ 28.2%). On the other hand, most markets in Southern Europe considera-bly contracted due to the tense economic situation. Deliveries to Spanish customers dropped by 17.9%. Automobile markets in Portugal and Greece have felt the brunt of the economic and financial crisis, and consequently went into the red. As a result ŠKODA AUTO had to come to terms with losses and reduced deliveries in Portugal (- 24.7%) and Greece (- 29.5%).
Overseas/Asia The Overseas/Asia region with its growing Chinese and Indian markets plays an important role in the ŠKODA growth stra tegy. Deliveries in this area developed favourably in 2012. A total of 319,694 ŠKODA brand vehicles were delivered here, which represents an annual increase by 11.8%.
The motor behind this trend was China, globally the biggest market for ŠKODA AUTO. 235,674 vehicles (+ 7.1%) were deliv-ered here in 2012. The growth in India equalled 14.2%, resulting in 34,265 delivered cars. We achieved a growth rate of 49.9% in the Indian market in 2011 already. Almost two thirds of the deliveries are represented by our compact limousine devel-oped for the local conditions – ŠKODA Rapid. The model was introduced at the end of 2011, and the figures for deliveries to customers the last year are in line with the estimated growth potential.In other countries in the Overseas/Asia region in 2012 a total of 49,755 ŠKODA vehicles were delivered, corresponding to a year-on-year increase of 39.2%.
Deliveriestocustomersbymodellines ŠKODA CitigoŠKODA Citigo is the smallest brand model, launched in Euro-pean markets in 2012. 29,960 customers bought this new car especially designed for urban areas. It is the first ever model in the brand's modern history that offers both 3-door and 5-door versions.
ŠKODAFabiaA well-established model, the ŠKODA Fabia, is the second-strongest in terms of volumes delivered. Properly defined pric-ing policy, two body versions together with variable assort-ment resulted in 240,470 units delivered in 2012. The fact that the ŠKODA Citigo has been launched and the ŠKODA Fabia is near the end of its life cycle, results in a year-on-year de-crease by 9.9%. The RS sports versions and the alluring Monte Carlo derivate contributed to the general attractiveness of the ŠKODA Fabia for a wide range of customers.
Deliveriestocustomersbyregion
Deliveriestocustomers(vehicles) Changein% %shareofpassengercarmarket**
2012 2011 2012/2011 2012 2011
Central Europe* 124,012 123,156 0.7% 18.9% 17.7%
Eastern Europe 137,057 108,423 26.4% 4.2% 3.6%
Western Europe 358,439 361,777 –0.9% 3.0% 2.8%
Overseas/Asia 319,694 285,828 11.8% 1.3% 0.6%
TotalŠKODAbrand 939,202 879,184 6.8% 1.4% 1.4%
* incl. Czech Republic ** total markets

25Annual Report 2012
Business Operations
ŠKODA RoomsterDeliveries of the ŠKODA Roomster model increased in 2012. Customers bought a total of 37,964 ŠKODA Roomster cars, which represents growth of 5.4%. Of those, 2,650, i.e. 7.0%, were the ŠKODA Praktik utility version. ŠKODA Roomster has been on the market without major changes since its launch in 2006. Stable demand for this small MPV is a result of utility features and good price positioning.
ŠKODARapidThe ŠKODA Rapid compact limousine entered the global mar-ket late in 2012. A total of 24,692 vehicles were delivered to customers of which 3,526 in the Czech Republic, 21,166 in India. When the market launch will have been completed in 2013 it is expected that the ŠKODA Rapid has established itself as one of the most successful models within the ŠKODA model range.
ŠKODA OctaviaThe ŠKODA Octavia once again underscored its key role as the best-selling car in the brand’s product portfolio. By achieving a
total number of 409,632 vehicles delivered in 2012, the model once again exceeded the already good results of the previous year by 5.8%. The ŠKODA Octavia Combi with 124,463 units de-livered made up 30.4% of the overall deliveries of the model. The sales figures for the ŠKODA Octavia were excellent, tak-ing into account that the third generation of this model had already been announced and will be launched in 2013.
ŠKODA YetiThe ŠKODA Yeti is a model that currently has the highest rate of sales growth among all ŠKODA vehicles. 87,397 vehicles were delivered to customers in 2012 – growth of 24.3%. With this, the ŠKODA Yeti model strengthened its position in the attractive compact SUV segment.
ŠKODASuperbThe ŠKODA Superb is the brand's flagship. Globally 109,087 vehicles were delivered, 43,041 in China. The deliveries to cus-tomers dropped by 6.5%, which is partially due to the contin-ued problems of European economies.
Deliveriestocustomersbymodel
2012 2011 2012/2011
Citigo 29,960 510 >100%
Fabia 178,038 192,852 –7.7%
Fabia Combi 62,432 73,911 –15.5%
Fabiatotal 240,470 266,763 –9.9%
Rapid 24,692 1,671 >100%
Roomster 35,314 33,005 7.0%
Roomster Praktik 2,650 3,005 –11.8%
Roomstertotal 37,964 36,010 5.4%
Octavia 285,169 261,572 9.0%
Octavia Combi 124,463 125,611 –0.9%
Octaviatotal* 409,632 387,183 5.8%
Yeti 87,397 70,321 24.3%
Superb 68,558 73,125 –6.2%
Superb Combi 40,529 43,601 –7.0%
Superbtotal 109,087 116,726 –6.5%
TotalŠKODAbrand 939,202 879,184 6.8%
* includes Octavia and Octavia Tour

26 Annual Report 2012
Business Operations
SalestocorporatecustomersSales to corporate customers played a major role in the suc-cess of the ŠKODA AUTO Group in 2012. Fleet sales (excl. Chi-na) in this market segment in 2012 grew to 250,273 vehicles (2011: 239,413 units). In Western Europe, traditionally a major market for corporate fleets, 148,930 cars were sold. Central Europe followed with 60,445 delivered cars, Eastern Europe (in particular Russia and Ukraine) with 26,791 vehicles. Among the national markets Germany remained the largest in 2012 – here 46,059 cars were sold as fleet vehicles, which is 18.4% of the total fleet sales of ŠKODA AUTO. Throughout 2012, ŠKODA AUTO continued the successful implementation of its "Fit For Fleet" programme, comprising comprehensive and professional offers for com-mercial customers, small and medium businesses.
SalesofgenuinepartsandaccessoriesThe sales of genuine parts and accessories in 2012 repre-sented an important part of the sales policy of ŠKODA AUTO. ŠKODA genuine parts and accessories offer premium quality, a wide range of products, guarantee availability and thus se-
cure customers satisfaction. With the ever-growing range of models, the assortment of parts and accessories is expanding; they are sold in more than 100 markets worldwide through advanced logistics channels using the latest IT technologies. As part of the optimization of the ŠKODA Genuine Parts and Accessories logistics centre, the first stage of the extension of the ŠKODA Parts Centre – new reception and dispatch terminal – was completed in November 2011. The second stage of the project was the construction of a fully automated silo 40 me-tres high, with a capacity of over 30,000 pallets, completed in December 2012. The total area of the depot is now 74,500 sqm.Revenues from the sales of ŠKODA genuine parts in 2012 were CZK 16.9 billion, which is an annual increase of 7.5% (2011: CZK 15.7 billion).By offering genuine accessories the Group is responding to continued growth of a customer segment that requests a higher level of individuality. At the same time the Group ex-tends the offer of leisure-time products while meeting strict quality criteria.Revenues of ŠKODA genuine accessories were CZK 2.4 billion. Compared to 2011, the increase was 9.1% (2011: CZK 2.2 billion).

27Annual Report 2012
Business Operations
ŠKODA AUTO significantly strengthened its attractiveness as an employer in 2012 and intends to continue this trend over the years to come.The objective of human resources management is to further strengthen and advance the position as active partner in the specialized domains. This approach includes major support for the specialized areas as regards personnel work, recruitment of highly qualified new employees, efficient development of all colleagues, and building up their loyalty to the Company. One of the main tasks was the adoption of intensive meas-ures aimed at improvement of staff qualification levels, and the Company succeeded in further increasing the share of uni-versity graduates. Other important topics included the optimi-zation of staff deployment processes, support during foreign assignments, and internationalization of the Czech plants, in which currently a work force consisting of 40 nationalities is employed. ŠKODA AUTO has long enjoyed a close partnership with the ZO OS KOVO union within ŠKODA AUTO a.s. Thanks to this cooperation, the Company is able to respond quickly to the needs of its employees, who provide the Company with maxi-mum support and greatly contribute to its results. The Com-pany's success stems from the high loyalty and motivation of employees. This was also reflected in an internal company survey from 2012 with the participation of 95% of the Com-pany's employees, which confirmed a further increase in em-ployee motivation.
ŠKODA AUTO continues to place great emphasis on the long-term retention of qualified employees. Certified experience secures permanent employment, work-life balance and health protection in the workplace, as well as gender and diversity management. The Company has been closely involved in the support of women and career development of all age groups. For its activities in this field, ŠKODA AUTO was awarded the TOP Responsible company title in the category "Company wel-coming seniors", and in the European project "2012 – European Year for Active Ageing and Solidarity between Generations" it was given second award in the category "Workplaces for all Ages".Due to the increasing internationalisation of the Company, one of the challenges for human resources management is to increase employee mobility and make working abroad more attractive, particularly at management level. This will also pro-mote in-company transfers of professional knowledge and offer employees extensive opportunities for personal devel-opment. Respective programmes are continuously tailored to meet individual needs. As a result, ŠKODA AUTO has greatly increased its presence abroad. In 2012, the number of employ-ees sent abroad exceeded 200 for the first time. A total of 214 employees in 14 countries in Europe and plants in Russia, India and China, represented the interests of ŠKODA AUTO abroad.
Qualificationsandprofessionaltrainingfor employeesAn important building block for the HR activities of ŠKODA AUTO is qualification of employees, with a focus on continu-ing education.Key examples of professional training to promote the Com-pany’s competitiveness and growth include language courses and training in cross-cultural knowledge and skills, which are intended to prepare employees for the further international development of ŠKODA AUTO.The Company also focuses on other areas of professional training and has invested a total of CZK 21.4 million in renovat-ing employee training facilities for welding, robotics, pneumat-ics and hydraulics. Almost 5,000 employees passed through
Humanresourcesmanagement
QualificationstructureoftheCompany’spermanentemployees
33.7% Secondary education with certificate
47.5% Technical secondary education
4.9% Basic education
13.9% University education

28 Annual Report 2012
Business Operations
these laboratories in 2012 and were able to increase their qual-ifications extensively. ŠKODA AUTO is aware of the shortage of technical experts on the job market and has therefore been heavily involved in enhancing the skills of young technicians.In 2012, ŠKODA AUTO trained approximately 900 young peo-ple for their future careers at its secondary education institute. The Company is also active in university education. In 2012, ap-proximately 1,100 students attended classes for their future professions at the ŠKODA AUTO University. ŠKODA AUTO ful-fils its social responsibility in this field in all areas where it is based, in active response to demographic trends in Europe.
Keyfactor–attractivenessasanemployerIn 2012, public opinion surveys once again rated ŠKODA AUTO one of the most popular companies in the Czech Republic. In 2012, it ranked first in the CZECH TOP 100 and is therefore
considered the most admired company in the Czech Republic.One of the Company's most important awards in the HR field was the Employer of the Decade award, which clearly confirms the long-term course the Company has taken in its work with employees. ŠKODA AUTO is a highly attractive employer for university graduates. The Company ranked third in the "Czech Republic Graduate Barometer" and was named "Captain of the Year" in the Czech Republic. The Company also took first place in the categories "Best HR advertisement", "Best recruiter" and "Best presentation at job fairs". The Company is actively involved in recruiting women. The results of a survey of around 10,200 final-year students and graduates in economics, engineering and IT from 22 universi-ties across the country confirmed that the Company is also a much more attractive employer for women than in 2011.
Groupworkforce
31.12.2012 31.12.2011 2012/2011
ParentCompany–permanentemployees 23,978 24,177 –0.8%
of which:
– Mladá Boleslav plant 19,559 19,691 –0.7%
– Vrchlabí plant** 938 860 9.1%
– Kvasiny plant 3,481 3,626 –4.0%
Parent Company – apprentices 810 759 6.7%
ParentCompany–employeestotal* 24,788 24,936 –0.6%
Subsidiaries – permanent employees 1,607 1,622 –0.9%
Subsidiaries – apprentices 9 7 28.6%
Subsidiaries–employeestotal* 1,616 1,629 –0.8%
ŠKODAAUTOGroupemployeestotal* 26,404 26,565 –0.6%
* excl. temporary employees incl. apprentices, representing the number of employees as at 31 December 2012** As at 31 December 2012 Vrchlabí plant including VAD facility (transmissions)

29Annual Report 2012
Sustainablity is a fundamental part of the corporate strategy of ŠKODA AUTO. The comprehensive ŠKODA sustainability strategy is based on three pillars: environmental, social and economic responsibility. Regarding the environment, the main focus is on low-impact production of vehicles and the devel-opment of low-emission vehicles. Social responsibility means dealing responsibly with customers, employees, shareholders, business partners and the general public. Economically, the company’s economic objectives are the focus.
Environmental responsibilityTechnologyforloweremissionsIn keeping with its responsibility for the community, ŠKODA AUTO is developing technologies for a cleaner, more effi-cient future for automobiles. The innovative Green tec pack-age developed for the entire portfolio features an automatic start-stop system which reuses braking energy and tyres with optimised rolling resistance. For example the sales of the ŠKODA Rapid started with five Green tec variants. A Green tec – equipped ŠKODA Rapid with a 1.6 litre-engine and an output of 77 kW has an average fuel consumption of 3.9 litres/100 km and emits only 104 grams CO2/km. The GreenLine vehicle model series includes additional tech-nical and aerodynamic modifications. The third generation of this technology for a cleaner environment will soon be avail-able. ŠKODA AUTO is showcasing an entirely new approach to reducing CO2 emissions with its first series model with a pres-surised natural gas fuel engine: the ŠKODA Citigo CNG with a 1.0 litre-engine emits only 79 grams CO2/km.
ŠKODAAUTOandenvironmentalprotectionA production which does not put more stress on the environ-ment than absolutely necessary is an important element of the Company’s environmental policy. In this respect, all legal requirements are met, and new, stricter standards are com-plied with as early as possible. The company received a re-newed ISO 14001 certificate in 2012.
EnvironmentalinvestmentsAs part of its growth strategy, ŠKODA is currently investing in various new capacities and projects. These investments meet cutting-edge environmental standards.
For example, the extension of the already-existing Technology and Development Centre in Česana was begun this year. Further central projects were completed in 2012. Among these are the new Service Training Centre, the new Lean Centre for optimised production and administration processes, the new IT Centre and the new ŠKODA Parts Centre for spare parts and accessories.Production facilities also received extensive investment. ŠKODA AUTO modernised and expanded significant parts of the production floor in the Mladá Boleslav parent plant for the production of the ŠKODA Rapid and the new ŠKODA Octavia. At the Vrchlabí plant, ŠKODA AUTO has been producing dual-clutch gearboxes for the Volkswagen Group. This addition also required extensive investments.Besides extending capacities, ŠKODA AUTO continuously monitors its production sites for environmental impact. This includes the adaptation of already approved partial facilities.
Air-qualityprotectionA “clean” factory is characterised by emissions which are as low as possible. Over the past years, ŠKODA AUTO has imple-mented many measures to reduce the air pollution caused by production to a minimum.Significant progress was made in particular regarding the emission of volatile organic compounds (VOC). These com-pounds are by-products of the painting process and account for more than 83% of the pollutants emitted by paint shops. Due to the continuous optimisation of the painting processes, ŠKODA AUTO has achieved a reduction of volatile organic com-pound emissions to significantly below the legally permitted maximum levels – and this independently of the number of paint-ed vehicles and their size. Per square metre of painted surface, fewer than 27 grams of volatile organic compounds were emit-ted; the legally prescribed maximum value is currently 45 grams. Those volatile organic compounds which are emitted are mixed with natural gas and burned. The heat released is used for heating the technology in the paint shop.
ContaminatedareasmostlyreconditionedSome contaminated production areas have remained from the years before 1990. By the end of 2012, more than 81% of these had been cleared. The Company invested in these activities a total of CZK 617.8 million until 2012.For example, ŠKODA AUTO implemented extensive recondi-tioning measures in the course of converting tool production
Sustainability
Business Operations

30 Annual Report 2012
Business Operations
in the Mladá Boleslav plant. The main aim was to prevent pol-lutants from entering the ground water. To achieve this, all floors were newly insulated. The quality of the ground water is analysed extensively twice a year.
WaterprotectionSubstances that pose a danger to ground water are handled exclusively in rooms and systems fitted with the appropriate technical safeguards. All substances potentially harmful to ground water are used and stored in accordance with strict regulations. The floors in all rooms in which such substances are emitted or stored are completely secure against seepage.In the interest of maximum resource efficiency, it is of deci-sive importance to keep water usage to a minimum and to discharge industrial water back into natural circulation. In this area, ŠKODA AUTO has achieved marked improvements both in the total water used and in the amount of wastewater per vehicle. Furthermore, the wastewater quality significantly ex-ceeds the prescribed legal limits.
Significantinvestmentinenvironmental protection In 2012, ŠKODA AUTO invested in construction projects to step up environmental protection. Total investment in environmen-tal protection since 1991 amounts to CZK 10.3 billion.
Social responsibilitySocial responsibility has always played a key role at ŠKODA AUTO. As one of the Czech Republic’s leading companies, ŠKODA AUTO believes it has a special responsibility for its em-ployees and their families, and – as a good neighbour – for peo-ple in the communities where its plants are located. The Com-pany pays particular attention to the welfare of its employees, offering a broad range of social benefits, guaranteeing health and occupational safety standards, and providing a unique sys-tem of corporate training and professional development.ŠKODA AUTO complies with all relevant recommendations of the Code of Corporate Governance, by which it declares its openness towards the public and the transparency of its in-ternal processes and relations with the sole shareholder. The Company maintains bilateral and mutually beneficial relation-ships with suppliers and follows the legacy of its founders, Laurin and Klement, stating that “...only the best we can do is good enough for our customers.”The Company pursues a long-term policy of dedicating maxi-mum effort to limiting the negative impact of its operations on the environment. This pertains not only to the Company’s own production and sales operations, but also to its selec-tion of suppliers who meet the most stringent ISO 14000 en-vironmental standards. Use of alternative energy sources and
Wastepervehicleproduced(kg/vehicle)*
0 10 20 30 40
2008
2009
2010
2011
2012
* In 2012, the methods of calculation of waste per vehicles produced was changed. The comparative figures for previous years were recalculated.

31Annual Report 2012
Business Operations
development of new products allows ŠKODA AUTO to reduce its output of CO2 emissions. In 2012, the Company's Board of Management adopted the concept for the GreenFuture pro-gramme, which is intended to reduce the environmental im-pact of production even further.A summary of information about all of the Company's major activities related to social responsibility – the Sustainability Report of SKODA AUTO for 2011/2012 – was published in Feb-ruary 2013.
RoadsafetyAside from sporting, cultural and social activities pursued within the scope of the social responsibility of ŠKODA AUTO, measures to improve road safety have become increasingly important. Projects include funding for children’s traffic-themed playgrounds in the regions where the Company’s pro-duction plants are located, and the development of a unique internet application “ŠKODA hrou” (“Playful ŠKODA”). Another project designed to improve safety features in cars is “Traffic Safety Research” under which the Company collaborates with fire fighters, police and medics. In 2012, ŠKODA AUTO was once again the general partner for a traffic contest “Cesty městy” (“Roads through Cities”) organised by the Partnership Founda-tion. The contest promotes well-designed traffic solutions for reducing traffic density in Czech cities and municipalities.
SupportofsocialactivitiesŠKODA AUTO is involved in sponsorships at both local and re-gional levels, i.e. directly where its factories operate, and also on a nationwide and global scale. In cooperation with leading foundations and charitable organisations, the Company spon-sors a variety of social, cultural and humanitarian projects. The Company ensures that it also supports sporting events involv-ing persons with disabilities.
CultureandtheartsThe traditional partners of ŠKODA AUTO include the Czech Philharmonic, the National Theatre, the National Museum and the National Technical Museum. The Company also supports selected international events held outside Prague, such as music festival Smetana’s Litomyšl and the International Film Festival for Children and Youth in Zlín. In addition, ŠKODA AUTO has established partnerships with the Festival of Ger-man Language in Prague and the Municipal Theatre in Mladá Boleslav.
SocialcommitmentŠKODA AUTO is a long-time supporter of the Paraple Centre, specifically as a supplier of vehicles with adjusted hand steer-ing, which help patients become more self-sufficient. The Car Club organisation, which provides comprehensive services in eight commercial centres in the Czech Republic, is a major part-ner in improving the mobility of disabled people. These com-mercial centres also employ disabled people. Other projects funded by the Company include the Forum 2000 Foundation and the Paralympic Committee.ŠKODA AUTO continues its long-term funding of the organi-sation “Zdravotní klaun” (“Clown Doctors”), which arranges for professional clowns to visit seriously ill children across the Czech Republic under the motto “laughter is the best doctor”. Another project named “One tree planted for each car sold in the Czech Republic” demonstrates the active ap-proach of ŠKODA AUTO to environmental protection. It allows employees and their families to volunteer for the Company’s social responsibility activities. In 2012, cooperation had been established with 44 partners, mainly from municipalities and non-profit organisations, and more than 363,000 trees were planted in more than 50 locations.
CommitmentrewardedAs part of the “European Year of Active Aging and Inter-gen-erational Solidarity”, ŠKODA AUTO won an award for its exem-plary approach to supporting seniors. The Company received an award for the company with the most beneficial approach to seniors in the Top Responsible Company 2012 competition in the Czech Republic. Moreover, it also performed well in the pan-European competition in the category "Workplaces for all ages", where it took second place. The Company was com-mended for the extensive measures it adopted in response to demographic trends to promote the employment of seniors.

32 Annual Report 2012
Risk Report
The global operations of ŠKODA AUTO Group in automotive markets pose numerous risks that may have a negative impact on its financial performance and business success. At the same time, economic and legislative changes may lead to a variety of opportunities that the Group strives to utilise to strengthen and further improve its position among competitors.
Risk management organisationThe risk management structure at ŠKODA AUTO Group is based on the common principle of risk management within the Volkswagen Group, which complies with German legisla-tive requirements for monitoring and transparency of a com-pany's activities (KonTraG). Risk management, as an operative component of the corporate process, involves identification of individual risks in detail, assessment of their scope, imple-mentation of measures to eliminate them and presentation of evidence about their effectiveness. The overall risk management is centrally coordinated by the Controlling division in cooperation with the Internal Audit divi-sion and the Governance, Risk & Compliance department. The joint implementation of the risk management system is de-scribed and ensured by the "Risk Management" organisational directive.The risk management system is based on decentralised re-sponsibilities. Every year, standardised questions for evaluating risk situations are forwarded to employees who handle risks in individual functional areas, including subsidiaries. Based on their feedback, the complete picture of the potential risk situa-tion is updated. For each identified risk, a qualitative probability of occurrence and relevant scope of damages is identified. Ap-propriate measures are specified in the form of standards and instructions to minimise or eliminate each risk. Internal rules are clearly defined and are usually available online. Manage-ment is regularly provided with a report containing a descrip-tion of the most significant risks and an up-to-date map of the risks in individual areas, including subsidiaries. In accordance with strategic aims, measures to eliminate or reduce risks are proposed and subsequently implemented. The results of these measures are continuously monitored and evaluated.The effectiveness and sufficiency of the system is regularly veri-fied, integrated into the planning, controlling and business pro-cesses system, and continuously optimised as part of the risk management process. In this case, the same importance is as-signed to internal and external requirements, particularly the Ger-man Accounting Law Modernisation Act (BilMoG). The system is optimised to achieve continuous monitoring of the major risk are-as, including the responsibilities of individual organisational units.
Risk description and managementThe most significant risks facing the Group are financial and sector-specific risks, risks arising from changes in the overall economic and political conditions and changes in legislation, operating risks and other risks, such as those arising from changes in quality and risks in the area of human resources.
Economic,politicalandlegislativerisksWith regard to the Group’s business activities, its financial position both as an exporter and as a local manufacturer is significantly influenced by general economic conditions and those in individual markets, such as the state of the economy and the related economic cycle, legislative changes, and also the political situation, terrorist activities or pandemics in the countries where the Group is active.This is accompanied by a persistent threat of risks related to a high level of public debt, high rates of unemployment, and fluc-tuations in prices of precious metals, oil and plastic. Other sig-nificant risks that could affect the Group’s business activity in global markets include a divergent pace of economic growth in specific countries or regions and a vulnerable banking system.Exports to countries carrying potential territorial and political risks are identified well in advance and hedged using stand-ard, approved products of the financial and insurance markets. In this field, the Group has partnered with Czech and interna-tional banking organisations, including EGAP. The Group's economic situation may also be adversely af-fected by additional technical development costs incurred as a result of changes in legislation, such as stricter legislative re-quirements for vehicle safety, fuel consumption or emissions of harmful substances, as well as adjustments in standard ve-hicle specifications. In the area of legislation pertaining to en-vironmental protection, it is necessary to anticipate tightening of EU legislation governing exhaust-gas emissions.
DemandrisksGrowing and more aggressive competition in the automotive sector is reflected in increasing support for sales. This is further exacerbated by market risks due to changes in customer de-mand, since customer purchase behaviour depends not only on actual conditions, such as real wages, but also on psychologi-cal factors. To mitigate these risks as far as possible, the Group continuously analyses competition and customer behaviour.
Purchase risksClose and economically beneficial collaboration between car-makers and their suppliers poses procurement-related risks that may disrupt production. These include late delivery, failure
Risk management system

33Annual Report 2012
Risk Report
to deliver and quality defects. Other risks arise from growing competition in the supplier industry. To mitigate these risks, the Group has teamed up with additional suppliers to source parts for vehicle assembly. In addition, preventive measures are being adopted within the risk management system to address possible supplier insolvency. The market situation is being assessed on an on-going basis, which allows for quick responses to changing conditions.
FinancialrisksFinancial risks and their management have been one of the most closely monitored aspects of ŠKODA AUTO Group’s risk management activities. In terms of materiality, the risk from exchange rate fluctua-tions against the Czech crown and their impact on cash flows and the financial and economic performance of the ŠKODA AUTO Group, is of primary importance. The risks and impact of exchange rate fluctuations are regularly analysed and man-aged with the use of standard instruments (foreign exchange termed forwards and swaps) approved by internal and the Volkswagen Group committees. All of these transactions are executed to comply with the requirements of the interna-tional accounting standards for hedge accounting. A similar method is used to resolve risks stemming from the purchase of aluminium, copper and lead, raw materials purchased for the manufacture of products at individual companies within the ŠKODA AUTO Group. Active management of the potential impact of trends in inter-est rates is an integral part of risk management. The Group guards against credit risks by using hedging instruments, both preventive (e.g. retention of title, advance payment, documen-tary letter of credit, etc.) and subsequent (e.g. confirmation of debt prolonging the statute of limitation, payment calendars, bills of exchange). The Group employs standard procedures and instruments to manage liquidity risk and ensure sufficient coverage for the period required, as defined by the internal rules of ŠKODA AUTO. The funding is based on financial resources of the Group and resources of Volkswagen Group companies.
ResearchanddevelopmentrisksNew products carry the inherent risk that customers might not accept them. The Group therefore performs extensive analyses and customer surveys. Trends are identified early and their rele-vance for customers is tested. Another potential risk arises from the Group’s possible failure to launch production start-ups with-in the scheduled timeline, in the required quality and with target expenditures. This risk is eliminated by performing on-going pro-ject checks and comparisons with specifications, since it allows requisite measures to be adopted if any irregularities are found.
QualityrisksDue to growing competitive pressures, the increasing com-plexity of production technologies and the large number of suppliers, quality assurance is an important part of the manu-
facturing process. Despite maintaining an effective and sys-tematic approach to quality assurance, product–liability risks cannot be entirely eliminated. In order to minimise quality risks from the very beginning, the Group endeavours to prevent these risks from occurring in all processes affecting product quality, specifically by implementing quality methods and con-trols and performing a variety of tests. These processes cover conceptual and development stages, serial production and care for the car during customer use. For timely identification of trends, it is important to share knowhow and, in cooperation with suppliers, develop tools and possible controls for quality management to maintain product quality at a level that meets the requirements and expectations of the Group’s customers.
HumanresourcesrisksHuman resources management largely reflects current circum-stances in ŠKODA AUTO Group’s key markets. These are typically a highly competitive environment, stagnation of developed au-tomotive markets and fast growth in emerging markets. As an employer with considerable social responsibility, ŠKODA AUTO Group makes an extraordinary effort to preserve jobs and re-tain key personnel. To facilitate this outcome, employees are continuously trained and systematically prepared to face new challenges within the Group with the aim of achieving maxi-mum flexibility and employee performance, while guaranteeing safe jobs and a high standard of remuneration for work done.
Informationtechnology(IT)risksIn the area of information systems and technologies, the Group takes great care to protect itself against risks involving data availability, confidentiality and integrity. Increased attention is paid to unauthorised access to and misuse of data through the implementation of various measures relating to employees, the organisation, applications, systems and data networks.Within the ŠKODA AUTO Group, an Information Security Man-agement System (ISMS) has been established to minimise infor-mation security risks and their impact on the Group's business objectives. Corporate guidelines for the handling of information and safe use of information systems apply to all employees. Additionally, standard technical measures have been imple-mented against external and internal threats (anti-virus protec-tion, secure internet access, separate access permissions, etc.).
LegalrisksThe Group conducts business activities in more than one hun-dred countries worldwide, which can involve risks pertaining to legal disputes against suppliers, importers, dealers and cus-tomers, as well as risks of administrative proceedings related to particular areas of the Group’s business activities.
Other operating risksAside from the aforementioned risks, there are factors of influence that cannot be predicted and that may affect the Group’s future development. Such events include natural dis-asters, epidemics and other threats.

34 Annual Report 2012
Outlook
Short-termandlong-termoutlook
Projecteddevelopmentontheautomobile marketsShould the economic problems of the Eurozone and espe-cially Southern Europe worsen, the sales in individual Euro-pean markets could be affected. Positive trends will continue in the Indian and Chinese markets. On the other hand Russia is expected not to continue its record growth as in 2012 and stagnation can be foreseen in 2013. Growth in global demand for new vehicles will probably be slower than in the reporting period.
CzechRepublicThe development of the market in the Czech Republic is ex-pected to follow the 2012 figures.
EuropeSlight decreasing demand is expected in Germany, which is the most important European market for ŠKODA AUTO. Sales in Western Europe will most likely reflect the economic situation in specific regions. It is expected that Western European market will show a decrease in demand. The same is expected for pas-senger cars in Central and Eastern European markets. In Russia sales are predicted to stay approximately on the level of 2012.
Overseas/AsiaThe positive development of the automobile market in China and India will continue through 2013. The reason is the dy-namic economic growth in these countries, combined with the ever-growing domestic demand. ŠKODA AUTO is going to be very active in these markets within the framework of its global growth strategy.
Overviewofplannedactivitiesandtargets
TechnicaldevelopmentAdditional new models will play a key role in the Company's plans for boosting its position in the global marketplace. In line with this aim, technical development will continue with
the development of new products and implementation of in-novations into existing vehicles. A major emphasis will be on reducing carbon dioxide emissions, as well as implementing new information technology. 2013 will be an exceptional year for the ŠKODA AUTO Group: In spring, it will present the successor to its most important, most successful model, the ŠKODA Octavia, at the Geneva Motor Show. Newly developed engines, assistance systems and security features will raise the bar for safety and comfort in its class. An updated ŠKODA Superb model will also be in-troduced in 2013.To reinforce the position of technical developments by ŠKODA AUTO in the Volkswagen Group, development capabili-ties will be further strengthened, particularly in the field of ag-gregate development. In late 2013, the first testing equipment will be put into operation at the aggregate testing centre.The ŠKODA Motorsport factory team, driving ŠKODA Fabia Super 2000 cars, will participate in selected races of the World Rally Championship in the categories Super 2000 (WRC-2) and European Rally Championship (ERC) in 2013, which has acquired renewed appeal thanks to the merger with the In-tercontinental Rally Challenge (IRC) series, where ŠKODA has become the most successful manufacturer in history after the third victory in a row in 2012.
ProductionandlogisticsSuccessful implementation of the ŠKODA growth strategy will continue throughout 2013, and the years after with ambitious targets. These include the extension of production capacities not only in the Czech Republic, but also in partner plants in Russia, India and China. In the Company's plants in the Czech Republic, the ramp-up of several new models is planned for 2013. In cooperation with the Volkswagen corporation, new models will be launched in the Russian GAZ factory in Nizhny Novgorod. ŠKODA AUTO is planning to expand its product port-folio in China as well. Due to the growing demand for DQ 200 transmissions, production capacity will be increased in the Vrchlabí plant in 2013.

35Annual Report 2012
Outlook
EnvironmentalProtectionŠKODA AUTO is continually reducing the environmental im-pact of its production processes, and has been doing so for a number of years. Since February 2012, the sustainable de-velopment of the Company has been given an even stronger impetus by a dedicated project entitled GreenFuture. By 2018, the environmental impact of the Company's production will be lowered by 25 per cent compared to 2010. GreenFuture fo-cuses on five parameters, including energy and water usage, CO2 emissions, waste amount and volatile organic compounds (VOC). These parameters are continually analysed. On the ba-sis of these data, measures for improvement are developed and implemented.
Markets,salesandmarketingŠKODA AUTO will strive in 2013 to boost its market shares and sales in the key markets. To achieve this target, the Company will pay special attention not only to the traditional markets, but also to the strategic countries Russia, China and India. The main objectives in 2013 will be the successful implementa-tion of the new generation of the ŠKODA Octavia onto the markets, the ramp-up of the completely new body variant of ŠKODA Rapid, and the establishment of the freshly introduced models ŠKODA Citigo and ŠKODA Rapid.To improve the presence of the ŠKODA brand in the major markets, a new corporate design will be introduced gradually in the global sales network in 2013. The network will be further extended in all the growth markets. Plus, the second stage of the "Human Touch" initiative will be implemented, which will enable continued improvement of our individual approach to customers throughout the ŠKODA sales and services network.
EmployeesIn 2013, ŠKODA AUTO will focus on retaining key employees and increasing flexibility in particular. The Company will con-centrate on enhancing employee skills and preparing them for future challenges. A further priority will be talent management, aiming at creating the necessary personnel requirements for
implementing the Company’s global internationalisation and growth strategy. ŠKODA AUTO is primarily interested in highly qualified applicants with excellent language skills for careers within its global network of production companies. In light of the volatility on the global markets, the Company will focus on human resources planning. Major attention will be paid – apart from the quantitative planning – to high quality of personnel planning, which is essential for the recruitment of employees in highly qualified professions, who are generally in short sup-ply. Due to that fact the development of the in-house resourc-es is of fundamental importance. The Company will also step up its efforts to support women in the workplace, as it sees major potential in this area. A further priority for HR is to pro-vide training for the largest possible number of workers. The main focus here is on cooperation with foreign universities and strengthening personnel marketing activities in Russia, China and India, as well as more extensive cooperation with the cities and regions where ŠKODA AUTO plants are located and further enhancing its attractiveness as the TOP employer for life.
FinanceThe ŠKODA AUTO Group will continue to renew its model range in 2013. The costs associated with the launch of the new ŠKODA Octavia and the end of the production of its pre-decessor will effect the year 2013. However, these invest-ments are important for the future of ŠKODA AUTO.The ŠKODA AUTO Group aims to achieve solid financial figures in 2013. Product cost optimisation and maintaining the pro-ductivity will count among the measures in place to ensure the Company’s financial goals. The focus will be on cost and li-quidity management through strict monitoring of cost targets, optimised use of working capital and continuous tracking of all investments.

36 Annual Report 2012
January
12 January Opening of three additional training centres
30 January Production of the fourteen-millionth ŠKODA brand vehicle
February
3 February Everyday road testing begins for a fleet of ŠKODA Octavia Green E Line cars
March
2 March ŠKODA AUTO helps plant 363,000 trees as part of its "One planted tree for each car sold in the Czech Republic” project
5 March World premiere of ŠKODA Citigo model with 5-door body at Geneva Motor Show
14 March ŠKODA the most successful brand in the Best Cars 2012 survey
21 March ŠKODA AUTO publishes the results for 2011 at the annual press conference in Prague
April
2 April Official presentation of the fleet for the IIHF Ice Hockey World Championship
23 April ŠKODA MissionL China introduced at the Beijing Motor Show
30 April ŠKODA AUTO main sponsor of the Ice Hockey World Championship IIHF for 20 consecutive years
May
4 May Production of the three-millionth ŠKODA Fabia
9 May The Prague Castle Administration accepts a ŠKODA Octavia Green E Line electric vehicle for testing
15 May World premieres of the ŠKODA Citigo Rally and ŠKODA Citigo DJ Car studies at the GTI meeting on Wörthersee
24 May Delivery of the ŠKODA Octavia Green E Line electric car to the Faculty of Trans-portation Sciences of Czech Technical University in Prague for testing
June
18 June A ŠKODA AUTO employee and his family test a ŠKODA Octavia Green E Line vehicle in everyday operation
19 June First place in the CZECH TOP 100 competi-tion to find the most successful company
22 June Manufacturing jubilee in Kvasiny plant: 500,000th ŠKODA Superb vehicle leaves the line
28 June ŠKODA AUTO once again main sponsor of the Tour de France in 2012
July
4 July Five-year anniversary of ŠKODA produc-tion in China
9 July Presentation of the new ŠKODA Rapid model to journalists from around the world in Slovakia
24 July Opening of new training centre for em-ployees, the Lean Centre
August
8 August ŠKODA Octavia Green E Line vehicles in the service of ČEZ company and the Ministry of Environment of the Czech Republic
23 August Start of serial production of ŠKODA Rapid
24 August Worldwide premiere of the ŠKODA Yeti Sochi action model at the Moscow Motor Show
30 August ŠKODA Citigo in show rooms also with the robotized transmission ASG
September
11 September ŠKODA AUTO completes construction of its new automatic rack warehouse in ŠKODA Parts Centre in Mladá Boleslav
24 September ŠKODA Citigo wins the Economy Run 2012 competition with a mere 2.97 li-tres/100 km consumption
25 September Construction of a new engine testing centre begins in Mladá Boleslav
29 September World premiere of the ŠKODA Rapid at the Paris Motor Show
Milestonesoftheyear2012
Outlook

37Annual Report 2012
Outlook
October
6 October Open House at the ŠKODA AUTO plant in Kvasiny
15 October ŠKODA AUTO plant in Vrchlabí begins production of the DQ 200 transmission
18 October ŠKODA AUTO awarded the title "Employer of the decade" in the Czech Republic
22 October Presented with an award at the interna-tional design competition for automobile brands, "Automotive Brand Contest 2012"
31 October ŠKODA Yeti launch in Laurin & Klement version in the market
November
4 November ŠKODA wins the IRC brand and racer titles for the third time
7 November ŠKODA AUTO awarded "Investor of the past two decades" title in the Czech Republic
12 November Launch of the first private half-year test of ŠKODA Octavia Green E Line
22 November Chinese premiere of ŠKODA Superb GreenLine model at AUTO GUANGZHOU 2012
26 November Opening of new interactive ŠKODA Muzeum in Mladá Boleslav
28 November ŠKODA Rapid received five stars from Euro NCAP for safety
December
3 December Production of new generation of gasoline engines EA211 launched in Mladá Boleslav
6 December Production of ŠKODA Yeti model launched in Nizhny Novgorod, Russia
8 December ŠKODA brand officially receives the cups for victories in the European and Asia-Pacific rally championships from the FIA
11 December Static presentation in Mladá Boleslav of the new generation of ŠKODA Octavia vehicles
17 December Serial production of a new generation of ŠKODA Octavia launched
17 December ŠKODA AUTO awarded the title "Exporter of the year 2012"

38 Annual Report 2012

Financial Section


41Annual Report 2012
Financial Section
42 Auditor‘s report on the annual report and the report on relations
44 Auditor’sreportontheconsolidatedfinancialstatements
46 Consolidatedfinancialstatementsfortheyearended31December2012
51 Notestotheconsolidatedfinancialstatements2012
106 Auditor’sreportontheseparatefinancialstatements
108 Separatefinancialstatementsfortheyearended31December2012
112 Notestotheseparatefinancialstatements2012
168 Reportonrelations
173 Glossaryoftermsandabbreviations
175 Listofnon-consolidatedcapitalholdingsofŠKODAAUTO
176 Personsresponsiblefortheannualreportandpost-balancesheetevents
177 Keyfiguresandfinancialresultsataglance

42 Annual Report 2012
Auditor’s report on the annual report and the report on relations
Auditor’s report on the annual report and the report on relations
Independent auditor’s report to the shareholder of ŠKODA AUTO a.s.
WehaveauditedtheseparatefinancialstatementsofŠKODAAUTOa.s.,identificationnumber00177041,with registered office at Tř. Václava Klementa 869,Mladá Boleslav (“the Company”) for the year ended 31December2012disclosedintheannualreportonpages108to167andissuedtheopiniondated14Febru-ary2013anddisclosedonpages106and107.WehavealsoauditedtheconsolidatedfinancialstatementsoftheCompanyanditssubsidiariesfortheyearended31December2012disclosedintheannualreportonpages46to105andissuedtheopiniondated14February2013anddisclosedonpages44and45(herein-aftercollectivellyreferredtoas“thefinancialstatements”).
Report on the Annual Report
Wehaveverified that theother information included in theannual reportof theCompany for theyearended 31 December 2012 is consistent with the financial statements referred to above. The Board of Directorsisresponsiblefortheaccuracyoftheannualreport.Ourresponsibilityistoexpressanopinionontheconsistencyoftheannualreportwiththefinancialstatementsbasedonourverificationprocedures.
Auditor’s ResponsibilityWeconductedourverificationproceduresinaccordancewiththeInternationalStandardsonAuditingandtherelatedapplicationguidanceoftheChamberofAuditorsoftheCzechRepublic.Thosestandardsrequirethatweplanandperformtheverificationprocedurestoobtainreasonableassuranceaboutwhethertheother information included in theannual reportwhichdescribesmatters thatarealsopresented in the financialstatementsis,inallmaterialrespects,consistentwiththerelevantfinancialstatements.Webe-lievethattheverificationproceduresperformedprovideareasonablebasisforouropinion.
OpinionInouropinion, theother information included in theannual reportof theCompany for the yearended 31December2012isconsistent,inallmaterialrespects,withthefinancialstatements.
PricewaterhouseCoopers Audit, s.r.o., Hvězdova 1734/2c, 140 00 Prague 4, Czech Republic T: +420 251 151 111, F: +420 251 156 111, www.pwc.com/cz PricewaterhouseCoopers Audit, s.r.o., registered seat Hvězdova 1734/2c, 140 00 Prague 4, Czech Republic, Identification Number: 765521, registered with the Commercial Register kept by the Municipal Court in Prague, Section C, Insert 3637, and in the Register of Audit Companies with the Chamber of Auditors of the Czech Republic under Licence No 021.

43Annual Report 2012
Auditor’s report on the annual report and the report on relations
Report on review of the Report on Relations
Inadditionwehavealso reviewedtheaccompanying reporton relationsbetweentheCompanyand itscontrollingpartyandbetweentheCompanyandtheotherpersonscontrolledbythesamecontrollingpartyfortheyearended31December2012(the“Report”).ThecompletenessandaccuracyoftheReportistheresponsibilityoftheBoardofDirectorsoftheCompany.OurresponsibilityistoexpressouropinionontheReportbasedonperformedreview.
Scope of Review WeconductedourreviewinaccordancewithAuditstandard56oftheChamberofAuditorsoftheCzechRepublic.Thisstandard requires thatweplanandperformthe reviewtoobtain limitedassuranceas towhether theReport is freeofmaterial factualmisstatement.A review is limitedprimarily to inquiriesofCompanypersonnel,analyticalproceduresandexamination,onatestbasis,offactualaccuracyofdata.Areviewthereforeprovideslessassurancethananaudit.Wehavenotperformedanauditand,accordingly,wedonotexpressanauditopinion.
ConclusionBasedonourreview,nothinghascometoourattentionthatcausesustobelievethattheaccompanyingReporthasnotbeenproperlyprepared, inallmaterial respects, inaccordancewith the requirementsofArticle66aoftheCommercialCode.
7March2013
representedby
Jiří Zouhar Pavel KulhavýPartner StatutoryAuditor,LicenceNo.1538
Note: Our report has been prepared in the Czech language and in English. In all matters of interpretation of information, views or opinions, the Czech version of our report takes precedence over the English version

44 Annual Report 2012
Auditor’s report on the consolidated financial statements
Auditor’s report on the consolidated financial statements
Independent auditor’s report to the shareholder of ŠKODA AUTO a.s.
WehaveauditedtheaccompanyingconsolidatedfinancialstatementsofŠKODAAUTOa.s.,identificationnumber00177041,withregisteredofficeatTř.VáclavaKlementa869,MladáBoleslav(“theCompany”)anditssubsidiaries(together“theGroup”),whichcomprisetheconsolidatedbalancesheetasat31December2012,theconsolidatedstatementsofincome,comprehensiveincome,changesinequityandcashflowsfortheyearthenendedandnotes,includingasummaryofsignificantaccountingpolicies(“theconsolidatedfinancialstatements”).
Board of Directors’ Responsibility for the Consolidated Financial StatementsTheBoardofDirectorsisresponsibleforthepreparationoftheconsolidatedfinancialstatementsthatgiveatrueandfairviewinaccordancewithInternationalFinancialReportingStandardsasadoptedbytheEuro-peanUnion,andforsuchinternalcontrolsastheBoardofDirectorsdeterminesisnecessarytoenablethepreparationoffinancialstatementsthatarefreefrommaterialmisstatement,whetherduetofraudorerror.
Auditor’s ResponsibilityOurresponsibilityistoexpressanopinionontheseconsolidatedfinancialstatementsbasedonouraudit.WeconductedourauditinaccordancewiththeActonAuditorsoftheCzechRepublic,InternationalStand-ardsonAuditingandtherelatedapplicationguidanceoftheChamberofAuditorsoftheCzechRepublic.Thosestandardsrequirethatwecomplywithethicalrequirementsandplanandperformtheaudittoobtainreasonableassuranceaboutwhetherthefinancialstatementsarefreefrommaterialmisstatement.
PricewaterhouseCoopers Audit, s.r.o., Hvězdova 1734/2c, 140 00 Prague 4, Czech Republic T: +420 251 151 111, F: +420 251 156 111, www.pwc.com/cz
PricewaterhouseCoopers Audit, s.r.o., registered seat Hvězdova 1734/2c, 140 00 Prague 4, Czech Republic, Identification Number: 40765521, registered with the Commercial Register kept by the Municipal Court in Prague, Section C, Insert 3637, and in the Register of Audit Companies with the Chamber of Auditors of the Czech Republic under Licence No 021.

45Annual Report 2012
Auditor’s report on the consolidated financial statements
Anauditinvolvesperformingprocedurestoobtainauditevidenceabouttheamountsanddisclosuresinthefinancialstatements.Theproceduresselecteddependontheauditor’s judgment, includingassessmentoftherisksofmaterialmisstatementofthefinancialstatements,whetherduetofraudorerror.Inmakingthoseriskassessments,theauditorconsidersinternalcontrolrelevanttotheGroup’spreparationofthefinancialstatementsthatgiveatrueandfairviewinordertodesignauditproceduresthatareappropriateinthecircumstances,butnotforthepurposeofexpressinganopinionontheeffectivenessoftheGroup’sinternalcontrol.Anauditalsoincludesevaluatingtheappropriatenessoftheaccountingpoliciesusedandthereasonablenessofaccountingestimatesmadebymanagement,aswellasevaluatingtheoverallpres-entationofthefinancialstatements.Webelievethattheauditevidencewehaveobtainedissufficientandappropriatetoprovideabasisforourauditopinion.
OpinionInouropinion,theconsolidatedfinancialstatementsgiveatrueandfairviewofthefinancialpositionoftheGroupasat31December2012,itsfinancialperformanceanditscashflowsfortheyearthenendedinaccordancewithInternationalFinancialReportingStandardsasadoptedbytheEuropeanUnion.
14February2013
representedby
Jiří Zouhar Pavel KulhavýPartner StatutoryAuditor,LicenceNo.1538
Note: Our report has been prepared in the Czech language and in English. In all matters of interpretation of information, views or opinions, the Czech version of our report takes precedence over the English version.

46
Consolidated financial statements for the year ended 31 December 2012
Consolidated financial statements for the year ended 31 December 2012
Consolidated income statement for the year ended 31 December 2012 (CZK million)
Note 2012 2011
Sales 17 262,649 252,562
Cost of sales 26 221,751 215,956
Gross profit 40,898 36,606
Distribution expenses 26 19,179 17,549
Administrative expenses 26 6,855 6,123
Other operating income 18 10,122 10,040
Other operating expenses 19 7,069 4,717
Operating profit 17,917 18,257
Financial income 1,689 2,757
Financial expenses 2,944 1,966
Financial result 20 (1,255) 791
Share on profit / (loss) of associates 1,272 227
Profit before income tax 17,934 19,275
Income tax expense 22 2,580 3,200
Profit for the year 15,354 16,075
Attributable to:
Owner of the Company 15,354 16,035
Non-controlling interests – 40
15,354 16,075
Thenotesonpages51to105areanintegralpartoftheseconsolidatedfinancialstatements.
AnnualReport2012

47Annual Report 2012
Consolidated financial statements for the year ended 31 December 2012
Consolidated statement of comprehensive income for the year ended 31 December 2012 (CZK million)
Note 2012 2011
Profit for the year 15,354 16,075
Cash flow hedges 12 1,780 (4,923)
Exchange differences 12 (155) 54
Other comprehensive income / (loss) 1,625 (4,869)
Total comprehensive income for the year 16,979 11,206
Total comprehensive income attributable to:
Owner of the Company 16,979 11,179
Non-controlling interests – 27
Thenotesonpages51to105areanintegralpartoftheseconsolidatedfinancialstatements..

48 Annual Report 2012
Consolidated financial statements for the year ended 31 December 2012
Consolidated balance sheet as at 31 December 2012 (CZK million)
Note 31 December 2012 31 December 2011
Assets
Intangible assets 5 18,782 13,654
Property, plant and equipment 6 56,288 46,265
Investments in associates 7 2,200 940
Other receivables and financial assets 8 4,196 1,159
Deferred tax asset 14 2,027 2,668
Non-current assets 83,493 64,686
Inventories 9 18,619 16,061
Trade receivables 8 12,015 13,423
Prepaid income tax 447 60
Other receivables and financial assets 8 4,945 28,076
Cash and cash equivalents 10 40,467 31,251
Current assets 76,493 88,871
Total assets 159,986 153,557
Note 31 December 2012 31 December 2011
Equity and liabilities
Share capital 11 16,709 16,709
Share premium 1,578 1,578
Retained earnings 12 72,511 64,301
Other reserves 12 108 (1,517)
Equity attributable to owner of the Company 90,906 81,071
Non-controlling interests – 140
Equity 90,906 81,211
Non-current financial liabilities 13 3,000 3,000
Other non-current liabilities 13 5,483 7,317
Non-current provisions 15 10,693 11,030
Non-current liabilities 19,176 21,347
Current financial liabilities 13 107 141
Trade payables 13 30,807 30,105
Other current liabilities 13 5,933 6,258
Current income tax liabilities 71 1,217
Current provisions 15 12,986 13,278
Current liabilities 49,904 50,999
Total equity and liabilities 159,986 153,557
Thenotesonpages51to105areanintegralpartoftheseconsolidatedfinancialstatements..

49Annual Report 2012
Consolidated financial statements for the year ended 31 December 2012
Consolidated statement of changes in equity for the year ended 31 December 2012 (CZK million)
NoteShare
capitalShare pre-
miumRetained earnings
Other reserves*
Equity attributable to owner of
the Company
Non-controlling
interests Total equity
Balance as at 1 January 2011 16,709 1,578 52,968 3,339 74,594 178 74,772
Profit for the year – – 16,035 – 16,035 40 16,075
Other comprehensive income / (loss) – – – (4,856) (4,856) (13) (4,869)
Total comprehensive income for the year – – 16,035 (4,856) 11,179 27 11,206
Dividends paid 11 – – (4,702) – (4,702) (65) (4,767)
Balance as at 31 December 2011 16,709 1,578 64,301 (1,517) 81,071 140 81,211
Balance as at 1 January 2012 16,709 1,578 64,301 (1,517) 81,071 140 81,211
Profit for the year – – 15,354 – 15,354 – 15,354
Other comprehensive income / (loss) – – – 1,625 1,625 – 1,625
Total comprehensive income for the year – – 15,354 1,625 16,979 – 16,979
Dividends paid 11 – – (7,144) – (7,144) – (7,144)
Disposal of a subsidiary 29 – – – – – (140) (140)
Balance as at 31 December 2012 16,709 1,578 72,511 108 90,906 – 90,906
* Explanatory notes on Other reserves are presented in Note 12.
Thenotesonpages51to105areanintegralpartoftheseconsolidatedfinancialstatements..

50 Annual Report 2012
Consolidated cash flow statement for the year ended 31 December 2012 (CZK million)
Note 2012 2011
Cash and cash equivalents as at 1 January 16 31,251 35,986
Profit before income tax 17,934 19,275
Depreciation and impairment of non-current assets 5, 6 11,932 12,746
Change in provisions (910) 3,875
Gain on disposal of non-current assets (10) (11)
Net interest (income) / expense 20 251 53
Change in inventories (3,747) (1,937)
Change in receivables 1,623 (3,701)
Change in liabilities 1,219 2,355
Income tax paid from operating activities (4,068) (3,561)
Interest paid (614) (531)
Interest received 694 652
Share on (profit) / loss of associates (1,272) (227)
Income from other investments 20 (84) (125)
Unrealised (gains) and losses from derivatives and other adjustments for non-cash transactions 715 (612)
(Gain) / loss on disposal of a subsidiary 29 (220) –
Cash flows from operating activities 23,443 28,251
Purchases of non-current assets (18,921) (13,558)
Additions to capitalised development costs 5 (6,104) (3,306)
(Increase) / decrease in short-term deposits* 8 21,533 (11,500)
Increase in long-term deposits 8 (3,033) –
Proceeds from sale of non-current assets 44 14
Proceeds from other investments 84 125
Net cash inflow / (outflow) on disposal of a subsidiary 29 (635) –
Cash flows from investing activities (7,032) (28,225)
Net cash flows (operating and investing activities) 16,411 26
Dividends paid (7,144) (4,767)
Loans received 13 – 33
Repayments of loans received (33) (120)
Cash flows from financing activities (7,177) (4,854)
Net change in cash and cash equivalents 9,234 (4,828)
Exchange gains / (losses) on cash and cash equivalents (18) 93
Cash and cash equivalents as at 31 December 16 40,467 31,251
* Deposits which do not meet criteria of cash equivalents according to IAS 7.
Thenotesonpages51to105areanintegralpartoftheseconsolidatedfinancialstatements..
Consolidated financial statements for the year ended 31 December 2012

51Annual Report 2012
Notes to the consolidated financial statements 2012
Notes to the consolidated financial statements 2012
Company informationFoundation and company enterprises
ŠKODAAUTOa.s.(“theCompany”)wasincorporatedasajoint-stockcompanyon20November1990.TheCompany’sprincipalbusinessactivitiesarethedevelopment,productionandsaleofvehiclesandrelatedaccessories.Registeredoffice: Tř.VáclavaKlementa869
29360MladáBoleslav CzechRepublic IČ:00177041 wwwaddress:www.skoda-auto.cz
The Company is registered in the Commercial Registermaintainedwith theMunicipal Court in Prague, SectionB,Insert332,withFileNo.Rg.B332.TheorganisationalstructureoftheCompanyisdividedintothefollowingmainareas:– Centralmanagementdepartment– Technicaldevelopment– Productionandlogistics– Salesandmarketing– Commercialaffairs– Humanresourcemanagement– PurchasingTheCompanyhasitsmainproductionplantinMladáBoleslavandtwootherproductionplantsinVrchlabíandKvasiny.ŠKODAAUTOa.s. is a subsidiaryofVolkswagen International FinanceN.V. included in the consolidationgroupof itsultimateparent companyand itsultimate controllingparty,VOLKSWAGENAG (“VolkswagenGroup”),withitsregisteredofficeinWolfsburg,theFederalRepublicofGermany(fordetailsseeNote31).
NoteThefinancialstatementshavebeenprepared inCzechand inEnglish. Inallmattersof interpretationofinformation,viewsoropinions,theCzechversionofthesefinancialstatementstakesprecedenceovertheEnglishversion

Notes to the consolidated financial statements 2012
52 Annual Report 2012
1. Summary of significant accounting policies and principles1.1 Compliance statement
TheconsolidatedfinancialstatementsofŠKODAAUTOa.s.anditssubsidiaries(together“theGroup”)fortheyearended31December2012havebeenpreparedinaccordancewithInternationalFinancialReportingStandardsasadoptedbytheEuropeanUnion(“IFRS”)asat31December2012.Based on the Company’s sole shareholder’s decision and under the paragraph 23aArticle 2 of ActNo.563/1991Coll.onAccounting,theGrouppreparestheconsolidatedfinancialstatementsinaccordancewithIFRSasadoptedbytheEuropeanUnion.RefertotheCompanyinformationintheprecedingnote“Companyinformation”.
1.2 Adoption of new or revised standards, amendments and interpretations to existing standards*
1.2.1 New standards, amendments and interpretations to existing standards mandatory for accounting periods beginning on 1 January 2012
Newstandards,amendments,interpretationsandimprovementstoexistingstandardsmandatoryforac-countingperiodsbeginningonorafter1January2012,whichareappliedbytheGroup:
IFRS Standard/Interpretation Effective Description Effect
IFRS 7 Financial Instruments: Disclosures Transfers of Financial Assets
1 July 2011 The amendment enhances the disclosure requirements related to transactions including a transfer of financial assets.
The improvement had an impact on the extent of disclosures in respect of the credit risk. The Group has newly disclosed its continuing involvement relating to the derecognised factored receivables and the related maximum exposure to the credit risk in a separate subnote 3.1.6.
Therearenoothernewstandards,amendments,interpretationsandimprovementstoexistingstandardsthatareeffectiveforthefinancialyearbeginningonorafter1January2012whichhavematerialimpactontheconsolidatedfinancialstatementsoftheGroup.
* The effective dates express the dates effective for the Group.

Notes to the consolidated financial statements 2012
53Annual Report 2012
1.2.2 New standards, amendments and interpretations to existing standards published not yet effective for accounting periods beginning on or after 1 January 2012
Newstandards,amendmentsandinterpretationstoexistingstandards,whichwillberelevantfortheGroupbuthavenotbeenearlyadoptedbytheGroup:
IFRS Standard/Interpretation Effective Description Effect
IFRS 9 Financial instruments 1 January 2015* IFRS 9 replaces those parts of IAS 39 relating to the classification and measurement of financial assets and changes also some disclosure requirements as set out by IFRS 7. Per IFRS 9, all financial assets, currently within scope of IAS 39, are required to be classified into two measurement categories – those to be measured subsequently at amortised cost, and those to be measured subsequently at fair value.
The Group expects that the new IFRS 9 will have impact on classification, measurement and disclosure of financial instruments in the notes to the financial statements. However, without a detailed analysis it is not possible to perform reliable estimate of such impact as at the date of the financial statements. The Group does not expect early adoption of the standard, while the transition to IFRS 9 will probably take place after 1 January 2015. The disclosure of information in the area of financial instruments will be ruled by IFRS 7 §44S-44W.
IFRS 13 Fair value measurement 1 January 2013 Aim of the new standard is to reduce complexity, improve consistency and clarify approach to disclosure of items in the financial statements carried at fair value. The standard clearly defines fair value and gives instruction for its application in case the fair value measurement is required or allowed by another IFRS. A definition of the fair value and a single source of fair value measurement and disclosure requirement for use across IFRSs.
The Group expects that the new standard IFRS 13 will have impact on measurement of items carried at fair value through profit or loss. However, without a detailed analysis it is not possible to perform reliable estimate of such impacts at the date of the financial statements.
IAS 1 Presentation of Financial Statements/Disclosure of items presented in other comprehensive income
1 July 2012 The amendments deal with disclosure of items presented in other comprehensive income. The amendments newly require entities to separate items presented in other comprehensive income into two groups, based on whether or not they may be reclassified to profit or loss in the future. Information to the user will be provided what proportion of total comprehensive income will never be reclassified to profit or loss for the period.
The Group expects that the amendments to IAS 1 will have impact on the extent of the disclosure of information in the Statement of comprehensive income.
IAS 19 Employee benefits/Changes to the recognition and measurement of defined benefit pension expense and termination benefits
1 January 2013 Amendment to IAS 19 makes changes to the recognition and measurement of defined benefit pension expense and termination benefits. The standard requires recognition of all changes in the defined benefit liability and assets of the plans when they occur, introduces extended disclosures for information about defined benefit plans and adjust accounting for termination benefits and clarifies many issues including classification of employee benefits.
The Group expects that the amendment to IAS 19 will have impact mainly on presentation of benefits upon employment termination. However, without a detailed analysis it is not possible to perform reliable estimate of such impacts at the date of the financial statements.
* Not yet adopted by the European Union as at 31 December 2012 (the specified date relates to effective date as per IASB).

Notes to the consolidated financial statements 2012
54 Annual Report 2012
Thefollowingstandards,amendmentsandinterpretationstoexistingstandardswhichwillnotberelevantfortheGrouporarenotexpectedtohaveasignificantimpactontheGroup’soperations:
IFRS Standard/Interpretation Effective Description
IFRS 1 Government Loans 1 January 2013* The amendment deals with loans received from governments at a below market rate of interest, by first-time adopters of IFRSs giving them relief from full retrospective application of IFRSs.
IFRS 7 Financial Instruments: Disclosures/Offsetting Financial Assets and Financial Liabilities
1 January 2013 The amendment requires disclosures that will enable users of an entity's financial statements to evaluate the effect or potential effect of netting arrangements, including rights of set-off.
IFRS 10 Consolidated Financial Statements 1 January 2014 IFRS 10 Consolidated Financial Statements replaces previous IAS 27 and SIC-12. The new standard follows up the current principles to determine control, focuses on clarification of the definition of control, while the rules for status of control are substantially extended.
IFRS 11 Joint Arrangements 1 January 2014 IFRS 11 fully replaces IAS 31 and SIC-13. Substantial change introduced by the new standard is elimination of jointly controlled assets and elimination of proportionate consolidation.
IFRS 12 Disclosure of Interest in Other Entities
1 January 2014 IFRS 12 deals with all disclosure requirements in respect of interests held in other reporting entities and replaces the previous standard IAS 27. The scope of the standard includes interests in subsidiaries, associates, joint arrangements and unconsolidated structured entities (formerly "special purpose entities").
IAS 27 Separate Financial Statements 1 January 2014 This standard replaces previous standard IAS 27. Requirements for separate financial statements remained without changes. Other parts of IAS 27 were replaced by IFRS 10.
IAS 28 Investments in Associates and Joint Ventures
1 January 2014 The amendment of IAS 28 modified the standard so that changes resulting from issuance of standards IFRS 10, IFRS 11 and IFRS 12 are reflected.
IAS 32 Financial Instruments: Offsetting Financial Assets and Financial Liabilities
1 January 2014 The amendments to IAS 32 deals with offsetting financial assets and liabilities. It clarifies conditions under which the offsetting may be applied.
IFRIC 20 Stripping Costs in the Production Phase of a Surface Mine
1 January 2013 The new interpretation IFRIC 20 deals with presentation of stripping costs in the production phase of a surface mine, the initial measurement and subsequent measurement of the stripping activity asset.
IFRS 10, IFRS 11, IFRS 12
Consolidated Financial Statements, Joint Arrangements and Disclosure of Interest in Other Entities - Transition Guidance Amendments
1 January 2013* The amendments clarify the transition guidance in IFRS 10 Consolidated Financial Statements and define the first day of the adoption of IFRS 10. The amendments determine under which conditions an entity must restate its consolidated figures retrospectively when adopting IFRS 10. The amendments also provide additional transition relief in respect of requirements of IFRS 10, IFRS 11 Joint Arrangements, and IFRS 12 Disclosure of Interests in Other Entities.
IFRS 10, IFRS 12, IAS 27
Consolidated Financial Statements, Disclosure of Interest in Other Entities - Transition Guidance Amendments and Separate Financial Statements - Amendment
1 January 2014* The amendment introduced a definition of an investment entity. An investment entity is required to account for its subsidiaries at fair value through profit or loss, and to consolidate only those subsidiaries that provide services that are related to the entity's investment activities.
* Not yet adopted by the European Union as at 31 December 2012 (the specified date relates to effective date as per IASB).

Notes to the consolidated financial statements 2012
55Annual Report 2012
ImprovementstoInternationalFinancialReportingStandardsissuedin2009-2011,mandatoryforaccount-ingperiodsbeginningonorafter1January2013*:
IFRS Standard/Interpretation Effective Description
IFRS 1 First-time adoption of International Financial Reporting Standards/ Repeated Application
1 January 2013 The amendment clarifies conditions under which an entity may apply IFRS 1 when resuming preparing its financial statements under IFRS, including the requirement to disclose the reasons for the interruption and the resumption of preparation of financial statements under IFRS.
IFRS 1 First-time adoption of International Financial Reporting Standards/ Borrowing Costs
1 January 2013 The amendment defines the presentation of borrowing costs capitalised under previous GAAP prior to the date of transition to IFRS, and presentation of borrowing costs relating to qualifying assets already under construction or production incurred at the date of transition to IFRS and after.
IAS 1 Presentation of Financial Statements/ Clarification of requirements for additional comparative statements
1 January 2013 The amendment clarifies the requirements for presentation of additional comparative statements.
IAS 16 Property, Plant and Equipment/ Classification of servicing equipment
1 January 2013 The amendment points out that stand-by equipment and servicing equipment shall be classified as plant and equipment if they meet the definition of plant and equipment.
IAS 32 Financial Instruments: Presentation/ Tax Consequences of Distributions to Owners
1 January 2013 The amendment specifies that income tax consequences relating to distribution to holders of an equity instrument and relating to transaction costs should be accounted for in accordance with IAS 12 Income Taxes.
IAS 34 Interim Financial Reporting / Disclosure of a measure of total assets and liabilities for an operating segment
1 January 2013 The amendment provides guidance in which cases disclosure of a measure of total assets and liabilities for a particular reportable segment is required in the entity's interim financial statements.
* Not yet adopted by the European Union as at 31 December 2012 (the specified date relates to effective date as per IASB).

Notes to the consolidated financial statements 2012
56 Annual Report 2012
2. Basis of preparation of consolidated financial statementsTheseconsolidatedfinancialstatementshavebeenpreparedunderthehistoricalcostconvention,exceptforfairvaluemeasurementofavailable-for-salefinancialassets,offinancialassetsandfinancialliabilitiesatfairvaluethroughprofitorlossandofallderivativecontracts.ThepreparationoffinancialstatementsinconformitywithIFRSrequirestheuseofcertaincriticalaccount-ingestimates.ItalsorequiresmanagementtoexercisetheirjudgmentintheprocessofapplyingtheGroup’saccountingpolicies.Amountsintheconsolidatedfinancialstatementsandinthenotesaredisclosedinmil-lionsofCzechcrowns(CZKmillion),unlessstatedotherwise.
2.1 Details of the Group
InadditiontoŠKODAAUTOa.s.locatedinMladáBoleslav,theGroupincludeallsignificantsubsidiaries.Seethe“Companyinformation”noteonpage51fortheCompany’sdetails.Subsidiariesarethosecompaniesandotherentities(includingspecialpurposeentities)inwhichaparentcompany,directlyorindirectly,hasaninterestofmorethanonehalfofthevotingrightsorotherwisehaspowertogovernthefinancialandoperatingpoliciessoastoobtainbenefits.Theexistenceandeffectofpotentialvotingrightsthatarepresentlyexercisableorpresentlyconvertibleareconsideredwhenassess-ingwhethertheGroupcontrolsanotherentity.Thesecompanies(“subsidiaries”)arefullyconsolidatedfromthedateonwhichthecontrolistransferredtotheGroupandaredeconsolidatedfromthedatethatcontrolceases.On1January2012,theCompanysoldits51%shareinthesubsidiarySkodaAutoPolskaS.A.toparentcom-panyVolkswagenInternationalFinanceN.V.(seeNote11).Asaresult,theCompanyhaslosttheentireinter-estinthesubsidiarySkodaAutoPolskaS.A.MoredetailedinformationaboutthedisposalofthesubsidiaryisincludedinNote29.ThesignificantsubsidiariescontrolledbytheCompanyasat31December2012:– ŠKODAAUTODeutschlandGmbH(100%);– ŠKODAAUTOSlovensko,s.r.o.(100%);– SkodaAutoIndiaPrivateLtd.(100%).AssociatesareallentitiesoverwhichtheGrouphassignificantinfluencebutnotcontrol,generallyaccom-panyingashareholdingofbetween20%and50%ofthevotingrights.TheŠKODAAUTOa.shadsignificantinfluenceasat31December2012intheassociates(seeNote7):– OOOVOLKSWAGENGroupRus,– ŠKO-ENERGOFIN,s.r.o.
2.2 Consolidation principles
Thesubsidiariesareconsolidatedusingthefull-scopeconsolidationmethod.Assetsandliabilitiesofthesubsidiariesare recognised in theconsolidatedfinancialstatements inaccordancewith theuniformac-countingpoliciesusedwithintheGroup.TheacquisitionmethodofaccountingwasusedtoaccountfortheacquisitionofsubsidiariesbytheGroup.Identifiableassetsacquiredandliabilitiesandcontingentliabilitiesassumedinabusinesscombinationweremeasuredattheirfairvaluesattheacquisitiondate,irrespectiveoftheextentofanynon-controllinginter-est.TheGroupmeasurednon-controllinginterestthatrepresentedpresentownershipinterestandentitledtheholdertoaproportionateshareofnetassetsintheeventofliquidationonatransactionbytransactionbasisatthenon-controllinginterest’sproportionateshareofnetassetsoftheacquiree.Goodwillwasmeasuredbydeductingthenetassetsof theacquireefromtheaggregateof theconsid-erationtransferred,theamountofnon-controllinginterestintheacquireeandfairvalueofaninterestintheacquireeheldimmediatelybeforetheacquisitiondate.Anynegativeamount(“negativegoodwill”)wasrecognisedinprofitorloss,aftermanagementreassessedwhetheritidentifiedalltheassetsacquiredandallliabilitiesandcontingentliabilitiesassumed,andreviewedappropriatenessoftheirmeasurement.Theconsiderationtransferredfortheacquireewasmeasuredatthefairvalueoftheassetsgivenup,equityinstrumentsissuedandliabilitiesincurredorassumed.Intercompanytransactions,balancesandunrealisedgainsontransactionsbetweengroupcompaniesareeliminated;unrealisedlossesarealsoeliminatedunlessthecostcannotberecovered.

Notes to the consolidated financial statements 2012
57Annual Report 2012
Non-controllinginterestisthatpartofthenetresultsandoftheequityofasubsidiaryattributabletointer-estswhicharenotowned,directlyorindirectly,bytheCompany.Non-controllinginterestformsaseparatecomponentoftheGroup’sequity.Investmentsinassociatesareaccountedforusingtheequitymethodofaccounting,andwereinitiallyrec-ognisedatcost.Thecarryingamountofassociatesincludesgoodwillidentifiedonacquisitionlessaccumu-latedimpairmentlosses,ifany.TheGroup’sshareofpost-acquisitionprofitsorlossesofassociatesisrecordedintheconsolidatedprofitorlossfortheyearasshareofresultofassociatesanditsshareofothercomprehensiveincomeisrecognisedinconsolidatedothercomprehensive income.Allotherpost-acquisitionchanges intheGroup’sshareofthecarryingvalueofnetassetsofassociatesarerecognisedinprofitorlosswithintheshareofresultofassociates.However,whentheGroup’sshareoflossesinanassociateequalsorexceedsitsinterestintheassociate,includinganyotherunsecuredreceivables,theGroupdoesnotrecognisefurtherlosses,unlessithasincurredobligationsormadepaymentsonbehalfoftheassociate.UnrealisedgainsontransactionsbetweentheGroupanditsassociatesareeliminatedtotheextentoftheGroup’s interest in theassociates;unrealised lossesarealsoeliminatedunlessthetransactionprovidesevidenceofanimpairmentoftheassettransferred.TheaccountingpoliciesoftheassociatehavebeenchangedwherenecessarytoensureconsistencywiththepoliciesadoptedbytheGroup.
2.3 Foreign currency translation
2.3.1 Functional of the Company and presentation currency of the Group ItemsincludedinthefinancialstatementsofeachoftheGroup’sentitiesaremeasuredusingthecurrencyof theprimary economicenvironment inwhich theentity operates (‘the functional currency’). The con-solidatedfinancialstatementsarepresentedinCzechcrowns(CZK),whichistheCompany’sfunctionalandpresentationcurrency.Foreigncurrency transactionsof theCompanyare translated into the functional currencyusing theex-changeratespublishedbytheCzechNationalBankprevailingonthedatesofthetransactions.Foreignexchangegainsandlossesresultingfromthesettlementofsuchtransactionsandfromthetranslationofmonetaryassetsandliabilitiesdenominatedinforeigncurrenciesatyear-endexchangeratespublishedbytheCzechNationalBankarerecognisedintheincomestatement.
2.3.2 Foreign subsidiaries and associatesOnconsolidation,exchangedifferencesarisingfromthetranslationofthenetinvestmentinforeignopera-tions,andofborrowingsandothercurrencyinstrumentsdesignatedashedgesofsuchinvestments,aretakentoothercomprehensiveincome.Whenaforeignoperationisdisposedof,exchangedifferencesthatwererecordedinothercomprehensiveincomearerecognisedintheincomestatementaspartofthegainorlossonsale.Foreignsubsidiariesandassociatesaresubjecttolegalandaccountingregulationsintheirrespectivecoun-try.Therespectivelocalcurrencyistheirfunctionalcurrency.TheexchangeratespublishedbytheCzechNational Bankwere usedwhen incorporating their financial statements into the consolidated financialstatementsoftheGroup:– Assetsandliabilitiesforeachbalancesheetpresentedaretranslatedattheclosingrateasatthedateofthatbalancesheet;
– Incomeandexpenses foreach incomestatementare translatedatmonthlyaverageexchange rates,unlessthisaverageisnotareasonableapproximationofthecumulativeeffectoftheratesprevailingonthetransactiondates, inwhichcasethe incomeandexpensesaretranslatedonthedatesofthetransactions;
– Allresultingexchangedifferencesarerecognisedasaseparatecomponentofothercomprehensivein-come;
– Goodwillandfairvalueadjustmentsarisingfromtheacquisitionofaforeignentityaretreatedasassetsandliabilitiesoftheforeignentityandtranslatedattheclosingrate.

Notes to the consolidated financial statements 2012
58 Annual Report 2012
CZK/Currency 2012 2011
Balance sheet foreign exchange rates as at 31 December
Poland PLN 6.172 5.789
India INR 0.347 0.376
Slovakia, Germany EUR 25.140 25.800
Russia RUB 0.625 0.618
2.4 Intangible assets
Purchasedintangibleassetsarerecordedatcostlesscumulativeamortisationandimpairmentlosses.Allresearchcostsarerecognisedasexpenseswithintheincomestatementwhenincurred.InaccordancewithIAS38,alldevelopmentcostsofnewŠKODAmodelsandotherproductsarerecognisedasintangibleassetswhenitisprobablethattheprojectwillbeasuccessconsideringitscommercialandtechnicalfeasibility,andcostscanbemeasuredreliably.Capitaliseddevelopmentcostsandotherinternallygeneratedintangibleas-setsarecarriedatcostlessaccumulatedamortisationandimpairmentlosses.Ifthecriteriaforrecognitionasanassetarenotmet,thecostsarerecognisedintheincomestatementintheyearinwhichtheyareincurred.Toolingrightsarecapitalisedasintangibleassets.Capitalisedcostsincludealldirectcostsaswellasanappropriateportionofdevelopment-relatedoverheads.Thecostofqualifyingintangibleassetsalsoincludesborrowingcostsrepresentedbyinterestandothercoststhatanentityincursinconnectionwithborrowingfunds.Aqualifyingassetisanassetthatnecessar-ilytakesatleastoneyeartogetreadyforitsintendeduse.TheGroupceasescapitalisingborrowingcostswhenthequalifyingassetisreadyforitsintendeduseorsale.Thedevelopmentcostsareamortisedusingthestraight-linemethodfromthestartofproductionovertheexpectedlifecycleofthemodelsorcomponents.Amortisationrecognisedduringtheyearisallocatedtotherelevantfunctionsintheincomestatement.Goodwill represents theexcessof theaggregateof the consideration transferred for theacquiree, theamountofnon-controlling interest intheacquireeandfairvalueofan interest intheacquireeheld im-mediatelybeforetheacquisitiondateover the fairvalueof thenetassetsof theacquiree.Goodwillonacquisitionsofsubsidiariesisincludedinintangibleassets.Goodwillisnotamortised,onlytestedannuallyforimpairmentandcarriedatcostlessaccumulatedimpairmentlosses.Intangibleassetsareamortisedapplyingthestraight-linemethodovertheirestimatedusefullivesasfol-lows:– Capitaliseddevelopmentcosts 2-12yearsaccordingtotheproductlifecycle– Software 3years– Toolingrights 8years– Otherintangiblefixedassets 3-5yearsEstimatedusefullivesanddepreciationmethodarereviewedattheendofeachaccountingperiod,theef-fectofanychangesinestimatesareaccountedforprospectively.Intangibleassetsnotyetavailableforusearetestedannuallyforpossibleimpairmentandarecarriedatcostlessaccumulatedimpairmentlosses.
2.5 Property, plant and equipment
Allproperty,plantandequipmentarestatedathistoricalcostlesscumulativedepreciationandimpairmentlosses.Historicalcostincludesexpenditurethatisdirectlyattributabletotheacquisitionoftheassets.Allrepairsandmaintenancecostsarechargedtotheincomestatementduringthereportingperiodinwhichtheyareincurred.Subsequentcostsareincludedintheasset’scarryingamountorrecognisedasaseparateasset,asappropriate,onlywhenitisprobablethatfutureeconomicbenefitsassociatedwiththeitemwillflowtotheGroupandthecostoftheitemcanbemeasuredreliably.

Notes to the consolidated financial statements 2012
59Annual Report 2012
Thecostofqualifyingtangibleassetsalsoincludesborrowingcostsrepresentedbyinterestandothercoststhatanentityincursinconnectionwithborrowingoffunds.Aqualifyingassetisanassetthatnecessarilytakesatleastoneyeartogetreadyforitsintendeduse.TheGroupceasescapitalisingofborrowingcostswhenthequalifyingassetisreadyforitsintendeduseorsale.Landisnotdepreciated.Depreciationofotherassetsiscalculatedusingthestraight-linemethodovertheirestimatedusefullivesasfollows:– Buildings 9-50years– Technicalequipmentandmachinery(incl.specialtooling) 2-18years– Otherequipment,operatingandofficeequipment 3-25yearsEstimatedusefullivesanddepreciationmethodarereviewedattheendofeachaccountingperiod,theef-fectofanychangesinestimatesareaccountedforprospectively.
2.6 Impairment of assets
Assetsthataresubjecttoamortisationanddepreciationarereviewedforimpairmentwhenevereventsorchangesincircumstancesindicatethatthecarryingamountmaynotberecoverable.Animpairmentlossisrecognisedintheamountbywhichtheasset’scarryingamountexceedsitsrecoverableamount.Therecov-erableamountisthehigherofanasset’sfairvaluelesscoststosellandvalueinuse.For thepurposesofassessing impairment,assetsaregroupedat the lowest levels forwhich thereareseparatelyidentifiablecashinflows(cash-generatingunits).
2.7 Financial instruments
2.7.1 Financial assetsTheGroupclassifiesitsfinancialassetsinthefollowingcategories:financialassetsatfairvaluethroughprofitorloss;loansandreceivables;andavailable-for-salefinancialassets.Theclassificationdependsonthepurposeforwhichthefinancialassetswereacquired.ManagementoftheGroupdeterminestheclas-sificationofitsfinancialassetsatinitialrecognition.Purchasesandsalesoffinancialassetsarerecognisedontradedate–thedateonwhichtheGroupcom-mitstopurchaseorselltheasset.Financialassets,withtheexceptionoffinancialassetscarriedatfairvaluethroughprofitorloss,areinitiallyrecognisedatfairvalueplustransactioncosts.Financialassetscarriedatfairvaluethroughprofitorlossareinitiallyrecognisedatfairvalue,andtransactioncostsareexpensedintheincomestatement.Available-for-salefinancialassetsandfinancialassetsatfairvaluethroughprofitorlossaresubsequentlycarriedatfairvalue.Equityinstrumentsthatdonothavequotedpricesinanactivemarketandtheirfairvaluecannotbereliablymeasuredarevaluedatcostnetofimpairment,ifany.Long-termloansandreceiva-blesarecarriedatamortisedcostusingtheeffectiveinterestmethod.TheGroupdeterminesateachbalancesheetdatewhetherthereisobjectiveevidencethatafinancialassetoragroupoffinancialassetswhicharenotcarriedatfairvaluethroughprofitorlossisimpaired.InitiallytheGroupdetermines,inlinewithIAS39,ifobjectiveevidenceexiststhatindividuallymaterialfinancialassetsareimpairedandperformsthesameassessmentindividuallyorcollectivelyforindividuallyimmaterialfinan-cialassets.IntheeventthattheGroupdoesnotfindobjectiveevidenceofimpairmentforindividuallyas-sessedfinancialassets,whethermaterialornot,theseassetsareincludedinthegroupoffinancialassetswithcommoncreditriskcharacteristicsandthegroupoffinancialassetsisassessedcollectivelyforimpair-ment.Individualassetsforwhichobjectiveevidenceofimpairmenthasbeenidentifiedarenotincludedinagroupofassetsthatareassessedcollectivelyforimpairment.Inthecaseofequitysecuritiesclassifiedasavailable-for-salefinancialassets,asignificantorprolongedde-clineinthefairvalueofthesecuritybelowitscostisconsideredasanindicatorthatthesecurityisimpaired.TradereceivablesareconsideredtobeimpairedifobjectiveevidenceexistsatthebalancesheetdatethattheGroupwillnotbeabletocollectalloutstandingbalancesinaccordancewithinitiallyagreedconditions.Significantfinancialdifficulties,theprobabilitythatthedebtorwillenterbankruptcyorfinancialreorgani-sation,anddefaultordelaysinpaymentofliabilitiesareconsideredindicatorsthattradereceivablesareimpaired.Fortradereceivables,theallowanceisquantifiedonthebasisofdetailedinformationaboutthefi-nancialsituationofthecustomerandpaymenthistory.Whenthereceivableisassessedasuncollectible,anallowanceequalto100%ofthereceivablebalanceiscreated.Forotherreceivables,theallowanceisquanti-

Notes to the consolidated financial statements 2012
60 Annual Report 2012
fiedonthebasisofdetailedinformationaboutthefinancialsituationofthecustomerandpaymenthistory.Thevalueoftheallowanceisthedifferencebetweentheasset’scarryingamountandthepresentvalueofestimatedfuturecashflows,discountedattheoriginaleffectiveinterestrateofthereceivable.Thecrea-tionoftheallowanceisrecognisedintheincomestatementwithinOtheroperatingexpenses.Whenthereceivablecannotbecollectedthroughlegalaction(i.e.thereceivableshavelapsed;insufficientassetsduetobankruptcyofthedebtor;debtorwasliquidatedwithoutalegalsuccessor,etc.),itiswrittenoffthroughprofitorlossandtheallowanceisutilised.FinancialassetsarederecognisedwhentherightstoreceivecashflowsfromtheinvestmentshaveexpiredorhavebeentransferredandtheGrouphastransferredsubstantiallyallrisksandrewardsofownership.
a) Financial assets at fair value through profit or lossFinancialassetsatfairvaluethroughprofitorlossarefinancialassetsheldfortradingorsodesignatedbymanagementoftheGroup.Derivativesarealsocategorisedasheldfortradingunlesstheyaredesignatedashedginginstruments.Realisedandunrealisedgainsandlossesfromchangesinthefairvalueoffinancialassetsvaluedatfairvaluethroughprofitorlossarerecognisedunderfinancialincomeorexpensesintheperiodinwhichtheyarise.Duringtheaccountingperiods2012and2011,theGrouponlyhadfinancialderiva-tiveswithinthiscategory(Note2.7.3).
b) Loans and receivablesLoansand receivablesarenon-derivativefinancialassetswithfixedordeterminablepayments thatarenotquotedinanactivemarket.TheyarisewhentheGroupprovidesmoney,goodsorservicesdirectlytoadebtorwithnointentionoftradingthereceivable.Theyareincludedincurrentassets,exceptformaturi-tiesgreaterthan12monthsafterthebalancesheetdate.Theseareclassifiedasnon-currentassets.Loansandreceivablesareclassifiedastradereceivables,orotherreceivablesandfinancialassetsinthebalancesheet(Note8).
c) Available-for-sale financial assetsAvailable-for-salefinancialassetsarenon-derivatives thatareeitherdesignated in this categoryornotclassifiedinanyoftheothercategories.Theyareincludedinnon-currentassetsunlessmanagementin-tends todisposeof the investmentwithin 12monthsof thebalancesheetdate.Dividend income fromtheseactivitiesisincludedinfinancialincome.Whensecuritiesclassifiedasavailable-for-salearesoldorimpaired,theaccumulatedfairvalueadjustmentsareincludedintheincomestatementasfinancialincomeorexpenses.Intheaccountingperiod2012(2011),theGrouponlyhad,withinthecategoryofavailable-for-salefinancialassetsinvestmentstoequityinstrumentsthatdidnothaveaquotedpriceinanactivemarket.
2.7.2 Financial liabilities a) Financial liabilities measured at fair value through profit or lossFinancialliabilitiesatfairvaluethroughprofitorlossarefinancialliabilitiesheldfortradingorsodesignatedbymanagement.Derivativesarealsocategorisedasheldfortradingunlesstheyaredesignatedashedginginstruments.Realisedandunrealisedgainsandlossesfromchangesinthefairvalueoffinancialliabilitiesvaluedatfairvaluethroughprofitorlossarerecognisedunderfinancialincomeorexpensesintheperiodinwhichtheyarise.Duringtheaccountingperiod2012(2011),theGrouponlyhadfinancialderivativesinthiscategory(Note2.7.3).
b) Financial liabilities measured at amortised costFinancial liabilitiesaremeasuredat fair valuenetof transactioncostsat initial recognition.Subsequentmeasurementisatamortisedcostbyapplyingtheeffectiveinterestratemethod.
2.7.3 Financial derivativesTheGroupusesderivatives tohedge currencyandprice risks.Derivativesare initially recognisedat fairvalueonthedateaderivativecontractisenteredintoandaresubsequentlyre-measuredattheirfairvalue.Themethodofrecognisingtheresultinggainorlossdependsonwhetherthederivativeisdesignatedasahedginginstrumentor instrumentheldfortrading.TheGroupdesignatesashedginginstrumentsonlythosewhichfulfiltherequirementsofhedgeaccounting.

Notes to the consolidated financial statements 2012
61Annual Report 2012
TheGroupusesderivativestohedgefuturecashflows.Thehedgeditemsareasfollows:– Highlyprobablefuturetransactions.TheGroup ishedgingagainstchanges incashflowsfromhighlyprobablefuturetransactionscausedbychangesinforeignexchangespotratesandotherpricechanges(arisingespeciallyfromthecombinationofcommodityandcurrencyrisk).Thechanges in thespotcomponentofcurrencyfinancialderivativesthatqualifyaseffectivecash-flowhedging instrumentsarerecognisedinothercomprehensive income.Thechanges intheforwardpointscomponentofcurrencyfinancialderivatives thatqualifyaseffectivecash-flowhedging instrumentsarerecognisedasagainorlossintheincomestatement.The changes in fair valueof commodity swaps thatqualify aseffective cash-flowhedging instrumentsarerecognisedinothercomprehensiveincome.Thechangesinfairvalueofcommodityswapsthatdonotqualifyaseffectivecash-flowhedginginstrumentsarerecognisedintheincomestatementandclassifiedasagainorloss.Thecumulativebalancesrecognisedinothercomprehensiveincomearerecycledintotheincomestate-mentasagainorlossintheperiodswhenthehedgeditemaffectstheincomestatement.Ifthetimingofthehedgedcashflowisdeferred,incompliancewithitshedgingstrategytheGroupprolongsthematurityoftheoriginalhedginginstrument.Insuchcasethespotcomponentoftheoriginalderivativecontractisheldinequityuntilthehedgeditemaffectstheincomestatement.Atthismoment,thebalanceofthespotcomponent isrecycledfromothercomprehensive incometotheincomestatementandrecognisedasagainorloss.Whenahedginginstrumentexpiresorissold,orwhenahedgenolongermeetsthecriteriaforhedgeac-counting,anycumulativegainorlosspreviouslyrecognisedinothercomprehensiveincomefromtheeffec-tivepartofthehedginginstrumentatthattimeremainsinothercomprehensiveincomeandisreclassifiedtotheincomestatementwhentheforecasttransactionisultimatelyrecognisedintheincomestatement.Whenaforecasttransactionisnolongerexpectedtooccur,thecumulativegainorlossthatwasreportedinothercomprehensiveincomeisimmediatelytransferredtotheincomestatement.Thefairvalueoffinancialinstrumentsthatarenottradedinanactivemarketisdeterminedbyusingvalu-ationtechniques,suchasnetpresentvalueoffuturecashflows.Thefairvalueofcurrencyforwardsandswapsisdeterminedasthepresentvalueoffuturecashflowsbasedonforwardexchangemarketratesasatthebalancesheetdate.ThefairvalueofcommodityswapsiscalculatedasthepresentvalueoffuturecashflowsbasedontheratesofLME(LondonMetalExchange).
2.8 Current and deferred income tax
Theincometaxexpenseconsistsofcurrentincometaxanddeferredincometax.Thetaxexpenseisrec-ognisedintheincomestatementwiththeexceptionofcaseswhenitrelatestoitemsrecognisedinothercomprehensiveincomeordirectlyinequity.Insuchcasesthecurrentincometaxanddeferredincometaxarerecognisedinothercomprehensiveincomeordirectlyinequity.
2.8.1 Current income taxCurrenttaxliabilities(receivables)forthecurrentperiodandprecedingperiodsarerecognisedintheamountofexpectedpaymentstoorclaimsfromtaxoffices,usingthetaxrates(andtaxlaws)validintherespectiveperiod.Currentincometaxrelatingtothecurrentaccountingperiodandtoprecedingperiodsreducedbytheamountalreadypaidisrecordedasaliability.Iftheamountalreadypaidinthecurrentandinprecedingperiodsexceedscurrentincometaxrelatedtotheseperiods,thedifferenceisrecordedasanasset.Thesituations,inwhichtheexpectedamountofpaymenttothetaxauthorities(orexpectedreceiptfromthem)isbasedontheinterpretationoftaxlaws,areregularlyreassessedandtheexpectedpaymentstotaxauthorities(orexpectedreceiptfromthem)areadjustedaccordinglytoreflectthebestestimateoftheamounttobepaidtotaxauthorities(ortobereceivedfromthem)basedonlegislationenactedorsubstan-tivelyenactedbythebalancesheetdate.

Notes to the consolidated financial statements 2012
62 Annual Report 2012
2.8.2 Deferred income taxDeferred incometax isdeterminedusingthebalance-sheet liabilitymethod,basedontemporarydiffer-encesarisingbetweenthetaxbasesofassetsandliabilitiesandtheircarryingamountsintheconsolidatedfinancialstatements.However,ifthedeferredincometaxarisesfrominitialrecognitionofanassetorli-abilityinatransactionotherthanabusinesscombinationthatatthetimeofthetransactionaffectsneitheraccountingnortaxableprofitorloss,itisnotaccountedfor.Deferredincometaxisdeterminedusingtaxratesandtaxlaws,thathavebeenenactedbythebalancesheetdateandareexpectedtoapplywhentherelateddeferredincometaxassetisrealisedorthedeferredincometaxliabilityissettled.Deferredincometaxassetsarerecognisedtotheextentthatitisprobablethatfuturetaxableprofitwillbeavailableagainstwhichthetemporarydifferencescanbeutilised.InaccordancewithIAS12,deferredtaxassetsandliabilitiesareoffsetifthedeferredtaxassetsandliabili-tiesrelatetoincometaxisleviedbythesametaxationauthority,andwherethecompaniesoftheGrouphavetheenforceablerighttooffsetthecurrenttaxassetsandliabilities.Deferredtaxrelatingtoitemsrecognisedinothercomprehensiveincome(forexampletheeffectiveportionofchangesinthefairvalueoffinancialderivativesthataredesignatedandqualifyascashflowhedges)isrecogniseddirectlyinothercomprehensiveincome.TheGrouprecognisesdeferredincometaxassetsrelatingtounusedtaxcreditsfrominvestmentincentivesagainstdeferredtaxincomeintheincomestatementtotheextentthatitisprobablethatfuturetaxableprofitswillbeavailableagainstwhichtheunusedtaxcreditscanbeutilised.
2.9 Inventories
Purchasedinventories(rawmaterials,consumables,suppliesandmaterialsusedinproduction,goods)arestatedatthe lowerofcostandnetrealisablevalue.Costs includepurchasecostsandotheracquisitioncosts(e.g.transportandpackaging).Inventoriesgeneratedfromownproduction,i.e.workinprogressandfinishedgoods,arestatedatlowerofownproductioncostsornetrealisablevalue.Ownproductioncostsincludedirectmaterial,directwagesandproductionoverheads.Theadministrationoverheadexpensesarenotincludedinthevaluationofworkinprogressandfinishedgoods.Netrealisablevalueistheestimatedsellingpriceintheordinarycourseofbusiness,lessestimatedcostsofcompletionlessapplicablevariablesellingexpenses.Netrealisablevaluereflectsallrisksofobsoleteandredundantrawmaterialsandexcessiveoriginalparts.Aweighted-averagecalculationisusedtoaccountfortheconsumptionofmaterials.
2.10 Provisions for long-term employee benefits
Thefollowingtypesoflong-termemployeebenefitsareincludedintheprovisionforlong-termemployeebenefits:– servicejubilee;– otherlong-servicebenefits.Theentitlementtothesebenefitsisusuallyconditionalontheemployeeremaininginserviceforacertainserviceperiod,oruptothemomentofacertainworkanniversaryoftheemployee.Theamountofprovisioncorrespondswiththepresentvalueofthe long-termemployeebenefits,forpastserviceatthebalancesheetdatedeterminedusingtheprojectedunitcreditmethod.Theseobligationsarevaluedannuallybyindependentqualifiedactuaries.Actuarialgainsandlossesarisingfromchangesinactuarialassumptionsandexperienceadjustmentsarechargedorcreditedtotheincomestatement.Thepresentvalueoflong-termemployeebenefitsisdeterminedbydiscountingtheestimatedfuturecashoutflowsarisingfromtheirsettlementusinginterestratesequallingmarketyieldoftreasurybondsbecausethere isnodeepmarketofhigh-qualitycorporatebondsdenominated inCZK.Thetermandcurrencyofthesecorporateortreasurybondsareconsistentwiththecurrencyandtermoftherespectiveotherlong-termemployeebenefits.

Notes to the consolidated financial statements 2012
63Annual Report 2012
2.11 Other provisions
InaccordancewithIAS37,provisionsarerecognisedwhereapresentobligationexiststothirdpartiesasaresultofapastevent;whereafutureoutflowofresourcesisprobable;andwhereareliableestimateofthatoutflowcanbemade.Futureoutflowsareestimatedwithrespecttoparticularspecificrisks.Provisionsnotresultinginanoutflowofresourceswithinoneyeararerecognisedattheirsettlementvaluediscountedtothebalancesheetdate.Discountingisbasedoncurrentmarketinterestrates.Wherethereareanumberofsimilarobligations,thelikelihoodthatanoutflowoccursuponthesettlementisdeterminedbyconsideringtheclassofobligationsasawhole.Aprovisionisrecognisedevenifthelikeli-hoodofanoutflowwithrespecttoanyoneitemincludedinthesameclassofobligationsmaybesmall.
2.12 Revenue and expense recognition
Revenuecomprisesthefairvalueofconsiderationreceivedorreceivableforthegoodssoldandservicesprovided,netofvalue-addedtax,rebatesanddiscountsandaftereliminationofsaleswithintheGroup.Salesofgoodsarerecognisedonlywhenthegoodshavebeendelivered,thatis,whenthesignificantrisksandrewardshavepassedtothecustomer,thesalespriceisagreedordeterminableandreceiptofpaymentisprobable.ThiscorrespondsgenerallytothedatewhentheproductsareprovidedtodealersoutsidetheGroup,ortothedeliverydateinthecaseofdirectsalestoconsumers.Revenuesfromone-offlicencesarerecognisedonlywhentheintellectualrightsaretransferredorwhenpartialdeliveryhasbeencompletedincompliancewithrelevantcontractualprovisions(e.g.deliveryoftech-nicaldocumentation,technicalsupport,etc.).Revenuesfromper-piecelicencesarerecognisedbasedonthenumberofcarsproducedinthecurrentaccountingperiod.Dividendincomeisgenerallyrecognisedonthedateatwhichthedividendislegallyapprovedandwhenthepaymentisprobable.Costsofsales includeproductioncosts, costsofgoodspurchased for resale,andadditions towarrantyprovisions.Researchanddevelopmentcostsnoteligibleforcapitalisationintheperiod,depreciationandimpairmentchargesforcapitaliseddevelopmentcostsandproductionequipmentarelikewisepresentedascostofsales.Distributionexpensesincludepersonnelandmaterialcosts,anddepreciationandamortisationapplicabletothedistributionfunction,aswellasthecostsofshipping,advertising,salespromotion,marketresearchandcustomerservice.Administrativeexpensesincludepersonnelcostsandoverheadsaswellasdepreciationandamortisationapplicabletoadministrativefunctions.
2.13 Leases
Leasesinwhichasignificantportionoftherisksandrewardsofownershipareretainedbythelessorareclassifiedasoperatingleases.Paymentsmadeunderoperatingleasesarechargedtotheincomestate-mentonastraight-linebasisovertheperiodofthelease.
2.14 Investment incentives and subsidies
Subsidiesofentrepreneurialactivitiesandofemployeetrainingandretrainingcostsarerecognisedasin-comeovertheperiodsnecessarytomatchthemwiththerelatedcostswhichtheyareintendedtocom-pensate,onasystematicbasis.Governmentgrants,includingnon-monetarygrantsrelatedtothepurchaseof tangibleand intangibleassets,are recognisedat fair valueas reduction in thevalueof tangibleandintangibleassets.
2.15 Related parties
Arelatedpartyisapersonthathascontrolorjointcontroloverthereportingentity;hassignificantinfluenceoverthereportingentity;orismemberofthekeymanagementpersonnelofthereportingentityorofaparentofthereportingentity.ArelatedpartyisalsoanentitywhichisamemberofthesamegroupasthereportingentityandotherentitiesasdefinedbyIAS24article9par.b.

Notes to the consolidated financial statements 2012
64 Annual Report 2012
2.16 Share capital
Thesubstanceofafinancial instrument,ratherthan its legalform,governs itsclassification intheGroup´sstatementoffinancialposition.Ordinarysharesareclassifiedassharecapital.TheGrouptypicallyincursvariouscostsinissuingoracquiringitsownequityinstruments.Thosecostsmightincluderegistrationandotherregu-latoryfees,amountspaidtolegal,accountingandotherprofessionaladvisers,printingcostsandstampduties.Thetransactioncostsofanequitytransactionareaccountedforasadeductionfromequity (netofanyrelated income tax benefit) to the extent they are incremental costs directly attributable to the equitytransactionthatotherwisewouldhavebeenavoided.Thecostsofanequitytransactionthatisabandonedarerecognisedasanexpense.Sharepremiumisrepresentedbythedifferencebetweenthenominalvalueofsharesissuedonsharecapi-talincreaseandthemarketpriceofsharesandisrecognisedwithinequity.
2.17 Critical accounting estimates and assumptions
TheGroupmakesestimatesandassumptionsconcerningthefuture.Theresultingaccountingestimateswill,bydefinition,seldomequaltherelatedactualresults.Theestimatesandassumptionsarecontinuouslyassessedbymanagement.Theestimatesandassumptionsarebasedonhistoricalexperienceandotherfactors,includingtherealisticassessmentoffuturedevelopments.Estimatesandassumptionsthathaveasignificantriskofcausingamaterialadjustmenttothecarryingamountsofassetsandliabilitieswithinthenextfinancialyeararediscussedbelow.
Capitalisation of development costsTheGroupcontinuouslyinvestsinresearchanddevelopmentofnewproducts,whichareeitherdevelopedinternallywithintheCompany’sresearchanddevelopmentcentreorwithintheVolkswagenGroup.Incom-pliancewithIAS38,foreachdevelopmentprojecttheGroupperformsanassessmentwhethertheprojectmeetsthedevelopmentcosts recognitioncriteria,especially theprobabilitythattheassetwillgeneratefutureeconomicbenefits.TheGroup’sassessmentisbasedonassumptionsandestimatesforthenextfiveandmoreyearswithrespecttotheproductsfuturesales,developmentoftheindividualmarketsandauto-motiveindustryitself.AlthoughtheGroup’sanalysesarebasedonthebestcurrentlyavailableinformation,theriskoffuturechangesanduncertaintywithrespecttofuturedevelopmentoftheassumptionsappliedremainsignificant.PleaserefertoNote5foradditionalinformationincludingtherespectiveamounts.
Impairment of non-current assetsInthecourseoftheproductlifecycleandinexceptionalsituationsalsobeforeitscommencement,theremaybecircumstanceswhichindicatethat“cashgeneratingunits”(tangibleandintangibleassetsemployedforproduc-tionofvehiclesofacertainmodel)mighthavesufferedimpairment.Todetermineanypossibleimpairment,theGroupestimatesvalueinuseofthecashgeneratingunitswhichiscalculatedasdiscountedexpectedfuturecashflowsassociatedwiththeemploymentofthecashgeneratingunits.Fordeterminationoftheestimatedfuturecashflows,theGroupappliesestimatesandassumptionsregardingfuturesalesofaparticularproduct,economicdevelopmentoftheindividualmarketsanddevelopmentoftheautomotiveindustryduringthenextfiveandmoreyears.AlthoughtheGroupestimatesthevalueinuseofthecashgeneratingunitsbasedonthebestinformationanddatacurrentlyavailabletotheGroup,theriskoffuturechangesanduncertaintywithre-specttothefuturedevelopmentoftheappliedassumptionsinthefollowingyearsremainssignificant.Morede-tailedinformationaboutimpairmentlossesisincludedinNote5andNote6inthesectionImpairmentreviews.
Provision for warranty claims TheGrouprecognisesprovisionsforwarrantyclaimsforfutureexpensesconnectedwiththebasicguarantee(2years),withtheguaranteeforcorrosion(dependentonthemodelfor10or12years)andotherguaranteesbeyondthescopeofbasicguarantee,especiallygood-willrepairs(the3rdandthe4thyear).TheGrouprecog-nisestheprovisionsforwarrantyclaimsatthemomentofsaleonthebasisofthenumberofsoldcarsandinadvancedeterminedratesforindividualmodellines.Theamountoftherateforthebasicguaranteeisdeterminedonthebasisofamanagementestimateoftheaveragenumberoffailuresintheguaranteeperiodandaveragesinglefailurecostswithregardtothespecificsofindividualcountriesandonthebasisofotherspecificassumptions(inflation,customersgroups

Notes to the consolidated financial statements 2012
65Annual Report 2012
development,etc.).Theamountoftheprovisionforcorrosionisdeterminedthroughamathematicalmodelwhichextrapolatesthecurveoffuturecostsdevelopmentfortherelevantperiodonthebasisofweightedaverageofactualcostsfrompreviouscalendaryearsofthemodelproduction.Theamountoftheprovisionforgood-willrepairsisdeterminedonthebasisofamanagementestimateofexistinggood-willrepaircostsanddefinedstrategyofthegood-willrepairtrademarkpolicywithregardtospecificsofindividualcountries.Theestimatesoftheratesarecontinuouslyrevisedwiththeuseofthemostrecenthistoricaldataaboutthenumberoffailuresandtheirrepaircosts.Changesintheseestimatescansignificantlyinfluencetheto-talamountoftheprovision.Thedetailedanalysisoftheprovisionaccordingtothesingletypes,productionyears,guaranteetypesandthesalesregionsispreparedattheyearend.MoredetailedinformationabouttheprovisionforwarrantyclaimsisincludedinNote15.
Provision for litigation risksCertaineventsrelatingtotheeconomicactivitiesoftheGroupmightresultindisputesresolvedincourtandout-of-courtproceedings.Theriskthatfuturecashoutflowswillberequiredtosettletheclaim(damages,courtfees,etc.)isassessedbytheGrouponceitbecomesinvolvedinanycourtorout-of-courtproceed-ings.TheriskisassessedbasedontheGroup’sexperiencewithsimilarlegalactions,reflectingthelatestdevelopmentsintheproceedings.Aprovisionisrecognisedifitismorelikelythannotthatanoutflowofeconomicbenefitswilloccurinthefuture.Theprovisionismeasuredbasedonthebestestimateoftheexpectedfuturecashoutflows.PleaserefertoNote15foradditionalinformation.
Useful livesTheestimateduseful livesof individual tangibleand intangibleassetsorclassesofassetsaredeterminedbasedontheGroup’sexperiencewithsimilarassetsandinaccordancewiththeexpectedfutureeconomicben-efitsoftheassets,takingintoaccountalsochangesinproductionplanandexpectedutilisationoftheseassets.
3. Financial risk management TheGroupoperatesintheautomotiveindustry,sellsitsproductsinmanycountriesaroundtheworldandperformstransactionsconnectedwithavarietyoffinancialrisks.TheobjectiveoftheGroupistominimisetheserisksthroughapplicationofaflexiblehedgingstrategywithutilisationofvariousinstruments.ThestructureofriskmanagementintheCompanyisbasedontheunifiedprincipleofriskmanagementappliedintheVolkswagenGroup.TheVolkswagenGroup’sriskmanagementprinciplesareincompliancewiththerequirementsoftheGermanActonControlandTransparencyinEnterprises(KonTraG).Incompliancewith theVolkswagenGrouppolicyallhedgingoperationsareagreedand implemented incooperationwiththeTreasurydepartmentoftheVolkswagenGroup.ManagementoftheCompanyisregularlyinformedofcurrentfinancialandotherrelatedrisks(liquidity,foreignexchangerates,interestrates,invoicecurrencies,paymentconditions,taxesetc.),whichisachievedthroughregular“liquiditymeeting”attendedbyrepresentativesfromTreasury,ControllingandAccounting,Volkswa-genGroupTreasury,representativesofsubsidiariesandmanagementoftheCommercialaffairsdepartment.Thesemeetingshaveapredefinedagenda,which includesalso informationon themainmacroeconomicindicatorsfromallimportantcountries,inwhichtheCompanysellsitsproducts.Meetingshaveaformalisedstructureandallminutesincludingthedecisionsarerecordedandtheirfulfilmentisperiodicallyreviewed.
3.1 Credit risk
Creditriskisariskthatonepartytoafinancialinstrumentwillcauseafinanciallosstootherpartybyfailingtodischargeanobligation.CreditriskarisesinthenormalcourseoftheGroup’soperations,aswellasthroughactivitiesconnectedwithfinancialmarkettransactions(moneymarket,currencyconversion,derivativestransactions,etc.).CreditriskarisingfromoperationsonthefinancialmarketismanagedbytheGroupTreasurythroughdetermina-tionofmaximallimitsforindividualcounterparties.Thequantificationofcreditrisksisbasedonseveraldifferentprimarycriteria,ofwhichthemostsignificantarethecountryriskandthecounterpartyrisk.Inassessingtheserisks,attentionispaidtothecountryinwhichtheheadquartersofthecounterpartiesaresituated.

Notes to the consolidated financial statements 2012
66 Annual Report 2012
Thecreditratingofthesecountriesismonitoredcloselyandattentionisfocusedontheanalysisofmacro-economicindices.ApartfromtheVolkswagenGroup’sRiskManagementDepartment,theGroupalsousestheservicesofexternalagencies(D&B,Creditreform,Reuters,etc.).Theacceptanceofnewbusinesspartnersisreliantonstandardapprovalprocedures.TheGroup’sinvolve-mentwithcounterpartiesismanagedbymeansofcreditlimitsthataremonitoredandre-evaluatedonaregularbasis.Adheringtotheselimitsismonitoredandevaluatedonaregularbasis.Activeadministrationandmanagementofreceivablesisincorporatedintothecreditriskmanagementpro-cess. In respectof the trade receivablessecuritystrategy, trade receivablesaredivided into receivablesfromdomesticcustomers,foreigncustomersandVolkswagenGroupentities.Receivablesaresecuredbypreventativeandsupplementalinstruments.Receivablessecuredbypreventativesecurityinstrumentsareusedmainlywhenthecustomercontractsareconcluded.Anobligatorysecurityinstrumentincorporatedinthewrittencontractsisinterestondefaultpaymentsandfurthermoreselectedtradereceivablesaresecuredbyanownershiptitletothesoldgoodsuntilfullsettlementofthepurchaseprice.TradereceivablesfromVolkswagenGroupcompaniesandfromassociatesareconsideredtobeartheleastrisk.Thereforethesuppliesofgoodsareperformedoncredittermsorthereceivablesaretransferredtoafactorthroughfactoring.Tradereceivablesfromcustomerslocatedabroadincludereceivablesfromgeneralimportersandothercus-tomers.Thereceivablesfromgeneral importersaresecuredbythefollowinginstruments:paymentsinad-vance, lettersof credit,documentarycollection,bankguarantees, standby lettersof creditand transferofreceivablestofactoring.Onlyanimmaterialpartofreceivablesfromothercustomersarisesoncreditterms.Receivablesfromdomesticcustomersaredividedintotwogroups:receivablesfromcontractualpartnersboundbysalesorserviceagreements,andfromotherdomesticcustomers.Thereceivablesarisingfromsalesofnewandusedvehiclestocontractualpartnersaretransferredtofactoring.Creditlimitsaresetupforthesuppliesofnewandusedvehicles,originalpartsandaccessories.Deliveriesofgoodsareautomati-callyblockedincasethecustomerfailstosettleoutstandingbalancesonmaturityanduponthesetlimitisexceeded.Onlyanimmaterialpartofsuppliestootherdomesticcustomersisrealisedoncreditterms.Differentcombinationsofthefollowinginstrumentsareusedasanadditionalsecurityofhigh-riskreceiva-bles:confirmationofdebtprolongingthestatuteoflimitation,paymentschedules,billsofexchange,pledg-es,orexecutorynotes.Loanstoemployeesaresecuredbyotheremployeeguarantees.Asat31December2012(asat31December2011),theGroupdidnotholdanycollateralforloansgiven.
3.1.1 Maximum exposure to credit risk (CZK million)Themaximumexposuretocreditrisk incaseofactivitiesconnectedtobusinessoperations,grantingofloans, supplier credits provided to customers anddeposits in companieswithinVolkswagenGroupandbankdepositsiscalculatedasthegrosscarryingamountoftheabovementionedfinancialassetslessanyimpairmentprovisions.Theexposuretocreditriskofderivativesismeasuredatfairvalueofthederivative.
Carrying amount as at 31 December 2012
Neither past due nor impaired financial
assets
Past due but not impaired financial
assetsImpaired financial
assets Total
Loans to employees 573 – – 573
Deposits in companies within Volkswagen Group 38,131 – – 38,131
Positive fair value of financial derivatives 1,129 – – 1,129
Other receivables and financial assets 58 – – 58
Trade receivables 10,094 1,907 14 12,015
Cash 5,369 – – 5,369
Total 55,354 1,907 14 57,275

Notes to the consolidated financial statements 2012
67Annual Report 2012
Carrying amount as at 31 December 2011
Neither past due nor impaired finan-
cial assets
Past due but not impaired financial
assetsImpaired financial
assets Total
Loans to employees 542 – – 542
Deposits in companies within Volkswagen Group 49,088 – – 49,088
Positive fair value of financial derivatives 1,851 – – 1,851
Other receivables and financial assets 457 – – 457
Trade receivables 12,010 1,393 20 13,423
Cash 3,703 – – 3,703
Total 67,651 1,393 20 69,064
ThelineitemDepositsincompanieswithinVolkswagenGroupcompaniesincludesdepositswithoriginalmatu-rityfromthreemonthstooneyearintotalamountofCZK0million(asat31December2011:CZK21,540million)anddepositswithoriginalmaturityfromoneyeartofiveyearsintotalamountofCZK3,033million(asat31De-cember2011:CZK0million)includedinbalancesheetinthelineOtherreceivablesandfinancialassets(seeNote8),anddepositswithoriginalmaturitylessthanthreemonthsintotalamountofCZK35,098million(asat31De-cember2011:CZK27,548million)includedinbalancesheetinthelineCashandcashequivalents(seeNote10).TheamountofguaranteesprovidedbytheGroupisCZK51millionasat31December2012(asat31Decem-ber2011:CZK51million).Inthefollowingtable,thereportedfiguresrepresenteitherthecarryingvalueofsecuredtradereceivables,orthecollateralvalueifthisvalueislower,determinedindividuallyforeachinstrument:
CZK million 2012 2011
Retention of legal ownership title to sold cars 1,060 2,403
Bank guarantees 1,217 1,761
Letters of credit 1,287 1,230
Documentary collection 190 235
Accepted deposit 19 19
Total 3,773 5,648
3.1.2 Risk concentrationTheGroupmonitorsconcentrationofcredit riskbydistribution regionsanddenominationcurrency.ThesensitivityoftheGrouptoforeignexchangeriskisdisclosedinNote3.4.1.Duringtheaccountingperiod2012(2011),theGroupdidnotidentifyasignificantriskconcentrationonthebasisofdistributionregion.Asignificantportionoffinancialassetsisofanintra-groupnature.TheGroupdepositedfreecashthroughVolkswagenGroupcompanies(asin2011).Thetotalvolumeofshort-termdepositswithVolkswagenGroupcompaniesamountedtoCZK39,359mil-lionasat31December2012(asat31December2011:CZK49,811million),outofwhich:– depositswithoriginalmaturityfromthreemonthstooneyearincludedinbalancesheetinthelineOtherreceivablesandfinancialassets(seeNote8)intotalamountofCZK0million(asat31December2011:CZK21,540million),
– depositswithoriginalmaturitylessthanthreemonthsincludedinbalancesheetinthelineCashandcashequivalents(seeNote10)intotalamountofCZK35,098million(asat31December2011:CZK27,548mil-lion),and
– overnightdepositsfromcashpoolingincludedinbalancesheetinthelineCashandcashequivalents(seeNote10)intotalamountofCZK4,261million(asat31December2011:CZK723million).
Inaddition to theabovementionedshort-termdepositswithVolkswagenGroupcompanies, theGroupfreecashwasalsodepositedforaperiodexceedingoneyearin2012.Thetotalvolumeofthelong-termdepositamountedtoCZK3,033millionasat31December2012(asat31December2011:CZK0millions)andisincludedinbalancesheetinthelineOtherreceivablesandfinancialassets(seeNote8).

Notes to the consolidated financial statements 2012
68 Annual Report 2012
In2012(2011),theGroupdidnotconsideritprobablethatadefaultcouldoccurinconnectionwiththefreecashdeposited.Possibleriskofunpaidreceivablesfromthirdpartieswasindividuallynotsignificant(spreadbetweenvariousdebtorsandregions).
3.1.3 Credit quality of financial assets neither past due nor impaired (CZK million)TheGroupusesthefollowingcriteriawhensettingratingsoffinancialassetsthatareneitherpastduenorimpaired.Solvencyclass1includesreceivables,depositsincompanieswithinVolkswagenGroup,securedreceivablesfromthirdpartiesandreceivablesthatwillbesubjecttofactoringwithoutrecourse.Thereisnoobjectiveevidenceindicatingimpairmentofthesereceivables.Solvencyclass2includesunsecuredtradereceivablesfromthirdpartiesforwhichthereisnoobjectiveevidenceindicatingimpairment(receivablesfromdealerswithoutriskandreceivablesfromdealerswithscheduleofpayments).
Solvency class 1 Solvency class 2 Total
Balance as at 31 December 2012
Loans to employees 573 – 573
Deposits in companies within Volkswagen Group 38,131 – 38,131
Positive fair value of financial derivatives 1,129 – 1,129
Other receivables and financial assets 58 – 58
Trade receivables 9,089 1,005 10,094
Cash 5,369 – 5,369
Total 54,349 1,005 55,354
Solvency class 1 Solvency class 2 Total
Balance as at 31 December 2011
Loans to employees 542 – 542
Deposits in companies within Volkswagen Group 49,088 – 49,088
Positive fair value of financial derivatives 1,851 – 1,851
Other receivables and financial assets 457 – 457
Trade receivables 10,743 1,267 12,010
Cash 3,703 – 3,703
Total 66,384 1,267 67,651
3.1.4 Carrying amount of financial assets past due and not impaired (CZK million)
Months past due
Less than 1 month 1-3 months More than 3 months Total
Trade receivables
Balance as at 31 December 2012 1,553 196 158 1,907
Balance as at 31 December 2011 935 158 300 1,393
Receivablesmorethan3monthspastduearerepresentedmainlybyreceivablesfromVolkswagenGroupcompanies.TheGroupdidnotidentifyanyneedforimpairmentofthesereceivables.Outofthetotalamountofreceivablesfromgroupcompanieswhichwerepastdueasat31December2011(CZK868million),CZK26millionwerestillnotpaidasat31December2012.

Notes to the consolidated financial statements 2012
69Annual Report 2012
3.1.5 Valuation allowance for receivables and other financial assets (CZK million)Impairmentstatusanddevelopmentofotherreceivablesandtradereceivableshasbeenanalysedasfollows:
2012 2011
Other receivables and financial assets
Gross balance as at 31 December 151 152
Valuation allowance:
Balance as at 1 January (152) (156)
Additions – –
Utilised 1 –
Released – 4
Balance as at 31 December (151) (152)
Net balance as at 31 December – –
Trade receivables
Gross balance as at 31 December 375 385
Valuation allowance:
Balance as at 1 January (365) (383)
Additions (87) (57)
Utilised 38 27
Released 53 48
Balance as at 31 December (361) (365)
Net balance as at 31 December 14 20
Duringtheaccountingperiod2012(2011),theGrouphadvaluationallowancesonindividualfinancialassetsonlyforwhichadefaultriskwasidentified.Duringtheaccountingperiod2012(2011),theGrouphadvalua-tionallowancesonlyonfinancialassetsincludedinthecategoryofloansandreceivables.
3.1.6 Transferred financial assets where the Group has continuing involvementTheGrouphasconcludedafactoringcontractwiththecompanyŠkoFINs.r.o.,underwhichthemajorityofrisksandrewardsrelatingtoownershipofreceivablesarisingfromsaleofneworusedcarsaretransferredto ŠkoFIN s.r.o. Under certain conditions, the company ŠkoFIN s.r.o. can claim compensation relating torealizedcredit lossesupto2%ofthetotalamountof transferredreceivablesduringtheyear,however,notmorethan49%oftheselossesandnotmorethanCZK51millionfortheyear.Thisamountrepresentscarryingamountandfairvalueoftherecognisedcontinuinginvolvementinthesereceivables,andrelatedfinancialliabilities.Atthesametime,thisamountrepresentsthemaximumexposuretocreditrisk.ThelossrecognisedatthedateoftransferoftheassetswasCZK25millionin2012.
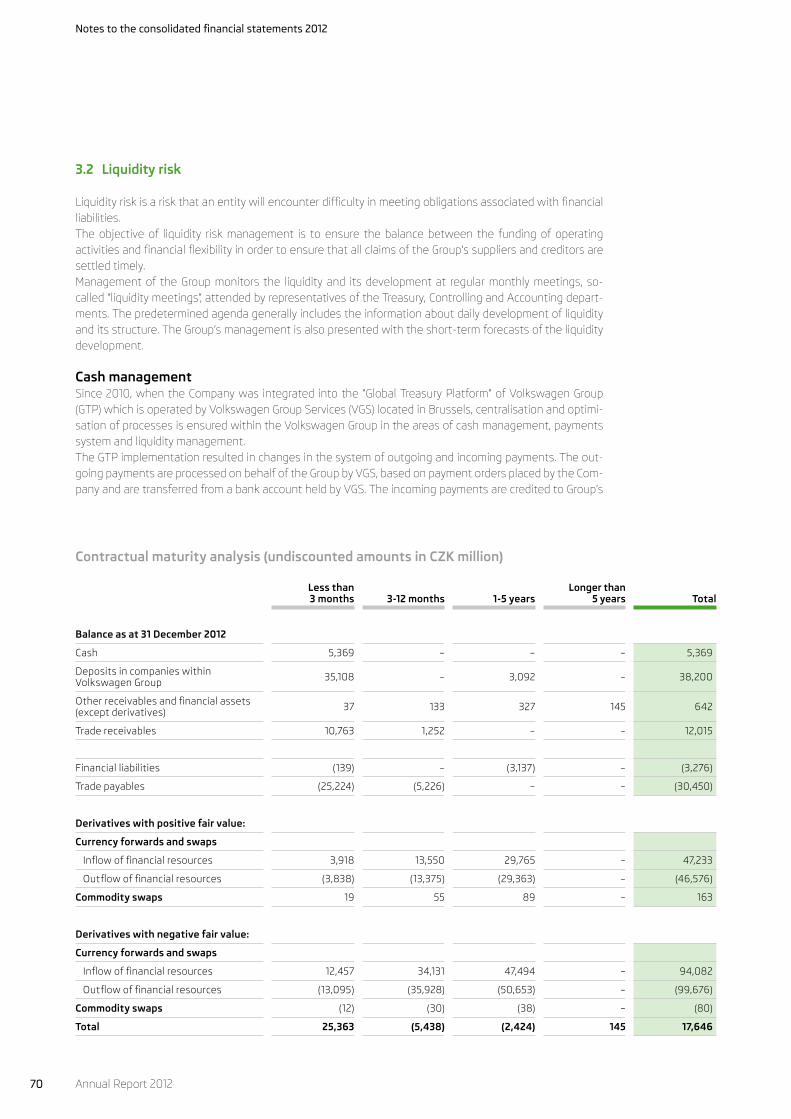
Notes to the consolidated financial statements 2012
70 Annual Report 2012
3.2 Liquidity risk
Liquidityriskisariskthatanentitywillencounterdifficultyinmeetingobligationsassociatedwithfinancialliabilities.Theobjectiveof liquidity riskmanagement is toensure thebalancebetween the fundingof operatingactivitiesandfinancialflexibilityinordertoensurethatallclaimsoftheGroup’ssuppliersandcreditorsaresettledtimely.Managementof theGroupmonitors the liquidityand itsdevelopmentat regularmonthlymeetings, so-called“liquiditymeetings”,attendedbyrepresentativesoftheTreasury,ControllingandAccountingdepart-ments.Thepredeterminedagendagenerallyincludestheinformationaboutdailydevelopmentofliquidityanditsstructure.TheGroup’smanagementisalsopresentedwiththeshort-termforecastsoftheliquiditydevelopment.
Cash managementSince2010,whentheCompanywas integrated intothe“GlobalTreasuryPlatform”ofVolkswagenGroup(GTP)whichisoperatedbyVolkswagenGroupServices(VGS)locatedinBrussels,centralisationandoptimi-sationofprocessesisensuredwithintheVolkswagenGroupintheareasofcashmanagement,paymentssystemandliquiditymanagement.TheGTPimplementationresultedinchangesinthesystemofoutgoingandincomingpayments.Theout-goingpaymentsareprocessedonbehalfoftheGroupbyVGS,basedonpaymentordersplacedbytheCom-panyandaretransferredfromabankaccountheldbyVGS.TheincomingpaymentsarecreditedtoGroup’s
Contractual maturity analysis (undiscounted amounts in CZK million)
Less than 3 months 3-12 months 1-5 years
Longer than 5 years Total
Balance as at 31 December 2012
Cash 5,369 – – – 5,369
Deposits in companies within Volkswagen Group 35,108 – 3,092 – 38,200
Other receivables and financial assets (except derivatives) 37 133 327 145 642
Trade receivables 10,763 1,252 – – 12,015
Financial liabilities (139) – (3,137) – (3,276)
Trade payables (25,224) (5,226) – – (30,450)
Derivatives with positive fair value:
Currency forwards and swaps
Inflow of financial resources 3,918 13,550 29,765 – 47,233
Outflow of financial resources (3,838) (13,375) (29,363) – (46,576)
Commodity swaps 19 55 89 – 163
Derivatives with negative fair value:
Currency forwards and swaps
Inflow of financial resources 12,457 34,131 47,494 – 94,082
Outflow of financial resources (13,095) (35,928) (50,653) – (99,676)
Commodity swaps (12) (30) (38) – (80)
Total 25,363 (5,438) (2,424) 145 17,646

Notes to the consolidated financial statements 2012
71Annual Report 2012
bankaccountsandsubsequentlyattheendofeachworkingdaytheyareautomaticallytransferredtoVGS’bankaccounts(masteraccount).TermsofsuchtransactionsaredefinedwithinthecashpoolingconceptagreeduponbetweentheCompany,thebankandVGS.AllincomingpaymentsaretranslatedintoCzechcrownsandcreditedtotheGroup’sbankaccountatthe“InhouseBank”(IHC)operatedbyVGS,wherethedifferencesbetweendebitandcreditbalancesonthecol-lectedfinancialresourcesarenetted-off.Major instrumentsoftheGroupusedtomaintainsufficient liquidityresourcesarerepresentedbyshort-termandlong-termfinancialplans,coordinationoffreeliquiditymanagementwithintheGTP,activecoop-erationwithbanks(creditlines)andmonitoringofthesituationatmoneymarketandcapitalmarket.Suf-ficientresourcesofliquidityareensuredmainlythroughresourcesfromotherVolkswagenGroupcompaniesintegratedintotheGTPand,toalimitedextent,throughcreditlinesarrangedwithexternalbanks.Thetotalamountofcreditlinesfrombanksasat31December2012wasCZK1,710million(asat31December2011:CZK9,583million)outofwhichCZK700millionwasinCzechcrownsandCZK1,010millionwasinfor-eigncurrency(INR2,910million).TheGrouphasnotutilisedanyagreedbankcreditlinesasat31December2012(asat31December2011).ThecreditlinefromtheVolkswagenGroupinthetotalamountofCZK3,000millionwasdrawninthewholeamountasat31December2012(asat31December2011).TheinformationaboutfinancialconditionsofcreditlinesdrawnisincludedinNote13.
Contractual maturity analysis (undiscounted amounts in CZK million)
Less than 3 months 3-12 months 1-5 years
Longer than 5 years Total
Balance as at 31 December 2011
Cash 3,703 – – – 3,703
Deposits in companies within Volkswagen Group 43,627 5,516 – – 49,143
Other receivables and financial assets (except derivatives) 420 143 364 94 1,021
Trade receivables 12,111 1,312 – – 13,423
Financial liabilities (172) – (3,276) – (3,448)
Trade payables (26,128) (3,562) (115) – (29,805)
Derivatives with positive fair value:
Currency forwards and swaps
Inflow of financial resources 4,305 20,500 13,913 – 38,718
Outflow of financial resources (4,125) (19,567) (13,292) – (36,984)
Commodity swaps 5 10 92 – 107
Derivatives with negative fair value:
Currency forwards and swaps
Inflow of financial resources 11,642 26,496 65,514 – 103,652
Outflow of financial resources (12,419) (28,534) (70,891) – (111,844)
Commodity swaps (14) (48) (102) – (164)
Total 32,955 2,266 (7,793) 94 27,522

Notes to the consolidated financial statements 2012
72 Annual Report 2012
3.3 Market risk
Marketriskisariskthatthefairvalueoffuturecashflowsoffinancialinstrumentswillfluctuatebecauseofchangesinmarketprices.Marketriskincludesthreetypesofrisks:currencyrisk,interestrateriskandpricerisk.Developmentsonthefinancialmarketsareconsideredtobethemostsignificantriskfactor,especiallythefluctuationofexchangerates.
3.3.1 Currency riskCurrencyriskisariskthatthefairvalueoffuturecashflowsoffinancialinstrumentswillfluctuatebecauseofchangesinforeignexchangerates.ThefluctuationofexchangeratesrepresentssignificantriskinthattheGroupsellsitsproducts,andpur-chasesmaterial,partsandservicesconcurrentlyinvariousforeigncurrencies.TheGroupactivelymanagesthisriskthroughcontinuallyupdatedmarketanalysis,worldwideprocurementofmaterialandequipmentandproductionofitsproductsinsomesalesregions.StandardderivativehedginginstrumentsareusedbytheGrouptomanagethecurrencyrisk.Theriskexposure,asdeterminedbytheanalysisof incomeandexpensestructuresbyforeigncurrency,ishedgedon thebasisofexpected future foreigncurrencycashflows.Theseexpectedcashflowsareplannedintheformofmonthlyforeigncurrencyplans(FXplan),whicharebeingupdatedregularlyandtheystretchoveratimehorizonupto5years.TheGroup’smanagementisregularlybeingupdatedaboutthecurrencyriskstatusbymeansoftheliquiditymeeting,attendedbyrepresentativesoftheTreasury,ControllingandAccountingdepartments,TreasuryDepartment of theVolkswagenGroup, representatives of subsidiaries andmanagement of Commercialaffairsdepartment.Inadditiontotheupdateofforeigncurrencyplans,actualdevelopmentofforeigncur-rencycashflowsandexchangeratesfluctuationsagainstCZK,suggestionsforadditionalhedgingarepre-sentedandagreedduringthesemeetings.Forwardexchangecontractsandcurrencyswapsareusedashedginginstrumentsforeliminationofcurren-cyrisk.ThebasicparametersofthehedgingpolicyaredefinedbythehedgingdirectivevalidfortheentireVolkswagenGroup,whichincludesalsothelistofpermittedfinancialproducts(derivatives).ContractsareconcludedupontherequestofindividualmembersoftheGroupandintheirnamebytheTreasuryDepart-mentoftheVolkswagenGroup.TheriskresultingfromchangesinexchangeratesagainstCZKishedgedforatotalof11currencies.ThemostimportanttradingcurrenciesareUSD,EUR,GBP,CHF,PLNandRUB.TheGroupapplieshedgeaccountingforcurrencyrisk.FortheanalysisofsensitivitytoexchangeratespleaserefertoNote3.4.1.
3.3.2 Interest rate riskInterestrateriskisariskthatthefairvalueoffuturecashflowsofafinancialinstrumentwillfluctuatebe-causeofchangesinmarketinterestrates.Theobjectiveofinterestrateriskmanagementistoeliminatetheriskarisingfromfluctuationsofinterestratesoffinancialliabilitiesandreceivableswithfloatinginterestratesbymaintaininganappropriatestruc-tureoffinancialliabilitiesandreceivables.ThemanagementoftheGroupmonitorstheinterestrateriskattheregularmonthlymeetingsattendedbyrepresentativesoftheTreasury,ControllingandAccountingdepartments.Thepredeterminedagendagen-erallyincludesthefollowing-informationaboutcurrentdevelopmentofinterbankinterestrates(especiallyPRIBOR,EURIBORandLIBOR)andinformationaboutcentralbanks’interestratesintheregionswheretheGroupoperates.TheGroup’smanagementisalsopresentedwithshort-termforecastsoftheinterestratesdevelopment.TheexposuretointerestrateriskarisesfromcashdepositsatVolkswagenGroupcompanies.FortheanalysisofsensitivitytointerestratespleaserefertoNote3.4.2.

Notes to the consolidated financial statements 2012
73Annual Report 2012
3.3.3 Price riskPriceriskisariskthatthefairvalueoffuturecashflowsfromthefinancialinstrumentswillfluctuatebe-causeofchangesinmarketprices,especiallycommodityprices(apartfromthatwhichresultsfromcurrencyandinterestrisk).Duetocontinuousvolatilityinthepricesoftherawmaterialcommoditiesandlimitedaccessibilitytospecificcommodities,managementhasaimed toeliminate these risks through target riskmanagement strate-gies.Inthisregard,utilisationofalternativeproductionmaterialsandproceduresaswellasutilisationofrecycledmaterialisbeingexamined.Inaddition,emphasisisplacedonextendingtheinternationalsupplychaininco-operationwiththeVolkswagenGroup.Highriskcommoditiesincludeprimarilyaluminium,cop-per,palladium,lead,platinumandrhodium.ThosecommoditiesidentifiedashighriskarecontrolledattheVolkswagenGrouplevelthroughlongtermsupplycontractswithsuppliers.TheGrouphedgesagainstprice risks ingeneral (asa consequenceof changes inparticular commoditypricesand foreignexchangerates) throughcommodityswaps (forcopper,aluminiumand lead)andcur-rencyforwards.ThosefinancialderivativesexceptforcommodityswapsforleadtotheGroupuseshedgeaccounting—hedgingoffuturecashflows.
3.3.4 Derivative financial instruments
Nominal and fair value of derivatives (CZK million)
Nominal value of derivatives Fair value of derivatives
Balance as at 31 December 2012
Balance as at 31 December 2011
Balance as at 31 December 2012
Balance as at 31 December 2011
With positive
fair value
With negative fair value
With positive
fair value
With negative fair value Positive Negative Positive Negative
Currency instruments
Currency forwards for trading 24 155 – – – 10 – –
Currency forwards – cash flow hedging 38,316 95,398 36,895 107,628 790 4,515 1,696 6,493
Currency swaps – cash flow hedging 8,486 4,195 1,632 4,193 179 94 50 277
Commodity instruments
Commodity swaps for trading 140 – – – 31 – – –
Commodity swaps – cash flow hedging 844 1,137 1,243 1,468 129 83 105 160
Total 47,810 100,885 39,770 113,289 1,129 4,702 1,851 6,930
Thefairvaluesoffinancialderivativesfulfilthecriteriaoflevel2incompliancewiththeIFRS7hierarchy(thefairvaluesarederivedfrommarketquotationsofforwardexchangerates,commoditypricesandyieldcurves,howeverthefinancialderivativesarenotdirectlytradedinactivefinancialmarkets).

Notes to the consolidated financial statements 2012
74 Annual Report 2012
Volume of hedged cash flows (CZK million)
Balance as at 31 December 2012 Volume of hedged cash flows
Within 1 year 1-5 years Total
Currency risk exposure
Hedging of future cash flows – future receivables 52,659 72,647 125,306
Hedging of future cash flows – future liabilities (12,831) (6,275) (19,106)
Other price risks (combination of commodity and currency risks)
Hedging of future cash flows – future liabilities (785) (1,173) (1,958)
Total 39,043 65,199 104,242
Balance as at 31 December 2011 Volume of hedged cash flows
Within 1 year 1-5 years Total
Currency risk exposure
Hedging of future cash flows – future receivables 49,167 70,354 119,521
Hedging of future cash flows – future liabilities (15,289) (10,596) (25,885)
Other price risks (combination of commodity and currency risks)
Hedging of future cash flows – future liabilities (609) (1,921) (2,530)
Total 33,269 57,837 91,106
3.4 Sensitivity analysis
3.4.1 Sensitivity to exchange ratesTheGroupisexposedtotheforeigncurrencyriskarisingmainlyfromtransactionsperformedwithEUcoun-tries(EUR,GBP)andwithcountriesusingUSDastransactioncurrency.Theforeigncurrencyriskismeasuredagainstthefunctionalcurrency(CZK)asatthebalancesheetdate,whenthefinancialassetsandliabilitiesdenominatedinforeigncurrenciesarerecalculatedtoCZKbyapplyingtheCzechNationalBankexchangerate.Thesensitivityanalysisincludesanalysisofexposurearisingfromderivativefinancialassetsandliabilitiesand unpaid financial assets and liabilities denominated in foreign currencies, andmeasures the impactfromrecalculationoftheseitemsasatbalancesheetdatebyusingadjustedexchangeratescomparedtothosepublishedbyCzechNationalBank.In2012(2011)theGroupconsiders(considered)themovementsofexchangeratesEUR,USD,CHFandGBPagainstCZKinthefollowingperiodof+10%(appreciationofCZK)and-10%(depreciationofCZK)aspossible.Thesensitivityanalysistoexchangeratechanges isbasedontheassumptionofexpectedpossibleex-changeratemovements.ThefollowingtablespresentimpactonprofitorlossandothercomprehensiveincomeofexpectedpossibleappreciationordepreciationofCZKtoforeigncurrencies:

Notes to the consolidated financial statements 2012
75Annual Report 2012
2012 (CZK million) CZK appreciation by 10%
EUR USD CHF GBPOther
currencies Total
Income statement
Non-derivative financial instruments 881 (67) (1) 3 (221) 595
Derivative financial instruments – (46) 2 (41) (76) (161)
Other comprehensive income
Derivative financial instruments (1,685) 2,906 1,978 3,706 3,503 10,408
2012 (CZK million) CZK depreciation by 10%
EUR USD CHF GBPOther
currencies Total
Income statement
Non-derivative financial instruments (881) 67 1 (3) 221 (595)
Derivative financial instruments – 46 (2) 41 76 161
Other comprehensive income
Derivative financial instruments 1,685 (2,906) (1,978) (3,706) (3,503) (10,408)
2011 (CZK million) CZK appreciation by 10%
EUR USD CHF GBPOther
currencies Total
Income statement
Non-derivative financial instruments 767 (84) (10) 5 (400) 278
Derivative financial instruments 10 (41) 2 (68) (83) (180)
Other comprehensive income
Derivative financial instruments (2,510) 2,307 2,436 3,323 3,739 9,295
2011 (CZK million) CZK depreciation by 10%
EUR USD CHF GBPOther
currencies Total
Income statement
Non-derivative financial instruments (767) 84 10 (5) 400 (278)
Derivative financial instruments (10) 41 (2) 68 83 180
Other comprehensive income
Derivative financial instruments 2,510 (2,307) (2,436) (3,323) (3,739) (9,295)

Notes to the consolidated financial statements 2012
76 Annual Report 2012
3.4.2 Sensitivity to interest ratesTheGroup isexposed to interest riskmainly in relation toshort-termdepositsprovided toVolkswagenGroupcompanies.Theanalysisofsensitivitytochangesininterestrateswasbasedonexposuretoderivativefinancialassetsandliabilitiesasatbalancesheetdateinthesamewayasforthenon-derivativefinancialassets.In2012(2011)theGroupassumes(assumed)possiblemovementsoftheyieldcurveinthefollowingperiodforshort-termdepositsprovidedtoVolkswagenGroupcompanies,bankdepositsandcurrencyforwardsandswapsby+100/-25basispoints.TheGroupismostsensitivetomovementsoftheCZKyieldcurve.Inthecaseofderivativefinancialinstruments,theGroupmeasurestheimpactonthechangeinfairvalueofthesederivativesthatresultsfromthechangeintheyieldcurve.Fornon-derivativefinancialinstrumentstheimpactonprofitorlossisdeterminedonthebasisofdefinedchangeintheinterestrate,whichwouldariseatthebeginningofthenextaccountingperiodandbasedontheassumptionthatnootherchangesintheinterestratewouldoccurduringtheentireaccountingperiod.Thefollowingtablespresentimpactonprofitorlossbeforetaxofexpectedincreaseordecreaseofinter-estrates:
2012 (CZK million) Interest rate increased by
100 basis points
Interest rate decreased by
25 basis points
Income statement
Non-derivative financial instruments 341 (85)
Derivative financial instruments 33 (8)
Total 374 (93)
2011 (CZK million) Interest rate increased by
100 basis points
Interest rate decreased by
25 basis points
Income statement
Non-derivative financial instruments 454 (114)
Derivative financial instruments 91 (23)
Total 545 (137)
3.4.3 Sensitivity to changes in other price risksTheGroupisexposedtoacombinationofcommodityandcurrencyrisksduetovolatilityinpricesofparticularcommoditiestradedinforeigncurrencies.Thisriskofchangeincashflowsishedgedbyacombinationofcom-modityswapsandcurrencyforwards.Thesensitivityanalysistochangesincommoditypriceswasdeterminedbasedontheexposuretoderivativefinancialassetsandliabilitiesasatthebalancesheetdate.In2012(2011),theGroupassumes(assumed)potentialmovementsincopperpricesinthefollowingperiodof+/-20%.In2012(2011)theGroupassumes(assumed)potentialmovementsinaluminiumpricesinthefollowingperiodof+/-10%.In2012theGroupassumespotentialmovementsinleadpricesinthefollowingperiodof+/-10%.TheGroupconsiderschangesinthefairvaluesofderivativefinancialinstrumentsduetochangesinspotcommodityprices.Othernon-derivativefinancialassetsandliabilitiesaredeemednottobesensitivetochangesincommoditypricessincethepricesarefixedatthetimeofrecognitionofthefinancialliabilityorasset.

Notes to the consolidated financial statements 2012
77Annual Report 2012
Thefollowingtablesrepresentimpactonprofitorlossandothercomprehensiveincomebeforetaxofex-pectedincreaseordecreaseofcopper,aluminiumandleadprices:
2012 (CZK million) Increase of copper
prices +20%
Decrease of copper
prices (20)%
Increase of aluminium
prices +10%
Decrease of aluminium
prices (10)%Increase of lead
prices +10%Decrease of lead
prices (10)%
Income statement
Derivative financial instruments – – – – 17 (17)
Other comprehensive income
Derivative financial instruments 252 (252) 76 (76) – –
2011 (CZK million) Increase of copper
prices +20%
Decrease of copper
prices (20)%
Increase of aluminium
prices +10%
Decrease of aluminium
prices (10)%Increase of lead
prices +10%Decrease of lead
prices (10)%
Income statement
Derivative financial instruments – – – – – –
Other comprehensive income
Derivative financial instruments 270 (270) 120 (120) – –
ThepossibleimpactonincomestatementofexpectedpriceincreaseordecreaseofcopperandaluminiumwasassessedbytheGroupasimmaterial.
3.5 Capital risk management
Theoptimalcapitalisationof theGroup is the resultofacompromisebetweentwo interests: returnoncapitalandtheGroup’scapacitytomeetallofitsliabilitiesdueforpayment.ItistheobjectiveofthecapitalmanagementfunctiontomaintainanadequateownedtoborrowedcapitalratiotoguaranteeduepaymentsofallfinancialliabilitieswhilepromotingcontinuedgrowthoftheGroup’svaluefortheshareholder.Theratiosofequityandofborrowedcapitalontotalcapitalareshowninthefollowingtable:
CZK million 2012 2011
Equity 90,906 81,211
Equity ratio 56.8% 52.9%
Non-current financial liabilities 3,000 3,000
Current financial liabilities 107 141
Total financial liabilities 3,107 3,141
Ratio of financial liabilities to total equity and liabilities 1.9% 2.0%
Total equity and liabilities 159,986 153,557

Notes to the consolidated financial statements 2012
78 Annual Report 2012
4. Geographical informationTheCompany’sheadofficeandmainproductionfacilitiesoftheGrouparesituatedintheCzechRepublic.TheGroup’ssalesaregeneratedfromfivebasicgeographicalregions:theCzechRepublic;Germany,West-ernEurope-Other;CentralandEasternEurope;andOverseas/Asia/Africa/Australia.Overseas/Asia/Africa/AustraliaregionisduetoitsimmaterialityreportedasUnallocated.
2012 (CZK million)Czech
Republic Germany
Western Europe -
Other
Central and Eastern Europe Unallocated Total
Sales – based on location of customers 21,927 61,155 78,837 56,192 44,538 262,649
Non-current assets* 75,988 193 – 9 1,080 77,270
2011 (CZK million)Czech
Republic Germany
Western Europe -
Other
Central and Eastern Europe Unallocated Total
Sales – based on location of customers 22,084 64,184 83,877 47,661 34,756 252,562
Non-current assets* 59,871 187 – 38 763 60,859
* Non-current assets other than financial instruments and deferred tax assets.
5. Intangible assets (CZK million)
Goodwill
Capitalised development costs
for products currently in use
Capitalised development costs for products under
developmentOther intangible
assets Total
Costs
Balance as at 1 January 2012 77 21,710 5,385 8,493 35,665
Additions – 4,012 2,092 2,024 8,128
Disposals – – – (396) (396)
Transfers – 5,251 (5,251) – –
Foreign exchange differences (2) – – (7) (9)
Balance as at 31 December 2012 75 30,973 2,226 10,114 43,388
Cumulative amortisation and impairment losses
Balance as at 1 January 2012 – (16,369) – (5,642) (22,011)
Amortisation – (2,093) – (479) (2,572)
Impairment losses – (404) – – (404)
Disposals – – – 375 375
Foreign exchange differences – – – 6 6
Balance as at 31 December 2012 – (18,866) – (5,740) (24,606)
Carrying amount as at 31 December 2012 75 12,107 2,226 4,374 18,782

Notes to the consolidated financial statements 2012
79Annual Report 2012
Goodwill
Capitalised development costs
for products currently in use
Capitalised development costs for products under
developmentOther intangible
assets Total
Costs
Balance as at 1 January 2011 75 24,577 2,143 6,879 33,674
Additions – 22 3,284 1,896 5,202
Disposals – (2,931) – (288) (3,219)
Transfers – 42 (42) 2 2
Foreign exchange differences 2 – – 4 6
Balance as at 31 December 2011 77 21,710 5,385 8,493 35,665
Cumulative amortisation and impairment losses
Balance as at 1 January 2011 – (16,228) – (4,477) (20,705)
Amortisation – (2,314) – (450) (2,764)
Impairment losses – (758) – (998) (1,756)
Disposals – 2,931 – 288 3,219
Foreign exchange differences – – – (5) (5)
Balance as at 31 December 2011 – (16,369) – (5,642) (22,011)
Carrying amount as at 31 December 2011 77 5,341 5,385 2,851 13,654
Otherintangibleassetsincludemainlytoolingrights,softwareandsoftwarelicences.Amortisationand impairment lossesof intangibleassetsofCZK2,837million (2011:CZK4,371million)areincludedinthecostofsales,CZK20million(2011:CZK14million)indistributionexpenses,andCZK119million(2011:CZK135million)inadministrativeexpenses.
Impairment reviewsGoodwill is allocated toŠKODAAUTODeutschlandGmbHas thecash-generatingunit for thepurposeofimpairmenttesting.Therecoverableamountofacash-generatingunitiscalculatedbasedonvalue-in-usecalculations.Thesecalculationsusecashflowprojectionsbasedonfinancialbudgetsapprovedbytheman-agementandcoveringafive-yearperiod.Cashflowsbeyondthefive-yearperiodareextrapolatedusingtheestimatedgrowthratethatdoesnotexceedthelong-termaveragegrowthrateforautomotiveindustry.Theexpectedgrowthratefortheimpairmenttestin2012was1%(2011:1%).Thediscountratesusedarepre-taxratesreflectingspecificrisksandcharacteristicsofthesegmentwherethecash-generatingunitoperates.Fortheyear2012,thediscountrateof5.6%(2011:6.0%)wasused.Therequirementsof IAS1, IAS10and IAS36havebeenassessedbytheGroup’smanagement inrelationtothedecrease inplannedcash inflowsregardingparticularŠKODAmodelsandtheirpotential impactonthecarryingamountoftheGroup‘snon-currentintangibleassets.Duetosubstantialchangesinthemarketenvironment, theGrouphasexperienced in2012adecrease intheplannedcash inflowsrelatingtothreecash-generatingunits(productionofcarsofcertainmodels).Impairmentreviewsofassetsrelatingtothosecash-generatingunitshavebeenperformed.Thecarryingamountsoftheassetsrelatingtothecash-gener-atingunitshavebeencomparedwiththerelevantrecoverableamounts.Therecoverableamountshavebeendeterminedbasedonthecalculationofthevalueinuseapplyingcashflowprojectionsoverthelifecycleofthecash-generatingunitsreflectingfinancialplans,approvedbytheGroup’smanagement.Fordiscountingcashflows,thediscountrateof6.6%hasbeenappliedin2012(2011:6.8%),reflectingthespe-cificrisksassociatedwiththesectorinwhichtheGroupoperates.Foronecash-generatingunitthecompari-sonofthecarryingamountswiththerelevantrecoverableamountsresultedinanimpairmentlossallocatedtointangibleassetsintheamountofCZK404million(2011twocash-generatingunits:CZK1,756million),whichhasbeenpostedtotheincomestatement(withinlineCostofsales)fortheyearended31December2012(31December2011).

Notes to the consolidated financial statements 2012
80 Annual Report 2012
Capitalisation of borrowing costs Forthecapitalisationofborrowingcostsin2012,theGroupappliedthecapitalisationrateof4.53%(2011:4.53%).Noborrowingcostshavebeencapitalisedinthecostofintangibleassetsin2012or2011astheywerenotsignificant.
The following amounts were recognised in the income statement as research and development expenses (CZK million)
2012 2011
Research and non-capitalised development costs 4,848 6,061
Amortisation and impairment losses of development costs 2,497 3,072
Research and development costs recognised in the income statement 7,345 9,133
6. Property, plant and equipment (CZK million)
Land and buildings
Technical equipment and
machineryTooling, office and
other equipment
Advances paid and assets under
construction Total
Costs
Balance as at 1 January 2012 31,547 61,645 46,411 12,351 151,954
Additions 2,225 7,825 4,605 4,423 19,078
Disposals (66) (1,101) (2,621) (3) (3,791)
Transfers 1,465 3,208 2,316 (6,989) –
Foreign exchange differences (46) (72) (42) (15) (175)
Balance as at 31 December 2012 35,125 71,505 50,669 9,767 167,066
Cumulative depreciation and impairment losses
Balance as at 1 January 2012 (13,151) (51,503) (41,035) – (105,689)
Amortisation (1,160) (4,142) (3,432) – (8,734)
Impairment losses – – (222) – (222)
Disposals 58 1,099 2,614 – 3,771
Foreign exchange differences 10 58 28 – 96
Balance as at 31 December 2012 (14,243) (54,488) (42,047) – (110,778)
Carrying amount as at 31 December 2012 20,882 17,017 8,622 9,767 56,288

Notes to the consolidated financial statements 2012
81Annual Report 2012
Land and buildings
Technical equipment and
machineryTooling, office and
other equipment
Advances paid and assets under
construction Total
Costs
Balance as at 1 January 2011 30,243 59,338 46,188 7,468 143,237
Additions 969 1,539 986 8,760 12,254
Disposals (64) (1,932) (1,360) (2) (3,358)
Transfers 456 2,793 623 (3,874) (2)
Foreign exchange differences (57) (93) (26) (1) (177)
Balance as at 31 December 2011 31,547 61,645 46,411 12,351 151,954
Cumulative depreciation and impairment losses
Balance as at 1 January 2011 (12,063) (50,363) (38,452) – (100,878)
Amortisation (1,119) (3,135) (3,479) – (7,733)
Impairment losses (7) (18) (468) – (493)
Disposals 25 1,933 1,355 – 3,313
Foreign exchange differences 13 80 9 – 102
Balance as at 31 December 2011 (13,151) (51,503) (41,035) – (105,689)
Carrying amount as at 31 December 2011 18,396 10,142 5,376 12,351 46,265
Depreciationand impairment lossesofthebuildingsandequipmentofCZK8,215million (2011:CZK7,518million)areincludedinthecostofsales,CZK176million(2011:CZK180million)indistributionexpenses,andCZK565million(2011:CZK528million)inadministrativeexpenses.
Impairment reviewsTherequirementsofIAS1,IAS10andIAS36havebeenassessedbytheGroup’smanagementinrelationto thedecrease inplannedcash inflowsregardingparticularŠKODAmodelsand itspotential impactonthecarryingamountoftheGroup‘snon-currenttangibleassets.Duetosubstantialchangesinthemarketenvironment,theGrouphasexperiencedin2012adecreaseintheplannedcashinflowsrelatingtothreecash-generatingunits(productionofcarsofcertainmodels).Impairmentreviewsofassetsrelatingtothosecash-generatingunitshavebeenperformed.Thecarryingamountsoftheassetsrelatingtothecash-gen-eratingunitshavebeencomparedwiththerelevantrecoverableamounts.Therecoverableamountshavebeendeterminedbasedonthecalculationofthevalueinuseapplyingcashflowprojectionsoverthelifecycleofthecash-generatingunitsreflectingfinancialplans,approvedbytheGroup’smanagement.Fordiscountingcashflows,thediscountrateof6.6%or6.8%in2012(2011:6.8%or7.3%)hasbeenapplieddependingonthecharacteristicsofindividualcash-generatingunits.ThediscountratesreflectthespecificrisksassociatedwiththesectorinwhichtheGroupoperates.Foronecash-generatingunit,thecomparisonofthecarryingamountswiththerelevantrecoverableamountsresultedinanimpairmentlossallocatedtotangibleassetsinthetotalamountofCZK222million(2011:CZK493million),whichhasbeenpostedtotheincomestatement(withinlineCostofsales)fortheyearended31December2012(31December2011).
Capitalisation of borrowing costs Forthecapitalisationofborrowingcostsin2012,theGroupappliedthecapitalisationrateof4.53%(2011:4.53%).Noborrowingcostshavebeencapitalisedinthecostofproperty,plantandequipmentin2012orin2011astheywerenotsignificant.

Notes to the consolidated financial statements 2012
82 Annual Report 2012
7. Investments in associates (CZK million)
2012 2011
Total assets 62,273 52,911
Total liabilities 51,896 49,623
Total revenue 168,391 121,296
Profit / (loss) (aggregated) 7,419 1,600
The table above summarises financial data of the associatesOOOVOLKSWAGENGroupRus and ŠKO-ENERGOFIN,s.r.o.TheCompany’sshareintheregisteredcapitalofthecompanyOOOVOLKSWAGENGroupRusasat31De-cember2012was16.8%(31December2011:16.8%).TheCompany’sshareofprofitsorlossesofthisassociatefor2012was17.91%(2011:17.91%).TheCompanyexercisessignificantinfluenceinthecompanyOOOVOLKS-WAGENGroupRusbasedonthefollowingfactors:theCompanyisparticipatinginpolicy-makingprocesses,includingparticipationindecisionsaboutdistributionofprofit;materialtransactionsareconductedbetweenbothcompanies;aninterchangeofmanagerialpersonneltakesplacesbetweenbothcompaniesandtheCompanyisprovidingessentialtechnicalinformationtothecompanyOOOVOLKSWAGENGroupRus.TheCompany’sshareintheregisteredcapitalofthecompanyŠKO-ENERGOFINasat31December2012was31.25%(asat31December2011:31.25%).ThevalueoftheCompany’ssharetotalledCZK529millionasat31December2012(asat31December2011:CZK529million).ŠKO-ENERGOFINpaiddividendstotheCompanyintheamountofCZK83million(2011:CZK104million).
Impairment reviews TherequirementsoftheIAS1,IAS10andIAS36standardswereassessedbytheGroup’smanagementinrelationtothedevelopmentoftheautomotiveindustryandplannedvolumesofsoldcarsandthepotentialimpactsonthecarryingamountoftheGroup’sfinancial investments inassociates.Basedonperformedanalyses,nofactorshavebeenidentifiedwhichwouldindicateaneedtorecogniseimpairmentlosseswithan exceptionof future economic benefits arising from investment in the associateOOOVOLKSWAGENGroupRus.TheGroup’smanagementhasthereforeperformedanimpairmentreviewofthiscash-generat-ingunit.Carryingvalueofthefinancialinvestmentintheassociatehasbeencomparedwiththerelevantrecoverableamount.Therecoverableamounthasbeendeterminedbasedonthecalculationofthevalueinuseapplyingcashflowprojectionsoverthefollowingfiveyears,reflectingfinancialplansapprovedbytheGroup’smanagement.Cashflowsbeyondthefiveyearsperiodhavebeenextrapolatedwithestimatedgrowthratewhichisnothigherthanexpectedlong-termaveragegrowthrateintheautomotiveindustry.Theapplieddiscountrateispost-taxandreflectsspecificrisksassociatedwiththesectorandtheregioninwhichthereviewedcompanyoperates.In2012,discountrateof11.2%(2011:9.5%)hasbeenapplied.Thecomparisonofthecarryingamountswiththerelevantrecoverableamounthasnotgivenrisetoanyimpair-mentlossasat31December2012or31December2011.

Notes to the consolidated financial statements 2012
83Annual Report 2012
8. Other non-current and current receivables, financial assets and trade receivables (CZK million)
Balance as at 31 December 2012 Financial assets at fair
value through profit or
loss**Loans and
receivables
Available for sale
financial assets
Financial assets
designated as hedging
instruments Other* Total
Other receivables and financial assets
Loans to employees – 573 – – – 573
Deposits in companies within Volkswagen Group – 3,033 – – – 3,033
Positive fair value of financial derivatives (29) – – 1,158 – 1,129
Available for sale financial assets – – 4 – – 4
Tax receivables (excl. income tax) – – – – 3,412 3,412
Others – 58 – – 932 990
Total (29) 3,664 4 1,158 4,344 9,141
Trade receivables
Third parties – 3,311 – – – 3,311
Related parties – 8,704 – – – 8,704
Total – 12,015 – – – 12,015
* The category Other does not meet a definition of financial instruments in terms of IAS 32.** Financial assets held-for-trading.
Note:The line Positive fair value of financial derivatives in the portfolio Financial assets designated as hedging instruments is represented by the spot component of finan-cial derivatives and in the portfolio Financial assets at fair value through profit or loss it is represented by the forward component of financial derivatives (see also Note 2.7.3). As the spot component exceeded the fair value as at 31 December 2012, the forward component was negative.

Notes to the consolidated financial statements 2012
84 Annual Report 2012
Balance as at 31 December 2011 Financial assets at fair
value through profit or
loss**Loans and
receivables
Available for sale
financial assets
Financial assets
designated as hedging
instruments Other* Total
Other receivables and financial assets
Loans to employees – 542 – – – 542
Deposits in companies within Volkswagen Group – 21,540 – – – 21,540
Positive fair value of financial derivatives (242) – – 2,093 – 1,851
Available for sale financial assets – – 4 – – 4
Tax receivables (excl. income tax) – – – – 4,405 4,405
Others – 457 – – 436 893
Total (242) 22,539 4 2,093 4,841 29,235
Trade receivables
Third parties – 4,733 – – – 4,733
Related parties – 8,690 – – – 8,690
Total – 13,423 – – – 13,423
* The category Other does not meet a definition of financial instruments in terms of IAS 32** Financial assets held-for-trading.
Note:The line Positive fair value of financial derivatives in the portfolio Financial assets designated as hedging instruments is represented by the spot component of finan-cial derivatives and in the portfolio Financial assets at fair value through profit or loss it is represented by the forward component of financial derivatives (see also Note 2.7.3). As the spot component exceeded the fair value as at 31 December 2011, the forward component was negative.
ThecarryingamountofloanstoemployeesanddepositsincompanieswithinVolkswagenGroupapproxi-matestheirfairvalue.Thecarryingamountnetofimpairmentlossforeachclassoffinancialassetswhicharenotcarriedatfairvalueapproximatestheirfairvalueduetotheshort-termnatureoftheseitems.ThelineDepositsincompanieswithinVolkswagenGroupcomprisesdepositsintheamountofCZK0mil-lion(asat31December2011:CZK21,540million)withoriginalmaturityfromthreemonthstooneyearanddepositsintheamountofCZK3,033million(asat31December2011:CZK0)withoriginalmaturityfromoneyeartofiveyears.TheweightedaverageeffectiveinterestratebasedonthecarryingamountofdepositswithoriginalmaturityfromthreemonthstooneyearprovidedtoVolkswagenGroupcompaniesasat31De-cember2012was0%(31December2011:0.88%).TheweightedaverageeffectiveinterestratebasedonthecarryingamountofdepositswithoriginalmaturityfromoneyeartofiveyearsprovidedtoVolkswagenGroupcompaniesasat31December2012was1.58%(31December2011:0%).All depositsprovided toVolkswagenGroupcompanieswithoriginalmaturity from threemonths tofiveyearsaredenominatedinCZK.LineOthersinotherreceivablesandfinancialassetsincludemainlyotherreceivablesfromemployeesandadvancespaid.Therearenosignificantrestrictionsregardingtherightsofuseimposedontheotherre-ceivablesandfinancialassets.Cumulativeimpairmentlossesreflecttheincurredrisksofthedebtors’delaysordefaults.TheallowancefortheimpairmentoftradereceivablesofCZK361million(2011:CZK365million)hasbeendeductedfrompresentedcarryingvaluesoftradereceivables.Thecarryingamountoftradere-ceivablesapproximatesthefairvalueatthebalancesheetdateafterthevaluationallowanceistakenintoaccount.

Notes to the consolidated financial statements 2012
85Annual Report 2012
9. Inventories (CZK million)
Carrying value as at 31 December 2012
Carrying value as at 31 December 2011
Structure of the inventories
Raw materials, consumables and supplies 4,546 4,818
Work in progress 2,751 2,368
Finished products and goods 11,322 8,875
Total 18,619 16,061
Theamountof inventories (includingproduction relatedpersonnelcostsandoverheadscapitalised intoinventories)recognisedasanexpenseduring2012wasCZK215,088million(2011:CZK208,208million).
10. Cash and cash equivalents (CZK million)
2012 2011
Cash in hand 4 4
Cash pooling 4,261 723
Bank accounts 1,104 2,976
Cash equivalents 35,098 27,548
Total 40,467 31,251
ThelineCashpoolingalsoincludesalsoovernightdepositsfromtheuseofcashpooling(Note3.2).ThelineCashequivalentsincludesdepositsinVolkswagenGroupcompanieswithoriginalmaturitylessthanthreemonths.ThesedepositsareincludedintheportfolioLoansandreceivablesintermsofIAS39.Theweightedaverageeffectiveinterestratebasedonthecarryingamountofbankaccountsasat31De-cember2012was0.08%(asat31December2011:1.91%).TheweightedaverageeffectiveinterestratebasedonthecarryingamountofdepositsinVolkswagenGroupcompanieswithoriginalmaturitylessthanthreemonthsasat31December2012was0.55%(asat31December2011:0.93%).OutofthetotalamountofdepositsprovidedtoVolkswagenGroupcompanieswithoriginalmaturitylessthanthreemonthsofCZK35,098million(asat31December2011:CZK27,548million)thereweredepositsdenominatedinCZKintheamountofCZK33,501million(asat31December2011:CZK23,309million),inEURintheamountofCZK0million(asat31December2011:CZK3,484million)anddepositsdenominatedinINRintheamountofCZK1,597million(asat31December2011:CZK755million).
11. Share capitalTheissuedsharecapitalconsistsof1,670,885ordinarysharesataparvalueofCZK10,000pershare.TheCompany’ssoleshareholderVolkswagenInternationalFinanceN.V.,Amsterdam,TheKingdomoftheNeth-erlands,holds 100%of theshares in theCompany.Volkswagen InternationalFinanceN.V. is indirectlya100%subsidiaryofVOLKSWAGENAG.TherewasnomovementintheGroup’ssharecapitalduringtheaccountingperiod2012(2011).TheCompanypaidadividendofCZK7,144millionin2012(2011:CZK4,702million).ThedividendpersharewasCZK4,276in2012(2011:CZK2,814).

Notes to the consolidated financial statements 2012
86 Annual Report 2012
12. Other reserves and retained earnings (CZK million)12.1 Other reserves
2012 2011
Currency translation reserve (502) (347)
Reserves for cash flow hedges* (2,766) (4,546)
Statutory reserve fund 3,366 3,366
Funds contributed by owner 10 10
Total 108 (1,517)
* Net of deferred tax from financial derivatives
Thestatutoryreservefundmaybeusedonlytooffsetlosses.Accordingtorelevantregulationsofthecom-mercialcodeoftheCzechRepublic,theCompanyisrequiredtotransfer5%ofitsannualnetprofittothestatutoryreservefunduntilthebalanceofthisreservereaches20%ofthesubscribedcapital.Movementinreserveforcashflowhedges:
Balance as at 1 January 2012 (CZK million) (4,546)
Total change in fair value in the period 613
Deferred tax on change in fair value (129)
Total transfers to profit or loss in the period – effective hedging 1,586
Total transfers to profit or loss in the period – ineffective hedging 12
Deferred tax on transfers to profit or loss (302)
Balance as at 31 December 2012 (2,766)
Balance as at 1 January 2011 (CZK million) 377
Total change in fair value in the period (4,540)
Deferred tax on change in fair value 875
Total transfers to profit or loss in the period – effective hedging (1,546)
Total transfers to profit or loss in the period – ineffective hedging 8
Deferred tax on transfers to profit or loss 280
Balance as at 31 December 2011 (4,546)
Thetransferfromreservesforcashflowhedgestoprofitorlossarisingfromeffectivehedgingisin2012presentedinthelineOtheroperatingexpenseinamountofCZK2,822million(2011:CZK1,076million)andinthelineOtheroperatingincomeinamountofCZK1,236million(2011:CZK2,622million).
12.2 Retained earnings
FromthetotalamountoftheGroup’sretainedearningsofCZK72,511millionasat31December2012(asat31December2011:CZK64,301million)unconsolidatedprofitfortheyear2012amountstoCZK15,354million(2011:CZK16,075million).Incompliancewiththerelevantregulationsofthecommercialcode,theunconsolidatedprofitoftheCom-panyfortheyear2012(determinedinaccordancewithIFRS)isgoingtobeappropriatedbasedonthedeci-sionoftheCompany’sannualgeneralmeeting.

Notes to the consolidated financial statements 2012
87Annual Report 2012
13. Financial, other and trade liabilities (CZK million)
Balance as at 31 December 2012 Financial liabilities at fair
value through profit or loss**
Financial liabilities carried at
amortised costs
Financial liabili-ties designated
as hedging instruments Other* Total
Financial liabilities
Loans and credits – 3,107 – – 3,107
Total – 3,107 – – 3,107
Other liabilities
Negative fair value of financial derivatives 505 – 4,197 – 4,702
Other tax liabilities (excl. income tax) – 221 – 3,190 3,411
Liabilities to employees – – – 1,857 1,857
Social security – – – 454 454
Others – – – 992 992
Total 505 221 4,197 6,493 11,416
Trade liabilities to
Third parties – 18,830 – 357 19,187
Related parties – 11,620 – – 11,620
Total – 30,450 – 357 30,807
* The category Other includes items that are not financial liabilities in terms of IAS 32.** Financial liabilities held for trading.
Note:The line Negative fair value of financial derivatives in the portfolio Financial liabilities designated as hedging instruments is represented by the spot component of financial derivatives and in the portfolio Financial liabilities at fair value through profit or loss it is represented by the forward component of financial derivatives (see also Note 2.7.3).

Notes to the consolidated financial statements 2012
88 Annual Report 2012
Balance as at 31 December 2011 Financial liabilities at fair
value through profit or loss**
Financial liabilities carried at
amortised costs
Financial liabili-ties designated
as hedging instruments Other* Total
Financial liabilities
Loans and credits – 3,141 – – 3,141
Total – 3,141 – – 3,141
Other liabilities
Negative fair value of financial derivatives (742) – 7,672 – 6,930
Other tax liabilities (excl. income tax) – 2,079 – 1,786 3,865
Liabilities to employees – – – 1,731 1,731
Social security – – – 433 433
Others – – – 616 616
Total (742) 2,079 7,672 4,566 13,575
Trade liabilities to
Third parties – 19,010 – 247 19,257
Related parties – 10,795 – 53 10,848
Total – 29,805 – 300 30,105
* The category Other includes items that are not financial liabilities in terms of IAS 32.** Financial liabilities held for trading.
Note:The line Negative fair value of financial derivatives in the portfolio Financial liabilities designated as hedging instruments is represented by the spot component of financial derivatives and in the portfolio Financial liabilities at fair value through profit or loss it is represented by the forward component of financial derivatives (see also Note 2.7.3). As the spot component exceeded the fair value as at 31 December 2011, the forward component is negative.
ThelineTradeliabilitiestorelatedpartiesincludesliabilitiestoafactoringcompanywithintheVolkswagenGroupofCZK2,470millionasat31December2012(2011:CZK2,302million).TheseliabilitiesaroseintheordinarycourseofbusinessanddonotrepresentfinancingoftheGroup.Thedetailed informationrelatingtothe liabilitiesarisingoutoffinancialderivativescanbefoundunderNote3.3.4.Thecarryingvalueforotherclassesoffinancialliabilities(otherliabilities,tradepayablesandloans)approxi-matesthefairvalueastheyincludeonlycurrentliabilities.Noneofthefinancialliabilitiesaresecuredbyalien.

Notes to the consolidated financial statements 2012
89Annual Report 2012
In the tablebelow, thefinancial conditionsattached to loans receivedaresummarisedat their carryingamounts:
Carrying amount as at 31 December 2012 Weighted average
effective interest
rate based on nominal
amount
Maturity
Currency
Interest terms
Interest commitment
endingNominal amount < 1 year 1-5 years > 5 years Total
CZK fixed 1-5 years 4.53% 3,000 107 3,000 – 3,107
Total financial liabilities 3,000 107 3,000 – 3,107
Carrying amount as at 31 December 2011 Weighted average
effective interest
rate based on nominal
amount
Maturity
Currency
Interest terms
Interest commitment
endingNominal amount < 1 year 1-5 years > 5 years Total
CZK fixed 1-5 years 4.53% 3,000 107 3,000 – 3,107
INR fixed < 1 year 10.50% 34 34 – – 34
Total financial liabilities 3,034 141 3,000 – 3,141

Notes to the consolidated financial statements 2012
90 Annual Report 2012
14. Deferred tax liabilities and assets (CZK million)Deferredincometaxassetsandliabilitiesareoffsetwhenthereisalegallyenforceablerighttooffsetthecurrenttaxassetsagainstcurrenttaxliabilities,andwhenthedeferredincometaxesrelatetothesamefiscalauthority.Asat31December2012theGrouprecognisedonthebalancesheetdeferredtaxassetsofCZK2,027million(asat31December2011:CZK2,668million).Themovementsindeferredtaxassetsandliabilitiesduringtheyear,withouttakingintoconsiderationtheoffsetting,areasfollows:
DepreciationFinancial
derivatives* ProvisionsConsolidation
differences Other Total
Deferred tax liabilities
Balance as at 1 January 2011 (2,582) (86) – – – (2,668)
Credited / (debited) to the income statement 86 – – – – 86
Charged to other comprehensive income – 86 – – – 86
Exchange differences (1) – – – – (1)
Balance as at 31 December 2011 (2,497) – – – – (2,497)
Credited / (debited) to the income statement (900) – – – – (900)
Charged to other comprehensive income – – – – – –
Exchange differences (14) – – – – (14)
Balance as at 31 December 2012 (3,411) – – – – (3,411)
DepreciationFinancial
derivatives* ProvisionsConsolidation
differences Other Total
Deferred tax assets
Balance as at 1 January 2011 – – 3,197 154 644 3,995
Credited / (debited) to the income statement – – 237 (122) 1 116
Charged to other comprehensive income – 1,069 – – – 1,069
Exchange differences – – 57 – (72) (15)
Balance as at 31 December 2011 – 1,069 3,491 32 573 5,165
Credited / (debited) to the income statement – 14 243 125 340 722
Charged to other comprehensive income – (431) – – – (431)
Exchange differences – – (21) – 3 (18)
Balance as at 31 December 2012 – 652 3,713 157 916 5,438
* Further information on financial derivatives is disclosed in Note 2.7.3.
TheGroupdidnotrecognisedeferredtaxassets (fromtax losses) intheamountofCZK510million,be-causeitsutilisationisnotexpected.Asat31December2011,theunrecogniseddeferredtaxassetwasCZK329million.

Notes to the consolidated financial statements 2012
91Annual Report 2012
15. Non-current and current provisions (CZK million)
Provisions for
warranty claims
Provisions for other
obligations arising
from sales
Provisions for
personnel costs
Provisions for the
disposal of end-of-life
vehicles
Provisions for
litigation risks
Provisions for
purchase risks
Other provisions Total
Balance as at 1 January 2011 10,950 3,128 1,618 910 1,593 784 1,305 20,288
Utilised (3,546) (2,469) (438) – (1) (161) (570) (7,185)
Additions 5,071 3,792 1,746 81 76 719 1,314 12,799
Interest expense / (income) 83 (19) – 80 – – – 144
Reversals (149) (336) (191) (272) (176) (611) (148) (1,883)
Foreign exchange differences 53 101 – 24 – – (33) 145
Balance as at 1 January 2012 12,462 4,197 2,735 823 1,492 731 1,868 24,308
Utilised (4,311) (3,003) (1,311) – (2) (543) (28) (9,198)
Additions 4,839 3,181 1,428 46 138 268 756 10,656
Interest expense / (income) 185 9 – 53 – – – 247
Reversals (249) (267) (268) (379) (414) (188) (506) (2,271)
Foreign exchange differences (89) 94 (4) (19) (42) – (3) (63)
Balance as at 31 December 2012 12,837 4,211 2,580 524 1,172 268 2,087 23,679
Non-currentandcurrentprovisionsaccordingtothetimeofexpecteduseofresources:
< 1 year 1-5 years > 5 years Total
Balance as at 31 December 2012
Provisions for warranty claims 4,336 7,548 953 12,837
Provisions for other obligations arising from sales 3,803 408 – 4,211
Provisions for personnel costs 1,534 411 635 2,580
Provisions for the disposal of end-of-life vehicles – – 524 524
Provisions for litigation risks 1,172 – – 1,172
Provisions for purchase risks 268 – – 268
Other provisions 1,873 214 – 2,087
Total 12,986 8,581 2,112 23,679

Notes to the consolidated financial statements 2012
92 Annual Report 2012
< 1 year 1-5 years > 5 years Total
Balance as at 31 December 2011
Provisions for warranty claims 3,830 7,667 965 12,462
Provisions for other obligations arising from sales 3,816 381 – 4,197
Provisions for personnel costs 1,723 328 684 2,735
Provisions for the disposal of end-of-life vehicles – – 823 823
Provisions for litigation risks 1,492 – – 1,492
Provisions for purchase risks 731 – – 731
Other provisions 1,686 182 – 1,868
Total 13,278 8,558 2,472 24,308
Theprovisionforwarrantyrepairsincludesprovisionforbasicguarantees(2years),provisionforcorrosionguarantees(dependentonthemodelfor10or12years)andotherguaranteesbeyondthescopeofbasicwarrantyespeciallygood-willrepairs(the3rdand4thyear).TheGrouprecognisestheprovisionforwarrantyclaimsatthemomentofsaleonthebasisofthenumberofsoldcarsandinadvancedeterminedratesforindividualmodellines.Provisionsforotherobligationsarisingfromsales includeprovisionforsalediscounts,salebonusesandsimilarallowancesincurred,settlementofwhichisexpectedafterthebalancesheetdate,butforwhichthereisalegalorconstructiveobligationattributabletosalesrevenuebeforethebalancesheetdate.Theadditionstoprovisionforotherobligationsarisingfromsalesaredecreasingrevenues.Provisionsforpersonnelcostsincludemainlyprovisionsforotherlong-termemployeebenefits,severancepaymentsandprovisionformanagementpersonnelremuneration.Provisionsfordisposalofend-of-lifevehiclesrelatetocostsofliquidationofend-of-lifevehiclesaccordingtoEUdirectiveno.2000/53/ECandaredeterminedmainlyonthebasisofregisteredcarsintherespectivecountries,officialstatistics,expectedcostsofthecarsecologicalscrappingandlegalrequirementsvalidinindividualcountries.Provisionsforlitigationrisksrelatemainlytoprovisionforrisksarisingfromlegaldisputes,legalfees,penaltyinterestandotherlitigationrisks.TheGroupprovidesfortheprobablecashoutflowsforexistinglegalandarbitrationproceedingsbymeansofarelevantprovision.TheGroupisnotinvolvedinanylegalcasesorarbitrationproceedingsforwhichnoprovisionhasbeencre-atedandwhichcouldhaveasignificantimpactonthefinancialpositionandthefinancialresults(financialstatements)oftheGroupandtherearenosuchproceedingsexpectedinthenearfuture.Provisions forpurchase risks includemainlyprovision for risksof retrospectivechanges inpricesof rawmaterialsandparts.OtherprovisionsincludemainlyprovisionfortaxrisksandcustomsrisksincountrieswheretheGroupoper-ates.

Notes to the consolidated financial statements 2012
93Annual Report 2012
16. Cash flow statementThecashandcashequivalentscontainedinthecashflowstatementalsocomprise,inadditiontocashandshort-termdeposits,short-termdepositsinVolkswagenGroupcompanieswithoriginalmaturityoflessthanthreemonths.ThedetailedinformationrelatingtothecashandcashequivalentscanbefoundunderNote10.Cashflowsarepresentedinthecashflowstatementandareclassifiedintocashflowsfromoperatingac-tivities,investingactivitiesandfinancingactivities.Cashflowsfromoperatingactivitiesarederivedindirectlyfromprofitbeforetax.Profitbeforetaxisadjustedtoeliminatenon-cashexpenses(mainlydepreciationandamortisation)andincomeandchangesinworkingcapital.Investingactivitiesincludeadditionstoproperty,plantandequipment,financialassets,aswellastocapi-taliseddevelopmentcost.Financingactivitiesincludeinadditiontotheoutflowsofcashfromdividendpay-ments,redemptionofliabilitiesfromfinancing,alsooutflowsandinflowsfromotherborrowings.
17. Sales (CZK million)
2012 2011
Cars 222,341 212,787
Spare parts and accessories 19,293 17,930
Supplies of components within Volkswagen Group 14,443 15,363
Revenues from license fees 1,897 1,248
Services related to sales 292 180
Other 4,383 5,054
Total 262,649 252,562
Othersalesrelatemainlytosalesofresultsoftechnicaldevelopment,scrap,toolingandusedcars.
18. Other operating income (CZK million)
2012 2011
Foreign exchange gains 2,790 2,627
Income from derivative transactions 1,158 2,219
Gains on non-current assets disposal 44 10
Reversal of provisions and accruals 2,816 2,868
Reversal of provision for receivables 53 53
Services – others 630 339
Gain on disposal of a subsidiary 220 –
Other 2,411 1,924
Total 10,122 10,040
Foreignexchangegainsincludemainlygainsfromdifferencesinexchangeratesbetweenthedatesofrec-ognitionandpaymentofreceivablesandpayablesdenominatedinforeigncurrencies,aswellasexchangerategainsresultingfromrevaluationasatthebalancesheetdateofthesereceivablesandpayables.For-eignexchangelossesfromtheseitemsareincludedinotheroperatingexpenses.

Notes to the consolidated financial statements 2012
94 Annual Report 2012
Reversalofprovisionsandaccrualsresultedfromchangesinestimatesdrivenmainlybythechangedexter-nalconditionsandcircumstancesonwhichtheGroupbasedtheestimates.
19. Other operating expenses (CZK million)
2012 2011
Foreign exchange losses 2,364 2,728
Losses from derivative transactions 3,158 1,078
Receivables write-offs 101 12
Other 1,446 899
Total 7,069 4,717
20. Financial result (CZK million)
2012 2011
Interest income 627 708
Foreign exchange gains from cash 6 45
Foreign exchange gains from spot operations 340 337
Income from other investments 84 125
Gains on revaluation of financial derivatives including ineffective hedging 632 1,542
Financial income total 1,689 2,757
Interest expenses 878 761
Foreign exchange losses from cash 14 49
Foreign exchange losses from spot operations 338 378
Loss on revaluation of financial derivatives including ineffective hedging 1,714 778
Financial expenses total 2,944 1,966
Net financial result (1,255) 791

Notes to the consolidated financial statements 2012
95Annual Report 2012
21. Net gains and losses from financial instruments (CZK million)
2012 2011
Financial instruments at fair value through profit or loss (1,084) 783
Loans and receivables 339 760
Available for sale financial assets 1 21
Financial liabilities carried at amortised costs 84 (792)
Financial instruments designated as hedging instruments (1,586) 1,546
Net gains / (losses) total (2,246) 2,318
ThelineFinancialinstrumentsatfairvaluethroughprofitorlossrepresentsgainsorlossesinparticularfromtheforwardcomponentofcurrencyforwardsandswaps.Otheritemscontainmainlyunrealisedandrealisedforeignexchangegainsandlossesontradereceivablesandliabilities,fromhedginginstruments,interestincomefromdepositsincompanieswithinVolkswagenGroupprovidednetinterestlossfromderivativehedginginstruments,foreignexchangegains/lossesfrombankdepositsandimpairmentlossesonfinancialassets.
22. Income tax (CZK million)
2012 2011
Current tax expense – domestic 2,134 3,127
Current tax expense – foreign 356 275
Current tax expense – total 2,490 3,402
Deferred tax income – domestic 196 (139)
Deferred tax income – foreign (106) (63)
Deferred tax income – total 90 (202)
Income tax total 2,580 3,200
StatutoryincometaxrateintheCzechRepublicforthe2012assessmentperiodwas19%(2011:19%).Asat31December2012and31December2011,deferredincometaxesattributabletotheCzechtaxjuris-dictionweremeasuredatataxrateof19%thatcorrespondswiththestatutorytaxratesenactedforthefutureperiodswhenrealisationofdeferredtaxassetsandliabilitiesisexpected.ThelocalincometaxratesappliedforcompaniesoutsidetheCzechRepublicvarybetween19%and32.45%.

Notes to the consolidated financial statements 2012
96 Annual Report 2012
Reconciliation of expected to effective income tax expense (CZK million)
2012 2011
Profit before income tax 17,934 19,275
Expected income tax expense at 19% (2011: 19%) 3,407 3,662
Effect of different tax rates outside the Czech Republic 88 93
Proportion of taxation relating to:
Permanent differences resulting from:
Tax exempt income and share on profit on associates (344) (133)
Expenses not deductible for tax purposes 77 214
Tax allowances and other tax credits (429) (659)
Prior-period current tax expense 366 (114)
Effect of tax rate changes (14) –
Reassessment and recognition of deferred tax from unused tax credits from investment incentives (585) 110
Other taxation effects 14 27
Effective income tax expense 2,580 3,200
Effective income tax rate 14% 17%
LineTaxallowancesandothertaxcreditsrepresentsmainlytaxcreditsfromdoubledeductionofresearchanddevelopmentcosts.
23. Subsidies and investment incentivesSubsidiesIn2012,theCompanyrecognisedincomefromsubsidiesofentrepreneurialactivitiesandemployeetrainingandretrainingcostsintheamountofCZK123million(2011:CZK66million).
Investment incentivesTobegrantedtheinvestmentincentives,theCompanyhastomeettheGeneralconditionsof§2art.2oftheActNo.72/2000Coll.,onInvestmentIncentives,asamendedandconditionsof§6aart.2and5ofthesameactandSpecialconditions§35boftheActNo.586/1992Coll.,onIncomeTaxasamended.FortheinvestmentincentivesgrantedtotheCompany,thetotalamountoftheincentiveisalwaysdependentontheamountinvested.InaccordancewiththeActonInvestmentIncentivesandbasedonrespectiveresolu-tions,theCompanywasgrantedthefollowinginvestmentincentiveswhichcanbeutilisedintheformoftaxcredit:
Model A SUVThetotalamountoftheincentiveislimitedtotheamountofCZK561million.Theprojectwascompletedin2010.Asat31December2012(2011),utilisationoftheinvestmentincentiveintheformoftaxcreditwasregardedasuncertainbytheCompanyandtherefore,norelateddeferredtaxassetwasrecognised.
Enlargement of production of parts of engine EA211 and its assemblyThetotalamountoftheincentiveislimitedtoCZK800million.In2012(2011),theprojectwasinprogressandtheCompanyexpectsutilisationoftheinvestmentincentiveinthefuture.Theamountofdeferredtaxassetrecognisedasat31December2012isCZK531million(31December2011:CZK0million).CZK429millionoutofthisamountrelatestoamountsinvestedinpriorperiods.Thedeferredtaxassetwasnotrecognisedasat31December2011becauseutilisationwasregardedasuncertain.

Notes to the consolidated financial statements 2012
97Annual Report 2012
Enlargement of production of transmissions – MQ 100ThetotalamountoftheincentiveislimitedtoCZK496million.In2012(2011),theprojectwasinprogressandtheCompanyexpectsutilisationoftheinvestmentincentiveinthefuture.Theamountofdeferredtaxassetrecognisedasat31December2012isCZK390million(31December2011:CZK335million).
Enlargement of technical development – Česana Jih premisesThetotalamountoftheincentiveislimitedtoCZK306million.Therealisationoftheprojectisexpectedinthefollowingyears.TheGroupwasalsograntedincentivesintheformofdeferralofpaymentofsalestaxliabilities.Thecarry-ingamountoftheliabilityamountedtoCZK1,766millionasat31December2012(2011:CZK2,074million).
24. Contingent liabilities Thetaxauthoritiesmayatanytimeinspecttheaccountingbooksandrecordssubsequentlytothereportedtaxyearasgovernedbytherespectivelegislation,andmayimposeadditionaltaxassessmentsandpenal-ties.TheGroupmanagement isnotawareofanycircumstancesthatcouldresult inmaterial liabilitiesarisingfromthetaxauditscarriedoutatpresentorpotentiallyinthefuture,exceptforthetaxrisksforwhichprovi-sionfortaxriskshasbeencreated(seeNote15).
25. Contractual obligations and other future commitments (CZK million)
Futurecommitmentsasatbalancesheetdateareasfollows:
Payable until year 2013 Payable 2014-2017 31 December 2012
Investment commitments – property, plant and equipment 9,037 607 9,644
Investment commitments – intangible assets 3,857 3,434 7,291
Operating leasing payments 313 252 565
Payable until year 2012 Payable 2013-2016 31 December 2011
Investment commitments – property, plant and equipment 10,926 1,328 12,254
Investment commitments – intangible assets 5,941 3,099 9,040
Operating leasing payments 184 584 768
Onthebasisofnon-cancellableoperatingleaseagreements,theGrouprentedvariousmachinesandofficeequipmentandbuildings.Inthecaseofterminationoftheseagreements,alloutstandingleasepaymentsuptotheoriginalexpirationdateofthecontractmustbepaid.

Notes to the consolidated financial statements 2012
98 Annual Report 2012
26. Expenses by nature – additional information (CZK million)
2012 2011
Material costs – raw materials and other supplies, goods 179,183 169,932
Production related services 9,675 14,843
Personnel costs 19,099 18,044
Wages 14,545 13,781
Pension benefit costs (defined contribution plans) 2,702 2,507
Social insurance and other personnel costs 1,852 1,756
Depreciation, amortisation and impairment losses 11,932 12,746
Other services 27,896 24,063
Total cost of sales, distribution and administrative expenses 247,785 239,628
Number of employees
Number of employees* 28,546 27,936
* Average number of employees (including temporary employees).
27. Related party transactionsIn2012,therewerenochangesintheownershipstructureoftheCompanyandthecompanyVOLKSWAGENAGhasbeentheultimateparentcompanyandtheultimatecontrollingpartyoftheCompanyfortheentireaccountingperiod.On1August2012,thecompanyVOLKSWAGENAGgainedfullcontroloverthePorscheAGGroup.Sincethatdate,allcompaniesofthisgrouparefullyconsolidatedbytheultimateparentVOLKSWAGENAGandareincludedinthecategoryCompaniescontrolledbyultimateparentcompany.ItemsincategoryOtherrelatedpartiesarecompaniesunderjointcontrolofVOLKSWAGENAG,however,accordingtothelawtheydonotmeetthedefinitionofanentitycontrolledbythesamecontrollingentitypursuantto§66aoftheActNo.513/1991Coll.,CommercialCode,asamended.In2012and2011,thiscategoryincludesmainlytransactionswithShanghaiVolkswagenAutomotiveCompanyLtd.andwiththosecompa-niesofthePorscheHoldingGmbHGroupandthePorscheAGGroup,whichwerenotfullyconsolidatedintherespectiveperiodsbytheultimateparentVOLKSWAGENAG.

Notes to the consolidated financial statements 2012
99Annual Report 2012
The Group participated in the following transactions with related parties:
Sales to related parties (CZK million)
2012 2011
Parent company
Volkswagen International Finance N.V. – –
Ultimate parent company
VOLKSWAGEN AG 3,759 5,352
Associates
OOO VOLKSWAGEN Group Rus 24,845 16,462
Companies controlled by ultimate parent company 91,653 76,919
Other related parties 2,149 2,387
Total 122,406 101,120
TheabovetableSalestorelatedpartiescomprisesonlyrevenuesfromsalesofvehicles,sparepartsandsuppliesofvehiclecomponents.InadditiontorevenuesspecifiedinthetableSalestorelatedparties,in2012(2011)theGroupalsorealisedrevenuesfromroyalties:
2012 2011
Revenues from license fees
Ultimate parent company – 112
Associates 129 72
Companies controlled by ultimate parent company – –
Other related parties 1,768 1,039
Total 1,897 1,223
InadditiontorevenuesspecifiedinthetableSalestorelatedparties,in2012(2011)theGroupalsorealisedrevenueswithrelatedpartiesrelatingtointerestfromintercompanydeposits:
2012 2011
Interest income from deposits
Ultimate parent company 2 8
Associates – –
Companies controlled by ultimate parent company 318 416
Other related parties – –
Total 320 424
InadditiontotherevenuesspecifiedinthetableSalestorelatedpartiesin2012Grouprecognisedrevenueondisposalofits51%shareonthesubsidiarySkodaAutoPolskaS.A.toparentVolkswagenInternationalFinanceN.V.(seeNote11)intheamountofCZK361million.MoredetailedinformationaboutthedisposalofthesubsidiaryisincludedinNote29.DividendsreceivedfromassociatesaredisclosedinNote7.

Notes to the consolidated financial statements 2012
100 Annual Report 2012
Purchases from related parties (CZK million)
2012 2011
Parent company
Volkswagen International Finance N.V. – –
Ultimate parent company
VOLKSWAGEN AG 36,920 35,029
Associates
OOO VOLKSWAGEN Group Rus 331 203
Companies controlled by ultimate parent company 48,094 38,348
Other related parties 37 76
Total 85,381 73,656
ThetablePurchasesfromrelatedpartiescomprisesonlypurchasesrelatingtotradeactivities.TheamountofdividendspaidtotheparentcompanyisdisclosedinNote11.
Receivables from related parties (CZK million)
2012 2011
Parent company
Volkswagen International Finance N.V. – –
Ultimate parent company
VOLKSWAGEN AG 553 325
Associates
OOO VOLKSWAGEN Group Rus 2,932 3,508
Companies controlled by ultimate parent company 2,770 3,710
Other related parties 2,449 1,147
Total 8,704 8,690
Theabovetablecomprisestradereceivablesandreceivablesfromroyalties.Receivablesfromroyaltiesarespecifiedbelow.
2012 2011
Receivables from royalties
Ultimate parent company – –
Associates 169 84
Companies controlled by ultimate parent company – –
Other related parties 2,097 519
Total 2,266 603

Notes to the consolidated financial statements 2012
101Annual Report 2012
Inadditiontotradereceivablesandreceivablesfromroyalties,theGroupalsohaddepositsincompaniescontrolledbyultimateparentcompanyinthetotalamountofCZK38,094million(31December2011:CZK49,037million).Receivablesfrominterestfromthedepositsasat31December2012amountedtoCZK37million(31December2011:CZK51million).Averageinterestraterelatingtothesedeposits isdisclosedinNote8andNote10.ReceivablesfromrelatedpartiesareconsideredbytheGrouptobeoftheleastrisk.Theproductsdeliveredtotherelatedpartiesaresuppliedoncredittermsortheresultingreceivablesaretransferredtofactoringcompanies.Noimpairmentlosswasidentifiedforanyofthereceivablesfromrelatedparties.CashpoolingbalancewithVolkswagenGroupServicesS.A.isdisclosedinNote10.InvestmentsinassociatesaredisclosedinNote7.
Liabilities to related parties (CZK million)
31 December 2012 31 December 2011
Parent company
Volkswagen International Finance N.V. – –
Ultimate parent company
VOLKSWAGEN AG 1,877 1,886
Associates
OOO VOLKSWAGEN Group Rus 16 18
Companies controlled by ultimate parent company 9,696 8,884
Other related parties 31 60
Total 11,620 10,848
Liabilitiestorelatedpartiesrepresentonlytradeliabilitiesforallthecategoriesstatedabove.Inadditiontothetradeliabilitiesstatedinthetableabove,theGrouphadaliabilityfromaloanfromVOLKS-WAGENAGoftotalamountofCZK3,000millionasat31December2012(31December2011:CZK3,000mil-lion).InterestpayablerelatingtothisloanamountstoCZK107millionasat31December2012(31December2011:CZK107million).DetailsabouttheloanarespecifiedinNote13.
31 December 2012 31 December 2011
Contractual obligations and other future commitments
Ultimate parent company 6,958 8,284
Associates – –
Companies controlled by ultimate parent company 345 736
Other related parties – –
Total 7,303 9,020
Contractualobligationstorelatedpartiesincludemainlycommitmentsinrespectofresearchanddevelop-mentcostsandtoolingrights.

Notes to the consolidated financial statements 2012
102 Annual Report 2012
Information on key management personnel remuneration (CZK million)
2012 2011
Salaries and other short-term employee benefits* 487 355
Other long-term employee benefits 12 14
Total 499 369
* Salaries and other short-term employee benefits include besides wages, salaries, bonuses and non-monetary remuneration also health and social insurance paid by employer for employees.
KeymanagementpersonnelincludemembersoftheBoardofDirectors,SupervisoryBoardandmanagersoftheGrouphavingauthorityandresponsibilityforplanning,directingandcontrollingtheactivitiesoftheGroup.TheremunerationofthemembersoftheBoardofDirectors,SupervisoryBoardandotherkeymanagementpersonnelincludestheremunerationpaid,payableorprovidedbytheGroupintheformofwages,salaries,bonusesandnon-monetaryremuneration.CZK252millionoutofthetotalamountdisclosedinthelineSalariesandothershort-termemployeeben-efitswasoutstandingasat31December2012(31December2011:CZK130million).
28. Other information (CZK million)Thecompensationpaid to theGroup’sauditors for theaccountingperiodwasCZK37million (2011:CZK36million)andcoveredthefollowingservices:
2012 2011
Audit and other assurance services 19 20
Tax and related services 4 6
Other advisory services 14 10
Total 37 36

Notes to the consolidated financial statements 2012
103Annual Report 2012
29. Disposal of the subsidiaryThefollowingtablepresentstheanalysisofassetsandliabilitiesofthesubsidiarySkodaAutoPolskaS.A.asat1January2012whentheCompanysoldthewhole51%share:
2012
Intangible assets 20
Property, plant and equipment 10
Deferred tax asset 89
Inventories 416
Trade receivables 331
Prepaid income tax 45
Other receivables and financial assets 7
Cash 996
Trade payables (960)
Other current liabilities (695)
Current provisions (29)
Total net assets 230
Non-controlling interest (140)
Company's share on net assets disposed of 90
Gain on disposal of the subsidiary
2012
Consideration received in cash 361
Company's share on net assets disposed of (90)
Cumulative foreign exchange loss recycled from other comprehensive income to profit or loss (51)
Gain / (loss) on disposal of a subsidiary 220
GainondisposalofthesubsidiaryintheamountofCZK220millionisincludedinotheroperatingincome(seeNote18).
Net cash outflow arising from disposal of the subsidiary
2012
Consideration received in cash 361
Consideration transferred in cash (996)
Net cash inflow / (outflow) on disposal of a subsidiary (635)

Notes to the consolidated financial statements 2012
104 Annual Report 2012
30. Significant events after the balance sheet dateAfterthebalancesheetdate,therewerenoeventsthatcouldhaveasignificantimpactontheconsolidatedfinancialstatementsoftheGroupfortheyearended31December2012.

Notes to the consolidated financial statements 2012
105Annual Report 2012
31. Information about Volkswagen Group ŠKODA AUTO a.s. is a subsidiary included in the consolidation group of its ultimate parent company VOLKSWAGENAGwitharegisteredofficeinWolfsburg,theFederalRepublicofGermany.TheVolkswagenGroupconsistsoftwodivisions-AutomotiveandFinancialServices.TheactivitiesrelatedtotheAutomotiveDivisionincludethedevelopmentofcarsandaggregates,productionandsaleofpas-sengerandcommercialcars,trucksandbusesaswellasthebusinesswithspareparts,large-boredieselengines,specialgearunitsandturbomachinery.ThefollowingbrandsbelongtoVolkswagenGroup:Volk-swagenPassengerCars,Audi,ŠKODA,SEAT,Bentley,Porsche,VolkswagenCommercialVehicles,Bugatti,Scania,MANandLamborghini.TheFinancialServicesDivision includesactivities related to thedealer andcustomerfinancing, leasing,bankingandinsuranceservicesandthefleetmanagement.ŠKODAAUTOand its subsidiaries (ŠKODAAUTODeutschlandGmbH, ŠKODAAUTOSlovensko, s.r.o. andSkodaAutoIndiaPrivateLtd.)andassociateOOOVOLKSWAGENGroupRusareincludedintheconsolidationofVolkswagenGroup’sfinancialstatements.Theseconsolidatedfinancialstatements,andotherinforma-tionrelatingtotheVolkswagenGroup,areavailableintheannualreportofVOLKSWAGENAGandonitsinternetsite(www.volkswagenag.com).
MladáBoleslav,14February2013
TheBoardofManagement:
WinfriedVahland
WinfriedKrause BohdanWojnar FrankWelsch
WernerEichhorn KarlheinzEmilHell MichaelOeljeklaus
Personsresponsibleforaccounting:
DanaNěmečková JanaFernándezZambrano

106 Annual Report 2012
Auditor´s report on the separate financial statements
Auditor s report on the separate financial statements
Independent auditor’s report to the shareholder of ŠKODA AUTO a.s.
WehaveauditedtheaccompanyingseparatefinancialstatementsofŠKODAAUTOa.s.,identificationnum-ber00177041,withregisteredofficeatTř.VáclavaKlementa869,MladáBoleslav (“theCompany”),whichcomprisethebalancesheetasat31December2012,thestatementsof income,comprehensiveincome,changesinequityandcashflowsfortheyearthenendedandnotes, includingasummaryofsignificantaccountingpolicies(“theseparatefinancialstatements”).
Board of Directors’ Responsibility for the Separate Financial StatementsTheBoardofDirectorsisresponsibleforthepreparationoftheseparatefinancialstatementsthatgiveatrueandfairviewinaccordancewithInternationalFinancialReportingStandardsasadoptedbytheEuro-peanUnion,andforsuchinternalcontrolsastheBoardofDirectorsdeterminesisnecessarytoenablethepreparationoffinancialstatementsthatarefreefrommaterialmisstatement,whetherduetofraudorerror.
Auditor’s ResponsibilityOurresponsibilityistoexpressanopinionontheseseparatefinancialstatementsbasedonouraudit.WeconductedourauditinaccordancewiththeActonAuditorsoftheCzechRepublic,InternationalStandardsonAuditingandtherelatedapplicationguidanceoftheChamberofAuditorsoftheCzechRepublic.Thosestandardsrequirethatwecomplywithethicalrequirementsandplanandperformtheaudittoobtainrea-sonableassuranceaboutwhetherthefinancialstatementsarefreefrommaterialmisstatement.
PricewaterhouseCoopers Audit, s.r.o., Hvězdova 1734/2c, 140 00 Prague 4, Czech Republic T: +420 251 151 111, F: +420 251 156 111, www.pwc.com/cz PricewaterhouseCoopers Audit, s.r.o., registered seat Hvězdova 1734/2c, 140 00 Prague 4, Czech Republic, Identification Number: 40765521, registered with the Commercial Register kept by the Municipal Court in Prague, Section C, Insert 3637, and in the Register of Audit Companies with the Chamber of Auditors of the Czech Republic under Licence No 021.

107Annual Report 2012
Auditor´s report on the separate financial statements
Anauditinvolvesperformingprocedurestoobtainauditevidenceabouttheamountsanddisclosuresinthefinancialstatements.Theproceduresselecteddependontheauditor’s judgment, includingassessmentoftherisksofmaterialmisstatementofthefinancialstatements,whetherduetofraudorerror.Inmakingthoseriskassessments,theauditorconsidersinternalcontrolrelevanttothepreparationofthefinancialstatementsthatgiveatrueandfairviewinordertodesignauditproceduresthatareappropriateinthecir-cumstances,butnotforthepurposeofexpressinganopinionontheeffectivenessoftheinternalcontrol.Anauditalsoincludesevaluatingtheappropriatenessoftheaccountingpoliciesusedandthereasonable-nessofaccountingestimatesmadebymanagement,aswellasevaluatingtheoverallpresentationofthefinancialstatements.Webelievethattheauditevidencewehaveobtainedissufficientandappropriatetoprovideabasisforourauditopinion.
OpinionInouropinion,theseparatefinancialstatementsgiveatrueandfairviewofthefinancialpositionoftheCompanyasat31December2012,itsfinancialperformanceanditscashflowsfortheyearthenendedinaccordancewithInternationalFinancialReportingStandardsasadoptedbytheEuropeanUnion.
14February2013
representedby
Jiří Zouhar Pavel KulhavýPartner StatutoryAuditor,LicenceNo.1538
Note: Our report has been prepared in the Czech language and in English. In all matters of interpretation of information, views or opinions, the Czech version of our report takes precedence over the English version.

108 Annual Report 2012
Separate financial statements for the year ended 31 december 2012
Separate financial statements for the year ended 31 December 2012
Income statement for the year ended 31 December 2012 (CZK million)
Note 2012 2011
Sales 18 239,101 231,742
Cost of sales 27 203,216 201,765
Gross profit 35,885 29,977
Distribution expenses 27 13,724 11,613
Administrative expenses 27 6,155 5,504
Other operating income 19 7,207 8,347
Other operating expenses 20 6,209 3,983
Operating profit 17,004 17,224
Financial income 2,163 2,790
Financial expenses 3,455 2,859
Financial result 21 (1,292) (69)
Profit before income tax 15,712 17,155
Income tax expense 23 2,453 2,867
Profit for the year 13,259 14,288
Statement of comprehensive income for the year ended 31 December 2012 (CZK million)
Note 2012 2011
Profit for the year 13,259 14,288
Cash flow hedges 13 1,780 (4,861)
Other comprehensive income / (loss) 1,780 (4,861)
Total comprehensive income for the year 15,039 9,427
Thenotesonpages112to167areanintegralpartofthesefinancialstatements.

109Annual Report 2012
Separate financial statements for the year ended 31 december 2012
Balance sheet as at 31 December 2012 (CZK million)
Note 31 December 2012 31 December 2011
Assets
Intangible assets 5 18,679 13,531
Property, plant and equipment 6 55,108 45,397
Investments in subsidiaries 7 247 247
Investments in associates 8 2,352 2,352
Other receivables and financial assets 9 4,188 1,152
Deferred tax asset 15 1,012 1,762
Non-current assets 81,586 64,441
Inventories 10 9,528 8,437
Trade receivables 9 11,177 11,695
Other receivables and financial assets 9 3,793 26,893
Prepaid income tax 420 –
Cash and cash equivalents 11 34,738 24,105
Current assets 59,656 71,130
Total assets 141,242 135,571
Note 31 December 2012 31 December 2011
Equity and liabilities
Share capital 12 16,709 16,709
Share premium 1,578 1,578
Retained earnings 13 69,405 63,290
Other reserves 13 610 (1,170)
Equity 88,302 80,407
Non-current financial liabilities 14 3,000 3,000
Other non-current liabilities 14 3,496 4,965
Non-current provisions 16 6,961 7,361
Non-current liabilities 13,457 15,326
Current financial liabilities 14 107 107
Trade payables 14 25,624 24,466
Other current liabilities 14 4,447 4,676
Current income tax liabilities – 1,184
Current provisions 16 9,305 9,405
Current liabilities 39,483 39,838
Total equity and liabilities 141,242 135,571
Thenotesonpages112to167areanintegralpartofthesefinancialstatements.

110 Annual Report 2012
Separate financial statements for the year ended 31 december 2012
Statement of changes in equity for the year ended 31 December 2012 (CZK million)
Share capitalShare
premiumRetained earn-
ingsOther
reserves* Total equity
Balance as at 1 January 2011 16,709 1,578 53,704 3,691 75,682
Profit for the year – – 14,288 – 14,288
Other comprehensive income/(loss) – – – (4,861) (4,861)
Total comprehensive income for the year – – 14,288 (4,861) 9,427
Dividends paid – – (4,702) – (4,702)
Balance as at 31 December 2011 16,709 1,578 63,290 (1,170) 80,407
Balance as at 1 January 2012 16,709 1,578 63,290 (1,170) 80,407
Profit for the year – – 13,259 – 13,259
Other comprehensive income/(loss) – – – 1,780 1,780
Total comprehensive income for the year – – 13,259 1,780 15,039
Dividends paid – – (7,144) – (7,144)
Balance as at 31 December 2012 16,709 1,578 69,405 610 88,302
* Explanatory notes on Other reserves are presented in Note 13.
Thenotesonpages112to167areanintegralpartofthesefinancialstatements.

111Annual Report 2012
Separate financial statements for the year ended 31 december 2012
Cash flow statement for the year ended 31 December 2012 (CZK million)
Note 2012 2011
Cash and cash equivalents as at 1 January 17 24,105 29,256
Profit before income tax 15,712 17,155
Depreciation and impairment of non-current assets 5, 6 11,792 12,601
Change in provisions (611) 2,287
Gain on disposal of non-current assets (10) (11)
Net interest (income) / expense 21 98 53
Change in inventories (1,092) 117
Change in receivables 1,069 (2,783)
Change in liabilities (398) 901
Income tax paid from operating activities (3,738) (3,081)
Interest paid (356) (384)
Interest received 389 456
Dividends income 21 (455) (388)
Impairment losses of investments in subsidiaries 7, 21 922 1,141
Unrealised (gains) and losses from derivatives and other adjustments for non-cash transactions 857 (797)
(Gain) / loss on disposal of a subsidiary 7 (360) –
Cash flows from operating activities 23,819 27,267
Purchases of non-current assets (18,376) (13,312)
Additions to capitalised development costs 5 (6,104) (3,306)
Increase in financial investments 8 (922) –
(Increase) / decrease in short-term deposits* 9 21,533 (11,500)
Increase in long-term deposits 9 (3,033) –
Proceeds from sale of non-current assets 44 14
Proceeds from dividends 455 388
Proceeds from sale of the subsidiary 361 –
Cash flows from investing activities (6,042) (27,716)
Net cash flows (operating and investing activities) 17,777 (449)
Dividends paid 12 (7,144) (4,702)
Cash flows from financing activities (7,144) (4,702)
Net change in cash and cash equivalents 10,633 (5,151)
Cash and cash equivalents as at 31 December 17 34,738 24,105
* Deposits which do not meet criteria of cash equivalents according to IAS 7.
Thenotesonpages112to167areanintegralpartofthesefinancialstatements.

112 Annual Report 2012
Notes to the separate financial statements 2012
Notes to the separate financial statements 2012
Company informationFoundation and company enterprises
ŠKODAAUTOa.s.(“theCompany”)wasincorporatedasajoint-stockcompanyon20November1990.TheCompany’sprincipalbusinessactivitiesarethedevelopment,productionandsaleofvehiclesandrelatedaccessories.Registeredoffice: Tř.VáclavaKlementa869 29360MladáBoleslav CzechRepublic IČ:00177041 wwwaddress:www.skoda-auto.czTheCompanyisregisteredintheCommercialRegistermaintainedwiththeMunicipalCourtinPrague,Sec-tionB,Insert332,withFileNo.Rg.B332.
TheorganisationalstructureoftheCompanyisdividedintothefollowingmainareas:– Centralmanagementdepartment– Technicaldevelopment– Productionandlogistics– Salesandmarketing– Commercialaffairs– Humanresourcemanagement– PurchasingThecompanyhasitsmainproductionplantinMladáBoleslavandtwootherproductionplantsinVrchlabíandKvasiny.ŠKODAAUTOa.s. is a subsidiaryofVolkswagen International FinanceN.V. included in the consolidationgroupof itsultimateparent companyand itsultimate controllingparty,VOLKSWAGENAG (“VolkswagenGroup”),withitsregisteredofficeinWolfsburg,theFederalRepublicofGermany(fordetailsseeNote31).
NoteThefinancialstatementshavebeenprepared inCzechand inEnglish. Inallmattersof interpretationofinformation,viewsoropinions,theCzechversionofthesefinancialstatementstakesprecedenceovertheEnglishversion.

113Annual Report 2012
Notes to the separate financial statements 2012
1. Summary of significant accounting policies and principles1.1 Compliance statement
These financial statements are separate financial statements of ŠKODA AUTO a.s. for the year ended 31December2012andrelatetotheconsolidatedfinancialstatementsofŠKODAAUTOa.s.anditssubsidi-ariesandassociatesfortheyearended31December2012.Usersoftheseseparatefinancialstatementsshould readthemtogetherwiththeconsolidatedfinancialstatementsfor theyearended31December2012inordertoobtainfullinformationonthefinancialposition,resultsofoperationsandchangesinfinan-cialpositionoftheGroupasawhole.TheCompanyasacontrolledentityisobligedtobepartoftheconsolidatedfinancialstatementsoftheVolkswagenGroupinaccordancewiththeInternationalFinancialReportingStandardsasadoptedbytheEuropeanUnion.AsaresultandbasedontheCompany’ssoleshareholder’sdecisionandunderparagraph19aArticle7ofActNo.563/1991Coll.onAccounting,theCompanypreparestheseparatefinancialstate-mentsinaccordancewithIFRSasadoptedbytheEuropeanUnion.RefertotheCompanyinformationintheprecedingnote“Companyinformation”.
1.2 Adoption of new or revised standards, amendments and interpretations to existing standards*
1.2.1 New standards, amendments and interpretations to existing standards mandatory for accounting periods beginning on 1 January 2012
Newstandards,amendments,interpretationsandimprovementstoexistingstandardsmandatoryforac-countingperiodsbeginningonorafter1January2012,whichareappliedbytheCompany:
IFRS Standard/Interpretation Effective Description Effect
IFRS 7 Financial instruments: Disclosures/Transfers of Financial Assets
1 July 2011 The amendment enhances the disclosure requirements related to transactions including a transfer of financial assets.
The improvement had an impact on the extent of disclosures in respect of the credit risk. The Company has newly disclosed its continuing involvement relating to the derecognised factored receivables and the related maximum exposure to the credit risk in a separate subnote 3.1.6.
Therearenoothernewstandards,amendments,interpretationsandimprovementstoexistingstandardsthatareeffectiveforthefinancialyearbeginningonorafter1January2012whichhavematerialimpactontheseparatefinancialstatementsoftheCompany.
* The effective dates express the dates effective for the Company.

Notes to the separate financial statements 2012
114 Annual Report 2012
1.2.2 1.2.2 New standards, amendments and interpretations to existing standards published not yet effective for accounting periods beginning on or after 1 January 2012
Newstandards,amendmentsandinterpretationstoexistingstandards,whichwillberelevantfortheCom-panybuthavenotbeenearlyadoptedbytheCompany:
IFRS Standard/Interpretation Effective Description Effect
IFRS 9 Financial instruments 1 January 2015* IFRS 9 replaces those parts of IAS 39 relating to the classification and measurement of financial assets and changes also some disclosure requirements as set out by IFRS 7. Per IFRS 9, all financial assets, currently within scope of IAS 39, are required to be classified into two measurement categories – those to be measured subsequently at amortised cost, and those to be measured subsequently at fair value.
The Company expects that the new IFRS 9 will have impact on classification, measurement and disclosure of financial instruments in the notes to the financial statements. However, without a detailed analysis it is not possible to perform reliable estimate of such impact as at the date of the financial statements. The Company does not expect early adoption of the standard, while the transition to IFRS 9 will probably take place after 1 January 2015. The disclosure of information in the area of financial instruments will be ruled by IFRS 7 §44S-44W
IFRS 13 Fair value measurement 1 January 2013 Aim of the new standard is to reduce complexity, improve consistency and clarify approach to disclosure of items in the financial statements carried at fair value. The standard clearly defines fair value and gives instruction for its application in case the fair value measurement is required or allowed by another IFRS. A definition of the fair value and a single source of fair value measurement and disclosure requirement for use across IFRSs.
The Company expects that the new standard IFRS 13 will have impact on measurement of items carried at fair value through profit or loss. However, without a detailed analysis it is not possible to perform reliable estimate of such impacts at the date of the financial statements.
IAS 1 Presentation of Financial Statements/Disclosure of items presented in other comprehensive income
1 July 2012 The amendments deal with disclosure of items presented in other comprehensive income. The amendments newly require entities to separate items presented in other comprehensive income into two groups, based on whether or not they may be reclassified to profit or loss in the future. Information to the user will be provided what proportion of total comprehensive income will never be reclassified to profit or loss for the period.
The Company expects that the amendments to IAS 1 will have impact on the extent of the disclosure of information in the Statement of comprehensive income.
IAS 19 Employee benefits/Changes to the recognition and measurement of defined benefit pension expense and termination benefits
1 January 2013 Amendment to IAS 19 makes changes to the recognition and measurement of defined benefit pension expense and termination benefits. The standard requires recognition of all changes in the defined benefit liability and assets of the plans when they occur, introduces extended disclosures for information about defined benefit plans and adjust accounting for termination benefits and clarifies many issues including classification of employee benefits.
The Company expects that the amendment to IAS 19 will have impact mainly on presentation of benefits upon employment termination. However, without a detailed analysis it is not possible to perform reliable estimate of such impacts at the date of the financial statements.
* Not yet adopted by the European Union as at 31 December 2012 (the specified date relates to effective date as per IASB).

Notes to the separate financial statements 2012
115Annual Report 2012
Thefollowingstandards,amendmentsandinterpretationstoexistingstandardswhichwillnotberelevantfortheCompanyorarenotexpectedtohaveasignificantimpactontheCompany’soperations:
IFRS Standard/Interpretation Effective Description
IFRS 1 Government Loans 1 January 2013* The amendment deals with loans received from governments at a below market rate of interest, by first-time adopters of IFRSs giving them relief from full retrospective application of IFRSs.
IFRS 7 Financial Instruments: Disclosures/Offsetting Financial Assets and Financial Liabilities
1 January 2013 The amendment requires disclosures that will enable users of an entity's financial statements to evaluate the effect or potential effect of netting arrangements, including rights of set-off.
IFRS 10 Consolidated Financial Statements 1 January 2014 IFRS 10 Consolidated Financial Statements replaces previous IAS 27 and SIC-12. The new standard follows up the current principles to determine control, focuses on clarification of the definition of control, while the rules for status of control are substantially extended.
IFRS 11 Joint Arrangements 1 January 2014 IFRS 11 fully replaces IAS 31 and SIC-13. Substantial change introduced by the new standard is elimination of jointly controlled assets and elimination of proportionate consolidation.
IFRS 12 Disclosure of Interest in Other Entities
1 January 2014 IFRS 12 deals with all disclosure requirements in respect of interests held in other reporting entities and replaces the previous standard IAS 27. The scope of the standard includes interests in subsidiaries, associates, joint arrangements and unconsolidated structured entities (formerly "special purpose entities").
IAS 27 Separate Financial Statements 1 January 2014 This standard replaces previous standard IAS 27. Requirements for separate financial statements remained without changes. Other parts of IAS 27 were replaced by IFRS 10.
IAS 28 Investments in Associates and Joint Ventures
1 January 2014 The amendment of IAS 28 modified the standard so that changes resulting from issuance of standards IFRS 10, IFRS 11 and IFRS 12 are reflected.
IAS 32 Financial Instruments: Offsetting Financial Assets and Financial Liabilities
1 January 2014 The amendments to IAS 32 deals with offsetting financial assets and liabilities. It clarifies conditions under which the offsetting may be applied.
IFRIC 20 Stripping Costs in the Production Phase of a Surface Mine
1 January 2013 The new interpretation IFRIC 20 deals with presentation of stripping costs in the production phase of a surface mine, the initial measurement and subsequent measurement of the stripping activity asset.
IFRS 10, IFRS 11, IFRS 12
Consolidated Financial Statements, Joint Arrangements and Disclosure of Interest in Other Entities - Transition Guidance Amendments
1 January 2013* The amendments clarify the transition guidance in IFRS 10 Consolidated Financial Statements and define the first day of the adoption of IFRS 10. The amendments determine under which conditions an entity must restate its consolidated figures retrospectively when adopting IFRS 10. The amendments also provide additional transition relief in respect of requirements of IFRS 10, IFRS 11 Joint Arrangements, and IFRS 12 Disclosure of Interests in Other Entities.
IFRS 10, IFRS 12, IAS 27
Consolidated Financial Statements, Disclosure of Interest in Other Entities - Transition Guidance Amendments and Separate Financial Statements - Amendment
1 January 2014* The amendment introduced a definition of an investment entity. An investment entity is required to account for its subsidiaries at fair value through profit or loss, and to consolidate only those subsidiaries that provide services that are related to the entity's investment activities.
* Not yet adopted by the European Union as at 31 December 2012 (the specified date relates to effective date as per IASB).

Notes to the separate financial statements 2012
116 Annual Report 2012
ImprovementstoInternationalFinancialReportingStandardsissuedin2009-2011,mandatoryforaccount-ingperiodsbeginningonorafter1January2013*:
IFRS Standard/Interpretation Effective Description
IFRS 1 First-time adoption of International Financial Reporting Standards/ Repeated Application
1 January 2013 The amendment clarifies conditions under which an entity may apply IFRS 1 when resuming preparing its financial statements under IFRS, including the requirement to disclose the reasons for the interruption and the resumption of preparation of financial statements under IFRS.
IFRS 1 First-time adoption of International Financial Reporting Standards/ Borrowing Costs
1 January 2013 The amendment defines the presentation of borrowing costs capitalised under previous GAAP prior to the date of transition to IFRS, and presentation of borrowing costs relating to qualifying assets already under construction or production incurred at the date of transition to IFRS and after.
IAS 1 Presentation of Financial Statements/ Clarification of requirements for additional comparative statements
1 January 2013 The amendment clarifies the requirements for presentation of additional comparative statements.
IAS 16 Property, Plant and Equipment/ Classification of servicing equipment
1 January 2013 The amendment points out that stand-by equipment and servicing equipment shall be classified as plant and equipment if they meet the definition of plant and equipment.
IAS 32 Financial Instruments: Presentation/ Tax Consequences of Distributions to Owners
1 January 2013 The amendment specifies that income tax consequences relating to distribution to holders of an equity instrument and relating to transaction costs should be accounted for in accordance with IAS 12 Income Taxes.
IAS 34 Interim Financial Reporting / Disclosure of a measure of total assets and liabilities for an operating segment
1 January 2013 The amendment provides guidance in which cases disclosure of a measure of total assets and liabilities for a particular reportable segment is required in the entity's interim financial statements.
* Not yet adopted by the European Union as at 31 December 2012 (the specified date relates to effective date as per IASB).

Notes to the separate financial statements 2012
117Annual Report 2012
2. Basis of preparation of financial statementsTheseseparatefinancialstatementshavebeenpreparedunderthehistoricalcostconvention,exceptforfairvaluemeasurementofavailable-for-salefinancialassets,offinancialassetsandfinancialliabilitiesatfairvaluethroughprofitorloss,andofallderivativecontracts.ThepreparationoffinancialstatementsinconformitywithIFRSrequirestheuseofcertaincriticalaccount-ingestimates.ItalsorequiresmanagementtoexercisetheirjudgmentintheprocessofapplyingtheCom-pany’saccountingpolicies.AmountsinthefinancialstatementsandinthenotesaredisclosedinmillionsofCzechcrowns(CZKmillion),unlessstatedotherwise.
2.1 Foreign currency translation
Functional and presentation currencyItemsincludedinthefinancialstatementsoftheCompanyaremeasuredusingthecurrencyoftheprimaryeconomicenvironmentinwhichtheCompanyoperates(‘thefunctionalcurrency’).ThefinancialstatementsarepresentedinCzechcrowns(CZK),whichistheCompany’sfunctionalandpresentationcurrency.Foreigncurrencytransactionsaretranslated intothefunctionalcurrencyusingtheexchangeratespub-lishedbytheCzechNationalBankprevailingonthedatesofthetransactions.Foreignexchangegainsandlossesresultingfromthesettlementofsuchtransactionsandfromthetranslationofmonetaryassetsandliabilitiesdenominatedinforeigncurrenciesatyear-endexchangeratespublishedbytheCzechNationalBankarerecognisedintheincomestatement.
2.2 Intangible assets
Purchasedintangibleassetsarerecordedatcostlesscumulativeamortisationandimpairmentlosses.Allresearchcostsarerecognisedasexpenseswithintheincomestatementwhenincurred.InaccordancewithIAS38,alldevelopmentcostsofnewŠKODAmodelsandotherproductsarerecognisedasintangibleassetswhenitisprobablethattheprojectwillbeasuccessconsideringitscommercialandtechnicalfeasibility,andcostscanbemeasuredreliably.Capitaliseddevelopmentcostsandotherinternallygeneratedintangibleas-setsarecarriedatcostlessaccumulatedamortisationandimpairmentlosses.Ifthecriteriaforrecognitionasanassetarenotmet,thecostsarerecognisedintheincomestatementintheyearinwhichtheyareincurred.Toolingrightsarecapitalisedasintangibleassets.Capitalisedcostsincludealldirectcostsaswellasanappropriateportionofdevelopment-relatedoverheads.Thecostofqualifyingintangibleassetsalsoincludesborrowingcostsrepresentedbyinterestandothercoststhatanentityincursinconnectionwithborrowingfunds.Aqualifyingassetisanassetthatnecessar-ilytakesatleastoneyeartogetreadyforitsintendeduse.TheCompanyceasescapitalisingborrowingcostswhenthequalifyingassetisreadyforitsintendeduseorsale.Thedevelopmentcostsareamortisedusingthestraight-linemethodfromthestartofproductionovertheexpectedlifecycleofthemodelsorcomponents.Amortisationrecognisedduringtheyearisallocatedtotherelevantfunctionsintheincomestatement.Intangibleassetsareamortisedapplyingthestraight-linemethodovertheirestimatedusefullivesasfol-lows:– Capitaliseddevelopmentcosts 2-12yearsaccordingtotheproductlifecycle– Software 3years– Toolingrights 8years– Otherintangiblefixedassets 3-5yearsEstimatedusefullivesanddepreciationmethodarereviewedattheendofeachaccountingperiod,theef-fectofanychangesinestimatesareaccountedforprospectively.Intangibleassetsnotyetavailableforusearetestedannuallyforpossibleimpairmentandarecarriedatcostlessaccumulatedimpairmentlosses.

Notes to the separate financial statements 2012
118 Annual Report 2012
2.3 Property, plant and equipment
Allproperty,plantandequipmentarestatedathistoricalcostlesscumulativedepreciationandimpairmentlosses.Historicalcostincludesexpenditurethatisdirectlyattributabletotheacquisitionoftheassets.Allrepairsandmaintenancecostsarechargedtotheincomestatementduringthereportingperiodinwhichtheyareincurred.Subsequentcostsareincludedintheasset’scarryingamountorrecognisedasaseparateasset,asappropriate,onlywhenitisprobablethatfutureeconomicbenefitsassociatedwiththeitemwillflowtotheCompanyandthecostoftheitemcanbemeasuredreliably.Thecostofqualifyingtangibleassetsalsoincludesborrowingcostsrepresentedbyinterestandothercoststhatanentityincursinconnectionwithborrowingoffunds.Aqualifyingassetisanassetthatnecessarilytakesat leastoneyeartogetreadyfor its intendeduse.TheCompanyceasescapitalisingofborrowingcostswhenthequalifyingassetisreadyforitsintendeduseorsale.Landisnotdepreciated.Depreciationofotherassetsiscalculatedusingthestraight-linemethodovertheirestimatedusefullivesasfollows:– Buildings 9-50years– Technicalequipmentandmachinery(incl.specialtooling) 2-18years– Otherequipment,operatingandofficeequipment 3-25yearsEstimatedusefullivesanddepreciationmethodarereviewedattheendofeachaccountingperiod,theef-fectofanychangesinestimatesareaccountedforprospectively.
2.4 Impairment of assets
Assetsthataresubjecttoamortisationanddepreciationarereviewedforimpairmentwhenevereventsorchangesincircumstancesindicatethatthecarryingamountmaynotberecoverable.Animpairmentlossisrecognisedintheamountbywhichtheasset’scarryingamountexceedsitsrecoverableamount.Therecov-erableamountisthehigherofanasset’sfairvaluelesscoststosellandvalueinuse.For thepurposesofassessing impairment,assetsaregroupedat the lowest levels forwhich thereareseparatelyidentifiablecashinflows(cash-generatingunits).
2.5 Financial instruments
2.5.1 Financial assetsTheCompanyclassifiesitsfinancialassetsinthefollowingcategories:financialassetsatfairvaluethroughprofitorloss;loansandreceivables,available-for-salefinancialassetsandinvestmentsinsubsidiariesandassociates.Theclassificationdependsonthepurposeforwhichthefinancialassetswereacquired.Man-agementoftheCompanydeterminestheclassificationofitsfinancialassetsatinitialrecognition.Purchasesandsalesoffinancialassetsarerecognisedontradedate–thedateonwhichtheCompanycommitstopurchaseorsell theasset.Financialassets,withtheexceptionoffinancialassetscarriedatfairvaluethroughprofitorloss,areinitiallyrecognisedatfairvalueplustransactioncosts.Financialassetscarriedatfairvaluethroughprofitorlossareinitiallyrecognisedatfairvalue,andtransactioncostsareex-pensedintheincomestatement.Available-for-salefinancialassetsandfinancialassetsatfairvaluethroughprofitorlossaresubsequentlycarriedatfairvalue.Equityinstrumentsthatdonothavequotedpricesinanactivemarketandtheirfairvaluecannotbereliablymeasuredarevaluedatcostnetofimpairment,ifany.Long-termloansandreceiva-blesarecarriedatamortisedcostusingtheeffectiveinterestmethod.TheCompanydeterminesateachbalancesheetdatewhetherthereisobjectiveevidencethatafinancialassetoragroupoffinancialassetswhicharenotcarriedatfairvaluethroughprofitor loss is impaired.InitiallytheCompanydetermines,inlinewithIAS39,ifobjectiveevidenceexiststhatindividuallymaterialfinancialassetsareimpairedandperformsthesameassessmentindividuallyorcollectivelyforindividuallyimmaterialfinancialassets.IntheeventthattheCompanydoesnotfindobjectiveevidenceofimpairmentforindividuallyassessedfinancialassets,whethermaterialornot,theseassetsareincludedinthegroupoffinancialassetswithcommoncreditriskcharacteristicsandthegroupoffinancialassetsisassessedcol-lectivelyforimpairment.Individualassetsforwhichobjectiveevidenceofimpairmenthasbeenidentifiedarenotincludedinagroupofassetsthatareassessedcollectivelyforimpairment.

Notes to the separate financial statements 2012
119Annual Report 2012
Inthecaseofequitysecuritiesclassifiedasavailable-for-salefinancialassets,asignificantorprolongeddecline inthefairvalueof thesecuritybelow itscost isconsideredasan indicator thatthesecurity isimpaired.TradereceivablesareconsideredtobeimpairedifobjectiveevidenceexistsatthebalancesheetdatethattheCompanywillnotbeabletocollectalloutstandingbalancesinaccordancewithinitiallyagreedcondi-tions.Significantfinancialdifficulties,theprobabilitythatthedebtorwillenterbankruptcyorfinancialreor-ganisation,anddefaultordelaysinpaymentofliabilitiesareconsideredindicatorsthattradereceivablesareimpaired.Fortradereceivables,theallowanceisquantifiedonthebasisofdetailedinformationaboutthefinancialsituationofthecustomerandpaymenthistory.Whenthereceivableisassessedasuncollectible,anallowanceequalto100%ofthereceivablebalanceiscreated.Forotherreceivables,theallowanceisquantifiedonthebasisofdetailedinformationaboutthefinancialsituationofthecustomerandpaymenthistory.Thevalueoftheallowanceisthedifferencebetweentheasset’scarryingamountandthepresentvalueofestimatedfuturecashflows,discountedattheoriginaleffectiveinterestrateofthereceivable.Thecreationof theallowance is recognised in the incomestatementwithinOtheroperatingexpenses.Whenthereceivablecannotbecollectedthroughlegalaction(i.e.thereceivableshavelapsed;insufficientassetsduetobankruptcyofthedebtor;debtorwasliquidatedwithoutalegalsuccessor,etc.),itiswrittenoffthroughprofitorlossandtheallowanceisutilised.FinancialassetsarederecognisedwhentherightstoreceivecashflowsfromtheinvestmentshaveexpiredorhavebeentransferredandtheCompanyhastransferredsubstantiallyallrisksandrewardsofownership.
a) Financial assets at fair value through profit or lossFinancialassetsatfairvaluethroughprofitorlossarefinancialassetsheldfortradingorsodesignatedbymanagement.Derivativesarealsocategorisedasheldfortradingunlesstheyaredesignatedashedginginstruments.Realisedandunrealisedgainsand lossesfromchanges inthefairvalueoffinancialassetsvaluedatfairvaluethroughprofitorlossarerecognisedunderfinancialincomeorexpensesintheperiodinwhichtheyarise.Duringtheaccountingperiods2012and2011,theCompanyonlyhadfinancialderivativeswithinthiscategory(Note2.5.3).
b) Loans and receivablesLoansandreceivablesarenon-derivativefinancialassetswithfixedordeterminablepaymentsthatarenotquotedinanactivemarket.TheyarisewhentheCompanyprovidesmoney,goodsorservicesdirectlytoadebtorwithnointentionoftradingthereceivable.Theyareincludedincurrentassets,exceptformaturi-tiesgreaterthan12monthsafterthebalancesheetdate.Theseareclassifiedasnon-currentassets.Loansandreceivablesareclassifiedastradereceivables,orotherreceivablesandfinancialassetsinthebalancesheet(Note9).
c) Available-for-sale financial assetsAvailable-for-salefinancialassetsarenon-derivatives thatareeitherdesignated in this categoryornotclassifiedinanyoftheothercategories.Theyareincludedinnon-currentassetsunlessmanagementin-tends todisposeof the investmentwithin 12monthsof thebalancesheetdate.Dividend income fromtheseactivitiesisincludedinfinancialincome.Whensecuritiesclassifiedasavailable-for-salearesoldorimpaired,theaccumulatedfairvalueadjustmentsareincludedintheincomestatementasfinancialincomeorexpenses.Intheaccountingperiod2012(2011),theCompanyonlyhad,withinthecategoryofavailable-for-salefinan-cialassets,investmentstoequityinstrumentsthatdidnothavequotedpriceinanactivemarket.
d) Investments in subsidiaries and associatesInvestmentsinsubsidiariesandassociatesarecarriedintheseparatefinancialstatementsatcostlessanyimpairmentloss.Dividendsreceivedfromsuchassetsarepresentedinfinancial income.Incaseinvestmentsinsubsidiar-iesandassociatesareimpaired,theimpairmentlossispresentedinthelinefinancialexpensesinincomestatement.Netgainsorlossesfromsaleofsharesinsubsidiariesandassociatesareincludedinfinancialincomeorexpenses.

Notes to the separate financial statements 2012
120 Annual Report 2012
2.5.2 Financial liabilities a) Financial liabilities measured at fair value through profit or lossFinancialliabilitiesatfairvaluethroughprofitorlossarefinancialliabilitiesheldfortradingorsodesignatedbymanagement.Derivativesarealsocategorisedasheldfortradingunlesstheyaredesignatedashedginginstruments.Realisedandunrealisedgainsandlossesfromchangesinthefairvalueoffinancialliabilitiesvaluedatfairvaluethroughprofitorlossarerecognisedunderfinancialincomeorexpensesintheperiodinwhichtheyarise.Duringtheaccountingperiod2012(2011),theCompanyonlyhadfinancialderivativesinthiscategory(Note2.5.3).
b) Financial liabilities measured at amortised costFinancial liabilitiesaremeasuredat fair valuenetof transactioncostsat initial recognition.Subsequentmeasurementisatamortisedcostbyapplyingtheeffectiveinterestratemethod.
2.5.3 Financial derivativesTheCompanyusesderivativestohedgecurrencyandpricerisks.Derivativesareinitiallyrecognisedatfairvalueonthedateaderivativecontractisenteredintoandaresubsequentlyre-measuredattheirfairvalue.Themethodofrecognisingtheresultinggainorlossdependsonwhetherthederivativeisdesignatedasahedginginstrumentorinstrumentheldfortrading.TheCompanydesignatesashedginginstrumentsonlythosewhichfulfiltherequirementsofhedgeaccounting.TheCompanyusesderivativestohedgefuturecashflows.Thehedgeditemsareasfollows:– Highlyprobablefuturetransactions.TheCompanyishedgingagainstchangesincashflowsfromhighlyprobablefuturetransactionscausedbychangesinforeignexchangespotratesandotherpricechanges(arisingespeciallyfromthecombinationofcommodityandcurrencyrisk).Thechanges in thespotcomponentofcurrencyfinancialderivativesthatqualifyaseffectivecash-flowhedging instrumentsarerecognisedinothercomprehensive income.Thechanges intheforwardpointscomponentofcurrencyfinancialderivatives thatqualifyaseffectivecash-flowhedging instrumentsarerecognisedasagainorlossintheincomestatement.The changes in fair valueof commodity swaps thatqualify aseffective cash-flowhedging instrumentsarerecognisedinothercomprehensiveincome.Thechangesinfairvalueofcommodityswapsthatdonotqualifyaseffectivecash-flowhedginginstrumentsarerecognisedintheincomestatementandclassifiedasagainorloss.Thecumulativebalancesrecognisedinothercomprehensiveincomearerecycledintotheincomestate-mentasagainorlossintheperiodswhenthehedgeditemaffectstheincomestatement.Ifthetimingofthehedgedcashflowisdeferred,incompliancewithitshedgingstrategytheCompanyprolongsthematu-rityoftheoriginalhedginginstrument.Insuchcasethespotcomponentoftheoriginalderivativecontractisheldinequityuntilthehedgeditemaffectstheincomestatement.Atthismoment,thebalanceofthespotcomponentisrecycledfromothercomprehensiveincometotheincomestatementandrecognisedasagainorloss.Whenahedginginstrumentexpiresorissold,orwhenahedgenolongermeetsthecriteriaforhedgeac-counting,anycumulativegainorlosspreviouslyrecognisedinothercomprehensiveincomefromtheeffec-tivepartofthehedginginstrumentatthattimeremainsinothercomprehensiveincomeandisreclassifiedtotheincomestatementwhentheforecasttransactionisultimatelyrecognisedintheincomestatement.Whenaforecasttransactionisnolongerexpectedtooccur,thecumulativegainorlossthatwasreportedinothercomprehensiveincomeisimmediatelytransferredtotheincomestatement.Thefairvalueoffinancialinstrumentsthatarenottradedinanactivemarketisdeterminedbyusingvalua-tiontechniques,suchasthenetpresentvalueoffuturecashflows.Thefairvalueofcurrencyforwardsandswapsisdeterminedasthepresentvalueoffuturecashflowsbasedonforwardexchangemarketratesasatthebalancesheetdate.ThefairvalueofcommodityswapsiscalculatedasthepresentvalueoffuturecashflowsbasedontheratesofLME(LondonMetalExchange).

Notes to the separate financial statements 2012
121Annual Report 2012
2.6 Current and deferred income tax
Theincometaxexpenseconsistsofcurrentincometaxanddeferredincometax.Thetaxexpenseisrec-ognisedintheincomestatementwiththeexceptionofcaseswhenitrelatestoitemsrecognisedinothercomprehensiveincomeordirectlyinequity.Insuchcasesthecurrentincometaxanddeferredincometaxarerecognisedinothercomprehensivein-comeordirectlyinequity.
2.6.1 Current income taxCurrenttaxliabilities(receivables)forthecurrentperiodandprecedingperiodsarerecognisedintheamountofexpectedpaymentstoorclaimsfromtaxoffices,usingthetaxrates(andtaxlaws)validintherespectiveperiod.Currentincometaxrelatingtothecurrentaccountingperiodandtoprecedingperiodsreducedbytheamountalreadypaidisrecordedasaliability.Iftheamountalreadypaidinthecurrentandinprecedingperiodsexceedscurrentincometaxrelatedtotheseperiods,thedifferenceisrecordedasanasset.Thesituations,inwhichtheexpectedamountofpaymenttothetaxauthorities(orexpectedreceiptfromthem)isbasedontheinterpretationoftaxlaws,areregularlyreassessedandtheexpectedpaymentstotaxauthorities(orexpectedreceiptfromthem)areadjustedaccordinglytoreflectthebestestimateoftheamounttobepaidtotaxauthorities(ortobereceivedfromthem)basedonlegislationenactedorsubstan-tivelyenactedbythebalancesheetdate.
2.6.2 Deferred income taxDeferred incometax isdeterminedusingthebalance-sheet liabilitymethod,basedontemporarydiffer-encesarisingbetweenthetaxbasesofassetsand liabilitiesandtheircarryingamounts inthefinancialstatements.However,ifthedeferredincometaxarisesfrominitialrecognitionofanassetorliabilityinatransactionotherthanabusinesscombinationthatatthetimeofthetransactionaffectsneitheraccount-ingnortaxableprofitorloss,itisnotaccountedfor.Deferredincometaxisdeterminedusingtaxratesandtaxlaws,thathavebeenenactedbythebalancesheetdateandareexpectedtoapplywhentherelateddeferredincometaxassetisrealisedorthedeferredincometaxliabilityissettled.Deferredincometaxassetsarerecognisedtotheextentthatitisprobablethatfuturetaxableprofitwillbeavailableagainstwhichthetemporarydifferencescanbeutilised.InaccordancewithIAS12,deferredtaxassetsandliabilitiesareoffsetifthedeferredtaxassetsandliabili-tiesrelatetoincometaxesleviedbythesametaxationauthority,andwheretheCompanyhastheenforce-ablerighttooffsetthecurrenttaxassetsandliabilities.Deferredtaxrelatingtoitemsrecognisedinothercomprehensiveincome(forexampletheeffectiveportionofchangesinthefairvalueoffinancialderivativesthataredesignatedandqualifyascashflowhedges)isalsorecognisedinothercomprehensiveincome.TheCompanyrecognisesdeferredincometaxassetsrelatingtounusedtaxcreditsfrominvestmentincen-tivesagainstdeferredtaxincomeintheincomestatementtotheextentthatitisprobablethatfuturetax-ableprofitswillbeavailableagainstwhichtheunusedtaxcreditscanbeutilised.
2.7 Inventories
Purchasedinventories(rawmaterials,consumables,suppliesandmaterialsusedinproduction,goods)arestatedatthe lowerofcostandnetrealisablevalue.Costs includepurchasecostsandotheracquisitioncosts(e.g.transportandpackaging).Inventoriesgeneratedfromownproduction,i.e.workinprogressandfinishedgoods,arestatedatlowerofownproductioncostsornetrealisablevalue.Ownproductioncostsincludedirectmaterial,directwagesandproductionoverheads.Theadministrationoverheadexpensesarenotincludedinthevaluationofworkinprogressandfinishedgoods.Netrealisablevalueistheestimatedsellingpriceintheordinarycourseofbusiness,lessestimatedcostsofcompletionlessapplicablevariablesellingexpenses.Netrealisablevaluereflectsallrisksofobsoleteandredundantrawmaterialsandexcessiveoriginalparts.Aweighted-averagecalculationisusedtoaccountfortheconsumptionofmaterials.

Notes to the separate financial statements 2012
122 Annual Report 2012
2.8 Provisions for long-term employee benefits
Thefollowingtypesoflong-termemployeebenefitsareincludedintheprovisionforlong-termemployeebenefits:– servicejubilee;– otherlong-servicebenefits.Theentitlementtothesebenefitsisusuallyconditionalontheemployeeremaininginserviceforacertainserviceperiodoruptothemomentofacertainworkanniversaryoftheemployee.Theamountofprovisioncorrespondswiththepresentvalueoflong-termemployeebenefitsforpastserviceatthebalancesheetdatedeterminedusingtheprojectedunitcreditmethod.Theseobligationsarevaluedannuallybyindependentqualifiedactuaries.Actuarialgainsandlossesarisingfromchangesinactuarialassumptionsandexperienceadjustmentsarechargedorcreditedtotheincomestatement.Thepresentvalueoflong-termemployeebenefitsisdeterminedbydiscountingtheestimatedfuturecashoutflowsarisingfromtheirsettlementusinginterestratesequallingmarketyieldoftreasurybondsbecausethere isnodeepmarketofhigh-qualitycorporatebondsdenominated inCZK.Thetermandcurrencyofthesecorporateortreasurybondsareconsistentwiththecurrencyandtermoftherespectiveotherlong-termemployeebenefits.
2.9 Other provisions
InaccordancewithIAS37,provisionsarerecognisedwhereapresentobligationexiststothirdpartiesasaresultofapastevent;whereafutureoutflowofresourcesisprobable;andwhereareliableestimateofthatoutflowcanbemade.Futureoutflowsareestimatedwithrespecttoparticularspecificrisks.Provisionsnotresultinginanoutflowofresourceswithinoneyeararerecognisedattheirsettlementvaluediscountedtothebalancesheetdate.Discountingisbasedoncurrentmarketinterestrates.Wherethereareanumberofsimilarobligations,thelikelihoodthatanoutflowoccursuponthesettlementisdeterminedbyconsideringtheclassofobligationsasawhole.Aprovisionisrecognisedevenifthelikeli-hoodofanoutflowwithrespecttoanyoneitemincludedinthesameclassofobligationsmaybesmall.
2.10 Revenue and expense recognition
Revenuecomprisesthefairvalueofconsiderationreceivedorreceivableforthegoodssoldandservicesprovided,netofvalue-addedtax,rebatesanddiscounts.Salesofgoodsarerecognisedonlywhenthegoodshavebeendelivered,thatis,whenthesignificantrisksandrewardshavepassedtothecustomer,thesalespriceisagreedordeterminableandreceiptofpaymentisprobable.ThiscorrespondsgenerallytothedatewhentheproductsareprovidedtodealersoutsidetheCompanyortothedeliverydateinthecaseofdirectsalestoconsumers.Revenuesfromone-offlicencesarerecognisedonlywhentheintellectualrightsaretransferredorwhenpartialdeliveryhasbeencompletedincompliancewithrelevantcontractualprovisions(e.g.deliveryoftech-nicaldocumentation,technicalsupport,etc.).Revenuesfromper-piecelicencesarerecognisedbasedonthenumberofcarsproducedinthecurrentaccountingperiod.Dividendincomeisgenerallyrecognisedonthedateatwhichthedividendislegallyapprovedandwhenthepaymentisprobable.Costsofsales includeproductioncosts, costsofgoodspurchased for resale,andadditions towarrantyprovisions.Researchanddevelopmentcostsnoteligibleforcapitalisationintheperiod,depreciationandimpairmentchargesforcapitaliseddevelopmentcostsandproductionequipmentarelikewisepresentedascostofsales.Distributionexpensesincludepersonnelandmaterialcosts,anddepreciationandamortisationapplicabletothedistributionfunction,aswellasthecostsofshipping,advertising,salespromotion,marketresearchandcustomerservice.Administrativeexpensesincludepersonnelcostsandoverheadsaswellasdepreciationandamortisationapplicabletoadministrativefunctions.

Notes to the separate financial statements 2012
123Annual Report 2012
2.11 Leases
Leasesinwhichasignificantportionoftherisksandrewardsofownershipareretainedbythelessorareclassifiedasoperatingleases.Paymentsmadeunderoperatingleasesarechargedtotheincomestate-mentonastraight-linebasisovertheperiodofthelease.
2.12 Investment incentives and subsidies
Subsidiesofentrepreneurialactivitiesandofemployeetrainingandretrainingcostsarerecognisedasin-comeovertheperiodsnecessarytomatchthemwiththerelatedcostswhichtheyareintendedtocom-pensate,onasystematicbasis.Governmentgrants,includingnon-monetarygrantsrelatedtothepurchaseof tangibleand intangibleassets,are recognisedat fair valueas reduction in thevalueof tangibleandintangibleassets.
2.13 Related parties
Arelatedpartyisapersonthathascontrolorjointcontroloverthereportingentity;hassignificantinfluenceoverthereportingentity;orismemberofthekeymanagementpersonnelofthereportingentityorofaparentofthereportingentity.ArelatedpartyisalsoanentitywhichisamemberofthesamegroupasthereportingentityandotherentitiesasdefinedbyIAS24article9par.b.
2.14 Share capital
Thesubstanceofafinancial instrument,ratherthanits legalform,governsitsclassificationintheCom-pany’sstatementoffinancialposition.Ordinarysharesareclassifiedassharecapital.TheCompanytypicallyincursvariouscostsinissuingoracquiringitsownequityinstruments.Thosecostsmightincluderegistra-tionandotherregulatoryfees,amountspaidtolegal,accountingandotherprofessionaladvisers,printingcostsandstampduties.Thetransactioncostsofanequitytransactionareaccountedforasadeductionfromequity (netofanyrelated income tax benefit) to the extent they are incremental costs directly attributable to the equitytransactionthatotherwisewouldhavebeenavoided.Thecostsofanequitytransactionthatisabandonedarerecognisedasanexpense.Sharepremiumisrepresentedbythedifferencebetweenthenominalvalueofsharesissuedonsharecapi-talincreaseandthemarketpriceofsharesandisrecognisedwithinequity.
2.15 Critical accounting estimates and assumptions
TheCompanymakesestimatesandassumptionsconcerningthefuture.Theresultingaccountingestimateswill,bydefinition,seldomequaltherelatedactualresults.Theestimatesandassumptionsarecontinuouslyassessedbymanagement.Theestimatesandassumptionsarebasedonhistoricalexperienceandotherfactors,includingtherealisticassessmentoffuturedevelopments.Estimatesandassumptionsthathaveasignificantriskofcausingamaterialadjustmenttothecarryingamountsofassetsandliabilitieswithinthenextfinancialyeararediscussedbelow.
Capitalisation of development costsTheCompanycontinuouslyinvestsinresearchanddevelopmentofnewproducts,whichareeitherdevel-opedinternallywithintheCompany’sresearchanddevelopmentcentreorwithintheVolkswagenGroup.IncompliancewithIAS38,foreachdevelopmentprojecttheCompanyperformsanassessmentwhethertheprojectmeetsthedevelopmentcostsrecognitioncriteria,especiallytheprobabilitythattheassetwillgeneratefutureeconomicbenefits.TheCompany’sassessmentisbasedonassumptionsandestimatesforthenextfiveandmoreyearswithrespecttotheproductsfuturesales,developmentoftheindividualmarketsandautomotiveindustryitself.AlthoughtheCompany’sanalysesarebasedonthebestcurrentlyavailable information, the riskof futurechangesanduncertaintywith respect to futuredevelopmentoftheassumptionsappliedremainsignificant.PleaserefertoNote5foradditionalinformationincludingtherespectiveamounts.

Notes to the separate financial statements 2012
124 Annual Report 2012
Impairment of non-current assetsInthecourseoftheproductlifecycleandinexceptionalsituationsalsobeforeitscommencement,theremaybecircumstanceswhichindicatethat“cashgeneratingunits”(tangibleandintangibleassetsemployedforproductionofvehiclesofacertainmodel)mighthavesufferedimpairment.Todetermineanypossibleimpairment,theCompanyestimatesvalueinuseofthecashgeneratingunitswhichiscalculatedasdis-countedexpectedfuturecashflowsassociatedwiththeemploymentofthecashgeneratingunits.Fordeterminationoftheestimatedfuturecashflows,theCompanyappliesestimatesandassumptionsregardingfuturesalesofaparticularproduct,economicdevelopmentoftheindividualmarketsanddevel-opmentoftheautomotiveindustryduringthenextfiveandmoreyears.AlthoughtheCompanyestimatesthevalueinuseofthecashgeneratingunitsbasedonthebestinformationanddatacurrentlyavailabletotheCompany,theriskoffuturechangesanduncertaintywithrespecttothefuturedevelopmentoftheappliedassumptionsinthefollowingyearsremainssignificant.MoredetailedinformationaboutimpairmentlossesisincludedinNote5andNote6inthesectionImpairmentreviews.
Provision for warranty claims TheCompanyrecognisesprovisionsforwarrantyclaimsforfutureexpensesconnectedwiththebasicguar-antee (2years),withtheguaranteeforcorrosion (dependentonthemodelfor10or12years)andotherguaranteesbeyondthescopeofbasicguarantee,especiallygood-willrepairs(the3rdandthe4thyear).TheCompanyrecognisestheprovisionsforwarrantyclaimsatthemomentofsaleonthebasisofthenumberofsoldcarsandinadvancedeterminedratesforindividualmodelline.Theamountoftherateforthebasicguaranteeisdeterminedonthebasisofamanagementestimateoftheaveragenumberoffailuresintheguaranteeperiodandaveragesinglefailurecostswithregardtothespecificsofindividualcountriesandonthebasisofotherspecificassumptions(inflation,customersgroupsdevelopment,etc.).Theamountoftheprovisionforcorrosionisdeterminedthroughamathematicalmodelwhichextrapolatesthecurveoffuturecostsdevelopmentfortherelevantperiodonthebasisofweightedaverageofactualcostsfrompreviouscalendaryearsofthemodelproduction.Theamountoftheprovisionforgood-will repairs isdeterminedonthebasisofamanagementestimateofexistinggood-will repaircostsanddefinedstrategyofthegood-willrepairtrademarkpolicywithregardtospecificsof individualcountries.Theestimatesoftheratesarecontinuouslyrevisedwiththeuseofthemostrecenthistoricaldataaboutthenumberoffailuresandtheirrepaircosts.Changesintheseestimatescansignificantlyinfluencetheto-talamountoftheprovision.Thedetailedanalysisoftheprovisionaccordingtothesingletypes,productionyears,guaranteetypesandthesalesregionsispreparedattheyearend.MoredetailedinformationabouttheprovisionforwarrantyclaimsisincludedinNote16.
Provision for litigation risksCertaineventsrelatingtotheeconomicactivitiesoftheCompanymightresultindisputesresolvedincourtandout-of-courtproceedings.Theriskthatfuturecashoutflowswillberequiredtosettletheclaim(dam-ages,courtfees,etc.)isassessedbytheCompanyonceitbecomesinvolvedinanycourtorout-of-courtproceedings.TheriskisassessedbasedontheCompany’sexperiencewithsimilarlegalactions,reflectingthelatestdevelopmentsintheproceedings.Aprovisionisrecognisedifitismorelikelythannotthatanoutflowofeconomicbenefitswilloccurinthefuture.Theprovisionismeasuredbasedonthebestestimateoftheexpectedfuturecashoutflows.PleaserefertoNote16foradditionalinformation.
Useful livesTheestimatedusefullivesofindividualtangibleandintangibleassetsorclassesofassetsaredeterminedbasedontheCompany’sexperiencewithsimilarassetsandinaccordancewiththeexpectedfutureeco-nomicbenefitsoftheassets,takingintoaccountalsochangesinproductionplanandexpectedutilisationoftheseassets.

Notes to the separate financial statements 2012
125Annual Report 2012
3. Financial risk management TheCompanyoperatesintheautomotiveindustry,sellsitsproductsinmanycountriesaroundtheworldandperformstransactionsconnectedwithavarietyoffinancialrisks.TheobjectiveoftheCompanyistominimisetheserisksthroughapplicationofaflexiblehedgingstrategywithutilisationofvarious instru-ments.Thestructureofriskmanagement intheCompany isbasedontheunifiedprincipleof riskman-agement applied in theVolkswagenGroup. TheVolkswagenGroup’s riskmanagement principles are incompliancewiththerequirementsoftheGermanActonControlandTransparencyinEnterprises(KonTraG).Incompliancewith theVolkswagenGrouppolicyallhedgingoperationsareagreedand implemented incooperationwiththeTreasurydepartmentoftheVolkswagenGroup.Managementof theCompany is regularly informedof currentfinancial andother related risks (liquidity,foreignexchangerates,interestrates,invoicecurrencies,paymentconditions,taxesetc.),whichisachievedthroughregular“liquiditymeeting”attendedbyrepresentativesfromTreasury,ControllingandAccounting,VolkswagenGroupTreasury, representativesof subsidiariesandmanagementof theCommercial affairsdepartment.Thesemeetingshavepredefinedagenda,whichincludesalsoinformationonthemainmacro-economicindicatorsfromallimportantcountries,inwhichtheCompanysellsitsproducts.Meetingshaveaformalisedstructureandallminutesincludingthedecisionsarerecordedandtheirfulfilmentisperiodicallyreviewed.
3.1 Credit risk
Creditriskisariskthatonepartytoafinancialinstrumentwillcauseafinanciallosstootherpartybyfailingtodischargeanobligation.CreditriskarisesinthenormalcourseoftheCompany’soperations,aswellasthroughactivitiesconnectedwithfinancialmarkettransactions(moneymarket,currencyconversion,derivativestransactions,etc.).CreditriskarisingfromoperationsonthefinancialmarketismanagedbytheCompanyTreasurythroughdetermi-nationofmaximallimitsforindividualcounterparties.Thequantificationofcreditrisksisbasedonseveraldifferentprimarycriteria,ofwhichthemostsignificantarethecountryriskandthecounterpartyrisk.Inassessingtheserisks,attentionispaidtothecountryinwhichtheheadquartersofthecounterpartiesaresituated.Thecreditratingofthesecountriesismonitoredcloselyandattention is focusedon theanalysisofmacroeconomic indices.Apart from theVolkswagenGroup’sRiskManagementDepartment, theCompanyalsouses theservicesofexternal agencies (D&B,Creditreform,Reuters,etc.).Theacceptanceofnewbusinesspartnersisreliantonstandardapprovalprocedures.TheCompany’sin-volvementwithcounterpartiesismanagedbymeansofcreditlimitsthataremonitoredandre-evaluatedonaregularbasis.Adheringtotheselimitsismonitoredandevaluatedonaregularbasis.Activeadministrationandmanagementofreceivablesisincorporatedintothecreditriskmanagementpro-cess. In respectof the trade receivablessecuritystrategy, trade receivablesaredivided into receivablesfromdomesticcustomers,foreigncustomersandVolkswagenGroupentities.Receivablesaresecuredbypreventativeandsupplementalinstruments.Receivablessecuredbypreventativesecurityinstrumentsareusedmainlywhenthecustomercontractsareconcluded.Anobligatorysecurityinstrumentincorporatedinthewrittencontractsisinterestondefaultpaymentsandfurthermoreselectedtradereceivablesaresecuredbyanownershiptitletothesoldgoodsuntilfullsettlementofthepurchaseprice.TradereceivablesfromVolkswagenGroupcompaniesandfromassociatesareconsideredtobeartheleastrisk.Thereforethesuppliesofgoodsareperformedoncredittermsorthereceivablesaretransferredtoafactorthroughfactoring.Tradereceivablesfromcustomerslocatedabroadincludereceivablesfromgeneralimportersandothercus-tomers.Thereceivablesfromgeneral importersaresecuredbythefollowinginstruments:paymentsinad-vance, lettersof credit,documentarycollection,bankguarantees, standby lettersof creditand transferofreceivablestofactoring.Onlyanimmaterialpartofreceivablesfromothercustomersarisesoncreditterms.Receivablesfromdomesticcustomersaredividedintotwogroups:receivablesfromcontractualpartnersboundbysalesorserviceagreements,andfromotherdomesticcustomers.Thereceivablesarisingfromsalesofnewandusedvehiclestocontractualpartnersaretransferredtofactoring.Creditlimitsaresetupforthesuppliesofnewandusedvehicles,originalpartsandaccessories.

Notes to the separate financial statements 2012
126 Annual Report 2012
Thedeliveriesofgoodsareautomaticallyblockedincasethecustomerfailstosettleoutstandingbalancesonmaturityanduponthesetlimitisexceeded.Onlyanimmaterialpartofsuppliestootherdomesticcus-tomersisrealisedoncreditterms.Differentcombinationsofthefollowinginstrumentsareusedasanadditionalsecurityofhigh-riskreceiva-bles:confirmationofdebtprolongingthestatuteoflimitation,paymentschedules,billsofexchange,pledg-es,orexecutorynote.Loanstoemployeesaresecuredbyotheremployeeguarantees.Asat31December2012(asat31December2011),theCompanydidnotholdanycollateralforloansgiven.
3.1.1 Maximum exposure to credit risk (CZK million)Themaximumexposuretocreditrisk incaseofactivitiesconnectedtobusinessoperations,grantingofloans, supplier credits provided to customers anddeposits in companieswithinVolkswagenGroupandbankdepositsiscalculatedasthegrosscarryingamountoftheabovementionedfinancialassetslessanyimpairmentprovisions.Theexposuretocreditriskofderivativesismeasuredatfairvalueofthederivative.
Carrying amount as at 31 December 2012
Neither past due nor impaired
financial assets
Past due but not impaired
financial assetsImpaired
financial assets Total
Loans to employees 573 – – 573
Deposits in companies within Volkswagen Group 36,534 – – 36,534
Positive fair value of financial derivatives 1,129 – – 1,129
Other receivables and financial assets 68 – – 68
Trade receivables 9,699 1,478 – 11,177
Cash 1,237 – – 1,237
Total 49,240 1,478 – 50,718
Carrying amount as at 31 December 2011
Neither past due nor impaired
financial assets
Past due but not impaired
financial assetsImpaired
financial assets Total
Loans to employees 542 – – 542
Deposits in companies within Volkswagen Group 44,848 – – 44,848
Positive fair value of financial derivatives 1,851 – – 1,851
Other receivables and financial assets 238 – – 238
Trade receivables 11,025 670 – 11,695
Cash 796 – – 796
Total 59,300 670 – 59,970
ThelineitemDepositsincompanieswithinVolkswagenGroupcompaniesincludesdepositswithoriginalmaturityfromthreemonthstooneyearintotalamountofCZK0million(asat31December2011:CZK21,539million)anddepositswithoriginalmaturityfromoneyeartofiveyearsintotalamountofCZK3,033million(asat31December2011:CZK0million)includedinbalancesheetinthelineOtherreceivablesandfinancialassets (seeNote9),anddepositswithoriginalmaturity less than threemonths in totalamountofCZK33,501million(asat31December2011:CZK23,309million)includedinbalancesheetinthelineCashandcashequivalents(seeNote11).

Notes to the separate financial statements 2012
127Annual Report 2012
TheamountofguaranteesprovidedbytheCompanyisCZK51millionasat31December2012(asat31De-cember2011:CZK51million).Inthefollowingtable,thereportedfiguresrepresenteitherthecarryingvalueofsecuredtradereceivables,orthecollateralvalueifthisvalueislower,determinedindividuallyforeachinstrument:
CZK million 2012 2011
Retention of legal ownership title to sold cars 1,176 2,336
Bank guarantees 767 837
Letters of credit 1,287 1,230
Documentary collection 190 235
Accepted deposit 19 19
Total 3,439 4,657
3.1.2 Risk concentrationTheCompanymonitorsconcentrationofcreditriskbydistributionregionsanddenominationcurrency.ThesensitivityoftheCompanytoforeignexchangeriskisdisclosedinNote3.4.1.Duringtheaccountingperiod2012(2011)theCompanydidnotidentifyanysignificantriskconcentrationonthebasisofdistributionregion.A significant portion of financial assets is of an intra-group nature. The Company deposited free cashthroughVolkswagenGroupcompanies(asin2011).Thetotalvolumeofshort-termdepositswithVolkswagenGroupcompaniesamountedtoCZK34,689mil-lionasat31December2012(asat31December2011:CZK45,571million),outofwhich:- depositswithoriginalmaturityfromthreemonthstooneyearincludedinbalancesheetinthelineOtherreceivablesandfinancialassets(seeNote9)intotalamountofCZK0million(asat31December2011:CZK21,539million),
- depositswithoriginalmaturity lessthanthreemonths included inbalancesheet inthe lineCashandcashequivalents(seeNote11)intotalamountofCZK33,501million(asat31December2011:CZK23,309million),and
- overnightdepositsfromcashpoolingincludedinbalancesheetinthelineCashandcashequivalents(seeNote11)intotalamountofCZK1,188million(asat31December2011:CZK723million).
Inadditiontotheabovementionedshort-termdepositswithVolkswagenGroupcompanies,theCompany’sfreecashwasalsodepositedforaperiodexceedingoneyearin2012.Thetotalvolumeofthelong-termdepositamountedtoCZK3,033millionasat31December2012(asat31December2011:CZK0millions)andisincludedinbalancesheetinthelineOtherreceivablesandfinancialassets(seeNote9).In2012(2011),theCompanydidnotconsideritprobablethatadefaultcouldoccurinconnectionwiththefreecashdeposited.Possibleriskofunpaidreceivablesfromthirdpartieswasindividuallynotsignificant(spreadbetweenvariousdebtorsandregions).

Notes to the separate financial statements 2012
128 Annual Report 2012
3.1.3 Credit quality of financial assets neither past due nor impaired (CZK million)TheCompanyusesthefollowingcriteriawhensettingratingsoffinancialassetsthatareneitherpastduenor impaired.Solvencyclass1 includesreceivables,deposits incompanieswithinVolkswagenGroup,se-curedreceivablesfromthirdpartiesandreceivablesthatwillbesubjecttofactoringwithoutrecourse.Thereisnoobjectiveevidenceindicatingimpairmentofthesereceivables.Solvencyclass2includesunsecuredtradereceivablesfromthirdpartiesforwhichthereisnoobjectiveevidenceindicatingimpairment(receiva-blesfromdealerswithoutriskandreceivablesfromdealerswithscheduleofpayments).
Solvency class 1 Solvency class 2 Total
Balance as at 31 December 2012
Loans to employees 573 – 573
Deposits in companies within Volkswagen Group 36,534 – 36,534
Positive fair value of financial derivatives 1,129 – 1,129
Other receivables and financial assets 68 – 68
Trade receivables 9,397 302 9,699
Cash 1,237 – 1,237
Total 48,938 302 49,240
Solvency class 1 Solvency class 2 Total
Balance as at 31 December 2011
Loans to employees 542 – 542
Deposits in companies within Volkswagen Group 44,848 – 44,848
Positive fair value of financial derivatives 1,851 – 1,851
Other receivables and financial assets 238 – 238
Trade receivables 10,600 425 11,025
Cash 796 – 796
Total 58,875 425 59,300
3.1.4 Carrying amount of financial assets past due and not impaired (CZK million)
Months past due
Less than 1 month 1-3 months More than 3 months Total
Trade receivables
Balance as at 31 December 2012 1,221 129 128 1,478
Balance as at 31 December 2011 303 91 276 670
Receivablesmorethan3monthspastduearerepresentedmainlybyreceivablesfromVolkswagenGroupcompanies.TheCompanydidnotidentifyanyneedforimpairmentofthesereceivables.Outofthetotalamountofreceivablesfromgroupcompanieswhichwerepastdueasat31December2011(CZK445million),CZK26millionwerestillnotpaidasat31December2012.

Notes to the separate financial statements 2012
129Annual Report 2012
3.1.5 Valuation allowance for receivables and other financial assets (CZK million)Impairmentstatusanddevelopmentofotherreceivablesandtradereceivableshasbeenanalysedasfollows:
2012 2011
Other receivables and financial assets
Gross balance as at 31 December 151 152
Valuation allowance:
Balance as at 1 January (152) (155)
Additions – –
Utilised 1 –
Released – 3
Balance as at 31 December (151) (152)
Net balance as at 31 December – –
Trade receivables
Gross balance as at 31 December 194 211
Valuation allowance:
Balance as at 1 January (211) (223)
Additions (39) (15)
Utilised 39 13
Released 17 14
Balance as at 31 December (194) (211)
Net balance as at 31 December – –
Duringtheaccountingperiod2012(2011)theCompanyhadvaluationallowancesonindividualfinancialas-setsonlyforwhichadefaultriskwasidentified.Duringtheaccountingperiod2012(2011)theCompanyhadvaluationallowancesonlyonfinancialassetsincludedinthecategoryofloansandreceivables.
3.1.6 Transferred financial assets where the Company has continuing involvement TheCompanyhasconcludedafactoringcontractwiththecompanyŠkoFINs.r.o.,underwhichthemajorityofrisksandrewardsrelatingtoownershipofreceivablesarisingfromsaleofneworusedcarsaretrans-ferredtoŠkoFINs.r.o.Undercertainconditions,thecompanyŠkoFINs.r.o.canclaimcompensationrelatingtorealizedcreditlossesupto2%ofthetotalamountoftransferredreceivablesduringtheyear,however,notmorethan49%oftheselossesandnotmorethanCZK51millionfortheyear.Thisamountrepresentscarryingamountandfairvalueoftherecognisedcontinuinginvolvementinthesereceivables,andrelatedfinancialliabilities.Atthesametime,thisamountrepresentsthemaximumexposuretocreditrisk.ThelossrecognisedatthedateoftransferoftheassetswasCZK25millionin2012.

Notes to the separate financial statements 2012
130 Annual Report 2012
3.2 Liquidity risk
Liquidityriskisariskthatanentitywillencounterdifficultyinmeetingobligationsassociatedwithfinan-cialliabilities.TheobjectiveofliquidityriskmanagementistoensurethebalancebetweenthefundingofoperatingactivitiesandfinancialflexibilityinordertoensurethatallclaimsoftheCompany’ssuppliersandcreditorsaresettledtimely.ManagementoftheCompanymonitorstheliquidityanditsdevelopmentatregularmonthlymeetings,socalled“liquiditymeetings”,attendedbyrepresentativesoftheTreasury,ControllingandAccountingdepart-ments.Thepredeterminedagendagenerallyincludestheinformationaboutdailydevelopmentofliquidityanditsstructure.TheCompany’smanagementisalsopresentedwiththeshort-termforecastsoftheliquid-itydevelopment.
Cash managementSince2010,whentheCompanywas integrated intothe“GlobalTreasuryPlatform”ofVolkswagenGroup(GTP)whichisoperatedbyVolkswagenGroupServices(VGS)locatedinBrussels,centralisationandopti-malisationofprocessesisensuredwithintheVolkswagenGroupintheareasofcashmanagement,pay-mentssystemandliquiditymanagement.TheGTPimplementationresultedinchangesinthesystemofoutgoingandincomingpayments.Theout-goingpaymentsareprocessedonbehalfoftheCompanybyVGS,basedonpaymentordersplacedbythe
Contractual maturity analysis (undiscounted amounts in CZK million)
Less than 3 months 3-12 months 1-5 years
Longer than 5 years Total
Balance as at 31 December 2012
Cash 1,237 – – – 1,237
Deposits in companies within Volkswagen Group 33,502 – 3,092 – 36,594
Other receivables and financial assets (except derivatives) 42 137 327 145 651
Trade receivables 10,903 274 – – 11,177
Financial liabilities (138) – (3,138) – (3,276)
Trade payables (23,187) (2,080) – – (25,267)
Derivatives with positive fair value:
Currency forwards and swaps
Inflow of financial resources 3,918 13,550 29,764 – 47,232
Outflow of financial resources (3,838) (13,375) (29,363) – (46,576)
Commodity swaps 19 55 89 – 163
Derivatives with negative fair value:
Currency forwards and swaps
Inflow of financial resources 12,457 34,131 47,494 – 94,082
Outflow of financial resources (13,095) (35,927) (50,653) – (99,675)
Commodity swaps (12) (29) (38) – (79)
Total 21,808 (3,264) (2,426) 145 16,263

Notes to the separate financial statements 2012
131Annual Report 2012
CompanyandaretransferredfromabankaccountheldbyVGS.The incomingpaymentsarecreditedtoCompany’sbankaccountsandsubsequentlyattheendofeachworkingdaytheyareautomaticallytrans-ferred toVGS’bankaccounts (masteraccount). Termsof such transactionsaredefinedwithin thecashpoolingconceptagreeduponbetweentheCompany,thebankandVGS.Allincomingpaymentsaretrans-latedintoCzechcrownsandcreditedtotheCompany’sbankaccountatthe“InhouseBank”(IHC)operatedbyVGS,wherethedifferencesbetweendebitandcreditbalancesonthecollectedfinancialresourcesarenetted-off.Majorinstrumentsusedtomaintainsufficientliquidityresourcesarerepresentedbyshort-termandlong-termfinancial plans, coordinationof free liquiditymanagementwithin theGTP, active cooperationwithbanks(creditlines)andmonitoringofthesituationatmoneymarketandcapitalmarket.SufficientresourcesofliquidityareensuredmainlythroughresourcesfromotherVolkswagenGroupcompaniesintegratedintotheGTPand,toalimitedextent,throughcreditlinesarrangedwithexternalbanks.Thetotalamountofcreditlinesfrombanksasat31December2012wasCZK700million(asat31December2011:CZK8,440million).AllcreditlinesarecontractedinCzechcrowns.TheCompanyhasnotutilisedanyagreedbankcreditlinesasat31December2012(asat31December2011).ThecreditlinefromtheVolkswagenGroupinthetotalamountofCZK3,000millionwasdrawninthewholeamountasat31December2012(asat31December2011).TheinformationaboutfinancialconditionsofcreditlinesdrawnisincludedinNote14.
Contractual maturity analysis (undiscounted amounts in CZK million)
Less than 3 months 3-12 months 1-5 years
Longer than 5 years Total
Balance as at 31 December 2011
Cash 796 – – – 796
Deposits in companies within Volkswagen Group 39,382 5,516 – – 44,898
Other receivables and financial assets (except derivatives) 210 134 364 94 802
Trade receivables 11,301 394 – – 11,695
Financial liabilities (138) – (3,276) – (3,414)
Trade payables (23,074) (569) (115) – (23,758)
Derivatives with positive fair value:
Currency forwards and swaps
Inflow of financial resources 4,305 20,500 13,912 – 38,717
Outflow of financial resources (4,125) (19,567) (13,292) – (36,984)
Commodity swaps 5 10 92 – 107
Derivatives with negative fair value:
Currency forwards and swaps
Inflow of financial resources 11,642 26,496 65,514 – 103,652
Outflow of financial resources (12,419) (28,534) (70,891) – (111,844)
Commodity swaps (14) (48) (102) – (164)
Total 27,871 4,332 (7,794) 94 24,503

Notes to the separate financial statements 2012
132 Annual Report 2012
3.3 Market risk
Marketriskisariskthatthefairvalueoffuturecashflowsoffinancialinstrumentswillfluctuatebecauseofchangesinmarketprices.Marketriskincludesthreetypesofrisks:currencyrisk,interestrateriskandpricerisk.Developmentsonthefinancialmarketsareconsideredtobethemostsignificantriskfactor,especiallythefluctuationofexchangerates.
3.3.1 Currency riskCurrencyriskisariskthatthefairvalueoffuturecashflowsoffinancialinstrumentswillfluctuatebecauseofchangesinforeignexchangerates.Thefluctuationofexchangeratesrepresentssignificantrisk inthattheCompanysells itsproducts,andpurchasesmaterial, parts and services concurrently in various foreign currencies. TheCompany activelymanages this risk throughcontinuallyupdatedmarketanalysis,worldwideprocurementofmaterialandequipmentandproductionofitsproductsinsomesalesregions.StandardderivativehedginginstrumentsareusedbytheCompanytomanagethecurrencyrisk.Theriskexposure,asdeterminedbytheanalysisof incomeandexpensestructuresbyforeigncurrency,ishedgedon thebasisofexpected future foreigncurrencycashflows.Theseexpectedcashflowsareplannedintheformofmonthlyforeigncurrencyplans(FXplan),whicharebeingupdatedregularlyandtheystretchoveratimehorizonupto5years.TheCompany’smanagement is regularlybeingupdatedaboutthecurrency riskstatusbymeansof theliquiditymeeting,attendedby representativesof theTreasury,ControllingandAccountingdepartments,TreasuryDepartmentoftheVolkswagenGroup,representativesofsubsidiariesandmanagementofCom-mercialaffairsdepartment.Inadditiontotheupdateofforeigncurrencyplans,actualdevelopmentoffor-eigncurrencycashflowsandexchangeratesfluctuationsagainstCZK,suggestionsforadditionalhedgingarepresentedandagreedduringthesemeetings.Forwardexchangecontractsandcurrencyswapsareusedashedginginstrumentsforeliminationofcur-rencyrisk.ThebasicparametersofthehedgingpolicyaredefinedbythehedgingdirectivevalidfortheentireVolkswagenGroup,whichincludesalsothelistofpermittedfinancialproducts(derivatives).ContractsareconcludedupontheCompany’srequestandinitsnamebytheTreasuryDepartmentoftheVolkswagenGroup.TheriskresultingfromchangesinexchangeratesagainstCZKishedgedforatotalof11currencies.ThemostimportanttradingcurrenciesareUSD,EUR,GBP,CHF,PLNandRUB.TheCompanyapplieshedgeaccountingforcurrencyrisk.FortheanalysisofsensitivitytoexchangeratespleaserefertoNote3.4.1.
3.3.2 Interest rate riskInterestrateriskisariskthatthefairvalueoffuturecashflowsofafinancialinstrumentwillfluctuatebe-causeofchangesinmarketinterestrates.Theobjectiveoftheinterestrateriskmanagementistoeliminatetheriskarisingfromfluctuationsofinter-estratesoffinancial liabilitiesandreceivableswithfloating interestratesbymaintaininganappropriatestructureoffinancialliabilitiesandreceivables.ThemanagementoftheCompanymonitorstheinterestrateriskattheregularmonthlymeetingsattendedbyrepresentativesoftheTreasury,ControllingandAccountingdepartments.Thepredeterminedagendagenerallyincludesthefollowing-informationaboutcurrentdevelopmentofinterbankinterestrates(es-peciallyPRIBOR,EURIBORandLIBOR)and informationaboutcentralbanks’ interestrates intheregionswheretheCompanyoperates.TheCompany’smanagementisalsopresentedwithshort-termforecastsoftheinterestratesdevelopment.TheexposuretointerestrateriskarisesfromcashdepositsatVolkswagenGroupcompanies.FortheanalysisofsensitivitytointerestratespleaserefertoNote3.4.2.

Notes to the separate financial statements 2012
133Annual Report 2012
3.3.3 Price riskPriceriskisariskthatthefairvalueoffuturecashflowsfromthefinancialinstrumentswillfluctuatebe-causeofchangesinmarketprices,especiallycommodityprices(apartfromthatwhichresultsfromcurrencyandinterestrisk).Duetocontinuousvolatilityinthepricesofrawmaterialcommoditiesandlimitedaccessibilitytospecificcommodities,managementhasaimed toeliminate these risks through target riskmanagement strate-gies.Inthisregard,utilisationofalternativeproductionmaterialsandproceduresaswellasutilisationofrecycledmaterialisbeingexamined.Inaddition,emphasisisplacedonextendingtheinternationalsupplychaininco-operationwiththeVolkswagenGroup.Highriskcommoditiesincludeprimarilyaluminium,cop-per,palladium,lead,platinumandrhodium.ThosecommoditiesidentifiedashighriskarecontrolledattheVolkswagenGrouplevelthroughlong-termsupplycontractswithsuppliers.TheCompanyhedgesagainstpricerisksingeneral(asaconsequenceofchangesinparticularcommoditypricesandforeignexchangerates)throughcommodityswaps(forcopper,aluminiumandlead)andcurrencyforwards.Thosefinancialderivatives,exceptforcommodityswapsforlead,aresubjecttohedgeaccount-ing—hedgingoffuturecashflows.
3.3.4 Derivative financial instruments
Nominal and fair value of derivatives (CZK million)
Nominal value of derivatives Fair value of derivatives
Balance as at 31 December 2012
Balance as at 31 December 2011
Balance as at 31 December 2012
Balance as at 31 December 2011
With positive
fair value
With negative fair value
With positive
fair value
With negative fair value Positive Negative Positive Negative
Currency instruments
Currency forwards for trading 24 155 – – – 10 – –
Currency forwards – cash flow hedging 38,316 95,398 36,895 107,628 790 4,515 1,696 6,493
Currency swaps – cash flow hedging 8,486 4,195 1,632 4,193 179 94 50 277
Commodity instruments
Commodity swaps for trading 140 – – – 31 – – –
Commodity swaps – cash flow hedging 844 1,137 1,243 1,468 129 83 105 160
Total 47,810 100,885 39,770 113,289 1,129 4,702 1,851 6,930
Thefairvaluesoffinancialderivativesfulfilthecriteriaoflevel2incompliancewiththeIFRS7hierarchy(thefairvaluesarederivedfrommarketquotationsofforwardexchangerates,commoditypricesandyieldcurves,howeverthefinancialderivativesarenotdirectlytradedinactivefinancialmarkets).

Notes to the separate financial statements 2012
134 Annual Report 2012
Volume of hedged cash flows (CZK million)
Balance as at 31 December 2012 Volume of hedged cash flows
Within 1 year 1-5 years Total
Currency risk exposure
Hedging of future cash flows – future receivables 52,659 72,647 125,306
Hedging of future cash flows – future liabilities (12,831) (6,275) (19,106)
Other price risks (combination of commodity and currency risks)
Hedging of future cash flows – future liabilities (785) (1,173) (1,958)
Total 39,043 65,199 104,242
Balance as at 31 December 2011 Volume of hedged cash flows
Within 1 year 1-5 years Total
Currency risk exposure
Hedging of future cash flows - future receivables 49,167 70,354 119,521
Hedging of future cash flows - future liabilities (15,289) (10,596) (25,885)
Other price risks (combination of commodity and currency risks)
Hedging of future cash flows - future liabilities (609) (1,921) (2,530)
Total 33,269 57,837 91,106
3.4 Sensitivity analysis
3.4.1 Sensitivity to exchange ratesTheCompanyisexposedtotheforeigncurrencyriskarisingmainlyfromtransactionsperformedwithEUcountries (EUR,GBP)andwithcountriesusingUSDas transactioncurrency.The foreigncurrency risk ismeasuredagainstthefunctionalcurrency(CZK)asatthebalancesheetdate,whenthefinancialassetsandliabilitiesdenominatedinforeigncurrenciesarerecalculatedtoCZKbyapplyingtheCzechNationalBankexchangerate.Thesensitivityanalysisincludesanalysisofexposurearisingfromderivativefinancialassetsandliabilitiesandunpaidfinancialassetsandliabilitiesdenominatedinforeigncurrencies,andmeasurestheimpactfromrecalculationoftheseitemsasatbalancesheetdatebyusingadjustedexchangeratescomparedtothosepublishedbyCzechNationalBank. In2012 (2011) theCompanyconsiders (considered)themovementsofexchangeratesEUR,USD,CHFandGBPagainstCZKinthefollowingperiodof+10%(appreciationofCZK)and-10%(depreciationofCZK)aspossible.Thesensitivityanalysistoexchangeratechanges isbasedontheassumptionofexpectedpossibleex-changeratemovements.Thefollowingtablespresentimpactonprofitorlossandonothercomprehensiveincomeofexpectedpos-sibleappreciationordepreciationofCZKtoforeigncurrencies:

Notes to the separate financial statements 2012
135Annual Report 2012
2012 (CZK million) CZK appreciation by 10%
EUR USD CHF GBPOther
currencies Total
Income statement
Non-derivative financial instruments 881 (67) (1) 3 (221) 595
Derivative financial instruments – (46) 2 (41) (76) (161)
Other comprehensive income
Derivative financial instruments (1,685) 2,906 1,978 3,706 3,503 10,408
2012 (CZK million) CZK depreciation by 10%
EUR USD CHF GBPOther
currencies Total
Income statement
Non-derivative financial instruments (881) 67 1 (3) 221 (595)
Derivative financial instruments – 46 (2) 41 76 161
Other comprehensive income
Derivative financial instruments 1,685 (2,906) (1,978) (3,706) (3,503) (10,408)
2011 (CZK million) CZK appreciation by 10%
EUR USD CHF GBPOther
currencies Total
Income statement
Non-derivative financial instruments 767 (84) (10) 5 (400) 278
Derivative financial instruments 10 (41) 2 (68) (83) (180)
Other comprehensive income
Derivative financial instruments (2,510) 2,307 2,436 3,323 3,739 9,295
2011 (CZK million) CZK depreciation by 10%
EUR USD CHF GBPOther
currencies Total
Income statement
Non-derivative financial instruments (767) 84 10 (5) 400 (278)
Derivative financial instruments (10) 41 (2) 68 83 180
Other comprehensive income
Derivative financial instruments 2,510 (2,307) (2,436) (3,323) (3,739) (9,295)

Notes to the separate financial statements 2012
136 Annual Report 2012
3.4.2 Sensitivity to interest ratesTheCompanyisexposedtointerestriskmainlyinrelationtoshort-termdepositsprovidedtoVolkswagenCompanycompanies.Theanalysisofsensitivitytochangesininterestrateswasbasedonexposuretoderivativefinancialassetsandliabilitiesasatbalancesheetdateinthesamewayasforthenon-derivativefinancialassets.In2012(2011)theCompanyassumes(assumed)possiblemovementsoftheyieldcurveinthefollowingperiodforshort-termdepositsprovidedtoVolkswagenGroupcompanies,bankdepositsandcurrencyforwardsandswapsby+100/-25basispoints.TheCompanyismostsensitivetomovementsoftheCZKyieldcurve.Inthecaseofderivativefinancial instruments, theCompanymeasuresthe impactonthechange infairvalueofthesederivativesthatresultsfromthechangeintheyieldcurve.Fornon-derivativefinancialinstru-ments,theimpactonprofitorlossisdeterminedonthebasisofdefinedchangeintheinterestrate,whichwouldariseatthebeginningofthenextaccountingperiodandbasedontheassumptionthatnootherchangesintheinterestratewouldoccurduringtheentireaccountingperiod.Thefollowingtablespresentimpactonprofitorlossbeforetaxofexpectedincreaseordecreaseofinter-estrates:
2012 (CZK million) Interest rate increased by
100 basis points
Interest rate decreased by
25 basis points
Income statement
Non-derivative financial instruments 341 (85)
Derivative financial instruments 33 (8)
Total 374 (93)
2011 (CZK million) Interest rate increased by
100 basis points
Interest rate decreased by
25 basis points
Income statement
Non-derivative financial instruments 454 (114)
Derivative financial instruments 91 (23)
Total 545 (137)

Notes to the separate financial statements 2012
137Annual Report 2012
3.4.3 Sensitivity to changes in other price risksTheCompany isexposedtoacombinationofcommodityandcurrencyrisksduetovolatility inpricesofparticularcommoditiestradedinforeigncurrencies.Thisriskofchangeincashflowsishedgedbyacombi-nationofcommodityswapsandcurrencyforwards.Thesensitivityanalysistochangesincommoditypriceswasdeterminedbasedontheexposuretoderiva-tivefinancialassetsandliabilitiesasatthebalancesheetdate.In2012(2011),theCompanyassumes(assumed)potentialmovementsincopperpricesinthefollowingpe-riodof+/-20%.In2012(2011)theCompanyassumes(assumed)potentialmovementsinaluminiumpricesinthefollowingperiodof+/-10%.In2012,theCompanyassumespotentialmovementsinleadpricesinthefollowingperiodof+/-10%.TheCompanyconsiderschanges inthefairvaluesofderivativefinancial instrumentsduetochanges inspotcommodityprices.Othernon-derivativefinancialassetsandliabilitiesaredeemednottobesensitivetochangesincommoditypricessincethepricesarefixedatthetimeofrecognitionofthefinancialliabilityorasset.Thefollowingtablesrepresentimpactonprofitorlossandonothercomprehensiveincomebeforetaxofexpectedincreaseordecreaseofcopper,aluminiumandleadprices:
2012 (CZK million) Increase of copper
prices +20%
Decrease of copper
prices (20)%
Increase of aluminium
prices +10%
Decrease of aluminium
prices (10)%Increase of lead
prices +10%Decrease of lead
prices (10)%
Income statement
Derivative financial instruments – – – – 17 (17)
Other comprehensive income
Derivative financial instruments 252 (252) 76 (76) – –
2011 (CZK million) Increase of copper
prices +20%
Decrease of copper
prices (20)%
Increase of aluminium
prices +10%
Decrease of aluminium
prices (10)%Increase of lead
prices +10%Decrease of lead
prices (10)%
Income statement
Derivative financial instruments – – – – – –
Other comprehensive income
Derivative financial instruments 270 (270) 120 (120) – –
ThepossibleimpactonincomestatementofexpectedpriceincreaseordecreaseofcopperandaluminiumwasassessedbytheCompanyasimmaterial.

Notes to the separate financial statements 2012
138 Annual Report 2012
3.5 Capital risk management
TheoptimalcapitalisationoftheCompanyistheresultofacompromisebetweentwointerests:returnoncapitalandtheCompany’scapacitytomeetallofitsliabilitiesdueforpayment.ItistheobjectiveofthecapitalmanagementfunctiontomaintainanadequateownedtoborrowedcapitalratiotoguaranteeduepaymentsofallfinancialliabilitieswhilepromotingcontinuedgrowthoftheCom-pany’svaluefortheshareholders.Theratiosofequityandofborrowedcapitalontotalcapitalareshowninthefollowingtable:
CZK million 2012 2011
Equity 88,302 80,407
Equity ratio 62.5% 59.3%
Non-current financial liabilities 3,000 3,000
Current financial liabilities 107 107
Total financial liabilities 3,107 3,107
Ratio of financial liabilities to total equity and liabilities 2.2% 2.3%
Total equity and liabilities 141,242 135,571

Notes to the separate financial statements 2012
139Annual Report 2012
4. Geographical informationTheCompany’sheadofficeandmainproductionfacilitiesaresituatedintheCzechRepublic.TheCompany’ssalesaregenerated fromfivebasicgeographical regions: theCzechRepublic;Germany;Western Europe-Other; Central and Eastern Europe; and Overseas/Asia/Africa/Australia. Overseas/Asia/ Africa/AustraliaregionisduetoitsimmaterialityreportedasUnallocated.
2012 (CZK million)Czech
Republic Germany
Western Europe -
Other
Central and Eastern Europe Unallocated Total
Sales – based on location of customers 21,927 54,717 78,837 55,142 28,478 239,101
Non-current assets* 74,316 198 – 1,872 – 76,386
2011 (CZK million)Czech
Republic Germany
Western Europe -
Other
Central and Eastern Europe Unallocated Total
Sales – based on location of customers 22,084 55,579 83,877 45,274 24,928 231,742
Non-current assets* 59,457 198 – 1,872 – 61,527
* Non-current assets other than financial instruments and deferred tax assets.

Notes to the separate financial statements 2012
140 Annual Report 2012
5. Intangible assets (CZK million)
Capitalised development costs
for products currently in use
Capitalised development costs for products under
developmentOther
intangible assets Total
Costs
Balance as at 1 January 2012 21,710 5,385 8,189 35,284
Additions 4,012 2,092 2,010 8,114
Disposals – – (350) (350)
Transfers 5,251 (5,251) – –
Balance as at 31 December 2012 30,973 2,226 9,849 43,048
Cumulative amortisation and impairment losses
Balance as at 1 January 2012 (16,369) – (5,384) (21,753)
Amortisation (2,093) – (469) (2,562)
Impairment losses (404) – – (404)
Disposals – – 350 350
Balance as at 31 December 2012 (18,866) – (5,503) (24,369)
Carrying amount as at 31 December 2012 12,107 2,226 4,346 18,679
Capitalised development costs
for products currently in use
Capitalised development costs for products under
developmentOther
intangible assets Total
Costs
Balance as at 1 January 2011 24,577 2,143 6,600 33,320
Additions 22 3,284 1,877 5,183
Disposals (2,931) – (288) (3,219)
Transfers 42 (42) – –
Balance as at 31 December 2011 21,710 5,385 8,189 35,284
Cumulative amortisation and impairment losses
Balance as at 1 January 2011 (16,228) – (4,240) (20,468)
Amortisation (2,314) – (434) (2,748)
Impairment losses (758) – (998) (1,756)
Disposals 2,931 – 288 3,219
Balance as at 31 December 2011 (16,369) – (5,384) (21,753)
Carrying amount as at 31 December 2011 5,341 5,385 2,805 13,531
Otherintangibleassetsincludemainlytoolingrights,softwareandsoftwarelicences.AmortisationandimpairmentlossesofintangibleassetsofCZK2,835million(2011:CZK4,365million)areincludedinthecostofsales,CZK19million(CZK2011:13million)indistributionexpenses,andCZK112million(2011:CZK126million)inadministrativeexpenses.

Notes to the separate financial statements 2012
141Annual Report 2012
Impairment reviewsTherequirementsofIAS1,IAS10andIAS36havebeenassessedbytheCompany’smanagementinrelationtothedecreaseinplannedcashinflowsregardingparticularŠKODAmodelsandtheirpotentialimpactonthecarryingamountoftheCompany‘snon-currentintangibleassets.Duetosubstantialchangesinthemarketenvironment,theCompanyhasexperiencedin2012adecreaseintheplannedcashinflowsrelatingtothreecash-generatingunits(productionofcarsofcertainmodels).Impairmentreviewsofassetsrelatingtothosecash-generatingunitshavebeenperformed.Thecarryingamountsoftheassetsrelatingtothecash-gener-atingunitshavebeencomparedwiththerelevantrecoverableamounts.Therecoverableamountshavebeendeterminedbasedonthecalculationofthevalueinuseapplyingcashflowprojectionsoverthelifecycleofthecash-generatingunitsreflectingfinancialplans,approvedbytheCompany’smanagement.Fordiscountingcashflows,thediscountrateof6.6%hasbeenapplied in2012 (2011:6.8%),reflectingthespecificrisksassociatedwiththesectorinwhichtheCompanyoperates.Foronecash-generatingunit,thecomparisonofthecarryingamountswiththerelevantrecoverableamountsresultedinanimpairmentlossallocatedtointangibleassetsintheamountofCZK404million(2011twocash-generatingunits:CZK1,756million),whichhasbeenpostedtotheincomestatement(withinlineCostofsales)fortheyearended31De-cember2012(31December2011).
Capitalisation of borrowing costs Forthecapitalisationofborrowingcostsin2012,theCompanyappliedthecapitalisationrateof4.53%(2011:4.53%).Noborrowingcostshavebeencapitalisedinthecostofintangibleassetsin2012or2011astheywerenotsignificant.
The following amounts were recognised in the income statement as research and development expenses (CZK million)
2012 2011
Research and non-capitalised development costs 4,848 6,061
Amortisation and impairment losses of development costs 2,497 3,072
Research and development costs recognised in the income statement 7,345 9,133

Notes to the separate financial statements 2012
142 Annual Report 2012
6. Property, plant and equipment (CZK million)
Land and buildings
Technical equipment and
machineryTooling, office and
other equipment
Advances paid and assets under
construction Total
Costs
Balance as at 1 January 2012 31,011 60,771 45,610 12,288 149,680
Additions 1,868 7,773 4,519 4,388 18,548
Disposals (24) (1,064) (2,615) – (3,703)
Transfers 1,461 3,197 2,303 (6,961) –
Balance as at 31 December 2012 34,316 70,677 49,817 9,715 164,525
Cumulative depreciation and impairment losses
Balance as at 1 January 2012 (13,010) (50,800) (40,473) – (104,283)
Amortisation (1,136) (4,111) (3,357) – (8,604)
Impairment losses – – (222) – (222)
Disposals 19 1,064 2,609 – 3,692
Balance as at 31 December 2012 (14,127) (53,847) (41,443) – (109,417)
Carrying amount as at 31 December 2012 20,189 16,830 8,374 9,715 55,108
Land and buildings
Technical equipment and
machineryTooling, office and
other equipment
Advances paid and assets under
construction Total
Costs
Balance as at 1 January 2011 29,680 58,432 45,427 7,433 140,972
Additions 941 1,468 917 8,697 12,023
Disposals (64) (1,913) (1,337) (1) (3,315)
Transfers 454 2,784 603 (3,841) –
Balance as at 31 December 2011 31,011 60,771 45,610 12,288 149,680
Cumulative depreciation and impairment losses
Balance as at 1 January 2011 (11,931) (49,591) (37,938) – (99,460)
Amortisation (1,098) (3,106) (3,400) – (7,604)
Impairment losses (7) (18) (468) – (493)
Disposals 26 1,915 1,333 – 3,274
Balance as at 31 December 2011 (13,010) (50,800) (40,473) – (104,283)
Carrying amount as at 31 December 2011 18,001 9,971 5,137 12,288 45,397
Depreciationand impairment lossesofthebuildingsandequipmentofCZK8,131million (2011:CZK7,444million)areincludedinthecostofsales,CZK162million(2011:CZK160million)indistributionexpenses,andCZK533million(2011:CZK493million)inadministrativeexpenses.

Notes to the separate financial statements 2012
143Annual Report 2012
Impairment reviewsTherequirementsofIAS1,IAS10andIAS36havebeenassessedbytheCompany’smanagementinrelationtothedecreaseinplannedcashinflowsregardingparticularŠKODAmodelsanditspotentialimpactonthecarryingamountoftheCompany‘snon-currenttangibleassets.Duetosubstantialchangesinthemarketenvironment,theCompanyhasexperiencedin2012adecreaseintheplannedcashinflowsrelatingtotwocash-generatingunits(productionofcarsofcertainmodels).Impairmentreviewsofassetsrelatingtothosecash-generatingunitshavebeenperformed.Thecarryingamountsoftheassetsrelatingtothecash-generatingunitshavebeencomparedwiththerelevantrecoverableamounts.Therecoverableamountshavebeendeterminedbasedonthecalculationofthevalueinuseapplyingcashflowprojectionsoverthelifecycleofthecash-generatingunitsreflectingfinancialplans,approvedbytheCompany’smanagement.Fordiscountingcashflows,thediscountrateof6.6%hasbeenappliedin2012(2011:6.8%),reflectingthespecificrisksassociatedwiththesectorinwhichtheCompanyoperates.Foronecash-generatingunit,thecomparisonofthecarryingamountswiththerelevantrecoverableamountsresultedinanimpairmentlossallocatedtotangibleassetsintheamountofCZK222million(2011:CZK493million),whichhasbeenpostedtotheincomestatement(withinlineCostofsales)fortheyearended31December2012(31December2011).
Capitalisation of borrowing costs Forthecapitalisationofborrowingcostsin2012,theCompanyappliedthecapitalisationrateof4.53%(2011:4.53%).Noborrowingcostshavebeencapitalisedinthecostofproperty,plantandequipmentin2012orin2011astheywerenotsignificant.

Notes to the separate financial statements 2012
144 Annual Report 2012
7. Investments in subsidiaries
Country of incorporation Shareholding %
Subsidiaries:
ŠKODA AUTO Deutschland GmbH Germany 100
ŠKODA AUTO Slovensko, s.r.o. Slovakia 100
Skoda Auto India Private Ltd. India 100
ThesubsidiariesinwhichtheCompanyhasafinancial investmentpaiddividendstotheCompanyintheamountofCZK371millionin2012(2011:CZK263million).In2012, theCompanymadeacashcontribution intotheregisteredcapitalof thesubsidiarySkodaAutoIndiaPrivateLtd.inthetotalamountofCZK1,189million.Also,thepreferenceshares,whichwerepreviouslyincludedinthecarryingvalueoftheinvestment,havebeenrepaidintheamountofCZK267million.On 1 January 2012, the Company sold its 51% share in the subsidiary Skoda Auto Polska S.A. to parent VolkswagenInternationalFinanceN.V.(seeNote12).Asaresult,theCompanyhaslosttheentireinterestinthesubsidiary.GainondisposalofthesubsidiaryisincludedinthefinancialresultinthelineIncomefrominvestmentsinassociates(seeNote21)intheamountofCZK360million.CarryingvalueoftheinvestmentbeforethesalewaslessthanCZK1million.
Impairment reviews TherequirementsoftheIAS1,IAS10andIAS36standardswereassessedbytheCompany’smanagementinrelationtothedevelopmentoftheautomotiveindustryandplannedvolumesofsoldcarsandthepoten-tialimpactsonthecarryingamountoftheCompany’sfinancialinvestmentsinsubsidiaries.TheCompany’smanagementhasperformedanimpairmentreviewofthecash-generatingunit,forwhichthedevelopmentoftheautomotiveindustryandplannedvolumesofsoldcarsindicatedapossibleimpairmentloss.Carry-ingvalueofthefinancial investmentinthesubsidiaryhasbeencomparedwiththerelevantrecoverableamount.Therecoverableamounthasbeendeterminedbasedonthecalculationofthevalueinuseapply-ingcashflowprojectionsoverthefollowingfiveyears,reflectingfinancialplansapprovedbytheCompany’smanagement.Cashflowsbeyondthefiveyearsperiodhavebeenextrapolatedwithanestimatedgrowthratewhichisnothigherthanexpectedlong-termaveragegrowthrateintheautomotiveindustry.Fordeterminationofthevalueinuseofthefinancialinvestmentin2012(2011),estimatedgrowthrateof1%hasbeenapplied.Theapplieddiscountrateispre-taxandreflectsspecificrisksassociatedwiththesectorandtheregioninwhichthereviewedcompanyoperates.In2012,adiscountrateof6.8%(2011:7.3%)hasbeenapplied.Foronecash-generating,thecomparisonofthecarryingamountwiththerelevantrecoverableamountre-sultedinanimpairmentlossintheamountofCZK922million(2011:CZK1,141million),whichhasbeenpostedtotheincomestatement(withinlineFinancialexpensefortheyearended31December2012).

Notes to the separate financial statements 2012
145Annual Report 2012
8. Investments in associates (CZK million)
2012 2011
Total assets 62,273 52,911
Total liabilities 51,896 49,623
Total revenue 168,391 121,296
Profit / (loss) (aggregated) 7,419 1,600
The table above summarises financial data of the associatesOOOVOLKSWAGENGroupRus and ŠKO-ENERGOFIN,s.r.o.TheCompany’sshareintheregisteredcapitalofthecompanyOOOVOLKSWAGENGroupRusasat31De-cember2012was16.8%(31December2011:16.8%).TheCompany’sshareofprofitsorlossesofthisassoci-atefor2012was17.91%(2011: 17.91%).TheCompanyexercisessignificant influence inthecompanyOOOVOLKSWAGENGroupRusbasedonthefollowingfactors:theCompanyisparticipatinginpolicy-makingpro-cesses,includingparticipationindecisionsaboutdistributionofprofit;materialtransactionsareconductedbetweenbothcompanies;aninterchangeofmanagerialpersonneltakesplacesbetweenbothcompaniesandtheCompany isprovidingessentialtechnical informationtothecompanyOOOVOLKSWAGENGroupRus.TheCompany’sshareintheregisteredcapitalofthecompanyŠKO-ENERGOFINasat31December2012was31.25%(asat31December2011:31.25%).ThevalueoftheCompany’ssharetotalledCZK529millionasat31December2012(asat31December2011:CZK529million).ŠKO-ENERGOFINpaiddividendstotheCompanyintheamountofCZK83million(2011:CZK104million).
Impairment reviews The requirementsof the IAS 1, IAS 10and IAS36standardswereassessedby theCompany’smanage-mentinrelationtothedevelopmentoftheautomotiveindustryandplannedvolumesofsoldcarsandthepotentialimpactsonthecarryingamountoftheCompany’sfinancialinvestmentsinassociates.Basedonperformedanalyses,nofactorshavebeenidentifiedwhichwouldindicateaneedtorecogniseimpairmentlosseswithanexceptionoffutureeconomicbenefitsarisingfrominvestmentintheassociateOOOVOLKS-WAGENGroupRus.TheCompany’smanagementhas thereforeperformedan impairment reviewof thiscash-generatingunit.Carryingvalueofthefinancialinvestmentintheassociatehasbeencomparedwiththerelevantrecoverableamount.Therecoverableamounthasbeendeterminedbasedonthecalculationofthevalueinuseapplyingcashflowprojectionsoverthefollowingfiveyears,reflectingfinancialplansapprovedbytheCompany’smanage-ment.Cashflowsbeyondthefiveyearsperiodhavebeenextrapolatedwithestimatedgrowthratewhichisnothigherthanexpectedlong-termaveragegrowthrateintheautomotiveindustry.Theapplieddiscountrateispost-taxandreflectsspecificrisksassociatedwiththesectorandtheregioninwhichthereviewedcompanyoperates. In2012,discount rateof 11.2% (2011:9.5%)hasbeenapplied.Thecomparisonof thecarryingamountswiththerelevantrecoverableamounthasnotgivenrisetoanyimpairmentlossasat31December2012or31December2011.

Notes to the separate financial statements 2012
146 Annual Report 2012
9. Other non-current and current receivables, financial assets and trade receivables (CZK million)
Balance as at 31 December 2012 Financial assets at fair
value through profit or
loss**Loans and
receivables
Available for sale
financial assets
Financial assets
designated as hedging
instruments Other* Total
Other receivables and financial assets
Loans to employees – 573 – – – 573
Deposits in companies within Volkswagen Group – 3,033 – – – 3,033
Positive fair value of financial derivatives (29) – – 1,158 – 1,129
Available for sale financial assets – – 4 – – 4
Tax receivables (excl. income tax) – – – – 2,867 2,867
Others – 68 – – 307 375
Total (29) 3,674 4 1,158 3,174 7,981
Trade receivables
Third parties – 1,915 – – – 1,915
Subsidiaries – 758 – – – 758
Other related parties – 8,504 – – – 8,504
Total – 11,177 – – – 11,177
* The category Other does not meet a definition of financial instruments in terms of IAS 32.** Financial assets held for trading.
Note:The line Positive fair value of financial derivatives in the portfolio Financial assets designated as hedging instruments is represented by the spot componentof financial derivatives and in the portfolio Financial assets at fair value through profit or loss it is represented by the forward component of financial derivatives (see also Note 2.5.3). As the spot component exceeded the fair value as at 31 December 2012, the forward component was negative.

Notes to the separate financial statements 2012
147Annual Report 2012
Balance as at 31 December 2011 Financial assets at fair
value through profit or
loss**Loans and
receivables
Available for sale
financial assets
Financial assets
designated as hedging
instruments Other* Total
Other receivables and financial assets
Loans to employees – 542 – – – 542
Deposits in companies within Volkswagen Group – 21,539 – – – 21,539
Positive fair value of financial derivatives (242) – – 2,093 – 1,851
Available for sale financial assets – – 4 – – 4
Tax receivables (excl. income tax) – – – – 3,574 3,574
Others – 238 – – 297 535
Total (242) 22,319 4 2,093 3,871 28,045
Trade receivables
Third parties – 2,773 – – – 2,773
Subsidiaries – 955 – – – 955
Other related parties – 7,967 – – – 7,967
Total – 11,695 – – – 11,695
* The category Other does not meet a definition of financial instruments in terms of IAS 32.** Financial assets held for trading.
Note:The line Positive fair value of financial derivatives in the portfolio Financial assets designated as hedging instruments is represented by the spot component of finan-cial derivatives and in the portfolio Financial assets at fair value through profit or loss it is represented by the forward component of financial derivatives (see also Note 2.5.3). As the spot component exceeded the fair value as at 31 December 2011, the forward component was negative.
ThecarryingamountofloanstoemployeesanddepositsincompanieswithinVolkswagenGroupapproxi-matestheirfairvalue.Thecarryingamountnetofimpairmentlossforeachclassoffinancialassetswhicharenotcarriedatfairvalueapproximatestheirfairvalueduetotheshort-termnatureoftheseitems.ThelineDepositsincompanieswithinVolkswagenGroupcomprisesdepositsintheamountofCZK0million(asat31December2011:CZK21,539million)withoriginalmaturityfromthreemonthstooneyearandde-positsintheamountofCZK3,033million(asat31December2011:CZK0)withoriginalmaturityfromoneyeartofiveyears.TheweightedaverageeffectiveinterestratebasedonthecarryingamountofdepositswithoriginalmaturityfromthreemonthstooneyearprovidedtoVolkswagenGroupcompaniesasat31December2012was0%(31December2011:0.88%).TheweightedaverageeffectiveinterestratebasedonthecarryingamountofdepositswithoriginalmaturityfromoneyeartofiveyearsprovidedtoVolkswagenGroupcompaniesasat31December2012was1.58%(31December2011:0%).AlldepositsprovidedtoVolks-wagenGroupcompanieswithoriginalmaturityfromthreemonthstofiveyearsaredenominatedinCZK.LineOthersinotherreceivablesandfinancialassetsincludemainlyotherreceivablesfromemployeesandadvancespaid.Therearenosignificantrestrictionsregardingtherightsofuseimposedontheotherre-ceivablesandfinancialassets.Cumulativeimpairmentlossesreflecttheincurredrisksofthedebtors’delaysordefaults.TheallowancefortheimpairmentoftradereceivablesofCZK194million(2011:CZK211million)hasbeendeductedfromthepresentedcarryingvaluesoftradereceivables.Duetotheirshorttermnaturethecarryingamountoftradereceivablesapproximatesthefairvalueasatthebalancesheetdateafterthevaluationallowanceistakenintoaccount.
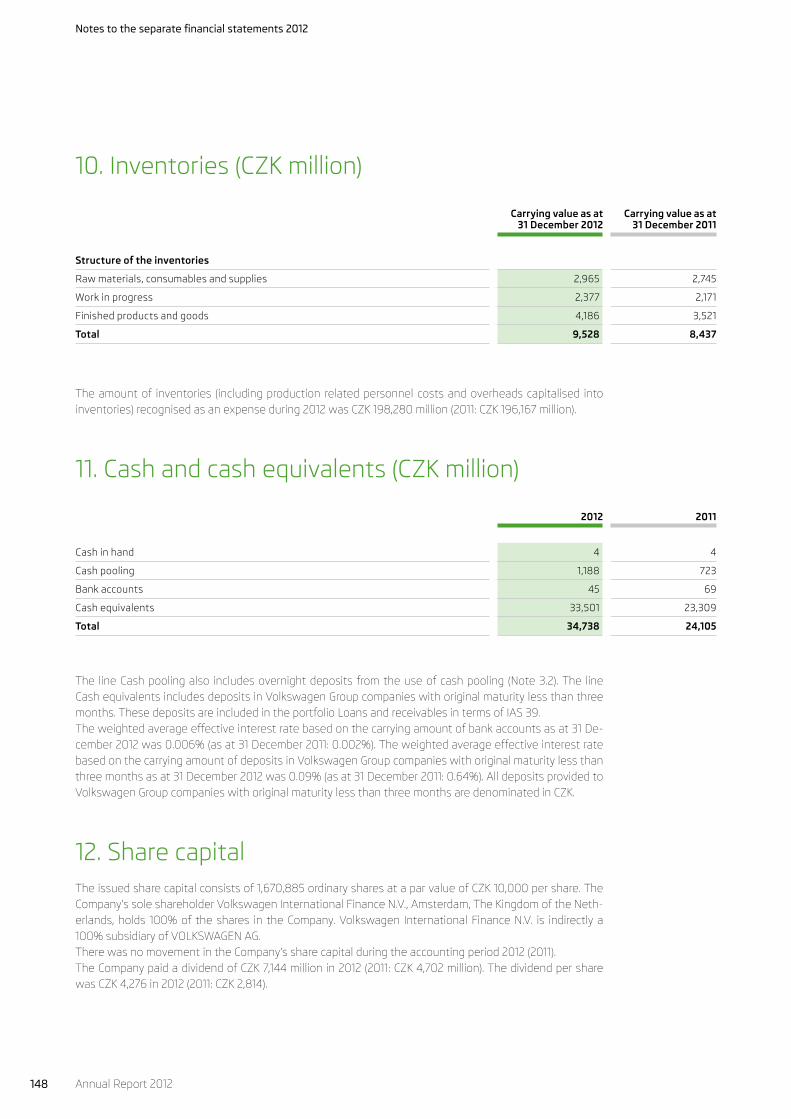
Notes to the separate financial statements 2012
148 Annual Report 2012
10. Inventories (CZK million)
Carrying value as at 31 December 2012
Carrying value as at 31 December 2011
Structure of the inventories
Raw materials, consumables and supplies 2,965 2,745
Work in progress 2,377 2,171
Finished products and goods 4,186 3,521
Total 9,528 8,437
Theamountof inventories (includingproduction relatedpersonnelcostsandoverheadscapitalised intoinventories)recognisedasanexpenseduring2012wasCZK198,280million(2011:CZK196,167million).
11. Cash and cash equivalents (CZK million)
2012 2011
Cash in hand 4 4
Cash pooling 1,188 723
Bank accounts 45 69
Cash equivalents 33,501 23,309
Total 34,738 24,105
The lineCashpoolingalso includesovernightdepositsfromtheuseofcashpooling (Note3.2).The lineCashequivalentsincludesdepositsinVolkswagenGroupcompanieswithoriginalmaturitylessthanthreemonths.ThesedepositsareincludedintheportfolioLoansandreceivablesintermsofIAS39.Theweightedaverageeffectiveinterestratebasedonthecarryingamountofbankaccountsasat31De-cember2012was0.006%(asat31December2011:0.002%).TheweightedaverageeffectiveinterestratebasedonthecarryingamountofdepositsinVolkswagenGroupcompanieswithoriginalmaturitylessthanthreemonthsasat31December2012was0.09%(asat31December2011:0.64%).AlldepositsprovidedtoVolkswagenGroupcompanieswithoriginalmaturitylessthanthreemonthsaredenominatedinCZK.
12. Share capitalTheissuedsharecapitalconsistsof1,670,885ordinarysharesataparvalueofCZK10,000pershare.TheCompany’ssoleshareholderVolkswagenInternationalFinanceN.V.,Amsterdam,TheKingdomoftheNeth-erlands,holds 100%of theshares in theCompany.Volkswagen InternationalFinanceN.V. is indirectlya100%subsidiaryofVOLKSWAGENAG.TherewasnomovementintheCompany’ssharecapitalduringtheaccountingperiod2012(2011).TheCompanypaidadividendofCZK7,144millionin2012(2011:CZK4,702million).ThedividendpersharewasCZK4,276in2012(2011:CZK2,814).

Notes to the separate financial statements 2012
149Annual Report 2012
13. Other reserves and retained earnings (CZK million)13.1 Other reserves
2012 2011
Reserves for cash flow hedges* (2,766) (4,546)
Statutory reserve fund 3,366 3,366
Funds contributed by owner 10 10
Total 610 (1,170)
* Net of deferred tax from financial derivatives.
Thestatutoryreservefundmaybeusedonlytooffsetlosses.Accordingtorelevantregulationsofthecom-mercialcodeoftheCzechRepublic,theCompanyisrequiredtotransfer5%ofitsannualnetprofittothestatutoryreservefunduntilthebalanceofthisreservereaches20%ofthesubscribedcapital.Movementinreserveforcashflowhedges:
Balance as at 1 January 2012 (CZK million) (4,546)
Total change in fair value in the period 596
Deferred tax on change in fair value (125)
Total transfers to profit or loss in the period – effective hedging 1,601
Total transfers to profit or loss in the period – ineffective hedging 14
Deferred tax on transfers to profit or loss (306)
Balance as at 31 December 2012 (2,766)
Balance as at 1 January 2011 (CZK million) 315
Total change in fair value in the period (4,543)
Deferred tax on change in fair value 875
Total transfers to profit or loss in the period – effective hedging (1,481)
Total transfers to profit or loss in the period – ineffective hedging 8
Deferred tax on transfers to profit or loss 280
Balance as at 31 December 2011 (4,546)
Thetransferfromreservesforcashflowhedgestoprofitorlossarisingfromeffectivehedgingisin2012presentedinthelineOtheroperatingexpenseinamountofCZK2,697million(2011:CZK1,074million)andinthelineOtheroperatingincomeinamountofCZK1,096million(2011:CZK2,555million).
13.2 Retained earnings
FromthetotalamountofretainedearningsofCZK69,405million(asat31December2011:CZK63,290mil-lion)unconsolidatedprofitfortheyear2012amountstoCZK13,259million(2011:CZK:14,288million).Incompliancewiththerelevantregulationsofthecommercialcode,theunconsolidatedprofitoftheCom-panyfortheyear2012(determinedinaccordancewithIFRS)isgoingtobeappropriatedbasedonthedeci-sionoftheCompany’sannualgeneralmeeting.

Notes to the separate financial statements 2012
150 Annual Report 2012
14. Financial, other and trade liabilities (CZK million)
Balance as at 31 December 2012 Financial liabilities at fair
value through profit or loss**
Financial liabilities carried at
amortised costs
Financial liabili-ties designated
as hedging instruments Other* Total
Financial liabilities
Loans and credits – 3,107 – – 3,107
Total – 3,107 – – 3,107
Other liabilities
Negative fair value of financial derivatives 505 – 4,197 – 4,702
Liabilities to employees – – – 1,800 1,800
Social security – – – 453 453
Others – – – 988 988
Total 505 – 4,197 3,241 7,943
Trade liabilities
Third parties – 16,249 – 357 16,606
Subsidiaries – 1,523 – – 1,523
Other related parties – 7,495 – – 7,495
Total – 25,267 – 357 25,624
* The category Other includes items that are not financial liabilities in terms of IAS 32.** Financial liabilities held for trading.
Note: The line Negative fair value of financial derivatives in the portfolio Financial liabilities designated as hedging instruments is represented by the spot component of financial derivatives and in the portfolio Financial liabilities at fair value through profit or loss it is represented by the forward component of financial derivatives (see also Note 2.5.3).

Notes to the separate financial statements 2012
151Annual Report 2012
Balance as at 31 December 2011 Financial liabilities at fair
value through profit or loss**
Financial liabilities carried at
amortised costs
Financial liabili-ties designated
as hedging instruments Other* Total
Financial liabilities
Loans and credits – 3,107 – – 3,107
Total – 3,107 – – 3,107
Other liabilities
Negative fair value of financial derivatives (742) – 7,672 – 6,930
Liabilities to employees – – – 1,679 1,679
Social security – – – 429 429
Others – – – 603 603
Total (742) – 7,672 2,711 9,641
Trade liabilities
Third parties – 15,905 – 222 16,127
Subsidiaries – 825 – 433 1,258
Other related parties – 7,028 – 53 7,081
Total – 23,758 – 708 24,466
* The category Other includes items that are not financial liabilities in terms of IAS 32.** Financial liabilities held for trading.
Note:The line Negative fair value of financial derivatives in the portfolio Financial liabilities designated as hedging instruments is represented by the spot component of financial derivatives and in the portfolio Financial liabilities at fair value through profit or loss it is represented by the forward component of financial derivatives (see also Note 2.5.3) As the spot component exceeded the fair value as at 31 December 2011, the forward component is negative.
ThelineTradeliabilitiestootherrelatedpartiesincludesliabilitiestoafactoringcompanywithintheVolk-swagenGroupofCZK759millionasat31December2012(2011:CZK1,138million).TheseliabilitiesaroseintheordinarycourseofbusinessanddonotrepresentfinancingoftheCompany.Thedetailed informationrelatingtothe liabilitiesarisingoutoffinancialderivativescanbefoundunderNote3.3.4.Thecarryingvalueforotherclassesoffinancialliabilities(tradepayablesandloans)approximatesthefairvalueastheyincludeonlycurrentliabilities.Noneofthefinancialliabilitiesaresecuredbyalien.

Notes to the separate financial statements 2012
152 Annual Report 2012
In the tablebelow, thefinancial conditionsattached to loans receivedaresummarisedat their carryingamounts:
Carrying amount as at 31 December 2012 Weighted average
effective interest
rate based on nominal
amount
Maturity
Currency
Interest terms
Interest commitment
endingNominal amount < 1 year 1-5 years > 5 years Total
CZK fixed 1-5 years 4.53 % 3,000 107 3,000 – 3,107
Total financial liabilities 3,000 107 3,000 – 3,107
Carrying amount as at 31 December 2011 Weighted average
effective interest
rate based on nominal
amount
Maturity
Currency
Interest terms
Interest commitment
endingNominal amount < 1 year 1-5 years > 5 years Total
CZK fixed 1-5 years 4.53 % 3,000 107 3,000 – 3,107
Total financial liabilities 3,000 107 3,000 – 3,107
15. Deferred tax liabilities and assets (CZK million)Deferredincometaxassetsandliabilitiesareoffsetwhenthereisalegallyenforceablerighttooffsetthecurrenttaxassetsagainstcurrenttaxliabilities,andwhenthedeferredincometaxesrelatetothesamefiscalauthority.Asat31December2012theCompanyrecognisedonthebalancesheetdeferredtaxassetsofCZK1,012mil-lion(2011:deferredtaxassetCZK1,762million).Themovementsindeferredtaxassetsandliabilitiesduringtheyear,withouttakingintoconsiderationtheoffsetting,areasfollows:
DepreciationFinancial
derivatives*
Provisions, Valuation
allowances Other Total
Deferred tax liabilities
Balance as at 1 January 2011 (2,782) (86) – – (2,868)
Credited/(debited) to the income statement 102 – – – 102
Charged to other comprehensive income – 86 – – 86
Balance as at 31 December 2011 (2,680) – – – (2,680)
Credited/(debited) to the income statement (875) – – – (875)
Charged to other comprehensive income – – – – –
Balance as at 31 December 2012 (3,555) – – – (3,555)
* Further information on financial derivatives is disclosed in Note 2.5.3.

Notes to the separate financial statements 2012
153Annual Report 2012
DepreciationFinancial
derivatives*
Provisions, Valuation
allowances Other Total
Deferred tax assets
Balance as at 1 January 2011 – – 2,654 561 3,215
Credited/(debited) to the income statement – – 282 (124) 158
Charged to other comprehensive income – 1,069 – – 1,069
Balance as at 31 December 2011 – 1,069 2,936 437 4,442
Credited/(debited) to the income statement – 14 (5) 547 556
Charged to other comprehensive income – (431) – – (431)
Balance as at 31 December 2012 – 652 2,931 984 4,567
* Further information on financial derivatives is disclosed in Note 2.5.3.
16. Non-current and current provisions (CZK million)
Provisions for
warranty claims
Provisions for other
obligations arising
from sales
Provisions for
personnel costs
Provisions for
litigation risks
Provisions for
purchase risks
Other provisions Total
Balance as at 1 January 2011 8,380 1,037 1,504 1,349 784 1,278 14,332
Utilised (2,393) (991) (391) (1) (161) (478) (4,415)
Additions 3,344 1,346 1,655 61 719 1,082 8,207
Interest expense / (income) 147 – – – – – 147
Reversals (142) (46) (190) (176) (611) (340) (1,505)
Balance as at 1 January 2012 9,336 1,346 2,578 1,233 731 1,542 16,766
Utilised (3,029) (977) (1,239) – (543) (8) (5,796)
Additions 3,411 1,156 1,361 27 268 646 6,869
Interest expense / (income) 111 – – – – – 111
Reversals (244) (112) (243) (407) (188) (490) (1,684)
Balance as at 31 December 2012 9,585 1,413 2,457 853 268 1,690 16,266

Notes to the separate financial statements 2012
154 Annual Report 2012
Non-currentandcurrentprovisionsaccordingtothetimeofexpecteduseofresources:
< 1 year 1-5 years > 5 years Total
Balance as at 31 December 2012
Provisions for warranty claims 3,632 5,014 939 9,585
Provisions for other obligations arising from sales 1,413 – – 1,413
Provisions for personnel costs 1,449 373 635 2,457
Provisions for litigation risks 853 – – 853
Provisions for purchase risks 268 – – 268
Other provisions 1,690 – – 1,690
Total 9,305 5,387 1,574 16,266
< 1 year 1-5 years > 5 years Total
Balance as at 31 December 2011
Provisions for warranty claims 2,974 5,369 993 9,336
Provisions for other obligations arising from sales 1,346 – – 1,346
Provisions for personnel costs 1,603 291 684 2,578
Provisions for litigation risks 1,233 – – 1,233
Provisions for purchase risks 731 – – 731
Other provisions 1,518 – 24 1,542
Total 9,405 5,660 1,701 16,766
Theprovisionforwarrantyrepairsincludesprovisionforbasicguarantees(2years),provisionforcorrosionguarantees(dependentonthemodelfor10or12years)andotherguaranteesbeyondthescopeofbasicwarrantyespeciallygood-willrepairs(the3rdand4thyear).TheCompanyrecognisestheprovisionforwar-rantyclaimsatthemomentofsaleonthebasisofthenumberofsoldcarsandinadvancedeterminedratesforindividualmodellines.Provisionsforotherobligationsarisingfromsales includeprovisionforsalediscounts,salebonusesandsimilarallowancesincurred,settlementofwhichisexpectedafterthebalancesheetdate,butforwhichthereisalegalorconstructiveobligationattributabletosalesrevenuebeforethebalancesheetdate.Theadditionstoprovisionforotherobligationsarisingfromsalesaredecreasingrevenues.Provisionsforpersonnelcostsincludemainlyprovisionsforotherlong-termemployeebenefits,severancepaymentsandprovisionformanagementpersonnelremuneration.Provisionsforlitigationrisksrelatemainlytoprovisionforrisksarisingfromlegaldisputes,legalfees,penaltyinterestandotherlitigationrisks.TheCompanyprovidesfortheprobablecashoutflowsforexistinglegalandarbitrationproceedingsbymeansofarelevantprovision.TheCompanyisnotinvolvedinanylegalcasesorarbitrationproceedingsforwhichnoprovisionhasbeencreatedandwhichcouldhaveasignificantimpactonthefinancialpositionandthefinancialresults(finan-cialstatements)oftheCompanyandtherearenosuchproceedingsexpectedinthenearfuture.Provisions forpurchase risks includemainlyprovision for risksof retrospectivechanges inpricesof rawmaterialsandparts.OtherprovisionsincludemainlyprovisionfortaxrisksandcustomsrisksincountrieswheretheCompanyoperates.

Notes to the separate financial statements 2012
155Annual Report 2012
17. Cash flow statementThecashandcashequivalentscontainedinthecashflowstatementalsocomprise,inadditiontocashandshort-termdeposits, short-termdeposits inVolkswagenGroupcompanieswithoriginalmaturityof lessthanthreemonths.ThedetailedinformationrelatingtothecashandcashequivalentscanbefoundunderNote11.Cashflowsarepresentedinthecashflowstatementandareclassifiedintocashflowsfromoperatingac-tivities,investingactivitiesandfinancingactivities.Cashflowsfromoperatingactivitiesarederivedindirectlyfromprofitbeforetax.Profitbeforetaxisadjustedtoeliminatenon-cashexpenses(mainlydepreciationandamortisation)andincomeandchangesinworkingcapital.Investingactivitiesincludeadditionstoproperty,plantandequipment,financialassets,aswellastocapi-taliseddevelopmentcost.Financingactivitiesincludeinadditiontotheoutflowsofcashfromdividendpay-ments,redemptionofliabilitiesfromfinancing,alsooutflowsandinflowsfromotherborrowings.
18. Sales (CZK million)
2012 2011
Cars 204,378 197,746
Spare parts and accessories 14,306 13,071
Supplies of components within Volkswagen Group 14,610 15,366
Revenues from license fees 1,917 1,265
Services related to sales 292 180
Other 3,598 4,114
Total 239,101 231,742
Othersalesrelatemainlytosalesofresultsoftechnicaldevelopment,scrapandtooling.

Notes to the separate financial statements 2012
156 Annual Report 2012
19. Other operating income (CZK million)
2012 2011
Foreign exchange gains 2,746 2,553
Income from derivative transactions 1,019 2,219
Gains on non-current assets disposal 44 10
Reversal of provisions and accruals 2,256 2,490
Reversal of provision for receivables 17 17
Services – others 630 339
Other 495 719
Total 7,207 8,347
Foreignexchangegainsincludemainlygainsfromdifferencesinexchangeratesbetweenthedatesofrec-ognitionandpaymentofreceivablesandpayablesdenominatedinforeigncurrencies,aswellasexchangerategainsresultingfromrevaluationasatthebalancesheetdateofthesereceivablesandpayables.For-eignexchangelossesfromtheseitemsareincludedinotheroperatingexpenses.Reversalofprovisionsandaccrualsresultedfromchangesinestimatesdrivenmainlybythechangedexter-nalconditionsandcircumstancesonwhichtheCompanybasedtheestimates.
20. Other operating expenses (CZK million)
2012 2011
Foreign exchange losses 2,235 2,643
Losses from derivative transactions 3,035 1,078
Receivables write-offs 52 24
Other 887 238
Total 6,209 3,983

Notes to the separate financial statements 2012
157Annual Report 2012
21. Financial result (CZK million)
2012 2011
Interest income 370 478
Foreign exchange gains from cash 6 45
Foreign exchange gains from spot operations 340 337
Income from investments * 815 388
Gains on revaluation of financial derivatives including ineffective hedging 632 1,542
Financial income total 2,163 2,790
Interest expenses 468 531
Foreign exchange losses from cash 14 49
Foreign exchange losses from spot operations 338 378
Impairment losses investments in subsidiaries 922 1,141
Loss on revaluation of financial derivatives including ineffective hedging 1,713 760
Financial expenses total 3,455 2,859
Net financial result (1,292) (69)
* The line Income from investments also includes gain on disposal of the subsidiary, see Note 7.
22. Net gains and losses from financial instruments (CZK million)
2012 2011
Financial instruments at fair value through profit or loss (1,084) 781
Loans and receivables 319 725
Available for sale financial assets 1 21
Financial liabilities carried at amortised costs 218 (751)
Financial instruments designated as hedging instruments (1,601) 1,481
Net gains / (losses) total (2,147) 2,257
ThelineFinancialinstrumentsatfairvaluethroughprofitorlossrepresentsgainsorlossesinparticularfromtheforwardcomponentofcurrencyforwardsandswaps.Otheritemscontainmainlyunrealisedandrealisedforeignexchangegainsandlossesontradereceivablesandliabilities,fromhedginginstruments,interestincomefromdepositsincompanieswithinVolkswagenGroup, net interest loss fromderivative hedging instruments, foreign exchange gains/losses frombankdepositsandimpairmentlossesonfinancialassets.

Notes to the separate financial statements 2012
158 Annual Report 2012
23. Income tax (CZK million)
2012 2011
Current tax expense 2,134 3,127
of which: adjustment in respect of prior years 366 (114)
Deferred tax 319 (260)
Income tax total 2,453 2,867
StatutoryincometaxrateintheCzechRepublicforthe2012assessmentperiodwas19%(2011:19%).Asat31December2012and31December2011,deferredincometaxesattributabletotheCzechtaxjurisdictionweremeasuredatataxrateof19%thatcorrespondswiththestatutorytaxratesenactedforthefutureperiodswhenrealisationofdeferredtaxassetsandliabilitiesisexpected.
Reconciliation of expected to effective income tax expense (CZK million)
2012 2011
Profit before income tax 15,712 17,155
Expected income tax expense 2,985 3,259
Proportion of taxation relating to:
Permanent differences resulting from:
Tax exempt income (199) (133)
Expenses not deductible for tax purposes 315 404
Tax allowances and other tax credits (429) (659)
Prior-period current tax expense 366 (114)
Reassessment and recognition of deferred tax from unused tax credits from investment incentives (585) 110
Effective income tax expense 2,453 2,867
Effective income tax rate 16% 17%
LineTaxallowancesandothertaxcreditsrepresentsmainlytaxcreditsfromdoubledeductionofresearchanddevelopmentcosts.

Notes to the separate financial statements 2012
159Annual Report 2012
24. Subsidies and investment incentivesSubsidies In2012,theCompanyrecognisedincomefromsubsidiesofentrepreneurialactivitiesandemployeetrainingandretrainingcostsintheamountofCZK123million(2011:CZK66million).
Investment incentives Tobegrantedtheinvestmentincentives,theCompanyhastomeettheGeneralconditionsof§2art.2oftheActNo.72/2000Coll.,onInvestmentIncentives,asamendedandconditionsof§6aart.2and5ofthesameactandSpecialconditions§35boftheActNo.586/1992Coll.,onIncomeTaxasamended.FortheinvestmentincentivesgrantedtotheCompany,thetotalamountoftheincentiveisalwaysdependentontheamountinvested.InaccordancewiththeActonInvestmentIncentivesandbasedonrespectiveresolu-tions,theCompanywasgrantedthefollowinginvestmentincentiveswhichcanbeutilisedintheformoftaxcredit:
Model A SUV ThetotalamountoftheincentiveislimitedtotheamountofCZK561million.Theprojectwascompletedin2010.Asat31December2012(2011),utilisationoftheinvestmentincentiveintheformoftaxcreditwasregardedasuncertainbytheCompanyandtherefore,norelateddeferredtaxassetwasrecognised.
Enlargement of production of parts of engine EA 211 and its assembly ThetotalamountoftheincentiveislimitedtoCZK800million.In2012(2011),theprojectwasinprogressandtheCompanyexpectsutilisationoftheinvestmentincentiveinthefuture.Theamountofdeferredtaxassetrecognisedasat31December2012isCZK531million(31December2011:CZK0million).CZK429millionoutofthisamountrelatestoamountsinvestedinpriorperiods.Thedeferredtaxassetwasnotrecognisedasat31December2011becauseutilisationwasregardedasuncertain.
Enlargement of production of transmissions - MQ 100 ThetotalamountoftheincentiveislimitedtoCZK496million.In2012(2011),theprojectwasinprogressandtheCompanyexpectsutilisationoftheinvestmentincentiveinthefuture.Theamountofdeferredtaxassetrecognisedasat31December2012isCZK390million(31December2011:CZK335million).
Enlargement of technical development - Česana Jih premises ThetotalamountoftheincentiveislimitedtoCZK306million.Therealisationoftheprojectisexpectedinthefollowingyears.
25. Contingent liabilities Thetaxauthoritiesmayatanytimeinspecttheaccountingbooksandrecordssubsequentlytothere-portedtaxyearasgovernedbytherespective legislation,andmay imposeadditional taxassessmentsandpenalties.TheCompany’smanagementisnotawareofanycircumstancesthatcouldresultinmaterialliabilitiesaris-ingfromthetaxauditscarriedoutatpresentorpotentiallyinthefuture,exceptforthetaxrisksforwhichprovisionfortaxriskshasbeencreated(seeNote16).

Notes to the separate financial statements 2012
160 Annual Report 2012
26. Contractual obligations and other future commitments (CZK million)
Futurecommitmentsasatbalancesheetdateareasfollows:
Payable until year 2013 Payable 2014-2017 31 December 2012
Investment commitments – property, plant and equipment 8,968 606 9,574
Investment commitments – intangible assets 3,857 3,434 7,291
Operating leasing payments 310 251 561
Payable until year 2012 Payable 2013-2016 31 December 2011
Investment commitments – property, plant and equipment 10,894 1,328 12,222
Investment commitments – intangible assets 5,941 3,099 9,040
Operating leasing payments 178 248 426
Onthebasisofnon-cancellableoperatingleaseagreements,theCompanyrentedvariousmachinesandofficeequipmentandbuildings.Inthecaseofterminationoftheseagreements,alloutstandingleasepay-mentsuptotheoriginalexpirationdateofthecontractmustbepaid.

Notes to the separate financial statements 2012
161Annual Report 2012
27. Expenses by nature – additional information (CZK million)
2012 2011
Material costs – raw materials and other supplies, goods 162,712 158,044
Production related services 8,237 12,955
Personnel costs 18,123 17,099
Wages 13,736 12,979
Pension benefit costs (defined contribution plans) 2,702 2,507
Social insurance and other personnel costs 1,685 1,613
Depreciation, amortisation and impairment losses 11,792 12,601
Other services 22,231 18,183
Total cost of sales, distribution and administrative expenses 223,095 218,882
Number of employees
Number of employees* 26,909 26,265
* Average number of employees (including temporary employees).
28. Related party transactionsIn2012,therewerenochangesintheownershipstructureoftheCompanyandthecompanyVOLKSWAGENAGhasbeentheultimateparentcompanyandtheultimatecontrollingpartyoftheCompanyfortheentireaccountingperiod.On1August2012,thecompanyVOLKSWAGENAGgainedfullcontroloverthePorscheAGGroup.Sincethatdate,allcompaniesofthisgrouparefullyconsolidatedbytheultimateparentVOLKSWAGENAGandareincludedinthecategoryCompaniescontrolledbyultimateparentcompany.ItemsincategoryOtherrelatedpartiesarecompaniesunderjointcontrolofVOLKSWAGENAG,however,accordingtothelawtheydonotmeetthedefinitionofanentitycontrolledbythesamecontrollingentitypursuantto§66aoftheActNo.513/1991Coll.,CommercialCode,asamended.In2012and2011,thiscategoryincludesmainlytransactionswithShanghaiVolkswagenAutomotiveCompanyLtd.andwiththosecom-paniesofthePorscheHoldingGmbHGroupandthePorscheAGGroup,whichwerenotfullyconsolidatedintherespectiveperiodsbytheultimateparentVOLKSWAGENAG.

Notes to the separate financial statements 2012
162 Annual Report 2012
The Company participated in the following transactions with related parties:
Sales to related parties (CZK million)
2012 2011
Parent company
Volkswagen International Finance N.V. – –
Ultimate parent company
VOLKSWAGEN AG 3,723 5,335
Subsidiaries
Skoda Auto India Private Ltd. 2,198 4,443
ŠKODA AUTO Deutschland GmbH 48,007 46,687
ŠKODA AUTO Slovensko, s.r.o. 4,459 4,670
Skoda Auto Polska S.A. – 10,336
Associates
OOO VOLKSWAGEN Group Rus 24,845 16,462
Companies controlled by ultimate parent company 80,585 68,405
Other related parties 2,149 2,387
Total 165,966 158,725
TheabovetableSalestorelatedpartiescomprisesonlyrevenuesfromsalesofvehicles,sparepartsandsuppliesofvehiclecomponents.InadditiontorevenuesspecifiedinthetableSalestorelatedparties,in2012(2011)theCompanyalsoreal-isedrevenuesfromroyalties:
2012 2011
Revenues from license fees
Ultimate parent company – 112
Subsidiaries 20 42
Associates 129 72
Companies controlled by ultimate parent company – –
Other related parties 1,768 1,039
Total 1,917 1,265

Notes to the separate financial statements 2012
163Annual Report 2012
InadditiontotherevenuesspecifiedinthetableSalestorelatedparties,in2012(2011)theCompanyalsorealisedrevenueswithrelatedpartiesrelatingtointerestfromintercompanydeposits:
2012 2011
Interest income from deposits
Ultimate parent company 2 8
Subsidiaries – –
Associates – –
Companies controlled by ultimate parent company 317 416
Other related parties – –
Total 319 424
In addition to the revenues specified in the table Sales to related parties in 2012 Company recognisedrevenueondisposalofits51%shareonthesubsidiarySkodaAutoPolskaS.A.toparentVolkswagenInter-nationalFinanceN.V.(seeNote12)intheamountofCZK361million.MoredetailedinformationaboutthedisposalofthesubsidiaryisincludedinNote7.DividendsreceivedfromsubsidiariesaredisclosedinNote7.Dividendsreceivedfromassociatesaredis-closedinNote8.
Purchases from related parties (CZK million)
2012 2011
Parent company
Volkswagen International Finance N.V. – –
Ultimate parent company
VOLKSWAGEN AG 36,048 33,829
Subsidiaries
Skoda Auto India Private Ltd. 49 94
ŠKODA AUTO Deutschland GmbH 758 553
ŠKODA AUTO Slovensko, s.r.o. 66 67
Skoda Auto Polska S.A. – 196
Associates
OOO VOLKSWAGEN Group Rus 331 203
Companies controlled by ultimate parent company 28,634 23,173
Other related parties 37 76
Total 65,923 58,191
ThetablePurchasesfromrelatedpartiescomprisesonlypurchasesrelatingtotradeactivities.TheamountofdividendspaidtotheparentcompanyisdisclosedinNote12

Notes to the separate financial statements 2012
164 Annual Report 2012
Receivables from related parties (CZK million)
31 December 2012 31 December 2011
Parent company
Volkswagen International Finance N.V. – –
Ultimate parent company
VOLKSWAGEN AG 532 321
Subsidiaries
Skoda Auto India Private Ltd. 505 786
ŠKODA AUTO Deutschland GmbH 232 22
ŠKODA AUTO Slovensko, s.r.o. 22 60
Skoda Auto Polska S.A. – 87
Associates
OOO VOLKSWAGEN Group Rus 2,932 3,508
Companies controlled by ultimate parent company 2,591 2,991
Other related parties 2,448 1,147
Total 9,262 8,922
Theabovetablecomprisestradereceivablesandreceivablesfromroyalties.Receivablesfromroyaltiesarespecifiedbelow.
31 December 2012 31 December 2011
Receivables from royalties
Ultimate parent company – –
Subsidiaries 13 17
Associates 169 84
Companies controlled by ultimate parent company – –
Other related parties 2,097 519
Total 2,279 620
Inadditiontotradereceivablesandreceivablesfromroyalties,theCompanyalsohaddepositsincompaniescontrolledbyultimateparentcompanyinthetotalamountofCZK36,500million(31December2011:44,800million).Receivablesfrominterestfromthedepositsasat31December2012amountedtoCZK34million(31December2011:CZK49million).AverageinterestraterelatingtothesedepositsisdisclosedinNote9andNote11.ReceivablesfromrelatedpartiesareconsideredbytheCompanytobeoftheleastrisk.Theproductsde-liveredtotherelatedpartiesaresuppliedoncredit termsortheresultingreceivablesaretransferredtofactoringcompanies.Noimpairmentlosswasidentifiedforanyofthereceivablesfromrelatedparties.CashpoolingbalancewithVolkswagenGroupServicesS.A.isdisclosedinNote11.InvestmentsinsubsidiariesaredisclosedinNote7andinvestmentsinassociatesaredisclosedinNote8.

Notes to the separate financial statements 2012
165Annual Report 2012
Liabilities to related parties (CZK million)
31 December 2012 31 December 2011
Parent company
Volkswagen International Finance N.V. – –
Ultimate parent company
VOLKSWAGEN AG 1,725 1,428
Subsidiaries
Skoda Auto India Private Ltd. 379 1
ŠKODA AUTO Deutschland GmbH 1,082 1,127
ŠKODA AUTO Slovensko, s.r.o. 62 37
Skoda Auto Polska S.A. – 92
Associates
OOO VOLKSWAGEN Group Rus 16 18
Companies controlled by ultimate parent company 5,750 5,576
Other related parties 4 60
Total 9,018 8,339
Liabilitiestorelatedpartiesrepresentonlytradeliabilitiesforallthecategoriesstatedabove.Inadditiontothetradeliabilitiesstatedinthetableabove,theCompanyhadaliabilityfromaloanfromVOLKSWAGENAGofatotalamountofCZK3,000millionasat31December2012(31December2011:CZK3,000million).InterestpayablerelatingtothisloanamountstoCZK107millionasat31December2012(31December2011:CZK107million).DetailsabouttheloanarespecifiedinNote14.
31 December 2012 31 December 2011
Contractual obligations and other future commitments
Ultimate parent company 6,958 8,284
Subsidiaries – –
Associates – –
Companies controlled by ultimate parent company 345 736
Other related parties – –
Total 7,303 9,020
Contractualobligationstorelatedpartiesincludemainlycommitmentsinrespectofresearchanddevelop-mentcostsandtoolingrights.

Notes to the separate financial statements 2012
166 Annual Report 2012
Information on key management personnel remuneration (CZK million)
2012 2011
Salaries and other short-term employee benefits* 487 355
Other long-term employee benefits 12 14
Total 499 369
* Salaries and other short-term employee benefits include besides wages, salaries, bonuses and non-monetary remuneration also health and social insurance paid by employer for employees.
KeymanagementpersonnelincludemembersoftheBoardofDirectors,SupervisoryBoardandmanagersoftheCompanyhavingauthorityandresponsibilityforplanning,directingandcontrollingtheactivitiesoftheCompany.TheremunerationofthemembersoftheBoardofDirectors,SupervisoryBoardandotherkeymanagementpersonnelincludestheremunerationpaid,payableorprovidedbytheCompanyintheformofwages,sala-ries,bonusesandnon-monetaryremuneration.CZK252millionoutofthetotalamountdisclosedinthelineSalariesandothershort-termemployeeben-efitswasoutstandingasat31December2012(31December2011:CZK130million).
29. Other information (CZK million)ThecompensationpaidtotheCompany’sauditorsfortheaccountingperiodwasCZK31million(2011:CZK29million)andcoveredthefollowingservices:
2012 2011
Audit and other assurance services 15 16
Tax and related services 3 4
Other advisory services 13 9
Total 31 29
30. Significant events after the balance sheet dateAfterthebalancesheetdate,therewerenoeventsthatcouldhaveasignificantimpactontheseparatefinancialstatementsoftheCompanyfortheyearended31December2012.

Notes to the separate financial statements 2012
167Annual Report 2012
31. Information about Volkswagen Group ŠKODA AUTO a.s. is a subsidiary included in the consolidation group of its ultimate parent company, VOLKSWAGENAG,witharegisteredofficeinWolfsburg,theFederalRepublicofGermany.TheVolkswagenGroupconsistsoftwodivisions-AutomotiveandFinancialServices.TheactivitiesrelatedtotheAutomotiveDivisionincludethedevelopmentofcarsandaggregates,productionandsaleofpas-sengerandcommercialcars,trucksandbusesaswellasthebusinesswithspareparts,large-boredieselengines,specialgearunitsandturbomachinery.ThefollowingbrandsbelongtoVolkswagenGroup:Volk-swagenPassengerCars,Audi,ŠKODA,SEAT,Bentley,Porsche,VolkswagenCommercialVehicles,Bugatti,Scania,MANandLamborghini.TheFinancialServicesDivision includesactivities related to thedealer andcustomerfinancing, leasing,bankingandinsuranceservicesandthefleetmanagement.ŠKODAAUTOand its subsidiaries (ŠKODAAUTODeutschlandGmbH, ŠKODAAUTOSlovensko, s.r.o. andSkodaAutoIndiaPrivateLtd.)andassociateOOOVOLKSWAGENGroupRusareincludedintheconsolidationofVolkswagenGroup’sfinancialstatements.Theseconsolidatedfinancialstatements,andotherinforma-tionrelatingtotheVolkswagenGroup,areavailableintheannualreportofVOLKSWAGENAGandonitsinternetsite(www.volkswagenag.com).
MladáBoleslav,14February2013
TheBoardofManagement:
WinfriedVahland
WinfriedKrause BohdanWojnar FrankWelsch
WernerEichhorn KarlheinzEmilHell MichaelOeljeklaus
Personsresponsibleforaccounting:
DanaNěmečková JanaFernándezZambrano

168 Annual Report 2012
Report on relations
Report on relationsReport on relations between VOLKSWAGEN AG and ŠKODA AUTO AUTO a.s. and between ŠKODA AUTO a.s. and other entities controlled by VOLKSWAGEN AG in the accounting period 1 January 2012 - 31 December 2012
ThereportonrelationsbetweenVOLKSWAGENAG,havingitsregisteredofficeinWolfsburg,FederalRe-publicofGermany,(hereinafterreferredtoasthe“ControllingEntity”or“Volkswagen”)andŠKODAAUTOa.s.,havingitsregisteredofficeinMladáBoleslav,Tř.VáclavaKlementa869,Postcode:29360,IDNo.:00177041(hereinafterreferredtoasthe“ControlledEntity”or“theCompany”or“ŠKODAAUTO”),andbetweenŠKODAAUTOandotherentitiescontrolledbyVolkswagenintheaccountingperiod1January2012to31December2012(hereinafterreferredtoasthe“accountingperiod”)waspreparedpursuanttoprovision§66apara-graph9oftheActNo.513/1991Coll.,CommercialCode,asamended.VolkswagenwasthesoleshareholderofŠKODAAUTOwith100%votingrightstill18July2007.AtthedateVolkswagenInternationalFinanceN.V.,havingitsregisteredofficeinAmsterdam,TheKingdomoftheNeth-erlands,becameanewsoleshareholderofŠKODAAUTOduetostructuralchangeswithintheVolkswagenGroup.VolkswagenInternationalFinanceN.V.isindirectlya100%subsidiaryofVolkswagenAG.InaccordancewiththeCommercialCodeandinternalpolicies,theControllingEntityconsidersmoredetailedinformationregardingcontracts,whicharelistedinthesection“Contractsconcluded”ofthisReport,asamatteroftradesecret,whichcannotbepubliclydisclosed.AlltransactionsregardingtheControllingEntityarisingfromthesecontractswerecarriedoutinadequateamountsandreflectedcontractualconditionsinrespectofpriceandqualityofservicesthatwouldbeotherwiseprovidedbythirdpartiesatthesametimeandonthesameorsimilarmarket.Fortheabovestatedreasons,thisreportdoesnotcontainanyinforma-tionaboutprices,quantitiesorvalues.
Contracts concludedŠKODAAUTOandVolkswagen,andŠKODAAUTOandthecompaniescontrolledbyVolkswagenconcludedcontractsinthefollowingareasduringtheaccountingperiod:
1. Sale of own products, goods and services
a) vehiclesŠKODAAUTOdidnotconcludeanynewcontractsregardingsaleofvehiclesintheaccountingperiod.
b) genuine parts ŠKODAAUTOdidnotconcludeanynewcontractsregardingsaleofgenuinepartsintheaccountingperiod.
c) other ŠKODAAUTOenteredintonewcontractsregardingsaleofservices,licenses,aggregates,bodyworksandotherproductswiththefollowingcompanies:
AUDIAGCentroTécnicoDeSEAT,S.A.OOOVOLKSWAGENGroupRusSEAT,S.A.VOLKSWAGENAGVolkswagenArgentinaS.A.VOLKSWAGENGroupItaliaS.p.A.VolkswagenofSouthAfrica(Pty.)Ltd.

169Annual Report 2012
Report on relations
2. Purchase of goods and services
a) production material and goodsŠKODA AUTO concluded new contracts regarding purchases of productionmaterial with the following companies:
GearboxdelPrat,S.A.SITECHSp.zo.o.VOLKSWAGENAGVolkswagenIndiaPrivateLtd.VolkswagenSachsenGmbHVOLKSWAGENSLOVAKIA,a.s.
b) indirect material and servicesŠKODAAUTOenteredintonewcontractsregardingpurchasesofindirectmaterialandservices(purchasesof indirectmaterialandservices,researchanddevelopmentcooperation,ITservices,softwareandhard-waresupplies,customerservicesconsultancy)withthefollowingcompanies:
AUDIAGAudiAkademieGmbHAUDIBRUSSELSS.A.AUDIElektronicsVentureGmbHAUDIHUNGARIAMOTORKft.AudiVertriebsbetreuungsgesellschaftmbHAutomotiveSafetyTechnologiesGmbHAutomobilmanufakturDresdenGmbHAutoVisionGmbHBentleyMotorsLtd.CarmeqGmbHCentroTécnicoDeSEAT,S.A.e4telectronicsfortransportations.r.o.GearboxdelPrat,S.A.GroupeVOLKSWAGENFrances.a.INISInternationalInsuranceServices.r.o.,vezkratceINISs.r.o.ItaldesignGiugiaroS.p.A.OOOVOLKSWAGENGroupRusPorscheAustriaGmbH&Co.OGPorscheConsultingGmbHPorscheČeskárepublikas.r.o.PorscheEngineeringGroupGmbHPorscheInterAutoCZspol.sr.o.PorscheInterAutoHungariaKft.PorscheMakedonijadooelPORSCHEROMANIASRLPorscheSLOVENIJAd.o.o.SEAT,S.A.ScaniaCzechRepublics.r.o.SITECHSitztechnikGmbHSITECHSp.zo.o.SkodaAutoIndiaPrivateLtd.ŠKODAAUTODeutschlandGmbHŠkoFINs.r.o.VOLKSWAGENAGVolkswagen(China)InvestmentCompanyLtd.Volkswagen-AudiEspaňaS.A.VolkswagenAutomaticTransmission(Dalian)Co.Ltd.VolkswagenCoachingGmbH

170 Annual Report 2012
Report on relations
VolkswagenDesignCenterPotsdamGmbHVolkswagendoBrasilIndústriadeVeículosAutomotoresLtda.VOLKSWAGENFINANCIALSERVICESAGVolkswagenGroupAustraliaPtyLtd.VolkswagenGroupIrelandLtd.VOLKSWAGENGroupItaliaS.p.A.VOLKSWAGENGroupJapanK.K.VolkswagenGroupofAmerica,Inc.VolkswagenGroupPolskaSp.zo.o.VolkswagenGroupSverigeABVOLKSWAGENGroupUnitedKingdomLtd.VolkswagenIndiaPrivateLtd.VolkswagenLogisticsGmbH&Co.OHGVolkswagenMotorPolskaSp.zo.o.VolkswagenMotorsportGmbHVolkswagenNavarra,S.A.VolkswagenPoznanSp.zo.o.VolkswagenProcurementServicesGmbHVolkswagenSachsenGmbHVOLKSWAGENSARAJEVO,d.o.oVOLKSWAGENSLOVAKIA,a.s.VolkswagenVersicherungsvermittlungGmbHVolkswagenZubehörGmbH
c) genuine partsŠKODAAUTOenteredintonewcontractsregardingpurchasesofgenuinepartswiththefollowingcompanies:
AUDIHUNGARIAMOTORKft.SITECHSp.zo.o.VOLKSWAGENAGVolkswagenSachsenGmbHVOLKSWAGENSLOVAKIA,a.s.
d) investmentsŠKODAAUTOenteredintonewcontractsregardingpurchasesofinvestmentswiththefollowingcompanies:
e4telectronicsfortransportations.r.o.SEATSportS.A.VOLKSWAGENAGVolkswagenCoachingGmbHVolkswagenProcurementServicesGmbH
3. Other contractual relationships
ŠKODAAUTOalsoestablishednewcontractualrelationships(particularlymarketingservices,training,salessupport,financialservices,systemsupport,consultancy,andproductionofcars)withthefollowingcompanies:
AUDIAGGroupeVOLKSWAGENFrances.a.IntercarAustriaGmbHOOOVOLKSWAGENGroupRusPorscheAlbaniaSh.p.k.PorscheHungariaHandelsKft.PorscheMakedonijadooelPorscheRomanias.r.l,PorscheSLOVENIJAd.o.oSEAT,S.A.SEATSportS.A.

171Annual Report 2012
Report on relations
SkodaAutoIndiaPrivateLtd.SkodaAutoPolskaS.A.ŠKODAAUTODeutschlandGmbHŠKODAAUTOSlovensko,s.r.o.ŠkoFINs.r.o.VOLKSWAGENAGVolkswagenGroupAustraliaPtyLtd.VolkswagenGroupImportCompanyLtd.VolkswagenGroupIrelandLtd.VOLKSWAGENGroupItaliaS.p.A.VolkswagenGroupPolskaSp.zo.o.VolkswagenGroupSverigeABVolkswagen(China)InvestmentCompanyLtd.VOLKSWAGENGroupUnitedKingdomLtd.VolkswagenMotorsportGmbHVolkswagen-AudiEspaňaS.A.VolkswagenofSouthAfrica(Pty.)Ltd.VOLKSWAGENSLOVAKIA,a.s.VolkswagenVersicherungsvermittlungGmbHVolkswagenZubehörGmbH
Transactions relating to contracts concluded in previous yearsBesidescompaniesdisclosedinpoints1,2and3,theControlledEntitycarriedouttransactionswiththefol-lowingcompanies,controlledbythesamecontrollingentity,basedoncontractsconcludedinpreviousyears.
Audi(China)EnterpriseManagementCo.Ltd.AutomobiliLamborghiniS.p.A.AutostadtGmbHBUGATTIAutomobilesS.A.SEuromobilAutovermietungGmbHImportVOLKSWAGENGroups.r.o.MMIMarketingManagementInstitutGmbHPorscheHoldingSalzburgAutomotivePorscheSlovakiaspol.sr.o.PSWautomotiveengineeringGmbHSeatDeutschlandGmbHShanghaiVolkswagenPowertrainCompanyLtd.ŠKO-ENERGOFIN,s.r.o.ŠKO-ENERGO,s.r.o.VolkswagenAutoeuropa,Lda.VolkswagendeMéxicoS.A.deC.V.VolkswagenGroupSalesIndiaP.L.VolkswagenGroupServicesS.A.VolkswagenImmobilienGmbHVolkswagenLeasingGmbHVolkswagenOriginalTeileLogistikGmbH&Co.KGVolkswagenOsnabrückGmbH
Other legal actsOn1January2012,theCompanysoldits51%shareinthesubsidiarySkodaAutoPolskaS.A.toparentVolk-swagenInternationalFinanceN.V.Asaresult,theCompanyhaslosttheentireinterest inthesubsidiarySkodaAutoPolskaS.A.ConsiderationfromthesaleofthesubsidiaryamountsofCZK361,118thousand.IntheaccountingperiodnofurtherlegalactswerereportedwhichwerecarriedoutinfavourofVolkswagenandentitiescontrolledbyVolkswagen,whichwentbeyondthescopeofstandardlegalactscarriedoutbyVolkswagenwhileexercisingitsrightsastheControllingEntityofŠKODAAUTO.ŠKODAAUTOpaidadividendofCZK7,143,970thousandtoVolkswagenInternationalFinanceN.V.,asthe

172 Annual Report 2012
Report on relations
soleshareholder,on5April2012basedontheDecisionofthesoleshareholderVolkswagenInternationalFinanceN.V.from23March2012.In2012,dividendsandshareinprofitofCZK370,875thousandwerepaidouttotheCompanybythesub-sidiaries.In2012,dividendsandshareinprofitofCZK83,803thousandwerepaidouttotheCompanybytheassociates.
Other measures, their advantages and disadvantagesDuringtheaccountingperiod,ŠKODAAUTOdidnotadoptortakeanymeasuresonthebehalfoforattheincentiveofVolkswagen,andotherentitiescontrolledbyVolkswagen,otherthanstepsnormallytakenvis-a-visVolkswagenastheControllingEntityofŠKODAAUTO.
Performance provided and counter-performance acceptedIntheaccountingperiodnootherperformanceandcounter-performanceinfavourorattheinitiativeofVolkswagen,andentitiescontrolledbyVolkswagen,whichexceededthescopeofstandardperformanceandcounter-performancetakenbyŠKODAAUTOregardingVolkswagen,astheControllingEntityofŠKODAAUTO,weretakenorimplementedbyŠKODAAUTO.Totalvaluesoftransactionswithrelatedpartiesamongwhichbelongalsotherelatedentitiesduringtheaccountingperiodaredisclosed inthenotes7,8,9,12,14and28ofthenotestotheseparatefinancialstatements.TheBoardofDirectorsoftheControlledEntitydeclaresthatŠKODAAUTOdidnotsufferfromanydamageordetrimentasaresultoftheconclusionoftheabovementionedcontracts,theotheraforesaidlegalacts,othermeasures,performanceprovidedoracceptedcounter-performance.
InMladáBoleslav,14February2013
MembersofBoardofDirectors:
WinfriedVahland
WinfriedKrause BohdanWojnar FrankWelsch
WernerEichhorn KarlheinzEmilHell MichaelOeljeklaus

173Annual Report 2012
Glossary of terms and abbreviation
BilMoG –Bilanzrechtsmodernisierungsgesetz–GermanAccountingAct
CAS – CzechaccountingstandardsforbusinessesandotheraccountingregulationsvalidintheCzechRe-public,particularlyActNo.563/1991Coll.onAccountingandDecreeNo.500/2002Coll.,implementingse-lectedprovisionsoftheAccountingAct,assubsequentlyamended.
CKD – completelyknockeddown,pressedandweldedpartsofcertainbodysub-assemblies,allpartsforassemblyincludingengine,gearbox,chassisandfluids
Company – intheAnnualReport,theterm“theCompany”isusedasasynonymforthecompanyŠKODAAUTO
Consolidated group –inadditiontoŠKODAAUTOa.s.withregisteredofficeinMladáBoleslav,alsoincludesallsignificantsubsidiariesandassociates
Deliveries to customers – numberofŠKODA-brandvehiclesdeliveredtoendcustomersthatwerepro-ducedinŠKODAAUTOGroupand/orpartnerplants
EGAP – ExportGuaranteeandInsuranceCorporation
Gross liquidity – liquidfunds,i.e.cash,short-termdepositsandshort-termlendings
Group – intheAnnualReport,theterms“theGroup”and“theŠKODAAUTOGroup”areusedassynonymsfortheŠKODAAUTOConsolidatedGroup
IAS / IFRS – InternationalAccountingStandards/InternationalFinancialReportingStandardsasadoptedbytheEuropeanUnion
Investment ratio – ratio of capital expenditures (less capitalised development expenses) to total sales revenues
KonTraG –GesetzzurKontrolleundTransparenzimUnternehmensbereich–GermanInformationDisclosureandTransparencyAct
MPV –multi-purposevehicleinthemid-rangecategoryofcars
Net liquidity – gross liquidity less financial obligations and liabilities to a factoring companywithin theVolkswagenGroup
Platform MQB –ModularerOuerbaukasten–modularplatform
Glossary of terms and abbreviation

174 Annual Report 2012
Glossary of terms and abbreviation
Production –numberofvehiclesproduced.ThetotalproductionfigurealsoincludesproductionofvehiclesforotherVolkswagenGroupbrands(Volkswagen,AudiandSEAT).Foraccuracy,vehicleassemblykitsarereportedinthevehiclessegment
Sales –numberofvehiclessoldtoimportersanddealers.Theunitsalesfigurealsoincludessalesofvehi-clesmanufacturedbyotherVolkswagenGroupbrands(SEATvehiclessoldbyŠAS;VWandAUDIvehiclessoldbySAIPL).Foraccuracy,vehicleassemblykitsarereportedinthevehiclessegment
SAIPL –SkodaAutoIndiaPrivateLtd.,asubsidiaryŠKODAAUTOa.s.
SKD –semi-knockeddown,fullyequippedcarbody,powertrain,chassis,exhaustmanifold,smallpartsforassemblyandoperatingfluids
SUV –Sportutilityvehicleinthemid-rangecategoryofcars
Temporary workers –employeesofalabouragencywhoaretemporarilysecondedtoworkforadifferentemployer

175Annual Report 2012
List of non-consolidated capital holdings of ŠKoDA auto
List of non-consolidated capital holdings of ŠKODA AUTO
ŠKODA AUTO a.s.
ŠKO-ENERGO, s.r.o e4t electronics for transportation s.r.o
Mladá Boleslav, Czech RepublicŠKODA AUTO stake: 44.5%
Principal business:generation and distribution of heat,electricity generation and trading,gas distribution, production of drinking and service water,water mains and sewer systems operation.
Prague, Czech RepublicŠKODA AUTO stake: 49.0%
Principal business:Research and development in the field of natural,technical and social sciences, training and consulting services.

176 Annual Report 2012
Persons responsible for the annual report and post-balance sheet events
Persons responsible for the annual report and post-balance sheet eventsEvents after the Balance Sheet DateNomaterialeventshaveoccurredbetweenthebalancesheetdateandthedateofpreparationofthisAn-nualReportthathavehadanimpactonanassessmentoftheCompany’sorGroup’sassets,liabilitiesandequityortheresultsofitsoperations.
AffirmationThepersonsstatedbelow,responsibleforthepreparationofthisAnnualReport,herebydeclarethattheinformationcontainedinthisAnnualReportisfactualandthatnosubstantivemattersthatcouldinfluenceanaccurateandcorrectevaluationofthesecuritiesissuerhavebeenknowinglyomittedordistorted.
MladáBoleslav,on7March2013
TheBoardofManagement:
WinfriedVahland
WinfriedKrause BohdanWojnar FrankWelsch
WernerEichhorn KarlheinzEmilHell MichaelOeljeklaus Personsresponsibleforaccounting:
DanaNěmečková JanaFernándezZambrano

177Annual Report 2012
Key figures and financial results at a glance
Key figures and financial results at a glance*ŠKODA AUTO key figures and financial results according to CAS
Production, sales and technical data
1999 2000 2001 2002 2003 2004
Deliveries to customers vehicles 385,330 435,403 460,252 445,525 449,758 451,675
Sales vehicles 376,329 448,394 460,670 440,572 438,843 441,820
Production vehicles 371,169 450,910 460,886 442,469 437,554 444,121
Employees persons 22,030 25,833 24,129 23,470 22,798 24,561
Profit and loss account
1999 2000 2001 2002 2003 2004
Sales revenue CZK millions 110,409 136,283 153,271 145,694 145,197 153,550
of which:
Domestic % 19 18 18 18 17 15
Export % 81 82 82 82 83 85
Raw materials and consumables CZK millions 80,426 105,996 116,350 109,868 108,283 115,382
% of revenues 72.8 77.8 75.9 75.4 74.6 75.1
Value added CZK millions 18,513 18,977 22,296 22,056 23,343 24,884
% of revenues 16.8 13.9 14.6 15.1 16.0 16.2
Staff costs CZK millions 6,629 7,465 7,583 7,834 8,060 8,500
Depreciation CZK millions 6,516 7,768 9,646 10,826 10,296 10,606
Operating profit CZK millions 5,237 5,204 4,643 3,677 5,209 5,856
% of revenues 4.7 3.8 3.0 2.5 3.6 3.9
Financial result CZK millions (1,422) (1,029) (1,969) (1,188) (2,692) (1,041)
Profit before income tax CZK millions 3,814 4,175 2,674 2,489 2,517 4,815
Profit before income tax-to-revenues ratio % 3.5 3.1 1.7 1.7 1.7 3.2
Tax on profit or loss CZK millions 1,177 839 545 664 1,039 1,318
Profit for the year CZK millions 2,637 3,336 2,129 1,825 1,478 3,497
Profit for the year-to-revenues ratio % 2.4 2.4 1.4 1.3 1.0 2.3
* The financial results reported according to CAS are not comparable with the financial results reported according to IFRS.

178 Annual Report 2012
Key figures and financial results at a glance
Balance sheet / financing
1999 2000 2001 2002 2003 2004
Fixed assets CZK millions 33,687 39,175 45,008 44,873 44,074 41,143
Current assets and other assets CZK millions 21,923 27,486 21,603 21,945 22,077 30,694
of which:
Loans to and deposits CZK millions – – – – – 8,600
Equity CZK millions 22,700 26,032 28,157 29,817 31,758 32,844
Liabilities and other liabilities CZK millions 32,910 40,629 38,454 37,001 34,393 38,993
of which:
Bonds CZK millions – 10,000 10,000 10,000 10,000 10,000
Provisions under special regulations CZK millions 4,949 4,284 3,939 4,398 5,108 6,522
Bank loans CZK millions 3,000 4,850 2,000 5,000 – –
Assets CZK millions 55,610 66,661 66,611 66,818 66,151 71,837
Net liquidity CZK millions (1,339) (4,007) (798) (4,660) 2,495 4,534
Investments CZK millions 11,313 13,873 16,235 11,586 10,248 8,430
Investment ratio % 10.2 10.2 10.6 8.0 7.1 5.5
Equity ratio % 40.8 39.1 42.3 44.6 48.0 45.7
Equity-to-fixed assets ratio % 67.4 66.5 62.6 66.4 72.1 79.8

179Annual Report 2012
Key figures and financial results according to IFRS
Production, sales and technical data
ŠKODA AUTO Group ŠKODA AUTO Company
2005 2006 2007 2008 2005 2006 2007 2008
Deliveries to customers vehicles 492,111 549,667 630,032 674,530 492,111 549,667 630,032 674,530
Sales vehicles 498,467 562,251 619,635 625,819 493,119 555,202 623,085 622,090
Sales of ŠKODA cars 496,387 559,821 617,269 621,683 493,119 555,202 623,085 622,083
Production vehicles 494,127 556,347 623,291 606,614 494,637 556,433 623,529 603,247
Production of ŠKODA cars 494,127 556,347 622,811 603,981 494,637 556,433 623,529 603,247
Employees* persons 26,742 27,680 29,141 26,695 26,014 26,738 27,753 25,331
ŠKODA AUTO Group ŠKODA AUTO Company
2009 2010 2011 2012 2009 2010 2011 2012
Deliveries to customers vehicles 684,226 762,600 879,184 939,202 684,226 762,600 879,184 939,202
Sales vehicles 551,604 584,763 690,350 726,576 539,382 583,780 676,787 691,853
Sales of ŠKODA cars 545,690 576,270 679,112 708,956 539,380 583,780 676,785 686,948
Production vehicles 522,542 583,333 681,880 669,341 519,910 576,362 673,127 656,306
Production of ŠKODA cars 519,645 575,742 674,010 651,750 519,910 576,362 673,127 651,306
Employees* persons 26,153 24,714 26,565 26,404 24,817 23,308 24,936 24,788
* In 2010 the method of reporting the employee’s headcount was altered. The number of employees is reported excluding temporary employees and including appren-tices and represents actual number of employees as at 31 December.
Key figures and financial results at a glance

180 Annual Report 2012
Profit and loss account
ŠKODA AUTO Group ŠKODA AUTO Company
2005 2006 2007 2008 2005 2006 2007 2008
Sales revenue CZK millions 187,382 203,659 221,967 200,182 177,822 189,816 211,026 188,572
of which:
Domestic % 13.3 12.6 11.8 11.9 14.0 13.5 12.4 12.7
Export % 86.7 87.4 88.2 88.1 86.0 86.5 87.6 87.3
Cost of sales CZK millions 163,738 175,636 185,474 171,523 159,187 167,709 180,865 165,600
% of revenues 87.4 86.2 83.6 85.7 89.5 88.4 85.7 87.8
Gross profit CZK millions 23,644 28,023 36,493 28,659 18,635 22,107 30,161 22,972
% of revenues 12.6 13.8 16.4 14.3 10.5 11.6 14.3 12.2
Distribution expenses CZK millions 10,611 11,903 13,201 12,804 6,558 6,905 7,964 7,590
Administrative expenses CZK millions 3,676 3,587 4,207 4,712 3,329 3,161 3,701 4,223
Balance of other operating revenues/costs
CZK millions 1,503 2,069 699 2,477 1,256 1,735 525 1,477
Operating profit CZK millions 10,860 14,602 19,784 13,620 10,004 13,776 19,021 12,636
% of revenues 5.8 7.2 8.9 6.8 5.6 7.3 9.0 6.7
Financial result CZK millions (787) (404) 171 262 (564) (216) 425 651
Profit before income tax CZK millions 10,073 14,198 19,860 13,376 9,440 13,560 19,446 13,287
Profit before income tax-to-revenues ratio % 5.4 7.0 8.9 6.7 5.3 7.1 9.2 7.0
Income tax expense CZK millions 2,180 3,136 3,878 2,558 2,077 2,678 3,554 2,020
Profit for the year* CZK millions 7,893 11,062 15,982 10,818 7,363 10,882 15,892 11,267
Profit for the year-to-sales ratio % 4.2 5.4 7.2 5.4 4.1 5.7 7.5 6.0
* Consolidated figures are given net of non-controlling interests.
Key figures and financial results at a glance

181Annual Report 2012
Profit and loss account
ŠKODA AUTO Group ŠKODA AUTO Company
2009 2010 2011 2012 2009 2010 2011 2012
Sales revenue CZK millions 187,858 219,454 252,562 262,649 170,666 203,695 231,742 239,101
of which:
Domestic % 11.5 10.0 8.7 8.3 12.5 10.7 9.5 9.2
Export % 88.5 90.0 91.3 91.7 87.5 89.3 90.5 90.8
Cost of sales CZK millions 166,296 190,234 215,956 221,751 155,868 180,343 201,765 203,216
% of revenues 88.5 86.7 85.5 84.4 91.3 88.5 87.1 85.0
Gross profit CZK millions 21,562 29,220 36,606 40,898 14,798 23,352 29,977 35,885
% of revenues 11.5 13.3 14.5 15.6 8.7 11.5 12.9 15.0
Distribution expenses CZK millions 13,153 14,509 17,549 19,179 7,702 9,449 11,613 13,724
Administrative expenses CZK millions 4,826 5,256 6,123 6,855 4,320 4,666 5,504 6,155
Balance of other operating revenues/costs
CZK millions 2,341 1,861 5,323 3,053 1,948 1,798 4,364 998
Operating profit CZK millions 5,924 11,316 18,257 17,917 4,724 11,035 17,224 17,004
% of revenues 3.2 5.2 7.2 6.8 2.8 5.4 7.4 7.1
Financial result CZK millions (667) (382) 791 (1,255) (343) 180 (69) (1,292)
Profit before income tax CZK millions 4,702 10,586 19,275 17,934 4,381 11,215 17,155 15,712
Profit before income tax-to-revenues ratio % 2.5 4.8 7.6 6.8 2.6 5.5 7.4 6.6
Income tax expense CZK millions 1,240 1,747 3,200 2,580 942 1,811 2,867 2,453
Profit for the year* CZK millions 3,462 8,839 16,075 15,354 3,439 9,404 14,288 13,259
Profit for the year-to-sales ratio % 1.8 4.0 6.4 5.8 2.0 4.6 6.2 5.5
* Consolidated figures are given net of non-controlling interests.
Key figures and financial results at a glance

182 Annual Report 2012
Balance sheet / financing ŠKODA AUTO Group ŠKODA AUTO Company
2009 2010 2011 2012 2009 2010 2011 2012
Non-current assets CZK millions 59,083 58,864 64,686 83,493 59,926 59,989 64,441 81,586
Current assets CZK millions 59,293 76,872 88,871 76,493 48,099 62,278 71,130 59,656
of which:
Loans and deposits CZK millions 13,562 35,678 49,088 38,131 13,562 34,378 44,848 36,534
Equity* CZK millions 68,180 74,772 81,211 90,906 68,519 75,682 80,407 88,302
Non-current and current liabilities CZK millions 50,196 60,964 72,346 69,080 39,506 46,585 55,164 52,940
of which:
Nominal value of bonds CZK millions 2,000 – – – 2,000 – – –
Assets CZK millions 118,376 135,736 153,557 159,986 108,025 122,267 135,571 141,242
Net liquidity CZK millions 28,013 40,211 47,348 34,890 23,350 35,047 41,399 30,872
Cash flows from operating activities CZK millions 26,529 28,168 28,251 23,443 22,321 26,256 27,267 23,819
Cash flows from investing activities CZK millions (10,942) (23,313) (28,225) (7,032) (11,454) (22,590) (27,716) (6,042)
Investment ratio % 5.4 4.6 5.6 8.0 6.0 4.9 6.0 8.6
Equity ratio % 57.6 55.1 52.9 56.8 63.4 61.9 59.3 62.5
Equity-to-fixed assets ratio % 115.4 127.0 125.5 108.9 114.3 126.2 124.8 108.2
* Consolidated figures are given net of non-controlling interests.
Key figures and financial results at a glance
Balance sheet / financing ŠKODA AUTO Group ŠKODA AUTO Company
2005 2006 2007 2008 2005 2006 2007 2008
Non-current assets CZK millions 55,424 54,292 56,767 60,017 55,023 53,936 56,903 60,119
Current assets CZK millions 34,331 50,920 59,014 62,439 28,956 43,499 48,658 51,276
of which:
Loans and deposits CZK millions 11,200 23,950 25,554 25,721 11,200 23,950 25,554 25,238
Equity* CZK millions 46,757 58,321 67,034 71,608 46,483 58,007 66,532 71,721
Non-current and current liabilities CZK millions 42,998 46,891 48,747 50,848 37,496 39,428 39,029 39,674
of which:
Nominal value of bonds CZK millions 5,000 5,000 2,000 2,000 5,000 5,000 2,000 2,000
Assets CZK millions 89,755 105,212 115,781 122,456 83,979 97,435 105,561 111,395
Net liquidity CZK millions 4,911 21,157 29,736 18,272 6,070 19,352 26,283 18,676
Cash flows from operating activities CZK millions 23,550 27,420 30,787 13,014 21,421 24,203 29,275 13,978
Cash flows from investing activities CZK millions (11,566) (11,090) (13,785) (16,147) (11,299) (10,910) (13,913) (14,445)
Investment ratio % 4.7 4.1 4.9 5.6 4.8 4.3 4.9 5.4
Equity ratio % 52.1 55.4 57.9 58.5 55.4 59.5 63.0 64.4
Equity-to-fixed assets ratio % 84.4 107.4 118.1 119.3 84.5 107.5 116.9 119.3
* Consolidated figures are given net of non-controlling interests.


Publishedby:© ŠKODA AUTO a.s., 2013Tř.VáclavaKlementa869293 60 Mladá BoleslavCzech RepublicID No.: 00177041
Recorded in the CommercialRegister maintainedby the Prague Municipal Court,Part B, Entry No. 332Tel.: +420 326 811 111Fax: +420 326 721 328
The Annual Report 2012 is also available on the Company’s website:www.skoda-auto.czwww.skoda-auto.com
2012 Annual Report closing date: 7 March 2013Annual Report prepared in-house using FIRE.sys
Consulting and print production:© Carlsberg & Richter – Communications Consulting, Munich, 2013