2012 annual report & 10k
TRANSCRIPT

A N N UA L R E P O RT & 1 0 K 2012
BU
SI
NE
SS
B
AN
KI
NG
PMBPACIFIC MERCANTILE BANK

3257 East Guasti Rd. Suite 110
Ontario, CA 91761
909-937-7260
9720 Wilshire Blvd. Suite 100
Beverly Hills, CA 90212
310-860-3000
1530 W. Whittier Blvd. Suite B
La Habra, CA 90631
562-690-7100
31601 Avenida Los Cerritos Suite 100
S. J. Capistrano, CA 92675
949-487-4200
949 South Coast Dr. Third Floor
Costa Mesa, CA 92626
714-438-2500
CORPORATE HEADQUARTERS
450 Newport Center Dr. Suite 100
Newport Beach, CA 92660
949-467-2200
4225 Executive Square Suite 150
La Jolla, CA 92037
858-320-8400
949 South Coast Dr. Suite 105
Costa Mesa, CA 92626
714-438-2600
LOS ANGELES COUNTY INLAND EMPIRE
ORANGE COUNTY
SAN DIEGO COUNTY
INVESTING IN BUSINESS
WWW.PMBANK.COM877-450-BANK (877-450-2265)
NASDAQ – PMBC
PMBPACIFIC MERCANTILE BANK

Message from the Chairman of the Board:
The leadership team at Pacific Mercantile Bancorp and its wholly-owned subsidiary Pacific Mercantile Bank has changed significantly during the last year. The Board of Directors has expanded to include leading executives from the Orange County and Los Angeles County communities. Shortly after the 2012 Shareholder Meeting I was pleased to be appointed to the Board of Directors, along with Michael Hoopis of Targus Group International and John Flemming of my firm, Carpenter Bank Partners. Later in 2012 we were pleased to welcome John Clark CPA., of Westar Capital LLC., a Costa Mesa-based investor and owner of companies in the manufacturing and service sectors, and in early 2013, Stephen Yost, the former chief credit officer of Imperial Bank in Los Angeles and Regional Chief Credit Officer for Comerica Bank for Southern California and Arizona joined the Board.
Most recently, Pacific Mercantile Bancorp and its subsidiary Pacific Mercantile Bank, announced that Steven K. Buster will join the Company and the Bank in April as their new President and CEO. Mr. Buster returns home to Orange County following his successful 8-year tenure as President and CEO of Mechanics Bank in Richmond, California. His assignment follows the recent retirement of Ray Dellerba, the founder and 15-year CEO of the Bank. Mr. Dellerba will remain with the Company and Bank, serving as Vice Chairman and Founder.
The last year has also seen significant change in the management team of Pacific Mercantile Bank. We added key California bankers to our team including: President of the Commercial Banking Division, Division Head of Mortgage, regional business banking leadership for our Southern Division, and highly accomplished leaders in cash management, SBA lending, and commercial banking.
At Pacific Mercantile Bank, we are continuing to develop and enhance products and services in support of our primary focus of banking local businesses. Our service area includes California’s 5-Southern counties: Los Angeles; Orange; Riverside; San Bernardino and San Diego. Our four financial centers in Orange County hold the largest deposit market-share of any locally-headquartered bank. Our financial centers in Beverly Hills, Ontario and La Jolla well-serve the adjacent four counties. With the return of economic growth in 2012, the output of business-related activities in these five counties grew to $983 Billion in GDP, ranking our 5-county region as the 15th largest economy in the world.
On behalf of the Board of Directors, officers and associates of Pacific Mercantile Bank, we look forward to 2013 as a year of continuing to build value for shareholders by offering our clients personalized attention and innovative services.
Sincerely,
Edward J. Carpenter Chairman of the Board Pacific Mercantile Bancorp

[THIS PAGE INTENTIONALLY LEFT BLANK]

UNITED STATES SECURITIES AND EXCHANGE COMMISSION
WASHINGTON, D.C. 20549
FORM 10-K
(Mark One) ANNUAL REPORT PURSUANT TO SECTION 13 OR 15(d) OF THE SECURITIES EXCHANGE
ACT OF 1934 For the fiscal year ended December 31, 2012
OR TRANSITION REPORT PURSUANT TO SECTION 13 OR 15(d) OF THE SECURITIES
EXCHANGE ACT OF 1934 For the transition period from to
Commission file number 0-30777
PACIFIC MERCANTILE BANCORP (Exact name of Registrant as specified in its charter)
California 33-0898238 (State or other jurisdiction of
incorporation or organization) (I.R.S. Employer
Identification No.)
949 South Coast Drive, Suite 300, Costa Mesa, California 92626 (Address of principal executive offices) (Zip Code)
(714) 438-2500 (Registrant’s telephone number, including area code)
Securities registered pursuant to Section 12(b) of the Act:
Title of each class registered
Name of each Exchange on which registered
Common Stock without par value NASDAQ Global Select Market Securities registered pursuant to Section 12(g) of the Act: None
Indicate by check mark if the registrant is a well-known seasoned issuer, as defined in Rule 405 of the Securities Act. Yes No . Indicate by check mark if the registrant is not required to file reports pursuant to Section 13 of 15(d) of the Act. Yes No . Indicate by check mark whether the registrant (1) has filed all reports required to be filed by Section 13 or 15(d) of the Securities Exchange
Act of 1934 during the preceding 12 months (or for such shorter period that the registrant was required to file such reports); and (2) has been subject to such filing requirements for the past 90 days. Yes No
Indicate by check mark whether the registrant has submitted electronically and posted on its corporate Web site, if any, every Interactive Data File required to be submitted and posted pursuant to Rule 405 of Regulation S-T (§232.405 of this chapter) during the preceding 12 months (or for such shorter period that the registrant was required to submit and post such files). Yes No .
Indicate by check mark if disclosure of delinquent filers pursuant to Item 405 of Regulation S-K is not contained herein, and will not be contained, to the best of registrant’s knowledge, in definitive proxy or information statements incorporated by reference in Part III of this Form 10-K or any amendment to this Form 10-K.
Indicate by check mark whether the registrant is a large accelerated filer, an accelerated filer, a non-accelerated filer or a smaller reporting company. See definitions of “large accelerated filer,” “accelerated filer,” “non-accelerated filer,” and “smaller reporting company” in Rule 12b-2 of the Exchange Act. (Check one):
Large accelerated filer Accelerated filer
Non-accelerated filer Smaller reporting company Indicate by check mark whether the registrant is a shell company (as defined in Securities Exchange Act Rule 12b-2). Yes No The aggregate market value of voting shares held by non-affiliates of registrant as of June 30, 2012, which was determined on the basis of the
closing price of registrant’s shares of common stock on that date, was approximately $73,700,000. As of February 28, 2013, there were 16,677,419 shares of Common Stock outstanding.
DOCUMENTS INCORPORATED BY REFERENCE Except as otherwise stated therein, Part III of the Form 10-K is incorporated by reference from the Registrant’s Definitive Proxy Statement
which is expected to be filed with the Commission on or before April 30, 2013 for its 2013 Annual Meeting of Shareholders.

i
PACIFIC MERCANTILE BANCORP ANNUAL REPORT ON FORM 10K
FOR THE YEAR ENDED DECEMBER 31, 2012 TABLE OF CONTENTS
Page No.
FORWARD LOOKING STATEMENTS
PART I
Item 1 Business ....................................................................................................................................... 1
Item 1A Risk Factors ................................................................................................................................. 21
Item 1B Unresolved Staff Comments ........................................................................................................ 31
Item 2 Properties ..................................................................................................................................... 31
Item 3 Legal Proceedings ........................................................................................................................ 31
Item 4 Executive Officers of the Registrant ............................................................................................ 31
PART II
Item 5 Market for Registrant’s Common Equity, Related Stockholder Matters and Issuer Repurchases of Equity Securities ............................................................................................ 33
Item 6 Selected Consolidated Financial Data .......................................................................................... 36
Item 7 Management’s Discussion and Analysis of Financial Condition and Results of Operations ....... 37
Item 8 Financial Statements .................................................................................................................... 66
Report of Independent Registered Public Accounting Firm ............................................... 67
Consolidated Statements of Financial Condition December 31, 2012 and 2011 ................ 68
Consolidated Statements of Operations for the years ended December 31, 2012, 2011, and 2010 ........................................................................................................................ 69
Consolidated Statement of Comprehensive Income(Loss) for the years ended December 31, 2012 and 2011 .......................................................................................................... 70
Consolidated Statement of Shareholders’ Equity and Comprehensive Income (Loss) for the three years ended December 31, 2012 ..................................................................... 71
Consolidated Statements of Cash Flows for the years ended December 31, 2012, 2011 and 2010 ........................................................................................................................ 72
Notes to Consolidated Financial Statements ...................................................................... 74
Item 9 Changes in and Disagreements with Accountants on Accounting and Financial Disclosures ..... 119
Item 9A(T) Controls and Procedures .............................................................................................................. 119
Management’s Report of Internal Control Over Financial Reporting .......................................... 119
Item 9B Other Information ....................................................................................................................... 120

ii
PART III
Item 10 Directors, Executive Officers and Corporate Governance ........................................................... 121
Item 11 Executive Compensation .............................................................................................................. 121
Item 12 Security Ownership of Certain Beneficial Owners and Management and Related Stockholder Matters ................................................................................................................ 121
Item 13 Certain Relationships and Related Transactions, and Director Independence ............................. 121
Item 14 Principal Accountant Fees and Services ...................................................................................... 121
PART IV
Item 15 Exhibits and Financial Statement Schedules ............................................................................... 121
Signatures ................................................................................................................................................................... S-1
Exhibit Index .............................................................................................................................................................. E-1
Exhibit 31.1 Certifications of Chief Executive Officer under Section 302 of the Sarbanes-Oxley Act of 2002
Exhibit 31.2 Certifications of Chief Financial Officer under Section 302 of the Sarbanes-Oxley Act of 2002
Exhibit 32.1 Certification of Chief Executive Officer under Section 906 of the Sarbanes-Oxley Act of 2002
Exhibit 32.1 Certification of Chief Financial Officer under Section 906 of the Sarbanes-Oxley Act of 2002

1
FORWARD LOOKING STATEMENTS
Statements contained in this Report that are not historical facts or that discuss our expectations, beliefs or views regarding our future operations or future financial performance, or financial or other trends in our business or markets, constitute “forward-looking statements” within the meaning of Section 27A of the Securities Act of 1933, as amended, and Section 21E of the Securities Exchange Act of 1934, as amended. Forward-looking statements can be identified by the fact that they do not relate strictly to historical or current facts. Often, they include the words “believe,” “expect,” “anticipate,” “intend,” “plan,” “estimate,” “project,” or words of similar meaning, or future or conditional verbs such as “will,” “would,” “should,” “could,” or “may.” The information contained in such forward-looking statements is based on current information and assumptions about future events over which we do not have control and our business is subject to a number of risks and uncertainties that could cause our financial condition or actual operating results in the future to differ significantly from our expected financial condition or operating results that are set forth in those forward-looking statements. See Item 1A “Risk Factors” in this Report.
Due to these risks and uncertainties, readers are cautioned not to place undue reliance on forward-looking statements contained in this Report, which speak only as of the date of this Annual Report. We undertake no obligation to update or revise any forward-looking statements, whether as a result of new information, future events or otherwise, except as may otherwise be required by applicable law or NASDAQ rules.
PART I
ITEM 1. BUSINESS
Background Pacific Mercantile Bancorp is a California corporation that owns 100% of the stock of Pacific Mercantile Bank, a
California state chartered commercial bank (which, for convenience, will sometimes be referred to in this report as the “Bank”). The capital stock of the Bank is our principal asset and substantially all of our business operations are conducted by the Bank which, as a result, accounts for substantially all of our revenues, expenses and income. As the owner of a commercial bank, Pacific Mercantile Bancorp is registered as a bank holding company under the Bank Holding Company Act of 1956, as amended (the “Bank Holding Company Act”) and, as such, our operations are regulated by the Board of Governors of the Federal Reserve System (the “Federal Reserve Board”). See “Supervision and Regulation” below in this Report. For ease of reference, we will sometimes use the terms “Company,” “we” or “us” in this Report to refer to Pacific Mercantile Bancorp on a consolidated basis and “PM Bancorp” or the “Bancorp” to refer to Pacific Mercantile Bancorp on a “stand-alone” or unconsolidated basis.
The Bank, which is headquartered in Orange County, California, approximately 40 miles south of Los Angeles, conducts a commercial banking business in Orange, Los Angeles, San Bernardino and San Diego counties in Southern California. The Bank is also a member of the Federal Reserve System and its deposits are insured, to the maximum extent permitted by law, by the Federal Deposit Insurance Corporation (commonly known as the “FDIC”).
At December 31, 2012, our total assets, net loans (which exclude loans held for sale) and total deposits were $1.054 billion, $719 million and $845 million, respectively. Additionally, as of that date a total of approximately 7,700 deposit accounts were being maintained at the Bank by our customers, of which approximately 38% were business customers. Currently we operate seven full service commercial banking offices (which we refer to as “financial centers”) and an online banking branch at www.pmbank.com. Due to the Bank’s online presence, the Bank has customers who are located in 49 states and the District of Columbia, although the vast majority of our customers reside or are located in Southern California.
The Bank commenced business in March 1999, with the opening of its first financial center, located in Newport Beach, California, and in April 1999 it launched its online banking site, at www.pmbank.com, where our customers are able to conduct many of their business and personal banking transactions, more conveniently and less expensively, with us, 24 hours a day, 7 days a week. Between August 1999 and July 2005, we opened six additional financial centers as part of an expansion of our banking franchise into Los Angeles, San Diego and San Bernardino counties in Southern California. Set forth below is information regarding our current financial centers.

2
Banking and Financial Center
County Date Opened for Business
Newport Beach, California ................................ Orange March 1999 San Juan Capistrano, California ......................... Orange August 1999 Costa Mesa, California ....................................... Orange June 2001 Beverly Hills, California .................................... Los Angeles July 2001 La Jolla, California............................................. San Diego June 2002 La Habra, California .......................................... Orange September 2003 Ontario, California ............................................. San Bernardino July 2005
According to data published by the FDIC, at December 31, 2012 there were approximately 119 commercial banks operating with banking offices located in the counties of Los Angeles, Orange, San Diego, Riverside and San Bernardino in Southern California. Of those commercial banks, 14 had assets in excess of $2 billion; 79 had assets under $500 million (which are often referred to as “community banks”); 14 had assets between $500 million and $1 billion, and 10, including our Bank, had assets ranging between $1 billion and $2 billion. As a result, we believe that we are well-positioned to achieve further growth in Southern California.
Our Business Strategy Our growth and expansion are the result of our adherence to a business plan which was created by our founders, who
include both experienced banking professionals and individuals who came out of the computer industry. That business plan is to build and grow a banking organization that offers its customers the best attributes of a community bank, which are personalized and responsive service, while taking advantage of advances in computer technology to reduce costs and at the same time extend the geographic coverage of our banking franchise, initially within Southern California, by opening additional financial centers and benefiting from opportunities that may arise in the future to acquire other banks.
In furtherance of that strategy: • We offer at our financial centers and at our interactive online banking website, a broad selection of financial
products and services that address, in particular, the banking needs of business customers and professional firms, including services that are typically available only from larger banks in our market areas.
• We provide a level of convenience and access to banking services that we believe are not typically available from the community banks with which we compete, made possible by the combination of our full service financial centers and the online banking capabilities coupled with personal services we offer our customers.
• We have built a technology and systems infrastructure that we believe will support the growth and further expansion of our banking franchise in Southern California.
• We continue to review and analyze additional opportunities to further enhance our profitability such as a return in 2010 to business of originating single family mortgage loans that qualify for resale into the secondary mortgage market.
We plan to continue to focus our services and offer products primarily to small to mid-size businesses in order to achieve internal growth of our banking franchise. We believe this focus will enable us to grow our loans and other earning assets and increase our core deposits (consisting of non-interest bearing demand, and lower cost savings and money market deposits), with the goal of increasing our net interest margins and improving our profitability. We also believe that, with our technology systems in place, we have the capability to significantly increase the volume of banking transactions without having to incur the cost or disruption of a major computer enhancement program.
Our Commercial Banking Operations We seek to meet the banking needs of small and moderate size businesses, professional firms and individuals by
providing our customers with: • A broad range of loan and deposit products and banking and financial services, more typically offered by larger
banks, in order to gain a competitive advantage over independent or community banks that do not provide the same range or breadth of services that we are able to provide to our customers;
• A high level of personal service and responsiveness, more typical of independent and community banks, which we believe gives us a competitive advantage over large out-of-state and other large multi-regional banks that are unable, or unwilling, due to the expense involved, to provide that same level of personal service to this segment of the banking market; and

3
• The added flexibility, convenience and efficiency of conducting banking transactions with us over the Internet, which we believe further differentiates us from many of the community banks with which we compete and enables us to reduce the costs of providing services to our customers.
Deposit Products Deposits are a bank’s principal source of funds for making loans and acquiring other interest earning assets.
Additionally, the interest expense that a bank must incur to attract and maintain deposits has a significant impact on its operating results. A bank’s interest expense, in turn, will be determined in large measure by the types of deposits that it offers to and is able to attract from its customers. Generally, banks seek to attract “core deposits” which consist of demand deposits that bear no interest and low cost interest-bearing checking, savings and money market deposits. By comparison, time deposits (also sometimes referred to as “certificates of deposit”), including those in denominations of $100,000 or more, usually bear much higher interest rates and are more interest-rate sensitive and volatile than core deposits. A bank that is not able to attract significant amounts of core deposits must rely on more expensive time deposits or alternative sources of cash, such as Federal Home Loan Bank borrowings, to fund interest-earning assets, which means that its costs of funds are likely to be higher and, as a result, its net interest margin is likely to be lower than a bank with higher proportion of core deposits. See “MANAGEMENT’S DISCUSSION AND ANALYSIS OF FINANCIAL CONDITIONS AND RESULTS OF OPERATIONS — Results of Operations-Net Interest Income” in Item 7 of this report.
The following table sets forth information regarding the composition, by type of deposits, maintained by our customers during the year ended and as of December 31, 2012:
Year-to-Date Average Balance
December 31, 2012
Balance at December 31,
2011
(Dollars in thousands) Type of Deposit
Noninterest-bearing checking accounts .............. $ 172,442 $ 170,259 Interest-bearing checking accounts(1) .................. 27,381 27,813 Money market and savings deposits(1) ................ 177,256 166,402 Certificates of deposit(2) ...................................... 492,765 480,921
Totals ........................................................ $ 869,844 $ 845,395
(1) Includes savings accounts and money market accounts. Excludes money market deposits maintained at the Bank by PM Bancorp with an annual average balance of $11.4 million for the year ended and a balance of $12.3 million at December 31, 2012.
(2) Comprised of time certificates of deposit in varying denominations under and over $100,000. Excludes certificates of deposit maintained by PM Bancorp at the Bank with an average balance of $250,000 for the year ended and a balance at December 31, 2012 of $250,000.
Loan Products We offer our customers a number of different loan products, including commercial loans and credit lines, accounts
receivable and inventory financing, SBA guaranteed business loans, commercial real estate, residential mortgage loans, and consumer loans. The following table sets forth the types and the amounts of our loans that were outstanding:
At December 31, 2012
Amount Percent of Total
(Dollars in thousands) Commercial loans ................................................................ $ 170,792 23.4%Commercial real estate loans – owner occupied .................. 165,922 22.7%Commercial real estate loans – all other .............................. 150,189 20.6%Residential mortgage loans – multi-family .......................... 105,119 14.4%Residential mortgage loans – single family ......................... 87,263 11.9%Land development loans ...................................................... 24,018 3.3%Consumer loans ................................................................... 27,296 3.7%
Gross loans .......................................................................... $ 730,599 100.0%

4
Commercial Loans The commercial loans we offer generally include short-term secured and unsecured business and commercial loans
with maturities ranging from 12 to 24 months, accounts receivable financing for terms of up to 18 months, equipment and automobile term loans and leases which generally amortize over a period of up to 7 years, and SBA guaranteed business loans with terms of up to 10 years. The interest rates on these loans generally are adjustable and usually are indexed to The Wall Street Journal’s prime rate and will vary based on market conditions and commensurate to the credit risk. However, since 2003 it generally has been our practice to establish an interest rate floor on a best effort basis on our commercial loans. In order to mitigate the risk of borrower default, we generally require collateral to support the credit or, in the case of loans made to businesses, personal guarantees from their owners, or both. In addition, all such loans must have well-defined primary and secondary sources of repayment. Generally, lines of credit are granted for no more than a 12-month period.
Commercial loans, including accounts receivable financing, generally are made to businesses that have been in operation for at least three years. To qualify for such loans, prospective borrowers generally must have debt-to-net worth ratios not exceeding 4-to-1, operating cash flow sufficient to demonstrate the ability to pay obligations as they become due, and good payment histories as evidenced by credit reports.
We also offer asset-based lending products, which involve a higher degree of risk because they generally are made to businesses that are growing rapidly, but cannot internally fund their growth without borrowings. These loans are collateralized primarily by the borrower’s accounts receivable and inventory. We control our risk by generally requiring loan-to-value ratios of not more than 80% and by closely and regularly monitoring the amount and value of the collateral in order to maintain that ratio.
Commercial loan growth is important to the growth and profitability of our banking franchise because, although not required to do so, commercial loan borrowers often establish noninterest-bearing (demand) and interest-bearing transaction deposit accounts and banking services relationships with us. Those deposit accounts help us to reduce our overall cost of funds and those banking services relationships provide us with a source of non-interest income.
Commercial Real Estate Loans The majority of our commercial real estate loans are secured by first trust deeds on nonresidential real property. Loans
secured by nonresidential real estate often involve loan balances to single borrowers or groups of related borrowers, and generally involve a greater risk of nonpayment than do mortgage loans secured by multi-family dwellings. Payments on these loans depend to a large degree on the results of operations and cash flows of the borrowers, which are generated from a wide variety of businesses and industries. As a result, repayment of these loans can be affected adversely by changes in the economy in general or by the real estate market more specifically. Accordingly, the nature of this type of loan makes it more difficult to monitor and evaluate. Consequently, we typically require personal guarantees from the owners of the businesses to which we make such loans.
Customers desiring to obtain commercial real estate loans are required to have good payment records with a debt coverage ratio generally of at least 1.25 to 1. In addition, we require adequate insurance on the properties securing those loans to protect the collateral value. These loans are generally adjustable rate loans with interest rates tied to a variety of independent indexes. However, in some instances, the interest rates on these loans are fixed for an initial five year period and then adjust thereafter based on an applicable index. These loans are generally written for terms of up to 10 years, with loan-to-value ratios of not more than 75% in the case of owner occupied properties and 65% on non-owner occupied properties.
Residential Mortgage Loans – Multi-family We make multi-family residential mortgage loans primarily in Southern California for terms up to 30 years. These
loans generally are adjustable rate loans with interest rates tied to a variety of independent indexes; although in some cases these loans have fixed interest rates for an initial five-year period and adjust thereafter based on an applicable index. These loans generally have interest rate floors, payment caps, and prepayment penalties. The loans are underwritten based on a variety of borrower and property criteria. Borrower criteria include liquidity and cash flow analysis and credit history verifications. Property criteria generally include loan to value limits under 75% and debt coverage ratios of 1.20 to 1 or greater.
5
Real Estate Construction and Land Development Loans To reduce our exposure to the deteriorating conditions in the real estate markets, in the fourth quarter of 2007, we
began reducing the volume of single family residential and real estate construction loans that we were making, while at the same time increasing our commercial and business lending. Moreover, in 2010 we essentially ceased all real estate construction lending.
Consumer Loans We offer a variety of loan and credit products to consumers including personal installment loans, lines of credit, credit
cards, and to high net-worth individuals for estate planning based upon cash surrender value life insurance. We design these products to meet the needs of our customers, and some are made at fixed rates of interest and others at adjustable rates of interest. Consumer loans often entail greater risk than real estate mortgage loans, particularly in the case of consumer loans which are unsecured or are secured by rapidly depreciable assets, such as automobiles, that may not provide an adequate source of repayment in the event of a default by the consumer. Consumer loan collections are dependent on the borrower’s ongoing financial stability. Furthermore, in the event a consumer files for bankruptcy protection, the bankruptcy and insolvency laws may limit the amount which can be recovered on such loans. To qualify for a consumer loan a prospective borrower must have a good payment record and, typically, debt ratios of not more than 45%.
Consumer loans and credit products are important because consumers are a source of noninterest-bearing checking accounts and low cost savings deposits. Additionally, banking relationships with consumers tend to be stable and longer lasting than banking relationships with businesses, which tend to be more sensitive to price competition.
Business Banking Services We offer various banking and financial services designed primarily for our business banking customers. Those
services include: • Financial management tools and services that include multiple account control, account analysis, transaction
security and verification, wire transfers, bill payment, payroll and lock box services, most of which are available at our Internet website, www.pmbank.com; and
• Automated clearinghouse (ACH) origination services which enable businesses that charge for their services or products on a recurring monthly or other periodic basis, to obtain payment from their customers through an automatic, pre-authorized debit from their customers’ bank accounts anywhere in the United States.
Convenience Banking Services We also offer a number of services and products that make it more convenient to conduct banking transactions with us,
such as online banking services, ATMs, night drop services, courier and armored car services that enable our business customers to order and receive cash without having to travel to our banking offices, and Remote Deposit Capture (PMB Xpress Deposit) which enables business customers to image checks they receive for electronic deposit at the Bank, thereby eliminating the need for customers to travel to our offices to deposit checks into their accounts.
Online Banking Services Our customers can securely access our online bank at www.pmbank.com to:
• Use financial cash management tools and services • View account balances and account history • Transfer funds between accounts • Pay bills and order wire transfers of funds • Transfer funds from credit lines to deposit accounts • Make loan payments • Print bank statements • Place stop payments • Purchase certificates of deposit

6
Our Mortgage Banking Business
During the second quarter of 2010, we commenced a new mortgage banking business to originate residential real estate mortgage loans that qualify for sale to third-party investors into the secondary mortgage markets. Residential mortgage loans consist of loans secured by single-family residential properties.
We offer a variety of mortgage loan products catering to the specific needs of home borrowers, including fixed rate and adjustable rate, conventional and government insured (Federal Housing Administration (FHA) and Veteran Affairs (VA)) mortgages with either 30-year or 15-year terms. We also offer jumbo loans that meet conventional underwriting criteria, except for the loan amounts which exceed Fannie Mae and Freddie Mac limits.
The mortgage loans we originate are generally secured by first liens on the underlying real properties. We do not originate mortgage loans defined as high cost by state or federal regulators or that do not comply with applicable agency or investor-specific underwriting guidelines. The majority of these residential mortgage loans are made to finance the purchase of, or to refinance existing loans on, owner-occupied homes, and are collateralized by real properties located in Southern California; however we also originate mortgage loans throughout California and in 17 other states. The mortgage lending business is subject to seasonality, and the overall demand for mortgage loans is driven largely by the applicable interest rates at any given time.
We handle mortgage loan processing, underwriting and closings at our headquarters offices in Costa Mesa, California, and we sell a majority of the mortgage loans to various investors in the secondary market, subject to certain indemnification obligations, which may require us to repurchase loans sold and repay the sales proceeds to investors under certain conditions. In addition, if a customer defaults on a mortgage payment shortly after the loan is originated, the investor may require us to repurchase the loan at the full amount paid by the investor. Mortgage loans which we do not sell into the secondary mortgage market are held for investment by us.
Our residential mortgage loan business initially focused on the origination of mortgage loans directly from consumers seeking to refinance existing mortgage loans or finance the purchase of residential real estate (the “direct-to-consumer retail mortgage channel”). In the latter half of 2011, we expanded our mortgage banking operations to include the funding of residential mortgage loans originated by independent mortgage brokers (the “wholesale mortgage channel”). Largely due to the growth of our wholesale mortgage business, the volume of residential mortgage loans funded by us grew from approximately $370 million in 2011 to approximately $955 million in 2012 and our mortgage banking division grew from approximately 172 employees at December 31, 2011 to approximately 212 employees at December 31, 2012.
However, as previously reported, based on review of our mortgage banking operations in mid-2012, we decided to focus our residential mortgage banking business entirely on the direct-to-consumer retail mortgage channel and to exit the wholesale mortgage banking business. Consequently, we ceased accepting new mortgage submissions submitted to us after August 31, 2012, although we did continue to process and fund all mortgage broker-originated loans in process or originated on our before that date. This action was taken (i) to enable us to redeploy some of our capital resources that were committed to the wholesale mortgage business to our core commercial lending business in anticipation of a strengthening of the economy and ahead of an expected reduction in the demand for residential mortgage loans due to an eventual increase in prevailing mortgage interest rates, (ii) to reduce and control our staffing costs and operating expenses, which had grown significantly due primarily to the growth of our wholesale mortgage business, and (iii) to manage and limit the interest rate and other risks inherent in residential mortgage businesses, including risks posed by the increase in government regulation of the mortgage industry primarily as a result of the adoption and implementation of the Dodd-Frank Wall Street Reform and Consumer Protection Act (the “Dodd-Frank Act”). See “—Impact of Economic Conditions, Government Policies and Legislation on our Business” below in this Item 1.
The full impact of our exit from the wholesale mortgage loan channel on our operating results is not reflected in our operating results during the four month period ended December 31, 2012, primarily because we continued to fund broker-originated loans that were in process or for which applications had been submitted to us prior to September 1, 2012. However, we expect that our exit from the wholesale mortgage channel will result in a reduction, which could be substantial, in our mortgage banking revenues in 2013, as compared to 2012, which could, in turn, result in a reduction in our net income in 2013. Nevertheless, in our view, the exit from the wholesale mortgage loan channel was prudent, because we believe that it will enable us to build a stronger foundation for achieving improved profitability in the future, reduce and control our operating costs and reduce and limit interest rate and other risks inherent in the mortgage business, in order to enhance the value of our banking franchise in the future. However, there is no assurance that these objectives will be achieved. See “RISK FACTORS —Our exit from the wholesale mortgage business could adversely affect our operating results in 2013 and thereafter” in Item 1A of this Report.

7
Security Measures Our ability to provide customers with secure and uninterrupted financial services is of paramount importance to our
business. We believe our computer banking systems, services and software meet the highest standards of bank and electronic systems security. The following are among the security measures that we have implemented:
Bank-Wide Security Measures • Service Continuity. In order to better ensure continuity of service, we have located our critical servers and
telecommunications systems at an offsite hardened and secure data center. This center provides the physical environment necessary to keep servers up and running 24 hours a day, 7 days a week. This data center has raised floors, temperature control systems with separate cooling zones, seismically braced racks, and generators to keep the system operating during power outages and has been designed to withstand fires and major earthquakes. The center also has a wide range of physical security features, including smoke detection and fire suppression systems, motion sensors, and 24x7 secured access, as well as video camera surveillance and security breach alarms. The center is connected to the Internet by redundant high speed data circuits with advanced capacity monitoring.
• Physical Security. All servers and network computers reside in secure facilities. Only employees with proper identification may enter the primary server areas.
• Monitoring. All customer transactions on our online servers and internal computer systems produce one or more entries into transactional logs. Our personnel routinely review these logs as a means of identifying and taking appropriate action with respect to any abnormal or unusual activity. We believe that, ultimately, vigilant monitoring is the best defense against fraud.
Internet Security Measures We maintain electronic and procedural safeguards that comply with federal regulations to guard nonpublic personal
information. We regularly assess and update our systems to improve our technology for protecting information. On our website, the security measures include:
• Secure Sockets Layer (SSL) protocol, • Digital certificates, • Multi-factor authentication (MFA), • Intrusion detection/prevention systems, and • Firewall protection.
We believe the risk of fraud presented by online banking is not materially different from the risk of fraud inherent in any banking relationship. Potential security breaches can arise from any of the following circumstances:
• misappropriation of a customer’s account number or password; • compromise of the customer’s computer system; • penetration of our servers by an outside “hacker;” • fraud committed by a new customer in completing his or her loan application or opening a deposit account with
us; and • fraud committed by employees or service providers.
Both traditional banks and internet banks are vulnerable to these types of fraud. By establishing the security measures described above, we believe we can minimize, to the extent practicable, our vulnerability to the first three types of fraud. To counteract fraud by employees and service providers, we have established internal procedures and policies designed to ensure that, as in any bank, proper control and supervision is exercised over employees and service providers. We also maintain insurance to protect us from losses due to fraud committed by employees or through breaches in our cyber security.
Additionally, the adequacy of our security measures is reviewed periodically by the Federal Reserve Board and the California Department of Financial Institutions (“DFI”), which are the federal and state government agencies, respectively, with supervisory authority over the Bank. We also retain the services of third party computer security firms to conduct periodic tests of our computer and online banking systems to identify potential threats to the security of our systems and to recommend additional actions that we can take to improve our security measures.

8
Competition Competitive Conditions in the Traditional Banking Environment
The banking business in California generally, and in our service area in particular, is highly competitive and is dominated by a relatively small number of large multi-state and California-based banks that have numerous banking offices operating over wide geographic areas. We compete for deposits and loans with those banks, with community banks that are based or have branch offices in our market areas, and with savings banks (also sometimes referred to as “thrifts”), credit unions, money market and other mutual funds, stock brokerage firms, insurance companies, and other traditional and nontraditional financial service organizations. We also compete for customers’ funds with governmental and private entities issuing debt or equity securities or other forms of investments which may offer different and potentially higher yields than those available through bank deposits.
Major financial institutions that operate throughout California and that have offices in our service areas include Bank of America, Wells Fargo Bank, Jpmorgan Chase, Union Bank of California, Bank of the West, U. S. Bancorp, Comerica Bank and Citibank. Larger independent banks and other financial institutions with offices in our service areas include, among others, OneWest Bank, City National Bank, Citizens Business Bank, Manufacturers Bank, and California Bank and Trust.
These banks, as well many other financial institutions in our service areas, have the financial capability to conduct extensive advertising campaigns and to shift their resources to regions or activities of greater potential profitability. Many of them also offer diversified financial services which we do not presently offer directly. The larger banks and financial institutions also have substantially more capital and higher lending limits than our Bank.
In order to compete with the banks and other financial institutions operating in our service areas, we rely on our ability to provide flexible, more convenient and more personalized service to customers, including online banking services and financial tools. At the same time, we:
• emphasize personal contacts with existing and potential new customers by our directors, officers and other employees;
• develop and participate in local promotional activities; and • seek to develop specialized or streamlined services for customers.
To the extent customers desire loans in excess of our lending limits or services not offered by us, we attempt to assist them in obtaining such loans or other services through participations with other banks or assistance from our correspondent banks or third party vendors.
Competitive Conditions in Online Banking There are a number of banks that offer services exclusively over the internet, such as E*TRADE Bank, and other
banks, such as Bank of America and Wells Fargo Bank, that market their internet banking services to their customers nationwide. We believe that only the larger of the commercial banks with which we compete offer the comprehensive set of online banking tools and services that we offer to our customers. However, an increasing number of community banks offer internet banking services to their customers by relying on third party vendors to provide the functionality they need to provide such services. Additionally, many of the larger banks have greater market presence and greater financial resources to market their internet banking services than do we. Moreover, new competitors and competitive factors are likely to emerge, particularly in view of the rapid development of internet commerce. On the other hand, there have been some recently published reports indicating that the actual rate of growth in the use of the internet banking services by consumers and businesses is lower than had been previously predicted and that many customers still prefer to be able to conduct at least some of their banking transactions at local banking offices. We believe that these findings support our strategic decision, made at the outset of our business, to offer customers the benefits of both traditional and online banking services. We also believe that this strategy has been an important factor in our growth to date and will contribute to our growth in the future. See “BUSINESS — Our Business Strategy” earlier in this Section of this Report.
Impact of Economic Conditions, Government Policies and Legislation on our Business Government Monetary Policies. Our profitability, like that of most financial institutions, is affected to a significant
extent by our net interest income, which is the difference between the interest income we generate on interest-earning assets, such as loans and investment securities, and the interest we pay on deposits and other interest-bearing liabilities, such as borrowings. Our interest income and interest expense, and hence our net interest income, depends to a great extent on prevailing market rates of interest, which are highly sensitive to many factors that are beyond our control, including inflation, recession and unemployment. Moreover, it is often difficult to predict, with any assurance, how changes in economic conditions of this nature will affect our future financial performance.

9
Our net interest income and operating results also are affected by monetary and fiscal policies of the federal government and the policies of regulatory agencies, particularly the Federal Reserve Board. The Federal Reserve Board implements national monetary policies to curb inflation, or to stimulate borrowing and spending in response to economic downturns, through its open-market operations by adjusting the required level of reserves that banks and other depository institutions must maintain, and by varying the target federal funds and discount rates on borrowings by banks and other depository institutions. These actions affect the growth of bank loans, investments and deposits and the interest earned on interest-earning assets and paid on interest-bearing liabilities. The nature and impact of any future changes in monetary and fiscal policies on us cannot be predicted with any assurance.
Legislation Generally. From time to time, federal and state legislation is enacted which can affect our operations and our operating results by materially increasing the costs of doing business, limiting or expanding the activities in which banks and other financial institutions may engage, or altering the competitive balance between banks and other financial services providers.
Economic Conditions and Recent Legislation and Other Government Actions. The recent economic recession, which is reported to have begun at the end of 2007, created wide ranging consequences
and difficulties for the banking and financial services industry, in particular, and the economy in general. The recession led to significant write-downs of the assets and an erosion of the capital of a large number of banks and other lending and financial institutions which, in turn, significantly and adversely affected the operating results of banking and other financial institutions and led to steep declines in their stock prices. In addition, bank regulatory agencies have been very aggressive in responding to concerns and trends identified in their bank examinations, which has resulted in the increased issuance of enforcement orders requiring banks to take actions to address credit quality, liquidity and risk management and capital adequacy, as well as other safety and soundness concerns. All of these conditions, moreover, led the U.S. Congress, the U.S. Treasury Department and the federal banking regulators, including the FDIC, to take broad actions, to address systemic risks and volatility in the U.S. banking system.
The Dodd-Frank Act On July 21, 2010, the Dodd-Frank Wall Street Reform and Consumer Protection Act (the “Dodd-Frank Act”) was
signed into law. The Dodd-Frank Act significantly changes federal banking regulation. Among other things, the Dodd-Frank Act created a new Financial Stability Oversight Council to identify systemic risks in the banking and financial system and gives federal regulators new authority to take control of and liquidate banking institutions and other financial firms facing the prospect of imminent failure that would create systemic risks to the U.S. financial system. The Dodd-Frank Act also creates a new independent federal regulator to administer federal consumer protection laws.
The Dodd-Frank Act is expected to have a significant impact on banks and bank holding companies generally and we expect that many of its provisions will impact our business operations as they take effect. However, many aspects of the Dodd-Frank Act are subject to further rulemaking and will take effect over several years, making it difficult to anticipate the overall impact of that Act on the Company and the Bank. Set forth below is a summary description of some of the key provisions of the Dodd-Frank Act that may affect us. The description does not purport to be complete and is qualified in its entirety by reference to the Dodd-Frank Act itself.
Imposition of New Capital Standards on Bank Holding Companies. The Dodd-Frank Act requires the FRB to apply consolidated capital requirements to depository institution holding companies, such as us, that are no less stringent than those currently applied to depository institutions, such as the Bank. Under these standards, trust preferred securities will be excluded from Tier 1 capital unless such securities were issued prior to May 19, 2010 by a bank holding company with less than $15 billion in assets. Since our trust preferred securities were issued prior to 2010 and our assets total approximately $1 billion, our trust preferred securities will continue to be included in our Tier 1 capital. The Dodd-Frank Act also requires that capital be increased in times of economic expansion and allowed to decrease in times of economic contraction, consistent with safety and soundness.
Increase in Deposit Insurance and Changes Affecting the FDIC Insurance Fund. The Dodd-Frank Act permanently increased the maximum deposit insurance amount for banks, savings institutions and credit unions to $250,000 per depositor. Additionally, the Dodd-Frank Act eliminates the federal statutory prohibition against the payment of interest on business checking accounts, which is likely to increase the competition for and interest that banks pay on such accounts. The Dodd-Frank Act also broadens the base for FDIC insurance assessments. Assessments will now be based on the average consolidated total assets less tangible equity capital of a financial institution, which may result in increases in FDIC insurance assessments for many FDIC insured banks. The Dodd-Frank Act requires the FDIC to increase the reserve ratio of the Deposit Insurance Fund from 1.15% to 1.35% of insured deposits by 2020 and eliminates the requirement that the FDIC pay dividends to insured depository institutions when the reserve ratio exceeds certain thresholds.

10
Say-on-Pay and other Executive Compensation Provisions. The Dodd-Frank Act requires publicly traded companies, including those that are depository institutions or bank holding companies, to give their shareholders the right to vote, on an advisory basis, on approval of (i) executive compensation, and (ii) so-called “golden parachute” payments in connection with approvals of mergers and acquisitions that will trigger such payments. The Dodd-Frank Act also directs federal banking regulators to promulgate rules prohibiting the payment of excessive compensation to executives of depository institutions and their holding companies with assets in excess of $1.0 billion, whether or not they are publicly traded.
Limitation on Conversion of Bank Charters. The Dodd-Frank Act prohibits a depository institution from converting from a state to federal charter or vice versa while it is the subject of a cease and desist order or other formal enforcement action or a memorandum of understanding with respect to a significant supervisory matter unless the appropriate federal banking agency gives notice of the conversion to the federal or state regulatory agency that issued the enforcement action and that agency does not object within 30 days.
Interstate Banking. The Dodd-Frank Act authorizes national and state banks to establish branches in other states to the same extent as a bank chartered by that state would be permitted to branch. Previously, banks could only establish branches in other states if the host state expressly permitted out-of-state banks to establish branches in that state. Accordingly, banks will be able to enter new markets more freely.
Restrictions on Derivative Transactions. Effective 18 months after enactment, the Dodd-Frank Act prohibits state-chartered banks from engaging in derivatives transactions unless the legal lending limits of the state in which the bank is chartered take into consideration credit exposure to derivatives transactions. For this purpose, derivative transactions include any contract, agreement, swap, warrant, note or option that is based in whole or in part on the value of, any interest in, or any quantitative measure or the occurrence of any event relating to, one or more commodities securities, currencies, interest or other rates, indices or other assets.
Extension of Limitations on Banking Transactions by Banks with their Affiliates. The Dodd-Frank Act applies Section 23A and Section 22(h) of the Federal Reserve Act (governing transactions with insiders) to derivative transactions, repurchase agreements and securities lending and borrowing transactions that create credit exposure to an affiliate or an insider. Any such transactions with affiliates must be fully secured. In addition, the exemption from Section 23A for transactions with financial subsidiaries has been eliminated. The Dodd-Frank Act also expands the definition of affiliate for purposes of quantitative and qualitative limitations of Section 23A of the Federal Reserve Act to include mutual funds advised by a depository institution or any of its affiliates.
Debit Card Fees. The Dodd-Frank Act provides that the amount of any interchange fee charged by a debit card issuer with respect to a debit card transaction must be reasonable and proportional to the cost incurred by the card issuer and requires, the Federal Reserve Board to establish standards for reasonable and proportional fees which may take into account the costs of preventing fraud. As a result, the Federal Reserve Board adopted a rule, effective October 1, 2011, which limits interchange fees on debit card transactions to a maximum of 21 cents per transaction plus 5 basis points of the transaction amount. A debit card issuer may recover an additional one cent per transaction for fraud prevention purposes if the issuer complies with certain fraud-related requirements prescribed by the Federal Reserve Board. Although, as a technical matter, this new limitation applies only to institutions with assets of more than $10 billion, it is expected that many smaller institutions will reduce their interchange fees in order to remain competitive with the larger institutions that are required to comply with this new limitation.
Consumer Protection Provisions. The Dodd-Frank Act creates a new, independent federal agency called the Consumer Financial Protection Bureau (“CFPB”), which is granted broad rulemaking, supervisory and enforcement powers under various federal consumer financial protection laws, including the Equal Credit Opportunity Act, Truth in Lending Act, Real Estate Settlement Procedures Act, Fair Credit Reporting Act, Fair Debt Collection Act, the Consumer Financial Privacy provisions of the Gramm-Leach-Bliley Act and certain other statutes. The CFPB has examination and primary enforcement authority with respect to depository institutions with $10 billion or more in assets. Smaller institutions will be subject to rules promulgated by the CFPB but will continue to be examined and supervised by federal banking regulators for consumer compliance purposes. The CFPB has authority to prevent unfair, deceptive or abusive practices in connection with the offering of consumer financial products. The Dodd-Frank Act also (i), authorizes the CFPB to establish certain minimum standards for the origination of residential mortgages including a determination of the borrower’s ability to repay and (ii) will allow borrowers to raise certain defenses to foreclosure if they receive any loan other than a “qualified mortgage” as defined by the CFPB. The Dodd-Frank Act permits states to adopt consumer protection laws and standards that are more stringent than those adopted at the federal level and, in certain circumstances, permits state attorneys general to enforce compliance with both the state and federal laws and regulations.

11
In January 2013, the CFPB approved certain mortgage lending reform regulations impacting the Truth in Lending Act (the “TILA”) and the Real Estate Settlement Procedures Act (“RESPA”), which:
• expand the population of loans that are subject to higher cost loan regulations and additional disclosures; • prohibit the payment of compensation to mortgage brokers based on certain fees or premiums, such yield spread
premiums, payable by or charged to home borrowers; • increase the regulation of mortgage servicing activities, including with respect to error resolution, forced-
placement insurance and loss mitigation and collection activities; • require financial institutions to make a reasonable and good faith determination that the borrower has ability to
repay the residential mortgage loan before it is approved for funding and provides that the failure of a financial institution to make such a determination will entitle the borrower to assert that failure as a defense to any foreclosure action on the mortgage loan;
• impose appraisal requirements for high cost loans and loans secured by first mortgage liens on residential real estate.
Although most of these regulations are scheduled to become effective as of January 1, 2014, some will be effective beginning in 2013.
The CFPB has proposed other regulatory changes that have not yet become final, including regulations that would require mortgage loan disclosures under TILA and RESPA to be simplified and integrated, and regulations that would govern electronic transfers of foreign currency.
Supervision and Regulation Both federal and state laws extensively regulate bank holding companies and banks. Such regulation is intended
primarily for the protection of depositors and the FDIC’s deposit insurance fund and is not for the benefit of shareholders. Set forth below is a summary description of the material laws and regulations that affect or bear on our operations. The description does not purport to be complete and is qualified in its entirety by reference to the laws and regulations that are summarized below.
Pacific Mercantile Bancorp General. Pacific Mercantile Bancorp is a registered bank holding company subject to regulation under the Bank
Holding Company Act of 1956, as amended (the “Holding Company Act”). Pursuant to that Act, we are subject to supervision and periodic examination by, and are required to file periodic reports with, the Board of Governors of the Federal Reserve System (the “Federal Reserve Board” or the “FRB”).
As a bank holding company, we are allowed to engage, directly or indirectly, only in banking and other activities that the Federal Reserve Board deems to be so closely related to banking or managing or controlling banks as to be a proper incident thereto. Business activities designated by the Federal Reserve Board to be closely related to banking include securities brokerage services and products and data processing services, among others.
As a bank holding company, we also are required to obtain the prior approval of the Federal Reserve Board for the acquisition of more than 5% of the outstanding shares of any class of voting securities, or of substantially all of the assets, by merger or purchases of (i) any bank or other bank holding company and (ii) any other entities engaged in banking-related businesses or that provide banking-related services.
Under Federal Reserve Board regulations, a bank holding company is required to serve as a source of financial and managerial strength to its subsidiary banks and may not conduct its operations in an unsafe or unsound manner. In addition, it is the Federal Reserve Board’s policy that, in serving as a source of strength to its subsidiary banks, a bank holding company should stand ready to use available resources to provide adequate capital funds to its subsidiary banks during periods of financial stress or adversity and should maintain the financial flexibility and capital-raising capacity to obtain additional resources for assisting its subsidiary banks. For that reason, among others, the Federal Reserve Board requires all bank holding companies to maintain capital at or above certain prescribed levels. A bank holding company’s failure to meet these requirements will generally be considered by the Federal Reserve Board to be an unsafe and unsound banking practice or a violation of the Federal Reserve Board’s regulations or both, which could lead to the imposition of restrictions on the offending bank holding company, including restrictions on its further growth. See the discussion below under the caption “—Capital Standards and Prompt Corrective Action.”

12
Additionally, among its powers, the Federal Reserve Board may require any bank holding company to terminate an activity or terminate control of, or liquidate or divest itself of, any subsidiary or affiliated company that the Federal Reserve Board determines constitutes a significant risk to the financial safety, soundness or stability of the bank holding company or any of its banking subsidiaries. The Federal Reserve Board also has the authority to regulate provisions of a bank holding company’s debt, including authority to impose interest ceilings and reserve requirements on such debt. Subject to certain exceptions, bank holding companies also are required to file written notice and obtain approval from the Federal Reserve Board prior to purchasing or redeeming their common stock or other equity securities. A bank holding company and its non-banking subsidiaries also are prohibited from implementing so-called tying arrangements whereby customers may be required to use or purchase services or products from the bank holding company or any of its non-bank subsidiaries in order to obtain a loan or other services from any of the holding company’s subsidiary banks.
The Company also is a bank holding company within the meaning of Section 3700 of the California Financial Code. As such, we are subject to examination by, and may be required to file reports with, the California Department of Financial Institutions.
Financial Services Modernization Legislation. The Financial Services Modernization Act, which also is known as the Gramm-Leach-Bliley Act, was enacted into law in 1999. The principal objectives of that Act were to establish a comprehensive framework to permit affiliations among commercial banks, insurance companies, securities and investment banking firms, and other financial service providers. Accordingly, the Act revised and expanded the Bank Holding Company Act to permit a bank holding company system, meeting certain specified qualifications, to engage in broader range of financial activities to foster greater competition among financial services companies. To accomplish those objectives, among other things, the Act repealed the two affiliation provisions of the Glass-Steagall Act that had been adopted in the early 1930s during the Depression: Section 20, which restricted the affiliation of Federal Reserve Member Banks with firms “engaged principally” in specified securities activities; and Section 32, which restricted officer, director, or employee interlocks between a member bank and any company or person “primarily engaged” in specified securities activities. The Financial Services Modernization Act also contains provisions that expressly preempt and make unenforceable any state law restricting the establishment of financial affiliations, primarily related to insurance. That Act also:
• broadened the activities that may be conducted by national banks, bank subsidiaries of bank holding companies, and their financial subsidiaries;
• provided an enhanced framework for protecting the privacy of consumer information; • adopted a number of provisions related to the capitalization, membership, corporate governance, and other
measures designed to modernize the Federal Home Loan Bank system; • modified the laws governing the implementation of the Community Reinvestment Act (which is described in
greater detail below); and • addressed a variety of other legal and regulatory issues affecting both day-to-day operations and long-term
activities of banking institutions.
Before a bank holding company may engage in any of the financial activities authorized by that Act, it must file an application with its Federal Reserve Bank that confirms that it meets certain qualitative eligibility requirements established by the FRB. A bank holding company that meets those qualifications and files such an application will be designated as a “financial holding company”, as a result of which it will become entitled to affiliate with securities firms and insurance companies and engage in other activities, primarily through non-banking subsidiaries, that are financial in nature or are incidental or complementary to activities that are financial in nature. According to current Federal Reserve Board regulations, activities that are financial in nature and may be engaged in by financial holding companies, through their non-bank subsidiaries, include:
• securities underwriting; dealing and market making; • sponsoring mutual funds and investment companies; • engaging in insurance underwriting and brokerage; and • engaging in merchant banking activities.
A bank holding company that does not qualify as a financial holding company may not engage in such financial activities. Instead, as discussed above, it is limited to engaging in banking and such other activities that have been determined by the Federal Reserve Board to be closely related to banking.
We have no current plans to engage in any activities not permitted to traditional bank holding companies, including those expressly permitted by the Financial Services Modernization Act and we are not a financial holding company.

13
Privacy Provisions of the Financial Services Modernization Act. As required by the Financial Services Modernization Act, federal banking regulators have adopted rules that limit the ability of banks and other financial institutions to disclose nonpublic information about consumers to nonaffiliated third parties. Pursuant to the rules, financial institutions must provide:
• initial notices to customers about their privacy policies, describing the conditions under which banks and other financial institutions may disclose non-public personal information about their customers to non-affiliated third parties and affiliates;
• annual notices of their privacy policies to current customers; and • a reasonable method for customers to “opt out” of disclosures to nonaffiliated third parties.
The Sarbanes-Oxley Act of 2002. The Sarbanes-Oxley Act of 2002 (i) established requirements with respect to oversight and supervision of public accounting firms, and (ii) required the implementation of measures designed to improve corporate governance of companies with securities registered under the Securities and Exchange Act of 1934, as amended (“public companies”) and which, therefore, apply to us. Among other things, the Sarbanes-Oxley Act:
• Provided for the establishment of a five-member oversight board, known as the Public Company Accounting Oversight Board (the “PCAOB”), which is appointed by the Securities and Exchange Commission and that is empowered to set standards for and has investigative and disciplinary authority over accounting firms that audit the financial statements of public companies.
• Prohibits public accounting firms from providing various types of consulting services to their public company clients and requires accounting firms to rotate partners among public company clients every five years in order to assure that public accountants maintain their independence from managements of the companies whose financial statements they audit.
• Increased the criminal penalties for financial crimes and securities fraud. • Requires public companies to implement disclosure controls and procedures designed to assure that material
information regarding their business and financial performance is included in the public reports they file under the Securities and Exchange Act of 1934 (“Exchange Act Reports”).
• Requires the chief executive and chief financial officers of public companies to certify as to the accuracy and completeness of the Exchange Act Reports that their companies file, the financial statements included in those Reports and the effectiveness of their disclosure procedures and controls.
• Requires, pursuant to Section 404 of the Act, that (i) the chief executive and chief financial officer of a public company to test and certify to the effectiveness of their company’s internal control over financial reporting, and (ii) a public company’s outside auditors to independently test and issue a report as to whether the company’s internal control over its financial reporting is effective and whether there are any material weaknesses or significant deficiencies in those financial controls.
• Requires a majority of the directors of public company to be independent of the company’s management and that the directors that serve on a public company’s audit committee meet standards of independence that are more stringent than those that apply to non-management directors generally.
• Requires public companies whose publicly traded securities have a value in excess of $75 million to file their Exchange Act Reports on a more accelerated basis than had been required prior to the adoption of the Sarbanes-Oxley Act.
• Requires more expeditious reporting by directors and officers and other public company insiders regarding their trading in company securities.
• Established statutory separations between investment banking firms and financial analysts.
We have taken the actions required by, and we believe we are in compliance with the provisions of the Sarbanes-Oxley Act that are applicable to us. Among other things, we have implemented disclosure controls and procedures and taken other actions to meet the expanded disclosure requirements and certification requirements of the Sarbanes-Oxley Act, such as testing our internal control over financial reporting.

14
Acquisitions of Control of Banks. The Holding Company Act and the Change in Bank Control Act of 1978, as amended, together with regulations of the FRB, require FRB approval before any person or company may acquire “control” of a Federal Reserve member bank, such as the Bank, subject to exemptions for some transactions. Control is conclusively presumed to exist if an individual or company (i) acquires 25% or more of any class of voting securities of the bank or (ii) has the direct or indirect power to direct or cause the direction of the management and policies of the bank, whether through ownership of voting securities, by contract or otherwise; provided that no individual will be deemed to control a bank solely on account of being director, officer or employee of the bank. Control is presumed to exist if a person acquires 10% or more but less than 25% of any class of voting securities of a bank holding company with securities registered under Section 12 of the Exchange Act or if no other person will own a greater percentage of that class of voting securities immediately after the transaction.
Pacific Mercantile Bank General. Pacific Mercantile Bank (the “Bank”) is subject to primary supervision, periodic examination and regulation
by (i) the Federal Reserve Board, which is its primary federal banking regulator, because the Bank is a member of the Federal Reserve Bank of San Francisco and (ii) the DFI, because the Bank is a California state chartered bank. The Bank also is subject to certain of the regulations promulgated by the FDIC, because its deposits are insured by the FDIC.
Various requirements and restrictions under the Federal and California banking laws affect the operations of the Bank. These laws and the implementing regulations, which are promulgated by Federal and State regulatory agencies, cover most aspects of a bank’s operations, including the reserves a bank must maintain against deposits and for possible loan losses and other contingencies; the types of deposits it obtains and the interest it is permitted to pay on different types of deposit accounts; the loans and investments that a bank may make; the borrowings that a bank may incur; the number and location of banking offices that a bank may establish; the rate at which it may grow its assets; the acquisition and merger activities of a bank; the amount of dividends that a bank may pay; and the capital requirements that a bank must satisfy, which can determine the extent of supervisory control to which a bank will be subject by its federal and state bank regulators. A more detailed discussion regarding capital requirements that are applicable to us and the Bank is set forth below under the caption “Capital Standards and Prompt Corrective Action.” and “Action by the FRB and DFI.”
Permissible Activities and Subsidiaries. California law permits state chartered commercial banks to engage in any activity permissible for national banks. Those permissible activities include conducting many so-called “closely related to banking” or “nonbanking” activities either directly or through their operating subsidiaries.
Interstate Banking and Branching. Under the Riegle-Neal Interstate Banking and Branching Efficiency Act of 1994, bank holding companies and banks generally have the ability to acquire or merge with banks in other states; and, subject to certain state restrictions, banks may also acquire or establish new branches outside their home states. Interstate branches are subject to certain laws of the states in which they are located. The Bank presently does not have any interstate branches.
Federal Home Loan Bank System. The Bank is a member of the Federal Home Loan Bank (“FHLB”) of San Francisco. Among other benefits, each FHLB serves as a reserve or central bank for its members within its assigned region and makes available loans or advances to its member banks. Each FHLB is financed primarily from the sale of consolidated obligations of the FHLB system. As an FHLB member, the Bank is required to own a certain amount of capital stock in the FHLB. At December 31, 2012, the Bank was in compliance with the FHLB’s stock ownership requirement. Historically, the FHLB has paid dividends on its capital stock to its members.
FRB Deposit Reserve Requirements. The Federal Reserve Board requires all federally-insured depository institutions to maintain noninterest bearing reserves at specified levels against their transaction accounts. At December 31, 2012, the Bank was in compliance with these requirements.
If, as a result of an examination of a federally regulated bank, its primary federal bank regulatory agency, such as the Federal Reserve Board, were to determine that the financial condition, capital resources, asset quality, earnings prospects, management, liquidity, or other aspects of a bank’s operations had become unsatisfactory or that the bank or its management was in violation of any law or regulation, that agency has the authority to take a number of different remedial actions as it deems appropriate under the circumstances. These actions include the power to enjoin “unsafe or unsound” banking practices; to require that affirmative action be taken to correct any conditions resulting from any violation or practice; to issue an administrative order that can be judicially enforced; to require the bank to increase its capital; to restrict the bank’s growth; to assess civil monetary penalties against the bank or its officers or directors; to remove officers and directors of the bank; and, if the federal agency concludes that such conditions cannot be corrected or there is an imminent risk of loss to depositors, to terminate a bank’s deposit insurance, which in the case of a California chartered bank would result in revocation of its charter and require it to cease its banking operations. Additionally, under California law the DFI has many of the same remedial powers with respect to the Bank, because it is a California state chartered bank.

15
Dividends and Other Transfers of Funds. Cash dividends from the Bank constitute the primary source of cash available to PM Bancorp for its operations and to fund any cash dividends that the board of directors might declare in the future. PM Bancorp is a legal entity separate and distinct from the Bank and the Bank is subject to various statutory and regulatory restrictions on its ability to pay cash dividends to PM Bancorp. Those restrictions would prohibit the Bank, subject to certain limited exceptions, from paying cash dividends in amounts that would cause the Bank to become undercapitalized. Additionally, the Federal Reserve Board and the DFI have the authority to prohibit the Bank from paying dividends, if either of those authorities deems the payment of dividends by the Bank to be an unsafe or unsound practice. See “Action by the FRB and DFI” below and “Dividend Policy—Restrictions on the Payment of Dividends” in Item 5 of this Report.
Additionally, it is FRB policy that bank holding companies should generally pay dividends on common stock only out of income available over the past year, and only if prospective earnings retention is consistent with the organization’s expected future needs and financial condition. It is also an FRB policy that bank holding companies should not maintain dividend levels that undermine their ability to be a source of strength to their banking subsidiaries. Additionally, due to the current financial and economic environment, the FRB has indicated that bank holding companies should carefully review their dividend policies and has discouraged dividend payment ratios that are at maximum allowable levels unless both asset quality and capital are very strong.
The Federal Reserve Board also has established guidelines with respect to the maintenance of appropriate levels of capital by banks and bank holding companies under its jurisdiction. Compliance with the standards set forth in those guidelines and the restrictions that are or may be imposed under the prompt corrective action provisions of federal law could limit the amount of dividends which the Bank or the Company may pay. See “—Capital Standards and Prompt Corrective Action” and “Action by the FRB and DFI” below in this Section of this Report.
Single Borrower Loan Limitations. With certain limited exceptions, the maximum amount of obligations, secured or unsecured, that any borrower (including certain related entities) may owe to a California state bank at any one time may not exceed 25% of the sum of the shareholders’ equity, allowance for loan losses, capital notes and debentures of the bank. Unsecured obligations may not exceed 15% of the sum of the shareholders’ equity, allowance for loan losses, capital notes and debentures of the bank.
Restrictions on Transactions between the Bank and the Company and its other Affiliates. The Bank is subject to restrictions imposed by federal law on any extensions of credit to, or the issuance of a guarantee or letter of credit on behalf of, the Company or any of its other subsidiaries; the purchase of, or investments in, Company stock or other Company securities and the taking of such securities as collateral for loans; and the purchase of assets from the Company or any of its other subsidiaries. These restrictions prevent the Company and any of its subsidiaries from borrowing from the Bank unless the loans are secured by marketable obligations in designated amounts, and such secured loans and investments by the Bank in the Company or any of its subsidiaries are limited, individually, to 10% of the Bank’s capital and surplus (as defined by federal regulations) and, in the aggregate, for all loans made to and investments made in the Company and its other subsidiaries, to 20% of the Bank’s capital and surplus. California law also imposes restrictions with respect to transactions involving the Company and other persons deemed under that law to control the Bank.
Safety and Soundness Standards Banking institutions may be subject to potential enforcement actions by the federal regulators for unsafe or unsound
practices or for violating any law, rule, regulation, or any condition imposed in writing by its primary federal banking regulatory agency or any written agreement with that agency. The federal banking agencies have adopted guidelines designed to identify and address potential safety and soundness concerns that could, if not corrected, lead to deterioration in the quality of a bank’s assets, liquidity or capital. Those guidelines set forth operational and managerial standards relating to such matters as:
• internal controls, information systems and internal audit systems; • loan documentation; • credit underwriting; • asset growth; • earnings; and • compensation, fees and benefits.

16
In addition, federal banking agencies have adopted safety and soundness guidelines with respect to asset quality. These guidelines provide six standards for establishing and maintaining a system to identify problem assets and prevent those assets from deteriorating. Under these standards, an FDIC-insured depository institution is expected to:
• conduct periodic asset quality reviews to identify problem assets, estimate the inherent losses in problem assets and establish reserves that are sufficient to absorb those estimated losses;
• compare problem asset totals to capital; • take appropriate corrective action to resolve problem assets; • consider the size and potential risks of material asset concentrations; and • provide periodic asset quality reports with adequate information for the bank’s management and the board of
directors to assess the level of asset risk.
These guidelines also establish standards for evaluating and monitoring earnings and for ensuring that earnings are sufficient for the maintenance of adequate capital and reserves.
Capital Standards and Prompt Corrective Action The Federal Deposit Insurance Act (“FDIA”) provides a framework for regulation of depository institutions and their
affiliates, including parent holding companies, by their federal banking regulators. Among other things, it requires the relevant federal banking regulator to take “prompt corrective action” with respect to a depository institution if that institution does not meet certain capital adequacy standards, including requiring the prompt submission of an acceptable capital restoration plan if the depository institution’s bank regulator has concluded that it needs additional capital.
Supervisory actions by a bank’s federal regulator under the prompt corrective action rules generally depend upon an institution’s classification within one of five capital categories, which is determined on the basis of a bank’s total capital ratio, Tier 1 capital ratio and leverage ratio. Tier 1 capital consists principally of common stock and nonredeemable preferred stock, retained earnings and, subject to certain limitations, subordinated long term debentures or notes that meet certain conditions established by the Federal Reserve Board. See “MANAGEMENT’S DISCUSSION AND ANALYSIS OF FINANCIAL CONDITIONS AND RESULTS OF OPERATIONS — Capital Resources” in Item 7 in Part II of this Report.
A depository institution’s capital category under the prompt corrective action regulations will depend upon how its capital levels compare with various relevant capital measures and the other factors established by the relevant regulations. Those regulations provide that a bank will be:
• “well capitalized” if it has a total risk-based capital ratio of 10.0% or greater, a Tier 1 risk-based capital ratio of 6.0% or greater, and a leverage ratio of 5.0% or greater, and is not subject to any order or written directive by any such regulatory authority to meet and maintain a specific capital level for any capital measure;
• “adequately capitalized” if it has a total risk-based capital ratio of 8.0% or greater, a Tier 1 risk-based capital ratio of 4.0% or greater, and a leverage ratio of 4.0% or greater and is not “well capitalized”;
• “undercapitalized” if it has a total risk-based capital ratio that is less than 8.0%, a Tier 1 risk-based capital ratio of less than 4.0% or a leverage ratio of less than 4.0%;
• “significantly undercapitalized” if it has a total risk-based capital ratio of less than 6.0%, a Tier 1 risk-based capital ratio of less than 3.0% or a leverage ratio of less than 3.0%; and
• “critically undercapitalized” if its tangible equity is equal to or less than 2.0% of average quarterly tangible assets.
If a bank that is classified as a well-capitalized institution is determined (after notice and opportunity for hearing), by its federal regulatory agency to be in an unsafe or unsound condition or to be engaging in an unsafe or unsound practice, that agency may, under certain circumstances, reclassify the bank as adequately capitalized. If a bank has been classified as adequately capitalized or undercapitalized, its federal regulatory agency may nevertheless require it to comply with bank supervisory provisions and restrictions that would apply to a bank in the next lower capital classification, if that regulatory agency has obtained supervisory information regarding the bank (other than with respect to its capital levels) that raises safety or soundness concerns. However, a significantly undercapitalized bank may not be treated by its regulatory agency as critically undercapitalized.

17
The FDIA generally prohibits a bank from making any capital distributions (including payments of dividends) or paying any management fee to its parent holding company if the bank would thereafter be “undercapitalized.” “Undercapitalized” banks are subject to growth limitations and are required to submit a capital restoration plan. The federal regulatory agency for such a bank may not accept its capital restoration plan unless it determines, among other things, that the plan is based on realistic assumptions and is likely to succeed in restoring the bank’s capital. In addition, for a capital restoration plan to be acceptable, the bank’s parent holding company must guarantee that the bank will comply with its capital restoration plan. The bank holding company also is required to provide appropriate assurances of performance. Under such a guarantee and assurance of performance, if the bank fails to comply with its capital restoration plan, the parent holding company may become subject to liability for such failure in an amount up to the lesser of (i) 5.0% of the its bank subsidiary’s total assets at the time it became undercapitalized, and (ii) the amount which is necessary (or would have been necessary) to bring the bank into compliance with all applicable capital standards as of the time it failed to comply with the plan.
If a bank fails to submit an acceptable capital restoration plan, it will be treated as if it is “significantly undercapitalized.” In that event, the bank’s federal regulatory agency may impose a number of additional requirements and restrictions on the bank, including orders or requirements (i) to sell sufficient voting stock to become “adequately capitalized,” (ii) to reduce its total assets, and (iii) cease the receipt of deposits from correspondent banks. “Critically undercapitalized” institutions are subject to the appointment of a receiver or conservator.
The following table sets forth, as of December 31, 2012, the regulatory capital ratios of the Company (on a consolidated basis) and the Bank (on a stand-alone basis) and compares those capital ratios to the federally established capital requirements that must be met for a bank holding company or a bank to be deemed “adequately capitalized” or “well capitalized” under the prompt corrective action regulations that are described above:
At December 31, 2012
Actual To Be Classified for Regulatory Purposes As
Adequately Capitalized Well Capitalized
Total Capital to Risk Weighted Assets
Company ............................................................................... 16.5% At least 8.0% N/A Bank ...................................................................................... 15.6% At least 8.0% At least 10.0%
Tier I Capital to Risk Weighted Assets
Company ............................................................................... 15.2% At least 4.0% N/A Bank ...................................................................................... 14.4% At least 4.0% At least 6.0%
Tier I Capital to Average Assets
Company ............................................................................... 12.1% At least 4.0% N/A Bank ...................................................................................... 11.5% At least 4.0% At least 5.0%
As the above table indicates, at December 31, 2012 the Bank (on a stand-alone basis) continued to qualify as a well-capitalized institution, and the Company (on a consolidated basis) continued to exceed the capital ratios applicable to bank holding companies, under federally mandated capital standards and federally established prompt corrective action regulations.
Basel III Capital Requirements The current risk-based capital guidelines which apply to the Company and the Bank are based upon the 1988 capital
accord of the International Basel Committee on Banking Supervision (the “BCBS”), which is a committee of central banks and bank supervisors/regulators from the major industrialized countries that develops broad policy guidelines for use by each country’s banking regulators in determining the banking supervisory policies they apply.
In December 2010, the BCBS issued a new set of international guidelines for determining regulatory capital, known as “Basel III.” These guidelines were revised in June 2011. As revised, the Basel III capital guidelines increase minimum capital requirements, and when fully implemented, will require banks to maintain a minimum ratio of Tier 1 common equity to risk-weighted assets of at least 4.5 percent plus a 2.5 percent capital conservation buffer.
In June 2012, the Federal Reserve Board issued three notices of proposed rulemaking (the “Basel III NPRs”) that would revise the regulatory risk-based capital and leverage requirements for banks in the United States consistent with the Basel III guidelines. The proposed revisions include the implementation of a more conservative definition of capital, a new common equity Tier 1 minimum capital requirement, a higher minimum Tier 1 capital requirement, and a supplementary leverage ratio. Also, consistent with Basel III, the Federal Reserve Board has proposed limiting capital distributions and certain discretionary bonus payments to the executives of a bank that fails to maintain specified capital buffers in addition to meeting minimum risk-based capital requirements. In addition, the Federal Reserve Board and other federal bank regulatory agencies have proposed to revise the calculation of risk-weighted assets under the general risk-based capital rule that would be applicable to all banks, including the Bank.

18
The Basel III NPRs had initially provided for an implementation date of January 1, 2013 and a transition period extending to 2019. However, the Federal Reserve Board has delayed the finalization of the proposals; but has not, as yet, provided any guidance as to when the final rules will be adopted or how this delay will affect the implementation date or the transition period.
Basel III Liquidity Proposal In 2009, the BCBS proposed two minimum standards for limiting liquidity risk: A Liquidity Coverage Ratio (“LCR”)
and a Net Stable Funding Ratio (“NSFR”). The LCR is designed to ensure that bank holding companies have sufficient high-quality liquid assets to survive a significant liquidity stress event lasting for 30 calendar days. The NSFR is designed to promote stable, longer-term funding of assets and business activities over a one-year time horizon. In January 2012, the BCBS revised these proposals and delayed their implementation by providing that these requirements would be phased in over a period of four years beginning on January 1, 2015. The federal banking regulatory agencies are expected to issue a notice of proposed rulemaking sometime in the future defining the LCR and NSFR for implementation in the United States.
FDIC Deposit Insurance The FDIC is an independent federal agency that insures deposits, up to prescribed statutory limits, of federally insured
banks and savings institutions in order to safeguard the safety and soundness of the banking and savings industries. The FDIC insures customer deposits through the Deposit Insurance Fund (the “DIF”) up to prescribed limits for each depositor. The Dodd-Frank Act increased the maximum deposit insurance amount from $100,000 to $250,000. The DIF is funded primarily by FDIC assessments paid by each DIF member institution. The amount of each DIF member’s assessment is based on its relative risk of default as measured by regulatory capital ratios and other supervisory factors. Pursuant to the Federal Deposit Insurance Reform Act of 2005, the FDIC is authorized to set the reserve ratio for the DIF annually at between 1.15% and 1.50% of estimated insured deposits. The FDIC may increase or decrease the assessment rate schedule on a semi-annual basis. The Dodd-Frank Act increased the minimum reserve ratio (the ratio of the net worth of the DIF to estimated insured deposits) from 1.15% of estimated deposits to 1.35% of estimated deposits (or a comparable percentage of the asset-based assessment base described above). The Dodd-Frank Act requires the FDIC to offset the effect of the increase in the minimum reserve ratio when setting assessments for insured depository institutions with less than $10 billion in total consolidated assets, such as the Bank. The FDIC has until September 30, 2020 to achieve the new minimum reserve ratio of 1.35%.
Additionally, all FDIC-insured institutions are required to pay assessments to the FDIC to fund interest payments on bonds issued by the Financing Corporation (“FICO”), an agency of the Federal government established to recapitalize the predecessor to the DIF. The FICO assessment rates, which are determined quarterly, averaged 0.066% of insured deposits in fiscal 2012. These assessments will continue until the FICO bonds mature in 2017.
The FDIC may terminate a depository institution’s deposit insurance upon a finding that the institution’s financial condition is unsafe or unsound or that the institution has engaged in unsafe or unsound practices that pose a risk to the DIF or that may prejudice the interest of the bank’s depositors. Pursuant to California law, the termination of a California state chartered bank’s FDIC deposit insurance would result in the revocation of the bank’s charter, forcing it to cease conducting banking operations.
Community Reinvestment Act and Fair Lending Developments The Bank is subject to fair lending requirements and the evaluation of its small business operations under the
Community Reinvestment Act (“CRA”). That Act generally requires the federal banking agencies to evaluate the record of a bank in meeting the credit needs of its local communities, including those of low- and moderate-income neighborhoods in its service area. A bank may be subject to substantial penalties and corrective measures for a violation of fair lending laws. Federal banking agencies also may take compliance with fair lending laws into account when regulating and supervising other activities of a bank or its bank holding company.
A bank’s compliance with its CRA obligations is based on a performance-based evaluation system which determines the bank’s CRA ratings on the basis of its community lending and community development performance. When a bank holding company files an application for approval to acquire a bank or another bank holding company, the Federal Reserve Board will review the CRA assessment of each of the subsidiary banks of the applicant bank holding company, and a low CRA rating may be the basis for denying the application.

19
USA Patriot Act of 2001
In October 2001, the Uniting and Strengthening America by Providing Appropriate Tools Required to Intercept and Obstruct Terrorism (USA Patriot Act) of 2001 was enacted into law in response to the September 11, 2001 terrorist attacks. The USA Patriot Act was adopted to strengthen the ability of U.S. law enforcement and intelligence agencies to work cohesively to combat terrorism on a variety of fronts.
Of particular relevance to banks and other federally insured depository institutions are the USA Patriot Act’s sweeping anti-money laundering and financial transparency provisions and various related implementing regulations that:
• establish due diligence requirements for financial institutions that administer, maintain, or manage private bank accounts and foreign correspondent accounts;
• prohibits US institutions from providing correspondent accounts to foreign shell banks; • establish standards for verifying customer identification at account opening; • set rules to promote cooperation among financial institutions, regulatory agencies and law enforcement entities in
identifying parties that may be involved in terrorism or money laundering;
Under implementing regulations issued by the U.S. Treasury Department, banking institutions are required to incorporate a customer identification program into their written money laundering plans that includes procedures for:
• verifying the identity of any person seeking to open an account, to the extent reasonable and practicable; • maintaining records of the information used to verify the person’s identity; and • determining whether the person appears on any list of known or suspected terrorists or terrorist organizations.
Consumer Laws The Company and the Bank are subject to a broad range of federal and state consumer protection laws and regulations
prohibiting unfair or fraudulent business practices, untrue or misleading advertising and unfair competition. Those laws and regulations include:
• The Home Ownership and Equity Protection Act of 1994, or HOEPA, which requires additional disclosures and consumer protections to borrowers designed to protect them against certain lending practices, such as practices deemed to constitute “predatory lending.”
• Laws and regulations requiring banks to establish privacy policies which limit the disclosure of nonpublic information about consumers to nonaffiliated third parties.
• The Fair Credit Reporting Act, as amended by the Fair and Accurate Credit Transactions Act, or the FACT Act, which requires banking institutions and financial services businesses to adopt practices and procedures designed to help deter identity theft, including developing appropriate fraud response programs, and provides consumers with greater control of their credit data.
• The Truth in Lending Act, or TILA, which requires that credit terms be disclosed in a meaningful and consistent way so that consumers may compare credit terms more readily and knowledgeably.
• The Equal Credit Opportunity Act, or ECOA which generally prohibits, in connection with any consumer or business credit transaction, discrimination on the basis of race, color, religion, national origin, sex, marital status, age (except in limited circumstances), or the fact that a borrower is receiving income from public assistance programs.
• The Fair Housing Act, which regulates many lending practices, including making it unlawful for any lender to discriminate in its housing-related lending activities against any person because of race, color, religion, national origin, sex, handicap or familial status.
• The Home Mortgage Disclosure Act, or HMDA, which includes a “fair lending” aspect that requires the collection and disclosure of data about applicant and borrower characteristics as a way of identifying possible discriminatory lending patterns and enforcing anti-discrimination statutes.
• The Real Estate Settlement Procedures Act, or RESPA, which requires lenders to provide borrowers with disclosures regarding the nature and cost of real estate settlements and prohibits certain abusive practices, such as kickbacks.
• The National Flood Insurance Act, or NFIA, which requires homes in flood-prone areas with mortgages from a federally regulated lender to have flood insurance.

20
• The Secure and Fair Enforcement for Mortgage Licensing Act of 2008, or SAFE Act, which requires mortgage loan originator employees of federally insured institutions to register with the Nationwide Mortgage Licensing System and Registry, a database created by the states to support the licensing of mortgage loan originators, prior to originating residential mortgage loans.
Regulation W The FRB has adopted Regulation W to comprehensively implement sections 23A and 23B of the Federal Reserve Act.
Sections 23A and 23B and Regulation W limit transactions between a bank and its affiliates and limit a bank’s ability to transfer to its affiliates the benefits arising from the bank’s access to insured deposits, the payment system and the discount window and other benefits of the Federal Reserve system. The statute and regulation impose quantitative and qualitative limits on the ability of a bank to extend credit to, or engage in certain other transactions with, an affiliate (and a non-affiliate if an affiliate benefits from the transaction). However, certain transactions that generally do not expose a bank to undue risk or abuse the safety net are exempted from coverage under Regulation W.
Historically, a subsidiary of a bank was not considered an affiliate for purposes of Sections 23A and 23B, since their activities were limited to activities permissible for the bank itself. However, the Gramm-Leach-Bliley Act authorized “financial subsidiaries” that may engage in activities not permissible for a bank. These financial subsidiaries are now considered affiliates. Certain transactions between a financial subsidiary and another affiliate of a bank are also covered by sections 23A and 23B and under Regulation W.
Regulatory Action by the FRBSF and DFI As previously reported in a Current Report on Form 8-K dated August 31, 2010 and filed with the SEC on August 31,
2010, the members of the respective Boards of Directors of the Company and the Bank entered into a Written Agreement (the “FRB Agreement”) with the Federal Reserve Bank of San Francisco (the “FRBSF”). On the same date, the Bank consented to the issuance of a Final Order by the DFI (the “DFI Order”). The principal purposes of the Agreement and DFI Order, which constitute formal supervisory actions by the FRBSF and the DFI, were to require us to adopt and implement formal plans and take certain actions, as well as to continue implementing measures that we previously adopted, to address the adverse consequences that the economic recession had on the performance of our loan portfolio and our operating results and to increase our capital to strengthen our ability to weather any further adverse conditions that might arise if the economic recovery remains weak or economic conditions deteriorate.
The FRB Agreement and DFI Order contain substantially similar provisions. They required the Boards of Directors of the Company and the Bank to prepare and submit written plans to the FRB and the DFI that addressed the following matters: (i) strengthening board oversight of the management operations of the Bank; (ii) strengthening credit risk management practices and improving credit administration policies and procedures; (iii) improving the Bank’s position with respect to problem assets; (iv) maintaining adequate reserves for loan losses in accordance with applicable supervisory guidelines; (v) improving the capital position of the Bank and, in the case of the FRB Agreement, the capital position of the Company; (vi) adopting and implementing a new strategic plan; and (vii) submitting a funding contingency plan for the Bank that identified available sources of liquidity and a plan for dealing with potential adverse economic and market conditions. In addition, the FRB Agreement and the DFI Order placed restrictions on lending by the Bank to borrowers who had loans that were criticized in an joint examination of the Bank conducted by the FRBSF and DFI in 2010 and required the Bank to charge off or collect loans that were classified as “loss” in that examination (to the extent that the Bank had not already done so). The Bank is also prohibited from paying dividends to the Company without the prior approval of the DFI, and without the prior approval of the FRBSF the Company may not declare or pay cash dividends, repurchase any of its shares, make payments on its trust preferred securities or incur or guarantee any debt.
The DFI Order also states that if the Bank were to violate or fail to comply with the Order, the Bank could be deemed to be conducting business in an unsafe manner which could subject the Bank to further regulatory enforcement action.
The Company and the Bank already have made substantial progress with respect to most of the requirements of the FRB Agreement and DFI Order and both the Board and management are committed to achieving the remaining requirements.
Under the DFI Order, the Bank was required to achieve a ratio of adjusted tangible shareholders’ equity to its tangible assets to 9.0% by January 31, 2011, by raising additional capital, generating earnings or reducing the Bank’s tangible assets (subject to a 15% limitation on such a reduction) or a combination thereof and, upon achieving that ratio, to thereafter maintain that ratio during the Term of the Order.

21
As previously reported, on August 26, 2011 we completed the sale of a total of $11.2 million of shares of a newly created Series B Convertible 8.4% Noncumulative Preferred Stock (the “Series B Shares”) to three institutional investors in a private placement. We then contributed the net proceeds from the sale of those shares of Series B Shares to the Bank to enable it to increase the ratio of its adjusted tangible shareholders’ equity to its tangible assets above 9% and thereby meet the capital requirement under the DFI Order. At December 31, 2012 that ratio had increased to 12.2%.
A copy of the FRB Agreement is attached as Exhibit 10.1, and a copy of the DFI Order is attached as Exhibit 10.2, to the Current Report on Form 8-K dated August 31, 2011, which we filed with the SEC on September 7, 2010. The foregoing summary of the FRB Agreement and the DFI Order is qualified in its entirety by reference to those Exhibits.
Employees As of December 31, 2012, we employed 324 persons on a full-time equivalent basis. None of our employees are
covered by a collective bargaining agreement. We believe relations with our employees are good.
Information Available on our Website Our Internet address is www.pmbank.com. We make available on our website, free of charge, our filings made with the
SEC electronically, including those on Form 10-K, Form 10-Q, and Form 8-K, and any amendments to those filings. Copies of these filings are available as soon as reasonably practicable after we have filed or furnished these documents to the SEC (at www.sec.gov).
ITEM 1A. RISK FACTORS Our business is subject to a number of risks and uncertainties that could cause our financial condition or operating
results in the future to differ significantly from our expected financial condition or operating results that are set forth in the forward looking statements contained in this Report. Set forth below is a summary description of many of those risks and uncertainties.
The United States recently experienced a severe economic recession the effects of which continue to adversely impact the banking and financial services industry in general, and our business and financial performance, in particular, and has created substantial uncertainties and risks for our business and future financial performance.
The United States recently experienced a severe economic recession. The recession created wide-ranging consequences and difficulties which continue to adversely affect the banking and financial services industry, in particular, and the economy, in general, including significant decreases in economic activity and in residential and commercial real estate prices and increases in unemployment, which led to increases in loan delinquencies and foreclosures. Those conditions and circumstances necessitated significant write-downs of the carrying values of assets by, and caused an erosion of the capital of, a large number of banks and other lending and financial institutions. Like many other banks, due primarily to these conditions, we experienced substantial increases in non-performing loans and in loan losses in 2008, 2009 and 2010. Those loan losses required us (and many other banks) to significantly increase the allowance for loan losses by charges to income. In addition, as the economy contracted, loan demand decreased and net interest margins declined as the Federal Reserve Board reduced interest rates in an effort to stimulate the economy, resulting in decreases in our net interest income. As a result, we incurred net losses of $12.0 million, $17.3 million and $14.0 million in 2008, 2009 and 2010, respectively.
Although, according to economists, the economic recession is over, the economic recovery has been weak and until recently, real estate prices continued to decline, unemployment and real estate foreclosures remained high and consumer confidence was low. Moreover, there are concerns that the economy may again fall into recession. Additionally, due to these conditions and the prospect that economic conditions will not soon recover, we face a number of risks that could adversely affect our operating results and financial condition in the future, including the following:
• We could experience further increases in non-performing loans and other non-performing assets, consisting primarily of real properties acquired on foreclosure of non-performing loans, that would require us to write down the carrying values of such loans and other non-performing assets and to set aside additional reserves, which could adversely affect our results of operations and cause us to incur operating losses in the future.
• Due to the continuing uncertainties about economic conditions, there is an increased risk that the judgments we might make in estimating loan losses inherent in our loan portfolio and in determining the adequacy of the allowance for loan losses will prove to have been incorrect, requiring us to set aside additional reserves that would adversely affect our results of operations in 2013.

22
• Possible further declines in economic activity in the United States, generally, and in our markets, in particular, due to weak business and consumer spending and high unemployment, which could lead to:
• reductions in loan demand and a further tightening of credit that would result in declines in interest income and a further compression of our net interest margins that would result in reductions in our net interest income; and
• increases in deposit withdrawals by customers to meet their operating or living expenses or to shift cash into higher yielding financial instruments offered by competing financial services organizations, which could reduce our liquidity and, therefore, the funds we would have available for lending and could cause our interest income to decline, possibly significantly, and our costs of funds to increase, thereby adversely affecting our operating results and financial condition.
• In response to the causes of the credit and foreclosure crises and the economic recession, Congress enacted the Dodd-Frank Act, which will increase the regulation of and impose new restrictions on banks and other financial institutions and could, as a result, increase our costs of doing business and limit our ability to pursue business and growth opportunities.
• We continue to have a substantial dollar amount of non-performing assets, consisting of non-performing loans and real properties that we acquired by or in lieu of foreclosure during the three years ended December 31, 2012. A failure to meaningfully improve the quality of the loans in our loan portfolio or to sell those real properties without incurring substantial losses could result in further write downs in the carrying values of those assets, which could (i) cause us to incur losses in 2013, and (ii) lead to the imposition, by federal and state bank regulators, of additional restrictions on our operations that could adversely affect our operating results and require us to raise additional capital that could dilute our existing shareholders. See “ — Risks and Uncertainties Posed by the FRB Agreement and DFI Order to which we and the Bank are subject” below in this Item 1A.
• We, as well as all other federally insured banks, may be required to pay significantly higher FDIC premiums to replenish the FDIC’s deposit insurance fund, which would increase our operating expenses and, thereby, reduce our income.
The recent downgrade of the U.S. government’s sovereign credit rating by Standard & Poor’s Ratings Services, and any future rating agency action with respect to the U.S. government’s sovereign credit rating, could have a material adverse effect on us. Further, the current debt crisis in Europe, and the risk that certain countries may default on their sovereign debt, and the resulting impact on the financial markets, could have a material adverse effect on our business, results of operations and financial condition.
On August 5, 2011, Standard & Poor’s downgraded the United States long-term debt rating from its AAA rating to AA+. On August 8, 2011, Standard & Poor’s downgraded the credit ratings of certain long-term debt instruments issued by Fannie Mae and Freddie Mac and other U.S. government agencies linked to long-term U.S. debt. These downgrades, any future downgrades, as well as any perceived concerns about the creditworthiness of U.S. government-related obligations, could impact our ability to obtain, and the pricing with respect to, funding that is collateralized by affected instruments and obtained through the secured and unsecured markets. We cannot predict how this or any further downgrades to the U.S. government’s sovereign credit rating, or such concerns about the creditworthiness of U.S. government-related obligations, will impact economic or capital markets conditions generally. It is possible that any such impact could have a material adverse effect on our business, results of operation, and financial position.
In addition, Western Europe has fallen back into recession and uncertainties remain with respect to the ability of certain European Union countries to continue to service their sovereign debt obligations. The recession and these uncertainties have adversely impacted and have created substantial volatility in the financial markets and have had a negative impact on global economic activity. Moreover, concerns have arisen that a failure of the European Union to satisfactorily resolve the sovereign debt crisis could lead to a global economic recession which could spread to the United States. As a result, even though neither we nor the Bank hold or have any exposure to European sovereign debt, if not satisfactorily resolved this debt crisis could have an adverse effect, which could be material, on our business, financial condition and future results of operations.

23
We could incur losses on the loans we make. Loan defaults and the incurrence of losses on the loans we make are an inherent risk of the banking business. That risk
has been exacerbated by the significant slowdown in the housing markets and significant increases in real estate loan foreclosures in Los Angeles, Orange, Riverside and San Diego counties of California where most of our customers are based. This slowdown is attributable to declining real estate prices, excess inventories of unsold homes, high vacancy rates at commercial properties and increases in unemployment and a resulting loss of confidence about the future among businesses and consumers that have combined to adversely affect business and consumer spending. These conditions led to increases in our non-performing assets in 2008, 2009 and 2010, which required us to record loan charge-offs and write-downs in the carrying values of real properties that we acquired by or in lieu of foreclosure and caused us to incur losses in that three year period. A further deterioration or even a continuing weakness in economic conditions could result in additional loan charge-offs and asset write-downs that would require us to increase the provisions we make for loan losses and losses on real estate owned that would have a material adverse effect on our future operating results, financial condition and capital.
We may be required to increase our reserve for loan losses which would adversely affect our financial performance in the future.
On a quarterly basis we evaluate and conduct an analysis to estimate the losses inherent in our loan portfolio. However, this evaluation requires us to make a number of estimates and judgments regarding the financial condition of a significant member of our borrowers, the fair value of the properties collateralizing our outstanding loans and economic trends that could affect the ability of borrowers to meet their payment obligations to us. Based on those estimates and judgments, we make determinations, which are necessarily subjective, with respect to (i) the adequacy of our allowance for loan losses to provide for write-downs in the carrying values and charge-offs of loans that may be required in the future and (ii) the need to increase the allowance for loan losses by means of a charge to income (commonly referred to as the provision for loan losses). If, due to events or circumstances outside of our control or otherwise, those estimates or judgments prove to have been incorrect or the Bank’s regulators come to a different conclusion than us regarding the adequacy of the Bank’s allowance for loan losses, we would have to increase the provisions we make for loan losses, which would reduce our income or could cause us to incur operating losses in the future.
Risks and Uncertainties Posed by the FRB Agreement and DFI Order to which we and the Bank are subject. As previously reported and described in our Current Report on Form 8-K dated August 31, 2010, we entered into a
written regulatory agreement (the “FRB Agreement”) with the FRBSF and the Bank consented to the issuance by the DFI of a Final Order (the “DFI Order”), due primarily to the increases in loan losses and other non-performing assets and the net losses we incurred in 2008, 2009 and 2010 and in the first half of 2011. Set forth below is a description of material risks and uncertainties created for us by the FRB Agreement and DFI Order.
We are subject to increased regulatory oversight which increases our costs of doing business and restricts our ability to grow our banking franchise. Under the terms of the FRB Agreement and DFI Order, we and the Bank are required to implement certain corrective and remedial measures within strict time frames and to maintain certain levels of liquidity, loan loss reserves and capital. In addition, we are required to increase management oversight of our operations and are subject to more frequent regulatory examinations. These requirements have had and in the future may have the effect of increasing our expenses and adversely affecting our operating results, and restricting our growth.
The Bank is restricted from paying dividends to us and we are restricted from paying dividends to our shareholders and from making interest payments on our subordinated debt securities. Dividends from the Bank to us comprise our primary source of funds for paying dividends to our shareholders and paying interest on our junior subordinated debentures (the “Junior Subordinated Debentures”), which we issued in connection with sales of trust preferred securities in 2002 and 2004. Pursuant to the FRB Agreement and DFI Order, the Bank may not pay cash dividends to us without the prior approval of the FRBSF and DFI and we may not pay cash dividends to our shareholders or interest on the Junior Subordinated Debentures without the prior approval of the FRBSF. As previously reported, we began to defer interest payments on the Junior Subordinated Debentures in mid-2010, when we were advised by the FRBSF that it would not approve further interest payments pending an improvement in our operating results and increases in the Bank’s capital and we cannot predict when the FRBSF will permit us to resume such payments. We are permitted to defer interest payments on the Junior Subordinated Debentures for up to 20 consecutive quarters; however, if we are not permitted by the FRBSF to pay the deferred interest and resume making interest payments on a current basis by January 2015, then we would be in default of our obligations under the Junior Subordinated Debentures, in which event the entire $17.5 million principal amount of, and accrued but unpaid interest on, the Junior Subordinated Debentures could be declared immediately due and payable.

24
Failure to satisfy the requirements of the FRB Agreement or the DFI Order could subject us to regulatory enforcement actions and additional restrictions on our business. Although we succeeded in satisfying a requirement, under the DFI Order, to increase the Bank’s capital with the net proceeds from the sale of $11.2 million of Series B Preferred Shares in August 2011, we are required to maintain the Bank’s capital ratios and continue to meet other requirements under the DFI Order and the FRB Agreement. There is no assurance that we will be able to do so. If we do not, the FRBSF and DFI could subject us and the Bank to regulatory enforcement actions, which could include the assessment of civil money penalties on us and the Bank, as well as on our directors, officers and other affiliated parties, and impose further restrictions on our business. Any such regulatory actions would increase our operating costs, restrict our ability to grow, make it more difficult for us to recruit officers and directors in the event the need to do so arises in the future, and could result in decreases in our income or cause us to incur losses in the future.
Liquidity risk could adversely affect our ability to fund operations and hurt our financial condition. Liquidity is essential to our business, as we use cash to fund loans and investments and other interest-earning assets and
deposit withdrawals that occur in the ordinary course of our business. Our principal sources of liquidity include deposits, Federal Home Loan Bank borrowings, sales of loans or investment securities held for sale, repayments to the Bank of loans it makes to borrowers and sales of equity securities by us. If our ability to obtain funds from these sources becomes limited or the costs to us of those funds increases, whether due to factors that affect us specifically, including our financial performance or the imposition of regulatory restrictions on us, or due to factors that affect the financial services industry in general, including weakening economic conditions or negative views and expectations about the prospects for the financial services industry as a whole, then, our ability to grow our banking business would be adversely affected and our financial condition and results of operations could be harmed.
We face intense competition from other banks and financial institutions that could hurt our business. We conduct our business operations in Southern California, where the banking business is highly competitive and is
dominated by large multi-state and in-state banks with operations and offices covering wide geographic areas. We also compete with other financial service businesses, mutual fund companies, and securities brokerage and investment banking firms that offer competitive banking and financial products and services as well as products and services that we do not offer. The larger banks and many of those other financial institutions have greater financial and other resources that enable them to conduct extensive advertising campaigns and to shift resources to regions or activities of greater potential profitability. They also have substantially more capital and higher lending limits than we do, which enable them to attract larger customers and offer financial products and services that we are unable to offer, putting us at a disadvantage in competing with them for loans and deposits. Increased competition may prevent us (i) from achieving increases, or could even result in decreases, in our loan volume or deposit balances, or (ii) from increasing interest rates on the loans we make or reducing the interest rates we pay to attract or retain deposits, either or both of which could cause a decline in our interest income or an increase in our interest expense and, therefore, lead to reductions in our net interest income and earnings.
Adverse changes in economic conditions in Southern California could disproportionately harm our business. The substantial majority of our customers and the properties securing a large proportion of our loans are located in
Southern California, where foreclosure rates and unemployment have remained high relative to most other regions of the country. A downturn in economic conditions or the occurrence of natural disasters, such as earthquakes or fires, which are more common in Southern California than in other parts of the country, could harm our business by:
• reducing loan demand which, in turn, would lead to reduced net interest margins and net interest income; • adversely affecting the financial capability of borrowers to meet their loan obligations to us, which could result in
increases in loan losses and require us to make additional provisions for possible loan losses, thereby adversely affecting our operating results or causing us to incur losses, as occurred in 2008, 2009 and 2010; and
• causing reductions in real property values that, due to our reliance on real property to collateralize many of our loans, could make it more difficult for us to prevent losses from being incurred on non-performing loans through the foreclosure and sale of such real properties.
25
Our business is subject to interest rate risk and variations in interest rates may negatively affect our financial performance.
A substantial portion of our income is derived from the differential or “spread” between the interest we earn on loans, securities and other interest-earning assets, and the interest we pay on deposits, borrowings and other interest-bearing liabilities. Due to the differences in the maturities and repricing characteristics of our interest-earning assets and interest-bearing liabilities, changes in interest rates do not produce equivalent changes in interest income earned on interest-earning assets and interest paid on interest-bearing liabilities. Accordingly, fluctuations in interest rates could adversely affect our interest rate spread and, in turn, our profitability. In addition, as a general rule, loan origination volumes are affected by market interest rates. Rising interest rates, generally, are associated with a lower volume of loan originations while lower interest rates are usually associated with higher loan originations. Conversely, in rising interest rate environments, loan repayment rates may decline and in falling interest rate environments, loan repayment rates may increase. Also, in a rising interest rate environment, we may need to accelerate the pace of rate increases on our deposit accounts as compared to the pace of increases in short-term market rates. Accordingly, changes in market interest rates could materially and adversely affect our net interest spread, asset quality and loan origination volume.
However, in the current economic environment, loan demand has been relatively weak despite the fact that interest rates are relatively low, due largely to the financial difficulties encountered by prospective borrowers as a result of the economic recession and the weakness of the hoped for economic recovery, the unwillingness of businesses and consumers to borrow due to uncertainties and a lack of confidence about future economic conditions and a tightening of loan underwriting standards by us, as well as other banks and lending institutions, in response to these conditions. As a result, it has become more difficult to predict the impact that changes in interest rates will have on interest rate spreads and on the future financial performance of banks, including our Bank, which has added to the volatility of and adversely affected the stock prices of many banking institutions, including our own. It is also not possible to predict how long these conditions will continue to affect us.
We also have adopted an interest rate risk management strategy for the purpose of protecting us against interest rate changes after approval and prior to the funding of mortgage loans and their subsequent sale in the secondary market. Developing an effective interest rate risk management strategy, however, is complex and no risk management strategy can completely insulate us from risks associated with interest rate changes. Pursuant to that strategy, during the first quarter of 2012, we began purchasing mortgaged backed to-be-announced (“TBA”) securities as a hedge against possible market interest rate movements during those periods. TBA securities are deemed to be derivatives and involve off-balance sheet financial risk that can arise from changes in (i) the volume of mortgage loans that we originate, (ii) market rates of interest, and (iii) the values of the financial instruments underlying these hedges, all of which our outside of our control. In addition, hedging against interest rate risks involves transaction costs which could reduce our income and there is no that we will not suffer the kinds of adverse consequences that our hedging transactions are intended to prevent. Moreover, we could incur losses if a provider of derivatives that we purchase becomes financially unsound or insolvent, forcing us to unwind those derivatives.
Government regulations may impair our operations, restrict our growth or increase our operating costs. We are subject to extensive supervision and regulation by federal and state bank regulatory agencies. The primary
objective of these agencies is to protect bank depositors and other customers and consumers and not shareholders, whose respective interests often differ. The regulatory agencies have the legal authority to impose restrictions which they believe are needed to protect depositors and customers of banking institutions, even if those restrictions would adversely affect the ability of the banking institution to expand its business or pay cash dividends, or result in increases in its costs of doing business or hinder its ability to compete with less regulated financial services companies. Additionally, due to the complex and technical nature of many of the government regulations to which banking organizations are subject, inadvertent violations of those regulations may and sometimes do occur. In such an event, we would be required to correct or implement measures to prevent a recurrence of such violations. If more serious violations were to occur, the regulatory agencies could limit our activities or growth or fine us, or ultimately put us out of business in the event we were to encounter severe liquidity problems or a significant erosion of our capital below the minimum amounts required under applicable bank regulatory guidelines.

26
The enactment of the Dodd-Frank Act poses uncertainties for our business and is likely to increase our costs of doing business in the future.
On July 21, 2010, the President signed the Dodd-Frank Act into law. Changes made by the Dodd-Frank Act include, among others: (i) new requirements on banking, derivative and investment activities, including modified capital requirements, the repeal of the prohibition on the payment of interest on business demand accounts, and limitations on debit card interchange fees; (ii) enhanced financial institution safety and soundness regulations and increases in assessment fees and deposit insurance coverage; (iii) corporate governance and executive compensation requirements; and (iv) the establishment of new regulatory bodies, such as the Bureau of Consumer Financial Protection (the “BCFP”). The BCFP has been granted rulemaking authority over several federal consumer financial protection laws and, in some instances, has the authority to examine and enforce compliance by banks and other financial service organizations with these laws and regulations. Certain provisions of the Dodd-Frank Act were made effective immediately; however, much of the Dodd-Frank Act is subject to further rulemaking and/or studies. As a result, we cannot fully assess the impact that the Dodd-Frank Act will have on us until final rules are adopted and implemented.
We expect that the provisions of the Dodd-Frank Act repealing the prohibition on the payment by banks of interest on business demand deposits will result in price competition among banks for such deposits, which could increase the costs of funds to us (as well as to other banks) and result in a reduction in our net interest income in the future. However, we do not have sufficient information, as yet, to make any reliable predictions as to the impact that these provisions will have on our results of operations and financial performance in the future. See “BUSINESS — Economic Conditions and Recent Legislation and Other Government Actions — The Dodd-Frank Act” in Item 1 of this Report.
The Dodd-Frank Act also permits states to adopt consumer protection laws and standards that are more stringent than those adopted at the federal level and permits state attorneys general to, in certain circumstances, enforce compliance with both the state and federal laws and regulations. We cannot predict whether California state agencies will adopt consumer protection laws and standards that are more stringent than those adopted at the federal level or, if any are adopted, what impact they may have on us, our business or operating results.
Premiums for federal deposit insurance have increased and may increase even more. The FDIC uses the Deposit Insurance Fund (the “DIF”) to cover insured deposits in the event of bank failures, and
maintains the DIF by assessing insurance premiums on FDIC-insured banks and depository institutions. The increase in bank failures during the three years ended December 31, 2010 caused the DIF to fall below the minimum balance required by law, forcing the FDIC to raise the insurance premiums assessed on FDIC-insured banks in order to rebuild the DIF. Depending on the frequency and severity of bank failures in the future, the FDIC may further increase premiums or assessments, which would increase our costs of business and could negatively affect our earnings and financial performance in the future.
The expiration of unlimited FDIC insurance on noninterest-bearing transaction accounts may increase our interest expense.
In October 2008, the FDIC announced the Transaction Account Guarantee Program to strengthen confidence and encourage liquidity in the banking system. Under that Program, the FDIC fully insured, without limit, qualifying transaction deposit accounts held at qualifying depository institutions through December 31, 2010. Qualifying transaction accounts included non-interest-bearing transaction accounts, Interest on lawyers trust accounts (“IOLTAs”), and negotiable orders of withdrawal (commonly referred to as “NOW Accounts”) with interest rates less than 0.5%. This Program expired on December 31, 2012. As a result, from and after January 1, 2013, the FDIC’s deposit insurance limit will be $250,000 per deposit account. This reduction in FDIC insurance could cause some depositors to move funds previously held in such noninterest-bearing accounts to interest-bearing accounts, which could increase our costs of funds and negatively impact our results of operations or to withdraw their deposits and invest the funds in investments perceived as being more secure, such as securities issued by the United States Treasury. As a result, it could become necessary for us to pay higher rates of interest to retain such deposits, which could adversely affect our net interest income and our earnings.
The loss of key personnel could hurt our financial performance. Our success depends to a great extent on the continued availability of our existing management and, in particular, on
Raymond E. Dellerba, our President and Chief Executive Officer. In addition to their skills and experience as bankers, our executive officers provide us with extensive community ties upon which our competitive strategy is partially based. As a result, the loss of the services of any of these officers could harm our ability to implement our business strategy or our future operating results.

27
Risks posed by our residential mortgage lending business. Our residential mortgage lending business, pursuant to which we originate residential real estate mortgage loans that
qualify for resale into the secondary mortgage market, poses a number of potentially significant risks that could adversely affect our business and future financial performance.
Those risks include, among others: the risk that the growth of our mortgage lending business will strain our cash and management resources; the risk that management’s time and efforts will be diverted from our commercial banking business, which could hurt our operating results; the risk that our mortgage lending business will not generate revenues in amounts sufficient to enable us to recover the substantial expenditures we have made to add experienced mortgage loan officers and administrators; the risk that our residential mortgage lending business will not grow sufficiently to contribute to earnings in relation to our investment; the risk that we will be unable to sell the mortgage loans we originate into the secondary mortgage market at a profit due to changes in interest rates or a reduction in the flow of funds into the secondary mortgage market, whether due to a weakening in the residential real estate market or a tightening in the availability of credit or otherwise; the risk that we will be required to repurchase mortgage loans in the event that they do not conform to representations and warranties we made with respect to such loans at the time of their sale, or borrowers default on the first few mortgage loan payments; the risks that there will be a decline in demand for residential mortgage loans or an increase in defaults by borrowers, due to increasing interest rates, an economic downturn, or declining real estate values, and due to the complexity of government regulations and disclosure requirements that apply to residential mortgage lending, inadvertent violations of those laws and regulations may and sometimes do occur. In the event of any such violations, we would be required to correct and implement measures to prevent their recurrence and, depending on the seriousness of the violations, regulatory agencies could place restrictions on the scope of our mortgage lending activities or fine us, or both. Accordingly, there is no assurance that our residential mortgage lending business will not hurt our earnings or cause us to incur losses in the future.
Our recent exit from the wholesale mortgage business could adversely affect our results of operations in the future. Based on a review of our mortgage banking operations, we decided to focus our mortgage banking business entirely on
our direct-to-consumer retail channel and, therefore, we exited the wholesale mortgage banking channel effective August 31, 2012, in order (i) to redeploy some of our capital resources committed to the wholesale mortgage business to our core commercial lending business, (ii) to reduce and control our staffing costs and operating expenses and (iii) to manage and limit interest rate and other risks inherent in the wholesale mortgage lending business. However, there is no assurance that our exit from the wholesale mortgage business will enable us to accomplish these purposes. Moreover, we expect our exit from the wholesale mortgage business will result in reductions, which could be significant, in our mortgage banking revenues, which could hurt our earnings or cause us to incur losses beginning in 2013 and possibly thereafter.
We may be unable to resume the implementation of our strategy to grow our banking franchise in the future. A key element of our business strategy has been to grow our banking franchise primarily by (i) opening new banking
offices, (ii) offering new revenue generating products or services, such as the commencement, in the second quarter of 2010, of our mortgage banking operations, and (iii) adding banking professionals at our existing banking offices, with the objective of attracting additional customers including, in particular, small-to-medium size businesses, that would add to our profitability. Due to the losses we incurred during the three years ended December 31, 2010, the restrictions placed on us under the FRB Agreement and DFI Order, the need to dedicate more personnel to the management and reduction of non-performing loans, and our increased focus on raising additional capital and returning the Bank to profitability, we have had to significantly curtail our growth strategy and we cannot predict how long it will be before we will able to resume the implementation of that strategy.
Expansion of our banking franchise might not achieve expected growth or increases in profitability and may adversely affect our future operating results.
We intend to resume the implementation of our growth strategy at such time as we are permitted to do so by the FRBSF and DFI However, the resumption of our growth strategy, either through organic growth or the acquisition of other banks, will pose a number of risks for us, including:
• the risk that any newly established banking offices will not generate revenues in amounts sufficient to cover the costs of those offices, which would reduce our income or cause us to incur operating losses;
• the risk that any bank acquisitions we might consummate in the future will prove not to be accretive to or may reduce our earnings if we do not realize anticipated cost savings or if we incur unanticipated costs in integrating the acquired banks into our operations or a substantial number of the customers of the acquired banks move their banking business to our competitors;

28
• the risk that such expansion efforts will divert management time and effort from our existing banking operations, which could adversely affect our future financial performance; or
• the risk that the additional capital we may need to support our growth or the issuance of shares in any bank acquisitions will be dilutive to the share ownership of our existing shareholders.
We rely on communications, information, operating and financial control systems technology from third-party service providers, and we may suffer an interruption in those systems.
We rely heavily on third-party service providers for much of our communications, information, operating and financial control systems technology, including our online banking services and data processing systems. Any failure or interruption, or breaches in security, of these systems could result in failures or interruptions in our customer relationship management, general ledger, deposit, servicing and/or loan origination systems and, therefore, could harm our business, operating results and financial condition. Additionally, interruptions in service and security breaches could lead existing customers to terminate their banking relationships with us and could make it more difficult for us to attract new banking customers.
We are exposed to risk of environmental liabilities with respect to real properties which we may acquire. Due to the continued weakness of the U.S. economy and, more specifically, the California economy, including high
levels of unemployment and the continuing declines in real estate values, many borrowers have been unable to meet their loan repayment obligations and, as a result, we have had to initiate foreclosure proceedings with respect to and take title to an increased number of real properties that had collateralized their loans. Moreover, if the economic conditions remain weak or worsen, we may have to continue to foreclose and take title to additional real properties. As an owner of such properties, we could become subject to environmental liabilities and incur substantial costs for any property damage, personal injury, investigation and clean-up that may be required due to any environmental contamination that may be found to exist at any of those properties, even though we did not engage in the activities that led to such contamination. In addition, if we are the owner or former owner of a contaminated site, we may be subject to common law claims by third parties seeking damages for environmental contamination emanating from the site. If we were to become subject to significant environmental liabilities or costs, our business, financial condition, results of operations and prospects could be adversely affected.
Managing reputational risk is important to attracting and maintaining customers, investors and employees. Threats to our reputation can come from many sources, including adverse sentiment about financial institutions
generally, unethical practices, employee misconduct, failure to deliver minimum standards of service or quality, compliance deficiencies and questionable or fraudulent activities of our customers. We have policies and procedures in place to promote ethical conduct and protect our reputation. However, these policies and procedures may not be fully effective. Negative publicity regarding our business, employees, or customers, with or without merit, may result in the loss of customers, investors and employees, costly litigation, a decline in revenues and increased governmental regulation.
The price of our common stock may be volatile or may decline, which may make it more difficult to realize a profit on your investment in our shares of common stock.
The trading prices of our common stock may fluctuate widely as a result of a number of factors, many of which are outside our control. In addition, our stock price has not only been volatile, but also has declined significantly during the three years ended December 31, 2010, due to the losses we incurred during that period and uncertainties about how long it will take us to achieve sustained profitability. Moreover our stock price in the future could be adversely affected by other factors, some of which are outside of our control, including:
• quarterly fluctuations in our operating results or financial condition; • failure to meet analysts’ revenue or earnings estimates; • the restrictions, described below, on our ability to pay cash dividends on our common stock; • the imposition of additional regulatory restrictions on our business and operations or an inability to meet
regulatory requirements such as those contained in the FRB Agreement and DFI Order; • an inability to resume our growth strategy in the near term or to successfully implement that strategy in
the future; • strategic actions by us or our competitors, such as acquisitions or restructurings; • fluctuations in the stock prices and operating results of our competitors; • general market conditions and, in particular, developments related to market conditions for the financial services
industry stocks;

29
• proposed or newly adopted legislative or regulatory changes or developments aimed at the financial services industry;
• any future proceedings or litigation that may involve or affect us; and • continuing concerns and a lack of confidence among investors that economic and market conditions
will improve.
We are currently restricted from paying dividends, and do not anticipate paying any cash dividends on our common stock for the foreseeable future.
Dividends from the Bank will be the principal source of funds available to us to pay cash dividends to our shareholders in the future. However, as described above, pursuant to the FRB Agreement and DFI Order, the Bank may not pay cash dividends to us without the prior approval of the FRB and DFI and we may not pay cash dividends to our shareholders without the prior approval of the FRB. There is no assurance when those restrictions might be lifted, if at all. Additionally, we and the Bank are subject to additional restrictions which currently and in the future may prevent us from paying cash dividends on our common stock:
• As described above, we began deferring interest payments on our Junior Subordinated Debentures in mid-2010. Under the terms of the indentures governing the Junior Subordinated Debentures, we are precluded from paying cash dividends on our common stock or preferred stock unless and until we have paid all of the deferred interest in full and thereafter make interest payments on the Junior Subordinated Debentures as and when they become due.
• No dividends may be declared or paid on shares of our common stock unless we first pay dividends to the holders of the outstanding shares of our preferred stock. There is no assurance if or when we will be able to pay such dividends on our preferred stock, however.
• California laws also place restrictions on the ability of California corporations to pay cash dividends on preferred or common stock. Subject to certain limited exceptions, a California corporation may pay cash dividends only to the extent of (i) the amount of its retained earnings or (ii) the amount by which the fair value of the corporation’s assets exceeds its liabilities. Although the fair value of our assets exceeded our liabilities at December 31, 2012, due to the restrictions under the FRB Agreement and DFI Order which preclude us from paying dividends to shareholders and interest on the Junior Subordinated Debentures and the Bank from paying dividends to us, as well as the dividend preference of the holders of our outstanding preferred stock, there is no assurance as to when we might be able to pay dividends on our common stock in the future.
Finally, even if the regulatory and other restrictions on the payment of dividends by us and the Bank are lifted and we generate retained earnings in the future, it is our intention to retain cash to increase our capital and fund our operations and the expansion of our banking franchise. As a result, we have no intention to pay cash dividends at least for the foreseeable future on our common stock.
Our principal shareholders and management own a significant percentage of our voting shares and are able to exercise significant influence over our business and have the power to block transactions that could benefit our other shareholders.
As a result of our sale of a total of 4,201,278 shares of common stock to Carpenter Community Bancfund, L.P. and Carpenter Community Bancfund-A, L.P. (collectively, the “Carpenter Funds”) in April 2012, the Carpenter Funds currently own a total of approximately 26% of our outstanding shares of voting stock and together constitute our largest shareholder. As previously reported, we also have entered into an agreement with the Carpenter Funds, effective as of February 27, 2013, to sell them up to an additional 2,222,222 shares of common stock, at a price of $6.75 per share in cash, which would increase the Carpenter Funds’ ownership to approximately 34% of our outstanding shares of voting stock. Further, as previously reported in our Current Report on Form 8-K dated February 28, 2012, pursuant to an investor rights agreement entered into with the Carpenter Funds, three individuals designated by the Carpenter Funds have been appointed to serve on the respective Boards of Directors of both the Company and the Bank. As a result, the Carpenter Funds have the ability to significantly influence the outcome of matters requiring approval of our Board of Directors and matters requiring the approval of our shareholders. Consequently, the Carpenter Funds have significant influence over our operations and outcome of shareholder votes on the approval of mergers and acquisitions or changes in corporate control which, among other things, could (i) discourage potential acquirers from attempting to acquire the Company, thereby impeding or preventing the consummation of acquisition or change of control transactions in which our shareholders might otherwise receive a premium for their shares, and (ii) make it more difficult for us to sell additional shares at prices in excess of those paid by the Carpenter Funds for their shares of common stock, even if our financial performance significantly improves.

30
If we sell additional shares of our common stock in the future, our shareholders could suffer significant dilution in their share ownership and voting power.
Subject to market conditions and other factors, we may pursue sales of additional common stock or other equity financings in the future to meet capital requirements or support the growth of our business. Sales of such additional common stock or other equity securities could be dilutive of our existing shareholders depending largely on the prices at which, and the number of, additional shares of common stock or other equity securities we may sell.
Additionally, at December 31, 2012, a total of 112,000 shares of our Series B Convertible 8.4% Preferred Stock (the “Series B Shares”) were outstanding. Those Series B Shares are convertible, at the option of the holders of such Shares, into a total of 2,105,262 shares of our common stock at a conversion price of $5.32 per share. The holders of the Series B Shares also are entitled to receive dividends payable in cash at a rate of 8.4% per annum if, as and when declared by the Board of Directors. However, the terms of the Series B Shares provide that, if due to legal or regulatory restrictions, we are unable to pay cash dividends on those Shares for two semi-annual dividend periods, we would be required to pay such dividends in shares of Series C Preferred Stock (“Series C Shares”). Due to the dividend restrictions under California law and the FRB Agreement, we were precluded from paying cash dividends on the Series B Shares in either of the six month periods ended June 30, 2012 and December 31, 2012, respectively, and, as a result, we issued a total of 12,803 Series C Shares as dividends on our outstanding Series B Preferred Shares during 2012. We also expect that, due to the same dividend restrictions, it will be necessary for us to continue issuing Series C Shares, in lieu of cash dividends on the Series B Shares at least in 2013 and possibly for some time thereafter.
The holders of the Series C Shares also are entitled to receive dividends payable in cash at a rate of 8.4% per annum if, as and when declared by the Board of Directors and if the Company is unable to pay such cash dividends for two semi-annual dividend periods, then we would be required to pay such dividends in additional Series C Shares.
Also, at December 31, 2012 (i) options to purchase a total of 1,566,965 shares of our common stock, at an average exercise price of $6.90 per share were outstanding, and an additional 115,494 shares were available for future grants of options or other equity incentives, under our 2010 Equity Incentive Plan; and (ii) warrants to purchase a total of 761,278 shares of our common stock, at an exercise price of $6.26 per share, issued to SBAV LP and the Carpenter Funds in connection with their purchases of Series B Shares and shares of common stock in 2011 and 2012, respectively, also were outstanding. However those warrants will not become exercisable unless the Company completes an acquisition, prior to April 23, 2016, of a bank with assets of at least $250 million.
The issuance of shares of our common stock on the conversion of the Series B Shares and the issuance of shares of Series C Preferred Stock as dividends on the Series B Shares and Series C Shares, as well as the issuance of shares of our common stock on the exercise of outstanding options, warrants or any other equity incentives that we may grant in the future may dilute the investments of other shareholders in the Company.
Our articles of incorporation permit our Board of Directors to authorize and sell additional shares of preferred stock on terms that could discourage a third party from making a takeover offer that may be beneficial to our shareholders.
Our Board of Directors has the power, under our articles of incorporation, to create and authorize the sale of one or more new series of preferred stock without having to obtain shareholder approval for such action. As a result, the Board could authorize the issuance of and issue shares of a new series of preferred stock to implement a shareholders rights plan (often referred to as a “poison pill”) or could sell and issue preferred shares with special voting rights or conversion rights that could deter or delay attempts by our shareholders to remove or replace management, and attempts of third parties to engage in proxy contests and effectuate changes in control of us.
Our business may face other risks. Our business and financial performance could be materially and adversely affected in the future by other risks or
developments that either are not known to us at the present time or are currently immaterial to our business. Such risks could include, but are not necessarily limited to, unexpected changes in government regulations, the commencement of litigation against us and unexpected adverse changes in local, national or global economic or market conditions.
For further discussion of risks that can affect our financial performance or financial condition, also see “Item 7. — Management’s Discussion and Analysis of Financial Condition and the Results of Operations” below in this Report.
Due to these and other possible uncertainties and risks, you are cautioned not to place undue reliance on the forward looking statements contained in this Report, which speak only as of the date of this Report. We also disclaim any obligation to update or revise forward-looking statements contained in this Report, except as may be required by law or by NASDAQ.

31
ITEM 1B. UNRESOLVED STAFF COMMENTS None.
ITEM 2. PROPERTIES Set forth below is information regarding our headquarters office and our seven existing financial services centers. All
of our offices are leased. We believe that our current facilities are sufficient for our company, if headcount increases above capacity we may need to lease additional space.
Location Square Footage
Lease Expiration Date
Headquarters Offices and Online Banking Facility:Costa Mesa, California ................................................. 21,000 May, 2016
Mortgage Banking Division: Costa Mesa, California ................................................. 13,300 January, 2015
Financial Centers: Costa Mesa, California ................................................. 3,000 June, 2016 Newport Beach, California ........................................... 10,500 June, 2016 San Juan Capistrano, California ................................... 7,600 April, 2013 Beverly Hills, California .............................................. 4,600 August, 2016 La Jolla, California ....................................................... 3,800 February, 2017 La Habra, California ..................................................... 6,000 January, 2013 Ontario, California ....................................................... 5,000 Month to Month
ITEM 3. LEGAL PROCEEDINGS Mark Zigner vs. Pacific Mercantile Bank, et al., filed in January, 2010, in the California Superior Court for the County
of Orange (Case No. 0337433). This lawsuit was filed by plaintiff asserting that the Bank had wrongfully exercised its right to recover borrowings owed by plaintiff to the Bank by setting off those borrowings against plaintiff’s deposit accounts with the Bank. The plaintiff also asserted certain related claims, including an alleged breach by the Bank of the covenant of good faith and fair dealing.
The case was tried before a jury in August, 2011. However (i) before the case went to the jury for a decision, the trial judge ruled that the Bank had wrongfully exercised its set off rights and based on that finding, the jury awarded plaintiff $100,000 of compensatory damages, and (ii) the jury later found that the Bank’s exercise of its set off rights also constituted a wrongful conversion of plaintiff’s funds and awarded the plaintiff $150,000 in compensatory damages and $950,000 in punitive damages against the Bank. In addition, the trial court entered an award to plaintiff of his attorney’s fees and costs, in the amount of $762,000.
Following the entry of the final judgment by the trial court in February 2012, the Bank filed an appeal of the trial court’s rulings and the jury verdict, asserting that those rulings and the jury’s verdict were erroneous and that plaintiff is not entitled, as a matter of law, to an award of either compensatory or punitive damages. Because the appeals process has just begun, it is not possible at this time to predict, with any certainty, how the appellate courts will ultimately rule on our appeal. However, we believe that the judgment entered by the court against the Bank should be overturned on appeal.
Other Legal Actions. We are subject to legal actions that arise from time to time in the ordinary course of our business. Currently there are no such pending legal proceedings that we believe will have a material adverse effect on our financial condition or results of operations.
ITEM 4. EXECUTIVE OFFICERS OF THE REGISTRANT Set forth below is information, as of January 26, 2012, regarding our principal executive officers:
Name and Age
Positions with Bancorp and the Bank
Raymond E. Dellerba, 65 ...... President and Chief Executive Officer of the Company and the Bank Nancy Gray, 62 ..................... Senior Executive Vice President and Chief Financial Officer of the Company and the BankThomas M. Vertin, 59 ........... President of Commercial Banking Division of the BankRobert W. Bartlett, 66 ........... Senior Executive Vice President and Chief Operating Officer of the Bank Michael G. Green, 61 ............ Executive Vice President and Chief Credit Officer of the Bank
There is no family relationship between the above-named officers.

32
Raymond E. Dellerba has served as President, Chief Executive Officer and a Director of the Company and the Bank since the dates of their inception, which were January 2000 and November 1998, respectively, pursuant to a multi-year employment agreement. From February 1993 to June 1997, Mr. Dellerba served as the President, Chief Operating Officer and director of Eldorado Bank, and as Executive Vice President and a Director of its parent company, Eldorado Bancorp. Mr. Dellerba has 42 years of experience as a banking executive, primarily in Southern California and in Arizona.
Nancy Gray, who is a certified public accountant, has been a Senior Executive Vice President and the Chief Financial Officer of the Company and the Bank since May 2002. From 1980 through 2001, Ms. Gray was Senior Vice President and Financial Executive of Bank of America in Southern California, Missouri, Georgia, and Texas.
Thomas M. Vertin, joined Pacific Mercantile Bank as its President of the Commercial Bank Division on September 29, 2012. Mr. Vertin held senior executive positions at Silicon Valley Bank, including Chief Operating Officer. Prior to that position, he led the California Division with direct responsibility for half of the bank’s revenues. During his 18 years with Silicon Valley Bank, he focused on revenue growth, sales management, client retention, team development and enterprise management. Mr. Vertin led turnarounds of units that included the nationwide asset-based lending business.
Robert W. Bartlett, joined Pacific Mercantile Bank as its Senior Executive Vice President and Chief Operating Officer on October 31, 2008. In his banking career spanning some 34 years, Mr. Bartlett has held key senior management positions in Orange and Los Angeles County banks including Commercial Banking Manager, Area Credit Administrator, Chief Credit Officer and Chief Operating Officer.
Michael G. Green, joined Pacific Mercantile Bank as its Executive Vice President and Chief Credit Officer on April 6, 2009. In 2002, Mr. Green was the Senior Credit Administrator for Central Pacific Bank in California, setting up four loan production offices and a central documentation and processing department for the bank’s commercial real estate and interim construction lending.

33
PART II
ITEM 5. MARKET FOR REGISTRANT’S COMMON EQUITY, RELATED STOCKHOLDER MATTERS AND ISSUER REPURCHASES OF EQUITY SECURITIES
Trading Market for the Company’s Shares Our common stock is traded on the NASDAQ Global Select Market under the symbol “PMBC.” The following table
presents the high and low sales prices of our common stock, as reported on the NASDAQ Global Select Market, for each of the calendar quarters indicated below:
High
Low
Year Ended December 31, 2012
First Quarter .................................................................................................... $ 5.49 $ 3.15 Second Quarter ................................................................................................ $ 7.29 $ 5.12 Third Quarter ................................................................................................... $ 7.30 $ 6.35 Fourth Quarter ................................................................................................. $ 7.26 $ 5.31
Year Ended December 31, 2011
First Quarter .................................................................................................... $ 4.72 $ 3.69 Second Quarter ................................................................................................ $ 4.44 $ 3.11 Third Quarter ................................................................................................... $ 4.54 $ 3.31 Fourth Quarter ................................................................................................. $ 3.50 $ 2.94
The high and low per share sale prices of our common stock on the NASDAQ Global Select Market on March 7, 2013, were $5.91 and $6.10 per share, respectively and, as of that same date, there were approximately 148 holders of record of our common stock.

34
Stock Price Performance The following graph compares the stock performance of our common stock, in each of the years in the five year period
ended December 31, 2012, with: (i) the Russell Microcap Index, which measures the performance of the smallest 1,000 securities in the small-cap Russell 2000 Index, plus the next smallest eligible securities by market cap, (ii) the Russell 2000 Index, which measures the performance of the smallest 2,000 members, by market cap, of the Russell 3,000 Index, and (iii) an index published by SNL Securities L.C. (“SNL”) and known as the SNL Western Bank Index, which is comprised of 51 banks and bank holding companies (including the Company), the shares of which are listed on NASDAQ or the New York Stock Exchange and most of which are based in California and the remainder of which are based in nine other western states. The Russell 2000 Index is being included in the graph this year because, in 2012, the Company became a member of that Index and ceased to be a member of the Russell Microcap Index.
(1) The source of the above graph and chart is SNL Securities, L.C. (“SNL”).
Period Ending
Index 12/31/07 12/31/08 12/31/09 12/31/10
12/31/11 12/31/12
Pacific Mercantile Bancorp ........................................... 100.00 40.20 24.78 30.44 26.75 51.60 Russell Microcap Index ................................................. 100.00 59.65 77.08 99.79 90.28 108.89 Russell 2000 Index ........................................................ 100.00 66.21 84.20 106.82 102.36 119.09 SNL Western Bank Index .............................................. 100.00 97.37 89.41 101.31 91.53 115.50
The Stock Performance Graph assumes that $100 was invested in Company common stock on December 31, 2007, and, at that same date, in the Russell Microcap Index, the Russell 2000 Index and the SNL Western Bank Index and that any dividends paid in the indicated periods were reinvested. Shareholder returns shown in the Performance Graph are not necessarily indicative of future stock price performance.
12/31/07 12/31/08
Total Return Performance
Ind
ex V
alu
e
12/31/09 12/31/10 12/31/11 12/31/120
25
50
75
100
125
150
Pacific Mercantile Bancorp
SNL Western Bank Index
Russell Microcap Index
Russell 2000 Index

35
Dividend Policy and Restrictions on the Payment of Dividends Our Board of Directors has followed the policy of retaining earnings to maintain capital and, thereby, support the
growth of the Company’s banking franchise. On occasion, the Board also considered paying cash dividends out of cash generated in excess of those capital requirements and, in February 2008, the Board of Directors declared a cash dividend, in the amount of $0.10 per share of common stock, that was paid on March 14, 2008.
The Board also authorized share repurchase programs in June 2005 and in October 2008, when the Board concluded that, at the then prevailing market prices, the Company’s shares represented an attractive investment opportunity and, therefore, that share repurchases would be a good use of Company funds. However, no shares have been repurchased under these programs since 2008.
In the first quarter of 2009, the Board of Directors decided that the prudent course of action, in light of the economic recession, was to preserve cash and earnings to enhance the Bank’s capital position and to be in a position to take advantage of improved economic and market conditions in the future.
In addition, the FRB Agreement provides that we may not pay cash dividends to our shareholders without the prior approval of the FRBSF and we do not expect to be able to obtain such approval until we significantly reduce our nonperforming assets and generate earnings on a sustainable basis. As a result, we do not expect to pay cash dividends or make share purchases at least for the foreseeable future. See “Item 1 – BUSINESS – Supervision and Regulation – Pacific Mercantile Bancorp — Regulatory Action Taken by the FRBSF and the DFI.”
Cash dividends from the Bank represent the principal source of funds available to the Bancorp for paying which it might use to pay cash dividends to shareholders. Therefore, government regulations, including the laws of the State of California, as they pertain to the payment of cash dividends by California state chartered banks, limit the amount of funds that the Bank would be permitted to dividend to the Bancorp. As a result, those laws also affect the ability our to pay cash dividends to our shareholders. In particular, under California law, cash dividends by a California state chartered bank may not exceed, in any calendar year, the lesser of (i) the sum of its net income for the year and its retained net income from the preceding two years (after deducting all dividends paid during the period), or (ii) the amount of its retained earnings.
Moreover, as a California corporation, the Company’s ability to pay cash dividends is subject to restrictions under the California Corporations Code. Those restrictions provide that a California corporation may pay a cash dividend (a) if the amount of the dividend does not exceed the sum of the corporation’s retained earnings plus (ii) the amount, if any, of dividends in arrears on shares which have preferential dividend rights over the rights of shareholders that will be receiving the dividend; or (b) if, immediately after the dividend is paid, the greater of the book or fair value of the corporation’s assets equals or exceeds the sum of (i) its total liabilities plus (ii) the liquidation preference of any shares which have a preference upon dissolution over the rights of shareholders receiving the dividend.
Additionally, because the payment of cash dividends has the effect of reducing capital, the capital requirements imposed on bank holding companies and commercial banks often operate, as a practical matter, to preclude the payment, or limit the amount of, cash dividends that might otherwise be permitted by California law; and the federal bank regulatory agencies, as part of their supervisory powers, generally require insured banks to adopt dividend policies which limit the payment of cash dividends much more strictly than do applicable state laws. Also, as discussed above, we are prohibited, by the FRB Agreement, from making interest payments on the junior subordinated debentures we issued in 2002 and 2004 and, as a result, we have had to defer interest payments on those debentures. Under the terms of those debentures, we may not pay cash dividends on our common stock or preferred stock unless and until we have paid all of the deferred interest in full and thereafter make interest payments on the debentures as and when they become due. See “MANAGEMENT’S DISCUSSION AND ANALYSIS OF FINANCIAL CONDITION AND RESULTS OF OPERATION —Contractual Obligations—Junior Subordinated Debentures” in Item 7 of this Report for additional information regarding the junior subordinated debentures.
The holders of our Series B shares and Series C Shares are entitled to receive dividends payable in cash at a rate of 8.4% per annum if, as and when declared by the Board of Directors. If, however, due to legal or regulatory restrictions, such as the dividend restrictions under California law or under the FRB Agreement, the Company is unable to pay cash dividends on the Series B Shares or the Series C Shares for two semi-annual dividend periods, then the Company is required to pay such dividends in Series C Shares. Because we were not able to obtain the approval of the FRBSF to pay cash dividends on the Series B Shares in 2012, we issued a total of 12,083 Series C Shares in lieu of those cash dividends in 2012 and in the future we will be required to issue additional Series C Shares as dividends on the Series B Shares and on all previously issued Series C Shares until such time as we are able to obtain the approval of the FRBSF to pay cash dividends on the Series B Shares and the Series C Shares from time to time outstanding. The issuance of Series C Shares will be dilutive of the investments which our existing common shareholders have in the Company due to the preferential rights that the Series C Shares have with respect the payment of dividends and the receipt of cash payments that may be made to our shareholders upon a sale or other acquisition of the Company. In addition, no dividends may be declared or paid on shares of the Company’s common stock unless dividends are first paid (either in cash or in shares of Series C Preferred Stock) on the shares of Series B Preferred Stock and any shares of Series C Preferred Stock that may have been issued and are then outstanding.

36
Accordingly, we do not expect to pay cash dividends for the forseeable future.
Restrictions on Inter-Company Transactions Section 23(a) of the Federal Reserve Act limits the amounts that a bank may loan to its bank holding company to an
aggregate of no more than 10% of the bank subsidiary’s capital surplus and retained earnings and requires that such loans be secured by specified assets of the bank holding company—See “BUSINESS—Supervision and Regulation–Restrictions on Transactions between the Bank and the Company and its other Affiliates”. We do not have any present intention to obtain any borrowings from the Bank.
Equity Compensation Plans Certain information, as of December 31, 2012, with respect to our equity compensation plans is set forth in Item 12, in
Part III, of this Report.
ITEM 6. SELECTED CONSOLIDATED FINANCIAL DATA The selected statement of operations data for the fiscal years ended December 31, 2012, 2011 and 2010, the selected
balance sheet data as of December 31, 2012 and 2011, and the selected financial ratios (other than tangible book value per share), that follow below were derived from our audited consolidated financial statements included in Item 8 of this Report and should be read in conjunction with those audited consolidated financial statements, together with the notes thereto, and with Management’s Discussion and Analysis of Financial Condition and Results of Operations set forth in Item 7 of this Report. The selected statement of operations data for the years ended December 31, 2009 and 2008, the selected balance sheet data as of December 31, 2010, 2009 and 2008, and the selected financial ratios (other than tangible book value per share) for the periods prior to January 1, 2011 are derived from audited consolidated financial statements that are not included in this Report.
Year Ended December 31,
2012 2011 2010 2009
2008
(Dollars in thousands except per share data) Selected Statement of Operations Data:
Total interest income ........................................ $ 41,814 $ 44,290 $ 50,919 $ 51,644 $ 61,611 Total interest expense ....................................... 8,543 11,099 18,081 29,883 34,498
Net interest income ........................................... 33,271 33,191 32,838 21,761 27,113 Provision for loan losses ................................... 1,950 (833) 8,288 23,673 21,685
Net interest income (loss) after provision for loan losses .................................................... 31,321 34,024 24,550 (1,912) 5,428
Noninterest income ........................................... 28,493 8,229 6,771 5,522 2,606 Noninterest expense .......................................... 53,124 37,054 36,317 33,251 23,702
Income (loss) before income taxes ................... 6,690 5,199 (4,996) (29,641) (15,668)Income tax expense (benefit) ............................ (2,964) (6,433) 8,958 (12,333) (3,702)
Net income (loss) ........................... $ 9,654 $ 11,632 $ (13,954) $ (17,308) $ (11,966)Accumulative declared dividends
on preferred stock ..................... (941) — — — — Accumulative undeclared
dividends on preferred stock ..... (17) (440) (1,075) (61) —
Net income (loss) available allocable to common shareholders .............................. $ 8,696 $ 11,192 $ (15,029) $ (17,369) $ (11,966)
Per share data-basic:
Net income (loss)—basic ........................ $ 0.57 $ 0.99 $ (1.44) $ (1.66) $ (1.14)
Per share data-diluted:
Net income (loss)—diluted ..................... $ 0.55 $ 0.98 $ (1.44) $ (1.66) $ (1.14)
Weighted average shares outstanding
Basic ........................................................ 15,386,106 11,361,389 10,434,665 10,434,665 10,473,476 Diluted ..................................................... 17,674,974 11,371,524 10,434,665 10,434,665 10,473,476
Dividends per share .......................................... — — — — $ 0.10

37
December 31,
2012 2011 2010 2009
2008
(Dollars in thousands except for per share information)Selected Balance Sheet Data:
Cash and cash equivalents(1) .................. $ 128,208 $ 96,467 $ 32,678 $ 141,651 $ 107,133 Total loans(2)........................................... 719,257 641,962 722,210 813,194 828,041 Total assets ............................................ 1,053,941 1,024,552 1,015,870 1,200,636 1,164,059 Total deposits ........................................ 845,395 862,047 816,226 960,438 821,686 Junior subordinated debentures ............. 17,527 17,527 17,527 17,527 17,527 Total shareholders’ equity ..................... 122,876 86,625 63,416 74,472 84,232 Tangible book value per share(3) ............ $ 6.75 $ 6.26 $ 4.86 $ 6.14 $ 8.07 Tangible book value per share, as
adjusted(3)(4) ........................................ $ 6.49 $ 6.08 $ 5.55 $ 6.71 $ 8.08
(1) Cash and cash equivalents include cash and due from other banks and federal funds sold. (2) Net of allowance for loan losses and exclusive of mortgage loans held for sale. (3) Tangible book value per share is unaudited. (4) Tangible book value per share, as adjusted is, does not include accumulated other comprehensive income (loss) which
is included in shareholders’ equity, and assumes that the each outstanding share of Series B and Series C Preferred Stock was converted into 18.80 shares, respectively, of common shares.
For the Year Ended December 31,
2012 2011 2010 2009
2008
(unaudited) Selected Financial Ratios:
Return on average assets ................................................... 0.90% 1.15% (1.20)% (1.45)% (1.06)%Return on average equity ................................................... 9.31% 16.51% (19.26)% (20.13)% (12.37)%Ratio of average equity to average assets .......................... 9.69% 6.98% 6.23% 7.16% 8.59%
ITEM 7. MANAGEMENT’S DISCUSSION AND ANALYSIS OF FINANCIAL CONDITION AND RESULTS OF OPERATIONS
Overview Forward Looking Statements
The following discussion contains statements (which are commonly referred to as “forward looking statements”) which discuss our beliefs or expectations about (i) our future financial performance and future financial condition and (ii) operating trends in our markets and in economic conditions generally. The consequences of those operating trends on our business and the realization of our expected future financial results, as discussed in those forward looking statements, are subject to a number of risks and uncertainties, including those described above in Item 1A of this Report under the caption “RISK FACTORS.” Due to those risks and uncertainties, our future financial performance may differ, possibly significantly, from the performance that is currently expected as set forth in the forward looking statements. As a result, you should not place undue reliance on those forward looking statements. We disclaim any obligation to update or revise any of the forward looking statements, whether as a result of new information, future events or otherwise, except as may be required by applicable law or NASDAQ rules.
Background The following discussion presents information about our consolidated results of operations, financial condition,
liquidity and capital resources and should be read in conjunction with our consolidated financial statements and the notes thereto included in Item 8 of this Report.
Our principal operating subsidiary is Pacific Mercantile Bank (the “Bank”), which is a California state chartered bank and a member of the Federal Reserve System. The Bank accounts for substantially all of our consolidated revenues, expenses and income and our consolidated assets and liabilities. Accordingly, the following discussion focuses primarily on the Bank’s results of operations and financial condition.

38
Overview of Fiscal 2012 Operating Results The following table sets forth selected financial information comparing our results of operations for the fiscal year
ended December 31, 2012 to our results of operations in the years ended December 31, 2011 and 2010.
Year Ended December 31,
Amount
Amount
Percent Change Amount
Percent Change
2012
2011 2012 vs. 2011 2010
2011 vs. 2010
(Dollars in thousands, except per share data) Interest income................................. $ 41,814 $ 44,290 (5.6)% $ 50,919 (13.0)%Interest expense ............................... 8,543 11,099 (23.0)% 18,081 (38.6)%
Net interest income ................ 33,271 33,191 0.2% 32,838 1.1%Provision for loan losses .................. 1,950 (833) 334.1% 8,288 (110.1)%
Net interest income (expense) after provision for loan losses ............. 31,321 34,024 (7.9)% 24,550 38.6%
Noninterest income .......................... 28,493 8,229 246.3% 6,771 21.5%Noninterest expense ......................... 53,124 37,054 43.4% 36,317 2.0%
Income (loss) before income taxes .. 6,690 5,199 28.7% (4,996) 204.1%Income tax provision (benefit) ......... (2,964) (6,433) (53.9)% 8,958 (171.8)%
Net income (loss) .......... $ 9,654 $ 11,632 (17.0)% (13,954) 183.4%
Net income (loss) per share—diluted ............................. $ 0.55 $ 0.98 (43.9)% $ (1.44) 168.41%
Weighted average number of diluted shares .............................. 17,749,852 11,371,524 56.1% 10,434,665 9.0%
Set forth below is information regarding the principal factors that led to the changes in our operating results in the year ended December 31, 2012 as compared to 2011.
Pre-Tax Income. In the year ended December 31, 2012 pre-tax income increased by $1.5 million, or 28.7%, to nearly $6.7 million from $5.2 million in the year ended December 31, 2011. As described in greater detail below, that increase was primarily due to a $20.3 million, or 246.3% increase in noninterest income, which more than offset a $16.1 million, or 43.4%, increase in noninterest expense in 2012, as compared to 2011.
Net Income and Income per Diluted Share. Notwithstanding that increase in pre-tax income, net income declined by 17.0% to approximately $9.7 million in the year ended December 31, 2012 from $11.6 million in the year ended December 31, 2011. That decrease was attributable to a $3.5 million reduction in income tax benefits to $3.0 million in 2012 from $6.4 million in 2011. Income per diluted share of common stock was $0.55 for 2012, as compared to $0.98 per diluted share in 2011, due not only to the lower income tax benefits in 2012, but also a 56% increase in the weighted average shares outstanding in 2012, as compared to 2011, due to primarily to our sale, in a private placement, of a total of 4,201,278 shares of our common stock in April 2012 at a price of $6.26 per share in cash.
The increase in pre-tax income in 2012 was primarily attributable to a combination of factors, the most important of which were the following:
• Increase in Noninterest Income. In 2012, noninterest income increased by $20.3 million, or 246.3%, as compared to 2011, which was primarily attributable to a $19.2 million, or 316.1%, increase in mortgage banking revenue and a $1.7 million, or 424.2%, increase in net gains from sales of securities held for sale. The increase in mortgage banking revenue was due primarily to the growth of our wholesale mortgage business which funded, and sold into the secondary mortgage market, residential mortgage loans originated for us by outside mortgage brokers. As previously reported and for the reasons discussed below, we exited the wholesale mortgage business by ceasing to accept mortgage loan applications from outside brokers effective August 31, 2012, while continuing our direct-to-consumer retail mortgage business in which we originate mortgage loans directly from consumers. As a result, we expect to report a significant decline in our mortgage banking revenues in 2013 when compared to 2012.

39
• Modest Increase in Net Interest Income. Net interest income increased by $80,000, or 0.2%, in 2012 due to a nearly $2.6 million, or 23.0%, decrease in interest expense that resulted primarily from (i) decreases in market rates of interest, which led to reductions in the rates of interest we paid on deposits and borrowings, and (ii) a change in the mix of our deposits to a higher proportion of non-interest bearing demand deposits. That decrease in interest expense more than offset a $2.5 million, or 5.6%, decline in interest income, which was primarily attributable to (i) a $1.7 million decline in interest earned on securities available for sale and (ii) an $808,000 decline in interest and fee income on loans, primarily reflecting the impact of declines in market rates of interest on the yields we earned on such securities and on our loans in 2012 and, to a lesser extent, a decline in the average volume of such securities outstanding during 2012.
• Increase in Noninterest Expense. Noninterest expense increased by $16.1 million, or 34.4%, in 2012, as compared to 2011. That increase was primarily attributable to increases of $9.0 million, $3.3 million, $1.9 million, and $1.6 million in compensation expense, expenses incurred in connection with other real estate owned (“OREO”), mortgage-loan related expenses and other operating expenses, respectively, in 2012 as compared to 2011. The increase in compensation expense was primarily attributable to an increase in mortgage banking personnel employed during 2012, as compared to 2011 and, to a much lesser extent, the addition of loan officers primarily for our SBA and entertainment industry lending businesses.
• Increase in Provision for Loan Losses. The provision we made for loan losses increased by nearly $2.8 million, or 334.1%, in 2012, as compared to 2011 when we recorded an $833,000 reduction in the provision. That increase was primarily attributable to $1.7 million of write-downs of the carrying values of $5.3 million of loans to market, upon the transfer of those loans from held for investment to loans held for sale. Since the write-downs were charged against the allowance for loan losses, we increased the provision for loan losses to offset those charges to the allowance.
• Income Tax Benefit. In 2012 we recorded a non-cash income tax benefit of $3.0 million as a result of a $4.6 million reduction we made in the valuation allowance that we had established against our deferred tax asset by means of non-cash charges to income tax expense in previous years. By comparison, in 2011 we recorded a non-cash income tax benefit of $6.4 million as a result of a $7.0 million reduction in that same valuation allowance. See “Critical Accounting Policies—Deferred Tax Asset” below.
Set forth below are certain key financial performance ratios and other financial data for or at the end of the periods indicated:
2012 2011 2010
Return on average assets ......................................................... 0.90% 1.15% (1.20)%Return on average shareholders’ equity .................................. 9.31% 16.51% (19.26)%Ratio of average equity to average assets ............................... 9.69% 6.98% 6.23%Net interest margin(1) ............................................................... 3.29% 3.41% 2.92%
(1) Net interest income expressed as a percentage of total average interest earning assets.
Overview of Changes in Financial Condition in 2012 Decrease in the Allowance for Loan Losses. We decreased the allowance for loan losses to $10.9 million, or 1.49% of
loans outstanding at December 31, 2012, from $15.6 million, or 2.37% of loans outstanding at December 31, 2011. That decrease was primarily attributable to transfers during 2012 of $14 million and $11 million in loans classified as special mention and substandard, respectively, to “pass” as the borrowers were able to bring their payments current on those loans.
Change in Mix of Deposits to a Greater Proportion of Lower Costs Deposits. During 2012, as a percentage of total deposits, the volume of non-interest bearing and lower cost deposits increased to 43.1% and the volume of higher-costs certificates of deposits declined to 56.9%, from 40.9% and 59.1%, respectively, at December 31, 2011. The average rate of interest we paid on certificates of deposits in 2012 decreased to 1.22% from 1.62% in 2011. The combination of this change in mix of deposits and this decrease in interest rates contributed to the decline in our interest expense during fiscal 2012.

40
Increase in Shareholder’s Equity and Improvements in Capital Ratios. Shareholders’ equity at December 31, 2012 totaled $122.5 million, an increase of $35.9 million, or 41.5%, from $86.6 million at December 31, 2011. That increase was primarily attributable to the $9.7 million in net income we earned in 2012 and the sale of $26.3 million of shares of our common stock, at a price of $6.26 per share, in April 2012 to Carpenter Community Bancfund, L.P. and Carpenter Community Bancfund-A, L.P. (the “Carpenter Funds”). As a result, the consolidated book value of our common stock increased to $6.75 per share at December 31, 2012 from $6.26 per share at December 31, 2011. Due to this increase in shareholder’s equity, the ratio of our consolidated total capital-to-risk weighted assets (which is the principal federal regulatory measure of the financial strength of banking institutions) increased to 16.3% at December 31, 2012, from 13.4% at December 31, 2011. As a result, at December 31, 2012 we continued to exceed the highest of the capital standards that are applicable to bank holding companies under federal banking regulations.
Outlook for 2013 Expected Decline in Mortgage Banking Revenues. As discussed above, effective August 31, 2012 we exited the
wholesale residential mortgage business. As a result, our Mortgage Banking Division is currently engaged in the direct-to-consumer retail mortgage business in which we originate mortgage loans directly from consumers seeking to refinance existing mortgage loans or finance the purchase of residential real estate. The decision to exit the wholesale mortgage business was made to enable us (i) to redeploy some of our capital resources, which had been committed to the wholesale mortgage business, to our core commercial lending business, (ii) to reduce and control our staffing costs and operating expenses, which had grown significantly to a large extent as a result of the growth of the wholesale mortgage business, and (iii) to manage and limit interest rate and other risks inherent in a wholesale mortgage business.
Accordingly, we have begun to refocus the resources that had been devoted to the wholesale mortgage business to initiatives to grow our commercial lending business and our retail mortgage business. However, as a result of our exit from wholesale residential mortgage business, we expect that mortgage banking revenue in 2013 will be significantly lower than in 2012.
Actions to Improve the Quality and Performance of the Bank’s Loan Portfolio and Strengthen its Financial Condition. In February 2013, we entered into a Stock Purchase Agreement to sell up to $15 million of additional shares of common stock, at a price of $6.75 per share in cash, to the Carpenter Funds. If that sale of shares is consummated, we intend to use the net proceeds to capitalize a new wholly-owned asset management subsidiary, which will use those proceeds to fund the purchase of nonperforming loans and OREO from the Bank and thereafter manage and dispose of those loans and OREO. The purpose of these transactions is to significantly reduce the Bank’s nonperforming assets in order to improve the Bank’s financial condition and reduce the costs it has been incurring in managing and disposing of those assets in order to improve the Bank’s results of operation. If these initiatives prove to be successful, we believe that such success will move the Bank closer to a relaxation of some of the regulatory restrictions under which it has been operating since August 2010 and which, therefore, could enable us to focus more resources on growing our banking franchise.
The sale of the shares of common stock to the Carpenter Funds also will strengthen the Company’s financial condition by increasing its capital and capital ratios. However, the Bank’s sale of non-performing assets to the Company’s new asset management subsidiary will not result in changes in or improvements to the Company’s consolidated financial condition or operating results, because those non-performing assets will remain on the Company’s consolidated balance sheet and the costs of managing and disposing of those assets, and any losses that may be recognized on their sale, will continue to be reflected in the Company’s consolidated operating results and cash flows until the sales or dispositions of those assets have been completed.
Critical Accounting Policies Our consolidated financial statements are prepared in accordance with generally accepted accounting principles in the
United States (“GAAP”) and regulatory accounting practices in the banking industry. Certain of those accounting policies are considered critical accounting policies, because they require us to make estimates and assumptions regarding circumstances or trends that could materially affect the value of those assets, such as economic conditions that could impact our ability to fully collect our loans or ultimately realize the carrying value of certain of our other assets. Those estimates and assumptions are made based on current information available to us regarding those economic conditions or trends or other circumstances. If changes were to occur in the events, trends or other circumstances on which our estimates or assumptions were based, or other unanticipated events were to occur that might affect our operations, we may be required under GAAP to adjust our earlier estimates and to reduce the carrying values of the affected assets on our balance sheet, generally by means of charges against income, which could also affect our results of operations in the fiscal periods when those charges are recognized.

41
Our critical accounting policies relate to the determinations of our allowance for loan losses, the fair values of securities available for sale and the realizability, and hence the valuation, of our deferred tax asset.
Allowance for Loan Losses. Like virtually all banks and other financial institutions, we follow the practice of maintaining an allowance to provide for possible loan losses that occur from time to time as an incidental part of the banking business. The accounting policies and practices we follow in determining the sufficiency of that allowance (which is commonly referred to as the “allowance for loan losses” or the “ALL”), require us to make judgments and assumptions about economic and market conditions and trends that can affect the ability of our borrowers to meet their loan payment obligations to us. In making those judgments, we use historical loss factors, adjusted for current economic and market conditions, other economic indicators and applicable bank regulatory guidelines, to determine losses inherent in our loan portfolio and the sufficiency of our allowance for loan losses. If unanticipated changes were to occur in those conditions or trends, or the financial condition of borrowers was to deteriorate, actual loan losses could be greater than those that had previously been predicted. In such events, or if there were changes to the loss factors or regulatory guidelines on which we had based our determinations regarding the sufficiency of the ALL, it could become necessary for us to increase the ALL by means of a charge to income referred to in our financial statements as the “provision for loan losses.” Such an increase would reduce the carrying value of the loans on our balance sheet and the provisions made for loan losses to increase that ALL would reduce our income in the period when it is determined that the increase was necessary. During the fourth quarter of 2008, federal bank regulatory agencies adopted new and more stringent guidelines and methodologies for identifying losses in bank loan portfolios and determining the sufficiency of loan loss reserves, as a result of the worsening of the economic recession and the prospects that conditions would not soon improve. We have been applying those new guidelines and methodologies since the fourth quarter of 2008. See the discussion in the subsections entitled “—Provision for Loan Losses” and “—Allowance for Loan Losses and Nonperforming Loans” below in this Item 7.
Fair Value of Securities Available for Sale. Under applicable accounting principles, we are required to recognize any unrealized loss on the securities we hold for sale. An unrealized loss occurs when the fair value of a security held for sale declines below its amortized cost as recorded on our balance sheet. As a result, we make determinations, on a quarterly basis, of the fair values of the securities held for sale in order to determine if there are any unrealized losses in those securities. When there is an active market for such a security, the determination of its fair value is based on market prices. If there is no active trading market, but such securities do trade from time to time, we rely primarily on quotes we obtain from third party vendors and securities brokers to determine the fair values of those securities. However, quotes are not always available for some securities and, in those instances, we make those fair value determinations on the basis of a variety of industry standard pricing methodologies, such as discounted cash flow analyses, matrix pricing, and option adjusted spread models, as well as fundamental analysis of the creditworthiness of the obligors under those securities. These methodologies require us to make various assumptions relating to such matters as future prepayment speeds, yield, duration, Federal Reserve Board monetary policies and the supply and demand for the individual securities. Consequently, if changes were to occur in market or other conditions or the circumstances on which our earlier assumptions or judgments were based, it could become necessary for us to reduce the fair values of such securities, which would result in charges to accumulated other comprehensive income (loss) on our balance sheet. Moreover, if we conclude that reductions in the fair values of any securities are other than temporary, it would be necessary for us to recognize an impairment loss to noninterest income in our statement of operations.
Fair Value of Financial Instruments Financial Accounting Standards Board—Accounting Standards Codification FASB ASC 820-10-35 defines fair value, establishes a framework for measuring fair value and outlines a fair value hierarchy based on the inputs to valuation techniques used to measure fair value. Fair value is defined as the price that would be received to sell an asset or paid to transfer a liability in an orderly transaction between market participants at the measurement date (also referred to as an exit price). Fair value measurements are categorized into a three-level hierarchy based on the extent to which the measurement relies on observable market inputs in measuring fair value. Level 1, which is the highest priority in the fair value hierarchy, is based on unadjusted quoted prices in active markets for identical assets or liabilities. Level 2 is based on observable market-based inputs, other than quoted prices, in active markets for identical assets or liabilities. Level 3, which is the lowest priority in the fair value hierarchy, is based on unobservable inputs. Assets and liabilities are classified within this hierarchy in their entirety based on the lowest level of any input that is significant to the fair value measurement.
The use of fair value to measure our financial instruments is fundamental to our financial statements and is a critical accounting estimate because a substantial portion of our mortgage banking assets and liabilities are recorded at estimated fair value. Financial instruments classified as Level 3 are generally based on unobservable inputs, and the process to determine fair value is generally more subjective and involves a high degree of management judgment and assumptions. These assumptions may have a significant effect on our estimates of fair value, and the use of different assumptions, as well as changes in market conditions and interest rates, could have a material effect on our results of operations or financial condition.

42
Mortgage loans held-for-sale — We elected to carry our mortgage loans held-for-sale originated or acquired from the mortgage lending operation at fair value. Fair value is based on quoted market prices, where available, prices for other traded mortgage loans with similar characteristics, and purchase commitments and bid information received from market participants.
Mortgage servicing rights — We elected to carry all of our mortgage servicing rights arising from the mortgage loan origination operation at fair value. The fair value of mortgage servicing rights is based upon market prices for similar instruments and a discounted cash flow model. The valuation model incorporates assumptions that market participants would use in estimating the fair value of servicing. These assumptions include estimates of prepayment speeds, discount rate, cost to service, escrow account earnings, contractual servicing fee income, prepayment and late fees, among other considerations.
Derivative financial instruments—We utilize certain derivative instruments in the ordinary course of our business to manage our exposure to changes in interest rates. These derivative instruments include forward sales of mortgage-backed securities (TBA MBS) and interest rate lock commitments (IRLCs) issued to borrowers in connection with single family mortgage loan originations. We recognize all derivative instruments at fair value. The estimated fair value of IRLCs are based on underlying loan types with similar characteristics using the TBA MBS market, which is actively quoted and easily validated through external sources. The data inputs used in this valuation include, but are not limited to, loan type, underlying loan amount, note rate, loan program, and expected sale date of the loan, adjusted for current market conditions. These valuations are adjusted at the loan level to consider the servicing release premium and loan pricing adjustments specific to each loan. For all IRLCs, the base value is then adjusted for the anticipated pull-through rate. The fair value of the forward sales of mortgage-backed securities is based on the actively quoted TBA MBS market using observable inputs related to characteristics of the underlying MBS stratified by product, coupon and settlement date.
Utilization and Valuation of Deferred Income Tax Benefits. We record as a “deferred tax asset” on our balance sheet an amount equal to the tax credit and tax loss carryforwards and tax deductions (“tax benefits”) that we believe will be available to us to offset or reduce income taxes in future periods. Under applicable federal and state income tax laws and regulations, in most cases such tax benefits will expire, if they cannot be used, within specified periods of time. Accordingly, the ability to fully use our deferred tax asset to reduce income taxes in the future depends on the amount of taxable income that we generate during those time periods. At least once each year, or more frequently, if circumstances warrant, we make estimates of future taxable income that we believe we are likely to generate during those future periods. If we conclude, on the basis of those estimates and the amount of the tax benefits available to us, that it is more likely, than not, that we will be able to fully utilize those tax benefits prior to their expiration, we recognize the deferred tax asset in full on our balance sheet. On the other hand, if we conclude, instead, that it has become more likely, than not, that we will be unable to utilize those tax benefits in full prior to their expiration, then, we would establish, or increase any existing, reserves (commonly referred to as a “valuation allowance”) to reduce the deferred tax asset on our balance sheet to the amount with respect to which we believe it is still more likely, than not, that we will be able to use to offset or reduce taxes in the future. The establishment of or an increase in that valuation allowance is implemented by recognizing a non-cash charge that would have the effect of increasing the provision, or reducing any credit, for income taxes that we would otherwise have recorded in our statements of operations. The determination of whether and the extent to which we will be able to utilize our deferred tax asset involves significant judgments and assumptions that are subject to period to period changes as a result of changes in tax laws, changes in market or economic conditions that could affect our operating results or variances between our actual operating results and the operating results that we had projected for any such period, as well as other factors.
We conducted an assessment of the realizability of our deferred tax asset as of June 30, 2010. Based on that assessment and due, in part, to continued weakness in the economy and financial markets, we concluded that it had become more likely, than not, that we would be unable to utilize our remaining tax benefits comprising our deferred tax asset prior to their expiration. Therefore, we recorded a valuation allowance against our net deferred tax asset in the amount of $10.7 million by means of a $9.0 million non-cash charge to income tax expense in the quarter ended June 30, 2010. The provision for income taxes we recorded in our statement of operations of nearly $9.0 million for the year ended December 31, 2010 was primarily attributable to that charge.
We conducted another assessment of the realizability of our deferred tax asset in the fourth quarter of 2011, due to a strengthening of economic conditions, an improvement in the quality of our loan portfolio, as reflected in declines in loan losses and loan delinquencies, and the earnings we generated from operations during 2011. Based on that assessment, we determined that it had become more likely, than not, that we would be able to use approximately $7.0 million of the income tax benefits comprising our deferred tax asset to offset or reduce taxes in future years. As a result we reduced, by a corresponding amount, the valuation allowance that we had established in previous years against our deferred tax asset by recording a non-cash income tax benefit for 2011 in the amount of $6.4 million.

43
At June 30, 2012 we conducted another assessment of the realizability of our deferred tax asset and due to a continued strengthening of economic conditions, a further improvement in the performance of our loan portfolio, and the earnings we were generating from our operations, we determined that it had become more likely than not that we would be able to use approximately $13.8 million of the income tax benefits comprising our deferred tax asset to offset or reduce taxes in future years. As a result, in the second quarter of 2012 we reduced the valuation allowance that we had previously established against our deferred tax asset, as a result of which we recognized a non-cash tax benefit of $3.0 million for the year ended December 31, 2012.
Results of Operations Net Interest Income
One of the principal determinants of a bank’s income is its net interest income, which is the difference between (i) the interest that a bank earns on loans, investment securities and other interest earning assets, on the one hand, and (ii) its interest expense, which consists primarily of the interest it must pay to attract and retain deposits and the interest that it pays on borrowings and other interest-bearing liabilities, on the other hand. A bank’s interest income and interest expense, in turn, are affected by a number of factors, some of which are outside of its control, including national and local economic conditions and the monetary policies of the Federal Reserve Board which affect interest rates, the demand for loans by prospective borrowers, the competition among banks and other lending institutions for loans and deposits and the ability of borrowers to meet their loan payment obligations. Net interest income, when expressed as a percentage of total average interest earning assets, is a banking organization’s “net interest margin.”
Fiscal 2012 Compared to Fiscal 2011. In fiscal 2012, our net interest income increased by $80,000, or 0.2%, to $33.3 million, from $33.2 million in fiscal 2011. Interest income decreased by $2.5 million, or 5.6%, to $41.8 million in 2012 from $44.3 million in 2011. That decrease was offset by a $2.6 million, or 23.0%, decrease in interest expense, to $8.5 million in 2012 from $11.1 million in 2011. The decrease in interest income was primarily due to further reductions by the Federal Reserve Board in interest rates and, to a lesser extent, a decrease in the volume of securities held for sale during 2012, which had the effect of reducing the yields that we were able to realize on our interest-earning assets to 4.94% in 2012 from 5.45% in 2011. The decrease in interest expense, which had the effect of reducing the average rate of interest that we paid on our interest-bearing liabilities to 1.11% in 2012 from 1.43% in 2011, was attributable primarily to continued reductions in market rates of interest and, to a lesser extent, an increase in noninterest bearing demand deposits and a reduction in time certificates of deposit on which we pay higher rates of interest than on our core deposits.
Due to the decline in our interest income in 2012, our net interest margin for fiscal 2012 decreased to 3.29% from 3.41% in fiscal 2011.

44
Information Regarding Average Assets and Average Liabilities The following tables set forth information regarding our average balance sheet, yields on interest earning assets,
interest expense on interest-bearing liabilities, the interest rate spread and the interest rate margin for the years ended December 31, 2012. The yield on interest earning assets declined by 0.40% to 4.15% in 2012 from 4.55% in 2011, which was partially offset by a decrease in the average interest rate paid on interest bearing liabilities by 0.32%, to 1.11% in 2012, from 1.43% in 2011. Average balances are calculated based on average daily balances.
Year Ended December 31,
2012
2011 2010
Average Balance
InterestEarned/
Paid Average Yield/ Rate
Average Balance
Interest Earned/
Paid Average Yield/ Rate
Average Balance
InterestEarned/
Paid Average Yield/ Rate
(Dollars in thousands)Interest earning assets
Short-term investments(1) .... $ 109,713 $ 278 0.25% $ 83,804 $ 211 0.25% $ 167,748 $ 468 0.28%Securities available for sale
and stock(2) ..................... 103,361 2,214 2.14% 153,490 3,949 2.57% 155,913 4,564 2.93%Loans(3) ............................... 795,395 39,322 4.94% 736,606 40,130 5.45% 801,613 45,887 5.72%
Total earning
assets .................... 1,008,469 41,814 4.15% 973,900 44,290 4.55% 1,125,274 50,919 4.53%Noninterest earning assets ............ 61,031 36,906 36,762
Total Assets .... $1,069,500 $ 1,010,806 $1,162,036 Interest-bearing liabilities: ............
Interest-bearing checking accounts ......................... $ 27,381 $ 82 0.30% $ 26,941 $ 89 0.33% $ 37,685 235 0.62%
Money market and savings accounts ......................... 177,256 1,341 0.76% 144,184 1,352 0.94% 134,863 1,506 1.12%
Certificates of deposit ......... 492,765 6,012 1.22% 513,619 8,337 1.62% 614,850 13,742 2.24%Other borrowings ................ 57,745 530 0.92% 75,367 780 1.03% 109,609 2,076 1.89%Junior subordinated
debentures ...................... 17,682 578 3.27% 17,682 541 3.07% 17,682 522 2.95%
Total interest bearing liabilities .............. 772,829 8,543 1.11% 777,793 11,099 1.43% 914,689 18,081 1.98%
Noninterest bearing liabilities ....... 192,995 162,559 174,907
Total liabilities .... 965,824 940,352 1,089,596
Shareholders’ equity ..................... 103,676 70,454 72,440 Total Liabilities and
Shareholders’ Equity ............... $1,069,500 $ 1,010,806 $1,162,036 $ 32,838
Net interest income ....................... $33,271 $33,191 Interest rate spread ........................ 3.04% 3.12% 2.55%
Net interest margin ....................... 3.29% 3.41% 2.92%
(1) Short-term investments consist of federal funds sold and interest bearing deposits that we maintain at other financial institutions.
(2) Stock consists of Federal Home Loan Bank Stock and Federal Reserve Bank Stock. (3) Loans include the average balance of nonaccrual loans.

45
The following table sets forth changes in interest income, including loan fees, and interest paid in each of the years ended December 31, 2012, 2011 and 2010 and the extent to which those changes were attributable to changes in (i) the volumes of or in the rates of interest earned on interest-earning assets and (ii) the volumes of or in the rates of interest paid on our interest-bearing liabilities.
2012 Compared to 2011 Increase (decrease) due to Changes in
2011 Compared to 2010 Increase (decrease) due to Changes in
Volume Rates
Total Increase
(Decrease) Volume Rates
Total Increase
(Decrease) (Dollars in thousands)
Interest income
Short-term investments(1) ...................... $ 66 $ 1 $ 67 $ (215) $ (42) $ (257)Securities available for sale and
stock (2) ............................................ (1,147) (588) (1,735) (70) (545) (615)Loans .................................................... 3,066 (3,874) (808) (3,609) (2,148) (5,757)
Total earning assets..................... 1,985 (4,461) (2,476) (3,894) (2,735) (6,629)Interest expense
Interest-bearing checking accounts ...... 1 (8) (7) (55) (91) (146)Money market and savings accounts .... 278 (289) (11) 99 (253) (154)Certificates of deposit ........................... (327) (1,998) (2,325) (2,030) (3,375) (5,405)Borrowings ........................................... (168) (82) (250) (529) (767) (1,296)Junior subordinated debentures ............ — 37 37 0 19 19
Total interest-bearing liabilities................................. (216) (2,340) (2,556) (2,515) (4,467) (6,982)
Net interest income ........... $ 2,201 $ (2,121) $ 80 $ (1,379) $ 1,732 $ 353
(1) Short-term investments consist of federal funds sold and interest bearing deposits with financial institutions. (2) Stock consists of Federal Reserve Bank stock and Federal Home Loan Bank stock.
The $2.5 million decrease in interest income in 2012 was primarily attributable to a decline in yields on interest-earning assets, which more than offset a $3.1 million increase in loan volume. The $2.6 million decrease in interest paid during 2012 was due primarily to reductions in the rates of interest on certificates of deposit and a change in the mix of deposits to a greater proportion of non-interest bearing and lower cost core deposits and a lower proportion of higher cost certificates of deposits. In 2011, the decline of $6.6 million in interest income was offset by a decrease of $7.0 million in interest expense as the result of decreases in volume of and declines in rates of interest on both interest-earning assets and interest-bearing liabilities.
Provision for Loan Losses Like virtually all banks and other financial institutions, we follow the practice of maintaining a reserve or allowance for
possible loan losses that are an incidental part of the banking business. When it is determined that the payment in full of a loan has become unlikely, the carrying value of the loan is reduced (“written down”) to what management believes is its realizable value or, if it is determined that a loan no longer has any realizable value, the carrying value of the loan is written off in its entirety (a loan “charge-off”). Loan charge-offs and write-downs are charged against that allowance (the “Allowance for Loan Losses” or the “ALL”). The amount of the ALL is adjusted periodically (i) to replenish the ALL after it has been reduced due to loan write-downs and charge-offs, (ii) to reflect increases in the volume of outstanding loans, and (iii) to take account of changes in the risk of potential loan losses due to a deterioration in the condition of borrowers or in the value of property securing non–performing loans or other adverse changes in economic conditions. See “—Financial Condition—Nonperforming Loans and the Allowance for Loan Losses” below in this Item 7. Increases in the ALL are made through a charge, recorded as an expense in the statement of operations, referred to as the “provision for loan losses.” The ALL is sometimes decreased as a result of reductions in the volume of loans outstanding, a decline in loan charge offs and delinquencies or recoveries of loans previously charged-off. Recoveries of loans that were previously charged-off are added back to the ALL and, therefore, have the effect of increasing the ALL and reducing the amount of the provisions that we might otherwise have had to make to replenish or increase the ALL.

46
We employ economic and loss migration models that are based on bank regulatory guidelines, industry standards and our own historical loan loss experience, as well as a number of more subjective qualitative factors, to determine both the sufficiency of the ALL and the amount of the provisions that need to be made for potential loan losses. However, those determinations involve judgments about changes and trends in current economic conditions and other events that can affect the ability of borrowers to meet their loan obligations to us and a weighting among the quantitative and qualitative factors we consider in determining the sufficiency of the ALL. Moreover, the duration and anticipated effects of prevailing economic conditions or trends can be uncertain and can be affected by number of risks and circumstances that are outside of our control. See the discussion above in Item 1A of this Report under the caption “RISK FACTORS—We could incur losses on the loans we make” and the discussion below in this Item 7 under the caption “Financial Condition—Nonperforming Loans and the Allowance for Loan Losses”. If changes in economic or market conditions or unexpected subsequent events were to occur, or if changes were made to bank regulatory guidelines or industry standards that are used to assess the sufficiency of the ALL, it could become necessary for us to incur additional, and possibly significant, charges to increase the ALL, which would have the effect of reducing our income or causing us to incur losses.
In addition, the FRB and the DFI, as an integral part of their examination processes, periodically review the adequacy of our ALL. These agencies may require us to make additional provisions for possible loan losses, over and above the provisions that we have already made, the effect of which would be to reduce our income or increase any losses we might incur.
As of December 31, 2012, we analyzed the ALL and determined that the credit risks inherent in our loan portfolio had declined during 2012 as compared to 2011. Based on that analysis and those determinations, we reduced the ALL by $4.7 million, or 30.0%, to $10.9 million at December 31, 2012 from $15.6 million at December 31, 2011. As a result, the ratio of the ALL to total loans outstanding (exclusive of loans held for sale) declined to 1.49% at December 31, 2012 from 2.47% at December 31, 2011. The factors that led us to reduce the ALL included (i) an improvement in the credit quality of previously classified loans, resulting in net transfers of $12.6 million of those loans from “special mention” or “substandard” to “pass”; (ii) a change in the mix of loans comprising our loan portfolio to a higher proportion of apartment, single family and SBA loans, which pose lower credit risks than do commercial loans; and (iii) declines in net loan charge-offs to $6.7 million at December 31, 2012 from $10.5 million at December 31, 2010. The improvement in the credit quality of the classified loans transferred to “pass” was primarily attributable to improvements in the financial condition and cash flows of the borrowers which, in turn, enabled them to bring their principal and interest payments current.
In 2011, we reduced the ALL by $2.5 million, or 13.7%, to $15.6 million at the end of December 31, 2011, compared to $18.1 million at the end of December 31, 2010, due in part to a reversal of $833,000 to the provision for loan losses in our 2011. Nevertheless, the ratio of the allowance for loan losses to total loans, which was 2.44% at December 31, 2010, remained substantially unchanged at 2.37% as of December 31, 2011. Moreover, that ratio was consistent with the ratios of the Bank’s peer group, comprised of banks with total assets between $300 million and $1 billion. The reduction in the ALL was primarily attributable to (i) a reduction in loan charge-offs to $1.6 million in 2011 from $10.5 million in 2010; (ii) a $7 million, or 39%, decline in loan delinquencies to approximately $11 million at December 31, 2011 as compared to approximately $18 million at December 31, 2010, and (iii) a $83 million, or 11.2%, reduction in gross loans outstanding to $658 million at December 31, 2011 from $741 million at December 31, 2010.

47
The following table sets forth the changes in the allowance for loan losses in the years ended December 31, 2012, 2011, 2010, 2009 and 2008.
Year Ended December 31,
2012 2011 2010 2009
2008
(Dollars in thousands) Total gross loans outstanding at end of period (1) ......... $ 730,599 $ 658,279 $ 741,007 $ 834,079 $ 843,494
Average total loans outstanding for the period (1) ......... $ 698,343 $ 709,168 $ 786,576 $ 833,550 $ 809,543
Allowance for loan losses at beginning of period ........ $ 15,627 $ 18,101 $ 20,345 $ 15,453 $ 6,126 Loans charged off
Commercial loans ............................................... (6,664) (1,218) (11,473) (15,153) (4,591)Construction loans – single family ..................... (80) (138) (101) (1,508) (3,424)Construction loans – other .................................. (78) — (548) (1,179) (2,680)Commercial real estate loans .............................. (1,184) (1,315) (660) (81) (1,006)Residential mortgage loans – single family ........ (534) (40) (631) (949) (307)Consumer loans .................................................. (14) (13) (152) (253) (311)Other loans ......................................................... (20) (12) — (15) (119)
Total loans charged off ............................. (8,574) (2,736) (13,565) (19,138) (12,438)Loan recoveries
Commercial loans ............................................... 1,657 1,067 2,327 129 37 Construction loans – single-family ..................... — — — 197 — Construction loans – other .................................. — — 4 — — Commercial real estate loans .............................. 198 3 345 — — Residential mortgage loans – single family ........ — 25 187 — — Consumer loans .................................................. 23 — 170 3 3 Other loans ......................................................... — — — 28 40
Total loan recoveries ................................. 1,878 1,095 3,033 357 80
Net loans charged off ................................................... (6,696) (1,641) (10,532) (18,781) (12,358)Provision for loan losses charged to operating
expense .................................................................... 1,950 (833) 8,288 23,673 21,685
Allowance for loan losses at end of period ................................................... $ 10,881 $ 15,627 $ 18,101 $ 20,345 $ 15,453
Allowance for loan losses as a percentage of average total loans ................................................................ 1.56% 2.20% 2.30% 2.44% 1.91%
Allowance for loan losses as a percentage of total outstanding loans at end of period .......................... 1.49% 2.37% 2.44% 2.44% 1.83%
Net charge-offs as a percentage of average total loans ................................................................ 0.96% 0.23% 1.34% 2.25% 1.53%
Net charge-offs as a percentage of total loans outstanding at end of period .................................... 0.92% 0.25% 1.42% 2.25% 1.47%
Net loans charged-off to allowance for loan losses ..... 61.54% 10.50% 58.18% 92.31% 79.97%Net loans charged-off to provision for loan losses....... 343.38% (197.00)% 127.08% 79.34% 56.99%
(1) Includes net deferred loan costs and excludes loans held for sale.

48
Noninterest Income The following table identifies the components of and the percentage changes in noninterest income in the fiscal years
ended December 31, 2012, 2011 and 2010, respectively:
Year Ended December 31,
Amount Amount
Percentage Change Amount
Percentage Change
2012 2011 2012 vs. 2011 2010
2011 vs. 2010
(Dollars in thousands) Total other-than-temporary impairment of securities .... $ (25) $ (41) (39.0)% $ (2,051) (98.0)%Portion of (losses) gains recognized in other
comprehensive loss ................................................... 52 128 (59.4)% (1,765) 107.3%
Net impairment loss recognized in earnings ................. (77) (169) (54.4)% (286) (40.9)%
Service fees on deposits and other banking services ..... 895 997 (10.2)% 1,207 (17.4)%Mortgage banking (including net gains on sales of
loans held for sale) ................................................... 25,257 6,070 316.1% 3,741 62.3%Net gains on sale of securities available for sale ........... 2,123 405 424.2% 1,530 (73.5)%Net gain (loss) on sale of other real estate owned ......... (528) 158 (234.2)% (64) 346.9%Other.............................................................................. 823 768 7.2% 643 19.4%
Total noninterest income ..................................... $ 28,493 $ 8,229 246.3% $ 6,771 21.5%
2012 Compared to 2011. In 2012, noninterest income increased by $20.3 million, or 246.3%, to $28.5 million from $8.2 million in 2011. That increase was primarily due to a $19.2 million, or 316.1%, increase in mortgage banking revenues, consisting of mortgage banking fees and proceeds from the sales of mortgage loans held for sale. As the table indicates, there was also an increase in net gains on sales of securities available for sale of $1.7 million, or 424.2%, which was partially offset by a net loss of $528,000 on sales of other real estate owned, as compared to a net gain of $158,000 on sales of OREO in 2011. Our mortgage banking business was comprised of the funding and sales into the secondary mortgage market of residential mortgage loans (i) that we originated directly from consumers (“direct-to-consumer retail mortgage loans”) and (ii) that were originated for us by outside mortgage brokers (“wholesale-originated mortgage loans”). The increase in mortgage banking revenues in 2012 was primarily attributable to a substantial increase in fundings and sales of wholesale-originated mortgage loans and a modest increase in fundings and sales of the direct to consumer retail mortgage loans.
2011 Compared to 2010. In 2011, noninterest income increased by nearly $1.4 million, or 21.5%, to $8.2 million as compared to $6.8 million in 2010. That increase was primarily due to a $2.4 million, or 62.3%, increase in mortgage banking revenues, consisting of mortgage banking fees and proceeds from the sale of mortgage loans held for sale. As the above table indicates, the increase in mortgage banking revenues was partially offset by a $1.1 million, or 73.5%, decrease in net gains on sale of securities available for sale.
Expectations for Mortgage Banking Revenues in 2013. Due to our exit from the wholesale residential mortgage business effective September 1, 2012, we currently expect that mortgage banking revenues will decline in 2013 as compared to 2012. See “—Overview-Outlook for 2013” above in this Item 7.

49
Noninterest Expense The following table sets forth the principal components and the amounts (in thousands of dollars) of, and the
percentage changes in, noninterest expense in the years ended December 31, 2012, 2011 and 2010, respectively.
Year Ended December 31,
2012 2011 2012 vs. 2011 2010
2011 vs. 2010
Amount Amount Percent Change Amount
Percent Change
Salaries and employee benefits ...................................... $ 26,096 $ 17,074 52.8% $ 15,345 11.3%Occupancy ..................................................................... 2,697 2,510 7.5% 2,668 (5.9)%Equipment and depreciation .......................................... 1,873 1,463 28.0% 1,277 14.6%Data processing .............................................................. 759 667 13.8% 684 (2.5)%FDIC insurance expense ................................................ 2,319 2,226 4.2% 3,753 (40.7)%Other real estate owned expenses .................................. 6,454 3,126 106.5% 2,772 12.8%Professional fees ............................................................ 4,551 3,922 16.0% 4,752 (17.5)%Provision for contingencies ........................................... 417 1,625 (74.3)% 550 195.5%Mortgage related loan expenses ..................................... 2,662 753 253.5% 484 55.6%Other operating expenses (1) ........................................... 5,296 3,688 43.6% 4,032 (8.5)%
Total noninterest expense ..................................... $ 53,124 $ 37,054 43.4% $ 36,317 2.0%
(1) Other operating expenses primarily consist of telephone, advertising, and investor relations, promotional, business development, and regulatory expenses, insurance premiums and correspondent bank fees.
2012 Compared to 2011. In 2012, noninterest expense increased by $16 million, or 43.4%, as compared to 2011, due primarily to (i) a $9 million, or 52.8%, increase in compensation expense, (ii) a $3.4 million, or 106.5%, increase in expenses related to other real estate owned (OREO) due to reductions in the carrying values of, and provisions of $1.6 million that we made to valuation reserves for potential losses on, those properties; (iii) a $1.9 million, or 253.5%, increase in mortgage related expenses, primarily as a result of increased mortgage loan volume, and (iv) a $1.6 million, or 44.4%, increase in other operating expenses primarily as a result of increases in business development expenses related to mortgage activity. The increase in compensation expense in 2012 was primarily attributable to increases in staffing in our mortgage banking division to enable us to take advantage of growth in the demand for residential real estate loans, due largely to declining mortgage interest rates and, to a lesser extent, the hiring of a new president and additional loan officers for our commercial banking division.
2011 Compared to 2010. In 2011, noninterest expense increased by $737,000, or 2.0%, as compared to 2010. The increase was primarily the result of a $1.7 million, or 11.3%, increase in compensation expense, due primarily to increased staffing required by the growth of our mortgage banking operations, and provisions of $1.6 million made to establish a reserve for litigation and other contingencies. Those increases were substantially offset by a $1.5 million, or 40.7%, decrease in FDIC insurance assessments and a $830,000, or 17.5%, decrease in professional fees, which consisted primarily of legal fees and expenses incurred principally in connection with the collection and foreclosures of non-performing loans and loan restructurings.
Income tax expense (benefit) For the year ended December 31, 2012 we recorded an income tax benefit of approximately $3.0 million as compared
to $6.4 million for the same period in 2011, as a result of the release of the remaining valuation allowance, in the amount of $5.0 million, which had been established against our deferred tax asset by means of charges to the provision for income taxes in prior years. The decision to release that valuation allowance was based on an assessment which we made in the second quarter of 2012 that, due primarily to the improvement in economic conditions, the decline in our nonperforming loans and the taxable earnings we had been generating from operations since the fourth quarter of 2010, it had become more likely, than not, that we would be able to use the income tax benefits comprising our deferred tax asset, in their entirety, to offset or reduce taxes in future periods. See –Critical Accounting Policies - Utilization and Valuation of Deferred Income Tax Benefits” above for additional information regarding our deferred tax asset and the changes in the valuation allowance established against that asset during the three year period ended December 31, 2012.

50
In 2011, we recorded a non-cash income tax benefit of $6.4 million in 2011 as a result of a $7.0 million reduction in the valuation allowance we had established in prior years against our deferred tax asset. That reduction in the valuation allowance was based on an assessment we made in the second quarter of 2011 that, due to a strengthening of economic conditions, an improvement in the quality of our loan portfolio, as reflected in declines in loan losses and loan delinquencies, and the earnings we were generating from operations, it had become more likely, than not, that we would be able to use approximately $7.0 million of the income tax benefits comprising our deferred tax asset to offset or reduce taxes in future periods.
In 2010, we recognized a non-charge of $9.0 million to the provision for income taxes in order to increase by $10.7 million the valuation allowance we had previously established against our deferred tax asset. That increase was the result of a determination that we made in the second quarter of 2010 that, due to the continuing weakness of the economy, uncertainties about the strength of the economic recovery and our continuing losses, it had become more likely, than not, that we would be unable to use the remainder of our deferred tax asset to offset or reduce income taxes in future periods.
Financial Condition Assets
Our total consolidated assets increased by $29 million to $1.054 billion at December 31, 2012 from $1.025 billion at December 31, 2011. The following table sets forth the composition of our interest earning assets, in thousands of dollars, at:
December 31,2012
December 31, 2011
Interest-bearing deposits with financial institutions (1) ... $ 115,952 $ 86,177 Interest-bearing time deposits with financial
institutions ................................................................ 2,423 1,423 Federal Reserve Bank and Federal Home Loan Bank
Stock, at cost ............................................................. 10,284 11,154 Securities available for sale, at fair value ...................... 86,378 147,909 Loans held for sale, (including $55,809 and $41,926,
respectively, of loans held for sale at value at December 31, 2012 and December 31, 2011 ............ 55,809 66,230
Loans (net of allowances of $10,881 and $15,627, respectively) ............................................................. 719,257 641,962
(1) Includes interest-earning balances maintained at the Federal Reserve Bank of San Francisco.
Investment Policy and Securities Available for Sale Our investment policy is designed to provide for our liquidity needs and to generate a favorable return on investment
without undue interest rate risk, credit risk or asset concentrations. Our investment policy: • authorizes us to invest in obligations issued or fully guaranteed by the United States Government, certain federal
agency obligations, time deposits issued by federally insured depository institutions, municipal securities and in federal funds sold;
• provides that the weighted average maturities of U.S. Government obligations and federal agency securities cannot exceed 10 years and municipal obligations cannot exceed 25 years;
• provides that time deposits that we maintain at other financial institutions must be placed with federally insured financial institutions, cannot exceed the maximum FDIC insured amount in any one institution, except for time deposits securing letter of credits for our borrowers in the total amount at December 31, 2012 $1.4 million, and may not have a maturity exceeding 60 months; and
• prohibits engaging in securities trading activities.
Securities Available for Sale. Securities that we intend to hold for an indefinite period of time, but which may be sold in response to changes in liquidity needs, in interest rates, or in prepayment risks or other similar factors, are classified as “securities available for sale”. Such securities are recorded on our balance sheet at their respective fair values and increases or decreases in those values are recorded as unrealized gains or losses, respectively, and are reported as Other Comprehensive Income (Loss) on our accompanying consolidated balance sheet, rather than included in or deducted from our earnings.

51
The following is a summary of the major components of securities available for sale and a comparison of the amortized cost, estimated fair values and the gross unrealized gains and losses attributable to those securities, as of December 31, 2012, 2011 and 2010:
(Dollars in thousands)
Amortized Cost Gross
Unrealized Gain Gross
Unrealized Loss
EstimatedFair Value
Securities available for sale at December 31, 2012:
Mortgage-backed securities issued by US agencies ............. $ 78,053 $ 553 $ (160) $ 78,446 Municipal securities ............................................................. — — — — Non-agency collateralized mortgage obligations ................. 2,599 87 (61) 2,625 Asset backed securities ......................................................... 2,247 — (1,347) 900 Mutual fund .......................................................................... 4,407 — — 4,407
Total securities available for sale ................................ $ 87,306 $ 640 $ (1,568) $ 86,378
Securities available for sale at December 31, 2011:
Mortgage-backed securities issued by US agencies ............. $ 133,859 $ 630 $ (363) $134,126 Municipal securities ............................................................. 6,389 96 (42) 6,443 Non-agency collateralized mortgage obligations ................. 3,040 — (455) 2,585 Asset backed securities ......................................................... 2,324 — (1,944) 380 Mutual fund .......................................................................... 4,375 — — 4,375
Total securities available for sale ................................ $ 149,987 $ 726 $ (2,804) $147,909
Securities available for sale at December 31, 2010:
Mortgage-backed securities issued by US agencies ............. $ 166,421 $ 24 $ (2,009) $164,436 Municipal securities ............................................................. 6,389 — (417) 5,972 Non-agency collateralized mortgage obligations ................. 3,500 21 (244) 3,277 Asset backed securities ......................................................... 2,493 — (2,122) 371 Mutual funds ........................................................................ 4,245 — — 4,245
Total securities available for sale ................................ $ 183,048 $ 45 $ (4,792) $178,301
At December 31, 2012, U.S. Government and federal agency securities, consisting principally of mortgage backed securities and collateralized mortgage obligations with an aggregate fair market value of $10 million were pledged to secure Federal Home Loan Bank borrowings, repurchase agreements, local agency deposits and treasury, tax and loan accounts.
The amortized cost, at December 31, 2012, of securities available for sale are shown in the table below by contractual maturities and historical prepayments based on the prior three months of principal payments. Expected maturities will differ from contractual maturities and historical prepayments, particularly with respect to collateralized mortgage obligations, because changes in interest rates will affect the timing and the extent of prepayments by borrowers.
December 31, 2012 Maturing in
One year or less
Over one year through
five years Over five
years through ten years
Over ten years
Total
(Dollars in thousands)
Book Value
Weighted Average
Yield
Book Value
WeightedAverage
Yield Book Value
Weighted Average
Yield Book Value
Weighted Average
Yield
Book Value
Weighted Average
Yield Securities available for
sale: Mortgage-backed
securities issued by U.S. Agencies ........ 10,893 1.55% $ 30,631 1.54% $ 23,505 1.52% $13,024 1.57% 78,053 1.54%
Non-agency collateralized mortgage obligations ............ 786 2.24% — — 1,233 3.53% 580 3.97% 2,599 3.20%
Asset backed securities .............. — — — — — — 2,247 — 2,247 —
Mutual funds ............. — — 4,407 2.19% — — — — 4,407 2.19% Total Securities
Available for sale ....... $ 11,679 1.59% $ 35,038 1.62% $ 24,738 1.62% $15,851 1.43% $ 87,306 1.58%

52
The table below shows, as of December 31, 2012, the gross unrealized losses and fair values of our investment securities, aggregated by investment category and the length of time that the individual securities have been in a continuous unrealized loss position.
Securities With Unrealized Loss as of December 31, 2012
Less than 12 months 12 months or more Total
(Dollars In thousands)
Fair Value Unrealized
Loss Fair Value Unrealized
Loss Fair Value
UnrealizedLoss
Mortgage backed securities issued by U.S. Agencies...................................... $ 35,996 $ (160) $ 39 $ — $ 36,035 $ (160)
Non-agency collateralized mortgage obligations ........................................... — — 1,172 (61) 1,172 (61)
Asset-backed securities ............................ — — 900 (1,347) 900 (1,347)
Total temporarily impaired securities .................................... $ 35,996 $ (160) $ 2,111 $ (1,408) $ 38,107 $ (1,568)
An impairment in the carrying value of a security held for sale exists when the fair value of the security has declined below its cost. We perform a quarterly assessment of the securities that have unrealized losses to determine whether the decline in their fair values below their costs is other-than-temporary.
We recognize other-than-temporary impairments (“OTTI”) to our available-for-sale debt securities in accordance with FASB ASC 320-10. When there are credit losses associated with, but we have no intention to sell, an impaired debt security, and it is more likely than not that we will not have to sell the security before recovery of its cost basis, we will separate the amounts of other-than-temporary impairments, or OTTI, between the amount that is credit related and the amount that is related to non-credit factors. Credit-related impairments are recognized in our consolidated statements of operations. Any non-credit-related impairments are recognized and reflected in other comprehensive income (loss).
Through the impairment assessment process, we determined that the available-for-sale securities discussed below were other-than-temporarily impaired at December 31, 2012. We recorded in our consolidated statements of operations for the year ended December 31, 2012 impairment credit losses of $77,000 on available-for-sale securities. The OTTI related to factors other than credit losses totaled $1.8 million, which was recognized as other comprehensive loss in our accompanying consolidated statement of financial condition.
The table below presents, for the year ended December 31, 2012, a roll-forward of OTTI in those instances when a portion of the OTTI was attributable to non-credit related factors and, therefore, was recognized in other comprehensive loss:
(Dollars in thousands)
Gross Other-Than-
Temporary Impairments
Other-Than- Temporary
Impairments Included in Other
Comprehensive Loss
Net Other-Than- Temporary
Impairments Included in
Retained Earnings (Deficit)
Balance – December 31, 2010 ...................... $ (2,666) $ (2,181) $ (485)Additions for credit losses on
securities for which an OTTI was not previously recognized ............... (41) 128 (169)
Balance – December 31, 2011 ...................... $ (2,707) $ (2,053) $ (654)Additions for credit losses on
securities for which an OTTI was not previously recognized ............... 131 208 (77)
Balance – December 31, 2012 ...................... $ (2,576) $ (1,845) $ (731)
In determining the component of OTTI attributable to credit losses, we compare the amortized cost basis of each OTTI security to the present value of its expected cash flows, discounted using the effective interest rate implicit in the security at the date of acquisition.
As a part of our OTTI assessment process with respect to securities held for sale with unrealized losses, we consider available information about (i) the performance of the collateral underlying each such security, including credit enhancements, (ii) historical prepayment speeds; (iii) delinquency and default rates, (iv) loss severities, (v) the age or “vintage” of the security, and (iv) rating agency reports on the security. Significant judgments are required with respect to these and other factors in order to make a determination of the future cash flows that can be expected to be generated by the security.

53
Based on our OTTI assessment process, we determined that there is one asset-backed security in our portfolio of securities held for sale that had become or was impaired as of December 31, 2012. This security is a multi-class, cash flow collateralized bond obligation backed by a pool of trust preferred securities issued by 56 different issuers consisting of 45 U.S. depository institutions and 11 insurance companies at the time of the security’s issuance in November 2007. We purchased $3.0 million face amount of this security in November 2007 at a price of 95.21% for a total purchase price of $2,856,420, out of a total of $363 million of this security sold by the issuer at the time of issuance. The security that we own (CUSIP 74042CAE8) is the mezzanine class B piece security with a variable interest rate of 3 month LIBOR +60 basis points, which had a rating of Aa2/AA by Moody’s and Fitch at the time of issuance in 2007.
As of December 31, 2012 the amortized cost of this security was $2.2 million with a fair value of $900,000, for an unrealized loss of approximately $1.3 million. Currently, the security has a Ca rating from Moody’s and CC rating from Fitch and has experienced $47.5 million in defaults (13% of total current collateral) and $43.5 million in deferring securities (12% of total current collateral) from issuance to December 31, 2012. The security did not pay its scheduled fourth quarter 2012 interest payment. The Company is not currently accruing interest on this security. We estimate that this asset-backed security could experience another $3.5 million in defaults before the issuer would not receive all of the contractual cash flows under this security. This analysis is based on the following assumptions: future default rates of 2%, prepayment rates of 1% until maturity, and 15% recovery of future defaults. With respect to this security, we have recognized impairment losses to earnings of $77,000, $169,000, and $199,000 for the years ended December 31, 2012, December 31, 2011 and December 31, 2010, respectively. Set forth below is additional information regarding impairment losses that we recognized in earnings for the year ended December 31, 2012:
Year Ended December 31,
2012 2011
2010
(In thousands) Impairment Losses on OTTI Securities:
Asset-Backed Security ......................................................... $ (77) $(169) $(199)Non-Agency CMO .............................................................. — — (87)
Total impairment loss recognized in earnings ............ $ (77) $(169) $(286)
We have made a determination that the remainder of our available for sale securities with respect to which there were unrealized losses as of December 31, 2012 are not other-than-temporarily impaired, because we have concluded that we have the ability to continue to hold those securities until their respective fair market values increase above their respective amortized costs or, if necessary, until their respective maturities. In reaching that conclusion, we considered a number of factors and other information, which included the significance of each such security in terms of (i) the amount of the unrealized losses attributable to each such security, (ii) our liquidity position, (iii) the impact that retention of those securities could have on our capital position and (iv) the expected future performance of these securities (based on the criteria discussed above).
Loans Held for Sale We commenced a new mortgage banking business during the second quarter of 2010 to originate, primarily in Southern
California, and fund residential real estate mortgage loans that qualify for sale into the secondary mortgage market. Our mortgage originations have been primarily for the financing of purchases of residential property and, to a lesser extent, refinancing of existing residential mortgage loans. In addition to conventional mortgage loans, we offer loan programs for low to moderate income families that qualify for mortgage assistance, such as the FHLB’s Wish Program, Homepath-financing on Fannie Mae repossessed homes, and Southern California Home Financing Authority and various mortgage assistance programs in counties and cities within our branch network. As a general rule, most of the residential mortgage loans that we originate are sold in the secondary mortgage market within a period of less than 30 days following their origination. The following table reflects the activity, in thousands of dollars, of our mortgage loan operations.
Year Ended December 31,
2012 Year Ended
December 31, 2011
Single family mortgage loans funded ......................... $ 933,214 $ 369,688 Single family mortgage loans sold .............................. 937,201 304,253 Loans held for sale (LHFS) ......................................... 55,809(1) 66,230(2)
(1) Includes $55.8 million of loans carried at fair value at December 31, 2012. (2) Includes $42.0 million of loans carried at fair value at December 31, 2011.
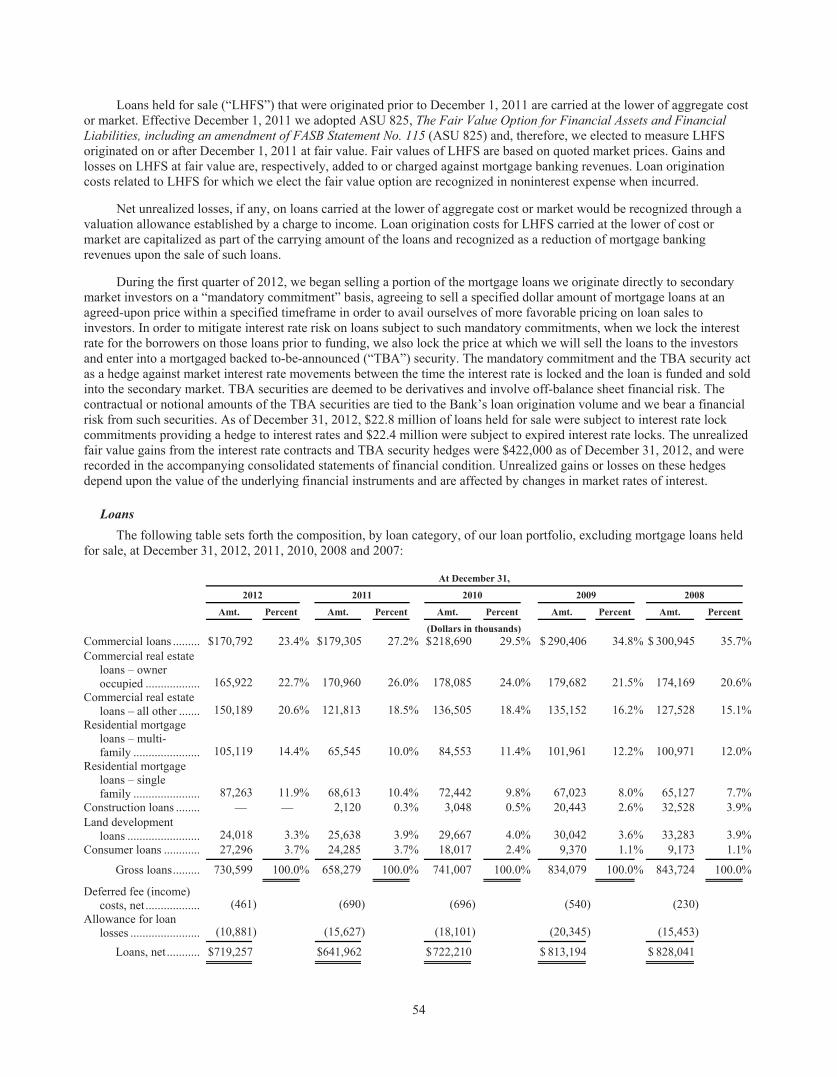
54
Loans held for sale (“LHFS”) that were originated prior to December 1, 2011 are carried at the lower of aggregate cost or market. Effective December 1, 2011 we adopted ASU 825, The Fair Value Option for Financial Assets and Financial Liabilities, including an amendment of FASB Statement No. 115 (ASU 825) and, therefore, we elected to measure LHFS originated on or after December 1, 2011 at fair value. Fair values of LHFS are based on quoted market prices. Gains and losses on LHFS at fair value are, respectively, added to or charged against mortgage banking revenues. Loan origination costs related to LHFS for which we elect the fair value option are recognized in noninterest expense when incurred.
Net unrealized losses, if any, on loans carried at the lower of aggregate cost or market would be recognized through a valuation allowance established by a charge to income. Loan origination costs for LHFS carried at the lower of cost or market are capitalized as part of the carrying amount of the loans and recognized as a reduction of mortgage banking revenues upon the sale of such loans.
During the first quarter of 2012, we began selling a portion of the mortgage loans we originate directly to secondary market investors on a “mandatory commitment” basis, agreeing to sell a specified dollar amount of mortgage loans at an agreed-upon price within a specified timeframe in order to avail ourselves of more favorable pricing on loan sales to investors. In order to mitigate interest rate risk on loans subject to such mandatory commitments, when we lock the interest rate for the borrowers on those loans prior to funding, we also lock the price at which we will sell the loans to the investors and enter into a mortgaged backed to-be-announced (“TBA”) security. The mandatory commitment and the TBA security act as a hedge against market interest rate movements between the time the interest rate is locked and the loan is funded and sold into the secondary market. TBA securities are deemed to be derivatives and involve off-balance sheet financial risk. The contractual or notional amounts of the TBA securities are tied to the Bank’s loan origination volume and we bear a financial risk from such securities. As of December 31, 2012, $22.8 million of loans held for sale were subject to interest rate lock commitments providing a hedge to interest rates and $22.4 million were subject to expired interest rate locks. The unrealized fair value gains from the interest rate contracts and TBA security hedges were $422,000 as of December 31, 2012, and were recorded in the accompanying consolidated statements of financial condition. Unrealized gains or losses on these hedges depend upon the value of the underlying financial instruments and are affected by changes in market rates of interest.
Loans The following table sets forth the composition, by loan category, of our loan portfolio, excluding mortgage loans held
for sale, at December 31, 2012, 2011, 2010, 2008 and 2007:
At December 31,
2012
2011 2010 2009
2008
Amt.
Percent
Amt.
Percent Amt. Percent Amt. Percent
Amt. Percent
(Dollars in thousands)Commercial loans ......... $170,792 23.4% $179,305 27.2% $ 218,690 29.5% $ 290,406 34.8 % $ 300,945 35.7%Commercial real estate
loans – owner occupied .................. 165,922 22.7% 170,960 26.0% 178,085 24.0% 179,682 21.5 % 174,169 20.6%
Commercial real estate loans – all other ....... 150,189 20.6% 121,813 18.5% 136,505 18.4% 135,152 16.2 % 127,528 15.1%
Residential mortgage loans – multi- family ...................... 105,119 14.4% 65,545 10.0% 84,553 11.4% 101,961 12.2 % 100,971 12.0%
Residential mortgage loans – single family ...................... 87,263 11.9% 68,613 10.4% 72,442 9.8% 67,023 8.0 % 65,127 7.7%
Construction loans ........ — — 2,120 0.3% 3,048 0.5% 20,443 2.6 % 32,528 3.9%Land development
loans ........................ 24,018 3.3% 25,638 3.9% 29,667 4.0% 30,042 3.6 % 33,283 3.9%Consumer loans ............ 27,296 3.7% 24,285 3.7% 18,017 2.4% 9,370 1.1 % 9,173 1.1%
Gross loans ......... 730,599 100.0% 658,279 100.0% 741,007 100.0% 834,079 100.0 % 843,724 100.0%
Deferred fee (income)
costs, net .................. (461) (690 ) (696) (540 ) (230)Allowance for loan
losses ....................... (10,881) (15,627 ) (18,101) (20,345 ) (15,453)
Loans, net ........... $719,257 $641,962 $ 722,210 $ 813,194 $ 828,041
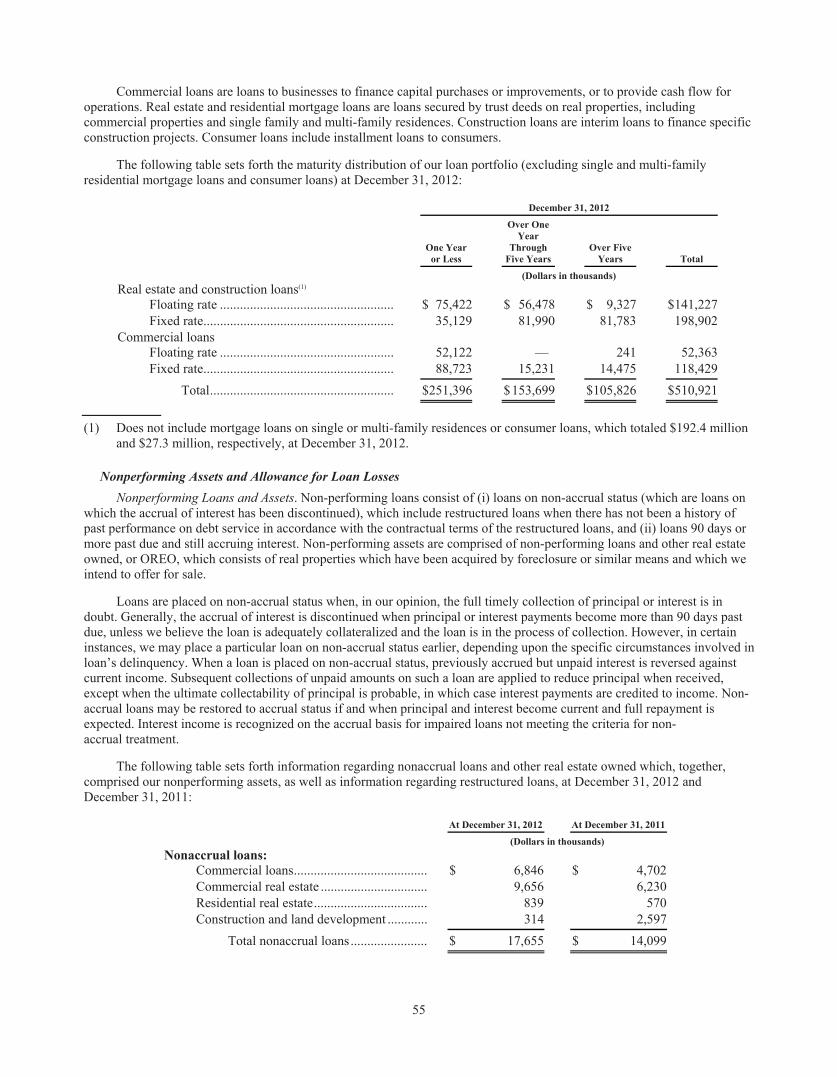
55
Commercial loans are loans to businesses to finance capital purchases or improvements, or to provide cash flow for operations. Real estate and residential mortgage loans are loans secured by trust deeds on real properties, including commercial properties and single family and multi-family residences. Construction loans are interim loans to finance specific construction projects. Consumer loans include installment loans to consumers.
The following table sets forth the maturity distribution of our loan portfolio (excluding single and multi-family residential mortgage loans and consumer loans) at December 31, 2012:
December 31, 2012
One Yearor Less
Over OneYear
Through Five Years
Over Five Years
Total
(Dollars in thousands) Real estate and construction loans(1)
Floating rate .................................................... $ 75,422 $ 56,478 $ 9,327 $ 141,227 Fixed rate ......................................................... 35,129 81,990 81,783 198,902
Commercial loans
Floating rate .................................................... 52,122 — 241 52,363 Fixed rate ......................................................... 88,723 15,231 14,475 118,429
Total ....................................................... $ 251,396 $ 153,699 $ 105,826 $ 510,921
(1) Does not include mortgage loans on single or multi-family residences or consumer loans, which totaled $192.4 million and $27.3 million, respectively, at December 31, 2012.
Nonperforming Assets and Allowance for Loan Losses Nonperforming Loans and Assets. Non-performing loans consist of (i) loans on non-accrual status (which are loans on
which the accrual of interest has been discontinued), which include restructured loans when there has not been a history of past performance on debt service in accordance with the contractual terms of the restructured loans, and (ii) loans 90 days or more past due and still accruing interest. Non-performing assets are comprised of non-performing loans and other real estate owned, or OREO, which consists of real properties which have been acquired by foreclosure or similar means and which we intend to offer for sale.
Loans are placed on non-accrual status when, in our opinion, the full timely collection of principal or interest is in doubt. Generally, the accrual of interest is discontinued when principal or interest payments become more than 90 days past due, unless we believe the loan is adequately collateralized and the loan is in the process of collection. However, in certain instances, we may place a particular loan on non-accrual status earlier, depending upon the specific circumstances involved in loan’s delinquency. When a loan is placed on non-accrual status, previously accrued but unpaid interest is reversed against current income. Subsequent collections of unpaid amounts on such a loan are applied to reduce principal when received, except when the ultimate collectability of principal is probable, in which case interest payments are credited to income. Non-accrual loans may be restored to accrual status if and when principal and interest become current and full repayment is expected. Interest income is recognized on the accrual basis for impaired loans not meeting the criteria for non- accrual treatment.
The following table sets forth information regarding nonaccrual loans and other real estate owned which, together, comprised our nonperforming assets, as well as information regarding restructured loans, at December 31, 2012 and December 31, 2011:
At December 31, 2012 At December 31, 2011
(Dollars in thousands) Nonaccrual loans:
Commercial loans ........................................ $ 6,846 $ 4,702 Commercial real estate ................................ 9,656 6,230 Residential real estate .................................. 839 570 Construction and land development ............ 314 2,597
Total nonaccrual loans ....................... $ 17,655 $ 14,099

56
At December 31, 2012 At December 31, 2011
(Dollars in thousands) Loans past due 90 days and still accruing
interest: Commercial loans .......................................... $ — $ —
Total loans past due 90 days and still accruing interest .............................. $ — $ —
Other real estate owned (OREO):Commercial loans .......................................... $ — $ 4,561 Commercial real estate .................................. 12,944 22,542 Residential real estate .................................... — 616 Construction and land development .............. 4,766 9,702
Total other real estate owned ............... $ 17,710 $ 37,421
Other nonperforming assets: Asset backed security .................................... 900 380
Total other nonperforming assets ........ $ 900 $ 380
Total nonperforming assets ........ $ 36,265 $ 51,900
Restructured loans: Accruing loans .............................................. $ 21,595 $ — Nonaccruing loans (included in nonaccrual
loans above) .............................................. 5,637 4,214
Total restructured loans ....................... $ 27,232 $ 4,214
Total nonperforming assets decreased by $15.6 million, or 30.1%, to $36.2 million at December 31, 2012 from $51.9 million at December 31, 2011. That decrease was due to a $19.7 million, or nearly 53%, reduction in other real estate owned (“OREO”) that was the result of sales of OREO during fiscal 2012. Nonaccrual loans increased by $3.6 million, or 25.5%, to $17.7 million at December 31, 2012 from $14.1 million at December 31, 2011. That increase was primarily due to the filing of Chapter 11 bankruptcies by two borrowers with outstanding loans from us totaling $8.1 million and an additional $2.7 million of delinquent loans more than 90 days past due, partially offset by a $3.3 million decrease in loans 30 to 89 days delinquent to $2.7 million at December 31, 2012 from $6.0 million at December 31, 2011. We also succeeded in restructuring a number of nonperforming loans, which resulted in an increase in restructured loans to $27.2 million at December 31, 2012 from $4.2 million at December 31, 2011. Those restructurings included the establishment of modified payment plans to ease the borrowers’ cash flow problems and thereby increase the likelihood that the borrowers would be able to repay those loans and, in certain instances, reductions in the principal amount of the borrowings.
We have allocated specific reserves within the allowance for loan losses to provide for losses we may incur on nonaccrual loans, and we have established specific reserves on other real estate owned.
Information Regarding Impaired Loans. At December 31, 2012, there were $39.3 million of loans deemed impaired, as compared to $18.4 million at December 31, 2011, primarily due to the increase in restructured loans, as discussed above. We had an average investment in impaired loans for the year ended December 31, 2012 of $34.8 million as compared to $27.5 million for the year ended December 31, 2011. The interest that would have been earned during 2012 had these impaired loans remained current in accordance with their original terms was $987,000.
The following table sets forth information, at December 31, 2012 and 2011, with respect to the amounts, determined in accordance with ASC 310-10, of impaired loans for which specific reserves have been set aside within the allowance for loan losses, the amounts of those reserves and the amounts of impaired loans for which no specific reserves have been allocated within the allowance for loan losses:
December 31, 2012 December 31, 2011
Impaired Loans
Loans
Reserves forLoan Losses
% of Reserves to
Loans Loans Reserves for Loan Losses
% of Reserves to
Loans (Dollars in thousands)
Impaired loans with specific reserves ....................................... $ 4,398 $ 2,448 55.7% $ 9,913 $ 2,783 28.1%
Impaired loans without specific reserves ....................................... 34,853 — — 8,482 — —
Total impaired loans ............... $ 39,251 $ 2,448 6.2% $ 18,395 $ 2,783 15.1%
57
Allowance for Loan Losses. At December 31, 2012 the allowance for loan losses (the “ALL”) totaled $10.9 million, as compared to $18.1 million at December 31, 2011. As a percentage of total loans outstanding, the ALL at December 31, 2012 was 1.49%, compared to 2.37% at December 31, 2011.
The adequacy of the ALL is determined through periodic evaluations of the loan portfolio and other factors that can reasonably be expected to affect the ability of borrowers to meet their loan obligations. Those factors are inherently subjective as the process for determining the adequacy of the ALL involves some significant estimates and assumptions about such matters such as (i) economic conditions and trends and the amounts and timing of expected future cash flows of borrowers which can affect their ability to meet their loan obligations to us, (ii) the fair value of the collateral securing non-performing loans, (iii) estimates of losses that we may incur on non-performing loans, which are determined on the basis of historical loss experience and industry loss factors and bank regulatory guidelines, which are subject to change, and (iv) various qualitative factors. Since those factors are subject to changes in economic and other conditions and changes in regulatory guidelines or other circumstances over which we have no control, the amount of the ALL may prove to be insufficient to cover all of the loan losses we might incur in the future. In such an event, it may become necessary for us to increase the ALL from time to time to maintain its adequacy. Such increases are effectuated by means of a charge to income, referred to as the “provision for loan losses”, in our statements of our operations. See “— Results of Operations — Provision for Loan Losses, above in this Item 7.
The amount of the ALL is first determined by assigning reserve ratios for all loans. All non-accrual loans and other loans classified as “special mention,” “substandard” or “doubtful” (“classified loans” or “classification categories”) and not fully collateralized are then assigned specific reserves within the ALL, with greater reserve allocations made to loans deemed to be of a higher risk. These ratios are determined based on prior loss history and industry guidelines and loss factors, by type of loan, adjusted for current economic factors and current economic trends.
On a quarterly basis, we utilize a classification migration model and individual loan review analytical tools as starting points for determining the adequacy of the ALL. Our loss migration analysis tracks a certain number of quarters of loan loss history and industry loss factors to determine historical losses by classification category for each loan type, except certain loans (automobile, mortgage and credit cards), which are analyzed as homogeneous loan pools. These calculated loss factors are then applied to outstanding loan balances. We also conduct individual loan review analysis, as part of the ALL allocation process, applying specific monitoring policies and procedures in analyzing the existing loan portfolio.
In determining whether and the extent to which we will make adjustments to our loan loss migration model for purposes of determining the ALL, we also consider a number of qualitative factors that can affect the performance and the collectability of the loans in our loan portfolio. Such qualitative factors include:
• The effects of changes that we may make in our loan policies or underwriting standards on the quality of the loans and the risks in our loan portfolios;
• Trends and changes in local, regional and national economic conditions, as well as changes in industry specific conditions, and any other reasonably foreseeable events that could affect the performance or the collectability of the loans in our loan portfolios;
• Material changes that may occur in the mix or in the volume of the loans in our loan portfolios that could alter, whether positively or negatively, the risk profile of those portfolios;
• Changes in management or loan personnel or other circumstances that could, either positively or negatively, impact the application of our loan underwriting standards, the monitoring of nonperforming loans or our loan collection efforts;
• Changes in the concentration of risk in the loan portfolio; and • External factors that, in addition to economic conditions, can affect the ability of borrowers to meet their loan
obligations, such as fires, earthquakes and terrorist attacks.
Determining the effects that these qualitative factors may have on the performance of each category of loans in our loan portfolio requires numerous judgments, assumptions and estimates about conditions, trends and events which may subsequently prove to have been incorrect due to circumstances outside of our control. Moreover, the effects of qualitative factors such as these on the performance of our loan portfolios are often difficult to quantify. As a result, we may sustain loan losses in any particular period that are sizable in relation to the ALL or that may even exceed the ALL.
In response to the economic recession, which resulted in increased and relatively persistent high rates of unemployment, and the credit crisis that has led to a severe tightening in the availability of credit, preventing borrowers from refinancing their loans, we (i) implemented more stringent loan underwriting standards, (ii) strengthened loan underwriting and approval processes, and (iii) added personnel with experience in addressing problem assets.

58
The following table compares the total amount of loans outstanding, and the allowance for loan losses, by loan category, in each case, in thousands of dollars, and certain related ratios, as of December 31, 2012 and December 31, 2011.
December 31, 2012
December 31, 2011
Increase (Decrease)
(Dollars in thousands) Loan Categories: Commercial loans ............................................................. $ 170,792 $ 179,305 $ (8,513)
Loans impaired(1) ..................................................... $ 16,180 $ 5,140 $ 11,040 Loans 90 days past due ............................................ $ 4,295 $ 2,021 $ 2,274 Loans 30 days past due ............................................ $ 2,099 $ 2,036 $ 63 Allowance for loan losses:
General component ........................................ $ 3,912 $ 7,260 $ (3,348)Specific component(1) ..................................... 2,428 1,648 780
Total allowance .................................... $ 6,340 $ 8,908 $ (2,568)Ratio of allowance to loan category ..... 3.71% 4.97% (1.26)%
Real estate loans: .............................................................. $ 421,230 $ 358,318 $ 62,912 Loans impaired(1) ..................................................... $ 21,918 $ 10,088 $ 11,830 Loans 90 days past due ............................................ $ 5,831 $ — $ 5,831 Loans 30 days past due ............................................ $ — $ 2,875 $ (2,875)Allowance for loan losses:
General component ........................................ $ 3,487 $ 4,642 $ (1,155)Specific component (1) .................................... — 1,135 (1,135)
Total allowance .................................... $ 3,487 $ 5,777 $ (2,290)Ratio of allowance to loan category ..... 0.83% 1.61% (0.78)%
Construction loans and land development ........................ $ 24,018 $ 27,758 $ (3,740)Loans impaired(1) ..................................................... $ 314 $ 2,597 $ (2,283)Loans 90 days past due ............................................ $ 314 $ 2,597 $ (2,283)Loans 30 days past due ............................................ $ — $ — $ — Allowance for loan losses:
General component ........................................ $ 248 $ 316 $ (68)Specific component(1) ..................................... — — —
Total allowance .................................... $ 248 $ 316 $ (68)Ratio of allowance to loan category ..... 1.03% 1.14% (0.11)%
Consumer and single family mortgages ............................ $ 114,559 $ 92,898 $ 21,661 Loans impaired(1) ..................................................... $ 839 $ 570 269 Loans 90 days past due ............................................ $ 359 $ 492 (133)Loans 30 days past due ............................................ $ 637 $ 1,130 (493)Allowance for loan losses:
General component ........................................ $ 806 $ 626 $ 180 Specific component(1) ..................................... — — —
Total allowance .................................... $ 806 $ 626 $ 180 Ratio of allowance to loan category ..... 0.70% 0.67% 0.03%
Total loans outstanding ..................................................... $ 730,599 $ 658,279 $ 72,320 Loans impaired(1) ..................................................... $ 39,251 $ 18,395 $ 20,856 Loans 90 days past due ............................................ $ 10,799 $ 5,110 $ 5,689 Loans 30 days past due ............................................ $ 2,736 $ 6,041 $ (3,305)Allowance for loan losses:
General component ........................................ $ 8,453 $ 12,844 $ (4,391)Specific component(1) ..................................... 2,428 2,783 (355)
Total allowance .................................... $ 10,881 $ 15,627 $ (4,746)Ratio of allowance to total loans
outstanding ...................................... 1.49% 2.37% (0.88)%
(1) Amounts in impaired loans and specific component include nonperforming delinquent loans.

59
Set forth below is a summary, in thousands of dollars, of the transactions in the allowance for loan losses for the years ended December 31, 2012 and December 31, 2011:
Year Ended December 31, 2012
Year Ended December 31, 2011
(Dollars in thousands) Balance, beginning of year ................................... $ 15,627 $ 18,101 Provision for loan losses ....................................... 1,950 (833)Recoveries on loans previously charged off ......... 1,878 1,095 Charged off loans .................................................. (8,574) (2,736)
Balance, end of year ............................................. $ 10,881 $ 15,627
The table below compares loan delinquencies, in thousands of dollars, at December 31, 2012 and December 31, 2011.
December 31,
2012 2011
Loans Delinquent:
90 days or more:
Commercial loans .................................................................... $ 4,295 $ 2,021 Commercial real estate ............................................................ 5,831 — Residential mortgages ............................................................. 359 492 Construction and land development loans ............................... 314 2,597 Consumer loans ....................................................................... — —
10,799 5,110
30-89 days:
Commercial loans .................................................................... 2,099 2,036 Commercial real estate ............................................................ — 2,875 Residential mortgages ............................................................. 637 1,130 Construction and land development loans ............................... — — Consumer loans ....................................................................... — —
2,736 6,041
Total Past Due (1) : ........................................................ $ 13,535 $ 11,151
(1) Past due balances include nonaccrual loans.
Deposits Average Balances of and Average Interest Rates Paid on Deposits. Set forth below are the average amounts (in
thousands of dollars) of, and the average rates paid on, deposits in each of 2012, 2011 and 2010:
Year Ended December 31,
2012 2011 2010
Average Balance
Average Rate
Average Balance
Average Rate
Average Balance
Average Rate
Noninterest bearing demand deposits .......... $ 172,442 — $ 155,077 — $ 167,357 — Interest-bearing checking accounts .............. 27,381 0.30% 26,941 0.33% 37,685 0.62%Money market and savings deposits ............ 177,256 0.76% 144,184 0.94% 134,863 1.12%Time deposits(1) ............................................ 492,765 1.22% 513,619 1.62% 614,850 2.24%
Total deposits ..................................... $ 869,844 0.85% $ 839,821 1.16% $ 954,755 1.62%
(1) Comprised of time certificates of deposit in denominations of less than and more than $100,000.
Deposit Totals at Fiscal Year-End. Total deposits decreased by $17 million or 2.0% to $845.4 million at December 31, 2012 from $862.0 million at December 31, 2011. At December 31, 2012, noninterest-bearing deposits totaled $170.2 million, and 20.1% of total deposits, as compared to $164.4 million, and 19.1% of total deposits at December 31, 2011. Certificates of deposit in denominations of $100,000 or more, on which we pay higher rates of interest than on other deposits, aggregated $407.4 million, or 48.2%, of total deposits at December 31, 2012, as compared to $417.7 million, and 48.4%, of total deposits at December 31, 2011.
60
Set forth below is a maturity schedule of domestic time certificates of deposit outstanding at December 31, 2012 and December 31, 2011:
December 31, 2012 December 31, 2011
Maturities
Certificates ofDeposit Under
$ 100,000 Certificates of
Deposit $100,000or more
Certificates of Deposit Under
$100,000
Certificates of Deposit $100,000
or more (Dollars in thousands)
Three months or less .................................. $ 23,505 $ 117,449 $ 36,756 $ 151,753 Over three and through six months ............ 13,036 64,369 16,059 65,756 Over six and through twelve months ......... 23,161 131,246 25,559 130,299 Over twelve months ................................... 13,861 94,294 13,583 69,923
Total ................................................. $ 73,563 $ 407,358 $ 91,957 $ 417,731
Liquidity We actively manage our liquidity needs to ensure that sufficient funds are available to meet our needs for cash,
including to fund new loans to and deposit withdrawals by our customers. We project the future sources and uses of funds and maintain liquid funds for unanticipated events. Our primary sources of cash include cash we have on deposit at other financial institutions, payments on loans, proceeds from the sale or maturity of securities, and from sales of residential mortgage loans, increases in deposits and increases in borrowings principally from the Federal Home Loan Bank. The primary uses of cash include funding new loans and making advances on existing lines of credit, purchasing investments, including securities available for sale, funding new residential mortgage loans, funding deposit withdrawals and paying operating expenses. We maintain funds in overnight federal funds and other short-term investments to provide for short-term liquidity needs. We also have obtained credit lines from the Federal Home Loan Bank and other financial institutions to meet any additional liquidity requirements.
Our liquid assets, which included cash and due from banks, federal funds sold, interest earning deposits with financial institutions and unpledged securities available for sale (excluding Federal Reserve Bank and Federal Home Loan Bank stock) totaled $204 million, which represented 19% of total assets, at December 31, 2012.
Cash Flow Provided by (Used in) Operating Activities. In 2012, operating activities provided net cash of $11 million, comprised primarily of our net income of $9.7 million and $982 million of cash from sales of and principal reductions on mortgage loans available for sale, substantially offset by $933 million of cash used to originate and purchase mortgage loans held for sale. In 2011, operating activities used net cash of $37 million, comprised primarily of $359 million used to originate and purchase mortgage loans held for sale, substantially offset by cash proceeds of $312 million of cash from sales of and principal reductions on mortgage loans available for sale and net income of $11.6 million.
Cash Flow Provided by Investing Activities. Investing activities provided net cash of $6 million, primarily attributable to (i) $186 million of cash from sales, and $29 million of cash from maturities of and principal payments on, securities available for sale and $13 million of proceeds from sales of OREO, partially offset by $150 million used to purchase securities available for sale and $73 million used to fund an increase loans. In 2011, investing activities provided net cash of $109 million, primarily comprised of $96 million from sales of securities available for sale, $59 million from repayments of loans, $14 million from sales of OREO, and $11 million from maturities of and principal payments on securities available for sale, only partially offset by $72 million used to purchase securities available for sale.
Cash Flow Used by Financing Activities. In 2012, financing activities provided net cash of $14 million, consisting primarily of net proceeds of approximately $24.6 million from a private placement of shares of our common stock in the second quarter of 2012, and a $6 million increase in borrowings, partially offset by a $17 million net decrease in deposits, which resulted primarily from a decision not to renew some time certificates of deposit at their maturity in order to reduce our costs of funds.
Ratio of Loans to Deposits. The relationship between gross loans and total deposits can provide a useful measure of a bank’s liquidity. Since repayment of loans tends to be less predictable than the maturity of investments and other liquid resources, the higher the loan-to-deposit ratio the less liquid are our assets. On the other hand, since we realize greater yields on loans than we do on investments, a lower loan-to-deposit ratio can adversely affect interest income and earnings. As a result, our goal is to achieve a loan-to-deposit ratio that appropriately balances the requirements of liquidity and the need to generate a fair return on our assets. At December 31, 2012, the loan-to-deposit ratio was 86%, as compared to 76%, at December 31, 2011, primarily as a result of an increase in loan volume in 2012.

61
Off Balance Sheet Arrangements Loan Commitments and Standby Letters of Credit. In order to meet the financing needs of our customers in the normal
course of business, we make commitments to extend credit and issue standby commercial letters of credit to or for our customers. At December 31, 2012 and 2011, we had outstanding commitments to fund loans totaling approximately $118 million and $121 million, respectively.
Commitments to extend credit and standby letters of credit generally have fixed expiration dates or other termination clauses and the customer may be required to pay a fee and meet other conditions in order to draw on those commitments or standby letters of credit. We expect, based on historical experience, that many of the commitments will expire without being drawn upon and, therefore, the total commitment amounts do not necessarily represent future cash requirements.
To varying degrees, commitments to extend credit involve elements of credit and interest rate risk for us that are in excess of the amounts recognized in our balance sheets. Our maximum exposure to credit loss in the event of nonperformance by the customers to whom such commitments are made could potentially be equal to the amount of those commitments. As a result, before making such a commitment to a customer, we evaluate the customer’s creditworthiness using the same underwriting standards that we would apply if we were approving loans to the customer. In addition, we often require the customer to secure its payment obligations for amounts drawn on such commitments with collateral such as accounts receivable, inventory, property, plant and equipment, income-producing commercial properties, residential properties and properties under construction. As a consequence, our exposure to credit and interest rate risk on such commitments is not different in character or amount than risks inherent in the outstanding loans in our loan portfolio.
Standby letters of credit are conditional commitments issued by the Bank to guarantee a payment obligation of a customer to a third party. The credit risk involved in issuing letters of credit is essentially the same as that involved in extending loan commitments to customers.
We believe that our cash and cash equivalent resources, together with available borrowings under our credit facilities, will be sufficient to enable us to meet any increases in demand for loans or in the utilization of outstanding loan commitments or standby letters of credit and any increase in deposit withdrawals that might occur in the foreseeable future.
Contractual Obligations
Borrowings. As of December 31, 2012, we had $20 million of outstanding short-term borrowings and $35 million of outstanding long-term borrowings that we had obtained from the Federal Home Loan Bank. The following table sets forth the amounts (in thousands of dollars) of, the interest rates we paid on, and the maturity dates of these Federal Home Loan Bank borrowings. These borrowings, along with the securities sold under agreements to repurchase, had a weighted-average annualized interest rate of 0.92% during 2012.
Principal Amounts
Interest Rate
Maturity Dates
PrincipalAmounts
Interest Rate Maturity Dates
(Dollars in thousands)$10,000 1.73% February 19, 2013 $ 5,000 0.48% April 14, 2014 5,000 1.06% August 9, 2013 5,000 0.48% May 6, 2014 5,000 0.41% November 5, 2013 3,000 0.64% September 26, 2014 7,500 0.49% March 3, 2014 4,500 0.78% March 26, 2015 5,000 0.56% March 26, 2014 5,000 0.76% March 30, 2015
At December 31, 2012, U.S. Agency and mortgage backed securities, U.S. Government agency securities and collateralized mortgage obligations with an aggregate fair market value of $2.2 million and $153 million of residential mortgage and other real estate secured loans were pledged to secure these Federal Home Loan Bank borrowings, repurchase agreements, local agency deposits and treasury, tax and loan accounts.
The highest amount of borrowings outstanding at any month end in 2012 consisted of $69 million of borrowings from the Federal Home Loan Bank and no overnight borrowings in the form of securities sold under repurchase agreements. By comparison, the highest amount of borrowings outstanding at any month end in 2011 consisted of $114 million of borrowings from the Federal Home Loan Bank and $11.0 million of overnight borrowings in the form of securities sold under repurchase agreements.

62
Junior Subordinated Debentures. Pursuant to rulings of the Federal Reserve Board, bank holding companies were permitted to issue long term subordinated debt instruments that, subject to certain conditions, would qualify as and, therefore, augment capital for regulatory purposes. At December 31, 2012, we had outstanding approximately $17.5 million principal amount of 30-year junior subordinated floating rate debentures (the “Debentures”), of which $16.8 million qualified as Tier 1 capital for regulatory purposes as of December 31, 2012. See discussion below under the subcaption “—Capital Resources-Regulatory Capital Requirements Applicable to Banking Institutions.”
Set forth below is certain information regarding the Debentures:
Original Issue Dates
Principal Amount Interest Rates Maturity Dates
September 2002 .................................... $ 7,217 Libor plus 3.40% September 2032October 2004 ........................................ 10,310 Libor plus 2.00% October 2034
Total ............................................ $ 17,527
(1) Subject to the receipt of prior regulatory approval, we may redeem the Debentures, in whole or in part, without premium or penalty, at any time prior to maturity.
As previously reported, since July 2009 we have been required to obtain the prior approval of the FRBSF to make interest payments on the Debentures. During the 12 months ended December 31, 2012, we were unable to obtain regulatory approvals to pay, and it became necessary for us to defer, quarterly interest payments on the Debentures. We cannot predict when the FRBSF will approve our resumption of such interest payments and until such approval can be obtained it will be necessary for us to continue deferring interest payments on the Debentures. Since we have the right, under the terms of the Debentures, to defer interest payments for up to twenty (20) quarters, the deferrals of interest payments to date have not constituted, and any future deferrals of interest payments through January 2015 will not constitute, a default under or with respect to the Debentures. However, if by that date we have not been able to obtain regulatory approval to pay all of the deferred interest payments, we would then be in default under the Debentures.
Under Federal Reserve Board rulings, the borrowings evidenced by the Debentures, which are subordinated to all other borrowings that are outstanding or which we may obtain in the future, are eligible (subject to certain dollar limitations) to qualify and, at December 31, 2012 and 2011, $16.8 million of those Debentures qualified as Tier I capital for regulatory purposes.
Investment Policy and Securities Available for Sale Our investment policy is designed to provide for our liquidity needs and to generate a favorable return on investments
without undue interest rate risk, credit risk or asset concentrations.
Our investment policy: • authorizes us to invest in obligations issued or fully guaranteed by the United States Government, certain federal
agency obligations, time deposits issued by federally insured depository institutions, municipal securities and in federal funds sold;
• provides that the aggregate weighted average life of U.S. Government obligations and federal agency securities exclusive of variable rate securities cannot, without approval by the Board of Directors, exceed 10 years and municipal obligations cannot exceed 25 years;
• provides that time deposits must be placed with federally insured financial institutions, cannot exceed the current federally insured amount in any one institution, except to secure letter of credits issued for our borrowers, and may not have a maturity exceeding 60 months, unless that time deposit is matched to a liability instrument issued by the Bank; and
• prohibits engaging in securities trading activities.

63
Other Contractual Obligations Set forth below is information regarding our material contractual obligations as of December 31, 2012:
Operating Lease Obligations. We lease certain facilities and equipment under various non-cancelable operating leases, which include escalation clauses ranging between 2% and 6% per annum. Future minimum non-cancelable lease commitments, in thousands of dollars, were as follows:
At December 31, 2012
2013 ......................................................................................... $ 2,278 2014 ......................................................................................... 2,225 2015 ......................................................................................... 1,662 2016 ......................................................................................... 797 2017 ......................................................................................... 18 Thereafter ................................................................................. 0
Total ......................................................................................... $ 6,980
Maturing Time Certificates of Deposits. Set forth below is a maturity schedule, as of December 31, 2012, of time certificates of deposit of $100,000 or more:
At December 31, 2012
(In thousands) 2013 ......................................................................................... $ 322,731 2014 ......................................................................................... 78,024 2015 ......................................................................................... 3,662 2016 ......................................................................................... 2,484 2017 and beyond ...................................................................... 458
Total ......................................................................................... $ 407,359
Capital Resources Regulatory Capital Requirements Applicable to Banking Institutions
Under federal banking regulations that apply to all United States based bank holding companies and federally insured banks, the Company (on a consolidated basis) and the Bank (on a stand-alone basis) must meet specific capital adequacy requirements that, for the most part, involve quantitative measures, primarily in terms of the ratios of their capital to their assets, liabilities, and certain off-balance sheet items, calculated under regulatory accounting practices. Under those regulations, each bank holding company must meet a minimum capital ratio and each federally insured bank is determined by its primary federal bank regulatory agency to come within one of the following capital adequacy categories on the basis of its capital ratios:
• well capitalized • adequately capitalized • undercapitalized • significantly undercapitalized; or • critically undercapitalized
Certain qualitative assessments also are made by a banking institution’s primary federal regulatory agency that could lead the agency to determine that the banking institution should be assigned to a lower capital category than the one indicated by the quantitative measures used to assess the institution’s capital adequacy. At each successive lower capital category, a banking institution is subject to greater operating restrictions and increased regulatory supervision by its federal bank regulatory agency.

64
The following table sets forth the capital and capital ratios of the Company (on a consolidated basis) and the Bank (on a stand-alone basis) at December 31, 2012, as compared to the respective regulatory requirements applicable to them.
Applicable Federal Regulatory Requirement
For Capital Adequacy Purposes
To be Categorized As Well Capital
Amount
Ratio Amount Ratio Amount
Ratio
(Dollars in thousands)Total Capital to Risk Weighted
Assets:
Company .................................... $ 141,946 16.5% $ 68,974 At least 8.0% N/A N/A Bank ........................................... 134,648 15.6% 68,969 At least 8.0% $ 86,211 At least 10.0%
Tier 1 Capital to Risk Weighted Assets:
Company .................................... $ 131,165 15.2% $ 34,487 At least 4.0% N/A N/A Bank ........................................... 123,868 14.4% 34,484 At least 4.0% $ 51,727 At least 6.0%
Tier 1 Capital to Average Assets:
Company .................................... $ 131,165 12.1% $ 43,219 At least 4.0% N/A N/A Bank ........................................... 123,868 11.5% 43,205 At least 4.0% $ 54,006 At least 5.0%
At December 31, 2012 the Bank (on a stand-alone basis) continued to qualify as a well-capitalized institution, and the Company continued to exceed the minimum required capital ratios applicable to it, under the capital adequacy guidelines described above.
The consolidated total capital and Tier 1 capital of the Company at December 31, 2012 includes an aggregate of $16.8 million principal amount of Junior Subordinated Debentures that we issued in 2002 and 2004. We contributed the net proceeds from the sales of the Junior Subordinated Debentures to the Bank over the eight year period ended December 31, 2012, thereby providing it with additional cash to fund the growth of its banking operations and, at the same time, to increase its total capital and Tier 1 capital.
Additional Sales of Common Stock Sale of Shares of Common Stock in 2012. As previously reported, in order to provide additional capital for our business
and maintain capital at levels well in excess of regulatory capital requirements, in April 2012 we consummated the sale to the Carpenter Funds of a total of 4,201,278 shares of our common stock, at a purchase price of $6.26 per share in cash, generating net proceeds of approximately $24.6 million, of which we contributed $15 million as additional capital to the Bank
Agreement to Sell Additional Shares of Common Stock. As we also have previously reported, in February 2013 we entered into a Stock Purchase Agreement which provides for us to sell up to an additional 2,222,222 shares of our common stock, at a purchase price of $6.75 per share in cash, to the Carpenter Funds. We intend to use the net proceeds from the sale of those shares, which are expected to total approximately $14,800,000, to capitalize a new wholly-owned asset management subsidiary, which will use those proceeds primarily to fund the purchase of nonperforming loans and OREO from the Bank. This asset management subsidiary will then focus its efforts and resources principally on managing and disposing of those assets. The sale of those assets by the Bank to the asset management subsidiary will significantly reduce the Bank’s nonperforming assets which, in turn, will result in improvements in the Bank’s financial condition. In addition, we expect the sale of those assets will result in improvements in the Bank’s future operating results because the Bank will no longer have to incur the costs of managing and disposing of those assets. In addition, the proceeds from the sale of those assets will provide the Bank with additional financial resources that it plans to use to fund new loans and growth initiatives.
Consummation of this sale of shares remains subject to the satisfaction, by no later than April 15, 2013, of conditions customary for transactions of this nature and the condition that the Company and the Carpenter Funds will have obtained, by no later than May 15, 2013, federal bank regulatory approvals for the transactions contemplated by the Stock Purchase Agreement, including for the purchase by the new asset management subsidiary of nonperforming assets from the Bank. There is no assurance that all of the conditions will be satisfied and, therefore, there can be no assurance that the sale of these shares of common stock to the Carpenter Funds will be consummated.

65
This sale of the shares to the Carpenter Funds also will strengthen the Company’s financial condition by increasing its consolidated shareholders equity and capital ratios. However, the Bank’s sale of non-performing assets to the Company’s new asset management subsidiary will not otherwise result in improvements to the Company’s consolidated financial condition or consolidated operating results, because those non-performing assets will remain on the Company’s consolidated balance sheet and the costs of managing and disposing of those assets, and any losses that may be recognized on their sale or other disposition, will continue to negatively affect the Company’s consolidated operating results and cash flows until the sales or dispositions of those assets are completed.
Dividend Policy and Share Repurchase Programs and Restrictions on Payment of Dividends. Our Board of Directors has followed the policy of retaining earnings to maintain capital and, thereby, support the
operations of the Bank. Moreover, the FRB Agreement prohibits our payment of cash dividends and any repurchases of shares of our common stock, without the prior approval of the FRBSF. In addition, the FRB Agreement prohibits us from making interest payments on our Junior Subordinated Debentures without the approval of the FRBSF. As described above, we have been unable to obtain those approvals and, consequently, we have had to defer interest payments on those Debentures since 2010. As a result, we are precluded, by the terms of those Debentures, from paying cash dividends on our common stock or preferred stock unless and until we have paid all of the deferred interest in full and thereafter make interest payments on the Junior Subordinated Debentures as and when they become due. Accordingly, we do not expect to pay cash dividends or make share purchases at least for the foreseeable future.
The holders of the Series B Shares are entitled to receive dividends payable in cash at a rate of 8.4% per annum if, as and when declared by the Board of Directors. If, however, due to legal or regulatory restrictions, the Company is unable to pay cash dividends on the Series B Shares for two semi-annual dividend periods, then the Company will be required to pay such dividends in shares of Series C Preferred Stock (“Series C Shares”). Due to the regulatory restrictions that preclude us from paying cash dividends, in 2012 we issued a total of 12,803 Series C Shares in lieu of the cash dividends that would otherwise have been payable on the Series B Shares. The issuance of Series C Shares is dilutive of the ownership that our existing shareholders have in the Company. In addition, no dividends may be declared or paid on shares of the Company’s common stock unless dividends are first paid (either in cash or in Series C Shares) on the shares of Series B Preferred Stock and any shares of Series C Preferred Stock that may be issued in the future.

66
ITEM 8. FINANCIAL STATEMENTS INDEX TO CONSOLIDATED FINANCIAL STATEMENTS
Page No.
Report of Independent Registered Public Accounting Firm ....................................................................................... 67 Consolidated Statements of Financial Condition as of December 31, 2012 and 2011 ............................................... 68 Consolidated Statements of Operations for the years ended December 31, 2012, 2011 and 2010 ............................. 69 Consolidated Statements of Comprehensive Income (Loss) for the years ended December 31, 2012, 2011
and 2010 ................................................................................................................................................................ 70 Consolidated Statement of Shareholders’ Equity for the years ended December 31, 2012, 2011 and 2010 .............. 71 Consolidated Statements of Cash Flows for the years ended December 31, 2012, 2011 and 2010 ............................ 72 Notes to Consolidated Financial Statements ............................................................................................................... 74

67
REPORT OF INDEPENDENT REGISTERED PUBLIC ACCOUNTING FIRM
Board of Directors and Shareholders Pacific Mercantile Bancorp and subsidiaries
We have audited the accompanying consolidated statements of financial condition of Pacific Mercantile Bancorp (a California Corporation) and subsidiaries (collectively, the “Company”) as of December 31, 2012 and 2011, and the related consolidated statements of operations, comprehensive income (loss), shareholders’ equity, and cash flows for each of the three years in the period ended December 31, 2012. These financial statements are the responsibility of the Company’s management. Our responsibility is to express an opinion on these financial statements based on our audits.
We conducted our audits in accordance with the standards of the Public Company Accounting Oversight Board (United States). Those standards require that we plan and perform the audits to obtain reasonable assurance about whether the financial statements are free of material misstatement. The Company is not required to have, nor were we engaged to perform, an audit of its internal control over financial reporting. Our audits included consideration of internal control over financial reporting as a basis for designing audit procedures that are appropriate in the circumstances, but not for the purpose of expressing an opinion on the effectiveness of the Company’s internal control over financial reporting. Accordingly, we express no such opinion. An audit includes examining, on a test basis, evidence supporting the amounts and disclosures in the financial statements. An audit also includes assessing the accounting principles used and significant estimates made by management, as well as evaluating the overall financial statement presentation. We believe that our audits provide a reasonable basis for our opinion.
In our opinion, the financial statements referred to above present fairly, in all material respects, the consolidated financial position of Pacific Mercantile Bancorp and subsidiaries as of December 31, 2012 and 2011, and the consolidated results of their operations and their cash flows for each of the three years in the period ended December 31, 2012 in conformity with accounting principles generally accepted in the United States of America.
As more fully described in Notes 3 and 19 to the consolidated financial statements, in August 2010, the Company and its wholly owned subsidiary, Pacific Mercantile Bank, (the “Bank”) entered into a written agreement (the “Written Agreement”) with its regulators. The Written Agreement includes certain requirements of the Company and the Bank which include (i) strengthening board oversight, (ii) improving the Bank’s position with respect to problem assets and maintaining adequate reserves for loan and lease losses, (iii) improving the Bank’s capital position, and (iv) improving the Bank’s earnings. The Company and the Bank have taken measures towards complying with the provisions of the Written Agreement, however the Company and Bank cannot predict the future impact of the Written Agreement upon their business, financial condition or results of operations, and there can be no assurance when or if the Company and Bank will be in compliance with the Written Agreement, or whether the regulators might take further action against the Company or Bank. The accompanying financial statements do not reflect the impact of this uncertainty.
/s/ SQUAR, MILNER, PETERSON, MIRANDA & WILLIAMSON, LLP
Newport Beach, California March 19, 2013

68
PACIFIC MERCANTILE BANCORP AND SUBSIDIARIES CONSOLIDATED STATEMENTS OF FINANCIAL CONDITION
(Dollars in thousands)
December 31,
2012
2011
ASSETS
Cash and due from banks ............................................................................................................ $ 12,256 $ 10,290 Interest bearing deposits with financial institutions .................................................................... 115,952 86,177
Cash and cash equivalents ................................................................................................. 128,208 96,467 Interest-bearing time deposits with financial institutions ........................................................... 2,423 1,423 Federal Reserve Bank and Federal Home Loan Bank Stock, at cost .......................................... 10,284 11,154 Securities available for sale, at fair value ................................................................................... 86,378 147,909 Loans held for sale (including $55,809 and $41,926 of loans held for sale at fair value) .......... 55,809 66,230 Loans (net of allowances of $10,881 and $15,627) .................................................................... 719,257 641,962 Other real estate owned............................................................................................................... 17,710 37,421 Accrued interest receivable ......................................................................................................... 2,242 2,505 Premises and equipment, net ...................................................................................................... 1,362 977 Other assets ................................................................................................................................. 30,268 18,504
Total assets .............................................................................................................. $ 1,053,941 $ 1,024,552
LIABILITIES AND SHAREHOLDERS’ EQUITY
Deposits:
Noninterest-bearing ........................................................................................................... $ 170,259 $ 164,382 Interest-bearing ................................................................................................................. 675,136 697,665
Total deposits ........................................................................................................... 845,395 862,047 Borrowings ................................................................................................................................. 55,000 49,000 Accrued interest payable ............................................................................................................. 1,832 1,444 Other liabilities ........................................................................................................................... 11,311 7,909 Junior subordinated debentures .................................................................................................. 17,527 17,527
Total liabilities ......................................................................................................... 931,065 937,927
Commitments and contingencies (Note 17)
Shareholders’ equity:
Preferred stock, no par value, 2,000,000 shares authorized:
Series A Convertible 10% Cumulative Preferred Stock, 155,000 shares authorized; no shares issued and outstanding at December 31, 2012 and 11,000 shares issued and outstanding at December 2011, respectively .............. — 1,100
Series B Convertible 8.4% Noncumulative Preferred Stock, 300,000 shares authorized; 112,000 issued and outstanding at December 31, 2012 and December 31, 2011; liquidation preference $100 per share, plus accumulated but undeclared dividends at December 31, 2012 and December 31, 2011 ......... 8,747 8,747
Series C Convertible 8.4% Noncumulative Preferred Stock, 300,000 shares authorized; 12,803 issued and outstanding at December 31, 2012 and no shares issued and outstanding at December 31, 2011; liquidation preference $100 per share plus accumulated but undeclared dividends at December 31, 2012 and December 31, 2011 ............................................................................. 1,280 —
Common stock, no par value, 85,000,000 shares authorized; 16,677,419 and 12,273,003 shares issued and outstanding at December 31, 2012 and December 31, 2011, respectively ......................................................................................................... 112,792 86,366
Retained earnings (accumulated deficit) ........................................................................... 622 (7,545)Accumulated other comprehensive loss ............................................................................ (565) (2,043)
Total shareholders’ equity ....................................................................................... 122,876 86,625
Total liabilities and shareholders’ equity ................................................................. $ 1,053,941 $ 1,024,552
The accompanying notes are an integral part of these consolidated financial statements.

69
PACIFIC MERCANTILE BANCORP AND SUBSIDIARIES CONSOLIDATED STATEMENTS OF OPERATIONS
(Dollars in thousands, except for per share data)
Year Ended December 31,
2012 2011
2010
Interest income:
Loans, including fees......................................................................... $ 39,322 $ 40,130 $ 45,887 Securities available for sale and stock ............................................... 2,214 3,949 4,564 Interest-bearing deposits with financial institutions .......................... 278 211 468
Total interest income ............................................................... 41,814 44,290 50,919 Interest expense:
Deposits ............................................................................................. 7,435 9,778 15,483 Borrowings ........................................................................................ 1,108 1,321 2,598
Total interest expense .............................................................. 8,543 11,099 18,081
Net interest income ..................................................................................... 33,271 33,191 32,838 Provision (benefit) for loan losses .............................................................. 1,950 (833) 8,288
Net interest income after provision (benefit) for loan losses ............. 31,321 34,024 24,550 Noninterest income
Total other-than-temporary impairment of securities ........................ 131 (41) (95)Less: portion of other-than-temporary impairment losses
recognized in other comprehensive loss ....................................... 208 128 191
Net impairment loss recognized in earnings ..................................... (77) (169) (286)Service fees on deposits and other banking services ......................... 895 997 1,207 Mortgage banking ............................................................................ 25,257 6,070 3,741 Net gains on sale of securities available for sale ............................... 2,123 405 1,530 Net (loss) gain on sale of other real estate owned ............................. (528) 158 (64)Other .................................................................................................. 823 768 643
Total noninterest income ......................................................... 28,493 8,229 6,771 Noninterest expense
Salaries and employee benefits ......................................................... 26,096 17,074 15,345 Occupancy ......................................................................................... 2,697 2,510 2,668 Equipment and depreciation .............................................................. 1,873 1,463 1,277 Data processing ................................................................................. 759 667 684 Provision for contingencies ............................................................... 417 1,625 550 FDIC expense .................................................................................... 2,319 2,226 3,753 Other real estate owned expense ....................................................... 6,454 3,126 2,772 Professional fees ................................................................................ 4,551 3,922 4,752 Mortgage related loan expense .......................................................... 2,662 753 484 Other operating expense .................................................................... 5,296 3,688 4,032
Total noninterest expense ........................................................ 53,124 37,054 36,317
Income (loss) before income taxes ............................................................. 6,690 5,199 (4,996)Income tax (benefit) provision ......................................................... (2,964) (6,433) 8,958
Net income (loss) ..................................................................... 9,654 11,632 (13,954)Accumulated declared dividends on preferred stock ............... (941) — — Accumulated undeclared dividends on preferred stock ........... (17) (440) (1,075)
Net income (loss) allocable to common shareholders ............. $ 8,696 $ 11,192 $ (15,029)
Income (loss) per common share:
Basic .................................................................................................. $ 0.57 $ 0.99 $ (1.44)Diluted ............................................................................................... $ 0.55 $ 0.98 $ (1.44)
Weighted average number of common shares outstanding:
Basic .................................................................................................. 15,386,106 11,361,389 10,434,665 Diluted ............................................................................................... 17,674,974 11,371,524 10,434,665
The accompanying notes are an integral part of these consolidated financial statements.

70
PACIFIC MERCANTILE BANCORP AND SUBSIDIARIES CONSOLIDATED STATEMENT OF COMPREHENSIVE INCOME (LOSS)
(Dollars in thousands)
Year Ended December 31
2012
2011
2010
Net income (loss) ............................................................................................................ $ 9,654 $ 11,632 $ (13,954)Other comprehensive income (loss), net of tax:
Change in unrealized gain (loss) on securities available for sale .......................... 1,533 2,670 (1,946)Change in net unrealized gain (loss) and prior service benefit on supplemental
executive retirement plan ................................................................................. (55) 31 72
Total comprehensive income (loss) ................................................................................ $ 11,132 $ 14,333 $ (15,828)
The accompanying notes are an integral part of these consolidated financial statements.

71
PACIFIC MERCANTILE BANCORP AND SUBSIDIARIES CONSOLIDATED STATEMENTS OF SHAREHOLDERS’ EQUITY
(Shares and dollars in thousands)
For the Three Years Ended December 31, 2012
Series A, B, and C Preferred stock Common stock Retained
earnings (accumulated
deficit)
Accumulatedother
comprehensiveincome (loss)
Total
Numberof shares Amount
Numberof shares Amount
Balance at December 31, 2009 ...................... 81 8,050 10,435 72,891 (3,599) (2,870) 74,472 Issuances of Series A Cumulative Preferred
Stock ......................................................... 46 4,605 — — — — 4,605 Common stock based compensation expense ... — — — 167 — — 167 Net loss .......................................................... — — — — (13,954) — (13,954)Change in accumulated comprehensive loss .... — — — — — (1,874) (1,874)
Balance at December 31, 2010 ...................... 127 $ 12,655 10,435 $ 73,058 $ (17,553) $ (4,744) $ 63,416 Series A Preferred Stock conversion to
common stock ........................................... (116) (11,555) 1,510 11,406 — — (149)Series A Preferred Stock dividend .................
328 1,624 (1,624) — —
Net proceeds from issuance of Series B Preferred Stock .......................................... 112 8,747 — — — — 8,747
Common stock based compensation expense ... — — — 278 — — 278 Net income ..................................................... — — — — 11,632 — 11,632 Change in accumulated comprehensive
income ....................................................... — — — — — 2,701 2,701
Balance at December 31, 2011 ...................... 123 $ 9,847 12,273 $ 86,366 $ (7,545) $ (2,043) $ 86,625 Sale of Common stock ................................... — — 4,201 24,591 — — 24,591 Conversion of Series A Preferred Stock
conversion to common stock ..................... (11) (1,100) 144 1,100 — — — Series A Preferred Stock dividend ................. — — 37 207 (207) — — Series C Preferred Stock issued as a stock
dividend on Series B Preferred Stock ....... 13 1,280 — — (1,280) — — Common Stock based compensation
expense ...................................................... — — — 483 — — 483 Common stock options exercised .................. — — 22 1 — — 1 Common Stock warrants issued ..................... — — — 44 — — 44 Net income ..................................................... — — — — 9,654 — 9,654 Change in accumulated comprehensive
income ....................................................... — — — — — 1,478 1,478
Balance at December 31, 2012 ...................... 125 $ 10,027 16,677 $112,792 $ 622 $ (565) $122,876
The accompanying notes are an integral part of these consolidated financial statements.

72
PACIFIC MERCANTILE BANCORP AND SUBSIDIARIES CONSOLIDATED STATEMENTS OF CASH FLOWS
(In thousands) Year Ended December 31,
2012 2011
2010
Cash Flows From Operating Activities: Net income (loss) ............................................................................................................ $ 9,654 $ 11,632 $ (13,954)Adjustments to reconcile net income (loss) to net cash used in operating activities: ......
Depreciation and amortization .............................................................................. 506 499 504 Provision for loan losses ....................................................................................... 1,950 (833) 8,288 Net amortization of premium on securities ........................................................... 363 585 611 Net gains on sales of securities available for sale ................................................. (2,123) (405) (1,530)Other than temporary impairments on securities available for sale ...................... 77 169 286 Net gains on sales of mortgage loans held for sale ............................................... (45,639) (3,845) (3,108)Net mark to market on mortgage loans held for sale ............................................ (943) (848) — Proceeds from sales and principal reductions of mortgage loans held for sale ..... 982,840 311,576 205,732 Originations and purchases of mortgage loans held for sale ................................. (933,214) (359,094) (217,050)Repurchases of mortgage loans held for sale ........................................................ (1,209) — — Net amortization of deferred fees and unearned income on loans ........................ (478) (633) (616)Net gain on sales of other real estate owned ......................................................... 528 (158) 64 Net gain on sale of fixed assets ............................................................................. (25) (18) — Write downs of other real estate owned ................................................................ 5,501 1,373 1,874 Stock-based compensation expense ...................................................................... 483 278 167 Net mark to market loss on derivatives ................................................................. 2,268 36 — Net mark to market gain on mortgage servicing rights ......................................... (2,801) — — Changes in operating assets and liabilities: ...........................................................
Net decrease in accrued interest receivable ................................................ 263 754 471 Net increase in other assets ........................................................................ (4,982) (876) (6,254)Net (increase) decrease in deferred taxes ................................................... (4,954) (7,227) 10,012 Net (increase) decrease in income taxes receivable ................................... (1,444) 7,400 980 Net decrease (increase) accrued interest payable ....................................... 388 459 (916)Net increase in other liabilities ................................................................... 3,347 2,224 4,189
Net cash provided by (used in) operating activities ......................... 10,356 (36,952) (10,250)Cash Flows From Investing Activities:
Net (increase) decrease in interest-bearing time deposits with financial institutions ...... (1,000) 655 7,722 Maturities of and principal payments received for securities available for sale and
other stock .................................................................................................................. 29,992 11,081 32,000 Purchase of securities available for sale and other stock ................................................. (150,455) (72,311) (280,992)Proceeds from sale of securities available for sale and other stock ................................. 185,696 95,609 242,822 Proceeds from sale of other real estate owned................................................................. 12,514 13,901 5,750 Capitalized cost of other real estate owned ..................................................................... (381) (212) (1,877)Net (increase) decrease in loans ...................................................................................... (72,602) 59,387 64,572 Net increase in commercial loans held for sale ............................................................... 4,503 — — Purchases of premises and equipment ............................................................................. (902) (541) (110)Proceeds from sales of mortgage loans held for investment ............................................ — 1,586 — Proceeds from sale of premises and equipment ............................................................... 36 18 —
Net cash provided by investing activities ........................................ 7,401 109,173 69,887 Cash Flows From Financing Activities:
Proceeds from sale of common stock .............................................................................. 24,591 — — Proceeds from issuance of Series A Preferred Stock ....................................................... — — 4,605 Proceeds from issuance of Series B Preferred Stock ....................................................... — 8,747 — Net (decrease) increase in deposits.................................................................................. (16,652) 45,821 (144,212)Net increase (decrease) in borrowings ............................................................................ 6,000 (63,000) (29,003)Proceeds from exercise of employee common stock options .......................................... 1 — — Proceeds from sale of common stock purchase warrants ................................................ 44 — —
Net cash provided by (used in) financing activities ......................... 13,984 (8,432) (168,610)Net increase (decrease) in cash and cash equivalents ................................................................ 31,741 63,789 (108,973)
Cash and Cash Equivalents, beginning of period ............................................................ 96,467 32,678 141,651 Cash and Cash Equivalents, end of period ...................................................................... $ 128,208 $ 96,467 $ 32,678
Supplementary Cash Flow Information:
Cash paid for interest on deposits and other borrowings ................................................. $ 8,155 $ 10,641 $ 19,802
Cash paid for income taxes ............................................................................................. 2,872 978 —
The accompanying notes are an integral part of these consolidated financial statements.

73
(Dollars in thousands) Year Ended December 31, 2012 2011
2010
Non-Cash Investing Activities: ..................................................................
Transfer of loans into other real estate owned ........................................... $ — $ 46,894 $ 28,269
Transfer of loans held for sale to loans held for investment ...................... $10,004 $ 1,586 $ —
Transfer of loans held for investment to loans held for sale ...................... $ 5,388 $ — $ —
Non-Cash Financing Activities:
Conversion of Series A Preferred Stock to common stock ........................ $ 1,100 $ — $ —
The accompanying notes are an integral part of these consolidated financial statements.

PACIFIC MERCANTILE BANCORP AND SUBSIDIARIES NOTES TO CONSOLIDATED FINANCIAL STATEMENTS
74
1. Nature of Business Organization
Pacific Mercantile Bancorp (“PMBC”) is a bank holding company which, through its wholly owned subsidiary, Pacific Mercantile Bank (the “Bank”) is engaged in commercial banking, and also conducts a mortgage banking business, in Southern California. PMBC is registered as a one bank holding company under the United States Bank Holding Company Act of 1956, as amended. The Bank is chartered by the California Department of Financial Institutions (the “DFI”) and is a member of the Federal Reserve Bank of San Francisco (“FRBSF”). In addition, the deposit accounts of the Bank’s customers are insured by the Federal Deposit Insurance Corporation (“FDIC”) up to the maximum amount allowed by law. For ease of reference, PMBC and the Bank are sometimes referred to, together, in this report as the “Company” or as “we”, “us” or “our”.
Substantially all of our operations are conducted and substantially all our assets are owned by the Bank, which accounts for substantially all of our consolidated revenues, expenses and earnings. The Bank provides a full range of banking services to small and medium-size businesses, professionals and the general public in Orange, Los Angeles, San Bernardino and San Diego Counties of California and is subject to competition from other banks and financial institutions and from financial services organizations conducting operations in those same markets.
2. Significant Accounting Policies The accompanying consolidated financial statements have been prepared in accordance with the instructions of the
U.S. Securities and Exchange Commission (the “SEC”) to Form 10-K and in accordance with generally accepted accounting principles in effect in the United States (“GAAP”), on a basis consistent with prior periods.
Use of Estimates
The preparation of the financial statements in conformity with generally accepted accounting principles requires us to make certain estimates and assumptions that could affect the reported amounts of certain of our assets, liabilities, and contingencies at the date of the financial statements and the reported amounts of our revenues and expenses during the reporting periods. For the fiscal periods covered by this Report, those estimates related primarily to our determinations of the allowance for loan losses, the fair values of securities available for sale and mortgage loans held for sale, repurchase reserves on mortgage loans held for sale, and the determination of reserves pertaining to deferred tax assets. If circumstances or financial trends on which those estimates were based were to change in the future or there were to occur any currently unanticipated events affecting the amounts of those estimates, our future financial position or results of operations could differ, possibly materially, from those expected at the current time.
Principles of Consolidation Our consolidated financial statements for the years ended December 31, 2012, 2011 and 2010 include the accounts of
PMBC and its wholly owned subsidiary, Pacific Mercantile Bank. All significant intercompany balances and transactions were eliminated in consolidation.
Cash and Cash Equivalents For purposes of the statements of cash flow, cash and cash equivalents consist of cash and due from banks, interest
bearing demand deposits with the FRBSF, federal funds sold and interest-bearing deposits, with original maturities of 90 days or less, with financial institutions. Generally, federal funds are sold for one-day periods. As of December 31, 2012 and 2011 the Bank maintained required reserves with FRBSF of approximately $607,000 and $282,000, respectively, which are included in cash and due from banks in the accompanying consolidated statements of financial condition.
Federal Home Loan Bank Stock and Federal Reserve Bank Stock The Bank, as a member of the Federal Home Loan Bank System, is required to maintain an investment in capital stock
of the Federal Home Loan Bank of San Francisco (“FHLB”) in varying amounts based on asset size and on amounts borrowed from the FHLB. Because no ready market exists and there is no quoted market value for this stock, the Bank’s investment in this stock is carried at cost.
The Bank also maintains an investment in capital stock of the FRBSF, which is carried at cost because no ready market exists and there is no quoted market value for this stock.

PACIFIC MERCANTILE BANCORP AND SUBSIDIARIES NOTES TO CONSOLIDATED FINANCIAL STATEMENTS
75
Securities Available for Sale, at Fair Value Securities available for sale are those which we intend to hold for an indefinite period of time, but which may be sold
in response to changes in liquidity needs, changes in interest rates, changes in prepayment risks and other similar factors. These securities are recorded at fair value, with unrealized gains and losses excluded from earnings and reported as other comprehensive income or loss, net of taxes. Purchased premiums and discounts are recognized as interest income using the interest method over the term of these securities. Gains and losses on the sale of securities are recorded on the trade date and are determined using the specific identification method.
Declines in the fair value of these securities below their cost which are other-than-temporary are reflected in earnings as realized losses. In determining other-than-temporary losses, we consider a number of factors, including: (1) the length of time and the extent to which the fair value has been less than cost, (2) the financial condition and near-term prospects of the issuer, (3) whether the market decline was affected by macroeconomic conditions, and (4) whether we have the intent to sell the security or it is more likely than not that we will be required to sell the security before its anticipated recovery. A high degree of subjectivity and judgment is involved in assessing whether an other-than-temporary decline exists and such assessments are based on information available to us at the time we make such assessments.
Fair Value Option The fair value option permits us to elect fair value as an alternative measurement for selected financial assets, financial
liabilities, unrecognized firm commitments and written loan commitments not previously carried at fair value. We have elected the fair value option on our mortgage servicing rights and on mortgage loans held for sale (“LHFS”) that were originated subsequent to December 1, 2011. The election was made to better reflect the underlying economics and to mitigate operational complexities of risk management activities related to its LHFS, pursuant to Financial Accounting Standards Board (“FASB”) Accounting Standards Codification (“ASC”) 815, Derivatives and Hedging (“FASB ASC 815”).
Mortgage Loans Held for Sale and Mortgage Banking Revenues With the election of the fair value option for LHFS originated on or subsequent to December 1, 2011, fees and costs
associated such originations are earned and expensed as incurred. For LHFS originated prior to December 1, 2011, such fees and costs are netted and recorded in operations in the period during which such LHFS are sold.
Revenue generated by the Bank’s mortgage loan origination division is comprised primarily from originations to fund either a purchase or to refinance a residential mortgage loan or from the sale of such loan. Fee income also is earned on all mortgage loan originations and in connection with the closing of such loans. Gains or losses recognized on sales of mortgage loans include realized and unrealized gains and losses on LHFS for which the fair value option has been elected. For LHFS for which the fair value option has not been elected, gains and losses include the realized gains or losses, as well as any lower-of-cost-or-market valuation adjustments. The valuation of the Bank’s LHFS approximates a whole-loan price, which includes the value of the related mortgage servicing rights. Both mortgage fee income and gains or losses on sales of mortgage loans are included in mortgage banking revenues as a component of noninterest income in the accompanying statements of operations.
We sell the mortgage loans we originate principally to private and institutional investors and to government-sponsored entities. To the extent a transfer of a mortgage loan qualifies, for accounting purposes, as a sale, we derecognize the asset and record a realized gain or loss on the sale date. If, instead, we determine that the transfer of a mortgage loan does not qualify for accounting purposes as a sale, the transfer would be treated as a secured borrowing. Mortgage loans are placed on nonaccrual status when any portion of the principal or interest is 90 days past due, or earlier if factors indicate that the ultimate collectability of the principal or interest is not probable. Interest received from such loans that are on nonaccrual status is recorded as a reduction of principal. A mortgage loan on non-accrual status is returned to accrual status when the principal and interest become current and it has become probable that principal and interest will be paid in accordance with the contractual terms of the loan.
Mortgage Servicing Rights We sell LHFS in the secondary market and sometimes retain the right to service those loans following their sale. Those
mortgage servicing rights (which are included in other assets in the accompanying consolidated statement of financial condition) are capitalized at the then current fair value of the future net cash flows expected to be realized from servicing the loans and are carried at their estimated fair value, with any difference between carrying cost and estimated fair value recorded in the statement of operations.

PACIFIC MERCANTILE BANCORP AND SUBSIDIARIES NOTES TO CONSOLIDATED FINANCIAL STATEMENTS
76
Loan Loss Obligation on Loans Previously Sold Upon a sale of LHFS that we have originated the risk of loss due to default by the borrower is generally transferred to
the investor. However, we are required to make certain representations to the purchasers of such loans relating to credit information, loan documentation and collateral. These representations and warranties may extend through the contractual life of the loan. If subsequent to the sale of such a loan, any underwriting deficiencies, borrower fraud or documentation defects are discovered with respect to the loan, we may become obligated to repurchase the loan or indemnify the investors for any losses from borrower defaults if such deficiencies or defects cannot be cured within the specified cure periods following their discovery. The obligation for losses attributable to any erroneous representations and warranties or other deficiencies or defects is recorded at its estimate of expected future losses using historical and projected loss frequency and loss severity ratios to estimate our exposure to such losses. In the case of early loan payoffs and early defaults on certain loans, we may be required to repay all or a portion of any premium initially paid by the purchaser of the loan at the time of sale. The obligations associated with early loan payoffs and early defaults on mortgage loans are estimated on the basis of historical loss experience by type of loan.
Accounting for Derivative Instruments and Interest Rate Lock Commitments In accordance with FASB ASC 815-10, the Company records all derivative instruments at fair value. The Company has
accounted for all its derivatives as non-designated hedge instruments or free-standing derivatives. The mortgage banking division enters into interest rate lock commitments and utilizes forward sold Fannie Mae and Ginnie Mae mortgage backed securities (which are sometimes referred to as to-be-announced or TBA securities) to hedge the fair value changes associated with changes in interest rates relating to its mortgage loan origination operations. The Company enters into commitments to originate mortgage loans whereby the interest rate on the loan is set prior to funding (interest rate lock commitments or “IRLCs”). IRLCs on mortgage loan funding commitments for mortgage loans that are intended to be sold are considered to be derivative instruments under GAAP and are recorded at fair value with any change in fair value between reporting periods recorded in operations. Unlike most other derivative instruments, there is no active market for the mortgage loan commitments that can be used to determine their fair value. The Company has developed a methodology for estimating the fair value by calculating the change in market value from a commitment date to measurement date based upon changes in applicable interest rates during the period, adjusted for a fallout factor (loans committed to funding that ultimately do not fund) and includes the value of servicing.
Loans and Allowance for Loan Losses Loans that we intend and have the ability to hold for the foreseeable future or until maturity or pay-off, are stated at
their respective principal amounts outstanding, net of unearned income. Interest is accrued daily as earned, except where reasonable doubt exists as to collectibility of the loan. A loan with principal or interest that is 90 days or more past due, based on its contractual payment due dates, is placed on nonaccrual status, in which case accrual of interest is discontinued, except that we may elect to continue the accrual of interest when the estimated net realizable value of collateral securing the loan is expected to be sufficient to enable us to recover both principal and accrued interest and those loans are in the process of collection. Generally, interest payments received on nonaccrual loans are applied to principal. Once all principal has been received by us, any additional interest payments are recognized as interest income on a cash basis.
An allowance for loan losses is established by means of a provision for loan losses that is charged against income. If we conclude that the collection, in full, of the carrying amount of a loan has become unlikely, the loan, or the portion thereof that is believed to be uncollectible, is charged against the allowance for loan losses. We carefully monitor changing economic conditions, the loan portfolio by category, the financial condition of borrowers and the history of the performance of the loan portfolio in determining the adequacy of the allowance for loan losses. Additionally, as the volume of loans increases, additional provisions for loan losses may be required to maintain the allowance at levels deemed adequate. Moreover, if economic conditions were to deteriorate, causing the risk of loan losses to increase, it would become necessary to increase the allowance to an even greater extent, which would necessitate additional provisions that would be charged to income. We also evaluate the unfunded portion of loan commitments and establish a loss reserve, included in other liabilities, for such unfunded commitments through a charge against noninterest expense. The loss reserve for unfunded loan commitments was $181,000 at both December 31, 2012 and 2011.
The allowance for loan losses is based on estimates, and ultimate loan losses may vary from current estimates. These estimates are reviewed periodically and, as adjustments become necessary, they are recorded in earnings in the periods in which they become known.

PACIFIC MERCANTILE BANCORP AND SUBSIDIARIES NOTES TO CONSOLIDATED FINANCIAL STATEMENTS
77
Impaired Loans A loan is generally classified as impaired when, in management’s opinion, the principal or interest will not be
collectible in accordance with its contractual terms. We measure and reserve for impairment on a loan-by-loan basis using either the present value of expected future cash flows discounted at the loan’s effective interest rate, or the fair value of the collateral if the loan is collateral dependent. We exclude smaller, homogeneous loans, such as consumer installment loans and lines of credit, from these impairment calculations. Also, loans that experience insignificant payment delays or shortfalls are generally not considered impaired.
Restructured Loans We sometimes modify or restructure loans when the borrower is experiencing financial difficulties by making a
concession to the borrower in the form of changes in the amortization terms, reductions in the interest rates, the acceptance of interest only payments and, in limited cases, concessions to the outstanding loan balances. These loans are classified as troubled debt restructurings or “TDRs”. TDRs are loans modified for the purpose of alleviating temporary impairments to the borrower’s financial condition or cash flows. A workout plan between us and the borrower is designed to provide a bridge for borrower cash flow shortfalls in the near term. If the borrower works through such near term issues, in most cases, the original contractual terms of the loan will be reinstated.
Loan Origination Fees and Costs Loan origination fees and related direct costs for loans held for investment are deferred and amortized to interest
income as an adjustment to yield over the respective lives of the loans using the effective interest method, except for loans that are revolving or short-term in nature for which the straight line method is used, which approximates the interest method.
Investment in Unconsolidated Subsidiaries Investment in unconsolidated subsidiaries is stated at cost. The unconsolidated subsidiaries are comprised of two
grantor trusts established in 2002 and 2004, respectively, in connection with our issuance of subordinated debentures in each of those years. During 2002, we organized three business trusts, under the names Pacific Mercantile Capital Trust I, PMB Capital Trust I, and PMB Statutory Trust III, respectively, to facilitate our issuance of $5.155 million, $5.155 million and $7.217 million, respectively, principal amount of junior subordinated debentures, all with maturity dates in 2032. In October 2004, we organized PMB Capital Trust III to facilitate our issuance of an additional $10.310 million principal amount of junior subordinated debentures, with a maturity date in 2034. In July 2007, we redeemed the $5.155 million principal amount of junior subordinated debentures issued in conjunction with the organization of Pacific Mercantile Capital Trust I and in August 2007, we redeemed the $5.155 million principal amount of junior subordinated debentures issued in conjunction with the organization of PMB Capital Trust I. Those trusts were dissolved as a result of those redemptions.
Other Real Estate Owned Other real estate owned (“OREO”) consists of real properties acquired by us through foreclosure or in lieu of
foreclosure in satisfaction of loans. OREO is recorded at fair value less selling costs at the time of acquisition or foreclosure. Loan balances in excess of fair value, less selling costs, are charged to the allowance for loan losses prior to foreclosure. Any subsequent operating expenses or income, reductions in estimated fair values and gains or losses on disposition of such properties are charged or credited to current operations.
Premises and Equipment Premises and equipment are stated at cost, less accumulated depreciation and amortization which are charged to
expense on a straight-line basis over the estimated useful lives of the assets or, in the case of leasehold improvements, over the term of the leases, whichever is shorter. For income tax purposes, accelerated depreciation methods are used. Maintenance and repairs are charged directly to expense as incurred. Improvements to premises and equipment that extend their useful lives are capitalized.
When such an asset is disposed of, the applicable costs and accumulated depreciation thereon are removed from the accounts and any resulting gain or loss is included in current operations. Rates of depreciation and amortization are based on the following estimated useful lives:
Furniture and equipment Three to seven yearsLeasehold improvements Lesser of the lease term or estimated useful life

PACIFIC MERCANTILE BANCORP AND SUBSIDIARIES NOTES TO CONSOLIDATED FINANCIAL STATEMENTS
78
Income Taxes Deferred income taxes and liabilities are determined using the asset and liability method. Under this method, the net
deferred tax asset or liability is determined based on the tax effects of the temporary differences between the book and tax basis of the various balance sheet assets and liabilities and gives current recognition to changes in tax rates and laws.
Deferred tax assets are equal to the tax credit and tax loss carryforwards and tax deductions (“tax benefits”) available to us to offset or reduce income taxes in future periods. Under applicable federal and state income tax laws and regulations, such tax benefits will expire if not used within specified periods of time. Accordingly, our ability to fully use our deferred tax assets depends on the amount of taxable income that we are able to generate during those time periods. At least once each year, or more frequently, if warranted, we make estimates of future taxable income that we believe we are likely to generate during those future periods. If we conclude, on the basis of those estimates and the amount of the tax benefits available to us, that it is more likely than not that we will be able to fully utilize those tax benefits prior to their expiration, we recognize the deferred tax asset in full on our balance sheet. If, on the other hand, we conclude it has become more likely than not that we will be unable to utilize those tax benefits in full prior to their expiration, then we would establish (or increase any existing) valuation allowance to reduce the deferred tax asset on our balance sheet to the amount which we believe we are more likely than not to be able to utilize. Such a reduction is implemented by recognizing a non-cash charge that would have the effect of increasing the provision, or reducing any credit, for income taxes that we would otherwise have recorded in our statements of operations. The determination of whether and the extent to which we will be able to utilize our deferred tax asset involves significant judgments and assumptions that are subject to period to period changes as a result of changes in tax laws, changes in market or economic conditions that could affect our operating results or variances between our actual operating results and our projected operating results, as wells as other factors.
Uncertain tax positions that meet the more likely than not recognition threshold are measured to determine the amount of benefit to recognize. An uncertain tax position is measured at the largest amount of benefit that management believes has a greater than 50% likelihood of realization upon settlement.
Earnings (Loss) Per Share Basic income (loss) per share for any fiscal period is computed by dividing net income (loss) allocable to our common
shareholders for such period by the weighted average number of common shares outstanding during that period. Fully diluted income (loss) per share reflects the potential dilution that could have occurred assuming the conversion of any convertible securities into common stock at conversion prices, and the exercise of all outstanding options and warrants to purchase shares of our common stock at exercise prices, that were less than the market price of our shares, thereby increasing the number of shares outstanding during the period, and is determined using the treasury method. Although accumulated undeclared dividends on our preferred stock are not recorded in the accompanying consolidated statement of operations, such dividends are included for purposes of computing earnings (loss) per share available to our common shareholders.
Stock Option Plans We follow FASB ASC 718-10, Share-Based Payment, which requires entities that grant stock options or other equity
compensation awards to employees to recognize in their financial statements the fair values of those options or share awards as compensation cost over their requisite service (vesting) periods of those options or share awards. Since stock-based compensation cost that is recognized in the statements of operations is to be determined based on the equity compensation awards that we expect will ultimately vest, that compensation expense is reduced for estimated forfeitures of unvested options or unvested share awards that typically occur due primarily to terminations of employment of optionees or recipients of such share awards. Forfeitures are required to be estimated at the time of the grant of options or other share awards and are revised, if necessary, in subsequent periods if actual forfeitures differ from those earlier estimates. For purposes of the determination of stock-based compensation expense for the year ended December 31, 2012, we estimated no forfeitures of unvested options that were granted to non-employee members of the Board of Directors and forfeitures of 4.4% of the options that were granted to officers and other employees.

PACIFIC MERCANTILE BANCORP AND SUBSIDIARIES NOTES TO CONSOLIDATED FINANCIAL STATEMENTS
79
Comprehensive Income (Loss) Accounting principles generally require that recognized revenue, expenses, gains and losses be included in net income.
However, certain changes in assets and liabilities, such as unrealized gains and losses on securities available for sale, are reported as a separate component of the equity in the accompanying consolidated statement of financial condition, net of income taxes, and such items, along with net income, are components of comprehensive income (loss).
The components of other comprehensive income (loss) and related tax effects were as follows:
(In thousands)
Year Ended December 31,
2012 2011
2010
Unrealized holding gain (loss) arising during period from securities available for sale ....................................................... $ 530 $ 2,434 $ (1,231)
Reclassification adjustment for gains included in income ............. 2,123 405 1,530 Reclassification adjustment for other-than-temporary
impairments .............................................................................. (77) (169) (286)
Net unrealized holding gain (loss) ................................................. 2,576 2,670 13 Net unrealized supplemental executive plan expense .................... (65) 31 121 Income tax effect ........................................................................... (1,033) — (2,008)
Other comprehensive income (loss) ..................................... $ 1,478 $ 2,701 $ (1,874)
The components of accumulated other comprehensive loss included in shareholders’ equity is as follows:
(Dollars in thousands)
As of December 31,
2012 2011
Net unrealized holding loss on securities available for sale .................. $ (928) $(2,078)Net unrealized supplemental executive plan expense ........................... (30) 35 Income tax effect .................................................................................. 393 —
Accumulated other comprehensive loss ...................................... $ (565) $(2,043)
Recent Accounting Pronouncements In May 2011, the FASB issued ASU 2011-04 – Amendments to Achieve Common Fair Value Measurement and
Disclosure Requirements (“ASU 2011-04”), clarifying how to measure and disclose fair value. This guidance amends the application of the “highest and best use” concept to be used only in the measurement of fair value of nonfinancial assets, clarifies that the measurement of the fair value of equity-classified financial instruments should be performed from the perspective of a market participant who holds the instrument as an asset, clarifies that an entity that manages a group of financial assets and liabilities on the basis of its net risk exposure can measure those financial instruments on the basis of its net exposure to those risks, and clarifies when premiums and discounts should be taken into account when measuring fair value. The fair value disclosure requirements also were amended. For public entities, the amendments in ASU 2011-04 are effective prospectively for interim and annual periods beginning after December 15, 2011. The adoption of the amended guidance did not have a significant impact on the Company’s results of operations or financial position.
On June 16, 2011, the FASB issued ASU No. 2011-05, “Presentation of Comprehensive Income”, which revises the manner in which entities present comprehensive income in their financial statements. The new guidance removes the presentation options in ASC 220 and requires entities to report components of comprehensive income in either (i) a continuous statement of comprehensive income, or (ii) two separate but consecutive statements. The ASU does not change the items that must be reported in other comprehensive income. The amendments are effective for fiscal years, and interim periods within those years, beginning after December 15, 2011. The adoption of ASU No. 2011-05 did not have a material impact on the Company’s statements of income and financial condition.
Significant Adjustments Each quarter, the Company evaluates all of the significant adjustments that were identified during the quarter to
determine whether the adjustments should be recorded in their entirety during that quarter or in one or more preceding quarters. During the third quarter of 2012, we evaluated a significant adjustment in connection with the recognition of a non-cash income tax benefit resulting from the reduction of the valuation allowance we had previously recorded against our deferred tax asset (Note 11). We determined that this adjustment only affected and, accordingly, was properly reflected in our results of operations for the third quarter of 2012 and the year ended December 31, 2012.

PACIFIC MERCANTILE BANCORP AND SUBSIDIARIES NOTES TO CONSOLIDATED FINANCIAL STATEMENTS
80
Subsequent events Subsequent events are events or transactions that occur after the balance sheet date but before financial statements are
issued. The Company recognizes in the financial statements the effects of all subsequent events that provide additional evidence about conditions that existed at the date of the balance sheet, including the estimates inherent in the process of preparing the financial statements. The Company’s financial statements do not recognize subsequent events that provide evidence about conditions that did not exist at the date of the balance sheet but arose after the balance sheet date and before financial statements are available to be issued.
The Company has evaluated events subsequent through the data these consolidated financial statements were filed with the Securities and Exchange Commission.
3. Regulatory Actions On August 31, 2010, the Company and the Bank entered into a Written Agreement with the FRBSF (the “FRB
Agreement”). On the same date, the Bank consented to the issuance of a regulatory order by the California Department of Financial Institutions (the “DFI Order”). The principal purposes of the FRB Agreement and DFI Order, which constitute formal supervisory actions by the FRB and the DFI, were to require us to adopt and implement formal plans and take certain actions, as well as to continue to implement other measures that we previously adopted, to address the adverse consequences that the economic recession had on the performance of our loan portfolio and our operating results, to improve our operating results, and to increase our capital to strengthen our ability to weather any further adverse economic conditions that might arise in the future.
The FRB Agreement and DFI Order contain substantially similar provisions. They required the Boards of Directors of the Company and the Bank to prepare and submit written plans to the FRB and the DFI to address the following matters: (i) strengthening board oversight of the management operations of the Bank; (ii) strengthening credit risk management practices; (iii) improving credit administration policies and procedures; (iv) improving the Bank’s position with respect to problem assets; (v) maintaining adequate reserves for loan losses in accordance with applicable supervisory guidelines; (vi) improving the capital position of the Bank and, in the case of the FRB Agreement, the capital position of the Company; (vii) improving the Bank’s earnings through the formulation, adoption and implementation of a new strategic plan, and (viii) submitting a satisfactory funding contingency plan for the Bank that would identify available sources of liquidity and a plan for dealing with adverse economic and market conditions that might arise in the future. The Bank is also prohibited from paying dividends to the Company without the prior approval of the DFI, and the Company may not declare or pay cash dividends, repurchase any of its shares, make payments on its trust preferred securities or incur or guarantee any debt, without the prior approval of the FRBSF.
The Company and the Bank already have made substantial progress with respect to several of these requirements and both the Board and management are committed to achieving all of the requirements. However, a failure by the Company or the Bank to meet any of the requirements of the FRB Agreement or a failure by the Bank to meet any of the requirements of the DFI Order could be deemed, by the FRB or the DFI, to be conducting business in an unsafe manner which could subject the Company or the Bank to further regulatory enforcement action.
Under the DFI Order, the Bank was required to achieve a ratio of adjusted tangible shareholders’ equity-to-tangible assets of 9.0% by January 31, 2011, by raising additional capital, generating earnings or reducing the Bank’s tangible assets (subject to a 15% limitation on such a reduction) or a combination thereof and, upon achieving that ratio, to thereafter maintain that ratio during the term of the DFI Order.
In August 2011, we completed the sale of $11.2 million of Series B Convertible 8.4% Series B Preferred Stock (the “Series B Preferred Stock”) and contributed the net proceeds from that sale to the Bank, thereby increasing its ratio of adjusted tangible shareholders’ equity-to-tangible assets to 9.0%, as required by the DFI Order. As a result of an additional contribution of capital to the Bank of $15 million from the sale of $26.3 million of shares of our common stock in April 2012, and earnings generated by the Bank in 2012, that ratio had increased to 11.6% as of December 31, 2012.
4. Interest-Bearing Deposits and Interest-Bearing Time Deposits with Financial Institutions At December 31, 2012, the Company had $116 million in interest bearing deposits at other financial institutions, as
compared to $86.2 million at December 31, 2011. The weighted average percentage yields on these deposits for years ended December 31, 2012 and December 31, 2011 were 0.25%. Interest bearing deposits with financial institutions can be withdrawn by the Company on demand and are considered cash equivalents for purposes of the consolidated statements of cash flows.

PACIFIC MERCANTILE BANCORP AND SUBSIDIARIES NOTES TO CONSOLIDATED FINANCIAL STATEMENTS
81
At December 31, 2012, we had $2.4 million of interest-bearing time deposits at other financial institutions, which were scheduled to mature within one year or had no stated maturity date. By comparison, as of December 31, 2011, the time deposits at other financial institutions totaled $1.4 million. The weighted average percentage yields on these deposits were 0.15% and 0.57% for the years ended December 31, 2012 and December 31, 2011, respectively.
5. Securities Available For Sale, at Fair Value
The following are summaries of the major components of securities available for sale and a comparison of amortized cost, estimated fair market values, and gross unrealized gains and losses at December 31, 2012 and 2011:
(Dollars in thousands)
December 31, 2012 December 31, 2011
AmortizedCost
Gross Unrealized EstimatedFair Value
AmortizedCost
Gross Unrealized Estimated
Fair Value Gain Loss Gain
Loss
Securities Available for Sale
Mortgage backed securities issued by U.S. Agencies(1) .... $ 78,053 $ 553 $ (160) $ 78,446 $133,859 $ 630 $ (363) $ 134,126
Municipal securities ................. — — — — 6,389 96 (42) 6,443Collateralized mortgage
obligations issued by non agencies(1) ............................. 2,599 87 (61) 2,625 3,040 — (455) 2,585
Asset backed security(2) ............. 2,247 — (1,347) 900 2,324 — (1,944) 380Mutual funds(3) .......................... 4,407 — — 4,407 4,375 — — 4,375
Total ............................... $ 87,306 $ 640 $ (1,568) $ 86,378 $149,987 $ 726 $ (2,804) $ 147,909
(1) Secured by closed-end first liens on 1-4 family residential mortgages. (2) Comprised of a security that represents an interest in a pool of trust preferred securities issued by U.S.-based banks and
insurance companies. (3) Consists primarily of mutual fund investments in closed-end first lien 1-4 family residential mortgages.
At December 31, 2012 and 2011, U.S. agency mortgage backed securities and collateralized mortgage obligations with an aggregate fair market value of $10 million and $12 million, respectively, were pledged to secure FHLB borrowings, repurchase agreements, local agency deposits and treasury, tax and loan accounts.
The amortized cost and estimated fair values of securities available for sale at December 31, 2012 and December 31, 2011 are shown in the tables below by contractual maturities and historical prepayments based, in each case, on the prior twelve months of principal payments. Expected maturities will differ from contractual maturities, particularly with respect to collateralized mortgage obligations, primarily because prepayment rates are affected by changes in conditions in the interest rate market and, therefore, may cause future prepayment rates to differ from historical prepayment rates.
At December 31, 2012 Maturing in
(Dollars in thousands)
One year or less
Over one year through
five years Over five
years through ten years
Over ten Years
Total
Securities available for sale, amortized cost ...... $ 11,679 $ 35,038 $ 24,738 $ 15,851 $ 87,306 Securities available for sale, estimated fair
value .............................................................. 11,788 35,264 24,747 14,579 86,378 Weighted average yield ..................................... 1.59% 1.62% 1.62% 1.43% 1.58%
At December 31, 2011 Maturing in
(Dollars in thousands)
One year or less
Over one year through
five years Over five
years through ten years
Over ten Years
Total
Securities available for sale, amortized cost .... $ 13,443 $ 44,574 $ 38,950 $ 53,020 $149,987 Securities available for sale, estimated fair
value ............................................................ 13,388 44,353 39,087 51,081 147,909 Weighted average yield ................................... 2.15% 2.32% 2.43% 2.48% 2.39%

PACIFIC MERCANTILE BANCORP AND SUBSIDIARIES NOTES TO CONSOLIDATED FINANCIAL STATEMENTS
82
We recognized net gains on sales of securities available for sale of (i) $2.1 million on sale proceeds of $186 million during the year ended December 31, 2012, and (ii) $405,000 on sale proceeds of $96 million during the year ended December 31, 2011.
The tables below show, as of December 31, 2012 and 2011, the respective fair values of and the gross unrealized losses on our investments, aggregated by investment category, and the lengths of time that the individual securities have been in a continuous unrealized loss position.
Securities with Unrealized Loss at December 31, 2012
Less than 12 months 12 months or more Total
(Dollars in thousands)
Fair Value Unrealized
Loss Fair Value Unrealized
Loss Fair Value
UnrealizedLoss
Mortgage backed securities issued by U.S. Agencies...................................... $ 35,996 $ (160) $ 39 $ — $ 36,035 $ (160)
Non-agency collateralized mortgage obligations ........................................... — — 1,172 (61) 1,172 (61)
Asset backed security .............................. — — 900 (1,347) 900 (1,347)
Total ............................................... $ 35,996 $ (160) $ 2,111 $ (1,408) $ 38,107 $ (1,568)
Securities With Unrealized Loss as of December 31, 2011
Less than 12 months 12 months or more Total
(Dollars In thousands)
Fair Value Unrealized
Loss Fair Value Unrealized
Loss Fair Value
UnrealizedLoss
Mortgage backed securities issued by U.S. Agencies...................................... $ 5,387 $ (9) $ 39,345 $ (354) $ 44,732 $ (363)
Municipal securities ................................. — — 1,784 (42) 1,784 (42)Non-agency collateralized mortgage
obligations ........................................... 813 (67) 1,771 (388) 2,584 (455)Asset-backed security .............................. — — 380 (1,944) 380 (1,944)
Total .............................................. $ 6,200 $ (76) $ 43,280 $ (2,728) $ 49,480 $ (2,804)
We regularly monitor investments for significant declines in fair value. We have determined that declines in the fair values of these investments below their respective amortized costs, as set forth in the tables above, are temporary because (i) those declines were due to interest rate changes and not to a deterioration in the creditworthiness of the issuers of those investment securities, and (ii) we have the ability to hold those securities until there is a recovery in their values or until their maturity.
We recognize other-than-temporary impairments (“OTTI”) to our available-for-sale debt securities in accordance with FASB ASC 320-10. When there are credit losses associated with, but we have no intention to sell, an impaired debt security, and it is more likely than not that we will not have to sell the security before recovery of its cost basis, we will separate the amount of impairment, or OTTI, between the amount that is credit related and the amount that is related to non-credit factors. Credit-related impairments are recognized in our consolidated statements of operations. Any non-credit-related impairments are recognized and reflected in other comprehensive income (loss).
Through the impairment assessment process, we determined that the available-for-sale securities discussed below were other-than-temporarily impaired at December 31, 2012. We recorded in our consolidated statements of operations for the year ended December 31, 2012 impairment credit losses of $77,000 on available-for-sale securities. The OTTI related to factors other than credit losses, in the aggregate amount of $1.8 million, was recognized as other comprehensive loss in our accompanying consolidated statement of financial condition.

PACIFIC MERCANTILE BANCORP AND SUBSIDIARIES NOTES TO CONSOLIDATED FINANCIAL STATEMENTS
83
The table below presents, for the year ended December 31, 2012, a roll-forward of OTTI in those instances when a portion of the OTTI was attributable to non-credit related factors and, therefore, was recognized in other comprehensive loss:
(Dollars in thousands)
Gross Other-Than-
Temporary Impairments
Other-Than- Temporary
Impairments Included in Other Comprehensive
Loss
Net Other-Than- Temporary
Impairments Included in
Retained Earnings(Deficit)
Balance – December 31, 2010 ......................................... $ (2,666) $ (2,181) $ (485)Changes for credit losses on securities for which an
OTTI was not previously recognized .......................... (41) 128 (169)
Balance – December 31, 2011 ......................................... $ (2,707) $ (2,053) $ (654)Changes for credit losses on securities for which an
OTTI was not previously recognized .......................... 131 208 (77)
Balance – December 31, 2012 ......................................... $ (2,576) $ (1,845) $ (731)
In determining the component of OTTI related to credit losses, we compare the amortized cost basis of each OTTI security to the present value of its expected cash flows, discounted using the effective interest rate implicit in the security at the date of acquisition.
As a part of our OTTI assessment process with respect to securities held for sale with unrealized losses, we consider available information about (i) the performance of the collateral underlying each such security, including credit enhancements, (ii) historical prepayment speeds, (iii) delinquency and default rates, (iv) loss severities, (v) the age or “vintage” of the security, and, (vi) rating agency reports on the security. Significant judgments are required with respect to these and other factors in order to make a determination of the future cash flows that can be expected to be generated by the security.
Based on our OTTI assessment process, we determined that there is one asset-backed security in our portfolio of securities held for sale that had become or was impaired as of December 31, 2012. This security is a multi-class, cash flow collateralized bond obligation backed by a pool of trust preferred securities issued by a diversified pool of 56 issuers consisting of 45 U.S. depository institutions and 11 insurance companies at the time of the security’s issuance in November 2007. We purchased $3.0 million face amount of this security in November 2007 at a price of 95.21% for a total purchase price of $2,856,420, out of a total of $363 million of this security sold at the time of issuance. The security that we own (CUSIP 74042CAE8) is the mezzanine class B piece security with a variable interest rate of 3 month LIBOR +60 basis points, which had a rating of Aa2/AA by Moody’s and Fitch at the time of issuance in 2007.
As of December 31, 2012 the amortized cost of this security was $2.2 million with a fair value of $900,000, for an unrealized loss of approximately $1.3 million. Currently, the security has a Ca rating from Moody’s and CC rating from Fitch and has experienced $47.5 million in defaults (13% of total current collateral) and $43.5 million in deferring securities (12% of total current collateral) from issuance to December 31, 2012. The security did not pay its scheduled fourth quarter interest payment. The Company is not currently accruing interest on this security. The Company estimates that the security could experience another $73.5 million in defaults before the issuer would not receive all of the contractual cash flows under this security. This analysis is based on the following assumptions: future default rates of 2%, prepayment rates of 1% until maturity, and 15% recovery of future defaults. With respect to this security, we have recognized impairment losses to earnings of $77,000, $169,000, and $199,000 for the years ended December 31, 2012, December 31, 2011 and December 31, 2010, respectively. Set forth below is additional information regarding impairment losses that we recognized in earnings for the year ended December 31, 2012:
Impairment Losses on OTTI Securities
For the Year Ended December 31,
(Dollars in thousands) 2012 2011
2010
Asset Backed Security ........................................................................... $ (77) $(169) $(199)Non Agency CMO ................................................................................. — — (87)
Total impairment loss recognized in earnings ....................................... $ (77) $(169) $(286)

PACIFIC MERCANTILE BANCORP AND SUBSIDIARIES NOTES TO CONSOLIDATED FINANCIAL STATEMENTS
84
We have made a determination that the remainder of our securities with respect to which there were unrealized losses as of December 31, 2012 are not other-than-temporarily impaired, because we have concluded that we have the ability to continue to hold those securities until their respective fair market values increase above their respective amortized costs or, if necessary, until their respective maturities. In reaching that conclusion we considered a number of factors and other information, which included: (i) the significance of each such security, (ii) the amount of the unrealized losses attributable to each such security, (iii) our liquidity position, (iv) the impact that retention of those securities could have on our capital position and (v) our evaluation of the expected future performance of these securities (based on the criteria discussed above).
6. Loans and Allowance for Loan Losses The loan portfolio consisted of the following at:
December 31, 2012 December 31, 2011
(Dollars in thousands)
Amount Percent Amount
Percent
Commercial loans .......................................................... $ 170,792 23.4% $ 179,305 27.2%Commercial real estate loans – owner occupied ........... 165,922 22.7% 170,960 26.0%Commercial real estate loans – all other ........................ 150,189 20.6% 121,813 18.5%Residential mortgage loans – multi-family ................... 105,119 14.4% 65,545 10.0%Residential mortgage loans – single family ................... 87,263 11.9% 68,613 10.4%Construction loans ......................................................... — — 2,120 0.3%Land development loans ................................................ 24,018 3.3% 25,638 3.9%Consumer loans ............................................................. 27,296 3.7% 24,285 3.7%
Gross loans .................................................................... 730,599 100.0% 658,279 100.0%
Deferred fee (income) costs, net .................................... (461) (690) Allowance for loan losses ............................................. (10,881) (15,627)
Loans, net............................................................. $ 719,257 $ 641,962
At December 31, 2012 and 2011, real estate loans of approximately $162 million and $161 million, respectively, were pledged to secure borrowings obtained from the Federal Home Loan Bank.
Allowance for Loan Losses The allowance for loan losses (“ALL”) represents our estimate of credit losses inherent in the loan portfolio at the
financial statement date. We employ economic models that are based on bank regulatory guidelines, industry standards and our own historical loan loss experience, as well as a number of more subjective qualitative factors, to determine both the sufficiency of the allowance for loan losses and the amount of the provisions that are required to be made to maintain the adequacy of the ALL.
The ALL is first determined by analyzing all classified loans (graded as “Substandard” or “Doubtful” under our internal credit quality grading parameters) that are on non-accrual status for loss exposure on such loans and then establishing specific reserves, within the ALL, for such loans as needed. ASC 310-10 defines loan impairment as the existence of uncertainty concerning collection of all principal and interest in accordance with the contractual terms of a loan. For collateral dependent loans, impairment is typically measured by comparing the loan amount to the fair value of collateral, less estimated costs to sell, with a specific reserve established for any shortfall for the amount by which, if any, that the carrying value of the loan exceeds its fair value. Other methods can be used in estimating a loan impairment, including market prices and the present value of expected future cash flows discounted at the loan’s original interest rate.

PACIFIC MERCANTILE BANCORP AND SUBSIDIARIES NOTES TO CONSOLIDATED FINANCIAL STATEMENTS
85
On a quarterly basis, we utilize a classification migration model and analytical loan review tools as starting points for determining the adequacy of the ALL for homogenous pools of loans that do not require the establishment of specific reserves within the ALL. Our loss migration analysis tracks a certain number of quarters of loan loss history and industry loss factors to determine historical losses for each homogenous group of loans, except certain consumer loans. We then apply the calculated loss factors, by classification category, together with a qualitative factor based on external economic factors and internal assessments, to the outstanding loan balances in each homogenous group of loans. Our classification categories for our loans include “Pass,” “Special Mention,” “Substandard” and “Doubtful”. We also conduct individual loan review analysis, as part of the allowance for loan losses allocation process, applying specific monitoring policies and procedures in analyzing the existing loan portfolio. Set forth below is a summary of the Company’s activity in the ALL during the years ended:
December 31,
2012 2011
2010
(In thousands) Balance, beginning of year ...................................................... $ 15,627 $ 18,101 $ 20,345 Provision for loan losses .......................................................... 1,950 (833) 8,288 Recoveries on loans previously charged off ............................ 1,878 1,095 3,033 Charged off loans ..................................................................... (8,574) (2,736) (13,565)
Balance, end of year ................................................................ $ 10,881 $ 15,627 $ 18,101
At December 31, 2012, the ALL totaled $10.9 million, as compared to $15.6 million and $18.1 million at December 31, 2011 and 2010, respectively. We were able to reduce the ALL during 2012 primarily as a result of an improvement in the credit quality ratings of the loans in our loan portfolio. This improvement included a $14 million decline in substandard loans and a decline of $11 million in special mention loans during 2012. Net loan charge-offs improved over the historical loss periods, and changes in the composition of our loan portfolio to a greater proportion of real estate commercial loans, resulted in improvements to the loss factors used to assess the adequacy of the ALL.

PACIFIC MERCANTILE BANCORP AND SUBSIDIARIES NOTES TO CONSOLIDATED FINANCIAL STATEMENTS
86
Set forth below is information regarding loan balances and the related ALL, by portfolio type, as of and for the years ended December 31, 2012 and 2011.
(Dollars in thousands)
Commercial Real Estate(1) Construction
and Land Development
Consumer andSingle Family
Mortgages
Total ALL in the year ended December 31, 2012:
Balance at beginning of year .......................... $ 8,908 $ 5,777 $ 316 $ 626 $ 15,627 Charge offs ............................................ (6,664) (1,184) (158) (568) (8,574)Recoveries ............................................. 1,657 198 — 23 1,878 Provision ............................................... 2,439 (1,304) 90 725 1,950
Balance at end of year ..................................... $ 6,340 $ 3,487 $ 248 $ 806 $ 10,881
ALL balance at end of year related to:
Loans individually evaluated for impairment........................................ $ 2,428 $ — $ — $ — $ 2,428
Loans collectively evaluated for impairment........................................ $ 3,912 $ 3,487 $ 248 $ 806 $ 8,453
Loans balance at end of year:
Loans individually evaluated for impairment........................................ $ 16,180 $ 21,918 $ 314 $ 839 $ 39,251
Loans collectively evaluated for impairment........................................ 154,612 399,312 23,704 113,720 691,348
Ending Balance ............................................... $ 170,792 $ 421,230 $ 24,018 $ 114,559 $ 730,599
ALL in the year ended December 31, 2011:
Balance at beginning of year .......................... $ 10,017 $ 6,351 $ 830 $ 903 $ 18,101 Charge offs ............................................ (1,218) (1,315) (138) (65) (2,736)Recoveries ............................................. 1,067 3 — 25 1,095 Provision ............................................... (958) 738 (376) (237) (833)
Balance at end of year ..................................... $ 8,908 $ 5,777 $ 316 $ 626 $ 15,627
ALL Balance at end of year related to:
Loans individually evaluated for impairment........................................ $ 1,648 $ 1,135 $ — $ — $ 2,783
Loans collectively evaluated for impairment........................................ $ 7,260 $ 4,642 $ 316 $ 626 $ 12,844
Loans balance at end of year:
Loans individually evaluated for impairment........................................ $ 5,140 $ 10,088 $ 2,597 $ 570 $ 18,395
Loans collectively evaluated for impairment........................................ 174,165 348,230 25,088 92,401 639,884
Ending Balance ............................................... $ 179,305 $ 358,318 $ 27,685 $ 92,971 $ 658,279
(1) Excludes mortgage loans held for sale.

PACIFIC MERCANTILE BANCORP AND SUBSIDIARIES NOTES TO CONSOLIDATED FINANCIAL STATEMENTS
87
Credit Quality The quality of the loans in the Company’s loan portfolio is assessed as a function of net credit losses and the levels of
nonperforming assets and delinquencies, as defined by the Company. These factors are an important part of the Company’s overall credit risk management process and its evaluation of the adequacy of the ALL.
The following table provides a summary of the delinquency status of the Bank’s loans by portfolio type at December 31 2012 and 2011:
(Dollars in thousands)
30- 59 Days
Past Due
60- 89 Days
Past Due
90 Days andGreater
Total Past Due Current
Total LoansOutstanding
Loans >90Days andAccruing
At December 31, 2012
Commercial loans ................. $ 1,321 $ 778 $ 4,295 $ 6,394 $ 164,398 $ 170,792 $ — Commercial real estate loans
– owner-occupied ............. — — 3,232 3,232 162,690 165,922 — Commercial real estate loans
– all other ......................... — — 2,599 2,599 147,590 150,189 — Residential mortgage loans –
multi-family ...................... — — — — 105,119 105,119 — Residential mortgage loans –
single family ..................... 259 378 359 996 86,267 87,263 — Construction loans ................ — — — — — — — Land development loans ....... — — 314 314 23,704 24,018 — Consumer loans ..................... — — — — 27,296 27,296 —
Total .......................... $ 1,580 $ 1,156 $ 10,799 $ 13,535 $ 717,064 $ 730,599 $ —
At December 31, 2011
Commercial loans ................. $ 1,877 $ 159 $ 2,021 $ 4,057 $ 175,248 $ 179,305 $ — Commercial real estate loans
– owner-occupied ............. — 2,016 — 2,016 168,944 170,960 — Commercial real estate loans
– all other ......................... — — — — 121,813 121,813 — Residential mortgage loans
– multi-family .................. — 859 — 859 64,686 65,545 — Residential mortgage loans
– single family .................. 80 1,050 492 1,622 66,991 68,613 — Construction loans ................ — — 2,047 2,047 73 2,120 — Land development loans ....... — — 550 550 25,088 25,638 — Consumer loans ..................... — — — — 24,285 24,285 —
Total .......................... $ 1,957 $ 4,084 $ 5,110 $ 11,151 $ 647,128 $ 658,279 $ —
As indicated above, loans 90 days or more delinquent increased by $5.7 million, to $10.8 million at December 31, 2012, from $5.1 million at December 31, 2011. That increase was primarily due to Chapter 11 bankruptcy filings by two borrowers with outstanding loans from us totaling $8.1 million. Loans 30 to 89 days delinquent declined by $3.3 million to $2.7 million at December 31, 2012, from $6.0 million at December 31, 2011. Loans outstanding increased by $72.3 million, or 11.0%, to $730.6 million at December 31, 2012, from $658.3 million at December 31, 2011, primarily attributable to increases in non-owner occupied commercial real estate loans and single and multi-family residential mortgage loans (which are not being held for sale).

PACIFIC MERCANTILE BANCORP AND SUBSIDIARIES NOTES TO CONSOLIDATED FINANCIAL STATEMENTS
88
Generally, the accrual of interest on a loan is discontinued when principal or interest payments become more than 90 days past due, unless management believes the loan is adequately collateralized and it is in the process of collection. There were no loans 90 days or more past due and still accruing interest at December 31, 2012 or December 31, 2011. In certain instances, when a loan is placed on non-accrual status, previously accrued but unpaid interest is reversed against current income. Subsequent collections of cash are applied as principal reductions when received, except when the ultimate collectability of principal is probable, in which case interest payments are credited to income. Non-accrual loans may be restored to accrual status when principal and interest become current and full repayment is expected. The following table provides information with respect to loans on nonaccrual status, as of December 31, 2012 and 2011:
December 31,
(Dollars in thousands)
2012 2011
Nonaccrual loans:
Commercial loans ..................................................................... $ 6,846 $ 4,702 Commercial real estate loans – owner occupied ...................... 3,232 2,016 Commercial real estate loans – all other ................................... 6,424 4,214 Residential mortgage loans – single family .............................. 839 570 Construction loans .................................................................... — 2,047 Land development loans ........................................................... 314 550
Total ................................................................................ $ 17,655 $ 14,099
There were no multi-family residential mortgage loans and consumer loans on non-accrual status at December 31, 2012 or December 31, 2011.

PACIFIC MERCANTILE BANCORP AND SUBSIDIARIES NOTES TO CONSOLIDATED FINANCIAL STATEMENTS
89
The Company classifies its loan portfolio using internal credit quality ratings, as discussed above. The following table provides a summary of loans by portfolio type and the Company’s internal credit quality ratings as of December 31, 2012 and 2011.
December 31,
(Dollars in thousands)
2012 2011
Increase (Decrease)
Pass:
Commercial loans .................................................................... $ 146,952 $ 149,522 $ (2,570)Commercial real estate loans – owner occupied ...................... 162,689 148,380 14,309 Commercial real estate loans – all other .................................. 135,274 109,482 25,792 Residential mortgage loans – multi family .............................. 104,747 61,190 43,557 Residential mortgage loans – single family ............................. 84,237 66,631 17,606 Construction loans ................................................................... — 73 (73)Land development loans .......................................................... 12,461 16,758 (4,297)Consumer loans ....................................................................... 27,296 24,285 3,011
Total pass loans .............................................................. $ 673,656 $ 576,321 $ 97,335 Special Mention:
Commercial loans .................................................................... $ 2,381 $ 4,570 $ (2,189)Commercial real estate loans – owner occupied ...................... — 6,826 (6,826)Commercial real estate loans – all other .................................. 3,859 2,553 1,306 Residential mortgage loans – multi family .............................. 373 3,316 (2,943)Residential mortgage loans – single family ............................. 990 1,014 (24)Construction loans ................................................................... — — — Land development loans .......................................................... 8,201 8,330 (129)Consumer loans ....................................................................... — — —
Total special mention loans ........................................... $ 15,804 $ 26,609 $ (10,805)Substandard:
Commercial loans .................................................................... $ 21,347 $ 24,551 $ (3,204)Commercial real estate loans – owner occupied ...................... 3,232 15,754 (12,522)Commercial real estate loans – all other .................................. 11,057 9,778 1,279 Residential mortgage loans – multi family .............................. — 1,039 (1,039)Residential mortgage loans – single family ............................. 2,036 968 1,068 Construction loans ................................................................... — 2,047 (2,047)Land development loans .......................................................... 3,355 550 2,805 Consumer loans ....................................................................... — — —
Total substandard loans ................................................. $ 41,027 $ 54,687 $ (13,660)Doubtful:
Commercial loans .................................................................... $ 112 $ 662 $ (550)Commercial real estate loans – owner occupied ...................... — — — Commercial real estate loans – all other .................................. — — — Residential mortgage loans – multi family .............................. — — — Residential mortgage loans – single family ............................. — — — Construction loans ................................................................... — — — Land development loans .......................................................... — — — Consumer loans ....................................................................... — — —
Total doubtful loans ....................................................... $ 112 $ 662 $ (550)
Total Outstanding Loans, gross: ................................ $ 730,599 $ 658,279 $ 72,320

PACIFIC MERCANTILE BANCORP AND SUBSIDIARIES NOTES TO CONSOLIDATED FINANCIAL STATEMENTS
90
The disaggregation of the loan portfolio by risk rating as set forth in the table above reflects the following changes that occurred between December 31, 2012 and December 31, 2011:
• Loans rated Pass increased by $97.4 million, or 16.9%, to $673.7 million at December 31, 2012, as compared to $576.3 million at December 31, 2011. That increase was primarily attributable to (i) new loans added to the loan portfolio during 2012, as net loans increased by $72.3 million, and (ii) net transfers to Pass of $3.2 million from Special Mention and $9.4 million from Substandard due to principal reduction payments received on those loans and the resumption of principal and interest payments in accordance with the contractual terms of the loans.
• Loans rated Special Mention decreased by $10.8 million to $15.8 million at December 31, 2012, as compared to $26.6 million at December 31, 2011, primarily due to net transfers of $3.2 million of such loans to Pass and downgrades of $6.8 million of loans to Substandard.
• Loans classified Substandard decreased by $13.7 million to $41.0 million at December 31, 2012 from $54.7 million at December 31, 2011. This decrease was primarily due to the foreclosure of $3.8 million of real estate loans and net transfers of $9.4 million of loans to Pass.
We analyzed the ALL at December 31, 2012 and determined that the credit risks inherent in our loan portfolio were lower than at December 31, 2011 and concluded that an ALL of $10.9 million was appropriate at December 31, 2012. That conclusion was based on a number of additional factors, including (i) improvements during 2012 in the financial condition and cash flows of borrowers which resulted in net transfers of $12.6 million in special mention and substandard loans to Pass, and (ii) changes in the composition of our loan portfolio to a greater proportion of real estate loans, which as a general matter require lower loan loss reserves than do commercial and other loans.
Impaired Loans A loan generally is classified as impaired and placed on nonaccrual status when, in our opinion, principal or interest
will not be collectible in accordance with the contractual terms of the loan agreement. We measure and reserve for impairments on a loan-by-loan basis, using either the present value of expected future cash flows discounted at the loan’s effective interest rate, or the fair value of the collateral if the loan is collateral dependent.
The following table sets forth information regarding nonaccrual loans and restructured loans, at December 31, 2012 and December 31, 2011:
December 31,
(Dollars in thousands)
2012 2011
Impaired loans: Nonaccruing loans .................................................................... $ 12,018 $ 9,885 Nonaccruing restructured loans ................................................ 5,637 4,214 Accruing restructured loans (1) .................................................. 21,596 — Accruing impaired loans .......................................................... — 4,296
Total impaired loans ....................................................... $ 39,251 $ 18,395
Impaired loans less than 90 days delinquent and included in total impaired loans ............................................................. $ 28,452 $ 13,285
(1) Please see Trouble Debt Restructing below for a description of accruing restructed loans at December 31, 2012.

PACIFIC MERCANTILE BANCORP AND SUBSIDIARIES NOTES TO CONSOLIDATED FINANCIAL STATEMENTS
91
The table below contains additional information with respect to impaired loans, by portfolio type, as of and for the years ended December 31, 2012 and 2011:
(Dollars in thousands)
RecordedInvestment
UnpaidPrincipalBalance
Related Allowance (a)
Average Recorded
Investment
Interest Income
Recognized 2012 Loans with no specific reserves established:
Commercial loans .................................................... $ 11,782 $ 12,770 $ — $ 7,733 $ 377 Commercial real estate loans – owner occupied ....... 4,644 4,649 — 5,584 92 Commercial real estate loans – all other ................... 17,274 17,317 — 10,893 703 Residential mortgage loans – multi-family .............. — — — 45 — Residential mortgage loans – single family .............. 839 1,033 — 1,050 41 Construction loans .................................................... — — — — — Land development loans .......................................... 314 318 — 424 33 Consumer loans ........................................................ — — — — —
2012 Loans with specific reserves established: Commercial loans .................................................... $ 4,398 $ 4,398 $ 2,428 $ 6,976 $ 221 Commercial real estate loans – owner occupied ....... — — — — — Commercial real estate loans – all other ................... — — — 2,053 — Residential mortgage loans – multi-family .............. — — — — — Residential mortgage loans – single family .............. — — — — — Construction loans .................................................... — — — — — Land development loans .......................................... — — — — — Consumer loans ........................................................ — — — — — 2012 Total:
Commercial loans .......................................... $ 16,180 $ 17,168 $ 2,428 $ 14,709 $ 598 Commercial real estate loans – owner
occupied ................................................... 4,644 4,649 — 5,584 92 Commercial real estate loans – all other ........ 17,274 17,317 — 12,946 703 Residential mortgage loans – multi-family .... — — — 45 — Residential mortgage loans – single family ... 839 1,033 — 1,050 41 Construction loans ......................................... — — — — — Land development loans ................................ 314 318 — 424 33 Consumer loans ............................................. — — — — —
2011 Loans with no specific reserves established: Commercial loans .................................................... $ 1,636 $ 2,361 $ — $ 1,395 $ 38 Commercial real estate loans – owner occupied ....... 3,583 3,583 — 4,621 340 Commercial real estate loans – all other ................... 96 96 — 3,420 3 Residential mortgage loans – multi-family .............. — — — — — Residential mortgage loans – single family .............. 570 581 — 790 15 Construction loans .................................................... 2,047 2,215 — 621 — Land development loans .......................................... 550 554 — 632 11 Consumer loans ........................................................ — — — 32 —
2011 Loans with specific reserves established: Commercial loans .................................................... $ 3,503 $ 3,527 $ 1,648 $ 1,722 $ 203 Commercial real estate loans – owner occupied ....... 2,016 2,016 659 3,015 48 Commercial real estate loans – all other ................... 4,214 4,818 347 9,281 — Residential mortgage loans – multi-family .............. 180 180 129 45 14 Residential mortgage loans – single family .............. — — — 273 — Construction loans .................................................... — — — 1,604 — Land development loans .......................................... — — — — — Consumer loans ........................................................ — — — — — 2011 Total:
Commercial loans .......................................... $ 5,139 $ 5,888 $ 1,648 $ 3,117 $ 241 Commercial real estate loans – owner
occupied ................................................... 5,599 5,599 659 7,636 388 Commercial real estate loans – all other ........ 4,310 4,914 347 12,701 3 Residential mortgage loans – multi-family .... 180 180 129 45 14 Residential mortgage loans – single family ... 570 581 — 1,063 15 Construction loans ......................................... 2,047 2,215 — 2,225 — Land development loans ................................ 550 554 — 632 11 Consumer loans ............................................. — — — 32 —

PACIFIC MERCANTILE BANCORP AND SUBSIDIARIES NOTES TO CONSOLIDATED FINANCIAL STATEMENTS
92
(a) When the discounted cash flows, collateral value or market price equals or exceeds the recorded investment in the loan,
then the loan does not require an allowance. This typically occurs when the impaired loans have been partially charged-off and/or there have been interest payments received and applied to the principal loan balance.
The ALL at December 31, 2012 included $2.4 million of reserves specifically allocated for $4.4 million in impaired loans, as compared to $2.8 million of reserves specifically allocated for $11.6 million of impaired loans at December 31, 2011. At December 31, 2012 and December 31, 2011 impaired loans totaled $34.9 million and $8.5 million, respectively, for which no reserves were specifically allocated, because payment of those loans was, in our judgment, sufficiently collateralized. Of the $34.9 million in impaired loans at December 31, 2012, for which no specific reserves were allocated, $2.4 million had been deemed impaired in prior quarters.
We had average investments in impaired loans of $34.8 million and $27.5 million during the years ended December 31, 2012 and December 31, 2011, respectively. The interest that would have been earned had the impaired loans remained current in accordance with their original terms was $1.5 million in 2012 and $672,000 in 2011.
Troubled Debt Restructurings Pursuant to FASB ASU No. 2011-02, if a loan has been restructured or modified and the lender separately concludes
that (i) the loan restructuring constitutes a concession, and (ii) the borrower is experiencing financial difficulties, the loan restructuring will be considered a troubled debt restructuring or a “TDR”. The modifications that we have historically extended to borrowers in loan restructurings have taken the form of changes in the amortization terms, reductions in the interest rates, the acceptance of interest only payments and, in limited cases, concessions to outstanding loan balances. A workout plan between a borrower and us is designed to provide a bridge for cash flow shortfalls in the near term being experienced by the borrower. If the borrower works through the near term issues, in most cases, the original contractual terms of the loan will be reinstated.
As of December 31, 2012, TDRs totaled $27.2 million, of which $21.6 million were accruing and $5.6 million were nonperforming. By comparison, there were no performing TDRs and $4.2 million of nonperforming TDRs outstanding at December 31, 2011. The $1.4 million increase in nonperforming TDRs during the year ended December 31, 2012 was primarily due to restructuring of six additional loans totaling $3.7 million, partially offset by $2.2 million of principal reductions on one TDR that was nonperforming at December 31, 2011. Loan modifications during the year ended December 31, 2012 consisted primarily of interest rate reductions on the loans. At December 31, 2012, s $2.4 million of specific reserves were allocated to two performing TDRs.

PACIFIC MERCANTILE BANCORP AND SUBSIDIARIES NOTES TO CONSOLIDATED FINANCIAL STATEMENTS
93
Additional information regarding performing and nonperforming TDRs at December 31, 2012 and 2011 is set forth in the following table.
December 31, 2012
(Dollars in thousands)
Number ofLoans
Pre- Modification Outstanding
Recorded Investment
Post- ModificationOutstanding
Recorded Investment
End of PeriodBalance
Performing
Commercial loans .................................................................................. 4 $ 9,754 $ 9,754 $ 9,334 Commercial real estate – all other ......................................................... 4 10,897 10,897 10,849 Land development loans ........................................................................ 1 1,429 1,429 1,412
9 22,080 22,080 21,595 Nonperforming
Commercial loans .................................................................................. 3 1,943 1,855 1,753 Commercial real estate – all other ......................................................... 2 6,814 6,685 3,825 Residential mortgage loans – single family ........................................... 1 171 64 59
6 8,928 8,604 5,637
Total Troubled Debt Restructurings ...................................................... 15 $ 31,008 $ 30,684 $27,232
December 31, 2011
Number ofloans
Pre- Modification Outstanding
Recorded Investment
Post- ModificationOutstanding
Recorded Investment
End of PeriodBalance
Nonperforming
Commercial real estate-all other ............................................................ 1 4,942 4,818 4,214
Total troubled debt restructurings .......................................................... 1 $ 4,942 $ 4,818 $ 4,214
7. Mortgage Banking Mortgage Loans Held for Sale (LHFS)
A summary of the unpaid principal balances of mortgage loans held-for-sale for which the fair value option has been elected, by type, is presented below:
2012 2011
Government ....................................................................................... $ 16,902 $ 15,797Conventional ...................................................................................... 10,805 13,177Jumbo ................................................................................................. 20,514 11,626Fair value adjustment ......................................................................... 2,269 1,326
Total mortgage loans held-for-sale at fair value ....................... $ 50,490 $ 41,926
We did not have any delinquent or nonaccrual LHFS as of December 31, 2012.
Gains on LHFS for the years ended December 31, 2012 and 2011 are as follows:
2012 2011
Gain on sale of mortgage loans ......................................................... $ 48,441 $ 3,845 Premium from servicing retained loan sales ..................................... 99 — Unrealized gains (losses) from derivative financial statements ........ 422 — Realized gains (losses) from derivative financial instruments .......... (2,880) — Mark to market gain on LHFS .......................................................... 943 848 Direct origination (expenses) fees, net .............................................. (21,670) 1,563 Provision for repurchases .................................................................. (791) (61)
Total gain on LHFS ................................................................. $ 24,564 $ 6,195

PACIFIC MERCANTILE BANCORP AND SUBSIDIARIES NOTES TO CONSOLIDATED FINANCIAL STATEMENTS
94
Repurchase Reserves We maintain reserves for possible repurchases that we may be required to make of certain of the mortgage loans which
we sell as a result of deficiencies or defects that may be found to exist in such loans. The following table sets forth information, for the years ended December 31, 2012 and 2011, with respect to such reserves:
2012
2011
Beginning balance ...................................................................................... $ 115 $ 54 Provision for repurchases ............................................................................ 791 61 Settlements .................................................................................................. — —
Total repurchases reserve .................................................................. $ 906 $ 115
The Company’s repurchase reserve for the mortgage banking division was established to cover returns of any premiums earned and administrative fees pertaining to the repurchase of mortgage loans that did not meet investor guidelines. We repurchased $1.2 million and $159,000 of loans in 2012 and 2011, respectively, by adjusting the gains on sale recorded for these loans. We review the repurchase reserves throughout the year for adequacy.
Mortgage Servicing Rights We sometimes retain mortgage servicing rights on mortgage loans that we sell. Such rights represent the net positive
cash flows generated from the servicing of such mortgage loans and we recognize such rights as assets on our statements of financial condition based on their estimated fair values. We receive servicing fees, less any subservicing costs, on the unpaid principal balances of such mortgage loans. Those fees are collected from the monthly payments made by the mortgagors or from the proceeds of the sale or foreclosure and liquidation of the underlying real property collateralizing the loans. We also generally receive various mortgagor-contracted fees, such as late charges, collateral reconveyance charges and nonsufficient fund fees. In addition, we generally are entitled to retain interest earned on funds held pending remittance (or float) related to its collection of principal, interest, taxes and insurance payments on the mortgage loans which we service. As of December 31, 2012 mortgage servicing rights totaled $2.8 million and are included in other assets in the accompanying consolidated statement of financial condition.
As of December 31, 2012 we were servicing approximately $456 million in principal amount of mortgage loans with the following characteristics:
Unpaid Principal Balance
Government ............................................................................................ $ 396,951Conventional ........................................................................................... 58,867
Total loans serviced ....................................................................... $ 455,818
At December 31, 2011, we were not servicing any mortgage loans that we had sold.
8. Fair Value Measurements Fair Value Hierarchy. Under FASB ASC 820-10, we group assets and liabilities at fair value in three levels, based on
the markets in which the assets and liabilities are traded and the reliability of the assumptions used to determine fair value. These levels are:
Level 1 Valuation is based upon quoted prices for identical instruments traded in active markets.
Level 2 Valuation is based upon quoted prices for similar instruments in active markets, quoted prices for identical or similar instruments in markets that are not active, and model-based valuation techniques for which all significant assumptions are observable in the market.
Level 3 Valuation is generated from model-based techniques that use at least one significant assumption not observable in the market. These unobservable assumptions reflect estimates of assumptions that market participants would use in pricing the asset or liability. Valuation techniques include use of option pricing models, discounted cash flow models and similar techniques.

PACIFIC MERCANTILE BANCORP AND SUBSIDIARIES NOTES TO CONSOLIDATED FINANCIAL STATEMENTS
95
The following table show the recorded amounts of assets and liabilities measured at fair value on a recurring basis at December 31, 2012 and 2011.
At December 31, 2012
(Dollars in thousands)
Total Level 1 Level 2
Level 3
Assets and Liabilities at Fair Value:
Investment securities available for sale
Mortgage backed securities issued by U.S. agencies ..................................................... $ 78,446 $ — $ 78,446 $ —
Collateralized mortgage obligations issued by non-agency ........................................... 2,625 — 1,963 662
Asset back securities ...................................... 900 — — 900 Mutual funds .................................................. 4,407 4,407 — —
Total securities available for sale at fair value .......................................... 86,378 4,407 80,409 1,562
Loans held for sale ................................................... 55,809 — 55,809 — Other assets – Mortgage servicing rights ................. 2,801 — — 2,801 Derivative assets – IRLC’s ...................................... 580 — — 580
Total assets measured at fair value on a recurring basis ........................................... $ 145,568 $ 4,407 $ 136,218 $ 4,943
Derivative liabilities – TBA securities .................... $ (158) $ — $ (158) $ —
Total liabilities measured at fair value on a recurring basis .......................... $ (158) $ — $ (158) $ —
At December 31, 2011
(Dollars in thousands)
Total Level 1 Level 2
Level 3
Assets and Liabilities at Fair Value:
Investment securities available for sale
Mortgage backed securities issued by U.S. agencies ..................................................... $ 134,126 $ — $ 134,126 $ —
Municipal securities ....................................... 6,443 — 6,443 — Collateralized mortgage obligations issued
by non agency ........................................... 2,585 — 1,930 655 Asset back securities ...................................... 380 — — 380 Mutual funds .................................................. 4,375 4,375 — —
Total securities available for sale at fair value .......................................... 147,909 4,375 142,499 1,035
Loans held for sale .................................................. 41,926 — 41,926 —
Total assets at fair value on recurring basis ........................ $ 189,835 $ 4,375 $ 184,425 $ 1,035

PACIFIC MERCANTILE BANCORP AND SUBSIDIARIES NOTES TO CONSOLIDATED FINANCIAL STATEMENTS
96
The changes in Level 3 assets measured at fair value on a recurring basis are summarized as follows for the years ended December 31, 2012 and 2011:
(Dollars in thousands)
Balance of recurring Level 3 instruments at January 1, 2012 ................... $ 1,035 Total gains or losses (realized/unrealized): ..................................... —
Included in earnings-realized (1) .................................... (77) Included in earnings-unrealized .................................. — Included in other comprehensive income ..................... (1,265) Purchases ...................................................................... — Sales ............................................................................. — Issuances ...................................................................... — Settlements ................................................................... 5,250
Transfers in and/or out of Level 3 ......................................... —
Balance of Level 3 assets at December 31, 2012 ...................................... $ 4,943
(1) Amount reported as an other than temporary impairment loss in the noninterest income portion of the income statement
(Dollars in thousands)
Balance of recurring Level 3 instruments at January 1, 2011 ................... $ 1,243 Total gains or losses (realized/unrealized): ..................................... —
Included in earnings-realized (1) .................................... (286) Included in earnings-unrealized .................................. — Included in other comprehensive income ..................... 2,053
Purchases ............................................................................... — Sales ....................................................................................... — Issuances ................................................................................ — Settlements............................................................................. (1,975) Transfers in and/or out of Level 3 ......................................... —
Balance of Level 3 assets at December 31, 2011 ...................................... $ 1,035
(1) Amount reported as other than temporary impairment loss in the noninterest income portion of the income statement.
The following is a description of valuation methodologies used for assets and liabilities recorded at fair value on a recurring basis.
Investment Securities Available for Sale. Fair value measurement is based upon quoted prices, if available. If quoted prices are not available, fair values are measured using independent pricing models or other model-based valuation techniques such as the present value of future cash flows, adjusted for the security’s credit rating, prepayment assumptions and other factors such as credit loss assumptions. Level 1 investments securities include those traded on an active exchange, such as the New York Stock Exchange, U.S. Treasury securities that are traded by dealers or brokers in active over-the- counter markets and money market funds. Level 2 investment securities include mortgage-backed securities issued by government sponsored entities, municipal bonds and corporate debt securities. Securities classified as Level 3 include asset-backed securities in less liquid markets.
Loans Held for Sale (LHFS). Effective December 1, 2011, the Company elected to measure new LHFS at fair value. The remaining LHFS are carried at the lower of cost or market. Fair value is based on quoted market prices, if available, prices for other traded mortgage loans with similar characteristics, purchase commitments and bid information received from market participants. We classify those loans subject to recurring fair value adjustments as Level 2, given the meaningful level of secondary market activity for conforming mortgage loans.

PACIFIC MERCANTILE BANCORP AND SUBSIDIARIES NOTES TO CONSOLIDATED FINANCIAL STATEMENTS
97
Mortgage Servicing Rights. Fair value measurement is based upon quoted prices, if available. If quoted prices are not available, fair values are measured using independent pricing models or other model-based valuation techniques that would incorporate assumptions that market participants would use in estimating the fair value of servicing. These assumptions might include estimates of prepayment speeds, discount rate, costs to service, escrow account earnings, contractual servicing fee income, prepayment and late fees, among other considerations. Mortgage servicing rights are considered a Level 3 measurement at December 31, 2012 and are included in other assets in the accompanying consolidated balance sheets.
Derivative Assets and Liabilities. The Company’s derivative assets and liabilities are carried at fair value as required by GAAP and are accounted for as free standing derivatives. The derivative assets are interest rate lock commitments (“IRLCs”) with prospective residential mortgage borrowers whereby the interest rate on the loan is determined prior to funding and the borrowers have locked in that interest rate. These commitments are determined to be derivative instruments in accordance with GAAP. The derivative liabilities are hedging instruments (typically TBA securities) used to hedge the risk of fair value changes associated with changes in interest rates relating to its mortgage loan origination operations. The Company hedges the period from the interest rate lock (assuming a fall-out factor) to the date of the loan sale. The estimated fair value is based on current market prices for similar assets and accordingly, the Company classifies its derivative assets and liabilities as Level 3 measurement at December 31, 2012 and such assets are included in other assets in the accompanying consolidated statement of financial condition.
The following descriptions present qualitative information about the valuation techniques and unobservable inputs applied to Level 3 fair value measurements for financial instruments measured at fair value on a recurring and non recurring basis at December 31, 2012.
Investment Securities Available for Sale. The valuation technique used for Level 3 investment securities is a discounted cash flow. Inputs considered in determining Level 3 pricing include, the securities anticipated prepayment rates, default rates, and the loss severity given a future default. Significant increases or decreases in any of those inputs in isolation would result in significantly lower or higher fair value measurement. In general, a change in the assumption regarding the probability of default is accompanied by a directionally similar change in the assumption used for the loss severity in an event of default. Prepayment rates are subject to change based on market conditions. For the asset backed security, the security was priced using an option adjusted discounted cash flow model. This discount margin of 6.5% was based on sector spreads and trading in related credit markets. A 2% constant default rate was presumed based on historical analysis and forward projection. A loss severity of 90% was based on low recovery expectations in this sector.
Mortgage Servicing Rights. The valuation technique used for Level 3 mortgage servicing rights is based upon market prices for similar instruments and an internal discounted cash flow model. The valuation model incorporates assumptions that market participants would use in estimating the fair value of servicing, the most significant of which include estimates of prepayment speeds of between 10% and 15%, and a discount rate of 12%. For mortgage servicing rights, a significant increase in discount rates would result in a significantly lower estimated fair value. The impact of changes in prepayment speeds would have differing impacts depending on the seniority or other characteristics of the instrument.
Derivative assets – IRLC’s. The valuation technique used for Level 3 IRLC’s is based on pricing of related loan instruments (which includes the value of servicing), which are Level 2 inputs, however also includes an estimate for a fall-out factor, otherwise known as the “pull-through” rate. A significant increase or decrease in pull-through rate assumptions would result in a significant increase or decrease in the fair value of IRLCs. The Company believes that the imprecision of an estimate could be significant.
Assets Recorded at Fair Value on a Nonrecurring Basis The Company may be required, from time to time, to measure certain assets at fair value on a nonrecurring basis in
accordance with U.S. generally accepted accounting principles. These include assets that are measured at the lower of cost or market or that were recognized at a fair value below cost at the end of the period.
We have elected to use fair value measurements to record fair value adjustments to certain assets and liabilities and to determine fair value disclosures. Securities available for sale are recorded at fair value on a recurring basis. Additionally, from time to time, we may be required to record at fair value other assets on a nonrecurring basis, such as loans held for investment and certain other assets. These nonrecurring fair value adjustments typically involve application of lower of cost or market accounting or write-downs of individual assets.
PACIFIC MERCANTILE BANCORP AND SUBSIDIARIES NOTES TO CONSOLIDATED FINANCIAL STATEMENTS
98
Impaired Loans. FASB ASC 820-10 applies to loans measured for impairment in accordance with ASC 310-10, Accounting by Creditors for Impairment of a Loan, including impaired loans measured at an observable market price (if available), and at the fair value of the loan’s collateral (if the loan is collateral dependent). The fair value of an impaired loan is estimated using one of several methods, including collateral value, market value of similar debt, enterprise value, liquidation value and discounted cash flows. Those impaired loans not requiring an allowance for possible losses represent loans for which the fair value of the expected repayments or collateral exceeds the recorded investments in such loans. When the fair value of the collateral is based on an observable market price or a current appraised value, we record the impaired loan at Level 2. When an appraised value is not available or management determines the fair value of the collateral is further impaired below the appraised value and there is no observable market price, we record the impaired loan at Level 3.
Foreclosed Assets. Foreclosed assets are adjusted to fair value, less estimated costs to sell, at the time the loans are transferred to foreclosed assets. Subsequently, foreclosed assets are carried at the lower of carrying value or fair value less estimated costs to sell. Fair value is determined based upon independent market prices, appraised values of the collateral or management’s estimation of the value of the collateral. When the fair value of the collateral is based on an observable market price or a current appraised value, we record the foreclosed asset at Level 2. When an appraised value is not available or management determines the fair value of the collateral is further impaired below the appraised value and there is no observable market price, we record the foreclosed asset at Level 3.
Mortgage loans Held for Sale. Mortgage loans held for sale and funded prior to December 1, 2011 are carried at the lower of cost or market value. The fair value of these loans held for sale is based on what secondary markets are currently offering for portfolios with similar characteristics. As such, the Company classifies loans subjected to nonrecurring fair value adjustments as Level 2.
Information regarding assets measured at fair value on a nonrecurring basis is set forth in the table below.
At December 31, 2012
(Dollars in thousands) Total Level 1 Level 2
Level 3
Assets at Fair Value:
Impaired loans ............................................................. $ 39,251 $ — $ 17,476 $ 21,775Loans held for sale not held at fair value ..................... 5,319 — 5,319 — Other assets(1) ............................................................... 17,710 — 17,710 —
Total ................................................................... $ 62,280 $ — $ 40,505 $ 21,775
(1) Includes foreclosed assets
There were no transfers in or out of level 3 measurements for nonrecurring items during the twelve months ended December 31, 2012.
Fair value estimates are made at a discrete point in time based on relevant market information and other information about the financial instruments. Because no active market exists for a significant portion of our financial instruments, fair value estimates are based in large part on judgments we make primarily regarding current economic conditions, risk characteristics of various financial instruments, prepayment rates, and future expected loss experience. These estimates are subjective in nature and invariably involve some inherent uncertainties. Additionally unexpected changes in events or circumstances can occur that could require us to make changes to our assumptions and which, in turn, could significantly affect and require us to make changes to our previous estimates of fair value.
In addition, the fair value estimates are based on existing on and off-balance sheet financial instruments without attempting to estimate the value of existing and anticipated future customer relationships and the value of assets and liabilities that are not considered financial instruments, such as premises and equipment and other real estate owned.

PACIFIC MERCANTILE BANCORP AND SUBSIDIARIES NOTES TO CONSOLIDATED FINANCIAL STATEMENTS
99
The following methods and assumptions were used to estimate the fair value of financial instruments not previously discussed.
Cash and Cash Equivalents. The fair value of cash and cash equivalents approximates its carrying value.
Interest-Bearing Deposits with Financial Institutions. The fair values of interest-bearing deposits maturing within ninety days approximate their carrying values.
Federal Home Loan Bank and Federal Reserve Bank Stock. The Bank is a member of the Federal Home Loan Bank (the “FHLB”) and the Federal Reserve Bank of San Francisco (the “FRB”). As members, we are required to own stock of the FHLB and the FRB, the amount of which is based primarily on the level of our borrowings from those institutions. We also have the right to acquire additional shares of stock in either or both of the FHLB and the FRB; however, to date, we have not done so. The fair values of that stock are equal to their respective carrying amounts, are classified as restricted securities and are periodically evaluated for impairment based on our assessment of the ultimate recoverability of our investments in that stock. Any cash or stock dividends paid to us on such stock are reported as income.
Loans. The fair value for loans with variable interest rates less a credit discount is the carrying amount. The fair value of fixed rate loans is derived by calculating the discounted value of future cash flows expected to be received by the various homogeneous categories of loans. All loans have been adjusted to reflect changes in credit risk. Changes are not recorded directly as an adjustment to current earnings or comprehensive income, but rather as an adjustment component in determining the overall adequacy of the loan loss reserve.
Deposits. The fair value of demand deposits, savings deposits, and money market deposits is defined as the amounts payable on demand. The fair value of fixed maturity certificates of deposit is estimated based on the discounted value of the future cash flows expected to be paid on the deposits.
Borrowings. The fair value of borrowings is the carrying amount for those borrowings that mature on a daily basis. The fair value of term borrowings is derived by calculating the discounted value of future cash flows expected to be paid out by the Company.
Junior Subordinated Debentures. The fair value of the junior subordinated debentures is defined as the carrying amount. These securities are variable rate in nature and repriced quarterly.
Commitments to Extend Credit and Standby Letters of Credit. The fair value of commitments to extend credit and standby letters of credit, are based on fees currently charged to enter into similar agreements, taking into account the remaining terms of the agreements and the counterparties’ credit standing. These fees were not material in amount either at December 31, 2012, and 2011.
The estimated fair values and related carrying amounts of the Company’s financial instruments are as follows:
(Dollars in thousands)
December 31,
2012 2011
CarryingAmount
EstimatedFair Value
Carrying Amount
EstimatedFair Value
Financial Assets:
Cash and cash equivalents ........................................ $ 128,208 $ 128,208 $ 96,467 $ 96,467Interest-bearing deposits with financial institutions ... 2,423 2,423 1,423 1,423Federal Reserve Bank and Federal Home Loan
Bank stock ........................................................... 10,284 10,284 11,154 11,154Securities available for sale ...................................... 86,378 86,378 147,909 147,909Loans held for sale ................................................... 55,809 55,809 66,230 66,230Loans, net ................................................................. 719,257 713,070 641,962 626,227IRLC’s ...................................................................... 580 580 136 136
Financial Liabilities:
Noninterest bearing deposits .................................... 170,259 170,259 164,382 164,382Interest-bearing deposits ........................................... 675,136 676,010 697,665 698,797Borrowings ............................................................... 55,000 55,163 49,000 58,409Junior subordinated debentures ................................ 17,527 17,527 17,527 17,527TBA securities .......................................................... 158 158 — —

PACIFIC MERCANTILE BANCORP AND SUBSIDIARIES NOTES TO CONSOLIDATED FINANCIAL STATEMENTS
100
Fair Value Option. The following table reflects the differences between the fair value carrying amount of LHFS measured at fair value under ASU 825 and the aggregate unpaid principal amount we are contractually entitled to receive at maturity.
December 31, 2012
(Dollars in thousands)
Fair ValueCarryingAmount
AggregateUnpaid
Principal
Fair Value Carrying Amount
Less Aggregate Unpaid Principal
Loans held for sale reported at fair value:
Total loans ........................................................... $ 55,809 $ 55,329 $ 480 Nonaccrual loans ................................................. — — — Loans 90 days or more past due and still
accruing .......................................................... — — —
The following table includes information for the derivative assets and liabilities for the periods presented:
Total Gains (Losses)
Notional Balance For the Year Ended
December 31, 2012 December 31, 2012(1)
Derivative assets - IRLC’s ....................................................... $ 19,683 $ 544 Derivative liabilities - TBAs .................................................... 44,000 (3,002)
The assets accounted for under the fair value option are initially measured at fair value. Gains and losses from initial measurement and subsequent changes in fair value are recognized in earnings. The changes in fair value related to initial measurement and subsequent changes in fair value included in earnings for these assets measured at fair value are shown, by income statement line item, below.
December 31, 2012
(Dollars in thousands)
Loans Held for Sale at Fair Value Changes in fair value included in net income:
Mortgage banking noninterest income .......... $ 943
9. Premises and Equipment The major classes of premises and equipment are as follows:
(Dollars in thousands)
December 31,
2012 2011
Furniture and equipment ..................................................................... $ 8,045 $ 7,239 Leasehold improvements .................................................................... 1,795 1,773
9,840 9,012 Accumulated depreciation and amortization ....................................... (8,478) (8,035)
Total .......................................................................................... $ 1,362 $ 977
The amount of depreciation and amortization included in operating expense was $506,000, $499,000 and $504,000 for the years ended December 31, 2012, 2011 and 2010, respectively.

PACIFIC MERCANTILE BANCORP AND SUBSIDIARIES NOTES TO CONSOLIDATED FINANCIAL STATEMENTS
101
10. Deposits The aggregate amount of time deposits in denominations of $100,000 or more at December 31, 2012 and 2011 were
$407 million and $418 million, respectively.
The scheduled maturities of time certificates of deposit at December 31, 2012 were as follows:
(Dollars in thousands)
At December 31, 2012
2013 ........................................................................................ $ 383,834 2014 ........................................................................................ 89,419 2015 ........................................................................................ 4,258 2016 ........................................................................................ 2,677 2017 and beyond ..................................................................... 733
Total .............................................................................. $ 480,921
11. Borrowings and Contractual Obligations At December 31, 2012 and 2011, our borrowings and contractual obligations consisted of the following:
December 31,
(Dollars in thousands)
2012 2011
Federal Home Loan advances—short-term ....................................... $ 20,000 $ 34,000 Federal Home Loan advances—long-term ........................................ 35,000 15,000
$ 55,000 $ 49,000
The table below sets forth the amounts (in thousands of dollars) of, the interest rates we pay on, and the maturity dates of these Federal Home Loan Bank borrowings. These borrowings had a weighted-average annualized interest rate of 0.82% for the year ended December 31, 2012.
Principal Amounts
Interest Rate
Maturity Dates Principal Amounts Interest Rate Maturity Dates
(Dollars in thousands) 10,000 1.73% February 19, 2013 5,000 0.48% April 14, 2014 5,000 1.06% August 9, 2013 5,000 0.48% May 6, 2014 5,000 0.41% November 5, 2013 3,000 0.64% September 26, 2014 7,500 0.49% March 3, 2014 4,500 0.78% March 26, 2015 5,000 0.56% March 26, 2014 5,000 0.76% March 30, 2015
At December 31, 2012, U.S. Agency and Mortgage Backed securities, U.S. Government agency securities, collateralized mortgage obligations with an aggregate fair market value of $10 million, and $153 million of residential mortgage and other real estate secured loans were pledged to secure these Federal Home Loan Bank borrowings, repurchase agreements, local agency deposits, and treasury, tax and loan accounts.
As of December 31, 2012, we had unused borrowing capacity of $58 million with the Federal Home Loan Bank. The highest amount of borrowings outstanding at any month-end during the year ended December 31, 2012 was $69 million.
As of December 31, 2011, we had $34 million of outstanding short-term borrowings and $15 million of outstanding long-term borrowings that we had obtained from the Federal Home Loan Bank. These borrowings had a weighted-average annualized interest rate of 1.19% for the year ended December 31, 2011.
As of December 31, 2011 we had unused borrowing capacity of $102 million with the Federal Home Loan Bank. The highest amount of borrowings outstanding at any month-end during the year ended December 31, 2011 was $114 million.
These Federal Home Loan Bank borrowings were obtained in accordance with the Company’s asset/liability management objective to reduce the Company’s exposure to interest rate fluctuations.
PACIFIC MERCANTILE BANCORP AND SUBSIDIARIES NOTES TO CONSOLIDATED FINANCIAL STATEMENTS
102
Junior Subordinated Debentures. In 2002, we formed grantor trusts to sell and issue to institutional investors a total of approximately $17.5 million of floating junior trust preferred securities (“trust preferred securities”). In October 2004, the Company established another grantor trust that sold an additional $10.3 million of trust preferred securities to an institutional investor. The Company received the net proceeds from the sales of the trust preferred securities in exchange for our issuance to the grantor trusts, of a total $27.5 million principal amount of our junior subordinated floating rate debentures (the “Debentures”). The payment terms of the Debentures mirror those of the trust preferred securities and the payments that we make of interest and principal on the Debentures are used by the grantor trusts to make the payments that come due to the holders of the trust preferred securities pursuant to the terms of those securities. The Debentures also were pledged by the grantor trusts as security for the payment obligations of the grantor trusts under the trust preferred securities.
During the year ended December 31, 2007, we voluntarily redeemed, at par, $10.3 million principal amount of the Debentures, and the corresponding trust preferred securities, that we issued in 2002.
Set forth below are the respective principal amounts, in thousands of dollars, and certain other information regarding the terms of the Debentures that remained outstanding as of December 31, 2012 and 2011:
Original Issue Dates
Principal Amount Interest Rate(1) Maturity Dates
(In thousands)
September 2002 ................................. $ 7,217 LIBOR plus 3.40% September 2032October 2004 ..................................... 10,310 LIBOR plus 2.00% October 2034
Total ................................................... $ 17,527
(1) Interest rate resets quarterly.
These Debentures require quarterly interest payments, which are used to make quarterly distributions required to be paid on the corresponding trust preferred securities. Subject to certain conditions, we have the right, at our discretion, to defer those interest payments, and the corresponding distributions on the trust preferred securities, for up to five years. Exercise of this deferral right does not constitute a default of our obligations to pay the interest on the Debentures or the corresponding distributions that are payable on the trust preferred securities.
Since July 2009 we have been required to obtain the prior approval of FRBSF to make interest payments on the Debentures. During the year ended December 31, 2012, we were unable to obtain regulatory approvals to pay, and it became necessary for us to defer, quarterly interest payments on the Debentures. We cannot predict when the FRBSF will approve our resumption of such interest payments and until such approval can be obtained it will be necessary for us to continue deferring interest payments on the Debentures. Since we have the right, under the terms of the Debentures, to defer interest payments for up to twenty (20) quarters, the deferrals of interest payments to date have not constituted, and any future deferrals of interest payments through January, 2015 will not constitute, a default under or with respect to the Debentures. However, if by that date we have not been able to obtain regulatory approval to pay all of the deferred interest payments, we would then be in default under the Debentures.
Under the Federal Reserve Board rulings, the borrowings evidenced by the Debentures, which are subordinated to all of our other borrowings that are outstanding or which we may obtain in the future, are eligible (subject to certain dollar limitations) to qualify and, at December 31, 2012 and 2011, $16.8 million of those Debentures qualified as Tier I capital, for regulatory purposes.
12. Loan and other Banking transactions with Board of Directors In the ordinary course of our business, we conduct banking transactions with and make loans to and enter into loan
commitments with members of our Board of Directors and certain of the businesses with which they are affiliated or associated. All such loans and loan commitments were made in accordance with applicable laws and government regulations and on substantially the same terms, including interest rates and collateral, as those prevailing at the same time for comparable transactions with persons of similar creditworthiness that are not affiliated with us and, when made, did not present any undue risk of collectibility.

PACIFIC MERCANTILE BANCORP AND SUBSIDIARIES NOTES TO CONSOLIDATED FINANCIAL STATEMENTS
103
The following is a summary of loan transactions with members of the Board of Directors and certain of their affiliates and associates:
Year Ended December 31,
(Dollars in thousands)
2012(1) 2011(1)
Beginning balance .............................................................................. $ 6,100 $ 9,412 New loans granted .............................................................................. 4,288 2,484 Principal repayments........................................................................... (5,623) (5,796)
Ending balance .................................................................................... $ 4,765 $ 6,100
(1) Includes loans made to executive officers who are not also directors totaling $53,000 in 2012. No loans were made to
any executive officers in 2011.
Deposits maintained by members of the Board of Directors and executive officers at the Bank totaled $1.1 million and $1.3 million at December 31, 2012 and 2011, respectively.
13. Income Taxes The components of income tax expense (benefit) consisted of the following for the years ended December 31:
(Dollars in thousands)
2012 2011
2010
Current taxes:
Federal .................................................................................. $ (93) $ 103 $ 257 State ...................................................................................... 119 617 2
Total current taxes ...................................................... 26 720 259 Deferred taxes:
Federal .................................................................................. 671 (5,282) 3,971 State ...................................................................................... (3,661) (1,871) 4,728
Total deferred taxes .................................................... (2,990) (7,153) 8,699
Total income tax (benefit) expense ................... $ (2,964) $ (6,433) $ 8,958
The reasons for the differences between the statutory federal income tax rates and our effective tax rates are summarized in the following table:
Year Ended December 31,
2012
2011
2010
Federal income tax based on statutory rate ........................................................................ 34.0% 34.0% (34.0)%State franchise tax net of federal income tax benefit ......................................................... 7.5 6.8 (7.5)Permanent differences ....................................................................................................... 1.0 (1.5) (4.7)Other .................................................................................................................................. (1.1) — 1.0 Valuation allowance .......................................................................................................... (85.5) (163.0) 255.2
Total income (benefit) tax expense .................................................................................... (44.1)% (123.7)% 210.0%

PACIFIC MERCANTILE BANCORP AND SUBSIDIARIES NOTES TO CONSOLIDATED FINANCIAL STATEMENTS
104
We recognize deferred tax assets and liabilities using estimated future tax rates for the effect of temporary differences between the book and tax bases of recorded assets and liabilities, including net operating loss carry forwards. The components of our net deferred tax asset are as follows at:
(Dollars in thousands)
December 31,
2012
2011
Deferred tax asset:
Allowance for loan losses ........................................................................................................... $ 4,575 $ 6,489 Other than temporary impairment on securities .......................................................................... 301 46 State taxes ................................................................................................................................... 1 141 Capital loss .................................................................................................................................. — 180 Deferred loan origination costs ................................................................................................... 195 307 Deferred compensation ............................................................................................................... 1,239 1,101 Litigation reserve ........................................................................................................................ 644 669 Other accrued expenses ............................................................................................................... 2,964 1,806 Charitable contributions .............................................................................................................. 156 — Reserve for unfunded commitments ............................................................................................ 75 75 Tax credits ................................................................................................................................... 44 193 State taxes net operating loss carry forward ................................................................................ 2,259 2,257 Stock based compensation .......................................................................................................... 654 634 Depreciation and amortization .................................................................................................... 64 111 Unrealized losses on securities and deferred compensation ........................................................ 633 841
Total deferred tax assets .................................................................................................... 13,804 14,850 Deferred tax liabilities:
Mortgage servicing rights ............................................................................................................ (2,086) —
Total deferred tax liabilities ............................................................................................... — —
Valuation allowance ............................................................................................................................. — (6,743)
Total net deferred tax asset ....................................................................................... $ 11,718 $ 8,107
Between the fourth quarter of 2008 and the second quarter 2010, we concluded that it had become more likely than not that our taxable income in the foreseeable future would not be sufficient to enable us to realize our deferred tax assets and we recorded a valuation allowance aggregating $13.7 million against our deferred tax asset for the portion of the tax benefits which, based on our assessment, we were more likely, than not, to be unable to use prior to their expiration.
During the fourth quarter of 2011, due to a strengthening of economic conditions, an improvement in the quality of our loan portfolio, as reflected in declines in loan losses and loan delinquencies, and the earnings we were generating from operations, we determined that it had become more likely, than not, that we would be able to use approximately $7.0 million of the income tax benefits comprising our deferred tax asset to offset or reduce taxes in future years. As a result we reduced, by a corresponding amount, the valuation allowance that we had previously established against our deferred tax asset which resulted in the recognition of a non-cash income tax benefit for 2011 in the amount of $6.4 million.
Due to primarily to a continued strengthening of economic conditions and increases in our earnings, at June 30, 2012, we determined that it had become more likely than not that we would be able to use approximately $13.8 million of the income tax benefits comprising our deferred tax asset to offset or reduce taxes in future years. As a result we further reduced the valuation allowance that we had previously established against our deferred tax asset, which resulted in the recognition of a non-cash income tax benefit for the second quarter of 2012 in the amount of $5.0 million.
We file income tax returns with the U.S. federal government and the state of California. As of December 31, 2012, we were subject to examination by the Internal Revenue Service with respect to our U.S. federal tax returns for the years from 2008 to 2011, inclusive. As of December 31, 2012, we were subject to examination by the Franchise Tax Board with respect to our California state income tax returns for the years from 2008 to 2011, inclusive. We do not believe there will be any material adverse changes in our unrecognized tax benefits over the next 12 months.
PACIFIC MERCANTILE BANCORP AND SUBSIDIARIES NOTES TO CONSOLIDATED FINANCIAL STATEMENTS
105
Net operating losses (“NOLs”) on U.S. federal income tax returns for tax years 2010 and 2011 may be carried back 5 years and forward 20 years. We filed an amended prior year U.S. federal tax return for the tax year 2010 to carryback the U.S. federal NOLs for 5 years. NOLs on our California state income tax returns for tax years 2009 and 2010 may be carried forward 20 years. However, the state of California has suspended net operating carryover deductions for the period from 2008 through 2011, inclusive, although corporate taxpayers were permitted to compute and carryover their NOLs during that suspension period. Beginning in 2012, that suspension was lifted and California taxpayers became entitled to carryback losses for 2 years and carryforward losses for 20 years, As a result, by 2013, California’s rules applicable to NOLs will conform to the corresponding rules under the U.S. tax laws. We expect (although no assurance can be given) that we will generate taxable income in future years to use the California NOLs that were generated in prior years.
Our policy is to recognize interest and penalties accrued on any unrecognized tax benefits as a component of tax expense. We did not have any accrued interest or penalties associated with any unrecognized tax benefits, and no interest expense was recognized during the years ended 2012 and 2011.
14. Stock-Based Employee Compensation Plans Our shareholders approved a 2010 Equity Incentive Plan (the “2010 Plan”), which provides for the grant of equity
incentives, consisting of options, restricted shares and stock appreciation rights (“SARs”) to officers, other key employees and directors of the Company and the Bank. The 2010 Plan set aside, for the grant or awarding of such equity incentives, 400,000 shares of our common stock, plus an additional 158,211 shares of common stock which was equal to the total of the shares that were then available for the grant of equity incentives under our shareholder-approved 2008 and 2004 Plans (the “Previously Approved Plans”). At the same time, those 158,211 shares ceased to be issuable under the Previously Approved Plans. As a result, upon approval of the 2010 Plan by our shareholders, a total of 558,211 shares were available for the grant or awarding of equity incentives under that Plan.
Options to purchase a total of 1,566,965 shares of our common stock granted under the Previously Approved Plans were outstanding at December 31, 2012. Those Plans had provided that, if any of the outstanding options were to expire or otherwise terminate, rather than being exercised, the shares that had been subject to those options would become available for the grant of new options under those Plans. However, the 2010 Plan provides that if any of the outstanding options granted under the Previously Approved Plans expire or are terminated for any reason, then, the number of shares that would become available for grants or awards of equity incentives under the 2010 Plan would be increased by an equivalent number of shares, instead of becoming available for new equity incentive grants under the Previously Approved Plans. If all of the options that were outstanding under the Previously Approved Plans when the 2010 Plan was adopted were to expire or be cancelled, then the maximum number of shares that could be issued pursuant to equity incentives under the 2010 Plan would be 1,682,459 shares.
Stock options entitle the recipients to purchase common stock at a price per share that may not be less than 100% of the fair market value of the Company’s shares on the respective grant dates of the stock options. Restricted shares may be granted at such purchase prices, or outright, and on such other terms, including restrictions and Company repurchase rights, as are fixed by the Compensation Committee at the time awards of restricted shares are granted. SARs entitle the recipient to receive a cash payment in an amount equal to the difference between the fair market value of the Company’s shares on the date of vesting and a “base price” (which, in most cases, will be equal to fair market value of the Company’s shares on the date of grant), subject to the right of the Company to make such payment in shares of its common stock at their then fair market value. Options, restricted shares and SARs may vest immediately or in installments over various periods generally ranging up to five years, subject to the recipient’s continued employment or service or the achievement of specified performance goals, as determined by the Compensation Committee at the time it grants or awards the options, the restricted shares or the SARs. Stock options and SARs may be granted for terms of up to 10 years after the date of grant, but will terminate sooner upon or shortly after a termination of service occurring prior to the expiration of the term of the option or SAR. The Company will become entitled to repurchase some or all of the unvested restricted shares, at the same price that was paid for the shares by the recipient, if any, in the event of a termination of employment or service of the holder of such shares or if any performance goals specified in the award are not satisfied prior to the vesting of those shares. To date, the Company has not granted any restricted shares or any SARs.
Under FASB ASC 718-10, we recognize in our consolidated statements of operation the fair values of the options or any restricted shares that we grant as compensation cost over their respective service periods.

PACIFIC MERCANTILE BANCORP AND SUBSIDIARIES NOTES TO CONSOLIDATED FINANCIAL STATEMENTS
106
The fair values of the options that were outstanding at December 31, 2012 under the 2010 Plan or the Previously Approved Plans (collectively referred to as the “Plans”) were estimated as of their respective dates of grant using the Black-Scholes option-pricing model. The table below summarizes the weighted average assumptions used to determine the fair values of the options granted during the following periods:
Twelve Months Ended December 31,
Assumptions with respect to:
2012 2011
2010
Expected volatility .................................................................. 47% 41% 34%Risk-free interest rate .............................................................. 0.90% 2.34% 2.48%Expected dividends ................................................................. 0.57% 0.26% 0.26%Expected term (years) ............................................................. 4.2-7.6 6.5-8.2 6.9 Weighted average fair value of options granted during
period ................................................................................. $ 2.48 $ 1.84 $ 1.26
The following table summarizes the stock option activity under the Company’s 2010 Plan and Previously Approved Plans (which are collectively referred as the “Plans”) during the years ended December 31, 2012, 2011 and 2010, respectively.
Number of Shares
Weighted-Average Exercise
Price Per Share
Number of Shares
Weighted- Average Exercise
Price Per Share
Number ofShares
Weighted-Average Exercise
Price Per Share
2012 2011 2010
Outstanding – January 1, ...................... 1,153,741 $ 7.39 1,177,642 $ 7.57 1,162,744 $ 9.51 Granted ........................................ 614,500 5.43 80,500 4.09 410,122 3.24 Exercised ..................................... (22,096) 3.40 — — — — Forfeited/Canceled ...................... (179,180) 5.47 (104,401) 6.87 (395,224) 7.06
Outstanding – December 31, ................ 1,566,965 6.90 1,153,741 7.39 1,177,642 7.57
Options Exercisable – December 31, .... 931,259 $ 8.07 801,692 $ 9.05 716,162 $ 10.04
Options to purchase 22,096 share of common stock were exercised during the year end December 31, 2012. There were no options exercised during either of the years ended December 31, 2011and December 31, 2010. The fair values of vested options at December 31, 2012, 2011 and 2010 were $443,000, $287,000 and $244,000, respectively.
The following table provides additional information regarding the vested and unvested options that were outstanding at December 31, 2012.
Options Outstanding as of December 31, 2012
Options Exercisable as of December 31, 2012(1)
Vested Unvested
WeightedAverageExercise
Price
Weighted Average
Remaining Contractual Life (Years) Shares
Weighted Average
Exercise Price $2.97 – $5.99 ............................................ 456,616 451,306 $ 4.13 8.17 456,616 $ 3.69 $6.00 – $9.99 ............................................ 25,200 184,400 6.76 8.80 25,200 7.40 $10.00 – $12.99 ........................................ 310,100 — 11.23 1.13 310,100 11.23 $13.00 – $17.99 ........................................ 119,843 — 15.10 2.61 119,843 15.10 $18.00 – $18.84 ........................................ 19,500 — 18.06 3.09 19,500 18.06
931,259 635,706 $ 6.90 6.37 931,259 $ 8.07 (1) The weighted average remaining contractual life of the options that were exercisable as of December 31, 2012 was 4.55
years.
The aggregate intrinsic values of options that were outstanding and exercisable under the Plans at December 31, 2012 and 2011 were $1.2 million and $31,000, respectively.

PACIFIC MERCANTILE BANCORP AND SUBSIDIARIES NOTES TO CONSOLIDATED FINANCIAL STATEMENTS
107
A summary of the status of the unvested options outstanding as of December 31, 2012, and changes in the number of shares subject to and in the weighted average grant date fair values of the unvested options during the year ended December 31, 2012, are set forth in the following table.
Number of Shares Subject
to Options
Weighted Average
Grant DateFair Value
Unvested at December 31, 2011 ........................................... 352,049 $ 1.43 Granted ........................................................................ 614,500 2.48 Vested .......................................................................... (256,796) 1.72 Forfeited/Cancelled ..................................................... (74,047) 1.50
Unvested at December 31, 2012 ........................................... 635,706 2.30
The aggregate amounts of stock based compensation expense recognized in our consolidated statements of operations for the years ended December 31, 2012, 2011 and 2010 were $484,000, $278,000 and $167,000 respectively, in each case net of taxes. At December 31, 2012, the weighted average period over which nonvested awards were expected to be recognized was 1.34 years.
The following table sets forth the compensation expense which, as of December 31, 2012, was expected to be recognized during the periods presented below in respect of non-vested stock options outstanding at December 31, 2012:
Estimated Stock Based
Compensation Expense
(Dollars in thousands)
For the years ending December 31,2013 ....................................................................................... $ 604 2014 ....................................................................................... 484 2015 ....................................................................................... 222 2016 ....................................................................................... 23 2017 ....................................................................................... 5
$ 1,338
15. Earnings Per Share (“EPS”) Basic EPS excludes dilution and is computed by dividing net income or loss available to common shareholders by the
weighted average number of common shares outstanding for the period. Diluted EPS reflects the potential dilution that could occur if stock options or other contracts to issue common stock were exercised or converted into common stock that would then share in our earnings. For the years ended December 31, 2012, 2011 and 2010 outstanding options to purchase 992,343, 984,619 and 1,177,642 shares, respectively, were not considered in computing diluted earnings (loss) per common share because they were antidilutive. Also, 761,278 shares of common stock subject to stock purchase warrants were excluded from the computation of diluted earnings per common share for the year ended December 31, 2012 because the exercisability of those warrants is conditioned on the happening of certain future events.

PACIFIC MERCANTILE BANCORP AND SUBSIDIARIES NOTES TO CONSOLIDATED FINANCIAL STATEMENTS
108
The following table shows how we computed basic and diluted EPS for the years ended December 31, 2012, 2011 and 2010.
(In thousands, except per share data)
For the twelve months ended December 31,
2012 2011
2010
Net income (loss) ...................................................................... $ 9,654 $ 11,632 $ (13,954)Accumulated declared dividend on preferred stock .................. (941) — — Accumulated undeclared dividend on preferred stock .............. (17) (440) (1,075)
Net gain( loss) available for common shareholders (A) ........... $ 8,696 $ 11,192 $ (15,029)
Weighted average outstanding shares of common stock (B) .... 15,386 11,361 10,435 Dilutive effect of employee stock options and warrants ........... 2,289 10 —
Common stock and common stock equivalents (C) .................. 17,675 11,371 10,435
Income (loss) per common share:
Basic (A/B) ............................................................................... $ 0.57 $ 0.99 $ (1.44)Diluted (A/C) ............................................................................ $ 0.55 $ 0.98 $ (1.44)
16. Shareholders’ Equity Preferred Stock. Series A Preferred Stock. In August 2010, we completed a private offering to three limited number of accredited investors
of shares of a newly authorized series of preferred stock, designated as the Company’s Series A Convertible 10% Cumulative Preferred Stock (the “Series A Shares”), at a price of $100.00 per Series A Share. We sold 126,550 Series A Shares in that private offering, raising a total of $12.655 million (before offering expenses). Cash dividends on the Series A Shares were payable if, as and when declared by the Board of Directors out of funds legally available therefor at a rate equal to 10% of the issue price per annum of the Series A Shares and, if not declared, would accumulate until paid. Unless and until any accrued but unpaid dividends on the Series A Shares were paid, no cash dividends could be paid on the Company’s outstanding common stock. Effective July 1, 2011 the holders of 115,500 of the 126,500 shares of Series A Preferred Stock outstanding voluntarily converted their Series A Shares, at a conversion price of $7.65 per common share, into a total of 1,510,238 shares of common stock of the Company. At the same time the Company issued to those Series A holders a total of 328,100 additional shares of common stock in exchange for the waiver of their rights to receive the payment in cash of the undeclared dividends that had accumulated on those Series A Shares. As a result of the conversion of those Series A Shares, dividends on those shares ceased to accrue as of July 1, 2011 and only 11,000 shares of the Series A Shares remained outstanding.
On January 26, 2012, the Company’s shareholders, voting together as a single class, and the holders of the Series A Shares, voting as a separate class, approved an amendment to the rights, preferences and privileges of the Series A Preferred Shares to permit the Company to pay accumulated, but unpaid, dividends on the Series A Preferred Stock in shares of common stock, in lieu of having to pay such dividends in cash. Following the effectiveness of that amendment, on January 26, 2012, the Company’s Board of Directors declared a dividend in the amount of all of the accumulated but unpaid dividends, which totaled $206,861, on the 11,000 Series A Preferred Shares that were still outstanding, which was paid by the issuance of a total of 37,272 shares of common stock of the Company on January 30, 2012. As a result of the payment of those dividends, the remaining 11,000 Series A Preferred Shares then outstanding converted automatically into a total of 143,790 shares of the Company’s common stock and, as a result no Series A Preferred Shares remain outstanding.
Series B and Series C Preferred Stock. On August 26, 2011 we completed a sale of a total of 112,000 shares of a newly created Series B Convertible 8.4% Noncumulative Preferred Stock (the “Series B Shares”), at a price of $100.00 per share in cash, in a private placement to SBAV, LP (“SBAV”), which purchased 75,000 of those Shares, and to Carpenter Community Bancfund LP and Carpenter Community Bancfund-A LP (collectively the “Carpenter Funds”), which purchased a total of 37,000 of those Shares. We then contributed the net proceeds from the sale of those Series B Shares, totaling $11.2 million, to the Bank to enable it to increase the ratio of its adjusted tangible shareholders’ equity to its tangible assets above 9% and thereby meet the capital requirement under the DFI Order.

PACIFIC MERCANTILE BANCORP AND SUBSIDIARIES NOTES TO CONSOLIDATED FINANCIAL STATEMENTS
109
The Series B Shares are convertible, at the option of the holders of those shares, at any time and from time to time, into shares of the Company’s common stock (“Conversion Shares”) at a conversion price of $5.32 per common share. Dividends on the Series B Shares are payable in cash at a rate of 8.4% per annum if, as and when declared by the Board of Directors. If, however, due to legal or regulatory restrictions, the Company is unable to pay cash dividends on the Series B Preferred Stock for two semi-annual dividend periods, then the Company is required to pay such dividends in shares of a newly created separate series of preferred stock, designated as the Company’s Series C 8.4% Noncumulative Preferred Stock (the “Series C Shares”). During the year ended December 31, 2012 Company issued 12,803 Series C Shares in lieu of accumulated declared and undeclared dividends on Series B Prefered Stock.
Sale of Common Stock to the Carpenter Funds. In February 2012, the Company and the Carpenter Funds entered into a stock purchase agreement pursuant to which the Carpenter Funds agreed to purchase, subject to certain conditions, $26.3 million of shares of Company common stock at a price equal to the greater of: (a) $6.26 per share, or (b) the book value per share of the Company’s common stock, as set forth or determined from the Company’s SEC periodic report last filed before the date on which the sale of the shares of common stock to the Carpenter Funds was consummated. That sale was consummated on April 23, 2012 at a price of $6.26 per share in cash. The NASDAQ closing price of the Company’s shares of common stock was $5.34 per share on April 20, 2012, the last trading day preceding the consummation of the sale of those shares to the Carpenter Funds. Upon consummation of this sale of shares of common stock, the Carpenter Funds became the Company’s largest shareholder, owning approximately 26% of its outstanding shares of common stock.
In connection with the above-described equity financing transactions, the Company:
(1) sold, for $44,055, warrants to SBAV to purchase, subject to certain conditions, up to 352,444 shares of Company common stock, also at an exercise price of $6.26 per share (the “SBAV Warrants”);
(2) sold, for $51,105, warrants to the Carpenter Funds to purchase, subject to certain conditions, an additional 408,834 shares of Company common stock at an exercise price of $6.26 per share (the “Carpenter Warrants”);
(3) entered into Investor Rights Agreements with SBAV and the Carpenter Funds which granted to SBAV and each of the Carpenter Funds the right to purchase (subject to certain exceptions) a pro-rata portion of any additional equity securities which the Company may sell during the succeeding four years, in order to enable each of them to maintain its percentage ownership interest in the Company.
(4) appointed, pursuant to those Investor Rights Agreements, Daniel A. Strauss as SBAV’s representative on the Boards of Directors of the Company and the Bank and Edward J. Carpenter, John Flemming and Michael P. Hoopis, as the representatives of the Carpenter Funds on the Boards of Directors of the Company and the Bank; and
(5) registered, for resale, under the Securities Act of 1933, (i) the Conversion Shares issuable on conversion of the Series B Shares, (ii) the shares of common stock purchased by the Carpenter Funds in April 2012 and (iii) the shares of common stock purchasable on exercise of the Carpenter Warrants and the SBAV Warrants.
The warrants are contingent an only exercisable to the extent that the Company completes an acquisition prior to April 23, 2016 of a bank with assets of at least $250 million.
FASB ASC 815-10-15 provides a scope exception for contracts such as warrants (that otherwise meet the definition of a derivative) issued by an entity that are both (i) indexed to its own stock and (ii) classified in stockholders’ equity. When this exception is satisfied, the financial instrument need not be recognized at fair value or (as applicable) separately accounted for as a liability. Rather, the warrants are accounted for by the issuer within stockholders’ equity. The Company’s warrants are indexed to its own stock as they are not subject to price protection, contain a contingency which is not based on an observable market or index, and can be settled in available registered shares.
Agreement to Sell $15 million of Shares of Common Stock to the Carpenter Funds in 2013. Effective February 27, 2013, the Company entered into a Common Stock Purchase Agreement which provides for the sale, subject to the receipt of required regulatory approvals and the satisfaction of certain other conditions, of up to a total of 2,222,222 shares of Company common stock, at a price of $6.75 per share in cash, to the Carpenter Funds. A summary of the terms of that Agreement is set forth in Note 22 below.

PACIFIC MERCANTILE BANCORP AND SUBSIDIARIES NOTES TO CONSOLIDATED FINANCIAL STATEMENTS
110
Payment of Cash Dividends by the Company. California laws place restrictions on the ability of California corporations to pay cash dividends on preferred or common stock. Subject to certain limited exceptions, a California corporation may pay cash dividends only to the extent of (i) the amount of its retained earnings or (ii) the amount by which the fair value of the corporation’s assets exceeds its liabilities. However, as described in Note 3, the FRB Written Agreement prohibits the Company from paying any cash dividends to any of its preferred or common shareholders without the prior approval of the FRBSF. Moreover, as discussed in Note 11, we have had to defer interest payments on our Junior Subordinated Debentures as a result of restrictions contained in the FRB Agreement. Under the terms of those debentures, we may not pay cash dividends on our common stock or preferred stock unless and until we have paid all of the deferred interest in full and thereafter make interest payments on the debentures as and when they become due. We cannot predict when we might be able to obtain FRBSF approval to resume paying interest on the Debentures or to pay cash dividends on the Series B Preferred Stock or our common stock in the future.
Payment of Dividends by the Bank to the Company. Generally, the principal source of cash available to a bank holding company consists of cash dividends from its bank subsidiaries. Under California law, the Board of Directors of the Bank may declare and pay cash dividends to the Company, which is its sole shareholder, subject to the restriction that the amount available for the payment of cash dividends may not exceed the lesser of (i) the Bank’s retained earnings or (ii) its net income for its last three fiscal years (less the amount of any dividends paid during such period). Cash dividends by the Bank to the Company in excess of that amount may be made only with the prior approval of the California Commissioner of Financial Institutions (“Commissioner”). If the Commissioner finds that the shareholders’ equity of the Bank is not adequate, or that the payment by the Bank of cash dividends to the Company would be unsafe or unsound for the Bank, the Commissioner can order the Bank not to pay such dividends.
The ability of the Bank to pay dividends is further restricted under the Federal Deposit Insurance Corporation Improvement Act of 1991, which prohibits an FDIC-insured bank from paying dividends if, after making such payment, the bank would fail to meet any of its minimum capital requirements. Under the Financial Institutions Supervisory Act and Federal Financial Institutions Reform, Recovery and Enforcement Act of 1989, federal banking regulators also have authority to prohibit FDIC-insured financial institutions from engaging in business practices which are considered to be unsafe or unsound. Under the authority of that Act, federal bank regulatory agencies, as part of their supervisory powers, generally require FDIC insured banks to adopt dividend policies which limit the payment of cash dividends much more strictly than do applicable state laws and, therefore, it is unlikely that the Bank would be permitted pay dividends in amounts that might otherwise, as a technical matter, be permitted under California law.
Moreover, the DFI Order prohibits the Bank from paying any cash dividends without the DFI’s prior approval, even if the payment of such dividends would otherwise be permitted under California law. As a result, it is not expected that the Bank will be permitted to pay cash dividends for the foreseeable future.
Stock Repurchase Program. In July 2005, the Company’s Board of Directors approved a share repurchase program, which authorized the Company to purchase up to two percent (2%), or approximately 200,000, of its outstanding common shares. That program provides for share repurchases to be made in the open market or in private transactions, in accordance with applicable SEC rules, when opportunities become available to purchase shares at prices believed to be attractive. The Company is under no obligation to repurchase any shares under the share repurchase program and the timing, actual number and value of shares that are repurchased by the Company under this program will depend on a number of factors, including the Company’s future financial performance and available cash resources, competing uses for its corporate funds, prevailing market prices of its common stock and the number of shares that become available for sale at prices that the Company believes are attractive, as well as any regulatory requirements applicable to the Company. Over the two years ended December 31, 2008, the Company purchased a total of 148,978 shares of its common stock in the open market under this program for an aggregate purchase price of approximately $1.4 million, which results in an average per share price of $9.30.
In October 2008, the Company’s Board of Directors approved a share repurchase program (the “2008 Share Repurchase Plan”) which authorized (but did not require) the Company to purchase up to $2 million of its shares of common stock. However, no shares have been repurchased under this Share Repurchase Plan.
The restrictions on the payment of cash dividends by the Company under the FRB Agreement also prohibit the Company from repurchasing any of its shares without the prior approval of the FRBSF. As a result, it is not expected that the Company will be permitted to repurchase any of its shares for the foreseeable future. See Note 3 above for additional information regarding the FRB Agreement.

PACIFIC MERCANTILE BANCORP AND SUBSIDIARIES NOTES TO CONSOLIDATED FINANCIAL STATEMENTS
111
17. Commitments and Contingencies Leases. The Company leases certain facilities and equipment under various non-cancelable operating leases, which
generally include 2% to 6% escalation clauses in the lease agreements. Rent expense for the years ended December 31, 2012, 2011 and 2010 was $2.5 million, $2.2 million, and $2.4 million, respectively.
Future minimum non-cancelable lease commitments were as follows at December 31, 2012:
(Dollars in thousands)
2013 ........................................................................................................... $ 2,278 2014 ........................................................................................................... 2,225 2015 ........................................................................................................... 1,662 2016 ........................................................................................................... 797 2017 and thereafter .................................................................................... 18
Total ........................................................................................................... $ 6,980
Commitments. To meet the financing needs of our customers in the normal course of business, the Company is party to financial instruments with off-balance sheet risk. These financial instruments include commitments to extend credit and standby letters of credit. These commitments involve, to varying degrees, elements of credit and interest rate risk in excess of the amount recognized in the consolidated financial statements. At December 31, 2012 and 2011, the Company was committed to fund certain loans including letters of credit amounting to approximately $118 million and $121 million, respectively. The contractual amounts of credit-related financial instruments such as commitments to extend credit, credit-card arrangements, and letters of credit represent the amounts of potential accounting loss should the commitment be fully drawn upon, the customer were to default, and the value of any existing collateral securing the customer’s payment obligation becomes worthless.
We use the same credit policies in making commitments to extend credit and conditional obligations as we do for on-balance sheet instruments. Commitments generally have fixed expiration dates; however, since many of the commitments are expected to expire without being drawn upon, the total commitment amounts do not necessarily represent future cash requirements. We evaluate each customer’s creditworthiness on a case-by-case basis. The amount of collateral obtained, if any, upon an extension of credit is based on management’s credit evaluation of the customer. Collateral held varies, but may include accounts receivable, inventory, property, plant and equipment, residential real estate and income-producing commercial properties.
During the first quarter of 2012, we began selling a portion of our mortgage loan production directly to secondary market investors on a “mandatory commitment” basis, agreeing to sell a specified dollar amount of mortgage loans at an agreed-upon price within a specified timeframe in order to avail ourselves of more favorable pricing on loan sales to investors. In order to mitigate interest rate risk on loans subject to such mandatory commitments, when we lock the interest rate for the borrowers on those loans prior to funding, we enter into a mandatory commitment which locks the price at which we will sell those loans to investors. At the same time, we enter into a mortgaged backed-to-be announced (“TBA”) security. The mandatory commitment and the TBA security act as a hedge against market interest rate movements between the time the interest rate is locked and the loan is funded and sold in the secondary market. TBA securities are deemed to be derivatives and involve off-balance sheet financial risk from such securities. We are required to recognize any unrealized fair value gains or losses on these interest rate contacts and TBA security hedges, the amount of which will depend upon the values of the underlying financial instruments, which are affected by changes in market rates of interest rates. As of December 31, 2012, we recognized unrealized fair value gains from the interest rate contacts and TBA security hedges of $422,000. TBA securities pose credit risk for us if and to the extent that the institutional counterparties are unable to meet the terms of the agreements. We control counterparty credit risk by using multiple counterparties and limiting them to major financial institutions with investment grade credit ratings. In addition, we regularly monitor the potential risk of loss with any one party resulting from this type of credit risk.
The Company is required to purchase stock in the FRBSF in an amount equal to 6% of its capital, one-half of which must be paid currently with the balance due upon request.
The Bank is a member of the FHLB and therefore, is required to purchase FHLB stock in an amount equal to the lesser of 1% of the Bank’s real estate loans that are secured by residential properties, or 5% of total advances.

PACIFIC MERCANTILE BANCORP AND SUBSIDIARIES NOTES TO CONSOLIDATED FINANCIAL STATEMENTS
112
Litigation, Claims and Assessments. The Company is a defendant in or a party to a number of legal actions or proceedings that arise in the ordinary course of business. In some of these actions and proceedings, claims for monetary damages are asserted against the Company. In view of the inherent uncertainties involved, the Company generally is unable to predict the eventual outcome or the timing of the ultimate resolution of pending legal actions or proceedings. In accordance with applicable accounting guidance, the Company establishes an accrued liability for lawsuits or other legal proceedings when they present loss contingencies that are both probable and estimable. We estimate the any potential loss based upon currently available information and significant judgments and a variety of assumptions, and known and unknown uncertainties. Moreover, the facts and circumstances on which such estimates are based will change over time. Therefore, the amount of any losses we might incur in any lawsuits or other legal proceedings may exceed amounts which we had accrued based on our estimates and those estimates do not represent the maximum loss exposure that the Company may have in connection with any lawsuits or other legal proceedings.
Based on the Company’s evaluation of the lawsuits and other legal proceedings that were pending against us as of December 31, 2012, we do not believe that the outcomes in those suits or other proceedings will have, either individually or in the aggregate, a material adverse effect on our consolidated financial position, results of operations or cash flows. However, in light of the inherent uncertainties involved, some of which are beyond our control, and the very large or indeterminate damages often sought in such legal actions or proceedings, an adverse outcome in one or more of these suits or proceedings could be material to the Company’s results of operations or cash flows for any particular reporting period.
Set forth below is a summary description of an ongoing legal proceeding which, depending on its eventual outcome, could have a material effect on our future financial condition, results of operations or cash flows.
Mark Zigner vs. Pacific Mercantile Bank, et al., filed in January, 2010, in the California Superior Court for the County of Orange (Case No. 0337433). This lawsuit was filed by plaintiff asserting that the Bank had wrongfully exercised its rights to recover borrowings owed by plaintiff to the Bank by setting off those borrowings against plaintiff’s deposit accounts with the Bank. The plaintiff also asserted certain related claims, including an alleged breach by the Bank of the covenant of good faith and fair dealing.
The case was tried before a jury in August, 2011. However (i) before the case went to the jury for a decision, the trial judge ruled that the Bank had wrongfully exercised its set off rights and based on that finding, the jury awarded plaintiff $100,000 of compensatory damages, and (ii) the jury later found that the Bank’s exercise of its set off rights also constituted a wrongful conversion of plaintiff’s funds and awarded the plaintiff $150,000 in compensatory damages and $950,000 in punitive damages against the Bank. In addition, the trial court entered an award to plaintiff of his attorney’s fees and costs, in the amount of $762,000.
Following the entry of the final judgment by the trial court in February 2012, the Bank filed an appeal of the trial court’s rulings and the jury verdict, asserting that those rulings and the jury’s verdict were erroneous and that plaintiff is not entitled, as a matter of law, to an award of either compensatory or punitive damages. Because the appeals process has just begun, it is not possible at this time to predict, with any certainty, how the appellate courts will ultimately rule on our appeal. However, management believes that the judgment entered by the court against the Bank should be overturned on appeal.
Other Claims. We also are subject to legal actions that arise from time to time in the ordinary course of our business. Currently there are no such pending legal proceedings that we believe will become material to our financial condition or results of operations.
18. Employee Benefit Plans The Company has a 401(k) plan that covers substantially all full-time employees. That plan permits voluntary
contributions by employees, a portion of which are sometimes matched by the Company. The Company’s expenses relating to its contributions to the 401(k) plan for the years ended December 31, 2012, 2011 and 2010 were $297,000, $19,000, and $79,000, respectively.
In January 2001 the Company established an unfunded Supplemental Retirement Plan (“SERP”) for its President and CEO, Raymond E. Dellerba. The SERP was amended and restated in April 2006 to comply with the requirements of new Section 409A of Internal Revenue Code. The SERP provides that, subject to meeting certain vesting requirements described below, upon reaching age 65 Mr. Dellerba will become entitled to receive 180 equal successive monthly retirement payments, each in an amount equal to 60% of his average monthly base salary during the three years immediately preceding his reaching 65 years old (the “Monthly SERP Benefit”). Mr. Dellerba’s right to receive that Benefit vests monthly during the term of his employment at a rate equal to 1.5 monthly retirement payments for each month until fully vested.

PACIFIC MERCANTILE BANCORP AND SUBSIDIARIES NOTES TO CONSOLIDATED FINANCIAL STATEMENTS
113
The Company follows FASB ASC 715-30-35, which requires us to recognize in our balance sheet the funded status of any post-retirement plans that we maintain and to recognize, in other comprehensive income, changes in funded status of any such plans in any year in which changes occur.
The changes in the projected benefit obligations under the SERP during 2012, 2011 and 2010, its funded status at December 31, 2012, 2011 and 2010, and the amounts recognized in our consolidated statements of financial condition at each of those dates were as follows:
At December 31,
(Dollars in thousands)
2012 2011
2010
Change in benefit obligation:
Benefit obligation at beginning of period .............................. $ 2,641 $ 2,315 $ 2,077 Service cost ........................................................................... 208 200 192 Interest cost ........................................................................... 166 148 137 Participant contributions ........................................................ — — — Plan amendments ................................................................... — — — Combination/divestiture/curtailment/settlement/
termination ........................................................................ — — — Actuarial loss/(gain) .............................................................. 27 (22) (91)(Benefits paid) ....................................................................... — — —
Benefit obligation at end of period .............................. $ 3,042 $ 2,641 $ 2,315
Funded status: ................................................................................. — — — Amounts recognized in the Statement of Financial
Condition ..........................................................................
Unfunded accrued SERP liability—current .......................... $ — $ — $ — Unfunded accrued SERP liability—noncurrent .................... (3,042) (2,641) (2,315)
Total unfunded accrued SERP liability ........................ $(3,042) $(2,641) $(2,315)
Net amount recognized in accumulated other comprehensive income
Prior service cost/(benefit) .................................................... $ 1 $ 16 $ 31 Net actuarial loss/(gain) ......................................................... 29 (51) (35)
Total net amount recognized in accumulated other comprehensive income ............................................ $ 30 $ (35) $ (4)
Accumulated benefit obligation ............................................ $ 2,975 $ 2,606 $ 2,225 Components of net periodic SERP cost year to date:
Service cost ........................................................................... $ 208 $ 200 $ 192 Interest cost ........................................................................... 166 148 137 Expected return on plan assets .............................................. — — — Amortization of prior service cost/(benefit) .......................... 15 15 15 Amortization of net actuarial loss/(gain) ............................... (53) (6) 15
Net periodic SERP cost ................................................ $ 336 $ 357 $ 359
Recognized in other comprehensive income year to date:
Prior service cost/(benefit) .................................................... $ — $ — $ — Net actuarial loss/(gain) ......................................................... 27 (22) (91)Amortization of prior service cost/(benefit) .......................... (15) (15) (15)Amortization of net actuarial loss/(gain) ............................... 53 6 (15)
Total recognized year to date in other comprehensive (loss) income ........................................................... $ 65 $ (31) $ (121)
Assumptions as of December 31,:
Assumed discount rate........................................................... 6.00% 6.00% 6.25%Rate of compensation increase .............................................. 4.00% 4.00% 4.00%

PACIFIC MERCANTILE BANCORP AND SUBSIDIARIES NOTES TO CONSOLIDATED FINANCIAL STATEMENTS
114
As of December 31, 2012, $1.5 million benefits are expected to be paid in the next five years and a total of $1.5 million of benefits are expected to be paid from year 2018 to year 2023. In 2013, $224,000 is expected to be recognized in net periodic benefit cost.
Mr. Dellerba reached the age of 65 in January 2013 and, as a result, a monthly benefit payment under the SERP to Mr. Dellerba commenced on February 1, 2013.
19. Regulatory Matters and Capital/Operating Plans The Company and the Bank are subject to various regulatory capital requirements administered by the federal and state
banking agencies. A failure to meet minimum capital requirements is likely to lead to the imposition by federal and state regulators of (i) certain requirements, such as an order requiring additional capital to be raised, and (ii) operational restrictions that could have a direct and material adverse effect on operating results. Under capital adequacy guidelines and the regulatory framework for prompt corrective action, the Company and the Bank must meet specific capital guidelines that involve quantitative measures of assets, liabilities, and certain off-balance sheet items as calculated under regulatory accounting practices. The capital amounts and classifications are also subject to qualitative judgments by the regulators about components, risk weightings, and other factors. Also, as a result of the Written Agreement issued in August 2010, the Company is taking actions designed to maintain capital and return the Company to profitability, including, among others, strategy planning and budgeting, and capital and profit planning.
Quantitative measures established by regulation to ensure capital adequacy require the Company and Bank to maintain minimum amounts and ratios (set forth in the following table) of total and Tier I capital (as defined in the regulations) to risk-weighted assets (as defined), and of Tier I capital (as defined) to average assets (as defined). We believe that, as of December 31, 2012, the Company and the Bank met all capital adequacy requirements to which they are subject and have not been notified by any regulatory agency that would require the Company or the Bank to maintain additional capital.
The actual capital amounts and ratios of the Company and the Bank at December 31, 2012 and December 31, 2011 are presented in the following tables:
Applicable Federal Regulatory Requirement
Actual Capital
For Capital Adequacy Purposes
To be Categorized
As Well Capitalized
Amount Ratio Amount Ratio Amount
Ratio
(Dollars in thousands)Total Capital to Risk Weighted Assets:
Company ......................................... $ 141,946 16.5% $ 68,974 At least 8.0% N/A N/A Bank ................................................ 134,648 15.6% 68,969 At least 8.0% $ 86,211 At least 10.0%
Tier 1 Capital to Risk Weighted Assets:
Company ......................................... $ 131,165 15.2% $ 34,487 At least 4.0% N/A N/A Bank ................................................ 123,868 14.4% 34,484 At least 4.0% $ 51,727 At least 6.0%
Tier 1 Capital to Average Assets:
Company ......................................... $ 131,165 12.1% $ 43,219 At least 4.0% N/A N/A Bank ................................................ 123,868 11.5% 43,205 At least 4.0% $ 54,006 At least 5.0%
Applicable Federal Regulatory Requirement
Actual Capital
For Capital Adequacy Purposes
To be Categorized As Well Capitalized
Amount Ratio Amount Ratio Amount
Ratio
(Dollars in thousands)Total Capital to Risk Weighted Assets:
Company ......................................... $109,884 13.4% $ 65,543 At least 8.0% N/A N/A Bank ................................................ 109,603 13.4% 65,518 At least 8.0% $ 81,898 At least 10.0%
Tier 1 Capital to Risk Weighted Assets:
Company ......................................... $ 99,168 12.1% $ 32,771 At least 4.0% N/A N/A Bank ................................................ 99,308 12.1% 32,759 At least 4.0% $ 49,139 At least 6.0%
Tier 1 Capital to Average Assets:
Company ......................................... $ 99,168 9.8% $ 40,331 At least 4.0% N/A N/A Bank ................................................ 99,308 9.9% 40,298 At least 4.0% $ 50,373 At least 5.0%

PACIFIC MERCANTILE BANCORP AND SUBSIDIARIES NOTES TO CONSOLIDATED FINANCIAL STATEMENTS
115
As the above tables indicate, at December 31, 2012 and 2011, the Bank (on a stand-alone basis) qualified as a “well-capitalized” institution, and the capital ratios of the Company (on a consolidated basis) exceeded the capital ratios mandated for bank holding companies, under federally mandated capital standards and federally established prompt corrective action regulations. Since December 31, 2012, there have been no events or circumstances known to us which have changed or which are expected to result in a change in the Company’s or the Bank’s classification as well-capitalized institutions.
20. Parent Company Only Information
Condensed Statements of Financial Condition
December 31,
(Dollars in thousands)
2012 2011
Assets:
Due from banks and interest-bearing deposits with financial institutions ................................................................................. $ 12,576 $ 3,511
Investment in subsidiaries .............................................................. 129,331 100,646 Loans ............................................................................................. — 39 Other assets .................................................................................... 66 952
Total assets ........................................................................... $ 141,973 $ 105,148
Liabilities and shareholders’ equity:
Liabilities ....................................................................................... $ 1,570 $ 997 Subordinated debentures ................................................................ 17,527 17,527 Shareholders’ equity ...................................................................... 122,876 86,624
Total liabilities and shareholders’ equity ............................. $ 141,973 $ 105,148
Condensed Statements of Operations
Year Ended December 31,
(Dollars in thousands)
2012 2011
2010
Interest income.......................................................................... $ 136 $ 77 $ 113 Interest expense ........................................................................ (578) (542) (522)Other expenses .......................................................................... (1,428) (713) (1,738)Equity in undistributed earnings of subsidiaries ....................... 11,525 12,810 (11,807)
Net income (loss) ...................................................................... $ 9,655 $ 11,632 $ (13,954)

PACIFIC MERCANTILE BANCORP AND SUBSIDIARIES NOTES TO CONSOLIDATED FINANCIAL STATEMENTS
116
Condensed Statements of Cash Flows
Year Ended December 31,
(Dollars in thousands)
2012 2011
2010
Cash Flows from Operating Activities:
Net income (loss) .................................................................... $ 9,655 $ 11,632 $ (13,954)Adjustments to reconcile net income (loss) to net cash
provided by (used in) operating activities:
Net decrease (increase) in other assets .................................... 203 358 (310)Net decrease in deferred taxes ................................................ — — 1,087 Stock-based compensation expense ........................................ 483 278 167 Undistributed (income) loss of subsidiary .............................. (11,525) (12,810) 11,807 Net increase in interest payable .............................................. 578 542 395 Net (decrease) increase in other liabilities .............................. (5) 6 (73)
Net cash provided by (used in) operating activities ...... (611) 6 (881)
Cash Flows from Investing Activities:
Net decrease in loans .............................................................. 40 11 —
Net cash provided by investing activities ...................... 40 11 — Cash Flows from Financing Activities:
Proceeds from sale of Common Stock .................................... 24,591 — — Common stock options exercised ........................................... 1 — — Common stock warrants issued .............................................. 44 — — Proceeds from sale of Series A and Series B Preferred
Stock .................................................................................. — 8,747 4,605 Capital contribution to subsidiaries ........................................ (15,000) (10,500) (5,750)
Net cash provided by (used in) financing activities ...... 9,636 (1,753) (1,145)
Net increase (decrease) in cash and cash equivalents ............. 9,065 (1,736) (2,026)Cash and Cash Equivalents, beginning of period ................... 3,511 5,247 7,273
Cash and Cash Equivalents, end of period .................... $ 12,576 $ 3,511 $ 5,247

PACIFIC MERCANTILE BANCORP AND SUBSIDIARIES NOTES TO CONSOLIDATED FINANCIAL STATEMENTS
117
21. Business Segment Information The Company has two reportable business segments, the commercial banking division and the mortgage banking
division, which began operations in the second quarter of 2010. The commercial bank segment provides small and medium-size businesses, professional firms and individuals with a diversified range of products and services such as various types of deposit accounts, various types of commercial and consumer loans, cash management services, and online banking services. The mortgage banking segment originates and purchases residential mortgages that, for the most part, are resold within 30 days to long-term investors in the secondary residential mortgage market.
Since the Company derives all of its revenues from interest and noninterest income and interest expense is its most significant expense, these two segments are reported below using net interest income (interest income less interest expense) and noninterest income (primarily net gains on sales of loans held for sale and fee income) for the years ended December 31, 2012, 2011 and 2010. The Company does not allocate general and administrative expenses or income taxes to the segments.
(Dollars in thousands)
Commercial Mortgage Other
Total
Net interest income for the period ended: December 31,
2012 ...................................................... $ 29,764 $ 3,949 $ (442) $ 33,271 2011 ...................................................... $ 32,103 $ 1,553 $ (465) $ 33,191 2010 ...................................................... $ 32,190 $ 1,057 $ (409) $ 32,838
Noninterest income for the period ended: December 31,
2012 ...................................................... $ 3,237 $ 25,256 $ — $ 28,493 2011 ...................................................... $ 2,107 $ 6,122 $ — $ 8,229 2010 ...................................................... $ 3,028 $ 3,739 $ 4 $ 6,771
Segment Assets at:
December 31, 2012 ............................... $ 940,748 $ 99,829 $ 13,024 $ 1,053,601 December 31, 2011 ............................... $ 840,549 $ 86,614 $ 97,389 $ 1,024,552
22. Subsequent Event The Company entered into a Stock Purchase Agreement, effective as of February 27, 2013 (the “Stock Purchase
Agreement”), providing for it to sell up to a total of 2,222,222 shares of its common stock, at a purchase price of $6.75 per share in cash, to Carpenter Community BancFund, L.P. and Carpenter Community BancFund-A, L.P. (collectively, the “Carpenter Funds”). The purchase price of $6.75 per share of common stock is equal to the Company’s tangible book value per share of common stock as of December 31, 2012.
The net proceeds from the sale of those shares, which will be approximately $15 million, will be contributed by the Company to capitalize a new wholly-owned asset management subsidiary, which will use those proceeds to fund the purchase of nonperforming loans and foreclosed real properties from the Bank. Following the purchase of those assets, the new asset management subsidiary will focus its efforts and resources principally on managing and disposing of those assets. By significantly reducing its nonperforming assets, the sale and transfer of those assets by the Bank to that subsidiary will result in improvements in the Bank’s financial condition and will reduce the costs it has been incurring in managing and disposing of those assets, which are expected to result in improvements in the Bank’s future financial performance. In addition, the proceeds from the sale of those assets will provide the Bank with additional financial resources that it plans to use to fund new loans and growth initiatives.
Consummation of the sale of the shares of common stock to the Carpenter Funds pursuant to the Stock Purchase Agreement remains subject to the satisfaction, by no later than April 15, 2013, of conditions customary for transactions of this nature and the condition that the Company and the Carpenter Funds will have obtained, by no later than May 15, 2013, federal bank regulatory approvals for the purchase by the Carpenter Funds of the shares of common stock and the purchase, by the Company’s new asset management subsidiary, of nonperforming assets from the Bank. There is no assurance that all of the conditions will be satisfied and, therefore, there can be no assurance that the sale of the $15 million of shares of common stock to the Carpenter Funds will be consummated.

PACIFIC MERCANTILE BANCORP AND SUBSIDIARIES NOTES TO CONSOLIDATED FINANCIAL STATEMENTS
118
The Company has agreed that, if the sale of the shares of common stock to the Carpenter Funds is consummated pursuant to the Stock Purchase Agreement, it will register those shares for resale under the Securities Act of 1933, as amended, pursuant to a Registration Rights Agreement entered into by the Company and the Carpenter Funds in connection with their purchase of $26.3 million of shares of Company common stock in April 2012. Under that Agreement, the registration expenses will be borne by the Company.
The Carpenter Funds currently own a total of approximately 28% of our voting stock and together constitute the Company’s largest shareholder. Upon the consummation of the transactions contemplated by the Stock Purchase Agreement, the Carpenter Funds will own approximately 34% of the Company’s voting stock. Further, as previously reported, pursuant to an investor rights agreement entered into by the Company with the Carpenter Funds in connection with their purchase of $26.3 million of shares of Company common stock in April 2012, three individuals designated by the Carpenter Funds were appointed to serve on the respective Boards of Directors of both the Company and the Bank.

119
ITEM 9. CHANGES IN AND DISAGREEMENTS WITH ACCOUNTANTS ON ACCOUNTING AND FINANCIAL DISCLOSURES
None.
ITEM 9A(T). CONTROLS AND PROCEDURES Disclosure Controls and Procedures
We maintain disclosure controls and procedures that are designed to ensure that information required to be disclosed in our reports under the Securities Exchange Act of 1934, as amended (the “Exchange Act”) is recorded, processed, summarized and reported within the time periods specified in the rules and forms of the Securities and Exchange Commission (the “SEC”), and that such information is accumulated and communicated to our management, including our Chief Executive Officer and Chief Financial Officer, to allow timely decisions regarding required disclosure. In designing and evaluating our disclosure controls and procedures, our management recognized that any system of controls and procedures, no matter how well designed and operated, can provide only reasonable assurance of achieving the desired control objectives, as ours are designed to do, and management necessarily was required to apply its judgment in evaluating the cost-benefit relationship of possible controls and procedures.
As required by SEC rules, an evaluation was performed under the supervision and with the participation of our Chief Executive Officer and Chief Financial Officer of the effectiveness, as of December 31, 2012, of the Company’s disclosure controls and procedures (as defined in Rule 13a-15(e) under the Exchange Act). Based on that evaluation, our Chief Executive Officer and Chief Financial Officer concluded that, as of December 31, 2012, the Company’s disclosure controls and procedures were effective to provide reasonable assurance that information required to be disclosed in the reports that we file under the Exchange Act is recorded, processed, summarized and reported within the time periods specified in the SEC’s rules and forms and that such information is accumulated and communicated to management, including our Chief Executive Officer and Chief Financial Officer, to allow timely decisions regarding required disclosure.
Internal Control Over Financial Reporting Management’s Annual Report on Internal Control Over Financial Reporting
Management of Pacific Mercantile Bancorp is responsible for establishing and maintaining adequate internal control over financial reporting as defined in Rules 13a-15(f) and 15d-15(f) under the Securities Exchange Act of 1934. Our internal control over financial reporting is a process designed to provide reasonable assurance regarding the reliability of financial reporting and the preparation of financial statements for external purposes in accordance with accounting principles generally accepted in the United States of America. Internal control over financial reporting includes those written policies and procedures that:
• pertain to the maintenance of records that, in reasonable detail, accurately and fairly reflect the transactions and dispositions of our assets;
• provide reasonable assurance that transactions are recorded as necessary to permit preparation of financial statements in accordance with accounting principles generally accepted in the United States of America;
• provide reasonable assurance that our receipts and expenditures are being made only in accordance with authorization of our management and board of directors; and
• provide reasonable assurance regarding prevention or timely detection of unauthorized acquisition, use or disposition of assets that could have a material effect on our consolidated financial statements.
Internal control over financial reporting includes the controls themselves, monitoring and internal auditing practices and actions taken to correct deficiencies as identified. Because of its inherent limitations, internal control over financial reporting may not prevent or detect misstatements. Also, projections of any evaluation of effectiveness to future periods are subject to the risks that controls may become inadequate because of changes in conditions or because the degree of compliance with the policies or procedures may deteriorate.
Management’s Assessment of Internal Control over Financial Reporting Our management assessed the effectiveness of the Company’s internal control over financial reporting as of
December 31, 2012, based on criteria for effective internal control over financial reporting described in “Internal Control – Integrated Framework” issued by the Committee of Sponsoring Organizations of the Treadway Commission. Management’s assessment included an evaluation of the design and the testing of the operational effectiveness of the Company’s internal control over financial reporting. Management reviewed the results of its assessment with the Audit Committee of our Board of Directors.

120
Based on that assessment, management determined that, as of December 31, 2012, Pacific Mercantile Bancorp maintained effective internal control over financial reporting.
The foregoing report on internal control over financial reporting shall not be deemed “filed” for purposes of Section 18 of the Exchange Act or otherwise subject to the liabilities of that section.
Section 989G of the Dodd-Frank Act, signed into law in July 2011, permanently exempts smaller reporting companies, such as the Company, and other non-accelerated filers, from Section 404(b) of the Sarbanes-Oxley Act requiring SEC reporting companies to obtain and include in their annual reports on Form 10-K, an attestation report from their independent registered accountants with respect to the effectiveness of their internal control over financial reporting. As a result, no such attestation report is included in this Annual Report.
Changes in Internal Control Over Financial Reporting There were no changes in our internal control over financial reporting during the quarter ended December 31, 2012 that
have materially affected, or are reasonably likely to materially affect, our internal control over financial reporting.
ITEM 9B. OTHER INFORMATION None.

121
PART III
ITEM 10. DIRECTORS, EXECUTIVE OFFICERS AND CORPORATE GOVERNANCE
The information required by this Item 10 is hereby incorporated by reference to Pacific Mercantile Bancorp’s definitive proxy statement, expected to be filed with the SEC on or before April 30, 2013, for its Annual Meeting of Shareholders.
ITEM 11. EXECUTIVE COMPENSATION
The information required by this Item 11 is hereby incorporated by reference to Pacific Mercantile Bancorp’s definitive proxy statement, expected to be filed with the SEC on or before April 30, 2013, for its Annual Meeting of Shareholders.
ITEM 12. SECURITY OWNERSHIP OF CERTAIN BENEFICIAL OWNERS AND MANAGEMENT AND RELATED STOCKHOLDER MATTERS
Except for the information below regarding our equity compensation plans, the information required by Item 12 is incorporated herein by reference from our definitive proxy statement expected to be filed with the SEC on or before April 30, 2013, for its Annual Meeting of Shareholders.
The following table provides information relating to our equity compensation plans as of December 31, 2012:
Column A Column B Column C
Number of Securities to be Issued
on Exercise of Outstanding Options
Weighted Average Exercise Price of Outstanding
Options
Number of Securities Remaining Available forFuture Issuance under Equity Compensation
Plans (Excluding Securities Reflected in
Column A Equity compensation plans approved by shareholders
Stock option and incentive plans ............................ 1,566,965 $ 6.90 115,494 Equity compensation plans not approved by
shareholders ................................................................ — — —
1,566,965 $ 6.90 115,494
ITEM 13. CERTAIN RELATIONSHIPS AND RELATED TRANSACTIONS, AND DIRECTOR INDEPENDENCE
The information required by this Item 13 is hereby incorporated by reference to Pacific Mercantile Bancorp’s definitive proxy statement expected to be filed with the SEC on or before April 30, 2012, for its Annual Meeting of Shareholders.
ITEM 14. PRINCIPAL ACCOUNTING FEES AND SERVICES The information required by this Item 14 is hereby incorporated by reference to Pacific Mercantile Bancorp’s definitive
proxy statement expected to be filed with the SEC on or before April 30, 2012, for its Annual Meeting of Shareholders.
PART IV
ITEM 15. EXHIBITS AND FINANCIAL STATEMENT SCHEDULES The following documents are filed as part of this Report: (1) Financial Statements. The Consolidated Financial Statements of Pacific Mercantile Bancorp: See Index to
Financial Statements on Page 68 of this Annual Report. (2) Financial Statement Schedules. No financial statement schedules are included in this Annual Report as such
schedules are not required or the information that would be included in such schedules is not material or is otherwise furnished.
(3) Exhibits. See Index to Exhibits, elsewhere in this Report, for a list and description of (i) exhibits previously filed by the Company with the Commission and (ii) the exhibits being filed with this Report.
S-1
SIGNATURES
Pursuant to the requirements of Section 13 or 15(d) of the Securities Exchange Act of 1934, the registrant has duly caused this report to be signed on its behalf by the undersigned, thereunto duly authorized, on the 19th day of March 2013.
PACIFIC MERCANTILE BANCORP By: /S/ RAYMOND E. DELLERBA
Raymond E. DellerbaPresident and Chief Executive Officer
POWER OF ATTORNEY
Each person whose signature appears below hereby appoints Raymond E. Dellerba, and Nancy Gray, and each of them individually, to act severally as his or her attorneys-in-fact and agent, with full power and authority, including the power of substitution and resubstitution, to sign and file on his or her behalf and in each capacity stated below, all amendments and/or supplements to this Annual Report on Form 10-K, which amendments or supplements may make changes and additions to this Report as such attorneys-in-fact, or any of them, may deem necessary or appropriate.
Pursuant to the requirements of the Securities Exchange Act of 1934, this Report on Form 10-K has been signed below by the following persons in their respective capacities and on the date or dates indicated below.
/S/ RAYMOND E. DELLERBA
Raymond E. Dellerba President, Chief Executive Officer and Director (Principal Executive Officer)
March 19, 2013
/S/ NANCY A. GRAY
Nancy A. Gray Senior Executive Vice President and Chief Financial Officer (Principal Financial and Principal Accounting Officer)
March 19, 2013
/s/ Edward J. Carpenter
Edward J. Carpenter Chairman of the Board and Director March 19, 2013
/S/ GEORGE L. ARGYROS
George L. Argyros Director March 19, 2013
/s/ John W. Clark
John W. Clark Director March 19, 2013
/S/ WARREN T. FINLEY
Warren T. Finley Director March 19, 2012
/S/ JOHN D. FLEMMING
John D. Flemming Director March 19, 2013
/s/ Michael P. Hoopis
Michael P. Hoopis Director March 19, 2013
/S/ ANDREW M. PHILLIPS
Andrew M. Phillips DirectorDirector
March 19, 2013
/s/ Daniel A. Strauss
Daniel A. Strauss Director March 19, 2013
/S/ JOHN THOMAS, M.D.
John Thomas, M.D Director March 19, 2013
/S/ GARY M. WILLIAMS
Gary M. Williams Director March 19, 2013

Exhibit 31.1
CERTIFICATIONS OF CHIEF EXECUTIVE OFFICER UNDER
SECTION 302 OF THE SARBANES-OXLEY ACT
I, Raymond E. Dellerba, certify that: 1. I have reviewed this Annual Report on Form 10-K of Pacific Mercantile Bancorp for the fiscal year ended
December 31, 2012. 2. Based on my knowledge, this report does not contain any untrue statement of a material fact or omit to state a
material fact necessary to make the statements made, in light of the circumstances under which such statements were made, not misleading with respect to the period covered by this report;
3. Based on my knowledge, the financial statements, and other financial information included in this report, fairly present in all material respects the financial condition, results of operations and cash flows of the registrant as of, and for, the periods presented in this report;
4. The registrant’s other certifying officer and I are responsible for establishing and maintaining disclosure controls and procedures (as defined in Exchange Act Rules 13a-15(e) and 15d-15(e)) and internal control over financial reporting (as defined in Exchange Act Rules 13a-15(f) and 15d-15(f)) for the registrant and have: (a) Designed such disclosure controls and procedures, or caused such disclosure controls and procedures to be
designed under our supervision, to ensure that material information relating to the registrant, including its consolidated subsidiaries, is made known to us by others within those entities, particularly during the period in which this report is being prepared;
(b) Designed such internal control over financial reporting, or caused such internal control over financial reporting to be designed under our supervision, to provide reasonable assurance regarding the reliability of financial reporting and the preparation of financial statements for external purposes in accordance with generally accepted accounting principles;
(c) Evaluated the effectiveness of the registrant’s disclosure controls and procedures and presented in this report our conclusions about the effectiveness of the disclosure controls and procedures as of the end of the period covered by this report based on such evaluation; and
(d) Disclosed in this report any change in the registrant’s internal control over financial reporting that occurred during the registrant’s most recent fiscal quarter (the registrant’s fourth fiscal quarter in the case of an annual report) that has materially affected, or is reasonably likely to materially affect, the registrant’s internal control over financial reporting; and
5. The registrant’s other certifying officer and I have disclosed, based on our most recent evaluation of internal control over financial reporting, to the registrant’s auditors and the audit committee of the registrant’s board of directors (or persons performing the equivalent functions): (a) All significant deficiencies and material weaknesses in the design or operation of internal control over
financial reporting which are reasonably likely to adversely affect the registrant’s ability to record, process, summarize and report financial information; and
(b) Any fraud, whether or not material, that involves management or other employees who have a significant role in the registrant’s internal control over financial reporting.
Date: March 19, 2013
/S/ RAYMOND E. DELLERBA
Raymond E. DellerbaPresident and Chief Executive Officer

Exhibit 31.2
CERTIFICATIONS OF CHIEF FINANCIAL OFFICER UNDER
SECTION 302 OF THE SARBANES-OXLEY ACT
I, Nancy A. Gray, certify that: 1. I have reviewed this Annual Report on Form 10-K of Pacific Mercantile Bancorp for the fiscal year ended
December 31, 2012. 2. Based on my knowledge, this report does not contain any untrue statement of a material fact or omit to state a
material fact necessary to make the statements made, in light of the circumstances under which such statements were made, not misleading with respect to the period covered by this report;
3. Based on my knowledge, the financial statements, and other financial information included in this report, fairly present in all material respects the financial condition, results of operations and cash flows of the registrant as of, and for, the periods presented in this report;
4. The registrant’s other certifying officer and I are responsible for establishing and maintaining disclosure controls and procedures (as defined in Exchange Act Rules 13a-15(e) and 15d-15(e)) and internal control over financial reporting (as defined in Exchange Act Rules 13a-15(f) and 15d-15(f)) for the registrant and have: (a) Designed such disclosure controls and procedures, or caused such disclosure controls and procedures to be
designed under our supervision, to ensure that material information relating to the registrant, including its consolidated subsidiaries, is made known to us by others within those entities, particularly during the period in which this report is being prepared;
(b) Designed such internal control over financial reporting, or caused such internal control over financial reporting to be designed under our supervision, to provide reasonable assurance regarding the reliability of financial reporting and the preparation of financial statements for external purposes in accordance with generally accepted accounting principles;
(c) Evaluated the effectiveness of the registrant’s disclosure controls and procedures and presented in this report our conclusions about the effectiveness of the disclosure controls and procedures as of the end of the period covered by this report based on such evaluation; and
(d) Disclosed in this report any change in the registrant’s internal control over financial reporting that occurred during the registrant’s most recent fiscal quarter (the registrant’s fourth fiscal quarter in the case of an annual report) that has materially affected, or is reasonably likely to materially affect, the registrant’s internal control over financial reporting; and
5. The registrant’s other certifying officer and I have disclosed, based on our most recent evaluation of internal control over financial reporting, to the registrant’s auditors and the audit committee of the registrant’s board of directors (or persons performing the equivalent functions): (a) All significant deficiencies and material weaknesses in the design or operation of internal control over
financial reporting which are reasonably likely to adversely affect the registrant’s ability to record, process, summarize and report financial information; and
(b) Any fraud, whether or not material, that involves management or other employees who have a significant role in the registrant’s internal control over financial reporting.
Date: March 19, 2013
/S/ NANCY A. GRAY
Nancy A. Gray Chief Financial Officer

Exhibit 32.1
CERTIFICATIONS OF CHIEF EXECUTIVE OFFICER UNDER
SECTION 906 OF THE SARBANES-OXLEY ACT
PACIFIC MERCANTILE BANCORP
Annual Report on Form 10-K for the Year ended December 31, 2012
In connection with the accompanying Annual Report on Form 10-K of Pacific Mercantile Bancorp (the “Company”) for the fiscal year ended December 31, 2012 (the “Annual Report”), and pursuant to 18 U.S.C. §1350, as adopted pursuant to §906 of the Sarbanes-Oxley Act of 2003, I, Raymond E. Dellerba, certify that:
(1) The Annual Report fully complies with the requirements of Section 13(a) and 15(d) of the Securities Exchange Act of 1934; and
(2) The information contained in the Annual Report fairly presents, in all material respects, the financial condition and results of operations of the Company.
Dated: March 19, 2013
/S/ RAYMOND E. DELLERBA Raymond E. Dellerba
President and Chief Executive Officer A signed original of this written statement required by Section 906 has been provided to Pacific Mercantile Bancorp and will be retained by Pacific Mercantile Bancorp and furnished to the Securities and Exchange Commission or its staff upon request.
Exhibit 32.2
CERTIFICATIONS OF CHIEF FINANCIAL OFFICER UNDER
SECTION 906 OF THE SARBANES-OXLEY ACT
PACIFIC MERCANTILE BANCORP
Annual Report on Form 10-K for the Year ended December 31, 2012
In connection with the accompanying Annual Report on Form 10-K of Pacific Mercantile Bancorp (the “Company”) for the fiscal year ended December 31, 2012 (the “Annual Report”), and pursuant to 18 U.S.C. §1350, as adopted pursuant to §906 of the Sarbanes-Oxley Act of 2003, I, Nancy A. Gray, certify that:
(1) The Annual Report fully complies with the requirements of Section 13(a) and 15(d) of the Securities Exchange Act of 1934; and
(2) The information contained in the Annual Report fairly presents, in all material respects, the financial condition and results of operations of the Company.
Dated: March 19, 2013
/S/ NANCY A. GRAY Nancy A. Gray
Chief Financial Officer A signed original of this written statement required by Section 906 has been provided to Pacific Mercantile Bancorp and will be retained by Pacific Mercantile Bancorp and furnished to the Securities and Exchange Commission or its staff upon request.

[THIS PAGE INTENTIONALLY LEFT BLANK]

PACIFIC MERCANTILE BANK & PACIFIC MERCANTILE BANCORP
Board of Directors
Edward J. Carpenter Chairman of the Board Chairman & CEO Carpenter & Company Members
George L. Argyros Chairman & Chief Executive Officer Arnel & Affiliates
Steven K. Buster President & CEO Pacific Mercantile Bancorp Pacific Mercantile Bank
John W. Clark Partner Westar Capital, LLC
Raymond E. Dellerba Vice Chairman & CEO Emeritus Pacific Mercantile Bancorp Pacific Mercantile Bank
Warren T. Finley Attorney at Law
John D. Flemming President & COO Carpenter & Company
Michael P. Hoopis President & CEO Targus Group International, Inc.
Andrew M. Phillips President & Founder CardFlex Financial Services
Daniel A. Strauss Senior Strategist Clinton Group, Inc.
John Thomas, M.D. President & Medical Director Red Bluff Cancer Center
Gary M. Williams President & Chief Executive Officer Garcher Enterprises, Inc.
Stephen P. Yost Financial Consultant Kestrel Advisors
CORPORATE OFFICERS
Pacific Mercantile Bancorp Steven K. Buster President & Chief Executive Officer
Raymond E. Dellerba Vice Chairman & CEO Emeritus
Nancy A. Gray Sr. Executive Vice President & Chief Financial Officer
Barbara I. Palermo Executive Vice President, Administration & Corporate Secretary
CORPORATE OFFICERS (continued)
Pacific Mercantile Bank Steven K. Buster President & CEO
Raymond E. Dellerba Vice Chairman & CEO Emeritus
Robert W. Bartlett Sr. Executive Vice President & Chief Credit Officer
Charles L. Dow Executive Vice President & Chief Technology Officer
Nancy A. Gray Sr. Executive Vice President & Chief Financial Officer
Michael G. Green Executive Vice President & Chief Credit Administrator
Gary Braunstein Executive Vice President, Mortgage Division Manager
Barbara I. Palermo Executive Vice President, Administration & Corp. Sec’y.
Maxwell G. Sinclair Executive Vice President, Chief Risk & Compliance Officer
Robert E. Sjogren General Counsel
Thomas M. Vertin President, Commercial Banking Division CORPORATE INFORMATION Legal Counsel Stradling Yocca Carlson & Rauth 660 Newport Center Drive, 16th Floor Newport Beach, CA 92660
Certified Public Accountants Squar, Milner, Peterson, Miranda & Williamson, LLP 4100 Newport Place Drive, Third Floor Newport Beach, CA 92660
Stock Transfer Agent and Registrar Computershare Investor Services, LLC 1745 Gardena Avenue Glendale, CA 91204-2991
Annual Stockholders Meeting Fairmont Hotel 4500 MacArthur Blvd. Newport Beach, CA 92660 May 22, 2013, 2:00 PM
Stock Listing The Company’s Common Stock is traded on Nasdaq National Markets under the symbol PMBC
Inquiries/Financial Information Stockholders or members of the Investment Community seeking information about Pacific Mercantile Bank or Pacific Mercantile Bancorp, should direct their inquiries to the Bank’s website at www.pmbank.com, or to Barbara I. Palermo, EVP, at 714-438-2500, or in writing to corporate headquarters.

PACIFIC MERCANTILE BANK
CORPORATE HEADQUARTERS
949 SOUTH COAST DRIVE, THIRD FLOOR
COSTA MESA, CA 92626
MORTGAGE DIVISION, SUITE 240
SBA DIVISION, SUITE 508
COSTA MESA, CA 92626
FINANCIAL CENTERS
450 NEWPORT CENTER DRIVE, SUITE 100
NEWPORT BEACH, CA 92660
949 SOUTH COAST DRIVE, SUITE 105
COSTA MESA, CA 92626
31601 AVENIDA LOS CERRITOS, SUITE 100
SAN JUAN CAPISTRANO, CA 92675
1530 W. WHITTIER BOULEVARD, SUITE B
LA HABRA, CA 90631
9720 WILSHIRE BOULEVARD, SUITE 100
ENTERTAINMENT INDUSTRIES DIVISION, SUITE 210
BEVERLY HILLS, CA 90212
3257 EAST GUASTI ROAD, SUITE 110
ONTARIO, CA 91761
4225 EXECUTIVE SQUARE, SUITE 150
LA JOLLA, CA 92037
www.pmbank.com