2012 annual report | lincoln electric
TRANSCRIPT
ww
w.l
inco
lnel
ectr
ic.c
om
LINCOLN ELECTRIC HOLDINGS, INC.
22801 St. Clair AvenueCleveland, Ohio 44117-1199U.S.A.
investing in GROWTHdriving INNOVATION
20
12
AN
NU
AL
RE
PO
RT
We are a global manufacturer and the market leader of the highest
quality welding, cutting, and joining products. Our enduring passion
for the development and application of our technologies allows us to
create complete solutions that make our customers more productive
and successful. We distinguish ourselves through an unwavering
commitment to our employees and a relentless drive to maximize
shareholder value.
Lincoln Electric is the world leader in the design, development
and manufacture of arc welding products, robotic arc-welding
systems, and plasma and oxyfuel cutting equipment, and has
a leading global position in the brazing and soldering alloys
market. Headquartered in Cleveland, Ohio, U.S.A., Lincoln
has 45 manufacturing locations, including operations and joint
ventures in 19 countries, and a worldwide network of distributors
and sales offices covering more than 160 countries.
Recognized as The Welding Experts®, Lincoln provides
cutting-edge products and solutions, and has a long history of
being a pioneer in new technology for arc welding consumables
and equipment. Lincoln operates the industry’s most extensive
and comprehensive research and product development program,
TABLE OF CONTENTSFinancial Highlights 1
Shareholder Letter 2
Industry Segments 6
Corporate Information 12
OUR VISION
WHO WE ARE + WHAT WE DOsupported by its R&D centers around the world, including the
David C. Lincoln Technology Center, the most advanced facility of
its kind in the welding industry.
Lincoln Electric’s products and welding solutions play an
important role in the development of many industries and
infrastructures around the world. Arc welding is the dominant
joining method for steel buildings and other industrial
construction, including oil and gas pipeline fabrication,
shipbuilding and oil refinery construction, construction
equipment and farm equipment. Lincoln services a wide variety
of industries that rely on arc welding, such as transportation,
power generation and all forms of metal fabrication.
1
FINANCIAL HIGHLIGHTS
Year Ended December 31(dollars in millions, except per share data)
2012 2011 2010
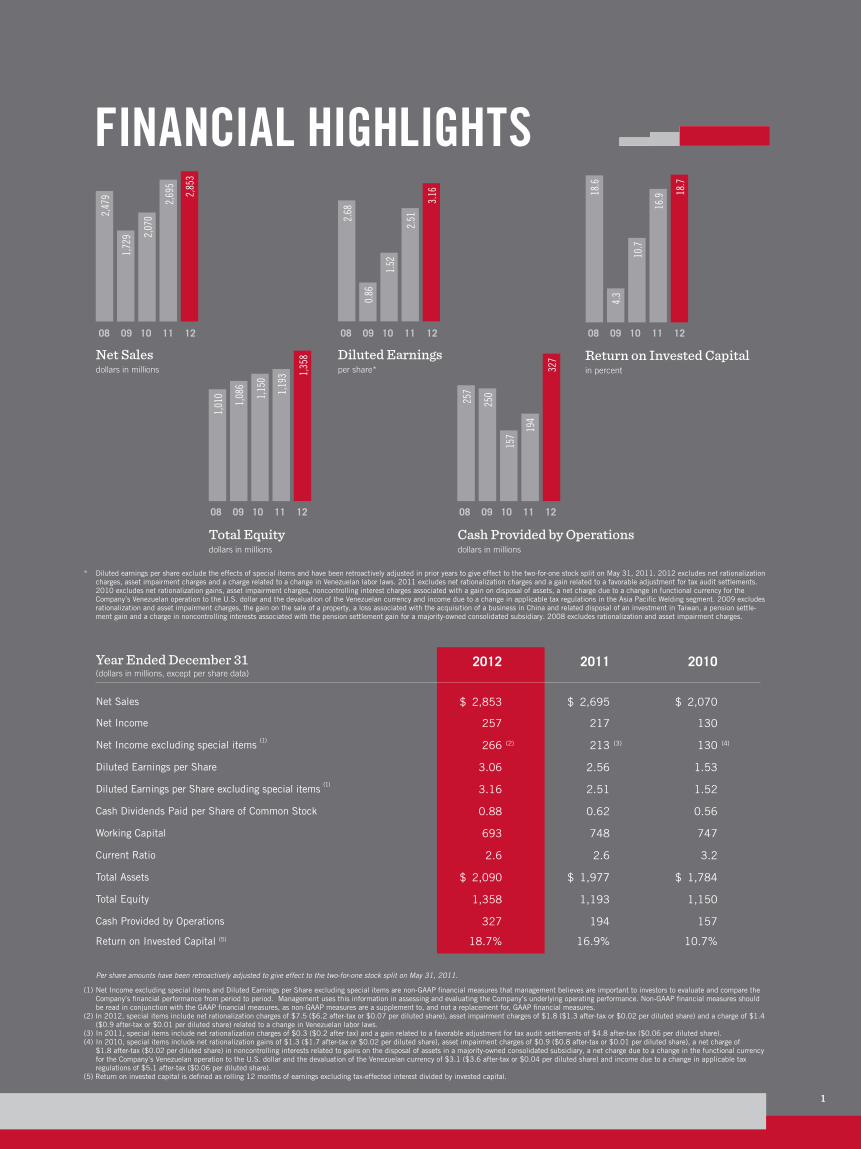
Net Sales $ 2,853 $ 2,695 $ 2,070
Net Income 257 217 130
Net Income excluding special items (1) 266 (2) 213 (3) 130 (4)
Diluted Earnings per Share 3.06 2.56 1.53
Diluted Earnings per Share excluding special items (1) 3.16 2.51 1.52
Cash Dividends Paid per Share of Common Stock 0.88 0.62 0.56
Working Capital 693 748 747
Current Ratio 2.6 2.6 3.2
Total Assets $ 2,090 $ 1,977 $ 1,784
Total Equity 1,358 1,193 1,150
Cash Provided by Operations 327 194 157
Return on Invested Capital (5) 18.7% 16.9% 10.7%
* Diluted earnings per share exclude the effects of special items and have been retroactively adjusted in prior years to give effect to the two-for-one stock split on May 31, 2011. 2012 excludes net rationalization charges, asset impairment charges and a charge related to a change in Venezuelan labor laws. 2011 excludes net rationalization charges and a gain related to a favorable adjustment for tax audit settlements. 2010 excludes net rationalization gains, asset impairment charges, noncontrolling interest charges associated with a gain on disposal of assets, a net charge due to a change in functional currency for the Company’s Venezuelan operation to the U.S. dollar and the devaluation of the Venezuelan currency and income due to a change in applicable tax regulations in the Asia Pacific Welding segment. 2009 excludes rationalization and asset impairment charges, the gain on the sale of a property, a loss associated with the acquisition of a business in China and related disposal of an investment in Taiwan, a pension settle-ment gain and a charge in noncontrolling interests associated with the pension settlement gain for a majority-owned consolidated subsidiary. 2008 excludes rationalization and asset impairment charges.
Per share amounts have been retroactively adjusted to give effect to the two-for-one stock split on May 31, 2011.
(1) Net Income excluding special items and Diluted Earnings per Share excluding special items are non-GAAP financial measures that management believes are important to investors to evaluate and compare the Company’s financial performance from period to period. Management uses this information in assessing and evaluating the Company’s underlying operating performance. Non-GAAP financial measures should be read in conjunction with the GAAP financial measures, as non-GAAP measures are a supplement to, and not a replacement for, GAAP financial measures.
(2) In 2012, special items include net rationalization charges of $7.5 ($6.2 after-tax or $0.07 per diluted share), asset impairment charges of $1.8 ($1.3 after-tax or $0.02 per diluted share) and a charge of $1.4 ($0.9 after-tax or $0.01 per diluted share) related to a change in Venezuelan labor laws.
(3) In 2011, special items include net rationalization charges of $0.3 ($0.2 after tax) and a gain related to a favorable adjustment for tax audit settlements of $4.8 after-tax ($0.06 per diluted share).(4) In 2010, special items include net rationalization gains of $1.3 ($1.7 after-tax or $0.02 per diluted share), asset impairment charges of $0.9 ($0.8 after-tax or $0.01 per diluted share), a net charge of
$1.8 after-tax ($0.02 per diluted share) in noncontrolling interests related to gains on the disposal of assets in a majority-owned consolidated subsidiary, a net charge due to a change in the functional currency for the Company’s Venezuelan operation to the U.S. dollar and the devaluation of the Venezuelan currency of $3.1 ($3.6 after-tax or $0.04 per diluted share) and income due to a change in applicable tax regulations of $5.1 after-tax ($0.06 per diluted share).
(5) Return on invested capital is defined as rolling 12 months of earnings excluding tax-effected interest divided by invested capital.
Net Salesdollars in millions
08 09 10 11 12
2,69
5
2,85
3
2,47
9
2,07
0
1,72
9
Cash Provided by Operationsdollars in millions
08 09 10 11 12
194
327
257
157
250
Diluted Earnings per share*
08 09 10 11 12
2.51
3.16
2.68
1.52
0.86
Return on Invested Capitalin percent
08 09 10 11 12
16.9 18
.7
18.6
10.7
4.3
08 09 10 11 12
1,19
3 1,35
8
1,01
0 1,15
0
1,08
6
Total Equitydollars in millions

2
As the theme of this year’s annual report highlights, we are unrelenting in our commitment to drive innovation and
invest in profitable growth. This past year, as has been the case in recent years, we continued our aggressive new product
development efforts. More than 50% of our 2012 equipment sales were derived from products developed during the
past five years. We will continue to invest heavily in our R&D activities, and our 2012 engineering training class was the
largest in our 118-year history, which bodes well for future innovation, successful new product launches and improved
customer support.
SHAREHOLDERSTo Our Fellow
Lincoln Electric continues to build on its long-standing track record of
returning exceptional value to shareholders. The Company generated solid
operating results in 2012 despite the weak macroeconomic environment in
many of our global markets. Our strong performance reflects the dedication
and talents of our entire team as they work tirelessly toward executing
our strategies and achieving our aggressive growth objectives. In addition,
our strong results and financial strength enabled the Board of Directors
to significantly increase the dividend and conduct a substantial share
repurchase program during the year.
Left to right:
Christopher L. Mapes, President and Chief Executive Officer John M. Stropki, Executive Chairman Vincent K. Petrella, SVP, Chief Financial Officer
3
Previous acquisitions enhanced our capabilities in strategic
growth areas – including Torchmate® in cutting equipment;
Arc Products® in automation systems; and Techalloy® in nickel
alloy consumables.
All told, business portfolio additions completed during 2011
and 2012 contributed approximately $133 million in revenues
in 2012, and have added new highly skilled employees to our
expanding worldwide workforce. We will continue to pursue
complementary acquisitions that will further strengthen our
position and the value we provide customers in growth
market segments.
2012: ANOTHER RECORD YEAR
Sales increased 5.9% to a record $2.9 billion, and net income
increased 18.5% to a record $257.4 million in 2012. Gross
profit margins increased to 30.4% in 2012 from 27.3% in 2011,
and our return on invested capital increased to 18.7% in 2012
from 16.9% for the previous year.
Our strong cash flow generation and healthy balance sheet
will enable us to consistently and opportunistically deploy our
cash in a disciplined approach to increase shareholder value, as
reflected by the 17.6% increase in the quarterly cash dividend
declared by the Board of Directors on December 5, 2012,
and the buyback of more than $81 million in common shares
throughout the year.
RECOGNITIONS FOR LEADERSHIP AND EXCELLENCE
We are especially proud that our Mason, Ohio, Harris Products
Group facility was named by Industry Week as one of the top
manufacturing plants for 2012. The award recognizes the plant
for its successful transformation into a leaner, more efficient
operation. Internally, the plant also received our Chairman’s
Award for environmental health and safety excellence.
Congratulations to everyone at the plant for their
outstanding work.
Our steady pipeline of new products is a key contributor as
we continue to pursue our Vision 2020 goals of at least 10%
compound annual growth and 15% return on invested capital
over the 10-year period that began in 2011. We are now two
years into the plan, and we are well ahead of the run rate that
would be necessary to achieve those ambitious goals.
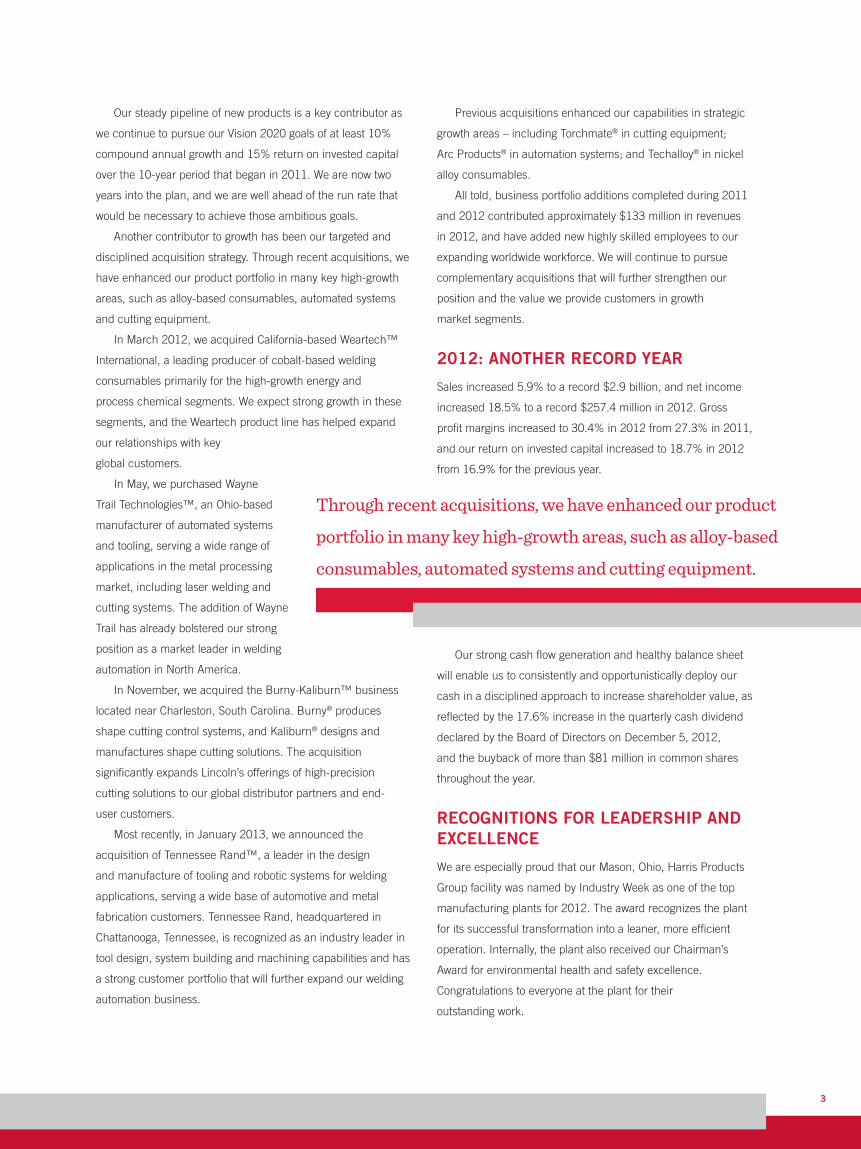
Another contributor to growth has been our targeted and
disciplined acquisition strategy. Through recent acquisitions, we
have enhanced our product portfolio in many key high-growth
areas, such as alloy-based consumables, automated systems
and cutting equipment.
In March 2012, we acquired California-based Weartech™
International, a leading producer of cobalt-based welding
consumables primarily for the high-growth energy and
process chemical segments. We expect strong growth in these
segments, and the Weartech product line has helped expand
our relationships with key
global customers.
In May, we purchased Wayne
Trail Technologies™, an Ohio-based
manufacturer of automated systems
and tooling, serving a wide range of
applications in the metal processing
market, including laser welding and
cutting systems. The addition of Wayne
Trail has already bolstered our strong
position as a market leader in welding
automation in North America.
In November, we acquired the Burny-Kaliburn™ business
located near Charleston, South Carolina. Burny® produces
shape cutting control systems, and Kaliburn® designs and
manufactures shape cutting solutions. The acquisition
significantly expands Lincoln’s offerings of high-precision
cutting solutions to our global distributor partners and end-
user customers.
Most recently, in January 2013, we announced the
acquisition of Tennessee Rand™, a leader in the design
and manufacture of tooling and robotic systems for welding
applications, serving a wide base of automotive and metal
fabrication customers. Tennessee Rand, headquartered in
Chattanooga, Tennessee, is recognized as an industry leader in
tool design, system building and machining capabilities and has
a strong customer portfolio that will further expand our welding
automation business.
Through recent acquisitions, we have enhanced our product
portfolio in many key high-growth areas, such as alloy-based
consumables, automated systems and cutting equipment.
4
Globally, we continue to lead the way in the welding industry
with our commitment to excellence, innovation and doing things
the right way. We have a well-developed culture of continuous
improvement, and almost 100% of our facilities around the
world are certified ISO 9001. More than 50% are certified
ISO 14001, and we are on an aggressive schedule to have the
remainder certified.
Our record in sustainability and the environment is another
area where we are achieving strong results. We continued
to reduce energy consumption and increase our reliance
on sustainable resources through more efficient lighting,
skylight installations, the use of more efficient gas burners on
combustion equipment, insulation projects and modern air
compressor replacements. Energy usage per hour worked was
reduced by 14% in 2012.
In recycling, our primary objective is to reduce, reuse and
recycle potential waste materials. We recycled 50% of
non-manufacturing wastes and 35% of all wastes in 2012,
a 26% improvement from 2011.
Safety of our people is our top priority, and we continue
to make significant improvements in this area. On a global
basis, our 2012 DART (Days Away, Restricted or Transferred)
rate improved 20% and marks the fifth consecutive year of
improvement. We continue to strive for zero incidents, and eight
facilities had zero DART incidents. Since the summer of 2008,
the people at our Harris Poland facility have worked more than
1.2 million hours with no DART incidents.
LEADERSHIP TRANSITION
Effective December 31, 2012, Christopher L. Mapes became
President and Chief Executive Officer of the Company. Chris
had served as Chief Operating Officer of the Company since
September 1, 2011, and has been a member of the Board
of Directors since February 2010. He has been pivotal in the
ongoing development and implementation of our global
Vision 2020 plan and brings outstanding leadership skills,
strategic insight and operational expertise to his new role.
Chris is highly qualified to lead Lincoln to new levels of growth
and value creation, building on the strong global leadership
position and phenomenal success that the Company has
achieved during the past decade and throughout its
118-year history.
INDUSTRY OUTLOOK AND VISION 2020 PROGRESS
While the global welding industry is changing rapidly, Lincoln
Electric remains the constant as the world leader in innovation
with a unique position to provide a full range of value and
service in close partnership with an expanding global customer
base. For customers with operations that extend to some of the
most remote regions of the earth, we often serve as the catalyst
for new technology. Our relationships with these customers
help them meet their objectives with state-of-the-art welding
equipment, products and services, consistent throughout all of
their locations.
In this way, our business has become
much more value-driven, and we have seen
customers turn more and more to Lincoln
for product and technology support. Their
projects are getting more complicated,
and finding skilled people to execute those
projects is becoming more challenging. Our
established leadership and commitment
to drive automation, training, safety,
productivity improvement and quality advancement in welding
is playing an increasingly important role to strengthen our
relationships with these customers. No competitor can match
Lincoln’s expertise, global reach and overall capabilities in these
critical areas.
On a macroeconomic level, although we remain cautious for
the near term, we are mildly optimistic that the global economy
could show moderate improvement in 2013. For the longer
term, we continue to reinforce our position and invest in growing
regions such as Asia and Latin America, and in other regions
that are rebounding, such as North America.
As we move forward with our 10-year Vision 2020 plan, we
are confident that we are on track to meet our aggressive goals.
Even if global economic challenges continue, we expect to
remain ahead of schedule.
As we move forward with our 10-year Vision 2020
plan, we are confident that we are on track to meet
our aggressive goals.
5
We will continue to invest in new products and explore
attractive acquisitions to expand our portfolio and extend our
global reach. We remain well-positioned to execute our long-
term strategic objectives, achieve significant earnings growth
and deliver superior returns on invested capital, and we intend
to continue our programs of creating additional value for
shareholders through stock buybacks and dividend increases,
when prudent.
Lincoln Electric holds an enviable position as the undisputed
leader in the global welding industry, and the vision and values
established by John C. and James F. Lincoln more than 100
years ago have never been stronger. Our dedication to quality,
passion for providing value and unwavering commitment to our
customers, employees and shareholders is a time-tested formula
for success.
For the past nine years I have been proud to help continue
the Lincoln legacy as Chairman and CEO. I have been honored
to work with the more than 10,000 dedicated and talented
individuals of our global workforce, and privileged to serve
our loyal shareholders. To all of you, I express my deepest
appreciation for your support for Lincoln Electric. As a fellow
shareholder, I look forward to the future accomplishments of
Chris and his team.
Sincerely,
John M. Stropki
Executive Chairman
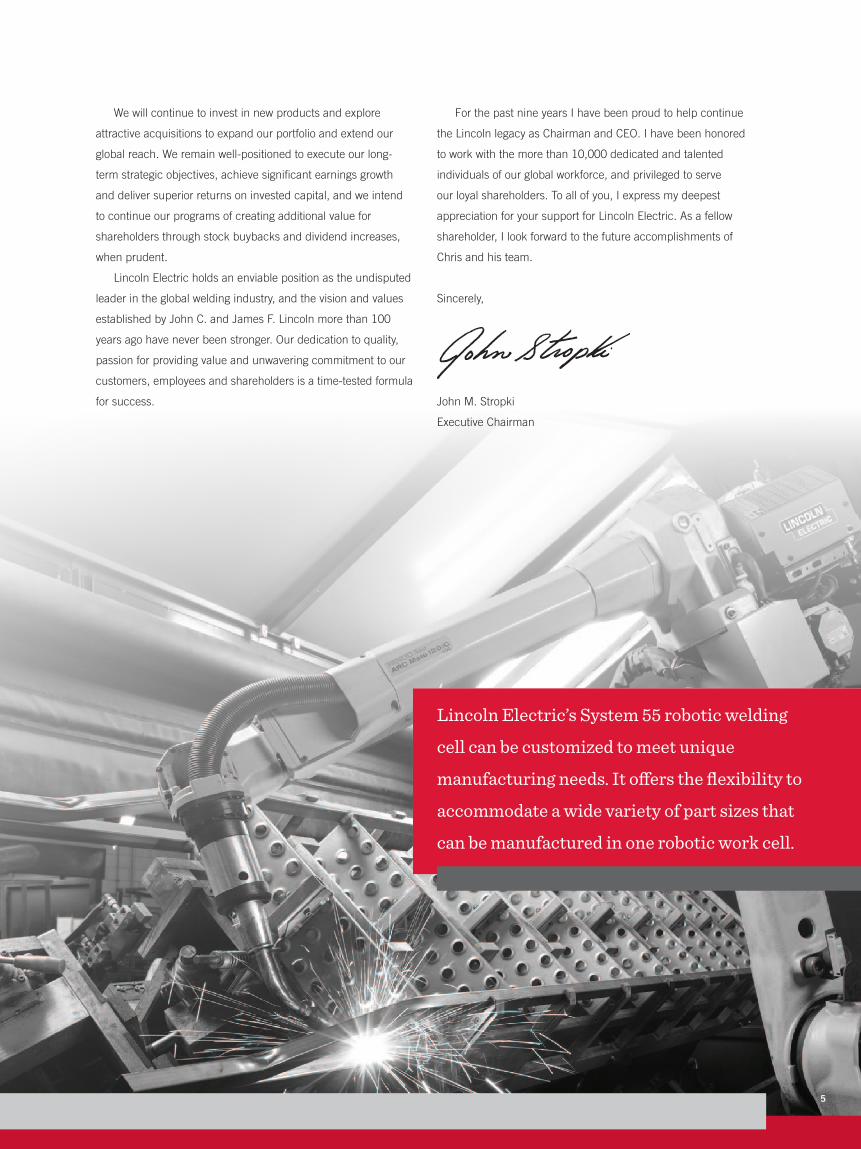
Lincoln Electric’s System 55 robotic welding
cell can be customized to meet unique
manufacturing needs. It offers the flexibility to
accommodate a wide variety of part sizes that
can be manufactured in one robotic work cell.
6
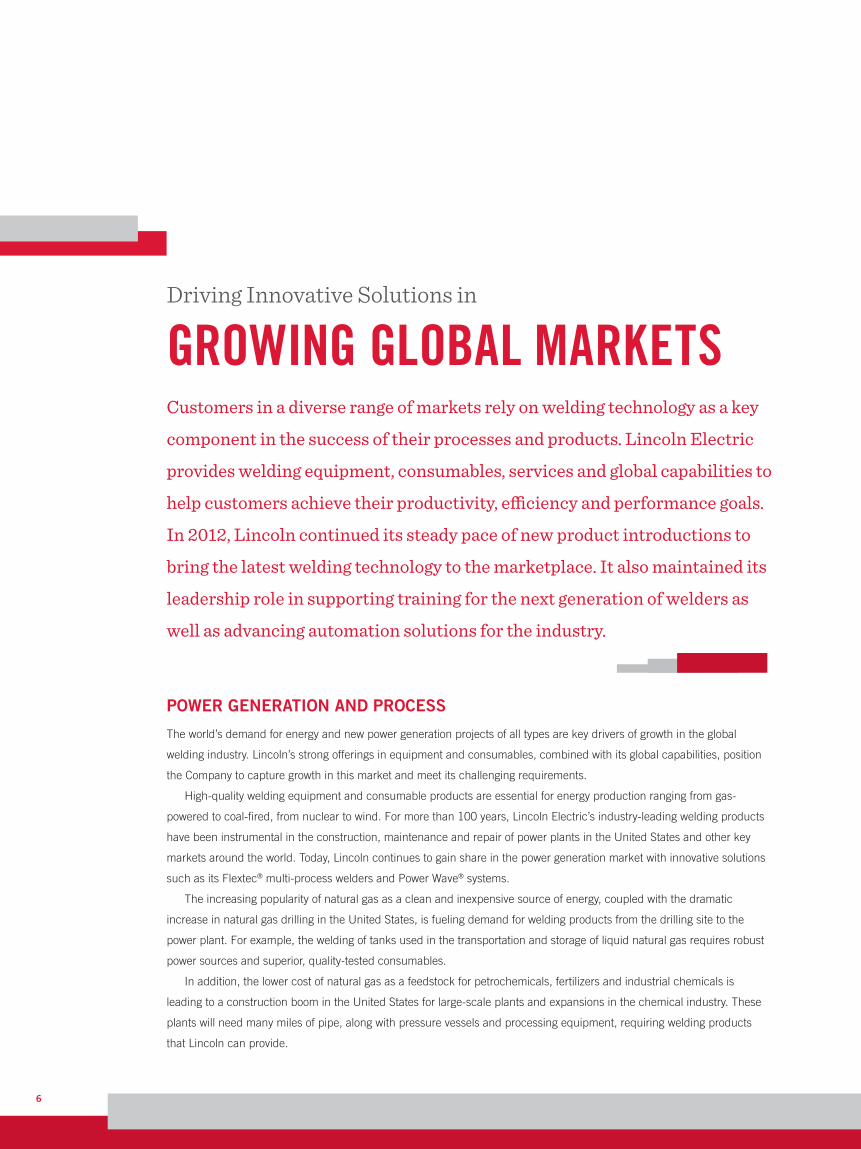
Customers in a diverse range of markets rely on welding technology as a key
component in the success of their processes and products. Lincoln Electric
provides welding equipment, consumables, services and global capabilities to
help customers achieve their productivity, efficiency and performance goals.
In 2012, Lincoln continued its steady pace of new product introductions to
bring the latest welding technology to the marketplace. It also maintained its
leadership role in supporting training for the next generation of welders as
well as advancing automation solutions for the industry.
GROWING GLOBAL MARKETSDriving Innovative Solutions in
POWER GENERATION AND PROCESS
The world’s demand for energy and new power generation projects of all types are key drivers of growth in the global
welding industry. Lincoln’s strong offerings in equipment and consumables, combined with its global capabilities, position
the Company to capture growth in this market and meet its challenging requirements.
High-quality welding equipment and consumable products are essential for energy production ranging from gas-
powered to coal-fired, from nuclear to wind. For more than 100 years, Lincoln Electric’s industry-leading welding products
have been instrumental in the construction, maintenance and repair of power plants in the United States and other key
markets around the world. Today, Lincoln continues to gain share in the power generation market with innovative solutions
such as its Flextec® multi-process welders and Power Wave® systems.
The increasing popularity of natural gas as a clean and inexpensive source of energy, coupled with the dramatic
increase in natural gas drilling in the United States, is fueling demand for welding products from the drilling site to the
power plant. For example, the welding of tanks used in the transportation and storage of liquid natural gas requires robust
power sources and superior, quality-tested consumables.
In addition, the lower cost of natural gas as a feedstock for petrochemicals, fertilizers and industrial chemicals is
leading to a construction boom in the United States for large-scale plants and expansions in the chemical industry. These
plants will need many miles of pipe, along with pressure vessels and processing equipment, requiring welding products
that Lincoln can provide.
7
Continued global growth is also expected in wind energy.
According to the Energy Information Administration, 44% of all
new electrical generating capacity in the United States comes
from wind energy. Demand for wind energy in Europe, Asia
and South America continues to be strong, as well. Wind tower
fabrication requires reliable power sources, consumables and
global technical support for welding. Lincoln Electric leads the
industry with high-technology equipment, specially engineered
consumables, unmatched application and process knowledge,
and globally available technical support and distribution.
Renewed interest in nuclear power is increasing the demand
for welding products designed to meet the rigorous needs of the
nuclear industry. Lincoln is a leading supplier for active nuclear
power plant projects in the United States, Asia and Europe,
with a host of welding equipment, consumables and application
knowledge specifically engineered for the construction,
maintenance and repair of nuclear power plants.
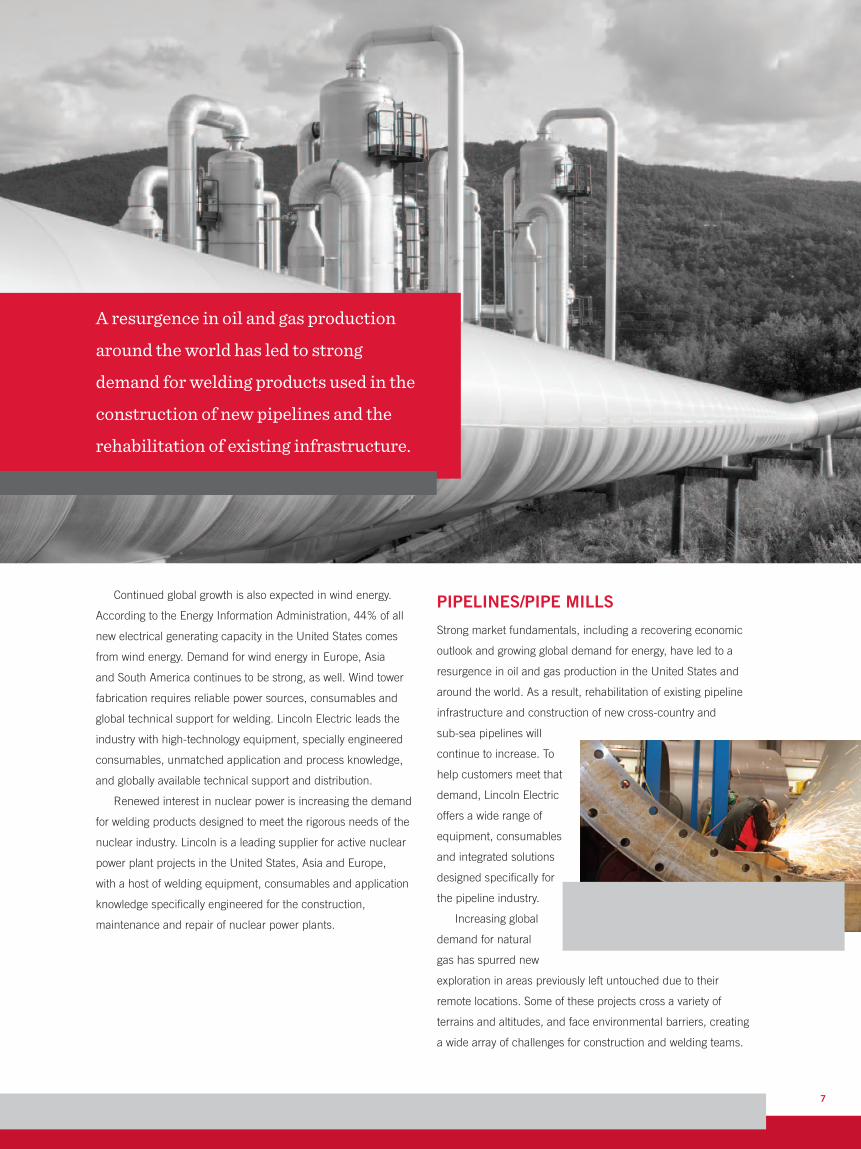
PIPELINES/PIPE MILLS
Strong market fundamentals, including a recovering economic
outlook and growing global demand for energy, have led to a
resurgence in oil and gas production in the United States and
around the world. As a result, rehabilitation of existing pipeline
infrastructure and construction of new cross-country and
sub-sea pipelines will
continue to increase. To
help customers meet that
demand, Lincoln Electric
offers a wide range of
equipment, consumables
and integrated solutions
designed specifically for
the pipeline industry.
Increasing global
demand for natural
gas has spurred new
exploration in areas previously left untouched due to their
remote locations. Some of these projects cross a variety of
terrains and altitudes, and face environmental barriers, creating
a wide array of challenges for construction and welding teams.
A resurgence in oil and gas production
around the world has led to strong
demand for welding products used in the
construction of new pipelines and the
rehabilitation of existing infrastructure.

8
Lincoln offers a complete line of welding solutions that
meet the demands of these challenging pipeline projects.
These solutions include its FCAW-G Pipeliner® family of
electrodes for automated and semi-automatic pipe welding
applications; the Pipeliner® 80Ni1 for high-strength pipe
applications; and the Power Wave® S350 and STT® Module
and consumables for high-quality welds in both offshore and
onshore pipeline construction.
Lincoln is the world leader in single-arc and multiple-arc
welding solutions for pipe mills, with durable equipment, proven
consumables, industry-leading application knowledge and
technical support necessary to meet customer needs in this
challenging market.
OFFSHORE
Oil and gas exploration and production projects are creating global
opportunities for Lincoln’s products and services in the offshore
market. Growth in offshore investment is expected to continue
in 2013 and well beyond, driven largely by Brazil, China and the
countries of Southeast Asia, which are working toward greater
energy independence. The market also is seeing renewed activity in
mature regions such as North America and Europe to support the
increasing needs for advanced sub-sea infrastructure.
Welding plays a vital role in the construction, maintenance
and repair of drilling rigs for exploration, production platforms
for extracting and processing oil and gas reserves, and sub-sea
infrastructure for safe delivery of the oil and gas. Each of these
types of operations must perform reliably in extremely harsh
environments.
Lincoln offers best-in-class, total package solutions that
provide consistency along each part of the supply chain
to meet this market’s demanding needs. These solutions
include equipment and consumables that offer a high level
of technical capability, such as Lincoln’s recently launched
submerged arc welding flux, Lincolnweld® 812-SRC™,
which is used for applications where mechanical and
metallurgical properties are of critical concern.
Welding plays a vital role in the
construction, maintenance and repair of
drilling rigs, production platforms and
sub-sea infrastructure which must operate
in extremely harsh environments.
9
The offshore segment’s technical needs
are continuing to be challenged as deep-water
exploration and production require new ideas and
proven leadership to execute. Lincoln is meeting
this challenge by investing in new solutions that
will continue to set the standard for best-in-class
performance and consistency. As an example,
Lincoln’s Techalloy® and Arc Products® acquisitions, which
both occurred in 2011, expanded the Company’s capabilities
as a potential single-source supplier to customers requiring
advanced pipe shop welding equipment and consumable
solutions, including stainless and nickel-based products for
critical offshore installations.
HEAVY FABRICATION
Manufacturers of heavy equipment require cutting-edge welding
products and processes to ensure top-quality performance and
to maintain their competitive advantage. Lincoln’s wide range
of robust power sources, consumables and industry-leading
application knowledge provide the benefits that manufacturers
need in the heavy fabrication market.
In North America, 2012 was a strong year for many key
customers in this market. These manufacturers’ welding needs
continue to evolve and their power source requirements are
shifting to more energy-efficient and automated solutions.
Lincoln’s upgraded Power Wave® line and Flextec® models
offer these customers a complete range of inverter-based
power sources to meet their welding needs. These products
are also globally approved, allowing global manufacturers to
use the same types of equipment and processes in all of their
facilities around the world. Lincoln’s expanded line of UltraCore®
wire products are also well-suited for this market. Automation
solutions, such as the FANUC® robot/Power Wave® combination,
are growing in popularity, especially in North America.
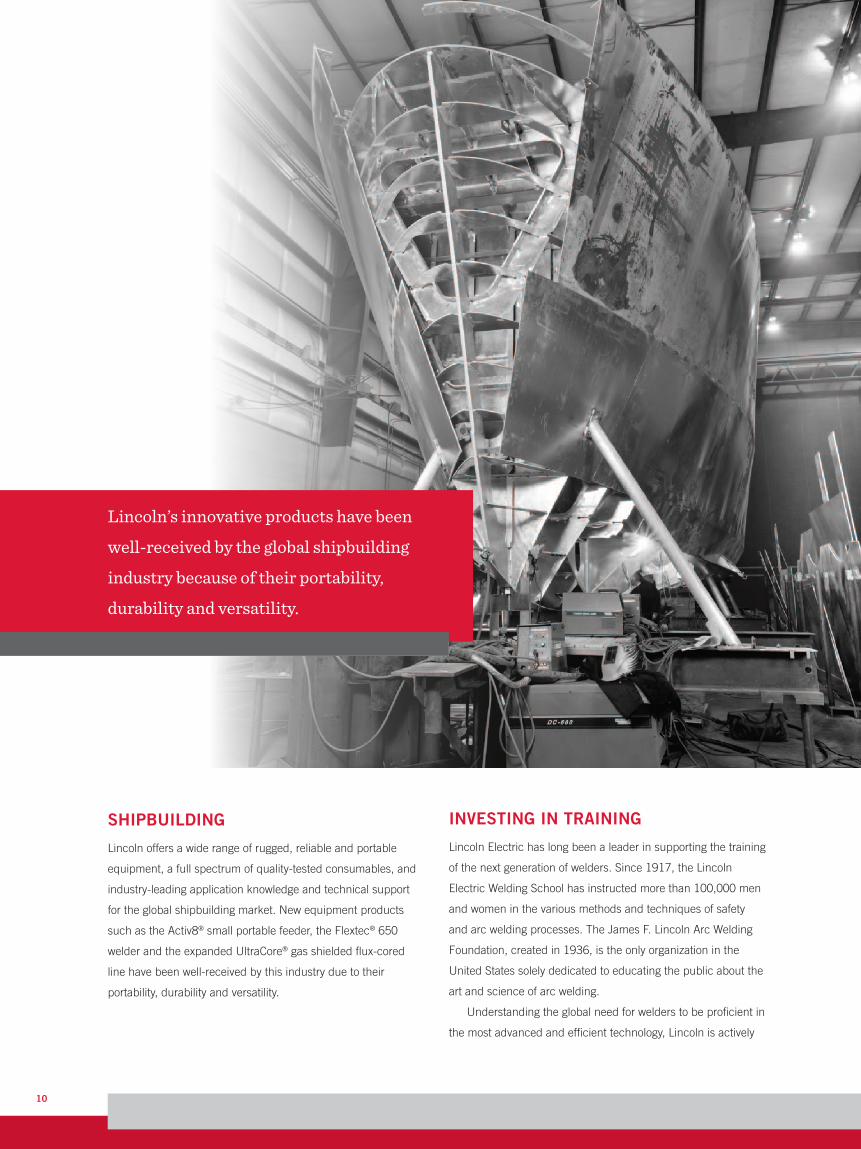
AUTOMOTIVE AND TRANSPORTATION
Global light vehicle production hit a record high level in 2012,
despite a contraction in European production and slower growth
in China. Growth occurred in the United States, Mexico, India
and Southeast Asia, and global forecasts for 2013 call for
another record year.
One important trend in this industry is the increasing use of
aluminum parts, which are arc-welded, to reduce the size and
weight of vehicles and improve their fuel economy. Reliance
on automation is rising, and Lincoln is aggressively expanding
its automation capabilities in Mexico and Brazil to better serve
automotive manufacturers.
Lincoln offers advanced welding solutions designed to meet
the needs of the automotive and transportation industries.
Its new Power Wave® S500 and R500 units are based on the
latest technologies and are sized as needed for the automotive
industry, particularly for
automation and robotics.
New innovative welding
solutions such as
Rapid X™ are also well-
suited to this industry.
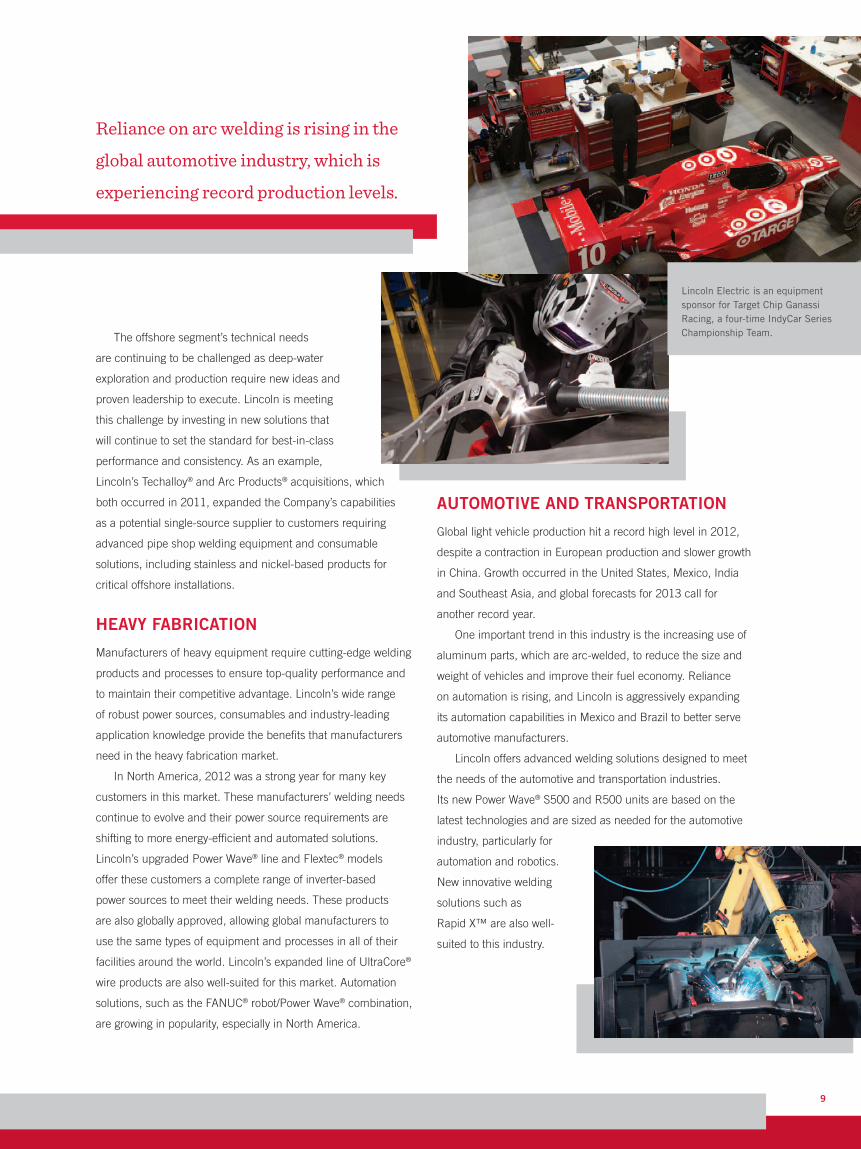
Reliance on arc welding is rising in the
global automotive industry, which is
experiencing record production levels.
Lincoln Electric is an equipment sponsor for Target Chip Ganassi Racing, a four-time IndyCar Series Championship Team.
10
SHIPBUILDING
Lincoln offers a wide range of rugged, reliable and portable
equipment, a full spectrum of quality-tested consumables, and
industry-leading application knowledge and technical support
for the global shipbuilding market. New equipment products
such as the Activ8® small portable feeder, the Flextec® 650
welder and the expanded UltraCore® gas shielded flux-cored
line have been well-received by this industry due to their
portability, durability and versatility.
INVESTING IN TRAINING
Lincoln Electric has long been a leader in supporting the training
of the next generation of welders. Since 1917, the Lincoln
Electric Welding School has instructed more than 100,000 men
and women in the various methods and techniques of safety
and arc welding processes. The James F. Lincoln Arc Welding
Foundation, created in 1936, is the only organization in the
United States solely dedicated to educating the public about the
art and science of arc welding.
Understanding the global need for welders to be proficient in
the most advanced and efficient technology, Lincoln is actively
Lincoln’s innovative products have been
well-received by the global shipbuilding
industry because of their portability,
durability and versatility.

11
involved in developing training equipment and supporting
educators worldwide who are instructing the next generation
of welders. The VRTEX® family of virtual reality arc welding
(VRAW™) training products includes the VRTEX® 360 and the
new, easily portable VRTEX® Mobile, which is ideal for onsite
training and recruitment events. New welders can use these
interactive teaching tools in either a traditional classroom setting
or at an actual manufacturing facility. They allow students of any
age to learn and train in a safe, virtual environment with realistic
imagery and scenes, thanks to a specially equipped virtual
reality welding helmet and rich, vivid graphics.
Lincoln was proud to support the welding competitions at
the 2012 SkillsUSA National Leadership & Skills Conference
in Kansas City, Missouri. More than 15,000 people – including
nearly 6,000 students – participated in the week-long event,
which showcases the best career and technical students in the
nation. The students competed in 94 hands-on trade, technical
and leadership fields, including welding.
GIVING BACKAs the global leader in the welding industry, Lincoln recognizes its responsibility to provide assistance when it can in times of crisis. The Company has donated equipment and consumables to help the First Response Team of America restore hope to victims and communities in the aftermath of a number of disasters. Above, First Response founder Tad Agoglia relies on Lincoln equipment at a location struck by Hurricane Sandy, which devastated portions of the U.S. East Coast in October 2012.
Ohio Governor John Kasich observes visiting middle-school students demonstrating the VRTEX® 360 virtual reality welding system. Governor Kasich visited Lincoln’s Euclid, Ohio plant in February 2012.
Lincoln Electric’s engineering and sales trainee program includes activities to support the communities where we live and work. As part of our community involvement program, our trainees last year logged in several days volunteering at the Cleveland Foodbank, and along with staff and other volunteers with Habitat for Humanity (pictured above), helped construct a new house in a Northeast Ohio community. Lincoln also donated safety apparel and safety glasses to the non-profit organization. In addition, our trainees volunteered at Habitat for Humanity’s ReStore facility, which sells new and gently used building materials to help raise money and divert material away from landfills.

12
COMPANY OFFICERS AND EXECUTIVE MANAGEMENTAnthony K. Battle Vice President, Internal Audit
George D. Blankenship* Senior Vice President President, Lincoln Electric North America
Gabriel Bruno* Vice President, Chief Information Officer
Joseph G. DoriaVice President President, Lincoln Electric Canada
Gretchen A. Farrell* Senior Vice President, Human Resources and Compliance
BOARD OF DIRECTORS
front row:
Kathryn Jo LincolnChair of the Lincoln Institute of Land Policy
G. Russell LincolnPresident of N.A.S.T. Inc.
John M. StropkiExecutive Chairman of the Company
Christopher L. MapesPresident and Chief Executive Officer of the Company
CORPORATE INFORMATIONAdditional copies of Lincoln Electric’s 2012 Annual Report and Form 10-K may be obtained by contacting Investor Relations at (216) 383-2534, sending a fax to (216) 383-8220 or visiting our website: www.lincolnelectric.com. This Annual Report may also be obtained by calling 1-888-400-7789.
Inquiries about dividends, shareholder records, share transfers, changes in ownership and address changes should be directed to the Transfer Agent and Registrar:
MailWells Fargo Shareowner Services P.O. Box 64854 St. Paul, Minnesota 55164-0854
CourierWells Fargo Shareowner Services 1110 Centre Pointe Curve Mendota Heights, Minnesota 55120-4100
Direct 800-468-9716 or 651-450-4064 www.wellsfargo.com/shareownerservices
The Annual Meeting of Lincoln Electric Shareholders is scheduled to be held on Thursday, April 25, 2013, at 11:30 a.m., at Marriott Cleveland East, 26300 Harvard Road, Warrensville Heights, Ohio 44122. The Company’s Common Shares are traded on the NASDAQ Stock Market under the stock symbol “LECO.” The number of record holders of Common Shares at December 31, 2012 was 1,699.
For additional Company information, contact:
Investor Relations Lincoln Electric Holdings, Inc. 22801 St. Clair Avenue Cleveland, Ohio 44117-1199 USA Phone: (216) 383-2534 Fax: (216) 383-8220
Harold L. AdamsLead Director Chairman Emeritus and Former Chairman, President and Chief Executive Officer of RTKL Associates Inc.
back row:
William E. MacDonald, IIIFormer Vice Chairman of National City Corporation
Robert J. KnollFormer Partner, Deloitte & Touche LLP
Curtis E. Espeland Senior Vice President and Chief Financial Officer, Eastman Chemical Company
George H. Walls, Jr. Former Chief Deputy Auditor, State of North Carolina
David H. GunningFormer Vice Chairman of Cleveland-Cliffs Inc
Hellene S. RuntaghFormer President and Chief Executive Officer of Berwind Group
Stephen G. HanksFormer President and Chief Executive Officer, Washington Group International, Inc.
Thomas A. Flohn*Vice President President, Lincoln Electric Europe, Middle East and Africa
Steven B. Hedlund*Vice President, Strategy and Business Development
Michele R. Kuhrt Vice President, Corporate Tax
Douglas S. Lance Vice President, Operations
David M. LeBlanc*Senior Vice President President, Lincoln Electric International
Christopher L. Mapes*President and Chief Executive Officer
William T. MatthewsVice President, Research and Development
Michael S. MintunVice President, Sales and Marketing, North America
David J. Nangle* Vice President President, Harris Products Group
Vincent K. Petrella* Senior Vice President, Chief Financial Officer and Treasurer
John M. Stropki* Executive Chairman
Frederick G. Stueber* Senior Vice President, General Counsel and Secretary
*Member, Management Committee
UNITED STATESSECURITIES AND EXCHANGE COMMISSION
WASHINGTON, D.C. 20549
FORM 10-KANNUAL REPORT PURSUANT TO SECTION 13 OR 15(d) OF
THE SECURITIES EXCHANGE ACT OF 1934
For the fiscal year ended December 31, 2012 Commission file number 0-1402
LINCOLN ELECTRIC HOLDINGS, INC.(Exact name of registrant as specified in its charter)
Ohio 34-1860551(State or other jurisdiction ofincorporation or organization)
(I.R.S. Employer Identification No.)
22801 St. Clair Avenue, Cleveland, Ohio 44117(Address of principal executive offices) (Zip Code)
(216) 481-8100(Registrant's telephone number, including area code)
Securities registered pursuant to Section 12(b) of the Act:
Common Shares, without par value The NASDAQ Stock Market LLC(Title of each class) (Name of each exchange on which registered)
Securities registered pursuant to Section 12(g) of the Act: NoneIndicate by check mark if the registrant is a well-known seasoned issuer, as defined in Rule 405 of the Securities Act. Yes No Indicate by check mark if the registrant is not required to file reports pursuant to Section 13 or Section 15(d) of the Act. Yes No Indicate by check mark whether the registrant (1) has filed all reports required to be filed by Section 13 or 15(d) of the Securities Exchange Act of 1934 during the preceding 12 months (or for such shorter period that the registrant was required to file such reports), and (2) has been subject to such filing requirements for the past 90 days. Yes No Indicate by check mark whether the registrant has submitted electronically and posted on its corporate Web site, if any, every Interactive Data File required to be submitted and posted pursuant to Rule 405 of Regulation S-T (§ 232.405 of this chapter) during the preceding 12 months (or for such shorter period that the registrant was required to submit and post such files). Yes No Indicate by check mark if disclosure of delinquent filers pursuant to Item 405 of Regulation S-K (§ 229.405 of this chapter) is not contained herein, and will not be contained, to the best of registrant's knowledge, in definitive proxy or information statements incorporated by reference in Part III of this Form 10-K or any amendment to this Form 10-K Indicate by check mark whether the registrant is a large accelerated filer, an accelerated filer, a non-accelerated filer, or a smaller reporting company. See the definitions of "large accelerated filer," "accelerated filer" and "smaller reporting company" in Rule 12b-2 of the Exchange Act.
Large accelerated filer Accelerated filer Non-accelerated filer (Do not check if a smaller reporting company) Smaller reporting company
Indicate by check mark whether the registrant is a shell company (as defined in Rule 12b-2 of the Exchange Act). Yes No The aggregate market value of the common shares held by non-affiliates as of June 30, 2012 was $3,558,724,932 (affiliates, for this purpose, have been deemed to be Directors and Executive Officers of the Company and certain significant shareholders).The number of shares outstanding of the registrant's common shares as of December 31, 2012 was 82,944,817.
DOCUMENTS INCORPORATED BY REFERENCE
Part III of this Annual Report on Form 10-K incorporates by reference certain information from the registrant's definitive proxy statement to be filed on or about March 22, 2013 with respect to the registrant's 2013 Annual Meeting of Shareholders.
1
PART I
ITEM 1. BUSINESS
General
As used in this Annual Report on Form 10-K, the term "Company," except as otherwise indicated by the context, means Lincoln Electric Holdings, Inc. and its wholly-owned and majority-owned subsidiaries for which it has a controlling interest. The Lincoln Electric Company began operations in 1895 and was incorporated under the laws of the State of Ohio in 1906. During 1998, The Lincoln Electric Company reorganized into a holding company structure, and Lincoln Electric Holdings, Inc. became the publicly-held parent of Lincoln Electric subsidiaries worldwide, including The Lincoln Electric Company.
The Company is one of only a few worldwide broad-line manufacturers of welding, cutting and brazing products. Welding products include arc welding power sources, wire feeding systems, robotic welding packages, fume extraction equipment, consumable electrodes and fluxes. The Company's product offering also includes computer numeric controlled ("CNC") plasma and oxy-fuel cutting systems and regulators and torches used in oxy-fuel welding, cutting and brazing. In addition, the Company has a leading global position in the brazing and soldering alloys market.
The arc welding power sources and wire feeding systems manufactured by the Company range in technology from basic units used for light manufacturing and maintenance to highly sophisticated robotic applications for high volume production welding and fabrication. Three primary types of arc welding electrodes are produced: (1) coated manual or stick electrodes; (2) solid electrodes produced in coil, reel or drum forms for continuous feeding in mechanized welding; and (3) cored electrodes produced in coil form for continuous feeding in mechanized welding.
The Company has, through wholly-owned subsidiaries or joint ventures, manufacturing facilities located in the United States, Brazil, Canada, China, Colombia, France, Germany, India, Indonesia, Italy, Mexico, the Netherlands, Poland, Portugal, Russia, Turkey, the United Kingdom and Venezuela, of which 34 are ISO 9001 certified.
The Company has aligned its business units into five operating segments to enhance the utilization of the Company's worldwide resources and global end user and sourcing initiatives. The operating segments consist of North America Welding, Europe Welding, Asia Pacific Welding, South America Welding and The Harris Products Group. The North America Welding segment includes welding operations in the United States, Canada and Mexico. The Europe Welding segment includes welding operations in Europe, Russia and Africa. The other two welding segments include welding operations in Asia Pacific and South America, respectively. The fifth segment, The Harris Products Group, includes the Company's global cutting, soldering and brazing businesses as well as the retail business in the United States. See Note 5 to the Company's consolidated financial statements for segment and geographic area information, which is incorporated herein by reference.
Customers
The Company's products are sold in both domestic and international markets. In North America, products are sold principally through industrial distributors, retailers and also directly to users of welding products. Outside of North America, the Company has an international sales organization comprised of Company employees and agents who sell products from the Company's various manufacturing sites to distributors and product users.
The Company's major end-user markets include:
• general metal fabrication,• power generation and process industry,• structural steel construction (buildings and bridges),• heavy equipment fabrication (farming, mining and rail),• shipbuilding,• automotive,• pipe mills and pipelines, and• offshore oil and gas exploration and extraction.
The Company is not dependent on a single customer or a few customers and no individual customer currently accounts for more than ten percent of total Net sales. However, the loss of a large customer could have an adverse effect on the Company's business. The Company's operating results are sensitive to changes in general economic conditions. The arc welding and cutting industry is generally a mature industry in developed markets such as North America and Western Europe, and is cyclical in nature. Overall demand for arc welding and cutting products is largely determined by economic cycles and the level of capital spending in manufacturing and other industrial sectors. The Company experiences some variability in reported period-to-period results as demand for the Company's products are mildly seasonal with generally higher demand in the second and
2
third quarters. See "Item 1A. Risk Factors" for further discussion regarding risks associated with customers, general economic conditions and demand.
Competition
Conditions in the arc welding and cutting industry are highly competitive. The Company believes it is the world's largest manufacturer of consumables and equipment with relatively few major broad-line competitors worldwide, but numerous smaller competitors in specific geographic markets. The Company continues to pursue strategies to heighten its competitiveness in domestic and international markets, which includes positioning low cost manufacturing facilities in most geographical markets. Competition in the arc welding and cutting industry is based on brand preference, product quality, price, performance, warranty, delivery, service and technical support. The Company believes its performance against these factors has contributed to the Company's position as the leader in the industry.
Most of the Company's products may be classified as standard commercial articles and are manufactured for stock. The Company believes it has a competitive advantage in the marketplace because of its highly trained technical sales force and the support of its welding research and development staff to assist customers in optimizing their welding applications. This allows the Company to introduce its products to new users and to establish and maintain close relationships with its customers. This close relationship between the technical sales force and the direct customers, together with its supportive relationship with its distributors, who are particularly interested in handling the broad range of the Company's products, is an important element of the Company's market success and a valuable asset of the Company.
Raw Materials
The principal raw materials essential to the Company's business are steel, electronic components, engines, brass, copper, silver, aluminum alloys and various chemicals, all of which are normally available for purchase in the open market.
Patents and Trademarks
The Company holds many valuable patents, primarily in arc welding, and has increased the application process as research and development has progressed in both the United States and major international jurisdictions. The Company believes its trademarks are an important asset and aggressively pursues brand management.
Environmental Regulations
The Company's facilities are subject to environmental regulations. To date, compliance with these environmental regulations has not had a material adverse effect on the Company's earnings. The Company is ISO 14001 certified at most significant manufacturing facilities in North America and Europe and is progressing towards certification at its remaining facilities worldwide. In addition, the Company is ISO 9001 certified at nearly all facilities worldwide.
International Operations
The Company conducts a significant amount of its business and has a number of operating facilities in countries outside the United States. As a result, the Company is subject to business risks inherent to non-U.S. activities, including political uncertainty, import and export limitations, exchange controls and currency fluctuations.
Research and Development
Research activities, which the Company believes provide a competitive advantage, relate to the development of new products and the improvement of existing products. Research activities are Company-sponsored. Refer to Note 1 to the Company's consolidated financial statements with respect to total costs of research and development, which is incorporated herein by reference.
Employees
The number of persons employed by the Company worldwide at December 31, 2012 was approximately 10,000. See "Part I, Item 1C" for information regarding the Company's executive officers, which is incorporated herein by reference.
Website Access
The Company's website, www.lincolnelectric.com, is used as a channel for routine distribution of important information, including news releases and financial information. The Company posts its filings as soon as reasonably practicable after they are electronically filed with, or furnished to, the SEC, including annual, quarterly, and current reports on Forms 10-K, 10-Q, and 8-K; proxy statements; and any amendments to those reports or statements. The Company also posts its Code of Corporate Conduct and Ethics on its website. All such postings and filings are available on the Company's website free of charge. In addition, this website allows investors and other interested persons to sign up to automatically receive e-mail alerts when news releases and financial information is posted on the website. The SEC also maintains a website, www.sec.gov, that contains reports, proxy and information statements and other information regarding issuers that file electronically with the SEC. The
3
content on any website referred to in this Annual Report on Form 10-K is not incorporated by reference into this Annual Report unless expressly noted.
ITEM 1A. RISK FACTORS
From time to time, information we provide, statements by our employees or information included in our filings with the SEC may contain forward-looking statements that are not historical facts. Those statements are "forward-looking" within the meaning of the Private Securities Litigation Reform Act of 1995. Forward-looking statements generally can be identified by the use of words such as "may," "will," "expect," "intend," "estimate," "anticipate," "believe," "forecast," "guidance" or words of similar meaning. Actual results may differ materially from such statements due to a variety of factors that could adversely affect the Company's operating results. Forward-looking statements, and our future performance, operating results, financial position and liquidity, are subject to a variety of factors that could materially affect results, including those risks described below. Any forward-looking statements made in this report or otherwise speak only as of the date of the statement, and, except as required by law, we undertake no obligation to update those statements. Comparisons of results for current and any prior periods are not intended to express any future trends or indications of future performance, unless expressed as such, and should only be viewed as historical data.
In the ordinary course of our business, we face various strategic, operating, compliance and financial risks. These risks could have a material impact on our business, financial condition, operating results and cash flows.
Our Enterprise Risk Management ("ERM") process seeks to identify and address significant risks. Our ERM process is a company-wide initiative that is designed with the intent of prioritizing risks and assigning appropriate consideration for such risks. We use the integrated risk framework of the Committee of Sponsoring Organizations to assess, manage and monitor risks.
Management has identified and prioritized critical risks based on the severity and likelihood of each risk and assigned an executive to address each major identified risk area and lead action plans to monitor and mitigate risks, where possible. Our Board of Directors provides oversight of the ERM process and systematically reviews identified critical risks. The Audit Committee also reviews major financial risk exposures and the steps management has taken to monitor and control them.
Our goal is to pro-actively manage risks in a structured approach and in conjunction with the strategic planning process, with the intent to preserve and enhance shareholder value. However, these and other risks and uncertainties could cause our results to vary materially from recent results or from our anticipated future results. The risk factors and uncertainties described below, together with information incorporated by reference or otherwise included elsewhere in this Annual Report on Form 10-K, should be carefully considered. Additional risks and uncertainties of which we are currently unaware or that we currently believe to be immaterial may also adversely affect our business.
General economic and market conditions may adversely affect the Company's financial condition, results of operations and access to capital markets.
The Company's operating results are sensitive to changes in general economic conditions. Further recessionary economic cycles, higher interest rates, inflation, higher labor costs, trade barriers in the world markets, financial turmoil related to sovereign debt and changes in tax laws or other economic factors affecting the countries and industries in which we do business could adversely affect demand for the Company's products, thereby impacting our results of operations, collection of accounts receivable and our expected cash flow generation from current and acquired businesses, which may adversely impact our financial condition and access to capital markets.
Economic and supply disruptions associated with events beyond our control, such as war, acts of terror, political unrest, public health concerns, labor disputes or natural disasters could adversely affect our supply chain and distribution channels or result in loss of sales and customers.
Our facilities and operations, and the facilities and operations of our suppliers and customers, could be disrupted by events beyond our control, such as war, political unrest, public health concerns, labor disputes or natural disasters. Any such disruption could cause delays in the production and distribution of our products and the loss of sales and customers. Insurance proceeds may not adequately compensate the Company for the losses.
4
Availability of and volatility in energy costs or raw material prices may adversely affect our performance.
In the normal course of business, we are exposed to market risks related to the availability of and price fluctuations in the purchase of energy and commodities used in the manufacture of our products (primarily steel, brass, copper, silver, aluminum alloys, electronic components, electricity and natural gas). The availability and prices for raw materials are subject to volatility and are influenced by worldwide economic conditions, speculative action, world supply and demand balances, inventory levels, availability of substitute materials, currency exchange rates, our competitors' production costs, anticipated or perceived shortages and other factors. The price of steel used to manufacture our products has experienced periods of significant price volatility and has been subject to periodic shortages due to global economic factors. We have also experienced substantial volatility in prices for other raw materials, including nonferrous metals, chemicals and energy costs.
Increases in the cost of raw materials and components may adversely affect our profitability if we are unable to pass along to our customers these cost increases in the form of price increases or otherwise reduce our cost of goods sold. Although most of the raw materials and components used in our products are commercially available from a number of sources and in adequate supply, any disruption in the availability of such raw materials and components, our inability to timely or otherwise obtain substitutes for such items, or any deterioration in our relationships with or the financial viability of our suppliers could adversely affect our business.
We are a co-defendant in litigation alleging asbestos induced illness. Liabilities relating to such litigation could reduce our profitability and impair our financial condition.
At December 31, 2012, we were a co-defendant in cases alleging asbestos induced illness involving claims by approximately 15,050 plaintiffs. In each instance, we are one of a large number of defendants. The asbestos claimants allege that exposure to asbestos contained in welding consumables caused the plaintiffs to develop adverse pulmonary diseases, including mesothelioma and other lung cancers.
Since January 1, 1995, we have been a co-defendant in asbestos cases that have been resolved as follows: 41,161 of those claims were dismissed, 20 were tried to defense verdicts, seven were tried to plaintiff verdicts (two of which are being appealed), one was resolved by agreement for an immaterial amount and 612 were decided in favor of the Company following summary judgment motions.
The long-term impact of the asbestos loss contingency, in the aggregate, on operating results, operating cash flows and access to capital markets is difficult to assess, particularly since claims are in many different stages of development and we benefit significantly from cost-sharing with co-defendants and insurance carriers. While we intend to contest these lawsuits vigorously, and believe we have applicable insurance relating to these claims, there are several risks and uncertainties that may affect our liability for personal injury claims relating to exposure to asbestos, including the future impact of changing cost sharing arrangements or a change in our overall trial experience.
Asbestos use in welding consumables in the U.S. ceased in 1981.
We may incur material losses and costs as a result of product liability claims that may be brought against us.
Our business exposes us to potential product liability risks that are inherent in the design, manufacture, sale and application of our products and the products of third-party suppliers that we utilize or resell. Our products are used in a variety of applications, including infrastructure projects such as oil and gas pipelines and platforms, buildings, bridges and power generation facilities, the manufacture of transportation and heavy equipment and machinery, and various other construction projects. We face risk of exposure to product liability claims in the event that accidents or failures on these projects result, or are alleged to result, in bodily injury or property damage. Further, our products are designed for use in specific applications, and if a product is used inappropriately, personal injury or property damage may result.
The occurrence of defects in or failures of our products, or the misuse of our products in specific applications, could cause termination of customer contracts, increased costs and losses to us, our customers and other end users. We cannot be assured that we will not experience any material product liability losses in the future or that we will not incur significant costs to defend those claims. Further, we cannot be assured that our product liability insurance coverage will be adequate for any liabilities that we may ultimately incur or that product liability insurance will continue to be available on terms acceptable to us.
The cyclical nature and maturity of the arc welding and cutting industry in developed markets may adversely affect our performance.
The arc welding and cutting industry is generally a mature industry in developed markets such as North America and Western Europe and is cyclical in nature. Overall demand for arc welding and cutting products is largely determined by the level of capital spending in manufacturing and other industrial sectors, and the welding industry has historically experienced contraction during periods of slowing industrial activity. If economic, business and industry conditions deteriorate, capital spending in those sectors may be substantially decreased, which could reduce demand for our products, our revenues and our results of operations.
5
We may not be able to complete our acquisition strategy or successfully integrate acquired businesses.
Part of our business strategy is to pursue targeted business acquisition opportunities, including foreign investment opportunities. For example, we have completed and continue to pursue acquisitions in emerging markets including, but not limited to, Brazil, Russia, India and China in order to strategically position resources to increase our presence in growing markets. We cannot be certain that we will be successful in pursuing potential acquisition candidates or that the consequences of any acquisition would be beneficial to us. Future acquisitions may expose us to unexpected liabilities and involve the expenditure of significant funds and management time. Further, we may not be able to successfully integrate any acquired business with our existing businesses or recognize the expected benefits from any completed acquisition.
Depending on the nature, size and timing of future acquisitions, we may be required to raise additional financing, which may not be available to us on acceptable terms. Our current operational cash flow is sufficient to fund our current acquisition plans, but a significant acquisition could require access to the capital markets.
If we cannot continue to develop, manufacture and market products that meet customer demands, our revenues and gross margins may suffer.
Our continued success depends, in part, on our ability to continue to meet our customers' needs for welding and cutting products through the introduction of innovative new products and the enhancement of existing product design and performance characteristics. We must remain committed to product research and development and customer service in order to remain competitive. We cannot be assured that new products or product improvements, once developed, will meet with customer acceptance and contribute positively to our operating results, or that we will be able to continue our product development efforts at a pace to sustain future growth. Further, we may lose customers to our competitors if they demonstrate product design, development or manufacturing capabilities superior to ours.
The competitive pressures we face could harm our revenue, gross margins and prospects.
We operate in a highly competitive global environment and compete in each of our businesses with other broad-line manufacturers and numerous smaller competitors specializing in particular products. We compete primarily on the basis of brand, product quality, price, performance, warranty, delivery, service and technical support. We have previously initiated, and may in the future initiate significant rationalization activities to align our business to market conditions. Such rationalization activities could fail to deliver the desired competitive cost structure and could result in disruptions in customer service. If our products, services, support and cost structure do not enable us to compete successfully based on any of the criteria listed above, our operations, results and prospects could suffer.
Further, in the past decade, the arc welding industry in the United States and other developed countries has been subject to increased levels of foreign competition as low cost imports have become more readily available. Our competitive position could also be harmed if new or emerging competitors become more active in the arc welding business. For example, while steel manufacturers traditionally have not been significant competitors in the domestic arc welding industry, some foreign integrated steel producers manufacture selected consumable arc welding products. Our sales and results of operations, as well as our plans to expand in some foreign countries, could be adversely affected by this practice.
The loss of any of our largest customers could adversely affect our revenue, gross margins and profit.
We have a large and varied customer base due, in part, to our extensive distribution channels in the industries and regions that we serve. Although no individual customer currently accounts for more than ten percent of total Net sales, there are customers to which we sell a large amount of product. The loss of any of these customers could have an adverse effect on our revenue, gross margins and profit.
We conduct our sales and distribution operations on a worldwide basis and maintain manufacturing facilities in a number of foreign countries, which subjects us to risks associated with doing business outside the United States.
Our long-term strategy is to continue to increase our market share in growing international markets, particularly Asia (with emphasis in China and India), Latin America, Eastern Europe, Russia and other developing markets.
The share of sales and profits we derive from our international operations and exports from the United States is significant and growing. This trend increases our exposure to the performance of many developing economies in addition to the developed economies outside of the United States. For example, during 2012, approximately 8% of our net sales were generated from China and approximately 19% of our property, plant and equipment were located there. If the Chinese economy were to experience a significant slowdown, it could adversely affect our financial condition, results of operations and cash flows.
There are a number of risks in doing business internationally, which may impede our ability to achieve our strategic objectives relating to our foreign operations. Many developing countries have a significant degree of political and economic uncertainty and social turmoil that may impede our ability to implement and achieve our international growth objectives. Conducting business internationally subjects us to corporate governance and management challenges in consideration of the numerous U.S.

6
and foreign laws and regulations, including regulations relating to import-export control, technology transfer restrictions, repatriation of earnings and funds, exchange controls, labor regulations, nationalization, anti-boycott provisions and anti-bribery laws (such as the Foreign Corrupt Practices Act and the Organization for Economic Cooperation and Development Convention). Failure by the Company or its sales representatives, agents or distributors to comply with these laws and regulations could result in administrative, civil or criminal liabilities, all or any of which could negatively impact our business and reputation. Our foreign operations also subject us to the risks of international terrorism and hostilities.
Our operations depend on maintaining a skilled workforce, and any interruption in our workforce could negatively impact our results of operations and financial condition.
Our success depends in part on the efforts and abilities of our management team and key employees. Their skills, experience and industry knowledge significantly benefit our operations and performance. Our future success will also depend on our ability to identify, attract, and retain highly qualified managerial, technical (including research and development), sales and marketing, and customer service personnel. Competition for these individuals is intense, and we may not succeed in identifying, attracting, or retaining qualified personnel. With our strategy to expand internationally into developing markets, we may incur additional risks as some developing economies lack a sufficiently trained labor pool.
Any interruption of our workforce, including interruptions due to unionization efforts, changes in labor relations or shortages of appropriately skilled individuals could impact our results of operations and financial condition.
Our revenues and results of operations may suffer if we cannot continue to enforce the intellectual property rights on which our business depends or if third parties assert that we violate their intellectual property rights.
We rely upon patent, trademark, copyright and trade secret laws in the United States and similar laws in foreign countries, as well as agreements with our employees, customers, suppliers and other third parties, to establish and maintain our intellectual property rights. However, any of our intellectual property rights could be challenged, invalidated or circumvented, or our intellectual property rights may not be sufficient to provide a competitive advantage. Further, the laws and their application in certain foreign countries do not protect our proprietary rights to the same extent as U.S. laws. Accordingly, in certain countries, we may be unable to protect our proprietary rights against unauthorized third-party copying or use, which could impact our competitive position.
Further, third parties may claim that we or our customers are infringing upon their intellectual property rights. Even if we believe that those claims are without merit, defending those claims and contesting the validity of patents can be time-consuming and costly. Claims of intellectual property infringement also might require us to redesign affected products, enter into costly settlement or license agreements or pay costly damage awards, or face a temporary or permanent injunction prohibiting us from manufacturing, marketing or selling certain of our products.
Our defined benefit pension plans are subject to financial market trends, such as changes in discount rates and actual investment return on pension assets, which could adversely affect our results of operations and cash flows.
The performance of the financial markets and interest rates impact our funding obligations under our defined benefit pension plans. Significant changes in discount rates, decreases in the fair value of plan assets and investment losses on plan assets may increase our benefit obligations and adversely impact our results of operations, shareholders' equity and cash flows through our annual measurement of plan assets and liabilities. For a discussion regarding how the financial statements have been affected by significant changes in 2012, refer to the pension related disclosure under "Part II, Item 7 – Critical Accounting Policies" and Note 11 to the Company's consolidated financial statements.
We are subject to changes in the U.S. regulatory environment, which could adversely affect our results of operations, cash flows and financial condition.
Our businesses, results of operations or financial condition could be adversely affected if laws, regulations or standards relating to us, our products or the markets in which we operate are newly implemented or changed. In March 2010, the Patient Protection and Affordable Care Act, as amended by the Health Care and Education Reconciliation Act of 2010 (collectively, “the Acts”) were signed into law. The Acts make broad-based changes to the U.S. health care system, which could significantly affect the U.S. economy and our financial results. While the provisions of the Acts are not expected to have any significant short-term impacts, the long-term potential impacts on our business and the consolidated financial statements are currently uncertain. We are currently assessing the potential impact of the Acts.
A significant fluctuation between the U.S. dollar and other currencies could adversely impact our operating income.
Although our financial results are reported in U.S. dollars, a significant portion of our sales and operating costs are realized in other currencies. Our profitability is affected by movements of the U.S. dollar against other foreign currencies in which we generate revenues and incur expenses. Significant long-term fluctuations in relative currency values, in particular an increase in the value of the U.S. dollar against foreign currencies, could have an adverse effect on our profitability and financial condition.
7
Changes in tax rates or exposure to additional income tax liabilities could affect profitability.
Our business is subject to income taxes in the United States and various foreign jurisdictions. Domestic and international tax liabilities are subject to the allocation of income among various tax jurisdictions. Our effective tax rate could be adversely affected by changes in the mix among earnings in countries with differing statutory tax rates, changes in the valuation allowances of deferred tax assets or changes in tax laws.
The amount of income taxes paid is subject to ongoing audits by United States federal, state and local tax authorities and by foreign tax authorities. If these audits result in assessments different from amounts reserved, future financial results may include unfavorable adjustments which could have a material adverse effect on our results of operations.
We are subject to risks relating to our information technology systems.
The conduct and management of our business relies extensively on information technology systems. If these systems are damaged, cease to function properly or are subject to a cyber security breach, we may suffer an interruption in our ability to manage and operate the business and our results of operations and financial condition could be adversely affected.
Our global operations are subject to increasingly complex environmental regulatory requirements.
We are subject to increasingly complex environmental regulations affecting international manufacturers, including those related to air and water emissions, waste management and climate change.
There is a growing political and scientific belief that emissions of greenhouse gases ("GHG") alter the composition of the global atmosphere in ways that are affecting the global climate. Various stakeholders, including legislators and regulators, shareholders and non-governmental organizations, as well as companies in many business sectors, are considering ways to reduce GHG emissions. These concerns may lead to international, national, regional or local legislative or regulatory responses in the future. Such regulation could result in new or additional regulatory or product standard requirements for the Company's global businesses. We are unable, at this time, to predict the significance of these requirements as the impact of any future GHG legislative, regulatory or product standards is dependent on the timing and design of the mandates or standards. Furthermore, the potential physical impacts of theorized climate change on the Company's customers, and therefore on the Company's operations, are speculative and highly uncertain, and would be particular to the circumstances developing in various geographical regions. These may include changes in weather patterns (including drought and rainfall levels), water availability, storm patterns and intensities, and temperature levels. These potential physical effects may adversely impact the cost, production, sales and financial performance of the Company's operations which we are unable, at this time, to predict.
It is our policy to apply strict standards for environmental protection to all of our operations inside and outside the United States, even when we are not subject to local government regulations. We may incur substantial costs, including cleanup costs, fines and civil or criminal sanctions, liabilities resulting from third-party property damage or personal injury claims, or our products could be enjoined from entering certain jurisdictions, if we were to violate or become liable under environmental laws or if our products become non-compliant with environmental laws.
We also face increasing complexity in our products design and procurement operations as we adjust to new and future requirements relating to the design, production and labeling of our products that are sold worldwide in multiple jurisdictions. The ultimate costs under environmental laws and the timing of these costs are difficult to predict, and liability under some environmental laws relating to contaminated locations can be imposed retroactively and on a joint and several basis.
ITEM 1B. UNRESOLVED STAFF COMMENTS
None.
8
ITEM 1C. EXECUTIVE OFFICERS OF THE REGISTRANT
EXECUTIVE OFFICERS OF THE REGISTRANT
Name Age Position
John M. Stropki, Jr. 62 Executive Chairman of the Board effective December 31, 2012; Chairman of the Board since October 13, 2004 to December 31, 2012; Director since 1998; Chief Executive Officer and President since June 3, 2004 to December 31, 2012; Chief Operating Officer from May 1, 2003 to June 3, 2004; Executive Vice President from 1995 to June 3, 2004; and President, North America from 1996 to 2003.
Christopher L. Mapes 51 President and Chief Executive Officer effective December 31, 2012; Chief Operating Officer from September 1, 2011 to December 31, 2012; Director since February 2010. Prior to his service with the Company, Mr. Mapes was Executive Vice President of A.O. Smith Corporation (a global manufacturer with a water heating and water treatment technologies business and an electric motor and motor solutions business) a position he held from 2006 through August 2011, and the President of its Electrical Products unit, a position he held from September 2004 through August 2011.
Vincent K. Petrella 52 Senior Vice President, Chief Financial Officer and Treasurer since October 7, 2005; VicePresident, Chief Financial Officer and Treasurer from February 4, 2004 to October 7, 2005;and Vice President, Corporate Controller from 2001 to 2003.
Frederick G. Stueber 59 Senior Vice President, General Counsel and Secretary since 1996.George D. Blankenship 50 Senior Vice President; President, Lincoln Electric North America since July 30, 2009; Senior
Vice President, Global Engineering from October 7, 2005 to July 30, 2009; Vice President,Global Engineering from May 5, 2005 to October 7, 2005; President, Lincoln Electric NorthAmerica of The Lincoln Electric Company since July 30, 2009; Senior Vice President;President, Lincoln Cleveland of The Lincoln Electric Company from January 8, 2008 toJuly 30, 2009; Senior Vice President, U.S. Operations of The Lincoln Electric Company fromOctober 7, 2005 to January 8, 2008; Vice President, Cleveland Operations of The LincolnElectric Company from June 6, 2005 to October 7, 2005; and Vice President, Engineering andQuality Assurance of The Lincoln Electric Company from 2000 to June 6, 2005.
Gabriel Bruno 45 Vice President, Chief Information Officer since May 1, 2012; Vice President, Corporate Controller from 2005 to May 1, 2012.
Gretchen A. Farrell 50 Senior Vice President, Human Resources and Compliance since July 30, 2009; VicePresident, Human Resources from May 5, 2005 to July 30, 2009; and Vice President, HumanResources of The Lincoln Electric Company since March 5, 2003.
Thomas A. Flohn 52 Vice President; President, Lincoln Electric Europe, Middle East & Africa (EMEA) sinceJuly 1, 2010; Vice President; President, Lincoln Asia Pacific from January 1, 2005 to June 30,2010; and Vice President of Sales and Marketing, Lincoln Electric Asia Pacific from May 1,1999 to December 31, 2004.
Steven B. Hedlund 46 Vice President, Strategy and Business Development since September 15, 2008. Prior to hisservice with the Company, Mr. Hedlund was the Vice President, Growth and Innovations withMaster Lock, LLC (a security products company) from June 1, 2005 to July 1, 2008.
David M. LeBlanc 48 Senior Vice President; President, Lincoln Electric International since July 30, 2009; VicePresident; President, Lincoln Electric Europe and Russia from March 10, 2008 to July 30,2009; Vice President; President, Lincoln Electric Europe from September 1, 2005 toMarch 10, 2008; and Vice President; President, Lincoln Electric Latin America fromJanuary 1, 2002 to August 31, 2005.
The Company has been advised that there is no arrangement or understanding among any one of the officers listed and any other persons pursuant to which he or she was elected as an officer. The executive officers are elected by the Board of Directors normally for a term of one year and/or until the election of their successors.
ITEM 2. PROPERTIES
The Company's corporate headquarters and principal United States manufacturing facilities are located in the Cleveland, Ohio area. Total Cleveland area property consists of 233 acres, of which present manufacturing facilities comprise an area of approximately 2,940,000 square feet.
9
The Company has 45 manufacturing facilities, including operations and joint ventures in 19 countries, the locations (grouped by operating segment) of which are as follows:
North America Welding: United States Cleveland and Fort Loramie, Ohio; San Diego and Anaheim, California; Reno, Nevada;
Baltimore, Maryland; Ladson, South Carolina; Chattanooga, Tennessee.Canada Toronto; Mississauga.Mexico Mexico City; Torreon.United Kingdom Port Talbot, Wales.
Europe Welding: France Grand-Quevilly.Germany Essen.Italy Genoa; Corsalone.Netherlands Nijmegen.Poland Bielawa; Dzierzoniow.Portugal Lisbon.Russia Mtsensk.Turkey Istanbul.United Kingdom Sheffield and Chertsey, England.
Asia Pacific Welding: China Shanghai; Jinzhou; Nanjing; Zhengzhou; Luan County.India Chennai.Indonesia Cikarang.
South America Welding: Brazil Sao Paulo.Colombia Bogota.Venezuela Maracay.
The Harris Products Group: United States Mason, Ohio; Gainesville, Georgia; Santa Fe Springs, California.Brazil Guarulhos.Mexico Tijuana.Poland Dzierzoniow.
All properties relating to the Company's Cleveland, Ohio headquarters and manufacturing facilities are owned by the Company. Most of the Company's foreign subsidiaries own manufacturing facilities in the country where they are located. The Company believes that its existing properties are in good condition and are suitable for the conduct of its business. At December 31, 2012, $0.2 million of indebtedness under capital leases was secured by property with a book value of $0.4 million.
In addition, the Company maintains operating leases for many of its distribution centers and sales offices throughout the world. See Note 16 to the Company's consolidated financial statements for information regarding the Company's lease commitments.
ITEM 3. LEGAL PROCEEDINGS
The Company is subject, from time to time, to a variety of civil and administrative proceedings arising out of its normal operations, including, without limitation, product liability claims, regulatory claims and health, safety and environmental claims. Among such proceedings are the cases described below.
At December 31, 2012, the Company was a co-defendant in cases alleging asbestos induced illness involving claims by approximately 15,050 plaintiffs, which is a net decrease of three claims from those previously reported. In each instance, the Company is one of a large number of defendants. The asbestos claimants seek compensatory and punitive damages, in most cases for unspecified sums. Since January 1, 1995, the Company has been a co-defendant in other similar cases that have been resolved as follows: 41,161 of those claims were dismissed, 20 were tried to defense verdicts, seven were tried to plaintiff verdicts (two of which are being appealed), one was resolved by agreement for an immaterial amount and 612 were decided in favor of the Company following summary judgment motions.
In July 2012, the Company received a Notice of Reassessment from the Canada Revenue Agency (the “CRA”) for 2004 to 2011, which would disallow the deductibility of inter-company dividends. These adjustments would increase Canadian federal
10
and provincial tax due. The Company disagrees with the position taken by the CRA and believes it is without merit. The Company will vigorously contest the assessment through the Tax Court of Canada. A trial date has not yet been scheduled. In connection with the litigation process, the Company is required to deposit no less than one-half of the tax and interest assessed by the CRA, of which a payment was made in September 2012 and the balance of the tax and interest assessment was made in the quarter ended December 31, 2012. Any Canadian tax ultimately due will be creditable in the parent company's U.S. federal tax return. The Company expects to be able to utilize the full amount of foreign tax credits generated in the statutorily allowed carry-back and carry-forward periods. Accordingly, should the Company not prevail in this dispute, the income statement charge will approximate the deficiency interest, net of tax. The Company believes it will prevail on the merits of the tax position. In accordance with prescribed recognition and measurement thresholds, no income tax accrual has been made for any uncertain tax positions related to the CRA reassessment. An unfavorable resolution of this matter could have a material effect on the Company's financial statements in the period in which a judgment is reached.
ITEM 4. MINE SAFETY DISCLOSURES
Not applicable.
PART II
ITEM 5. MARKET FOR REGISTRANT'S COMMON EQUITY, RELATED STOCKHOLDER MATTERS AND ISSUER PURCHASES OF EQUITY SECURITIES
The Company's common shares are traded on The NASDAQ Global Select Market under the symbol "LECO." The number of record holders of common shares at December 31, 2012 was 1,699.
The total amount of dividends paid in 2012 was $73.1 million. During 2012, dividends were paid quarterly on January 13, April 13, July 13 and October 15. The December dividend that the Company would normally pay in January 2013 was paid on December 28, 2012.
Quarterly high and low stock prices and dividends declared per share for the last two years were:
2012 2011
Stock Price DividendsDeclared
Stock Price DividendsDeclaredHigh Low High Low
First quarter $ 47.87 $ 38.96 $ 0.170 $ 38.50 $ 32.69 $ 0.155Second quarter 50.36 41.42 0.170 39.62 32.30 0.155Third quarter 46.11 37.83 0.170 39.18 27.47 0.155Fourth quarter 49.00 37.63 0.200 40.10 26.84 0.170
Issuer purchases of equity securities for the fourth quarter 2012 were:
PeriodTotal Number of
Shares RepurchasedAverage PricePaid Per Share
Total Number ofShares Repurchasedas Part of Publicly
Announced Plans orPrograms
Maximum Number of Shares that May Yet be Purchased Under the Plans or Programs (2)
October 1-31, 2012 — $ — — 3,779,773November 1-30, 2012 271,518 (1) 44.74 253,400 3,526,373December 1-31, 2012 184,000 47.36 184,000 3,342,373Total 455,518 45.80 437,400
(1) The above share repurchases include the surrender of 18,118 shares of the Company's common stock to satisfy minimum income tax withholding requirements related to the vesting of 45,460 restricted shares granted pursuant to the Company's 2006 Equity and Performance Incentive Plan.
(2) The Company's Board of Directors authorized a share repurchase program for up to 30 million shares of the Company's common stock. Total shares purchased through the share repurchase program were 26,657,627 shares at a cost of $430.1 million for a weighted average cost of $16.13 per share through December 31, 2012.
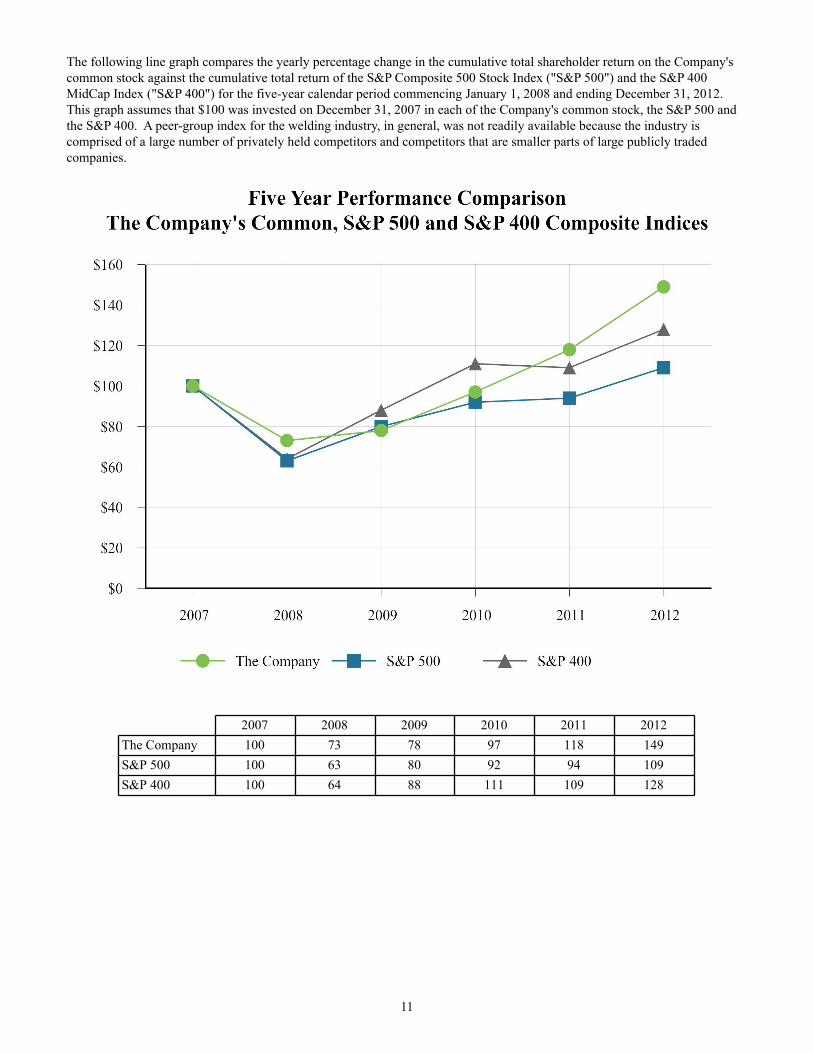
11
The following line graph compares the yearly percentage change in the cumulative total shareholder return on the Company's common stock against the cumulative total return of the S&P Composite 500 Stock Index ("S&P 500") and the S&P 400 MidCap Index ("S&P 400") for the five-year calendar period commencing January 1, 2008 and ending December 31, 2012. This graph assumes that $100 was invested on December 31, 2007 in each of the Company's common stock, the S&P 500 and the S&P 400. A peer-group index for the welding industry, in general, was not readily available because the industry is comprised of a large number of privately held competitors and competitors that are smaller parts of large publicly traded companies.
2007 2008 2009 2010 2011 2012The Company 100 73 78 97 118 149S&P 500 100 63 80 92 94 109S&P 400 100 64 88 111 109 128
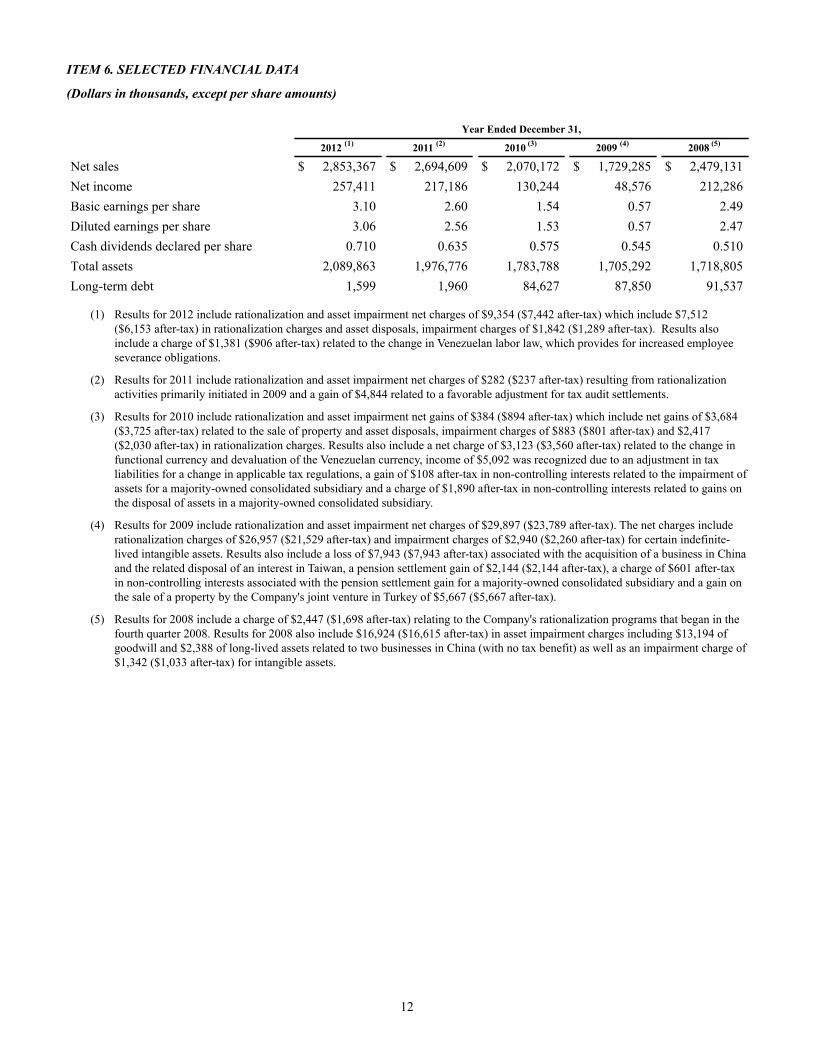
12
ITEM 6. SELECTED FINANCIAL DATA
(Dollars in thousands, except per share amounts)
Year Ended December 31,
2012 (1) 2011 (2) 2010 (3) 2009 (4) 2008 (5)
Net sales $ 2,853,367 $ 2,694,609 $ 2,070,172 $ 1,729,285 $ 2,479,131Net income 257,411 217,186 130,244 48,576 212,286Basic earnings per share 3.10 2.60 1.54 0.57 2.49Diluted earnings per share 3.06 2.56 1.53 0.57 2.47Cash dividends declared per share 0.710 0.635 0.575 0.545 0.510Total assets 2,089,863 1,976,776 1,783,788 1,705,292 1,718,805Long-term debt 1,599 1,960 84,627 87,850 91,537
(1) Results for 2012 include rationalization and asset impairment net charges of $9,354 ($7,442 after-tax) which include $7,512 ($6,153 after-tax) in rationalization charges and asset disposals, impairment charges of $1,842 ($1,289 after-tax). Results also include a charge of $1,381 ($906 after-tax) related to the change in Venezuelan labor law, which provides for increased employee severance obligations.
(2) Results for 2011 include rationalization and asset impairment net charges of $282 ($237 after-tax) resulting from rationalization activities primarily initiated in 2009 and a gain of $4,844 related to a favorable adjustment for tax audit settlements.
(3) Results for 2010 include rationalization and asset impairment net gains of $384 ($894 after-tax) which include net gains of $3,684 ($3,725 after-tax) related to the sale of property and asset disposals, impairment charges of $883 ($801 after-tax) and $2,417 ($2,030 after-tax) in rationalization charges. Results also include a net charge of $3,123 ($3,560 after-tax) related to the change in functional currency and devaluation of the Venezuelan currency, income of $5,092 was recognized due to an adjustment in tax liabilities for a change in applicable tax regulations, a gain of $108 after-tax in non-controlling interests related to the impairment of assets for a majority-owned consolidated subsidiary and a charge of $1,890 after-tax in non-controlling interests related to gains on the disposal of assets in a majority-owned consolidated subsidiary.
(4) Results for 2009 include rationalization and asset impairment net charges of $29,897 ($23,789 after-tax). The net charges include rationalization charges of $26,957 ($21,529 after-tax) and impairment charges of $2,940 ($2,260 after-tax) for certain indefinite-lived intangible assets. Results also include a loss of $7,943 ($7,943 after-tax) associated with the acquisition of a business in China and the related disposal of an interest in Taiwan, a pension settlement gain of $2,144 ($2,144 after-tax), a charge of $601 after-tax in non-controlling interests associated with the pension settlement gain for a majority-owned consolidated subsidiary and a gain on the sale of a property by the Company's joint venture in Turkey of $5,667 ($5,667 after-tax).
(5) Results for 2008 include a charge of $2,447 ($1,698 after-tax) relating to the Company's rationalization programs that began in the fourth quarter 2008. Results for 2008 also include $16,924 ($16,615 after-tax) in asset impairment charges including $13,194 of goodwill and $2,388 of long-lived assets related to two businesses in China (with no tax benefit) as well as an impairment charge of $1,342 ($1,033 after-tax) for intangible assets.
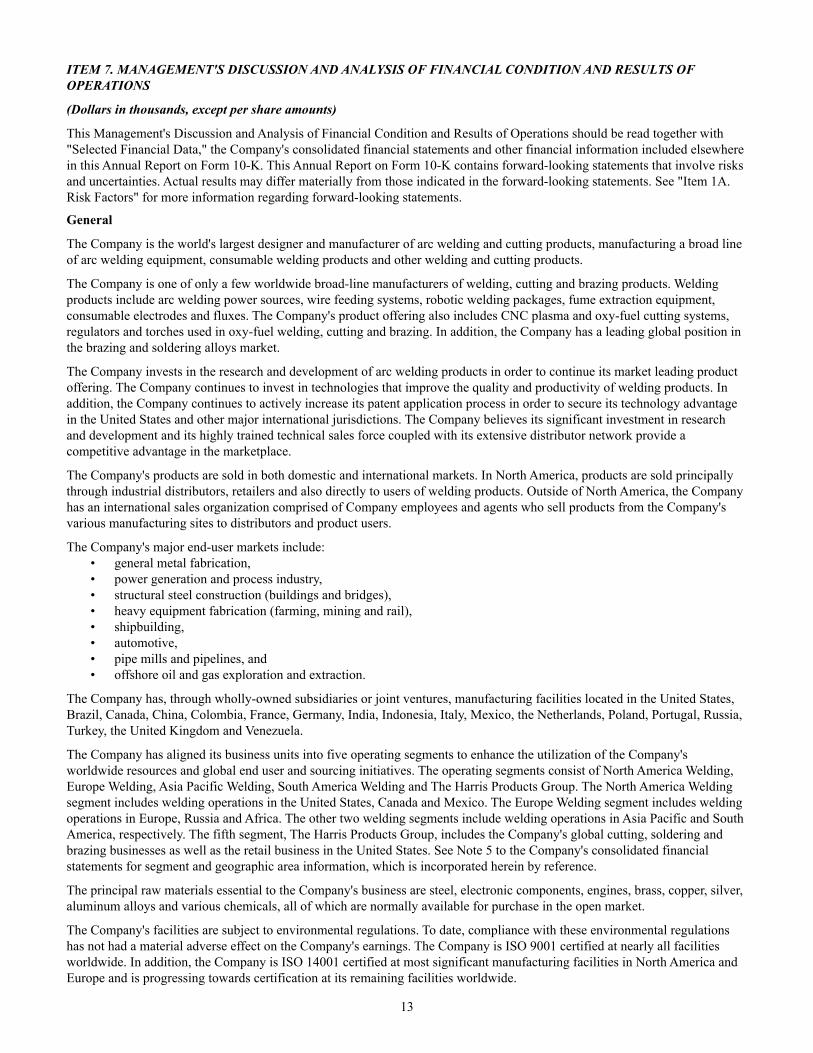
13
ITEM 7. MANAGEMENT'S DISCUSSION AND ANALYSIS OF FINANCIAL CONDITION AND RESULTS OF OPERATIONS
(Dollars in thousands, except per share amounts)
This Management's Discussion and Analysis of Financial Condition and Results of Operations should be read together with "Selected Financial Data," the Company's consolidated financial statements and other financial information included elsewhere in this Annual Report on Form 10-K. This Annual Report on Form 10-K contains forward-looking statements that involve risks and uncertainties. Actual results may differ materially from those indicated in the forward-looking statements. See "Item 1A. Risk Factors" for more information regarding forward-looking statements.
General
The Company is the world's largest designer and manufacturer of arc welding and cutting products, manufacturing a broad line of arc welding equipment, consumable welding products and other welding and cutting products.
The Company is one of only a few worldwide broad-line manufacturers of welding, cutting and brazing products. Welding products include arc welding power sources, wire feeding systems, robotic welding packages, fume extraction equipment, consumable electrodes and fluxes. The Company's product offering also includes CNC plasma and oxy-fuel cutting systems, regulators and torches used in oxy-fuel welding, cutting and brazing. In addition, the Company has a leading global position in the brazing and soldering alloys market.
The Company invests in the research and development of arc welding products in order to continue its market leading product offering. The Company continues to invest in technologies that improve the quality and productivity of welding products. In addition, the Company continues to actively increase its patent application process in order to secure its technology advantage in the United States and other major international jurisdictions. The Company believes its significant investment in research and development and its highly trained technical sales force coupled with its extensive distributor network provide a competitive advantage in the marketplace.
The Company's products are sold in both domestic and international markets. In North America, products are sold principally through industrial distributors, retailers and also directly to users of welding products. Outside of North America, the Company has an international sales organization comprised of Company employees and agents who sell products from the Company's various manufacturing sites to distributors and product users.
The Company's major end-user markets include:• general metal fabrication,• power generation and process industry,• structural steel construction (buildings and bridges),• heavy equipment fabrication (farming, mining and rail),• shipbuilding,• automotive,• pipe mills and pipelines, and• offshore oil and gas exploration and extraction.
The Company has, through wholly-owned subsidiaries or joint ventures, manufacturing facilities located in the United States, Brazil, Canada, China, Colombia, France, Germany, India, Indonesia, Italy, Mexico, the Netherlands, Poland, Portugal, Russia, Turkey, the United Kingdom and Venezuela.
The Company has aligned its business units into five operating segments to enhance the utilization of the Company's worldwide resources and global end user and sourcing initiatives. The operating segments consist of North America Welding, Europe Welding, Asia Pacific Welding, South America Welding and The Harris Products Group. The North America Welding segment includes welding operations in the United States, Canada and Mexico. The Europe Welding segment includes welding operations in Europe, Russia and Africa. The other two welding segments include welding operations in Asia Pacific and South America, respectively. The fifth segment, The Harris Products Group, includes the Company's global cutting, soldering and brazing businesses as well as the retail business in the United States. See Note 5 to the Company's consolidated financial statements for segment and geographic area information, which is incorporated herein by reference.
The principal raw materials essential to the Company's business are steel, electronic components, engines, brass, copper, silver, aluminum alloys and various chemicals, all of which are normally available for purchase in the open market.
The Company's facilities are subject to environmental regulations. To date, compliance with these environmental regulations has not had a material adverse effect on the Company's earnings. The Company is ISO 9001 certified at nearly all facilities worldwide. In addition, the Company is ISO 14001 certified at most significant manufacturing facilities in North America and Europe and is progressing towards certification at its remaining facilities worldwide.
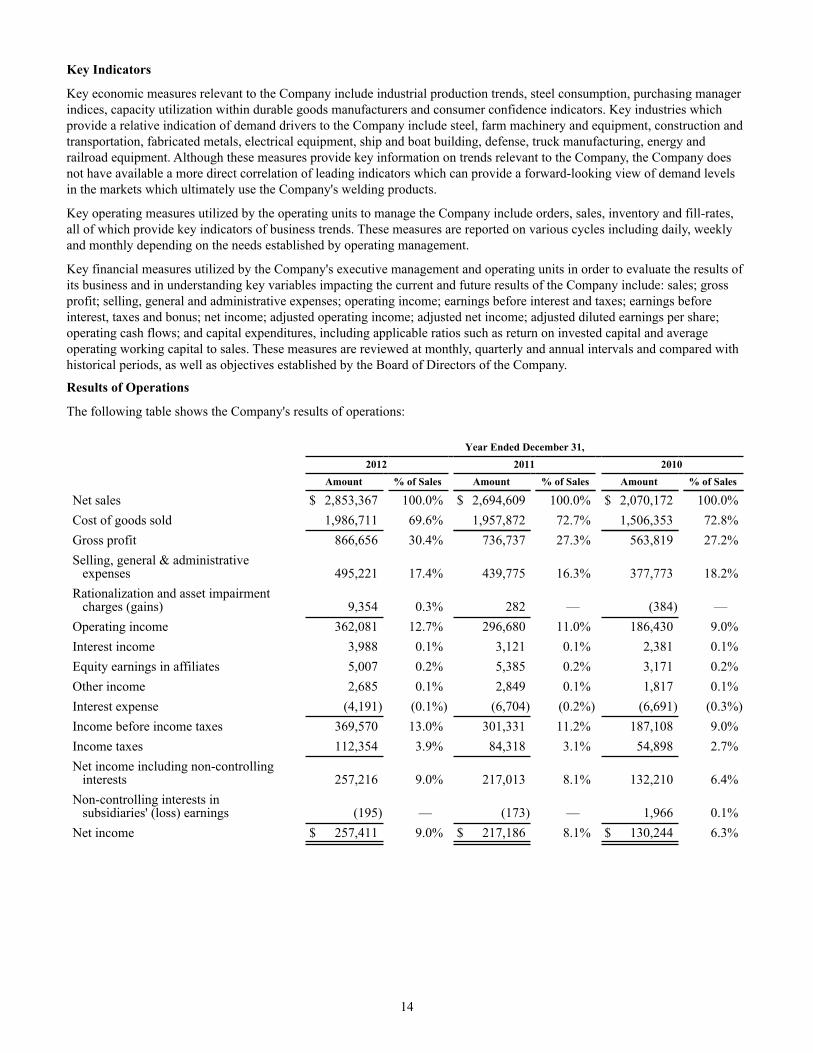
14
Key Indicators
Key economic measures relevant to the Company include industrial production trends, steel consumption, purchasing manager indices, capacity utilization within durable goods manufacturers and consumer confidence indicators. Key industries which provide a relative indication of demand drivers to the Company include steel, farm machinery and equipment, construction and transportation, fabricated metals, electrical equipment, ship and boat building, defense, truck manufacturing, energy and railroad equipment. Although these measures provide key information on trends relevant to the Company, the Company does not have available a more direct correlation of leading indicators which can provide a forward-looking view of demand levels in the markets which ultimately use the Company's welding products.
Key operating measures utilized by the operating units to manage the Company include orders, sales, inventory and fill-rates, all of which provide key indicators of business trends. These measures are reported on various cycles including daily, weekly and monthly depending on the needs established by operating management.
Key financial measures utilized by the Company's executive management and operating units in order to evaluate the results of its business and in understanding key variables impacting the current and future results of the Company include: sales; gross profit; selling, general and administrative expenses; operating income; earnings before interest and taxes; earnings before interest, taxes and bonus; net income; adjusted operating income; adjusted net income; adjusted diluted earnings per share; operating cash flows; and capital expenditures, including applicable ratios such as return on invested capital and average operating working capital to sales. These measures are reviewed at monthly, quarterly and annual intervals and compared with historical periods, as well as objectives established by the Board of Directors of the Company.
Results of Operations
The following table shows the Company's results of operations:
Year Ended December 31, 2012 2011 2010 Amount % of Sales Amount % of Sales Amount % of Sales
Net sales $ 2,853,367 100.0% $ 2,694,609 100.0% $ 2,070,172 100.0%Cost of goods sold 1,986,711 69.6% 1,957,872 72.7% 1,506,353 72.8%Gross profit 866,656 30.4% 736,737 27.3% 563,819 27.2%Selling, general & administrative expenses 495,221 17.4% 439,775 16.3% 377,773 18.2%Rationalization and asset impairment charges (gains) 9,354 0.3% 282 — (384) —Operating income 362,081 12.7% 296,680 11.0% 186,430 9.0%Interest income 3,988 0.1% 3,121 0.1% 2,381 0.1%Equity earnings in affiliates 5,007 0.2% 5,385 0.2% 3,171 0.2%Other income 2,685 0.1% 2,849 0.1% 1,817 0.1%Interest expense (4,191) (0.1%) (6,704) (0.2%) (6,691) (0.3%)Income before income taxes 369,570 13.0% 301,331 11.2% 187,108 9.0%Income taxes 112,354 3.9% 84,318 3.1% 54,898 2.7%Net income including non-controlling interests 257,216 9.0% 217,013 8.1% 132,210 6.4%Non-controlling interests in subsidiaries' (loss) earnings (195) — (173) — 1,966 0.1%Net income $ 257,411 9.0% $ 217,186 8.1% $ 130,244 6.3%
15
2012 Compared with 2011
Net Sales: Net sales for 2012 increased 5.9% from 2011. The sales increase reflects volume increases of 1.3%, price increases of 1.7%, increases from acquisitions of 4.9% and unfavorable impacts from foreign exchange of 2.0%. Sales volumes increased because of growth in the domestic markets offset by lower demand in the international markets. Product pricing increased from prior year levels due to the realization of price increases implemented in response to increases in raw material costs.
Gross Profit: Gross profit increased 17.6% to $866,656 during 2012 compared with $736,737 in 2011. As a percentage of Net sales, Gross profit increased to 30.4% in 2012 compared with 27.3% in 2011. The increase was the result of pricing increases and operating leverage partially offset by lower margins from the acquisitions of Kaliburn, Burny and Cleveland Motion Control businesses (collectively, "Kaliburn"), Wayne Trail Technologies, Inc. (“Wayne Trail”), Weartech International, Inc. (“Weartech”), Techalloy Company, Inc. and certain assets of its parent company, Central Wire Industries Ltd. (collectively, "Techalloy") and OOO Severstal-metiz: welding consumables ("Severstal"). In the current period, the Company recorded charges of $2,334 related to the initial accounting for recent acquisitions and charges of $1,039 due to a change in Venezuelan labor law, which provides for increased employee severance obligations. Foreign currency exchange rates had a $13,166 unfavorable translation impact in 2012.
Selling, General & Administrative ("SG&A") Expenses: SG&A expenses increased 12.6% to $495,221 during 2012 compared with $439,775 in 2011. The increase was primarily due to higher bonus expense of $20,439, incremental SG&A expenses from acquisitions of $15,403, higher general and administrative spending primarily related to additional employee compensation costs of $12,692, higher U.S. retirement costs of $3,986 and higher legal expenses of $2,142 partially offset by foreign currency translation of $8,821.
Rationalization and Asset Impairment Charges (Gains): In 2012, the Company recorded $9,354 in charges primarily related to rationalization actions initiated in 2012. See "Rationalization and Asset Impairments" for additional information.
Interest Income: Interest income increased to $3,988 in 2012 from $3,121 in 2011. The increase was largely due to international entities earning more favorable interest rates.
Equity Earnings in Affiliates: Equity earnings in affiliates were $5,007 in 2012 compared with earnings of $5,385 in 2011. The decrease was due to a decrease in earnings of $542 in Chile being partially offset by an increase in earnings of $164 in Turkey.
Interest Expense: Interest expense decreased to $4,191 in 2012 from $6,704 in 2011, primarily as a result of lower levels of debt in the current period.
Income Taxes: The Company recorded $112,354 of tax expense on pre-tax income of $369,570, resulting in an effective tax rate of 30.4% for 2012. The effective income tax rate is lower than the Company's statutory rate primarily due to income earned in lower tax rate jurisdictions and the utilization of foreign tax loss carry-forwards for which valuation allowances had been previously provided.
The effective income tax rate of 28.0% for 2011 was lower than the Company's statutory rate primarily due to income earned in lower tax rate jurisdictions, the utilization of foreign tax loss carry-forwards for which valuation allowances had been previously provided and a tax benefit of $4,844 for tax audit settlements.
Net Income: Net income for 2012 was $257,411 compared with $217,186 in the prior year. Diluted earnings per share for 2012 were $3.06 compared with diluted earnings of $2.56 per share in 2011. Foreign currency exchange rate movements had an unfavorable translation effect of $2,879 and a favorable translation effect of $2,948 on Net income for 2012 and 2011, respectively.
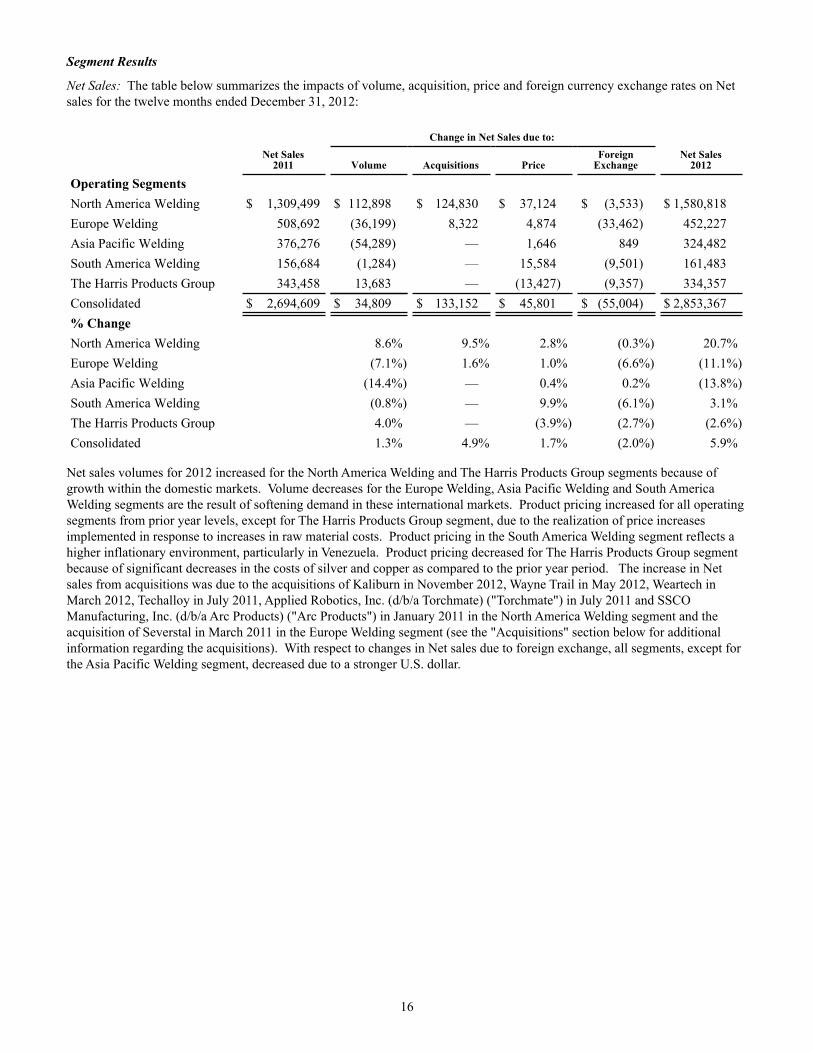
16
Segment Results
Net Sales: The table below summarizes the impacts of volume, acquisition, price and foreign currency exchange rates on Net sales for the twelve months ended December 31, 2012:
Change in Net Sales due to:
Net Sales
2011 Volume Acquisitions PriceForeign
ExchangeNet Sales
2012
Operating Segments North America Welding $ 1,309,499 $ 112,898 $ 124,830 $ 37,124 $ (3,533) $ 1,580,818Europe Welding 508,692 (36,199) 8,322 4,874 (33,462) 452,227Asia Pacific Welding 376,276 (54,289) — 1,646 849 324,482South America Welding 156,684 (1,284) — 15,584 (9,501) 161,483The Harris Products Group 343,458 13,683 — (13,427) (9,357) 334,357Consolidated $ 2,694,609 $ 34,809 $ 133,152 $ 45,801 $ (55,004) $ 2,853,367% Change North America Welding 8.6% 9.5% 2.8% (0.3%) 20.7%Europe Welding (7.1%) 1.6% 1.0% (6.6%) (11.1%)Asia Pacific Welding (14.4%) — 0.4% 0.2% (13.8%)South America Welding (0.8%) — 9.9% (6.1%) 3.1%The Harris Products Group 4.0% — (3.9%) (2.7%) (2.6%)Consolidated 1.3% 4.9% 1.7% (2.0%) 5.9%
Net sales volumes for 2012 increased for the North America Welding and The Harris Products Group segments because of growth within the domestic markets. Volume decreases for the Europe Welding, Asia Pacific Welding and South America Welding segments are the result of softening demand in these international markets. Product pricing increased for all operating segments from prior year levels, except for The Harris Products Group segment, due to the realization of price increases implemented in response to increases in raw material costs. Product pricing in the South America Welding segment reflects a higher inflationary environment, particularly in Venezuela. Product pricing decreased for The Harris Products Group segment because of significant decreases in the costs of silver and copper as compared to the prior year period. The increase in Net sales from acquisitions was due to the acquisitions of Kaliburn in November 2012, Wayne Trail in May 2012, Weartech in March 2012, Techalloy in July 2011, Applied Robotics, Inc. (d/b/a Torchmate) ("Torchmate") in July 2011 and SSCO Manufacturing, Inc. (d/b/a Arc Products) ("Arc Products") in January 2011 in the North America Welding segment and the acquisition of Severstal in March 2011 in the Europe Welding segment (see the "Acquisitions" section below for additional information regarding the acquisitions). With respect to changes in Net sales due to foreign exchange, all segments, except for the Asia Pacific Welding segment, decreased due to a stronger U.S. dollar.
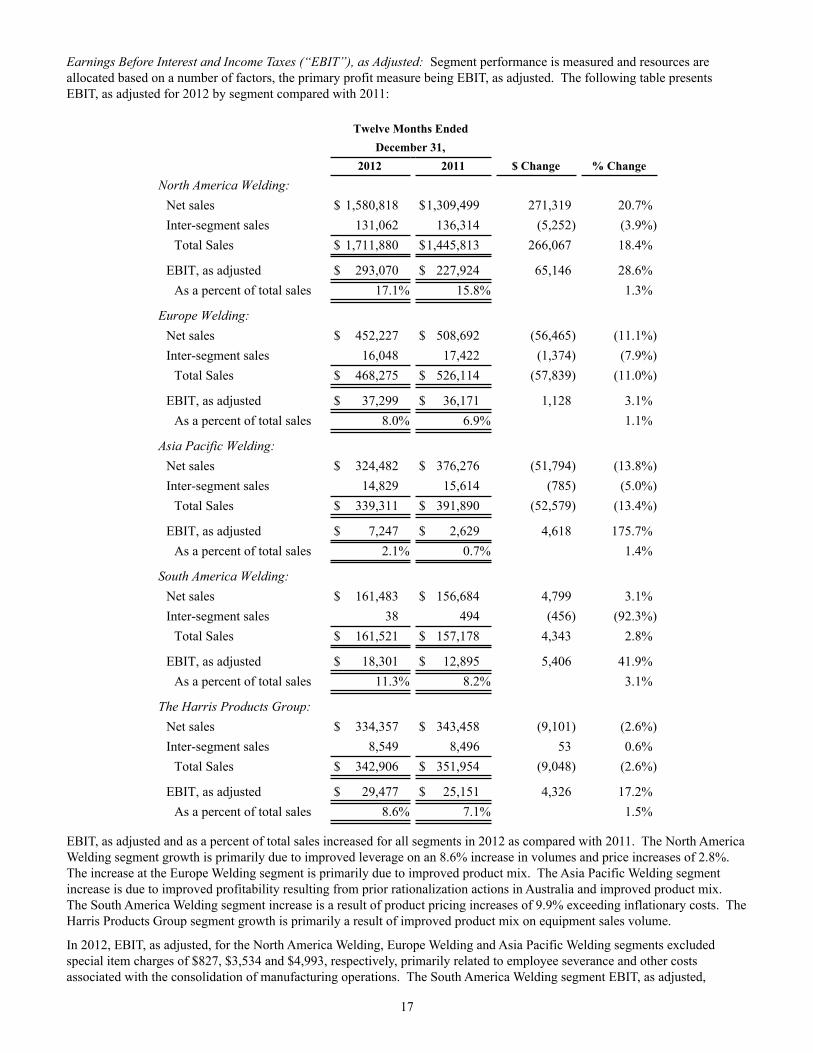
17
Earnings Before Interest and Income Taxes (“EBIT”), as Adjusted: Segment performance is measured and resources are allocated based on a number of factors, the primary profit measure being EBIT, as adjusted. The following table presents EBIT, as adjusted for 2012 by segment compared with 2011:
Twelve Months EndedDecember 31,
2012 2011 $ Change % ChangeNorth America Welding:
Net sales $ 1,580,818 $1,309,499 271,319 20.7%Inter-segment sales 131,062 136,314 (5,252) (3.9%)
Total Sales $ 1,711,880 $1,445,813 266,067 18.4%
EBIT, as adjusted $ 293,070 $ 227,924 65,146 28.6%As a percent of total sales 17.1% 15.8% 1.3%
Europe Welding:Net sales $ 452,227 $ 508,692 (56,465) (11.1%)Inter-segment sales 16,048 17,422 (1,374) (7.9%)
Total Sales $ 468,275 $ 526,114 (57,839) (11.0%)
EBIT, as adjusted $ 37,299 $ 36,171 1,128 3.1%As a percent of total sales 8.0% 6.9% 1.1%
Asia Pacific Welding:Net sales $ 324,482 $ 376,276 (51,794) (13.8%)Inter-segment sales 14,829 15,614 (785) (5.0%)
Total Sales $ 339,311 $ 391,890 (52,579) (13.4%)
EBIT, as adjusted $ 7,247 $ 2,629 4,618 175.7%As a percent of total sales 2.1% 0.7% 1.4%
South America Welding:Net sales $ 161,483 $ 156,684 4,799 3.1%Inter-segment sales 38 494 (456) (92.3%)
Total Sales $ 161,521 $ 157,178 4,343 2.8%
EBIT, as adjusted $ 18,301 $ 12,895 5,406 41.9%As a percent of total sales 11.3% 8.2% 3.1%
The Harris Products Group:Net sales $ 334,357 $ 343,458 (9,101) (2.6%)Inter-segment sales 8,549 8,496 53 0.6%
Total Sales $ 342,906 $ 351,954 (9,048) (2.6%)
EBIT, as adjusted $ 29,477 $ 25,151 4,326 17.2%As a percent of total sales 8.6% 7.1% 1.5%
EBIT, as adjusted and as a percent of total sales increased for all segments in 2012 as compared with 2011. The North America Welding segment growth is primarily due to improved leverage on an 8.6% increase in volumes and price increases of 2.8%. The increase at the Europe Welding segment is primarily due to improved product mix. The Asia Pacific Welding segment increase is due to improved profitability resulting from prior rationalization actions in Australia and improved product mix. The South America Welding segment increase is a result of product pricing increases of 9.9% exceeding inflationary costs. The Harris Products Group segment growth is primarily a result of improved product mix on equipment sales volume.
In 2012, EBIT, as adjusted, for the North America Welding, Europe Welding and Asia Pacific Welding segments excluded special item charges of $827, $3,534 and $4,993, respectively, primarily related to employee severance and other costs associated with the consolidation of manufacturing operations. The South America Welding segment EBIT, as adjusted,
18
excluded a special item charge of $1,381, related to a change in Venezuelan labor law, which provides for increased employee severance obligations.
In 2011, EBIT, as adjusted, for the Europe Welding and Asia Pacific Welding segments excluded special items net charges of $188 and $93, respectively, primarily related to employee severance and other costs associated with the consolidation of manufacturing operations. The Europe Welding segment special items also include a loss of $204 on the sale of assets at a rationalized operation. The Asia Pacific Welding segment special items also include a gain of $203 on the sale of assets at a rationalized operation.
2011 Compared with 2010
Net Sales: Net sales volume for 2011 increased for all operating segments as a result of higher demand levels from expanding industrial economies associated with the improved global economy and modest market share gains. Product pricing increased for all operating segments due to the realization of price increases implemented in response to increases in raw material costs. Product pricing in the South America Welding segment reflected a higher inflationary environment, particularly in Venezuela. Product pricing increased in The Harris Products Group segment due to the pass-through effect of higher commodity costs, particularly silver and copper. The increase in Net sales from acquisitions was due to the acquisitions of Arc Products in January 2011, Techalloy and Torchmate in July 2011 in the North America Welding segment and the acquisitions of Severstal in March 2011 and Mezhgosmetiz-Mtsensk OAO ("MGM") in October 2010 in the Europe Welding segment (see the "Acquisitions" section below for additional information regarding the acquisitions). With respect to changes in Net sales due to foreign exchange, all segments increased due to a weaker U.S. dollar.
Gross Profit: Gross profit increased 30.7% to $736,737 during 2011 compared with $563,819 in 2010. As a percentage of Net sales, Gross profit increased slightly to 27.3% in 2011 compared with 27.2% in 2010. The increase was the result of pricing increases and operating leverage offset by rising material costs and lower margins from the acquisitions of MGM, Severstal and Techalloy. In the prior year, the South America Welding segment recorded charges of $5,755 resulting from the change in functional currency and related devaluation of the Venezuelan currency. Foreign currency exchange rates had an $11,125 favorable translation impact in 2011.
Selling, General & Administrative ("SG&A") Expenses: SG&A expenses increased 16.4% to $439,775 during 2011 compared with $377,773 in 2010. The increase was primarily due to higher bonus expense of $30,714, higher selling, administrative and research and development expenses of $15,546, incremental SG&A expenses from acquisitions of $8,600, higher foreign currency translation of $7,257 and higher foreign exchange transaction losses of $4,531 partially offset by lower legal expenses of $4,124. In the prior year period, the South America Welding segment recorded a gain of $2,632 resulting from the change in Venezuela's functional currency to the U.S. dollar and the devaluation of the bolivar.
Rationalization and Asset Impairment Charges (Gains): In 2011, the Company recorded $282 in charges primarily related to rationalization actions initiated in 2009. See "Rationalization and Asset Impairments" for additional information.
Interest Income: Interest income increased to $3,121 in 2011 from $2,381 in 2010. The increase was largely due to interest income received on a sales tax refund.
Equity Earnings (Loss) in Affiliates: Equity earnings in affiliates were $5,385 in 2011 compared with earnings of $3,171 in 2010. The increase was due to an increase in earnings of $1,895 in Turkey and an increase of $319 in Chile.
Interest Expense: Interest expense remained flat at $6,704 in 2011 as compared to $6,691 in 2010, primarily as a result of higher interest rates offset by lower levels of debt in the current period.
Income Taxes: The Company recorded $84,318 of tax expense on pre-tax income of $301,331, resulting in an effective tax rate of 28.0% for 2011. The effective income tax rate is lower than the Company's statutory rate primarily due to income earned in lower tax rate jurisdictions, the utilization of foreign tax loss carry-forwards for which valuation allowances had been previously provided and a tax benefit of $4,844 for tax audit settlements.
The effective income tax rate of 29.3% for 2010 was primarily due to income earned in lower tax rate jurisdictions and the utilization of foreign tax loss carry-forwards for which valuation allowances had been previously provided.
Net Income: Net income for 2011 was $217,186 compared with $130,244 in the prior year. Diluted earnings per share for 2011 were $2.56 compared with diluted earnings of $1.53 per share in 2010. Foreign currency exchange rate movements had a favorable translation effect of $2,948 and $762 on Net income for 2011 and 2010, respectively.

19
Segment Results
Net Sales: The table below summarizes the impacts of volume, acquisition, price and foreign currency exchange rates on Net sales for the twelve months ended December 31, 2011:
Change in Net Sales due to:
Net Sales
2010 Volume Acquisitions PriceForeign
ExchangeNet Sales
2011
Operating Segments North America Welding $ 1,013,193 $ 194,618 $ 54,452 $ 41,839 $ 5,397 $ 1,309,499Europe Welding 359,925 42,376 66,425 20,390 19,576 508,692Asia Pacific Welding 324,092 26,198 — 3,305 22,681 376,276South America Welding 117,419 24,209 — 11,618 3,438 156,684The Harris Products Group 255,543 18,625 — 65,753 3,537 343,458Consolidated $ 2,070,172 $ 306,026 $ 120,877 $ 142,905 $ 54,629 $ 2,694,609% Change North America Welding 19.2% 5.4% 4.1% 0.5% 29.2%Europe Welding 11.8% 18.5% 5.7% 5.4% 41.3%Asia Pacific Welding 8.1% — 1.0% 7.0% 16.1%South America Welding 20.6% — 9.9% 2.9% 33.4%The Harris Products Group 7.3% — 25.7% 1.4% 34.4%Consolidated 14.8% 5.8% 6.9% 2.6% 30.2%
Net sales volume for 2011 increased for all operating segments as a result of higher demand levels from expanding industrial economies associated with the improved global economy and modest market share gains. Product pricing increased for all operating segments due to the realization of price increases implemented in response to increases in raw material costs. Product pricing in the South America Welding segment reflected a higher inflationary environment, particularly in Venezuela. Product pricing increased in The Harris Products Group segment due to the pass-through effect of higher commodity costs, particularly silver and copper. The increase in Net sales from acquisitions was due to the acquisitions of Arc Products in January 2011, Techalloy and Torchmate in July 2011 in the North America Welding segment and the acquisitions of Severstal in March 2011 and Mezhgosmetiz-Mtsensk OAO ("MGM") in October 2010 in the Europe Welding segment (see the "Acquisitions" section below for additional information regarding the acquisitions). With respect to changes in Net sales due to foreign exchange, all segments increased due to a weaker U.S. dollar.
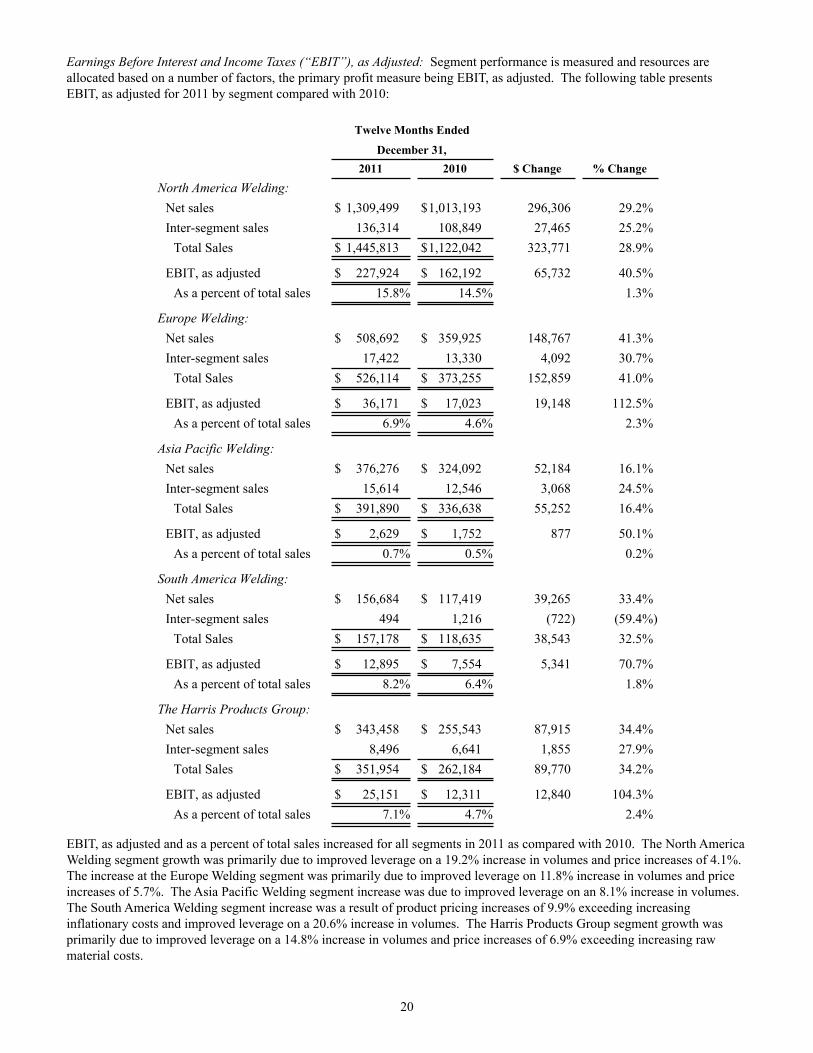
20
Earnings Before Interest and Income Taxes (“EBIT”), as Adjusted: Segment performance is measured and resources are allocated based on a number of factors, the primary profit measure being EBIT, as adjusted. The following table presents EBIT, as adjusted for 2011 by segment compared with 2010:
Twelve Months Ended
December 31,2011 2010 $ Change % Change
North America Welding:Net sales $ 1,309,499 $1,013,193 296,306 29.2%Inter-segment sales 136,314 108,849 27,465 25.2%
Total Sales $ 1,445,813 $1,122,042 323,771 28.9%
EBIT, as adjusted $ 227,924 $ 162,192 65,732 40.5%As a percent of total sales 15.8% 14.5% 1.3%
Europe Welding:Net sales $ 508,692 $ 359,925 148,767 41.3%Inter-segment sales 17,422 13,330 4,092 30.7%
Total Sales $ 526,114 $ 373,255 152,859 41.0%
EBIT, as adjusted $ 36,171 $ 17,023 19,148 112.5%As a percent of total sales 6.9% 4.6% 2.3%
Asia Pacific Welding:Net sales $ 376,276 $ 324,092 52,184 16.1%Inter-segment sales 15,614 12,546 3,068 24.5%
Total Sales $ 391,890 $ 336,638 55,252 16.4%
EBIT, as adjusted $ 2,629 $ 1,752 877 50.1%As a percent of total sales 0.7% 0.5% 0.2%
South America Welding:Net sales $ 156,684 $ 117,419 39,265 33.4%Inter-segment sales 494 1,216 (722) (59.4%)
Total Sales $ 157,178 $ 118,635 38,543 32.5%
EBIT, as adjusted $ 12,895 $ 7,554 5,341 70.7%As a percent of total sales 8.2% 6.4% 1.8%
The Harris Products Group:Net sales $ 343,458 $ 255,543 87,915 34.4%Inter-segment sales 8,496 6,641 1,855 27.9%
Total Sales $ 351,954 $ 262,184 89,770 34.2%
EBIT, as adjusted $ 25,151 $ 12,311 12,840 104.3%As a percent of total sales 7.1% 4.7% 2.4%
EBIT, as adjusted and as a percent of total sales increased for all segments in 2011 as compared with 2010. The North America Welding segment growth was primarily due to improved leverage on a 19.2% increase in volumes and price increases of 4.1%. The increase at the Europe Welding segment was primarily due to improved leverage on 11.8% increase in volumes and price increases of 5.7%. The Asia Pacific Welding segment increase was due to improved leverage on an 8.1% increase in volumes. The South America Welding segment increase was a result of product pricing increases of 9.9% exceeding increasing inflationary costs and improved leverage on a 20.6% increase in volumes. The Harris Products Group segment growth was primarily due to improved leverage on a 14.8% increase in volumes and price increases of 6.9% exceeding increasing raw material costs.
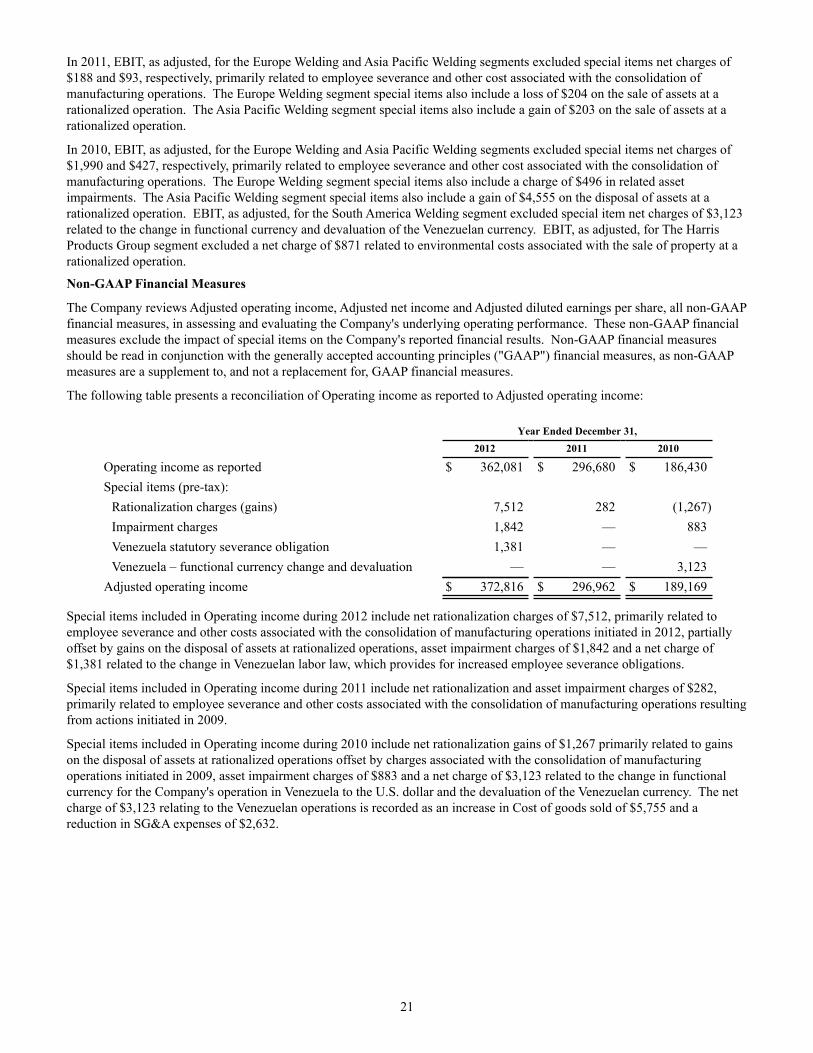
21
In 2011, EBIT, as adjusted, for the Europe Welding and Asia Pacific Welding segments excluded special items net charges of $188 and $93, respectively, primarily related to employee severance and other cost associated with the consolidation of manufacturing operations. The Europe Welding segment special items also include a loss of $204 on the sale of assets at a rationalized operation. The Asia Pacific Welding segment special items also include a gain of $203 on the sale of assets at a rationalized operation.
In 2010, EBIT, as adjusted, for the Europe Welding and Asia Pacific Welding segments excluded special items net charges of $1,990 and $427, respectively, primarily related to employee severance and other cost associated with the consolidation of manufacturing operations. The Europe Welding segment special items also include a charge of $496 in related asset impairments. The Asia Pacific Welding segment special items also include a gain of $4,555 on the disposal of assets at a rationalized operation. EBIT, as adjusted, for the South America Welding segment excluded special item net charges of $3,123 related to the change in functional currency and devaluation of the Venezuelan currency. EBIT, as adjusted, for The Harris Products Group segment excluded a net charge of $871 related to environmental costs associated with the sale of property at a rationalized operation.
Non-GAAP Financial Measures
The Company reviews Adjusted operating income, Adjusted net income and Adjusted diluted earnings per share, all non-GAAP financial measures, in assessing and evaluating the Company's underlying operating performance. These non-GAAP financial measures exclude the impact of special items on the Company's reported financial results. Non-GAAP financial measures should be read in conjunction with the generally accepted accounting principles ("GAAP") financial measures, as non-GAAP measures are a supplement to, and not a replacement for, GAAP financial measures.
The following table presents a reconciliation of Operating income as reported to Adjusted operating income:
Year Ended December 31, 2012 2011 2010
Operating income as reported $ 362,081 $ 296,680 $ 186,430Special items (pre-tax):
Rationalization charges (gains) 7,512 282 (1,267)Impairment charges 1,842 — 883Venezuela statutory severance obligation 1,381 — —Venezuela – functional currency change and devaluation — — 3,123
Adjusted operating income $ 372,816 $ 296,962 $ 189,169
Special items included in Operating income during 2012 include net rationalization charges of $7,512, primarily related to employee severance and other costs associated with the consolidation of manufacturing operations initiated in 2012, partially offset by gains on the disposal of assets at rationalized operations, asset impairment charges of $1,842 and a net charge of $1,381 related to the change in Venezuelan labor law, which provides for increased employee severance obligations.
Special items included in Operating income during 2011 include net rationalization and asset impairment charges of $282, primarily related to employee severance and other costs associated with the consolidation of manufacturing operations resulting from actions initiated in 2009.
Special items included in Operating income during 2010 include net rationalization gains of $1,267 primarily related to gains on the disposal of assets at rationalized operations offset by charges associated with the consolidation of manufacturing operations initiated in 2009, asset impairment charges of $883 and a net charge of $3,123 related to the change in functional currency for the Company's operation in Venezuela to the U.S. dollar and the devaluation of the Venezuelan currency. The net charge of $3,123 relating to the Venezuelan operations is recorded as an increase in Cost of goods sold of $5,755 and a reduction in SG&A expenses of $2,632.
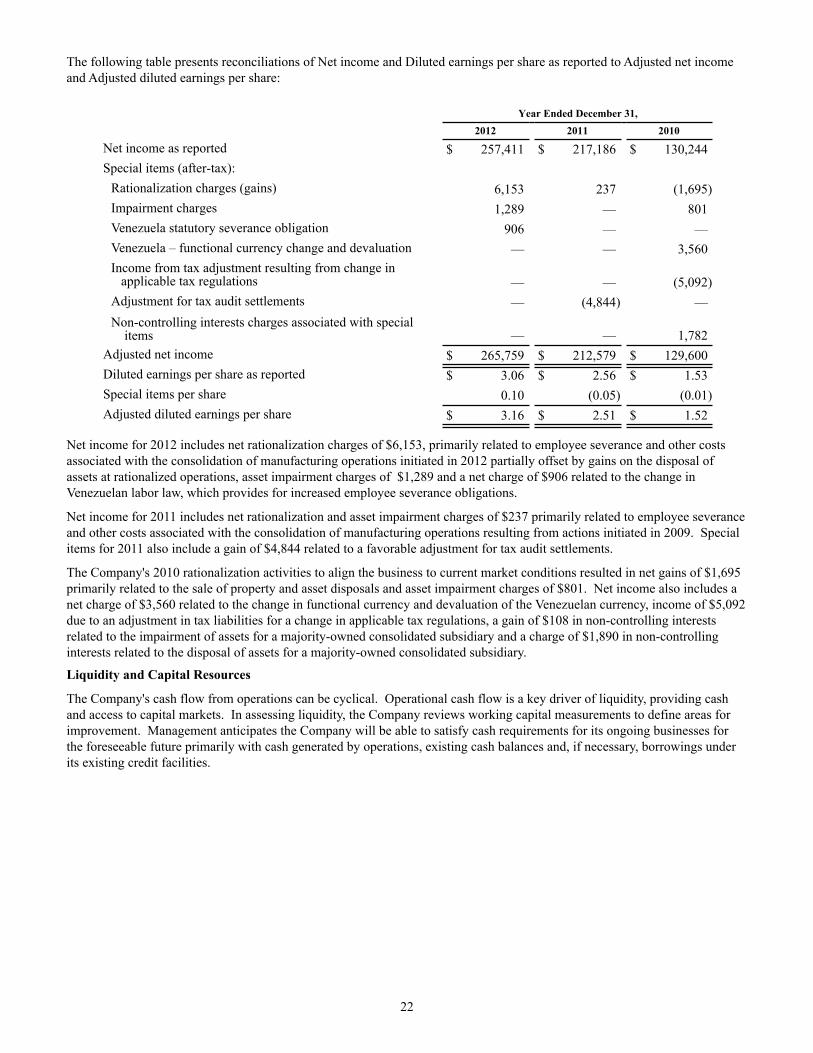
22
The following table presents reconciliations of Net income and Diluted earnings per share as reported to Adjusted net income and Adjusted diluted earnings per share:
Year Ended December 31,2012 2011 2010
Net income as reported $ 257,411 $ 217,186 $ 130,244Special items (after-tax):
Rationalization charges (gains) 6,153 237 (1,695)Impairment charges 1,289 — 801Venezuela statutory severance obligation 906 — —Venezuela – functional currency change and devaluation — — 3,560Income from tax adjustment resulting from change in applicable tax regulations — — (5,092)Adjustment for tax audit settlements — (4,844) —Non-controlling interests charges associated with special
items — — 1,782Adjusted net income $ 265,759 $ 212,579 $ 129,600Diluted earnings per share as reported $ 3.06 $ 2.56 $ 1.53Special items per share 0.10 (0.05) (0.01)Adjusted diluted earnings per share $ 3.16 $ 2.51 $ 1.52
Net income for 2012 includes net rationalization charges of $6,153, primarily related to employee severance and other costs associated with the consolidation of manufacturing operations initiated in 2012 partially offset by gains on the disposal of assets at rationalized operations, asset impairment charges of $1,289 and a net charge of $906 related to the change in Venezuelan labor law, which provides for increased employee severance obligations.
Net income for 2011 includes net rationalization and asset impairment charges of $237 primarily related to employee severance and other costs associated with the consolidation of manufacturing operations resulting from actions initiated in 2009. Special items for 2011 also include a gain of $4,844 related to a favorable adjustment for tax audit settlements.
The Company's 2010 rationalization activities to align the business to current market conditions resulted in net gains of $1,695 primarily related to the sale of property and asset disposals and asset impairment charges of $801. Net income also includes a net charge of $3,560 related to the change in functional currency and devaluation of the Venezuelan currency, income of $5,092 due to an adjustment in tax liabilities for a change in applicable tax regulations, a gain of $108 in non-controlling interests related to the impairment of assets for a majority-owned consolidated subsidiary and a charge of $1,890 in non-controlling interests related to the disposal of assets for a majority-owned consolidated subsidiary.
Liquidity and Capital Resources
The Company's cash flow from operations can be cyclical. Operational cash flow is a key driver of liquidity, providing cash and access to capital markets. In assessing liquidity, the Company reviews working capital measurements to define areas for improvement. Management anticipates the Company will be able to satisfy cash requirements for its ongoing businesses for the foreseeable future primarily with cash generated by operations, existing cash balances and, if necessary, borrowings under its existing credit facilities.
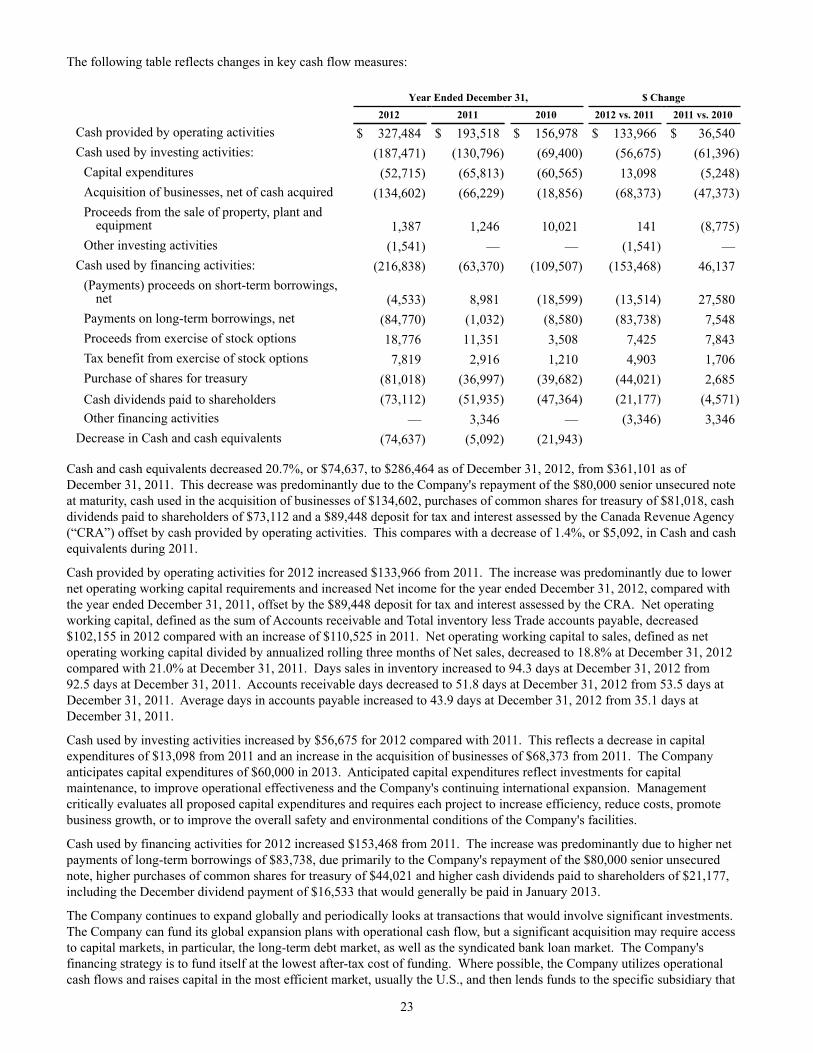
23
The following table reflects changes in key cash flow measures:
Year Ended December 31, $ Change2012 2011 2010 2012 vs. 2011 2011 vs. 2010
Cash provided by operating activities $ 327,484 $ 193,518 $ 156,978 $ 133,966 $ 36,540Cash used by investing activities: (187,471) (130,796) (69,400) (56,675) (61,396)
Capital expenditures (52,715) (65,813) (60,565) 13,098 (5,248)Acquisition of businesses, net of cash acquired (134,602) (66,229) (18,856) (68,373) (47,373)Proceeds from the sale of property, plant and
equipment 1,387 1,246 10,021 141 (8,775)Other investing activities (1,541) — — (1,541) —
Cash used by financing activities: (216,838) (63,370) (109,507) (153,468) 46,137(Payments) proceeds on short-term borrowings,
net (4,533) 8,981 (18,599) (13,514) 27,580Payments on long-term borrowings, net (84,770) (1,032) (8,580) (83,738) 7,548Proceeds from exercise of stock options 18,776 11,351 3,508 7,425 7,843Tax benefit from exercise of stock options 7,819 2,916 1,210 4,903 1,706Purchase of shares for treasury (81,018) (36,997) (39,682) (44,021) 2,685Cash dividends paid to shareholders (73,112) (51,935) (47,364) (21,177) (4,571)Other financing activities — 3,346 — (3,346) 3,346
Decrease in Cash and cash equivalents (74,637) (5,092) (21,943)
Cash and cash equivalents decreased 20.7%, or $74,637, to $286,464 as of December 31, 2012, from $361,101 as of December 31, 2011. This decrease was predominantly due to the Company's repayment of the $80,000 senior unsecured note at maturity, cash used in the acquisition of businesses of $134,602, purchases of common shares for treasury of $81,018, cash dividends paid to shareholders of $73,112 and a $89,448 deposit for tax and interest assessed by the Canada Revenue Agency (“CRA”) offset by cash provided by operating activities. This compares with a decrease of 1.4%, or $5,092, in Cash and cash equivalents during 2011.
Cash provided by operating activities for 2012 increased $133,966 from 2011. The increase was predominantly due to lower net operating working capital requirements and increased Net income for the year ended December 31, 2012, compared with the year ended December 31, 2011, offset by the $89,448 deposit for tax and interest assessed by the CRA. Net operating working capital, defined as the sum of Accounts receivable and Total inventory less Trade accounts payable, decreased $102,155 in 2012 compared with an increase of $110,525 in 2011. Net operating working capital to sales, defined as net operating working capital divided by annualized rolling three months of Net sales, decreased to 18.8% at December 31, 2012 compared with 21.0% at December 31, 2011. Days sales in inventory increased to 94.3 days at December 31, 2012 from 92.5 days at December 31, 2011. Accounts receivable days decreased to 51.8 days at December 31, 2012 from 53.5 days at December 31, 2011. Average days in accounts payable increased to 43.9 days at December 31, 2012 from 35.1 days at December 31, 2011.
Cash used by investing activities increased by $56,675 for 2012 compared with 2011. This reflects a decrease in capital expenditures of $13,098 from 2011 and an increase in the acquisition of businesses of $68,373 from 2011. The Company anticipates capital expenditures of $60,000 in 2013. Anticipated capital expenditures reflect investments for capital maintenance, to improve operational effectiveness and the Company's continuing international expansion. Management critically evaluates all proposed capital expenditures and requires each project to increase efficiency, reduce costs, promote business growth, or to improve the overall safety and environmental conditions of the Company's facilities.
Cash used by financing activities for 2012 increased $153,468 from 2011. The increase was predominantly due to higher net payments of long-term borrowings of $83,738, due primarily to the Company's repayment of the $80,000 senior unsecured note, higher purchases of common shares for treasury of $44,021 and higher cash dividends paid to shareholders of $21,177, including the December dividend payment of $16,533 that would generally be paid in January 2013.
The Company continues to expand globally and periodically looks at transactions that would involve significant investments. The Company can fund its global expansion plans with operational cash flow, but a significant acquisition may require access to capital markets, in particular, the long-term debt market, as well as the syndicated bank loan market. The Company's financing strategy is to fund itself at the lowest after-tax cost of funding. Where possible, the Company utilizes operational cash flows and raises capital in the most efficient market, usually the U.S., and then lends funds to the specific subsidiary that
24
requires funding. If additional acquisitions providing appropriate financial benefits become available, additional expenditures may be made.
The Company's debt levels decreased from $103,378 at December 31, 2011 to $20,275 at December 31, 2012. Debt to total invested capital decreased to 1.5% at December 31, 2012 from 8.0% at December 31, 2011. The decrease was predominantly due to the repayment of the Company's $80,000 senior unsecured note on March 12, 2012.
The Company paid $73,112 in cash dividends to its shareholders in the year ended December 31, 2012.
The Company has a share repurchase program for up to 30 million shares of the Company's common stock. At management's discretion, the Company repurchases its common stock from time to time in the open market, depending on market conditions, stock price and other factors. During the year ended December 31, 2012, the Company purchased 1,779,384 shares at a cost of $80,178. As of December 31, 2012, 3,342,373 shares remained available for repurchase under the stock repurchase program.
The Company made voluntary contributions to its U.S. defined benefit plans of $60,277, $30,000 and $41,500 in 2012, 2011 and 2010, respectively. The Company expects to voluntarily contribute approximately $103,000 to its U.S. plans in 2013. Based on current pension funding rules, the Company does not anticipate that contributions to the plans would be required in 2013.
As discussed in Note 12 to the consolidated financial statements, in July 2012, the Company received a Notice of Reassessment from the CRA for 2004 to 2011, which would disallow the deductibility of inter-company dividends. These adjustments would increase Canadian federal and provincial tax due by $62,120 plus approximately $17,156 of interest, net of tax. The Company disagrees with the position taken by the CRA and believes it is without merit. The Company will vigorously contest the assessment through the Tax Court of Canada. A trial date has not yet been scheduled. In connection with the litigation process, the Company is required to deposit no less than one half of the tax and interest assessed by the CRA. The Company has elected to deposit the entire amount of the dispute in order to suspend the continuing accrual of a 5% interest charge. Additionally, deposited amounts will earn interest of approximately 1% due upon a favorable outcome. A deposit was made and is recorded as a non-current asset as of December 31, 2012. Although the Company believes it will prevail on the merits of the tax position, the ultimate outcome of the assessment remains uncertain.
Rationalization and Asset Impairments
In 2012, the Company recorded rationalization and asset impairment net charges of $9,354 for the year ended December 31, 2012 resulting from rationalization activities primarily initiated in 2012. The Company initiated a number of rationalization activities in 2012 to align its business to current market conditions. The 2012 net charges include $7,512 primarily related to employee severance and other related costs, partially offset by gains from sales of assets at rationalized operations and $1,842 in asset impairment charges.
In 2011, the Company recorded rationalization and asset impairment net charges of $282 for the year ended December 31, 2011 resulting from rationalization activities primarily initiated in the third and second quarters of 2009. The Company initiated a number of rationalization activities in 2009 to align its business to current market conditions. The 2011 net charges include $259 primarily related to employee severance and other related costs and $23 in asset impairment charges.
In 2010, the Company recorded rationalization and asset impairment net gains of $384 resulting from rationalization activities primarily initiated in the third and second quarters of 2009. The 2010 net gains include $4,555 primarily related to asset disposals offset by charges of $2,417 primarily related to employee severance and other related costs, $871 related to environmental costs associated with the sale of property and $883 in asset impairment charges.
Fair values of impaired assets were determined using projected discounted cash flows.
Acquisitions
On December 31, 2012, the Company completed the acquisition of the privately-held automated systems and tooling manufacturer, Tennessee Rand, Inc. ("Tenn Rand"). Tenn Rand, based in Chattanooga, Tennessee, is a leader in the design and manufacture of tooling and robotic systems for welding applications. The acquisition added tool design, system building and machining capabilities that will enable the Company to further expand its welding automation business. Annual sales for Tenn Rand at the date of acquisition were approximately $35,000.
On November 13, 2012, the Company completed the acquisition of Kaliburn from ITT Corporation. Kaliburn, headquartered in Ladson, South Carolina, is a designer and manufacturer of shape cutting solutions, producer of shape cutting control systems and manufacturer of web tension transducers and engineered machine systems. The acquisition added to the Company's cutting business portfolio. Annual sales for Kaliburn as of the date of acquisition were approximately $36,000.
On May 17, 2012, the Company completed the acquisition of Wayne Trail. Wayne Trail, based in Ft. Loramie, Ohio, is a manufacturer of automated systems and tooling, serving a wide range of applications in the metal processing market. The
25
acquisition added to the Company’s welding and automated solutions portfolio. Annual sales for Wayne Trail at the date of acquisition were approximately $50,000.
On March 6, 2012, the Company completed the acquisition of Weartech. Weartech, based in Anaheim, California, is a producer of cobalt-based hard facing and wear-resistant welding consumables. The acquisition added to the Company’s consumables portfolio. Sales for Weartech during 2011 were approximately $40,000.
The Company acquired Tenn Rand, Kaliburn, Wayne Trail and Weartech for approximately $143,504 in cash, net of cash acquired, and assumed debt. The fair value of net assets acquired was $75,764, resulting in goodwill of $67,740. Some of the purchase price allocations are preliminary and subject to final opening balance sheet adjustments.
On July 29, 2011, the Company acquired substantially all of the assets of Techalloy. Techalloy, based in Baltimore, Maryland, was a privately-held manufacturer of nickel alloy and stainless steel welding consumables. The acquisition added to the Company's consumables portfolio. Annual sales for Techalloy at the date of acquisition were approximately $70,000.
On July 29, 2011, the Company acquired substantially all of the assets of Torchmate. Torchmate, based in Reno, Nevada, provides a wide selection of computer numeric controlled plasma cutter and oxy-fuel cutting systems. The acquisition added to the Company's plasma and oxy-fuel cutting product offering. Annual sales for Torchmate at the date of acquisition were approximately $13,000.
On March 11, 2011, the Company completed the acquisition of Severstal. Severstal is a leading manufacturer of welding consumables in Russia and was a subsidiary of OAO Severstal, one of the world's leading vertically integrated steel and mining companies. This acquisition expanded the Company's capacity and distribution channels in Russia and the Commonwealth of Independent States ("CIS"). Sales for Severstal during 2010 were approximately $40,000.
On January 31, 2011, the Company acquired substantially all of the assets of Arc Products. Arc Products was a privately-held manufacturer of orbital welding systems and welding automation components based in Southern California. Orbital welding systems are designed to automatically weld pipe and tube in difficult to access locations and for mission-critical applications requiring high weld integrity and sophisticated quality monitoring capabilities. The acquisition will complement the Company's ability to serve global customers in the nuclear, power generation and process industries worldwide. Sales for Arc Products during 2010 were not significant.
The Company acquired Techalloy, Torchmate, Severstal and Arc Products for approximately $65,321 in cash and assumed debt and a contingent consideration liability fair valued at $3,806. The contingent consideration is based upon estimated sales at the related acquisition for the five-year period ending December 31, 2015 and will be paid in 2016 based on actual sales during the five-year period. The fair value of net assets acquired was $46,837, resulting in goodwill of $22,290.
On October 29, 2010, the Company acquired all of the outstanding stock of MGM, a privately-held welding wire manufacturer based in the Orel region of Russia, for approximately $28,500 in cash and assumed debt. This acquisition represented the Company's first manufacturing operation in Russia as well as established distribution channels to serve the growing Russian and CIS welding markets. Annual sales for MGM at the date of acquisition were approximately $30,000.
Pro forma information related to these acquisitions has not been presented because the impact on the Company's Consolidated Statements of Income is not material. Acquired companies are included in the Company's consolidated financial statements as of the date of acquisition.
Debt
During March 2002, the Company issued Senior Unsecured Notes (the "Notes") totaling $150,000 with original maturities ranging from five to ten years and a weighted-average interest rate of 6.1%. The proceeds were used for general corporate purposes, including acquisitions, and were generally invested in short-term, highly liquid investments. The Company repaid the $40,000 Series A Notes in March 2007, the $30,000 Series B Notes in March 2009 and the $80,000 Series C Notes in March 2012.
The Company has no interest rate swaps outstanding at December 31, 2012.
At December 31, 2012 and 2011, the fair value of long-term debt, including the current portion, was approximately $1,919 and $84,110, respectively, which was determined using available market information and methodologies requiring judgment. Since considerable judgment is required in interpreting market information, the fair value of the debt is not necessarily the amount which could be realized in a current market exchange.
Revolving Credit Agreement
The Company has a line of credit totaling $300,000 through the Amended and Restated Credit Agreement (the “Credit Agreement”), which was entered into on July 26, 2012. The Credit Agreement contains customary affirmative, negative and financial covenants for credit facilities of this type, including limitations on the Company and its subsidiaries with respect to
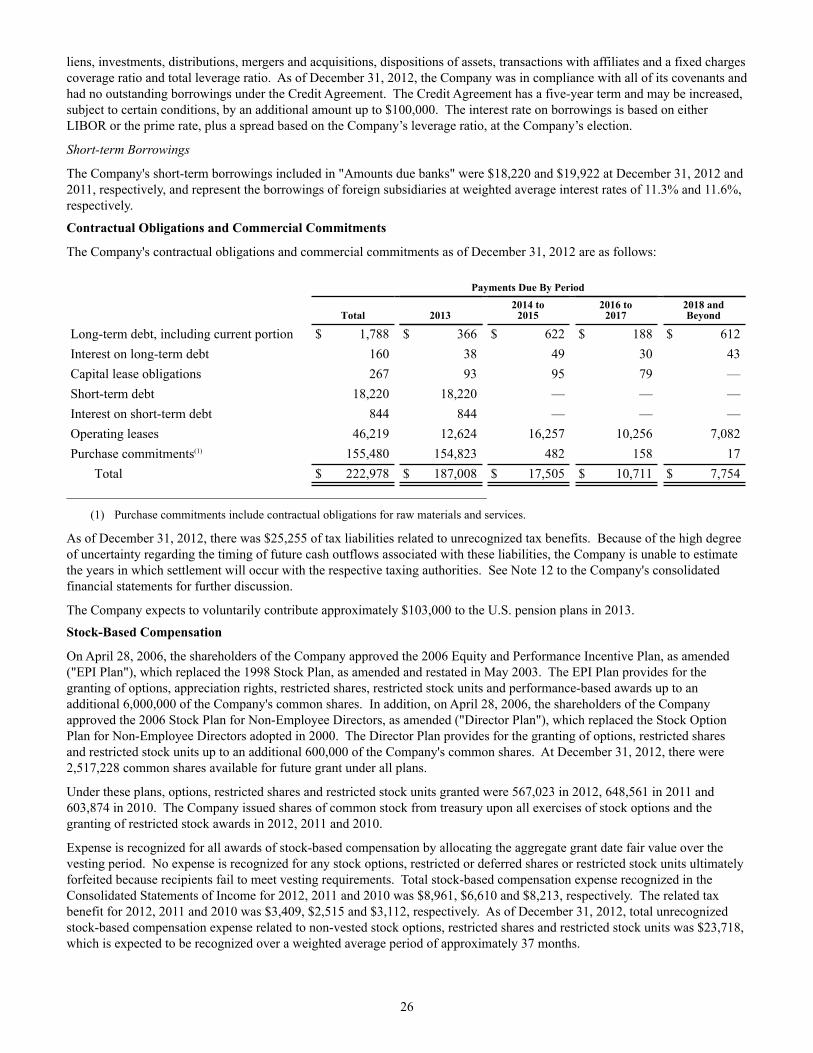
26
liens, investments, distributions, mergers and acquisitions, dispositions of assets, transactions with affiliates and a fixed charges coverage ratio and total leverage ratio. As of December 31, 2012, the Company was in compliance with all of its covenants and had no outstanding borrowings under the Credit Agreement. The Credit Agreement has a five-year term and may be increased, subject to certain conditions, by an additional amount up to $100,000. The interest rate on borrowings is based on either LIBOR or the prime rate, plus a spread based on the Company’s leverage ratio, at the Company’s election.
Short-term Borrowings
The Company's short-term borrowings included in "Amounts due banks" were $18,220 and $19,922 at December 31, 2012 and 2011, respectively, and represent the borrowings of foreign subsidiaries at weighted average interest rates of 11.3% and 11.6%, respectively.
Contractual Obligations and Commercial Commitments
The Company's contractual obligations and commercial commitments as of December 31, 2012 are as follows:
Payments Due By Period
Total 20132014 to
20152016 to
20172018 andBeyond
Long-term debt, including current portion $ 1,788 $ 366 $ 622 $ 188 $ 612Interest on long-term debt 160 38 49 30 43Capital lease obligations 267 93 95 79 —Short-term debt 18,220 18,220 — — —Interest on short-term debt 844 844 — — —Operating leases 46,219 12,624 16,257 10,256 7,082Purchase commitments(1) 155,480 154,823 482 158 17
Total $ 222,978 $ 187,008 $ 17,505 $ 10,711 $ 7,754_______________________________________________________________________________
(1) Purchase commitments include contractual obligations for raw materials and services.
As of December 31, 2012, there was $25,255 of tax liabilities related to unrecognized tax benefits. Because of the high degree of uncertainty regarding the timing of future cash outflows associated with these liabilities, the Company is unable to estimate the years in which settlement will occur with the respective taxing authorities. See Note 12 to the Company's consolidated financial statements for further discussion.
The Company expects to voluntarily contribute approximately $103,000 to the U.S. pension plans in 2013.
Stock-Based Compensation
On April 28, 2006, the shareholders of the Company approved the 2006 Equity and Performance Incentive Plan, as amended ("EPI Plan"), which replaced the 1998 Stock Plan, as amended and restated in May 2003. The EPI Plan provides for the granting of options, appreciation rights, restricted shares, restricted stock units and performance-based awards up to an additional 6,000,000 of the Company's common shares. In addition, on April 28, 2006, the shareholders of the Company approved the 2006 Stock Plan for Non-Employee Directors, as amended ("Director Plan"), which replaced the Stock Option Plan for Non-Employee Directors adopted in 2000. The Director Plan provides for the granting of options, restricted shares and restricted stock units up to an additional 600,000 of the Company's common shares. At December 31, 2012, there were 2,517,228 common shares available for future grant under all plans.
Under these plans, options, restricted shares and restricted stock units granted were 567,023 in 2012, 648,561 in 2011 and 603,874 in 2010. The Company issued shares of common stock from treasury upon all exercises of stock options and the granting of restricted stock awards in 2012, 2011 and 2010.
Expense is recognized for all awards of stock-based compensation by allocating the aggregate grant date fair value over the vesting period. No expense is recognized for any stock options, restricted or deferred shares or restricted stock units ultimately forfeited because recipients fail to meet vesting requirements. Total stock-based compensation expense recognized in the Consolidated Statements of Income for 2012, 2011 and 2010 was $8,961, $6,610 and $8,213, respectively. The related tax benefit for 2012, 2011 and 2010 was $3,409, $2,515 and $3,112, respectively. As of December 31, 2012, total unrecognized stock-based compensation expense related to non-vested stock options, restricted shares and restricted stock units was $23,718, which is expected to be recognized over a weighted average period of approximately 37 months.
27
The aggregate intrinsic value of options outstanding and exercisable which would have been received by the optionees had all awards been exercised at December 31, 2012, was $54,178 and $47,464, respectively. The total intrinsic value of awards exercised during 2012, 2011 and 2010 was $18,776, $10,028 and $4,270 respectively.
Product Liability Costs
Product liability costs have historically been significant particularly with respect to welding fume claims. Costs incurred are volatile and are largely related to trial activity. The costs associated with these claims are predominantly defense costs which are recognized in the periods incurred. Product liability costs decreased $2,922 in 2012 compared with 2011 primarily due to reduced trial activity.
The long-term impact of the welding fume loss contingency, in the aggregate, on operating results, operating cash flows and access to capital markets is difficult to assess, particularly since claims are in many different stages of development and the Company benefits significantly from cost sharing with co-defendants and insurance carriers. Moreover, the Company has been largely successful to date in its defense of these claims.
Off-Balance Sheet Arrangements
The Company utilizes letters of credit to back certain payment and performance obligations. Letters of credit are subject to limits based on amounts outstanding under the Company's Credit Agreement.
New Accounting Pronouncements
New Accounting Standards to be Adopted:
In February 2013, the Financial Accounting Standards Board ("FASB") issued Accounting Standards Update ("ASU") No. 2013-02, “Comprehensive Income (Topic 220): Reporting of Amounts Reclassified Out of Accumulated Other Comprehensive Income.” ASU 2013-02 requires an entity to provide information about the amounts reclassified out of accumulated other comprehensive income by component. In addition, an entity is required to present, either on the face of the statement where net income is presented or in the notes, significant amounts reclassified out of accumulated other comprehensive income by the respective line items of net income but only if the amount reclassified is required under U.S. GAAP to be reclassified to net income in its entirety in the same reporting period. For other amounts, an entity is required to cross-reference to other disclosures required under U.S. GAAP that provide additional detail about those amounts. The amendments are effective prospectively for reporting periods beginning after December 15, 2012. The Company is currently evaluating the impact of the adoption of ASU 2013-02 on the Company's financial statements.
In July 2012, the FASB issued ASU No. 2012-02, “Intangibles - Goodwill and Other (Topic 350): Testing Indefinite-Lived Intangible Assets for Impairment.” ASU 2012-02 permits an entity first to assess qualitative factors to determine whether it is more likely than not that an indefinite-lived intangible asset is impaired as a basis for determining whether it is necessary to perform the quantitative impairment test in accordance with Subtopic 350-30, Intangibles - Goodwill and Other - General Intangibles Other than Goodwill. The more-likely-than-not threshold is defined as having a likelihood of more than 50 percent. In accordance with this update, an entity will have an option not to calculate annually the fair value of an indefinite-lived intangible asset if the entity determines that it is not more likely than not that the asset is impaired. The amendments are effective for annual and interim impairment tests performed for fiscal years beginning after September 15, 2012. The Company is currently evaluating the impact of the adoption of ASU 2012-02 on the Company's financial statements.
In December 2011, the FASB issued ASU No. 2011-11, "Balance Sheet (Topic 210): Disclosures about Offsetting Assets and Liabilities." ASU 2011-11 requires an entity to disclose information about financial instruments and derivative instruments that are subject to offsetting, master netting or other similar arrangements, to illustrate the effect or potential effect of those arrangements on the Company's financial position. In January 2013, the FASB issued ASU No. 2013-01, “Balance Sheet (Topic 210): Clarifying the Scope of Disclosures about Offsetting Assets and Liabilities,” which clarifies the scope of ASU 2011-11. The amendments are effective for annual periods beginning on or after January 1, 2013 and interim periods within those annual periods. The amendments should be applied retrospectively for all prior periods presented. The Company is currently evaluating the impact of the adoption of ASU 2011-11 on the Company's financial statements.
Critical Accounting Policies
The Company's consolidated financial statements are based on the selection and application of significant accounting policies, which require management to make estimates and assumptions. These estimates and assumptions are reviewed periodically by management and compared to historical trends to determine the accuracy of estimates and assumptions used. If warranted, these estimates and assumptions may be changed as current trends are assessed and updated. Historically, the Company's estimates have been determined to be reasonable. No material changes to the Company's accounting policies were made during 2012. The Company believes the following are some of the more critical judgment areas in the application of its accounting policies that affect its financial condition and results of operations.
28
Legal and Tax Contingencies
The Company, like other manufacturers, is subject from time to time to a variety of civil and administrative proceedings arising in the ordinary course of business. Such claims and litigation include, without limitation, product liability claims and health, safety and environmental claims, some of which relate to cases alleging asbestos induced illnesses. The costs associated with these claims are predominantly defense costs, which are recognized in the periods incurred. Insurance reimbursements mitigate these costs and, where reimbursements are probable, they are recognized in the applicable period. With respect to costs other than defense costs (i.e., for liability and/or settlement or other resolution), reserves are recorded when it is probable that the contingencies will have an unfavorable outcome. The Company accrues its best estimate of the probable costs, after a review of the facts with management and counsel and taking into account past experience. If an unfavorable outcome is determined to be reasonably possible but not probable, or if the amount of loss cannot be reasonably estimated, disclosure is provided for material claims or litigation. Many of the current cases are in differing procedural stages and information on the circumstances of each claimant, which forms the basis for judgments as to the validity or ultimate disposition of such actions, varies greatly. Therefore, in many situations a range of possible losses cannot be made. Reserves are adjusted as facts and circumstances change and related management assessments of the underlying merits and the likelihood of outcomes change. Moreover, reserves only cover identified and/or asserted claims. Future claims could, therefore, give rise to increases to such reserves.
The Company is subject to taxation from U.S. federal, state, municipal and international jurisdictions. The calculation of current income tax expense is based on the best information available and involves significant management judgment. The actual income tax liability for each jurisdiction in any year can in some instances be ultimately determined several years after the financial statements are published.
The Company maintains reserves for estimated income tax exposures for many jurisdictions. Exposures are settled primarily through the completion of audits within each individual tax jurisdiction or the closing of a statute of limitation. Exposures can also be affected by changes in applicable tax law or other factors, which may cause management to believe a revision of past estimates is appropriate. Management believes that an appropriate liability has been established for income tax exposures; however, actual results may materially differ from these estimates. See Note 12 to the Company's consolidated financial statements and "Item 3. Legal Proceedings" section of this Annual Report on Form 10-K for further discussion of tax contingencies.
Translation of Foreign Currencies
Asset and liability accounts are translated into U.S. dollars using exchange rates in effect at the dates of the Consolidated Balance Sheets; revenue and expense accounts are translated at average monthly exchange rates. Translation adjustments are reflected as a component of Total equity. For subsidiaries operating in highly inflationary economies, both historical and current exchange rates are used in translating balance sheet accounts, and translation adjustments are included in Net income.
Foreign currency transaction losses are included in "Selling, general & administrative expenses" and were $4,608, $4,904 and $118 in 2012, 2011 and 2010, respectively.
Venezuela – Highly Inflationary Economy
Venezuela is a highly inflationary economy under U.S. GAAP. As a result, the financial statements of the Company's Venezuelan operation are reported under highly inflationary accounting rules as of January 1, 2010. Under highly inflationary accounting, the financial statements of the Company's Venezuelan operation have been remeasured into the Company's reporting currency and exchange gains and losses from the re-measurement of monetary assets and liabilities are reflected in current earnings. In remeasuring the financial statements, the official exchange rate for non-essential goods of 4.3 (the "Non-Essential Rate") is used as this is the rate expected to be applicable to dividend repatriations.
Future impacts to earnings of applying highly inflationary accounting for Venezuela on the Company's consolidated financial statements will be dependent upon movements in the applicable exchange rates between the bolivar and the U.S. dollar and the amount of monetary assets and liabilities included in the Company's Venezuelan operation's balance sheet. The bolivar-denominated monetary net asset position was $31,545 at December 31, 2012 and $6,826 at December 31, 2011. The increased exposure was due to the limited opportunities to convert bolivars into U.S. dollars.
The Company's ability to effectively manage sales and profit levels in Venezuela will be impacted by several factors. These include, but are not limited to, the Company's ability to mitigate the effect of any potential devaluation and Venezuelan government price exchange controls. If in the future the Company were to convert bolivars at a rate other than the official exchange rate or the official exchange rate is revised, the Company may realize a loss to earnings.
In 2010, the Company participated in Venezuelan sovereign debt offerings as a means of converting bolivars to U.S. dollars. The conversion of bolivars to U.S. dollars through Venezuelan sovereign debt offerings generated foreign currency transaction losses as the debt was purchased at the Non-Essential Rate and subsequently sold at a discount. During 2010, the Company acquired $7,672 of Venezuelan sovereign debt at the Non-Essential Rate, which was immediately sold at a discount for $6,022.
29
The sale of the Venezuelan sovereign debt resulted in a loss of $1,650 recognized in Selling, general & administrative expenses. In 2012 and 2011, the Company was not successful in utilizing this vehicle as a means of converting bolivars to U.S. dollars.
The devaluation of the bolivar and the change to the U.S. dollar as the functional currency resulted in a foreign currency transaction gain of $2,632 in "Selling, general & administrative expenses" and higher "Cost of goods sold" of $5,755 due to the liquidation of inventory valued at the historical exchange rate for the year ended December 31, 2010.
On February 8, 2013, the Venezuelan government announced the devaluation of its currency relative to the U.S. dollar. The Non-Essential Rate moved from 4.3 to 6.3 bolivars to one U.S. dollar. The devaluation of the bolivar is expected to result in a foreign currency transaction charge of approximately $8,500 in Selling, general & administrative expenses. This charge will be recognized during the first quarter of 2013. The impact of selling inventories carried at the previous exchange rate is expected to decrease gross profit by approximately $4,000 in 2013. These charges will be recognized during the first half of 2013. The Company also expects that its Venezuelan subsidiary's results of operations will decrease significantly in 2013 due to the new exchange rate.
Deferred Income Taxes
Deferred income taxes are recognized at currently enacted tax rates for temporary differences between the financial reporting and income tax bases of assets and liabilities and operating loss and tax credit carry-forwards. The Company does not provide deferred income taxes on unremitted earnings of certain non-U.S. subsidiaries, which are deemed permanently reinvested. It is not practicable to calculate the deferred taxes associated with the remittance of these earnings. Deferred income taxes associated with earnings of $3,776 that are not expected to be permanently reinvested were not significant. At December 31, 2012, the Company had approximately $170,175 of gross deferred tax assets related to deductible temporary differences and tax loss and credit carry-forwards which may reduce taxable income in future years.
In assessing the realizability of deferred tax assets, the Company assesses whether it is more likely than not that a portion or all of the deferred tax assets will not be realized. The Company considers the scheduled reversal of deferred tax liabilities, tax planning strategies, and projected future taxable income in making this assessment. At December 31, 2012, a valuation allowance of $38,799 was recorded against these deferred tax assets based on this assessment. The Company believes it is more likely than not that the tax benefit of the remaining net deferred tax assets will be realized. The amount of net deferred tax assets considered realizable could be increased or reduced in the future if the Company's assessment of future taxable income or tax planning strategies changes.
Pensions
The Company maintains a number of defined benefit and defined contribution plans to provide retirement benefits for employees. These plans are maintained and contributions are made in accordance with the Employee Retirement Income Security Act of 1974 ("ERISA"), local statutory law or as determined by the Board of Directors. The plans generally provide benefits based upon years of service and compensation. Pension plans are funded except for a domestic non-qualified pension plan for certain key employees and certain foreign plans.
A substantial portion of the Company's pension amounts relates to its defined benefit plan in the United States. The fair value of plan assets is determined at December 31 of each year.
A significant element in determining the Company's pension expense is the expected return on plan assets. At the end of each year, the expected return on plan assets is determined based on the weighted average expected return of the various asset classes in the plan's portfolio and the targeted allocation of plan assets. The asset class return is developed using historical asset return performance as well as current market conditions such as inflation, interest rates and equity market performance. The Company determined this rate to be 7.7% and 7.9% at December 31, 2012 and 2011, respectively. The assumed long-term rate of return on assets is applied to the market value of plan assets. This produces the expected return on plan assets included in pension expense. The difference between this expected return and the actual return on plan assets is deferred and amortized over the average remaining service period of active employees expected to receive benefits under the plan. The amortization of the net deferral of past losses will increase future pension expense. During 2012, investment returns were 11.1% compared with a return of 4.1% in 2011. A 25 basis point change in the expected return on plan assets would increase or decrease pension expense by approximately $1,800.
Another significant element in determining the Company's pension expense is the discount rate for plan liabilities. To develop the discount rate assumption to be used, the Company refers to the yield derived from matching projected pension payments with maturities of a portfolio of available non-callable bonds rated AA- or better. The Company determined this rate to be 3.8% at December 31, 2012 and 4.2% at December 31, 2011. A 10 basis point change in the discount rate would increase or decrease pension expense by approximately $1,100.
Pension expense relating to the Company's defined benefit plans was $36,258, $26,370 and $29,123 in 2012, 2011 and 2010, respectively. The Company expects 2013 defined benefit pension expense to increase by approximately $200 to $500.
30
The Accumulated other comprehensive loss, excluding tax effects, recognized on the Consolidated Balance Sheet was $417,967 as of December 31, 2012 and $408,000 as of December 31, 2011. The increase is primarily the result of an increase in actuarial losses. Actuarial losses arising during 2012 are primarily attributable to a lower discount rate.
The Company made voluntary contributions to its U.S. defined benefit plans of $60,277, $30,000 and $41,500 in 2012, 2011 and 2010, respectively. The Company expects to voluntarily contribute $103,000 to its U.S. plans in 2013. Based on current pension funding rules, the Company does not anticipate that contributions to the plans would be required in 2013.
Inventories
Inventories are valued at the lower of cost or market. Fixed manufacturing overhead costs are allocated to inventory based on normal production capacity and abnormal manufacturing costs are recognized as period costs. For most domestic inventories, cost is determined principally by the last-in, first-out ("LIFO") method, and for non-U.S. inventories, cost is determined by the first-in, first-out ("FIFO") method. The valuation of LIFO inventories is made at the end of each year based on inventory levels and costs at that time. Accordingly, interim LIFO calculations are based on management's estimates of expected year-end inventory levels and costs. Actual year-end costs and inventory levels may differ from interim LIFO inventory valuations. The excess of current cost over LIFO cost was $72,173 at December 31, 2012 and $78,292 at December 31, 2011.
The Company reviews the net realizable value of inventory on an on-going basis, with consideration given to deterioration, obsolescence and other factors. If actual market conditions differ from those projected by management, and the Company's estimates prove to be inaccurate, write-downs of inventory values and adjustments to Cost of goods sold may be required. Historically, the Company's reserves have approximated actual experience.
Accounts Receivable
The Company maintains an allowance for doubtful accounts for estimated losses from the failure of its customers to make required payments for products delivered. The Company estimates this allowance based on the age of the related receivable, knowledge of the financial condition of customers, review of historical receivables and reserve trends and other pertinent information. If the financial condition of customers deteriorates or an unfavorable trend in receivable collections is experienced in the future, additional allowances may be required. Historically, the Company's reserves have approximated actual experience.
Long-Lived Assets
The Company periodically evaluates whether current facts or circumstances indicate that the carrying value of its depreciable long-lived assets to be held and used may not be recoverable. If such circumstances are determined to exist, an estimate of undiscounted future cash flows produced by the long-lived asset, or the appropriate grouping of assets, is compared to the carrying value to determine whether impairment exists. If an asset is determined to be impaired, a loss is recognized to the extent that carrying value exceeds fair value. Fair value is measured based on quoted market prices in active markets, if available. If quoted market prices are not available, the estimate of fair value is based on various valuation techniques, including the discounted value of estimated future cash flows.
Goodwill and Intangibles
The Company performs an annual impairment test of goodwill and indefinite-lived intangible assets in the fourth quarter using the same dates each year or more frequently if changes in circumstances or the occurrence of events indicate potential impairment. The fair value of each indefinite-lived intangible asset is compared to its carrying value and an impairment charge is recorded if the carrying value exceeds the fair value. Goodwill is tested by comparing the fair value of each reporting unit with its carrying value. If the carrying value of the reporting unit exceeds its fair value, the implied value of goodwill is compared to its carrying value and impairment is recognized to the extent that the carrying value exceeds the implied fair value.
Fair values are determined using established business valuation multiples and models developed by the Company that incorporate allocations of certain assets and cash flows among reporting units, estimates of market participant assumptions of future cash flows, future growth rates and the applicable discount rates to value estimated cash flows. Changes in economic and operating conditions impacting these assumptions could result in asset impairments in future periods.
The fair value of goodwill for all of the Company's operating business units exceeded its carrying value by at least 10% as of the testing date during the fourth quarter of 2012. Key assumptions in estimating the reporting unit's fair value include assumed market participant assumptions of revenue growth, operating margins and the rate used to discount future cash flows. Actual revenue growth and operating margins below the assumed market participant assumptions or an increase in the discount rate would have a negative impact on the fair value of the reporting unit that could result in a goodwill impairment charge in a future period.
31
Stock-Based Compensation
The Company utilizes the Black-Scholes option pricing model for estimating fair values of options. The Black-Scholes model requires assumptions regarding the volatility of the Company's stock, the expected life of the stock award and the Company's dividend yield. The Company utilizes historical data in determining these assumptions. An increase or decrease in the assumptions or economic events outside of management's control could have a direct impact on the Black-Scholes model.
ITEM 7A. QUANTITATIVE AND QUALITATIVE DISCLOSURES ABOUT MARKET RISK
The Company's primary financial market risks include fluctuations in currency exchange rates, commodity prices and interest rates. The Company manages these risks by using derivative financial instruments in accordance with established policies and procedures. The Company does not enter into derivatives or other financial instruments for trading or speculative purposes.
Included below is a sensitivity analysis based upon a hypothetical 10% weakening or strengthening in the U.S. dollar compared to foreign currency exchange rates at December 31, 2012, a 10% change in commodity prices, and a 100 basis point increase in effective interest rates under the Company's current borrowing arrangements. The contractual derivative and borrowing arrangements in effect at December 31, 2012 were compared to the hypothetical foreign exchange, commodity price, or interest rates in the sensitivity analysis to determine the effect on income before taxes, interest expense, or accumulated other comprehensive loss. The analysis takes into consideration any offset that would result from changes in the value of the hedged asset or liability.
Foreign Currency Exchange Risk
The Company enters into forward foreign exchange contracts principally to hedge the currency fluctuations in transactions denominated in foreign currencies, thereby limiting the Company's risk that would otherwise result from changes in exchange rates. At December 31, 2012, the Company hedged certain third-party and inter-company purchases and sales. At December 31, 2012, the Company had foreign exchange contracts with a notional value of approximately $39,597. At December 31, 2012, a hypothetical 10% weakening of the U.S. dollar would not materially affect the Company's financial statements.
Commodity Price Risk
From time to time, the Company uses various hedging arrangements to manage exposures to price risk from commodity purchases. These hedging arrangements have the effect of locking in for specified periods the prices the Company will pay for the volume to which the hedge relates. A hypothetical 10% adverse change in commodity prices on the Company's open commodity futures at December 31, 2012 would not materially affect the Company's financial statements.
Interest Rate Risk
As of December 31, 2012, the Company had no interest rate swaps outstanding. Additionally, the Company had no outstanding borrowings under the Credit Agreement, therefore an interest rate increase would have no effect on interest expense.
The fair value of the Company's Cash and cash equivalents at December 31, 2012 approximated carrying value. The Company's financial instruments are subject to concentrations of credit risk. The Company has minimized this risk by entering into investments with a number of major banks and financial institutions and investing in high-quality instruments. The Company does not expect any counter-parties to fail to meet their obligations.
ITEM 8. FINANCIAL STATEMENTS AND SUPPLEMENTARY DATA
The response to this item is submitted in a separate section of this Annual Report on Form 10-K following the signature page.
ITEM 9. CHANGES IN AND DISAGREEMENTS WITH ACCOUNTANTS ON ACCOUNTING AND FINANCIAL DISCLOSURES
None.
ITEM 9A. CONTROLS AND PROCEDURES
Conclusion Regarding the Effectiveness of Disclosure Controls and Procedures
Under the supervision and with the participation of management, including the Chief Executive Officer and Chief Financial Officer, the Company conducted an evaluation of disclosure controls and procedures, as such term is defined in Rule 13a-15(e) of the Exchange Act. Based on this evaluation, the Chief Executive Officer and Chief Financial Officer concluded that the Company's disclosure controls and procedures were effective as of the end of the period covered by this Annual Report on Form 10-K.
32
Management's Report on Internal Control Over Financial Reporting
The Company's management is responsible for establishing and maintaining adequate internal control over financial reporting, as such term is defined in Exchange Act Rule 13a-15(f). Under the supervision and with the participation of the Company's management, including the Chief Executive Officer and Chief Financial Officer, the Company conducted an evaluation of the effectiveness of internal control over financial reporting as of December 31, 2012 based on the framework in "Internal Control – Integrated Framework" issued by the Committee of Sponsoring Organizations of the Treadway Commission. Based on the Company's evaluation under such framework, management concluded that the Company's internal control over financial reporting was effective as of December 31, 2012.
The effectiveness of the Company's internal control over financial reporting as of December 31, 2012 has been audited by Ernst & Young LLP, an independent registered public accounting firm, as stated in their report, which is included elsewhere in this Annual Report on Form 10-K and is incorporated herein by reference.
Changes in Internal Control Over Financial Reporting
There have been no changes in the Company's internal control over financial reporting that occurred during the fourth quarter of 2012 that materially affected, or are reasonably likely to materially affect, the Company's internal control over financial reporting.
ITEM 9B. OTHER INFORMATION
None.
33
PART III
ITEM 10. DIRECTORS, EXECUTIVE OFFICERS AND CORPORATE GOVERNANCE
The Company is expected to file its 2013 proxy statement pursuant to Regulation 14A of the Exchange Act prior to April 30, 2013.
Except for the information set forth within Part I, Item 1C section of this Annual Report on Form 10-K concerning our Executive Officers, the information required by this item is incorporated by reference from the 2013 proxy statement.
ITEM 11. EXECUTIVE COMPENSATION
The information required by this item is incorporated by reference from the 2013 proxy statement.
ITEM 12. SECURITY OWNERSHIP OF CERTAIN BENEFICIAL OWNERS AND MANAGEMENT AND RELATED STOCKHOLDER MATTERS
The information required by this item is incorporated by reference from the 2013 proxy statement.
For further information on the Company's equity compensation plans, see Note 1 and Note 9 to the Company's consolidated financial statements.
ITEM 13. CERTAIN RELATIONSHIPS AND RELATED TRANSACTIONS, AND DIRECTOR INDEPENDENCE
The information required by this item is incorporated by reference from the 2013 proxy statement.
ITEM 14. PRINCIPAL ACCOUNTANT FEES AND SERVICES
The information required by this item is incorporated by reference from the 2013 proxy statement.
PART IV
ITEM 15. EXHIBITS AND FINANCIAL STATEMENT SCHEDULES
(a)(1) Financial Statements
The following consolidated financial statements of the Company are included in a separate section of this report following the signature page and certifications:
Report of Independent Registered Public Accounting Firm
Report of Independent Registered Public Accounting Firm on Internal Control Over Financial Reporting
Consolidated Balance Sheets – December 31, 2012 and 2011
Consolidated Statements of Income – Years ended December 31, 2012, 2011 and 2010
Consolidated Statements of Comprehensive Income – Years ended December 31, 2012, 2011 and 2010
Consolidated Statements of Equity – Years ended December 31, 2012, 2011 and 2010
Consolidated Statements of Cash Flows – Years ended December 31, 2012, 2011 and 2010
Notes to Consolidated Financial Statements
(a)(2) Financial Statement Schedules
The following consolidated financial statement schedule of the Company is included in a separate section of this report following the signature page:
Schedule II – Valuation and Qualifying Accounts
All other schedules for which provision is made in the applicable accounting regulation of the Securities and Exchange Commission are not required under the related instructions or are inapplicable, and therefore, have been omitted.
34
(a)(3) Exhibits
Exhibit No. Description
3.1 Amended and Restated Articles of Incorporation of Lincoln Electric Holdings, Inc. (filed as Exhibit 3.1 toForm 8-K of Lincoln Electric Holdings, Inc. filed on September 27, 2011, SEC file No. 0-1402 andincorporated herein by reference and made a part hereof).
3.2 Amended and Restated Code of Regulations of Lincoln Electric Holdings, Inc. (as Amended on November 3,2009) (filed as Exhibit 3.2 to Form 10-Q of Lincoln Electric Holdings, Inc. for the three months endedSeptember 30, 2009, SEC File No. 0-1402 and incorporated herein by reference and made a part hereof).
10.1 Amended and Restated Credit Agreement, dated as of July 26, 2012, by and among Lincoln Electric Holdings, Inc., The Lincoln Electric Company, Lincoln Electric International Holding Company, J.W. Harris Co., Inc., Techalloy, Inc., Wayne Trail Technologies, Inc., Lincoln Global, Inc., the Lenders and KeyBank National Association, as Letter of Credit Issuer and Administrative Agent (filed as Exhibit 10.1 to Form 8-K of Lincoln Electric Holdings, Inc. filed on July 31, 2012, SEC File No. 0-1402 and incorporated herein by reference and made a part hereof).
10.2* 1998 Stock Plan (Amended, Restated and Renamed as of May 1, 2003) (filed as Appendix B to the LincolnElectric Holdings, Inc. proxy statement dated March 31, 2003, SEC File No. 0-1402 and incorporated herein byreference and made a part hereof).
10.3* Amendment No. 1 to the 1998 Stock Plan (Amended, Restated and Renamed Effective May 1, 2003) datedOctober 20, 2006 (filed as Exhibit 10.6 to Form 10-K of Lincoln Electric Holdings, Inc. for the year endedDecember 31, 2007, SEC File No. 0-1402 and incorporated herein by reference and made a part hereof).
10.4* 1988 Incentive Equity Plan (filed as Exhibit 28 to the Form S-8 Registration Statement of The Lincoln ElectricCompany, SEC File No. 33-25209 and incorporated herein by reference and made a part hereof) as adopted andamended by Lincoln Electric Holdings, Inc. pursuant to an Instrument of Adoption and Amendment datedDecember 29, 1998 (filed as Exhibit 10(d) to Form 10-K of Lincoln Electric Holdings, Inc. for the year endedDecember 31, 1998, SEC File No. 0-1402 and incorporated herein by reference and made a part hereof).
10.5* Amendment No. 2 to the 1988 Incentive Equity Plan dated October 20, 2006 (filed as Exhibit 10.8 to Form 10-K of Lincoln Electric Holdings, Inc. for the year ended December 31, 2007, SEC File No. 0-1402 andincorporated herein by reference and made a part hereof).
10.6* Supplemental Executive Retirement Plan (Amended and Restated as of December 31, 2008) (filed asExhibit 10.1 to Form 8-K of Lincoln Electric Holdings, Inc. filed on January 7, 2009, SEC File No. 0-1402 andincorporated herein by reference and made part hereof).
10.7* Deferred Compensation Plan for Certain Retention Agreements and Other Contractual Arrangements(Amended and Restated as of January 1, 2004) (filed as Exhibit 10(i) to Form 10-K of Lincoln ElectricHoldings, Inc. for the year ended December 31, 2003, SEC File No. 0-1402 and incorporated herein byreference and made a part hereof).
10.8* Non-Employee Directors' Deferred Compensation Plan (Amended and Restated as of December 31, 2008)(filed as Exhibit 10.3 to Form 8-K of Lincoln Electric Holdings, Inc. filed on January 7, 2009, SEC FileNo. 0-1402 and incorporated herein by reference and made a part hereof).
10.9* 2005 Deferred Compensation Plan for Executives (Amended and Restated as of August 1, 2011) (filed asExhibit 10.1 to Form 8-K of Lincoln Electric Holdings, Inc. filed on August 4, 2011, SEC File No. 0-1402 andincorporated herein by reference and made a part hereof).
10.10* Description of Management Incentive Plan (filed as Exhibit 10(e) to Form 10-K of The Lincoln ElectricCompany for the year ended December 31, 1995, SEC File No. 0-1402 and incorporated herein by referenceand made a part hereof).
10.11* Description of Long-Term Performance Plan (filed as Exhibit 10(f) to Form 10-K of The Lincoln ElectricCompany for the year ended December 31, 1997, SEC File No. 0-1402 and incorporated herein by referenceand made a part hereof).
10.12* Form of Severance Agreement (as entered into by the Company and the following executive officers:Messrs. Stropki, Mapes, Petrella, Stueber, LeBlanc and Blankenship) (filed as Exhibit 10.1 to Form 10-Q ofLincoln Electric Holdings, Inc. for the three months ended June 30, 2009, SEC File No. 0-1402 andincorporated herein by reference and made a part hereof).
10.13* Stock Option Plan for Non-Employee Directors (filed as Exhibit 10(p) to Form 10-Q of Lincoln ElectricHoldings, Inc. for the three months ended March 31, 2000, SEC File No. 0-1402 and incorporated herein byreference and made a part hereof).
10.14* Amendment No. 1 to the Stock Option Plan for Non-Employee Directors dated October 20, 2006 (filed asExhibit 10.26 to Form 10-K of Lincoln Electric Holdings, Inc. for the year ended December 31, 2007, SEC FileNo. 0-1402 and incorporated herein by reference and made a part hereof).
10.15* Summary of Cash Long-Term Incentive Plan, as amended (filed as Exhibit 10.1 to Form 8-K of LincolnElectric Holdings, Inc. filed on April 6, 2005, SEC File No. 0-1402 and incorporated herein by reference andmade a part hereof).
35
10.16* Letter Agreement between John M. Stropki, Jr. and Lincoln Electric Holdings, Inc. dated October 12, 2004(filed as Exhibit 10.1 to Form 8-K of Lincoln Electric Holdings, Inc. filed on October 18, 2004, SEC FileNo. 0-1402 and incorporated herein by reference and made a part hereof).
10.17* 2006 Equity and Performance Incentive Plan (Restated as of March 3, 2011) (filed as Annex A to the Lincoln Electric Holdings, Inc. proxy statement dated March 18, 2011, SEC File No. 0-1402 and incorporated herein by reference and made a part hereof).
10.18* 2006 Stock Plan for Non-Employee Directors (filed as Appendix C to the Lincoln Electric Holdings, Inc. proxystatement dated March 28, 2006, SEC File No. 0-1402 and incorporated herein by reference and made a parthereof).
10.19* Amendment No. 1 to the 2006 Stock Plan for Non-Employee Directors dated October 20, 2006 (filed asExhibit 10.2 to Form 10-Q of Lincoln Electric Holdings, Inc. for the three months ended March 31, 2007, SECfile No. 0-1402 and incorporated herein by reference and made a part hereof).
10.20* Amendment No. 2 to the 2006 Stock Plan for Non-Employee Directors dated July 26, 2007 (filed asExhibit 10.1 to Form 10-Q of Lincoln Electric Holdings, Inc. for the three months ended September 30, 2007,SEC file No. 0-1402 and incorporated herein by reference and made a part hereof).
10.21* 2007 Management Incentive Compensation Plan (Amended and Restated as of December 31, 2008) (filed asExhibit 10.4 to Form 8-K of Lincoln Electric Holdings, Inc. filed on January 7, 2009, SEC File No. 0-1402 andincorporated herein by reference and made a part hereof).
10.22* Form of Restricted Shares Agreement for Non-Employee Directors (filed as Exhibit 10.1 to Form 10-Q ofLincoln Electric Holdings, Inc. for the three months ended September 30, 2010, SEC File No. 0-1402 andincorporated herein by reference and made a part hereof).
10.23* Form of Restricted Shares Agreement for Executive Officers (filed as Exhibit 10.2 to Form 10-Q of LincolnElectric Holdings, Inc. for the three months ended September 30, 2010, SEC File No. 0-1402 and incorporatedherein by reference and made a part hereof).
10.24* Form of Stock Option Agreement for Non-Employee Directors (filed as Exhibit 10.3 to Form 10-Q of LincolnElectric Holdings, Inc. for the three months ended September 30, 2010, SEC File No. 0-1402 and incorporatedherein by reference and made a part hereof).
10.25* Form of Stock Option Agreement for Executive Officers (filed as Exhibit 10.4 to Form 10-Q of LincolnElectric Holdings, Inc. for the three months ended September 30, 2010, SEC File No. 0-1402 and incorporatedherein by reference and made a part hereof).
10.26* Form of Restricted Shares Agreement for Non-Employee Directors (for awards made on or after December 1,2010) (filed as Exhibit 10.35 to Form 10-K of the Lincoln Electric Holdings, Inc. for the year endedDecember 31, 2010, SEC File No. 0-1402 and incorporated herein by reference and made a part hereof).
10.27* Form of Restricted Shares Agreement for Executive Officers (for awards made on or after December 1, 2010)(filed as Exhibit 10.36 to Form 10-K of the Lincoln Electric Holdings, Inc. for the year ended December 31,2010, SEC File No. 0-1402 and incorporated herein by reference and made a part hereof).
10.28* Form of Stock Option Agreement for Executive Officers (for awards made on or after December 1, 2010) (filedas Exhibit 10.37 to Form 10-K of the Lincoln Electric Holdings, Inc. for the year ended December 31, 2010,SEC File No. 0-1402 and incorporated herein by reference and made a part hereof).
10.29* Form of Restricted Stock Unit Agreement for Executive Officers (filed as Exhibit 10.2 to Form 8-K of LincolnElectric Holdings, Inc. filed on August 4, 2011, SEC File No. 0-1402 and incorporated herein by reference andmade a part thereof).
10.30* Form of Officer Indemnification Agreement (effective February 23, 2012) (filed as Exhibit 10.1 to Form 8-K of Lincoln Electric Holdings, Inc. filed on February 29, 2012, SEC File No. 0-1402 and incorporated herein by reference and made a part hereof).
10.31* Form of Director Indemnification Agreement (effective February 23, 2012) (filed as Exhibit 10.1 to Form 8-K of Lincoln Electric Holdings, Inc. filed on February 29, 2012, SEC File No. 0-1402 and incorporated herein by reference and made a part hereof).
21 Subsidiaries of the Registrant.23 Consent of Independent Registered Public Accounting Firm.24 Powers of Attorney.
31.1 Certification by the President and Chief Executive Officer pursuant to Rule 13a-14(a) of the SecuritiesExchange Act of 1934.
31.2 Certification by the Senior Vice President, Chief Financial Officer and Treasurer pursuant to Rule 13a-14(a) ofthe Securities Exchange Act of 1934.
32.1 Certifications pursuant to 18 U.S.C. Section 1350, as adopted pursuant to Section 906 of the Sarbanes-OxleyAct of 2002.
101.INS XBRL Instance Document
36
101.SCH XBRL Taxonomy Extension Schema Document101.CAL XBRL Taxonomy Extension Calculation Linkbase Document101.LAB XBRL Taxonomy Extension Label Linkbase Document101.PRE XBRL Taxonomy Extension Presentation Linkbase Document101.DEF XBRL Taxonomy Extension Definition Linkbase Document
* Reflects management contract or other compensatory arrangement required to be filed as an exhibit pursuant to Item 15(b) of this report.

37
SIGNATURES
Pursuant to the requirements of Section 13 or 15(d) of the Securities Exchange Act of 1934, the registrant has duly caused this report to be signed on its behalf by the undersigned, thereunto duly authorized.
LINCOLN ELECTRIC HOLDINGS, INC. By: /s/ VINCENT K. PETRELLA
Vincent K. PetrellaSenior Vice President, Chief FinancialOfficer and Treasurer(principal financial and accounting officer)February 22, 2013
38
Pursuant to the requirements of the Securities Exchange Act of 1934, this report has been signed below by the following persons on behalf of the registrant and in the capacities and on the dates indicated.
/s/ CHRISTOPHER L. MAPES /s/ VINCENT K. PETRELLAChristopher L. Mapes, President and Chief Executive Officer (principal executive officer)February 22, 2013
Vincent K. Petrella,Senior Vice President, Chief Financial Officer andTreasurer (principal financial and accounting officer)February 22, 2013
/s/ JOHN M. STROPKI, JR. /s/ VINCENT K. PETRELLAJohn M. Stropki, Jr., Executive Chairman of the BoardFebruary 22, 2013
Vincent K. Petrella asAttorney-in-Fact forHarold L. Adams, DirectorFebruary 22, 2013
/s/ VINCENT K. PETRELLA /s/ VINCENT K. PETRELLAVincent K. Petrella asAttorney-in-Fact forCurtis E. EspelandFebruary 22, 2013
Vincent K. Petrella asAttorney-in-Fact forDavid H. Gunning, DirectorFebruary 22, 2013
/s/ VINCENT K. PETRELLA /s/ VINCENT K. PETRELLAVincent K. Petrella asAttorney-in-Fact forStephen G. Hanks, DirectorFebruary 22, 2013
Vincent K. Petrella asAttorney-in-Fact forRobert J. Knoll, DirectorFebruary 22, 2013
/s/ VINCENT K. PETRELLA /s/ VINCENT K. PETRELLAVincent K. Petrella asAttorney-in-Fact forG. Russell Lincoln, DirectorFebruary 22, 2013
Vincent K. Petrella asAttorney-in-Fact forKathryn Jo Lincoln, DirectorFebruary 22, 2013
/s/ VINCENT K. PETRELLA /s/ VINCENT K. PETRELLAVincent K. Petrella asAttorney-in-Fact forWilliam E. MacDonald, III, DirectorFebruary 22, 2013
Vincent K. Petrella asAttorney-in-Fact forHellene S. Runtagh, DirectorFebruary 22, 2013
/s/ VINCENT K. PETRELLAVincent K. Petrella asAttorney-in-Fact forGeorge H. Walls, Jr., DirectorFebruary 22, 2013
F-1
Report of Independent Registered Public Accounting Firm
The Board of Directors and Shareholders of Lincoln Electric Holdings, Inc.
We have audited the accompanying consolidated balance sheets of Lincoln Electric Holdings, Inc. and subsidiaries as of December 31, 2012 and 2011, and the related consolidated statements of income, comprehensive income, equity, and cash flows for each of the three years in the period ended December 31, 2012. Our audits also included the financial statement schedule listed in the Index as Item 15 (a) (2). These financial statements and schedule are the responsibility of the Company's management. Our responsibility is to express an opinion on these financial statements and schedule based on our audits.
We conducted our audits in accordance with the standards of the Public Company Accounting Oversight Board (United States). Those standards require that we plan and perform the audit to obtain reasonable assurance about whether the financial statements are free of material misstatement. An audit includes examining, on a test basis, evidence supporting the amounts and disclosures in the financial statements. An audit also includes assessing the accounting principles used and significant estimates made by management, as well as evaluating the overall financial statement presentation. We believe that our audits provide a reasonable basis for our opinion.
In our opinion, the financial statements referred to above present fairly, in all material respects, the consolidated financial position of Lincoln Electric Holdings, Inc. and subsidiaries at December 31, 2012 and 2011, and the consolidated results of their operations and their cash flows for each of the three years in the period ended December 31, 2012, in conformity with U.S. generally accepted accounting principles. Also, in our opinion, the related financial statement schedule, when considered in relation to the basic financial statements taken as a whole, presents fairly in all material respects, the information set forth therein.
We also have audited, in accordance with the standards of the Public Company Accounting Oversight Board (United States), Lincoln Electric Holdings, Inc. and subsidiaries' internal control over financial reporting as of December 31, 2012, based on criteria established in Internal Control-Integrated Framework issued by the Committee of Sponsoring Organizations of the Treadway Commission and our report dated February 22, 2013 expressed an unqualified opinion thereon.
/s/ Ernst & Young LLPCleveland, OhioFebruary 22, 2013
F-2
Report of Independent Registered Public Accounting Firm
The Board of Directors and Shareholders of Lincoln Electric Holdings, Inc.
We have audited Lincoln Electric Holdings, Inc. and subsidiaries' internal control over financial reporting as of December 31, 2012, based on criteria established in Internal Control – Integrated Framework issued by the Committee of Sponsoring Organizations of the Treadway Commission (the COSO criteria). Lincoln Electric Holdings, Inc. and subsidiaries' management is responsible for maintaining effective internal control over financial reporting, and for its assessment of the effectiveness of internal control over financial reporting included in the accompanying Management's Report on Internal Control over Financial Reporting in Item 9A. Our responsibility is to express an opinion on the company's internal control over financial reporting based on our audit.
We conducted our audit in accordance with the standards of the Public Company Accounting Oversight Board (United States). Those standards require that we plan and perform the audit to obtain reasonable assurance about whether effective internal control over financial reporting was maintained in all material respects. Our audit included obtaining an understanding of internal control over financial reporting, assessing the risk that a material weakness exists, testing and evaluating the design and operating effectiveness of internal control based on the assessed risk, and performing such other procedures as we considered necessary in the circumstances. We believe that our audit provides a reasonable basis for our opinion.
A company's internal control over financial reporting is a process designed to provide reasonable assurance regarding the reliability of financial reporting and the preparation of financial statements for external purposes in accordance with generally accepted accounting principles. A company's internal control over financial reporting includes those policies and procedures that (1) pertain to the maintenance of records that, in reasonable detail, accurately and fairly reflect the transactions and dispositions of the assets of the company; (2) provide reasonable assurance that transactions are recorded as necessary to permit preparation of financial statements in accordance with generally accepted accounting principles, and that receipts and expenditures of the company are being made only in accordance with authorizations of management and directors of the company; and (3) provide reasonable assurance regarding prevention or timely detection of unauthorized acquisition, use, or disposition of the company's assets that could have a material effect on the financial statements.
Because of its inherent limitations, internal control over financial reporting may not prevent or detect misstatements. Also, projections of any evaluation of effectiveness to future periods are subject to the risk that controls may become inadequate because of changes in conditions, or that the degree of compliance with the policies or procedures may deteriorate.
In our opinion, Lincoln Electric Holdings, Inc. and subsidiaries maintained, in all material respects, effective internal control over financial reporting as of December 31, 2012, based on the COSO criteria.
We also have audited, in accordance with the standards of the Public Company Accounting Oversight Board (United States), the consolidated balance sheets of Lincoln Electric Holdings, Inc. and subsidiaries as of December 31, 2012 and 2011, and the related consolidated statements of income, comprehensive income, equity, and cash flows for each of the three years in the period ended December 31, 2012 of Lincoln Electric Holdings, Inc. and subsidiaries and our report dated February 22, 2013 expressed an unqualified opinion thereon.
/s/ Ernst & Young LLPCleveland, OhioFebruary 22, 2013
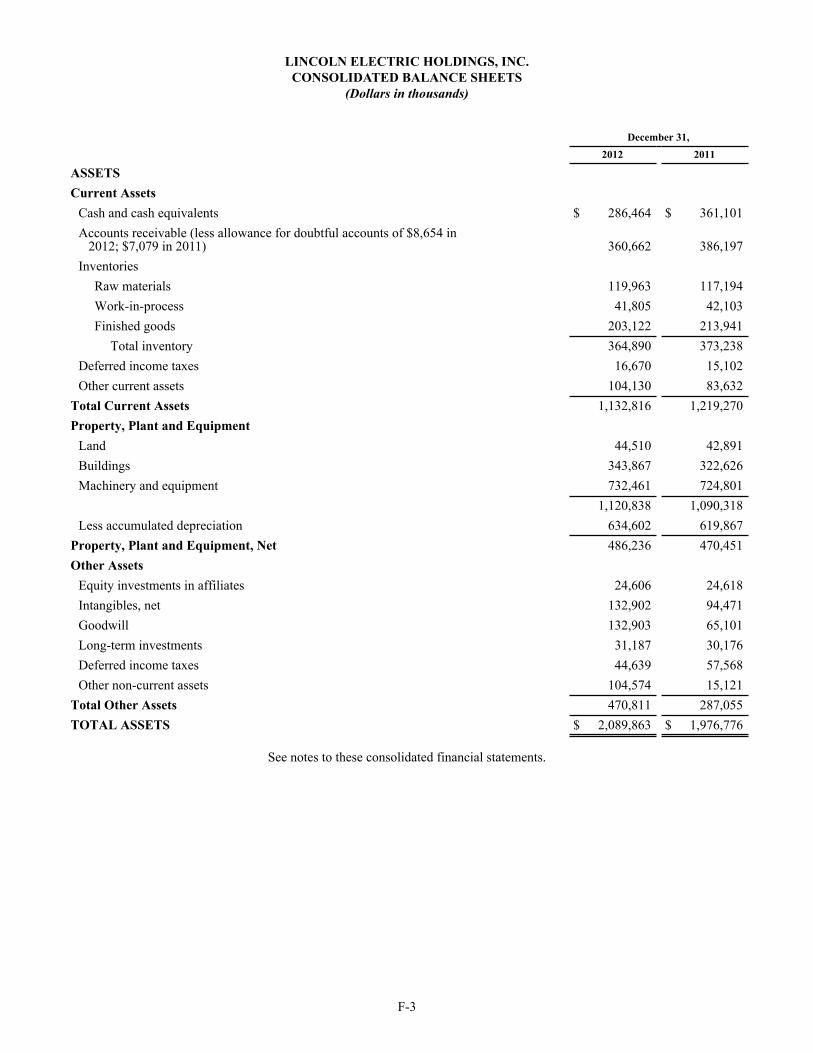
F-3
LINCOLN ELECTRIC HOLDINGS, INC.CONSOLIDATED BALANCE SHEETS
(Dollars in thousands)
December 31, 2012 2011
ASSETS Current Assets
Cash and cash equivalents $ 286,464 $ 361,101Accounts receivable (less allowance for doubtful accounts of $8,654 in 2012; $7,079 in 2011) 360,662 386,197Inventories
Raw materials 119,963 117,194Work-in-process 41,805 42,103Finished goods 203,122 213,941
Total inventory 364,890 373,238Deferred income taxes 16,670 15,102Other current assets 104,130 83,632
Total Current Assets 1,132,816 1,219,270Property, Plant and Equipment
Land 44,510 42,891Buildings 343,867 322,626Machinery and equipment 732,461 724,801
1,120,838 1,090,318Less accumulated depreciation 634,602 619,867
Property, Plant and Equipment, Net 486,236 470,451Other Assets
Equity investments in affiliates 24,606 24,618Intangibles, net 132,902 94,471Goodwill 132,903 65,101Long-term investments 31,187 30,176Deferred income taxes 44,639 57,568Other non-current assets 104,574 15,121
Total Other Assets 470,811 287,055TOTAL ASSETS $ 2,089,863 $ 1,976,776
See notes to these consolidated financial statements.
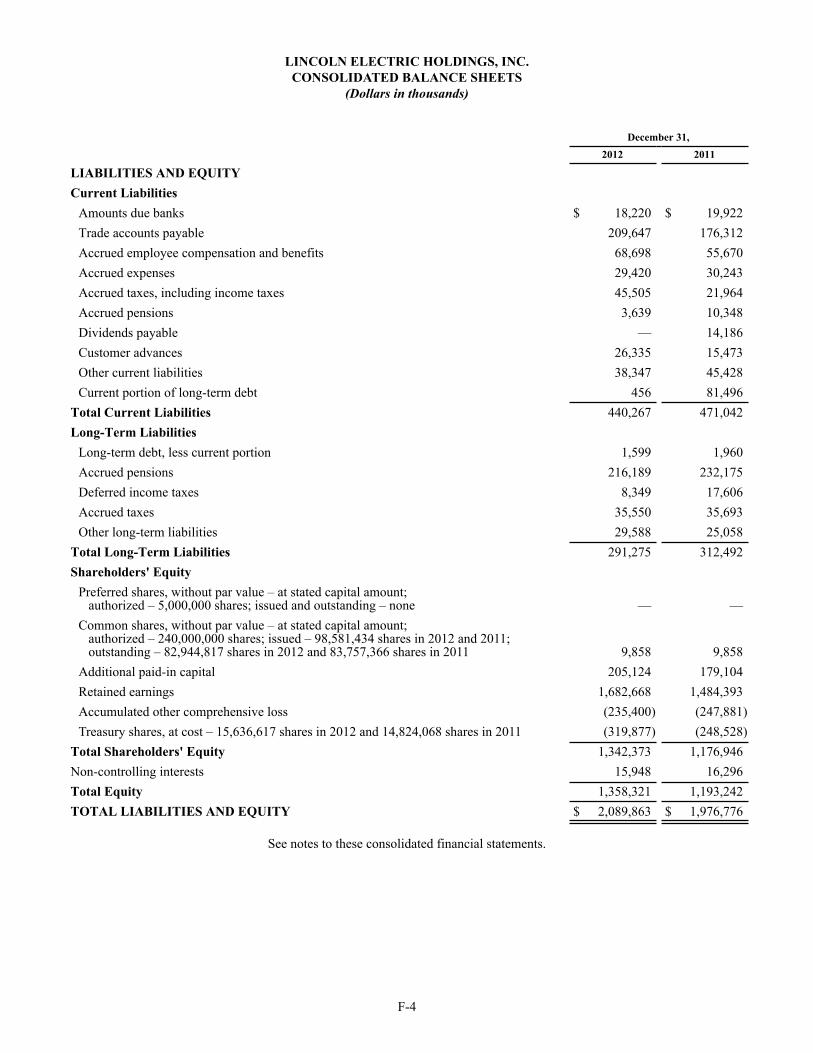
F-4
LINCOLN ELECTRIC HOLDINGS, INC.CONSOLIDATED BALANCE SHEETS
(Dollars in thousands)
December 31, 2012 2011
LIABILITIES AND EQUITY Current Liabilities
Amounts due banks $ 18,220 $ 19,922Trade accounts payable 209,647 176,312Accrued employee compensation and benefits 68,698 55,670Accrued expenses 29,420 30,243Accrued taxes, including income taxes 45,505 21,964Accrued pensions 3,639 10,348Dividends payable — 14,186Customer advances 26,335 15,473Other current liabilities 38,347 45,428Current portion of long-term debt 456 81,496
Total Current Liabilities 440,267 471,042Long-Term Liabilities
Long-term debt, less current portion 1,599 1,960Accrued pensions 216,189 232,175Deferred income taxes 8,349 17,606Accrued taxes 35,550 35,693Other long-term liabilities 29,588 25,058
Total Long-Term Liabilities 291,275 312,492Shareholders' Equity
Preferred shares, without par value – at stated capital amount; authorized – 5,000,000 shares; issued and outstanding – none — —Common shares, without par value – at stated capital amount; authorized – 240,000,000 shares; issued – 98,581,434 shares in 2012 and 2011; outstanding – 82,944,817 shares in 2012 and 83,757,366 shares in 2011 9,858 9,858Additional paid-in capital 205,124 179,104Retained earnings 1,682,668 1,484,393Accumulated other comprehensive loss (235,400) (247,881)Treasury shares, at cost – 15,636,617 shares in 2012 and 14,824,068 shares in 2011 (319,877) (248,528)
Total Shareholders' Equity 1,342,373 1,176,946Non-controlling interests 15,948 16,296Total Equity 1,358,321 1,193,242TOTAL LIABILITIES AND EQUITY $ 2,089,863 $ 1,976,776
See notes to these consolidated financial statements.
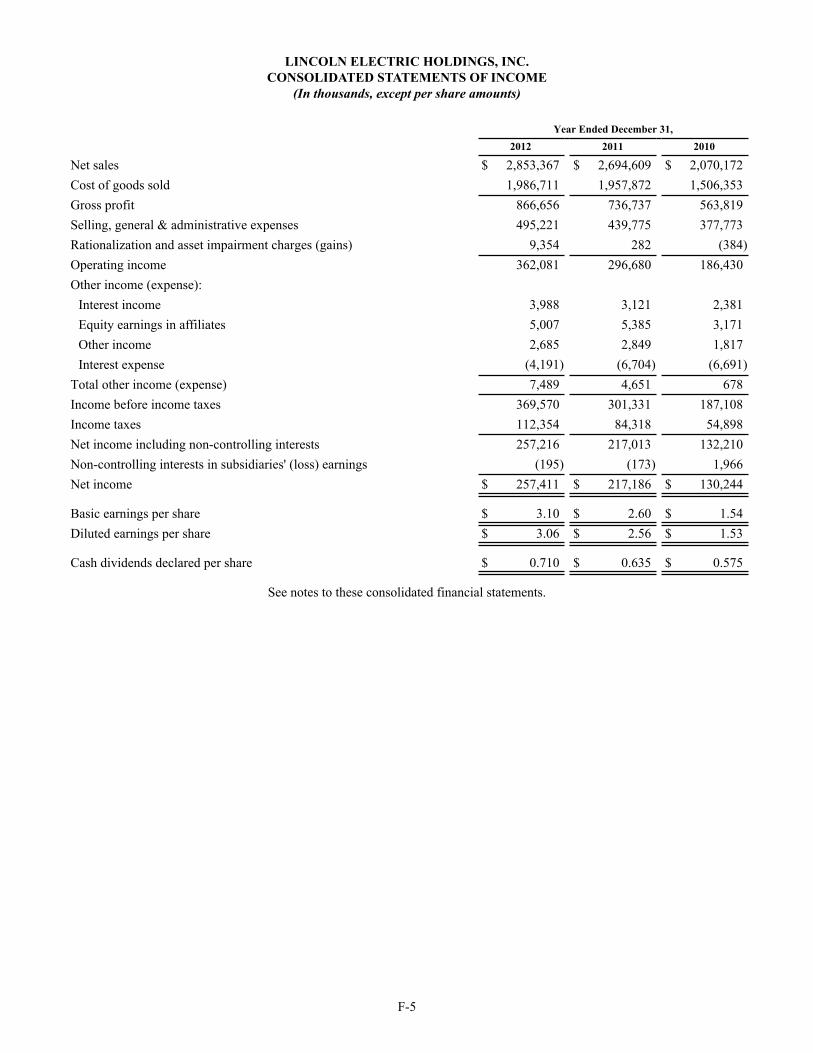
F-5
LINCOLN ELECTRIC HOLDINGS, INC.CONSOLIDATED STATEMENTS OF INCOME
(In thousands, except per share amounts)
Year Ended December 31, 2012 2011 2010
Net sales $ 2,853,367 $ 2,694,609 $ 2,070,172Cost of goods sold 1,986,711 1,957,872 1,506,353Gross profit 866,656 736,737 563,819Selling, general & administrative expenses 495,221 439,775 377,773Rationalization and asset impairment charges (gains) 9,354 282 (384)Operating income 362,081 296,680 186,430Other income (expense):
Interest income 3,988 3,121 2,381Equity earnings in affiliates 5,007 5,385 3,171Other income 2,685 2,849 1,817Interest expense (4,191) (6,704) (6,691)
Total other income (expense) 7,489 4,651 678Income before income taxes 369,570 301,331 187,108Income taxes 112,354 84,318 54,898Net income including non-controlling interests 257,216 217,013 132,210Non-controlling interests in subsidiaries' (loss) earnings (195) (173) 1,966Net income $ 257,411 $ 217,186 $ 130,244
Basic earnings per share $ 3.10 $ 2.60 $ 1.54Diluted earnings per share $ 3.06 $ 2.56 $ 1.53
Cash dividends declared per share $ 0.710 $ 0.635 $ 0.575
See notes to these consolidated financial statements.
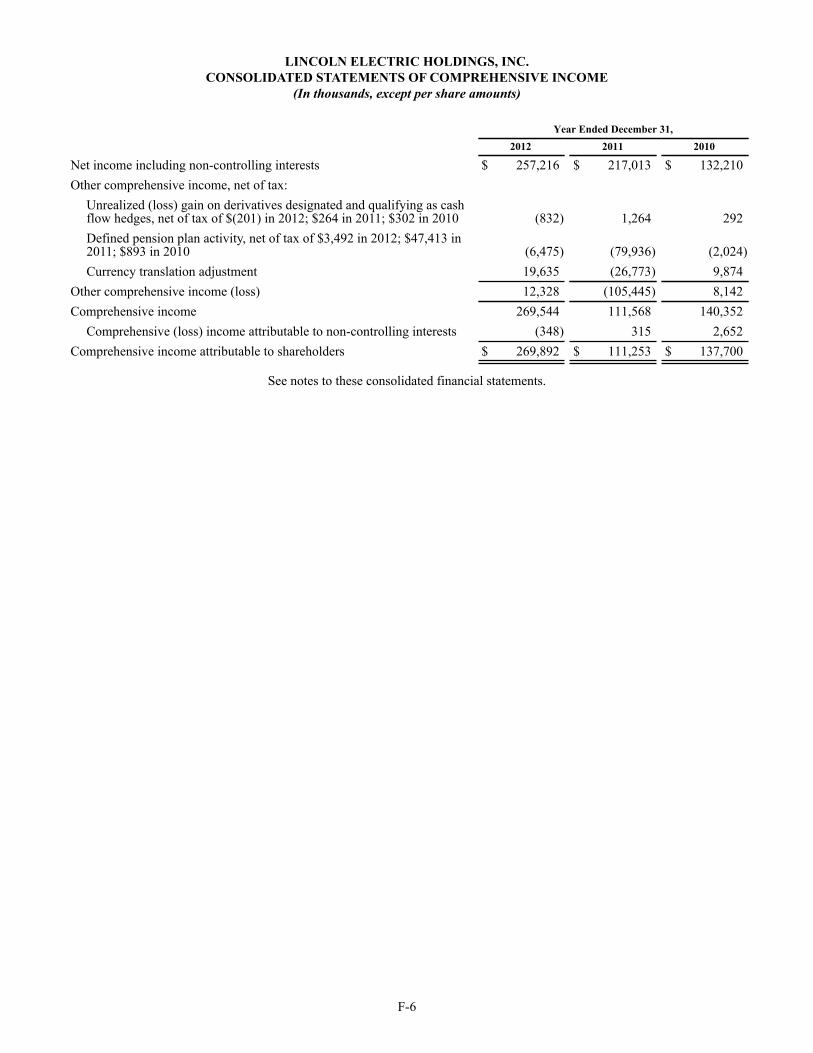
F-6
LINCOLN ELECTRIC HOLDINGS, INC.CONSOLIDATED STATEMENTS OF COMPREHENSIVE INCOME
(In thousands, except per share amounts)
Year Ended December 31, 2012 2011 2010
Net income including non-controlling interests $ 257,216 $ 217,013 $ 132,210Other comprehensive income, net of tax:
Unrealized (loss) gain on derivatives designated and qualifying as cash flow hedges, net of tax of $(201) in 2012; $264 in 2011; $302 in 2010 (832) 1,264 292Defined pension plan activity, net of tax of $3,492 in 2012; $47,413 in 2011; $893 in 2010 (6,475) (79,936) (2,024)Currency translation adjustment 19,635 (26,773) 9,874
Other comprehensive income (loss) 12,328 (105,445) 8,142Comprehensive income 269,544 111,568 140,352
Comprehensive (loss) income attributable to non-controlling interests (348) 315 2,652Comprehensive income attributable to shareholders $ 269,892 $ 111,253 $ 137,700
See notes to these consolidated financial statements.
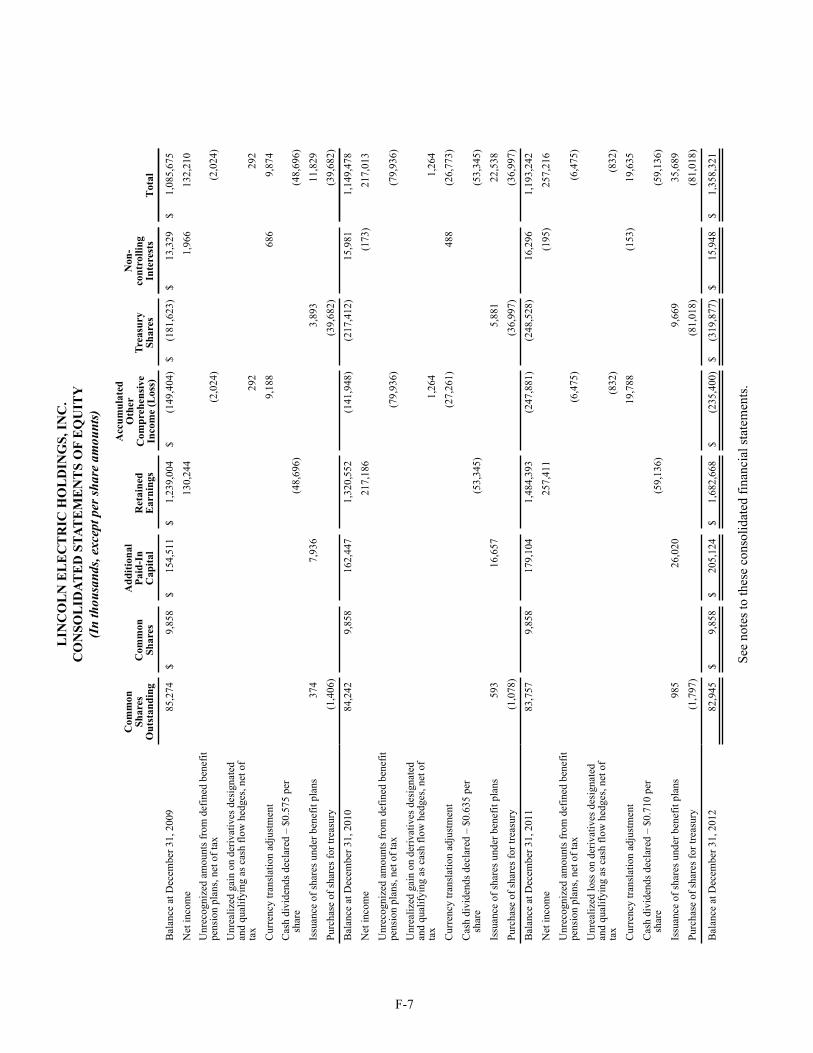
F-7
LIN
CO
LN
EL
EC
TR
IC H
OL
DIN
GS,
INC
.C
ON
SOL
IDAT
ED
STA
TE
ME
NT
S O
F E
QU
ITY
(In
thou
sand
s, ex
cept
per
shar
e am
ount
s)
Com
mon
Shar
esO
utst
andi
ngC
omm
onSh
ares
Add
ition
alPa
id-I
nC
apita
lR
etai
ned
Ear
ning
s
Acc
umul
ated
Oth
erC
ompr
ehen
sive
Inco
me
(Los
s)Tr
easu
rySh
ares
Non
-co
ntro
lling
Inte
rest
sT
otal
Bal
ance
at D
ecem
ber 3
1, 2
009
85,2
74$
9,85
8$
154,
511
$1,
239,
004
$(1
49,4
04)
$(1
81,6
23)
$13
,329
$1,
085,
675
Net
inco
me
130,
244
1,96
613
2,21
0U
nrec
ogni
zed
amou
nts f
rom
def
ined
ben
efit
pens
ion
plan
s, ne
t of t
ax
(2
,024
)
(2,0
24)
Unr
ealiz
ed g
ain
on d
eriv
ativ
es d
esig
nate
d an
d qu
alify
ing
as c
ash
flow
hed
ges,
net o
f ta
x
29
2
29
2C
urre
ncy
trans
latio
n ad
just
men
t
9,
188
68
69,
874
Cas
h di
vide
nds d
ecla
red
– $0
.575
per
shar
e
(48,
696)
(4
8,69
6 )Is
suan
ce o
f sha
res u
nder
ben
efit
plan
s37
4
7,93
6
3,
893
11
,829
Purc
hase
of s
hare
s for
trea
sury
(1,4
06)
(39,
682)
(3
9,68
2 )B
alan
ce a
t Dec
embe
r 31,
201
084
,242
9,85
816
2,44
71,
320,
552
(141
,948
)(2
17,4
12)
15,9
811,
149,
478
Net
inco
me
217,
186
(173
)21
7,01
3U
nrec
ogni
zed
amou
nts f
rom
def
ined
ben
efit
pens
ion
plan
s, ne
t of t
ax
(7
9,93
6)
(7
9,93
6 )U
nrea
lized
gai
n on
der
ivat
ives
des
igna
ted
and
qual
ifyin
g as
cas
h flo
w h
edge
s, ne
t of
tax
1,26
4
1,
264
Cur
renc
y tra
nsla
tion
adju
stm
ent
(27,
261)
48
8(2
6,77
3 )C
ash
divi
dend
s dec
lare
d –
$0.6
35 p
er
sh
are
(5
3,34
5)
(53,
345 )
Issu
ance
of s
hare
s und
er b
enef
it pl
ans
593
16
,657
5,88
1
22,5
38Pu
rcha
se o
f sha
res f
or tr
easu
ry(1
,078
)
(3
6,99
7)
(36,
997 )
Bal
ance
at D
ecem
ber 3
1, 2
011
83,7
579,
858
179,
104
1,48
4,39
3(2
47,8
81)
(248
,528
)16
,296
1,19
3,24
2N
et in
com
e25
7,41
1(1
95)
257,
216
Unr
ecog
nize
d am
ount
s fro
m d
efin
ed b
enef
it pe
nsio
n pl
ans,
net o
f tax
(6,4
75)
(6,4
75)
Unr
ealiz
ed lo
ss o
n de
rivat
ives
des
igna
ted
and
qual
ifyin
g as
cas
h flo
w h
edge
s, ne
t of
tax
(832
)
(8
32)
Cur
renc
y tra
nsla
tion
adju
stm
ent
19,7
88
(153
)19
,635
Cas
h di
vide
nds d
ecla
red
– $0
.710
per
shar
e
(59,
136)
(5
9,13
6 )Is
suan
ce o
f sha
res u
nder
ben
efit
plan
s98
5
26,0
20
9,
669
35
,689
Purc
hase
of s
hare
s for
trea
sury
(1,7
97)
(81,
018)
(8
1,01
8 )
Bal
ance
at D
ecem
ber 3
1, 2
012
82,9
45$
9,85
8$
205,
124
$1,
682,
668
$(2
35,4
00)
$(3
19,8
77)
$15
,948
$1,
358,
321
See
note
s to
thes
e co
nsol
idat
ed fi
nanc
ial s
tate
men
ts.
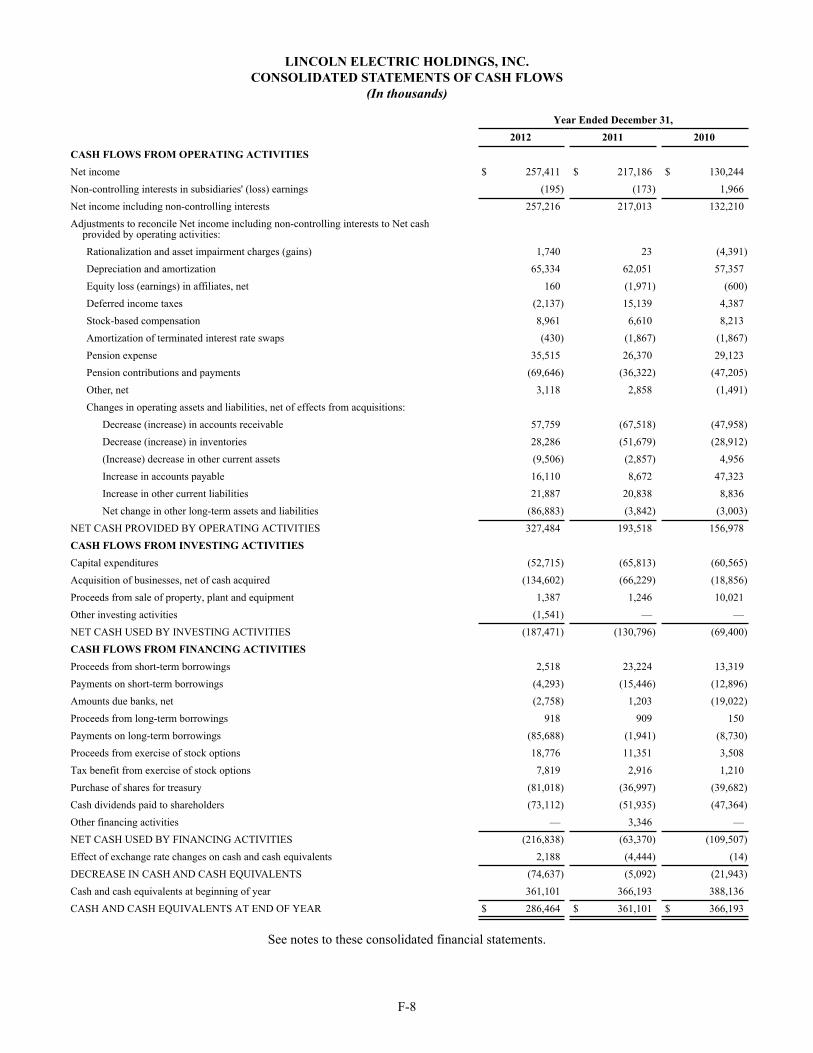
F-8
LINCOLN ELECTRIC HOLDINGS, INC.CONSOLIDATED STATEMENTS OF CASH FLOWS
(In thousands)
Year Ended December 31, 2012 2011 2010CASH FLOWS FROM OPERATING ACTIVITIES Net income $ 257,411 $ 217,186 $ 130,244Non-controlling interests in subsidiaries' (loss) earnings (195) (173) 1,966Net income including non-controlling interests 257,216 217,013 132,210Adjustments to reconcile Net income including non-controlling interests to Net cash
provided by operating activities: Rationalization and asset impairment charges (gains) 1,740 23 (4,391)Depreciation and amortization 65,334 62,051 57,357Equity loss (earnings) in affiliates, net 160 (1,971) (600)Deferred income taxes (2,137) 15,139 4,387Stock-based compensation 8,961 6,610 8,213Amortization of terminated interest rate swaps (430) (1,867) (1,867)Pension expense 35,515 26,370 29,123Pension contributions and payments (69,646) (36,322) (47,205)Other, net 3,118 2,858 (1,491)Changes in operating assets and liabilities, net of effects from acquisitions:
Decrease (increase) in accounts receivable 57,759 (67,518) (47,958)Decrease (increase) in inventories 28,286 (51,679) (28,912)(Increase) decrease in other current assets (9,506) (2,857) 4,956Increase in accounts payable 16,110 8,672 47,323Increase in other current liabilities 21,887 20,838 8,836Net change in other long-term assets and liabilities (86,883) (3,842) (3,003)
NET CASH PROVIDED BY OPERATING ACTIVITIES 327,484 193,518 156,978CASH FLOWS FROM INVESTING ACTIVITIES Capital expenditures (52,715) (65,813) (60,565)Acquisition of businesses, net of cash acquired (134,602) (66,229) (18,856)Proceeds from sale of property, plant and equipment 1,387 1,246 10,021Other investing activities (1,541) — —NET CASH USED BY INVESTING ACTIVITIES (187,471) (130,796) (69,400)CASH FLOWS FROM FINANCING ACTIVITIES Proceeds from short-term borrowings 2,518 23,224 13,319Payments on short-term borrowings (4,293) (15,446) (12,896)Amounts due banks, net (2,758) 1,203 (19,022)Proceeds from long-term borrowings 918 909 150Payments on long-term borrowings (85,688) (1,941) (8,730)Proceeds from exercise of stock options 18,776 11,351 3,508Tax benefit from exercise of stock options 7,819 2,916 1,210Purchase of shares for treasury (81,018) (36,997) (39,682)Cash dividends paid to shareholders (73,112) (51,935) (47,364)Other financing activities — 3,346 —NET CASH USED BY FINANCING ACTIVITIES (216,838) (63,370) (109,507)Effect of exchange rate changes on cash and cash equivalents 2,188 (4,444) (14)DECREASE IN CASH AND CASH EQUIVALENTS (74,637) (5,092) (21,943)Cash and cash equivalents at beginning of year 361,101 366,193 388,136CASH AND CASH EQUIVALENTS AT END OF YEAR $ 286,464 $ 361,101 $ 366,193
See notes to these consolidated financial statements.
F-9
LINCOLN ELECTRIC HOLDINGS, INC.NOTES TO CONSOLIDATED FINANCIAL STATEMENTS
(Dollars in thousands, except share and per share amounts)
NOTE 1 – SIGNIFICANT ACCOUNTING POLICIES
Principles of Consolidation
The consolidated financial statements include the accounts of Lincoln Electric Holdings, Inc. and its wholly-owned and majority-owned subsidiaries for which it has a controlling interest (the "Company") after elimination of all inter-company accounts, transactions and profits.
General Information
The Company is a manufacturer of welding, cutting and brazing products. Welding products include arc welding power sources, wire feeding systems, robotic welding packages, fume extraction equipment, consumable electrodes and fluxes. The Company's product offering also includes CNC plasma and oxy-fuel cutting systems, regulators and torches used in oxy-fuel welding, cutting and brazing and consumables used in the brazing and soldering alloys market.
Translation of Foreign Currencies
Asset and liability accounts are translated into U.S. dollars using exchange rates in effect at the dates of the Consolidated Balance Sheets; revenue and expense accounts are translated at average monthly exchange rates. Translation adjustments are reflected as a component of Total equity. For subsidiaries operating in highly inflationary economies, both historical and current exchange rates are used in translating balance sheet accounts, and translation adjustments are included in Net income.
The translation of assets and liabilities originally denominated in foreign currencies into U.S. dollars is for consolidation purposes, and does not necessarily indicate that the Company could realize or settle the reported value of those assets and liabilities in U.S. dollars. Additionally, such a translation does not necessarily indicate that the Company could return or distribute the reported U.S. dollar value of the net equity of its foreign operations to shareholders.
Foreign currency transaction losses are included in Selling, general & administrative expenses and were $4,608, $4,904 and $118 in 2012, 2011 and 2010, respectively.
Venezuela – Highly Inflationary Economy
Venezuela is a highly inflationary economy under U.S. generally accepted accounting principles ("GAAP"). As a result, the financial statements of the Company's Venezuelan operation are reported under highly inflationary accounting rules as of January 1, 2010. Under highly inflationary accounting, the financial statements of the Company's Venezuelan operation have been remeasured into the Company's reporting currency and exchange gains and losses from the re-measurement of monetary assets and liabilities are reflected in current earnings. In remeasuring the financial statements, the official exchange rate for non-essential goods of 4.3 bolivars to the U.S. dollar (the "Non-Essential Rate") is used as this is the rate expected to be applicable to dividend repatriations.
Future impacts to earnings of applying highly inflationary accounting for Venezuela on the Company's consolidated financial statements will be dependent upon movements in the applicable exchange rates between the bolivar and the U.S. dollar and the amount of monetary assets and liabilities included in the Company's Venezuelan operation's balance sheet. The bolivar-denominated monetary net asset position was $31,545 at December 31, 2012 and $6,826 at December 31, 2011. The increased exposure was due to the limited opportunities to convert bolivars into U.S. dollars.
In 2010, the Company participated in Venezuelan sovereign debt offerings as a means of converting bolivars to U.S. dollars. The conversion of bolivars to U.S. dollars through Venezuelan sovereign debt offerings generated foreign currency transaction losses as the debt was purchased at the Non-Essential Rate and subsequently sold at a discount. During 2010, the Company acquired $7,672 of Venezuelan sovereign debt at the Non-Essential Rate, which was immediately sold at a discount for $6,022. The sale of the Venezuelan sovereign debt resulted in a loss of $1,650 recognized in Selling, general and administrative expenses.
The devaluation of the bolivar and the change to the U.S. dollar as the functional currency resulted in a foreign currency transaction gain of $2,632 in Selling, general & administrative expenses and higher Cost of goods sold of $5,755 due to the liquidation of inventory valued at the historical exchange rate for the year ended December 31, 2010.
On February 8, 2013, the Venezuelan government announced the devaluation of its currency relative to the U.S. dollar. The Non-Essential Rate moved from 4.3 to 6.3 bolivars to one U.S. dollar. The devaluation of the bolivar is expected to result in a foreign currency transaction charge of approximately $8,500 in Selling, general & administrative expenses. This charge will be recognized during the first quarter of 2013. The impact of selling inventories carried at the previous exchange rate is expected
LINCOLN ELECTRIC HOLDINGS, INC.NOTES TO CONSOLIDATED FINANCIAL STATEMENTS (Continued)
(Dollars in thousands, except share and per share amounts)
F-10
to decrease gross profit by approximately $4,000 in 2013. These charges will be recognized during the first half of 2013. The Company also expects that its Venezuelan subsidiary's results of operations will decrease significantly in 2013 due to the new exchange rate.
Cash Equivalents
The Company considers all highly liquid investments with a maturity of three months or less when purchased to be cash equivalents.
Accounts Receivable
The Company maintains an allowance for doubtful accounts for estimated losses from the failure of its customers to make required payments for products delivered. The Company estimates this allowance based on the age of the related receivable, knowledge of the financial condition of customers, review of historical receivables and reserve trends and other pertinent information. If the financial condition of customers deteriorates or an unfavorable trend in receivable collections is experienced in the future, additional allowances may be required. Historically, the Company's reserves have approximated actual experience.
Inventories
Inventories are valued at the lower of cost or market. Fixed manufacturing overhead costs are allocated to inventory based on normal production capacity and abnormal manufacturing costs are recognized as period costs. For most domestic inventories, cost is determined principally by the last-in, first-out ("LIFO") method, and for non-U.S. inventories, cost is determined by the first-in, first-out ("FIFO") method.
Reserves are maintained for estimated obsolescence or excess inventory equal to the difference between the cost of inventory and the estimated market value based upon assumptions about future demand and market conditions. Historically, the Company's reserves have approximated actual experience.
Equity Investments
Investments in businesses in which the Company does not have a controlling interest and holds between a 20% and 50% ownership interest are accounted for using the equity method of accounting on a one-month lag basis. The Company's 50% ownership interest in equity investments includes investments in Turkey and Chile. The amount of retained earnings that represents undistributed earnings of 50% or less owned equity investments was $15,034 at December 31, 2012 and $15,190 at December 31, 2011.
Property, Plant and Equipment
Property, plant and equipment are stated at cost and include improvements which significantly increase capacities or extend the useful lives of existing plant and equipment. Depreciation and amortization are computed using a straight-line method over useful lives ranging from three to 20 years for machinery, tools and equipment, and up to 50 years for buildings. Net gains or losses related to asset dispositions are recognized in earnings in the period in which dispositions occur.
Routine maintenance, repairs and replacements are expensed as incurred. The Company capitalizes interest costs associated with long-term construction in progress.
Goodwill and Intangibles
Goodwill is recorded when the cost of acquired businesses exceeds the fair value of the identifiable net assets acquired. Intangible assets other than goodwill are recorded at fair value at the time acquired or at cost, if applicable. Intangible assets that do not have indefinite lives are amortized in line with the pattern in which the economic benefits of the intangible asset are consumed. If the pattern of economic benefit cannot be reliably determined, the intangible assets are amortized on a straight-line basis over the shorter of the legal or estimated life.
Goodwill and indefinite-lived intangibles assets are not amortized, but are tested for impairment in the fourth quarter using the same dates each year or more frequently if changes in circumstances or the occurrence of events indicate potential impairment. The fair value of each indefinite-lived intangible asset is compared to its carrying value and an impairment charge is recorded if the carrying value exceeds the fair value. Goodwill is tested by comparing the fair value of each reporting unit with its carrying value. If the carrying value of the reporting unit exceeds its fair value, the implied value of goodwill is compared to its carrying value and impairment is recognized to the extent that the carrying value exceeds the implied fair value.

LINCOLN ELECTRIC HOLDINGS, INC.NOTES TO CONSOLIDATED FINANCIAL STATEMENTS (Continued)
(Dollars in thousands, except share and per share amounts)
F-11
Long-Lived Assets
The Company evaluates whether current facts or circumstances indicate that the carrying value of its depreciable long-lived assets to be held and used may not be recoverable. If such circumstances are determined to exist, an estimate of undiscounted future cash flows produced by the long-lived asset, or the appropriate grouping of assets, is compared to the carrying value to determine whether impairment exists. If an asset is determined to be impaired, a loss is recognized to the extent that carrying value exceeds fair value. Fair value is measured based on quoted market prices in active markets, if available. If quoted market prices are not available, the estimate of fair value is based on various valuation techniques, including the discounted value of estimated future cash flows.
Fair Value Measurements
Financial assets and liabilities, such as the Company's defined benefit pension plan assets and derivative contracts, are valued at fair value using the market and income valuation approaches. Fair value is defined as the price that would be received to sell an asset or paid to transfer a liability in an orderly transaction between market participants at the measurement date (exit price). The Company uses the market approach to value similar assets and liabilities in active markets and the income approach that consists of discounted cash flow models that take into account the present value of future cash flows under the terms of the contracts using current market information as of the reporting date. The following hierarchy is used to classify the inputs used to measure fair value:
Level 1 Inputs to the valuation methodology are unadjusted quoted prices for identical assets or liabilities in active markets.Level 2 Inputs to the valuation methodology include: • Quoted prices for similar assets or liabilities in active markets; • Quoted prices for identical or similar assets or liabilities in inactive markets; • Inputs other than quoted prices that are observable for the asset or liability; and • Inputs that are derived principally from or corroborated by observable market data by correlation or other
means. If the asset or liability has a specific (contractual) term, the Level 2 input must be observable for substantially the
full term of the asset or liability.Level 3 Inputs to the valuation methodology are unobservable and significant to the fair value measurement.
Product Warranties
The Company accrues for product warranty claims based on historical experience and the expected material and labor costs to provide warranty service. Warranty services are provided for periods up to three years from the date of sale. The accrual for product warranty claims is included in "Accrued expenses."
Revenue Recognition
Substantially all of the Company's revenues are recognized when the risks and rewards of ownership and title to the product have transferred to the customer which generally occurs at point of shipment. The Company recognizes any discounts, credits, returns, rebates and incentive programs based on reasonable estimates as a reduction of Sales to arrive at Net sales at the same time the related revenue is recorded.
For contracts accounted for under the percentage of completion method, revenue recognition is based upon the ratio of costs incurred to date compared with estimated total costs to complete. The cumulative impact of revisions to total estimated costs is reflected in the period of the change, including anticipated losses.
Distribution Costs
Distribution costs, including warehousing and freight related to product shipments, are included in "Cost of goods sold."
Stock-Based Compensation
Expense is recognized for all awards of stock-based compensation by allocating the aggregate grant date fair value over the vesting period. No expense is recognized for any stock options, restricted or deferred shares or restricted stock units ultimately forfeited because the recipients fail to meet vesting requirements.
Common stock issuable upon the exercise of employee stock options is excluded from the calculation of diluted earnings per share when the calculation of option equivalent shares is anti-dilutive.
LINCOLN ELECTRIC HOLDINGS, INC.NOTES TO CONSOLIDATED FINANCIAL STATEMENTS (Continued)
(Dollars in thousands, except share and per share amounts)
F-12
Financial Instruments
The Company uses forward contracts to hedge exposures to commodity prices and exchange rate fluctuations on certain purchase and sales transactions and balance sheet exposures. Contracts are generally written on a short-term basis but may cover exposures for up to two years and are not held for trading or speculative purposes. The Company uses interest rate swaps from time to time to hedge changes in the fair value of debt. The Company recognizes derivative instruments as either assets or liabilities at fair value. The accounting for changes in the fair value of derivative instruments depends on whether it has been designated and qualifies as part of a hedging relationship and on the type of hedging relationship.
For derivative instruments that qualify as a fair value hedge (i.e., hedging the exposure to changes in the fair value of an asset or a liability), the gain or loss on the derivative instrument, as well as the offsetting loss or gain on the hedged item are recognized in earnings. For derivative instruments that qualify as a cash flow hedge (i.e., hedging the exposure to variability in expected future cash flows), the effective portion of the unrealized gain or loss on the derivative instrument is reported as a component of "Accumulated other comprehensive loss" with offsetting amounts recorded as "Other current assets," "Other non-current assets," "Other current liabilities" or "Other long-term liabilities" depending on the position and the duration of the contract. At settlement, the realized gain or loss is reflected in earnings in the same period or periods during which the hedged transaction affects earnings. Any remaining gain or loss on the derivative instrument is recognized in earnings. For derivative instruments not designated as hedges, the gain or loss from changes in the fair value of the instruments is recognized in earnings. The Company does not hedge its net investments in foreign subsidiaries.
Advertising Costs
Advertising costs are charged to "Selling, general & administrative expenses" as incurred and totaled $12,376, $11,269 and $9,222 in 2012, 2011 and 2010, respectively.
Research and Development
Research and development costs are charged to "Selling, general & administrative expenses" as incurred and totaled $37,305, $32,834 and $29,489 in 2012, 2011 and 2010, respectively.
Bonus
Included in "Selling, general & administrative expenses" are the costs related to the Company's discretionary employee bonus programs, which for certain U.S.- based employees are net of hospitalization costs. Bonus costs were $124,947 in 2012, $104,361 in 2011 and $73,197 in 2010.
Income Taxes
Deferred income taxes are recognized at currently enacted tax rates for temporary differences between the financial reporting and income tax basis of assets and liabilities and operating loss and tax credit carry-forwards. In assessing the realizability of deferred tax assets, the Company assesses whether it is more likely than not that a portion or all of the deferred tax assets will not be realized.
Estimates
The preparation of financial statements in conformity with GAAP requires management to make estimates and assumptions in certain circumstances that affect the amounts reported in the accompanying consolidated financial statements and notes. Actual results could differ from these estimates.
Reclassification
Certain reclassifications have been made to prior year financial statements to conform to current year classifications.
New Accounting Pronouncements
New Accounting Standards Adopted:
In September 2011, the Financial Accounting Standards Board ("FASB") issued Accounting Standards Update ("ASU") No. 2011-08, "Intangibles – Goodwill and Other (Topic 350): Testing Goodwill for Impairment." ASU 2011-08 provides an entity the option to first assess qualitative factors to determine whether the existence of events or circumstance leads to the determination that it is more likely than not that the fair value of a reporting unit is less than its carrying amount. If the entity determines it is not more likely than not that the fair value is less than the carrying amount, then performing the two-step impairment test is unnecessary. However, if the entity concludes otherwise, it is required to perform the first step of the two-step impairment test. The amendments are effective for annual and interim goodwill impairment tests performed for fiscal years beginning after December 15, 2011. ASU 2011-08 was adopted by the Company on January 1, 2012 and did not have a significant impact on the Company's financial statements.
LINCOLN ELECTRIC HOLDINGS, INC.NOTES TO CONSOLIDATED FINANCIAL STATEMENTS (Continued)
(Dollars in thousands, except share and per share amounts)
F-13
In June 2011, the FASB issued ASU No. 2011-05, “Comprehensive Income (Topic 220): Presentation of Comprehensive Income.” This update provides amendments to Accounting Standards Codification (“ASC”) Topic 220, Comprehensive Income. ASU 2011-05 provides an entity the option to present the total of comprehensive income, the components of net income and the components of other comprehensive income either in a single continuous statement of comprehensive income or in two separate but consecutive statements. Under both options, an entity is required to present each component of net income along with total net income, each component of other comprehensive income along with a total for other comprehensive income and a total amount for comprehensive income. Further, ASU 2011-05 requires the presentation on the face of the financial statements items that are reclassified from other comprehensive income to net income in the statement(s) where the components of net income and the components of other comprehensive income are presented. The amendment to present reclassification adjustments was deferred when the FASB issued ASU 2011-12. ASU 2011-05 should be applied retrospectively and is effective for fiscal years, and interim periods within those years, beginning after December 15, 2011. The Company adopted ASU 2011-05, excluding deferred portions, on January 1, 2012. Refer to the consolidated financial statements herein.
In May 2011, the FASB issued ASU No. 2011-04, "Fair Value Measurement (Topic 820): Amendments to Achieve Common Fair Value Measurement and Disclosure Requirements in U.S. GAAP and IFRS's." ASU 2011-04 amends ASC Topic 820, resulting in common fair value measurement and disclosure requirements in GAAP and International Financial Reporting Standards ("IFRS"). Consequently, the amendments change the wording used to describe many of the requirements in GAAP for measuring fair value and for disclosing information about fair value measurements. These amendments are to be applied prospectively and are effective for fiscal years, and interim periods within those years, beginning after December 15, 2011. ASU 2011-04 was adopted by the Company on January 1, 2012 and did not have a significant impact on the Company's financial statements.
New Accounting Standards to be Adopted:
In February 2013, the FASB issued ASU No. 2013-02, “Comprehensive Income (Topic 220): Reporting of Amounts Reclassified Out of Accumulated Other Comprehensive Income.” ASU 2013-02 requires an entity to provide information about the amounts reclassified out of accumulated other comprehensive income by component. In addition, an entity is required to present, either on the face of the statement where net income is presented or in the notes, significant amounts reclassified out of accumulated other comprehensive income by the respective line items of net income but only if the amount reclassified is required under U.S. GAAP to be reclassified to net income in its entirety in the same reporting period. For other amounts, an entity is required to cross-reference to other disclosures required under U.S. GAAP that provide additional detail about those amounts. The amendments are effective prospectively for reporting periods beginning after December 15, 2012. The Company is currently evaluating the impact of the adoption of ASU 2013-02 on the Company's financial statements.
In July 2012, the FASB issued ASU No. 2012-02, “Intangibles - Goodwill and Other (Topic 350): Testing Indefinite-Lived Intangible Assets for Impairment.” ASU 2012-02 permits an entity first to assess qualitative factors to determine whether it is more likely than not that an indefinite-lived intangible asset is impaired as a basis for determining whether it is necessary to perform the quantitative impairment test in accordance with Subtopic 350-30, Intangibles - Goodwill and Other - General Intangibles Other than Goodwill. The more-likely-than-not threshold is defined as having a likelihood of more than 50 percent. In accordance with this update, an entity will have an option not to calculate annually the fair value of an indefinite-lived intangible asset if the entity determines that it is not more likely than not that the asset is impaired. The amendments are effective for annual and interim impairment tests performed for fiscal years beginning after September 15, 2012. The Company is currently evaluating the impact of the adoption of ASU 2012-02 on the Company's financial statements.
In December 2011, the FASB issued ASU No. 2011-11, "Balance Sheet (Topic 210): Disclosures about Offsetting Assets and Liabilities." ASU 2011-11 requires an entity to disclose information about financial instruments and derivative instruments that are subject to offsetting, master netting or other similar arrangements, to illustrate the effect or potential effect of those arrangements on the Company's financial position. In January 2013, the FASB issued ASU No. 2013-01, “Balance Sheet (Topic 210): Clarifying the Scope of Disclosures about Offsetting Assets and Liabilities,” which clarifies the scope of ASU 2011-11. The amendments are effective for annual periods beginning on or after January 1, 2013 and interim periods within those annual periods. The amendments should be applied retrospectively for all prior periods presented. The Company is currently evaluating the impact of the adoption of ASU 2011-11 on the Company's financial statements.
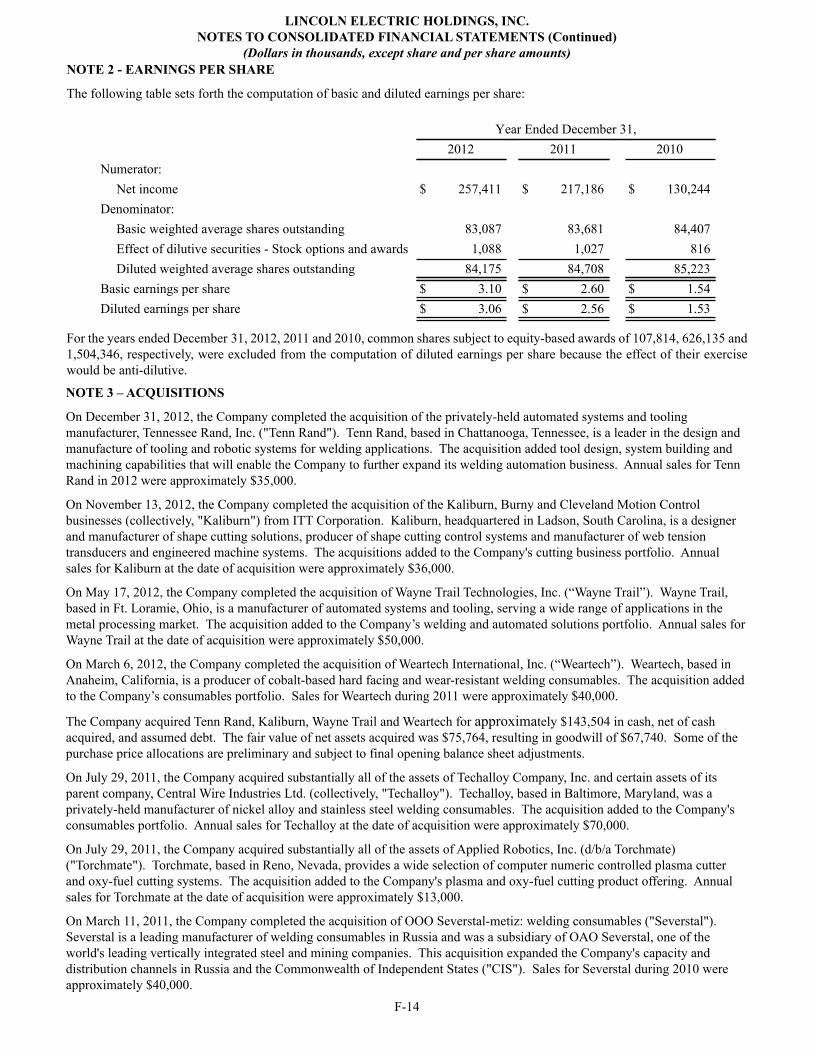
LINCOLN ELECTRIC HOLDINGS, INC.NOTES TO CONSOLIDATED FINANCIAL STATEMENTS (Continued)
(Dollars in thousands, except share and per share amounts)
F-14
NOTE 2 - EARNINGS PER SHARE
The following table sets forth the computation of basic and diluted earnings per share:
Year Ended December 31,2012 2011 2010
Numerator:Net income $ 257,411 $ 217,186 $ 130,244
Denominator:Basic weighted average shares outstanding 83,087 83,681 84,407Effect of dilutive securities - Stock options and awards 1,088 1,027 816Diluted weighted average shares outstanding 84,175 84,708 85,223
Basic earnings per share $ 3.10 $ 2.60 $ 1.54Diluted earnings per share $ 3.06 $ 2.56 $ 1.53
For the years ended December 31, 2012, 2011 and 2010, common shares subject to equity-based awards of 107,814, 626,135 and 1,504,346, respectively, were excluded from the computation of diluted earnings per share because the effect of their exercise would be anti-dilutive.
NOTE 3 – ACQUISITIONS
On December 31, 2012, the Company completed the acquisition of the privately-held automated systems and tooling manufacturer, Tennessee Rand, Inc. ("Tenn Rand"). Tenn Rand, based in Chattanooga, Tennessee, is a leader in the design and manufacture of tooling and robotic systems for welding applications. The acquisition added tool design, system building and machining capabilities that will enable the Company to further expand its welding automation business. Annual sales for Tenn Rand in 2012 were approximately $35,000.
On November 13, 2012, the Company completed the acquisition of the Kaliburn, Burny and Cleveland Motion Control businesses (collectively, "Kaliburn") from ITT Corporation. Kaliburn, headquartered in Ladson, South Carolina, is a designer and manufacturer of shape cutting solutions, producer of shape cutting control systems and manufacturer of web tension transducers and engineered machine systems. The acquisitions added to the Company's cutting business portfolio. Annual sales for Kaliburn at the date of acquisition were approximately $36,000.
On May 17, 2012, the Company completed the acquisition of Wayne Trail Technologies, Inc. (“Wayne Trail”). Wayne Trail, based in Ft. Loramie, Ohio, is a manufacturer of automated systems and tooling, serving a wide range of applications in the metal processing market. The acquisition added to the Company’s welding and automated solutions portfolio. Annual sales for Wayne Trail at the date of acquisition were approximately $50,000.
On March 6, 2012, the Company completed the acquisition of Weartech International, Inc. (“Weartech”). Weartech, based in Anaheim, California, is a producer of cobalt-based hard facing and wear-resistant welding consumables. The acquisition added to the Company’s consumables portfolio. Sales for Weartech during 2011 were approximately $40,000.
The Company acquired Tenn Rand, Kaliburn, Wayne Trail and Weartech for approximately $143,504 in cash, net of cash acquired, and assumed debt. The fair value of net assets acquired was $75,764, resulting in goodwill of $67,740. Some of the purchase price allocations are preliminary and subject to final opening balance sheet adjustments.
On July 29, 2011, the Company acquired substantially all of the assets of Techalloy Company, Inc. and certain assets of its parent company, Central Wire Industries Ltd. (collectively, "Techalloy"). Techalloy, based in Baltimore, Maryland, was a privately-held manufacturer of nickel alloy and stainless steel welding consumables. The acquisition added to the Company's consumables portfolio. Annual sales for Techalloy at the date of acquisition were approximately $70,000.
On July 29, 2011, the Company acquired substantially all of the assets of Applied Robotics, Inc. (d/b/a Torchmate) ("Torchmate"). Torchmate, based in Reno, Nevada, provides a wide selection of computer numeric controlled plasma cutter and oxy-fuel cutting systems. The acquisition added to the Company's plasma and oxy-fuel cutting product offering. Annual sales for Torchmate at the date of acquisition were approximately $13,000.
On March 11, 2011, the Company completed the acquisition of OOO Severstal-metiz: welding consumables ("Severstal"). Severstal is a leading manufacturer of welding consumables in Russia and was a subsidiary of OAO Severstal, one of the world's leading vertically integrated steel and mining companies. This acquisition expanded the Company's capacity and distribution channels in Russia and the Commonwealth of Independent States ("CIS"). Sales for Severstal during 2010 were approximately $40,000.
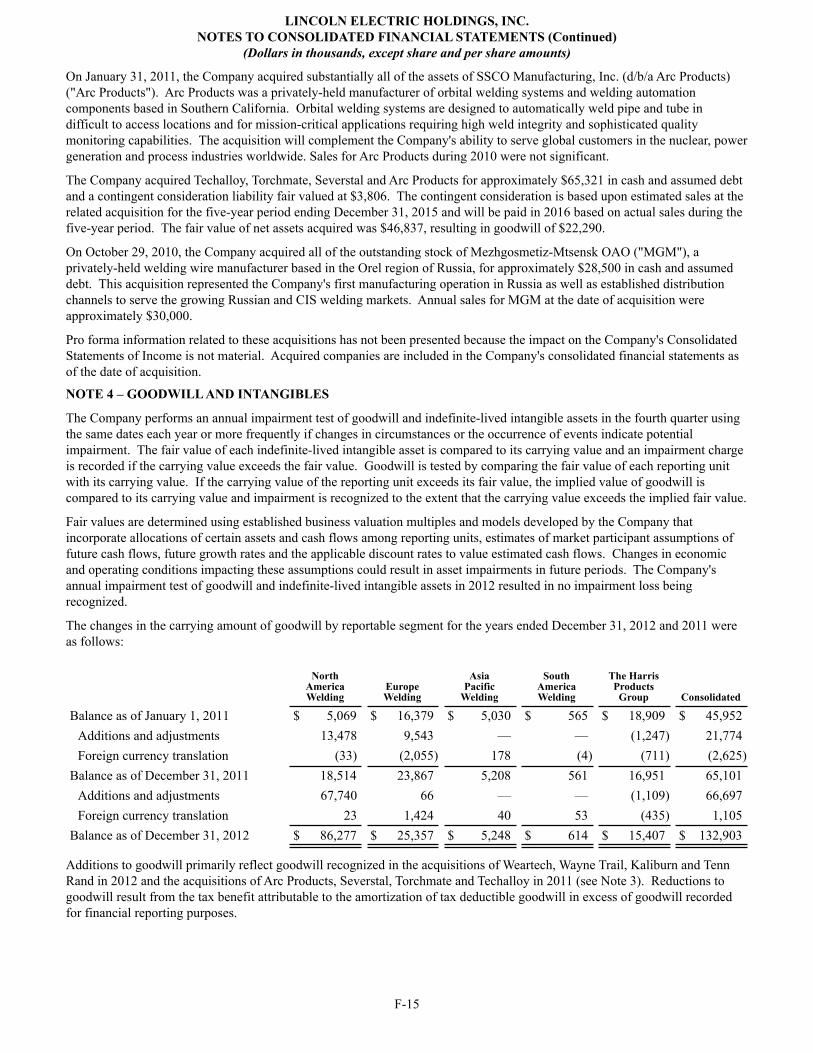
LINCOLN ELECTRIC HOLDINGS, INC.NOTES TO CONSOLIDATED FINANCIAL STATEMENTS (Continued)
(Dollars in thousands, except share and per share amounts)
F-15
On January 31, 2011, the Company acquired substantially all of the assets of SSCO Manufacturing, Inc. (d/b/a Arc Products) ("Arc Products"). Arc Products was a privately-held manufacturer of orbital welding systems and welding automation components based in Southern California. Orbital welding systems are designed to automatically weld pipe and tube in difficult to access locations and for mission-critical applications requiring high weld integrity and sophisticated quality monitoring capabilities. The acquisition will complement the Company's ability to serve global customers in the nuclear, power generation and process industries worldwide. Sales for Arc Products during 2010 were not significant.
The Company acquired Techalloy, Torchmate, Severstal and Arc Products for approximately $65,321 in cash and assumed debt and a contingent consideration liability fair valued at $3,806. The contingent consideration is based upon estimated sales at the related acquisition for the five-year period ending December 31, 2015 and will be paid in 2016 based on actual sales during the five-year period. The fair value of net assets acquired was $46,837, resulting in goodwill of $22,290.
On October 29, 2010, the Company acquired all of the outstanding stock of Mezhgosmetiz-Mtsensk OAO ("MGM"), a privately-held welding wire manufacturer based in the Orel region of Russia, for approximately $28,500 in cash and assumed debt. This acquisition represented the Company's first manufacturing operation in Russia as well as established distribution channels to serve the growing Russian and CIS welding markets. Annual sales for MGM at the date of acquisition were approximately $30,000.
Pro forma information related to these acquisitions has not been presented because the impact on the Company's Consolidated Statements of Income is not material. Acquired companies are included in the Company's consolidated financial statements as of the date of acquisition.
NOTE 4 – GOODWILL AND INTANGIBLES
The Company performs an annual impairment test of goodwill and indefinite-lived intangible assets in the fourth quarter using the same dates each year or more frequently if changes in circumstances or the occurrence of events indicate potential impairment. The fair value of each indefinite-lived intangible asset is compared to its carrying value and an impairment charge is recorded if the carrying value exceeds the fair value. Goodwill is tested by comparing the fair value of each reporting unit with its carrying value. If the carrying value of the reporting unit exceeds its fair value, the implied value of goodwill is compared to its carrying value and impairment is recognized to the extent that the carrying value exceeds the implied fair value.
Fair values are determined using established business valuation multiples and models developed by the Company that incorporate allocations of certain assets and cash flows among reporting units, estimates of market participant assumptions of future cash flows, future growth rates and the applicable discount rates to value estimated cash flows. Changes in economic and operating conditions impacting these assumptions could result in asset impairments in future periods. The Company's annual impairment test of goodwill and indefinite-lived intangible assets in 2012 resulted in no impairment loss being recognized.
The changes in the carrying amount of goodwill by reportable segment for the years ended December 31, 2012 and 2011 were as follows:
NorthAmericaWelding
EuropeWelding
AsiaPacific
Welding
SouthAmericaWelding
The HarrisProductsGroup Consolidated
Balance as of January 1, 2011 $ 5,069 $ 16,379 $ 5,030 $ 565 $ 18,909 $ 45,952Additions and adjustments 13,478 9,543 — — (1,247) 21,774Foreign currency translation (33) (2,055) 178 (4) (711) (2,625)
Balance as of December 31, 2011 18,514 23,867 5,208 561 16,951 65,101Additions and adjustments 67,740 66 — — (1,109) 66,697Foreign currency translation 23 1,424 40 53 (435) 1,105
Balance as of December 31, 2012 $ 86,277 $ 25,357 $ 5,248 $ 614 $ 15,407 $ 132,903
Additions to goodwill primarily reflect goodwill recognized in the acquisitions of Weartech, Wayne Trail, Kaliburn and Tenn Rand in 2012 and the acquisitions of Arc Products, Severstal, Torchmate and Techalloy in 2011 (see Note 3). Reductions to goodwill result from the tax benefit attributable to the amortization of tax deductible goodwill in excess of goodwill recorded for financial reporting purposes.
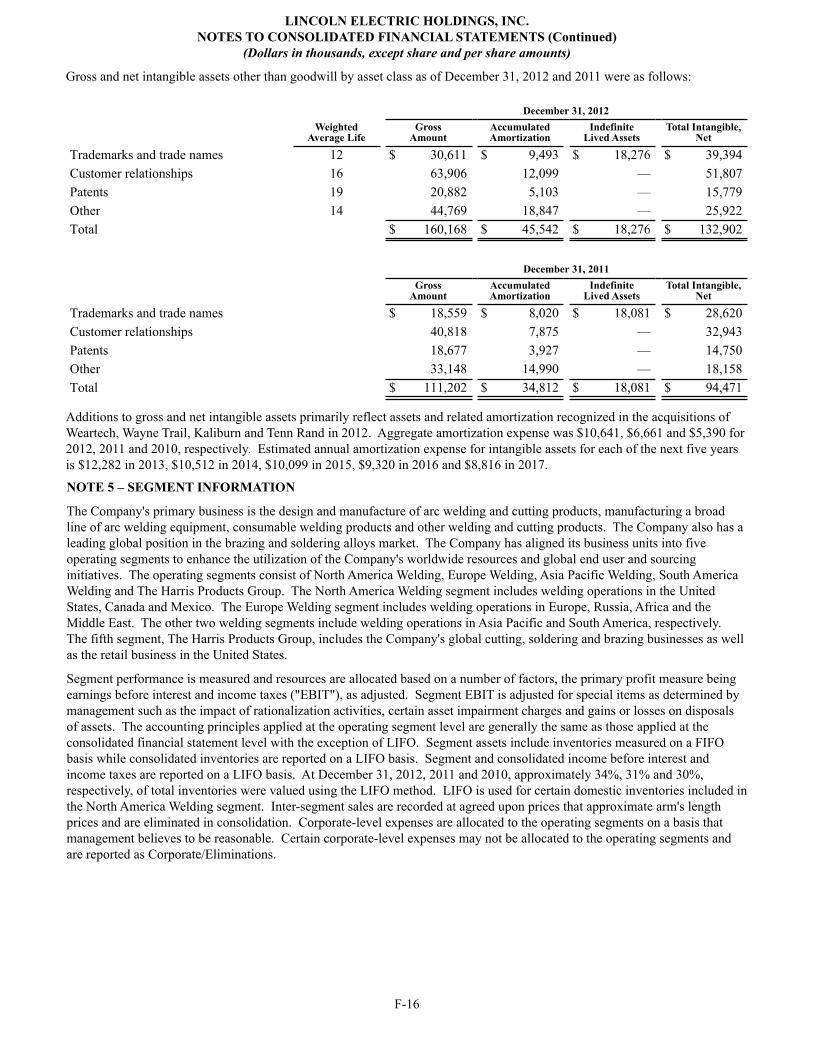
LINCOLN ELECTRIC HOLDINGS, INC.NOTES TO CONSOLIDATED FINANCIAL STATEMENTS (Continued)
(Dollars in thousands, except share and per share amounts)
F-16
Gross and net intangible assets other than goodwill by asset class as of December 31, 2012 and 2011 were as follows:
December 31, 2012
Weighted
Average LifeGross
AmountAccumulatedAmortization
IndefiniteLived Assets
Total Intangible,Net
Trademarks and trade names 12 $ 30,611 $ 9,493 $ 18,276 $ 39,394Customer relationships 16 63,906 12,099 — 51,807Patents 19 20,882 5,103 — 15,779Other 14 44,769 18,847 — 25,922Total $ 160,168 $ 45,542 $ 18,276 $ 132,902
December 31, 2011
Gross
AmountAccumulatedAmortization
IndefiniteLived Assets
Total Intangible,Net
Trademarks and trade names $ 18,559 $ 8,020 $ 18,081 $ 28,620Customer relationships 40,818 7,875 — 32,943Patents 18,677 3,927 — 14,750Other 33,148 14,990 — 18,158Total $ 111,202 $ 34,812 $ 18,081 $ 94,471
Additions to gross and net intangible assets primarily reflect assets and related amortization recognized in the acquisitions of Weartech, Wayne Trail, Kaliburn and Tenn Rand in 2012. Aggregate amortization expense was $10,641, $6,661 and $5,390 for 2012, 2011 and 2010, respectively. Estimated annual amortization expense for intangible assets for each of the next five years is $12,282 in 2013, $10,512 in 2014, $10,099 in 2015, $9,320 in 2016 and $8,816 in 2017.
NOTE 5 – SEGMENT INFORMATION
The Company's primary business is the design and manufacture of arc welding and cutting products, manufacturing a broad line of arc welding equipment, consumable welding products and other welding and cutting products. The Company also has a leading global position in the brazing and soldering alloys market. The Company has aligned its business units into five operating segments to enhance the utilization of the Company's worldwide resources and global end user and sourcing initiatives. The operating segments consist of North America Welding, Europe Welding, Asia Pacific Welding, South America Welding and The Harris Products Group. The North America Welding segment includes welding operations in the United States, Canada and Mexico. The Europe Welding segment includes welding operations in Europe, Russia, Africa and the Middle East. The other two welding segments include welding operations in Asia Pacific and South America, respectively. The fifth segment, The Harris Products Group, includes the Company's global cutting, soldering and brazing businesses as well as the retail business in the United States.
Segment performance is measured and resources are allocated based on a number of factors, the primary profit measure being earnings before interest and income taxes ("EBIT"), as adjusted. Segment EBIT is adjusted for special items as determined by management such as the impact of rationalization activities, certain asset impairment charges and gains or losses on disposals of assets. The accounting principles applied at the operating segment level are generally the same as those applied at the consolidated financial statement level with the exception of LIFO. Segment assets include inventories measured on a FIFO basis while consolidated inventories are reported on a LIFO basis. Segment and consolidated income before interest and income taxes are reported on a LIFO basis. At December 31, 2012, 2011 and 2010, approximately 34%, 31% and 30%, respectively, of total inventories were valued using the LIFO method. LIFO is used for certain domestic inventories included in the North America Welding segment. Inter-segment sales are recorded at agreed upon prices that approximate arm's length prices and are eliminated in consolidation. Corporate-level expenses are allocated to the operating segments on a basis that management believes to be reasonable. Certain corporate-level expenses may not be allocated to the operating segments and are reported as Corporate/Eliminations.
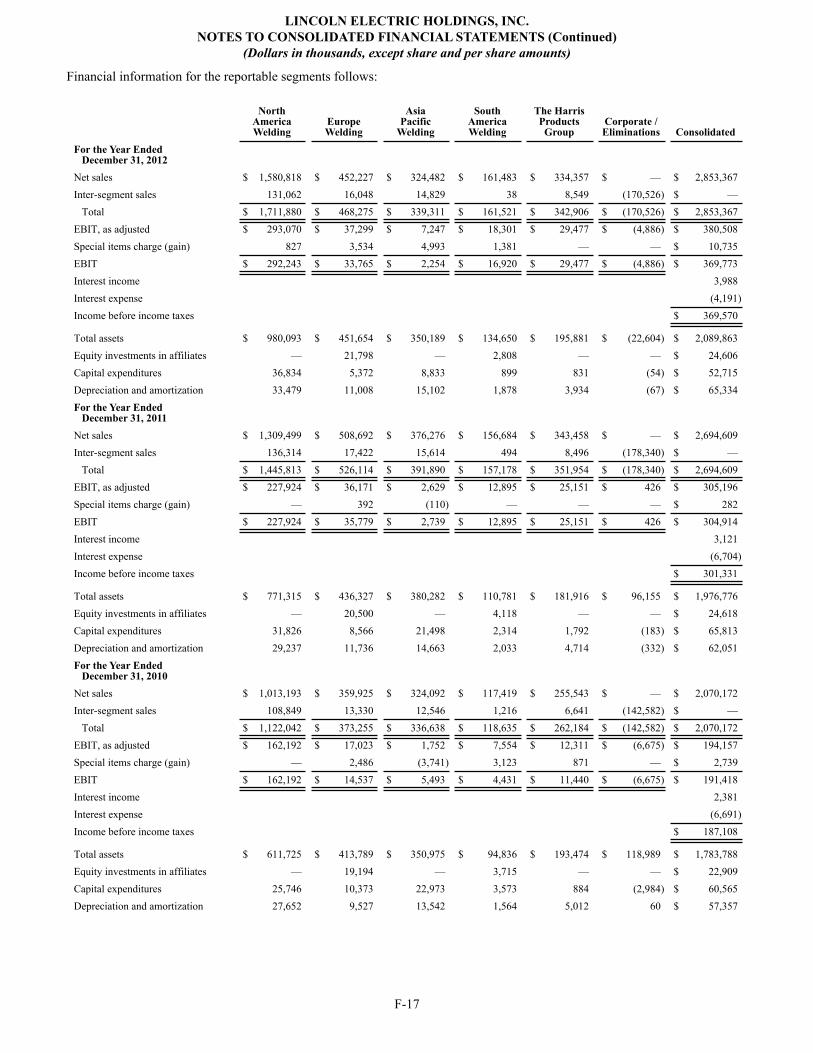
LINCOLN ELECTRIC HOLDINGS, INC.NOTES TO CONSOLIDATED FINANCIAL STATEMENTS (Continued)
(Dollars in thousands, except share and per share amounts)
F-17
Financial information for the reportable segments follows:
NorthAmericaWelding
EuropeWelding
AsiaPacific
Welding
SouthAmericaWelding
The HarrisProductsGroup
Corporate /Eliminations Consolidated
For the Year Ended December 31, 2012Net sales $ 1,580,818 $ 452,227 $ 324,482 $ 161,483 $ 334,357 $ — $ 2,853,367Inter-segment sales 131,062 16,048 14,829 38 8,549 (170,526) $ —
Total $ 1,711,880 $ 468,275 $ 339,311 $ 161,521 $ 342,906 $ (170,526) $ 2,853,367EBIT, as adjusted $ 293,070 $ 37,299 $ 7,247 $ 18,301 $ 29,477 $ (4,886) $ 380,508Special items charge (gain) 827 3,534 4,993 1,381 — — $ 10,735EBIT $ 292,243 $ 33,765 $ 2,254 $ 16,920 $ 29,477 $ (4,886) $ 369,773Interest income 3,988Interest expense (4,191)Income before income taxes $ 369,570
Total assets $ 980,093 $ 451,654 $ 350,189 $ 134,650 $ 195,881 $ (22,604) $ 2,089,863Equity investments in affiliates — 21,798 — 2,808 — — $ 24,606Capital expenditures 36,834 5,372 8,833 899 831 (54) $ 52,715Depreciation and amortization 33,479 11,008 15,102 1,878 3,934 (67) $ 65,334For the Year Ended December 31, 2011Net sales $ 1,309,499 $ 508,692 $ 376,276 $ 156,684 $ 343,458 $ — $ 2,694,609Inter-segment sales 136,314 17,422 15,614 494 8,496 (178,340) $ —
Total $ 1,445,813 $ 526,114 $ 391,890 $ 157,178 $ 351,954 $ (178,340) $ 2,694,609EBIT, as adjusted $ 227,924 $ 36,171 $ 2,629 $ 12,895 $ 25,151 $ 426 $ 305,196Special items charge (gain) — 392 (110) — — — $ 282EBIT $ 227,924 $ 35,779 $ 2,739 $ 12,895 $ 25,151 $ 426 $ 304,914Interest income 3,121Interest expense (6,704)Income before income taxes $ 301,331
Total assets $ 771,315 $ 436,327 $ 380,282 $ 110,781 $ 181,916 $ 96,155 $ 1,976,776Equity investments in affiliates — 20,500 — 4,118 — — $ 24,618Capital expenditures 31,826 8,566 21,498 2,314 1,792 (183) $ 65,813Depreciation and amortization 29,237 11,736 14,663 2,033 4,714 (332) $ 62,051For the Year Ended December 31, 2010Net sales $ 1,013,193 $ 359,925 $ 324,092 $ 117,419 $ 255,543 $ — $ 2,070,172Inter-segment sales 108,849 13,330 12,546 1,216 6,641 (142,582) $ —
Total $ 1,122,042 $ 373,255 $ 336,638 $ 118,635 $ 262,184 $ (142,582) $ 2,070,172EBIT, as adjusted $ 162,192 $ 17,023 $ 1,752 $ 7,554 $ 12,311 $ (6,675) $ 194,157Special items charge (gain) — 2,486 (3,741) 3,123 871 — $ 2,739EBIT $ 162,192 $ 14,537 $ 5,493 $ 4,431 $ 11,440 $ (6,675) $ 191,418Interest income 2,381Interest expense (6,691)Income before income taxes $ 187,108
Total assets $ 611,725 $ 413,789 $ 350,975 $ 94,836 $ 193,474 $ 118,989 $ 1,783,788Equity investments in affiliates — 19,194 — 3,715 — — $ 22,909Capital expenditures 25,746 10,373 22,973 3,573 884 (2,984) $ 60,565Depreciation and amortization 27,652 9,527 13,542 1,564 5,012 60 $ 57,357
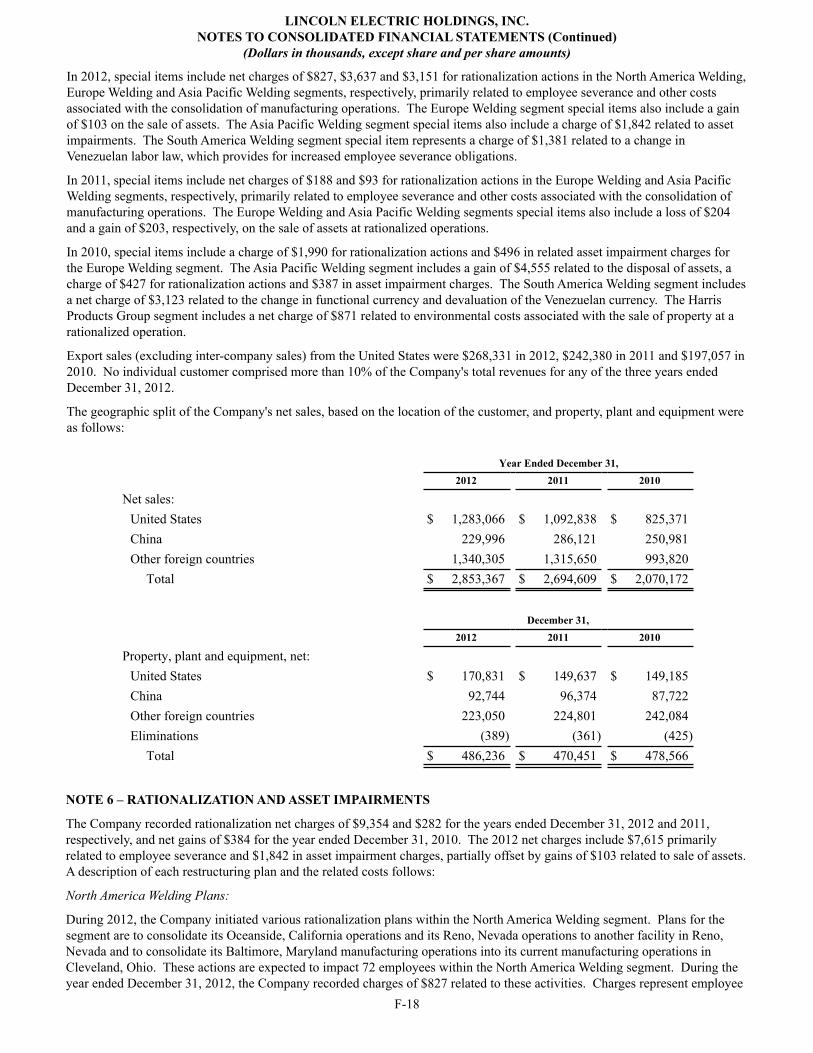
LINCOLN ELECTRIC HOLDINGS, INC.NOTES TO CONSOLIDATED FINANCIAL STATEMENTS (Continued)
(Dollars in thousands, except share and per share amounts)
F-18
In 2012, special items include net charges of $827, $3,637 and $3,151 for rationalization actions in the North America Welding, Europe Welding and Asia Pacific Welding segments, respectively, primarily related to employee severance and other costs associated with the consolidation of manufacturing operations. The Europe Welding segment special items also include a gain of $103 on the sale of assets. The Asia Pacific Welding segment special items also include a charge of $1,842 related to asset impairments. The South America Welding segment special item represents a charge of $1,381 related to a change in Venezuelan labor law, which provides for increased employee severance obligations.
In 2011, special items include net charges of $188 and $93 for rationalization actions in the Europe Welding and Asia Pacific Welding segments, respectively, primarily related to employee severance and other costs associated with the consolidation of manufacturing operations. The Europe Welding and Asia Pacific Welding segments special items also include a loss of $204 and a gain of $203, respectively, on the sale of assets at rationalized operations.
In 2010, special items include a charge of $1,990 for rationalization actions and $496 in related asset impairment charges for the Europe Welding segment. The Asia Pacific Welding segment includes a gain of $4,555 related to the disposal of assets, a charge of $427 for rationalization actions and $387 in asset impairment charges. The South America Welding segment includes a net charge of $3,123 related to the change in functional currency and devaluation of the Venezuelan currency. The Harris Products Group segment includes a net charge of $871 related to environmental costs associated with the sale of property at a rationalized operation.
Export sales (excluding inter-company sales) from the United States were $268,331 in 2012, $242,380 in 2011 and $197,057 in 2010. No individual customer comprised more than 10% of the Company's total revenues for any of the three years ended December 31, 2012.
The geographic split of the Company's net sales, based on the location of the customer, and property, plant and equipment were as follows:
Year Ended December 31, 2012 2011 2010
Net sales: United States $ 1,283,066 $ 1,092,838 $ 825,371China 229,996 286,121 250,981Other foreign countries 1,340,305 1,315,650 993,820
Total $ 2,853,367 $ 2,694,609 $ 2,070,172
December 31, 2012 2011 2010
Property, plant and equipment, net: United States $ 170,831 $ 149,637 $ 149,185China 92,744 96,374 87,722Other foreign countries 223,050 224,801 242,084Eliminations (389) (361) (425)
Total $ 486,236 $ 470,451 $ 478,566
NOTE 6 – RATIONALIZATION AND ASSET IMPAIRMENTS
The Company recorded rationalization net charges of $9,354 and $282 for the years ended December 31, 2012 and 2011, respectively, and net gains of $384 for the year ended December 31, 2010. The 2012 net charges include $7,615 primarily related to employee severance and $1,842 in asset impairment charges, partially offset by gains of $103 related to sale of assets. A description of each restructuring plan and the related costs follows:
North America Welding Plans:
During 2012, the Company initiated various rationalization plans within the North America Welding segment. Plans for the segment are to consolidate its Oceanside, California operations and its Reno, Nevada operations to another facility in Reno, Nevada and to consolidate its Baltimore, Maryland manufacturing operations into its current manufacturing operations in Cleveland, Ohio. These actions are expected to impact 72 employees within the North America Welding segment. During the year ended December 31, 2012, the Company recorded charges of $827 related to these activities. Charges represent employee
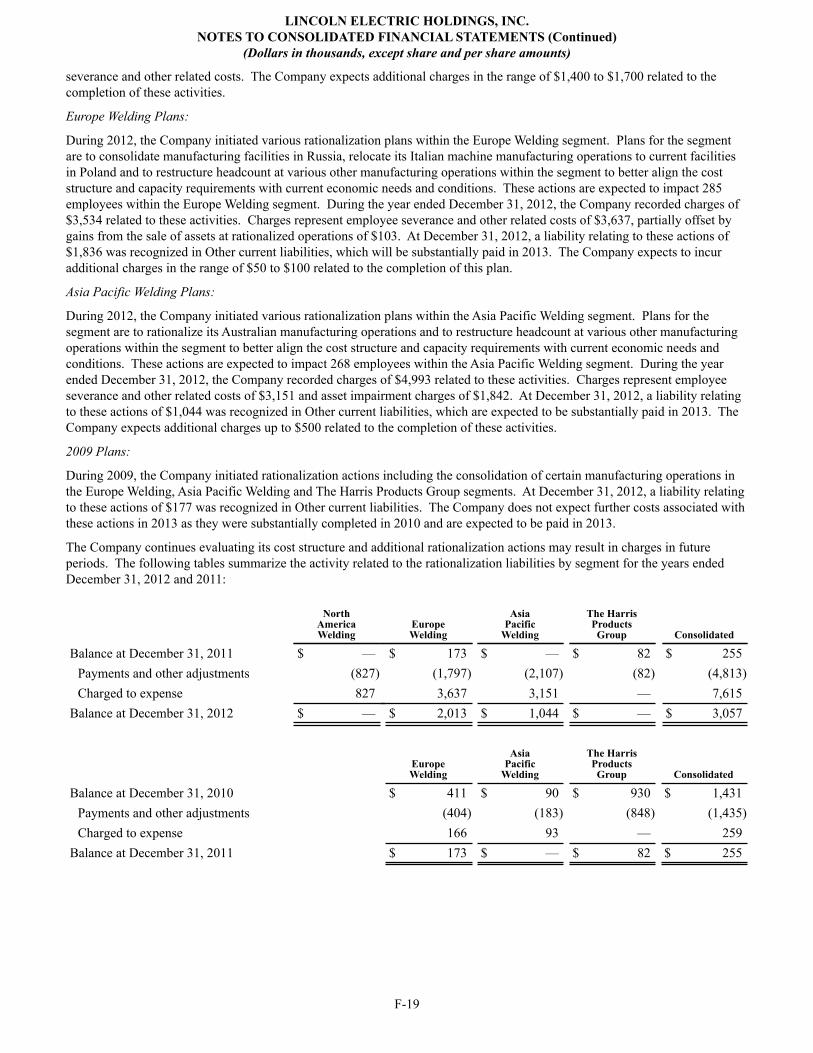
LINCOLN ELECTRIC HOLDINGS, INC.NOTES TO CONSOLIDATED FINANCIAL STATEMENTS (Continued)
(Dollars in thousands, except share and per share amounts)
F-19
severance and other related costs. The Company expects additional charges in the range of $1,400 to $1,700 related to the completion of these activities.
Europe Welding Plans:
During 2012, the Company initiated various rationalization plans within the Europe Welding segment. Plans for the segment are to consolidate manufacturing facilities in Russia, relocate its Italian machine manufacturing operations to current facilities in Poland and to restructure headcount at various other manufacturing operations within the segment to better align the cost structure and capacity requirements with current economic needs and conditions. These actions are expected to impact 285 employees within the Europe Welding segment. During the year ended December 31, 2012, the Company recorded charges of $3,534 related to these activities. Charges represent employee severance and other related costs of $3,637, partially offset by gains from the sale of assets at rationalized operations of $103. At December 31, 2012, a liability relating to these actions of $1,836 was recognized in Other current liabilities, which will be substantially paid in 2013. The Company expects to incur additional charges in the range of $50 to $100 related to the completion of this plan.
Asia Pacific Welding Plans:
During 2012, the Company initiated various rationalization plans within the Asia Pacific Welding segment. Plans for the segment are to rationalize its Australian manufacturing operations and to restructure headcount at various other manufacturing operations within the segment to better align the cost structure and capacity requirements with current economic needs and conditions. These actions are expected to impact 268 employees within the Asia Pacific Welding segment. During the year ended December 31, 2012, the Company recorded charges of $4,993 related to these activities. Charges represent employee severance and other related costs of $3,151 and asset impairment charges of $1,842. At December 31, 2012, a liability relating to these actions of $1,044 was recognized in Other current liabilities, which are expected to be substantially paid in 2013. The Company expects additional charges up to $500 related to the completion of these activities.
2009 Plans:
During 2009, the Company initiated rationalization actions including the consolidation of certain manufacturing operations in the Europe Welding, Asia Pacific Welding and The Harris Products Group segments. At December 31, 2012, a liability relating to these actions of $177 was recognized in Other current liabilities. The Company does not expect further costs associated with these actions in 2013 as they were substantially completed in 2010 and are expected to be paid in 2013.
The Company continues evaluating its cost structure and additional rationalization actions may result in charges in future periods. The following tables summarize the activity related to the rationalization liabilities by segment for the years ended December 31, 2012 and 2011:
North America Welding
EuropeWelding
AsiaPacific
Welding
The HarrisProductsGroup Consolidated
Balance at December 31, 2011 $ — $ 173 $ — $ 82 $ 255Payments and other adjustments (827) (1,797) (2,107) (82) (4,813)Charged to expense 827 3,637 3,151 — 7,615
Balance at December 31, 2012 $ — $ 2,013 $ 1,044 $ — $ 3,057
EuropeWelding
AsiaPacific
Welding
The HarrisProductsGroup Consolidated
Balance at December 31, 2010 $ 411 $ 90 $ 930 $ 1,431Payments and other adjustments (404) (183) (848) (1,435)Charged to expense 166 93 — 259
Balance at December 31, 2011 $ 173 $ — $ 82 $ 255
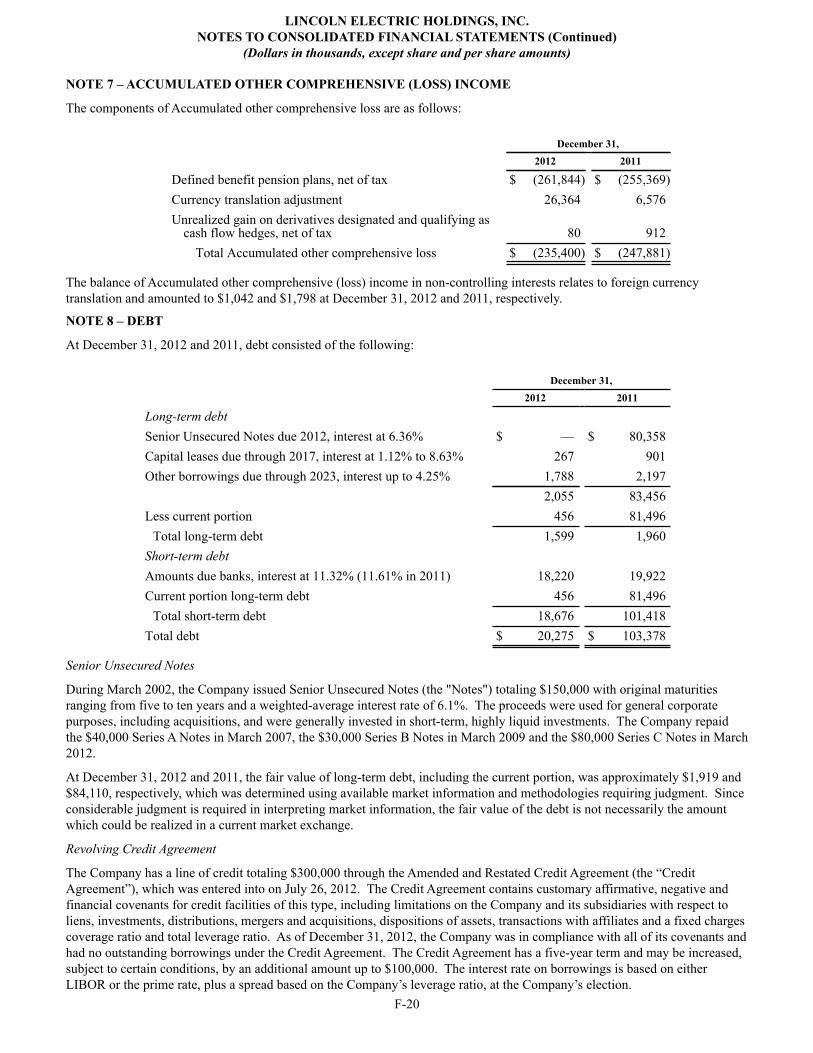
LINCOLN ELECTRIC HOLDINGS, INC.NOTES TO CONSOLIDATED FINANCIAL STATEMENTS (Continued)
(Dollars in thousands, except share and per share amounts)
F-20
NOTE 7 – ACCUMULATED OTHER COMPREHENSIVE (LOSS) INCOME
The components of Accumulated other comprehensive loss are as follows:
December 31, 2012 2011
Defined benefit pension plans, net of tax $ (261,844) $ (255,369)Currency translation adjustment 26,364 6,576Unrealized gain on derivatives designated and qualifying as
cash flow hedges, net of tax 80 912Total Accumulated other comprehensive loss $ (235,400) $ (247,881)
The balance of Accumulated other comprehensive (loss) income in non-controlling interests relates to foreign currency translation and amounted to $1,042 and $1,798 at December 31, 2012 and 2011, respectively.
NOTE 8 – DEBT
At December 31, 2012 and 2011, debt consisted of the following:
December 31, 2012 2011
Long-term debt Senior Unsecured Notes due 2012, interest at 6.36% $ — $ 80,358Capital leases due through 2017, interest at 1.12% to 8.63% 267 901Other borrowings due through 2023, interest up to 4.25% 1,788 2,197
2,055 83,456Less current portion 456 81,496
Total long-term debt 1,599 1,960Short-term debt Amounts due banks, interest at 11.32% (11.61% in 2011) 18,220 19,922Current portion long-term debt 456 81,496
Total short-term debt 18,676 101,418Total debt $ 20,275 $ 103,378
Senior Unsecured Notes
During March 2002, the Company issued Senior Unsecured Notes (the "Notes") totaling $150,000 with original maturities ranging from five to ten years and a weighted-average interest rate of 6.1%. The proceeds were used for general corporate purposes, including acquisitions, and were generally invested in short-term, highly liquid investments. The Company repaid the $40,000 Series A Notes in March 2007, the $30,000 Series B Notes in March 2009 and the $80,000 Series C Notes in March 2012.
At December 31, 2012 and 2011, the fair value of long-term debt, including the current portion, was approximately $1,919 and $84,110, respectively, which was determined using available market information and methodologies requiring judgment. Since considerable judgment is required in interpreting market information, the fair value of the debt is not necessarily the amount which could be realized in a current market exchange.
Revolving Credit Agreement
The Company has a line of credit totaling $300,000 through the Amended and Restated Credit Agreement (the “Credit Agreement”), which was entered into on July 26, 2012. The Credit Agreement contains customary affirmative, negative and financial covenants for credit facilities of this type, including limitations on the Company and its subsidiaries with respect to liens, investments, distributions, mergers and acquisitions, dispositions of assets, transactions with affiliates and a fixed charges coverage ratio and total leverage ratio. As of December 31, 2012, the Company was in compliance with all of its covenants and had no outstanding borrowings under the Credit Agreement. The Credit Agreement has a five-year term and may be increased, subject to certain conditions, by an additional amount up to $100,000. The interest rate on borrowings is based on either LIBOR or the prime rate, plus a spread based on the Company’s leverage ratio, at the Company’s election.
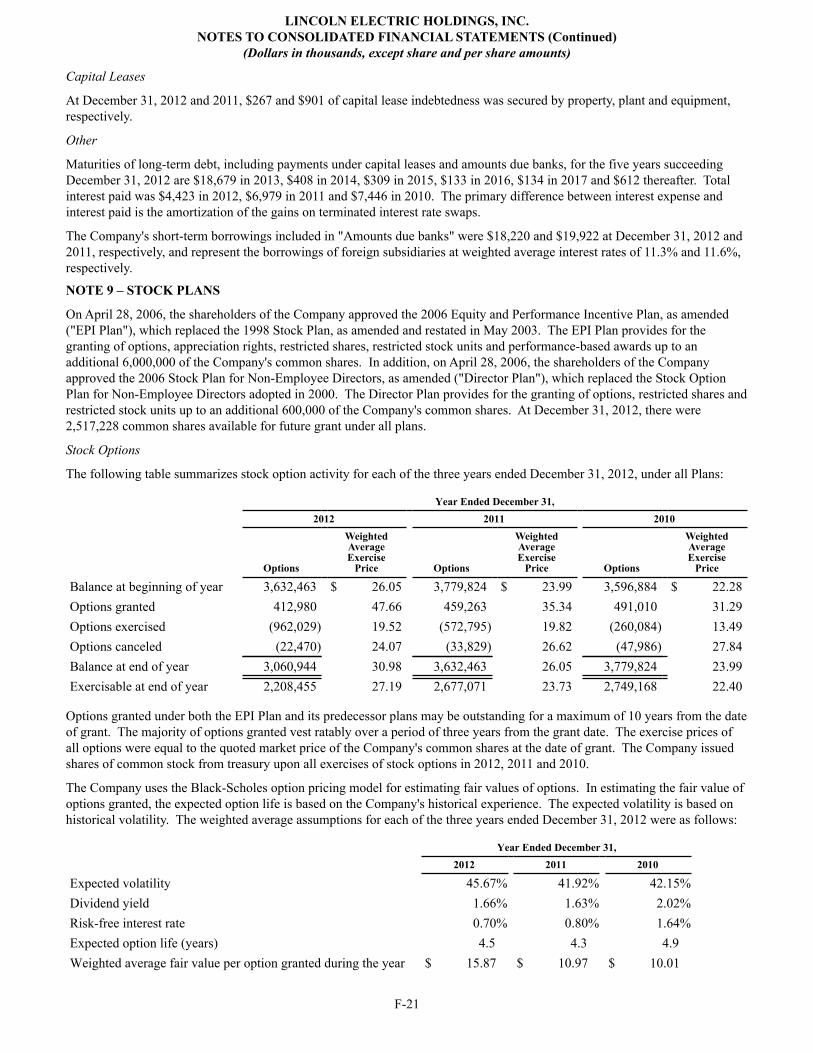
LINCOLN ELECTRIC HOLDINGS, INC.NOTES TO CONSOLIDATED FINANCIAL STATEMENTS (Continued)
(Dollars in thousands, except share and per share amounts)
F-21
Capital Leases
At December 31, 2012 and 2011, $267 and $901 of capital lease indebtedness was secured by property, plant and equipment, respectively.
Other
Maturities of long-term debt, including payments under capital leases and amounts due banks, for the five years succeeding December 31, 2012 are $18,679 in 2013, $408 in 2014, $309 in 2015, $133 in 2016, $134 in 2017 and $612 thereafter. Total interest paid was $4,423 in 2012, $6,979 in 2011 and $7,446 in 2010. The primary difference between interest expense and interest paid is the amortization of the gains on terminated interest rate swaps.
The Company's short-term borrowings included in "Amounts due banks" were $18,220 and $19,922 at December 31, 2012 and 2011, respectively, and represent the borrowings of foreign subsidiaries at weighted average interest rates of 11.3% and 11.6%, respectively.
NOTE 9 – STOCK PLANS
On April 28, 2006, the shareholders of the Company approved the 2006 Equity and Performance Incentive Plan, as amended ("EPI Plan"), which replaced the 1998 Stock Plan, as amended and restated in May 2003. The EPI Plan provides for the granting of options, appreciation rights, restricted shares, restricted stock units and performance-based awards up to an additional 6,000,000 of the Company's common shares. In addition, on April 28, 2006, the shareholders of the Company approved the 2006 Stock Plan for Non-Employee Directors, as amended ("Director Plan"), which replaced the Stock Option Plan for Non-Employee Directors adopted in 2000. The Director Plan provides for the granting of options, restricted shares and restricted stock units up to an additional 600,000 of the Company's common shares. At December 31, 2012, there were 2,517,228 common shares available for future grant under all plans.
Stock Options
The following table summarizes stock option activity for each of the three years ended December 31, 2012, under all Plans:
Year Ended December 31, 2012 2011 2010
Options
WeightedAverageExercise
Price Options
WeightedAverageExercise
Price Options
WeightedAverageExercise
Price
Balance at beginning of year 3,632,463 $ 26.05 3,779,824 $ 23.99 3,596,884 $ 22.28Options granted 412,980 47.66 459,263 35.34 491,010 31.29Options exercised (962,029) 19.52 (572,795) 19.82 (260,084) 13.49Options canceled (22,470) 24.07 (33,829) 26.62 (47,986) 27.84Balance at end of year 3,060,944 30.98 3,632,463 26.05 3,779,824 23.99Exercisable at end of year 2,208,455 27.19 2,677,071 23.73 2,749,168 22.40
Options granted under both the EPI Plan and its predecessor plans may be outstanding for a maximum of 10 years from the date of grant. The majority of options granted vest ratably over a period of three years from the grant date. The exercise prices of all options were equal to the quoted market price of the Company's common shares at the date of grant. The Company issued shares of common stock from treasury upon all exercises of stock options in 2012, 2011 and 2010.
The Company uses the Black-Scholes option pricing model for estimating fair values of options. In estimating the fair value of options granted, the expected option life is based on the Company's historical experience. The expected volatility is based on historical volatility. The weighted average assumptions for each of the three years ended December 31, 2012 were as follows:
Year Ended December 31, 2012 2011 2010
Expected volatility 45.67% 41.92% 42.15%Dividend yield 1.66% 1.63% 2.02%Risk-free interest rate 0.70% 0.80% 1.64%Expected option life (years) 4.5 4.3 4.9Weighted average fair value per option granted during the year $ 15.87 $ 10.97 $ 10.01
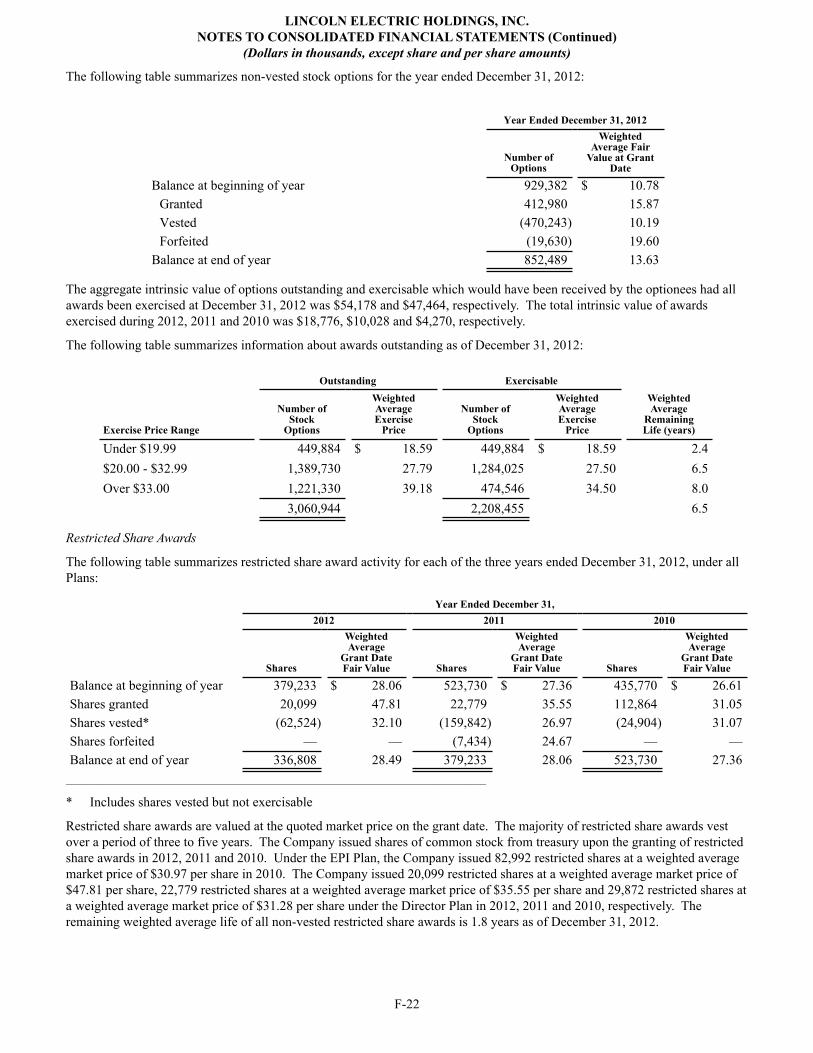
LINCOLN ELECTRIC HOLDINGS, INC.NOTES TO CONSOLIDATED FINANCIAL STATEMENTS (Continued)
(Dollars in thousands, except share and per share amounts)
F-22
The following table summarizes non-vested stock options for the year ended December 31, 2012:
Year Ended December 31, 2012
Number of
Options
WeightedAverage Fair
Value at GrantDate
Balance at beginning of year 929,382 $ 10.78Granted 412,980 15.87Vested (470,243) 10.19Forfeited (19,630) 19.60
Balance at end of year 852,489 13.63
The aggregate intrinsic value of options outstanding and exercisable which would have been received by the optionees had all awards been exercised at December 31, 2012 was $54,178 and $47,464, respectively. The total intrinsic value of awards exercised during 2012, 2011 and 2010 was $18,776, $10,028 and $4,270, respectively.
The following table summarizes information about awards outstanding as of December 31, 2012:
Outstanding Exercisable
Exercise Price Range
Number ofStock
Options
WeightedAverageExercise
Price
Number ofStock
Options
WeightedAverageExercise
Price
WeightedAverage
RemainingLife (years)
Under $19.99 449,884 $ 18.59 449,884 $ 18.59 2.4$20.00 - $32.99 1,389,730 27.79 1,284,025 27.50 6.5Over $33.00 1,221,330 39.18 474,546 34.50 8.0
3,060,944 2,208,455 6.5
Restricted Share Awards
The following table summarizes restricted share award activity for each of the three years ended December 31, 2012, under all Plans:
Year Ended December 31, 2012 2011 2010
Shares
WeightedAverage
Grant DateFair Value Shares
WeightedAverage
Grant DateFair Value Shares
WeightedAverage
Grant DateFair Value
Balance at beginning of year 379,233 $ 28.06 523,730 $ 27.36 435,770 $ 26.61Shares granted 20,099 47.81 22,779 35.55 112,864 31.05Shares vested* (62,524) 32.10 (159,842) 26.97 (24,904) 31.07Shares forfeited — — (7,434) 24.67 — —Balance at end of year 336,808 28.49 379,233 28.06 523,730 27.36
_______________________________________________________________________________
* Includes shares vested but not exercisable
Restricted share awards are valued at the quoted market price on the grant date. The majority of restricted share awards vest over a period of three to five years. The Company issued shares of common stock from treasury upon the granting of restricted share awards in 2012, 2011 and 2010. Under the EPI Plan, the Company issued 82,992 restricted shares at a weighted average market price of $30.97 per share in 2010. The Company issued 20,099 restricted shares at a weighted average market price of $47.81 per share, 22,779 restricted shares at a weighted average market price of $35.55 per share and 29,872 restricted shares at a weighted average market price of $31.28 per share under the Director Plan in 2012, 2011 and 2010, respectively. The remaining weighted average life of all non-vested restricted share awards is 1.8 years as of December 31, 2012.
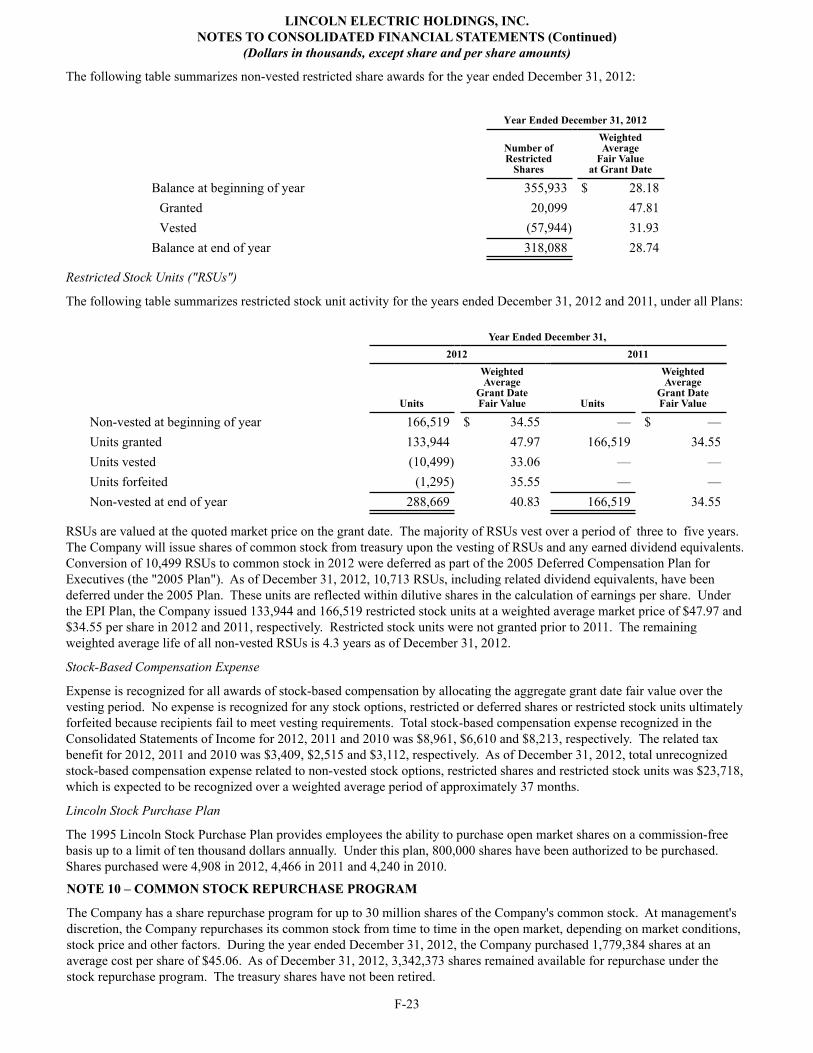
LINCOLN ELECTRIC HOLDINGS, INC.NOTES TO CONSOLIDATED FINANCIAL STATEMENTS (Continued)
(Dollars in thousands, except share and per share amounts)
F-23
The following table summarizes non-vested restricted share awards for the year ended December 31, 2012:
Year Ended December 31, 2012
Number ofRestricted
Shares
WeightedAverage
Fair Valueat Grant Date
Balance at beginning of year 355,933 $ 28.18Granted 20,099 47.81Vested (57,944) 31.93
Balance at end of year 318,088 28.74
Restricted Stock Units ("RSUs")
The following table summarizes restricted stock unit activity for the years ended December 31, 2012 and 2011, under all Plans:
Year Ended December 31,2012 2011
Units
WeightedAverage
Grant DateFair Value Units
WeightedAverage
Grant DateFair Value
Non-vested at beginning of year 166,519 $ 34.55 — $ —Units granted 133,944 47.97 166,519 34.55Units vested (10,499) 33.06 — —Units forfeited (1,295) 35.55 — —Non-vested at end of year 288,669 40.83 166,519 34.55
RSUs are valued at the quoted market price on the grant date. The majority of RSUs vest over a period of three to five years. The Company will issue shares of common stock from treasury upon the vesting of RSUs and any earned dividend equivalents. Conversion of 10,499 RSUs to common stock in 2012 were deferred as part of the 2005 Deferred Compensation Plan for Executives (the "2005 Plan"). As of December 31, 2012, 10,713 RSUs, including related dividend equivalents, have been deferred under the 2005 Plan. These units are reflected within dilutive shares in the calculation of earnings per share. Under the EPI Plan, the Company issued 133,944 and 166,519 restricted stock units at a weighted average market price of $47.97 and $34.55 per share in 2012 and 2011, respectively. Restricted stock units were not granted prior to 2011. The remaining weighted average life of all non-vested RSUs is 4.3 years as of December 31, 2012.
Stock-Based Compensation Expense
Expense is recognized for all awards of stock-based compensation by allocating the aggregate grant date fair value over the vesting period. No expense is recognized for any stock options, restricted or deferred shares or restricted stock units ultimately forfeited because recipients fail to meet vesting requirements. Total stock-based compensation expense recognized in the Consolidated Statements of Income for 2012, 2011 and 2010 was $8,961, $6,610 and $8,213, respectively. The related tax benefit for 2012, 2011 and 2010 was $3,409, $2,515 and $3,112, respectively. As of December 31, 2012, total unrecognized stock-based compensation expense related to non-vested stock options, restricted shares and restricted stock units was $23,718, which is expected to be recognized over a weighted average period of approximately 37 months.
Lincoln Stock Purchase Plan
The 1995 Lincoln Stock Purchase Plan provides employees the ability to purchase open market shares on a commission-free basis up to a limit of ten thousand dollars annually. Under this plan, 800,000 shares have been authorized to be purchased. Shares purchased were 4,908 in 2012, 4,466 in 2011 and 4,240 in 2010.
NOTE 10 – COMMON STOCK REPURCHASE PROGRAM
The Company has a share repurchase program for up to 30 million shares of the Company's common stock. At management's discretion, the Company repurchases its common stock from time to time in the open market, depending on market conditions, stock price and other factors. During the year ended December 31, 2012, the Company purchased 1,779,384 shares at an average cost per share of $45.06. As of December 31, 2012, 3,342,373 shares remained available for repurchase under the stock repurchase program. The treasury shares have not been retired.
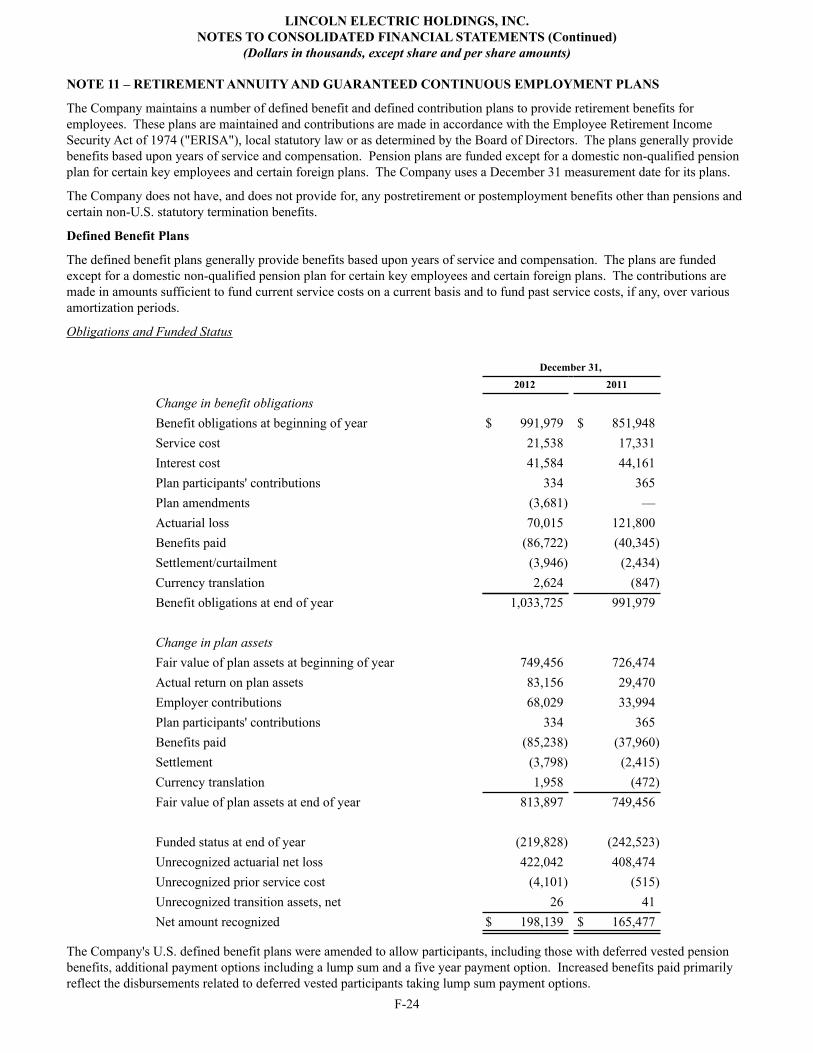
LINCOLN ELECTRIC HOLDINGS, INC.NOTES TO CONSOLIDATED FINANCIAL STATEMENTS (Continued)
(Dollars in thousands, except share and per share amounts)
F-24
NOTE 11 – RETIREMENT ANNUITY AND GUARANTEED CONTINUOUS EMPLOYMENT PLANS
The Company maintains a number of defined benefit and defined contribution plans to provide retirement benefits for employees. These plans are maintained and contributions are made in accordance with the Employee Retirement Income Security Act of 1974 ("ERISA"), local statutory law or as determined by the Board of Directors. The plans generally provide benefits based upon years of service and compensation. Pension plans are funded except for a domestic non-qualified pension plan for certain key employees and certain foreign plans. The Company uses a December 31 measurement date for its plans.
The Company does not have, and does not provide for, any postretirement or postemployment benefits other than pensions and certain non-U.S. statutory termination benefits.
Defined Benefit Plans
The defined benefit plans generally provide benefits based upon years of service and compensation. The plans are funded except for a domestic non-qualified pension plan for certain key employees and certain foreign plans. The contributions are made in amounts sufficient to fund current service costs on a current basis and to fund past service costs, if any, over various amortization periods.
Obligations and Funded Status
December 31, 2012 2011
Change in benefit obligations Benefit obligations at beginning of year $ 991,979 $ 851,948Service cost 21,538 17,331Interest cost 41,584 44,161Plan participants' contributions 334 365Plan amendments (3,681) —Actuarial loss 70,015 121,800Benefits paid (86,722) (40,345)Settlement/curtailment (3,946) (2,434)Currency translation 2,624 (847)Benefit obligations at end of year 1,033,725 991,979
Change in plan assets Fair value of plan assets at beginning of year 749,456 726,474Actual return on plan assets 83,156 29,470Employer contributions 68,029 33,994Plan participants' contributions 334 365Benefits paid (85,238) (37,960)Settlement (3,798) (2,415)Currency translation 1,958 (472)Fair value of plan assets at end of year 813,897 749,456
Funded status at end of year (219,828) (242,523)Unrecognized actuarial net loss 422,042 408,474Unrecognized prior service cost (4,101) (515)Unrecognized transition assets, net 26 41Net amount recognized $ 198,139 $ 165,477
The Company's U.S. defined benefit plans were amended to allow participants, including those with deferred vested pension benefits, additional payment options including a lump sum and a five year payment option. Increased benefits paid primarily reflect the disbursements related to deferred vested participants taking lump sum payment options.
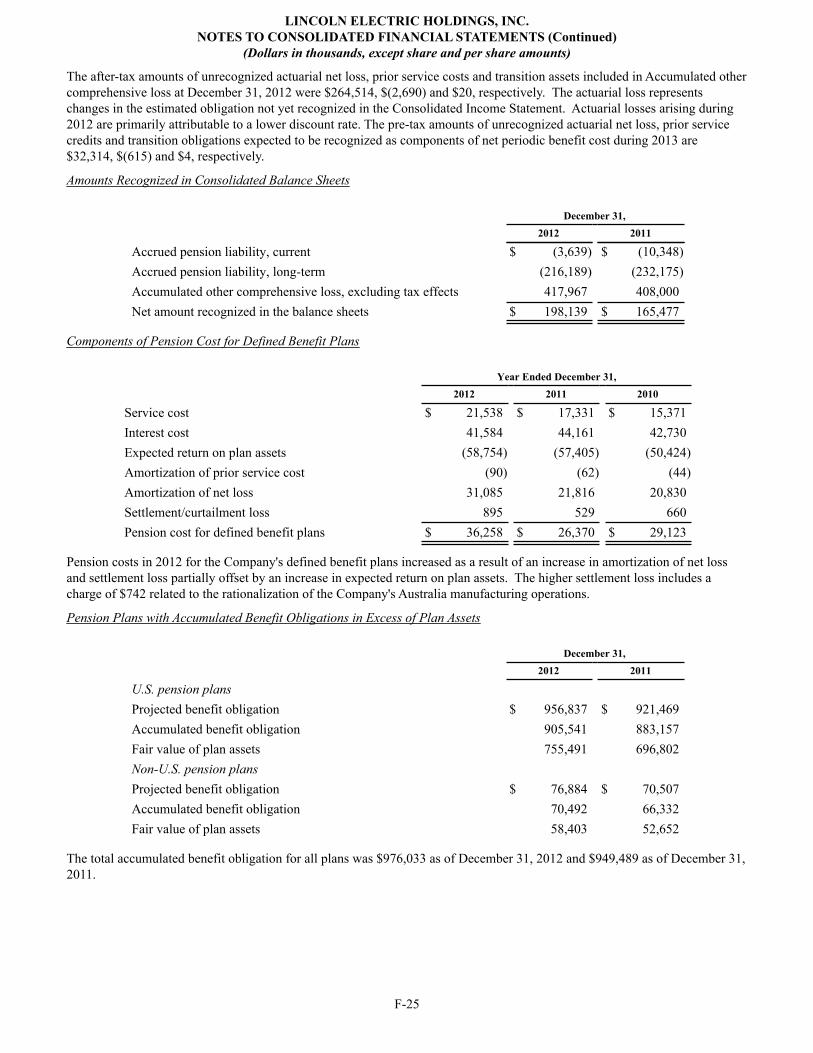
LINCOLN ELECTRIC HOLDINGS, INC.NOTES TO CONSOLIDATED FINANCIAL STATEMENTS (Continued)
(Dollars in thousands, except share and per share amounts)
F-25
The after-tax amounts of unrecognized actuarial net loss, prior service costs and transition assets included in Accumulated other comprehensive loss at December 31, 2012 were $264,514, $(2,690) and $20, respectively. The actuarial loss represents changes in the estimated obligation not yet recognized in the Consolidated Income Statement. Actuarial losses arising during 2012 are primarily attributable to a lower discount rate. The pre-tax amounts of unrecognized actuarial net loss, prior service credits and transition obligations expected to be recognized as components of net periodic benefit cost during 2013 are $32,314, $(615) and $4, respectively.
Amounts Recognized in Consolidated Balance Sheets
December 31, 2012 2011
Accrued pension liability, current $ (3,639) $ (10,348)Accrued pension liability, long-term (216,189) (232,175)Accumulated other comprehensive loss, excluding tax effects 417,967 408,000Net amount recognized in the balance sheets $ 198,139 $ 165,477
Components of Pension Cost for Defined Benefit Plans
Year Ended December 31, 2012 2011 2010
Service cost $ 21,538 $ 17,331 $ 15,371Interest cost 41,584 44,161 42,730Expected return on plan assets (58,754) (57,405) (50,424)Amortization of prior service cost (90) (62) (44)Amortization of net loss 31,085 21,816 20,830Settlement/curtailment loss 895 529 660Pension cost for defined benefit plans $ 36,258 $ 26,370 $ 29,123
Pension costs in 2012 for the Company's defined benefit plans increased as a result of an increase in amortization of net loss and settlement loss partially offset by an increase in expected return on plan assets. The higher settlement loss includes a charge of $742 related to the rationalization of the Company's Australia manufacturing operations.
Pension Plans with Accumulated Benefit Obligations in Excess of Plan Assets
December 31, 2012 2011
U.S. pension plans Projected benefit obligation $ 956,837 $ 921,469Accumulated benefit obligation 905,541 883,157Fair value of plan assets 755,491 696,802Non-U.S. pension plans Projected benefit obligation $ 76,884 $ 70,507Accumulated benefit obligation 70,492 66,332Fair value of plan assets 58,403 52,652
The total accumulated benefit obligation for all plans was $976,033 as of December 31, 2012 and $949,489 as of December 31, 2011.
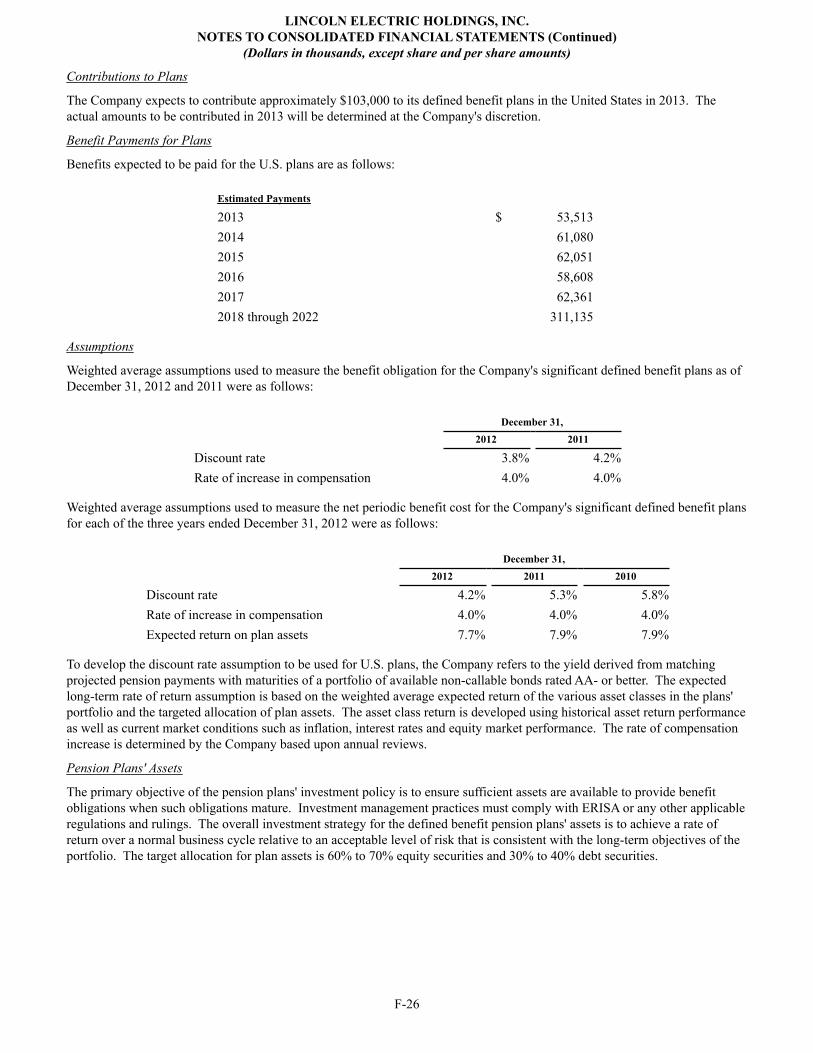
LINCOLN ELECTRIC HOLDINGS, INC.NOTES TO CONSOLIDATED FINANCIAL STATEMENTS (Continued)
(Dollars in thousands, except share and per share amounts)
F-26
Contributions to Plans
The Company expects to contribute approximately $103,000 to its defined benefit plans in the United States in 2013. The actual amounts to be contributed in 2013 will be determined at the Company's discretion.
Benefit Payments for Plans
Benefits expected to be paid for the U.S. plans are as follows:
Estimated Payments
2013 $ 53,5132014 61,0802015 62,0512016 58,6082017 62,3612018 through 2022 311,135
Assumptions
Weighted average assumptions used to measure the benefit obligation for the Company's significant defined benefit plans as of December 31, 2012 and 2011 were as follows:
December 31, 2012 2011
Discount rate 3.8% 4.2%Rate of increase in compensation 4.0% 4.0%
Weighted average assumptions used to measure the net periodic benefit cost for the Company's significant defined benefit plans for each of the three years ended December 31, 2012 were as follows:
December 31, 2012 2011 2010
Discount rate 4.2% 5.3% 5.8%Rate of increase in compensation 4.0% 4.0% 4.0%Expected return on plan assets 7.7% 7.9% 7.9%
To develop the discount rate assumption to be used for U.S. plans, the Company refers to the yield derived from matching projected pension payments with maturities of a portfolio of available non-callable bonds rated AA- or better. The expected long-term rate of return assumption is based on the weighted average expected return of the various asset classes in the plans' portfolio and the targeted allocation of plan assets. The asset class return is developed using historical asset return performance as well as current market conditions such as inflation, interest rates and equity market performance. The rate of compensation increase is determined by the Company based upon annual reviews.
Pension Plans' Assets
The primary objective of the pension plans' investment policy is to ensure sufficient assets are available to provide benefit obligations when such obligations mature. Investment management practices must comply with ERISA or any other applicable regulations and rulings. The overall investment strategy for the defined benefit pension plans' assets is to achieve a rate of return over a normal business cycle relative to an acceptable level of risk that is consistent with the long-term objectives of the portfolio. The target allocation for plan assets is 60% to 70% equity securities and 30% to 40% debt securities.
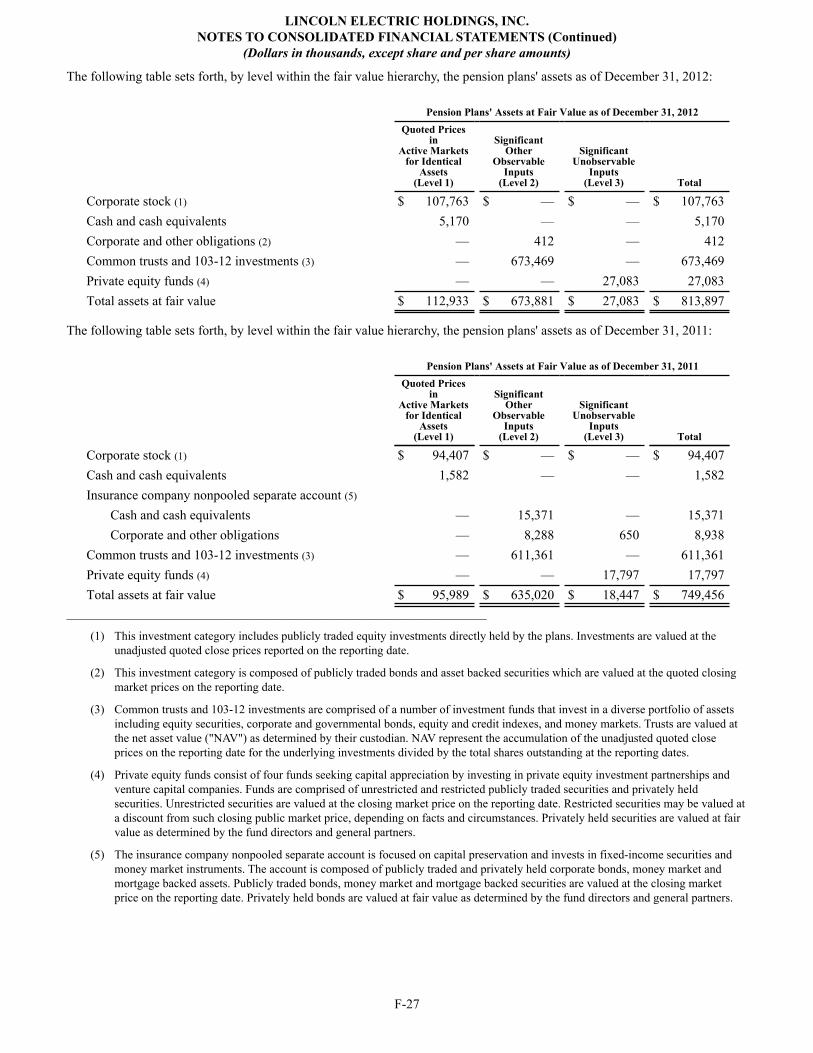
LINCOLN ELECTRIC HOLDINGS, INC.NOTES TO CONSOLIDATED FINANCIAL STATEMENTS (Continued)
(Dollars in thousands, except share and per share amounts)
F-27
The following table sets forth, by level within the fair value hierarchy, the pension plans' assets as of December 31, 2012:
Pension Plans' Assets at Fair Value as of December 31, 2012
Quoted Pricesin
Active Marketsfor Identical
Assets(Level 1)
Significant Other
Observable Inputs
(Level 2)
SignificantUnobservable
Inputs(Level 3) Total
Corporate stock (1) $ 107,763 $ — $ — $ 107,763Cash and cash equivalents 5,170 — — 5,170Corporate and other obligations (2) — 412 — 412Common trusts and 103-12 investments (3) — 673,469 — 673,469Private equity funds (4) — — 27,083 27,083Total assets at fair value $ 112,933 $ 673,881 $ 27,083 $ 813,897
The following table sets forth, by level within the fair value hierarchy, the pension plans' assets as of December 31, 2011:
Pension Plans' Assets at Fair Value as of December 31, 2011
Quoted Pricesin
Active Marketsfor Identical
Assets(Level 1)
Significant Other
Observable Inputs
(Level 2)
SignificantUnobservable
Inputs(Level 3) Total
Corporate stock (1) $ 94,407 $ — $ — $ 94,407Cash and cash equivalents 1,582 — — 1,582Insurance company nonpooled separate account (5)
Cash and cash equivalents — 15,371 — 15,371Corporate and other obligations — 8,288 650 8,938
Common trusts and 103-12 investments (3) — 611,361 — 611,361Private equity funds (4) — — 17,797 17,797Total assets at fair value $ 95,989 $ 635,020 $ 18,447 $ 749,456
_______________________________________________________________________________
(1) This investment category includes publicly traded equity investments directly held by the plans. Investments are valued at the unadjusted quoted close prices reported on the reporting date.
(2) This investment category is composed of publicly traded bonds and asset backed securities which are valued at the quoted closing market prices on the reporting date.
(3) Common trusts and 103-12 investments are comprised of a number of investment funds that invest in a diverse portfolio of assets including equity securities, corporate and governmental bonds, equity and credit indexes, and money markets. Trusts are valued at the net asset value ("NAV") as determined by their custodian. NAV represent the accumulation of the unadjusted quoted close prices on the reporting date for the underlying investments divided by the total shares outstanding at the reporting dates.
(4) Private equity funds consist of four funds seeking capital appreciation by investing in private equity investment partnerships and venture capital companies. Funds are comprised of unrestricted and restricted publicly traded securities and privately held securities. Unrestricted securities are valued at the closing market price on the reporting date. Restricted securities may be valued at a discount from such closing public market price, depending on facts and circumstances. Privately held securities are valued at fair value as determined by the fund directors and general partners.
(5) The insurance company nonpooled separate account is focused on capital preservation and invests in fixed-income securities and money market instruments. The account is composed of publicly traded and privately held corporate bonds, money market and mortgage backed assets. Publicly traded bonds, money market and mortgage backed securities are valued at the closing market price on the reporting date. Privately held bonds are valued at fair value as determined by the fund directors and general partners.
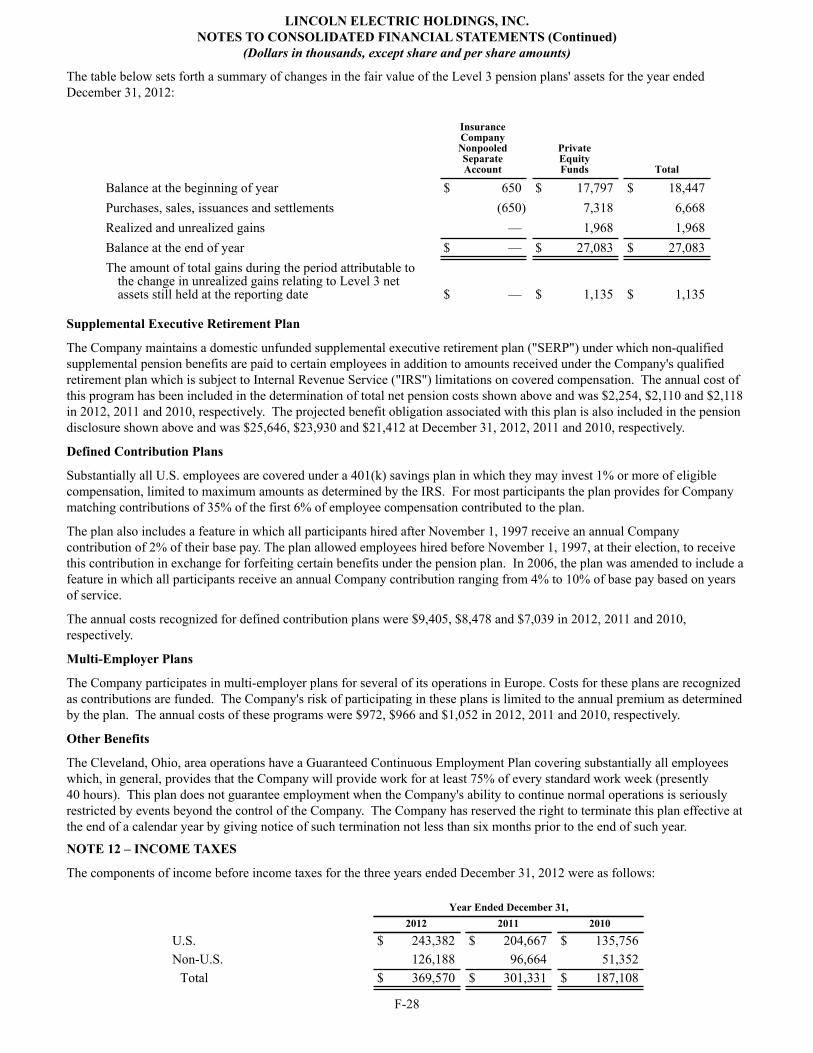
LINCOLN ELECTRIC HOLDINGS, INC.NOTES TO CONSOLIDATED FINANCIAL STATEMENTS (Continued)
(Dollars in thousands, except share and per share amounts)
F-28
The table below sets forth a summary of changes in the fair value of the Level 3 pension plans' assets for the year ended December 31, 2012:
InsuranceCompanyNonpooledSeparateAccount
PrivateEquityFunds Total
Balance at the beginning of year $ 650 $ 17,797 $ 18,447Purchases, sales, issuances and settlements (650) 7,318 6,668Realized and unrealized gains — 1,968 1,968Balance at the end of year $ — $ 27,083 $ 27,083The amount of total gains during the period attributable to
the change in unrealized gains relating to Level 3 net assets still held at the reporting date $ — $ 1,135 $ 1,135
Supplemental Executive Retirement Plan
The Company maintains a domestic unfunded supplemental executive retirement plan ("SERP") under which non-qualified supplemental pension benefits are paid to certain employees in addition to amounts received under the Company's qualified retirement plan which is subject to Internal Revenue Service ("IRS") limitations on covered compensation. The annual cost of this program has been included in the determination of total net pension costs shown above and was $2,254, $2,110 and $2,118 in 2012, 2011 and 2010, respectively. The projected benefit obligation associated with this plan is also included in the pension disclosure shown above and was $25,646, $23,930 and $21,412 at December 31, 2012, 2011 and 2010, respectively.
Defined Contribution Plans
Substantially all U.S. employees are covered under a 401(k) savings plan in which they may invest 1% or more of eligible compensation, limited to maximum amounts as determined by the IRS. For most participants the plan provides for Company matching contributions of 35% of the first 6% of employee compensation contributed to the plan.
The plan also includes a feature in which all participants hired after November 1, 1997 receive an annual Company contribution of 2% of their base pay. The plan allowed employees hired before November 1, 1997, at their election, to receive this contribution in exchange for forfeiting certain benefits under the pension plan. In 2006, the plan was amended to include a feature in which all participants receive an annual Company contribution ranging from 4% to 10% of base pay based on years of service.
The annual costs recognized for defined contribution plans were $9,405, $8,478 and $7,039 in 2012, 2011 and 2010, respectively.
Multi-Employer Plans
The Company participates in multi-employer plans for several of its operations in Europe. Costs for these plans are recognized as contributions are funded. The Company's risk of participating in these plans is limited to the annual premium as determined by the plan. The annual costs of these programs were $972, $966 and $1,052 in 2012, 2011 and 2010, respectively.
Other Benefits
The Cleveland, Ohio, area operations have a Guaranteed Continuous Employment Plan covering substantially all employees which, in general, provides that the Company will provide work for at least 75% of every standard work week (presently 40 hours). This plan does not guarantee employment when the Company's ability to continue normal operations is seriously restricted by events beyond the control of the Company. The Company has reserved the right to terminate this plan effective at the end of a calendar year by giving notice of such termination not less than six months prior to the end of such year.
NOTE 12 – INCOME TAXES
The components of income before income taxes for the three years ended December 31, 2012 were as follows:
Year Ended December 31, 2012 2011 2010
U.S. $ 243,382 $ 204,667 $ 135,756Non-U.S. 126,188 96,664 51,352
Total $ 369,570 $ 301,331 $ 187,108
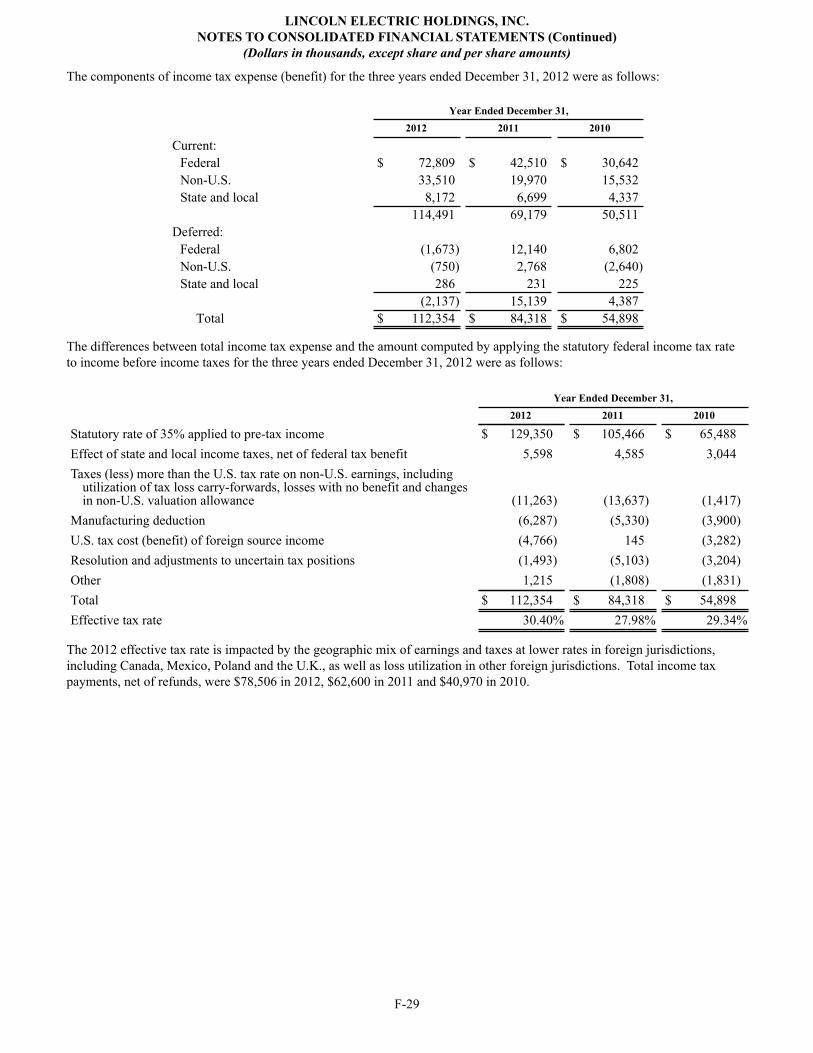
LINCOLN ELECTRIC HOLDINGS, INC.NOTES TO CONSOLIDATED FINANCIAL STATEMENTS (Continued)
(Dollars in thousands, except share and per share amounts)
F-29
The components of income tax expense (benefit) for the three years ended December 31, 2012 were as follows:
Year Ended December 31, 2012 2011 2010
Current: Federal $ 72,809 $ 42,510 $ 30,642Non-U.S. 33,510 19,970 15,532State and local 8,172 6,699 4,337
114,491 69,179 50,511Deferred:
Federal (1,673) 12,140 6,802Non-U.S. (750) 2,768 (2,640)State and local 286 231 225
(2,137) 15,139 4,387Total $ 112,354 $ 84,318 $ 54,898
The differences between total income tax expense and the amount computed by applying the statutory federal income tax rate to income before income taxes for the three years ended December 31, 2012 were as follows:
Year Ended December 31, 2012 2011 2010
Statutory rate of 35% applied to pre-tax income $ 129,350 $ 105,466 $ 65,488Effect of state and local income taxes, net of federal tax benefit 5,598 4,585 3,044Taxes (less) more than the U.S. tax rate on non-U.S. earnings, including
utilization of tax loss carry-forwards, losses with no benefit and changes in non-U.S. valuation allowance (11,263) (13,637) (1,417)
Manufacturing deduction (6,287) (5,330) (3,900)U.S. tax cost (benefit) of foreign source income (4,766) 145 (3,282)Resolution and adjustments to uncertain tax positions (1,493) (5,103) (3,204)Other 1,215 (1,808) (1,831)Total $ 112,354 $ 84,318 $ 54,898Effective tax rate 30.40% 27.98% 29.34%
The 2012 effective tax rate is impacted by the geographic mix of earnings and taxes at lower rates in foreign jurisdictions, including Canada, Mexico, Poland and the U.K., as well as loss utilization in other foreign jurisdictions. Total income tax payments, net of refunds, were $78,506 in 2012, $62,600 in 2011 and $40,970 in 2010.
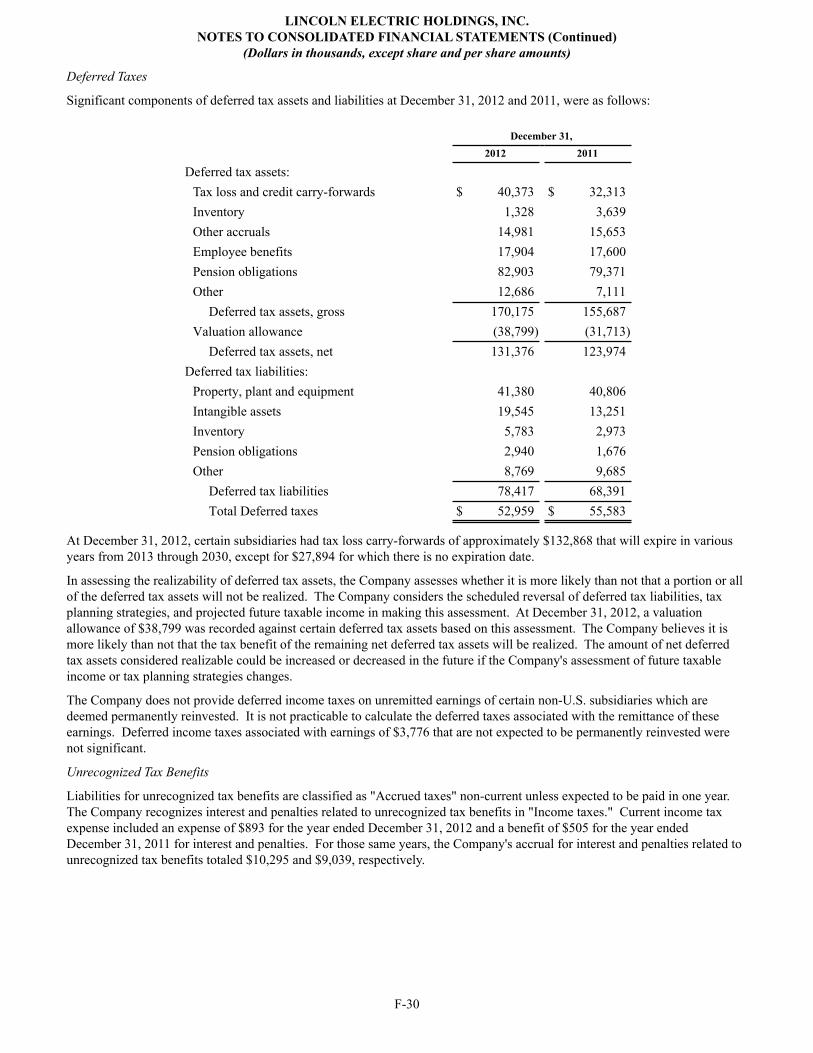
LINCOLN ELECTRIC HOLDINGS, INC.NOTES TO CONSOLIDATED FINANCIAL STATEMENTS (Continued)
(Dollars in thousands, except share and per share amounts)
F-30
Deferred Taxes
Significant components of deferred tax assets and liabilities at December 31, 2012 and 2011, were as follows:
December 31, 2012 2011
Deferred tax assets: Tax loss and credit carry-forwards $ 40,373 $ 32,313Inventory 1,328 3,639Other accruals 14,981 15,653Employee benefits 17,904 17,600Pension obligations 82,903 79,371Other 12,686 7,111
Deferred tax assets, gross 170,175 155,687Valuation allowance (38,799) (31,713)
Deferred tax assets, net 131,376 123,974Deferred tax liabilities:
Property, plant and equipment 41,380 40,806Intangible assets 19,545 13,251Inventory 5,783 2,973Pension obligations 2,940 1,676Other 8,769 9,685
Deferred tax liabilities 78,417 68,391Total Deferred taxes $ 52,959 $ 55,583
At December 31, 2012, certain subsidiaries had tax loss carry-forwards of approximately $132,868 that will expire in various years from 2013 through 2030, except for $27,894 for which there is no expiration date.
In assessing the realizability of deferred tax assets, the Company assesses whether it is more likely than not that a portion or all of the deferred tax assets will not be realized. The Company considers the scheduled reversal of deferred tax liabilities, tax planning strategies, and projected future taxable income in making this assessment. At December 31, 2012, a valuation allowance of $38,799 was recorded against certain deferred tax assets based on this assessment. The Company believes it is more likely than not that the tax benefit of the remaining net deferred tax assets will be realized. The amount of net deferred tax assets considered realizable could be increased or decreased in the future if the Company's assessment of future taxable income or tax planning strategies changes.
The Company does not provide deferred income taxes on unremitted earnings of certain non-U.S. subsidiaries which are deemed permanently reinvested. It is not practicable to calculate the deferred taxes associated with the remittance of these earnings. Deferred income taxes associated with earnings of $3,776 that are not expected to be permanently reinvested were not significant.
Unrecognized Tax Benefits
Liabilities for unrecognized tax benefits are classified as "Accrued taxes" non-current unless expected to be paid in one year. The Company recognizes interest and penalties related to unrecognized tax benefits in "Income taxes." Current income tax expense included an expense of $893 for the year ended December 31, 2012 and a benefit of $505 for the year ended December 31, 2011 for interest and penalties. For those same years, the Company's accrual for interest and penalties related to unrecognized tax benefits totaled $10,295 and $9,039, respectively.
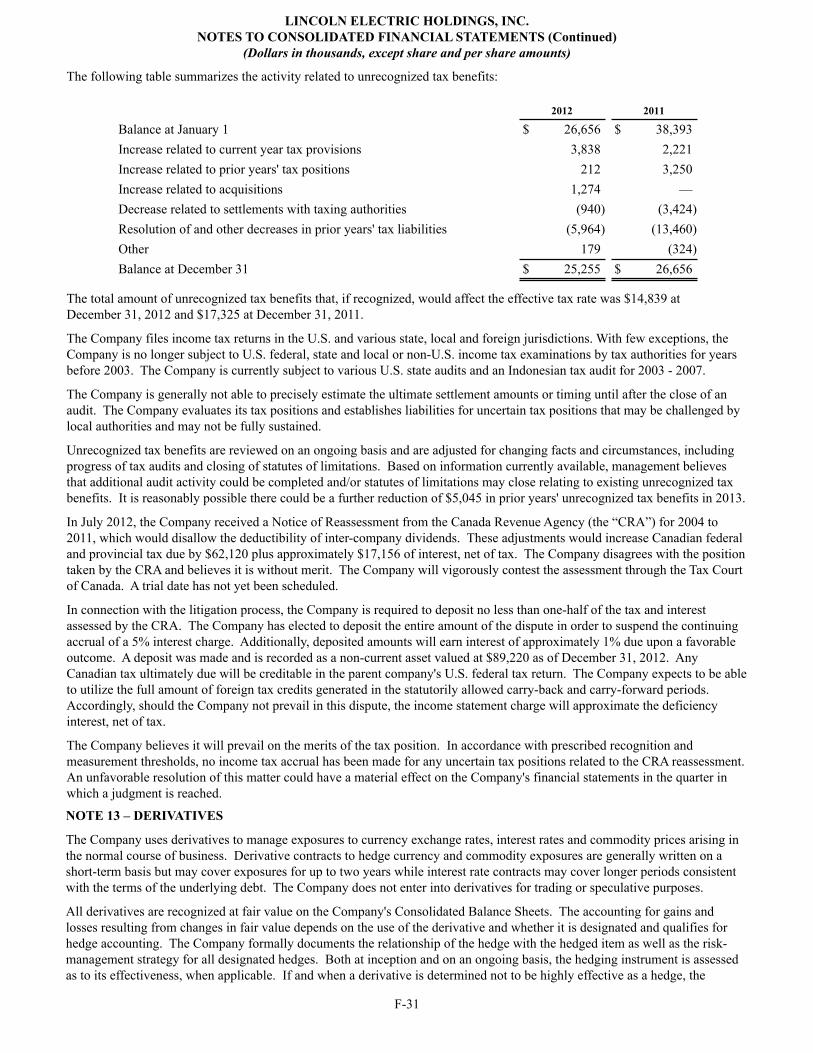
LINCOLN ELECTRIC HOLDINGS, INC.NOTES TO CONSOLIDATED FINANCIAL STATEMENTS (Continued)
(Dollars in thousands, except share and per share amounts)
F-31
The following table summarizes the activity related to unrecognized tax benefits:
2012 2011
Balance at January 1 $ 26,656 $ 38,393Increase related to current year tax provisions 3,838 2,221Increase related to prior years' tax positions 212 3,250Increase related to acquisitions 1,274 —Decrease related to settlements with taxing authorities (940) (3,424)Resolution of and other decreases in prior years' tax liabilities (5,964) (13,460)Other 179 (324)Balance at December 31 $ 25,255 $ 26,656
The total amount of unrecognized tax benefits that, if recognized, would affect the effective tax rate was $14,839 at December 31, 2012 and $17,325 at December 31, 2011.
The Company files income tax returns in the U.S. and various state, local and foreign jurisdictions. With few exceptions, the Company is no longer subject to U.S. federal, state and local or non-U.S. income tax examinations by tax authorities for years before 2003. The Company is currently subject to various U.S. state audits and an Indonesian tax audit for 2003 - 2007.
The Company is generally not able to precisely estimate the ultimate settlement amounts or timing until after the close of an audit. The Company evaluates its tax positions and establishes liabilities for uncertain tax positions that may be challenged by local authorities and may not be fully sustained.
Unrecognized tax benefits are reviewed on an ongoing basis and are adjusted for changing facts and circumstances, including progress of tax audits and closing of statutes of limitations. Based on information currently available, management believes that additional audit activity could be completed and/or statutes of limitations may close relating to existing unrecognized tax benefits. It is reasonably possible there could be a further reduction of $5,045 in prior years' unrecognized tax benefits in 2013.
In July 2012, the Company received a Notice of Reassessment from the Canada Revenue Agency (the “CRA”) for 2004 to 2011, which would disallow the deductibility of inter-company dividends. These adjustments would increase Canadian federal and provincial tax due by $62,120 plus approximately $17,156 of interest, net of tax. The Company disagrees with the position taken by the CRA and believes it is without merit. The Company will vigorously contest the assessment through the Tax Court of Canada. A trial date has not yet been scheduled.
In connection with the litigation process, the Company is required to deposit no less than one-half of the tax and interest assessed by the CRA. The Company has elected to deposit the entire amount of the dispute in order to suspend the continuing accrual of a 5% interest charge. Additionally, deposited amounts will earn interest of approximately 1% due upon a favorable outcome. A deposit was made and is recorded as a non-current asset valued at $89,220 as of December 31, 2012. Any Canadian tax ultimately due will be creditable in the parent company's U.S. federal tax return. The Company expects to be able to utilize the full amount of foreign tax credits generated in the statutorily allowed carry-back and carry-forward periods. Accordingly, should the Company not prevail in this dispute, the income statement charge will approximate the deficiency interest, net of tax.
The Company believes it will prevail on the merits of the tax position. In accordance with prescribed recognition and measurement thresholds, no income tax accrual has been made for any uncertain tax positions related to the CRA reassessment. An unfavorable resolution of this matter could have a material effect on the Company's financial statements in the quarter in which a judgment is reached.
NOTE 13 – DERIVATIVES
The Company uses derivatives to manage exposures to currency exchange rates, interest rates and commodity prices arising in the normal course of business. Derivative contracts to hedge currency and commodity exposures are generally written on a short-term basis but may cover exposures for up to two years while interest rate contracts may cover longer periods consistent with the terms of the underlying debt. The Company does not enter into derivatives for trading or speculative purposes.
All derivatives are recognized at fair value on the Company's Consolidated Balance Sheets. The accounting for gains and losses resulting from changes in fair value depends on the use of the derivative and whether it is designated and qualifies for hedge accounting. The Company formally documents the relationship of the hedge with the hedged item as well as the risk-management strategy for all designated hedges. Both at inception and on an ongoing basis, the hedging instrument is assessed as to its effectiveness, when applicable. If and when a derivative is determined not to be highly effective as a hedge, the
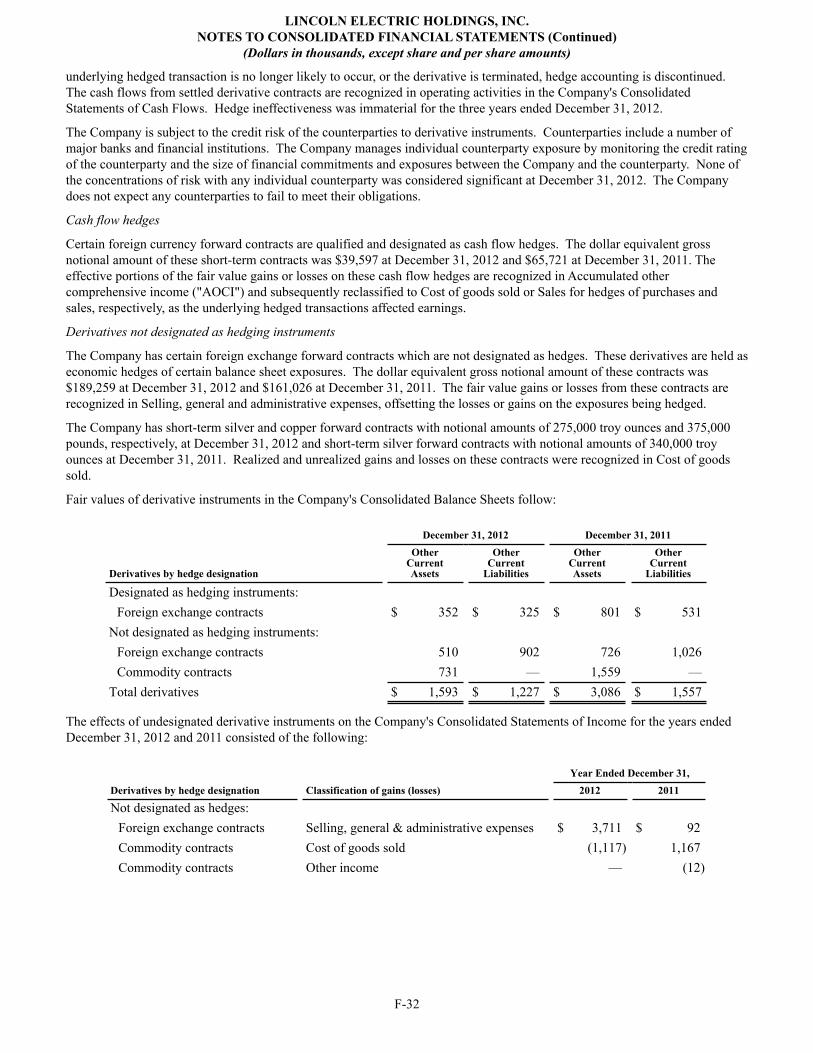
LINCOLN ELECTRIC HOLDINGS, INC.NOTES TO CONSOLIDATED FINANCIAL STATEMENTS (Continued)
(Dollars in thousands, except share and per share amounts)
F-32
underlying hedged transaction is no longer likely to occur, or the derivative is terminated, hedge accounting is discontinued. The cash flows from settled derivative contracts are recognized in operating activities in the Company's Consolidated Statements of Cash Flows. Hedge ineffectiveness was immaterial for the three years ended December 31, 2012.
The Company is subject to the credit risk of the counterparties to derivative instruments. Counterparties include a number of major banks and financial institutions. The Company manages individual counterparty exposure by monitoring the credit rating of the counterparty and the size of financial commitments and exposures between the Company and the counterparty. None of the concentrations of risk with any individual counterparty was considered significant at December 31, 2012. The Company does not expect any counterparties to fail to meet their obligations.
Cash flow hedges
Certain foreign currency forward contracts are qualified and designated as cash flow hedges. The dollar equivalent gross notional amount of these short-term contracts was $39,597 at December 31, 2012 and $65,721 at December 31, 2011. The effective portions of the fair value gains or losses on these cash flow hedges are recognized in Accumulated other comprehensive income ("AOCI") and subsequently reclassified to Cost of goods sold or Sales for hedges of purchases and sales, respectively, as the underlying hedged transactions affected earnings.
Derivatives not designated as hedging instruments
The Company has certain foreign exchange forward contracts which are not designated as hedges. These derivatives are held as economic hedges of certain balance sheet exposures. The dollar equivalent gross notional amount of these contracts was $189,259 at December 31, 2012 and $161,026 at December 31, 2011. The fair value gains or losses from these contracts are recognized in Selling, general and administrative expenses, offsetting the losses or gains on the exposures being hedged.
The Company has short-term silver and copper forward contracts with notional amounts of 275,000 troy ounces and 375,000 pounds, respectively, at December 31, 2012 and short-term silver forward contracts with notional amounts of 340,000 troy ounces at December 31, 2011. Realized and unrealized gains and losses on these contracts were recognized in Cost of goods sold.
Fair values of derivative instruments in the Company's Consolidated Balance Sheets follow:
December 31, 2012 December 31, 2011
Derivatives by hedge designation
OtherCurrentAssets
OtherCurrent
Liabilities
OtherCurrentAssets
OtherCurrent
Liabilities
Designated as hedging instruments: Foreign exchange contracts $ 352 $ 325 $ 801 $ 531
Not designated as hedging instruments:Foreign exchange contracts 510 902 726 1,026Commodity contracts 731 — 1,559 —
Total derivatives $ 1,593 $ 1,227 $ 3,086 $ 1,557
The effects of undesignated derivative instruments on the Company's Consolidated Statements of Income for the years ended December 31, 2012 and 2011 consisted of the following:
Year Ended December 31,Derivatives by hedge designation Classification of gains (losses) 2012 2011
Not designated as hedges: Foreign exchange contracts Selling, general & administrative expenses $ 3,711 $ 92Commodity contracts Cost of goods sold (1,117) 1,167Commodity contracts Other income — (12)
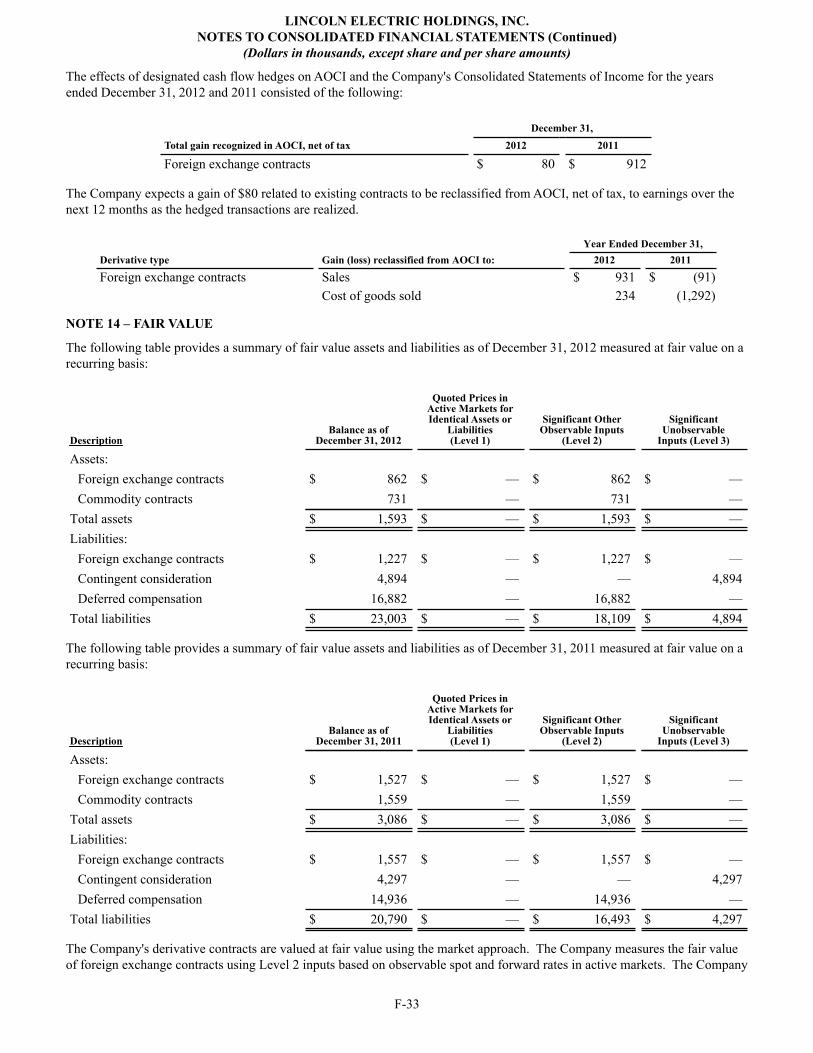
LINCOLN ELECTRIC HOLDINGS, INC.NOTES TO CONSOLIDATED FINANCIAL STATEMENTS (Continued)
(Dollars in thousands, except share and per share amounts)
F-33
The effects of designated cash flow hedges on AOCI and the Company's Consolidated Statements of Income for the years ended December 31, 2012 and 2011 consisted of the following:
December 31,Total gain recognized in AOCI, net of tax 2012 2011
Foreign exchange contracts $ 80 $ 912
The Company expects a gain of $80 related to existing contracts to be reclassified from AOCI, net of tax, to earnings over the next 12 months as the hedged transactions are realized.
Year Ended December 31,Derivative type Gain (loss) reclassified from AOCI to: 2012 2011
Foreign exchange contracts Sales $ 931 $ (91)Cost of goods sold 234 (1,292)
NOTE 14 – FAIR VALUE
The following table provides a summary of fair value assets and liabilities as of December 31, 2012 measured at fair value on a recurring basis:
DescriptionBalance as of
December 31, 2012
Quoted Prices inActive Markets forIdentical Assets or
Liabilities(Level 1)
Significant OtherObservable Inputs
(Level 2)
SignificantUnobservable
Inputs (Level 3)
Assets: Foreign exchange contracts $ 862 $ — $ 862 $ —Commodity contracts 731 — 731 —
Total assets $ 1,593 $ — $ 1,593 $ —Liabilities:
Foreign exchange contracts $ 1,227 $ — $ 1,227 $ —Contingent consideration 4,894 — — 4,894Deferred compensation 16,882 — 16,882 —
Total liabilities $ 23,003 $ — $ 18,109 $ 4,894
The following table provides a summary of fair value assets and liabilities as of December 31, 2011 measured at fair value on a recurring basis:
DescriptionBalance as of
December 31, 2011
Quoted Prices inActive Markets forIdentical Assets or
Liabilities(Level 1)
Significant OtherObservable Inputs
(Level 2)
SignificantUnobservable
Inputs (Level 3)
Assets: Foreign exchange contracts $ 1,527 $ — $ 1,527 $ —Commodity contracts 1,559 — 1,559 —
Total assets $ 3,086 $ — $ 3,086 $ —Liabilities:
Foreign exchange contracts $ 1,557 $ — $ 1,557 $ —Contingent consideration 4,297 — — 4,297Deferred compensation 14,936 — 14,936 —
Total liabilities $ 20,790 $ — $ 16,493 $ 4,297
The Company's derivative contracts are valued at fair value using the market approach. The Company measures the fair value of foreign exchange contracts using Level 2 inputs based on observable spot and forward rates in active markets. The Company
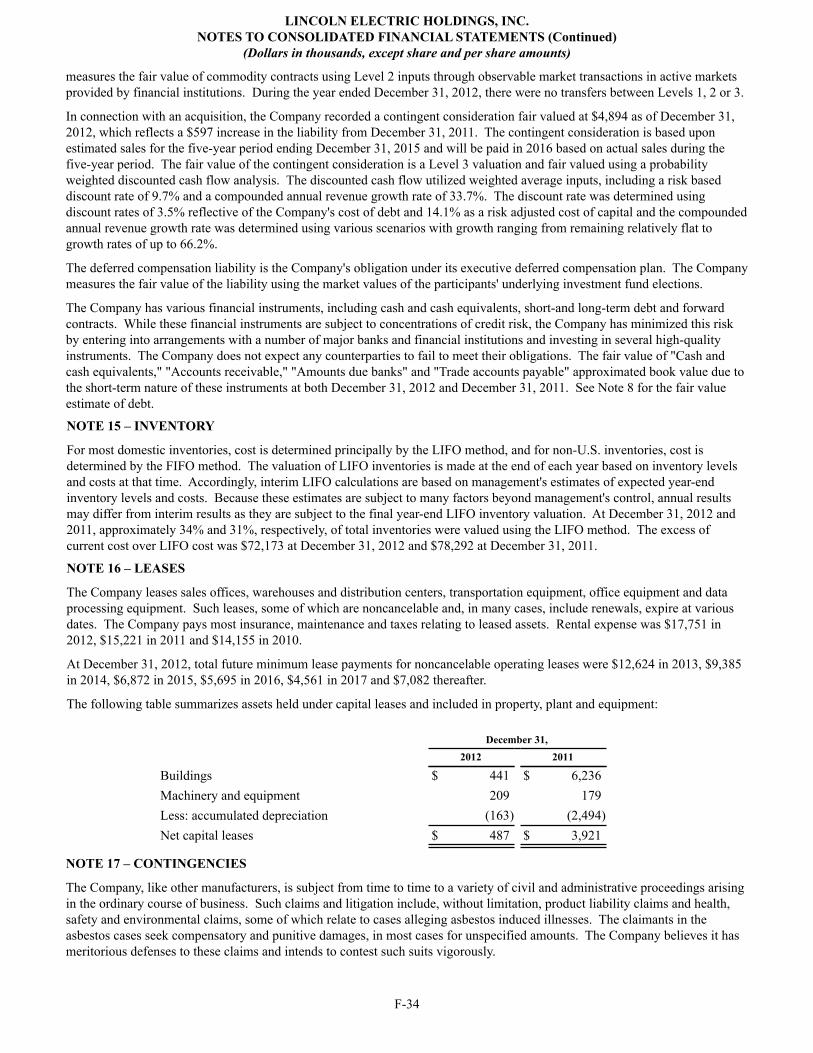
LINCOLN ELECTRIC HOLDINGS, INC.NOTES TO CONSOLIDATED FINANCIAL STATEMENTS (Continued)
(Dollars in thousands, except share and per share amounts)
F-34
measures the fair value of commodity contracts using Level 2 inputs through observable market transactions in active markets provided by financial institutions. During the year ended December 31, 2012, there were no transfers between Levels 1, 2 or 3.
In connection with an acquisition, the Company recorded a contingent consideration fair valued at $4,894 as of December 31, 2012, which reflects a $597 increase in the liability from December 31, 2011. The contingent consideration is based upon estimated sales for the five-year period ending December 31, 2015 and will be paid in 2016 based on actual sales during the five-year period. The fair value of the contingent consideration is a Level 3 valuation and fair valued using a probability weighted discounted cash flow analysis. The discounted cash flow utilized weighted average inputs, including a risk based discount rate of 9.7% and a compounded annual revenue growth rate of 33.7%. The discount rate was determined using discount rates of 3.5% reflective of the Company's cost of debt and 14.1% as a risk adjusted cost of capital and the compounded annual revenue growth rate was determined using various scenarios with growth ranging from remaining relatively flat to growth rates of up to 66.2%.
The deferred compensation liability is the Company's obligation under its executive deferred compensation plan. The Company measures the fair value of the liability using the market values of the participants' underlying investment fund elections.
The Company has various financial instruments, including cash and cash equivalents, short-and long-term debt and forward contracts. While these financial instruments are subject to concentrations of credit risk, the Company has minimized this risk by entering into arrangements with a number of major banks and financial institutions and investing in several high-quality instruments. The Company does not expect any counterparties to fail to meet their obligations. The fair value of "Cash and cash equivalents," "Accounts receivable," "Amounts due banks" and "Trade accounts payable" approximated book value due to the short-term nature of these instruments at both December 31, 2012 and December 31, 2011. See Note 8 for the fair value estimate of debt.
NOTE 15 – INVENTORY
For most domestic inventories, cost is determined principally by the LIFO method, and for non-U.S. inventories, cost is determined by the FIFO method. The valuation of LIFO inventories is made at the end of each year based on inventory levels and costs at that time. Accordingly, interim LIFO calculations are based on management's estimates of expected year-end inventory levels and costs. Because these estimates are subject to many factors beyond management's control, annual results may differ from interim results as they are subject to the final year-end LIFO inventory valuation. At December 31, 2012 and 2011, approximately 34% and 31%, respectively, of total inventories were valued using the LIFO method. The excess of current cost over LIFO cost was $72,173 at December 31, 2012 and $78,292 at December 31, 2011.
NOTE 16 – LEASES
The Company leases sales offices, warehouses and distribution centers, transportation equipment, office equipment and data processing equipment. Such leases, some of which are noncancelable and, in many cases, include renewals, expire at various dates. The Company pays most insurance, maintenance and taxes relating to leased assets. Rental expense was $17,751 in 2012, $15,221 in 2011 and $14,155 in 2010.
At December 31, 2012, total future minimum lease payments for noncancelable operating leases were $12,624 in 2013, $9,385 in 2014, $6,872 in 2015, $5,695 in 2016, $4,561 in 2017 and $7,082 thereafter.
The following table summarizes assets held under capital leases and included in property, plant and equipment:
December 31, 2012 2011
Buildings $ 441 $ 6,236Machinery and equipment 209 179Less: accumulated depreciation (163) (2,494)Net capital leases $ 487 $ 3,921
NOTE 17 – CONTINGENCIES
The Company, like other manufacturers, is subject from time to time to a variety of civil and administrative proceedings arising in the ordinary course of business. Such claims and litigation include, without limitation, product liability claims and health, safety and environmental claims, some of which relate to cases alleging asbestos induced illnesses. The claimants in the asbestos cases seek compensatory and punitive damages, in most cases for unspecified amounts. The Company believes it has meritorious defenses to these claims and intends to contest such suits vigorously.
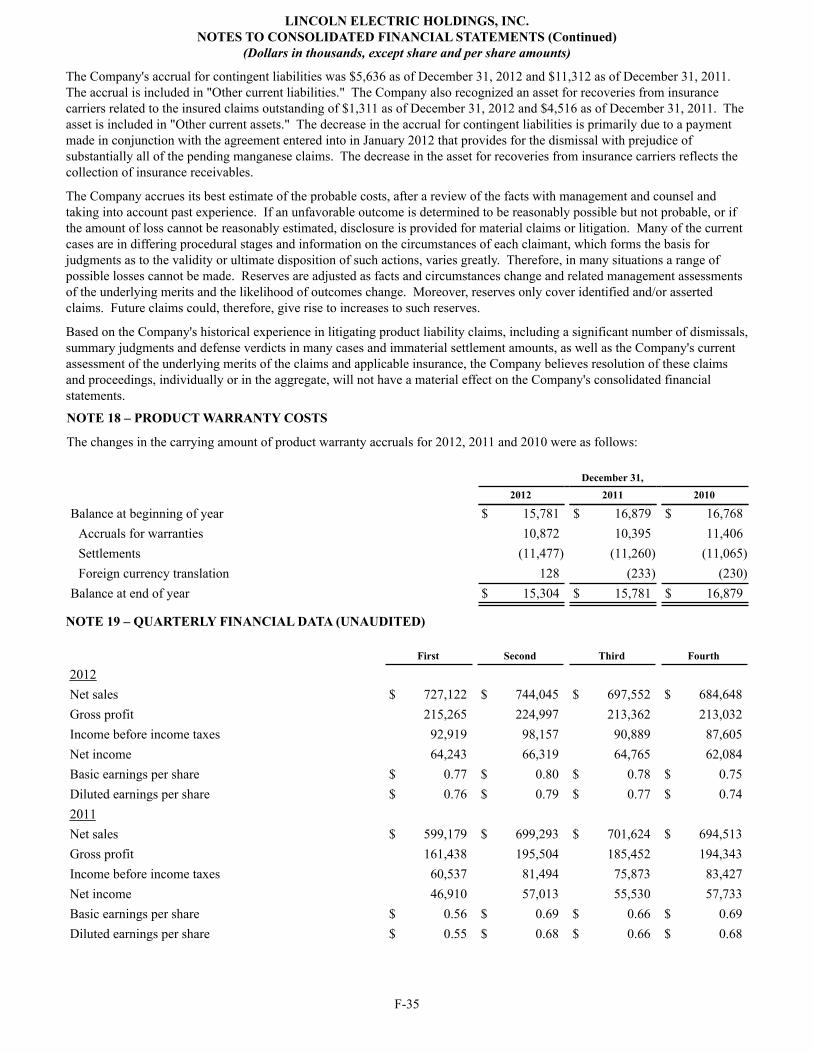
LINCOLN ELECTRIC HOLDINGS, INC.NOTES TO CONSOLIDATED FINANCIAL STATEMENTS (Continued)
(Dollars in thousands, except share and per share amounts)
F-35
The Company's accrual for contingent liabilities was $5,636 as of December 31, 2012 and $11,312 as of December 31, 2011. The accrual is included in "Other current liabilities." The Company also recognized an asset for recoveries from insurance carriers related to the insured claims outstanding of $1,311 as of December 31, 2012 and $4,516 as of December 31, 2011. The asset is included in "Other current assets." The decrease in the accrual for contingent liabilities is primarily due to a payment made in conjunction with the agreement entered into in January 2012 that provides for the dismissal with prejudice of substantially all of the pending manganese claims. The decrease in the asset for recoveries from insurance carriers reflects the collection of insurance receivables.
The Company accrues its best estimate of the probable costs, after a review of the facts with management and counsel and taking into account past experience. If an unfavorable outcome is determined to be reasonably possible but not probable, or if the amount of loss cannot be reasonably estimated, disclosure is provided for material claims or litigation. Many of the current cases are in differing procedural stages and information on the circumstances of each claimant, which forms the basis for judgments as to the validity or ultimate disposition of such actions, varies greatly. Therefore, in many situations a range of possible losses cannot be made. Reserves are adjusted as facts and circumstances change and related management assessments of the underlying merits and the likelihood of outcomes change. Moreover, reserves only cover identified and/or asserted claims. Future claims could, therefore, give rise to increases to such reserves.
Based on the Company's historical experience in litigating product liability claims, including a significant number of dismissals, summary judgments and defense verdicts in many cases and immaterial settlement amounts, as well as the Company's current assessment of the underlying merits of the claims and applicable insurance, the Company believes resolution of these claims and proceedings, individually or in the aggregate, will not have a material effect on the Company's consolidated financial statements.
NOTE 18 – PRODUCT WARRANTY COSTS
The changes in the carrying amount of product warranty accruals for 2012, 2011 and 2010 were as follows:
December 31, 2012 2011 2010
Balance at beginning of year $ 15,781 $ 16,879 $ 16,768Accruals for warranties 10,872 10,395 11,406Settlements (11,477) (11,260) (11,065)Foreign currency translation 128 (233) (230)
Balance at end of year $ 15,304 $ 15,781 $ 16,879
NOTE 19 – QUARTERLY FINANCIAL DATA (UNAUDITED)
First Second Third Fourth
2012 Net sales $ 727,122 $ 744,045 $ 697,552 $ 684,648Gross profit 215,265 224,997 213,362 213,032Income before income taxes 92,919 98,157 90,889 87,605Net income 64,243 66,319 64,765 62,084Basic earnings per share $ 0.77 $ 0.80 $ 0.78 $ 0.75Diluted earnings per share $ 0.76 $ 0.79 $ 0.77 $ 0.742011 Net sales $ 599,179 $ 699,293 $ 701,624 $ 694,513Gross profit 161,438 195,504 185,452 194,343Income before income taxes 60,537 81,494 75,873 83,427Net income 46,910 57,013 55,530 57,733Basic earnings per share $ 0.56 $ 0.69 $ 0.66 $ 0.69Diluted earnings per share $ 0.55 $ 0.68 $ 0.66 $ 0.68
LINCOLN ELECTRIC HOLDINGS, INC.NOTES TO CONSOLIDATED FINANCIAL STATEMENTS (Continued)
(Dollars in thousands, except share and per share amounts)
F-36
The quarter ended December 31, 2012 includes rationalization and asset impairment net charges of $5,037 ($3,823 after-tax) primarily related to employee severance and other costs associated with the consolidation of manufacturing operations in North America Welding, Europe Welding and Asia Pacific Welding segments.
The quarter ended September 30, 2012 includes rationalization and asset impairment net charges of $3,059 ($2,704 after-tax) primarily related to employee severance and other costs associated with the consolidation of manufacturing operations in North America Welding, Europe Welding and Asia Pacific Welding segments.
The quarter ended June 30, 2012 includes rationalization net charges of $1,258 ($915 after-tax) primarily related to employee severance and other costs associated with the consolidation of manufacturing operations in North America Welding, Europe Welding and Asia Pacific Welding segments and a charge of $1,381 ($906 after-tax) related to a change in Venezuelan labor law, which provides for increased employee severance obligations in the South America Welding segment.
The quarter ended June 30, 2011 includes rationalization and asset impairment net gains of $75 ($44 after-tax) primarily related to the gain on sale of assets at rationalized operations in the Asia Pacific Welding segment resulting from actions initiated in 2009.
The quarter ended March 31, 2011 includes rationalization and asset impairment net charges of $357 ($281 after-tax) primarily related to employee severance and other costs associated with the consolidation of manufacturing operations in the Europe Welding and Asia Pacific Welding segments resulting from actions initiated in 2009 and a gain of $4,844 related to a favorable adjustment for tax audit settlements in the North America Welding segment.
The quarterly earnings per share ("EPS") amounts are each calculated independently. Therefore, the sum of the quarterly EPS amounts may not equal the annual totals.
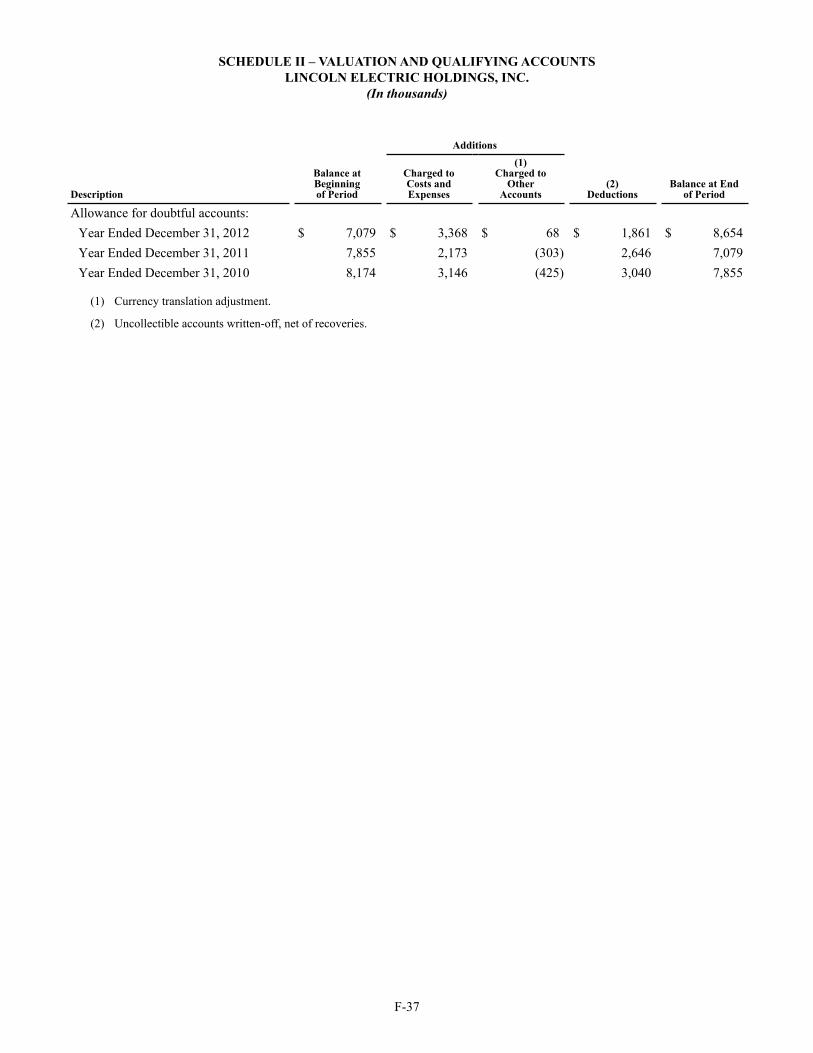
F-37
SCHEDULE II – VALUATION AND QUALIFYING ACCOUNTSLINCOLN ELECTRIC HOLDINGS, INC.
(In thousands)
Additions
Description
Balance atBeginningof Period
Charged toCosts andExpenses
(1)Charged to
OtherAccounts
(2)Deductions
Balance at Endof Period
Allowance for doubtful accounts: Year Ended December 31, 2012 $ 7,079 $ 3,368 $ 68 $ 1,861 $ 8,654Year Ended December 31, 2011 7,855 2,173 (303) 2,646 7,079Year Ended December 31, 2010 8,174 3,146 (425) 3,040 7,855
(1) Currency translation adjustment.
(2) Uncollectible accounts written-off, net of recoveries.
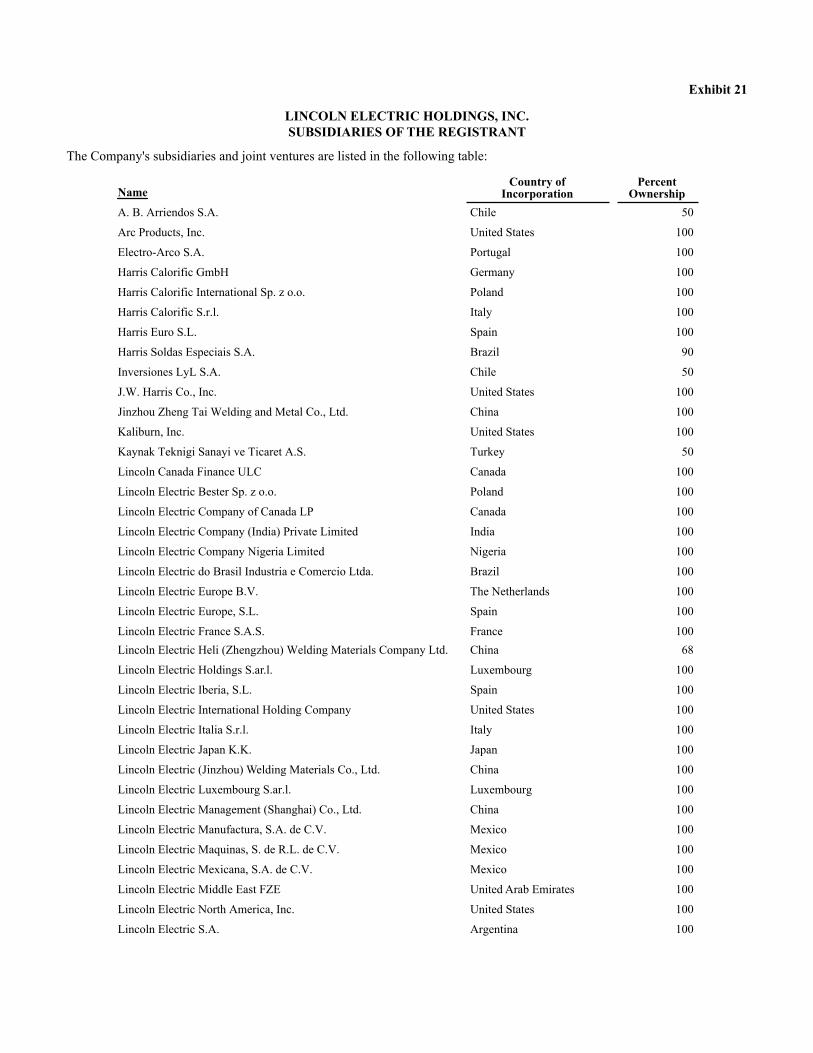
Exhibit 21
LINCOLN ELECTRIC HOLDINGS, INC.SUBSIDIARIES OF THE REGISTRANT
The Company's subsidiaries and joint ventures are listed in the following table:
NameCountry of
IncorporationPercent
OwnershipA. B. Arriendos S.A. Chile 50
Arc Products, Inc. United States 100
Electro-Arco S.A. Portugal 100
Harris Calorific GmbH Germany 100
Harris Calorific International Sp. z o.o. Poland 100
Harris Calorific S.r.l. Italy 100
Harris Euro S.L. Spain 100
Harris Soldas Especiais S.A. Brazil 90
Inversiones LyL S.A. Chile 50
J.W. Harris Co., Inc. United States 100
Jinzhou Zheng Tai Welding and Metal Co., Ltd. China 100
Kaliburn, Inc. United States 100
Kaynak Teknigi Sanayi ve Ticaret A.S. Turkey 50
Lincoln Canada Finance ULC Canada 100
Lincoln Electric Bester Sp. z o.o. Poland 100
Lincoln Electric Company of Canada LP Canada 100
Lincoln Electric Company (India) Private Limited India 100
Lincoln Electric Company Nigeria Limited Nigeria 100
Lincoln Electric do Brasil Industria e Comercio Ltda. Brazil 100
Lincoln Electric Europe B.V. The Netherlands 100
Lincoln Electric Europe, S.L. Spain 100
Lincoln Electric France S.A.S. France 100Lincoln Electric Heli (Zhengzhou) Welding Materials Company Ltd. China 68
Lincoln Electric Holdings S.ar.l. Luxembourg 100
Lincoln Electric Iberia, S.L. Spain 100
Lincoln Electric International Holding Company United States 100
Lincoln Electric Italia S.r.l. Italy 100
Lincoln Electric Japan K.K. Japan 100
Lincoln Electric (Jinzhou) Welding Materials Co., Ltd. China 100
Lincoln Electric Luxembourg S.ar.l. Luxembourg 100
Lincoln Electric Management (Shanghai) Co., Ltd. China 100
Lincoln Electric Manufactura, S.A. de C.V. Mexico 100
Lincoln Electric Maquinas, S. de R.L. de C.V. Mexico 100
Lincoln Electric Mexicana, S.A. de C.V. Mexico 100
Lincoln Electric Middle East FZE United Arab Emirates 100
Lincoln Electric North America, Inc. United States 100
Lincoln Electric S.A. Argentina 100
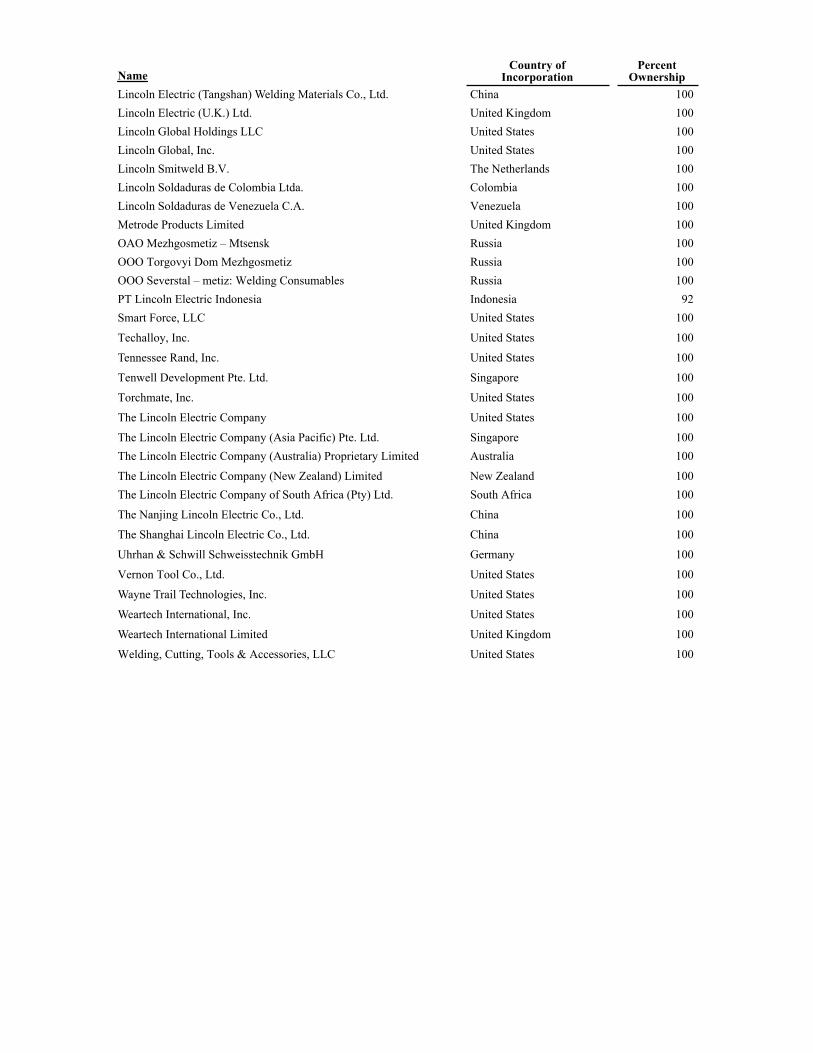
NameCountry of
IncorporationPercent
OwnershipLincoln Electric (Tangshan) Welding Materials Co., Ltd. China 100Lincoln Electric (U.K.) Ltd. United Kingdom 100Lincoln Global Holdings LLC United States 100Lincoln Global, Inc. United States 100Lincoln Smitweld B.V. The Netherlands 100Lincoln Soldaduras de Colombia Ltda. Colombia 100Lincoln Soldaduras de Venezuela C.A. Venezuela 100Metrode Products Limited United Kingdom 100OAO Mezhgosmetiz – Mtsensk Russia 100OOO Torgovyi Dom Mezhgosmetiz Russia 100OOO Severstal – metiz: Welding Consumables Russia 100PT Lincoln Electric Indonesia Indonesia 92Smart Force, LLC United States 100
Techalloy, Inc. United States 100
Tennessee Rand, Inc. United States 100
Tenwell Development Pte. Ltd. Singapore 100
Torchmate, Inc. United States 100
The Lincoln Electric Company United States 100
The Lincoln Electric Company (Asia Pacific) Pte. Ltd. Singapore 100The Lincoln Electric Company (Australia) Proprietary Limited Australia 100
The Lincoln Electric Company (New Zealand) Limited New Zealand 100The Lincoln Electric Company of South Africa (Pty) Ltd. South Africa 100
The Nanjing Lincoln Electric Co., Ltd. China 100
The Shanghai Lincoln Electric Co., Ltd. China 100
Uhrhan & Schwill Schweisstechnik GmbH Germany 100
Vernon Tool Co., Ltd. United States 100
Wayne Trail Technologies, Inc. United States 100
Weartech International, Inc. United States 100
Weartech International Limited United Kingdom 100
Welding, Cutting, Tools & Accessories, LLC United States 100
Exhibit 23
Consent of Independent Registered Public Accounting Firm
We consent to the incorporation by reference in the following registration statements:
Form S-8 Registration Statement of Lincoln Electric Holdings, Inc. for the Stock Option Plan for Non-Employee Directors (Form S-8 No. 333-49976),
Form S-8 Registration Statement of Lincoln Electric Holdings, Inc. for the 1998 Stock Plan, including Post-Effective Amendment No. 1 (Form S-8 No. 333-58305),
Form S-8 Registration Statement of Lincoln Electric Holdings, Inc. for The Lincoln Electric Company Employee Savings Plan (Form S-8 Nos. 333-107114 and 333-132036),
Form S-8 Registration Statement of Lincoln Electric Holdings, Inc. (as successor to The Lincoln Electric Company) for The Lincoln Electric Company Employee Savings Plan, including Post-Effective Amendment No. 1 (Form S-8 No. 033-64187),
Form S-8 Registration Statement of Lincoln Electric Holdings, Inc. (as successor to The Lincoln Electric Company) for The Lincoln Electric Company 1988 Incentive Equity Plan (Form S-8 No. 033-25209), including Post-Effective Amendment No. 1 (Form S-8 No. 033-25210),
Form S-8 Registration Statement of Lincoln Electric Holdings, Inc. (as successor to The Lincoln Electric Company) for the 1995 Lincoln Stock Purchase Plan, including Post-Effective Amendment No. 1 (Form S-8 No. 033-64189),
Form S-8 Registration Statement of Lincoln Electric Holdings, Inc. for the 2006 Equity and Performance Incentive Plan (Form S-8 No. 333-134212), and
Form S-8 Registration Statement of Lincoln Electric Holdings, Inc. for the 2006 Stock Plan for Non-Employee Directors (Form S-8 No. 333-134210),
of our reports dated February 22, 2013, with respect to the consolidated financial statements and schedule of Lincoln Electric Holdings, Inc. and subsidiaries, and the effectiveness of internal control over financial reporting of Lincoln Electric Holdings, Inc. and subsidiaries, included in this Annual Report (Form 10-K) for the year ended December 31, 2012.
/s/ Ernst & Young LLP
Cleveland, Ohio
February 22, 2013

Exhibit 24
POWER OF ATTORNEY
Directors of Lincoln Electric Holdings, Inc.
Each of the undersigned Directors of Lincoln Electric Holdings, Inc. hereby appoints Christopher L. Mapes, Vincent K. Petrella and Frederick G. Stueber, and each of them, as attorneys for the undersigned, for and in the name, place and stead of the undersigned in the capacity specified, to prepare or cause to be prepared, to execute and to file with the Securities and Exchange Commission under the Securities Exchange Act of 1934, as amended (the "Act"), an Annual Report on Form 10-K for the year ended December 31, 2012 relating to Lincoln Electric Holdings, Inc., such other periodic reports as may be required pursuant to the Act, amendments and exhibits to any of the foregoing and any and all other documents to be filed with the Securities and Exchange Commission or elsewhere pertaining to such reports, with full power and authority to take any other action deemed necessary or appropriate to effect the filing of the documents.
Executed the date set forth below.
/s/ John M. Stropki, Jr. /s/ Christopher L. Mapes /s/ Harold L. AdamsJohn M. Stropki, Jr., Director Christopher L. Mapes, Director Harold L. Adams, DirectorFebruary 21, 2013 February 21, 2013 February 21, 2013
/s/ Curtis E. Espeland /s/ David H. Gunning /s/ Stephen G. HanksCurtis E. Espeland, Director David H. Gunning, Director Stephen G. Hanks, DirectorFebruary 21, 2013 February 21, 2013 February 21, 2013
/s/ Robert J. Knoll /s/ G. Russell Lincoln /s/ Kathryn Jo LincolnRobert J. Knoll, Director G. Russell Lincoln, Director Kathryn Jo Lincoln, DirectorFebruary 21, 2013 February 21, 2013 February 21, 2013
/s/ William E. MacDonald, III /s/ Hellene S. Runtagh /s/ George H. Walls, Jr.William E. MacDonald, III, Director Hellene S. Runtagh, Director George H. Walls, Jr., DirectorFebruary 21, 2013 February 21, 2013 February 21, 2013
Exhibit 31.1CERTIFICATION
I, Christopher L. Mapes, certify that:
1. I have reviewed this annual report on Form 10-K of Lincoln Electric Holdings, Inc.;
2. Based on my knowledge, this report does not contain any untrue statement of a material fact or omit to state a material fact necessary to make the statements made, in light of the circumstances under which such statements were made, not misleading with respect to the period covered by this report;
3. Based on my knowledge, the financial statements, and other financial information included in this report, fairly present in all material respects the financial condition, results of operations and cash flows of the registrant as of, and for, the periods presented in this report;
4. The registrant's other certifying officer and I are responsible for establishing and maintaining disclosure controls and procedures (as defined in Exchange Act Rules 13a-15(e) and 15d-15(e)) and internal control over financial reporting (as defined in Exchange Act Rules 13a-15(f) and 15d-15(f)) for the registrant and have:
a) Designed such disclosure controls and procedures, or caused such disclosure controls and procedures to be designed under our supervision, to ensure that material information relating to the registrant, including its consolidated subsidiaries, is made known to us by others within those entities, particularly during the period in which this report is being prepared;
b) Designed such internal control over financial reporting, or caused such internal control over financial reporting to be designed under our supervision, to provide reasonable assurance regarding the reliability of financial reporting and the preparation of financial statements for external purposes in accordance with generally accepted accounting principles;
c) Evaluated the effectiveness of the registrant's disclosure controls and procedures and presented in this report our conclusions about the effectiveness of the disclosure controls and procedures, as of the end of the period covered by this report based on such evaluation; and
d) Disclosed in this report any change in the registrant's internal control over financial reporting that occurred during the registrant's most recent fiscal quarter (the registrant's fourth fiscal quarter in the case of an annual report) that has materially affected, or is reasonably likely to materially affect, the registrant's internal control over financial reporting; and
5. The registrant's other certifying officer and I have disclosed, based on our most recent evaluation of internal control over financial reporting, to the registrant's auditors and the audit committee of the registrant's board of directors (or persons performing the equivalent functions):
a) All significant deficiencies and material weaknesses in the design or operation of internal control over financial reporting which are reasonably likely to adversely affect the registrant's ability to record, process, summarize and report financial information; and
b) Any fraud, whether or not material, that involves management or other employees who have a significant role in the registrant's internal control over financial reporting.
Date: February 22, 2013
/s/ Christopher L. MapesChristopher L. MapesPresident and Chief Executive Officer
Exhibit 31.2CERTIFICATION
I, Vincent K. Petrella, certify that:
1. I have reviewed this annual report on Form 10-K of Lincoln Electric Holdings, Inc.;
2. Based on my knowledge, this report does not contain any untrue statement of a material fact or omit to state a material fact necessary to make the statements made, in light of the circumstances under which such statements were made, not misleading with respect to the period covered by this report;
3. Based on my knowledge, the financial statements, and other financial information included in this report, fairly present in all material respects the financial condition, results of operations and cash flows of the registrant as of, and for, the periods presented in this report;
4. The registrant's other certifying officer and I are responsible for establishing and maintaining disclosure controls and procedures (as defined in Exchange Act Rules 13a-15(e) and 15d-15(e)) and internal control over financial reporting (as defined in Exchange Act Rules 13a-15(f) and 15d-15(f)) for the registrant and have:
a) Designed such disclosure controls and procedures, or caused such disclosure controls and procedures to be designed under our supervision, to ensure that material information relating to the registrant, including its consolidated subsidiaries, is made known to us by others within those entities, particularly during the period in which this report is being prepared;
b) Designed such internal control over financial reporting, or caused such internal control over financial reporting to be designed under our supervision, to provide reasonable assurance regarding the reliability of financial reporting and the preparation of financial statements for external purposes in accordance with generally accepted accounting principles;
c) Evaluated the effectiveness of the registrant's disclosure controls and procedures and presented in this report our conclusions about the effectiveness of the disclosure controls and procedures, as of the end of the period covered by this report based on such evaluation; and
d) Disclosed in this report any change in the registrant's internal control over financial reporting that occurred during the registrant's most recent fiscal quarter (the registrant's fourth fiscal quarter in the case of an annual report) that has materially affected, or is reasonably likely to materially affect, the registrant's internal control over financial reporting; and
5. The registrant's other certifying officer and I have disclosed, based on our most recent evaluation of internal control over financial reporting, to the registrant's auditors and the audit committee of the registrant's board of directors (or persons performing the equivalent functions):
a) All significant deficiencies and material weaknesses in the design or operation of internal control over financial reporting which are reasonably likely to adversely affect the registrant's ability to record, process, summarize and report financial information; and
b) Any fraud, whether or not material, that involves management or other employees who have a significant role in the registrant's internal control over financial reporting.
Date: February 22, 2013
/s/ Vincent K. PetrellaVincent K. PetrellaSenior Vice President, Chief FinancialOfficer and Treasurer
Exhibit 32.1
CERTIFICATION PURSUANT TO18 U.S.C. SECTION 1350,
AS ADOPTED PURSUANT TOSECTION 906 OF THE SARBANES-OXLEY ACT OF 2002
In connection with the Annual Report on Form 10-K of Lincoln Electric Holdings, Inc. (the "Company") for the year ended December 31, 2012, as filed with the Securities and Exchange Commission (the "Report"), each of the undersigned officers of the Company certifies, pursuant to 18 U.S.C. § 1350, as adopted pursuant to § 906 of the Sarbanes-Oxley Act of 2002, that, to such officer's knowledge:
(1) The Report fully complies with the requirements of Section 13(a) or 15(d) of the Securities Exchange Act of 1934; and
(2) The information contained in the Report fairly presents, in all material respects, the financial condition and results of operations of the Company as of the dates and for the periods expressed in the Report.
Date: February 22, 2013
/s/ Christopher L. Mapes
Christopher L. Mapes President and Chief Executive Officer
/s/ Vincent K. PetrellaVincent K. PetrellaSenior Vice President, Chief FinancialOfficer and Treasurer

ww
w.l
inco
lnel
ectr
ic.c
om
LINCOLN ELECTRIC HOLDINGS, INC.
22801 St. Clair AvenueCleveland, Ohio 44117-1199U.S.A.
investing in GROWTHdriving INNOVATION
20
12
AN
NU
AL
RE
PO
RT
ww
w.l
inco
lnel
ectr
ic.c
om
LINCOLN ELECTRIC HOLDINGS, INC.
22801 St. Clair AvenueCleveland, Ohio 44117-1199U.S.A.
investing in GROWTHdriving INNOVATION
20
12
AN
NU
AL
RE
PO
RT