© 2012 arbitron inc. all rights reserved · 2 public radio today • 2012 edition © 2012 arbitron...
TRANSCRIPT

© 2012 Arbitron Inc. All Rights Reserved © 2012 Arbitron Inc. All Rights Reserved

© 2012 Arbitron Inc. All Rights ReservedPUBLIC RADIO TODAY • 2012 EDITION2
How America Listens to Public Radio
Public radio continues to be a vibrant and relevant part of many Americans’ lives. The stations we evaluated for this study broadcast unique programming to nearly 32 million weekly listeners. Public radio is also meeting the challenges of a crowded media landscape by taking full advantage of technological innovations, including podcasting, Internet streaming, and HD Radio® multicasting.
Public Radio Today 2012 is an in-depth look at the listening activity to the nine most popular public radio formats representing the Fall 2011 Diary and October-November-December 2011 PPM survey periods: News/Talk/Information, Classical Music, News-Classical, Adult Album Alternative (AAA), Jazz, News-AAA, News-Music, News-Jazz, and Variety Music. The statistics include Average Quarter-Hour (AQH) Share of the total public radio audience, each format’s weekly reach in terms of total listeners (Cume), segmentation of audience composition by age group, Time Spent Listening (TSL) by demographic, education levels, income by household, gender composition, ratings by daypart, a state-by-state index and listening by at-home vs. out-of-home locations.
Public Radio Today 2012 also includes Scarborough consumer data to present a comprehensive consumer profile of public radio listening across America. This in-depth profile is drawn with information on public radio listeners’ household characteristics and consumption behaviors among several popular product categories.
We thank these public radio organizations for helping us shape this study and invite you to visit their websites to learn more about their contributions to public radio:
American Public Media www.publicradio.orgNational Public Radio www.npr.orgPublic Radio International www.pri.orgRadio Research Consortium www.rrconline.org
PPM ratings are based on audience estimates and are the opinion of Arbitron and should not be relied on for precise accuracy or precise representativeness of a demographic or radio market.Public Radio Today and all ratings, data and other content contained in this report are protected under United States copyright and trademark laws,international conventions and other applicable laws. You may not quote, reference, link to, frame, copy, modify, distribute, publicly display, broadcast, transmit or make any commercial use of any portion of this report, including any ratings, data or other content.

© 2012 Arbitron Inc. All Rights ReservedPUBLIC RADIO TODAY • 2012 EDITION3
Introduction: How America Listens to Public Radio 2
Executive Summary 4
What’s New and Noteworthy 5
About Public Radio Today 2012 6
Glossary 7
Public Radio Formats 8
News/Talk/Information 9
Classical Music 12
News-Classical 15
Adult Album Alternative (AAA) 18
Jazz 21
News-AAA 24
News-Music 27
News-Jazz 30
Variety Music 33
Scarborough Qualitatives 36
Environmental Efforts 37
Health and Wellness 38
Financial Planning 39
Home Sweet Home 40
Business Travelers- Staying Connected 41
National Public Radio Listening Trends 42
Public Radio Reaches All Ages—Weekly Cume Rating 43
Public Radio Reaches All Ages—Time Spent Listening 44
Hour-by-Hour Listening 45
Public Radio Listening Location by Men and Women 46
Public Radio Listening Location by At Hove vs. Away From Home 47
Public Radio Listening by Time of Day 48
Public Radio Formats Ranked by Audience Share and Availability 49
Public Radio Formats Ranked by Audience Share by Demographic 50
Contents
Keep up with Arbitron on Facebook® and Twitter® accounts:
www.facebook.com/arbitroninc
www.twitter.com/arbitroninc
www.twitter.com/arbprogramming

© 2012 Arbitron Inc. All Rights ReservedPUBLIC RADIO TODAY • 2012 EDITION4
The Executive Summary
Public Radio Thrives With Significant Portion of the U.S. Population
• During the Fall 2011 rating period covered by this year’s edition of Public Radio Today, nearly 32 million people—about 12% of the 12+ population—listened to a public radio station in an average week.
• Some 1,235 rated radio stations (AM, FM, streamed, and HD radio) were evaluated for this year’s report.• In an environment of increased media choices, time spent listening to public radio is stable when compared to the previous
year and we observed significant increases in public radio TSL among Men 18-34 and Men 55-64. • Public radio’s popularity among younger audiences continued to grow—it reached record numbers of 18-24 Men and 25-34
Men in Fall 2011. Even teens were listening to public radio since our first study in 2007.• The public News/Talk/Information format now accounts for a third of all rated public stations and about one-half of all public
radio listening. The format is most popular in the PPM markets but it’s the No. 1 format in Diary markets as well.• Classical this year became the second most popular public radio format. Classical Music stations accounted for 14% of all
public stations as of Fall 2011. • Nearly 10% of all public radio listening was to an Adult Album Alternative (AAA) or News-AAA station—a doubling of
listening compared to just two years ago.

© 2012 Arbitron Inc. All Rights ReservedPUBLIC RADIO TODAY • 2012 EDITION5
What’s New & Noteworthy in Public Radio Today 2012
PPM-Rated Markets Now in Place for Full Year
In December 2010, Arbitron completed its commercialization of the PPM service in 48 Metro markets. That means that for the first time since we began our series of public radio studies, users can compare the 2011 and 2012 editions of Public Radio Today using a similar set of Diary and PPM markets. Do note, however, that other market conditions may affect the data estimates in a specific year. For example, in this year’s study (2012), data from the Hartford-New Britain-Middletown market was not included due to the after effects of Hurricane Irene in 2011.
Some Factors to Consider When Comparing Editions of Public Radio Today. Several significant events affected radio ratings data in this and recent years:
• We did not publish a Public Radio Today study in 2008 (representing the 2007 data year), which could account for some larger-than-typical shifts in the data trends between 2006 and 2008.
• PPM data were included for the first time in the 2009 report, and the number of PPM-measured markets was expanded in the 2010 and 2011 reports.
• As a result of Hurricane Ike in 2008, data from Houston were not represented in the 2009 report. • Due to the after effects of Hurricane Irene in 2011, data from Hartford-New Britain-Middletown are not represented in the
2012 report.

© 2012 Arbitron Inc. All Rights ReservedPUBLIC RADIO TODAY • 2012 EDITION6
About Public Radio Today 2012
Public Radio Today contains radio listening and consumer behavior statistics for listeners to public radio stations in the United States. Data for the charts and graphs in this edition come from these sources:
• Format definitions are supplied to Arbitron by the Public Radio organizations listed on Page 2.
• The Arbitron TASPCAN™ Web National Regional Database, Fall 2011, includes quantitative radio audience information from across the United States.
• Scarborough data in this report is from the company’s National USA+ Study, Release 2, 2011.
Public Radio Today 2012 is published by Arbitron Inc.
• Ron Rodrigues, Arbitron Marketing/Radio Today Editor
• Jeff Green and Lauren Virshup, Arbitron Data Research
• Jenny Tsao, Scarborough Data Research
• Randy Brooks and Tatia Pack, Art Direction
• Kaitlyn Watkins, Copy Editor
Inquiries about Public Radio Today
Public radio clients should direct inquires to Chris Meinhardt: ([email protected])
Inquiries from journalists should go to Kim Myers: ([email protected])
Other inquiries should go to Ron Rodrigues: ([email protected])
About Scarborough
Scarborough (www.scarborough.com, [email protected])
measures American life. Its consumer insights reflect shopping
patterns, media usage across platforms, and lifestyle trends for
adults. Media professionals and marketers use Scarborough
insights to make smarter marketing/business decisions on things
like ad placement, multicultural targeting, and sponsorship
opportunities. The company’s core syndicated consumer insight
studies in 77 Top‐Tier Markets, its Multi‐Market Study and its
national USA+ Study are Media Rating Council (MRC) accredited.
Other products and services include Scarborough Mid‐Tier Local
Market Studies, Hispanic Studies and Custom Research Solutions.
Scarborough measures 2,000 consumer categories and serves a
broad client base that includes marketers, advertising agencies,
print and electronic media (broadcast and cable television, radio
stations), sports teams and leagues and out‐of‐home media
companies. Surveying more than 210,000 adults annually,
Scarborough is a joint venture between Arbitron Inc. and The
Nielsen Company.

© 2012 Arbitron Inc. All Rights Reserved
Average Quarter-Hour Persons(AQH Persons)The average number of Persons listening to aparticular station for at least five minutes duringa 15-minute period.
Average Quarter-Hour Rating (AQH Ratingor AQH PUR [Persons Using Radio])The Average Quarter-Hour Persons estimateexpressed as a percentage of the population beingmeasured.
Cume PersonsThe total number of different Persons who tune into a radio station during the course of a daypart forat least five minutes.
Cume Rating or Cume PURThe Cume Persons audience expressed as apercentage of all Persons estimated to be inthe specified demographic group listening to aparticular radio station or format.Example:
Format ShareThe percentage of those listening to radio in theMetro who are listening to a particular radio stationor format. Example:
IndexA numerical comparison of one percentage toanother, with 100 being the norm.
Time Spent Listening (TSL)An estimate of the amount of time the averagelistener spent with a station (or total radio) during aparticular daypart. This estimate, expressed inhours and minutes, is reported for the Metro only.Example:
PUBLIC RADIO TODAY • 2012 EDITION7
Glossary
6,400 AQH Persons to a specific format x 100 = Share of 8.0%
80,000 AQH Persons to all formats
168 Quarter-Hoursin a time period x 2,000 AQH
Persons = TSL of 8.4 hours40,000 Cume Audience
AQH Persons x 100 = AQH Rating (%)Population
Cume Personsx 100 = Cume Rating%
Population Group

© 2012 Arbitron Inc. All Rights ReservedPUBLIC RADIO TODAY • 2012 EDITION8
Public Radio Formats
Public Radio Formats
Public radio stations cover a wide variety of news, entertainment, music, and cultural genres. The programming format of a public station, like that of a commercial station, largely determines the kind of audience it attracts, as well as characteristics such as Time Spent Listening.
Most of the formats featured in Arbitron Public Radio Today differ from those listed in commercial radio versions of Radio Today. This is because the contrasting nature of public and commercial programming has led to radio formats that are distinctively public or commercial. The nine formats examined in this study are the leading formats in public radio programming. Their definitions were supplied to Arbitron by the public radio research and programming consortia noted on Page 2. Each station’s format was determined based on the station's programming during the Monday-Friday 6AM-7PM dayparts. Nationwide, 1,235 public radio stations met the Arbitron Minimum Reporting Standards, and those data were included in the 2012 study.
Some Notes About the Format Pages
The “Education” and “Household Income” charts only include responses from Persons aged 18 or older. The “Audience Composition” information shows how each age group contributes to that format’s total audience. For additional terms and definitions, please see the Glossary on the preceding page.
© 2012 Arbitron Inc. All Rights Reserved .
News/Talk/Information
PUBLIC RADIO TODAY • 2012 EDITION9
1.7% 2.6%
9.9%13.8%
21.0%24.8% 26.2%
P12+ P18-24 P25-34 P35-44 P45-54 P55-64 P65+
Women46.5% Men
53.5%
Listeners 12+Mon-Sun, 6AM-Mid
Audience CompositionPercent of Format Audience by Demographic
Mon-Sun, 6AM-Mid
continuedSource: TAPSCAN Web, Fall 2011. Note: Due to rounding, totals may not add to 100.
AQH Share of All Public Radio Listening
16,640,200Format Cume
Weekly Listeners 12+
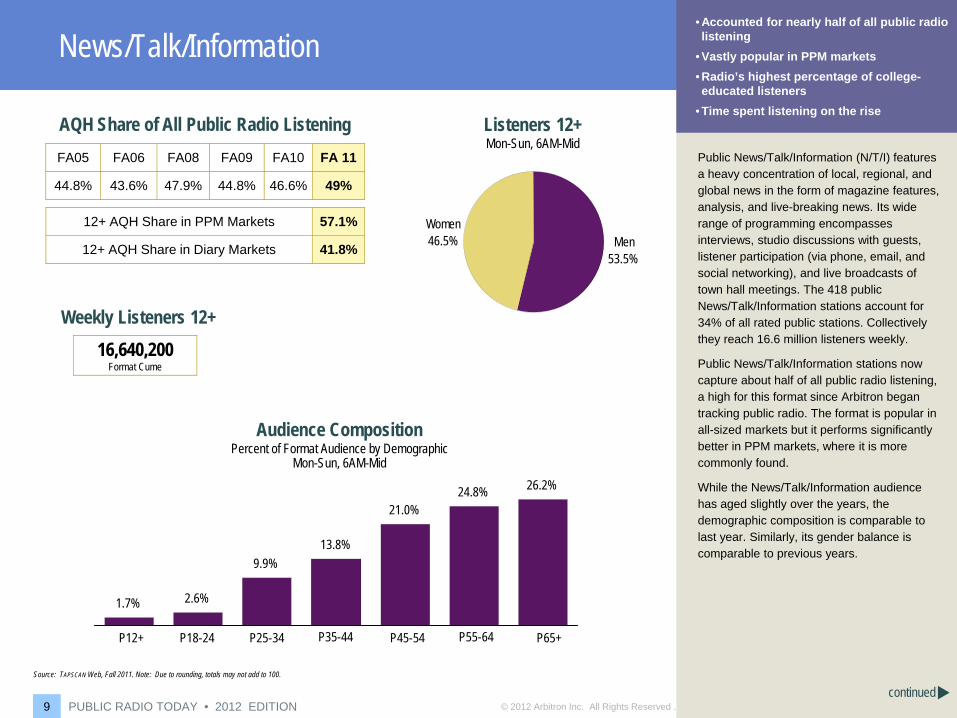
• Accounted for nearly half of all public radio listening
• Vastly popular in PPM markets• Radio’s highest percentage of college-educated listeners
• Time spent listening on the rise
FA05 FA06 FA08 FA09 FA10 FA 11
44.8% 43.6% 47.9% 44.8% 46.6% 49%
12+ AQH Share in PPM Markets 57.1%
12+ AQH Share in Diary Markets 41.8%
Public News/Talk/Information (N/T/I) features a heavy concentration of local, regional, and global news in the form of magazine features, analysis, and live-breaking news. Its wide range of programming encompasses interviews, studio discussions with guests, listener participation (via phone, email, and social networking), and live broadcasts of town hall meetings. The 418 public News/Talk/Information stations account for 34% of all rated public stations. Collectively they reach 16.6 million listeners weekly.
Public News/Talk/Information stations now capture about half of all public radio listening, a high for this format since Arbitron began tracking public radio. The format is popular in all-sized markets but it performs significantly better in PPM markets, where it is more commonly found.
While the News/Talk/Information audience has aged slightly over the years, the demographic composition is comparable to last year. Similarly, its gender balance is comparable to previous years.

© 2012 Arbitron Inc. All Rights Reserved .PUBLIC RADIO TODAY • 2012 EDITION10
News/Talk/Information
AQH Share of Listening by Location
Mon-Sun, 6AM-Mid, Persons 12+
At Home, 50.8%
Away From Home, 49.2%
continued
Audience Share by StateMon-Sun, 6AM-Mid, Persons 12+, AQH Shares
Index: Percent +/- National Format Share
No stations
<75%
75-150%
>150%
Source: TAPSCAN Web, Fall 2011. Note: Due to rounding, totals may not add to 100.
As with most information-based formats, public News/Talk/Information performed best during morning and afternoon drive times. Thanks in large part to NPR’s “Morning Edition,” public N/T/I far outperformed its total week AQH share during the weekday mornings. Afternoon drive on the format was similarly strong. Public N/T/I’s weekend ratings fell below its weekly average, but popular weekend programs such as “Car Talk,” “Wait Wait… Don’t Tell Me,” “This American Life,” and “A Prairie Home Companion,” helped the format to perform well on Saturdays and Sundays.
Listening to public N/T/I occurred evenly within the home and away-from-home, a trend that has been fairly stable throughout the years we’ve tracked public radio.
In Fall 2011, there were six states whose listening to public N/T/I exceeded the national average by more than 50%. N/T/I listening in an additional 21 states was above the national average. Seven states had no rated N/T/I stations and thus had no listening (and were colored neutral on the U.S. map).
Index of AQH Listening by DaypartPersons 12+, Mon-Sun, 6AM-Mid
100 = Mon-Sun, 6AM-Mid AQH Share
Mon-Fri6AM-10AM
Mon-Fri10AM-3PM
Mon-Fri3PM-7PM
Mon-Fri7PM-Mid
Sat-Sun6AM-Mid
169 108 130 35 85

© 2012 Arbitron Inc. All Rights Reserved .PUBLIC RADIO TODAY • 2012 EDITION11
Time Spent Listening by Demographic(Hours:Minutes)
Mon-Sun, 6AM-Mid
<$25K8.9%
$50K-$75K23.3%
>$75K49.5%
$25K-$50K18.3%
News/Talk/Information
Household IncomePersons 18+
College Graduate
69.7%
Some College21.4%
High School
Graduate7.5%
<12th Grade1.4%
EducationPersons 18+
Source: TAPSCAN Web, Fall 2011. Note: Due to rounding, totals may not add to 100.
5:154:30
3:302:30
P12-24 P18-34 P25-54 P35-64
5:15P12+
Public N/T/I listeners continue to be the best educated audience in all of radio—over 90% of its listeners have attended college and seven out of every 10 listeners held a college degree. Listeners to this format also lived in high-income households: half lived in households with at least $75,000 in income and nearly an additional quarter of the listeners were from homes with at least $50,000 in income. Together these income levels lead all other public and commercial formats.
This is the first year since the introduction of PPM measurement that we are able to compare time spent listening trends using the same grouping of PPM and Diary markets. TSL to public N/T/I expanded year over year; overall it is 15 minutes longer in the 2012 report compared to a year earlier.
© 2012 Arbitron Inc. All Rights Reserved .12
Classical Music
PUBLIC RADIO TODAY • 2012 EDITION12
continued
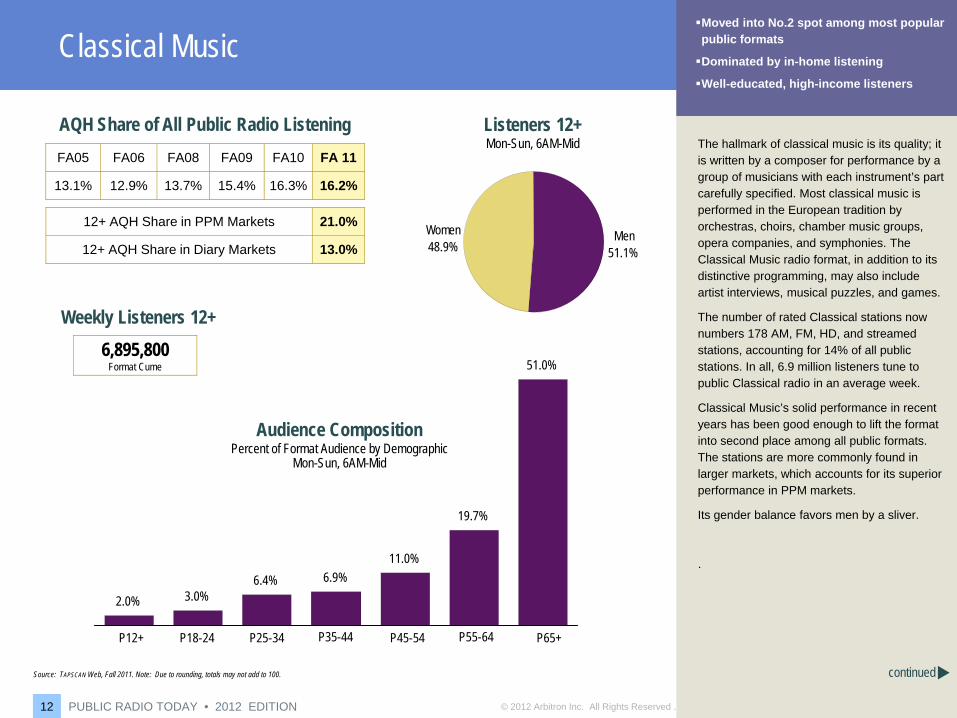
Moved into No.2 spot among most popular public formats
Dominated by in-home listening
Well-educated, high-income listeners
2.0% 3.0%6.4% 6.9%
11.0%
19.7%
51.0%
P12+ P18-24 P25-34 P35-44 P45-54 P55-64 P65+
Listeners 12+Mon-Sun, 6AM-Mid
Audience CompositionPercent of Format Audience by Demographic
Mon-Sun, 6AM-Mid
Source: TAPSCAN Web, Fall 2011. Note: Due to rounding, totals may not add to 100.
AQH Share of All Public Radio Listening
6,895,800Format Cume
Weekly Listeners 12+
FA05 FA06 FA08 FA09 FA10 FA 11
13.1% 12.9% 13.7% 15.4% 16.3% 16.2%
12+ AQH Share in PPM Markets 21.0%
12+ AQH Share in Diary Markets 13.0%Women48.9%
Men51.1%
The hallmark of classical music is its quality; it is written by a composer for performance by a group of musicians with each instrument’s part carefully specified. Most classical music is performed in the European tradition by orchestras, choirs, chamber music groups, opera companies, and symphonies. The Classical Music radio format, in addition to its distinctive programming, may also include artist interviews, musical puzzles, and games.
The number of rated Classical stations now numbers 178 AM, FM, HD, and streamed stations, accounting for 14% of all public stations. In all, 6.9 million listeners tune to public Classical radio in an average week.
Classical Music’s solid performance in recent years has been good enough to lift the format into second place among all public formats. The stations are more commonly found in larger markets, which accounts for its superior performance in PPM markets.
Its gender balance favors men by a sliver.
.

© 2012 Arbitron Inc. All Rights Reserved .13
Classical Music
13
AQH Share of Listening by Location
Mon-Sun, 6AM-Mid, Persons 12+
continued
Audience Share by StateMon-Sun, 6AM-Mid, Persons 12+, AQH Shares
At Home60.6%
Away From Home39.4%
Index: Percent +/- National Format Share
No stations
<75%
75-150%
>150%
Source: TAPSCAN Web, Fall 2011. Note: Due to rounding, totals may not add to 100.
PUBLIC RADIO TODAY • 2012 EDITION
Public classical performed best during the weekday midday hours (10AM-3PM), followed by stronger-than-average performances in morning and afternoon drive times. Its performance on the weekends and in evenings was lower than its total-week average.
Classical was dominated by in-home listening, a phenomenon that’s remained consistent going back to our 2007 report.
Public Classical in New Jersey, the District of Columbia, Maryland, and Arkansas earned a disproportionate amount of listening compared to the national average. Fourteen other states had public Classical listening larger than the national average. Eighteen states had no rated public Classical station.
Index of AQH Listening by DaypartPersons 12+, Mon-Sun, 6AM-Mid
100 = Mon-Sun, 6AM-Mid AQH Share
Mon-Fri6AM-10AM
Mon-Fri10AM-3PM
Mon-Fri3PM-7PM
Mon-Fri7PM-Mid
Sat-Sun6AM-Mid
116 139 115 56 86

© 2012 Arbitron Inc. All Rights Reserved .14
Classical Music
14 PUBLIC RADIO TODAY • 2012 EDITIONPUBLIC RADIO TODAY • 2012 EDITION14
Time Spent Listening by Demographic(Hours:Minutes)
Mon-Sun, 6AM-Mid
<$25K12.3%
$25K-$50K24.7%
$50K-$75K22.4%
>$75K40.6%
Household IncomePersons 18+
Some College24.4%
College Graduate
63.8%
High School
Graduate10.5%
<12th Grade1.3%
EducationPersons 18+
Source: TAPSCAN Web, Fall 2011. Note: Due to rounding, totals may not add to 100.
3:152:303:302:30
P12-24 P18-34 P25-54 P35-64
4:15P12+
Nearly 90% of public Classical listeners have attended college and nearly two-thirds of the audience graduated. Close to two-thirds of its audience lived in households with at least $50,000 in income.
Time spent listening to public Classical fell slightly, from four and a half hours to four hours, fifteen minutes.

© 2012 Arbitron Inc. All Rights Reserved .
News-Classical
15
continued
•Moved into 3rd place after holding 2nd for most of last decade
•Attracted 4.5 million weekly listeners
•Time spent listening gains across age spectrum
•Nearly two-thirds of listeners lived in $50k+ households
1.1% 2.5%6.9%
9.5%
16.9%
24.9%
38.3%
P12+ P18-24 P25-34 P35-44 P45-54 P55-64 P65+
Women50%
Men50%
Listeners 12+Mon-Sun, 6AM-Mid
Audience CompositionPercent of Format Audience by Demographic
Mon-Sun, 6AM-Mid
Source: TAPSCAN Web, Fall 2011. Note: Due to rounding, totals may not add to 100.
AQH Share of All Public Radio Listening
4,525,600Format Cume
Weekly Listeners 12+
FA05 FA06 FA08 FA09 FA10 FA 11
20.6% 21.1% 20.2% 21.2% 18.1% 15.6%
12+ AQH Share in PPM Markets 2.8%
12+ AQH Share in Diary Markets 26.9%
PUBLIC RADIO TODAY • 2012 EDITION
News-Classical stations devote at least 30% of airtime to news, public affairs or talk programming, or carry NPR newsmagazines. In addition, these stations spend at least 30%of their Monday-Friday 6AM-7PM airtime playing classical music.
Attracting 4.5 million weekly listeners, there were 230 rated News-Classical stations in the Fall of 2011, representing 19% of the public radio total. By comparison, 23% of public stations were News-Classical in the previous year.
News-Classical lost audience share in all sized markets, but the loss was most notable in the PPM markets where it lost about 60% of its audience.
Over time, the proportion of News-Classical listeners has grown somewhat in the 55+ age categories. Its gender balance was dead even: 50% male, 50% female.
© 2012 Arbitron Inc. All Rights Reserved .PUBLIC RADIO TODAY • 2012 EDITION16
News-Classical
AQH Share of Listening by Location
Mon-Sun, 6AM-Mid, Persons 12+
continued
Audience Share by StateMon-Sun, 6AM-Mid, Persons 12+, AQH Shares
Index: Percent +/- National Format Share
No stations
<75%
75-150%
>150%
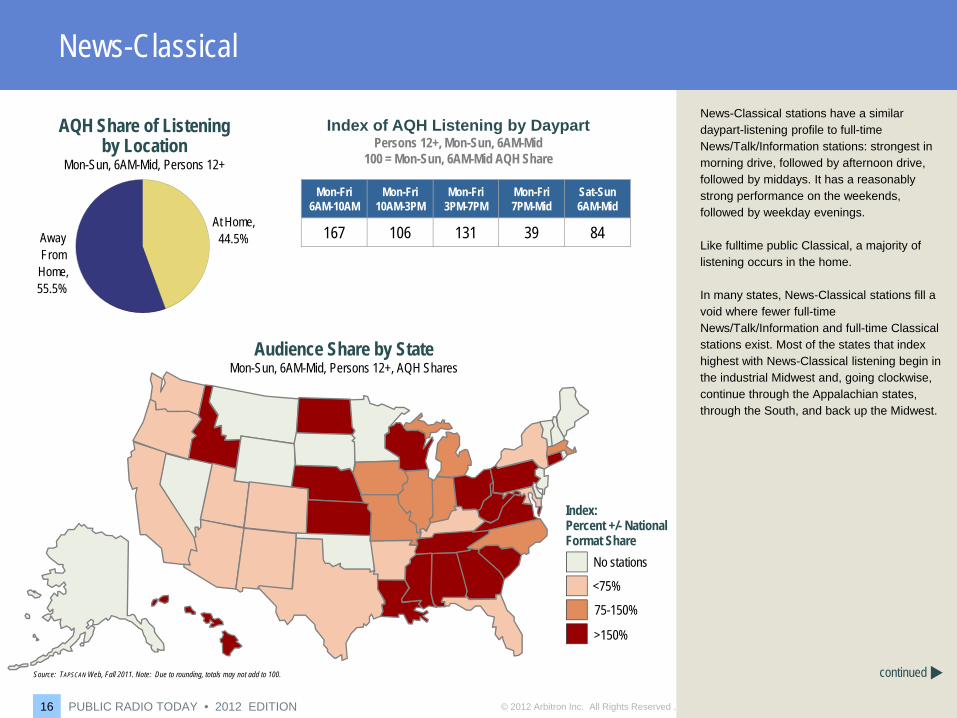
At Home, 44.5%Away
From Home, 55.5%
Source: TAPSCAN Web, Fall 2011. Note: Due to rounding, totals may not add to 100.
News-Classical stations have a similar daypart-listening profile to full-time News/Talk/Information stations: strongest in morning drive, followed by afternoon drive, followed by middays. It has a reasonably strong performance on the weekends, followed by weekday evenings.
Like fulltime public Classical, a majority of listening occurs in the home.
In many states, News-Classical stations fill a void where fewer full-time News/Talk/Information and full-time Classical stations exist. Most of the states that index highest with News-Classical listening begin in the industrial Midwest and, going clockwise, continue through the Appalachian states, through the South, and back up the Midwest.
Index of AQH Listening by DaypartPersons 12+, Mon-Sun, 6AM-Mid
100 = Mon-Sun, 6AM-Mid AQH Share
Mon-Fri6AM-10AM
Mon-Fri10AM-3PM
Mon-Fri3PM-7PM
Mon-Fri7PM-Mid
Sat-Sun6AM-Mid
167 106 131 39 84

© 2012 Arbitron Inc. All Rights Reserved .PUBLIC RADIO TODAY • 2012 EDITION17
6:005:00
3:452:45
P12-24 P18-34 P25-54 P35-64
6:00P12+
Time Spent Listening by Demographic(Hours:Minutes)
Mon-Sun, 6AM-Mid
News-Classical
Household IncomePersons 18+
<$25K11.8%
$25K-$50K24.0%
$50K-$75K22.7%
>$75K41.5%
Source: TAPSCAN Web, Fall 2011. Note: Due to rounding, totals may not add to 100.
Some College23.4%
College Graduate
66.2%
High School
Graduate9.2%
<12th Grade1.1%
EducationPersons 18+
News-Classical’s audience education profile looked similar to News/Talk/Information’s profile: about 90% of the audience attended college and two-thirds have a college degree. Forty percent of listeners lived in $75,000 or higher income-earning households and an additional 23% lived in $50k-earning households.
Time spent listening to News-Classical held steady for the third consecutive year at six hours even. TSL among each of the demographic cells between ages 12 and 64 rose by 15 minutes over the previous year.
© 2012 Arbitron Inc. All Rights Reserved .18
Adult Album Alternative (AAA)
18
continued
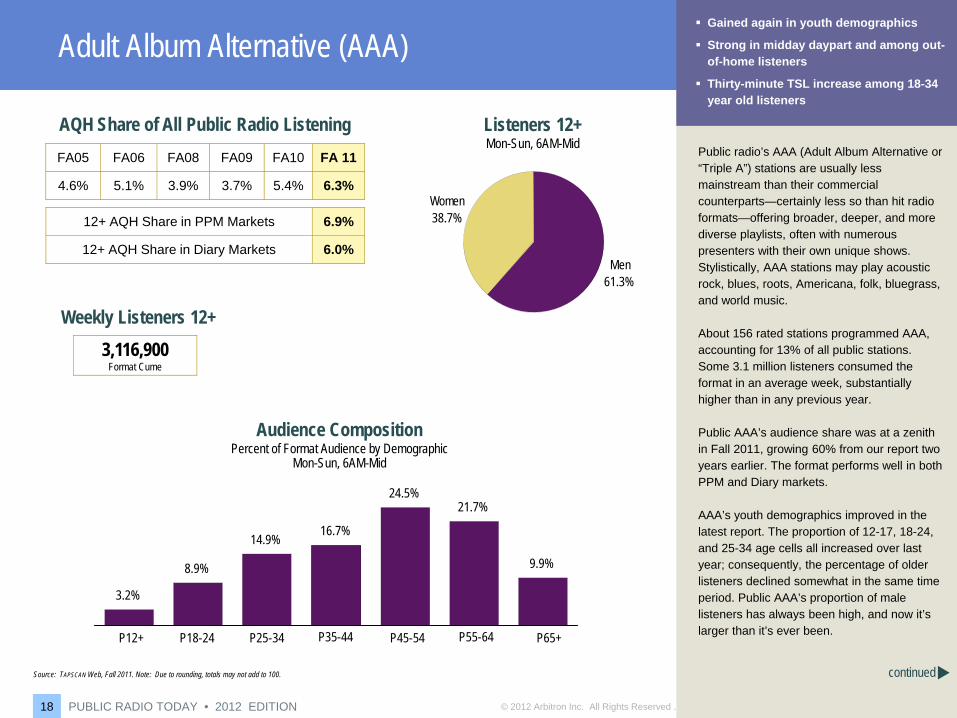
Gained again in youth demographics
Strong in midday daypart and among out-of-home listeners
Thirty-minute TSL increase among 18-34 year old listeners
PUBLIC RADIO TODAY • 2012 EDITION
3.2%
8.9%
14.9% 16.7%
24.5%21.7%
9.9%
P12+ P18-24 P25-34 P35-44 P45-54 P55-64 P65+
Women38.7%
Men61.3%
Listeners 12+Mon-Sun, 6AM-Mid
Audience CompositionPercent of Format Audience by Demographic
Mon-Sun, 6AM-Mid
Source: TAPSCAN Web, Fall 2011. Note: Due to rounding, totals may not add to 100.
AQH Share of All Public Radio Listening
3,116,900Format Cume
Weekly Listeners 12+
FA05 FA06 FA08 FA09 FA10 FA 11
4.6% 5.1% 3.9% 3.7% 5.4% 6.3%
12+ AQH Share in PPM Markets 6.9%
12+ AQH Share in Diary Markets 6.0%
Public radio’s AAA (Adult Album Alternative or “Triple A”) stations are usually less mainstream than their commercial counterparts—certainly less so than hit radio formats—offering broader, deeper, and more diverse playlists, often with numerous presenters with their own unique shows. Stylistically, AAA stations may play acoustic rock, blues, roots, Americana, folk, bluegrass, and world music.
About 156 rated stations programmed AAA, accounting for 13% of all public stations. Some 3.1 million listeners consumed the format in an average week, substantially higher than in any previous year.
Public AAA’s audience share was at a zenith in Fall 2011, growing 60% from our report two years earlier. The format performs well in both PPM and Diary markets.
AAA’s youth demographics improved in the latest report. The proportion of 12-17, 18-24, and 25-34 age cells all increased over last year; consequently, the percentage of older listeners declined somewhat in the same time period. Public AAA’s proportion of male listeners has always been high, and now it’s larger than it’s ever been.

© 2012 Arbitron Inc. All Rights Reserved .19
At Home39.8%
Away From Home60.2%
Adult Album Alternative (AAA)
19
AQH Share of Listening by Location
Mon-Sun, 6AM-Mid, Persons 12+
continued
Audience Share by StateMon-Sun, 6AM-Mid, Persons 12+, AQH Shares
Index: Percent +/- National Format Share
No stations
<75%
75-150%
>150%
Source: TAPSCAN Web, Fall 2011. Note: Due to rounding, totals may not add to 100.
PUBLIC RADIO TODAY • 2012 EDITION
AAA performed best in middays, Monday-Friday. The format still outperformed its weekly average in morning and afternoon drive, and its weekend performance was about average for public radio.
With its relatively youthful audience, a majority of public AAA’s listening occurred out of the home.
AAA’s listening levels exceeded the national average in 15 states (in four states it was triple the national average).
Index of AQH Listening by DaypartPersons 12+, Mon-Sun, 6AM-Mid
100 = Mon-Sun, 6AM-Mid AQH Share
Mon-Fri6AM-10AM
Mon-Fri10AM-3PM
Mon-Fri3PM-7PM
Mon-Fri7PM-Mid
Sat-Sun6AM-Mid
115 144 129 48 81

© 2012 Arbitron Inc. All Rights Reserved .
Adult Album Alternative (AAA)
PUBLIC RADIO TODAY • 2012 EDITION20
Time Spent Listening by Demographic(Hours:Minutes)
Mon-Sun, 6AM-Mid
<$25K10.4%
$25K-$50K24.3%
$50K-$75K27.6%
>$75K37.7%
Household IncomePersons 18+
<12th Grade4.0%
High School
Graduate19.7%
Some College28.8%
College Graduate
47.5%
EducationPersons 18+
Source: TAPSCAN Web, Fall 2011. Note: Due to rounding, totals may not add to 100.
4:003:303:153:00
P12-24 P18-34 P25-54 P35-64
3:30P12+
Compared to other public radio formats, the education level of public AAA listeners ranked about average, but still ahead of any commercial radio format. Back in our 2007 report about 46% of public AAA listeners resided in $75,000+ households compared to 38% in our current report. Public AAA has increased its proportion of households in the other income tiers in recent years.
Public AAA’s time spent listening has held steady from last year at three hours, 30 minutes. Average TSL among 18-34 listeners increased by a half-hour over last year.
© 2012 Arbitron Inc. All Rights Reserved .21
Jazz
21
continued
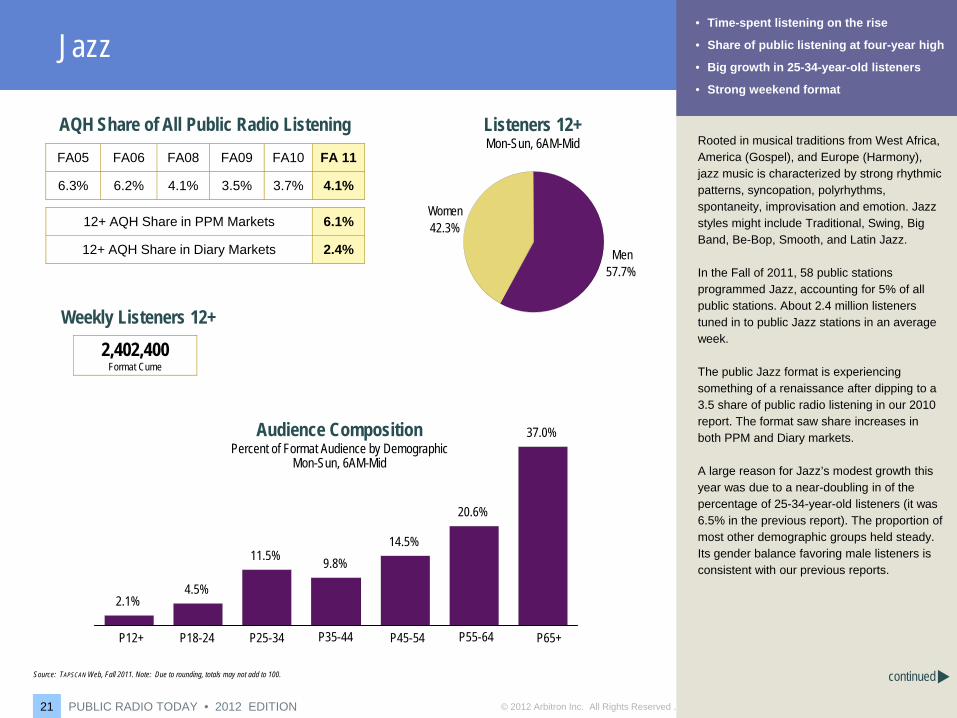
• Time-spent listening on the rise
• Share of public listening at four-year high
• Big growth in 25-34-year-old listeners
• Strong weekend format
PUBLIC RADIO TODAY • 2012 EDITION
2.1%4.5%
11.5% 9.8%14.5%
20.6%
37.0%
P12+ P18-24 P25-34 P35-44 P45-54 P55-64 P65+
Women42.3%
Men57.7%
Listeners 12+Mon-Sun, 6AM-Mid
Audience CompositionPercent of Format Audience by Demographic
Mon-Sun, 6AM-Mid
Source: TAPSCAN Web, Fall 2011. Note: Due to rounding, totals may not add to 100.
AQH Share of All Public Radio Listening
2,402,400Format Cume
Weekly Listeners 12+
FA05 FA06 FA08 FA09 FA10 FA 11
6.3% 6.2% 4.1% 3.5% 3.7% 4.1%
12+ AQH Share in PPM Markets 6.1%
12+ AQH Share in Diary Markets 2.4%
Rooted in musical traditions from West Africa, America (Gospel), and Europe (Harmony), jazz music is characterized by strong rhythmic patterns, syncopation, polyrhythms, spontaneity, improvisation and emotion. Jazz styles might include Traditional, Swing, Big Band, Be-Bop, Smooth, and Latin Jazz.
In the Fall of 2011, 58 public stations programmed Jazz, accounting for 5% of all public stations. About 2.4 million listeners tuned in to public Jazz stations in an average week.
The public Jazz format is experiencing something of a renaissance after dipping to a 3.5 share of public radio listening in our 2010 report. The format saw share increases in both PPM and Diary markets.
A large reason for Jazz’s modest growth this year was due to a near-doubling in of the percentage of 25-34-year-old listeners (it was 6.5% in the previous report). The proportion of most other demographic groups held steady. Its gender balance favoring male listeners is consistent with our previous reports.

© 2012 Arbitron Inc. All Rights Reserved .22
At Home47.8%
Away From Home52.2%
Jazz
22
AQH Share of Listening by Location
Mon-Sun, 6AM-Mid, Persons 12+
continued
Audience Share by StateMon-Sun, 6AM-Mid, Persons 12+, AQH Shares
Index: Percent +/- National Format Share
No stations
<75%
75-150%
>150%
Source: TAPSCAN Web, Fall 2011. Note: Due to rounding, totals may not add to 100.
PUBLIC RADIO TODAY • 2012 EDITION
Like other public music formats, public Jazz performed best at middays during the week, followed by weekday afternoons. It did particularly well on weekends and somewhat less so on weekday morning drives.
A slight majority of listening to Jazz occurred out of the home. In our 2007 report, a slight majority listened to public Jazz at home, which equates to an eight-point shift towards out-of-home listening over five years.
Twenty-three of the states had a public Jazz station with a ratings presence. Perhaps not surprisingly, Louisiana was the king of all public Jazz listening—the format in the Pelican state was nearly seven times as popular than the national average; Illinois and Alabama also had huge amounts of public Jazz listening, and five more states had public Jazz listening levels at least twice the national average.
Index of AQH Listening by DaypartPersons 12+, Mon-Sun, 6AM-Mid
100 = Mon-Sun, 6AM-Mid AQH Share
Mon-Fri6AM-10AM
Mon-Fri10AM-3PM
Mon-Fri3PM-7PM
Mon-Fri7PM-Mid
Sat-Sun6AM-Mid
87 138 120 54 102
© 2012 Arbitron Inc. All Rights Reserved .23
Jazz
23 PUBLIC RADIO TODAY • 2012 EDITIONPUBLIC RADIO TODAY • 2012 EDITION23
Time Spent Listening by Demographic(Hours:Minutes)
Mon-Sun, 6AM-Mid
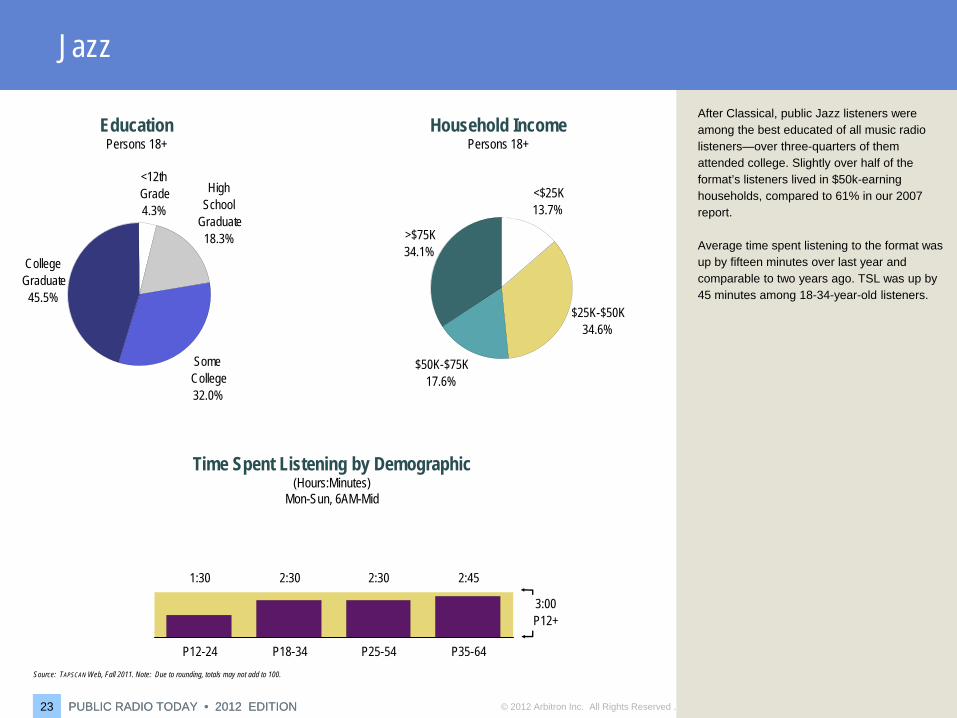
<$25K13.7%
$25K-$50K34.6%
$50K-$75K17.6%
>$75K34.1%
Household IncomePersons 18+
<12th Grade4.3%
High School
Graduate18.3%
Some College32.0%
College Graduate
45.5%
EducationPersons 18+
Source: TAPSCAN Web, Fall 2011. Note: Due to rounding, totals may not add to 100.
2:452:302:301:30
P12-24 P18-34 P25-54 P35-64
3:00P12+
After Classical, public Jazz listeners were among the best educated of all music radio listeners—over three-quarters of them attended college. Slightly over half of the format’s listeners lived in $50k-earning households, compared to 61% in our 2007 report.
Average time spent listening to the format was up by fifteen minutes over last year and comparable to two years ago. TSL was up by 45 minutes among 18-34-year-old listeners.
© 2012 Arbitron Inc. All Rights Reserved .24
News-AAA
24
continued
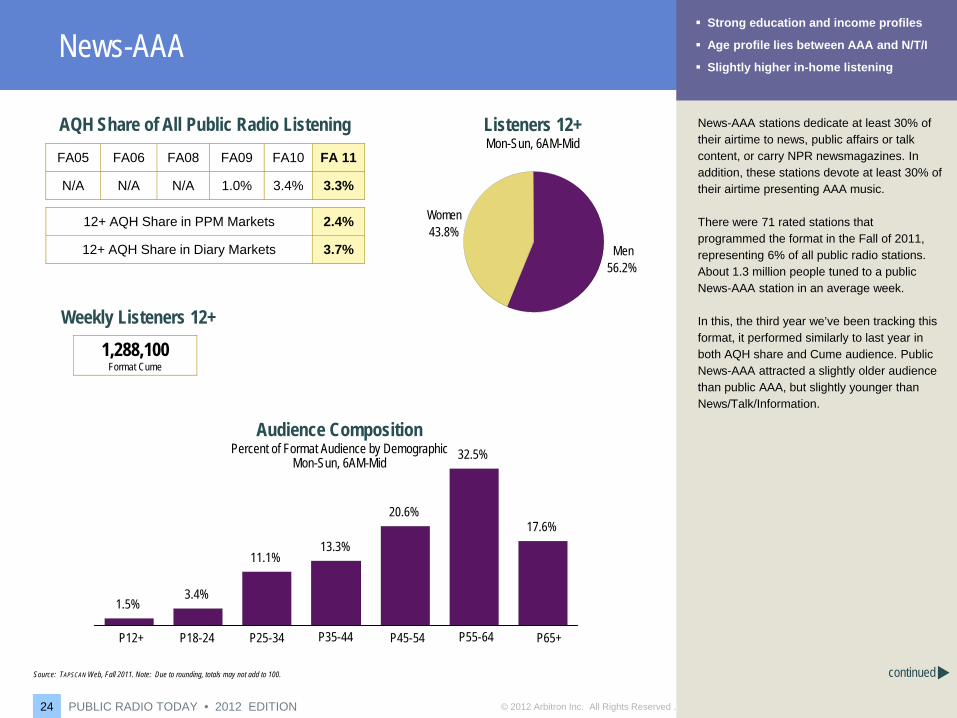
Strong education and income profiles
Age profile lies between AAA and N/T/I
Slightly higher in-home listening
PUBLIC RADIO TODAY • 2012 EDITION
1.5%3.4%
11.1%13.3%
20.6%
32.5%
17.6%
P12+ P18-24 P25-34 P35-44 P45-54 P55-64 P65+
Men56.2%
Women43.8%
Listeners 12+Mon-Sun, 6AM-Mid
Audience CompositionPercent of Format Audience by Demographic
Mon-Sun, 6AM-Mid
Source: TAPSCAN Web, Fall 2011. Note: Due to rounding, totals may not add to 100.
AQH Share of All Public Radio Listening
1,288,100Format Cume
Weekly Listeners 12+
FA05 FA06 FA08 FA09 FA10 FA 11
N/A N/A N/A 1.0% 3.4% 3.3%
12+ AQH Share in PPM Markets 2.4%
12+ AQH Share in Diary Markets 3.7%
News-AAA stations dedicate at least 30% of their airtime to news, public affairs or talk content, or carry NPR newsmagazines. In addition, these stations devote at least 30% of their airtime presenting AAA music.
There were 71 rated stations that programmed the format in the Fall of 2011, representing 6% of all public radio stations. About 1.3 million people tuned to a public News-AAA station in an average week.
In this, the third year we’ve been tracking this format, it performed similarly to last year in both AQH share and Cume audience. Public News-AAA attracted a slightly older audience than public AAA, but slightly younger than News/Talk/Information.

© 2012 Arbitron Inc. All Rights Reserved .25
At Home52.9%
Away From Home47.1%
News-AAA
25
AQH Share of Listening by Location
Mon-Sun, 6AM-Mid, Persons 12+
continued
Audience Share by StateMon-Sun, 6AM-Mid, Persons 12+, AQH Shares
Index: Percent +/- National Format Share
No stations
<75%
75-150%
>150%
Source: TAPSCAN Web, Fall 2011. Note: Due to rounding, totals may not add to 100.
PUBLIC RADIO TODAY • 2012 EDITION
Consistent with other full-time and part-time spoken word public formats, the format overperformed in morning and afternoon drive. It performed near its weekly average in middays, followed by a near-average performance on the weekends.
A slightly higher percentage of listening to public News-AAA occurred in the home vs. out of the home.
There were 14 rated News-AAA signals in Colorado, far more than any other state, making it the most popular state for the format. Nineteen other states had rated News-AAA stations, 10 of which exceeded the national listening average.
Index of AQH Listening by DaypartPersons 12+, Mon-Sun, 6AM-Mid
100 = Mon-Sun, 6AM-Mid AQH Share
Mon-Fri6AM-10AM
Mon-Fri10AM-3PM
Mon-Fri3PM-7PM
Mon-Fri7PM-Mid
Sat-Sun6AM-Mid
171 103 124 36 90

© 2012 Arbitron Inc. All Rights Reserved .
News-AAA
PUBLIC RADIO TODAY • 2012 EDITION26
Time Spent Listening by Demographic(Hours:Minutes)
Mon-Sun, 6AM-Mid
<$25K10.0%
$25K-$50K24.8%
$50K-$75K22.0%
>$75K43.1%
Household IncomePersons 18+
<12th Grade3.0%
High School
Graduate12.8%
Some College22.6%College
Graduate61.6%
EducationPersons 18+
Source: TAPSCAN Web, Fall 2011. Note: Due to rounding, totals may not add to 100.
4:454:003:30
2:30
P12-24 P18-34 P25-54 P35-64
4:30 P12+
The addition of news to any music format will raise the education and household income profile. About 84% of News-AAA listeners attended college, compared to 76% of AAA’s listeners, and 43% of News-AAA listeners lived in households earning $75k+ compared to 38% of AAA’s listeners.
Time spent listening to these stations was off by fifteen minutes over the last year and thirty minutes over the past two years.

© 2012 Arbitron Inc. All Rights Reserved .PUBLIC RADIO TODAY • 2012 EDITION27
News-Music
continued
More likely to be found in Diary and non-Metro areas
Growth in younger and older demographics
Strongest in Montana, Dakotas, Missouri
1.7%
7.8%10.3%
7.8%
18.7%22.6%
31.2%
P12+ P18-24 P25-34 P35-44 P45-54 P55-64 P65+
Men50.7%
Women49.3%
Listeners 12+Mon-Sun, 6AM-Mid
Audience CompositionPercent of Format Audience by Demographic
Mon-Sun, 6AM-Mid
Source: TAPSCAN Web, Fall 2011. Note: Due to rounding, totals may not add to 100.
AQH Share of All Public Radio Listening
713,700Format Cume
Weekly Listeners 12+
FA05 FA06 FA08 FA09 FA10 FA 11
5.7% 6.0% 6.2% 5.6% 2.9% 2.5%
12+ AQH Share in PPM Markets 0.1%
12+ AQH Share in Diary Markets 3.7%
News-Music dedicates at least 30% of airtime to news, public affairs or talk programming, or NPR newsmagazines. In addition, News-Music stations spend at least 30% of their airtime with a mix of music genres (such as Classical, Jazz, AAA, popular), typically with no single genre dominating that time.
There were 63 stations that programmed News-Music in the Fall of 2011, representing 5% of all public stations. About 713,000 listeners consumed News-Music stations in an average week.
News-Music stations were more likely to be found in smaller markets, which accounted for the format’s better AQH performance in Diary markets.
While the percentage of listeners to News-Music between ages 35 and 54 has declined over the years, the format saw growth in demographics younger than 35 and older than 54. The format’s gender balance was split nearly evenly between men and women.
© 2012 Arbitron Inc. All Rights Reserved .PUBLIC RADIO TODAY • 2012 EDITION28
News-Music
AQH Share of Listening by Location
Mon-Sun, 6AM-Mid, Persons 12+
continued
Audience Share by StateMon-Sun, 6AM-Mid, Persons 12+, AQH Shares
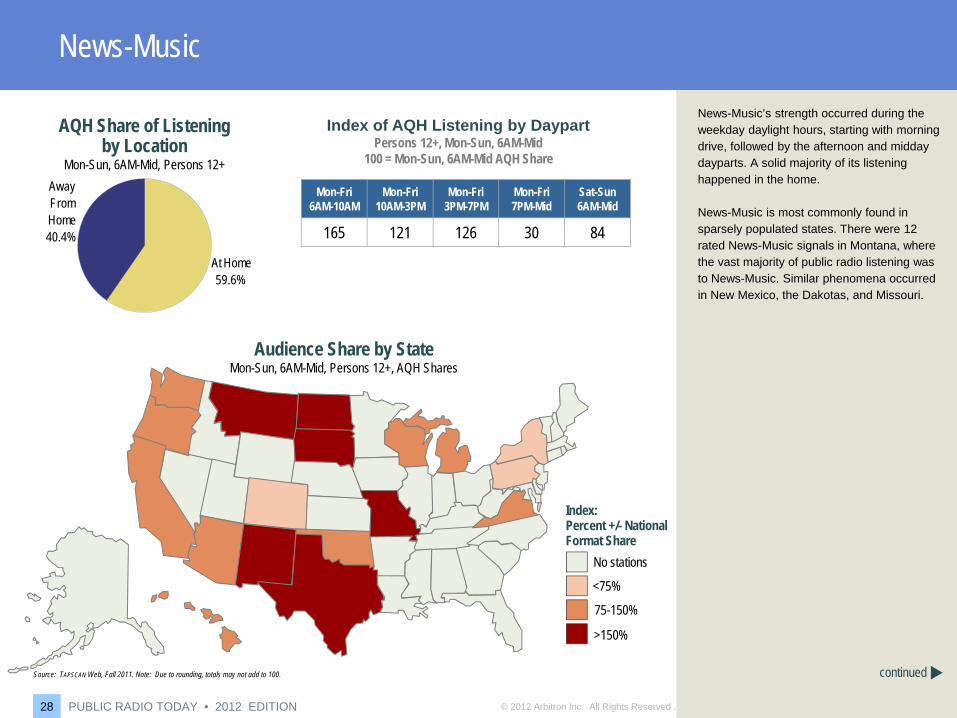
At Home59.6%
Away From Home40.4%
Index: Percent +/- National Format Share
No stations
<75%
75-150%
>150%
Source: TAPSCAN Web, Fall 2011. Note: Due to rounding, totals may not add to 100.
News-Music’s strength occurred during the weekday daylight hours, starting with morning drive, followed by the afternoon and midday dayparts. A solid majority of its listening happened in the home.
News-Music is most commonly found in sparsely populated states. There were 12 rated News-Music signals in Montana, where the vast majority of public radio listening was to News-Music. Similar phenomena occurred in New Mexico, the Dakotas, and Missouri.
Index of AQH Listening by DaypartPersons 12+, Mon-Sun, 6AM-Mid
100 = Mon-Sun, 6AM-Mid AQH Share
Mon-Fri6AM-10AM
Mon-Fri10AM-3PM
Mon-Fri3PM-7PM
Mon-Fri7PM-Mid
Sat-Sun6AM-Mid
165 121 126 30 84

© 2012 Arbitron Inc. All Rights Reserved .PUBLIC RADIO TODAY • 2012 EDITION29
News-Music
PUBLIC RADIO TODAY • 2012 EDITION29
Time Spent Listening by Demographic(Hours:Minutes)
Mon-Sun, 6AM-Mid
<$25K28.5%
$25K-$50K26.0%
$50K-$75K20.6%
>$75K24.9%
Household IncomePersons 18+
<12th Grade8.8%
High School
Graduate19.5%
Some College26.3%
College Graduate
45.5%
EducationPersons 18+
Source: TAPSCAN Web, Fall 2011. Note: Due to rounding, totals may not add to 100.
4:305:45 5:30 6:00
P12-24 P18-34 P25-54 P35-64
6:15P12+
News-Music’s education and household income profiles were somewhat lower than most other public formats, due in part to its younger demographics as well as the location of many of its stations in rural states and communities. “Only” 46% of its listeners had a college degree, yet that figure was as high as any commercial radio format. News-Music’s household income distribution was distributed fairly equally across the four categories.
As a large number of News-Music stations were located in smaller markets and towns, the format saw less fluctuation in its time spent listening figures than any other public format. Compared to the six hours, 45 minutes of TSL in our 2007 report, News-Music’s 2012 TSL was just a half-hour less.

© 2012 Arbitron Inc. All Rights Reserved .30
News-Jazz
30
continued
Among the best educated music radio consumers
Strongest in Diary, rural markets
Big numbers in Nevada, Washington, Mississippi
PUBLIC RADIO TODAY • 2012 EDITION
1.1% 1.8%
6.7%
11.7%
19.9%
30.9%28.0%
P12+ P18-24 P25-34 P35-44 P45-54 P55-64 P65+
Men56.0%
Women44.0%
Listeners 12+Mon-Sun, 6AM-Mid
Audience CompositionPercent of Format Audience by Demographic
Mon-Sun, 6AM-Mid
Source: TAPSCAN Web, Fall 2011. Note: Due to rounding, totals may not add to 100.
AQH Share of All Public Radio Listening
1,010,400Format Cume
Weekly Listeners 12+
FA05 FA06 FA08 FA09 FA10 FA 11
3.0% 2.5% 2.8% 2.7% 2.2% 2.0%
12+ AQH Share in PPM Markets 2.6%
12+ AQH Share in Diary Markets 1.3%
News-Jazz dedicates at least 30% of its airtime to news, public affairs or talk content, or carries NPR newsmagazines. In addition, these stations devote at least 30% of their airtime presenting jazz music.
Twenty-one stations programmed News-Jazz in the Fall of 2001, representing 2% of all public stations. About one million listeners consumed public News-Jazz radio in an average week.
Owing to the migration of many News-Jazz stations to other formats over the years, the format was at its lowest AQH ebb since Arbitron began tracking public radio.

© 2012 Arbitron Inc. All Rights Reserved .31
At Home51.9%
Away From Home48.1%
News-Jazz
31
AQH Share of Listening by Location
Mon-Sun, 6AM-Mid, Persons 12+
continued
Audience Share by StateMon-Sun, 6AM-Mid, Persons 12+, AQH Shares
Index: Percent +/- National Format Share
No stations
<75%
75-150%
>150%
Source: TAPSCAN Web, Fall 2011. Note: Due to rounding, totals may not add to 100.
PUBLIC RADIO TODAY • 2012 EDITION
News-Jazz performed at or above its weekly ratings average in every major daypart of the week, except for weekday evenings, a characteristic that no other public format can match.
A slight majority of News-Jazz listening occurred in the home, a measure that’s been consistent in recent years.
News-Jazz had a rated presence in 12 states and was most popular in Nevada, Washington, Mississippi, and Maryland.
Index of AQH Listening by DaypartPersons 12+, Mon-Sun, 6AM-Mid
100 = Mon-Sun, 6AM-Mid AQH Share
Mon-Fri6AM-10AM
Mon-Fri10AM-3PM
Mon-Fri3PM-7PM
Mon-Fri7PM-Mid
Sat-Sun6AM-Mid
138 104 131 40 101
© 2012 Arbitron Inc. All Rights Reserved .32
News-Jazz
32 PUBLIC RADIO TODAY • 2012 EDITIONPUBLIC RADIO TODAY • 2012 EDITION32
Time Spent Listening by Demographic(Hours:Minutes)
Mon-Sun, 6AM-Mid
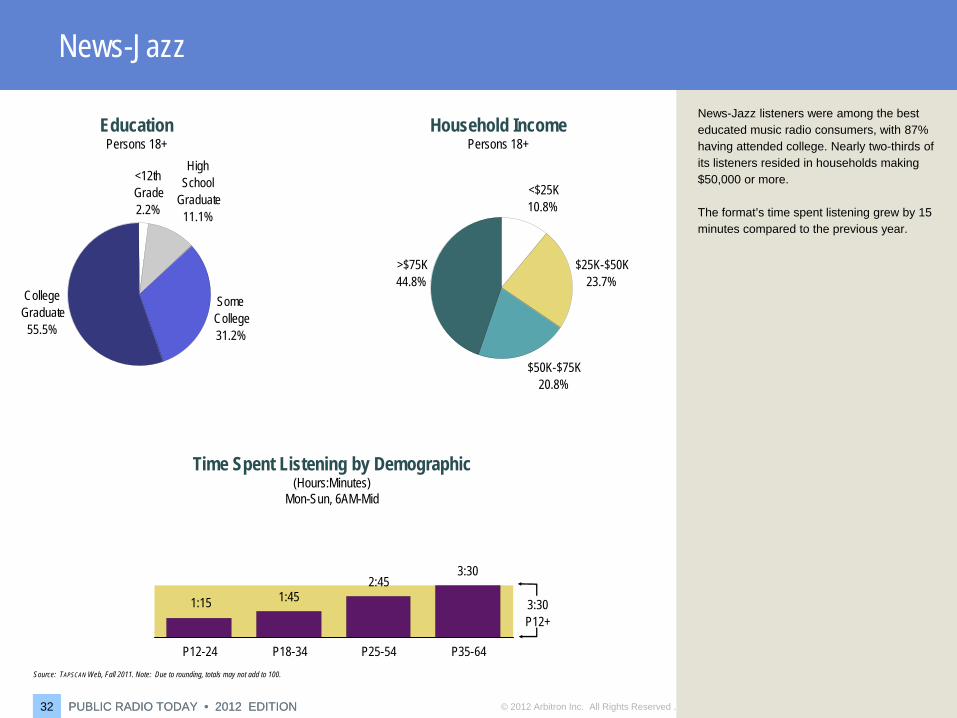
<$25K10.8%
$25K-$50K23.7%
$50K-$75K20.8%
>$75K44.8%
Household IncomePersons 18+
<12th Grade2.2%
High School
Graduate11.1%
Some College31.2%
College Graduate
55.5%
EducationPersons 18+
Source: TAPSCAN Web, Fall 2011. Note: Due to rounding, totals may not add to 100.
1:452:45
3:30
1:15
P12-24 P18-34 P25-54 P35-64
3:30P12+
News-Jazz listeners were among the best educated music radio consumers, with 87% having attended college. Nearly two-thirds of its listeners resided in households making $50,000 or more.
The format’s time spent listening grew by 15 minutes compared to the previous year.
© 2012 Arbitron Inc. All Rights Reserved .33
Variety Music
33
continued
Strongest performance in middays and afternoons
Majority of listening was out of home
Reaches nearly one million listeners in average week
PUBLIC RADIO TODAY • 2012 EDITION
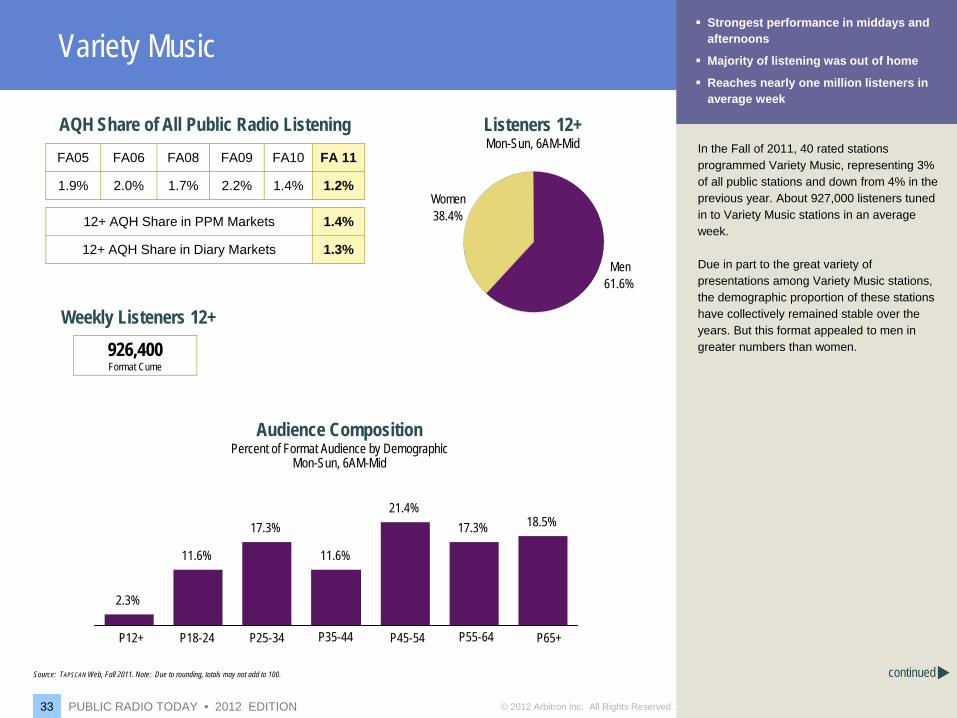
2.3%
11.6%
17.3%
11.6%
21.4%17.3% 18.5%
P12+ P18-24 P25-34 P35-44 P45-54 P55-64 P65+
Men61.6%
Women38.4%
Listeners 12+Mon-Sun, 6AM-Mid
Audience CompositionPercent of Format Audience by Demographic
Mon-Sun, 6AM-Mid
Source: TAPSCAN Web, Fall 2011. Note: Due to rounding, totals may not add to 100.
AQH Share of All Public Radio Listening
926,400Format Cume
Weekly Listeners 12+
FA05 FA06 FA08 FA09 FA10 FA 11
1.9% 2.0% 1.7% 2.2% 1.4% 1.2%
12+ AQH Share in PPM Markets 1.4%
12+ AQH Share in Diary Markets 1.3%
In the Fall of 2011, 40 rated stations programmed Variety Music, representing 3% of all public stations and down from 4% in the previous year. About 927,000 listeners tuned in to Variety Music stations in an average week.
Due in part to the great variety of presentations among Variety Music stations, the demographic proportion of these stations have collectively remained stable over the years. But this format appealed to men in greater numbers than women.

© 2012 Arbitron Inc. All Rights Reserved .34
At Home40.1%
Away From Home59.9%
Variety Music
34
AQH Share of Listening by Location
Mon-Sun, 6AM-Mid, Persons 12+
continued
Audience Share by StateMon-Sun, 6AM-Mid, Persons 12+, AQH Shares
Index: Percent +/- National Format Share
No stations
<75%
75-150%
>150%
Source: TAPSCAN Web, Fall 2011. Note: Due to rounding, totals may not add to 100.
PUBLIC RADIO TODAY • 2012 EDITION
Due to the nature of programming on these stations, Variety Music did best during the weekday midday and afternoon drive dayparts.
Considering its relatively youthful demographic profile, about 60% of public Variety Music’s listening occurred away from the home.
There were 15 states with Variety Music stations. The most popular states for the format were Texas, Maine, Missouri, Massachusetts, and Indiana.
Index of AQH Listening by DaypartPersons 12+, Mon-Sun, 6AM-Mid
100 = Mon-Sun, 6AM-Mid AQH Share
Mon-Fri6AM-10AM
Mon-Fri10AM-3PM
Mon-Fri3PM-7PM
Mon-Fri7PM-Mid
Sat-Sun6AM-Mid
94 136 130 47 98

© 2012 Arbitron Inc. All Rights Reserved .35
Variety Music
35 PUBLIC RADIO TODAY • 2012 EDITIONPUBLIC RADIO TODAY • 2012 EDITION35
Time Spent Listening by Demographic(Hours:Minutes)
Mon-Sun, 6AM-Mid
<$25K24.9%
$25K-$50K29.0%
$50K-$75K19.5%
>$75K26.6%
Household IncomePersons 18+
<12th Grade11.3%
High School
Graduate28.0%
Some College28.6%
College Graduate
32.1%
EducationPersons 18+
Source: TAPSCAN Web, Fall 2011. Note: Due to rounding, totals may not add to 100.
2:15 2:15 2:152:00
P12-24 P18-34 P25-54 P35-64
2:15P12+
Variety Music stations had a lower education and household income profile that the other public formats, due in part to their location primarily in rural areas and lesser populated states along with a younger demographic profile. About 61% of its listeners attended college, which still ranked high among all radio listeners. Nearly half of its listeners lived in households with at least $50,000 in income.
Variety Music’s two hours, 15 minutes of weekly time spent listening was the lowest of any public radio format.
© 2012 Arbitron Inc. All Rights ReservedPUBLIC RADIO TODAY • 2012 EDITION36
Scarborough Qualitatives
Public Radio Today 2012 provides expanded insights into household factors, employment and homeownership, culled from our Scarborough Research databases. You’ll also find indices for these consumer behaviors among public radio listeners:
• Environmental Efforts• Health and Wellness• Financial Planning• Home Sweet Home• Business Travelers—Staying Connected

© 2012 Arbitron Inc. All Rights Reserved .37
Environmental Efforts
Public radio listeners are above national norms for practicing every eco-friendly activity measured in the Scarborough survey.
They are above average in conserving resources at home by recycling, using less water, using energy-efficient light bulbs and installing energy-saving appliances. And they carry their ecological principles to the grocery store with them by using reusable grocery bags and buying locally grown and organic food products and eco-friendly cleaning products.
Although hybrid vehicles account for less than two percent of total vehicles on the road in the USA today, public radio listeners are twice as likely as the general public to live in households that own or lease hybrids. And one of every four adults who report that they are planning to buy a hybrid is a public radio listener.
Listeners are more likely than the general public to pay more to obtain eco-friendly products and services and to make financial contributions to environmental organizations.
37
Source: Scarborough USA+, Release 2, 2011. Index compares public radio listeners with total adults in USA. An index of 100 is average.
Compared with total adults nationwide, public radio listeners are more likely to: Index
Recycle Glass, Plastic, Paper 118
Use Energy-Efficient Light Bulbs 106
Use Reusable Grocery Bags 125
Use Less Water at Home 113
Recycle Electronics 139
Buy Locally Grown Food 127
Live in Households that Own Energy-Saving Appliances 112
Use Rechargeable Batteries 110
Drive Less or Use Alternative Transportation 120
Buy Eco-Friendly Cleaning Products 132
Buy Organic Food 156
Pay More for Eco-Friendly Products and Services 160
Support Politicians Based on Environmental Positions 213
Contribute to Environmental Organizations 202
Live in Households That Are Planning to Buy Energy-Saving Appliances 108
Live in Households That Are Planning to Buy a Hybrid Vehicle 139
Live in Households That Own or Lease a Hybrid Vehicle 203
PUBLIC RADIO TODAY • 2012 EDITION

© 2012 Arbitron Inc. All Rights Reserved .PUBLIC RADIO TODAY • 2012 EDITION38
Health and Wellness
Public radio listeners exceed national norms for a number of health and wellness indicators that are measured in the Scarborough survey.
A strong majority (90%) of listeners have some type of health insurance and nearlytwo-thirds (64%) have life insurance. These rates of coverage are higher than those of the average adult (85% have health insurance and 59% have life insurance).
Compared with the general public, public radio listeners are more likely to get dental and vision checkups and to see dermatologists. They are above average in choosing activities that contribute to a healthy lifestyle—like swimming, biking, hitting the gym and eating organically.
Listeners are also more inclined to use the Internet as a health and wellness tool—they are above average for seeking out medical services or information online and for shopping for medicine or prescriptions online.
Compared with total adults nationwide, public radio listeners are more likely to: Index
Have Health Insurance 106
Have Life Insurance 108
Have Dental Check ups or Procedures 118
Have Vision Check ups or Procedures 110
See Dermatologists 136
Look for Medical Services or Information Online 135
Shop for Medicine or Prescriptions Online 129
Swim 107
Bike 128
Use Free Weights/Circuit Training 129
Belong to Health or Exercise Club 138
Regularly Buy Organic Food 156
Jog/Run 107
Hike/Backpack 154
Golf 123
Practice Yoga/Pilates 157
Source: Scarborough USA+, Release 2, 2011. Index compares public radio listeners with total adults in USA. An index of 100 is average.

© 2012 Arbitron Inc. All Rights Reserved .PUBLIC RADIO TODAY • 2012 EDITION39
Financial Planning
Public radio listeners live in households where saving is valued. Most (74%) have some type of savings product, well above the average of 67% among the general population. They are more likely than national norms to live in households that have savings accounts, IRAs and 401(k) plans, money market accounts and CDs. Savings accounts are the most common type of savings products used.
Most listeners (64%) also have household investments and are much more likely than the general public (at 50%) to have stocks, mutual funds, money market funds and bonds.
They are also more inclined to engage the services of financial professionals like accountants, financial planners and full-service or discount stockbrokers.
The public radio audience is well ahead of the general public in using online bill paying and in accessing other types of financial information and services that are available online.
Compared with total adults nationwide, public radio listeners are more likely to live in households that have:Savings Products Index
Savings Account 111
IRA 147
401(k) Plan 136
Money Market Account 152
Certificates of Deposit (CDs) 129
529 College Savings Plan 167Investment Products Index
Stocks or Stock Options 142
Mutual Funds 155
Money Market Funds 154
Bonds 154
Second Home or Real Estate Property 136Professional Services Index
Accountant 143
Financial Planner 145
Stockbroker 160Use of Online Access Index
Pay Bills Online 122
Go Online for Financial Information or Services 144
Source: Scarborough USA+, Release 2, 2011. Index compares public radio listeners with total adults in USA. An index of 100 is average.

© 2012 Arbitron Inc. All Rights Reserved .PUBLIC RADIO TODAY • 2012 EDITION40
Home Sweet Home
Public radio listeners are 11% more likely to be homeowners than are total U.S. adults (78% of listeners own their home compared with 71% of total adults).
Listeners do a better than average job of keeping up with home maintenance like interior and exterior painting and window replacement. Home-improvement projects are also a priority for many homeowners in the public radio audience. Listeners are above the national average of all homeowners for annual spending on hardware, building, paint, and lawn and garden items. Annual household spending for these items among public radio listeners averages $3,991 (compared with $3,636 among all homeowners).
Listeners are more likely than the average homeowner to buy furniture during a typical year and to shop online for home furnishings and accessories. Both local and national companies wishing to reach a highly qualified group of homeowners have an ideal opportunity to do so through public radio sponsorships and underwriting programs.
Compared with all homeowners, those who are public radio listeners are more likely to: Index
Have Broadband Internet Connection 109
Own HDTV 101
Enjoy Gardening 109
Have a Mortgage 119
Own or Plan to Buy Energy-Saving Appliances 108
Do Landscaping Projects 112
Spend $3,000+ on Hardware, Building, Paint, Lawn and Garden Items During a Typical Year 109
Do Interior Painting/Wallpapering 103
Buy Furniture 112
Have a Home Security System 114
Have an Office in the Home 128
Use a Pest Control Service 106
Shop Online for Home Accessories 118
Shop Online for Furniture/Home Furnishings 126
Do Exterior Painting 114
Buy Home Music Systems/Equipment 114
Replace Windows 113
Source: Scarborough USA+, Release 2, 2011. Index compares public radio listener homeowners with total homeowners in USA. An index of 100 is average.
© 2012 Arbitron Inc. All Rights Reserved .PUBLIC RADIO TODAY • 2012 EDITION41
Business Travelers—Staying Connected
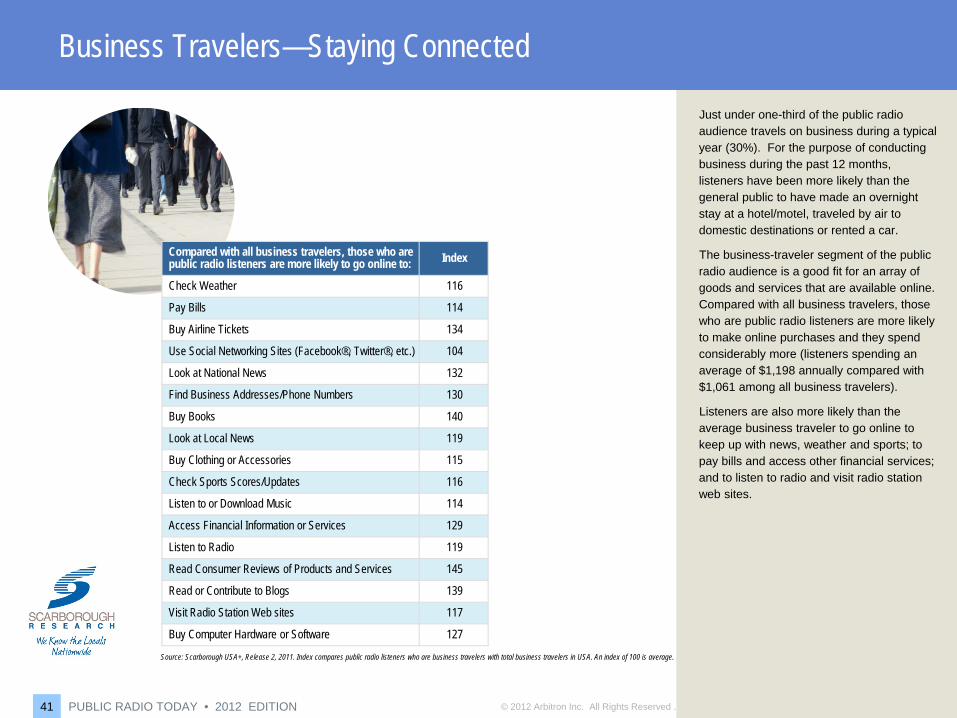
Just under one-third of the public radio audience travels on business during a typical year (30%). For the purpose of conducting business during the past 12 months, listeners have been more likely than the general public to have made an overnight stay at a hotel/motel, traveled by air to domestic destinations or rented a car.
The business-traveler segment of the public radio audience is a good fit for an array of goods and services that are available online. Compared with all business travelers, those who are public radio listeners are more likely to make online purchases and they spend considerably more (listeners spending an average of $1,198 annually compared with $1,061 among all business travelers).
Listeners are also more likely than the average business traveler to go online to keep up with news, weather and sports; to pay bills and access other financial services; and to listen to radio and visit radio station web sites.
Compared with all business travelers, those who are public radio listeners are more likely to go online to: Index
Check Weather 116
Pay Bills 114
Buy Airline Tickets 134
Use Social Networking Sites (Facebook®, Twitter®, etc.) 104
Look at National News 132
Find Business Addresses/Phone Numbers 130
Buy Books 140
Look at Local News 119
Buy Clothing or Accessories 115
Check Sports Scores/Updates 116
Listen to or Download Music 114
Access Financial Information or Services 129
Listen to Radio 119
Read Consumer Reviews of Products and Services 145
Read or Contribute to Blogs 139
Visit Radio Station Web sites 117
Buy Computer Hardware or Software 127
Source: Scarborough USA+, Release 2, 2011. Index compares public radio listeners who are business travelers with total business travelers in USA. An index of 100 is average.
© 2012 Arbitron Inc. All Rights ReservedPUBLIC RADIO TODAY • 2012 EDITION42
National Public Radio Listening Trends
The following pages detail nationwide listening patterns among public radio audiences. You’ll see listening data tracked by age, gender, time-of-day, and listening location. Also presented are informative format rankings by audience share and geographic region.

© 2012 Arbitron Inc. All Rights Reserved .PUBLIC RADIO TODAY • 2012 EDITION43
6.2 6.4
11.1
13.4
15.1
18.4 18.1
6.2 5.9
9.710.6
12.4
14.6 14.7
P12-17 P18-24 P25-34 P35-44 P45-54 P55-64 P65+
12.1 P12+
Public Radio Reaches All Ages
Weekly Cume RatingPercent of Population That Tunes In to Public Radio
MenWomen How To Read:
These figures represent “weekly Cume ratings.” For example, in the Fall of 2011, 13.4% of all men aged 35-44 in the United States tuned in to public radio between the hours of 6AM and Midnight, Monday through Sunday, at least once during an average week. The tinted background represents the average of all 12+ Americans who listened to public radio at least once during the week.
continued
Source: TAPSCAN Web, Fall 2011. Note: Due to rounding, totals may not add to 100.
During the Fall of 2011, 12% of the 12+ population in the U.S. listened to a public radio station at least once in an average week. That figure is nearly even with last year’s 12.2 Cume Rating, which represented a high water mark since we began tracking public radio listening trends. Public radio earned record listening levels this year from certain age groups, including Men 18-24 and Men 25-34. Among 12-17-year-olds, 6.2% of teen boys and a like percentage of teen girls listened to a public station in a given week; those figures match or exceed any previous listening levels in this demographic.
Among the older age groups, listening levels were relatively stable from last year; the most dramatic year-to-year change was a .6 increase in Cume Rating among Women 45-54 and a .8 decrease in Cume Rating among Women 55-64.

© 2012 Arbitron Inc. All Rights Reserved .PUBLIC RADIO TODAY • 2012 EDITION44
Public Radio Reaches All Ages
2:00
3:30 3:454:15
5:30
7:158:00
2:00
3:003:45 4:00
5:15
6:30
8:15
P12-17 P18-24 P25-34 P35-44 P45-54 P55-64 P65+
5:30 P12+
Time Spent Listening to Public RadioHours:Minutes per Week
MenWomen
Source: TAPSCAN Web, Fall 2011. Note: Due to rounding, totals may not add to 100.
This is the first year in our Public Radio Todayseries in which we can fairly compare year-to-year time spent listening trends. Year-to-year comparisons in previous years were difficult because of the ongoing conversion of markets from Diary to PPM measurement; the last of these methodology conversions occurred in December 2010, which means that this year’s edition of Public Radio Today represents the second consecutive report with the same set of Diary and PPM markets.
Overall 12+ time spent listening of five hours, 30 minutes to Public Radio did not change from the previous year. Most of the changes among the specific age cells were also stable, with a couple of exceptions: time spent listening among Men 18-24 increased from two hours, 45 minutes to three hours, 30 minutes and among Men 55-64 increased from six hours, 45 minutes to seven hours, 15 minutes.
© 2012 Arbitron Inc. All Rights Reserved .PUBLIC RADIO TODAY • 2012 EDITION45
Hour-by-Hour Listening
0.0
0.2
0.4
0.6
0.8
1.0
1.2
5 6 7 8 9 10 11 12 1 2 3 4 5 6 7 8 9 10 11 12 1 2 3 4
Mon-Fri
Sat-Sun
Noon PM Mid AMAM
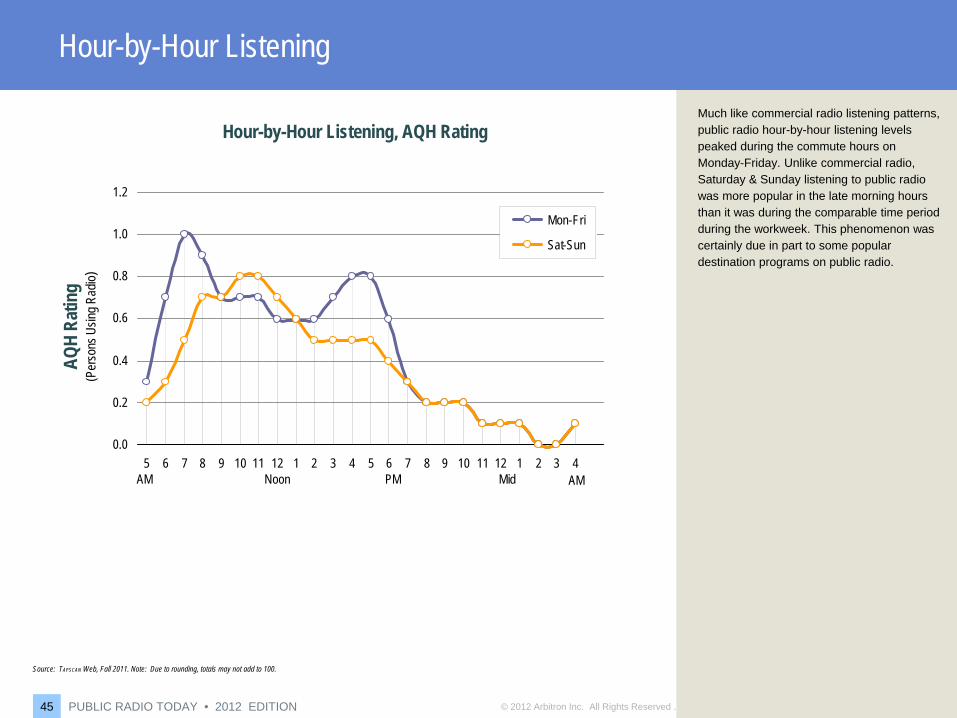
Hour-by-Hour Listening, AQH Rating
AQH
Ratin
g(P
erso
ns U
sing R
adio)
Source: TAPSCAN Web, Fall 2011. Note: Due to rounding, totals may not add to 100.
Much like commercial radio listening patterns, public radio hour-by-hour listening levels peaked during the commute hours on Monday-Friday. Unlike commercial radio, Saturday & Sunday listening to public radio was more popular in the late morning hours than it was during the comparable time period during the workweek. This phenomenon was certainly due in part to some popular destination programs on public radio.

© 2012 Arbitron Inc. All Rights Reserved .PUBLIC RADIO TODAY • 2012 EDITION46
Public Radio Listening Location by Men and Women
0.0
0.20.3
0.4 0.4
0.00.1
0.20.3 0.3
P12-17 P18-34 P25-54 P35-64 P65+
0.3 P12+
MenWomen
0.1 0.10.2
0.3
0.7
0.1 0.10.2
0.3
0.7
P12-17 P18-34 P25-54 P35-64 P65+
0.3 P12+
Source: TAPSCAN Web, Fall 2010. Note: Due to rounding, totals may not add to 100.
The proportional breakout of public radio listening according to listening location (“at home” vs. “away from home”) has hardly changed over the years. Slightly more listening occurred out of the home among listeners under the age of 65. These figures changed dramatically among listeners aged 65+, where twice as much listening occurs at home as it does away from home.
At-Home Listening for Men and WomenTotal Week, AQH Rating
Away-from-Home Listening for Men and WomenTotal Week, AQH Rating

© 2012 Arbitron Inc. All Rights Reserved .PUBLIC RADIO TODAY • 2012 EDITION47
Public Radio Listening Location—At Home vs. Away From Home
Home
Away From Home
Mon-Sun 6AM-Mid 52.6% 47.4%
Mon-Fri 6AM-10AM 57.3% 42.7%
Mon-Fri 10AM-3PM 43.4% 56.6%
Mon-Fri 3PM-7PM 37.5% 62.5%
Mon-Fri 7PM-Mid 63.2% 36.8%
Weekend 10AM-7PM 59.6% 40.4%
Distribution of AQH Radio Listeners by Listening Location
Persons 12+
Source: TAPSCAN Web, Fall 2010. Note: Due to rounding, totals may not add to 100.
While at-home listening is self-explanatory, away-from-home listening takes many forms: in-car, at-work, and “other” listening, which includes locations such as the gym, a friend’s house, or at a picnic. And “at-work” listening doesn’t just include office listening but might include construction sites, delivery vehicles, and retail outlets.
The Arbitron Diary asks listeners to identify their listening location by offering “at-home,” “at-work,” “in-car,” and “other” locations. The Arbitron PPM service automatically detects whether exposure is occurring “at-home” or “away-from-home.” Our Radio Today studies consolidate “at-work,” “in-car,” and “other” locations in the Diary service to harmonize with the PPM’s “away-from-home” listening location.
This year’s “at-home” and “away-from-home” listening data are consistent with results from previous years.

© 2012 Arbitron Inc. All Rights Reserved .PUBLIC RADIO TODAY • 2012 EDITION48
Public Radio Listening by Time of Day
Mon-Fri6AM-10AM
Mon-Fri10AM-3PM
Mon-Fri3PM-7PM
Mon-Fri 7PM-Mid
Sat-Sun6AM-Mid
Mon-Sun6AM-Mid
P12-17 M 2.5 1.2 2.7 1.5 2.7 6.2W 2.3 1.5 2.4 1.5 2.7 6.2
P18-24 M 2.5 2.7 2.9 2.1 2.9 6.4W 2.2 2.6 2.7 1.5 2.7 5.9
P25-34 M 6.0 4.7 6.3 3.4 5.3 11.1
W 5.0 4.2 5.3 2.8 4.7 9.7
P35-44 M 7.9 5.7 8.1 4.0 6.5 13.4W 5.9 4.8 5.9 2.8 5.1 10.6
P45-54 M 8.7 7.0 9.3 4.9 8.0 15.1W 6.9 5.9 7.2 3.6 6.8 12.4
P55-64 M 10.7 9.8 11.3 6.1 11.6 18.4W 8.2 7.5 8.7 4.2 9.0 14.6
P65+ M 9.9 11.8 10.1 5.6 12.3 18.1W 7.8 9.7 8.1 4.1 9.9 14.7
Public Radio’s Reach by DaypartCume Ratings
Source: TAPSCAN Web, Fall 2011. Note: Due to rounding, totals may not add to 100.
As mentioned on Page 43, public radio’s overall weekly reach in the Fall of 2011 barely changed from the previous year. In most dayparts, most of the age cells experienced Cume Ratings gains from the previous year (except in morning drive where most of the age cells were flat or had slight declines).

© 2012 Arbitron Inc. All Rights ReservedPUBLIC RADIO TODAY • 2012 EDITION49
Public Radio Formats Ranked by Audience Share and Availability
Format ShareNews Talk Information 49.0%Classical 16.2%News-Classical 15.6%Adult Album Alternative (AAA) 6.3%Jazz 4.1%News-AAA 3.3%News-Music 2.5%News-Jazz 2.0%Variety 1.2%
Public Radio Formats Ranked by Audience ShareAmong All Public Radio ListeningMon-Sun, 6AM-Mid, AQH Persons 12+, Fall 2010
FormatNumber of
StationsNews Talk 418News-Classical 230Classical 178Adult Album Alternative (AAA) 156News-AAA 71News-Music 63Jazz 58Variety 40News-Jazz 21
Public Radio Formats Ranked by AvailabilityAmong All Public Radio ListeningMon-Sun, 6AM-Mid, AQH Persons 12+, Fall 2010
Source: TAPSCAN Web, Fall 2011. Note: Due to rounding, totals may not add to 100.

© 2012 Arbitron Inc. All Rights ReservedPUBLIC RADIO TODAY • 2012 EDITION50
Public Radio Formats Ranked by Audience Share by Demographic
Persons 12-17News Talk Information 47.2%Classical 18.5%AAA 11.7%News-Classical 9.7%Jazz 4.8% News-AAA 2.8%News-Music 2.4%Variety 1.6%News-Jazz 1.2%
Persons 18-24News Talk Information 37.5%AAA 16.8%Classical 14.5%News-Classical 11.5%News-music 5.9%Jazz 5.5%Variety 4.2%News-AAA 3.4%News-Jazz 1.0%
Persons 25-34News Talk Information 52.0%News-Classical 11.4%Classical 11.1%AAA 10.2%Jazz 5.0%News-AAA 3.9%News-Music 2.8%Variety 2.3%News-Jazz 1.4%
Public Radio Formats Ranked by Audience Share by DemographicFigures noted are share of listening to formats within each demographic group. Mon-Sun, 6AM-Mid, AQH Persons 12+, Fall 2011
Persons 35-44News Talk Information 57.4%News-Classical 12.5%Classical 9.5%AAA 9.0%News-AAA 3.7%Jazz 3.4%News-Jazz 2.0%News-Music 1.7%Variety 1.2%
Persons 45-54News Talk Information 55.3%News-Classical 14.1%Classical 9.5%AAA 8.4%News-AAA 3.7%Jazz 3.2%News-Music 2.5%News-Jazz 2.1%Variety 1.4%
Persons 55-64News Talk Information 50.9%News-Classical 16.3%Classical 13.4%AAA 5.8%News-AAA 4.5%Jazz 3.5%News-Jazz 2.6%News-Music 2.4%Variety .9%
Persons 65+News Talk Information 41.1%Classical 26.4%News-Classical 19.1%Jazz 4.8%News-Music 2.5%AAA 2.0%News-AAA 1.9%News-Jazz 1.8%Variety 0.7%
Source: TAPSCAN Web, Fall 2011. Note: Due to rounding, totals may not add to 100.

© 2012 Arbitron Inc. All Rights Reserved
arbitron.com
arbitrontraining.com
my.arbitron.com
RSS-12-07768 Printed in the USA.Portable People MeterTM, PPMTM and RADAR® are marks of Arbitron Inc. HR Radio® is a registered trademark of iBiquity Digital Corp. TAPSCANTM is a registered mark of TAPSCAN Inc., used under license. Facebook® is a registered trademark of Facebook Inc. Twitter® is a registered trademark of Twitter Inc.
Any brand names, product names, titles used in this presentation are trademarks, trade names and/or copyrights of their respective holders. All images are used for purposes of demonstration only, and the entities associated with the products shown in those images are not affiliated with Arbitron in any way, nor have they provided endorsements of any kind. No permission is given to make use of any of the above, and such use may constitute an infringement of the holder’s rights.