2012 management’s discussion and analysis of results … · 2012 management’s discussion and...
TRANSCRIPT

2012 Management’s Discussion and Analysis of Results of Operations and Financial Condition
2012
Management’s Discussion and Analysis of Results of Operations and Financial Condition
February 7, 2013
2012 Management’s Discussion and Analysis of Results of Operations and Financial Condition
TABLE OF CONTENTS
1. Highlights ............................................................................................................................................................................................... 1 2. Introduction and Key Assumptions .................................................................................................................................................. 3 3. About Air Canada ................................................................................................................................................................................. 4 4. Strategy .................................................................................................................................................................................................. 6 5. Overview ............................................................................................................................................................................................. 12 6. Results of Operations – Full Year 2012 versus Full Year 2011 ............................................................................................... 14 7. Results of Operations – Fourth Quarter 2012 versus Fourth Quarter 2011 ....................................................................... 23 8. Fleet ...................................................................................................................................................................................................... 34 9. Financial and Capital Management ............................................................................................................................................... 38
9.1. Liquidity ..................................................................................................................................................................................... 38 9.2. Financial Position .................................................................................................................................................................... 38 9.3. Adjusted Net Debt .................................................................................................................................................................. 39 9.4. Working Capital ....................................................................................................................................................................... 40 9.5. Consolidated Cash Flow Movements .................................................................................................................................. 41 9.6. Capital Expenditures and Related Financing Arrangements .......................................................................................... 42 9.7. Pension Funding Obligations ................................................................................................................................................ 43 9.8. Contractual Obligations ........................................................................................................................................................ 47 9.9. Share Information ................................................................................................................................................................... 48
10. Quarterly Financial Data ................................................................................................................................................................. 50 11. Selected Annual Information .......................................................................................................................................................... 52 12. Financial Instruments and Risk Management ............................................................................................................................. 53 13. Critical Accounting Estimates ........................................................................................................................................................ 56 14. Accounting Policies ........................................................................................................................................................................... 60 15. Off-Balance Sheet Arrangements .................................................................................................................................................. 63 16. Related Party Transactions .............................................................................................................................................................. 64 17. Sensitivity of Results ........................................................................................................................................................................ 65 18. Risk Factors ......................................................................................................................................................................................... 66 19. Controls and Procedures .................................................................................................................................................................. 77 20. Non-GAAP Financial Measures ....................................................................................................................................................... 78 21. Glossary ............................................................................................................................................................................................... 81
2012 Management’s Discussion and Analysis of Results of Operations and Financial Condition
1
1. HIGHLIGHTS
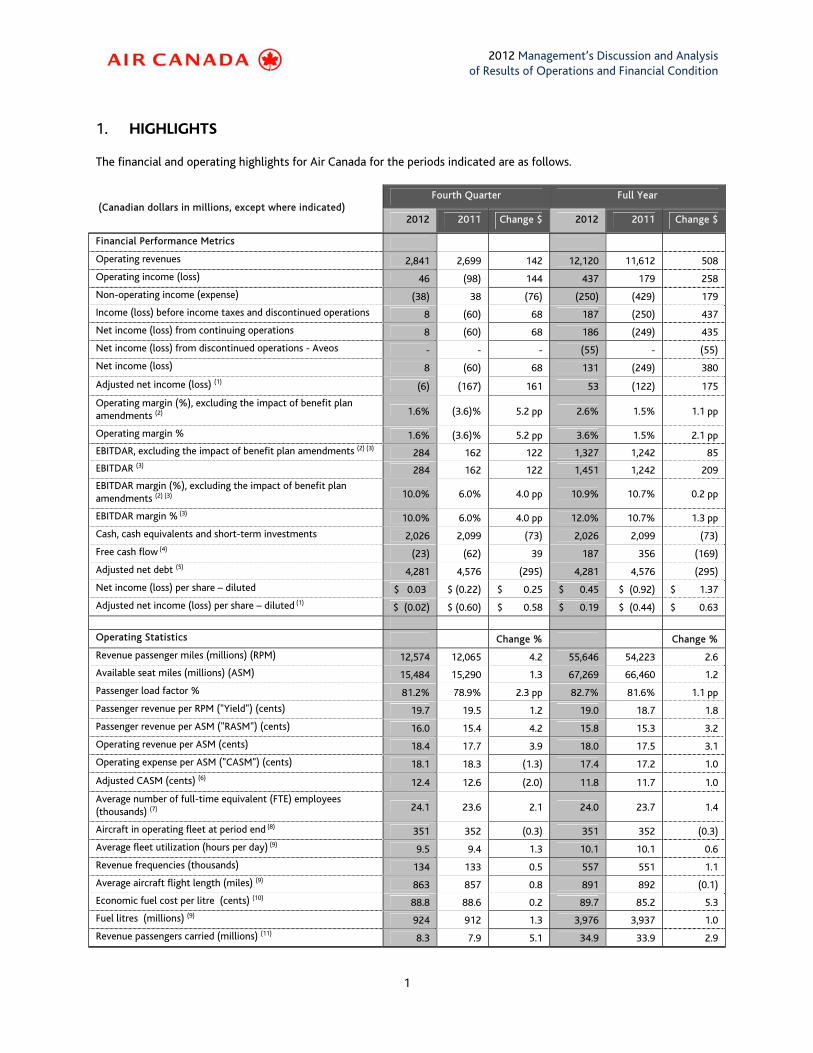
The financial and operating highlights for Air Canada for the periods indicated are as follows.
(Canadian dollars in millions, except where indicated) Fourth Quarter Full Year
2012 2011 Change $ 2012 2011 Change $
Financial Performance Metrics
Operating revenues 2,841 2,699 142 12,120 11,612 508
Operating income (loss) 46 (98) 144 437 179 258
Non-operating income (expense) (38) 38 (76) (250) (429) 179
Income (loss) before income taxes and discontinued operations 8 (60) 68 187 (250) 437
Net income (loss) from continuing operations 8 (60) 68 186 (249) 435
Net income (loss) from discontinued operations - Aveos - - - (55) - (55)
Net income (loss) 8 (60) 68 131 (249) 380
Adjusted net income (loss) (1) (6) (167) 161 53 (122) 175
Operating margin (%), excluding the impact of benefit plan amendments (2) 1.6% (3.6)% 5.2 pp 2.6% 1.5% 1.1 pp
Operating margin % 1.6% (3.6)% 5.2 pp 3.6% 1.5% 2.1 pp
EBITDAR, excluding the impact of benefit plan amendments (2) (3) 284 162 122 1,327 1,242 85
EBITDAR (3) 284 162 122 1,451 1,242 209
EBITDAR margin (%), excluding the impact of benefit plan amendments (2) (3) 10.0% 6.0% 4.0 pp 10.9% 10.7% 0.2 pp
EBITDAR margin % (3) 10.0% 6.0% 4.0 pp 12.0% 10.7% 1.3 pp
Cash, cash equivalents and short-term investments 2,026 2,099 (73) 2,026 2,099 (73)
Free cash flow (4) (23) (62) 39 187 356 (169)
Adjusted net debt (5) 4,281 4,576 (295) 4,281 4,576 (295)
Net income (loss) per share – diluted $ 0.03 $ (0.22) $ 0.25 $ 0.45 $ (0.92) $ 1.37
Adjusted net income (loss) per share – diluted (1) $ (0.02) $ (0.60) $ 0.58 $ 0.19 $ (0.44) $ 0.63
Operating Statistics Change % Change %
Revenue passenger miles (millions) (RPM) 12,574 12,065 4.2 55,646 54,223 2.6
Available seat miles (millions) (ASM) 15,484 15,290 1.3 67,269 66,460 1.2
Passenger load factor % 81.2% 78.9% 2.3 pp 82.7% 81.6% 1.1 pp
Passenger revenue per RPM ("Yield") (cents) 19.7 19.5 1.2 19.0 18.7 1.8
Passenger revenue per ASM ("RASM") (cents) 16.0 15.4 4.2 15.8 15.3 3.2
Operating revenue per ASM (cents) 18.4 17.7 3.9 18.0 17.5 3.1
Operating expense per ASM ("CASM") (cents) 18.1 18.3 (1.3) 17.4 17.2 1.0
Adjusted CASM (cents) (6) 12.4 12.6 (2.0) 11.8 11.7 1.0
Average number of full-time equivalent (FTE) employees (thousands) (7) 24.1 23.6 2.1 24.0 23.7 1.4
Aircraft in operating fleet at period end (8) 351 352 (0.3) 351 352 (0.3)
Average fleet utilization (hours per day) (9) 9.5 9.4 1.3 10.1 10.1 0.6
Revenue frequencies (thousands) 134 133 0.5 557 551 1.1
Average aircraft flight length (miles) (9) 863 857 0.8 891 892 (0.1)
Economic fuel cost per litre (cents) (10) 88.8 88.6 0.2 89.7 85.2 5.3
Fuel litres (millions) (9) 924 912 1.3 3,976 3,937 1.0
Revenue passengers carried (millions) (11) 8.3 7.9 5.1 34.9 33.9 2.9
2012 Management’s Discussion and Analysis of Results of Operations and Financial Condition
2
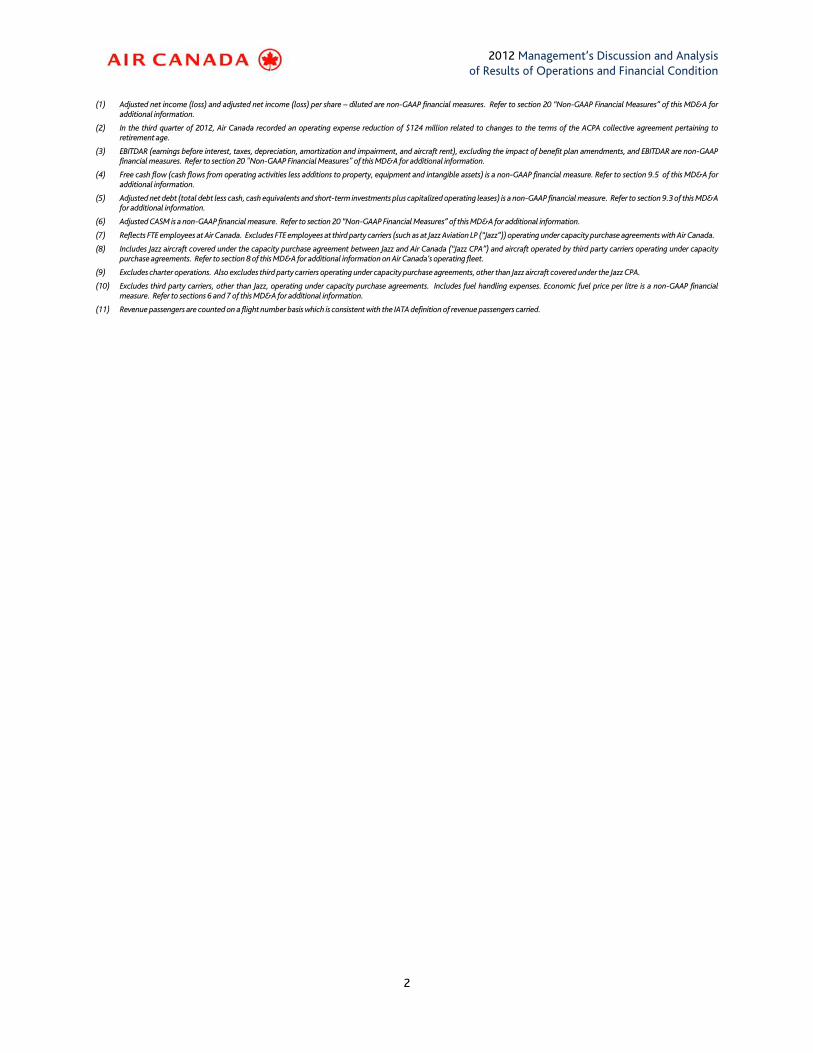
(1) Adjusted net income (loss) and adjusted net income (loss) per share – diluted are non-GAAP financial measures. Refer to section 20 “Non-GAAP Financial Measures” of this MD&A for additional information.
(2) In the third quarter of 2012, Air Canada recorded an operating expense reduction of $124 million related to changes to the terms of the ACPA collective agreement pertaining to retirement age.
(3) EBITDAR (earnings before interest, taxes, depreciation, amortization and impairment, and aircraft rent), excluding the impact of benefit plan amendments, and EBITDAR are non-GAAP financial measures. Refer to section 20 "Non-GAAP Financial Measures" of this MD&A for additional information.
(4) Free cash flow (cash flows from operating activities less additions to property, equipment and intangible assets) is a non-GAAP financial measure. Refer to section 9.5 of this MD&A for additional information.
(5) Adjusted net debt (total debt less cash, cash equivalents and short-term investments plus capitalized operating leases) is a non-GAAP financial measure. Refer to section 9.3 of this MD&A for additional information.
(6) Adjusted CASM is a non-GAAP financial measure. Refer to section 20 “Non-GAAP Financial Measures” of this MD&A for additional information.
(7) Reflects FTE employees at Air Canada. Excludes FTE employees at third party carriers (such as at Jazz Aviation LP (“Jazz”)) operating under capacity purchase agreements with Air Canada.
(8) Includes Jazz aircraft covered under the capacity purchase agreement between Jazz and Air Canada (“Jazz CPA”) and aircraft operated by third party carriers operating under capacity purchase agreements. Refer to section 8 of this MD&A for additional information on Air Canada’s operating fleet.
(9) Excludes charter operations. Also excludes third party carriers operating under capacity purchase agreements, other than Jazz aircraft covered under the Jazz CPA.
(10) Excludes third party carriers, other than Jazz, operating under capacity purchase agreements. Includes fuel handling expenses. Economic fuel price per litre is a non-GAAP financial measure. Refer to sections 6 and 7 of this MD&A for additional information.
(11) Revenue passengers are counted on a flight number basis which is consistent with the IATA definition of revenue passengers carried.
2012 Management’s Discussion and Analysis of Results of Operations and Financial Condition
3
2. INTRODUCTION AND KEY ASSUMPTIONS
In this Management’s Discussion and Analysis of Results of Operations and Financial Condition (“MD&A”), the “Corporation” refers, as the context may require, to Air Canada and/or one or more of Air Canada’s subsidiaries. This MD&A provides the reader with a review and analysis, from the perspective of management, of Air Canada’s financial results for the fourth quarter of 2012 and the full year 2012. This MD&A should be read in conjunction with Air Canada’s audited consolidated financial statements and notes for 2012. All financial information has been prepared in accordance with generally accepted accounting principles in Canada (“GAAP”), as set out in the Handbook of the Canadian Institute of Chartered Accountants – Part 1 (“CICA Handbook”), which incorporates International Financial Reporting Standards (“IFRS”) as issued by the International Accounting Standards Board (“IASB”), except for any financial information specifically denoted otherwise.
Except as otherwise noted, monetary amounts are stated in Canadian dollars. For an explanation of certain terms used in this MD&A, refer to section 21 “Glossary” of this MD&A. Except as otherwise noted or where the context may otherwise require, this MD&A is current as of February 6, 2013. Forward-looking statements are included in this MD&A. See “Caution Regarding Forward-Looking Information” below for a discussion of risks, uncertainties and assumptions relating to these statements. For a description of risks relating to Air Canada, refer to section 18 “Risk Factors” of this MD&A. Air Canada issued a news release dated February 7, 2013 reporting on its results for the fourth quarter of 2012 and the full year 2012. This news release is available on Air Canada’s website at aircanada.com and on SEDAR’s website at www.sedar.com. For further information on Air Canada’s public disclosures, including Air Canada’s Annual Information Form, consult SEDAR at www.sedar.com.
CAUTION REGARDING FORWARD-LOOKING INFORMATION
Air Canada’s public communications may include written or oral forward-looking statements within the meaning of applicable securities laws. Such statements are included in this MD&A and may be included in other communications, including filings with regulatory authorities and securities regulators. Forward-looking statements may be based on forecasts of future results and estimates of amounts not yet determinable. These statements may involve, but are not limited to, comments relating to strategies, expectations, planned operations or future actions. Forward-looking statements are identified by the use of terms and phrases such as “anticipate”, “believe”, “could”, “estimate”, “expect”, “intend”, “may”, “plan”, “predict”, “project”, “will”, “would”, and similar terms and phrases, including references to assumptions.
Forward-looking statements, by their nature, are based on assumptions, including those described herein and are subject to important risks and uncertainties. Forward-looking statements cannot be relied upon due to, amongst other things, changing external events and general uncertainties of the business. Actual results may differ materially from results indicated in forward-looking statements due to a number of factors, including without limitation, industry, market, credit and economic conditions, the ability to reduce operating costs and secure financing, pension issues, energy prices, employee and labour relations, currency exchange and interest rates, competition, war, terrorist acts, epidemic diseases, environmental factors (including weather systems and other natural phenomena and factors arising from man-made sources), insurance issues and costs, changes in demand due to the seasonal nature of the business, supply issues, changes in laws, regulatory developments or proceedings, pending and future litigation and actions by third parties as well as the factors identified throughout this MD&A and, in particular, those identified in section 18 “Risk Factors” of this MD&A. The forward-looking statements contained in this MD&A represent Air Canada’s expectations as of February 6, 2013 (or as of the date they are otherwise stated to be made), and are subject to change after such date. However, Air Canada disclaims any intention or obligation to update or revise any forward-looking statements whether as a result of new information, future events or otherwise, except as required under applicable securities regulations.
KEY ASSUMPTIONS
Assumptions were made by Air Canada in preparing and making forward-looking statements. As part of its assumptions, Air Canada assumes Canadian GDP growth of 1.5% to 2.0% for 2013. In addition, Air Canada expects that the Canadian dollar will trade, on average, at C$1.00 per U.S. dollar in the first quarter of 2013 and for the full year 2013 and that the price of jet fuel will average 88 cents per litre for the first quarter of 2013 and 89 cents per litre for the full year 2013.
2012 Management’s Discussion and Analysis of Results of Operations and Financial Condition
4
3. ABOUT AIR CANADA
Air Canada is Canada’s largest domestic, U.S. transborder and international airline and the largest provider of scheduled passenger services in the Canadian market, the Canada-U.S. transborder market and in the international market to and from Canada. In 2012, Air Canada, together with Jazz and other regional airlines operating flights on behalf of Air Canada under capacity purchase agreements, operated, on average, 1,520 daily scheduled flights to 59 destinations in Canada, 55 destinations in the U.S. and a total of 64 destinations in the Canada-Europe, Canada-Pacific, Canada-Caribbean/Central America and Canada-South America markets. Domestic, U.S. transborder and international departures accounted for approximately 66%, 26% and 8%, respectively, of the 1,520 average daily departures. In 2012, Air Canada carried close to 35 million revenue passengers and provided passenger service to 178 direct destinations on five continents.
Air Canada enhances its domestic and transborder network through capacity purchase agreements, including the Jazz CPA and other capacity purchase agreements with regional airlines operating flights under the Air Canada Express brand name. Under the Jazz CPA, Air Canada purchases the greater part of Jazz’s fleet capacity based on predetermined rates and Air Canada determines the routes and schedule which Jazz operates on Air Canada’s behalf. Under the Jazz CPA, Jazz operates with smaller jet and turboprop aircraft that have lower trip costs than conventional large jet aircraft, allowing Jazz to provide service to Air Canada’s customers in lower density markets as well as in higher density markets at off-peak times throughout Canada and the United States.
As at December 31, 2012, Air Canada operated a mainline fleet of 205 aircraft comprised of 89 Airbus narrowbody aircraft, 56 Boeing and Airbus widebody aircraft and 60 Embraer regional jets. In addition, as at December 31, 2012, Jazz operated, on behalf of Air Canada, 124 aircraft comprised of 49 Bombardier regional jets and 75 Dash-8 turboprop aircraft, and other regional airlines operating flights on behalf of Air Canada operated an additional 22 aircraft.
In late 2012, Air Canada unveiled plans for a new leisure travel group, which comprises the activities of the airline’s tour operator business, Air Canada Vacations, and a new low-cost leisure airline which will operate under the brand name Air Canada rougeTM. Air Canada rougeTM, which will begin flight operations in July 2013, will leverage the strengths of Air Canada’s extensive network, operational expertise and frequent flyer reward program and will allow the airline to compete more effectively in the leisure market, with a goal of improving Air Canada’s earnings capabilities and strengthening its competitive position. Air Canada Vacations is a leading Canadian tour operator. Based in Montreal and Toronto, Air Canada Vacations operates its business in the outbound leisure travel market (Caribbean, Mexico, U.S., Europe, Central and South America, South Pacific and Asia) by developing, marketing and distributing vacation travel packages. Air Canada Vacations also offers cruise packages in North America, Europe and the Caribbean.
Air Canada is a founding member of the Star Alliance™ network. Through Star Alliance™ network’s 27 member airlines, Air Canada is able to offer its customers access to approximately 1,329 destinations in 194 countries, as well as reciprocal participation in frequent flyer programs and use of airport lounges and other common airport facilities.
Air Canada participates in a transatlantic joint venture with United Airlines and Deutsche Lufthansa AG through which the carriers provide customers with more choice and streamlined service on routings between North and Central America, and Africa, India, Europe and the Middle East. This transatlantic joint venture, including its revenue share structure, was implemented effective January 1, 2010. Air Canada, together with United Airlines, also has the ability to create a transborder joint venture.
Through its long-term relationship with Aimia Canada Inc. (formerly Aeroplan Canada Inc. and referred to as “Aeroplan” in this MD&A), Air Canada’s loyalty program provider, Air Canada is able to build customer loyalty by offering those customers who are Aeroplan® members the opportunity to earn Aeroplan® Miles when they fly with Air Canada and with the 27 Star AllianceTM member airlines. Aeroplan is also Air Canada’s single largest customer. The relationship with Aeroplan is designed to provide a stable and recurring source of revenue from the purchase of Air Canada seats by Aeroplan, which in turn are provided to Aeroplan® members who choose to redeem their Aeroplan® Miles for travel on Air Canada. Additionally, Aeroplan® members may also choose to redeem their Aeroplan® Miles for travel with the Star AllianceTM
member airlines.
2012 Management’s Discussion and Analysis of Results of Operations and Financial Condition
5
Air Canada also generates revenue from its Air Canada Cargo division. Air Canada Cargo provides direct cargo services to over 150 Canadian, U.S. transborder and international destinations and has sales representation in over 50 countries. Air Canada Cargo is Canada’s largest provider of air cargo services as measured by cargo capacity. Air cargo services are provided on domestic and U.S. transborder flights and on international flights on routes between Canada and major markets in Europe, Asia, South America and Australia.
2012 Management’s Discussion and Analysis of Results of Operations and Financial Condition
6
4. STRATEGY
In 2013, Air Canada will continue to build on its underlying fundamental strengths and its strategic plan priorities in its continued effort to improve its earnings generation capability, strengthen its competitive position and fulfill its strategic vision of building value for customers, shareholders, employees and other stakeholders.
Air Canada’s business strategy focuses on four key priorities:
• Pursuing revenue enhancements and transforming costs to enhance its competitiveness;
• Expanding internationally and increasing connecting traffic through its international gateways;
• Engaging with customers, with a particular emphasis on premium class passengers and products; and
• Fostering positive changes to its culture.
Air Canada’s key priorities, including successes realized in 2012, are outlined below.
Cost Transformation and Revenue Enhancement
Key achievements in 2012
• Concluded collective agreements with all its major Canadian unions, which include modifications to the defined benefit pension plans (which remain subject to regulatory approval);
• Concluded new agreements and is in the process of selecting and finalizing other agreements with aircraft maintenance service providers, on a cost competitive basis;
• Entered into an agreement which, subject to conclusion of certain conditions, provides for the transfer of 15 Embraer 175 aircraft to Sky Regional Airlines Inc. (“Sky Regional”), who will operate these aircraft, under the Air Canada Express banner, at a lower cost; and
• Announced the launch of Air Canada rougeTM, a new low-cost leisure airline.
Air Canada’s Business Transformation team leads the airline’s cost transformation and revenue enhancement priority. Its mandate is two-fold, namely, to pursue revenue generating and cost reduction opportunities and to transform the way the airline operates, including by changing business processes, implementing cross-functional improvement projects, improving employee productivity and investing in new technology. Over the last several years, Air Canada has successfully implemented and continues to seek out and implement many cost-saving and revenue-generating initiatives, including through contract renegotiation and operating process improvements, all with a goal of improving the airline’s ability to meet its long-term financial objectives.
The collective agreements concluded in 2011 and 2012 with the airline’s main labour groups provide Air Canada with the flexibility to implement certain strategic initiatives, including Air Canada rougeTM, that were not possible in the past. The implementation of such strategic initiatives will be designed to provide Air Canada with opportunities to increase its competitiveness, grow its revenues, lower its costs and ultimately enhance profitability.
For example, the new five-year collective agreement concluded with the Air Canada Pilots Association (“ACPA”), the union representing Air Canada’s pilots, permits the airline to better manage its fleet and productivity which, in turn, allows Air Canada to better compete in the current industry environment and to reduce costs. The new agreement improves Air Canada’s competitive position by allowing certain adjustments to its relationship with regional airlines and to the composition of the mainline fleet. In this regard, in 2013 and subject to certain conditions, Air Canada plans to transfer 15 Embraer 175 aircraft from its mainline fleet to Sky Regional, who will operate these aircraft on Air Canada’s behalf. These aircraft will continue flying on U.S. short-haul routes, primarily from Toronto and Montreal to destinations in the Northeast U.S. Air Canada will derive cost saving benefits from this initiative as Sky Regional’s costs to operate these aircraft will be lower.
2012 Management’s Discussion and Analysis of Results of Operations and Financial Condition
7
The new collective agreement concluded with ACPA also provides Air Canada with the ability to operate a low-cost airline with up to 50 aircraft. As discussed in section 3 of this MD&A, Air Canada rougeTM will begin flight operations in 2013 under a more competitive cost structure and enable Air Canada to more effectively compete in the low-cost segment of the leisure market.
In 2012, Air Canada also created the Air Canada Leisure Group, which is comprised of Air Canada’s leisure tour operator, Air Canada Vacations, and Air Canada rougeTM. The Air Canada Leisure Group will also be well positioned in the highly competitive, but growing, leisure segment in Canada, with a strong value proposition and competitive cost structure. Air Canada rougeTM will operate under the principle of maintaining a long-term cost structure consistent with that of its low-cost competitors. By delivering its leisure product at lower costs, the airline expects to improve its operating margins.
The collective agreements concluded with Air Canada’s main labour groups also contain amendments to the defined benefit plans. Based on the actuarial valuations as at January 1, 2012, Air Canada estimated that these changes, in the aggregate, would result in a decline of approximately $1.1 billion to the solvency deficit in its domestic registered pension plans, had these amendments been implemented on January 1, 2012. These changes remain subject to regulatory approvals by the Office of the Superintendent of Financial Institutions (“OSFI”). Except for new hires represented by the Canadian Auto Workers (“CAW”) and the Canadian Union of Public Employees (“CUPE”) (who will participate in a new pension plan with a defined benefit and defined contribution component), all new hires participate in defined contribution plans which, in the long-term, will reduce the volatility of Air Canada’s pension obligations. Since 2005, new non-unionized employee hires participate in defined contribution plans (rather than defined benefit plans) and similar amendments to the defined benefit plans for existing management and other non-unionized employees will, subject to regulatory approval, be implemented.
Following the filing by Aveos Fleet Performance Inc. (“Aveos”) under the Companies’ Creditors Arrangement Act (“CCAA”) and the termination of all maintenance agreements between Air Canada and Aveos, Air Canada has entered, or is in the process of entering, into new maintenance contracts with experienced and cost competitive service providers. The new maintenance agreements, negotiated at market terms and rates, have resulted in meaningful unit cost savings and better aircraft turnaround times.
Through its Business Transformation team, Air Canada is also working towards lowering fuel consumption; bettering aircraft turnaround times; reducing credit card fees; improving productivity in its call centres; enhancing passenger revenues through product and service innovations and cargo revenues through the more effective use of aircraft space.
Air Canada is also leveraging its Aeroplan loyalty program and offering new tier levels in its rebranded frequent flyer status recognition program, Air Canada Altitude, to build loyalty and generate incremental revenues.
In late 2013, Air Canada expects to begin implementing a new revenue management system aimed at optimizing the airline’s network revenue performance on the basis of a passenger’s full trip itinerary. This new system will be implemented over a two-year period and will be designed to improve the manner in which Air Canada optimizes its passenger revenues.
Air Canada also expects to achieve further cost savings starting in 2014 when it is scheduled to begin introducing Boeing 787 aircraft into its fleet. The Boeing 787 aircraft will allow the airline to reduce operating expenses through fuel and maintenance savings.
Expanding internationally and Increasing Connecting Traffic through International Gateways
Key achievements in 2012
• Increased its sixth freedom traffic (international to international, including U.S.) connecting at Toronto Pearson by over 20% from 2011;
• Announced plans for a major international expansion with a focus on key gateways to Asia;
2012 Management’s Discussion and Analysis of Results of Operations and Financial Condition
8
• Announced the launch of Air Canada rougeTM, which will operate routes not currently operated by Air Canada, including Venice, Italy, and Edinburgh, Scotland;
• Concluded a number of new codeshare agreements, including with Egyptair, South African Airways, Turkish Airlines and Aer Lingus; and
• Together with United Airlines, concluded an agreement with Canada's Commissioner of Competition which preserves, subject to agreed conditions, the airlines' existing commercial agreements and the ability to create a transborder joint venture.
In 2013, Air Canada plans on selectively and profitably expanding its international services and growing its market share, including through its numerous airline relationships. Air Canada believes it is well-positioned to grow international revenues by leveraging the following competitive advantages:
• A widely-recognized brand and a strong position in the market for transatlantic and transpacific travel to and from Canada and to and from South America via Canada;
• An extensive and expanding global network, which is enhanced by the airline’s membership in Star Alliance, numerous codeshare agreements, and participation in revenue sharing joint ventures;
• A flexible fleet mix, which provides the airline with the ability to easily redeploy capacity when changes in demand occur;
• The Air Canada Top Tier Program, Air Canada’s frequent flyer program (which will be renamed Air Canada Altitude in the first quarter of 2013), which recognizes the airline's most frequent flyers by offering them a range of exclusive travel privileges, including the benefits derived from Air Canada's partnership with the Aeroplan program, which allows all customers to earn and redeem Aeroplan® Miles with Canada's leading coalition loyalty program;
• Competitive products and services, including lie-flat beds in the Executive First cabin, concierge services and Maple Leaf lounges; and
• Geographically well-positioned hubs (Toronto, Montreal, Vancouver and Calgary), which provide competitive advantages to serve customers travelling to or from the U.S. to Asia and Europe.
Over the last several years, Air Canada has been intensifying its focus on high growth economies, such as the Asian markets. In 2013, Air Canada plans on further expanding its capacity in these markets, including through the introduction of a new Toronto-Seoul service which will operate three times a week, creating a fifth Asian destination from Air Canada's Toronto Pearson hub. Furthermore, Air Canada will add three weekly departures between Toronto and Beijing, bringing the total number of departures from Toronto to Beijing to ten a week, and will add four departures a week between Vancouver and Beijing, for a total of 11 weekly departures. Air Canada has also upgraded its Calgary-Tokyo Narita service to offer daily departures, up from five a week. Beginning in June 2013, Air Canada will also begin flying three-times weekly, year-round, from Toronto to Istanbul, providing a gateway to other destinations in Turkey, Central Asia, the Middle East and Africa.
In 2013, Air Canada plans to grow global connecting traffic via Canada through its world-class hub in Toronto and its strong international gateways in Montreal, Vancouver and Calgary.
While Toronto Pearson’s costs are high relative to other North American airports, Toronto Pearson International Airport (“Toronto Pearson”) has a strategic geographic advantage due to its proximity to major markets in the U.S. and can accommodate further growth in connecting passenger traffic.
Over the last several years, Air Canada has been working closely with the Greater Toronto Airport Authority (“GTAA”) to transform Toronto Pearson into a leading North American airport in order to gain a greater share of the global international-to-international connection market. Air Canada’s success in marketing its superior product offerings to
2012 Management’s Discussion and Analysis of Results of Operations and Financial Condition
9
U.S. customers combined with Toronto Pearson’s efficient in-transit facilities, which allow passengers and their bags to move seamlessly between Canada and U.S. Customs and Immigration, have helped boost Air Canada’s international connecting traffic at Toronto Pearson by over 20% since 2011. As well, with Air Canada's growing International reach, Toronto is experiencing a significant increase in transfer traffic connecting between international points.
The further development of commercial alliances with major international carriers continues to be an important aspect of Air Canada’s business strategy. These commercial arrangements provide Air Canada with an effective way of leveraging expansion and broadening its network appeal. Air Canada is extending its global reach through its membership in Star Alliance, which allows the airline to offer its customers a choice of 1,329 airports in 194 countries. Air Canada is also strengthening its market presence in North and Central America, Europe, the Middle East, Africa and India through its participation in a transatlantic revenue sharing joint venture with United Airlines and Deutsche Lufthansa AG, referred to as A++, and has the ability to pursue a U.S. transborder joint venture with United Airlines. By coordinating pricing, scheduling and sales, Air Canada is better able to serve customers by offering more travel options, while reducing travel times. Air Canada is also achieving greater critical mass and network scope through numerous codeshare and interline agreements. For example, in anticipation of Air Canada’s new service to Istanbul, Air Canada and Turkish Airlines have agreed to reciprocal code-sharing which will ensure seamless connections on a single itinerary for customers travelling beyond Istanbul, throughout Turkey and to points in Central Asia, Africa and the Middle East.
For its inaugural 2013 season, Air Canada rougeTM is planning on introducing routes not currently operated by Air Canada, such as Venice, Italy, and Edinburgh, Scotland. In addition, Air Canada seasonal services from Toronto and Montreal to Athens, Greece are scheduled to be transferred to the leisure carrier. Similarly, existing Air Canada flights operated in cooperation with Air Canada Vacations to Cuba, the Dominican Republic, Jamaica and Costa Rica are scheduled to be operated by Air Canada rougeTM effective July 2013. Air Canada rougeTM flights to all destinations to be served in the carrier’s inaugural 2013 summer schedule will depart Air Canada’s main hub at Toronto Pearson offering customers seamless connections with Air Canada, Air Canada Express and its Star Alliance partner flights. Air Canada rougeTM will also operate non-stop flights to Athens from Montreal’s Trudeau Airport, in addition to its Toronto-Athens flights. Air Canada rougeTM customers will benefit from attractively priced through-fares from any point within Air Canada’s extensive network on a single ticket as well as baggage checked through to final destination and Aeroplan mileage accumulation and redemption.
The Air Canada rougeTM fleet will initially be comprised of two Boeing 767-300ER aircraft to operate transatlantic flights in a two-cabin configuration offering a selection of “rougeTM Plus” seats with additional legroom and “Premium rougeTM” seats featuring additional seating comfort, space and enhanced meal and beverage service; and two Airbus A319 aircraft to operate North American flights in an all-economy configuration offering a selection of “rouge PlusTM” seats with additional legroom. Prior to the end of 2013, Air Canada plans to transfer an additional six Airbus A319 aircraft, for a total of eight Airbus A319 aircraft, from its mainline fleet to Air Canada rougeTM. Air Canada rougeTM will expand to other leisure destinations as Air Canada starts to take delivery of new Boeing 787 Dreamliner aircraft, which is scheduled to commence in 2014, thereby freeing up aircraft for transfer to the Air Canada rougeTM fleet. As this occurs, and subject to commercial demand, Air Canada rougeTM may operate up to 20 Boeing 767-300ER aircraft and 30 Airbus A319 aircraft, for a total of 50 aircraft, to pursue opportunities in markets made viable by the lower operating cost structure of Air Canada rougeTM.
Engaging with Customers with Particular Emphasis on Premium Passengers and Premium Products
Key achievements in 2012
In 2012, Air Canada received the following important industry awards which demonstrate its customers’ appreciation of the airline’s extensive network, alliance relationships and leading products and services, as well as their recognition of the dedication and professionalism of Air Canada’s employees in delivering its world class products and services.
• “Best In-flight Services in North America” and “Best North American Airline for International Travel” in Business Traveler’s “Best in Business Travel” award program, for a fifth consecutive year;
• “Best Flight Experience to Canada from Anywhere in the World” by readers of Executive Travel Magazine in their annual “Leading Edge Awards” readership survey of frequent international travelers, for a fifth consecutive year;
2012 Management’s Discussion and Analysis of Results of Operations and Financial Condition
10
• “Best International Airline in North America” in a worldwide survey of more than 18 million air travelers conducted by independent U.K. research firm, Skytrax, for their 2012 World Airline Awards, for a third consecutive year;
• “Best Airline in North America” by Global Traveler magazine, for a fourth consecutive year; and
• “Best North American Airline for Business Class Service”, “Best North American Airline for International Travel” and “Best Flight Attendants in North America” by Premier Traveler magazine.
Air Canada was also recognized for its airport and onboard product and service improvements. The airline has become the only international network carrier in North America to receive a Four-Star ranking according to Skytrax. The much-coveted rating is considered an airline industry benchmark and is based on detailed, independently conducted, quality analysis by Skytrax across more than 800 different areas of airport and onboard product and service delivery.
In addition, Air Canada was recognized as the preferred airline for more than 79% of frequent business travellers in Canada according to the 2012 Canadian Business Travel Survey by Ipsos Reid, which confirms that Air Canada’s efforts in promoting its premium class products and services are yielding positive results.
Increasing customer satisfaction levels and growing the airline’s premium customer base remain key elements of Air Canada’s business strategy. Air Canada recognizes that its success is dependent on consistently delivering superior value and innovative products, constantly striving to provide the highest levels of customer service, and continuing to evolve to anticipate the changing needs of customers. In 2013, Air Canada will continue to focus on understanding and anticipating customer preferences to ensure it has the appropriate products and services in place.
In 2013, Air Canada will continue to focus on better managing its premium class cabin to maximize revenues and in seeking new opportunities to increase premium cabin revenues. Air Canada believes it maintains a revenue premium that more than offsets the higher costs associated with service to premium passengers.
Air Canada is one of the most recognized brands in Canada, and the airline plans to continue to leverage this strength to attract revenue, particularly on its international service. Air Canada’s extensive and expanding global network, its modern fleet, industry-leading on-board products and services, lounges and airport facilities are among the advantages of flying Air Canada.
When surveyed, customers cite Air Canada’s frequent flyer program, “The Air Canada Top Tier Program”, as one of the key reasons they fly Air Canada. There are currently three tiers to the 2012 program: Air Canada Super Elite, Air Canada Elite and Air Canada Prestige. Beginning on March 1, 2013, the Air Canada Top Tier Program will have a new name – Air Canada Altitude – including two additional status levels and more benefits than in the past. Designed to recognize and reward Air Canada’s most frequent flyers, Air Canada Altitude offers a range of privileges, including priority travel services, upgrades to Executive Class, and recognition across Star Alliance. Air Canada Altitude members will continue to benefit from Air Canada’s partnership with the Aeroplan program, which provides a wide range of ways to earn and redeem valuable Aeroplan® Miles, including flights to over 1,200 destinations worldwide.
The “Air Canada Rewards for Small Business” program is allowing the airline to broaden its access to corporate customers and providing it with new business opportunities. Designed to bridge the gap between the average leisure traveler and occasional business traveler, and the large corporate accounts with numerous frequent flyers, the program caters to small and medium size businesses, allowing them to earn rewards and complimentary services, including discounts on Air Canada flights. The program also offers businesses the use of an exclusive online tool that manages travel expenses and tracks rewards simultaneously. Rewards can be shared among employees, in addition to the Aeroplan® Miles and Air Canada Status Miles that employees can earn by flying Air Canada. This is one example of how Air Canada is increasing its customer reach.
In May 2012, Air Canada doubled its in-flight movie programming and significantly increased its television content. In fact, Air Canada was among the world's best airlines for in-flight entertainment, according to a list compiled by the Smarter Travel website. Frequent flyers also rate Air Canada’s lounges and its concierge service high on their list of reasons for choosing to fly Air Canada and the airline plans on building on these offerings in 2013, including with the addition of Maple Leaf Lounges and an additional concierge base in Europe.
2012 Management’s Discussion and Analysis of Results of Operations and Financial Condition
11
Fostering Positive Culture Change
Air Canada believes that a healthy and dynamic corporate culture can have a significant impact on its long-term performance. The workforce’s ability to respond and adapt to changing market conditions and customer expectations is a key ingredient to the airline’s continued success. Acknowledging the importance of aligning its corporate culture with its strategic plans, over the last several years, Air Canada has been seeking to foster a common sense of purpose, shared values and common goals among employees to ensure the airline’s prosperity and growth. This important initiative is delivered in many forms, including through executive presentations, daily communiqués, monthly letters from senior executives, quarterly conference calls, and in many daily interactions.
While the difficult collective bargaining process in 2011 and 2012 presented challenges for the company to move culture change initiatives forward, the customer awards referred to previously show that Air Canada’s employees are engaged and motivated to deliver a superior customer service experience. To ensure that high levels of customer satisfaction are maintained, many of Air Canada’s training programs are being re-evaluated. In fact, Air Canada is currently implementing a three-year talent management plan which comprises several elements designed to ensure that the right talent is recruited and developed with a thorough understanding of the impact that each employee has on the quality of Air Canada’s products and services. The modular courses will focus on defining and subsequently developing key behaviors that all employees need to understand and exhibit.
In 2013, Air Canada plans to continue fostering positive changes to its culture by promoting;
• Entrepreneurship • Engagement • Empowerment • Earnings for Performance
Air Canada believes that employees are more likely to embrace culture change if they take an active part in the transformation, and Air Canada will continue to encourage employee feedback and ideas as employees are often in a good position to identify improvements and changes for success.
In 2012, Air Canada celebrated its employees and its achievements throughout the past 75 years and will continue to host employee recognition events to celebrate its successes going forward.
To encourage the development of a corporate culture which is focused on transformation and performance, Air Canada has a profit sharing program in place which allows eligible employees to be recognized for their contributions and share in the financial success of the airline. In 2013, the airline will remain focused on raising employee awareness on the importance of Air Canada achieving its financial goals and will continue to promote the message that a healthy share price can provide stability and growth opportunities.
2012 Management’s Discussion and Analysis of Results of Operations and Financial Condition
12
5. OVERVIEW
Due to continuing strong passenger demand, a disciplined approach to capacity management and an ongoing focus on cost transformation, Air Canada reported solid improvements in its financial performance in 2012 with adjusted net income of $53 million, a $175 million improvement over 2011 results. On a GAAP basis, in 2012, net income amounted to $131 million compared to a net loss of $249 million in 2011, an improvement of $380 million. Additional information on Air Canada’s full year and fourth quarter 2012 financial performance is provided below:
Full Year 2012 Financial Summary
Operating revenue growth of $508 million or 4% from 2011.
Passenger revenue growth of $529 million or 5.2% on a 2.6% increase in system passenger traffic and a 1.8% improvement in system yield. Passenger revenues in the premium cabin increased $87 million or 4.0% on a 2.7% growth in traffic and a 1.3% improvement in yield.
System ASM capacity increase of 1.2%, reflecting capacity growth in all markets with the exception of the Atlantic market where capacity was unchanged from 2011. The system capacity growth was in line with the 0.75% to 1.25% full year 2012 ASM capacity increase projected in Air Canada’s news release dated November 8, 2012.
RASM growth of 3.2%, reflecting RASM increases in all markets with the exception of the U.S. transborder market. The RASM increase was due to the yield growth of 1.8% and a passenger load factor improvement of 1.1 percentage points.
Operating expense increase of $250 million or 2% from 2011. In 2012, the ACPA collective agreement was amended to allow pilots to continue to work past age 60, which was the age of mandatory retirement in the previous collective agreement. As a result of these changes to retirement age, in 2012, Air Canada recorded an operating expense reduction of $124 million in Benefit plan amendments on its consolidated statement of operations related to the impact of those amendments on pension and other employee benefit liabilities. In 2012, adjusted CASM increased 1.0% from 2011, in line with the 0.75% to 1.25% increase projected in Air Canada’s news release dated November 8, 2012. Refer to section 20 “Non-GAAP Financial Measures” for additional information.
Operating income of $437 million compared to operating income of $179 million in 2011, an increase of $258 million.
Net income of $131 million or $0.45 per diluted share compared to a net loss of $249 million or $0.92 per diluted share in 2011, an increase of $380 million or $1.37 per diluted share.
EBITDAR (excluding the impact of benefit plan amendments) of $1,327 million compared to EBITDAR of $1,242 million in 2011, an increase of $85 million. Refer to section 20 “Non-GAAP Financial Measures” for additional information.
Adjusted net income of $53 million or $0.19 per diluted share compared to an adjusted net loss of $122 million or $0.44 per diluted share in 2011. Refer to section 20 “Non-GAAP Financial Measures” for additional information.
Free cash flow of $187 million, a decrease of $169 million from 2011, largely reflecting the airline’s continued funding of ongoing purchase deposit payments on committed Boeing 777 and 787 aircraft.
At December 31, 2012, adjusted net debt of $4,281 million, a decrease of $295 million from December 31, 2011, reflecting the impact of ongoing net debt repayments and the resulting lower debt balances.
At December 31, 2012, cash and short-term investments amounted to $2,026 million, or 17% of 2012 annual operating revenues (December 31, 2011 – $2,099 million, or 18% of 2011 annual operating revenues).

2012 Management’s Discussion and Analysis of Results of Operations and Financial Condition
13
Fourth Quarter 2012 Financial Summary
Operating revenue growth of $142 million or 5% from the fourth quarter of 2011.
Passenger revenue growth of $139 million or 5.8% on a 4.2% growth in system passenger traffic and a 1.2% improvement in yield. Passenger revenues in the premium cabin increased $12 million or 2.2% on a 3.0% improvement in yield as premium cabin traffic declined 0.8% year-over-year.
System ASM capacity increase of 1.3% from the fourth quarter of 2011, reflecting capacity growth in all markets. The system capacity increase was slightly above the 0% to 1.0% fourth quarter 2012 ASM capacity increase projected in Air Canada’s news release dated November 8, 2012, due to stronger than expected passenger demand.
RASM growth of 4.2%, reflecting RASM increases in the domestic, Atlantic and Pacific markets. The RASM increase was due to a passenger load factor improvement of 2.3 percentage points and yield growth of 1.2%.
Operating expense decrease of $2 million from the fourth quarter of 2011. In 2012, adjusted CASM decreased 2.0% from the fourth quarter of 2011, in line with the 2.0% to 3.0% decrease projected in Air Canada’s news release dated November 8, 2012. Refer to section 20 “Non-GAAP Financial Measures” for additional information.
Operating income of $46 million compared to operating loss of $98 million in the fourth quarter of 2011, an improvement of $144 million.
Net income of $8 million or $0.03 per diluted share compared to a net loss of $60 million or $0.22 per diluted share in the fourth quarter of 2011, an improvement of $68 million or $0.25 per diluted share.
EBITDAR of $284 compared to EBITDAR of $162 million in the fourth quarter of 2011, an increase of $122 million. Refer to section 20 “Non-GAAP Financial Measures” for additional information.
An adjusted net loss of $6 million or $0.02 per diluted share compared to an adjusted net loss of $167 million or $0.60 per diluted share in the fourth quarter of 2011. Refer to section 20 “Non-GAAP Financial Measures” for additional information.
Negative free cash flow of $23 million compared to negative free cash flow of $62 million in the fourth quarter of 2011, an improvement of $39 million, mainly due to an increase in net cash flows from operating activities.
2012 Management’s Discussion and Analysis of Results of Operations and Financial Condition
14
6. RESULTS OF OPERATIONS – FULL YEAR 2012 VERSUS FULL YEAR 2011
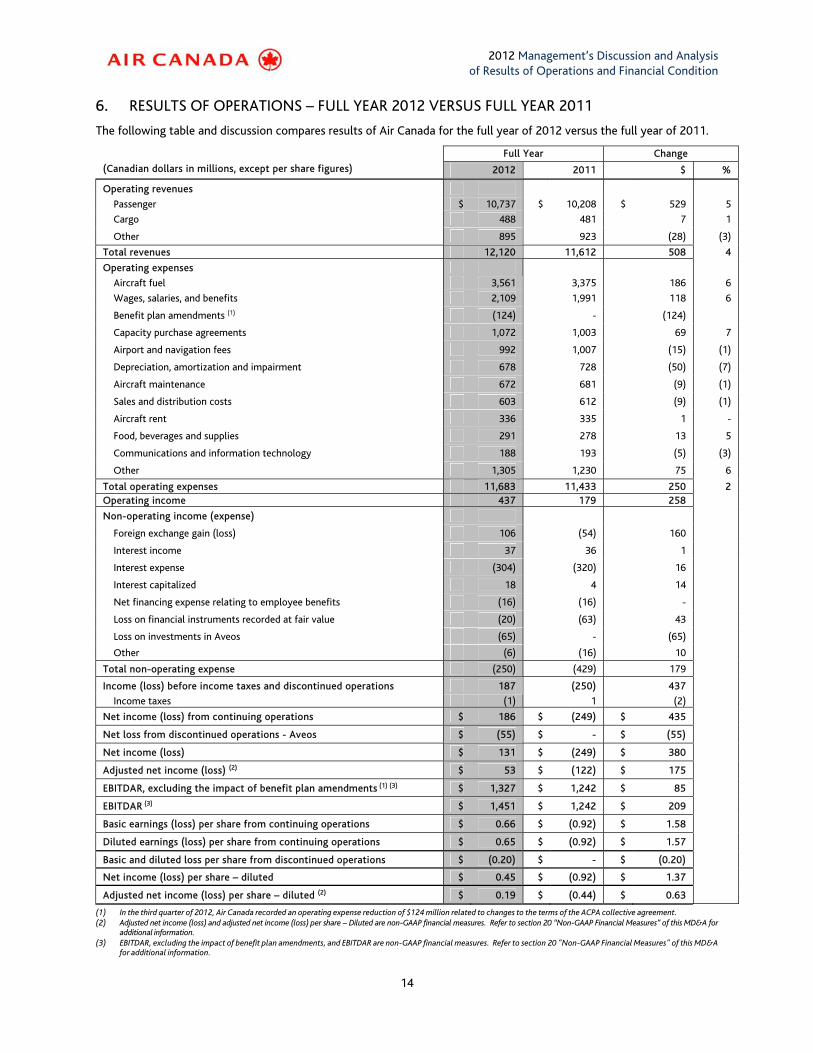
The following table and discussion compares results of Air Canada for the full year of 2012 versus the full year of 2011.
Full Year Change
(Canadian dollars in millions, except per share figures) 2012 2011 $ %
Operating revenues
Passenger $ 10,737 $ 10,208 $ 529 5
Cargo 488 481 7 1
Other 895 923 (28) (3)
Total revenues 12,120 11,612 508 4
Operating expenses
Aircraft fuel 3,561 3,375 186 6
Wages, salaries, and benefits 2,109 1,991 118 6
Benefit plan amendments (1) (124) - (124)
Capacity purchase agreements 1,072 1,003 69 7
Airport and navigation fees 992 1,007 (15) (1)
Depreciation, amortization and impairment 678 728 (50) (7)
Aircraft maintenance 672 681 (9) (1)
Sales and distribution costs 603 612 (9) (1)
Aircraft rent 336 335 1 -
Food, beverages and supplies 291 278 13 5
Communications and information technology 188 193 (5) (3)
Other 1,305 1,230 75 6
Total operating expenses 11,683 11,433 250 2 Operating income 437 179 258
Non-operating income (expense)
Foreign exchange gain (loss) 106 (54) 160
Interest income 37 36 1
Interest expense (304) (320) 16
Interest capitalized 18 4 14
Net financing expense relating to employee benefits (16) (16) -
Loss on financial instruments recorded at fair value (20) (63) 43
Loss on investments in Aveos (65) - (65)
Other (6) (16) 10
Total non-operating expense (250) (429) 179
Income (loss) before income taxes and discontinued operations 187 (250) 437
Income taxes (1) 1 (2)
Net income (loss) from continuing operations $ 186 $ (249) $ 435
Net loss from discontinued operations - Aveos $ (55) $ - $ (55)
Net income (loss) $ 131 $ (249) $ 380
Adjusted net income (loss) (2) $ 53 $ (122) $ 175
EBITDAR, excluding the impact of benefit plan amendments (1) (3) $ 1,327 $ 1,242 $ 85
EBITDAR (3) $ 1,451 $ 1,242 $ 209
Basic earnings (loss) per share from continuing operations $ 0.66 $ (0.92) $ 1.58
Diluted earnings (loss) per share from continuing operations $ 0.65 $ (0.92) $ 1.57
Basic and diluted loss per share from discontinued operations $ (0.20) $ - $ (0.20)
Net income (loss) per share – diluted $ 0.45 $ (0.92) $ 1.37
Adjusted net income (loss) per share – diluted (2) $ 0.19 $ (0.44) $ 0.63
(1) In the third quarter of 2012, Air Canada recorded an operating expense reduction of $124 million related to changes to the terms of the ACPA collective agreement. (2) Adjusted net income (loss) and adjusted net income (loss) per share – Diluted are non-GAAP financial measures. Refer to section 20 “Non-GAAP Financial Measures” of this MD&A for
additional information. (3) EBITDAR, excluding the impact of benefit plan amendments, and EBITDAR are non-GAAP financial measures. Refer to section 20 "Non-GAAP Financial Measures" of this MD&A
for additional information.
2012 Management’s Discussion and Analysis of Results of Operations and Financial Condition
15
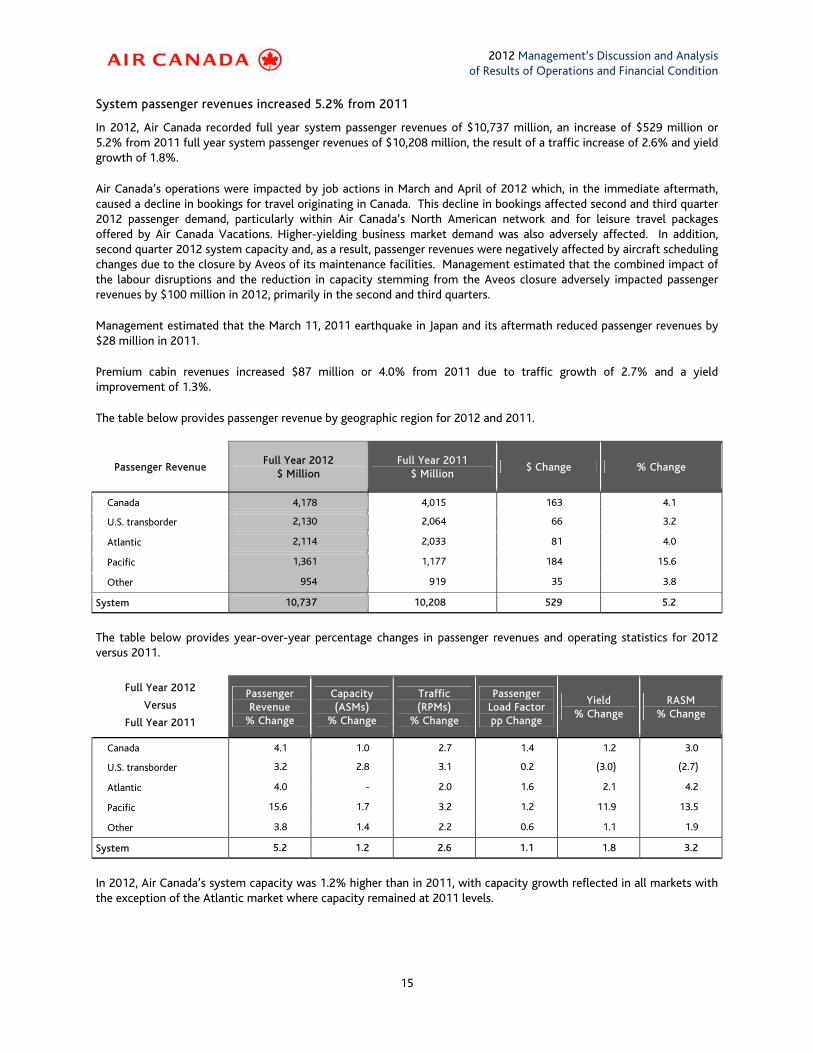
System passenger revenues increased 5.2% from 2011
In 2012, Air Canada recorded full year system passenger revenues of $10,737 million, an increase of $529 million or 5.2% from 2011 full year system passenger revenues of $10,208 million, the result of a traffic increase of 2.6% and yield growth of 1.8%.
Air Canada’s operations were impacted by job actions in March and April of 2012 which, in the immediate aftermath, caused a decline in bookings for travel originating in Canada. This decline in bookings affected second and third quarter 2012 passenger demand, particularly within Air Canada’s North American network and for leisure travel packages offered by Air Canada Vacations. Higher-yielding business market demand was also adversely affected. In addition, second quarter 2012 system capacity and, as a result, passenger revenues were negatively affected by aircraft scheduling changes due to the closure by Aveos of its maintenance facilities. Management estimated that the combined impact of the labour disruptions and the reduction in capacity stemming from the Aveos closure adversely impacted passenger revenues by $100 million in 2012, primarily in the second and third quarters.
Management estimated that the March 11, 2011 earthquake in Japan and its aftermath reduced passenger revenues by $28 million in 2011.
Premium cabin revenues increased $87 million or 4.0% from 2011 due to traffic growth of 2.7% and a yield improvement of 1.3%.
The table below provides passenger revenue by geographic region for 2012 and 2011.
Passenger Revenue Full Year 2012
$ Million Full Year 2011
$ Million $ Change % Change
Canada 4,178 4,015 163 4.1
U.S. transborder 2,130 2,064 66 3.2
Atlantic 2,114 2,033 81 4.0
Pacific 1,361 1,177 184 15.6
Other 954 919 35 3.8
System 10,737 10,208 529 5.2
The table below provides year-over-year percentage changes in passenger revenues and operating statistics for 2012 versus 2011.
Full Year 2012
Versus
Full Year 2011
Passenger Revenue
% Change
Capacity (ASMs)
% Change
Traffic (RPMs)
% Change
Passenger Load Factor pp Change
Yield % Change
RASM % Change
Canada 4.1 1.0 2.7 1.4 1.2 3.0
U.S. transborder 3.2 2.8 3.1 0.2 (3.0) (2.7)
Atlantic 4.0 - 2.0 1.6 2.1 4.2
Pacific 15.6 1.7 3.2 1.2 11.9 13.5
Other 3.8 1.4 2.2 0.6 1.1 1.9
System 5.2 1.2 2.6 1.1 1.8 3.2
In 2012, Air Canada’s system capacity was 1.2% higher than in 2011, with capacity growth reflected in all markets with the exception of the Atlantic market where capacity remained at 2011 levels.
2012 Management’s Discussion and Analysis of Results of Operations and Financial Condition
16
Components of the year-over-year change in full year system passenger revenues included:
• The 2.6% traffic increase which reflected traffic growth in all markets.
• The 1.8% system yield improvement which reflected growth in all markets with the exception of U.S. transborder market where U.S. short-haul routes continued to be impacted by increased industry capacity and aggressive competitive pricing activities. The overall yield improvement was due to increased fares and higher fuel surcharges to partly offset higher fuel prices, and gains in premium cabin traffic. The favourable impact of a weaker Canadian dollar on foreign currency denominated passenger revenues was also a factor in the yield improvement, increasing revenues by $35 million year-over-year.
The 3.2% RASM increase was due to the higher yield and a passenger load factor improvement of 1.1 percentage points. RASM improvements were recorded in all markets with the exception of the U.S. transborder market.
Refer to section 7 of this MD&A for year-over-year percentage changes in passenger revenues, capacity, traffic, passenger load factor, yield and RASM by quarter for the fourth quarter 2012 and each of the previous four quarters.
Domestic passenger revenues increased 4.1% from 2011
In 2012, domestic passenger revenues of $4,178 million increased $163 million or 4.1% from 2011, largely due to traffic growth of 2.7%. The 1.0% domestic capacity increase reflected capacity growth on routes linking Toronto and Montreal, on regional routes in Ontario, and on routes to the Maritimes.
Components of the year-over-year change in domestic passenger revenues included:
• The 2.7% traffic increase which reflected traffic growth on all major domestic services.
• The 1.2% yield increase which reflected yield growth on all major domestic services with the exception of routes linking Toronto and Montreal and of regional routes in Ontario. These routes were adversely impacted by increased industry capacity and aggressive pricing activities. The overall yield improvement was mainly due to fare increases, an improvement in the proportion of higher-yielding passengers, primarily in the economy cabin, and a favourable currency impact of $5 million.
The 3.0% RASM increase was due to a 1.4 percentage point improvement in passenger load factor and the higher yield.
U.S. transborder passenger revenues increased 3.2% from 2011
In 2012, U.S. transborder passenger revenues of $2,130 million increased $66 million or 3.2% from 2011 due to traffic growth of 3.1% and an increase in baggage fee revenues. The 2.8% U.S. transborder capacity growth reflected an increase in frequencies and/or the use of larger aircraft on routes to California, Florida, Hawaii and Las Vegas, and on U.S. short-haul routes such as Boston, New York and Washington D.C.
Components of the year-over-year change in U.S. transborder passenger revenues included:
• The introduction of a new baggage fee policy on U.S. transborder services effective October 27, 2011.
• The traffic increase of 3.1% which reflected traffic growth on all major U.S. transborder services.
• The 3.0% yield decrease which reflected the impact of increased industry capacity and competitive pricing activities, particularly on U.S. short-haul routes such as Boston, New York and Washington, D.C. Partly offsetting the yield decrease was a favourable currency impact of $11 million.
The 2.7% RASM decrease was primarily due to the lower yield. Baggage fee revenues are not included in Air Canada’s yield and RASM results.
2012 Management’s Discussion and Analysis of Results of Operations and Financial Condition
17
Atlantic passenger revenues increased 4.0% from 2011
In 2012, Atlantic passenger revenues of $2,114 million increased $81 million or 4.0% from 2011 due to yield growth of 2.1% and a traffic increase of 2.0%. Atlantic capacity was unchanged from 2011. Capacity increases on the airline’s service from Western Canada to Germany and on services to Switzerland, Spain and Scandinavia were offset by capacity reductions on the airline’s service from Eastern Canada to Germany and on services to the U.K. and France.
Components of the year-over-year change in Atlantic passenger revenues included:
• The 2.0% traffic increase which reflected traffic growth on all major Atlantic services.
• The 2.1% yield increase which was due to an improvement in the proportion of higher-yielding passengers in the economy and premium cabins, gains in premium cabin traffic, and increased fares and fuel surcharges to partly offset higher fuel prices. Partly offsetting the yield improvement was an unfavourable currency impact of $7 million.
The 4.2% RASM increase was due to the higher yield and a 1.6 percentage point improvement in passenger load factor.
Pacific passenger revenues increased 15.6% from 2011
In 2012, Pacific passenger revenues of $1,361 million increased $184 million or 15.6% from 2011 due to yield growth of 11.9% and a traffic increase of 3.2%. The 1.7% Pacific capacity increase reflected capacity growth on services to Japan largely offset by capacity decreases on services to China and Hong Kong. Air Canada had estimated that the impact of the Japan earthquake and its aftermath reduced passenger revenues by $28 million in 2011.
Components of the year-over-year change in Pacific passenger revenues included:
• The 3.2% traffic increase which reflected traffic growth on all major Pacific services with the exception of services to Hong Kong.
• The 11.9% yield increase which reflected yield growth on all major Pacific services. The yield improvement was due to higher fuel surcharges to partly offset higher fuel prices, fare increases, and the introduction of Tango® fares on all Asian routes, with reduced Aeroplan® Miles offered which, in turn, produced strong buy-up to higher-yielding Tango® Plus fares. A significant yield increase in the premium cabin, changes to the airline’s fare structure, and a favourable currency impact of $21 million were also factors in the overall yield improvement year-over-year.
The 13.5% RASM increase was due to the yield growth and, to a lesser extent, a 1.2 percentage point improvement in passenger load factor.
Other passenger revenues increased 3.8% from 2011
In 2012, Other passenger revenues (comprised of Australia, Caribbean, Mexico and Central and South America) of $954 million increased $35 million or 3.8% from 2011 due to a traffic increase of 2.2% and yield growth of 1.1%. The 1.4% capacity increase in “Other markets” was due to capacity growth on services to South America and to an increase in frequencies on Air Canada’s route to Sydney, Australia, partly offset by a capacity decrease on services to traditional leisure destinations.
Components of the year-over-year increase in Other passenger revenues included:
• The overall 2.2% traffic increase which reflected traffic growth on services to South America and to Sydney, Australia.
• The overall 1.1% yield improvement which reflected yield growth on services to South America and to Sydney, Australia, on stronger passenger demand, particularly in the first half of 2012. The overall yield improvement was due to increased fares and fuel surcharges to partly offset higher fuel prices, as well as gains in premium cabin traffic. A favourable currency impact of $5 million was also a factor in the yield improvement year-over-
2012 Management’s Discussion and Analysis of Results of Operations and Financial Condition
18
year. In 2012, services to traditional leisure destinations were negatively impacted by increased industry capacity and competitive pricing activities.
The 1.9% RASM increase was due to the yield growth and, to a lesser extent, a 0.6 percentage point improvement in passenger load factor.
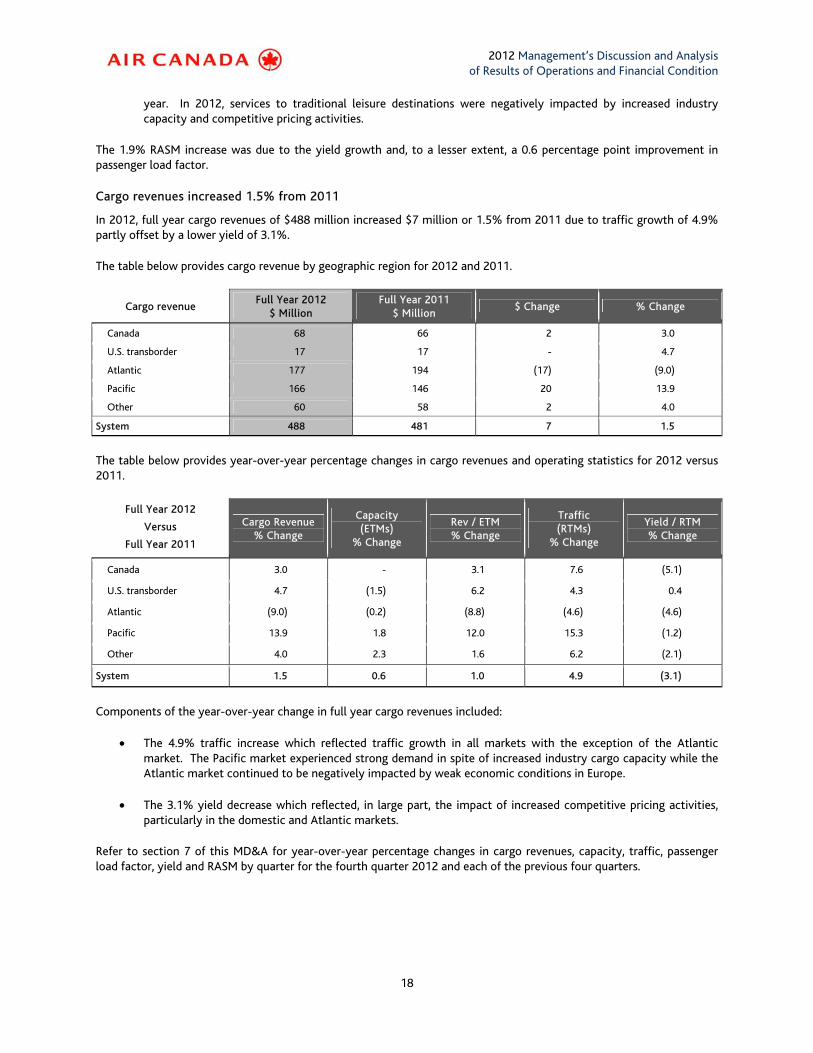
Cargo revenues increased 1.5% from 2011
In 2012, full year cargo revenues of $488 million increased $7 million or 1.5% from 2011 due to traffic growth of 4.9% partly offset by a lower yield of 3.1%.
The table below provides cargo revenue by geographic region for 2012 and 2011.
Cargo revenue Full Year 2012
$ Million Full Year 2011
$ Million $ Change % Change
Canada 68 66 2 3.0
U.S. transborder 17 17 - 4.7
Atlantic 177 194 (17) (9.0)
Pacific 166 146 20 13.9
Other 60 58 2 4.0
System 488 481 7 1.5
The table below provides year-over-year percentage changes in cargo revenues and operating statistics for 2012 versus 2011.
Full Year 2012
Versus
Full Year 2011
Cargo Revenue % Change
Capacity (ETMs)
% Change
Rev / ETM % Change
Traffic (RTMs)
% Change
Yield / RTM % Change
Canada 3.0 - 3.1 7.6 (5.1)
U.S. transborder 4.7 (1.5) 6.2 4.3 0.4
Atlantic (9.0) (0.2) (8.8) (4.6) (4.6)
Pacific 13.9 1.8 12.0 15.3 (1.2)
Other 4.0 2.3 1.6 6.2 (2.1)
System 1.5 0.6 1.0 4.9 (3.1)
Components of the year-over-year change in full year cargo revenues included:
• The 4.9% traffic increase which reflected traffic growth in all markets with the exception of the Atlantic market. The Pacific market experienced strong demand in spite of increased industry cargo capacity while the Atlantic market continued to be negatively impacted by weak economic conditions in Europe.
• The 3.1% yield decrease which reflected, in large part, the impact of increased competitive pricing activities, particularly in the domestic and Atlantic markets.
Refer to section 7 of this MD&A for year-over-year percentage changes in cargo revenues, capacity, traffic, passenger load factor, yield and RASM by quarter for the fourth quarter 2012 and each of the previous four quarters.
2012 Management’s Discussion and Analysis of Results of Operations and Financial Condition
19
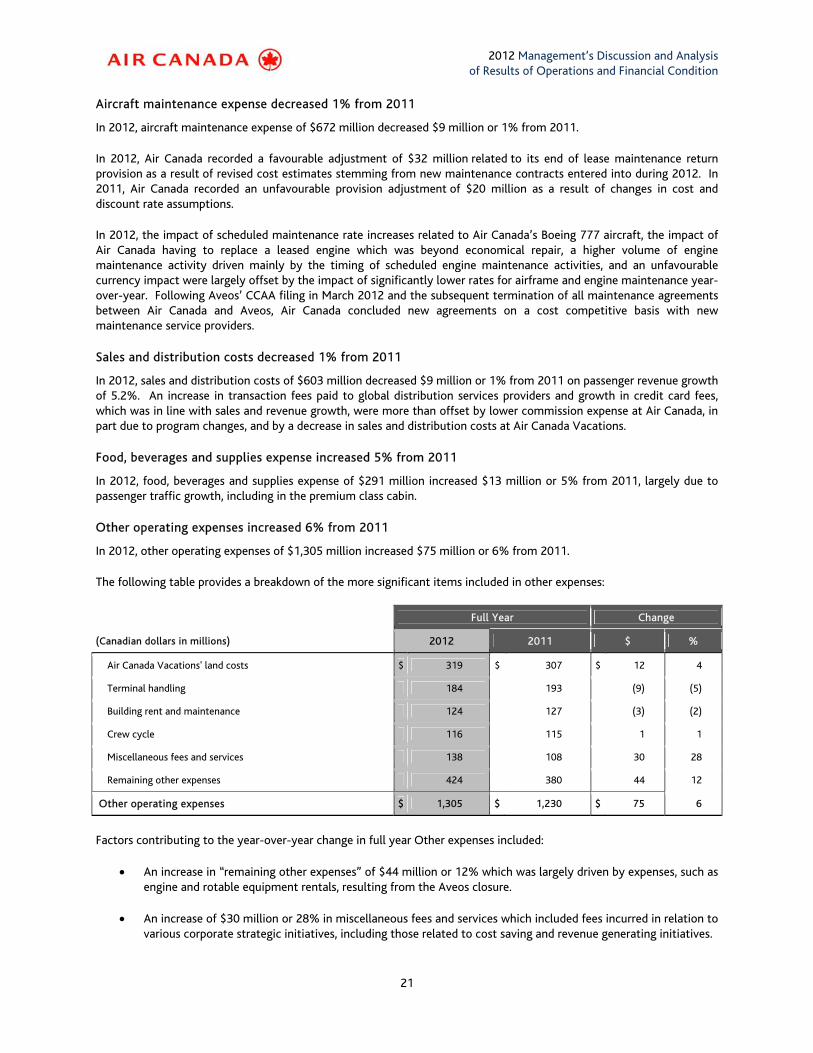
Other revenues decreased 3% from 2011
Other revenues consist primarily of revenues from the sale of the ground portion of vacation packages, ground handling services, and other airline-related services, as well as revenues related to the lease or sublease of aircraft to third parties.
In 2012, other revenues of $895 million decreased $28 million or 3% from 2011. The decrease in other revenues was largely due to a reduction in property rent revenues from Aveos of $18 million, a decline in ground package revenues at Air Canada Vacations of $8 million, as well as lower aircraft lease revenues of $7 million, mainly as a result of fewer aircraft leased to Jazz when compared to 2011. The decrease in ground package revenues at Air Canada Vacations was due to lower passenger volumes driven by increased industry capacity. The effect of passenger uncertainty in booking with Air Canada as a result of the labour disruptions experienced in March and April 2012 negatively impacted revenues at Air Canada Vacations. These decreases were partly offset by growth in cancellation and change fees year-over-year.
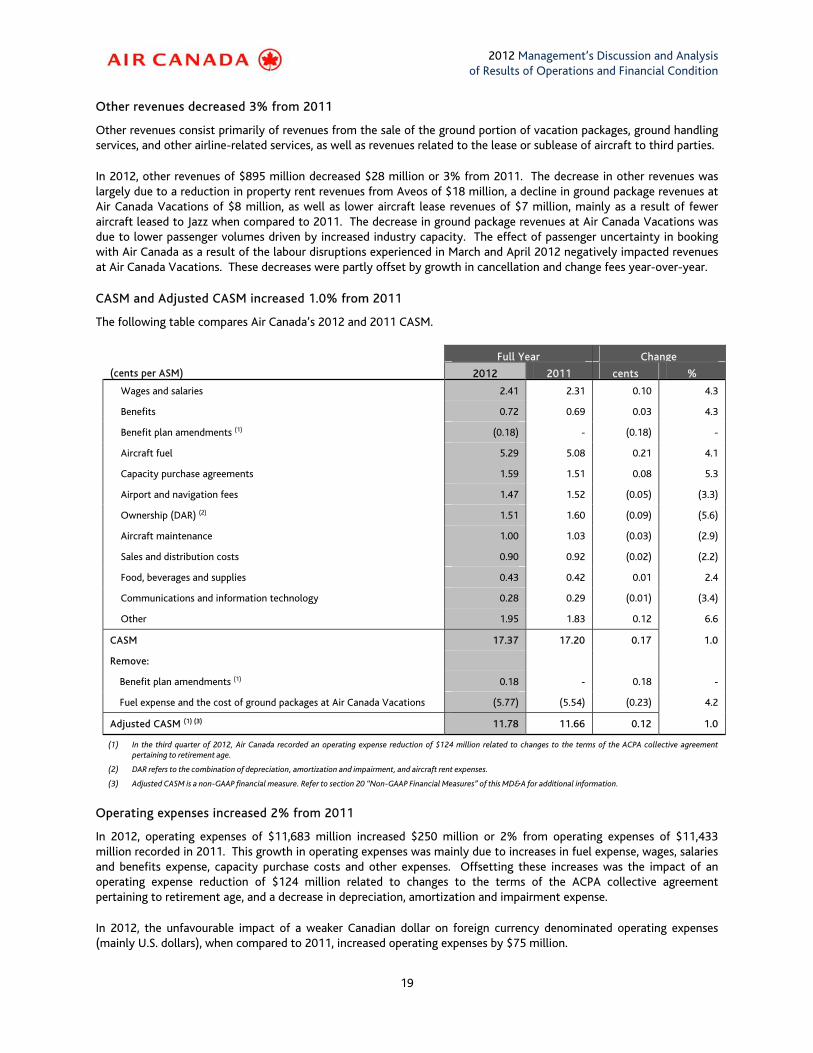
CASM and Adjusted CASM increased 1.0% from 2011
The following table compares Air Canada’s 2012 and 2011 CASM.
Full Year Change
(cents per ASM) 2012 2011 cents %
Wages and salaries 2.41 2.31 0.10 4.3
Benefits 0.72 0.69 0.03 4.3
Benefit plan amendments (1) (0.18) - (0.18) -
Aircraft fuel 5.29 5.08 0.21 4.1
Capacity purchase agreements 1.59 1.51 0.08 5.3
Airport and navigation fees 1.47 1.52 (0.05) (3.3)
Ownership (DAR) (2) 1.51 1.60 (0.09) (5.6)
Aircraft maintenance 1.00 1.03 (0.03) (2.9)
Sales and distribution costs 0.90 0.92 (0.02) (2.2)
Food, beverages and supplies 0.43 0.42 0.01 2.4
Communications and information technology 0.28 0.29 (0.01) (3.4)
Other 1.95 1.83 0.12 6.6
CASM 17.37 17.20 0.17 1.0
Remove:
Benefit plan amendments (1) 0.18 - 0.18 -
Fuel expense and the cost of ground packages at Air Canada Vacations (5.77) (5.54) (0.23) 4.2
Adjusted CASM (1) (3) 11.78 11.66 0.12 1.0
(1) In the third quarter of 2012, Air Canada recorded an operating expense reduction of $124 million related to changes to the terms of the ACPA collective agreement pertaining to retirement age.
(2) DAR refers to the combination of depreciation, amortization and impairment, and aircraft rent expenses.
(3) Adjusted CASM is a non-GAAP financial measure. Refer to section 20 “Non-GAAP Financial Measures” of this MD&A for additional information.
Operating expenses increased 2% from 2011
In 2012, operating expenses of $11,683 million increased $250 million or 2% from operating expenses of $11,433 million recorded in 2011. This growth in operating expenses was mainly due to increases in fuel expense, wages, salaries and benefits expense, capacity purchase costs and other expenses. Offsetting these increases was the impact of an operating expense reduction of $124 million related to changes to the terms of the ACPA collective agreement pertaining to retirement age, and a decrease in depreciation, amortization and impairment expense.
In 2012, the unfavourable impact of a weaker Canadian dollar on foreign currency denominated operating expenses (mainly U.S. dollars), when compared to 2011, increased operating expenses by $75 million.
2012 Management’s Discussion and Analysis of Results of Operations and Financial Condition
20
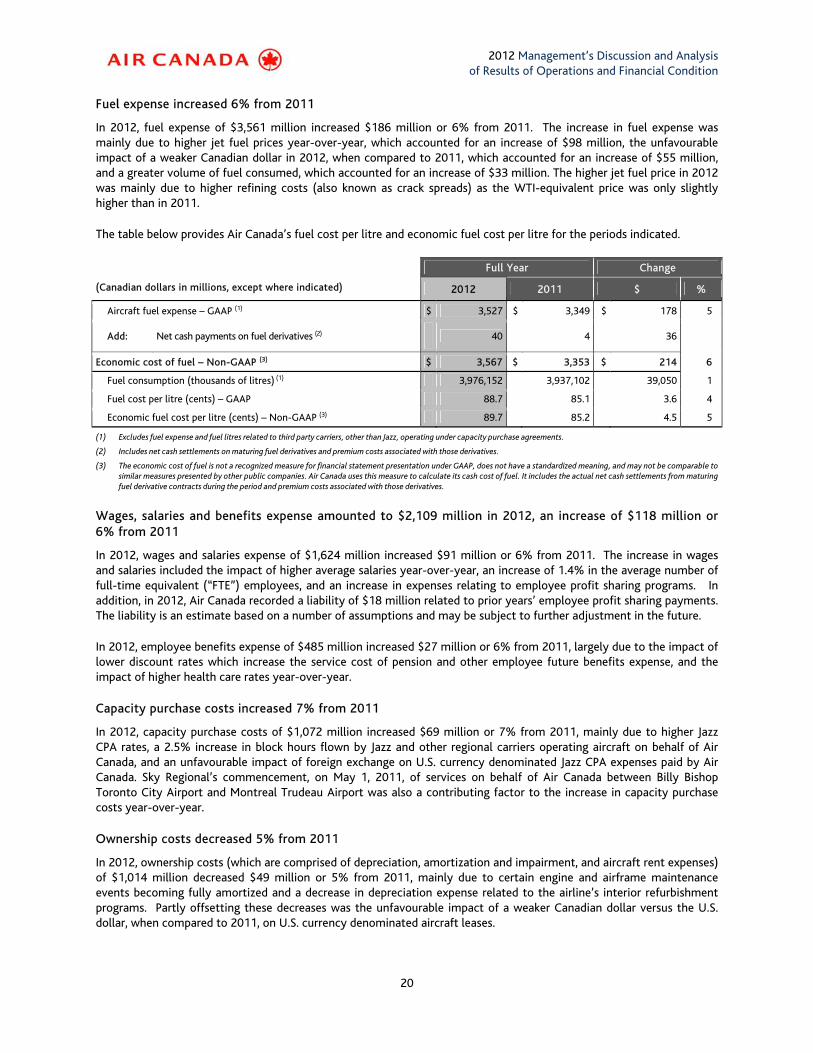
Fuel expense increased 6% from 2011
In 2012, fuel expense of $3,561 million increased $186 million or 6% from 2011. The increase in fuel expense was mainly due to higher jet fuel prices year-over-year, which accounted for an increase of $98 million, the unfavourable impact of a weaker Canadian dollar in 2012, when compared to 2011, which accounted for an increase of $55 million, and a greater volume of fuel consumed, which accounted for an increase of $33 million. The higher jet fuel price in 2012 was mainly due to higher refining costs (also known as crack spreads) as the WTI-equivalent price was only slightly higher than in 2011.
The table below provides Air Canada’s fuel cost per litre and economic fuel cost per litre for the periods indicated.
Full Year Change
(Canadian dollars in millions, except where indicated) 2012 2011 $ %
Aircraft fuel expense – GAAP (1) $ 3,527 $ 3,349 $ 178 5
Add: Net cash payments on fuel derivatives (2)
40
4 36
Economic cost of fuel – Non-GAAP (3) $ 3,567 $ 3,353 $ 214 6
Fuel consumption (thousands of litres) (1) 3,976,152 3,937,102 39,050 1
Fuel cost per litre (cents) – GAAP 88.7 85.1 3.6 4
Economic fuel cost per litre (cents) – Non-GAAP (3) 89.7 85.2 4.5 5
(1) Excludes fuel expense and fuel litres related to third party carriers, other than Jazz, operating under capacity purchase agreements.
(2) Includes net cash settlements on maturing fuel derivatives and premium costs associated with those derivatives.
(3) The economic cost of fuel is not a recognized measure for financial statement presentation under GAAP, does not have a standardized meaning, and may not be comparable to similar measures presented by other public companies. Air Canada uses this measure to calculate its cash cost of fuel. It includes the actual net cash settlements from maturing fuel derivative contracts during the period and premium costs associated with those derivatives.
Wages, salaries and benefits expense amounted to $2,109 million in 2012, an increase of $118 million or 6% from 2011
In 2012, wages and salaries expense of $1,624 million increased $91 million or 6% from 2011. The increase in wages and salaries included the impact of higher average salaries year-over-year, an increase of 1.4% in the average number of full-time equivalent (“FTE”) employees, and an increase in expenses relating to employee profit sharing programs. In addition, in 2012, Air Canada recorded a liability of $18 million related to prior years’ employee profit sharing payments. The liability is an estimate based on a number of assumptions and may be subject to further adjustment in the future.
In 2012, employee benefits expense of $485 million increased $27 million or 6% from 2011, largely due to the impact of lower discount rates which increase the service cost of pension and other employee future benefits expense, and the impact of higher health care rates year-over-year.
Capacity purchase costs increased 7% from 2011
In 2012, capacity purchase costs of $1,072 million increased $69 million or 7% from 2011, mainly due to higher Jazz CPA rates, a 2.5% increase in block hours flown by Jazz and other regional carriers operating aircraft on behalf of Air Canada, and an unfavourable impact of foreign exchange on U.S. currency denominated Jazz CPA expenses paid by Air Canada. Sky Regional’s commencement, on May 1, 2011, of services on behalf of Air Canada between Billy Bishop Toronto City Airport and Montreal Trudeau Airport was also a contributing factor to the increase in capacity purchase costs year-over-year.
Ownership costs decreased 5% from 2011
In 2012, ownership costs (which are comprised of depreciation, amortization and impairment, and aircraft rent expenses) of $1,014 million decreased $49 million or 5% from 2011, mainly due to certain engine and airframe maintenance events becoming fully amortized and a decrease in depreciation expense related to the airline’s interior refurbishment programs. Partly offsetting these decreases was the unfavourable impact of a weaker Canadian dollar versus the U.S. dollar, when compared to 2011, on U.S. currency denominated aircraft leases.
2012 Management’s Discussion and Analysis of Results of Operations and Financial Condition
21
Aircraft maintenance expense decreased 1% from 2011
In 2012, aircraft maintenance expense of $672 million decreased $9 million or 1% from 2011.
In 2012, Air Canada recorded a favourable adjustment of $32 million related to its end of lease maintenance return provision as a result of revised cost estimates stemming from new maintenance contracts entered into during 2012. In 2011, Air Canada recorded an unfavourable provision adjustment of $20 million as a result of changes in cost and discount rate assumptions.
In 2012, the impact of scheduled maintenance rate increases related to Air Canada’s Boeing 777 aircraft, the impact of Air Canada having to replace a leased engine which was beyond economical repair, a higher volume of engine maintenance activity driven mainly by the timing of scheduled engine maintenance activities, and an unfavourable currency impact were largely offset by the impact of significantly lower rates for airframe and engine maintenance year-over-year. Following Aveos’ CCAA filing in March 2012 and the subsequent termination of all maintenance agreements between Air Canada and Aveos, Air Canada concluded new agreements on a cost competitive basis with new maintenance service providers.
Sales and distribution costs decreased 1% from 2011
In 2012, sales and distribution costs of $603 million decreased $9 million or 1% from 2011 on passenger revenue growth of 5.2%. An increase in transaction fees paid to global distribution services providers and growth in credit card fees, which was in line with sales and revenue growth, were more than offset by lower commission expense at Air Canada, in part due to program changes, and by a decrease in sales and distribution costs at Air Canada Vacations.
Food, beverages and supplies expense increased 5% from 2011
In 2012, food, beverages and supplies expense of $291 million increased $13 million or 5% from 2011, largely due to passenger traffic growth, including in the premium class cabin.
Other operating expenses increased 6% from 2011
In 2012, other operating expenses of $1,305 million increased $75 million or 6% from 2011.
The following table provides a breakdown of the more significant items included in other expenses:
Full Year Change
(Canadian dollars in millions) 2012 2011 $ %
Air Canada Vacations' land costs $ 319 $ 307 $ 12 4
Terminal handling 184 193 (9) (5)
Building rent and maintenance 124 127 (3) (2)
Crew cycle 116 115 1 1
Miscellaneous fees and services 138 108 30 28
Remaining other expenses 424 380 44 12
Other operating expenses $ 1,305 $ 1,230 $ 75 6
Factors contributing to the year-over-year change in full year Other expenses included:
• An increase in “remaining other expenses” of $44 million or 12% which was largely driven by expenses, such as engine and rotable equipment rentals, resulting from the Aveos closure.
• An increase of $30 million or 28% in miscellaneous fees and services which included fees incurred in relation to various corporate strategic initiatives, including those related to cost saving and revenue generating initiatives.
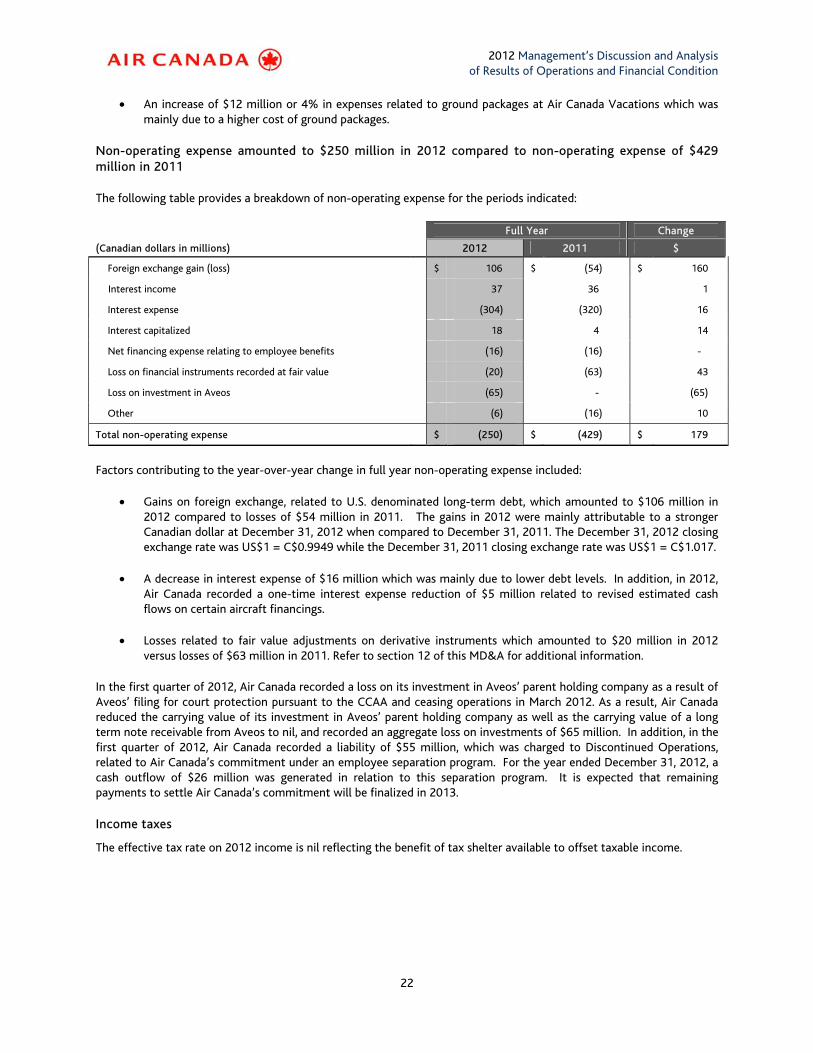
2012 Management’s Discussion and Analysis of Results of Operations and Financial Condition
22
• An increase of $12 million or 4% in expenses related to ground packages at Air Canada Vacations which was mainly due to a higher cost of ground packages.
Non-operating expense amounted to $250 million in 2012 compared to non-operating expense of $429 million in 2011
The following table provides a breakdown of non-operating expense for the periods indicated:
Full Year Change
(Canadian dollars in millions) 2012 2011 $
Foreign exchange gain (loss) $ 106 $ (54) $ 160
Interest income 37 36 1
Interest expense (304) (320) 16
Interest capitalized 18 4 14
Net financing expense relating to employee benefits (16) (16) -
Loss on financial instruments recorded at fair value (20) (63) 43
Loss on investment in Aveos (65) - (65)
Other (6) (16) 10
Total non-operating expense $ (250) $ (429) $ 179
Factors contributing to the year-over-year change in full year non-operating expense included:
• Gains on foreign exchange, related to U.S. denominated long-term debt, which amounted to $106 million in 2012 compared to losses of $54 million in 2011. The gains in 2012 were mainly attributable to a stronger Canadian dollar at December 31, 2012 when compared to December 31, 2011. The December 31, 2012 closing exchange rate was US$1 = C$0.9949 while the December 31, 2011 closing exchange rate was US$1 = C$1.017.
• A decrease in interest expense of $16 million which was mainly due to lower debt levels. In addition, in 2012, Air Canada recorded a one-time interest expense reduction of $5 million related to revised estimated cash flows on certain aircraft financings.
• Losses related to fair value adjustments on derivative instruments which amounted to $20 million in 2012 versus losses of $63 million in 2011. Refer to section 12 of this MD&A for additional information.
In the first quarter of 2012, Air Canada recorded a loss on its investment in Aveos’ parent holding company as a result of Aveos’ filing for court protection pursuant to the CCAA and ceasing operations in March 2012. As a result, Air Canada reduced the carrying value of its investment in Aveos’ parent holding company as well as the carrying value of a long term note receivable from Aveos to nil, and recorded an aggregate loss on investments of $65 million. In addition, in the first quarter of 2012, Air Canada recorded a liability of $55 million, which was charged to Discontinued Operations, related to Air Canada’s commitment under an employee separation program. For the year ended December 31, 2012, a cash outflow of $26 million was generated in relation to this separation program. It is expected that remaining payments to settle Air Canada’s commitment will be finalized in 2013.
Income taxes
The effective tax rate on 2012 income is nil reflecting the benefit of tax shelter available to offset taxable income.
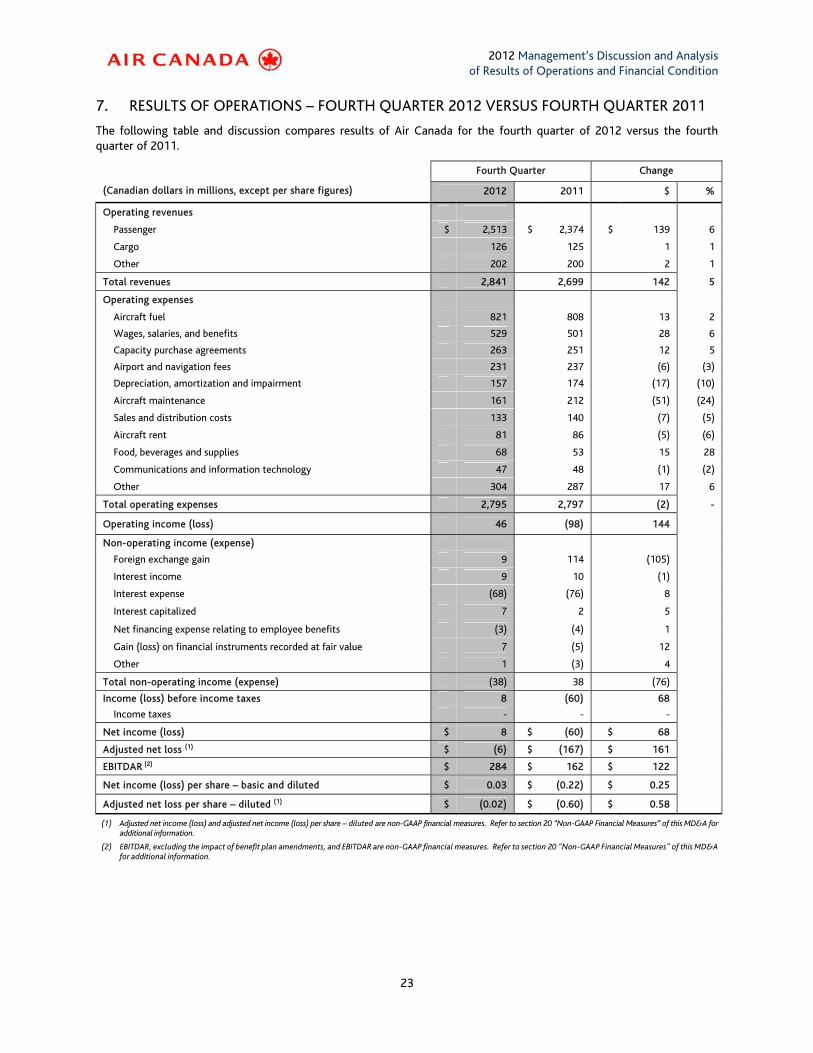
2012 Management’s Discussion and Analysis of Results of Operations and Financial Condition
23
7. RESULTS OF OPERATIONS – FOURTH QUARTER 2012 VERSUS FOURTH QUARTER 2011
The following table and discussion compares results of Air Canada for the fourth quarter of 2012 versus the fourth quarter of 2011.
Fourth Quarter Change
(Canadian dollars in millions, except per share figures) 2012 2011 $ %
Operating revenues
Passenger $ 2,513 $ 2,374 $ 139 6
Cargo 126 125 1 1
Other 202 200 2 1
Total revenues 2,841 2,699 142 5
Operating expenses
Aircraft fuel 821 808 13 2
Wages, salaries, and benefits 529 501 28 6
Capacity purchase agreements 263 251 12 5
Airport and navigation fees 231 237 (6) (3)
Depreciation, amortization and impairment 157 174 (17) (10)
Aircraft maintenance 161 212 (51) (24)
Sales and distribution costs 133 140 (7) (5)
Aircraft rent 81 86 (5) (6)
Food, beverages and supplies 68 53 15 28
Communications and information technology 47 48 (1) (2)
Other 304 287 17 6
Total operating expenses 2,795 2,797 (2) -
Operating income (loss) 46 (98) 144
Non-operating income (expense)
Foreign exchange gain 9 114 (105)
Interest income 9 10 (1)
Interest expense (68) (76) 8
Interest capitalized 7 2 5
Net financing expense relating to employee benefits (3) (4) 1
Gain (loss) on financial instruments recorded at fair value 7 (5) 12
Other 1 (3) 4
Total non-operating income (expense) (38) 38 (76)
Income (loss) before income taxes 8 (60) 68
Income taxes - - -
Net income (loss) $ 8 $ (60) $ 68
Adjusted net loss (1) $ (6) $ (167) $ 161
EBITDAR (2) $ 284 $ 162 $ 122
Net income (loss) per share – basic and diluted $ 0.03 $ (0.22) $ 0.25
Adjusted net loss per share – diluted (1) $ (0.02) $ (0.60) $ 0.58
(1) Adjusted net income (loss) and adjusted net income (loss) per share – diluted are non-GAAP financial measures. Refer to section 20 “Non-GAAP Financial Measures” of this MD&A for additional information.
(2) EBITDAR, excluding the impact of benefit plan amendments, and EBITDAR are non-GAAP financial measures. Refer to section 20 "Non-GAAP Financial Measures" of this MD&A for additional information.
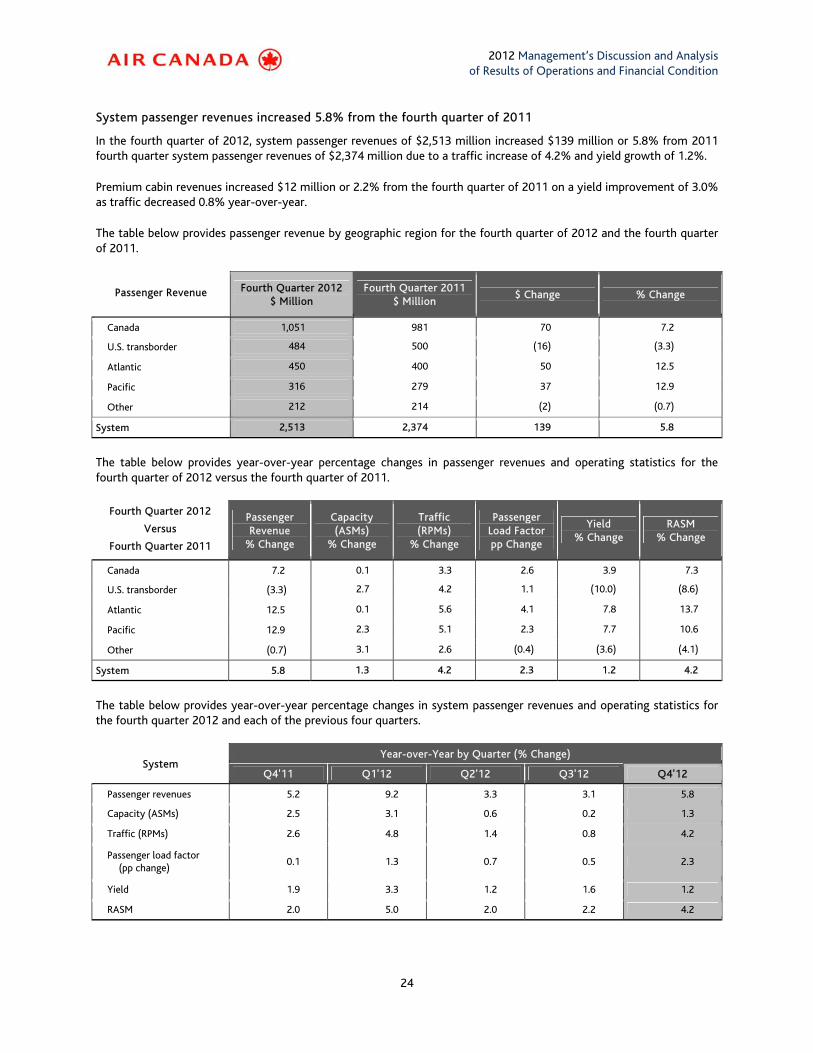
2012 Management’s Discussion and Analysis of Results of Operations and Financial Condition
24
System passenger revenues increased 5.8% from the fourth quarter of 2011
In the fourth quarter of 2012, system passenger revenues of $2,513 million increased $139 million or 5.8% from 2011 fourth quarter system passenger revenues of $2,374 million due to a traffic increase of 4.2% and yield growth of 1.2%.
Premium cabin revenues increased $12 million or 2.2% from the fourth quarter of 2011 on a yield improvement of 3.0% as traffic decreased 0.8% year-over-year.
The table below provides passenger revenue by geographic region for the fourth quarter of 2012 and the fourth quarter of 2011.
Passenger Revenue Fourth Quarter 2012 $ Million
Fourth Quarter 2011 $ Million
$ Change % Change
Canada 1,051 981 70 7.2
U.S. transborder 484 500 (16) (3.3)
Atlantic 450 400 50 12.5
Pacific 316 279 37 12.9
Other 212 214 (2) (0.7)
System 2,513 2,374 139 5.8
The table below provides year-over-year percentage changes in passenger revenues and operating statistics for the fourth quarter of 2012 versus the fourth quarter of 2011.
Fourth Quarter 2012
Versus
Fourth Quarter 2011
Passenger Revenue
% Change
Capacity (ASMs)
% Change
Traffic (RPMs)
% Change
Passenger Load Factor pp Change
Yield % Change
RASM % Change
Canada 7.2 0.1 3.3 2.6 3.9 7.3
U.S. transborder (3.3) 2.7 4.2 1.1 (10.0) (8.6)
Atlantic 12.5 0.1 5.6 4.1 7.8 13.7
Pacific 12.9 2.3 5.1 2.3 7.7 10.6
Other (0.7) 3.1 2.6 (0.4) (3.6) (4.1)
System 5.8 1.3 4.2 2.3 1.2 4.2
The table below provides year-over-year percentage changes in system passenger revenues and operating statistics for the fourth quarter 2012 and each of the previous four quarters.
System Year-over-Year by Quarter (% Change)
Q4'11 Q1'12 Q2'12 Q3'12 Q4'12
Passenger revenues 5.2 9.2 3.3 3.1 5.8
Capacity (ASMs) 2.5 3.1 0.6 0.2 1.3
Traffic (RPMs) 2.6 4.8 1.4 0.8 4.2
Passenger load factor (pp change)
0.1 1.3 0.7 0.5 2.3
Yield 1.9 3.3 1.2 1.6 1.2
RASM 2.0 5.0 2.0 2.2 4.2
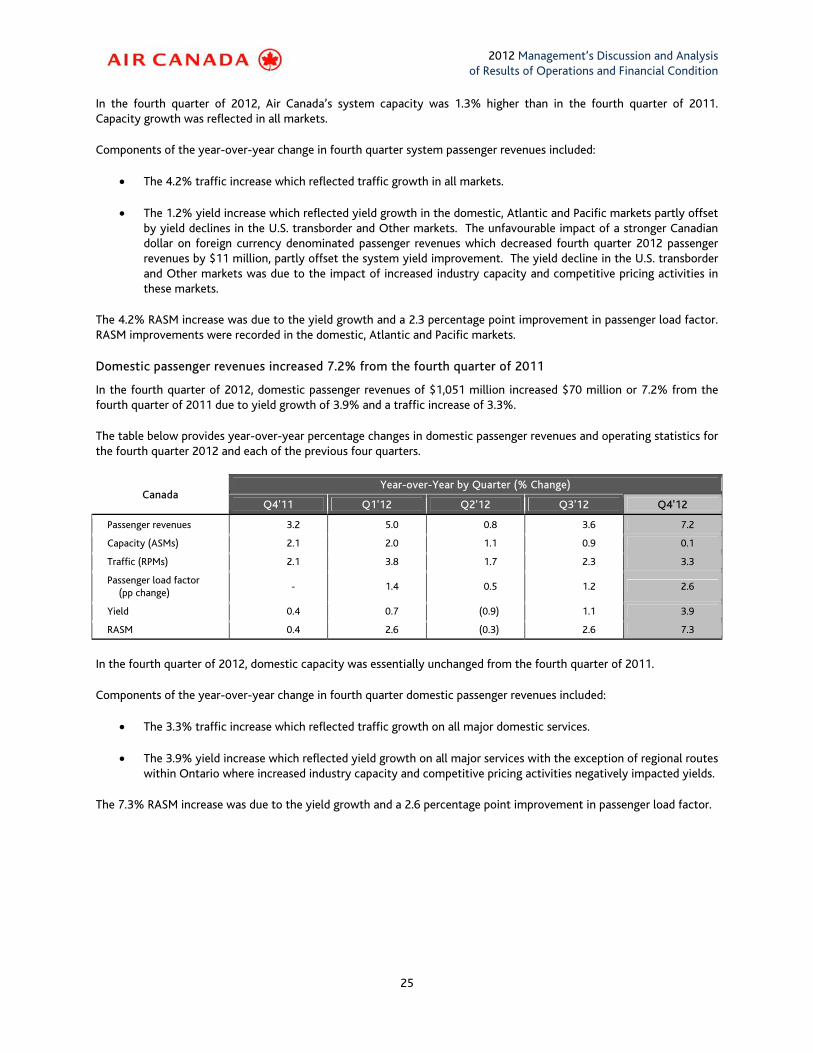
2012 Management’s Discussion and Analysis of Results of Operations and Financial Condition
25
In the fourth quarter of 2012, Air Canada’s system capacity was 1.3% higher than in the fourth quarter of 2011. Capacity growth was reflected in all markets.
Components of the year-over-year change in fourth quarter system passenger revenues included:
• The 4.2% traffic increase which reflected traffic growth in all markets.
• The 1.2% yield increase which reflected yield growth in the domestic, Atlantic and Pacific markets partly offset by yield declines in the U.S. transborder and Other markets. The unfavourable impact of a stronger Canadian dollar on foreign currency denominated passenger revenues which decreased fourth quarter 2012 passenger revenues by $11 million, partly offset the system yield improvement. The yield decline in the U.S. transborder and Other markets was due to the impact of increased industry capacity and competitive pricing activities in these markets.
The 4.2% RASM increase was due to the yield growth and a 2.3 percentage point improvement in passenger load factor. RASM improvements were recorded in the domestic, Atlantic and Pacific markets.
Domestic passenger revenues increased 7.2% from the fourth quarter of 2011
In the fourth quarter of 2012, domestic passenger revenues of $1,051 million increased $70 million or 7.2% from the fourth quarter of 2011 due to yield growth of 3.9% and a traffic increase of 3.3%.
The table below provides year-over-year percentage changes in domestic passenger revenues and operating statistics for the fourth quarter 2012 and each of the previous four quarters.
Canada Year-over-Year by Quarter (% Change)
Q4'11 Q1'12 Q2'12 Q3'12 Q4'12
Passenger revenues 3.2 5.0 0.8 3.6 7.2
Capacity (ASMs) 2.1 2.0 1.1 0.9 0.1
Traffic (RPMs) 2.1 3.8 1.7 2.3 3.3
Passenger load factor (pp change)
- 1.4 0.5 1.2 2.6
Yield 0.4 0.7 (0.9) 1.1 3.9
RASM 0.4 2.6 (0.3) 2.6 7.3
In the fourth quarter of 2012, domestic capacity was essentially unchanged from the fourth quarter of 2011.
Components of the year-over-year change in fourth quarter domestic passenger revenues included:
• The 3.3% traffic increase which reflected traffic growth on all major domestic services.
• The 3.9% yield increase which reflected yield growth on all major services with the exception of regional routes within Ontario where increased industry capacity and competitive pricing activities negatively impacted yields.
The 7.3% RASM increase was due to the yield growth and a 2.6 percentage point improvement in passenger load factor.
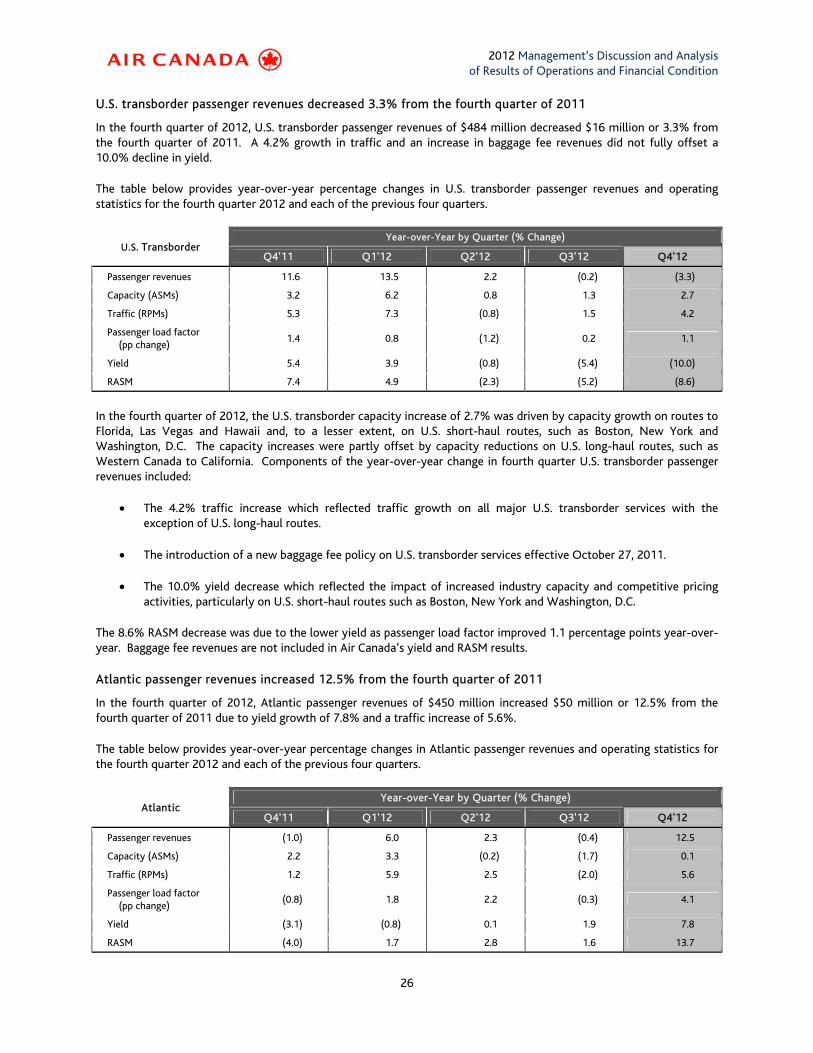
2012 Management’s Discussion and Analysis of Results of Operations and Financial Condition
26
U.S. transborder passenger revenues decreased 3.3% from the fourth quarter of 2011
In the fourth quarter of 2012, U.S. transborder passenger revenues of $484 million decreased $16 million or 3.3% from the fourth quarter of 2011. A 4.2% growth in traffic and an increase in baggage fee revenues did not fully offset a 10.0% decline in yield.
The table below provides year-over-year percentage changes in U.S. transborder passenger revenues and operating statistics for the fourth quarter 2012 and each of the previous four quarters.
U.S. Transborder Year-over-Year by Quarter (% Change)
Q4'11 Q1'12 Q2'12 Q3'12 Q4'12
Passenger revenues 11.6 13.5 2.2 (0.2) (3.3)
Capacity (ASMs) 3.2 6.2 0.8 1.3 2.7
Traffic (RPMs) 5.3 7.3 (0.8) 1.5 4.2
Passenger load factor (pp change)
1.4 0.8 (1.2) 0.2 1.1
Yield 5.4 3.9 (0.8) (5.4) (10.0)
RASM 7.4 4.9 (2.3) (5.2) (8.6)
In the fourth quarter of 2012, the U.S. transborder capacity increase of 2.7% was driven by capacity growth on routes to Florida, Las Vegas and Hawaii and, to a lesser extent, on U.S. short-haul routes, such as Boston, New York and Washington, D.C. The capacity increases were partly offset by capacity reductions on U.S. long-haul routes, such as Western Canada to California. Components of the year-over-year change in fourth quarter U.S. transborder passenger revenues included:
• The 4.2% traffic increase which reflected traffic growth on all major U.S. transborder services with the exception of U.S. long-haul routes.
• The introduction of a new baggage fee policy on U.S. transborder services effective October 27, 2011.
• The 10.0% yield decrease which reflected the impact of increased industry capacity and competitive pricing activities, particularly on U.S. short-haul routes such as Boston, New York and Washington, D.C.
The 8.6% RASM decrease was due to the lower yield as passenger load factor improved 1.1 percentage points year-over-year. Baggage fee revenues are not included in Air Canada’s yield and RASM results.
Atlantic passenger revenues increased 12.5% from the fourth quarter of 2011
In the fourth quarter of 2012, Atlantic passenger revenues of $450 million increased $50 million or 12.5% from the fourth quarter of 2011 due to yield growth of 7.8% and a traffic increase of 5.6%.
The table below provides year-over-year percentage changes in Atlantic passenger revenues and operating statistics for the fourth quarter 2012 and each of the previous four quarters.
Atlantic Year-over-Year by Quarter (% Change)
Q4'11 Q1'12 Q2'12 Q3'12 Q4'12
Passenger revenues (1.0) 6.0 2.3 (0.4) 12.5
Capacity (ASMs) 2.2 3.3 (0.2) (1.7) 0.1
Traffic (RPMs) 1.2 5.9 2.5 (2.0) 5.6
Passenger load factor (pp change)
(0.8) 1.8 2.2 (0.3) 4.1
Yield (3.1) (0.8) 0.1 1.9 7.8
RASM (4.0) 1.7 2.8 1.6 13.7
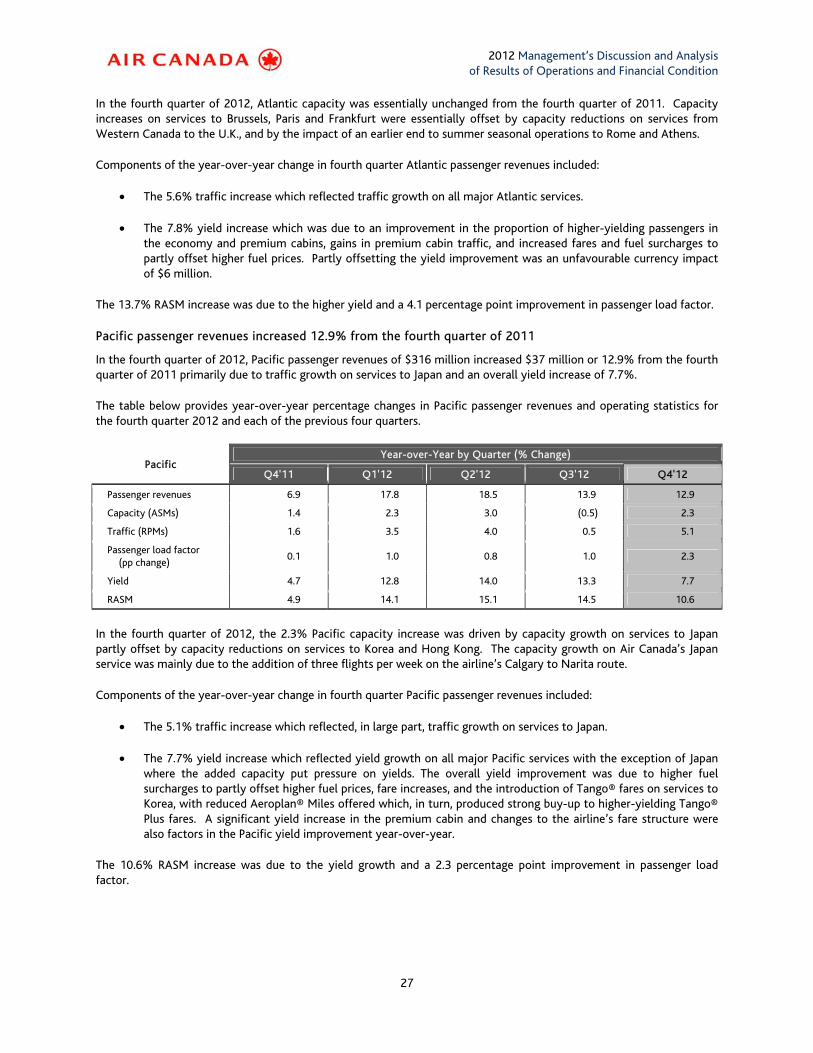
2012 Management’s Discussion and Analysis of Results of Operations and Financial Condition
27
In the fourth quarter of 2012, Atlantic capacity was essentially unchanged from the fourth quarter of 2011. Capacity increases on services to Brussels, Paris and Frankfurt were essentially offset by capacity reductions on services from Western Canada to the U.K., and by the impact of an earlier end to summer seasonal operations to Rome and Athens.
Components of the year-over-year change in fourth quarter Atlantic passenger revenues included:
• The 5.6% traffic increase which reflected traffic growth on all major Atlantic services.
• The 7.8% yield increase which was due to an improvement in the proportion of higher-yielding passengers in the economy and premium cabins, gains in premium cabin traffic, and increased fares and fuel surcharges to partly offset higher fuel prices. Partly offsetting the yield improvement was an unfavourable currency impact of $6 million.
The 13.7% RASM increase was due to the higher yield and a 4.1 percentage point improvement in passenger load factor.
Pacific passenger revenues increased 12.9% from the fourth quarter of 2011
In the fourth quarter of 2012, Pacific passenger revenues of $316 million increased $37 million or 12.9% from the fourth quarter of 2011 primarily due to traffic growth on services to Japan and an overall yield increase of 7.7%.
The table below provides year-over-year percentage changes in Pacific passenger revenues and operating statistics for the fourth quarter 2012 and each of the previous four quarters.
Pacific Year-over-Year by Quarter (% Change)
Q4'11 Q1'12 Q2'12 Q3'12 Q4'12
Passenger revenues 6.9 17.8 18.5 13.9 12.9
Capacity (ASMs) 1.4 2.3 3.0 (0.5) 2.3
Traffic (RPMs) 1.6 3.5 4.0 0.5 5.1
Passenger load factor (pp change)
0.1 1.0 0.8 1.0 2.3
Yield 4.7 12.8 14.0 13.3 7.7
RASM 4.9 14.1 15.1 14.5 10.6
In the fourth quarter of 2012, the 2.3% Pacific capacity increase was driven by capacity growth on services to Japan partly offset by capacity reductions on services to Korea and Hong Kong. The capacity growth on Air Canada’s Japan service was mainly due to the addition of three flights per week on the airline’s Calgary to Narita route.
Components of the year-over-year change in fourth quarter Pacific passenger revenues included:
• The 5.1% traffic increase which reflected, in large part, traffic growth on services to Japan.
• The 7.7% yield increase which reflected yield growth on all major Pacific services with the exception of Japan where the added capacity put pressure on yields. The overall yield improvement was due to higher fuel surcharges to partly offset higher fuel prices, fare increases, and the introduction of Tango® fares on services to Korea, with reduced Aeroplan® Miles offered which, in turn, produced strong buy-up to higher-yielding Tango® Plus fares. A significant yield increase in the premium cabin and changes to the airline’s fare structure were also factors in the Pacific yield improvement year-over-year.
The 10.6% RASM increase was due to the yield growth and a 2.3 percentage point improvement in passenger load factor.
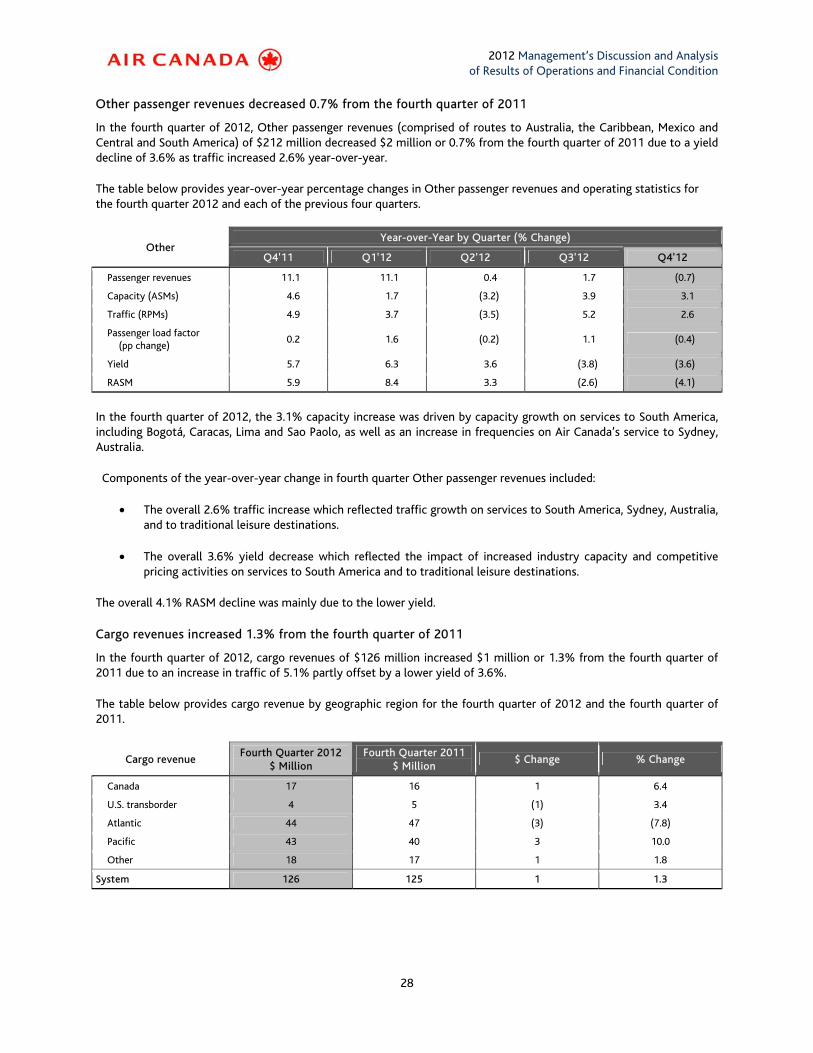
2012 Management’s Discussion and Analysis of Results of Operations and Financial Condition
28
Other passenger revenues decreased 0.7% from the fourth quarter of 2011
In the fourth quarter of 2012, Other passenger revenues (comprised of routes to Australia, the Caribbean, Mexico and Central and South America) of $212 million decreased $2 million or 0.7% from the fourth quarter of 2011 due to a yield decline of 3.6% as traffic increased 2.6% year-over-year.
The table below provides year-over-year percentage changes in Other passenger revenues and operating statistics for the fourth quarter 2012 and each of the previous four quarters.
Other Year-over-Year by Quarter (% Change)
Q4'11 Q1'12 Q2'12 Q3'12 Q4'12
Passenger revenues 11.1 11.1 0.4 1.7 (0.7)
Capacity (ASMs) 4.6 1.7 (3.2) 3.9 3.1
Traffic (RPMs) 4.9 3.7 (3.5) 5.2 2.6
Passenger load factor (pp change)
0.2 1.6 (0.2) 1.1 (0.4)
Yield 5.7 6.3 3.6 (3.8) (3.6)
RASM 5.9 8.4 3.3 (2.6) (4.1)
In the fourth quarter of 2012, the 3.1% capacity increase was driven by capacity growth on services to South America, including Bogotá, Caracas, Lima and Sao Paolo, as well as an increase in frequencies on Air Canada’s service to Sydney, Australia.
Components of the year-over-year change in fourth quarter Other passenger revenues included:
• The overall 2.6% traffic increase which reflected traffic growth on services to South America, Sydney, Australia, and to traditional leisure destinations.
• The overall 3.6% yield decrease which reflected the impact of increased industry capacity and competitive pricing activities on services to South America and to traditional leisure destinations.
The overall 4.1% RASM decline was mainly due to the lower yield.
Cargo revenues increased 1.3% from the fourth quarter of 2011
In the fourth quarter of 2012, cargo revenues of $126 million increased $1 million or 1.3% from the fourth quarter of 2011 due to an increase in traffic of 5.1% partly offset by a lower yield of 3.6%.
The table below provides cargo revenue by geographic region for the fourth quarter of 2012 and the fourth quarter of 2011.
Cargo revenue Fourth Quarter 2012
$ Million Fourth Quarter 2011
$ Million $ Change % Change
Canada 17 16 1 6.4
U.S. transborder 4 5 (1) 3.4
Atlantic 44 47 (3) (7.8)
Pacific 43 40 3 10.0
Other 18 17 1 1.8
System 126 125 1 1.3
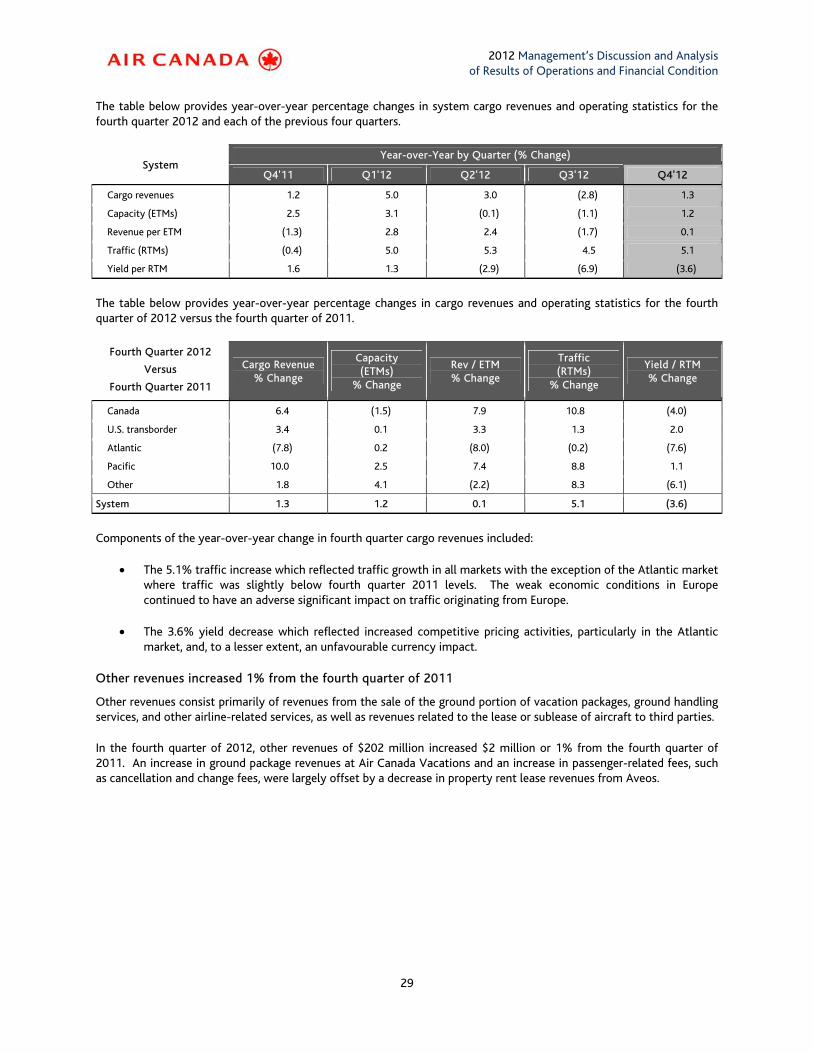
2012 Management’s Discussion and Analysis of Results of Operations and Financial Condition
29
The table below provides year-over-year percentage changes in system cargo revenues and operating statistics for the fourth quarter 2012 and each of the previous four quarters.
System Year-over-Year by Quarter (% Change)
Q4'11 Q1'12 Q2'12 Q3'12 Q4'12
Cargo revenues 1.2 5.0 3.0 (2.8) 1.3
Capacity (ETMs) 2.5 3.1 (0.1) (1.1) 1.2
Revenue per ETM (1.3) 2.8 2.4 (1.7) 0.1
Traffic (RTMs) (0.4) 5.0 5.3 4.5 5.1
Yield per RTM 1.6 1.3 (2.9) (6.9) (3.6)
The table below provides year-over-year percentage changes in cargo revenues and operating statistics for the fourth quarter of 2012 versus the fourth quarter of 2011.
Fourth Quarter 2012
Versus
Fourth Quarter 2011
Cargo Revenue % Change
Capacity (ETMs)
% Change
Rev / ETM % Change
Traffic (RTMs)
% Change
Yield / RTM % Change
Canada 6.4 (1.5) 7.9 10.8 (4.0)
U.S. transborder 3.4 0.1 3.3 1.3 2.0
Atlantic (7.8) 0.2 (8.0) (0.2) (7.6)
Pacific 10.0 2.5 7.4 8.8 1.1
Other 1.8 4.1 (2.2) 8.3 (6.1)
System 1.3 1.2 0.1 5.1 (3.6)
Components of the year-over-year change in fourth quarter cargo revenues included:
• The 5.1% traffic increase which reflected traffic growth in all markets with the exception of the Atlantic market where traffic was slightly below fourth quarter 2011 levels. The weak economic conditions in Europe continued to have an adverse significant impact on traffic originating from Europe.
• The 3.6% yield decrease which reflected increased competitive pricing activities, particularly in the Atlantic market, and, to a lesser extent, an unfavourable currency impact.
Other revenues increased 1% from the fourth quarter of 2011
Other revenues consist primarily of revenues from the sale of the ground portion of vacation packages, ground handling services, and other airline-related services, as well as revenues related to the lease or sublease of aircraft to third parties.
In the fourth quarter of 2012, other revenues of $202 million increased $2 million or 1% from the fourth quarter of 2011. An increase in ground package revenues at Air Canada Vacations and an increase in passenger-related fees, such as cancellation and change fees, were largely offset by a decrease in property rent lease revenues from Aveos.
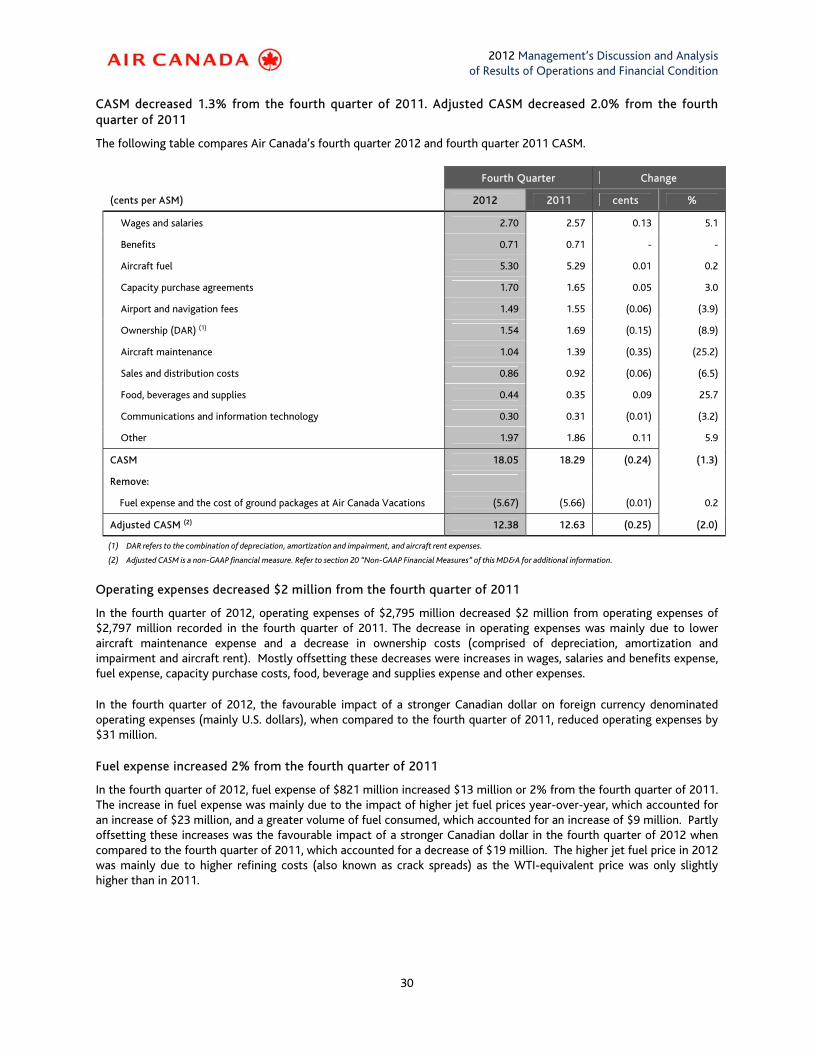
2012 Management’s Discussion and Analysis of Results of Operations and Financial Condition
30
CASM decreased 1.3% from the fourth quarter of 2011. Adjusted CASM decreased 2.0% from the fourth quarter of 2011
The following table compares Air Canada’s fourth quarter 2012 and fourth quarter 2011 CASM.
Fourth Quarter Change
(cents per ASM) 2012 2011 cents %
Wages and salaries 2.70 2.57 0.13 5.1
Benefits 0.71 0.71 - -
Aircraft fuel 5.30 5.29 0.01 0.2
Capacity purchase agreements 1.70 1.65 0.05 3.0
Airport and navigation fees 1.49 1.55 (0.06) (3.9)
Ownership (DAR) (1) 1.54 1.69 (0.15) (8.9)
Aircraft maintenance 1.04 1.39 (0.35) (25.2)
Sales and distribution costs 0.86 0.92 (0.06) (6.5)
Food, beverages and supplies 0.44 0.35 0.09 25.7
Communications and information technology 0.30 0.31 (0.01) (3.2)
Other 1.97 1.86 0.11 5.9
CASM 18.05 18.29 (0.24) (1.3)
Remove:
Fuel expense and the cost of ground packages at Air Canada Vacations (5.67) (5.66) (0.01) 0.2
Adjusted CASM (2) 12.38 12.63 (0.25) (2.0)
(1) DAR refers to the combination of depreciation, amortization and impairment, and aircraft rent expenses.
(2) Adjusted CASM is a non-GAAP financial measure. Refer to section 20 “Non-GAAP Financial Measures” of this MD&A for additional information.
Operating expenses decreased $2 million from the fourth quarter of 2011
In the fourth quarter of 2012, operating expenses of $2,795 million decreased $2 million from operating expenses of $2,797 million recorded in the fourth quarter of 2011. The decrease in operating expenses was mainly due to lower aircraft maintenance expense and a decrease in ownership costs (comprised of depreciation, amortization and impairment and aircraft rent). Mostly offsetting these decreases were increases in wages, salaries and benefits expense, fuel expense, capacity purchase costs, food, beverage and supplies expense and other expenses.
In the fourth quarter of 2012, the favourable impact of a stronger Canadian dollar on foreign currency denominated operating expenses (mainly U.S. dollars), when compared to the fourth quarter of 2011, reduced operating expenses by $31 million.
Fuel expense increased 2% from the fourth quarter of 2011
In the fourth quarter of 2012, fuel expense of $821 million increased $13 million or 2% from the fourth quarter of 2011. The increase in fuel expense was mainly due to the impact of higher jet fuel prices year-over-year, which accounted for an increase of $23 million, and a greater volume of fuel consumed, which accounted for an increase of $9 million. Partly offsetting these increases was the favourable impact of a stronger Canadian dollar in the fourth quarter of 2012 when compared to the fourth quarter of 2011, which accounted for a decrease of $19 million. The higher jet fuel price in 2012 was mainly due to higher refining costs (also known as crack spreads) as the WTI-equivalent price was only slightly higher than in 2011.
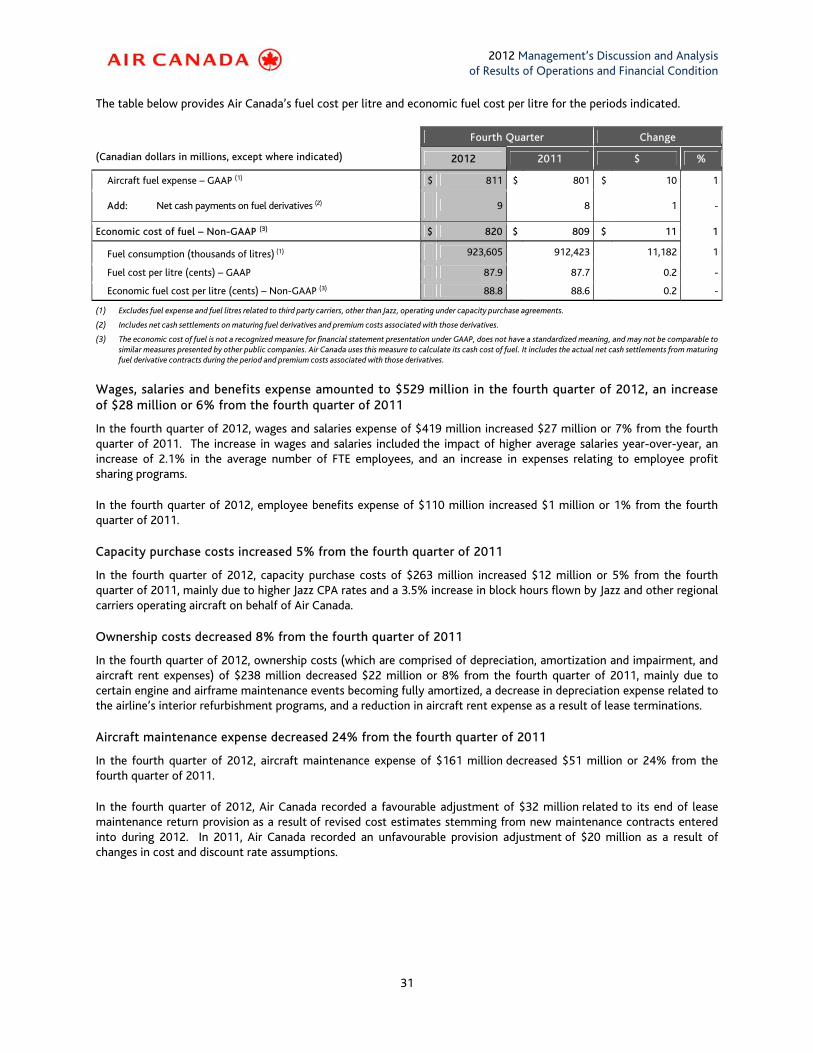
2012 Management’s Discussion and Analysis of Results of Operations and Financial Condition
31
The table below provides Air Canada’s fuel cost per litre and economic fuel cost per litre for the periods indicated.
Fourth Quarter Change
(Canadian dollars in millions, except where indicated) 2012 2011 $ %
Aircraft fuel expense – GAAP (1) $ 811 $ 801 $ 10 1
Add: Net cash payments on fuel derivatives (2)
9
8 1 -
Economic cost of fuel – Non-GAAP (3) $ 820 $ 809 $ 11 1
Fuel consumption (thousands of litres) (1) 923,605 912,423 11,182 1
Fuel cost per litre (cents) – GAAP 87.9 87.7 0.2 -
Economic fuel cost per litre (cents) – Non-GAAP (3) 88.8 88.6 0.2 -
(1) Excludes fuel expense and fuel litres related to third party carriers, other than Jazz, operating under capacity purchase agreements.
(2) Includes net cash settlements on maturing fuel derivatives and premium costs associated with those derivatives.
(3) The economic cost of fuel is not a recognized measure for financial statement presentation under GAAP, does not have a standardized meaning, and may not be comparable to similar measures presented by other public companies. Air Canada uses this measure to calculate its cash cost of fuel. It includes the actual net cash settlements from maturing fuel derivative contracts during the period and premium costs associated with those derivatives.
Wages, salaries and benefits expense amounted to $529 million in the fourth quarter of 2012, an increase of $28 million or 6% from the fourth quarter of 2011
In the fourth quarter of 2012, wages and salaries expense of $419 million increased $27 million or 7% from the fourth quarter of 2011. The increase in wages and salaries included the impact of higher average salaries year-over-year, an increase of 2.1% in the average number of FTE employees, and an increase in expenses relating to employee profit sharing programs.
In the fourth quarter of 2012, employee benefits expense of $110 million increased $1 million or 1% from the fourth quarter of 2011.
Capacity purchase costs increased 5% from the fourth quarter of 2011
In the fourth quarter of 2012, capacity purchase costs of $263 million increased $12 million or 5% from the fourth quarter of 2011, mainly due to higher Jazz CPA rates and a 3.5% increase in block hours flown by Jazz and other regional carriers operating aircraft on behalf of Air Canada.
Ownership costs decreased 8% from the fourth quarter of 2011
In the fourth quarter of 2012, ownership costs (which are comprised of depreciation, amortization and impairment, and aircraft rent expenses) of $238 million decreased $22 million or 8% from the fourth quarter of 2011, mainly due to certain engine and airframe maintenance events becoming fully amortized, a decrease in depreciation expense related to the airline’s interior refurbishment programs, and a reduction in aircraft rent expense as a result of lease terminations.
Aircraft maintenance expense decreased 24% from the fourth quarter of 2011
In the fourth quarter of 2012, aircraft maintenance expense of $161 million decreased $51 million or 24% from the fourth quarter of 2011.
In the fourth quarter of 2012, Air Canada recorded a favourable adjustment of $32 million related to its end of lease maintenance return provision as a result of revised cost estimates stemming from new maintenance contracts entered into during 2012. In 2011, Air Canada recorded an unfavourable provision adjustment of $20 million as a result of changes in cost and discount rate assumptions.
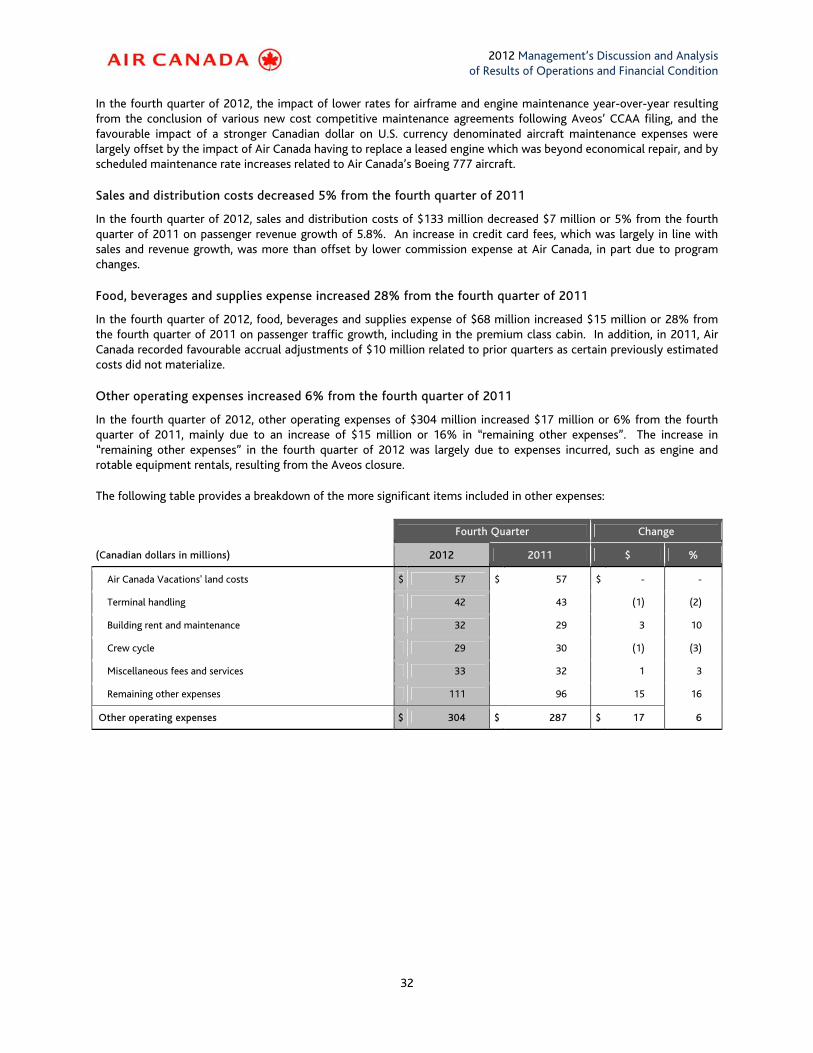
2012 Management’s Discussion and Analysis of Results of Operations and Financial Condition
32
In the fourth quarter of 2012, the impact of lower rates for airframe and engine maintenance year-over-year resulting from the conclusion of various new cost competitive maintenance agreements following Aveos’ CCAA filing, and the favourable impact of a stronger Canadian dollar on U.S. currency denominated aircraft maintenance expenses were largely offset by the impact of Air Canada having to replace a leased engine which was beyond economical repair, and by scheduled maintenance rate increases related to Air Canada’s Boeing 777 aircraft.
Sales and distribution costs decreased 5% from the fourth quarter of 2011
In the fourth quarter of 2012, sales and distribution costs of $133 million decreased $7 million or 5% from the fourth quarter of 2011 on passenger revenue growth of 5.8%. An increase in credit card fees, which was largely in line with sales and revenue growth, was more than offset by lower commission expense at Air Canada, in part due to program changes.
Food, beverages and supplies expense increased 28% from the fourth quarter of 2011
In the fourth quarter of 2012, food, beverages and supplies expense of $68 million increased $15 million or 28% from the fourth quarter of 2011 on passenger traffic growth, including in the premium class cabin. In addition, in 2011, Air Canada recorded favourable accrual adjustments of $10 million related to prior quarters as certain previously estimated costs did not materialize.
Other operating expenses increased 6% from the fourth quarter of 2011
In the fourth quarter of 2012, other operating expenses of $304 million increased $17 million or 6% from the fourth quarter of 2011, mainly due to an increase of $15 million or 16% in “remaining other expenses”. The increase in “remaining other expenses” in the fourth quarter of 2012 was largely due to expenses incurred, such as engine and rotable equipment rentals, resulting from the Aveos closure.
The following table provides a breakdown of the more significant items included in other expenses:
Fourth Quarter Change
(Canadian dollars in millions) 2012 2011 $ %
Air Canada Vacations' land costs $ 57 $ 57 $ - -
Terminal handling 42 43 (1) (2)
Building rent and maintenance 32 29 3 10
Crew cycle 29 30 (1) (3)
Miscellaneous fees and services 33 32 1 3
Remaining other expenses 111 96 15 16
Other operating expenses $ 304 $ 287 $ 17 6
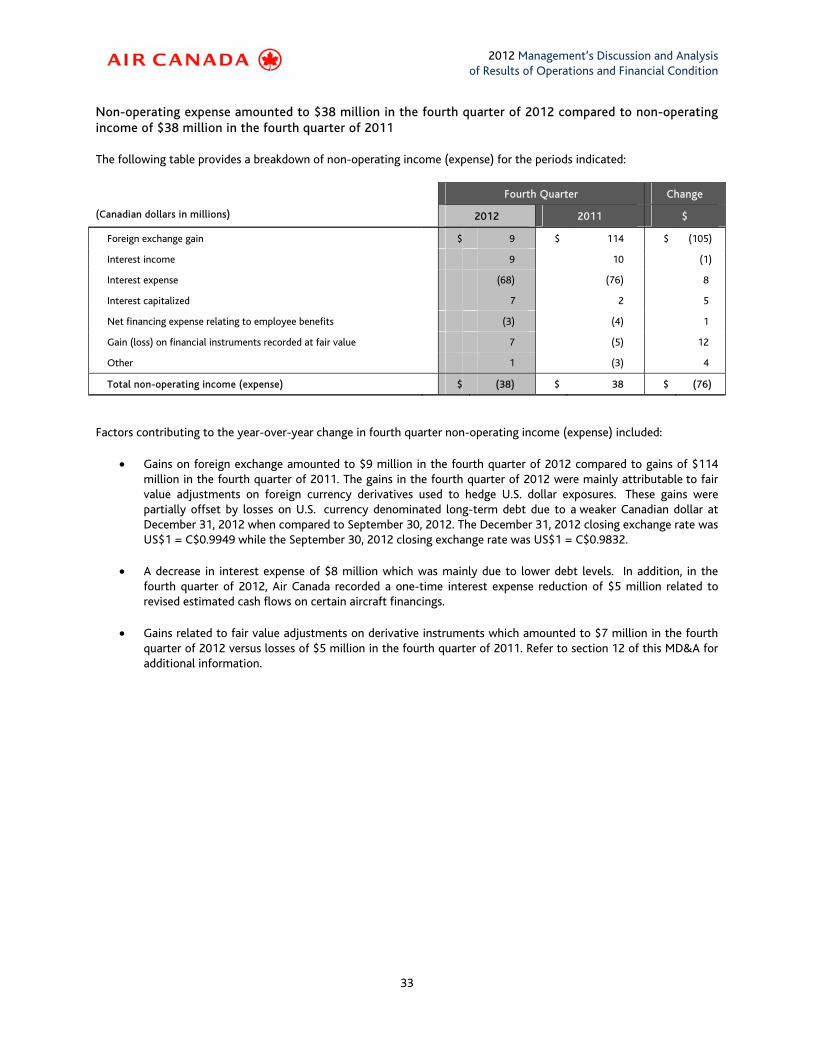
2012 Management’s Discussion and Analysis of Results of Operations and Financial Condition
33
Non-operating expense amounted to $38 million in the fourth quarter of 2012 compared to non-operating income of $38 million in the fourth quarter of 2011
The following table provides a breakdown of non-operating income (expense) for the periods indicated:
Fourth Quarter Change
(Canadian dollars in millions) 2012 2011 $
Foreign exchange gain $ 9 $ 114 $ (105)
Interest income 9 10 (1)
Interest expense (68) (76) 8
Interest capitalized 7 2 5
Net financing expense relating to employee benefits (3) (4) 1
Gain (loss) on financial instruments recorded at fair value 7 (5) 12
Other 1 (3) 4
Total non-operating income (expense) $ (38) $ 38 $ (76)
Factors contributing to the year-over-year change in fourth quarter non-operating income (expense) included:
• Gains on foreign exchange amounted to $9 million in the fourth quarter of 2012 compared to gains of $114 million in the fourth quarter of 2011. The gains in the fourth quarter of 2012 were mainly attributable to fair value adjustments on foreign currency derivatives used to hedge U.S. dollar exposures. These gains were partially offset by losses on U.S. currency denominated long-term debt due to a weaker Canadian dollar at December 31, 2012 when compared to September 30, 2012. The December 31, 2012 closing exchange rate was US$1 = C$0.9949 while the September 30, 2012 closing exchange rate was US$1 = C$0.9832.
• A decrease in interest expense of $8 million which was mainly due to lower debt levels. In addition, in the fourth quarter of 2012, Air Canada recorded a one-time interest expense reduction of $5 million related to revised estimated cash flows on certain aircraft financings.
• Gains related to fair value adjustments on derivative instruments which amounted to $7 million in the fourth quarter of 2012 versus losses of $5 million in the fourth quarter of 2011. Refer to section 12 of this MD&A for additional information.
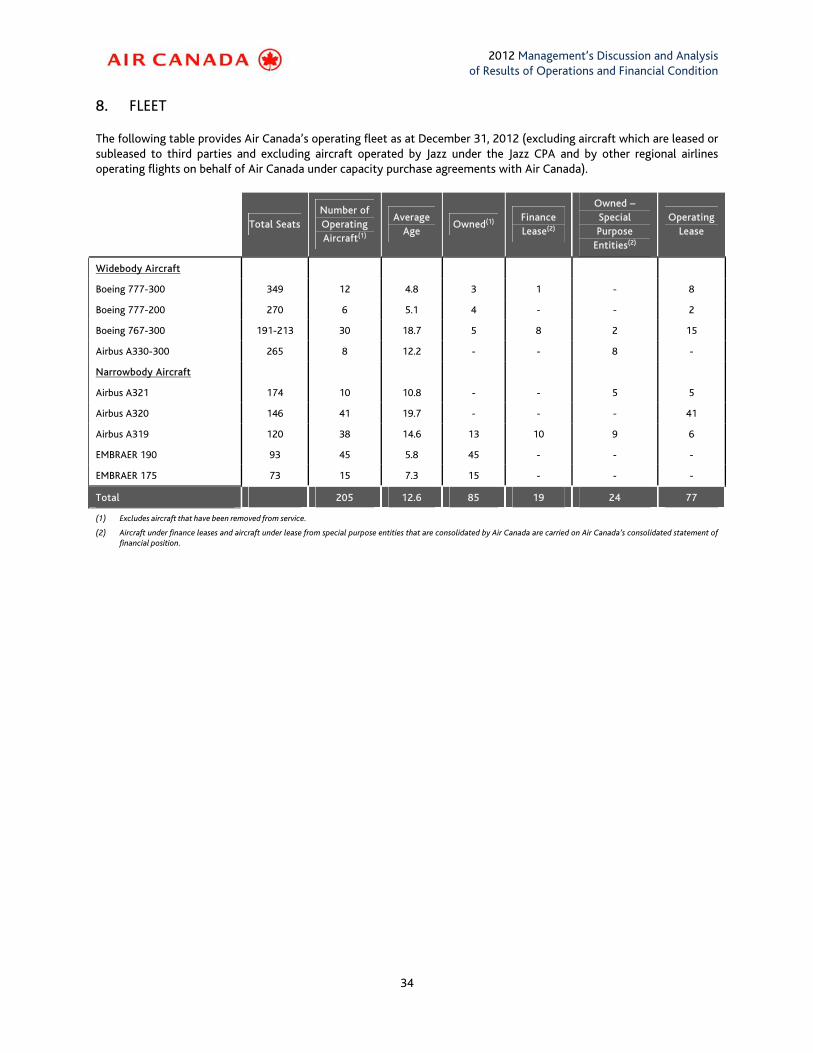
2012 Management’s Discussion and Analysis of Results of Operations and Financial Condition
34
8. FLEET
The following table provides Air Canada’s operating fleet as at December 31, 2012 (excluding aircraft which are leased or subleased to third parties and excluding aircraft operated by Jazz under the Jazz CPA and by other regional airlines operating flights on behalf of Air Canada under capacity purchase agreements with Air Canada).
Total Seats Number of Operating Aircraft(1)
Average Age
Owned(1) Finance Lease(2)
Owned – Special Purpose
Entities(2)
Operating Lease
Widebody Aircraft
Boeing 777-300 349 12 4.8 3 1 - 8
Boeing 777-200 270 6 5.1 4 - - 2
Boeing 767-300 191-213 30 18.7 5 8 2 15
Airbus A330-300 265 8 12.2 - - 8 -
Narrowbody Aircraft
Airbus A321 174 10 10.8 - - 5 5
Airbus A320 146 41 19.7 - - - 41
Airbus A319 120 38 14.6 13 10 9 6
EMBRAER 190 93 45 5.8 45 - - -
EMBRAER 175 73 15 7.3 15 - - -
Total 205 12.6 85 19 24 77
(1) Excludes aircraft that have been removed from service.
(2) Aircraft under finance leases and aircraft under lease from special purpose entities that are consolidated by Air Canada are carried on Air Canada’s consolidated statement of financial position.
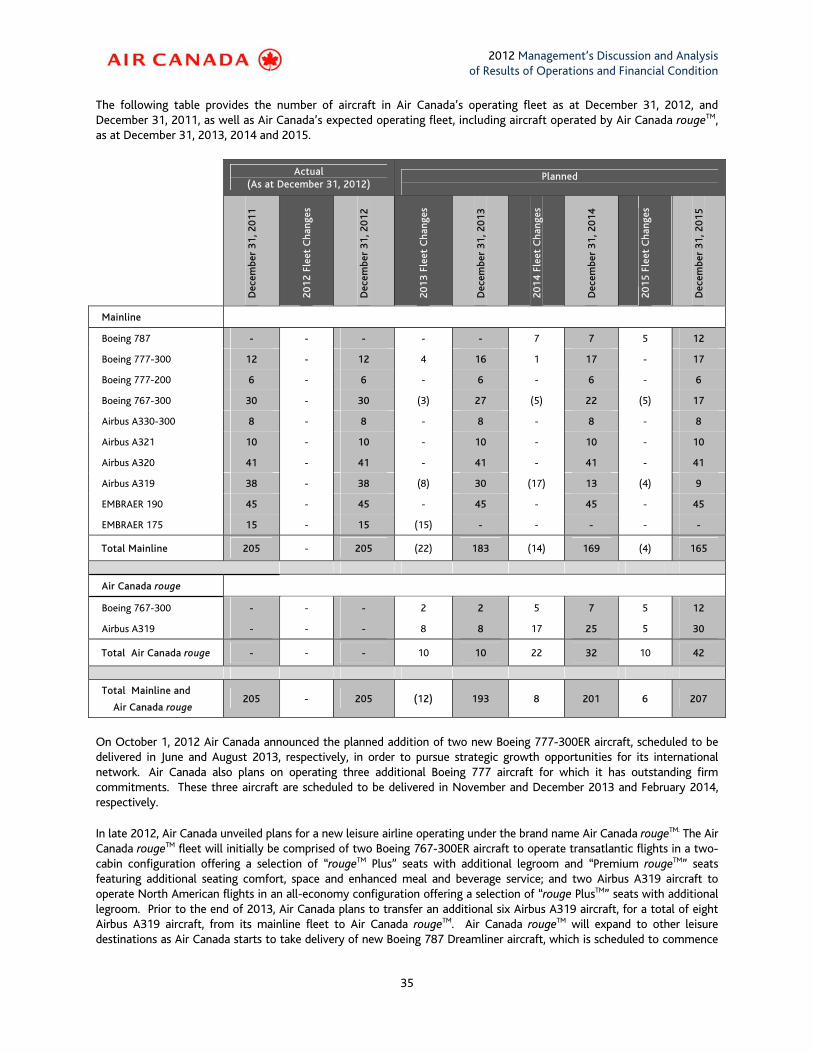
2012 Management’s Discussion and Analysis of Results of Operations and Financial Condition
35
The following table provides the number of aircraft in Air Canada’s operating fleet as at December 31, 2012, and December 31, 2011, as well as Air Canada’s expected operating fleet, including aircraft operated by Air Canada rougeTM, as at December 31, 2013, 2014 and 2015.
Actual
(As at December 31, 2012) Planned
D
ecem
ber
31
, 20
11
20
12
Fle
et C
han
ges
Dec
embe
r 3
1, 2
01
2
20
13
Fle
et C
han
ges
Dec
embe
r 3
1, 2
01
3
20
14
Fle
et C
han
ges
Dec
embe
r 3
1, 2
01
4
20
15
Fle
et C
han
ges
Dec
embe
r 3
1, 2
01
5
Mainline
Boeing 787 - - - - - 7 7 5 12
Boeing 777-300 12 - 12 4 16 1 17 - 17
Boeing 777-200 6 - 6 - 6 - 6 - 6
Boeing 767-300 30 - 30 (3) 27 (5) 22 (5) 17
Airbus A330-300 8 - 8 - 8 - 8 - 8
Airbus A321 10 - 10 - 10 - 10 - 10
Airbus A320 41 - 41 - 41 - 41 - 41
Airbus A319 38 - 38 (8) 30 (17) 13 (4) 9
EMBRAER 190 45 - 45 - 45 - 45 - 45
EMBRAER 175 15 - 15 (15) - - - - -
Total Mainline 205 - 205 (22) 183 (14) 169 (4) 165
Air Canada rouge
Boeing 767-300 - - - 2 2 5 7 5 12
Airbus A319 - - - 8 8 17 25 5 30
Total Air Canada rouge - - - 10 10 22 32 10 42
Total Mainline and
Air Canada rouge 205 - 205 (12) 193 8 201 6 207
On October 1, 2012 Air Canada announced the planned addition of two new Boeing 777-300ER aircraft, scheduled to be delivered in June and August 2013, respectively, in order to pursue strategic growth opportunities for its international network. Air Canada also plans on operating three additional Boeing 777 aircraft for which it has outstanding firm commitments. These three aircraft are scheduled to be delivered in November and December 2013 and February 2014, respectively.
In late 2012, Air Canada unveiled plans for a new leisure airline operating under the brand name Air Canada rougeTM. The Air Canada rougeTM fleet will initially be comprised of two Boeing 767-300ER aircraft to operate transatlantic flights in a two-cabin configuration offering a selection of “rougeTM Plus” seats with additional legroom and “Premium rougeTM” seats featuring additional seating comfort, space and enhanced meal and beverage service; and two Airbus A319 aircraft to operate North American flights in an all-economy configuration offering a selection of “rouge PlusTM” seats with additional legroom. Prior to the end of 2013, Air Canada plans to transfer an additional six Airbus A319 aircraft, for a total of eight Airbus A319 aircraft, from its mainline fleet to Air Canada rougeTM. Air Canada rougeTM will expand to other leisure destinations as Air Canada starts to take delivery of new Boeing 787 Dreamliner aircraft, which is scheduled to commence
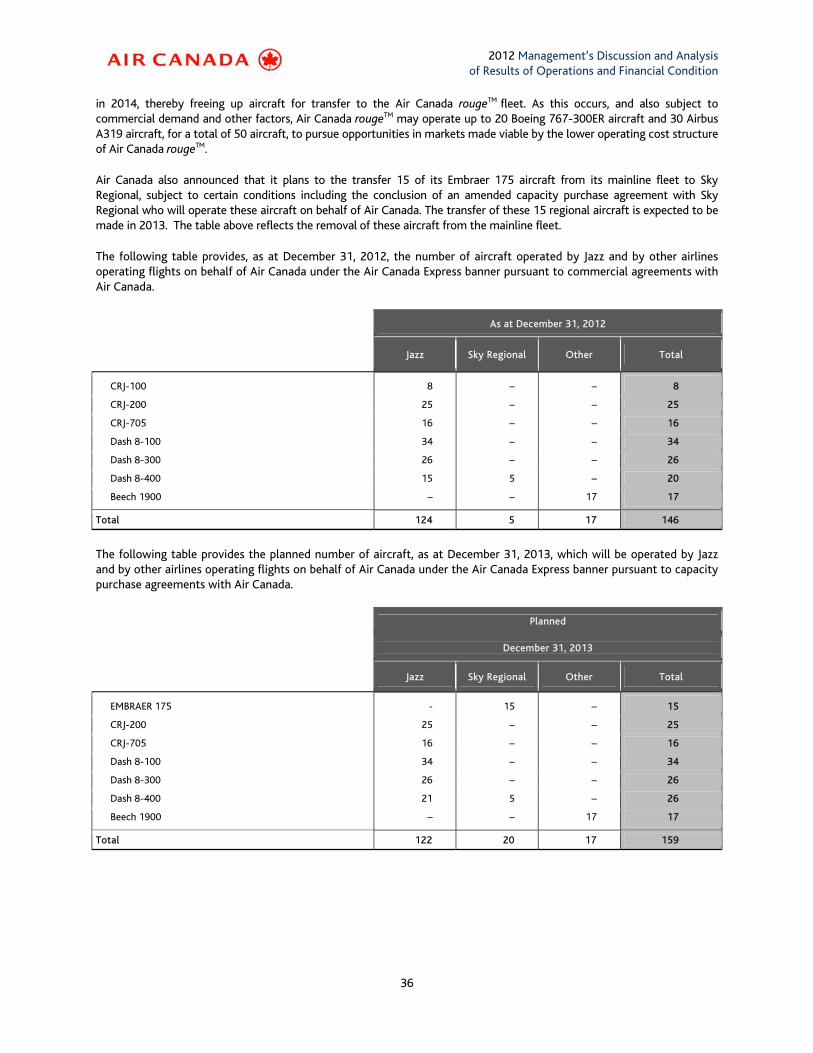
2012 Management’s Discussion and Analysis of Results of Operations and Financial Condition
36
in 2014, thereby freeing up aircraft for transfer to the Air Canada rougeTM fleet. As this occurs, and also subject to commercial demand and other factors, Air Canada rougeTM may operate up to 20 Boeing 767-300ER aircraft and 30 Airbus A319 aircraft, for a total of 50 aircraft, to pursue opportunities in markets made viable by the lower operating cost structure of Air Canada rougeTM.
Air Canada also announced that it plans to the transfer 15 of its Embraer 175 aircraft from its mainline fleet to Sky Regional, subject to certain conditions including the conclusion of an amended capacity purchase agreement with Sky Regional who will operate these aircraft on behalf of Air Canada. The transfer of these 15 regional aircraft is expected to be made in 2013. The table above reflects the removal of these aircraft from the mainline fleet.
The following table provides, as at December 31, 2012, the number of aircraft operated by Jazz and by other airlines operating flights on behalf of Air Canada under the Air Canada Express banner pursuant to commercial agreements with Air Canada.
As at December 31, 2012
Jazz Sky Regional Other Total
CRJ-100 8 – – 8
CRJ-200 25 – – 25
CRJ-705 16 – – 16
Dash 8-100 34 – – 34
Dash 8-300 26 – – 26
Dash 8-400 15 5 – 20
Beech 1900 – – 17 17
Total 124 5 17 146
The following table provides the planned number of aircraft, as at December 31, 2013, which will be operated by Jazz and by other airlines operating flights on behalf of Air Canada under the Air Canada Express banner pursuant to capacity purchase agreements with Air Canada.
Planned
December 31, 2013
Jazz Sky Regional Other Total
EMBRAER 175 - 15 – 15
CRJ-200 25 – – 25
CRJ-705 16 – – 16
Dash 8-100 34 – – 34
Dash 8-300 26 – – 26
Dash 8-400 21 5 – 26
Beech 1900 – – 17 17
Total 122 20 17 159
2012 Management’s Discussion and Analysis of Results of Operations and Financial Condition
37
The table above also reflects the transfer of 15 Embraer aircraft from the mainline fleet to Sky Regional which is expected to be made in 2013.
On July 12, 2012, Chorus Aviation Inc. (“Chorus”) announced that it had exercised six of 15 options it held to acquire additional Dash 8-400 (“Q400”) aircraft to be operated by its subsidiary, Jazz, under the Air Canada Express banner. Chorus announced that the six optioned 74-seat Q400 aircraft are contracted to be delivered at a rate of two per month in February, March and April 2013, and will be placed in operation the subsequent month. At that time, Chorus also announced that a total of nine 50-seat CRJ-100 aircraft would be removed from the Jazz fleet, one of which was removed in December 2012 with the remaining eight planned for removal by May 2013. As a result, as of May 2013, the number of covered aircraft under the Jazz CPA will be reduced to 122 aircraft, with the overall seating capacity, operated under the Jazz CPA, being held relatively constant.
In October 2012, Air Canada announced it was increasing capacity on regional routes across Western Canada in the fall and winter to meet demand and that it would gradually be introducing Q400 aircraft operated by Jazz under the Air Canada Express banner on key markets beginning in 2013. In early February 2013, the airline announced that Q400 service had begun between Calgary and Fort McMurray, Calgary and Regina and between Calgary and Saskatoon. Air Canada also announced it would continue to roll out Q400 aircraft on additional routes to British Columbia, Alberta and the Northwest Territories in the coming months and, in response to strong demand, it was also increasing capacity on key regional routes in Western Canada in the spring and summer of 2013 either through the use of larger aircraft or with additional frequencies.
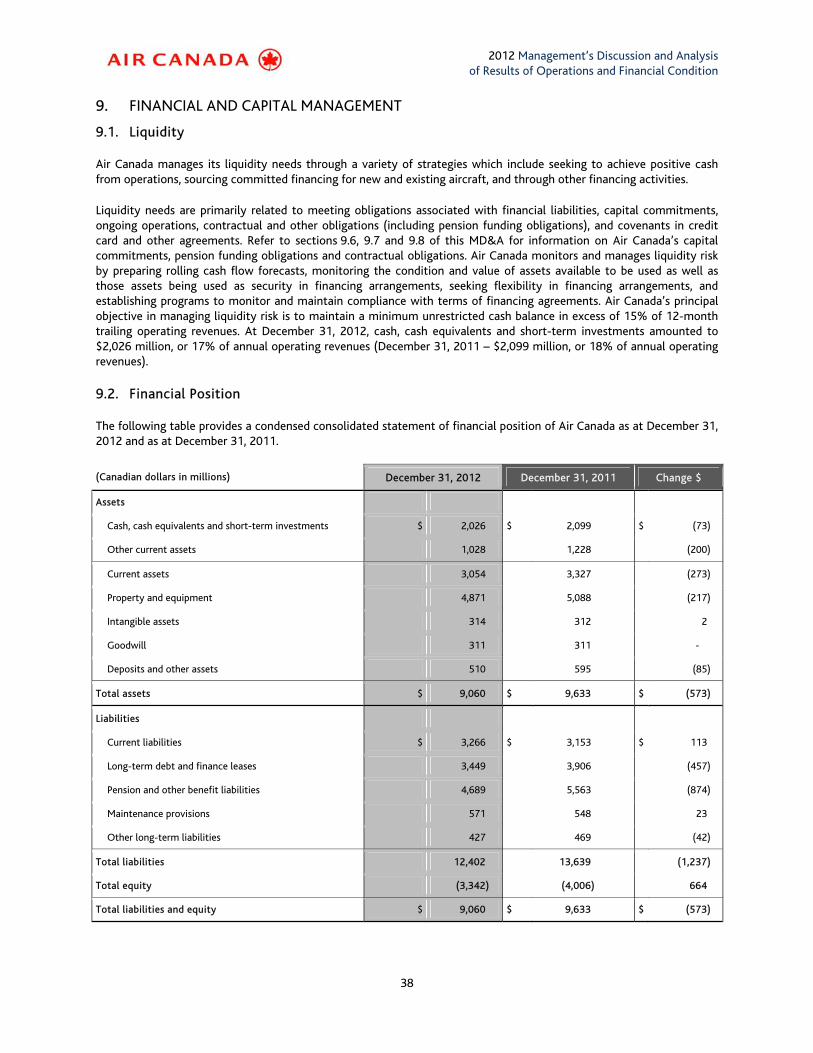
2012 Management’s Discussion and Analysis of Results of Operations and Financial Condition
38
9. FINANCIAL AND CAPITAL MANAGEMENT
9.1. Liquidity
Air Canada manages its liquidity needs through a variety of strategies which include seeking to achieve positive cash from operations, sourcing committed financing for new and existing aircraft, and through other financing activities.
Liquidity needs are primarily related to meeting obligations associated with financial liabilities, capital commitments, ongoing operations, contractual and other obligations (including pension funding obligations), and covenants in credit card and other agreements. Refer to sections 9.6, 9.7 and 9.8 of this MD&A for information on Air Canada’s capital commitments, pension funding obligations and contractual obligations. Air Canada monitors and manages liquidity risk by preparing rolling cash flow forecasts, monitoring the condition and value of assets available to be used as well as those assets being used as security in financing arrangements, seeking flexibility in financing arrangements, and establishing programs to monitor and maintain compliance with terms of financing agreements. Air Canada’s principal objective in managing liquidity risk is to maintain a minimum unrestricted cash balance in excess of 15% of 12-month trailing operating revenues. At December 31, 2012, cash, cash equivalents and short-term investments amounted to $2,026 million, or 17% of annual operating revenues (December 31, 2011 – $2,099 million, or 18% of annual operating revenues).
9.2. Financial Position
The following table provides a condensed consolidated statement of financial position of Air Canada as at December 31, 2012 and as at December 31, 2011.
(Canadian dollars in millions) December 31, 2012 December 31, 2011 Change $
Assets
Cash, cash equivalents and short-term investments $ 2,026 $ 2,099 $ (73)
Other current assets 1,028 1,228 (200)
Current assets 3,054 3,327 (273)
Property and equipment 4,871 5,088 (217)
Intangible assets 314 312 2
Goodwill 311 311 -
Deposits and other assets 510 595 (85)
Total assets $ 9,060 $ 9,633 $ (573)
Liabilities
Current liabilities $ 3,266 $ 3,153 $ 113
Long-term debt and finance leases 3,449 3,906 (457)
Pension and other benefit liabilities 4,689 5,563 (874)
Maintenance provisions 571 548 23
Other long-term liabilities 427 469 (42)
Total liabilities 12,402 13,639 (1,237)
Total equity (3,342) (4,006) 664
Total liabilities and equity $ 9,060 $ 9,633 $ (573)
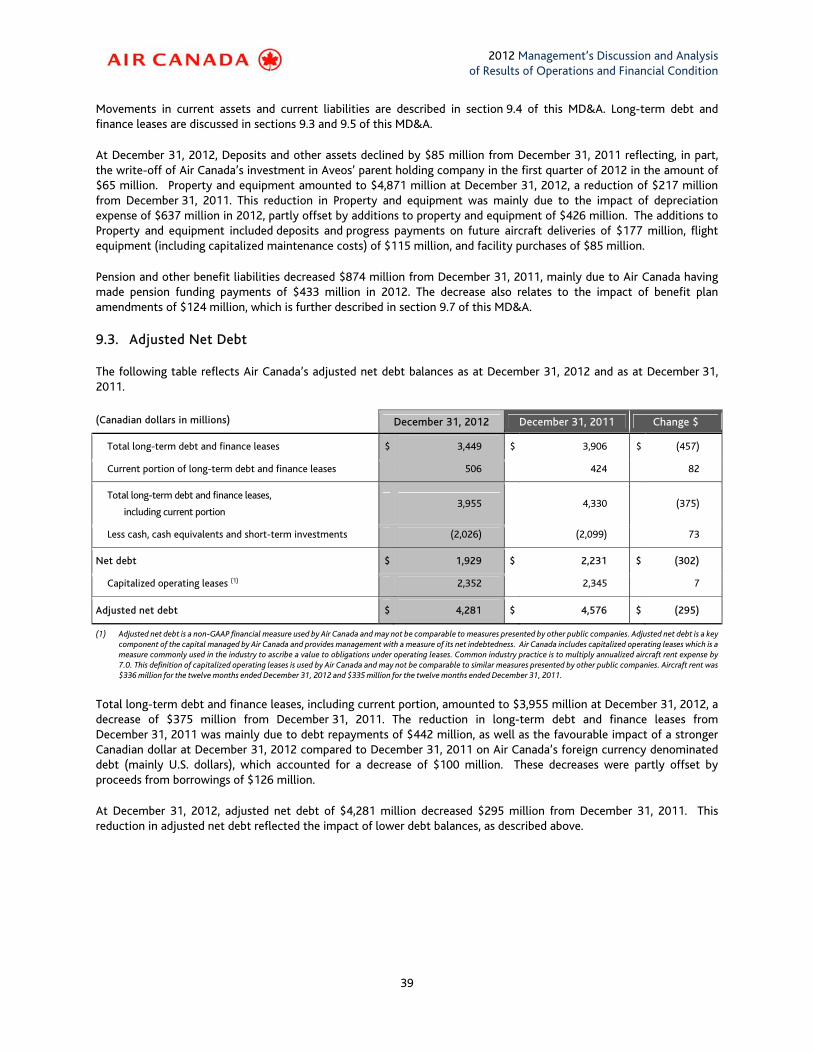
2012 Management’s Discussion and Analysis of Results of Operations and Financial Condition
39
Movements in current assets and current liabilities are described in section 9.4 of this MD&A. Long-term debt and finance leases are discussed in sections 9.3 and 9.5 of this MD&A.
At December 31, 2012, Deposits and other assets declined by $85 million from December 31, 2011 reflecting, in part, the write-off of Air Canada’s investment in Aveos’ parent holding company in the first quarter of 2012 in the amount of $65 million. Property and equipment amounted to $4,871 million at December 31, 2012, a reduction of $217 million from December 31, 2011. This reduction in Property and equipment was mainly due to the impact of depreciation expense of $637 million in 2012, partly offset by additions to property and equipment of $426 million. The additions to Property and equipment included deposits and progress payments on future aircraft deliveries of $177 million, flight equipment (including capitalized maintenance costs) of $115 million, and facility purchases of $85 million.
Pension and other benefit liabilities decreased $874 million from December 31, 2011, mainly due to Air Canada having made pension funding payments of $433 million in 2012. The decrease also relates to the impact of benefit plan amendments of $124 million, which is further described in section 9.7 of this MD&A.
9.3. Adjusted Net Debt
The following table reflects Air Canada’s adjusted net debt balances as at December 31, 2012 and as at December 31, 2011.
(Canadian dollars in millions) December 31, 2012 December 31, 2011 Change $
Total long-term debt and finance leases $ 3,449 $ 3,906 $ (457)
Current portion of long-term debt and finance leases 506 424 82
Total long-term debt and finance leases,
including current portion 3,955 4,330 (375)
Less cash, cash equivalents and short-term investments (2,026) (2,099) 73
Net debt $ 1,929 $ 2,231 $ (302)
Capitalized operating leases (1) 2,352 2,345 7
Adjusted net debt $ 4,281 $ 4,576 $ (295)
(1) Adjusted net debt is a non-GAAP financial measure used by Air Canada and may not be comparable to measures presented by other public companies. Adjusted net debt is a key component of the capital managed by Air Canada and provides management with a measure of its net indebtedness. Air Canada includes capitalized operating leases which is a measure commonly used in the industry to ascribe a value to obligations under operating leases. Common industry practice is to multiply annualized aircraft rent expense by 7.0. This definition of capitalized operating leases is used by Air Canada and may not be comparable to similar measures presented by other public companies. Aircraft rent was $336 million for the twelve months ended December 31, 2012 and $335 million for the twelve months ended December 31, 2011.
Total long-term debt and finance leases, including current portion, amounted to $3,955 million at December 31, 2012, a decrease of $375 million from December 31, 2011. The reduction in long-term debt and finance leases from December 31, 2011 was mainly due to debt repayments of $442 million, as well as the favourable impact of a stronger Canadian dollar at December 31, 2012 compared to December 31, 2011 on Air Canada’s foreign currency denominated debt (mainly U.S. dollars), which accounted for a decrease of $100 million. These decreases were partly offset by proceeds from borrowings of $126 million.
At December 31, 2012, adjusted net debt of $4,281 million decreased $295 million from December 31, 2011. This reduction in adjusted net debt reflected the impact of lower debt balances, as described above.

2012 Management’s Discussion and Analysis of Results of Operations and Financial Condition
40
9.4. Working Capital
The following table provides information on Air Canada’s working capital balances at December 31, 2012 and at December 31, 2011.
(Canadian dollars in millions) December 31, 2012 December 31, 2011 Change $
Cash and short-term investments $ 2,026 $ 2,099 $ (73)
Accounts receivable 550 712 (162)
Other current assets 478 516 (38)
Accounts payable and accrued liabilities (1,161) (1,175) 14
Advance ticket sales (1,599) (1,554) (45)
Current portion of long-term debt and finance leases (506) (424) (82)
Net working capital $ (212) $ 174 $ (386)
The net negative working capital of $212 million at December 31, 2012 represented a deterioration of $386 million from December 31, 2011. This decline in net working capital was largely due to the impact of capital expenditures of $462 million, pension funding payments of $433 million, and an increase in the current portion of long-term debt reflecting a higher level of debt maturities in 2013. Partly offsetting these decreases was the impact of positive cash flows from operating activities of $649 million. The decrease in Accounts receivable of $162 million was mainly due to the reporting of accounts receivable from Aveos net against related accounts payable following Aveos’ closure in the first quarter of 2012, as well as decreases in tax- related and other receivables.
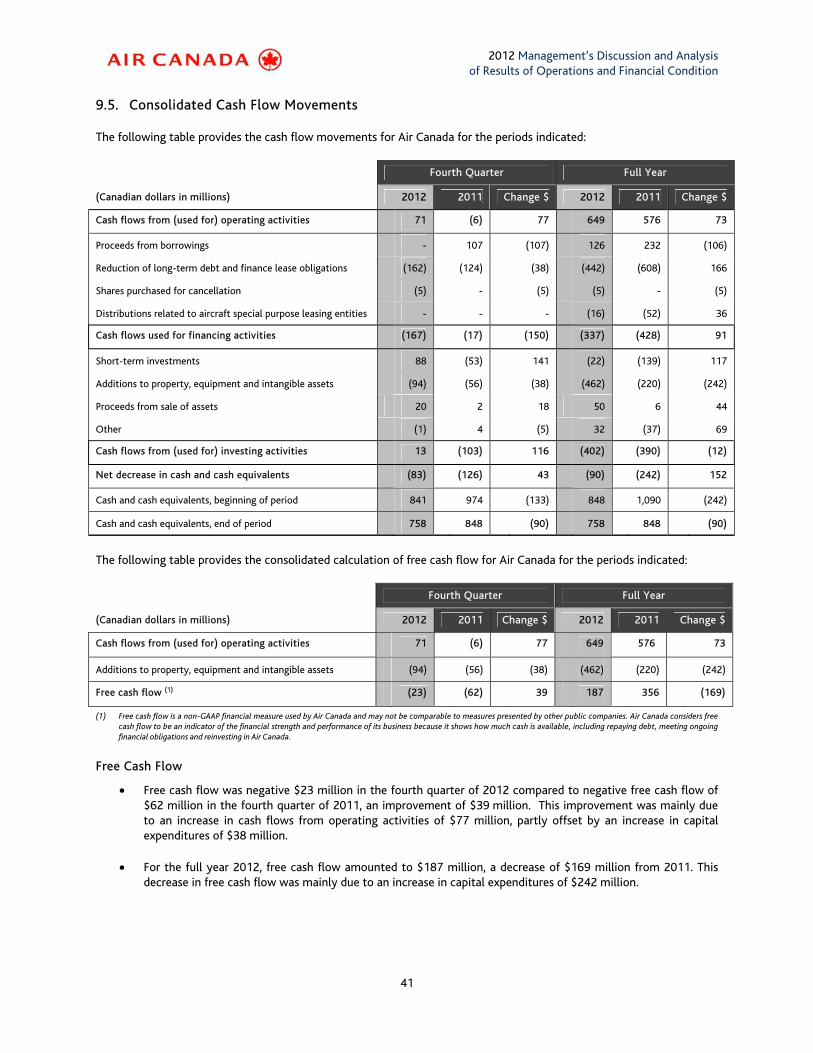
2012 Management’s Discussion and Analysis of Results of Operations and Financial Condition
41
9.5. Consolidated Cash Flow Movements
The following table provides the cash flow movements for Air Canada for the periods indicated:
Fourth Quarter Full Year
(Canadian dollars in millions) 2012 2011 Change $ 2012 2011 Change $
Cash flows from (used for) operating activities 71 (6) 77 649
576 73
Proceeds from borrowings - 107 (107) 126 232 (106)
Reduction of long-term debt and finance lease obligations (162) (124) (38) (442) (608) 166
Shares purchased for cancellation (5) - (5) (5) - (5)
Distributions related to aircraft special purpose leasing entities - - - (16) (52) 36
Cash flows used for financing activities (167) (17) (150) (337)
(428) 91
Short-term investments 88 (53) 141 (22) (139) 117
Additions to property, equipment and intangible assets (94) (56) (38) (462) (220) (242)
Proceeds from sale of assets 20 2 18 50 6 44
Other (1) 4 (5) 32 (37) 69
Cash flows from (used for) investing activities 13 (103) 116 (402)
(390) (12)
Net decrease in cash and cash equivalents (83) (126) 43 (90)
(242) 152
Cash and cash equivalents, beginning of period 841 974 (133) 848 1,090 (242)
Cash and cash equivalents, end of period 758 848 (90) 758 848 (90)
The following table provides the consolidated calculation of free cash flow for Air Canada for the periods indicated:
Fourth Quarter Full Year
(Canadian dollars in millions) 2012 2011 Change $ 2012 2011 Change $
Cash flows from (used for) operating activities 71 (6) 77 649 576 73
Additions to property, equipment and intangible assets (94) (56) (38) (462) (220) (242)
Free cash flow (1) (23) (62) 39 187 356 (169)
(1) Free cash flow is a non-GAAP financial measure used by Air Canada and may not be comparable to measures presented by other public companies. Air Canada considers free cash flow to be an indicator of the financial strength and performance of its business because it shows how much cash is available, including repaying debt, meeting ongoing financial obligations and reinvesting in Air Canada.
Free Cash Flow
• Free cash flow was negative $23 million in the fourth quarter of 2012 compared to negative free cash flow of $62 million in the fourth quarter of 2011, an improvement of $39 million. This improvement was mainly due to an increase in cash flows from operating activities of $77 million, partly offset by an increase in capital expenditures of $38 million.
• For the full year 2012, free cash flow amounted to $187 million, a decrease of $169 million from 2011. This decrease in free cash flow was mainly due to an increase in capital expenditures of $242 million.
2012 Management’s Discussion and Analysis of Results of Operations and Financial Condition
42
Cash from (used for) operating activities
• Cash from operations for the fourth quarter 2012 of $71 million improved $77 million versus the fourth quarter of 2011. This increase was driven by the stronger earnings performance in the fourth quarter of 2012.
• Cash from operations for the full year 2012 of $649 million improved $73 million versus the full year 2011. This increase was also driven by the higher earnings performance year-over-year as well as improvements in cash provided by working capital. Partially offsetting these improvements was the impact of higher pension payments, with payments to Air Canada’s pension plans of $433 million in 2012, $48 million higher than 2011 levels. In addition, cash premiums paid on fuel derivatives, net of hedge settlements, reflected an outflow of $48 million in 2012 versus a net outflow of $4 million in 2011.
Cash used for financing activities
• Air Canada continued its focus to reduce its debt levels with net debt repayments (reduction of long-term debt less proceeds from borrowings) of $162 million in the fourth quarter of 2012 and $316 million in the full year 2012.
• In 2012, proceeds from borrowings amounted to $126 million, which included net financing proceeds of $41 million under a credit agreement to refinance amounts related to four Airbus A319 aircraft, with refinanced terms of five years, as well as additional draws of $82 million under a revolving loan facility.
• Cash of $5 million was used during the fourth quarter of 2012 to repurchase and cancel 3,019,600 shares under Air Canada’s normal course issuer bid which expired on December 11, 2012. Refer to section 9.9 of this MD&A for additional information.
Cash from (used for) investing activities
• Capital expenditures of $462 million for the full year 2012 increased $242 million over 2011. This increase was primarily related to the ongoing purchase deposit payments on committed Boeing 777 and 787 aircraft, as described in section 9.6 of this MD&A.
9.6. Capital Expenditures and Related Financing Arrangements
Boeing
Air Canada has outstanding purchase commitments with The Boeing Company (“Boeing”) for the acquisition of 37 Boeing 787 aircraft. The first seven deliveries are scheduled for 2014 and the remaining 30 between 2015 and 2019. Air Canada also has purchase options for 13 Boeing 787 aircraft (entitling Air Canada to purchase aircraft based on previously determined pricing and delivery positions), and purchase rights for 10 Boeing 787 aircraft (entitling Air Canada to purchase aircraft based on Boeing’s then current pricing).
Air Canada has financing commitments from Boeing and the engine manufacturer covering 31 of the 37 Boeing 787 firm aircraft orders. The financing terms for 28 out of the 31 covered aircraft is for 80% of the aircraft delivery price and the term to maturity is 12 years with straight-line principal repayments. For the remaining three out of the 31 covered aircraft, the financing under the commitment covers up to 90% of the capital expenditure and the term to maturity is 15 years with principal payments made on a mortgage style basis resulting in equal installment payments of principal and interest over the term to maturity.
In addition, Air Canada has outstanding purchase commitments for the acquisition of five Boeing 777 aircraft, all of which will be added to Air Canada’s mainline fleet in the second half of 2013 and the first half of 2014. Air Canada also has purchase rights for 13 Boeing 777 (entitling Air Canada to purchase aircraft based on previously determined pricing). Air Canada is evaluating financing alternatives in the approximate range of $550 million to $650 million, covering all five aircraft. The impact of such financing is not reflected in the table below.
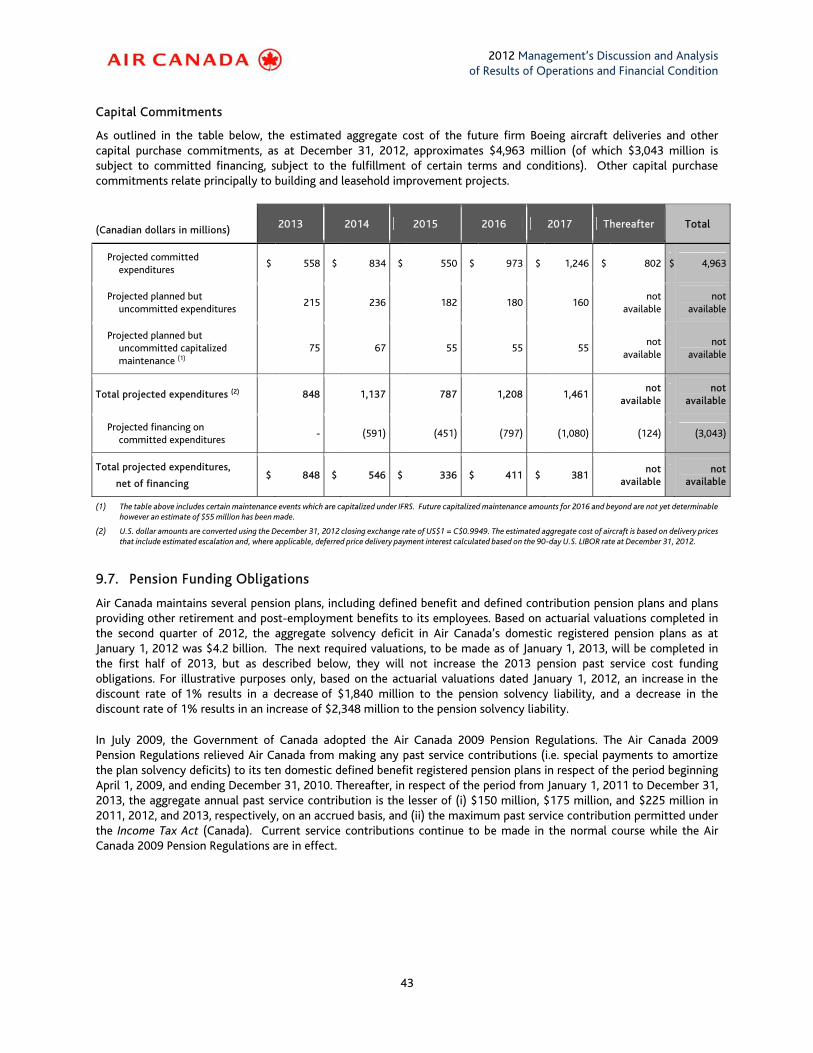
2012 Management’s Discussion and Analysis of Results of Operations and Financial Condition
43
Capital Commitments
As outlined in the table below, the estimated aggregate cost of the future firm Boeing aircraft deliveries and other capital purchase commitments, as at December 31, 2012, approximates $4,963 million (of which $3,043 million is subject to committed financing, subject to the fulfillment of certain terms and conditions). Other capital purchase commitments relate principally to building and leasehold improvement projects.
(Canadian dollars in millions) 2013 2014 2015 2016 2017 Thereafter Total
Projected committed expenditures
$ 558 $ 834 $ 550 $ 973 $ 1,246 $ 802 $ 4,963
Projected planned but uncommitted expenditures
215 236 182 180 160 not
availablenot
available
Projected planned but uncommitted capitalized maintenance (1)
75 67 55 55 55 not
availablenot
available
Total projected expenditures (2) 848 1,137 787 1,208 1,461 not
availablenot
available
Projected financing on committed expenditures
- (591) (451) (797) (1,080) (124) (3,043)
Total projected expenditures,
net of financing $ 848 $ 546 $ 336 $ 411 $ 381
not available
not available
(1) The table above includes certain maintenance events which are capitalized under IFRS. Future capitalized maintenance amounts for 2016 and beyond are not yet determinable however an estimate of $55 million has been made.
(2) U.S. dollar amounts are converted using the December 31, 2012 closing exchange rate of US$1 = C$0.9949. The estimated aggregate cost of aircraft is based on delivery prices that include estimated escalation and, where applicable, deferred price delivery payment interest calculated based on the 90-day U.S. LIBOR rate at December 31, 2012.
9.7. Pension Funding Obligations
Air Canada maintains several pension plans, including defined benefit and defined contribution pension plans and plans providing other retirement and post-employment benefits to its employees. Based on actuarial valuations completed in the second quarter of 2012, the aggregate solvency deficit in Air Canada’s domestic registered pension plans as at January 1, 2012 was $4.2 billion. The next required valuations, to be made as of January 1, 2013, will be completed in the first half of 2013, but as described below, they will not increase the 2013 pension past service cost funding obligations. For illustrative purposes only, based on the actuarial valuations dated January 1, 2012, an increase in the discount rate of 1% results in a decrease of $1,840 million to the pension solvency liability, and a decrease in the discount rate of 1% results in an increase of $2,348 million to the pension solvency liability.
In July 2009, the Government of Canada adopted the Air Canada 2009 Pension Regulations. The Air Canada 2009 Pension Regulations relieved Air Canada from making any past service contributions (i.e. special payments to amortize the plan solvency deficits) to its ten domestic defined benefit registered pension plans in respect of the period beginning April 1, 2009, and ending December 31, 2010. Thereafter, in respect of the period from January 1, 2011 to December 31, 2013, the aggregate annual past service contribution is the lesser of (i) $150 million, $175 million, and $225 million in 2011, 2012, and 2013, respectively, on an accrued basis, and (ii) the maximum past service contribution permitted under the Income Tax Act (Canada). Current service contributions continue to be made in the normal course while the Air Canada 2009 Pension Regulations are in effect.
2012 Management’s Discussion and Analysis of Results of Operations and Financial Condition
44
After consideration of the effect of the Air Canada 2009 Pension Regulations, as outlined above, total employer pension funding contributions in 2012 amounted to $433 million.
(Canadian dollars in millions) 2012 2011
Past service domestic registered plans $ 173 $ 138
Current service domestic registered plans 169 171
Other pension arrangements(1) 91 76
Pension funding obligations $ 433 $ 385
(1) Includes retirement compensation arrangements, supplemental plans and international plans.
Pension funding obligations are generally dependent on a number of factors, including the assumptions used in the most recently filed actuarial valuation reports for current service (including the applicable discount rate used or assumed in the actuarial valuation), the plan demographics at the valuation date, the existing plan provisions, existing pension legislation and changes in economic conditions (mainly the return on fund assets and changes in interest rates). Actual contributions that are determined on the basis of future valuation reports filed annually may vary significantly from projections. In addition to changes in plan demographics and experience, actuarial assumptions and methods may be changed from one valuation to the next, including due to changes in plan experience, financial markets, future expectations, and changes in legislation and other factors. Until the end of 2013, Air Canada’s past service pension funding obligations are limited by the Air Canada 2009 Pension Regulations.
As of 2014, the Air Canada 2009 Pension Regulations will cease to have effect. Air Canada has, with the support of its five main Canadian labour groups, entered into discussions with the federal government with the purpose of requesting an extension of pension funding relief which would cap annual pension funding contributions at acceptable levels. There can be no assurances that extended or new pension funding relief will be available and any such relief would be subject to the passing of regulations by the federal government.
Absent the adoption and implementation of new rules establishing funding requirements within defined parameters applicable specifically to Air Canada, under generally applicable regulations, Air Canada's pension funding obligations may vary significantly based on a wide variety of factors, including those described above as well as the application of normal past service contribution rules which would generally require one fifth of any solvency deficit, determined on the basis of an average over the previous three years, to be funded each year in addition to required current service contributions.
Air Canada's projected pension funding obligations, on a cash basis, for 2013, are provided in the table below.
(Canadian dollars in millions) 2013
Past service domestic registered plans $ 221
Current service domestic registered plans 170
Other pension arrangements(1) 80
Projected pension funding obligations $ 471
(1) Includes retirement compensation arrangements, supplemental plans and international plans.
Amendments to the Defined Benefit Pension Plans
In 2011, collective agreements were concluded and ratified and/or conclusively settled through arbitration with the CAW and with CUPE. The agreements include amendments to the defined benefit pension plans for CAW and CUPE represented plan members, which are subject to regulatory approval and will be accounted for at the time this approval is received. In addition, a hybrid pension regime consisting of defined contribution and defined benefit components applies to new employees represented by the CAW and CUPE, hired after the date of ratification, for CAW, and the coming into force, for CUPE, of the new agreements.
2012 Management’s Discussion and Analysis of Results of Operations and Financial Condition
45
As described below, collective agreements obtained through arbitration with the International Association of Machinists and Aerospace Workers (“IAMAW”) and ACPA, and collective agreements concluded with the CAW in respect of crew schedulers and with the Canadian Airline Dispatchers Association (“CALDA”) in 2012 also include amendments to the defined benefit pension plans for represented plan members. Similar amendments will also be made to the defined benefit pension plans applicable to management and other non-unionized employees, which are also subject to regulatory approval. Based on the actuarial valuations of January 1, 2012, Air Canada has estimated that these changes in the aggregate would result in a decline of approximately $1.1 billion to the solvency deficit in its domestic registered pension plans, had these amendments been implemented on January 1, 2012. Such amendments, which remain subject to regulatory approval by OSFI, would take effect on January 1, 2014. The reduction to the solvency deficit will reduce the pension benefit obligation recorded on Air Canada’s consolidated statement of financial position and will be accounted for at the time these approvals are received. However, the final accounting impact has not yet been determined. The accounting impact of such benefit reductions would be in addition to the operating expense reduction of $124 million recorded in 2012 in Benefit plan amendments on Air Canada’s consolidated statement of operations.
In June 2012, Air Canada and IAMAW received the decision of the arbitrator in the final offer selection arbitration conducted in accordance with the process legislated by the federal government in the Protecting Air Service Act. The arbitrator’s final offer selection concludes a new five-year collective agreement with the IAMAW which is in effect until March 31, 2016. The new collective agreement preserves the defined benefit pension plans for current employees and introduces a new IAMAW multi-employer pension plan to which, subject to certain conditions, Air Canada will become a party for new employees hired after the date of the decision. This new IAMAW multi-employer pension plan will be accounted for as a defined contribution plan as Air Canada’s contributions are limited to the amount determined in accordance with the new collective agreement. The collective agreement also includes amendments to the defined benefit pension plans of current IAMAW members which are subject to regulatory approval by OSFI and will be accounted for at the time this approval is received.
On July 30, 2012, Air Canada and ACPA received the decision of the arbitrator in the final offer selection arbitration conducted in accordance with the Protecting Air Service Act. The arbitrator's final offer selection concludes a new five-year collective agreement with ACPA which is in effect until April 1, 2016. This new collective agreement preserves defined benefit pension plans for current employees and introduces a defined contribution pension plan for new employees hired after July 30, 2012. As disclosed above, the collective agreement also includes amendments to the defined benefit pension plans of current ACPA members which are subject to regulatory approval by OSFI and will be accounted for at the time this approval is received. In addition, the new ACPA collective agreement contemplates pilots working past age 60, which was the age of mandatory retirement in the previous collective agreement. As a result of these changes to retirement age, which are not subject to regulatory approval, as disclosed above, Air Canada recorded an operating expense reduction of $124 million in Benefit plan amendments in the third quarter of 2012 related to the impact of those amendments on pension and other employee benefit liabilities. By virtue of its size and incidence, this item is separately disclosed on Air Canada’s consolidated statement of operations.
In 2012, Air Canada concluded agreements with the CAW in respect of crew schedulers and with the Canadian Airline Dispatchers Association (“CALDA”). The new collective agreements also include amendments to the defined benefit pension plans of crew schedulers and CALDA members which are subject to regulatory approval and will be accounted for at the time this approval is received. In addition, a hybrid pension regime consisting of a defined contribution and a defined benefit plan applies to new crew schedulers employees hired after the date of ratification of the new agreements. For CALDA employees, the new pension arrangement for new hires is a defined contribution plan.
In June 2012, Air Canada also concluded an agreement with Aimia Canada Inc. (formerly Aeroplan) through which Air Canada will transfer to the Aeroplan defined benefit pension plan all the pension plan assets and obligations related to pension benefits accrued by CAW-represented employees who were Air Canada employees and who chose to transition to employment at Aeroplan in 2009. The transfer is subject to the approval of OSFI but the 2012 actuarial valuations assume that the transfer has been made. Based on the most recent actuarial valuation report, the solvency deficit and related compensation for transferred employees is not material.
2012 Management’s Discussion and Analysis of Results of Operations and Financial Condition
46
Pension and Benefits Agreement with Aveos
On June 22, 2007, Air Canada and Aveos entered into a Pension and Benefits Agreement covering the transfer of certain pension and benefit assets and obligations to Aveos. On July 14, 2011 (the “Certification Date”), certain unionized employees of Air Canada elected to become employees of Aveos. The Pension and Benefits Agreement provided that, subject to regulatory approval by OSFI, where required, the assets and obligations under the pension, other post-retirement and post-employment benefits plans pertaining to the transferred unionized employees would be transferred to Aveos, with Air Canada providing compensation payments to be paid quarterly to Aveos over a period not exceeding five years once determined after the transfer. In 2012, OSFI ordered the termination of Aveos’ defined benefit pension plans and, as a result, the assets and liabilities, accruing prior to the Certification Date in respect of transferred employees will remain under Air Canada’s pension plans. In addition, obligations under the other post-retirement and post-employment benefits plans pertaining to the transferred unionized employees, for accounting purposes, continue to be included in Air Canada’s consolidated financial statements but their final determination may be subject to Aveos’ CCAA proceedings.
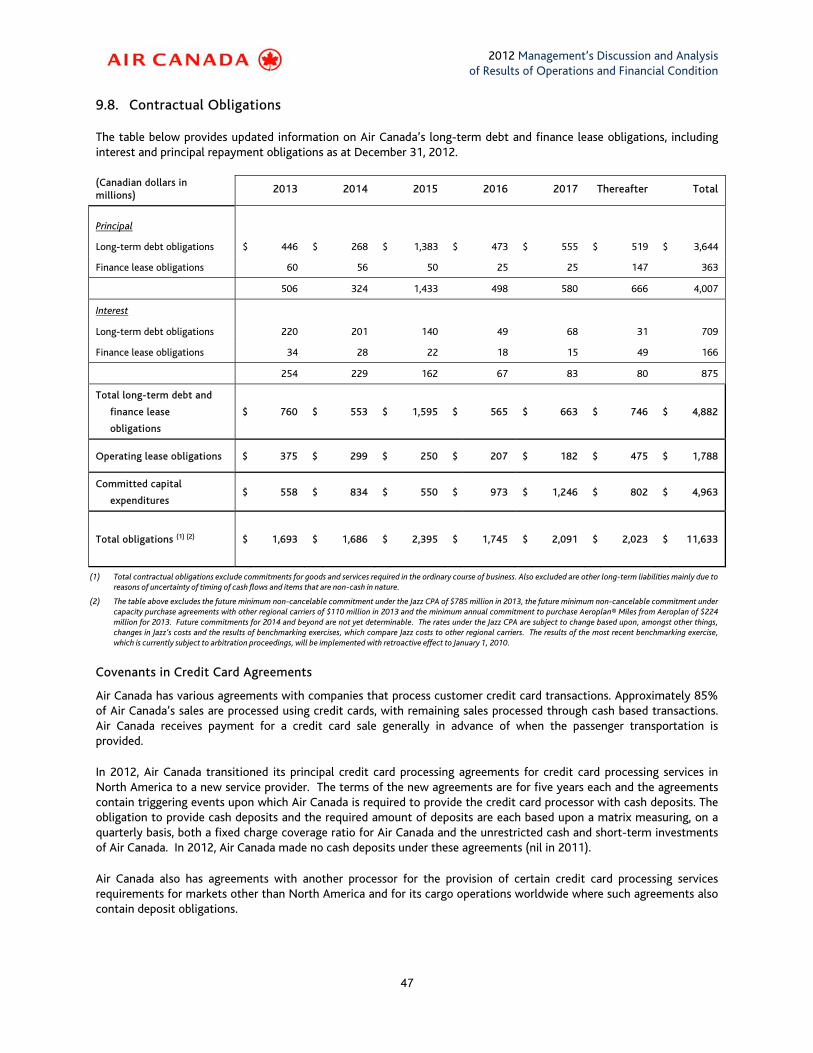
2012 Management’s Discussion and Analysis of Results of Operations and Financial Condition
47
9.8. Contractual Obligations
The table below provides updated information on Air Canada’s long-term debt and finance lease obligations, including interest and principal repayment obligations as at December 31, 2012.
(Canadian dollars in millions)
2013 2014 2015 2016 2017 Thereafter Total
Principal
Long-term debt obligations $ 446 $ 268 $ 1,383 $ 473 $ 555 $ 519 $ 3,644
Finance lease obligations 60 56 50 25 25 147 363
506 324 1,433 498 580 666 4,007
Interest
Long-term debt obligations 220 201 140 49 68 31 709
Finance lease obligations 34 28 22 18 15 49 166
254 229 162 67 83 80 875
Total long-term debt and
finance lease
obligations
$ 760 $ 553 $ 1,595 $ 565 $ 663 $ 746 $ 4,882
Operating lease obligations $ 375 $ 299 $ 250 $ 207 $ 182 $ 475 $ 1,788
Committed capital
expenditures $ 558 $ 834 $ 550 $ 973 $ 1,246 $ 802 $ 4,963
Total obligations (1) (2)
$ 1,693 $ 1,686 $ 2,395 $ 1,745 $ 2,091 $ 2,023 $ 11,633
(1) Total contractual obligations exclude commitments for goods and services required in the ordinary course of business. Also excluded are other long-term liabilities mainly due to reasons of uncertainty of timing of cash flows and items that are non-cash in nature.
(2) The table above excludes the future minimum non-cancelable commitment under the Jazz CPA of $785 million in 2013, the future minimum non-cancelable commitment under capacity purchase agreements with other regional carriers of $110 million in 2013 and the minimum annual commitment to purchase Aeroplan® Miles from Aeroplan of $224 million for 2013. Future commitments for 2014 and beyond are not yet determinable. The rates under the Jazz CPA are subject to change based upon, amongst other things, changes in Jazz’s costs and the results of benchmarking exercises, which compare Jazz costs to other regional carriers. The results of the most recent benchmarking exercise, which is currently subject to arbitration proceedings, will be implemented with retroactive effect to January 1, 2010.
Covenants in Credit Card Agreements
Air Canada has various agreements with companies that process customer credit card transactions. Approximately 85% of Air Canada’s sales are processed using credit cards, with remaining sales processed through cash based transactions. Air Canada receives payment for a credit card sale generally in advance of when the passenger transportation is provided.
In 2012, Air Canada transitioned its principal credit card processing agreements for credit card processing services in North America to a new service provider. The terms of the new agreements are for five years each and the agreements contain triggering events upon which Air Canada is required to provide the credit card processor with cash deposits. The obligation to provide cash deposits and the required amount of deposits are each based upon a matrix measuring, on a quarterly basis, both a fixed charge coverage ratio for Air Canada and the unrestricted cash and short-term investments of Air Canada. In 2012, Air Canada made no cash deposits under these agreements (nil in 2011).
Air Canada also has agreements with another processor for the provision of certain credit card processing services requirements for markets other than North America and for its cargo operations worldwide where such agreements also contain deposit obligations.
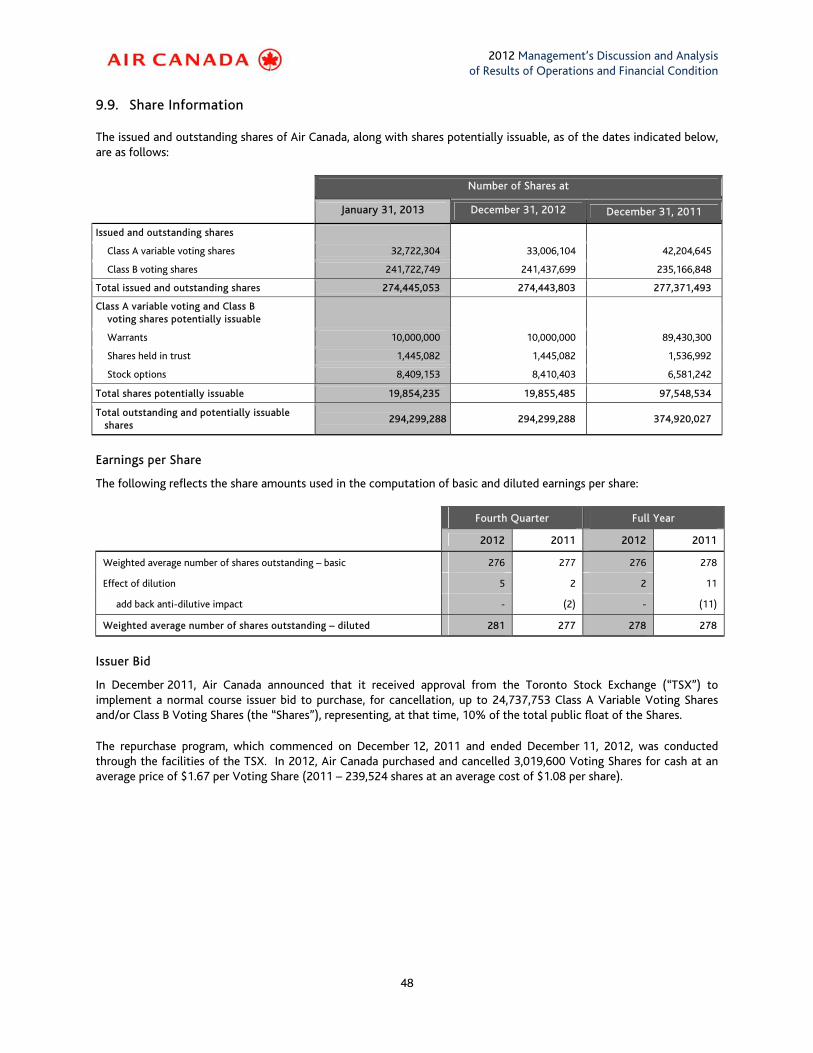
2012 Management’s Discussion and Analysis of Results of Operations and Financial Condition
48
9.9. Share Information
The issued and outstanding shares of Air Canada, along with shares potentially issuable, as of the dates indicated below, are as follows:
Number of Shares at
January 31, 2013 December 31, 2012 December 31, 2011
Issued and outstanding shares
Class A variable voting shares 32,722,304 33,006,104 42,204,645
Class B voting shares 241,722,749 241,437,699 235,166,848
Total issued and outstanding shares 274,445,053 274,443,803 277,371,493
Class A variable voting and Class B voting shares potentially issuable
Warrants 10,000,000 10,000,000 89,430,300
Shares held in trust 1,445,082 1,445,082 1,536,992
Stock options 8,409,153 8,410,403 6,581,242
Total shares potentially issuable 19,854,235 19,855,485 97,548,534
Total outstanding and potentially issuable shares
294,299,288 294,299,288 374,920,027
Earnings per Share
The following reflects the share amounts used in the computation of basic and diluted earnings per share:
Fourth Quarter Full Year
2012 2011 2012 2011
Weighted average number of shares outstanding – basic 276 277 276 278
Effect of dilution 5 2 2 11
add back anti-dilutive impact - (2) - (11)
Weighted average number of shares outstanding – diluted 281 277 278 278
Issuer Bid
In December 2011, Air Canada announced that it received approval from the Toronto Stock Exchange (“TSX”) to implement a normal course issuer bid to purchase, for cancellation, up to 24,737,753 Class A Variable Voting Shares and/or Class B Voting Shares (the “Shares”), representing, at that time, 10% of the total public float of the Shares.
The repurchase program, which commenced on December 12, 2011 and ended December 11, 2012, was conducted through the facilities of the TSX. In 2012, Air Canada purchased and cancelled 3,019,600 Voting Shares for cash at an average price of $1.67 per Voting Share (2011 – 239,524 shares at an average cost of $1.08 per share).
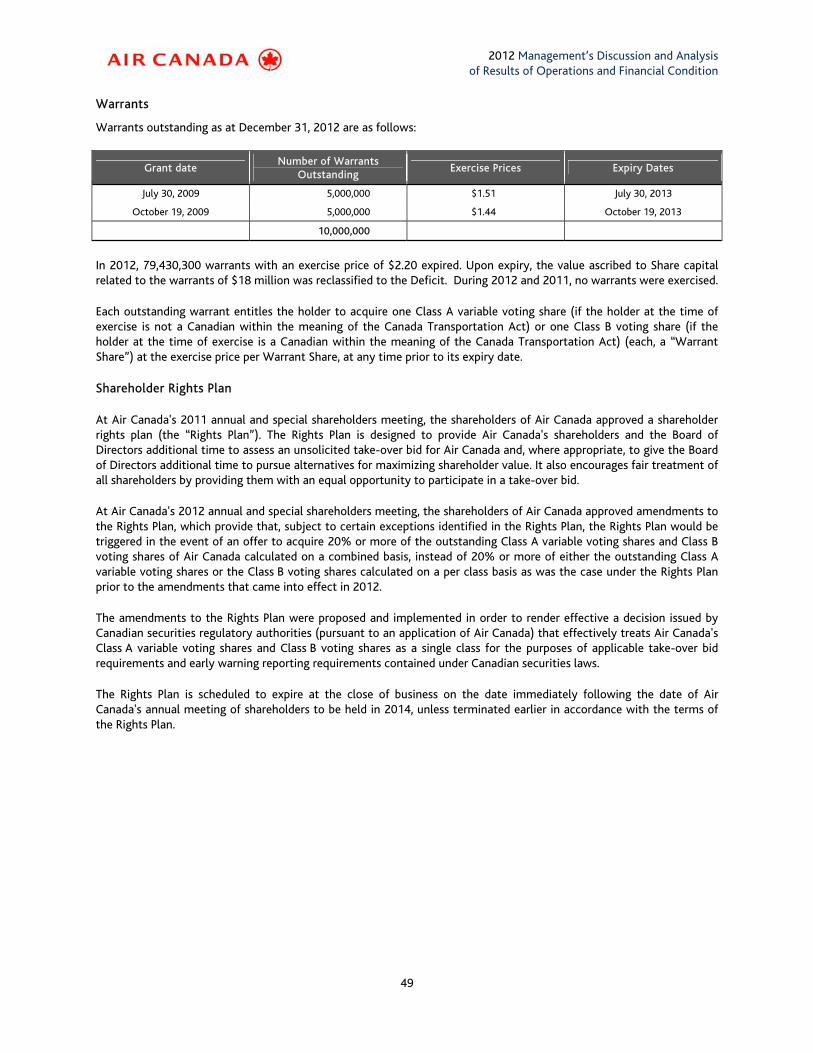
2012 Management’s Discussion and Analysis of Results of Operations and Financial Condition
49
Warrants
Warrants outstanding as at December 31, 2012 are as follows:
Grant date Number of Warrants
Outstanding Exercise Prices Expiry Dates
July 30, 2009 5,000,000 $1.51 July 30, 2013
October 19, 2009 5,000,000 $1.44 October 19, 2013
10,000,000
In 2012, 79,430,300 warrants with an exercise price of $2.20 expired. Upon expiry, the value ascribed to Share capital related to the warrants of $18 million was reclassified to the Deficit. During 2012 and 2011, no warrants were exercised.
Each outstanding warrant entitles the holder to acquire one Class A variable voting share (if the holder at the time of exercise is not a Canadian within the meaning of the Canada Transportation Act) or one Class B voting share (if the holder at the time of exercise is a Canadian within the meaning of the Canada Transportation Act) (each, a “Warrant Share”) at the exercise price per Warrant Share, at any time prior to its expiry date.
Shareholder Rights Plan
At Air Canada's 2011 annual and special shareholders meeting, the shareholders of Air Canada approved a shareholder rights plan (the “Rights Plan”). The Rights Plan is designed to provide Air Canada's shareholders and the Board of Directors additional time to assess an unsolicited take-over bid for Air Canada and, where appropriate, to give the Board of Directors additional time to pursue alternatives for maximizing shareholder value. It also encourages fair treatment of all shareholders by providing them with an equal opportunity to participate in a take-over bid.
At Air Canada's 2012 annual and special shareholders meeting, the shareholders of Air Canada approved amendments to the Rights Plan, which provide that, subject to certain exceptions identified in the Rights Plan, the Rights Plan would be triggered in the event of an offer to acquire 20% or more of the outstanding Class A variable voting shares and Class B voting shares of Air Canada calculated on a combined basis, instead of 20% or more of either the outstanding Class A variable voting shares or the Class B voting shares calculated on a per class basis as was the case under the Rights Plan prior to the amendments that came into effect in 2012.
The amendments to the Rights Plan were proposed and implemented in order to render effective a decision issued by Canadian securities regulatory authorities (pursuant to an application of Air Canada) that effectively treats Air Canada's Class A variable voting shares and Class B voting shares as a single class for the purposes of applicable take-over bid requirements and early warning reporting requirements contained under Canadian securities laws.
The Rights Plan is scheduled to expire at the close of business on the date immediately following the date of Air Canada's annual meeting of shareholders to be held in 2014, unless terminated earlier in accordance with the terms of the Rights Plan.
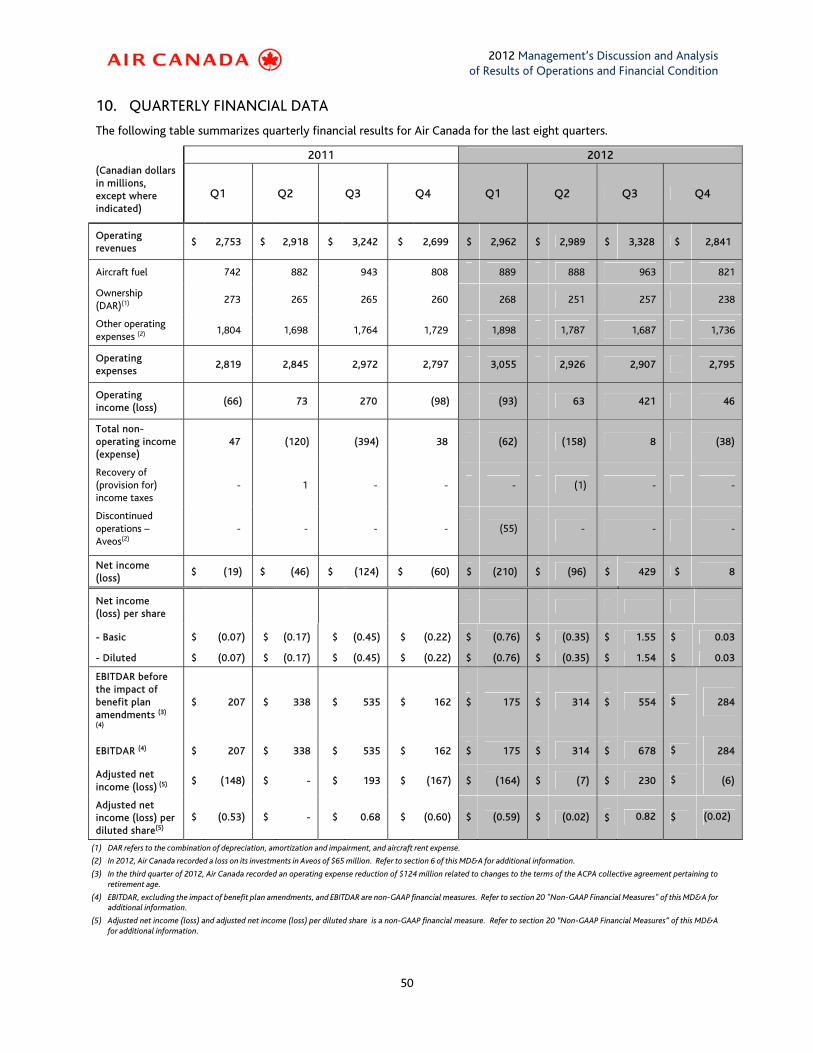
2012 Management’s Discussion and Analysis of Results of Operations and Financial Condition
50
10. QUARTERLY FINANCIAL DATA
The following table summarizes quarterly financial results for Air Canada for the last eight quarters.
2011 2012 (Canadian dollars in millions, except where indicated)
Q1 Q2 Q3 Q4 Q1 Q2 Q3 Q4
Operating revenues
$ 2,753 $ 2,918 $ 3,242 $ 2,699 $ 2,962 $ 2,989 $ 3,328 $ 2,841
Aircraft fuel 742 882 943 808 889 888 963 821
Ownership (DAR)(1)
273 265 265 260 268 251 257 238
Other operating expenses (2)
1,804 1,698 1,764 1,729 1,898 1,787 1,687 1,736
Operating expenses
2,819 2,845 2,972 2,797 3,055 2,926 2,907 2,795
Operating income (loss)
(66) 73 270 (98) (93) 63 421 46
Total non-operating income (expense)
47 (120) (394) 38 (62) (158) 8 (38)
Recovery of (provision for) income taxes
- 1 - - - (1) - -
Discontinued operations – Aveos(2)
- - - - (55) - - -
Net income (loss)
$ (19) $ (46) $ (124) $ (60) $ (210) $ (96) $ 429 $ 8
Net income (loss) per share
- Basic $ (0.07) $ (0.17) $ (0.45) $ (0.22) $ (0.76) $ (0.35) $ 1.55 $ 0.03
- Diluted $ (0.07) $ (0.17) $ (0.45) $ (0.22) $ (0.76) $ (0.35) $ 1.54 $ 0.03
EBITDAR before the impact of benefit plan amendments (3)
(4)
$ 207 $ 338 $ 535 $ 162 $ 175 $ 314 $ 554 $ 284
EBITDAR (4) $ 207 $ 338 $ 535 $ 162 $ 175 $ 314 $ 678 $ 284
Adjusted net income (loss) (5)
$ (148) $ - $ 193 $ (167) $ (164) $ (7) $ 230 $ (6)
Adjusted net income (loss) per diluted share(5)
$ (0.53) $ - $ 0.68 $ (0.60) $ (0.59) $ (0.02) $ 0.82 $ (0.02)
(1) DAR refers to the combination of depreciation, amortization and impairment, and aircraft rent expense.
(2) In 2012, Air Canada recorded a loss on its investments in Aveos of $65 million. Refer to section 6 of this MD&A for additional information.
(3) In the third quarter of 2012, Air Canada recorded an operating expense reduction of $124 million related to changes to the terms of the ACPA collective agreement pertaining to retirement age.
(4) EBITDAR, excluding the impact of benefit plan amendments, and EBITDAR are non-GAAP financial measures. Refer to section 20 "Non-GAAP Financial Measures" of this MD&A for additional information.
(5) Adjusted net income (loss) and adjusted net income (loss) per diluted share is a non-GAAP financial measure. Refer to section 20 “Non-GAAP Financial Measures” of this MD&A for additional information.
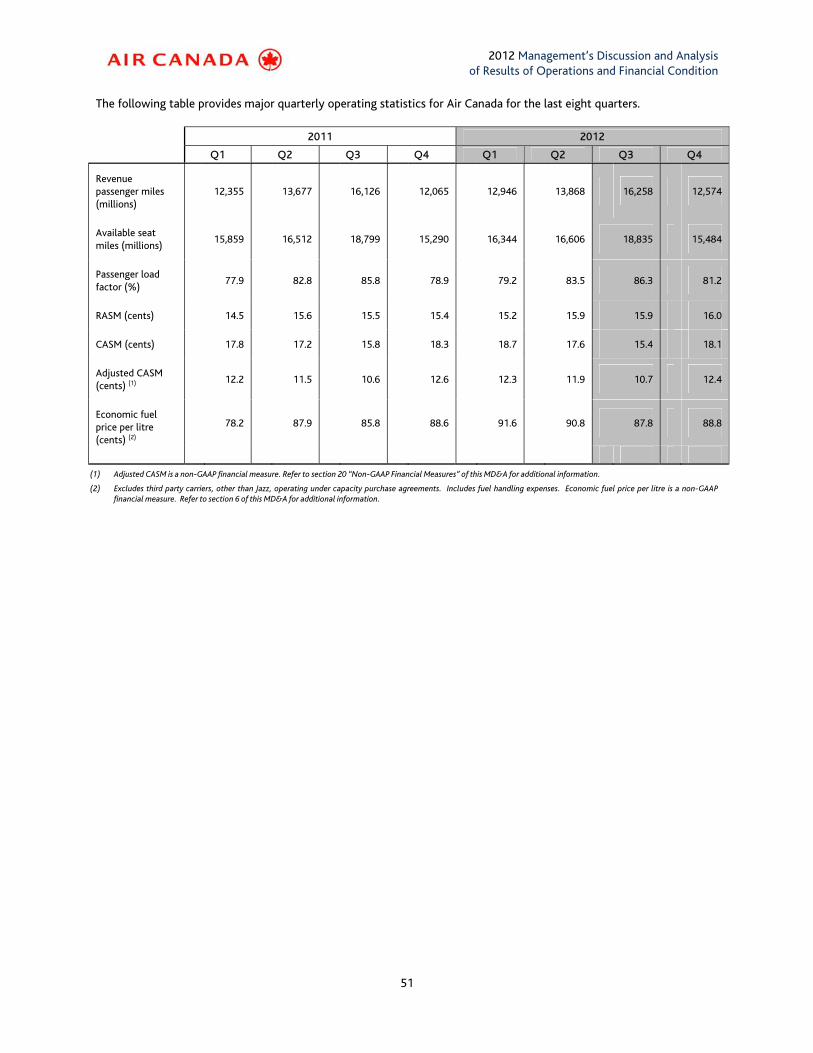
2012 Management’s Discussion and Analysis of Results of Operations and Financial Condition
51
The following table provides major quarterly operating statistics for Air Canada for the last eight quarters.
2011 2012
Q1 Q2 Q3 Q4 Q1 Q2 Q3 Q4
Revenue passenger miles (millions)
12,355 13,677 16,126 12,065 12,946 13,868 16,258 12,574
Available seat miles (millions)
15,859 16,512 18,799 15,290 16,344 16,606 18,835 15,484
Passenger load factor (%)
77.9 82.8 85.8 78.9 79.2 83.5 86.3 81.2
RASM (cents) 14.5 15.6 15.5 15.4 15.2 15.9 15.9 16.0
CASM (cents) 17.8 17.2 15.8 18.3 18.7 17.6 15.4 18.1
Adjusted CASM (cents) (1)
12.2 11.5 10.6 12.6 12.3 11.9 10.7 12.4
Economic fuel price per litre (cents) (2)
78.2 87.9 85.8 88.6 91.6 90.8 87.8 88.8
(1) Adjusted CASM is a non-GAAP financial measure. Refer to section 20 “Non-GAAP Financial Measures” of this MD&A for additional information.
(2) Excludes third party carriers, other than Jazz, operating under capacity purchase agreements. Includes fuel handling expenses. Economic fuel price per litre is a non-GAAP financial measure. Refer to section 6 of this MD&A for additional information.
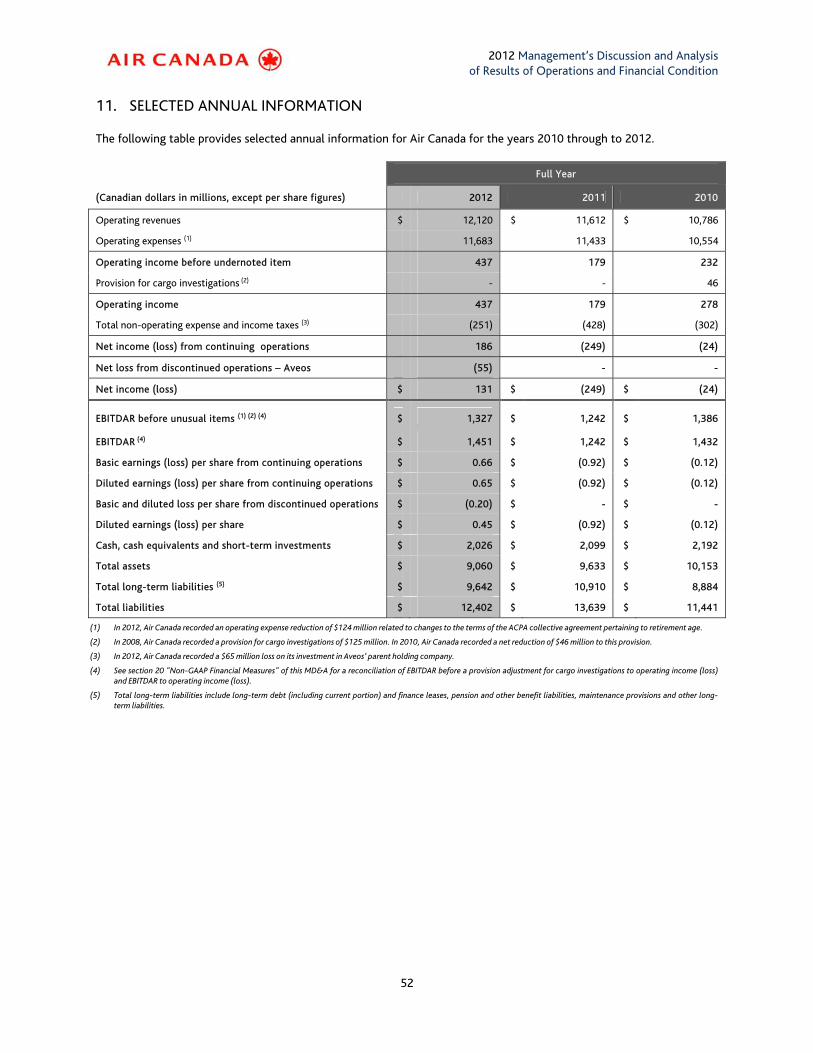
2012 Management’s Discussion and Analysis of Results of Operations and Financial Condition
52
11. SELECTED ANNUAL INFORMATION
The following table provides selected annual information for Air Canada for the years 2010 through to 2012.
Full Year
(Canadian dollars in millions, except per share figures) 2012 2011 2010
Operating revenues $ 12,120 $ 11,612 $ 10,786
Operating expenses (1) 11,683 11,433 10,554
Operating income before undernoted item 437 179 232
Provision for cargo investigations (2) - - 46
Operating income 437 179 278
Total non-operating expense and income taxes (3) (251) (428) (302)
Net income (loss) from continuing operations 186 (249) (24)
Net loss from discontinued operations – Aveos (55) - -
Net income (loss) $ 131 $ (249) $ (24)
EBITDAR before unusual items (1) (2) (4) $ 1,327 $ 1,242 $ 1,386
EBITDAR (4) $ 1,451 $ 1,242 $ 1,432
Basic earnings (loss) per share from continuing operations $ 0.66 $ (0.92) $ (0.12)
Diluted earnings (loss) per share from continuing operations $ 0.65 $ (0.92) $ (0.12)
Basic and diluted loss per share from discontinued operations $ (0.20) $ - $ -
Diluted earnings (loss) per share $ 0.45 $ (0.92) $ (0.12)
Cash, cash equivalents and short-term investments $ 2,026 $ 2,099 $ 2,192
Total assets $ 9,060 $ 9,633 $ 10,153
Total long-term liabilities (5) $ 9,642 $ 10,910 $ 8,884
Total liabilities $ 12,402 $ 13,639 $ 11,441
(1) In 2012, Air Canada recorded an operating expense reduction of $124 million related to changes to the terms of the ACPA collective agreement pertaining to retirement age.
(2) In 2008, Air Canada recorded a provision for cargo investigations of $125 million. In 2010, Air Canada recorded a net reduction of $46 million to this provision.
(3) In 2012, Air Canada recorded a $65 million loss on its investment in Aveos’ parent holding company.
(4) See section 20 "Non-GAAP Financial Measures" of this MD&A for a reconciliation of EBITDAR before a provision adjustment for cargo investigations to operating income (loss) and EBITDAR to operating income (loss).
(5) Total long-term liabilities include long-term debt (including current portion) and finance leases, pension and other benefit liabilities, maintenance provisions and other long-term liabilities.
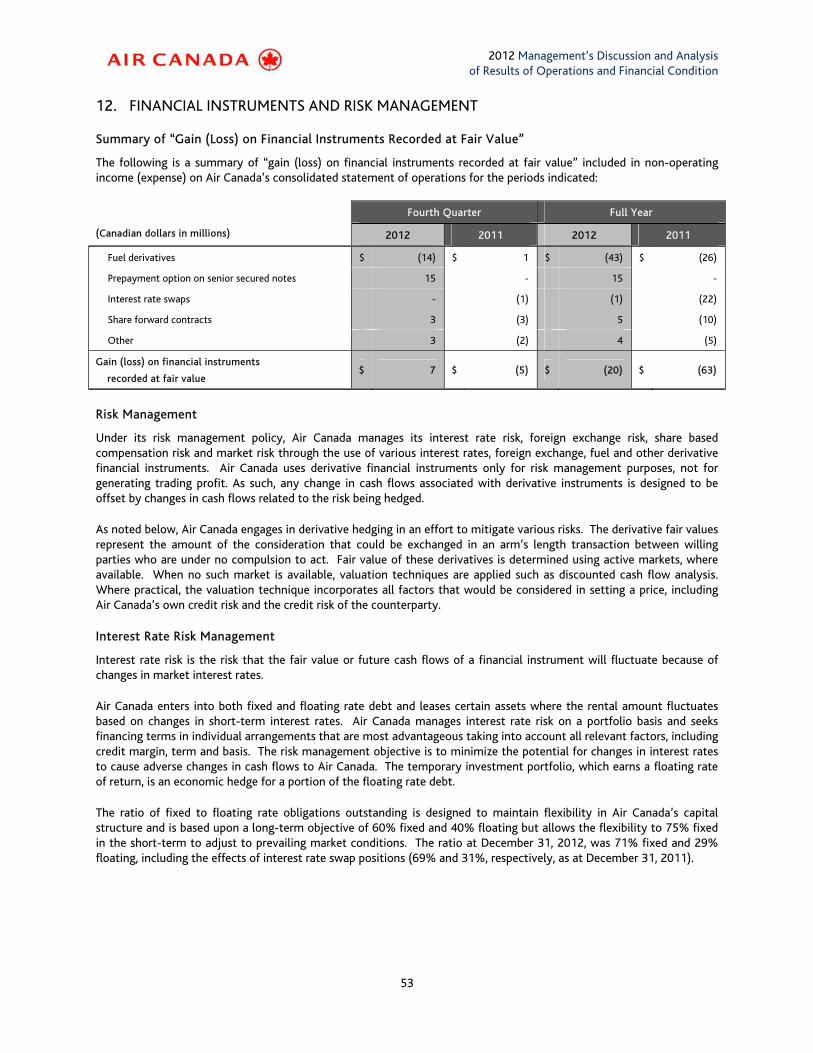
2012 Management’s Discussion and Analysis of Results of Operations and Financial Condition
53
12. FINANCIAL INSTRUMENTS AND RISK MANAGEMENT
Summary of “Gain (Loss) on Financial Instruments Recorded at Fair Value”
The following is a summary of “gain (loss) on financial instruments recorded at fair value” included in non-operating income (expense) on Air Canada’s consolidated statement of operations for the periods indicated:
Fourth Quarter Full Year
(Canadian dollars in millions) 2012 2011 2012 2011
Fuel derivatives $ (14) $ 1 $ (43) $ (26)
Prepayment option on senior secured notes 15 - 15 -
Interest rate swaps - (1) (1) (22)
Share forward contracts 3 (3) 5 (10)
Other 3 (2) 4 (5)
Gain (loss) on financial instruments
recorded at fair value $ 7 $ (5) $ (20) $ (63)
Risk Management
Under its risk management policy, Air Canada manages its interest rate risk, foreign exchange risk, share based compensation risk and market risk through the use of various interest rates, foreign exchange, fuel and other derivative financial instruments. Air Canada uses derivative financial instruments only for risk management purposes, not for generating trading profit. As such, any change in cash flows associated with derivative instruments is designed to be offset by changes in cash flows related to the risk being hedged.
As noted below, Air Canada engages in derivative hedging in an effort to mitigate various risks. The derivative fair values represent the amount of the consideration that could be exchanged in an arm’s length transaction between willing parties who are under no compulsion to act. Fair value of these derivatives is determined using active markets, where available. When no such market is available, valuation techniques are applied such as discounted cash flow analysis. Where practical, the valuation technique incorporates all factors that would be considered in setting a price, including Air Canada’s own credit risk and the credit risk of the counterparty.
Interest Rate Risk Management
Interest rate risk is the risk that the fair value or future cash flows of a financial instrument will fluctuate because of changes in market interest rates.
Air Canada enters into both fixed and floating rate debt and leases certain assets where the rental amount fluctuates based on changes in short-term interest rates. Air Canada manages interest rate risk on a portfolio basis and seeks financing terms in individual arrangements that are most advantageous taking into account all relevant factors, including credit margin, term and basis. The risk management objective is to minimize the potential for changes in interest rates to cause adverse changes in cash flows to Air Canada. The temporary investment portfolio, which earns a floating rate of return, is an economic hedge for a portion of the floating rate debt.
The ratio of fixed to floating rate obligations outstanding is designed to maintain flexibility in Air Canada’s capital structure and is based upon a long-term objective of 60% fixed and 40% floating but allows the flexibility to 75% fixed in the short-term to adjust to prevailing market conditions. The ratio at December 31, 2012, was 71% fixed and 29% floating, including the effects of interest rate swap positions (69% and 31%, respectively, as at December 31, 2011).
2012 Management’s Discussion and Analysis of Results of Operations and Financial Condition
54
The following are the current derivatives employed in interest rate risk management activities and the adjustments recorded during 2012:
• As at December 31, 2012, Air Canada had two interest rate swap agreements in place with terms to July 2022 and January 2024 relating to two Boeing 767 aircraft financing agreements with an aggregate notional value of $65 million (US$66 million) (2011 – $74 million (US$73 million)). These swaps convert the lease payments on the two aircraft leases from fixed to floating rates. The fair value of these contracts as at December 31, 2012 was $13 million in favour of Air Canada (2011 – $15 million in favour of Air Canada). These derivative instruments have not been designated as hedges for accounting purposes and are recorded at fair value. In 2012, a gain of $2 million was recorded in Gain on financial instruments recorded at fair value on Air Canada’s consolidated statement of operations related to these derivatives (2011 – $6 million gain).
• Certain payments based upon aircraft rental amounts for the delivery of 15 Q400 aircraft to Jazz are based on medium-term U.S. interest rates at the time of delivery. To hedge against the exposure to increases in interest rates until the expected delivery date, in 2011, Air Canada entered into forward start interest rate swaps with an aggregate notional value of US$234 million. The swaps had contractual terms of maturity that coincided with the term of the rental agreements. However, the derivatives were settled on each delivery date of the aircraft with the final maturity in 2012. The aggregate notional value outstanding at December 31, 2011 was US$109 million for the delivery of seven Q400 aircraft. These derivatives had not been designated as hedges for accounting purposes. In 2012, a loss of $3 million was recorded in Loss on financial instruments recorded at fair value on Air Canada’s consolidated statement of operations related to these derivatives (2011 – $28 million loss).
Interest income includes $33 million (2011 – $32 million) related to Cash and cash equivalents and Short-term investments, which are classified as held for trading. Interest expense reflected on Air Canada’s consolidated statement of operations relates to financial liabilities recorded at amortized cost.
Foreign Exchange Risk
Foreign exchange risk is the risk that the fair value or future cash flows of a financial instrument will fluctuate because of changes in foreign exchange rates.
Air Canada’s risk management objective is to reduce cash flow risk related to foreign denominated cash flows.
Air Canada’s cash inflows are primarily in Canadian dollars, while a large portion of its outflows are in U.S. dollars. This unbalanced mix results in an annual U.S. dollar shortfall from operations. In order to mitigate this imbalance, Air Canada has adopted the practice of converting excess revenues from offshore currencies into U.S. dollars. In 2012, this conversion generated coverage of approximately 19% of the imbalance. The remaining 81% was covered through the use of a variety of foreign exchange derivatives, including spot transactions and U.S. dollar investments, which had maturity dates corresponding to the forecasted shortfall dates. The level of foreign exchange derivatives expiring at any one point in time is dependent upon a number of factors, which include the amount of foreign revenue conversion available, U.S. dollar net cash flows, as well as the amount attributed to aircraft and debt payments.
The following are the current derivatives employed in foreign exchange risk management activities and the adjustments recorded in 2012:
• As at December 31, 2012, Air Canada had outstanding foreign currency options and swap agreements to purchase U.S. dollars against Canadian dollars on $1,289 million (US$1,296 million) which mature in 2013 (2011 - $1,008 million (US$991 million) which matured in 2012). The fair value of these foreign currency contracts as at December 31, 2012 was less than $1 million in favour of Air Canada (2011 - $5 million in favour of Air Canada). These derivative instruments have not been designated as hedges for accounting purposes and are recorded at fair value. In 2012, a gain of $20 million was recorded in Foreign exchange gain (loss) on Air Canada’s consolidated statement of operations (2011 - $26 million gain).
2012 Management’s Discussion and Analysis of Results of Operations and Financial Condition
55
Fuel Price Risk Management
Fuel price risk is the risk that future cash flows relating to jet fuel purchases will fluctuate because of changes in jet fuel prices. In order to manage its exposure to jet fuel prices and to help mitigate volatility in operating cash flows, Air Canada enters into derivative contracts with financial intermediaries.
Air Canada uses derivative contracts based on jet fuel, heating oil and crude-oil based contracts. Heating oil and crude-oil derivatives are used due to the relative limited liquidity of jet fuel derivative instruments on a medium to long-term horizon since jet fuel is not traded on an organized futures exchange. Air Canada’s policy permits hedging of up to 75% of the projected jet fuel purchases for the next 12 months, 50% for the next 13 to 24 months and 25% for the next 25 to 36 months. These are maximum (but not mandated) limits. There is no minimum monthly hedging requirement. There are regular reviews to adjust the strategy in light of market conditions. Air Canada does not purchase or hold any derivative financial instrument for speculative purposes.
In 2012:
• Air Canada recorded a loss of $43 million in Loss on financial instruments recorded at fair value on Air Canada’s consolidated statement of operations related to fuel derivatives ($26 million loss in 2011).
• Air Canada purchased crude-oil and refined products-based call options and call spreads covering a portion of 2012 and 2013 fuel exposure. The cash premium related to these contracts was $51 million ($35 million in 2011 for 2011 and 2012 exposures).
• Fuel derivative contracts cash settled with a net fair value of $3 million in favour of Air Canada ($31 million in favour of Air Canada in 2011).
As of January 31, 2013, approximately 27% (approximately 24% at December 31, 2012) of Air Canada's anticipated purchases of jet fuel for 2013 was hedged at an average West Texas Intermediate (“WTI”) equivalent capped price of US$101 per barrel (US$100 per barrel at December 31, 2012). Air Canada’s contracts to hedge anticipated jet fuel purchases over the 2013 period are comprised of call options and call spreads.
The fair value of the fuel derivatives portfolio at December 31, 2012 was $16 million in favour of Air Canada ($11 million in favour of Air Canada in 2011) and was recorded within Prepaid expenses and other current assets on Air Canada’s consolidated statement of financial position.
The following table outlines the notional volumes per barrel along with the WTI equivalent weighted average capped price by type of derivative instruments as at January 31, 2013. Air Canada is expected to generate fuel hedging gains if oil prices increase above the average capped price.
Derivative Instruments Term Volume (bbls) WTI
Weighted Average Capped Price (US$/bbl)
Call options 2013 6,218,499 $ 101
Call spreads 2013 450,000 $ 92
2012 Management’s Discussion and Analysis of Results of Operations and Financial Condition
56
13. CRITICAL ACCOUNTING ESTIMATES
Critical accounting estimates are those that are most important to the portrayal of Air Canada’s financial condition and results of operations. They require management's most difficult, subjective or complex judgments, often because of the need to make estimates about the effect of matters that are inherently uncertain. Actual results could differ from those estimates under different assumptions or conditions.
Air Canada has identified the following areas that contain critical accounting estimates utilized in the preparation of its consolidated financial statements.
Employee Future Benefits
The cost and related liabilities of Air Canada’s pensions, other post-retirement and post-employment benefit programs are determined using actuarial valuations. The actuarial valuations involve assumptions, including discount rates, expected rates of return on assets, future salary increases, mortality rates and future benefit increases. Also, due to the long-term nature of these programs, such estimates are subject to significant uncertainty.
Air Canada maintains several defined benefit plans providing pension, other retirement and post-employment benefits to its employees. Management makes a number of assumptions in the calculation of both the accrued benefit obligations as well as the costs.
Pension Benefits Other Employee Future Benefits
2012 2011 2012 2011
Discount rate used to determine:
Accrued benefit cost for the year ended December 31 5.20% 5.50% 4.90% 5.35%
Accrued benefit liability as at December 31 4.30% 5.20% 4.17% 4.90%
Expected long-term rate of return on plan assets used
to determine:
Accrued benefit cost for the year ended December 31 6.60% 6.90% not applicable not applicable
Rate of future increases in compensation used
to determine:
Accrued benefit cost for the year ended December 31 2.50% 2.50% not applicable not applicable
Accrued benefit obligation as at December 31 2.50% 2.50% not applicable not applicable
Discount Rate
The discount rate used to determine the pension obligation was determined by reference to market interest rates on corporate bonds rated "AA" or better with cash flows that approximately match the timing and amount of expected benefit payments.
Expected Return on Assets Assumption
Air Canada’s expected long-term rate of return on assets assumption is selected based on the facts and circumstances that existed as of the measurement date and the specific portfolio mix of plan assets. Air Canada’s management, in conjunction with its actuaries, reviews anticipated future long-term performance of individual asset categories and considers the asset allocation strategy adopted by Air Canada, including the longer duration in its bond portfolio in comparison to other pension plans. These factors are used to determine the average rate of expected return on the funds invested to provide for the pension plan benefits. The determination of the long-term rate considers recent fund performance and historical returns, to the extent that the past is indicative of the expected long-term, prospective rate.
2012 Management’s Discussion and Analysis of Results of Operations and Financial Condition
57
There can be no assurance that any of the plans will earn the expected rate of return. A sensitivity analysis on pension expense assuming a change in the expected return on plan assets is provided below.
Composition of Pension Plan Assets
Domestic Registered Plans
The composition of the domestic registered plan assets and the target allocation as follows:
2012 2011 Target allocation (1)
Non-matched assets (mainly equities) 54.9% 53.0% 54.4%
Matched assets (mainly Canadian bonds) 45.1% 47.0% 45.6%
Total 100.0% 100.0% 100.0%
(1) Weighted average of the Master Trust Fund target allocation (99% of Domestic Registered Plan assets) and the Bond Trust Fund target allocation. The Bond Trust Fund serves the purpose of altering the asset mix of some of the participating plans. These plans exhibit characteristics that differ from the majority of the participating plans, which are solely invested in the Master Trust.
For the domestic registered plans, the investments conform to the Statement of Investment Policy and Objectives of the Air Canada Pension Funds as amended during 2012. The investment return objective of the Fund is to achieve a total annualized rate of return that exceeds by a minimum of 1.0% before investment fees on average over the long term (i.e. 10 years) the total annualized return that could have been earned by passively managing the Liability Benchmark. The Liability Benchmark, which is referenced to widely used Canadian fixed income performance benchmarks (DEX), is composed of a mix of the DEX Universe Provincial Bond Index, DEX Long Term Provincial Bond Index and DEX Real Return Bond Index that closely matches the characteristics of the pension liabilities.
In addition to the broad asset allocation, as summarized in the asset allocation section above, the following policies apply to individual asset classes:
• Non-matched assets are mainly equities, and are required to be diversified among industries and economic sectors. Foreign equities can comprise 25% to 39% of the total market value of the Master Trust Fund. Limitations are placed on the overall allocation to any individual security. Investments in alternative investments are allowed up to 15% of the total market value of the Master Trust Fund.
• Matched assets are mainly Canadian bonds, oriented toward long term investment grade securities rated "BBB" or higher. With the exception of Government of Canada securities or a province thereof, in which the plan may invest the entire fixed income allocation, these investments are required to be diversified among individual securities and sectors.
Derivatives are permitted provided that they are used for hedging a particular risk (including interest rate risk related to pension liabilities) or to create exposures to given markets and currencies and that counterparties have a minimum credit rating of “A”. As of December 31, 2012, a 15% derivative exposure to matched assets is in place to hedge interest rate risk related to pension liabilities.
Similar investment policies are established for the international pension plans sponsored by Air Canada.
The trusts for the supplemental plans are invested 50% in indexed equity investments, in accordance with their investment policies, with the remaining 50% held by the Canada Revenue Agency as a refundable tax, in accordance with tax legislation.
Air Canada's expected long-term rate of return on assets assumption is selected based on the facts and circumstances that exist as of the measurement date, and the specific portfolio mix of plan assets. Management reviewed anticipated future long-term performance of individual asset categories and considered the asset allocation strategy adopted by Air Canada, including the longer duration in its bond portfolio in comparison to other pension plans. These factors are used to determine the average rate of expected return on the funds invested to provide for the pension plan benefits. While
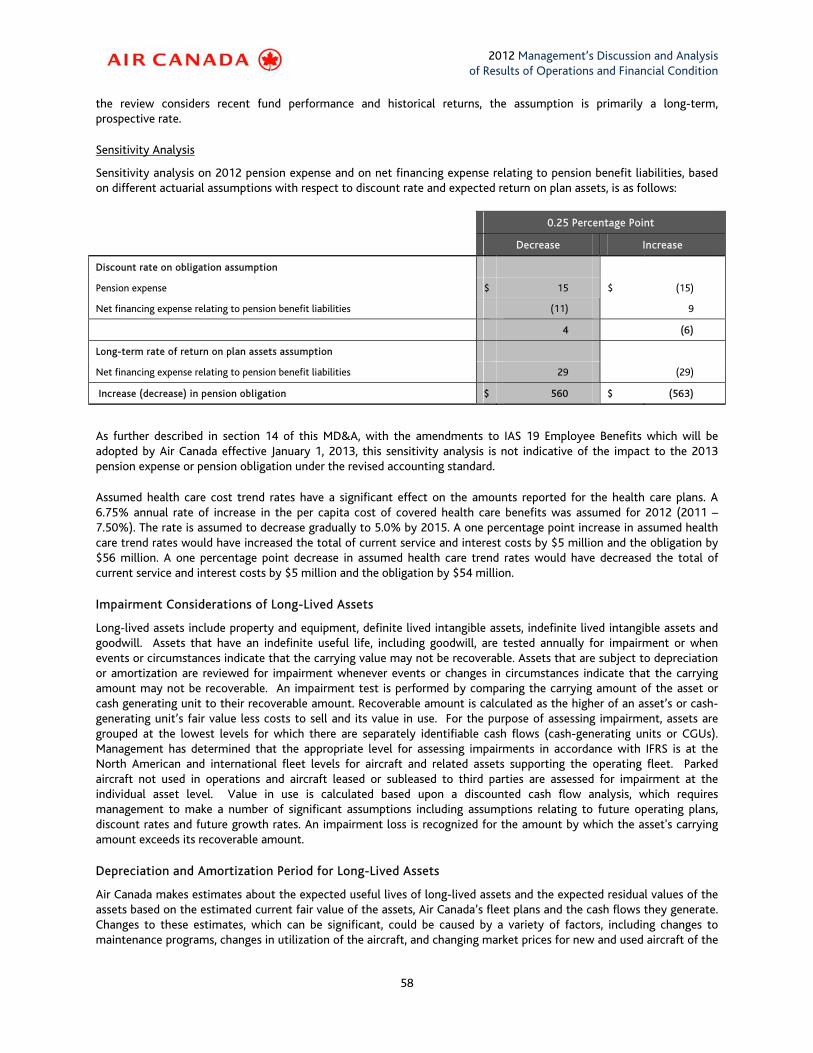
2012 Management’s Discussion and Analysis of Results of Operations and Financial Condition
58
the review considers recent fund performance and historical returns, the assumption is primarily a long-term, prospective rate.
Sensitivity Analysis
Sensitivity analysis on 2012 pension expense and on net financing expense relating to pension benefit liabilities, based on different actuarial assumptions with respect to discount rate and expected return on plan assets, is as follows:
0.25 Percentage Point
Decrease Increase
Discount rate on obligation assumption
Pension expense $ 15 $ (15)
Net financing expense relating to pension benefit liabilities (11) 9
4 (6)
Long-term rate of return on plan assets assumption
Net financing expense relating to pension benefit liabilities 29 (29)
Increase (decrease) in pension obligation $ 560 $ (563)
As further described in section 14 of this MD&A, with the amendments to IAS 19 Employee Benefits which will be adopted by Air Canada effective January 1, 2013, this sensitivity analysis is not indicative of the impact to the 2013 pension expense or pension obligation under the revised accounting standard.
Assumed health care cost trend rates have a significant effect on the amounts reported for the health care plans. A 6.75% annual rate of increase in the per capita cost of covered health care benefits was assumed for 2012 (2011 – 7.50%). The rate is assumed to decrease gradually to 5.0% by 2015. A one percentage point increase in assumed health care trend rates would have increased the total of current service and interest costs by $5 million and the obligation by $56 million. A one percentage point decrease in assumed health care trend rates would have decreased the total of current service and interest costs by $5 million and the obligation by $54 million.
Impairment Considerations of Long-Lived Assets
Long-lived assets include property and equipment, definite lived intangible assets, indefinite lived intangible assets and goodwill. Assets that have an indefinite useful life, including goodwill, are tested annually for impairment or when events or circumstances indicate that the carrying value may not be recoverable. Assets that are subject to depreciation or amortization are reviewed for impairment whenever events or changes in circumstances indicate that the carrying amount may not be recoverable. An impairment test is performed by comparing the carrying amount of the asset or cash generating unit to their recoverable amount. Recoverable amount is calculated as the higher of an asset’s or cash-generating unit’s fair value less costs to sell and its value in use. For the purpose of assessing impairment, assets are grouped at the lowest levels for which there are separately identifiable cash flows (cash-generating units or CGUs). Management has determined that the appropriate level for assessing impairments in accordance with IFRS is at the North American and international fleet levels for aircraft and related assets supporting the operating fleet. Parked aircraft not used in operations and aircraft leased or subleased to third parties are assessed for impairment at the individual asset level. Value in use is calculated based upon a discounted cash flow analysis, which requires management to make a number of significant assumptions including assumptions relating to future operating plans, discount rates and future growth rates. An impairment loss is recognized for the amount by which the asset's carrying amount exceeds its recoverable amount.
Depreciation and Amortization Period for Long-Lived Assets
Air Canada makes estimates about the expected useful lives of long-lived assets and the expected residual values of the assets based on the estimated current fair value of the assets, Air Canada’s fleet plans and the cash flows they generate. Changes to these estimates, which can be significant, could be caused by a variety of factors, including changes to maintenance programs, changes in utilization of the aircraft, and changing market prices for new and used aircraft of the
2012 Management’s Discussion and Analysis of Results of Operations and Financial Condition
59
same or similar types. Estimates and assumptions are evaluated at least annually. Generally, these adjustments are accounted for on a prospective basis, through depreciation and amortization expense. For the purposes of sensitivity analysis on these estimates, a 50% reduction to residual values on aircraft with remaining useful lives greater than five years results in an increase of $17 million to annual depreciation expense. For aircraft with shorter remaining useful lives, the residual values are not expected to change significantly.
Maintenance Provisions
The recording of maintenance provisions related to return conditions on aircraft leases requires management to make estimates of the future costs associated with the maintenance events required under the lease return condition and estimates of the expected future maintenance condition of the aircraft at the time of lease expiry. These estimates take into account current costs of these maintenance events, estimates of inflation surrounding these costs as well as assumptions surrounding utilization of the related aircraft. Any difference in the actual maintenance cost incurred and the amount of the provision is recorded in maintenance expense in the period. The effect of any changes in estimates, including changes in discount rates, inflation assumptions, cost estimates or lease expiries, is also recognized in maintenance expense in the period. Assuming the aggregate cost for return conditions increases by 2%, holding all other factors constant, there would be a cumulative balance sheet adjustment to increase the provision by $11 million at December 31, 2012 and an increase to maintenance expense in 2013 of approximately $1 million. For illustrative purposes, if the discount rates were to increase by 1%, holding all other factors constant, there would be a cumulative balance sheet adjustment to decrease the provision by $12 million at December 31, 2012. Due to low market rates of interest, a 1% decrease in discount rates was not considered a reasonable scenario.
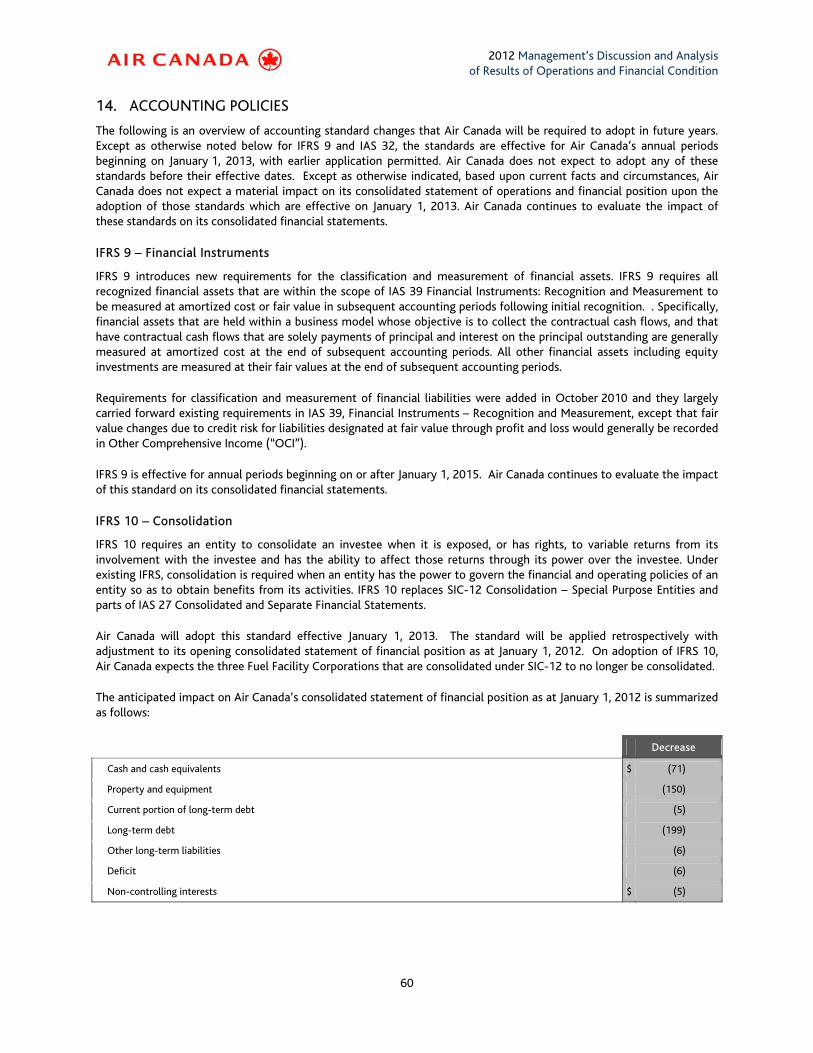
2012 Management’s Discussion and Analysis of Results of Operations and Financial Condition
60
14. ACCOUNTING POLICIES
The following is an overview of accounting standard changes that Air Canada will be required to adopt in future years. Except as otherwise noted below for IFRS 9 and IAS 32, the standards are effective for Air Canada’s annual periods beginning on January 1, 2013, with earlier application permitted. Air Canada does not expect to adopt any of these standards before their effective dates. Except as otherwise indicated, based upon current facts and circumstances, Air Canada does not expect a material impact on its consolidated statement of operations and financial position upon the adoption of those standards which are effective on January 1, 2013. Air Canada continues to evaluate the impact of these standards on its consolidated financial statements.
IFRS 9 – Financial Instruments
IFRS 9 introduces new requirements for the classification and measurement of financial assets. IFRS 9 requires all recognized financial assets that are within the scope of IAS 39 Financial Instruments: Recognition and Measurement to be measured at amortized cost or fair value in subsequent accounting periods following initial recognition. . Specifically, financial assets that are held within a business model whose objective is to collect the contractual cash flows, and that have contractual cash flows that are solely payments of principal and interest on the principal outstanding are generally measured at amortized cost at the end of subsequent accounting periods. All other financial assets including equity investments are measured at their fair values at the end of subsequent accounting periods.
Requirements for classification and measurement of financial liabilities were added in October 2010 and they largely carried forward existing requirements in IAS 39, Financial Instruments – Recognition and Measurement, except that fair value changes due to credit risk for liabilities designated at fair value through profit and loss would generally be recorded in Other Comprehensive Income (“OCI”).
IFRS 9 is effective for annual periods beginning on or after January 1, 2015. Air Canada continues to evaluate the impact of this standard on its consolidated financial statements.
IFRS 10 – Consolidation
IFRS 10 requires an entity to consolidate an investee when it is exposed, or has rights, to variable returns from its involvement with the investee and has the ability to affect those returns through its power over the investee. Under existing IFRS, consolidation is required when an entity has the power to govern the financial and operating policies of an entity so as to obtain benefits from its activities. IFRS 10 replaces SIC-12 Consolidation – Special Purpose Entities and parts of IAS 27 Consolidated and Separate Financial Statements.
Air Canada will adopt this standard effective January 1, 2013. The standard will be applied retrospectively with adjustment to its opening consolidated statement of financial position as at January 1, 2012. On adoption of IFRS 10, Air Canada expects the three Fuel Facility Corporations that are consolidated under SIC-12 to no longer be consolidated.
The anticipated impact on Air Canada’s consolidated statement of financial position as at January 1, 2012 is summarized as follows:
Decrease
Cash and cash equivalents $ (71)
Property and equipment (150)
Current portion of long-term debt (5)
Long-term debt (199)
Other long-term liabilities (6)
Deficit (6)
Non-controlling interests $ (5)
2012 Management’s Discussion and Analysis of Results of Operations and Financial Condition
61
The expected impact of the amended standard on Air Canada’s consolidated statement of operations is a decrease to Other revenues of $6 million, and a decrease to Depreciation, amortization and impairment of $9 million for the year ended December 31, 2012, which would result in an increase of $3 million to Net income for the year ended December 31, 2012.
IFRS 11 – Joint Arrangements
IFRS 11 requires a venturer to classify its interest in a joint arrangement as a joint venture or joint operation. Joint ventures will be accounted for using the equity method of accounting whereas for a joint operation the venturer will recognize its share of the assets, liabilities, revenue and expenses of the joint operation. Under existing IFRS, entities have the choice to proportionately consolidate or equity account for interests in joint ventures. IFRS 11 supersedes IAS 31, Interests in Joint Ventures, and SIC-13, Jointly Controlled Entities-Non-monetary Contributions by Venturers.
IFRS 12 – Disclosure of Interests in Other Entities
IFRS 12 establishes disclosure requirements for interests in other entities, such as joint arrangements, associates, special purpose vehicles and off balance sheet vehicles. The standard carries forward existing disclosures and also introduces significant additional disclosure requirements that address the nature of, and risks associated with, an entity’s interests in other entities.
IFRS 13 – Fair Value Measurement
Under existing IFRS, guidance on measuring and disclosing fair value is dispersed among the specific standards requiring fair value measurements. IFRS 13 is a more comprehensive standard for fair value measurement and disclosure requirements for use across all IFRS standards. The new standard clarifies that fair value is the price that would be received to sell an asset, or paid to transfer a liability in an orderly transaction between market participants, at the measurement date. It also establishes disclosures about fair value measurement.
Amendments to IAS 19 – Employee Benefits
The amendments to IAS 19 make significant changes to the recognition and measurement of defined benefit pension expense and termination benefits, and enhance the disclosures for employee benefits. Actuarial gains and losses are renamed ‘remeasurements’ and will be recognized immediately in OCI. Remeasurements recognized in OCI will not be recycled through profit or loss in subsequent periods. The amendments also accelerate the recognition of past service costs whereby they are recognized in the period of a plan amendment, irrespective of whether the benefits have vested. The annual expense for a funded benefit plan will be computed based on the application of the discount rate to the net defined benefit asset or liability, including interest on any liability in respect of minimum funding requirements.
A number of other amendments have been made to recognition, measurement and classification including those re-defining short-term and other long-term benefits guidance on the treatment of taxes related to benefit plans, guidance on risk/cost sharing factors and expanded disclosures.
Air Canada’s current accounting policy for employee benefits for the immediate recognition of actuarial gains and losses in OCI is consistent with the requirements in the new standard, however, additional disclosures and the computation of annual expense based on the application of the discount rate to the net defined benefit asset or liability will be required in relation to the revised standard, including interest on any liability in respect of minimum funding requirements.
Upon retrospective application of the new standard on January 1, 2013, Air Canada expects restated net income for 2012 to be lower than originally reported under the current accounting standard. The decrease is expected to arise from net financing expense relating to the pension benefit liability which will be calculated using the discount rate used to value the benefit obligation. As the discount rate is lower than the expected rate of return on plan assets, consistent with Air Canada’s current view and long-term historical experience, financing expense will increase as the interest attributable to plan assets will decline. The difference, if any, between the actual rate of return on plan assets and the discount rate, would be included in OCI as a remeasurement. Under the new standard, the interest cost on the additional minimum funding liability will be recorded in Air Canada’s consolidation statement of operations, whereas it is reported in OCI under the current standard. The impact of this change is estimated to decrease restated net income for 2012 in the amount of $102 million and increase OCI in the same amount, with no net impact on comprehensive
2012 Management’s Discussion and Analysis of Results of Operations and Financial Condition
62
income. This element, which was identified upon further evaluation of the standard, was not included in the expected impact previously provided in section 11 of Air Canada’s Third Quarter 2012 MD&A.
This impact is not expected to be indicative of 2013 expense as the additional minimum liability, which forms the basis of this element of interest cost, has been reduced from $1,965 million at December 31, 2011 to $335 million at December 31, 2012.
The total expected impact of the amended standard on Air Canada’s consolidated statement of operations, including the presentation of interest cost on the additional minimum funding liability, is an increase to Net financing expense relating to employee benefits of $272 million for the year ended December 31, 2012, and a decrease to Salary, wages and benefits of $2 million for the year ended December 31, 2012, with an offset to OCI of $273 million. The net result of these combine to produce an increase of $3 million to total comprehensive income, with a corresponding decrease of $3 million to the other employee future benefits liability for the year ended December 31, 2012. The amended standard will not impact Air Canada’s consolidated statement of cash flow.
Amendments to IAS 1 – Financial Statement Presentation
The amendments to IAS 1 require entities to separate items presented in OCI into two groups, based on whether or not they may be recycled to profit or loss in the future. Items that will not be recycled such as remeasurements related to IAS 19 will be presented separately from items that may be recycled in the future, such as deferred gains and losses on cash flow hedges. Entities that choose to present OCI items before tax will be required to show the amount of tax related to the two groups separately.
Amendments to Other Standards
In addition, there have been amendments to existing standards, including IFRS 7 Financial Instruments: Disclosure, IAS 27, Separate Financial Statements, IAS 28, Investments in Associates and Joint Ventures, and IAS 32, Financial Instruments: Presentation. IFRS 7 amendments require disclosure about the effects of offsetting financial assets and financial liabilities and related arrangements on an entity’s financial position. IAS 27 addresses accounting for subsidiaries, jointly controlled entities and associates in non-consolidated financial statements. IAS 28 has been amended to include joint ventures in its scope and to address the changes in IFRS 10 –13. IAS 32 addresses inconsistencies when applying the offsetting requirements, and is effective for annual periods beginning on or after January 1, 2014.
Carbon Emissions Accounting Policy
The European Union passed legislation for an Emissions Trading System (“ETS”) which includes carbon emissions from aviation which was to commence January 2012, including for flights operated between Canada and countries within the European Union. The legislation required aircraft operators to monitor and report on fuel use and emissions data.
In November 2012, the European Commission announced that it would defer the implementation of the ETS for international aviation pending the work that ICAO is doing on the multilateral global alternative program and the ICAO assembly in the fall of 2013. The portion of flights that constituted intra-European Union flying in 2012 were still subject to carbon emission reporting and surrender of allowance to cover the emissions. This amount represented an insignificant cost to Air Canada.
2012 Management’s Discussion and Analysis of Results of Operations and Financial Condition
63
15. OFF-BALANCE SHEET ARRANGEMENTS
The following is a summary of Air Canada’s more significant off-balance sheet arrangements.
Guarantees
Performance Obligations Relating to Aircraft Leasing Agreements
With respect to 23 Air Canada aircraft leases, the difference between the reduced rents as a result of the implementation of the Plan of Reorganization, Compromise and Arrangement under the CCAA on September 30, 2004, and amounts which would have been due under the original lease contracts will be forgiven at the expiry date of the leases if no material default has occurred by such date. In the event of a material default, which does not include any cross defaults to other unrelated agreements (including agreements with the counterparties of these aircraft leases), this difference plus interest will become due and payable and all future rent will be based on the original contracted rates. Rent expense is being recorded on the renegotiated lease agreements, and any additional liability would be recorded only at the time management believes the amount is likely to be incurred.
Guarantees in Fuel Facilities Arrangements
Air Canada participates in fuel facility arrangements operated through Fuel Facility Corporations, along with other airlines that contract for fuel services at various major airports in Canada. The Fuel Facility Corporations operate on a cost recovery basis. The purpose of the Fuel Facility Corporations is to own and finance the system that distributes the fuel to the contracting airlines, including leasing the land rights under the land lease. The aggregate debt of the five Fuel Facility Corporations in Canada that have not been consolidated by Air Canada under SIC Interpretation 12 – Consolidation of Special Purpose Entities is approximately $193 million as at December 31, 2012 (2011 - $187 million), which is Air Canada's maximum exposure to loss before taking into consideration the value of the assets that secure the obligations and any cost sharing that would occur amongst the other contracting airlines. Air Canada views this loss potential as remote. Each contracting airline participating in a Fuel Facility Corporation shares pro rata, based on system usage, in the guarantee of this debt. The maturities of these debt arrangements vary but generally extend beyond five years.
Indemnification Agreements
In the ordinary course of Air Canada’s business, Air Canada enters into a variety of agreements, some of which may provide for indemnifications to counterparties that may require Air Canada to pay for costs and/or losses incurred by such counterparties. Air Canada cannot reasonably estimate the potential amount, if any, it could be required to pay under such indemnifications. Such amount would also depend on the outcome of future events and conditions, which cannot be predicted. While certain agreements specify a maximum potential exposure, certain others do not specify a maximum amount or a limited period. Historically, Air Canada has not made any significant payments under these indemnifications.
Air Canada enters into real estate leases or operating agreements, which grant a license to Air Canada to use certain premises, in substantially all cities that it serves. It is common in such commercial lease transactions for Air Canada, as the lessee, to agree to indemnify the lessor and other related third parties for tort liabilities that arise out of or relate to Air Canada’s use or occupancy of the leased or licensed premises. Exceptionally, this indemnity extends to related liabilities arising from the negligence of the indemnified parties, but usually excludes any liabilities caused by their gross negligence or willful misconduct. Additionally, Air Canada typically indemnifies such parties for any environmental liability that arises out of or relates to its use or occupancy of the leased or licensed premises.
In aircraft financing or leasing agreements, Air Canada typically indemnifies the financing parties, trustees acting on their behalf and other related parties and/or lessors against liabilities that arise from the manufacture, design, ownership, financing, use, operation and maintenance of the aircraft and for tort liability, whether or not these liabilities arise out of or relate to the negligence of these indemnified parties, except for their gross negligence or willful misconduct. In addition, in aircraft financing or leasing transactions, including those structured as leveraged leases, Air Canada typically provides indemnities in respect of various tax consequences including in relation to the leased or financed aircraft, the use, possession, operation, maintenance, leasing, subleasing, repair, insurance, delivery, import, export of such aircraft, the lease or finance arrangements entered in connection therewith, changes of law and certain income, commodity and withholding tax consequences.
2012 Management’s Discussion and Analysis of Results of Operations and Financial Condition
64
When Air Canada, as a customer, enters into technical service agreements with service providers, primarily service providers who operate an airline as their main business, Air Canada has from time to time agreed to indemnify the service provider against certain liabilities that arise from third party claims, which may relate to the services performed by the service provider.
Under its general by-laws and pursuant to contractual agreements between Air Canada and each of its officers and directors, Air Canada has indemnification obligations to its directors and officers. Pursuant to such obligations, Air Canada indemnifies these individuals, to the extent permitted by law, against any and all claims or losses (including amounts paid in settlement of claims) incurred as a result of their service to Air Canada.
The maximum amount payable under the foregoing indemnities cannot be reasonably estimated. Air Canada expects that it would be covered by insurance for most tort liabilities and certain related contractual indemnities described above.
16. RELATED PARTY TRANSACTIONS
At December 31, 2012, Air Canada had no transactions with related parties as defined in the CICA Handbook – Part 1, except those pertaining to transactions with key management personnel in the ordinary course of their employment or directorship agreements.
2012 Management’s Discussion and Analysis of Results of Operations and Financial Condition
65
17. SENSITIVITY OF RESULTS
Air Canada’s financial results are subject to many different internal and external factors which can have a significant impact on operating results. The following table describes, on an indicative basis, the financial impact that changes in certain assumptions would generally have had on Air Canada’s operating results. These guidelines were derived from 2012 levels of activity and make use of management estimates. The impacts are not additive, do not reflect the interdependent relationship of the elements and actual results may vary significantly due to a wide range of factors many of which are beyond the control of Air Canada.
(Canadian dollars in millions, Favourable/(Unfavourable)
Except where indicated) 2012
Measure
Estimated Operating
Key Variable Sensitivity Factor Income Impact
Revenue Measures Passenger yield (cents) System 19.0 1% increase in yield $ 100
Canada 25.3 $ 39
Traffic (RPMs) (millions) System 55,646 1% increase in traffic $ 95
Canada 16,403 $ 37
Passenger load factor (%) System 82.7 1 percentage point increase $ 115
RASM (cents) System 15.8 1% increase in RASM $ 98
Cost Measures Fuel – WTI price (US$/barrel) (1) 95 US$1/barrel increase to WTI $ (25)
Fuel – jet fuel price (CAD cents/litre) (1) 89 1% increase $ (34)
Cost per ASM (cents) 17.4 1% increase in CASM $ (117)
Adjusted cost per ASM (cents) (2) 11.8 1% increase in adjusted CASM $ (79)
Currency Exchange
C$ to US$ C$1 = US$1.00 1 cent increase in exchange rate $ 33
(i.e., $1.01 to $1.00 per US dollar)
(1) Excludes the impact of fuel surcharges and fuel hedging. Refer to section 12 of this MD&A for information on Air Canada’s fuel derivative instruments.
(2) Adjusted CASM is a non-GAAP financial measure. In 2012, CASM was adjusted to exclude the impact of benefit plan amendments, fuel expense and the cost of ground packages at Air Canada Vacations. Refer to section 20 of this MD&A for additional information.
Favourable/(Unfavourable)
(Canadian dollars in millions) 2012
Measure
Estimated Pre-Tax
Key Variable Sensitivity Factor Income Impact
Currency Exchange
C$ to US$ C$1 = US$1.00 1 cent increase in exchange rate $ 54
(i.e., $1.01 to $1.00 per US dollar)
2012 Management’s Discussion and Analysis of Results of Operations and Financial Condition
66
18. RISK FACTORS
The risks described herein may not be the only risks faced by Air Canada. Other risks of which Air Canada is not aware or which Air Canada currently deems to be immaterial may surface and have a material adverse impact on Air Canada, its business, results from operations and financial condition.
Risks Relating to Air Canada
Operating Results
Prior to emergence, on September 30, 2004, from its restructuring under the CCAA, Air Canada had sustained significant losses and Air Canada may sustain significant losses in the future. Since emergence from CCAA to December 31, 2012, Air Canada has accumulated a deficit of $3,406 million in Shareholders’ Equity. A variety of factors, including economic conditions and other factors described in this Risk Factors section, may result in Air Canada incurring significant losses. Despite ongoing strategic and business initiatives, including efforts at securing cost reductions, revenue improvements as well as efforts relating to the launch of a low cost carrier, Air Canada may not be able to successfully achieve positive net profitability or realize the objectives of any or all of its initiatives, including those which seek to decrease costs, improve yield or offset or mitigate risks facing Air Canada, including those relating to economic conditions, labour issues, liquidity, pension funding, competition, and volatility in fuel costs and other expenses.
Leverage
Air Canada has, and is expected to continue to have and incur, a significant amount of indebtedness, including substantial fixed obligations under aircraft leases and other financings (including under the private offering of senior secured notes completed in 2010), and as a result of challenging economic or other conditions affecting Air Canada, Air Canada may incur greater levels of indebtedness than currently exist. The amount of indebtedness that Air Canada currently has and which it may incur in the future could have a material adverse effect on Air Canada, for example, by (i) limiting Air Canada’s ability to obtain additional financing, (ii) requiring Air Canada to dedicate a substantial portion of its cash flow from operations to payments on its indebtedness and fixed cost obligations, thereby reducing the funds available for other purposes, (iii) making Air Canada more vulnerable to economic downturns, and (iv) limiting Air Canada’s flexibility in planning for, or reacting to, competitive pressures or changes in its business environment.
The ability of Air Canada to make scheduled payments under its indebtedness will depend on, among other things, its future operating performance and its ability to refinance its indebtedness, if necessary. In addition, as Air Canada incurs indebtedness which bears interest at fluctuating interest rates, to the extent these interest rates increase, its interest expense will increase. There can be no assurance that Air Canada will be able to generate sufficient cash from its operations to pay its debts and lease obligations. Each of these factors is, to a large extent, subject to economic, financial, competitive, regulatory, operational and other factors, many of which are beyond Air Canada’s control.
Need for Additional Capital and Liquidity
Air Canada faces a number of challenges in its business, including in relation to economic conditions, pension plan funding, labour issues, volatile fuel prices, contractual covenants which require Air Canada to maintain minimum cash reserves and which could require Air Canada to deposit cash collateral with third parties, foreign exchange rates and increased competition from international, U.S. transborder and low-cost domestic carriers. Air Canada’s liquidity levels may be adversely impacted by these as well as by other factors and risks identified in this MD&A. As part of Air Canada’s efforts to meet such challenges and to support Air Canada’s business strategy, significant liquidity and significant operating and capital expenditures are, and will in the future be, required. There can be no assurance that Air Canada will continue to be able to obtain on a timely basis sufficient funds on terms acceptable to Air Canada to provide adequate liquidity and to finance the operating and capital expenditures necessary to overcome challenges and support its business strategy if cash flows from operations and cash on hand are insufficient.
2012 Management’s Discussion and Analysis of Results of Operations and Financial Condition
67
Failure to generate additional funds, whether from operations or additional debt or equity financings, could require Air Canada to delay or abandon some or all of its anticipated expenditures or to modify its business strategy and could have a material adverse effect on Air Canada, its business, results from operations and financial condition. Furthermore, competitors with greater liquidity or the ability to raise money more easily and on less onerous terms could represent a competitive disadvantage to Air Canada.
Air Canada’s credit ratings influence its ability to access capital markets and improve its liquidity. There can be no assurance that Air Canada’s credit ratings will not be downgraded, which would add to Air Canada’s borrowing costs, hamper its ability to attract capital, adversely impact its liquidity, and limit its ability to operate its business, all of which could have a material adverse effect on Air Canada, its business, results from operations and financial condition.
Economic and Geopolitical Conditions
Airline operating results are sensitive to economic and geopolitical conditions which can have a significant impact on Air Canada. For example, economic and geopolitical conditions may impact demand for air transportation in general or to or from certain destinations, and may also impact Air Canada’s operating costs, pension plan contributions, fuel costs, and costs and availability of capital and supplies required by Air Canada. Especially in light of Air Canada’s substantial fixed cost structure, any prolonged or significant impact arising from economic and geopolitical conditions, including weakness of the Canadian, U.S. or world economies could have a material adverse effect on Air Canada, its business, results from operations and financial condition.
Airline fares and passenger demand have fluctuated significantly in the past and may fluctuate significantly in the future. Air Canada is not able to predict with certainty market conditions and the fares that Air Canada may be able to charge. Customer expectations can change rapidly and the demand for lower fares may limit revenue opportunities. Travel, especially leisure travel, is a discretionary consumer expense. Demand for business and premium travel are also impacted by economic conditions. Depressed economic conditions in North America and other areas served by Air Canada, as well as geopolitical instability in various areas of the world, concerns about the environmental impacts of air travel and tendencies towards “green” travel initiatives where consumers reduce their travel activities, could have the effect of reducing demand for air travel in Canada and abroad and could materially adversely impact Air Canada’s profitability.
Pension Plans
Canadian federal pension legislation requires that the funded status of registered pension plans be determined periodically, on both a going concern basis (essentially assuming indefinite plan continuation) and a solvency basis (essentially assuming immediate plan termination).
Pension plan solvency valuations are influenced primarily by long-term interest rates and by the investment return on plan assets, which in turn may be dependent on a variety of factors, including economic conditions. The interest rate used to calculate benefit obligations for solvency purposes is a prescribed rate derived from the interest rates on long-term Government of Canada bonds. Deteriorating economic conditions or prolonged period of low interest rates may result in significant increases in Air Canada’s funding obligations, which could have a material adverse effect on Air Canada, its business, results from operations and financial condition.
Refer to section 9.7 of this MD&A for additional information relating to Air Canada’s pension funding obligations. In particular, as of 2014, the Air Canada 2009 Pension Regulations will cease to have effect and, absent the adoption and implementation of new rules establishing funding requirements within defined parameters applicable specifically to Air Canada, under generally applicable regulations, Air Canada's pension funding obligations may vary significantly based on a wide variety of factors, including regulatory developments, assumptions and methods used and changes in the economic conditions (mainly the return on fund assets and changes in interest rates) as well as the application of normal past service contribution rules which would generally require one fifth of any solvency deficit, determined on the basis of an average over the previous three years, to be funded each year in addition to required current service contributions.
Underfunded pension plans or a failure or inability by Air Canada to make required cash contributions to its registered pension plans may have a material adverse effect on Air Canada, its business, results from operations and financial condition.
2012 Management’s Discussion and Analysis of Results of Operations and Financial Condition
68
Fuel Costs
Fuel costs constituted the largest percentage of the total operating costs of Air Canada in 2012. Fuel prices fluctuate widely depending on many factors including international market conditions, geopolitical events, jet fuel refining costs and the Canada/U.S. dollar exchange rate. Air Canada cannot accurately predict fuel prices. Since approximately 2007, fuel prices have significantly increased and fluctuated near or at historically high levels. Should fuel prices fluctuate significantly or increase significantly above current levels, fuel costs could have a material adverse effect on Air Canada, its business, results from operations and financial condition. Due to the competitive nature of the airline industry, Air Canada may not be able to pass on increases in fuel prices to its customers by increasing its fares. Based on 2012 volumes, management estimates that a US$1 per barrel movement in the average price of West Texas Intermediate (“WTI”) crude oil would have resulted in an approximate $25 million change in 2012 fuel expense for Air Canada (excluding any impact of fuel surcharges, foreign exchange rates and fuel hedging), assuming flying capacity remained unchanged and that refining spreads between WTI crude oil and jet fuel as well as foreign exchange rates remained constant.
Foreign Exchange
Air Canada’s financial results are sensitive to the fluctuating value of the Canadian dollar. In particular, Air Canada has a significant annual net outflow of U.S. dollars and is affected by fluctuations in the U.S./Canada dollar exchange rate. Management estimates that during 2012, a $0.01 strengthening of the Canadian dollar versus the U.S. dollar (i.e., $1.01 to $1.00 per U.S. dollar) would have had an estimated $33 million favourable impact on operating income and a $54 million favourable impact on pre-tax income. Conversely, a corresponding opposite change in the exchange rate would have had the corresponding opposite effect. Air Canada incurs significant expenses in U.S. dollars for items such as fuel, aircraft rental and maintenance charges, interest payments, debt servicing and computerized reservations system fees, while a substantial portion of its revenues are generated in Canadian dollars. A significant deterioration of the Canadian dollar relative to the U.S. dollar would increase the costs of Air Canada relative to its U.S. competitors and could have a material adverse effect on Air Canada, its business, results from operations and financial condition. In addition, Air Canada may be unable to appropriately hedge the risks associated with fluctuations in exchange rates.
Competition
North America
Air Canada operates within a highly competitive industry. Over the past few years, several carriers have entered or announced their intention to enter or expand into the domestic (including regional), the U.S. transborder and international markets in which Air Canada operates.
Canadian low-cost and other carriers have entered and/or expanded or announced their intention to compete in many of Air Canada’s key domestic (including regional) markets and, along with some U.S. carriers have also entered and/or expanded their operations in the U.S. transborder and leisure-oriented markets. Carriers against which Air Canada competes, including U.S. carriers, may undergo (and some have undergone) substantial reorganizations (including by way of merger with or acquisition by another carrier), creating reduced levels of indebtedness and lower operating costs and may therefore be in a position to more effectively compete with Air Canada.
The proximity of several American airports in cities close to the Canadian border (such as Plattsburgh, Buffalo and Bellingham) has also presented an additional challenge for Air Canada. Higher taxes, charges and fees for passengers departing from Canada travelling to the U.S. has redirected appreciable passenger traffic away from Canadian airports. Low-cost carriers based in the U.S. have and may continue to increase their capacity at these airports and attract Canadian-originating, price-sensitive, leisure customers.
International
Air Canada is also facing increasing competition in international markets as carriers increase their international capacity, both by expansion and by shifting existing domestic capacity to international operations to avoid low-cost domestic competition.
2012 Management’s Discussion and Analysis of Results of Operations and Financial Condition
69
Given Canada’s diverse, sustained immigration levels and multicultural population, Canadian gateways such as Toronto, Montreal, and Vancouver are deemed attractive by international carriers. Alone for 2012, foreign carriers such as Air Algerie, Air China, British Airways, Egyptair, Korean Airlines, Lufthansa, Philippines Airlines, Saudi Arabian Airlines, and Turkish Airlines have entered or announced their intention to enter or expand their operations into Canada.
Increased competition in the domestic, transborder or international markets could have a material adverse effect on Air Canada, its business, results from operations and financial condition.
Labour Costs and Labour Relations
Labour costs constituted another one of Air Canada’s largest operating cost items in 2012. There can be no assurance that Air Canada will be able to maintain such costs at levels that do not negatively affect its business, results from operations and financial condition. There can be no assurance that future agreements with employees’ unions or the outcome of arbitrations will be on terms consistent with Air Canada’s expectations or comparable to agreements entered into by Air Canada’s competitors. Any future agreements or outcome of negotiations or arbitrations including in relation to wages or other labour costs or work rules may result in increased labour costs or other charges, which could have a material adverse effect on Air Canada, its business, results from operations and financial condition.
Most of Air Canada’s employees are unionized. In 2011, tentative collective agreements with the CAW, the union representing Air Canada’s customer service employees at airports and call centres, as well as with CUPE, the union representing Air Canada’s flight attendants, were concluded and, respectively, ratified or conclusively settled through arbitration. The agreement with the CAW is in effect until February 28, 2015 and the agreement with CUPE is in effect until March 31, 2015. In 2011, Air Canada also entered into a collective agreement with UNITE, the union representing the airline’s London Heathrow-based employees. In the first quarter of 2012, Air Canada concluded agreements with the CAW, in relation to in-flight crew schedulers and flight operations crew schedulers, and with CALDA, in relation to flight dispatchers. In June 2012, the decision of the arbitrator was issued in respect of the IAMAW final offer selection arbitration conducted in accordance with the process legislated by the federal government in the Protecting Air Service Act. The arbitrator’s final offer selection concluded a new five-year collective agreement between Air Canada and the IAMAW which is in effect until March 31, 2016. In July 2012, the decision of the arbitrator was issued in respect of the ACPA final offer selection arbitration conducted in accordance with the process legislated by the federal government in the Protecting Air Service Act. The arbitrator’s final offer selection concluded a new five-year collective agreement between Air Canada and ACPA which is in effect until April 1, 2016.
ACPA and the IAMAW have, each, independently, instituted proceedings to contest the constitutional validity of the legislation which referred to arbitration the resolution of the issues that had not been resolved in bargaining. Air Canada is not a party to these proceedings. Air Canada expects that in both cases the legislation (and therefore the collective agreements concluded through the arbitration process) will be upheld.
No strikes or lock-outs may lawfully occur during the term of the collective agreements, nor during the negotiations of their renewal until a number of pre-conditions, in respect of the unions for Canadian-based employees, prescribed by the Canada Labour Code, have been satisfied. There can be no assurance that collective agreements will be further renewed without labour conflict or action or that there will not otherwise be any labour conflict or action that could also lead to a degradation, interruption or stoppage in Air Canada’s service or otherwise adversely affect the ability of Air Canada to conduct its operations, any of which could have a material adverse effect on Air Canada, its business, results from operations and financial condition.
Any labour disruption or work stoppage by any of the unionized work groups of Jazz or other parties with whom Air Canada conducts business could have a material adverse effect on Air Canada, its business, results from operations and financial condition. In addition, labour conflicts at Star Alliance partners could result in lower demand for connecting traffic with Air Canada and, ultimately, could have a material adverse effect on Air Canada, its business, results from operations and financial condition.
Revenue and Alliance Environment
Air Canada also encounters substantial price competition. The prevalence of low-cost carriers, along with the advent of Internet travel websites and other travel products distribution channels, has resulted in a substantial increase in discounted and promotional fares initiated by Air Canada’s competitors. A decision to match competitors’ fares to
2012 Management’s Discussion and Analysis of Results of Operations and Financial Condition
70
maintain passenger traffic results in reduced yields which, in turn, could have a material adverse effect on Air Canada, its business, results from operations and financial condition. Furthermore, Air Canada’s ability to reduce its fares in order to effectively compete with other carriers is dependent on Air Canada’s ability to achieve acceptable operating margins and may also be limited by government policies to encourage competition. Likewise, competitors continue to pursue commissions/incentive actions and, in many cases, increase these payments. The decision to modify Air Canada’s current programs in order to remain competitive and maintain passenger traffic could result in increased costs to Air Canada’s business.
Furthermore, consolidation within the airline industry could result in increased competition as some airlines emerging from such consolidations and entering into integrated commercial cooperation arrangements, such as joint ventures, may be able to compete more effectively, which could have a material adverse effect on Air Canada.
Airline Industry Characterized by Low Gross Profit Margins and High Fixed Costs
The airline industry is characterized by low gross profit margins and high fixed costs. The costs of operating any particular flight do not vary significantly with the number of passengers carried and, therefore, a relatively small change in the number of passengers or in fare pricing or traffic mix would have a significant effect on Air Canada’s operating and financial results. This condition has been exacerbated by aggressive pricing by low-cost carriers, which has had the effect of driving down fares in general. Accordingly, a shortfall from expected revenue levels could have a material adverse effect on Air Canada, its business, results from operations and financial condition. As a result of high fixed costs, should Air Canada be required to reduce its overall capacity or the number of flights operated, it may not be able to successfully reduce certain fixed costs in the short-term and may be required to incur important termination or other restructuring costs, which could have a material adverse effect on Air Canada, its business, results from operations and financial condition.
Limitations Due to Restrictive Covenants
Some of the financing and other major agreements to which Air Canada is a party contain, and in the future may contain, restrictive, financial (including in relation to asset valuations, liquidity, minimum EBITDAR results, fixed charge coverage ratio and debt coverage ratios) and other covenants which affect and, in some cases, significantly limit or prohibit, among other things, the manner in which Air Canada may structure or operate its business, including by reducing Air Canada’s liquidity, limiting Air Canada’s ability to incur indebtedness, create liens, sell assets, pay dividends, make capital expenditures, and engage in acquisitions, mergers or restructurings or a change of control. Future financing and other major agreements may also be subject to similar covenants which limit Air Canada’s operating and financial flexibility, which could materially and adversely affect Air Canada’s ability to operate its business and its profitability.
A failure by Air Canada to comply with its contractual obligations (including restrictive, financial and other covenants), or to pay its indebtedness and fixed costs could result in a variety of material adverse consequences, including the acceleration of its indebtedness, the withholding of credit card proceeds by the credit card service providers and the exercise of remedies by its creditors, lessors or other co-contracting parties, and such defaults could trigger additional defaults under other indebtedness or agreements. In such a situation, Air Canada may not be able to repay the accelerated indebtedness or fulfill its obligations under certain contracts, make required aircraft lease payments or otherwise cover its fixed costs. Also, the lenders under the financing arrangements could foreclose upon all or substantially all of the assets of Air Canada which secure Air Canada’s obligations.
Refer to section 9.8 of this MD&A for information on Air Canada’s credit card processing agreements.
Strategic, Business, Technology and Other Important Initiatives
In order to operate its business, achieve its goals and remain competitive, Air Canada continuously seeks to identify and devise, invest in, implement and pursue strategic, business, technology and other important initiatives, such as those relating to participation in the low-cost market (including the planned launch of Air Canada rougeTM in the second half of 2013) the aircraft fleet restructuring (including the planned transfer of 15 Embraer 175 aircraft to Sky Regional), business processes, information technology, revenue management (including the planned implementation of Air Canada’s revenue management system), cost transformation, improving premium passenger revenues, expansion of flying capacity (including in respect of new routes), corporate culture transformation, initiatives seeking to ensure a consistently high quality customer service experience and others. These initiatives, including activities relating to their
2012 Management’s Discussion and Analysis of Results of Operations and Financial Condition
71
development and implementation, may be adversely impacted by a wide range of factors, many of which are beyond Air Canada’s control. Such factors include the need to seek legal or regulatory approvals, the performance of third parties, including suppliers, the implementation and integration of such initiatives into Air Canada’s other activities and processes as well as the adoption and acceptance of these initiatives by Air Canada’s customers, suppliers, unions and personnel. A delay or failure to sufficiently and successfully identify and devise, invest in or implement these initiatives could adversely affect Air Canada’s ability to operate its business, achieve its goals and remain competitive and could have a material adverse effect on Air Canada, its business, results from operations and financial condition.
For instance, a key component of Air Canada’s business plan is the acquisition of new and more efficient Boeing 787 aircraft. A delay or failure in the completion of Air Canada’s fleet restructuring, including further delays by the manufacturers in the delivery of the widebody aircraft, or an inability to remove, as planned, certain aircraft from the fleet in coordination with the planned entry into service of new aircraft, could adversely affect the implementation of Air Canada’s business plan which may, in turn, have a material adverse effect on Air Canada, its business, results from operations and financial condition.
Airport User Fees and Air Navigation Fees
With the privatization of airports and air navigation authorities in Canada, airport and air navigation authorities have significantly increased their fees. Though certain authorities have implemented some fee reductions, if authorities in Canada or elsewhere were to significantly increase their fees, Air Canada, its business, results from operations and financial condition could be materially adversely affected.
Dependence on Technology
Air Canada relies heavily on technology, including computer and telecommunications equipment and software and internet-based systems, to operate its business, increase its revenues and reduce its costs. These systems include those relating to Air Canada’s telecommunications, websites, computerized airline reservations and airport customer services and flight operations.
These technology systems may be vulnerable to a variety of sources of failure, interruption or misuse, including by reason of third party suppliers’ acts or omissions, natural disasters, terrorist attacks, telecommunications failures, power failures, computer viruses, unauthorized or fraudulent users, and other operational and security issues. While Air Canada continues to invest in initiatives, including security initiatives and disaster recovery plans, these measures may not be adequate or implemented properly. Any such technology systems failure, interruption or misuse, whether at Air Canada or a third party on whom Air Canada relies, could materially and adversely affect Air Canada’s operations and could have a material adverse effect on Air Canada, its business, results from operations and financial condition.
Key Supplies and Suppliers
Air Canada is dependent upon its ability to source, on favourable terms and costs, sufficient quantities of goods and services in a timely manner, including those available at airports or from airport authorities or otherwise required for Air Canada’s operations such as fuel, aircraft and related parts and aircraft maintenance services. In certain cases, Air Canada may only be able to access goods and services from a limited number of suppliers and transition to new suppliers (including aircraft maintenance service providers to whom Air Canada transitioned following Aveos’ closure) may take a significant amount of time and require significant resources. A failure, refusal or inability of a supplier may arise as a result of a wide range of causes, many of which are beyond Air Canada’s control. In addition, there can be no assurance as to the continued viability of any of Air Canada’s suppliers. Any failure or inability of Air Canada to successfully source goods and services, including by reason of a failure, refusal or inability of a supplier, or to source goods and services on terms and pricing and within the timeframes acceptable to Air Canada, could have a material adverse effect on Air Canada, its business, results from operations and financial condition.
Aeroplan®
Through its commercial agreement with Aeroplan, Air Canada is able to offer its customers who are Aeroplan® members the opportunity to earn Aeroplan® Miles. Based on customer surveys, management believes that rewarding customers with Aeroplan® Miles is a significant factor in customers’ decision to travel with Air Canada and contributes to building customer loyalty. The failure by Aeroplan to adequately fulfill its obligations towards Air Canada under the Aeroplan Commercial Participation and Services Agreement and in connection with the Aeroplan program, or other unexpected
2012 Management’s Discussion and Analysis of Results of Operations and Financial Condition
72
interruptions or disruptions of Aeroplan services which are beyond Air Canada’s control, could have a material adverse effect on Air Canada, its business, results from operations and financial condition.
Regional Carriers
Air Canada seeks to enhance its network through capacity purchase agreements, including the Jazz CPA and other capacity purchase agreements with regional airlines, such as Sky Regional, operating flights on behalf of Air Canada.
Under the Jazz CPA, Jazz provides Air Canada’s customers service in lower density markets and higher density markets at off-peak times throughout Canada and to and from certain destinations in the United States and also provides valuable traffic feed to Air Canada’s mainline routes. Pursuant to the terms of the Jazz CPA, Air Canada pays Jazz a number of fees which are determined based upon certain costs incurred by Jazz. Air Canada also reimburses Jazz, without mark-up, for certain pass-through costs incurred directly by Jazz, such as fuel, navigation, landing and terminal fees and certain other costs. Significant increases in such pass-through costs, the failure by Jazz to adequately fulfill its obligations under the Jazz CPA, or other unexpected interruptions or cessation of Jazz’s services which are beyond Air Canada’s control could have a material adverse effect on Air Canada, its business, results from operations and financial condition. In addition, the Jazz CPA requires that Jazz maintain a minimum fleet size and contains a minimum average daily utilization guarantee which requires that Air Canada make certain minimum payments to Jazz regardless of the amount of flying done on its behalf by Jazz.
The failure by Air Canada’s other regional carriers to fulfill their obligations under their respective agreements, or other unexpected interruptions or disruptions of their services which are beyond Air Canada’s control could have a material adverse effect on Air Canada, its business, results from operations and financial condition.
Star Alliance™
The strategic and commercial arrangements with Star Alliance members provide Air Canada with important benefits, including codesharing, efficient connections and transfers, reciprocal participation in frequent flyer programs and use of airport lounges from the other members. Should a key member leave Star Alliance or otherwise fail to meet its obligations thereunder, Air Canada, its business, results from operations and financial condition could be materially adversely affected.
Interruptions or Disruptions in Service
Air Canada’s business is significantly dependent upon its ability to operate without interruption at a number of hub airports, including Toronto Pearson International Airport. Delays or disruptions in service, including those due to security or other incidents, weather conditions, labour conflicts with airport workers, baggage handlers, air traffic controllers and other workers not employed by Air Canada or other causes beyond the control of Air Canada could have a material adverse impact on Air Canada, its business, results from operations and financial condition.
Interruptions and disruptions in service may be caused by, and the demand and cost of air travel may be adversely impacted by, environmental conditions and factors in addition to those relating to the weather. Environmental conditions and factors, such as those arising from volcanic eruptions or other natural phenomena, as well as those arising from man-made sources, could cause interruptions and disruptions in service, increase Air Canada’s costs or adversely impact demand for air travel, any of which could have a material adverse impact on Air Canada, its business, results from operations and financial condition.
Current Legal Proceedings
Investigations by Competition Authorities Relating to Cargo
The European Commission and the United States Department of Justice investigated and the Competition Bureau in Canada is investigating alleged anti-competitive cargo pricing activities, including the levying of certain fuel surcharges, of a number of airlines and cargo operators, including Air Canada. Competition authorities in several jurisdictions have sought or requested information from Air Canada as part of their investigations. Air Canada has been cooperating with these investigations, which are likely to lead, or have led, to proceedings against Air Canada and a number of airlines and other cargo operators in certain jurisdictions. Air Canada is also named as a defendant, and may otherwise become implicated, in a number of class action lawsuits and other proceedings that have been filed before the United States
2012 Management’s Discussion and Analysis of Results of Operations and Financial Condition
73
District Court, in Canada and Europe in connection with these allegations. In the United States, the investigation by the US Department of Justice has concluded with no proceedings having been instituted against Air Canada and, in 2012, Air Canada entered into a settlement agreement relating to class action proceedings in the United States in connection with these allegations under which Air Canada made no admission of liability. Under the settlement agreement for which final court approval was obtained, a payment of $8 million was made by Air Canada in 2012.
In 2010, the European Commissions issued a decision finding that 12 air cargo carriers (including groups of related carriers) had infringed European Union competition law in the setting of certain cargo charges and rates for various periods between 1999 and 2006. Air Canada was among the carriers subject to the decision and a fine of 21 million Euros (approximately C$29 million at an exchange rate of $1.3970) was imposed on Air Canada. Air Canada is appealing this decision and filed an application for appeal before the European General Court. In 2011, Air Canada paid the fine, as required, pending the outcome of its appeal.
As at December 31, 2012, Air Canada has a provision of $29 million relating to outstanding claims in this matter, which is recorded in accounts payable and accrued liabilities on Air Canada’s consolidated statement of financial position. This provision is an estimate based upon the status of the investigations and proceedings at this time and Air Canada’s assessment as to the potential outcome for certain of them. The provision does not address the proceedings and investigations in all jurisdictions, but only where there is sufficient information to do so. Air Canada has determined it is not possible at this time to predict with any degree of certainty the outcome of all proceedings and investigations. As stated above, Air Canada is appealing the decision issued by the European Commission and, if and as appropriate, based on the outcome of any updates regarding this appeal as well as developments regarding proceedings and investigations in other jurisdictions, may record adjustments to the provision and/or its income in subsequent periods as required.
Billy Bishop Toronto City Airport
In February 2006, Jazz commenced proceedings before the Ontario Superior Court of Justice against Porter Airlines Inc. (“Porter”) and other defendants (collectively the “Porter Defendants”) after Jazz became aware that it would be excluded from operating flights from Billy Bishop Toronto City Airport. On October 26, 2007, the Porter Defendants counter-claimed against Jazz and Air Canada alleging various violations of competition law, including that Jazz and Air Canada’s commercial relationship contravenes Canadian competition laws, and claiming $850 million in damages. On October 16, 2009, Jazz discontinued its suit in the Ontario Superior Court against Porter.
The counterclaim filed by Porter in the Ontario Superior Court of Justice against Jazz and Air Canada was stayed pending the outcome of a mirror counterclaim made by Porter in the Federal Court in relation to proceedings in the Federal Court that have been discontinued. This stay in the Ontario Superior Court has now been lifted and the counterclaim has been reactivated. Management views Porter’s counterclaim as being without merit.
Pay Equity
The Canadian Union of Public Employees (“CUPE”), which represents Air Canada’s flight attendants, filed a complaint in 1991 before the Canadian Human Rights Commission alleging gender-based wage discrimination. CUPE claims the predominantly female flight attendant group should be paid the same as the predominantly male pilot and mechanics groups because their work is of equal value. Litigation on a preliminary matter was pursued through the Supreme Court of Canada, and the Commission did not begin investigating the complaint on the merits until March 2007. The Commission concluded its investigation in 2011 and decided not to refer the complaint to the Canadian Human Rights Tribunal for inquiry. CUPE has initiated proceedings before the Federal Court to challenge this determination, which Air Canada is seeking to have upheld. Air Canada considers that any proceedings will show that it is complying with the equal pay provisions of the Canadian Human Rights Act however, management has determined that it is not possible at this time to predict with any degree of certainty the final outcome of the proceedings.
Mandatory Retirement
Air Canada is engaged in a number of proceedings involving challenges to the mandatory retirement provisions of certain of its collective agreements, including the Air Canada–Air Canada Pilots Association (“ACPA”) collective agreement which incorporate provisions of the pension plan terms and conditions applicable to pilots requiring them to retire at age 60. Air Canada has fully or partially resolved some of these complaints and is defending others. At this time, it is not possible to determine with any degree of certainty the extent of any financial liability that may arise from Air Canada being unsuccessful in its defence of these proceedings.
2012 Management’s Discussion and Analysis of Results of Operations and Financial Condition
74
Future Legal Proceedings
Airlines are susceptible to various claims and litigation, including class action claims, in the course of operating their business or with respect to the interpretation of existing agreements. Any future claims or litigation could also have a material adverse effect on Air Canada, its business, results from operations and financial condition.
Key Personnel
Air Canada is dependent on the experience and industry knowledge of its executive officers and other key employees to execute its business plan. If Air Canada were to experience a substantial turnover in its leadership or other key employees, Air Canada, its business, results from operations and financial condition could be materially adversely affected. Additionally, Air Canada may be unable to attract and retain additional qualified key personnel as needed in the future.
Risks Relating to the Airline Industry
Terrorist Attacks and Security Measures
The potential for terrorist attacks and terrorist activity causes uncertainty in the minds of the traveling public. The occurrence of a terrorist attack (or attempted attacks) (whether domestic or international and whether involving Air Canada or another carrier or no carrier at all) and increasingly restrictive security measures, such as those relating to the content of carry-on baggage, passenger identification document requirements, and passenger screening procedures could have a material adverse effect on passenger demand for air travel and on the number of passengers traveling on Air Canada’s flights. It could also lead to a substantial increase in insurance, airport security and other costs. Any resulting reduction in passenger revenues and/or increases in costs, including insurance, security or other costs could have a material adverse effect on Air Canada, its business, results from operations and financial condition.
Epidemic Diseases (Severe Acute Respiratory Syndrome (SARS), H1N1 Influenza or Other Epidemic Diseases)
The international outbreaks of Severe Acute Respiratory Syndrome (SARS) in 2003, and the resulting actions of the World Health Organization (the “WHO”), including a travel advisory against non-essential travel to Toronto, Canada, had a significant adverse effect on passenger demand for air travel in Air Canada’s markets and resulted in a major negative impact on traffic on the entire network. An outbreak of influenza, SARS, H1N1 influenza virus or of another epidemic disease (whether domestic or international) or any WHO or similar travel advisories (whether relating to Canadian cities or regions or other cities, regions or countries) could have a material adverse effect on passenger demand for air travel. Any resulting reduction in traffic in the markets served by Air Canada could have a material adverse effect on Air Canada, its business, results from operations and financial condition.
Casualty Losses
Due to the nature of its core operating business, Air Canada may be subject to liability claims arising out of accidents or disasters involving aircraft on which Air Canada’s customers are traveling or involving aircraft of other carriers maintained or repaired by Air Canada, including claims for serious personal injury or death. There can be no assurance that Air Canada’s insurance coverage will be sufficient to cover one or more large claims and any shortfall may be material. Additionally, any accident or disaster involving an aircraft operated by or on behalf of Air Canada or an aircraft of another carrier receiving line maintenance services from Air Canada may significantly harm Air Canada’s reputation for safety, which would have a material adverse effect on Air Canada, its business, results from operations and financial condition.
Seasonal Nature of the Business, Other Factors and Prior Performance
Air Canada has historically experienced considerably greater demand for its services in the second and third quarters of the calendar year and significantly lower demand in the first and fourth quarters of the calendar year. This demand pattern is principally a result of the preference of a high number of leisure travelers to travel during the spring and summer months. Air Canada has substantial fixed costs that do not meaningfully fluctuate with passenger demand in the short-term.
2012 Management’s Discussion and Analysis of Results of Operations and Financial Condition
75
As described elsewhere, demand for and cost of air travel is also affected by factors such as geopolitical and economic conditions, war or the threat of war or terrorist attacks, fare levels and weather conditions. Due to these and other factors, operating results for an interim period are not necessarily indicative of operating results for an entire year, and operating results for an historical period are not necessarily indicative of operating results for a future period.
Regulatory Matters
The airline industry is subject to extensive Canadian and foreign government regulations relating to, among other things, security, safety, consumer rights, privacy, licensing, competition, environment (including noise levels and carbon emissions) and, in some measure, pricing. For example, new and proposed legislation have been considered or adopted concerning carbon emissions emanating from the aviation industry. Such legislative initiatives include, for example, market-based mechanisms called emissions trading systems, which are being proposed and implemented to reduce the amount of carbon emissions through the setting of emissions allowances and charging aircraft operators for a certain percentage of theses allowances. The implementation of additional regulations or decisions, including those relating to carbon emissions, and others, whether by Transport Canada, the Competition Bureau and/or the Competition Tribunal, the Canadian Transportation Agency or other domestic or foreign governmental entities, may have a material adverse effect on Air Canada, its business, results from operations and financial condition.
The European Union passed legislation for an Emissions Trading System, which will include carbon emissions from aviation commencing in January 2012, including for flights operated between Canada and countries within the European Union. The legislation requires aircraft operators to monitor and report on fuel use and emissions data. While this legislation is expected to result in increased costs relating to the purchase of emissions allowances, the net financial impact will, in part, depend upon how much of such cost, if any, will be recovered, including in the form of higher passenger fares and cargo rates. In November 2012, the European Commission announced that it would defer their Emissions Trading System for international aviation by approximately eleven months pending an anticipated agreement on a multilateral global alternative program being agreed by the ICAO Assembly in the fall of 2013.
The availability of international routes to Canadian air carriers is regulated by agreements between Canada and foreign governments. Changes in Canadian or foreign government aviation policy could result in the alteration or termination of these agreements and could adversely affect Air Canada and its international operations.
Air Canada is subject to domestic and foreign laws regarding privacy of passenger and employee data, including advance passenger information and access to airline reservation systems, which are not consistent in all countries in which Air Canada operates. The need to comply with these regulatory regimes results in additional operating costs and further regulation in this area could have a material adverse effect on Air Canada, its business, results from operations and financial condition.
There can be no assurances that new laws, regulations or revisions to same, or decisions, will not be adopted or rendered, from time to time, and these could impose additional requirements or restrictions, which may adversely impact Air Canada, its business, results from operations and financial condition.
Availability of Insurance Coverage and Increased Insurance Costs
The aviation insurance industry has been continually re-evaluating the terrorism risks that it covers, and this activity may adversely affect some of Air Canada’s existing insurance carriers or Air Canada’s ability to obtain future insurance coverage. To the extent that Air Canada’s existing insurance carriers are unable or unwilling to provide it with insurance coverage, and in the absence of measures by the Government of Canada to provide the required coverage, Air Canada’s insurance costs may increase further and may result in Air Canada being in breach of regulatory requirements or contractual arrangements requiring that specific insurance be maintained, which may have a material adverse effect on Air Canada, its business, results from operations and financial condition.
Third Party War Risk Insurance
There is a risk that the Government of Canada may not continue to provide an indemnity for third party war risk liability coverage, which it currently provides to Air Canada and certain other carriers in Canada until December 31, 2013. In the event that the Government of Canada does not continue to provide such indemnity or amends such indemnity, Air Canada and other industry participants would have to turn to the commercial insurance market to seek such coverage.
2012 Management’s Discussion and Analysis of Results of Operations and Financial Condition
76
Air Canada estimates that such coverage would cost Air Canada approximately US$3 million per year. Alternative solutions, such as those envisioned by the International Civil Aviation Organization (“ICAO”) and the International Air Transport Association (“IATA”), have not developed as planned, due to actions taken by other countries and the recent availability of supplemental insurance products. ICAO and IATA are continuing their efforts in this area; however, the achievement of a global solution is not likely in the immediate or near future. The U.S. federal government has set up its own facility to provide war risk coverage to U.S. carriers, thus removing itself as a key component of any global plan.
2012 Management’s Discussion and Analysis of Results of Operations and Financial Condition
77
19. CONTROLS AND PROCEDURES
Disclosure Controls and Procedures and Internal Controls over Financial Reporting
Disclosure controls and procedures within the Corporation have been designed to provide reasonable assurance that all relevant information is identified to its President and Chief Executive Officer (“CEO”), its Executive Vice President and Chief Financial Officer (“CFO”) and its Disclosure Policy Committee to ensure appropriate and timely decisions are made regarding public disclosure.
Internal controls over financial reporting have been designed by management, under the supervision of, and with the participation of the Corporation's CEO and CFO, to provide reasonable assurance regarding the reliability of the Corporation’s financial reporting and its preparation of financial statements for external purposes in accordance with GAAP.
The Corporation will file certifications, signed by the Corporation's CEO and CFO, with the Canadian Securities Administrators (“CSA”) upon filing of the Corporation’s Annual Information Form. In those filings, the Corporation’s CEO and CFO will certify, as required by National Instrument 52-109, the appropriateness of the financial disclosure, the design and effectiveness of the Corporation’s disclosure controls and procedures and the design and effectiveness of internal controls over financial reporting. The Corporation’s CEO and CFO also certify the appropriateness of the financial disclosures in the Corporation’s interim filings with securities regulators. In those interim filings, the Corporation’s CEO and CFO also certify the design of the Corporation’s disclosure controls and procedures and the design of internal controls over financial reporting.
The Corporation’s Audit, Finance and Risk Committee reviewed this MD&A and the audited consolidated financial statements, and the Corporation’s Board of Directors approved these documents prior to their release.
Management’s Report on Disclosure Controls and Procedures
Management, under the supervision of and with the participation of the Corporation's CEO and CFO, evaluated the effectiveness of the Corporation's disclosure controls and procedures (as defined under National Instrument 52-109) and concluded, as at December 31, 2012, that such disclosure controls and procedures were effective.
Management’s Report on Internal Controls over Financial Reporting
Management, under the supervision of and with the participation of the Corporation’s CEO and CFO, evaluated the effectiveness of the Corporation’s internal controls over financial reporting (as defined under National Instrument 52-109). In making this evaluation, management used the criteria set forth by the Committee of Sponsoring Organizations of the Treadway Commissions (“COSO”) in Internal Control - Integrated Framework. Based on that evaluation, management and the CEO and CFO have concluded that, as at December 31, 2012, the Corporation’s internal controls over financial reporting were effective. This evaluation took into consideration the Corporation’s Corporate Disclosure Policy and the functioning of its Disclosure Policy Committee.
Changes in Internal Controls over Financial Reporting
There have been no changes to the Corporation’s internal controls over financial reporting during the year ended December 31, 2012 that have materially affected, or are reasonably likely to materially affect, its internal controls over financial reporting.
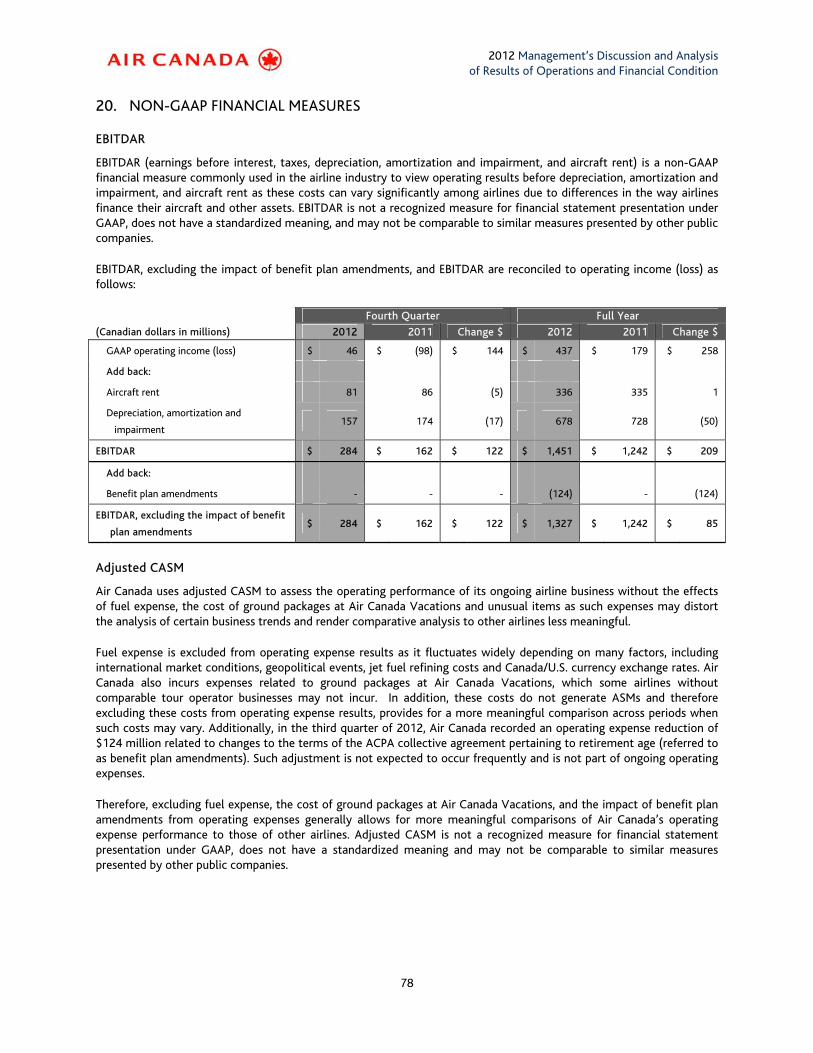
2012 Management’s Discussion and Analysis of Results of Operations and Financial Condition
78
20. NON-GAAP FINANCIAL MEASURES
EBITDAR
EBITDAR (earnings before interest, taxes, depreciation, amortization and impairment, and aircraft rent) is a non-GAAP financial measure commonly used in the airline industry to view operating results before depreciation, amortization and impairment, and aircraft rent as these costs can vary significantly among airlines due to differences in the way airlines finance their aircraft and other assets. EBITDAR is not a recognized measure for financial statement presentation under GAAP, does not have a standardized meaning, and may not be comparable to similar measures presented by other public companies.
EBITDAR, excluding the impact of benefit plan amendments, and EBITDAR are reconciled to operating income (loss) as follows:
Fourth Quarter Full Year
(Canadian dollars in millions) 2012 2011 Change $ 2012 2011 Change $
GAAP operating income (loss) $ 46 $ (98) $ 144 $ 437 $ 179 $ 258
Add back:
Aircraft rent 81 86 (5) 336 335 1
Depreciation, amortization and
impairment 157 174 (17) 678 728 (50)
EBITDAR $ 284 $ 162 $ 122 $ 1,451 $ 1,242 $ 209
Add back:
Benefit plan amendments - - - (124) - (124)
EBITDAR, excluding the impact of benefit
plan amendments $ 284 $ 162 $ 122 $ 1,327 $ 1,242 $ 85
Adjusted CASM
Air Canada uses adjusted CASM to assess the operating performance of its ongoing airline business without the effects of fuel expense, the cost of ground packages at Air Canada Vacations and unusual items as such expenses may distort the analysis of certain business trends and render comparative analysis to other airlines less meaningful.
Fuel expense is excluded from operating expense results as it fluctuates widely depending on many factors, including international market conditions, geopolitical events, jet fuel refining costs and Canada/U.S. currency exchange rates. Air Canada also incurs expenses related to ground packages at Air Canada Vacations, which some airlines without comparable tour operator businesses may not incur. In addition, these costs do not generate ASMs and therefore excluding these costs from operating expense results, provides for a more meaningful comparison across periods when such costs may vary. Additionally, in the third quarter of 2012, Air Canada recorded an operating expense reduction of $124 million related to changes to the terms of the ACPA collective agreement pertaining to retirement age (referred to as benefit plan amendments). Such adjustment is not expected to occur frequently and is not part of ongoing operating expenses.
Therefore, excluding fuel expense, the cost of ground packages at Air Canada Vacations, and the impact of benefit plan amendments from operating expenses generally allows for more meaningful comparisons of Air Canada’s operating expense performance to those of other airlines. Adjusted CASM is not a recognized measure for financial statement presentation under GAAP, does not have a standardized meaning and may not be comparable to similar measures presented by other public companies.

2012 Management’s Discussion and Analysis of Results of Operations and Financial Condition
79
Adjusted CASM is reconciled to GAAP operating expense as follows:
Fourth Quarter Full Year
(Canadian dollars in millions, except where indicated)
2012 2011 Change 2012 2011 Change
GAAP operating expense $ 2,795 $ 2,797 $ (2) $ 11,683 $ 11,433 $ 250
Remove:
Aircraft fuel (821) (808) (13) (3,561) (3,375) (186)
Cost of ground packages at Air Canada
Vacations (57) (57) - (319) (307) (12)
Benefit plan amendments - - - 124 - 124
Operating expense, excluding the above-
noted items $ 1,917 $ 1,932 $ (15) $ 7,927 $ 7,751 $ 176
ASMs (millions) 15,484 15,290 1.3% 67,269 66,460 1.2%
Adjusted CASM (cents) ¢ 12.4 ¢ 12.6 (2.0%) ¢ 11.8 ¢ 11.7 1.0%
Adjusted Net Income (Loss) and Adjusted Net Income (Loss) Per Share – Diluted
Air Canada uses adjusted net income (loss) and adjusted net income (loss) per share – diluted to assess the performance of its business without the effects of foreign exchange, net financing income (expense) relating to employee benefits, mark-to-market adjustments on derivatives and other financial instruments recorded at fair value and unusual items. These measures are not recognized measures for financial statement presentation under GAAP, do not have a standardized meaning and may not be comparable to similar measures presented by other public companies.
Fourth Quarter Full Year
(Canadian dollars in millions, except per share values) 2012 2011 Change $ 2012 2011 Change $
Net income (loss) for the period
attributable to shareholders $ 7 $ (62) $ 69 $ 127 $ (255) $ 382
Remove:
Benefit plan amendments - - - (124) - (124)
Foreign exchange (gain) loss (9) (114) 105 (106) 54 (160)
Net financing expense (income) relating
to employee benefits 3 4 (1) 16 16 -
(Gain ) loss on financial instruments
recorded at fair value (7) 5 (12) 20 63 (43)
Loss on investment in Aveos - - - 65 - 65
Discontinued operations – Aveos - - - 55 - 55
Adjusted net income (loss) $ (6) $ (167) $ 161 $ 53 $ (122) $ 175
Weighted average number of
outstanding shares used in computing
diluted income per share (in millions)
276 277 (1) 278 278 -
Adjusted net income (loss) per share –
diluted $ (0.02) $ (0.60) $ 0.58 $ 0.19 $ (0.44) $ 0.63
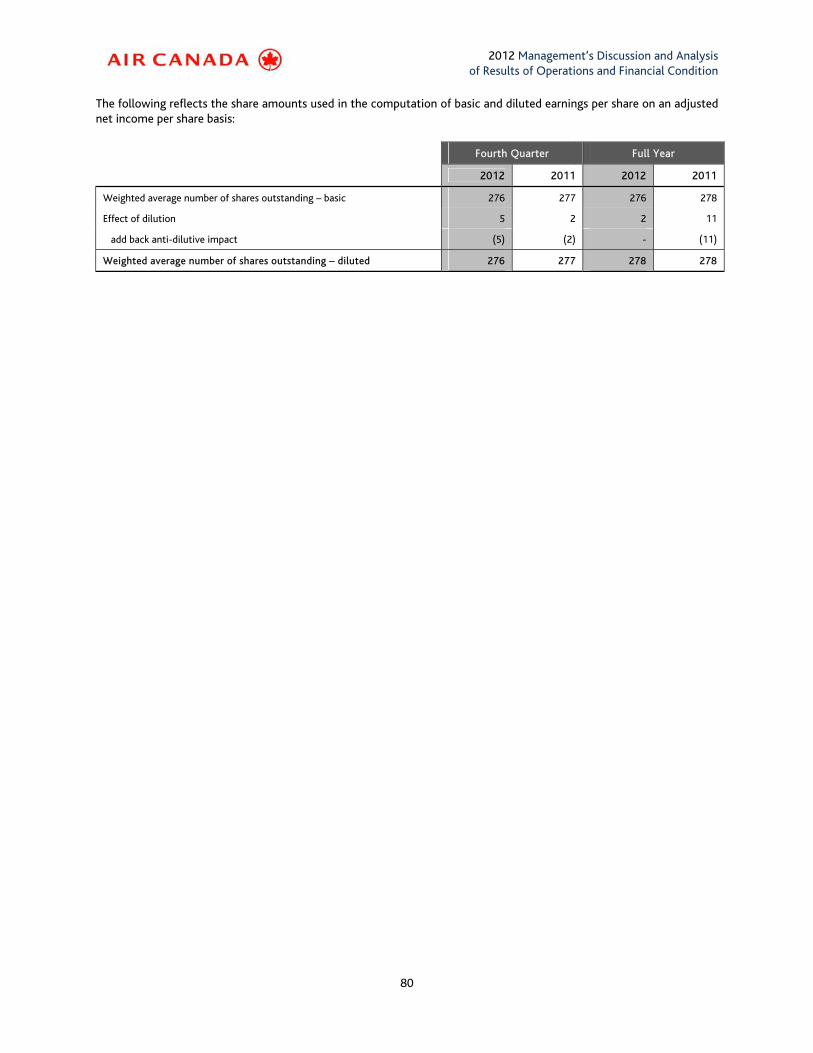
2012 Management’s Discussion and Analysis of Results of Operations and Financial Condition
80
The following reflects the share amounts used in the computation of basic and diluted earnings per share on an adjusted net income per share basis:
Fourth Quarter Full Year
2012 2011 2012 2011
Weighted average number of shares outstanding – basic 276 277 276 278
Effect of dilution 5 2 2 11
add back anti-dilutive impact (5) (2) - (11)
Weighted average number of shares outstanding – diluted 276 277 278 278
2012 Management’s Discussion and Analysis of Results of Operations and Financial Condition
81
21. GLOSSARY
ACPA – Refers to the Air Canada Pilots Association.
Adjusted CASM – Refers to operating expense per ASM adjusted to remove the effects of fuel expense, the cost of ground packages at Air Canada Vacations and unusual items. Refer to section 20 of this MD&A for additional information.
Adjusted net income – Refers to the consolidated net income (loss) of the Corporation attributable to the shareholders of Air Canada adjusted to remove the effects of (to the extent included in consolidated net income (loss)) foreign exchange, net financing income (expense) relating to employee benefits, mark-to-market adjustments on derivatives and other financial instruments recorded at fair value and unusual items. Refer to section 20 of this MD&A for additional information.
Atlantic passenger and cargo revenues – Refers to revenues from flights that cross the Atlantic Ocean with origins and destinations principally in Europe.
Available Seat Miles or ASMs – Refers to a measure of passenger capacity calculated by multiplying the total number of seats available for passengers by the miles flown.
CALDA – Refers to the Canadian Airline Dispatchers Association.
CASM – Refers to operating expense per ASM.
CAW – Refers to the Canadian Auto Workers.
CUPE – Refers to the Canadian Union of Public Employees.
EBITDAR – EBITDAR is earnings before interest, taxes, depreciation, amortization and impairment, and aircraft rent and is a non-GAAP financial measure commonly used in the airline industry to view operating results before depreciation, amortization and impairment, and aircraft rent as these costs can vary significantly among airlines due to differences in the way airlines finance their aircraft and other assets. Refer to section 20 of this MD&A for additional information.
Effective Ton Miles or ETMs – Refers to the mathematical product of tonnage capacity times distance hauled.
IAMAW – Refers to the International Association of Machinists and Aerospace Workers.
IATA – Refers to the International Air Transport Association.
Other passenger and cargo revenues – Refers to revenues from flights with origins and destinations principally in Central and South America, Australia, the Caribbean and Mexico.
Pacific passenger and cargo revenues – Refers to revenues from flights that cross the Pacific Ocean with origins and destinations principally in Asia.
Passenger Load Factor – Refers to a measure of passenger capacity utilization derived by expressing Revenue Passenger Miles as a percentage of Available Seat Miles.
Passenger Revenue per Available Seat Mile or RASM – Refers to average passenger revenue per ASM (baggage fee revenues, which are included in passenger revenues, are removed for the purposes of calculating RASM).
Percentage point (pp) – Refers to a measure for the arithmetic difference of two percentages.
Revenue Passenger Carried – Refers to IATA’s definition of passenger carried whereby passengers are counted on a flight no. basis rather than by journey/itinerary or by leg.
2012 Management’s Discussion and Analysis of Results of Operations and Financial Condition
82
Revenue Passenger Miles or RPMs – Refers to a measure of passenger traffic calculated by multiplying the total number of revenue passengers carried by the miles they are carried.
Revenue Ton Miles or RTMs – Refers to the mathematical product of weight in tons of a shipment being transported by the number of miles that it is transported.
Yield – Refers to average passenger revenue per RPM (baggage fee revenues, which are included in passenger revenues, are removed for the purposes of calculating yield).