2012 north dakota statewide housing needs - vision west nd
TRANSCRIPT
2012 NORTH DAKOTA STATEWIDE HOUSING NEEDS ASSESSMENT: HOUSING FORECAST
A detailed analysis to be er understand housing needs in North Dakota
Prepared for:North Dakota Housing Finance Agencyand its Partners
Prepared by:Center for Social Researchat North Dakota State University,an Equal Opportunity Ins tu on,in Fargo, North Dakota
September 2012
Available online at:h p://www.ndhfa.org
The 2012 North Dakota Statewide Housing Needs Assessment is composed of four components. The Housing Forecast is the fi rst component of the study.
Component 1. Housing ForecastComponent 2. Detailed TablesComponent 3. Survey of StakeholdersComponent 4. SHARP Website Tool
2012 North Dakota Statewide Housing Needs Assessment: Housing Forecast September 2012 Center for Social Research at North Dakota State University Richard Rathge Ramona Danielson Caitlin Deal Kendra Erickson Jennie Lazarus Karen Olson Kay Schwarzwalter Ashley Wiertzema

2012 NORTH DAKOTA STATEWIDE HOUSING NEEDS ASSESSMENT: HOUSING FORECAST 3 ACKNOWLEDGMENTS
ACKNOWLEDGMENTS The 2012 North Dakota Statewide Housing Needs Assessment is a significant undertaking resulting from the vision and leadership of numerous individuals and governing bodies. It is important to acknowledge those who have dedicated time and energy to ensure that thoughtful planning and long-range strategic vision serve as the basis for policy and decision-making regarding housing issues in North Dakota. We also wish to recognize and thank the numerous key leaders and stakeholders throughout the state who took the time to share their insights so that local communities, counties, reservation areas, and agencies/organizations that provide housing for North Dakotans could be a vital part of this undertaking. Researchers at the Center for Social Research at North Dakota State University gratefully acknowledge the support of the following individuals and organizations in the preparation of the 2012 North Dakota Statewide Housing Needs Assessment:
North Dakota Housing Finance Agency
North Dakota Department of Commerce Division of Community Services
Governor Jack Dalrymple, North Dakota Industrial Commission Chairman Agriculture Commissioner Doug Goehring, North Dakota Industrial Commission Member
Attorney General Wayne Stenehjem, North Dakota Industrial Commission Member
North Dakota Housing Finance Agency Advisory Board Gerald Eid, Chairman
Ron Jordan, Vice-Chairman Jim Farnsworth, Member
Becky Knight, Member Lisa Rotvold, Member
Ninetta Wandler, Member
Assessment Contributors City of Fargo
City of Bismarck City of Grand Forks
City of Williston CommunityWorks North Dakota
North Dakota Chapter of the National Association of Housing and Redevelopment Officers Grand Forks Housing Authority
North Dakota Association of Builders
Special Acknowledgments North Dakota Association of Counties, North Dakota Bankers Association,
Independent Community Bankers of North Dakota, North Dakota League of Cities, North Dakota Indian Affairs Committee
Cover Photos Courtesy of
Linda Boyd, Dayna DelVal, and Rhonda Kitch

2012 NORTH DAKOTA STATEWIDE HOUSING NEEDS ASSESSMENT: HOUSING FORECAST 4 TABLE OF CONTENTS
TABLE OF CONTENTS Acknowledgments .................................................................................................................... 3 Components of the 2012 North Dakota Statewide Housing Needs Assessment ......................... 5 Executive Summary ............................................................................................................... 6-9 Statewide Context – Key Findings ..............................................................................................6 Housing Forecast – Key Findings ................................................................................................7 Key Priority Areas .......................................................................................................................9 Introduction ...................................................................................................................... 10-11 Purpose ................................................................................................................................... 10 Organization of This Report .................................................................................................... 10 Statewide Context: Setting the Stage ................................................................................. 12-25 Population Change .................................................................................................................. 12 Population Consolidation ........................................................................................................ 13 Shifting Age Distribution ......................................................................................................... 14 Changing Household Composition .......................................................................................... 15 Racial Diversity ........................................................................................................................ 16 Changes in the State’s Labor Force ......................................................................................... 16 Income and Wages .................................................................................................................. 17 North Dakota’s Economy ........................................................................................................ 18 Housing Stock .......................................................................................................................... 18 Affordable Housing ................................................................................................................. 19 Housing Conditions ................................................................................................................. 20 Special Populations ................................................................................................................. 21 Land Use .................................................................................................................................. 23 Housing Forecast: Future Demand and Supply ................................................................... 26-34 Modeling Methodology ........................................................................................................... 26 Projected Housing Demand .................................................................................................... 29 Projected Housing Supply ....................................................................................................... 32 Profiles ............................................................................................................................ 35-106 North Dakota and Its Eight Planning Regions .......................................................................... 36 Tri-County Region I and Its Components ................................................................................ 43 Souris Basin Region II and Its Components ............................................................................. 50 North Central Region III and Its Components ......................................................................... 57 Red River Region IV and Its Components ................................................................................ 64 Lake Agassiz Region V and Its Components ............................................................................ 71 South Central Dakota Region VI and Its Components ............................................................. 78 Lewis and Clark Region VII and Its Components ..................................................................... 85 Roosevelt-Custer Region VIII and Its Components .................................................................. 92 Native American Indian Reservations in North Dakota ........................................................... 99

2012 NORTH DAKOTA STATEWIDE HOUSING NEEDS ASSESSMENT: HOUSING FORECAST 5 COMPONENTS
COMPONENTS OF THE 2012 NORTH DAKOTA STATEWIDE HOUSING NEEDS ASSESSMENT An analysis of North Dakota’s current and future housing needs was conducted in 2012 by staff at the Center for Social Research at North Dakota State University. The results of the needs assessment are summarized in the 2012 North Dakota Statewide Housing Needs Assessment: Briefing Points. Detailed results of this analysis are presented in the following four formats: Component 1. 2012 North Dakota Statewide Housing Needs Assessment: Housing Forecast
This report presents a statewide contextual analysis of trends affecting housing supply and demand along with an analysis of the forecasted housing projections based on modeling methodology and is available at http://www.ndhfa.org/.
Ten profiles are also included consisting of housing context and forecasted projections organized by a) state and eight planning region totals; b) each individual planning region and its associated counties and large cities; and c) the four major Native American Indian Reservations.
Component 2. 2012 North Dakota Statewide Housing Needs Assessment: Detailed Tables
These tables present a series of 76 data tables relating to a) population, b) housing supply, c) housing demand, d) special populations, and e) substandard housing. They are available at http://www.ndhfa.org/.
Most tables present data for a) North Dakota and the eight planning regions, b) the four major Native American Indian Reservation areas, c) all 53 counties, and d) the 12 cities with 6,500 residents or more.
Component 3. 2012 North Dakota Statewide Housing Needs Assessment: Survey of Stakeholders
This report presents findings of a statewide survey of key leaders and stakeholders regarding housing issues. The key leaders included representatives from cities, counties, reservations, regions, public housing authorities, banks, real estate agents, apartment associations, builders, and statewide housing organizations. Key stakeholder groups included planners and those involved in community development representing North Dakota cities, counties, reservations, and planning regions. The report is available at http://www.ndhfa.org/.
Survey results offer insight into issues, barriers, challenges, and housing needs within the state. Particular attention is given to issues and challenges resulting from energy development activities and recent flooding within the state.
Component 4. 2012 North Dakota Statewide Housing Needs Assessment: North Dakota Statewide Housing Assessment Resource Project (SHARP) Website Tool
The website is for broader dissemination of the assessment information and is available at http://www.ndhfa.org/.
The site is organized around the following themes: a) population, b) housing supply, c) housing demand, d) substandard housing, e) special populations, and f) land use.
Users may view various tables related to the housing themes and select the level of geography most appropriate for their use.
It provides links to related publications/products (including the final report, detailed tables, and survey report) and other websites.

2012 NORTH DAKOTA STATEWIDE HOUSING NEEDS ASSESSMENT: HOUSING FORECAST 6 EXECUTIVE SUMMARY
2012 North Dakota Statewide Housing Needs Assessment: Housing Forecast
EXECUTIVE SUMMARY STATEWIDE CONTEXT – KEY FINDINGS Population Change
North Dakota’s population grew by 5 percent from 642,200 in 2000 to 672,591 in 2010. However, this modest growth does not reflect more recent gains occurring in western counties of the state due to energy development activity.
North Dakota’s strong, diversified economy has contributed to population increases in several of the counties with the state’s largest cities. Moreover, energy development activity has reversed decades of population decline in many of the state’s western counties. Ten of the 16 western counties impacted by energy development had persistent population loss over seven decades. However, projections indicate they will grow over the next 15 years. Continued robust growth is expected in most of the counties with the state’s largest cities.
Overall, the state is expected to grow by 25 percent over the next 15 years, reaching 841,820 people by 2025; however, the growth is expected to be mixed geographically. Twenty counties are forecast to continue to decline. Within Regions IV and V, only Grand Forks and Cass counties are expected to grow. Several counties that showed declines over the previous decade are expected to grow, including 10 energy development counties that are projected to grow by at least 50 percent.
North Dakota’s age distribution will shift from 2010 to 2025 largely due to the aging of the baby boom population. o From 2010 to 2025, residents ages 65 and older are projected to expand by 52 percent (50,583 residents) while the cohort they are aging out of,
those ages 45 to 64, will expand by only 5 percent statewide (7,972 residents). In 2025, residents ages 65 and older are projected to be 18 percent of the total population (up from 14 percent in 2010), and residents ages 45 to 64 will represent 22 percent of the population (down from 27 percent).
o The age group under 25 years is expected to grow by 18 percent (41,395 residents) in the next 15 years after declining by 1 percent from 2000 to 2010.
Changing Household Composition
The aging of the baby boom population has contributed to notable changes in the state’s household composition over time. In 1960, 52 percent of households were married-couple families with children. In 2010, that proportion was 19 percent, which is a 41 percent decline (a loss of 37,000 households). In contrast, married-couple households without children increased 76 percent, although maintaining a similar proportion of total households at 30 percent in 2010 compared to 28 percent in 1960.
Non-family households have become a more prominent form of household in the state, nearly quadrupling since 1960. In 2010, 39 percent of all households were non-family households, of which 80 percent were persons living alone. Approximately one-third of single-persons households were elderly.
Housing Stock
Occupied housing units in the state increased by 9 percent (24,040 units) from 2000 to 2010.
Owner-occupied housing units grew at a slower pace from 2000 to 2010 (7 percent) than renter-occupied units which expanded by 13 percent.
Vacant housing units accounted for more than 11 percent of total housing units in 2010. However, one-third of those vacant units were recreational units.

2012 NORTH DAKOTA STATEWIDE HOUSING NEEDS ASSESSMENT: HOUSING FORECAST 7 EXECUTIVE SUMMARY
Affordable Housing
The proportion of the current housing stock in North Dakota that is affordable for those in extremely low- and very low-income households is very limited. Using the statewide median family income (MFI) for 2010 as a benchmark ($61,500), the data for North Dakota indicates that:
o 16 percent of owner-occupied units and 35 percent of renter-occupied homes are affordable to those with extremely low incomes of less than 30 percent of MFI.
o 29 percent of owner-occupied homes are affordable to those with very low incomes at 31 percent to 50 percent of MFI. A much larger proportion (75 percent) of renter-occupied units are affordable to those with incomes at 31 percent to 50 percent of MFI.
Housing Conditions
The proportion of housing in North Dakota viewed as substandard in 2010 was very low.
Only a small fraction of owner-occupied units (0.2 percent) lacked complete plumbing or kitchen facilities.
Less than 1 percent of owner-occupied units (1,328 units) were overcrowded by having more than one occupant per room.
Very few renter-occupied units lacked complete plumbing facilities (0.3 percent) or complete kitchen facilities (1.5 percent).
Less than 2 percent of renter-occupied units (1,631 units) were overcrowded, having more than one occupant per room. Special Populations
A survey of homeless in North Dakota in January of 2011 indicated that there were 1,094 homeless people in the state, 26 percent of whom were children. A July 2011 survey indicated that there were 1,773 homeless people in North Dakota. The majority of these individuals were unsheltered (54 percent).
There is a need for housing for low- and moderate-income elderly. o One-fifth of householders ages 65 and older in owner-occupied units have housing cost burdens that exceed 30 percent of their household income. o Half of householders ages 65 and older in renter-occupied units have housing cost burdens that exceed 30 percent of their household income.
HOUSING FORECAST – KEY FINDINGS Modeling Methodology
We forecast housing demand for 2015, 2020, and 2025 using established modeling techniques within the context of projected residential change with breakdowns by age, income, and homebuyer type.
We forecast housing supply to the year 2025 based on historical trends in housing construction (i.e., Model 1 – Based on Building Trends of Previous Decade) and based on the growth of, or decline in, future households (i.e., Model 2 – Based on Projected Demand). Contrasting these two supply forecasts offers a useful perspective regarding how well the current pattern of housing construction, if continued into the future, fits the expected housing needs based on population projections.
It is important to acknowledge that determining future housing needs is a complex issue. Predictions of residential growth and corresponding housing demand can only be simulated through modeling. How close the prediction is to reality is a function of how well the assumptions match what actually happens over time. Therefore, housing forecasts should be used only as one tool in developing housing policy. Nonetheless, the patterns that emerge from modeling, when placed within the appropriate economic and political context, are useful for predicting future housing needs.
Projected Housing Demand
Our approach to forecasting housing demand for the state was a two-staged process. In the first stage, we developed county and age-specific population projections for the years 2015, 2020, and 2025 and then determined the age-specific distribution of householders based on 2010 Census data. In the second stage, we forecast demand for housing based on the characteristics of income and homebuyer type.

2012 NORTH DAKOTA STATEWIDE HOUSING NEEDS ASSESSMENT: HOUSING FORECAST 8 EXECUTIVE SUMMARY
Statewide forecasts indicate that demand for housing will increase by 30 percent (83,429 units) from 2010 to 2025. The energy development activity in western North Dakota has created an unprecedented demand for housing which has greatly outpaced supply.
o Housing demand in Region I will increase by 167 percent (nearly triple previous demand levels) due to energy development activity while in Region VIII it will increase by 69 percent.
o While the rest of the state shows increased demand for housing, the pace of growth is expected to be much slower.
The statewide projected demand for housing from 2010 to 2025 is as follows for various household characteristics: o Age:
The number of young adult households (i.e., under age 25) will expand by 2 percent. Prime working-age households (i.e., ages 25 to 44) will increase by 42 percent (37,268 households), reflecting oil sector employment. Pre-retiree households (i.e., ages 45 to 64) will expand by only 9 percent as a result of the aging forward of baby boomers. Elderly households (i.e., ages 65 and older) will increase by 60 percent (36,795 households).
o Income: Households with extremely low incomes of less than 30 percent of MFI will increase by 31 percent (17,263 households). Households with very low incomes at 31 percent to 50 percent of MFI will increase by 32 percent (10,462 households). Households with low incomes at 51 percent to 80 percent of MFI will increase by 31 percent (17,801 households). Households with moderate incomes at 81 percent to 115 percent of MFI will increase by 30 percent (16,695 households). Households with incomes above 115 percent of MFI will increase by 28 percent (21,192 households).
o Type: First-time homebuyers are expected to increase by one-third statewide (17,227 households). Upscale homebuyers are expected to increase by 25 percent (16,403 households). Low-income homebuyers are expected to increase by 19 percent (18,850 households). Moderate homebuyers are expected to increase by 26 percent (11,114 households). Elderly homebuyers are expected to increase by 60 percent (36,794 households).
Projected Housing Supply
In order to evaluate the relationship between future demand for housing and what housing might be available (i.e., supply), we developed two housing supply forecasts. Model 1 presents a scenario of what housing supply would be if the past trend in housing construction were to continue through the year 2025 while Model 2 projects a scenario of future housing units based on the growth of, or decline in, future households through the year 2025.
If recent trends in housing construction continue (Model 1), the state’s overall housing stock will expand by 16 percent (51,292 units) from 2010 to 2025. Housing supply forecasts for the same time period based on population change (Model 2) show an increase in the state’s overall housing stock of 29 percent (90,469 units; this number is higher than the projected increase in demand for housing (83,429 units) because supply modeling incorporates vacancies). Change in the housing supply forecast based on population change (Model 2) is 76 percent higher than change based on the past decade’s building trends (Model 1), reflecting the unprecedented boom from energy development activity.
Stark differences exist geographically between projected housing supply based on current building trends (Model 1) versus projected demand (Model 2) through the year 2025.
o The increase in housing supply based on projected demand in Regions I and VIII is four times greater than what current trends in building will produce, largely reflecting increasing demand for housing in western North Dakota. Model 2 outpaces Model 1 in Regions IV and VII as well.
o In Region V, changes in housing supply based on current building trends are expected to be more in line with projected demand. o The current pattern of housing construction in Regions III and VI indicates a housing slowdown is likely to occur, while supply forecasts based on
housing demand for these regions suggest that the need for housing is expected to grow.

2012 NORTH DAKOTA STATEWIDE HOUSING NEEDS ASSESSMENT: HOUSING FORECAST 9 EXECUTIVE SUMMARY
KEY PRIORITY AREAS Based on an overall analysis of the findings and an interpretation of the housing forecast, several key priority areas were identified. Following is a list of the key areas to be considered, listed in no particular order of priority.
Short- and long-term housing shortages in counties impacted by energy development. Significant pressure will be placed on counties that are forecast to expand by more than 50 percent by 2025. Many of these counties have relatively small population bases, thus the impacts can be sizeable.
Attention to demand for temporary housing within energy development counties. Although this report does not address temporary housing, the workforce analysis indicates that it will be a significant issue in the short term. An approach to addressing temporary housing needs to be considered within the context of long-term permanent housing because the two must coexist. Demand pressures from the one impact the demand on the other.
Housing affordability The supply of affordable housing, especially for households with income under 30 percent of the state’s median family income, is very limited. This situation has worsened since the last Statewide Housing Needs Assessment conducted in 2004.
Elderly housing The aging forward of the baby boom population is rapidly expanding the senior population of the state which will require “elderly friendly” housing. The forecast of a 52 percent increase of householders ages 65 and older by 2025 will create increased pressure for elderly housing, much of which will be for single elderly and those with low income.
Consideration for the homeless Surveys of the homeless population within the state indicate an important and challenging need. Attention needs to be given to the seasonal effects of homelessness.
Attention to changing household composition The type of housing needed within the state is shifting as a result of changes in household composition (e.g., non-family households now comprise 40 percent of all households in the state; the majority of these are single-person households). This will be a key concern especially in urban areas of the state. Consideration needs to be given to assessing the appropriate mix of housing to accommodate shifting household types.

2012 NORTH DAKOTA STATEWIDE HOUSING NEEDS ASSESSMENT: HOUSING FORECAST 10 INTRODUCTION
INTRODUCTION PURPOSE This report is an update from a previous Statewide Housing Needs Assessment conducted in 2004. It follows a similar format and has three main goals. First, it provides a perspective on the current housing situation in the state and places that knowledge into historical context by reporting changing trends in both housing stock and characteristics of owners and renters. This is useful for understanding the relationship between housing supply and demand and necessary for the second goal of the report which is forecasting. We used established modeling techniques to first forecast housing supply to the year 2025 based on historical trends in housing construction. Next, we forecast demand for housing based on shifts in population for the same time period. Contrasting these two forecasts offers a useful perspective regarding how well the current pattern of housing construction, if continued into the future, fits the expected housing needs based on population projections. It is important to acknowledge, however, that determining future housing needs is a complex issue. The dynamic nature of western North Dakota based on the unprecedented boom in energy development is an excellent illustration. At best, the predictions of residential growth and corresponding housing demand can only be simulated through modeling. How close the prediction is to reality is a function of how well the assumptions match what actually happens over time. Therefore, housing forecasts should be used only as one tool in developing housing policy and strategic planning. Nonetheless, the patterns that emerge from modeling, when placed within the appropriate economic and political context, are useful for predicting future housing needs. The third and final goal of the report is to place the forecast of housing demand within the context of projected residential change. Specifically, what type of housing should be considered to best meet the needs of the changing distribution of households that are projected? We provide a breakdown of the housing forecast by age, income, and homebuyer type to help address this issue. It is important to remember that the main focus of this report is to assist the North Dakota Housing Finance Agency (NDHFA) and its partners who need updated information regarding housing needs, especially among those of low- and moderate-income persons, in order to target and coordinate the use of federal, state, and local resources available for housing. These housing needs are reflected in the characteristics we selected to report in this study.
ORGANIZATION OF THIS REPORT This report serves as the summary of the housing forecast component of the 2012 Statewide Housing Needs Assessment. It begins with an overview providing statewide context of important trends that affect housing dynamics. These trends include historical shifts in population, changes in the state’s economy, housing trends, and land use issues. It also explains the modeling methodology used to generate the projections of housing demand and supply and briefly summarizes the housing forecast. The second section of the report is designed to profile housing needs through a series of tables and figures. It is arranged by geography to facilitate in-depth analysis. There are 10 distinct groupings of profiles. The first centers on the state and its eight planning regions and is intended to provide a quick comparison of regions within the context of the state. The next eight groupings of profiles are region-specific and include data on the counties and cities (if they are among the 12 largest populated places in the state) within the corresponding region. Regional totals are provided within each profile for context. This section of the report provides the reader the ability to focus their attention on a specific region and explore changes occurring within that specific region. The final grouping of profiles looks specifically at the state’s Native American Indian Reservations. The location of the state’s 53 counties, eight planning regions, 12 most populated cities, five Native American reservations, and 16 counties comprising the oil-impacted energy development activity in western North Dakota are shown in Figure 1.

2012 NORTH DAKOTA STATEWIDE HOUSING NEEDS ASSESSMENT: HOUSING FORECAST 11 INTRODUCTION
Figure 1. North Dakota Geographic Locations and Boundaries used in the 2012 North Dakota Statewide Housing Needs Assessment

2012 NORTH DAKOTA STATEWIDE HOUSING NEEDS ASSESSMENT: HOUSING FORECAST 12 STATEWIDE CONTEXT
STATEWIDE CONTEXT: SETTING THE STAGE POPULATION CHANGE North Dakota’s population has changed dramatically during the past decade reversing a historical downward trend that has dominated much of the state since the early 1940s. North Dakota’s population increased markedly from statehood up until World War II. However, since 1940 the state’s total population has remained relatively stable with 641,935 residents in 1940 and 642,200 in 2000. However, masked within the aggregate population total is the significant consolidation that occurred within the state over the past half century as a result of persistent migration from rural areas to urban population centers. This movement largely reflects the transformation of agriculture as the number of farms within the state dropped from approximately 85,000 in 1935 to 32,000 currently. This internal redistribution of population is best illustrated in Figure 2 which depicts county population losses over the past seven decades. In more than half of the state’s 53 counties, the population at the beginning of the decade was larger than at the end of the decade, and this decline continued unabated for seven decades. For three out of four counties in the state, persistent population loss occurred in at least five of the past seven decades. In contrast, only two counties in the state (Burleigh and Cass) had population growth in each of the past seven decades. What is particularly noteworthy is that, of the 16 western counties currently impacted by energy development (see Figure 1), 10 had persistent population loss over seven decades. Energy development activity has significantly changed this historical population trend. North Dakota’s population change in the last half of this past decade (i.e., 2000 to 2010) stands in stark contrast to the previous seven decades. The impact of energy development activity, which started in 2006, significantly altered migration flows. More than half of the western counties in North Dakota began experiencing population growth as documented in the U.S. Census Bureau’s Population Estimates for the time period 2008 to 2009 (see Figure 3). For some of the western counties, the growth in the latter part of the decade was not sufficient to offset population losses sustained earlier in the decade. This resulted in an overall population decline for several of the western counties for the decade as noted in Figure 4. The state’s population gain from 2000 to 2010 was 5 percent, reaching 672,591 residents – the second highest population mark on record for North Dakota.
Figure 2. Decades of Population Decline for North Dakota by County Since 1940
Source: U.S. Census Bureau

2012 NORTH DAKOTA STATEWIDE HOUSING NEEDS ASSESSMENT: HOUSING FORECAST 13 STATEWIDE CONTEXT
POPULATION CONSOLIDATION
As noted earlier, the rural-to-urban movement of people in the state began in earnest during the 1940s (see Figure 5). At that time, nearly 80 percent of the state’s population was living either on a farm or the countryside or in a place of fewer than 2,500 residents. The lack of employment opportunities in small towns and rural areas pushed many residents to move to larger cities in the state. This trend accelerated during the 1950s and 1960s, and slowed somewhat during the 1970s and 1980s. Nonetheless, by 1990, the majority of residents in the state were living in urban areas. Based on 2010 data from the American Community Survey, 54 percent of North Dakota’s population was defined as urban. The historical rural-to-urban movement of people dramatically shifted the balance of community size (see Table 1). The number of urban cities (i.e., those with populations of at least 2,500) in the state changed little from 1960 to 2010. In contrast, the state’s medium size communities shrank, creating a rapidly growing number of very small communities. In 1960, a little more than one-third (36 percent) of the incorporated places in the state had fewer than 200 residents. By 2010, the majority (56 percent) of incorporated places in North Dakota had fewer than 200 people. The consolidation of population in the state significantly changed housing demand in communities. The vast majority of housing demand is located in the larger cities while population decline has reduced demand in the state’s rural areas. For example, from 2000 to 2010 nearly two out of three counties in the state had a net loss of occupied housing units. In contrast, the state’s 12 largest cities had a net housing gain during the same time period (Source: U.S. Census Bureau). In cities like Bismarck, Fargo, and Grand Forks,
Figure 4. Percent Change in Population for North Dakota by County, 2000 to 2010
Source: U.S. Census Bureau
Figure 5. Rural-Urban Population Distribution for North Dakota, 1900 to 2010
Source: U.S. Census Bureau
92.7 89.0 86.4
83.4 79.4
73.4 64.8
55.7 51.2
46.7 44.1 44.4 46.5
7.3 11.0 13.6
16.6 20.6
26.6
35.2
44.3 48.8
53.3 55.9 55.6
53.5
0
20
40
60
80
100
Per
cen
t
Rural Urban
Figure 3. Percent Change in Population for North Dakota by County, 2008 to 2009
Source: U.S. Census Bureau

2012 NORTH DAKOTA STATEWIDE HOUSING NEEDS ASSESSMENT: HOUSING FORECAST 14 STATEWIDE CONTEXT
population consolidation provided for consistently low vacancy rates. However, energy development activity is reversing this trend in western North Dakota counties. In 2000, 70 percent of the counties in the state had vacancy rates for year-round housing that exceeded 10 percent. In 2010, that proportion dropped to a little over 50 percent because of the influx of workers needing housing in rural western counties impacted by energy development. Modeling suggests that an additional seven western oil-impacted counties whose vacancy rates were above 10 percent in 2010 are well below that level currently, thus reducing the proportion of North Dakota counties with vacancy rates above 10 percent to half the level witnessed in 2000. SHIFTING AGE DISTRIBUTION The age structure in the state is being impacted by a strong, diversified economy in the eastern part of the state as well as energy development activity in western North Dakota. For the first time since the early 1980s, the pre-school age population within the state is growing (see Figure 6). After decades of decline, a sustained upswing in births began in North Dakota starting in 2002 when there were 7,755 births recorded. By 2010 there were 9,088 births. This reversal parallels a significant upturn in the 25 to 44 age cohort which is the prime child bearing age category. It also reflects the prime working age category which grew in response to the state’s robust economy. The aging of the baby boomers across the state is another key factor; the 45 to 64 age cohort grew, which includes the tail end of the baby boom generation. In contrast, declines continued in three main age groups from 2000 to 2010. First, the elementary- and middle school-aged population, ages 5 to 14, declined throughout the decade with a slight upturn starting in 2009. Similarly, the age cohort covering high school, ages 15 to 17, also declined from 2000 to 2010. Finally, the young-adult population, ages 18 to 24, began growing in the early part of the decade but the trend reversed during the latter part of the decade. The elderly population, those ages 65 and older, were relatively stable throughout the decade. The future age structure of North Dakota will change dramatically over the next two decades as the baby boom population moves into their retirement years and the prime workforce grows, spurred on by a strong agricultural sector and an exploding energy development sector. This is best illustrated by contrasting changes in age cohorts during the past decade with what is projected for the period 2010 to 2025, as noted in Table 2.
Table 1. Number of Incorporated Cities in North Dakota by Population Size, 1960 and 2010
City Population Size
1960 Census 2010 Census
Number of Cities Percent of Total Number of Cities Percent of Total
25,000 persons or more 4 1.1 5 1.4
10,000 to 24,999 persons 3 0.9 4 1.1
5,000 to 9,999 persons 5 1.4 3 0.8
2,500 to 4,999 persons 3 0.9 3 0.8
2,000 to 2,499 persons 7 2.0 7 2.0
1,500 to 1,999 persons 15 4.3 8 2.2
1,000 to 1,499 persons 26 7.5 19 5.3
500 to 999 persons 45 12.9 45 12.6
200 to 499 persons 114 32.7 65 18.2
Less than 200 persons 127 36.4 198 55.5
Total Number of Cities 349 100.0 357 100.0
Source: U.S. Census Bureau
Figure 6. Age Distribution for North Dakota, 2000 to 2010
Sources: U.S. Census Bureau
0
20,000
40,000
60,000
80,000
100,000
120,000
140,000
160,000
180,000
200,000
2000 2001 2002 2003 2004 2005 2006 2007 2008 2009 2010
0 to 4
5 to 14
15 to 17
18 to 24
25 to 44
45 to 64
65 plus
Table 2. Age Distribution for North Dakota, 2010 Census and Projections for 2025
Age
2010 Census 2025 Projections
Number Percent Change
2000 to 2010 Number Percent Change
2010 to 2025
0 to 24 230,891 -1.3 272,286 17.9
25 to 44 165,747 -5.2 235,026 41.8
45 to 64 178,476 28.5 186,448 4.5
65 and older 97,477 3.2 148,060 51.9
Total 672,591 4.7 841,820 25.2
Sources: U.S. Census Bureau and the Center for Social Research at NDSU

2012 NORTH DAKOTA STATEWIDE HOUSING NEEDS ASSESSMENT: HOUSING FORECAST 15 STATEWIDE CONTEXT
Geographic details regarding the projections are reported in the second section of this report. However, in summary, the most significant change that is expected to occur over the next 15 years will be in the 25 to 44 age cohort, or the prime working age group. From 2000 to 2010, the number of residents in this age group collectively declined in North Dakota from 174,891 to 165,747 people or 5.2 percent. In contrast, from 2010 to 2025 this age group is expected to expand by 41.8 percent reaching 235,026 residents. This largely reflects the impact of the state’s robust economy, especially the energy development sector where employment expansion will be staggering. In Region I (Divide, Williams, and McKenzie counties), this age group is expected to more than triple in population by 2025, growing from 7,357 to 24,065 residents. Similarly, in Region VIII (Dunn, Billings, Golden Valley, Stark, Slope, Hettinger, Bowman, and Adams counties), this age cohort is expected to more than double by 2025 expanding from 8,617 to 17,869 residents. The second major shift will be the aging forward of the baby boom cohort into the elderly category (i.e., ages 65 and older), which will translate into a heightened demand for housing that is suited to meet the needs of the elderly. Statewide this expansion will increase the elderly population by nearly 52 percent, compared to a 3 percent growth from 2000 to 2010, increasing this cohort from 97,477 in 2010 to 148,060 by 2025. In Regions IV, V, and VII, this age cohort is expected to grow by at least 50 percent, and it will more than double in Region I. The aging forward of this cohort will result in a significant reduction in growth of the 45 to 64 age group, which is expected to expand by only 4.5 percent after growing by 28.5 percent from 2000 to 2010. Finally, the 0 to 24 age cohort is expected to increase by nearly 18 percent from 2010 to 2025 after declining 1.3 percent from 2000 to 2010. This, in part, reflects the growth in the number of children that will occur as a result of a burgeoning young adult population who are in their prime childbearing ages. Additionally, it represents the attraction and retention of young adults due to expanded employment potential. The consequence on housing of this growing population will be manifest in an increased demand by first-time homebuyers. CHANGING HOUSEHOLD COMPOSITION Household composition in North Dakota continues to change creating new demands on housing within the state. Figure 7 illustrates the significant shift that has occurred in household types from 1960 to 2010 in the state. Housing in 1960 was dominated by married couples with children under age 18 representing 89,590 households or 52 percent of occupied housing units in the state. In 2010, married couples with children under age 18 accounted for 52,438 households, a decline of approximately 37,000 households or 41 percent. More importantly, these households represented 19 percent of all households in the state. This dramatic transition demonstrates the impact of the baby boom generation and its consequence on housing within the state. As children from the baby boom cohort left home, the proportion of households comprised of married couples without children under age 18 grew steadily from 47,808 households in 1960 (28 percent of occupied housing
units) to 84,084 households in 2010 (maintaining a similar proportion at 30 percent of occupied housing units despite the rapid growth in the number of households), an increase of 76 percent. This transition has created an increasing supply of starter homes vacated by “empty nesters” and greater demand for smaller homes (for those “empty nesters” wanting to downsize). Starting in 2011, the leading edge of the baby boom cohort turned age 65 and, as they continue to age, there will be an increasing demand within the housing market for housing that meets the needs of the elderly (e.g., new construction, retrofitting). The shift in household composition that is having the greatest impact on housing within the state is the explosion of non-family households. Non-family households represented fewer than 24,000 households in 1960 or 14 percent of occupied housing units. However, by the year 2010 this household type quadrupled to more than 110,000 households representing nearly 40 percent of the occupied housing units in the state. Approximately 80 percent of these non-family households were accounted for by persons living alone. While elderly (i.e., ages 65 and older) were 15 percent of the population in North Dakota in 2010, they represented 35 percent of all persons living alone.
Figure 7. North Dakota Households by Type and Presence of Children Less Than Age 18, 1960 to 2010
Source: U.S. Census Bureau
0
20,000
40,000
60,000
80,000
100,000
120,000
Marriedwith
children
Marriedwithoutchildren
Otherfamily with
children
Otherfamily
withoutchildren
Non-familyNu
mb
er o
f H
ou
seh
old
s
1960 1970 1980 1990 2000 2010
2012 NORTH DAKOTA STATEWIDE HOUSING NEEDS ASSESSMENT: HOUSING FORECAST 16 STATEWIDE CONTEXT
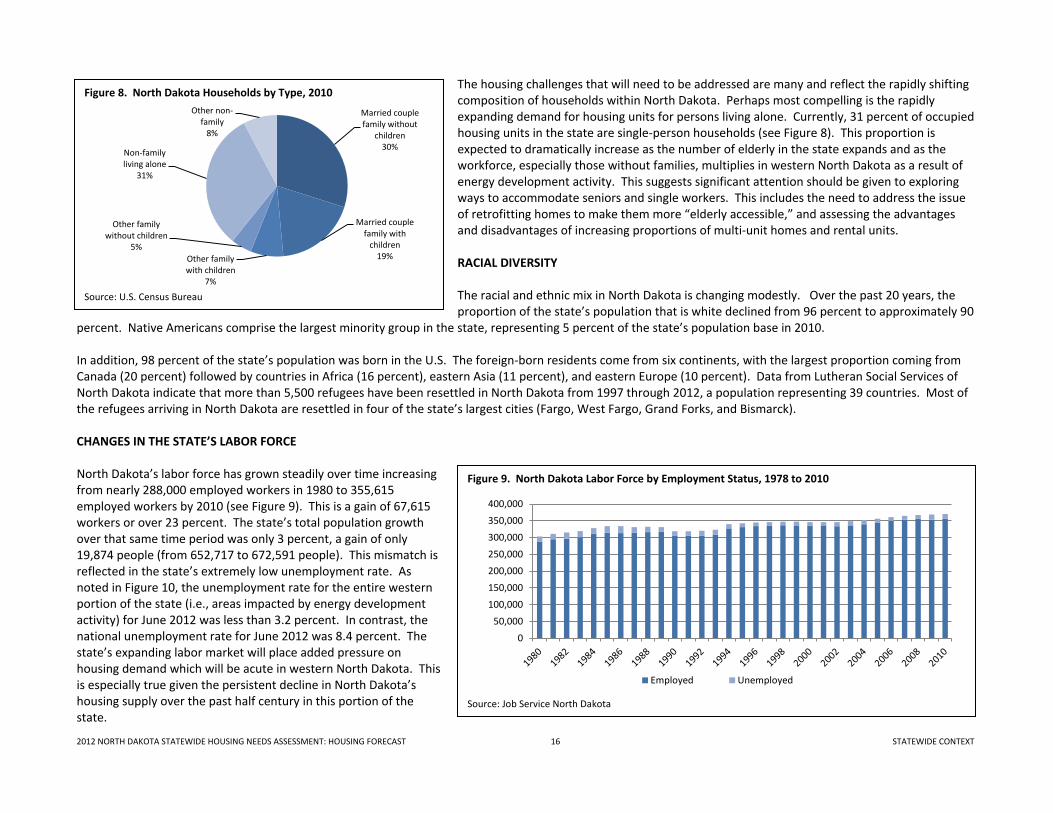
The housing challenges that will need to be addressed are many and reflect the rapidly shifting composition of households within North Dakota. Perhaps most compelling is the rapidly expanding demand for housing units for persons living alone. Currently, 31 percent of occupied housing units in the state are single-person households (see Figure 8). This proportion is expected to dramatically increase as the number of elderly in the state expands and as the workforce, especially those without families, multiplies in western North Dakota as a result of energy development activity. This suggests significant attention should be given to exploring ways to accommodate seniors and single workers. This includes the need to address the issue of retrofitting homes to make them more “elderly accessible,” and assessing the advantages and disadvantages of increasing proportions of multi-unit homes and rental units. RACIAL DIVERSITY The racial and ethnic mix in North Dakota is changing modestly. Over the past 20 years, the proportion of the state’s population that is white declined from 96 percent to approximately 90
percent. Native Americans comprise the largest minority group in the state, representing 5 percent of the state’s population base in 2010. In addition, 98 percent of the state’s population was born in the U.S. The foreign-born residents come from six continents, with the largest proportion coming from Canada (20 percent) followed by countries in Africa (16 percent), eastern Asia (11 percent), and eastern Europe (10 percent). Data from Lutheran Social Services of North Dakota indicate that more than 5,500 refugees have been resettled in North Dakota from 1997 through 2012, a population representing 39 countries. Most of the refugees arriving in North Dakota are resettled in four of the state’s largest cities (Fargo, West Fargo, Grand Forks, and Bismarck). CHANGES IN THE STATE’S LABOR FORCE North Dakota’s labor force has grown steadily over time increasing from nearly 288,000 employed workers in 1980 to 355,615 employed workers by 2010 (see Figure 9). This is a gain of 67,615 workers or over 23 percent. The state’s total population growth over that same time period was only 3 percent, a gain of only 19,874 people (from 652,717 to 672,591 people). This mismatch is reflected in the state’s extremely low unemployment rate. As noted in Figure 10, the unemployment rate for the entire western portion of the state (i.e., areas impacted by energy development activity) for June 2012 was less than 3.2 percent. In contrast, the national unemployment rate for June 2012 was 8.4 percent. The state’s expanding labor market will place added pressure on housing demand which will be acute in western North Dakota. This is especially true given the persistent decline in North Dakota’s housing supply over the past half century in this portion of the state.
Figure 9. North Dakota Labor Force by Employment Status, 1978 to 2010
Source: Job Service North Dakota
0
50,000
100,000
150,000
200,000
250,000
300,000
350,000
400,000
Employed Unemployed
Figure 8. North Dakota Households by Type, 2010
Source: U.S. Census Bureau
Married couple family without
children 30%
Married couple family with
children 19% Other family
with children 7%
Other family without children
5%
Non-family living alone
31%
Other non-family
8%

2012 NORTH DAKOTA STATEWIDE HOUSING NEEDS ASSESSMENT: HOUSING FORECAST 17 STATEWIDE CONTEXT
INCOME AND WAGES Personal income in North Dakota has significantly increased as a result of the state’s robust economy. In 2000, North Dakota’s per capita income was $25,592 which was nearly 16 percentage points below the national average of $30,319, placing North Dakota 38th in the nation. However, by 2011 North Dakota’s per capita income grew to $45,747, the 9th highest rank in the nation. This is the first time since the early 1970s that North Dakota’s per capita income outpaced the national average, which was $41,663 in 2011. The early 1970s was another very robust economic period for North Dakota when, starting in 1973, oil prices spiked due to the OPEC oil embargo and grain prices spiked due to the Russian Wheat Deal. The average compensation per job in North Dakota also has increased in recent years. Employee compensation includes wage and salary disbursements and supplements to wages and salaries (i.e., employer contributions for employee pension, insurance funds, and government social insurance funds). In the vast majority of counties in the state, the compensation of employees grew by at least 2 percent from 2009 to 2010 (see Figure 11). In North Dakota, average annual employee compensation in 2010 was $47,593, a 5.3 percent increase from 2009. In most western North Dakota counties, compensation per job grew by at least 7 percent. For comparison, the average annual compensation per job for the U.S. was $58,451 in 2010, an increase of 2.7 percent from the previous year. For nearly 70 percent of the counties in the state, annual employee compensation grew faster than the nation; for half of the counties, it grew at a rate twice that of the nation. Seven of the western counties impacted by energy development (Divide, Dunn, McKenzie, Mountrail, Slope, Stark, and Williams) had rates in the double digits. Average annual employee compensation in Williams County in 2010 was $66,131 and in McKenzie County it was $60,459. The latest data from Job Service North Dakota highlight the impact of the state’s robust economy on wages. Their 2011 estimate of the average annual wage for North Dakota, excluding benefits, was $41,778. Williams County had the highest average annual wage in 2011 at $70,027, followed by Slope County at $65,834 and McKenzie County at $64,857.
Figure 10. Unemployment Rates for North Dakota by County, June 2012
Figure 11. Percent Change in Average Compensation of Employees Per Job, 2009 to 2010
Source: U.S. Bureau of Economic Analysis

2012 NORTH DAKOTA STATEWIDE HOUSING NEEDS ASSESSMENT: HOUSING FORECAST 18 STATEWIDE CONTEXT
NORTH DAKOTA’S ECONOMY An effective measure of a state’s economy is its gross state product (GSP). This measure, often considered a state’s counterpart to the nation’s gross domestic product (GDP), is the value added in production by the labor and property located in the state. North Dakota’s GSP in 2011 was $34 billion in inflation-adjusted real dollars (i.e., chained 2005 dollars), which is up 7.6 percent from 2010. Using this measure, North Dakota has the fastest growing economy in the nation. In fact, North Dakota ranked either first or second in GSP growth among all states in the past four years. The leading economic sectors included government at 12 percent of GSP and real estate at 11 percent; mining is sixth largest at 7 percent and agriculture is ninth largest also at 7 percent (agriculture is still a dominant industry in the state, but secondary and tertiary components of agriculture are captured in other sectors). However, what is most informative regarding the shift in the state’s economy is the pace of change within each sector. For example, mining as an economic sector increased its activity by 70 percent from 2010 to 2011. The next largest changes during the same time period occurred in the following sectors: transportation and warehousing (30 percent growth); construction (20 percent growth); wholesale trade (19 percent growth); and real estate, rental, and leasing (18 percent growth). In contrast, the state’s largest economic sector, government, grew 3 percent. The greatest economic shift to North Dakota’s economy is energy development activity. Oil production in the state has escalated at a pace few could have imagined. Annual production was relatively stable from 2000 to 2006, moving from 32.7 million barrels per year in 2000 to 39.9 million in 2006. In 2006, North Dakota ranked 8th in oil production out of 32 oil-producing states in the country. However, by 2008 the state doubled its oil production to 62.8 million barrels, moving to 6th place nationwide. One year later in 2009, North Dakota expanded its oil production to 80 million barrels and moved to 4th place behind Texas, Alaska, and California. Two years later in 2011, North Dakota produced 153 million barrels of oil. In March of 2012, North Dakota’s daily oil production reached the 578,112 barrel mark surpassing Alaska for second place. Three months later in June of 2012, North Dakota had 7,352 producing wells and pumped a daily average of 660,322 barrels of oil. If the state continues this pace of oil production it would top 226 million barrels for 2012. Texas currently produces nearly three times the amount of oil per day compared to North Dakota, with a daily oil production of 1.8 million barrels in May of 2012. Thus, surpassing Texas in oil production is not expected in the near future. However, industry estimates indicate that there are a potential of 32,000 to 35,000 wells in North Dakota that could be drilled within the next 20 years, so production is expected to continue at an extraordinary pace. In addition to oil production, North Dakota’s natural gas production also is rapidly expanding. Natural gas is a byproduct of oil production. In the early 1990s, the state produced around 5 million cubic feet of gas per month. This level held steady until the recent oil boom period which started after 2006. The latest data indicate that North Dakota produced 21 million cubic feet of natural gas in June of 2012. Production of natural gas in the state is expected to significantly increase over the next 15 to 20 years paralleling oil production in the state. The current rapid expansion of oil production in North Dakota has limited the state’s ability to capture a significant portion of the natural gas that is extracted during the oil recovery process. Natural gas collection systems and pipelines have been overwhelmed. As a result, estimates suggest that as much as one-third of the natural gas is being flared off rather than captured. As solutions are implemented and adopted, production will markedly increase. HOUSING STOCK Counts of housing units for 2010 indicate there were 317,498 total housing units in North Dakota with an additional 3,833 housing units authorized by building permits, resulting in a potential 321,331 housing units. The housing supply in North Dakota has gradually increased to meet the state’s growing demand. The number of occupied housing units in the state expanded from 257,152 units in 2000 to 281,192 in 2010, an increase of 9 percent (see Table 3). The largest growth in occupied housing from 2000 to 2010 was among renter-occupied units which grew by 13 percent. In contrast, the proportion of owner-occupied units in the state increased by 7 percent. As a result, the overall proportion of renter-occupied units relative to all occupied units grew by 4 percent from 2000 to 2010 while owner-occupied units as a proportion of all occupied units decreased by 2 percent. The change in occupied housing units differed markedly depending on location within the state. The dominant trend throughout the state was one of loss with declines in occupied housing units in 60 percent of the counties (32 counties) in the state. In contrast, the

2012 NORTH DAKOTA STATEWIDE HOUSING NEEDS ASSESSMENT: HOUSING FORECAST 19 STATEWIDE CONTEXT
counties with major urban centers saw double digit increases (i.e., Cass at 22.6 percent and Burleigh at 19.3 percent) as did some of the western energy development counties (i.e., McKenzie at 14.7 percent, Williams at 13.6 percent, and Mountrail at 11.4 percent). The limited number of western counties that showed growth in housing from 2000 to 2010 reflects the fact that the broader impact of energy development activity did not begin in earnest until the latter part of the decade. The demand was primarily being met by available housing stock, thus growth in housing stock is largely absent from this trend line. In addition, it is important to distinguish between the demand for permanent versus temporary housing, which reflects the distinction of permanent versus temporary workers. Census data and the data in our report focus on permanent housing; this could lead to confusion about why the numbers may not match the number of people on the ground. It is extremely important to recognize that housing needs for temporary workers are not addressed in this report, but represent a very significant concern. The trend in housing vacancy rates from 2000 to 2010 parallels the previous decade. In 2000, 32,525 housing units were vacant, which was 11.2 percent of all housing (see Table 3). This was a decline of 8 percent from 1990. In 2010, 11.4 percent of the total housing units in the state were vacant. The greatest decrease in housing vacancy was in western North Dakota. Of the 16 counties impacted by energy development activity, half had declines in housing vacancy that exceeded 30 percent from 2000 to 2010. AFFORDABLE HOUSING Affordable housing is a function of both the supply of low-cost housing and the income levels of residents. Table 4 provides a benchmark of income levels for residents in the state and it is designed to align closely with various federal housing programs. The benchmark of $61,500 in 2010 is based on median family income (MFI) of North Dakota residents as reported by the U.S. Department of Housing and Urban Development (HUD). Six categories of incomes are provided for program purposes and are based on a percentage below or above the state’s MFI. Monthly affordable housing costs were estimated at 30 percent of the corresponding income category while affordable purchase price was based on a more complex formula that is typical of those used by lenders. The main assumptions include a 30-year loan fixed at 4 percent interest, 5 percent down payment, property taxes at 1.25 percent of the loan, mortgage and hazard insurance at 0.6 percent of the loan, and total debts at no more than 20 percent of income. Table 4. North Dakota Annual Income Level Category Characteristics, 2010
Characteristic
Income Categories Based on Income as a Percentage of the Median Family Income (MFI) FY 2010
(FY 2010 MFI=$61,500 in North Dakota)
Extremely low: 0% to 30% MFI
Very Low: 31% to 50% MFI
Low Income: 51% to 80% MFI
Moderate:
81% to 115% MFI
Upper: Above 115% MFI
Tax Credit: 51% to 60% MFI
From: To: From: To: From: To: From: To: From: To: From: To:
Annual Income Ranges ($) $0 $18,450 $18,451 $30,750 $30,751 $49,200 $49,201 $70,725 $70,726 and above $30,751 $36,900
Monthly Affordable Housing Costs ($) $0 $461 $462 $769 $770 $1,230 $1,231 $1,768 $1,769 and above $770 $923
Affordable Purchase Price ($) $37,741 $62,845 $100,665 $144,923 $174,814 $75,738
% of Owner-Occupied Housing Units That Are Affordable 16.2% 28.9% 56.6% 67.3% 77.5% 33.8%
% of Renter-Occupied Housing Units That Are Affordable 35.2% 75.4% 87.7% 90.1% 90.1% 84.1%
Sources: U.S. Department of Housing and Urban Development and the Center for Social Research at NDSU
Table 3. North Dakota Housing Supply by Occupancy Status and Tenure, 1990, 2000, and 2010
Occupancy and Tenure 1990 2000 2010 % Change: 2000-10
Total housing units 276,340 289,677 317,498 9.6%
Occupied housing units 240,878 257,152 281,192 9.3%
Owner-occupied 157,950 171,310 183,943 7.4%
Percent of all occupied housing 65.6% 66.6% 65.4% -1.8%
Renter-occupied 82,928 85,842 97,249 13.3%
Percent of all occupied housing 34.4% 33.4% 34.6% 3.6%
Vacant housing units 35,462 32,525 36,306 11.6%
Percent of total housing units 12.8% 11.2% 11.4% 1.8% Source: U.S. Census Bureau, Decennial Census. Please note that the U.S. Census Bureau’s American Community Survey 2006-2010 5-Year Estimates were used in the state and regional profiles of this study to be consistent with modeling efforts. Thus, there will be slight differences in the 2010 data between this table and the profiles.

2012 NORTH DAKOTA STATEWIDE HOUSING NEEDS ASSESSMENT: HOUSING FORECAST 20 STATEWIDE CONTEXT
Based on these assumptions, the purchase price of a home for a family below 30 percent of the MFI would be $37,741. At present, only 16 percent of the owner-occupied housing units in the state, if sold, would be affordable for people in this income circumstance. Similarly, only 35 percent of the rental units in the state are affordable to those below 30 percent of the state’s MFI. In contrast, those in the moderate income bracket have a much greater opportunity for housing, since 67 percent of the current owner-occupied housing stock and 90 percent of rental units would be affordable to them. HOUSING CONDITIONS In general, the overall housing conditions in the state are very good. An estimated 440 owner-occupied housing units in the state lacked plumbing (0.2 percent) in 2010 and 357 units lacked a complete kitchen facility (0.2 percent). Less than one percent was classified as overcrowded by having more than one occupant per room (see Table 5). Renter-occupied housing has slightly more substandard issues than owner-occupied housing, with 1.5 percent of these units lacking complete kitchen facilities and nearly 2 percent classified as overcrowded. There are some variations by region, but the greatest proportion of substandard owner-occupied housing is in Region III due to overcrowding. Region III also has the greatest proportion of rental units that are substandard with over six percent of all rental units classified as overcrowded. It is worth noting that the significant demand for housing for temporary workers has created issues such as lack of plumbing and kitchen facilities or overcrowding that largely are not reflected in these data, but are important issues to be addressed. Table 5. North Dakota Substandard Occupied Housing Units (Lacking Complete Kitchen or Plumbing, or Overcrowded) by Tenure, 2010
Area
Owner-Occupied Housing Units Renter-Occupied Housing Units
Total
Lacking Complete Plumbing Facilities
Lacking Complete Kitchen Facilities
Overcrowded (>1 Person Per Room)
Total
Lacking Complete Plumbing Facilities
Lacking Complete Kitchen Facilities
Overcrowded (>1 Person Per Room)
# % # % # % # % # % # %
North Dakota 184,117 440 0.2% 357 0.2% 1,328 0.7% 92,525 280 0.3% 1,391 1.5% 1,631 1.8%
Region I 9,051 24 0.3% 25 0.3% 82 0.9% 3,621 23 0.6% 51 1.4% 54 1.5%
Region II 24,932 75 0.3% 79 0.3% 132 0.5% 11,655 3 0.0% 128 1.1% 259 2.2%
Region III 11,148 50 0.4% 39 0.3% 313 2.8% 4,426 17 0.4% 38 0.9% 283 6.4%
Region IV 21,771 33 0.2% 26 0.1% 162 0.7% 14,236 39 0.3% 90 0.6% 121 0.8%
Region V 44,875 79 0.2% 74 0.2% 234 0.5% 32,923 82 0.2% 707 2.1% 578 1.8%
Region VI 17,806 61 0.3% 34 0.2% 66 0.4% 6,602 48 0.7% 109 1.7% 55 0.8%
Region VII 42,551 86 0.2% 38 0.1% 287 0.7% 15,163 34 0.2% 180 1.2% 258 1.7%
Region VIII 11,983 32 0.3% 42 0.4% 52 0.4% 3,899 34 0.9% 88 2.3% 23 0.6%
Source: U.S. Census Bureau

2012 NORTH DAKOTA STATEWIDE HOUSING NEEDS ASSESSMENT: HOUSING FORECAST 21 STATEWIDE CONTEXT
SPECIAL POPULATIONS Special attention needs to be given to housing needs of unique populations within the state. Two categories of residents receive particular attention in this analysis. The first is the elderly whose numbers and proportions are growing as a result of the baby boom cohort aging into the next broad age category, a process known as aging forward. Those seniors whose limited income places them in a vulnerable position with regard to housing need particular attention. As noted in Table 6, more than one in five owner-occupied householders ages 65 and older were cost-burdened in 2010, in that housing costs exceeded 30 percent of their household income. The number of seniors in this situation has grown by 91 percent from 2000 when only 15.4 percent of the state’s residents 65 and older who lived in owner-occupied units were cost-burdened. An even more noteworthy figure is the proportion of seniors living in rental units who are cost-burdened. In 2010, nearly half of the 16,449 senior householders who were renting their home paid at least 30 percent of their total income towards rent. Although the actual number of senior renters who were cost-burdened in 2010 is similar to that in 2000, the proportions have dramatically increased, from 38.0 percent to 49.1 percent, respectively. The second special population that deserves attention is the homeless in the state. According to a statewide point-in-time survey of homeless people on January 26, 2011, there were 1,094 people identified as homeless throughout North Dakota (see Table 7). Approximately one-fourth of these individuals were children under 18 years of age. Additionally, more than one in four of the homeless counted in January were chronic or long-term homeless which indicates their situation has lasted more than a year or over multiple years. Two-thirds of the homeless counted in January of 2011 were located in Cass and Burleigh counties. Obtaining an accurate count of homeless is challenging, and the rapid dynamics associated with the boom in energy development in our state makes it even more difficult to assess. Our harsh winter climate results in seasonal variations in the homeless count; locating the homeless and getting volunteers to help are also more difficult during the winter. With these challenges in mind, the North Dakota Coalition for Homeless People, Inc. conducted a summer survey on July 27, 2011 in addition to the January survey it typically conducts. This July 2011 survey included data regarding people who were sheltered (i.e., in an emergency shelter, domestic violence shelter, or transitional housing facility) and interviews with and counts of people who were unsheltered (i.e., outside, in a vehicle/tent, or in another location not meant for human habitation including a dwelling with no operating utilities). For more information about the survey methodology, visit http://www.ndhomelesscoalition.org.
Table 7. North Dakota’s Homeless Population Characteristics on January 26, 2011
Area
Homeless Persons
Total Persons
Age*
Chronic1 Long-term Homeless2
Children Ages 0 to 17
Adults Ages 18 and Older
North Dakota 1,094 281 776 67 240
Region I 39 7 32 1 2
Region II 51 8 43 1 7
Region III 11 0 11 0 1
Region IV 172 39 120 19 40
Region V 406 79 304 36 128
Region VI 48 5 43 0 24
Region VII 328 128 199 8 32
Region VIII 39 15 24 2 6 Notes: *Information regarding age was not provided by some respondents.
1Chronic Status is determined
using the HUD definition, which is an individual with a disabling condition who has been homeless for at least one year, or four or more times in the last three years, and is sleeping either in an emergency shelter or somewhere not fit for human habitation.
2Long-term homeless is the definition adopted by the ND
Interagency Council on Homelessness (ICH), which is an individual or a family with a disabling condition who has been homeless continuously for at least one year or more than four times in the last three years. The ICH definition does not exclude people who are currently living “doubled up” with friends/family, people precariously housed in motels, or those in transitional housing. Source: North Dakota Coalition for Homeless People, North Dakota Homeless Population January 26, 2011Point in Time Survey, http://www.ndhomelesscoalition.org/
Table 6. North Dakota Elderly Householders Burdened by Housing Costs (30% or More of Income toward Housing Costs) by Tenure, 2000 and 2010
2000 2010
Owner-Occupied
Households
Renter-Occupied
Households
Owner-Occupied
Households
Renter-Occupied
Households
All householders 65 and older 32,980 16,124 44,819 16,449
Cost-burdened 5,087 6,129 9,713 8,080
Percent 15.4% 38.0% 21.7% 49.1% Source: U.S. Census Bureau

2012 NORTH DAKOTA STATEWIDE HOUSING NEEDS ASSESSMENT: HOUSING FORECAST 22 STATEWIDE CONTEXT
According to the July 27, 2011 results, there were 1,773 people who were homeless in the summer months within the state. The majority of these individuals were unsheltered (54 percent). Interviews with the unsheltered households conducted during the July 2011 homeless count offer some insight into the life situation of these individuals. When asked where they slept last night, 44 percent of the unsheltered population surveyed indicated they slept in a vehicle or a tent and 39 percent slept outside. The majority of those surveyed were dealing with substance abuse (53 percent) and mental illness (56 percent). One in three surveyed was a
veteran and 15 percent were impacted by domestic violence. Nearly one-fifth were displaced by flooding (18 percent) and 40 percent came from another state looking for work; 70 percent of those who came from another state looking for work did not have permanent housing to return to (see Figure 12). As part of their effort, the Coalition determined the number of beds needed within each planning region throughout the state. The calculation of need is based on a standardized formula established by the U.S. Department of Housing and Urban Development (HUD). The results, reported in Table 8, show that the type of housing need varies by region. Beds within emergency shelters and transitional housing represent the majority of need for homeless in Regions I, II, III, VII, and VIII. The need within Regions IV, V, and VI is mostly for permanent supportive housing.
Table 8. Needed Beds by Type for North Dakota’s Homeless Population on July 27, 2011
Area
Needed Beds as of July 27, 2011
Emergency Shelter Transitional Housing Permanent Supportive Housing Total
Number % of Regional Total Number % of Regional Total Number % of Regional Total Number % of Regional Total
North Dakota 385 25.6% 460 30.6% 660 43.9% 1,505 100.0%
Region I 125 68.7% 41 22.5% 16 8.8% 182 100.0%
Region II 44 21.0% 120 57.1% 46 21.9% 210 100.0%
Region III 50 62.5% 10 12.5% 20 25.0% 80 100.0%
Region IV 31 25.0% 11 8.9% 82 66.1% 124 100.0%
Region V 21 5.5% 29 7.7% 329 86.8% 379 100.0%
Region VI 10 23.3% 9 20.9% 24 55.8% 43 100.0%
Region VII 60 29.3% 65 31.7% 80 39.0% 205 100.0%
Region VIII 44 15.6% 175 62.1% 63 22.3% 282 100.0% Source: North Dakota Coalition for Homeless People, North Dakota Homeless Population Point in Time Survey, http://www.ndhomelesscoalition.org/
Figure 12. Responses from Unsheltered Households in North Dakota on July 27, 2011
Source: North Dakota Coalition for Homeless People, North Dakota Homeless Population July 27, 2011 Point in Time Survey, http://www.ndhomelesscoalition.org/
14.7%
18.2%
33.7%
38.8%
40.1%
43.6%
45.0%
52.6%
55.8%
70.1%
0.0% 20.0% 40.0% 60.0% 80.0%
Associated with domestic violence
Displaced by flooding
Veteran
Stayed outside last night
Came from another state for work
Stayed in a vehicle/tent last night
Homeless for > 1 year or 4+ times in past 3 years
Associated substance abuse
Associated mental illness
Of those here for work, no housing in home state
2012 NORTH DAKOTA STATEWIDE HOUSING NEEDS ASSESSMENT: HOUSING FORECAST 23 STATEWIDE CONTEXT
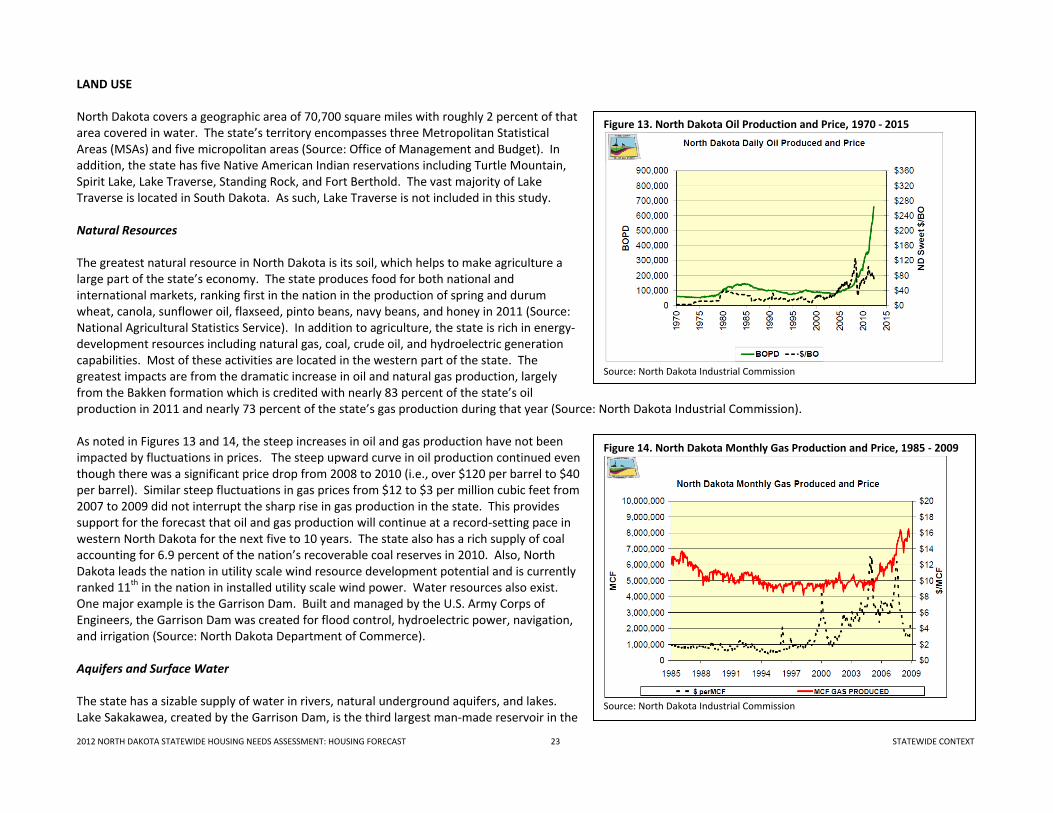
LAND USE North Dakota covers a geographic area of 70,700 square miles with roughly 2 percent of that area covered in water. The state’s territory encompasses three Metropolitan Statistical Areas (MSAs) and five micropolitan areas (Source: Office of Management and Budget). In addition, the state has five Native American Indian reservations including Turtle Mountain, Spirit Lake, Lake Traverse, Standing Rock, and Fort Berthold. The vast majority of Lake Traverse is located in South Dakota. As such, Lake Traverse is not included in this study. Natural Resources The greatest natural resource in North Dakota is its soil, which helps to make agriculture a large part of the state’s economy. The state produces food for both national and international markets, ranking first in the nation in the production of spring and durum wheat, canola, sunflower oil, flaxseed, pinto beans, navy beans, and honey in 2011 (Source: National Agricultural Statistics Service). In addition to agriculture, the state is rich in energy-development resources including natural gas, coal, crude oil, and hydroelectric generation capabilities. Most of these activities are located in the western part of the state. The greatest impacts are from the dramatic increase in oil and natural gas production, largely from the Bakken formation which is credited with nearly 83 percent of the state’s oil production in 2011 and nearly 73 percent of the state’s gas production during that year (Source: North Dakota Industrial Commission). As noted in Figures 13 and 14, the steep increases in oil and gas production have not been impacted by fluctuations in prices. The steep upward curve in oil production continued even though there was a significant price drop from 2008 to 2010 (i.e., over $120 per barrel to $40 per barrel). Similar steep fluctuations in gas prices from $12 to $3 per million cubic feet from 2007 to 2009 did not interrupt the sharp rise in gas production in the state. This provides support for the forecast that oil and gas production will continue at a record-setting pace in western North Dakota for the next five to 10 years. The state also has a rich supply of coal accounting for 6.9 percent of the nation’s recoverable coal reserves in 2010. Also, North Dakota leads the nation in utility scale wind resource development potential and is currently ranked 11th in the nation in installed utility scale wind power. Water resources also exist. One major example is the Garrison Dam. Built and managed by the U.S. Army Corps of Engineers, the Garrison Dam was created for flood control, hydroelectric power, navigation, and irrigation (Source: North Dakota Department of Commerce). Aquifers and Surface Water The state has a sizable supply of water in rivers, natural underground aquifers, and lakes. Lake Sakakawea, created by the Garrison Dam, is the third largest man-made reservoir in the
Figure 13. North Dakota Oil Production and Price, 1970 - 2015
Source: North Dakota Industrial Commission
Figure 14. North Dakota Monthly Gas Production and Price, 1985 - 2009
Source: North Dakota Industrial Commission

2012 NORTH DAKOTA STATEWIDE HOUSING NEEDS ASSESSMENT: HOUSING FORECAST 24 STATEWIDE CONTEXT
country. The middle section of the state is richly supplied by water from the Missouri River while the eastern portion of the state draws water from the Red River which runs north to Canada. Due to the continuous development of agriculture and food processing in the state, the number of irrigated acres in North Dakota has grown from 190,000 in 1990 to 260,000 in 2012 which is slightly more than 1 percent of the total cultivated land in the state (Source: North Dakota State University). Conflict between agricultural users of water and housing developments’ need for water is a concern in the state. However, flooding issues have received greater attention in recent years. Major flooding events in 2011 occurred in the Devils Lake Basin and along the Red River of the North, James, Sheyenne, Missouri, and Mouse rivers. The historic flooding in 2011 displaced over 11,000 residents in the city of Minot and impacted 4,100 homes and businesses. The North Dakota Department of Emergency Services estimated the final cost associated with the 2011 flooding throughout North Dakota could exceed $1.4 billion. Federal disaster declarations were issued for 44 of the state’s 53 counties and four tribal reservations allowing them to apply for public assistance for recovery efforts. The Federal Emergency Management Agency and the U.S. Small Business Administration provided North Dakota more than $495 million for recovery efforts as a result of flooding in 2011. Nearly $317 million in Federal Highway Emergency Relief funds were made available to address flooding impacts on state, county, or federal aid routes. Additionally, the state was allocated nearly $11.8 million from the U.S. Department of Housing and Urban Development for disaster relief with an additional $67.5 million for the city of Minot. The state also responded by providing a series of funding opportunities including a $50 million Rebuilders Loan Program; $23 million to help cities, counties, and townships with extraordinary road repairs; and $500,000 for grants to flood-damaged schools. In short, the impact of flooding is significant. Land Valuation North Dakota’s land values have been rapidly increasing in recent years due to a robust agricultural economy. The average value per acre of all agricultural land in North Dakota increased by 29 percent from 2011 to 2012 based on the value of production. The value of cropland increased by 31 percent while non-cropland value increased by 23 percent. The value for all agricultural land is a weighted average of cropland and non-cropland in each county. Calculated values for cropland generally are three to five times the value of non-cropland. North Dakota’s 2012 capitalized average annual value of land per acre was $604.51 for cropland, $121.92 for non-cropland, and $452.47 for all agricultural land. According to calculations by staff at the North Dakota State University Department of Agribusiness and Applied Economics, the northern half of the state saw the greatest increase in land values (see Figure 15). McIntosh County, with the smallest increase in average land value from 2011 to 2012 of 19 percent, demonstrates the significant surge in land values within the state. In 2007, North Dakota had 31,971 farms/ranches that accounted for almost 40 million acres of land. It is noteworthy that the amount of land in agriculture has not changed significantly over time (Source: U.S. Department of Agriculture). Nonetheless, agricultural issues do pose some concerns for housing development. One-fourth of the 211 key leaders and stakeholders surveyed for the purposes of the Statewide Housing Needs Assessment indicated that zoning issues regarding the development of agricultural land inhibit housing and development in their communities. Another concern was the willingness of farmers/ranchers to sell their property for residential development. The vast majority of key stakeholders surveyed indicated that ecological issues involving agricultural enterprises (i.e., air, noise, and water quality issues) did not inhibit housing and development. Details from this survey are presented in a companion report, 2012 North Dakota Statewide Housing Needs Assessment: Survey of Stakeholders.
Figure 15. Percent Change in Average Value of All Agricultural Land in North Dakota by County, 2011-2012
Source: North Dakota State University Department of Agribusiness and Applied Economics

2012 NORTH DAKOTA STATEWIDE HOUSING NEEDS ASSESSMENT: HOUSING FORECAST 25 STATEWIDE CONTEXT
Transportation North Dakota has more miles of road per capita than any other state in the nation – approximately 166 miles of road for every 1,000 people (Source: North Dakota Department of Transportation). The average commuting time for workers in the state was under 16 minutes, which was lower than the national average of 25.2 minutes in 2010. Nonetheless, workers’ commute time is increasing in North Dakota, up from 13 minutes in 1990 (Source: U.S. Census Bureau). Two of the nation’s main trade corridors cut through the state: the Central North American Trade Corridor (Highway 85) and the Red River Trade Corridor (Interstate 29). These corridors, along with the state’s main east-west highway (Interstate 94), generate a significant amount of commerce (Source: North Dakota Department of Commerce). North Dakota has seven railroad systems, providing approximately 3,667 miles of track. Railroads operating in North Dakota include two Class I railroads: Burlington Northern Santa Fe which accounts for 1,732 miles of main line track, and the CP Rail System (Soo Line) representing 482 miles of track. In addition, the state has three regional railroads (Red River Valley & Western; Dakota, Missouri Valley & Western; and Northern Plains Railroad) and two local railroads (Yellowstone Valley Railroad and Dakota Northern Railroad). Amtrak, which is the state’s only passenger train carrier, serves seven stations throughout the state. North Dakota has 89 public airports; four are international airports. The seven airlines that currently serve the state are Allegiant, American, Bakken Air, Delta, Frontier Airlines, Great Lakes, and United (Source: North Dakota Aeronautics Commission).
2012 NORTH DAKOTA STATEWIDE HOUSING NEEDS ASSESSMENT: HOUSING FORECAST 26 HOUSING FORECAST
HOUSING FORECAST: FUTURE DEMAND AND SUPPLY MODELING METHODOLOGY We used established modeling techniques to forecast housing demand within the context of projected residential change with breakdowns by age, income, and homebuyer type. Regarding housing supply, we forecast housing supply to the year 2025 based on historical trends in housing construction (Model 1) and based on the growth of, or decline in, future households (Model 2). Contrasting these two supply forecasts offers a useful perspective regarding how well the current pattern of housing construction, if continued into the future, fits the expected housing needs based on population projections. It is important to acknowledge that determining future housing needs is a complex issue. The dynamic nature of western North Dakota based on the unprecedented boom in energy development is an excellent illustration. At best, the predictions of residential growth and corresponding housing demand can only be simulated through modeling. How close the prediction is to reality is a function of how well the assumptions match what actually happens over time. Therefore, housing forecasts should be used only as one tool in developing housing policy. Nonetheless, the patterns that emerge from modeling, when placed within the appropriate economic and political context, are useful for predicting future housing needs. PROJECTED HOUSING DEMAND Modeling of Projected Housing Demand Our approach to forecasting housing demand for the state was a two-staged process. In the first stage, we developed county and age-specific population projections for the years 2015, 2020, and 2025 and then determined the age-specific distribution of householders based on 2010 Census data. In the second stage, we forecast housing based on the characteristics of income and homebuyer type. First Stage: Projections of Population and Householders In the first stage, we used a complex multi-step approach to develop our age-specific projections of population and householders. Because the growth in western North Dakota is so out of line with previous trends, we modeled population in the western portion of the state separately from the eastern side. We targeted the 16 rapid expansion counties in western North Dakota impacted by energy development activity (see Figure 1) and used an employment-based economic model to project population change. There were two main steps to the process of modeling population projections to serve as thresholds of population in the western part of the state: to project employment and then to estimate total households (and the number of people in those households) based on employment. The third step in the first stage was to utilize the thresholds when using the cohort component population projection model to develop age-specific population projections for these western counties along with the rest of the state. The fourth step was to determine the age-specific distribution of householders based on 2010 Census data. The first step for the 16 western North Dakota counties was to develop an annual forecast of total employment that included future estimates of petroleum sector employment along with trends in base (residual) employment (see Figure 16). These employment estimates were generated by economists from North Dakota State University using data from the petroleum industry, Job Service North Dakota, and other sources (see Bangsund, Hodur, Rathge, & Olson, 2012). The employment estimates were based on information from the petroleum industry that predicts 32,000 wells will be developed by 2036. As noted in Figure 16, total employment demand jumps from around 78,000 in 2010 to a peak of nearly 130,000 by the year 2020 after which it begins to stabilize.

2012 NORTH DAKOTA STATEWIDE HOUSING NEEDS ASSESSMENT: HOUSING FORECAST 27 HOUSING FORECAST
Petroleum sector employment was separated into two categories, temporary workers and permanent workers. Temporary workers were viewed as those largely responsible for drilling, fracturing, and construction of in-field gathering systems. In contrast, permanent workers were defined as those who worked in oil field service, gas processing, gas and oil shipment, maintenance of in-field gathering systems, and about 10 percent of the drilling and fracturing employment. This distinction is important because of the unique characteristics of the petroleum sector workforce. Some of the jobs in the sector are filled with workers that are not actual residents of North Dakota – they work in North Dakota, but live elsewhere and upon completion of their job will move on to the next worksite. That portion of the workforce was categorized as a temporary worker. The permanent workforce is made up of employees that work in North Dakota and are actual residents of the state. The distinction is important as the two groups of workers may need different types of housing. Estimating demand for housing based on all permanent and temporary workers would likely lead to overbuilding and subsequent negative consequences. As noted in Figure 16, the temporary workforce is estimated to jump from 2,000 in 2007 to a peak of over 42,000 in 2013. In our population projection modeling for western North Dakota we separated these two categories of workers and used only the permanent workers in our calculations. This is an important point because the population projections produced in this report and the resulting housing demand reflect only that proportion of the population that represent potentially permanent residents. As noted in Figure 16, temporary employment represents a significant proportion of total employment through the year 2020. This means that from 2010 to 2020, there will be a significant mismatch between population projections for western energy development counties reported in this report and actual number of people on the ground in these western counties. Likewise, the corresponding housing demand forecasts in this report for permanent residents in those western counties will greatly underrepresent actual housing need for that time period when including the needs of temporary workers. The amount of this underestimation is illustrated by the difference between permanent employment and total employment noted in Figure 16. It is extremely important, therefore, that planners and policy makers recognize that housing needs for temporary workers are not addressed in this report, but represent a very significant concern. The second step for the 16 western North Dakota counties was to translate employment projections of permanent workers into households using the ratio of change in employment from 2000 to 2010 and change in households during that same period. Census data were used in the calculations. Next, households were then translated into estimates of total residential population based on trends in persons per household, also using Census data. Since the impact of oil and gas development on employment differed markedly within this 16-county area, we combined the counties into three trade areas which reflect the economic base of the region: Dickinson, Minot, and Williston. This allowed us to adapt the calculations to the uniqueness of each of the trade areas. Dickinson was the first trade area and included the counties of Billings, Dunn, Golden Valley, Hettinger, Slope, and Stark. Minot was the second trade area and included the counties of Bottineau, Burke, McHenry, Mountrail, Pierce, Renville, and Ward. Williston was the final trade area and included the counties of Divide, McKenzie, and Williams. A detailed explanation of this econometric approach can be found in Bangsund et al. (2012).
Figure 16. Employment Figures and Projections for Oil-Impacted Counties in North Dakota, 2000 to 2036
Source: North Dakota State University Department of Agribusiness and Applied Economics
0
20,000
40,000
60,000
80,000
100,000
120,000
140,000
20
00
20
03
20
06
20
09
20
12
20
15
20
18
20
21
20
24
20
27
20
30
20
33
20
36
TotalEmployment
PermanentEmployment
TemporaryEmployment

2012 NORTH DAKOTA STATEWIDE HOUSING NEEDS ASSESSMENT: HOUSING FORECAST 28 HOUSING FORECAST
In the third step, we used the forecast of total population change for each of the 16 energy-impacted counties as a threshold and relied on a cohort component population projection model to develop age-specific population projections. We also used this cohort component population projection model for the remaining counties in the state. A standard cohort-component population projection model uses county-specific trends in fertility, mortality, and migration to project future population. In our model we used age-specific fertility rates from 2007 to 2009. We aggregated the counties into three types based on different trends in fertility rates: reservation counties, urban counties, and rural counties. Mortality rates were based on age-specific death rates, by gender, from 2004 to 2006. Migration rates were based on county- and age-specific migration patterns from 2006 to 2009. However, we adapted these migration rates to current trends for 2009 through 2011 using cohort-specific trend line data from a) births, b) school enrollments, c) age-specific workforce data, and d) Medicare/Social Security data. In the fourth and final step, we determined the age-specific distribution of householders based on 2010 Census data. The stability of this distribution was evaluated by cross-checking the age-specific proportions with 1990 and 2000 Census data. In general, the relationship between the number of persons in a specific age group and the proportion of householders in that age group remained fairly constant over time. We assumed, therefore, this relationship would hold throughout our projection period. We then applied the age-specific distribution of householders to our age-specific population projections to determine housing demand. Second Stage: Modeling household characteristics In the second stage, we forecast housing demand based on household characteristics, specifically income, homebuyer type, and tenure. Shifts in age of householders are an important component of housing demand that need to be monitored (see Table 9); shifts in income of householders (see Table 10) as well as homebuyer type, which looks at the interplay of householder age and income (see Table 11), are important components as well. In order to monitor these trends, we developed a forecast of households by income as well as by type of homebuyer. This was accomplished through a three-step procedure. First, distributions of household income by age were calculated for six broad income categories and four broad age categories using 2010 data from the U.S. Census Bureau’s American Community Survey (ACS). Second, the usefulness of utilizing proportional assignment of income to householders by age of householder for the purpose of forecasting was assessed by cross-checking the distributions found in 2010 against the corresponding age-specific income distributions found in the 2000 Census. Similar proportions of age-specific households were found in each income category related to MFI, thus it was assumed that these proportions would hold throughout the projection period. Third, the age- and income-specific proportions based on 2010 ACS data were applied to the total projected number of households to project households by household income and to the projected number of households by age to project households by type of homebuyer. The distribution of household income by age was calculated for six broad income categories using 2010 data from the U.S. Census Bureau’s American Community Survey (ACS). The value of using proportional assignment to MFI is that it eliminates the need to project actual future income levels and associated inflation. Instead, the forecast focuses on changes in the distribution of households relative to MFI. As noted earlier, these categories were selected to align with various housing support programs. The income categories, based on median family income (MFI), are: Extremely Low Income (i.e., 0 to 30 percent MFI or less than $20,000 in 2010 dollars), Very Low Income (i.e., 31 percent to 50 percent MFI or $20,000 to $29,999 in 2010 dollars), Low Income (i.e., 51 percent to 80 percent MFI or $30,000 to $49,999 in 2010 dollars), Moderate Income (i.e., 81 percent to 115 percent MFI or $50,000 to $74,999 in 2010 dollars), Upper Income (i.e., above 115 percent MFI or $75,000 and above in 2010 dollars), and Tax Credit (i.e., 51 percent to 60 percent MFI or $30,000 to $39,999 in 2010 dollars). The age groupings were householders less than 25 years, ages 25 to 44, ages 45 to 64, and ages 65 and older. Five types of homebuyers were classified based on historical profiles of these homebuyers as well as the parameters of our source data. The first-time homebuyer was assumed to be under the age of 45 and have a household income from $30,000 to $74,999 (based on the dollar value in 2010). Low-income homebuyers were assumed to be younger than 65 years of age and have a household income less than $50,000 (based on the dollar value in 2010). Moderate-income homebuyers were assumed to be from the ages of 25 to 64 and have a household income from $50,000 to $74,999 (based on the dollar value in 2010). Upscale homebuyers were assumed to be from the ages of 25 to 64 and have a household income of $75,000 or more (based on the dollar value in 2010). Finally, elderly homebuyers were classified as any homebuyer ages 65 or older.

2012 NORTH DAKOTA STATEWIDE HOUSING NEEDS ASSESSMENT: HOUSING FORECAST 29 HOUSING FORECAST
Finally, projections of housing by tenure were calculated based on the assumption that historical patterns of homeownership are good predictors of future trends. Age-specific distributions of homeownership and rental-occupied housing were calculated for each geography (e.g., region, county, city, and reservation) based on the 2010 Census. The stability of these distributions was evaluated by comparing them to corresponding distributions for 2000. In general, the pattern of owner-occupied and rental-occupied units for each age category was very similar for the two time periods. Therefore, we assumed the age-specific proportions of owner- and renter-occupied units relative to total occupied housing units would hold throughout the projection period. We applied the 2010 age-specific distributions of owner- and renter-occupied housing units to our projections of total occupied housing units to make our forecast of housing by tenure. Housing Demand Forecast The future demand for housing is dramatically changing, especially in western North Dakota as a result of energy development activity. The tremendous influx of workers and their families into the area has consumed available housing supply and created an unprecedented demand for housing which places substantial pressure on policy makers, planners, and developers. Therefore, housing demand forecasts are extremely important. However, one must be cautioned that demand forecasts are simple mathematical models that indicate the number and type of housing that will likely be needed if population projections are accurate. In the rapidly changing environment of energy development booms, these forecasts need to be constantly monitored over time to assess how well they are trending. Thus, it is important to use these forecasts as only one tool in developing policy or planning. As noted in Table 9, four major trends in overall housing demand and age of householder need to be considered when addressing housing policy. First, the overall demand for housing in the state is expected to increase by 30 percent from 2010 to 2025. This is a dramatic shift from historical trends. Expansion in the number of households (i.e., occupied housing units) within the state during the past decade was 9 percent, or 24,040 households (see Table 3). In contrast, our forecast indicates the state is expected to grow by 83,429 households by the year 2025. The second major trend is that this growth is dominated by increasing demand for housing in western North Dakota’s oil patch (i.e., Regions I, II, and most of VIII), although Regions IV, V, and VII are also expected to see double digit growth. Households in Region I are expected to nearly triple by the year 2025, growing by 167 percent (21,172 households). Region II is expected to expand by more than 38 percent (nearly 14,000 households). Additionally, Region VIII is forecast to grow their number of households by nearly 70 percent (roughly 11,000 households). In contrast, Regions III and VI are expected to grow by less than 10 percent during the same time period. What is compelling is that housing demand in the energy-impacted counties is expected to expand significantly across all age categories. The third major trend is that the demand by younger households will generally decline in the state with the exception of energy development-impacted areas of the state and Region III which is home to a large proportion of Native Americans. This follows a continued historical trend of the loss of young adults in rural areas. The fourth major shift in housing demand will result from the aging forward of the baby boom population. The leading edge of this sizeable baby boom cohort, born from 1946 to 1964, turned 65 years of age in 2011, thus the demand for elderly housing will expand greatly over the next 15 years. This is reflected in the significant declines or much smaller increases in the 45 to 64 age cohort in much of the state and corresponding increases in the 65 and older cohort. Another area of housing demand that needs to be monitored is tied to shifts in the income of households. A review of the projected change detailed in Table 10 indicates some noteworthy trends. Statewide there is a significant growth across the board in households in all income categories over the next 15 years. The relatively even distribution is driven by significant gains in western counties and corresponding gains in regions with large urban centers. What is particularly noteworthy, however, is the growth in the number of households at the very low end of the income scale during a time when the state’s overall economy is likely to remain very robust. Statewide, the forecast indicates a 31 percent increase in the number of households at or below 30 percent of MFI (i.e., under $20,000 in 2010 dollars) by the year 2025, which translates into an increase of 17,263 extremely low-income households. Similarly, a 32 percent increase is expected in the number of households at 31 percent to 50 percent MFI (i.e., $20,000 to 29,999 in 2010 dollars) for the same time period adding another 10,462 very low-income households. On the other end of the income scale, the forecast indicates an expected increase of 28 percent of households at or above 115 percent of MFI or 21,192 households. Worthy of note also is the decline in upper-income households in Regions III and VI and only modest gains in Region IV. These trends present significant challenges.

2012 NORTH DAKOTA STATEWIDE HOUSING NEEDS ASSESSMENT: HOUSING FORECAST 30 HOUSING FORECAST
The sizeable growth in low-income households will place a significant burden on the state in terms of providing access to low-income housing. This will be particularly challenging in western North Dakota where housing shortages have already driven up home prices. Moreover, the rate of growth in overall demand that is forecast (i.e., more than doubling in some regions) suggests the challenge will be daunting for housing officials, especially given the historical context of decades of decline in many rural areas. Table 9. Projected Change in North Dakota Households by Age of Householder, 2010 to 2025
Area
Projected Change in Households by Age of Householder, 2010 to 2025
Total Householder Less than 25 years Householder Ages 25 to 44 Householder Ages 45 to 64 Householder Ages 65 and Older
Numeric Percent Numeric Percent Numeric Percent Numeric Percent Numeric Percent
North Dakota 83,429 30.2% 394 1.5% 37,268 42.2% 8,972 8.9% 36,795 60.1%
Region I 21,172 167.1% 306 34.5% 8,392 214.2% 8,325 167.6% 4,149 143.0%
Region II 13,994 38.2% -175 -5.3% 7,545 65.5% 2,662 20.0% 3,962 47.0%
Region III 1,426 9.2% 322 60.4% 173 3.6% -575 -9.5% 1,506 36.2%
Region IV 3,972 11.0% -254 -5.3% 3,488 30.4% -3,458 -27.8% 4,196 57.7%
Region V 17,317 22.3% -495 -4.6% 4,755 16.7% 1,873 7.4% 11,184 85.8%
Region VI 965 4.0% 3 0.3% 1,246 20.7% -1,680 -17.9% 1,396 17.7%
Region VII 13,648 23.6% 192 4.9% 6,429 35.7% -1,079 -4.8% 8,106 61.7%
Region VIII 10,935 68.9% 495 55.5% 5,240 127.0% 2,904 45.3% 2,296 51.5%
Sources: U.S. Census Bureau and the Center for Social Research at NDSU
Table 10. Projected Change in North Dakota Households by Household Income, 2010 to 2025
Area
Projected Change in North Dakota Households by Household Income Levels, 2010 to 2025
Extremely Low: 0 to 30% MFI
Very Low: 31% to 50% MFI
Low Income: 51% to 80% MFI
Moderate: 81% to 115% MFI
Upper: Above 115% MFI
Tax Credit: 51% to 60% MFI
Numeric Percent Numeric Percent Numeric Percent Numeric Percent Numeric Percent Numeric Percent
North Dakota 17,263 31.1% 10,462 31.6% 17,801 30.7% 16,695 30.3% 21,192 28.2% 9,567 31.0%
Region I 3,091 148.5% 2,052 160.9% 4,315 164.3% 4,670 177.0% 7,043 173.9% 2,230 165.0%
Region II 2,460 37.3% 1,730 35.9% 2,969 37.3% 3,178 40.6% 3,657 38.9% 1,593 37.0%
Region III 888 20.0% 287 13.9% 240 7.4% 51 1.8% -34 -1.2% 138 7.0%
Region IV 1,260 15.8% 799 18.0% 1,168 15.3% 500 7.3% 244 2.7% 626 16.0%
Region V 3,910 25.5% 2,339 26.1% 3,934 24.0% 3,181 21.0% 3,952 18.0% 2,172 24.0%
Region VI 446 8.0% 224 7.3% 230 4.2% 141 2.8% -74 -1.4% 156 5.0%
Region VII 3,145 31.5% 2,033 30.4% 2,751 24.1% 2,582 22.5% 3,139 17.3% 1,491 24.0%
Region VIII 2,063 59.6% 998 57.0% 2,194 68.0% 2,392 71.9% 3,265 79.3% 1,161 69.0%
Sources: U.S. Census Bureau and the Center for Social Research at NDSU Note: The projected change in number of households by income levels (83,413) does not match the total projected change in households listed in Table 9 (83,429) due to rounding error during modeling.

2012 NORTH DAKOTA STATEWIDE HOUSING NEEDS ASSESSMENT: HOUSING FORECAST 31 HOUSING FORECAST
The demand for housing by household type also is dominated by the impact of energy development in western North Dakota. In Region I, the demand for housing in each of the five categories was more than a doubling (and near tripling) of the existing housing units. A similar pattern exists for Region VIII at a slightly lower intensity (i.e., the lowest category expected a 52 percent increase). Excluding the impact from the energy development counties, the greatest demand for future housing statewide continues to be among the elderly. The forecast indicates that demand among householders ages 65 and older will grow by 60 percent from 2010 to 2025, which translates into a need for an additional 36,794 housing units appropriate for seniors. Region VI, with the smallest forecast increase at 18 percent, underscores the sizeable growth in demand for elderly housing that is anticipated as a result of the aging forward of the baby boom cohort. It is important to point out that a significant portion of the elderly housing demand is for low-income housing. For example, in Table 10 the change in demand for housing units below $50,000 (i.e., extremely low-, very low-, and low-income households) was estimated at 45,526 units from 2010 to 2025. At least half of those units would be needed for elderly. The change in demand for non-elderly low-income housing is 18,850 units by the year 2025 as noted in Table 11, which is a 19 percent increase from 2010. In general, despite having the second highest numeric change, non-elderly low-income housing had the lowest forecast need with respect to percent change among the five categories. Housing demand among the other three groups is fairly mixed and depends on the region of the state. For example, the change in demand for first-time homebuyers will be greatest in Regions I, II, and VIII, which are all dominated by energy development activity, followed by Region VII which includes the Bismarck-Mandan metropolitan area. Demand for moderate-income housing is forecast to decrease in Regions III, IV, and VI and only modestly grow in the remaining regions outside oil country. Finally, the demand for upscale housing also is expected to decrease in Regions III, IV, and VI but expand by more than 12 percent in Regions V and VII. Upscale housing demand in the energy development counties will be very strong with demand in Region I nearly tripling the existing upscale housing stock. Table 11. Projected Change in North Dakota Households by Type of Homebuyer, 2010 to 2025
Area
Projected Change in Households by Type of Homebuyer, 2010 to 2025
First-Time Homebuyer
(ages 15-44; $30,000-$74,999)
Low-Income
(ages 15-64; <$50,000)
Moderate-Income
(ages 25-64; $50,000-$74,999)
Upscale
(ages 25-64; $75,000+)
Elderly
(ages 65 p, any income)
Numeric Percent Numeric Percent Numeric Percent Numeric Percent Numeric Percent
North Dakota 17,227 34.7% 18,850 18.7% 11,114 25.6% 16,403 24.7% 36,794 60.1%
Region I 4,011 184.2% 6,347 166.6% 4,112 191.8% 6,437 185.0% 4,147 142.9%
Region II 3,566 51.1% 4,222 32.3% 2,599 42.2% 3,226 39.0% 3,964 47.0%
Region III 148 6.9% 152 2.4% -129 -5.5% -164 -6.4% 1,506 36.2%
Region IV 1,440 21.6% 241 1.6% -117 -2.2% -316 -3.9% 4,194 57.7%
Region V 1,957 12.0% 2,350 7.5% 1,437 11.8% 2,416 12.3% 11,184 85.8%
Region VI 650 17.7% -177 -2.2% -47 -1.2% -199 -4.4% 1,395 17.7%
Region VII 2,887 30.2% 2,257 12.1% 1,241 14.1% 1,981 12.3% 8,110 61.7%
Region VIII 2,568 114.8% 3,458 70.1% 2,018 78.6% 3,022 81.8% 2,294 51.5%
Sources: U.S. Census Bureau and the Center for Social Research at NDSU
Citation: Bangsund, D. A., Hodur, N. M., Rathge, R., & Olson, K. (August 2012). “Modeling employment, housing, and population in western North Dakota: The case of
Dickinson.” Agribusiness and Applied Economics Report 695. Fargo, ND: Department of Agribusiness and Applied Economics, Agricultural Experiment Station, North Dakota State University.

2012 NORTH DAKOTA STATEWIDE HOUSING NEEDS ASSESSMENT: HOUSING FORECAST 32 HOUSING FORECAST
PROJECTED HOUSING SUPPLY Modeling of Projected Housing Supply In order to evaluate the relationship between future demand for housing and what housing might be available (i.e., supply), we developed two housing supply forecasts. Model 1 presents a scenario of what housing supply would be if past trends in housing construction were to continue through the year 2025 while Model 2 projects a scenario of future housing units based on the growth of, or decline in, future households through the year 2025. Housing Supply Model 1 – Based on Building Trends of Previous Decades The first housing supply forecast, Model 1, presents a scenario of what housing supply would be if past trends in housing construction were to continue through the year 2025 (see Table 12 for projected changes using this model). In an attempt to capture the most realistic picture of future supply, we needed to adapt our historical trend lines to the most relevant snapshot of housing construction for the different geographies under consideration. Five different approaches were used in calculating Model I housing supply. At the county level, we used the percent change in housing units from 2010 to 2011 for all counties except Cass County where we used the average annual change in housing from 2006 to 2010. The impact of the state’s robust economy is best illustrated by the most recent housing growth, thus we used the latest year of data. However, the housing growth in Cass County was unusually high for that year, thus we used an average of the most recent four years. For the 12 largest cities, we used the average annual growth for either the entire decade (i.e., 2000 to 2010) or the latter half of the decade (i.e., 2006 to 2010) depending on which best reflected sustainable growth. The only exception was the city of Williston where we used the change from 2009 to 2010, which were the most recent data available. For the four reservation areas, we used the percent change in housing units from 2000 to 2010. We applied the respective rate of change for each geography to the existing housing stock for each successive year until 2025. The purpose of the scenario depicted by Model 1 is to provide decision-makers a benchmark for evaluating the appropriateness of continuing the existing level of housing construction. One needs to keep in mind that this is a linear projection. Thus, this model assumes that the housing construction depicted in the historical trend we selected for that geography will continue unabated to the year 2025. Housing Supply Model 2 – Based on Projected Demand The second housing supply forecast, Model 2, projects a scenario of future housing units based on the growth of, or decline in, future households through the year 2025. This model forecasts changes in housing supply based on shifts in an area’s population profile (see Table 13). In particular, it relies on population projections which are translated into estimates of future households (or occupied housing units). These projections are then applied to a historical relationship between households and available housing units. In brief, it assumes that the way the market historically responded to changes in the number of households, through the supply of new housing units, should be similar to how the market will respond in the future. Therefore, this forecast is based on the ratio of households (i.e., occupied housing units) to total housing units. Calculation of Model 2 projections required two main steps. The first step was to calculate two ratios. The first ratio was the ratio of total population to occupied housing units (i.e., households) for each geographic area using data from the 2010 Census. The second ratio was the ratio of the proportional change in housing units to the proportional change in occupied housing units from 2000 to 2010, again using Census data. This measure reflects how the housing market in each geographic area adapts to changing population dynamics. This ratio was assumed to hold throughout the projection period. The second step was to use these two ratios to calculate our housing unit estimates for the three projection periods (i.e., 2015, 2020, and 2025). For the first projection period, we applied the ratio of population to occupied housing units based on 2010 Census data to our population projections for 2015 to determine an estimate of occupied housing units for 2015. Next we

2012 NORTH DAKOTA STATEWIDE HOUSING NEEDS ASSESSMENT: HOUSING FORECAST 33 HOUSING FORECAST
calculated the percent change in occupied-housing units for the time period 2010 to 2015. This estimate was applied to the ratio of relative change in occupied housing units to total housing units to forecast the number of housing units for 2015. For the second projection period, the percent change in occupied housing units from 2015 to 2020 was calculated using the same approach in the first step, but adjusting for the time period. Once again, the ratio was applied to this relative change to determine the housing units for 2020. The same process was followed for the third projection period to determine housing units for 2025. The value of the scenario depicted by Model 2 is to illustrate what will likely occur if the response to future housing demand follows the historical relationship between total housing units and occupied housing units as it adapts to population change. This model will be more sensitive to population change and serves as a juxtaposition to Model 1 showing the difference between what is likely to happen with housing stock if historical trends in building persist (i.e., Model 1) versus what that actual demand for housing will be given population change (i.e., Model 2). Housing Supply Forecast The first housing supply forecast, Model 1, presents a scenario of what housing supply would be if past trends in housing construction were to continue through the year 2025 (see Table 12 for projected changes using this model). In general, if current trends in housing construction continue, the state’s overall housing stock will expand by slightly more than 1 percent per year or by 51,292 units by the year 2025. Region I is expected to grow at twice that level, while Regions II, V, and VII will grow by more than 20 percent. In contrast, Regions III and VI, which lost housing units over the past decade, are projected to continue to lose housing based on this model (Model 1). Relative stability in housing is projected for Region IV. The second housing supply forecast, Model 2, projects future housing units based on the growth of, or decline in, future households. This model forecasts changes in housing supply based on shifts in an area’s population profile (see Table 13). In particular, it relies on population projections which are translated into estimates of future households (or occupied housing units). These projections are then applied to a historical relationship between households and available housing units. In brief, it assumes that the way the market historically responded to changes in the number of households, through the supply of new housing units, should be similar to how the market will respond in the future. Therefore, this forecast is based on the ratio of households (i.e., occupied housing units) to total housing units. Housing supply forecasts for Model 2 show an increase in the state’s overall housing stock of 29 percent (90,469 units; this number is higher than the 83,429 projected increased demand for housing because supply modeling incorporates vacancies). Change in housing supply forecasts based on population change (Model 2) rather than on the past decade’s building trends (Model 1) are 76 percent higher reflecting the unprecedented boom from energy development activity. The projected changes in housing supply based on the two models are shown in Table 12 (Model 1) and Table 13 (Model 2). The demand model that is driven by population change (i.e., Model 2) is significantly different than the one based on the past decade’s building trend (i.e., Model 1). The forecast based on recent construction trends indicates that overall statewide housing stock is expected to expand by 51,292 units by 2025 which is 57 percent less than the 90,469 units that would need to be built based population forecasts (i.e., Model 2). This implies that the current trend in housing construction is inadequate to keep pace with anticipated population growth. This is obviously true for much of western North Dakota where rapid population growth quickly outpaced existing housing stock. However, even in the regions not directly impacted by energy development, housing supply based on current trends in housing construction appears to be inadequate to meet projected demand based on population projections. The anticipated need for housing in Regions I and VIII are staggering. The demand model (i.e., Model 2) indicates that an additional 9,673 housing units will be needed in Region I by 2015, which is a 66 percent increase from 2010. This explosion in the need for housing in the region is expected to continue unabated, doubling the demand for housing from 2010 to 2020 with an increase in demand of 17,333 units. When the oil boom begins leveling off which is expected to begin somewhere around the year 2025, the demand for additional housing in Region I will have reached 20,854 units, or a 143 percent increase from 2010. In contrast, if the supply of housing in Region I maintained the pace it set from 2009 to 2010 (i.e., Model 1), only an additional 5,094 housing units would be built by 2025. This would be less

2012 NORTH DAKOTA STATEWIDE HOUSING NEEDS ASSESSMENT: HOUSING FORECAST 34 HOUSING FORECAST
than one-fourth the demand forecast based on population projections used in Model 2. A similar but less dramatic impact is forecast in Region VIII. From 2010 to 2015, an additional 4,461 housing units will be needed, which is a 24 percent increase. This demand will double by 2025 resulting in a need for 10,962 housing units from 2010 to 2025, which is a 57.7 percent increase. Once again, this is nearly four times the level of housing demand that was forecast in Model 1. Significant levels of housing demand are forecast in the other regions as well. In Regions II, V, and VII, Model 2 forecasts indicate a need for more than a 20 percent increase in housing stock by the year 2025. It is important to note that a similar forecast is indicated in Model 1, which suggests that current housing construction in these regions is in line with anticipated population growth. However, in Regions III and VI the forecast in Model 2 is for modest growth in housing demand while current trends in housing supply, noted in Model 1, indicate actual loss of housing. This implies that population growth in these regions is expected to be larger than current building trends would anticipate. Table 12. Projected Change in North Dakota Housing Units (Model 1 - Based on Building Trends of Previous Decade), 2010 to 2025
Area Number of Housing Units:
2010
Projected Change in Total Housing Units
2010 to 2015 2010 to 2020 2010 to 2025
Numeric Percent Numeric Percent Numeric Percent
North Dakota 289,677 20,398 6.5% 35,849 11.5% 51,292 16.4%
Region I 13,868 1,870 12.8% 3,482 23.8% 5,094 34.9%
Region II 41,021 3,425 8.1% 6,224 14.7% 9,022 21.3%
Region III 19,389 -271 -1.4% -499 -2.6% -729 -3.8%
Region IV 39,259 759 1.9% 1,330 3.3% 1,898 4.7%
Region V 70,924 8,370 10.1% 14,486 17.4% 20,600 24.8%
Region VI 29,346 -213 -0.7% -414 -1.4% -617 -2.1%
Region VII 57,799 5,388 8.3% 9,318 14.3% 13,248 20.4%
Region VIII 18,071 1,070 5.6% 1,922 10.1% 2,776 14.6%
Sources: U.S. Census Bureau and the Center for Social Research at NDSU
Table 13. Projected Change in North Dakota Housing Units (Model 2 - Based on Projected Demand), 2010 to 2025
Area
Number of Housing
Units: 2010
Change in Total Housing Units
2010 to 2015 2010 to 2020 2010 to 2025
Numeric Percent Numeric Percent Numeric Percent
North Dakota 289,677 42,322 13.5% 71,620 22.9% 90,469 28.9%
Region I 13,868 9,673 66.2% 17,333 118.6% 20,854 142.7%
Region II 41,021 10,829 25.5% 14,047 33.1% 13,725 32.3%
Region III 19,389 820 4.3% 1,416 7.4% 1,812 9.5%
Region IV 39,259 1,699 4.2% 3,018 7.5% 4,265 10.5%
Region V 70,924 8,187 9,8% 14,511 17.4% 21,113 25.4%
Region VI 29,346 836 2.9% 1,511 5.2% 2,204 7.5%
Region VII 57,799 5,817 9.0% 10,875 16.7% 15,534 23.9%
Region VIII 18,071 4,461 23.5% 8,909 46.9% 10,962 57.7%
Sources: U.S. Census Bureau and the Center for Social Research at NDSU

2012 NORTH DAKOTA STATEWIDE HOUSING NEEDS ASSESSMENT: HOUSING FORECAST 35 PROFILES
PROFILES North Dakota and Its Eight Planning Regions ................................................................................. 36 Tri-County Region I and Its Components ........................................................................................ 43 Souris Basin Region II and Its Components .................................................................................... 50 North Central Region III and Its Components ................................................................................ 57 Red River Region IV and Its Components ....................................................................................... 64 Lake Agassiz Region V and Its Components ................................................................................... 71 South Central Dakota Region VI and Its Components .................................................................... 78 Lewis and Clark Region VII and Its Components ............................................................................ 85 Roosevelt-Custer Region VIII and Its Components ......................................................................... 92 Native American Indian Reservations in North Dakota .................................................................. 99

2012 NORTH DAKOTA STATEWIDE HOUSING NEEDS ASSESSMENT: HOUSING FORECAST PROFILES – NORTH DAKOTA AND ITS EIGHT PLANNING REGIONS 36
NORTH DAKOTA AND ITS EIGHT PLANNING REGIONS
POPULATION CHANGE
$ Total population in North Dakota showed modest growth during the last decade – a 5 percent increase
from 642,200 in 2000 to 672,591 in 2010. Population projections for the state suggest significant change
over the next 15 years; North Dakota’s population could reach 841,820 by 2025, an increase of 25 percent
(169,229 people). Western North Dakota is expected to see the fastest growth, with Region I’s
population more than doubling in the next 15 years (42,335 people); Region VIII could see a growth of 60
percent (23,162 people). Regions II, V, and VII are also expected to see strong growth.
$ North Dakota is expecting to see population increases across all age groups by 2025. Largely as a result
of oil field development, the population of the prime workforce (ages 25 to 44) is projected to double in
Region VIII and more than triple in Region I. Beginning in 2011, baby boomers began turning 65. Thus,
over the next 15 years, the number of people ages 65 and older is projected to increase by half (52
percent). The 45 to 64 age group will grow by only 5 percent in North Dakota as a whole; Regions I, II,
and VIII are expected to see increases while Region V will remain stable and Regions III, IV, VI, and VII are
projected to see decreases. Population younger than 25 years within the state is projected to grow by
18 percent, with the largest increases projected in Regions I and VIII.
TRENDS IN HOUSING
$ Total housing units in North Dakota increased 8 percent from 2000 to 2010. Based on historical building trends (i.e., the basis for Model 1 projections), housing supply in the state is
projected to grow 16 percent by 2025 (an increase of 51,292 units). Region I is expected to show the fastest growth at 35 percent in the next 15 years. In contrast, Region III could lose
4 percent of their housing supply.
$ Using projections based on shifts in population and housing demand (i.e., the basis for Model 2) rather than on historical building trends, the housing supply in North Dakota could
increase 29 percent by 2025 (an increase of 90,469 units). The number of housing units in Region I could more than double over the next 15 years; Region VIII could see an increase of a
little more than half (58 percent).
$ In 2010, the majority of housing in the state was owner occupied (67 percent). Rental units, which captured one-third of housing in 2010, are projected to increase by one-third (36
percent) in the next 15 years. Rental units could nearly triple in Region I and double in Region VIII by 2025.
$ Very few owner or rental units in North Dakota were considered substandard (i.e., lacking complete plumbing or kitchen facilities) or overcrowded in 2010.
$ Three-fourths of owner- and renter-occupied housing units in the state were built prior to 1980 (79 percent and 76 percent, respectively). One-third of owner-occupied housing units in
the state were built prior to 1940; one-fourth of rental units were built prior to 1940.
$ Approximately one-tenth of all housing units in North Dakota were vacant in 2010. Of all the vacant units in state, 7 percent were for sale; 18 percent were available for rent; and 34
percent were for seasonal, recreational, or occasional use.
ECONOMICS OF HOUSING
$ According to 2010 data from the U.S. Census Bureau’s American Community Survey, median values of owner-occupied housing units for regions within North Dakota ranged from $54,478
in Region III to $114,282 in Region VII. Median gross rents for regions within the state ranged from $371 per month in Region III to $555 per month in Region V.
$ Over half of owner-occupied housing in North Dakota (61 percent) was valued at $90,000 or more in 2010; 43 percent was valued at $125,000 or more. Within Region V, three-fourths
of owner-occupied housing was valued at $90,000 or more and over half (57 percent) was valued at $125,000 or more.
$ Half of all rental units in North Dakota rented for at least $550 per month in 2010 (51 percent); 21 percent were at least $750 per month.
$ Housing unit projections suggest that housing demand in North Dakota will increase by around 30 percent across all income groups by 2025.

2012 NORTH DAKOTA STATEWIDE HOUSING NEEDS ASSESSMENT: HOUSING FORECAST PROFILES – NORTH DAKOTA AND ITS EIGHT PLANNING REGIONS 37
TABLE 1. TOTAL POPULATION, 2000 to 2025
TABLE 3. TOTAL HOUSING UNITS, 2000 to 2025 (Building Trends – Model 1)
TABLE 2. POPULATION BY AGE, 2010 and 2025
Area
Less Than 25 Years of Age Ages 25 to 44 Ages 45 to 64 65 Years and Older
2010 2025 Change: 2010
to 2025 2010 2025
Change: 2010 to 2025
2010 2025 Change: 2010
to 2025 2010 2025
Change: 2010 to 2025
North Dakota 230,891 272,286 17.9% 165,747 235,026 41.8% 178,476 186,448 4.5% 97,477 148,060 51.9%
Region I 9,819 15,811 61.0% 7,357 24,065 227.1% 8,872 22,637 155.2% 4,781 10,651 122.8%
Region II 31,237 39,071 25.1% 22,376 36,415 62.7% 22,835 27,232 19.3% 13,519 18,725 38.5%
Region III 14,529 15,561 7.1% 8,555 9,860 15.3% 11,105 9,249 -16.7% 6,483 8,346 28.7%
Region IV 33,807 35,541 5.1% 20,996 27,118 29.2% 22,229 15,202 -31.6% 11,487 17,264 50.3%
Region V 68,438 77,939 13.9% 51,328 59,249 15.4% 44,968 45,522 1.2% 20,747 36,089 73.9%
Region VI 16,117 16,646 3.3% 11,503 14,020 21.9% 16,636 13,300 -20.1% 12,107 14,256 17.8%
Region VII 44,867 54,047 20.5% 35,015 46,430 32.6% 40,662 37,211 -8.5% 21,320 32,305 51.5%
Region VIII 12,077 17,670 46.3% 8,617 17,869 107.4% 11,169 16,095 44.1% 7,033 10,424 48.2%
Area 2000 2010
Change: 2000 to
2010
Projections Change: 2010 to
2025 2015 2020 2025
North Dakota 642,200 672,591 4.7% 750,023 806,541 841,820 25.2%
Region I 27,781 30,829 11.0% 50,529 66,938 73,164 137.3%
Region II 88,089 89,967 2.1% 114,709 121,425 121,443 35.0%
Region III 43,168 40,672 -5.8% 41,434 42,254 43,016 5.8%
Region IV 90,798 88,519 -2.5% 90,506 92,800 95,125 7.5%
Region V 162,127 185,481 14.4% 196,322 207,284 218,799 18.0%
Region VI 61,454 56,363 -8.3% 56,813 57,349 58,222 3.3%
Region VII 130,418 141,864 8.8% 151,192 160,356 169,993 19.8%
Region VIII 38,365 38,896 1.4% 48,518 58,135 62,058 59.5%
Area 2000 2010
Change: 2000 to
2010
Projections – Model 1 Change: 2010 to
2025 2015 2020 2025
North Dakota 289,677 312,861 8.0% 333,259 348,710 364,153 16.4%
Region I 13,868 14,611 5.4% 16,481 18,093 19,705 34.9%
Region II 41,021 42,435 3.4% 45,860 48,659 51,457 21.3%
Region III 19,389 19,058 -1.7% 18,787 18,559 18,329 -3.8%
Region IV 39,259 40,436 3.0% 41,195 41,766 42,334 4.7%
Region V 70,924 83,159 17.3% 91,529 97,645 103,759 24.8%
Region VI 29,346 29,194 -0.5% 28,981 28,780 28,577 -2.1%
Region VII 57,799 64,960 12.4% 70,348 74,278 78,208 20.4%
Region VIII 18,071 19,008 5.2% 20,078 20,930 21,784 14.6%

2012 NORTH DAKOTA STATEWIDE HOUSING NEEDS ASSESSMENT: HOUSING FORECAST PROFILES – NORTH DAKOTA AND ITS EIGHT PLANNING REGIONS 38
TABLE 4. TOTAL OCCUPIED HOUSING UNITS, 2000 to 2025
TABLE 5. OCCUPIED HOUSING UNITS BY TENURE, 2010
Area
Total Occupied Housing Units
Owner-Occupied
Renter-Occupied
Number
Percent
Number
Percent
North Dakota 276,642 184,117 66.6% 92,525 33.4%
Region I 12,672 9,051 71.4% 3,621 28.6%
Region II 36,587 24,932 68.1% 11,655 31.9%
Region III 15,574 11,148 71.6% 4,426 28.4%
Region IV 36,007 21,771 60.5% 14,236 39.5%
Region V 77,798 44,875 57.7% 32,923 42.3%
Region VI 24,408 17,806 73.0% 6,602 27.0%
Region VII 57,714 42,551 73.7% 15,163 26.3%
Region VIII 15,882 11,983 75.5% 3,899 24.5%
TABLE 6. VACANT HOUSING UNITS BY STATUS, 2010
Area
Total Vacant
Housing Units
For Rent
For Sale Only
Rented or Sold, Not Occupied
For Seasonal, Recreational, or
Occasional Use
For Migrant Workers
Other Vacant
Number
Percent
Number
Percent
Number
Percent
Number
Percent
Number
Percent
Number
Percent
North Dakota 36,219 6,499 17.9% 2,623 7.2% 4,660 12.9% 12,327 34.0% 303 0.8% 9,807 27.1%
Region I 1,939 55 2.8% 47 2.4% 104 5.4% 1,083 55.9% 0 0.0% 650 33.5%
Region II 5,848 474 8.1% 201 3.4% 1,379 23.6% 2,894 49.5% 0 0.0% 900 15.4%
Region III 3,484 687 19.7% 253 7.3% 101 2.9% 1,301 37.3% 0 0.0% 1,142 32.8%
Region IV 4,429 1,394 31.5% 322 7.3% 302 6.8% 475 10.7% 72 1.6% 1,864 42.1%
Region V 5,361 2,021 37.7% 665 12.4% 517 9.6% 794 14.8% 17 0.3% 1,347 25.1%
Region VI 4,786 742 15.5% 459 9.6% 1,425 29.8% 1,050 21.9% 49 1.0% 1,061 22.2%
Region VII 7,246 898 12.4% 510 7.0% 616 8.5% 3,497 48.3% 71 1.0% 1,654 22.8%
Region VIII 3,126 228 7.3% 166 5.3% 216 6.9% 1,233 39.4% 94 3.0% 1,189 38.0%
Area 2000 2010
Change: 2000 to
2010
Projections Change: 2010 to
2025 2015 2020 2025
North Dakota 257,152 276,642 7.6% 315,830 342,933 360,071 30.2%
Region I 11,251 12,672 12.6% 21,967 30,003 33,844 167.1%
Region II 35,151 36,587 4.1% 47,473 50,735 50,581 38.2%
Region III 16,240 15,574 -4.1% 16,251 16,686 17,000 9.2%
Region IV 35,627 36,007 1.1% 37,949 38,984 39,979 11.0%
Region V 66,600 77,798 16.8% 84,089 89,531 95,115 22.3%
Region VI 25,426 24,408 -4.0% 24,577 24,914 25,373 4.0%
Region VII 51,476 57,714 12.1% 62,849 67,099 71,362 23.6%
Region VIII 15,381 15,882 3.3% 20,675 24,981 26,817 68.9%
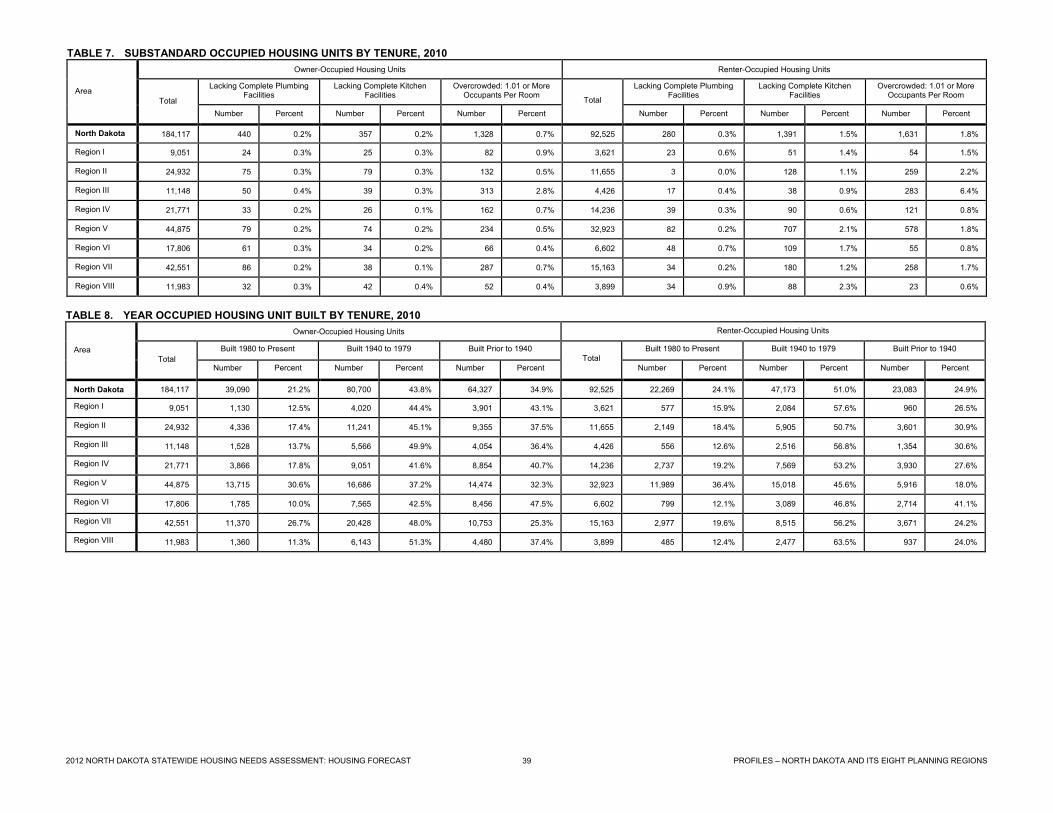
2012 NORTH DAKOTA STATEWIDE HOUSING NEEDS ASSESSMENT: HOUSING FORECAST PROFILES – NORTH DAKOTA AND ITS EIGHT PLANNING REGIONS 39
TABLE 7. SUBSTANDARD OCCUPIED HOUSING UNITS BY TENURE, 2010
Area
Owner-Occupied Housing Units
Renter-Occupied Housing Units
Total
Lacking Complete Plumbing Facilities
Lacking Complete Kitchen Facilities
Overcrowded: 1.01 or More Occupants Per Room
Total
Lacking Complete Plumbing Facilities
Lacking Complete Kitchen Facilities
Overcrowded: 1.01 or More Occupants Per Room
Number Percent Number Percent Number Percent Number Percent Number Percent Number Percent
North Dakota 184,117 440 0.2% 357 0.2% 1,328 0.7% 92,525 280 0.3% 1,391 1.5% 1,631 1.8%
Region I 9,051 24 0.3% 25 0.3% 82 0.9% 3,621 23 0.6% 51 1.4% 54 1.5%
Region II 24,932 75 0.3% 79 0.3% 132 0.5% 11,655 3 0.0% 128 1.1% 259 2.2%
Region III 11,148 50 0.4% 39 0.3% 313 2.8% 4,426 17 0.4% 38 0.9% 283 6.4%
Region IV 21,771 33 0.2% 26 0.1% 162 0.7% 14,236 39 0.3% 90 0.6% 121 0.8%
Region V 44,875 79 0.2% 74 0.2% 234 0.5% 32,923 82 0.2% 707 2.1% 578 1.8%
Region VI 17,806 61 0.3% 34 0.2% 66 0.4% 6,602 48 0.7% 109 1.7% 55 0.8%
Region VII 42,551 86 0.2% 38 0.1% 287 0.7% 15,163 34 0.2% 180 1.2% 258 1.7%
Region VIII 11,983 32 0.3% 42 0.4% 52 0.4% 3,899 34 0.9% 88 2.3% 23 0.6%
TABLE 8. YEAR OCCUPIED HOUSING UNIT BUILT BY TENURE, 2010
Area
Owner-Occupied Housing Units Renter-Occupied Housing Units
Total
Built 1980 to Present Built 1940 to 1979 Built Prior to 1940
Total
Built 1980 to Present Built 1940 to 1979 Built Prior to 1940
Number Percent Number Percent Number Percent Number Percent Number Percent Number Percent
North Dakota 184,117 39,090 21.2% 80,700 43.8% 64,327 34.9% 92,525 22,269 24.1% 47,173 51.0% 23,083 24.9%
Region I 9,051 1,130 12.5% 4,020 44.4% 3,901 43.1% 3,621 577 15.9% 2,084 57.6% 960 26.5%
Region II 24,932 4,336 17.4% 11,241 45.1% 9,355 37.5% 11,655 2,149 18.4% 5,905 50.7% 3,601 30.9%
Region III 11,148 1,528 13.7% 5,566 49.9% 4,054 36.4% 4,426 556 12.6% 2,516 56.8% 1,354 30.6%
Region IV 21,771 3,866 17.8% 9,051 41.6% 8,854 40.7% 14,236 2,737 19.2% 7,569 53.2% 3,930 27.6%
Region V 44,875 13,715 30.6% 16,686 37.2% 14,474 32.3% 32,923 11,989 36.4% 15,018 45.6% 5,916 18.0%
Region VI 17,806 1,785 10.0% 7,565 42.5% 8,456 47.5% 6,602 799 12.1% 3,089 46.8% 2,714 41.1%
Region VII 42,551 11,370 26.7% 20,428 48.0% 10,753 25.3% 15,163 2,977 19.6% 8,515 56.2% 3,671 24.2%
Region VIII 11,983 1,360 11.3% 6,143 51.3% 4,480 37.4% 3,899 485 12.4% 2,477 63.5% 937 24.0%

2012 NORTH DAKOTA STATEWIDE HOUSING NEEDS ASSESSMENT: HOUSING FORECAST PROFILES – NORTH DAKOTA AND ITS EIGHT PLANNING REGIONS 40
FIGURE 1. MEDIAN VALUE OF ALL OWNER-OCCUPIED HOUSING UNITS, 2010
TABLE 9. VALUE OF ALL OWNER-OCCUPIED HOUSING UNITS, 2010
Area
Owner-Occupied Housing Units by Value
Total
Less Than $40,000 $40,000 to $69,999 $70,000 to $89,999 $90,000 to $124,999 $125,000 to $199,999 $200,000 or More
Number Percent Number Percent Number Percent Number Percent Number Percent Number Percent
North Dakota 184,117 29,852 16.2% 23,312 12.7% 19,741 10.7% 31,397 17.1% 48,782 26.5% 31,033 16.9%
Region I 9,051 1,628 18.0% 1,598 17.7% 1,391 15.4% 1,380 15.2% 1,910 21.1% 1,144 12.6%
Region II 24,932 4,604 18.5% 3,424 13.7% 3,251 13.0% 4,727 19.0% 5,282 21.2% 3,644 14.6%
Region III 11,148 3,937 35.3% 2,275 20.4% 1,519 13.6% 1,317 11.8% 1,123 10.1% 977 8.8%
Region IV 21,771 3,290 15.1% 2,777 12.8% 2,167 10.0% 3,796 17.4% 6,438 29.6% 3,303 15.2%
Region V 44,875 3,725 8.3% 3,443 7.7% 3,771 8.4% 8,363 18.6% 15,536 34.6% 10,065 22.4%
Region VI 17,806 4,539 25.5% 3,744 21.0% 2,586 14.5% 2,886 16.2% 2,551 14.3% 1,500 8.4%
Region VII 42,551 6,275 14.7% 4,051 9.5% 3,449 8.1% 6,703 15.8% 13,294 31.2% 8,779 20.6%
Region VIII 11,983 1,882 15.7% 2,000 16.7% 1,607 13.4% 2,225 18.6% 2,648 22.1% 1,621 13.5%
$111,300
$88,821 $85,393
$54,478
$88,317
$111,627
$76,899
$114,282
$89,503
$0
$20,000
$40,000
$60,000
$80,000
$100,000
$120,000
North Dakota Region I Region II Region III Region IV Region V Region VI Region VII Region VIII

2012 NORTH DAKOTA STATEWIDE HOUSING NEEDS ASSESSMENT: HOUSING FORECAST PROFILES – NORTH DAKOTA AND ITS EIGHT PLANNING REGIONS 41
FIGURE 2. MEDIAN GROSS RENT OF RENTER-OCCUPIED HOUSING UNITS PAYING CASH RENT, 2010
TABLE 10. GROSS RENT OF RENTER-OCCUPIED HOUSING UNITS PAYING CASH RENT, 2010
Area
Renter-Occupied Housing Units Paying Cash Rent by Monthly Gross Rent
Total
Less Than $250 $250 to $349 $350 to $449 $450 to $549 $550 to $749 $750 or More
Number Percent Number Percent Number Percent Number Percent Number Percent Number Percent
North Dakota 84,113 5,734 6.8% 6,606 7.9% 12,520 14.9% 16,475 19.6% 24,831 29.5% 17,947 21.3%
Region I 3,153 278 8.8% 287 9.1% 617 19.6% 653 20.7% 892 28.3% 426 13.5%
Region II 9,320 665 7.1% 566 6.1% 1,427 15.3% 2,072 22.2% 2,351 25.2% 2,239 24.0%
Region III 3,927 899 22.9% 767 19.5% 855 21.8% 515 13.1% 533 13.6% 358 9.1%
Region IV 12,974 638 4.9% 782 6.0% 1,837 14.2% 2,032 15.7% 4,062 31.3% 3,623 27.9%
Region V 31,596 1,173 3.7% 1,734 5.5% 3,927 12.4% 6,336 20.1% 10,484 33.2% 7,942 25.1%
Region VI 5,812 889 15.3% 720 12.4% 1,131 19.5% 1,090 18.8% 1,347 23.2% 635 10.9%
Region VII 13,923 835 6.0% 1,372 9.9% 2,203 15.8% 3,209 23.0% 4,197 30.1% 2,107 15.1%
Region VIII 3,408 357 10.5% 378 11.1% 523 15.3% 568 16.7% 965 28.3% 617 18.1%
$555
$493
$540
$371
$536 $555
$466
$512 $513
$0
$100
$200
$300
$400
$500
$600
North Dakota Region I Region II Region III Region IV Region V Region VI Region VII Region VIII

2012 NORTH DAKOTA STATEWIDE HOUSING NEEDS ASSESSMENT: HOUSING FORECAST PROFILES – NORTH DAKOTA AND ITS EIGHT PLANNING REGIONS 42
TABLE 11. NUMBER OF HOUSEHOLDS BY INCOME LEVELS AS A PERCENT OF THE MEDIAN FAMILY INCOME (MFI), 2010 and 2025
Area
Extremely Low: 0-30% MFI (Less than $20,000 in 2010)
Very Low: 31-50% MFI ($20,000 to $29,999 in 2010)
Low Income: 51-80% MFI ($30,000 to $49,999 in 2010)
Moderate: 81-115% MFI ($50,000 to $74,999 in 2010)
Upper: Above 115% MFI ($75,000 or more in 2010)
Tax Credit: 51 to 60% MFI ($30,000 to $39,999 in 2010)
2010 2025 %
Change 2010 2025 %
Change 2010 2025 %
Change 2010 2025 %
Change 2010 2025 %
Change 2010 2025 %
Change
North Dakota 55,436 72,699 31.1% 33,078 43,540 31.6% 57,935 75,736 30.7% 55,089 71,784 30.3% 75,104 96,296 28.2% 30,980 40,547 30.9%
Region I 2,082 5,173 148.5% 1,275 3,327 160.9% 2,627 6,942 164.3% 2,638 7,308 177.0% 4,050 11,093 173.9% 1,351 3,581 165.1%
Region II 6,590 9,050 37.3% 4,816 6,546 35.9% 7,955 10,924 37.3% 7,825 11,003 40.6% 9,401 13,058 38.9% 4,253 5,846 37.5%
Region III 4,438 5,326 20.0% 2,069 2,356 13.9% 3,232 3,472 7.4% 2,881 2,932 1.8% 2,954 2,920 -1.2% 1,860 1,998 7.4%
Region IV 7,976 9,236 15.8% 4,445 5,244 18.0% 7,619 8,787 15.3% 6,879 7,379 7.3% 9,088 9,332 2.7% 3,844 4,470 16.3%
Region V 15,359 19,269 25.5% 8,954 11,293 26.1% 16,386 20,320 24.0% 15,133 18,314 21.0% 21,966 25,918 18.0% 8,972 11,144 24.2%
Region VI 5,548 5,994 8.0% 3,073 3,297 7.3% 5,463 5,693 4.2% 4,955 5,096 2.8% 5,369 5,295 -1.4% 2,930 3,086 5.3%
Region VII 9,981 13,126 31.5% 6,694 8,727 30.4% 11,427 14,178 24.1% 11,453 14,035 22.5% 18,159 21,298 17.3% 6,092 7,583 24.5%
Region VIII 3,462 5,525 59.6% 1,752 2,750 57.0% 3,226 5,420 68.0% 3,325 5,717 71.9% 4,117 7,382 79.3% 1,678 2,839 69.2%
TABLE 12. TOTAL HOUSING UNITS, 2000 to 2025 (Projected Demand – Model 2) TABLE 13. CHANGE IN RENTER-OCCUPIED HOUSING UNITS, 2010 to 2025
Area Renter-Occupied Housing Units,
2010
Change in Renter-Occupied Housing Units
2010 to 2015 2010 to 2020 2010 to 2025
3 Numeric % Numeric % Numeric %
North Dakota 92,525 17,296 18.7% 26,929 29.1% 33,412 36.1%
Region I 3,621 3,307 91.3% 5,797 160.1% 6,626 183.0%
Region II 11,655 3,627 31.1% 4,482 38.5% 4,336 37.2%
Region III 4,426 563 12.7% 749 16.9% 921 20.8%
Region IV 14,236 1,708 12.0% 2,380 16.7% 2,982 20.9%
Region V 32,923 2,980 9.1% 5,418 16.5% 8,080 24.5%
Region VI 6,602 426 6.5% 639 9.7% 907 13.7%
Region VII 15,163 2,605 17.2% 4,090 27.0% 5,664 37.4%
Region VIII 3,899 2,080 53.3% 3,374 86.5% 3,896 99.9%
Area 2000 2010
Change: 2000 to
2010
Projections – Model 2 Change: 2010 to
2025 2015 2020 2025
North Dakota 289,677 312,861 8.0% 355,183 384,481 403,330 28.9%
Region I 13,868 14,611 5.4% 24,284 31,944 35,465 142.7%
Region II 41,021 42,435 3.4% 53,264 56,482 56,160 32.3%
Region III 19,389 19,058 -1.7% 19,878 20,474 20,870 9.5%
Region IV 39,259 40,436 3.0% 42,135 43,454 44,701 10.5%
Region V 70,924 83,159 17.3% 91,346 97,670 104,272 25.4%
Region VI 29,346 29,194 -0.5% 30,030 30,705 31,398 7.5%
Region VII 57,799 64,960 12.4% 70,777 75,835 80,494 23.9%
Region VIII 18,071 19,008 5.2% 23,469 27,917 29,970 57.7%

2012 NORTH DAKOTA STATEWIDE HOUSING NEEDS ASSESSMENT: HOUSING FORECAST PROFILES – TRI-COUNTY REGION I 43
TRI-COUNTY REGION I AND ITS COMPONENTS
POPULATION CHANGE
$ Total population in Region I increased 11 percent from 27,781 in 2000 to 30,829 in 2010. Counties
within the region and the City of Williston each displayed this same level of growth with the exception of
Divide County which decreased 9 percent during the past decade. Current population projections
indicate a dramatic increase in population throughout Region I, reaching 73,164 by 2025 (growing by
about 42,000 people). Populations in Divide and Williams counties are projected to more than double
by 2025; McKenzie County’s population could nearly triple.
$ Largely as a result of oil field development, the population of the prime workforce (ages 25 to 44) is
projected to triple by 2025 in Region I. The population of pre-retirees or baby boomers (currently ages
45 to 64) is projected to more than double in Region I, a much higher rate of growth than is expected for
this age group in the rest of the state. Beginning in 2011, baby boomers began turning 65; over the next
15 years, the number of people ages 65 and older is projected to double.
TRENDS IN HOUSING
$ Total housing units in Region I increased by 5 percent from 2000 to 2010. Based on historical building
trends (i.e., the basis for Model 1 projections), housing supply in Region I is expected to grow 35 percent by 2025. The city of Williston is expected to show the fastest growth in the
region at 82 percent by 2025. Divide County could potentially lose 24 percent of its housing supply in the next 15 years.
$ Using projections based on shifts in population and housing demand (i.e., the basis for Model 2) rather than on historical building trends, housing unit projections indicate that Region I
could expect a significant increase from 2010 to 2025, with the number of housing units more than doubling to 35,465 units in 2025 (a growth of 143 percent or nearly 21,000 units).
With the exception of Divide County, which is expected to see an increase of 82 percent, all other counties in the region could more than double by 2025. The city of Williston is also
projected to more than double (an increase of nearly 9,500 housing units).
$ The majority of housing in Region I was owner-occupied in 2010 (71 percent). Although rental units captured only 29 percent of housing in the region during the last decade, projections
indicate that rental units could nearly double by 2025 (a growth of 3,000 units).
$ Very few owner- or renter-occupied units in Region I were considered substandard (i.e., lacking complete plumbing or kitchen facilities) or overcrowded in 2010.
$ The vast majority of owner-occupied housing units in the region were built prior to 1980 (88 percent); 43 percent were built prior to 1940. Construction of rental units in Region I is
slightly newer than single-family homes; 27 percent were built before 1940. However, the majority of rental units in Region I were built prior to 1980 (84 percent).
$ Increased demand for housing will likely further reduce already low vacancy levels.
ECONOMICS OF HOUSING
According to 2010 data from the U.S. Census Bureau’s American Community Survey, median values of owner-occupied housing units for counties within Region I ranged from $56,000 in
Divide County to $93,800 in Williams County. A similar pattern is found with respect to median gross rents for counties within the region, ranging from $346 per month in Divide County
to $515 in Williams County. Increased demand for housing will likely result in higher housing values and rents.
Half of owner-occupied housing in Region I was valued at $90,000 or more (49 percent) in 2010; one-third was valued at $125,000 or more.
Nearly two-thirds of all rental units in Region I rented for at least $450 per month in 2010; 14 percent were at least $750. Within Divide County, half of all rentals rented for less than
$350 per month.
Housing unit projections suggest that housing demand for all income groups in Region I could double (and in some cases nearly triple) by 2025.

2012 NORTH DAKOTA STATEWIDE HOUSING NEEDS ASSESSMENT: HOUSING FORECAST PROFILES – TRI-COUNTY REGION I 44
TABLE 1. TOTAL POPULATION, 2000 to 2025
Area 2000 2010
Change: 2000 to
2010
Projections Change: 2010 to
2025 2015 2020 2025
Region I 27,781 30,829 11.0% 50,529 66,938 73,164 137.3%
Divide 2,283 2,071 -9.3% 3,273 4,313 4,948 138.9%
McKenzie 5,737 6,360 10.9% 11,771 15,550 17,110 169.0%
Williams 19,761 22,398 13.3% 35,485 47,075 51,106 128.2%
Williston 12,512 14,716 17.6% 23,481 30,756 32,860 123.3%
TABLE 3. TOTAL HOUSING UNITS, 2000 to 2025 (Building Trends – Model 1)
Area 2000 2010
Change: 2000 to
2010
Projections – Model 1 Change: 2010 to
2025 2015 2020 2025
Region I 13,868 14,611 5.4% 16,481 18,093 19,705 34.9%
Divide 1,469 1,408 -4.2% 1,240 1,156 1,072 -23.9%
McKenzie 2,719 3,019 11.0% 3,488 3,888 4,288 42.0%
Williams 9,680 10,184 5.2% 11,753 13,049 14,345 40.9%
Williston 5,940 6,426 8.2% 8,259 9,976 11,692 81.9%
TABLE 2. POPULATION BY AGE, 2010 and 2025
Area
Less Than 25 Years of Age Ages 25 to 44 Ages 45 to 64 65 Years and Older
2010 2025 Change: 2010
to 2025 2010 2025
Change: 2010 to 2025
2010 2025 Change: 2010
to 2025 2010 2025
Change: 2010 to 2025
Region I 9,819 15,811 61.0% 7,357 24,065 227.1% 8,872 22,637 155.2% 4,781 10,651 122.8%
Divide 463 921 98.9% 363 1,648 354.0% 694 1,238 78.4% 551 1,141 107.1%
McKenzie 2,212 4,105 85.6% 1,455 5,745 294.8% 1,791 5,083 183.8% 902 2,177 141.4%
Williams 7,144 10,785 51.0% 5,539 16,672 201.0% 6,387 16,316 155.5% 3,328 7,333 120.3%
Williston 4,937 7,402 49.9% 3,926 11,433 191.2% 3,738 9,630 157.6% 2,115 4,395 107.8%

2012 NORTH DAKOTA STATEWIDE HOUSING NEEDS ASSESSMENT: HOUSING FORECAST PROFILES – TRI-COUNTY REGION I 45
TABLE 4. TOTAL OCCUPIED HOUSING UNITS, 2000 to 2025
TABLE 5. OCCUPIED HOUSING UNITS BY TENURE, 2010
TABLE 6. VACANT HOUSING UNITS BY STATUS, 2010
Area
Total Vacant
Housing Units
For Rent
For Sale Only
Rented or Sold, Not Occupied
For Seasonal, Recreational, or
Occasional Use
For Migrant Workers
Other Vacant
Number
Percent
Number
Percent
Number
Percent
Number
Percent
Number
Percent
Number
Percent
Region I 1,939 55 2.8% 47 2.4% 104 5.4% 1,083 55.9% - 0.0% 650 33.5%
Divide 396 10 2.5% 18 4.5% 14 3.5% 217 54.8% 0 0.0% 137 34.6%
McKenzie 551 0 0.0% 6 1.1% 21 3.8% 331 60.1% 0 0.0% 193 35.0%
Williams 992 45 4.5% 23 2.3% 69 7.0% 535 53.9% 0 0.0% 320 32.3%
Williston 426 42 9.9% 0 0.0% 60 14.1% 207 48.6% 0 0.0% 117 27.5%
Area 2000 2010
Change: 2000 to
2010
Projections Change: 2010 to
2025 2015 2020 2025
Region I 11,251 12,672 12.6% 21,967 30,003 33,844 167.1%
Divide 1,005 1,012 0.7% 1,526 2,058 2,407 137.8%
McKenzie 2,151 2,468 14.7% 4,834 6,585 7,345 197.6%
Williams 8,095 9,192 13.6% 15,607 21,360 24,092 162.1%
Williston 5,297 6,000 13.3% 10,406 14,044 15,536 158.9%
Area Total Occupied Housing Units
Owner-Occupied Renter-Occupied
Number Percent Number Percent
Region I 12,672 9,051 71.4% 3,621 28.6%
Divide 1,012 820 81.0% 192 19.0%
McKenzie 2,468 1,687 68.4% 781 31.6%
Williams 9,192 6,544 71.2% 2,648 28.8%
Williston 6,000 3,774 62.9% 2,226 37.1%

2012 NORTH DAKOTA STATEWIDE HOUSING NEEDS ASSESSMENT: HOUSING FORECAST PROFILES – TRI-COUNTY REGION I 46
TABLE 7. SUBSTANDARD OCCUPIED HOUSING UNITS BY TENURE, 2010
Area
Owner-Occupied Housing Units
Renter-Occupied Housing Units
Total
Lacking Complete Plumbing Facilities
Lacking Complete Kitchen Facilities
Overcrowded: 1.01 or More Occupants Per Room
Total
Lacking Complete Plumbing Facilities
Lacking Complete Kitchen Facilities
Overcrowded: 1.01 or More Occupants Per Room
Number Percent Number Percent Number Percent Number Percent Number Percent Number Percent
Region I 9,051 24 0.3% 25 0.3% 82 0.9% 3,621 23 0.6% 51 1.4% 54 1.5%
Divide 820 0 0.0% 0 0.0% 0 0.0% 192 0 0.0% 4 2.1% 0 0.0%
McKenzie 1,687 4 0.2% 4 0.2% 24 1.4% 781 16 2.0% 16 2.0% 41 5.2%
Williams 6,544 20 0.3% 21 0.3% 58 0.9% 2,648 7 0.3% 31 1.2% 13 0.5%
Williston 3,774 0 0.0% 8 0.2% 40 1.1% 2,226 0 0.0% 24 1.1% 13 0.6%
TABLE 8. YEAR OCCUPIED HOUSING UNIT BUILT BY TENURE, 2010
Area
Owner-Occupied Housing Units Renter-Occupied Housing Units
Total
Built 1980 to Present Built 1940 to 1979 Built Prior to 1940
Total
Built 1980 to Present Built 1940 to 1979 Built Prior to 1940
Number Percent Number Percent Number Percent Number Percent Number Percent Number Percent
Region I 9,051 1,130 12.5% 4,020 44.4% 3,901 43.1% 3,621 577 15.9% 2,084 57.6% 960 26.5%
Divide 820 46 5.6% 332 40.5% 442 53.9% 192 9 4.7% 111 57.8% 72 37.5%
McKenzie 1,687 201 11.9% 848 50.3% 638 37.8% 781 172 22.0% 419 53.6% 190 24.3%
Williams 6,544 883 13.5% 2,840 43.4% 2,821 43.1% 2,648 396 15.0% 1,554 58.7% 698 26.4%
Williston 3,774 493 13.1% 1,440 38.2% 1,841 48.8% 2,226 302 13.6% 1,379 61.9% 545 24.5%

2012 NORTH DAKOTA STATEWIDE HOUSING NEEDS ASSESSMENT: HOUSING FORECAST PROFILES – TRI-COUNTY REGION I 47
FIGURE 1. MEDIAN VALUE OF ALL OWNER-OCCUPIED HOUSING UNITS, 2010
TABLE 9. VALUE OF ALL OWNER-OCCUPIED HOUSING UNITS, 2010
Area
Owner-Occupied Housing Units by Value
Total
Less Than $40,000 $40,000 to $69,999 $70,000 to $89,999 $90,000 to $124,999 $125,000 to $199,999 $200,000 or More
Number Percent Number Percent Number Percent Number Percent Number Percent Number Percent
Region I 9,051 1,628 18.0% 1,598 17.7% 1,391 15.4% 1,380 15.2% 1,910 21.1% 1,144 12.6%
Divide 820 282 34.4% 216 26.3% 76 9.3% 82 10.0% 103 12.6% 61 7.4%
McKenzie 1,687 276 16.4% 320 19.0% 316 18.7% 284 16.8% 354 21.0% 137 8.1%
Williams 6,544 1,070 16.4% 1,062 16.2% 999 15.3% 1,014 15.5% 1,453 22.2% 946 14.5%
Williston 3,774 550 14.6% 591 15.7% 612 16.2% 638 16.9% 998 26.4% 385 10.2%
$111,300
$88,821
$56,000
$86,600
$93,800 $95,200
$0
$20,000
$40,000
$60,000
$80,000
$100,000
$120,000
North Dakota Region I Divide County McKenzie County Williams County Williston city

2012 NORTH DAKOTA STATEWIDE HOUSING NEEDS ASSESSMENT: HOUSING FORECAST PROFILES – TRI-COUNTY REGION I 48
FIGURE 2. MEDIAN GROSS RENT OF RENTER-OCCUPIED HOUSING UNITS PAYING CASH RENT, 2010
TABLE 10. GROSS RENT OF RENTER-OCCUPIED HOUSING UNITS PAYING CASH RENT, 2010
Area
Renter-Occupied Housing Units Paying Cash Rent by Monthly Gross Rent
Total
Less Than $250 $250 to $349 $350 to $449 $450 to $549 $550 to $749 $750 or More
Number Percent Number Percent Number Percent Number Percent Number Percent Number Percent
Region I 3,153 278 8.8% 287 9.1% 617 19.6% 653 20.7% 892 28.3% 426 13.5%
Divide 116 26 22.4% 34 29.3% 8 6.9% 6 5.2% 11 9.5% 31 26.7%
McKenzie 578 69 11.9% 91 15.7% 102 17.6% 78 13.5% 170 29.4% 68 11.8%
Williams 2,459 183 7.4% 162 6.6% 507 20.6% 569 23.1% 711 28.9% 327 13.3%
Williston 2,128 149 7.0% 97 4.6% 432 20.3% 496 23.3% 665 31.3% 289 13.6%
$555
$493
$346
$481
$515 $527
$0
$100
$200
$300
$400
$500
$600
North Dakota Region I Divide County McKenzie County Williams County Williston city

2012 NORTH DAKOTA STATEWIDE HOUSING NEEDS ASSESSMENT: HOUSING FORECAST PROFILES – TRI-COUNTY REGION I 49
TABLE 11. NUMBER OF HOUSEHOLDS BY INCOME LEVELS AS A PERCENT OF THE MEDIAN FAMILY INCOME (MFI), 2010 and 2025
Area
Extremely Low: 0-30% MFI (Less than $20,000 in 2010)
Very Low: 31-50% MFI ($20,000 to $29,999 in 2010)
Low Income: 51-80% MFI ($30,000 to $49,999 in 2010)
Moderate: 81-115% MFI ($50,000 to $74,999 in 2010)
Upper: Above 115% MFI ($75,000 or more in 2010)
Tax Credit: 51 to 60% MFI ($30,000 to $39,999 in 2010)
2010 2025 %
Change 2010 2025 %
Change 2010 2025 %
Change 2010 2025 %
Change 2010 2025 %
Change 2010 2025 %
Change
Region I 2,082 5,173 148.5% 1,275 3,327 160.9% 2,627 6,942 164.3% 2,638 7,308 177.0% 4,050 11,093 173.9% 1,351 3,581 165.1%
Divide 216 529 144.9% 112 276 146.4% 212 507 139.2% 179 408 127.9% 293 687 134.5% 115 284 147.0%
McKenzie 444 1,176 164.9% 278 802 188.5% 557 1,659 197.8% 552 1,747 216.5% 637 1,961 207.8% 206 601 191.7%
Williams 1,422 3,468 143.9% 885 2,249 154.1% 1,858 4,776 157.1% 1,907 5,153 170.2% 3,120 8,445 170.7% 1,030 2,696 161.7%
Williston 977 2,323 137.8% 560 1,401 150.2% 1,292 3,287 154.4% 1,193 3,255 172.8% 1,978 5,271 166.5% 683 1,795 162.8%
TABLE 12. TOTAL HOUSING UNITS, 2000 to 2025 (Projected Demand – Model 2)
Area 2000 2010
Change: 2000 to
2010
Projections Change: 2010 to
2025 2015 2020 2025
Region I 13,868 14,611 5.4% 24,284 31,944 35,465 142.7%
Divide 1,469 1,408 -4.2% 1,845 2,295 2,567 82.3%
McKenzie 2,719 3,019 11.0% 5,576 7,192 7,856 160.2%
Williams 9,680 10,184 5.2% 16,863 22,457 25,042 145.9%
Williston 5,940 6,426 8.2% 10,792 14,376 15,827 146.3%
TABLE 13. CHANGE IN RENTER-OCCUPIED HOUSING UNITS, 2010 to 2025
Area Renter-Occupied Housing Units,
2010
Change in Renter-Occupied Housing Units
2010 to 2015 2010 to 2020 2010 to 2025
3 Numeric % Numeric % Numeric %
Region I 3,621 3,307 91.3% 5,797 160.1% 6,626 183.0%
Divide 192 132 68.8% 275 143.2% 362 188.5%
McKenzie 781 758 97.1% 1,359 174.0% 1,545 197.8%
Williams 2,648 2,417 91.3% 4,163 157.2% 4,719 178.2%
Williston 2,226 1,845 82.9% 3,178 142.8% 3,565 160.2%

2012 NORTH DAKOTA STATEWIDE HOUSING NEEDS ASSESSMENT: HOUSING FORECAST PROFILES – SOURIS BASIN REGION II 50
SOURIS BASIN REGION II AND ITS COMPONENTS
POPULATION CHANGE
$ Total population in Region II increased 2 percent from 88,089 in 2000 to 89,967 in 2010. While five of
the seven counties within Region II saw a decrease in population over the last decade, population
increases in Mountrail and Ward counties resulted in the modest growth in the region overall. Current
population projections suggest a significant shift in growth patterns throughout Region II, reaching
121,443 by 2025. Over the next 15 years, total population could grow by more than 31,000 people. All
counties within the region are expected to grow by at least 22 percent by 2025; Mountrail County is
expected to grow by 77 percent.
$ Energy development and flood recovery efforts are major factors affecting population change in Region II.
The demand for employment could result in the number of people ages 25 to 44 increasing by 63 percent
by 2025 in Region II. People ages 25 to 44 in Mountrail, Renville, and McHenry counties could double or
near double by 2025. Beginning in 2011, baby boomers (i.e., the large cohort of people born from 1946
to 1964) began turning 65. Thus, over the next 15 years the number of people ages 65 and older in
Region II is expected to grow by 39 percent.
TRENDS IN HOUSING
$ Total housing units in Region II increased by 3 percent from 2000 to 2010. Based on historical building trends (i.e., the basis for Model 1 projections), housing supply in Region II is
projected to grow 21 percent by 2025 (9,022 units). Mountrail County is expected to show the fastest growth in the region (52 percent by 2025); the city of Minot could increase by 39
percent. If historical trends in housing construction continued in Renville, Bottineau, Burke, and Pierce, these counties would lose around 10 percent of their housing supply by 2025.
$ Using projections based on shifts in population and housing demand (i.e., the basis for Model 2) rather than on historical building trends, the housing supply in Region II could grow by 32
percent from 2010 to 2025 (a growth of 13,725 units). All counties in Region II (with the exception of Renville County) are expected to grow by at least 20 percent; Mountrail County is
expected to see the greatest percentage growth at 57 percent. Renville County is expecting a 15 percent growth.
$ In 2010, the majority of housing in Region II was owner-occupied (68 percent). Rental units, which captured 32 percent of regional housing in 2010, are projected to increase by 37
percent by 2025; rental units in Mountrail County are expected to double.
$ Very few owner or rental units in Region II were considered substandard (i.e., lacking complete plumbing or kitchen facilities) or overcrowded in 2010. One exception is Mountrail
County in which 10 percent of renter-occupied housing units were overcrowded.
$ The vast majority of owner-occupied housing units in the region were built prior to 1980 (83 percent); 38 percent were built prior to 1940. Similar construction exists for
renter-occupied housing units in Region II; 82 percent were built prior to 1980 and 31 percent were built prior to 1940.
$ Increased demand for housing will likely further reduce already low vacancy rates.
ECONOMICS OF HOUSING
$ According to 2010 data from the U.S. Census Bureau’s American Community Survey, median values of owner-occupied housing units for counties within Region II ranged from $45,600 in
Burke County to $118,200 in Ward County. A similar pattern is found with respect to median gross rents for counties within the region, ranging from $386 per month in Burke County to
$574 in Ward County. Increased demand for housing will likely result in higher housing values and rents.
$ Half of owner-occupied housing in Region II was valued at $90,000 or more in 2010 (55 percent); about one-third was valued at $125,000 or more. Within Ward County almost half of
owner-occupied housing was $125,000 or more.
$ Half of all rental units in Region II rented for at least $550 per month in 2010; one-quarter were at least $750.
$ Housing unit projections suggest that housing demand in Region II will increase significantly across all income groups by 2025. Mountrail County could see the fastest percentage
growth, with demand projected to double for the lower-income households.

2012 NORTH DAKOTA STATEWIDE HOUSING NEEDS ASSESSMENT: HOUSING FORECAST PROFILES – SOURIS BASIN REGION II 51
TABLE 1. TOTAL POPULATION, 2000 to 2025
Area 2000 2010
Change: 2000 to
2010
Projections Change: 2010 to
2025 2015 2020 2025
Region II 88,089 89,967 2.1% 114,709 121,425 121,443 35.0%
Bottineau 7,149 6,429 -10.1% 9,984 10,691 10,721 66.8%
Burke 2,242 1,968 -12.2% 2,921 3,043 2,989 51.9%
McHenry 5,987 5,395 -9.9% 7,116 7,687 7,784 44.3%
Mountrail 6,631 7,673 15.7% 12,819 13,527 13,575 76.9%
Pierce 4,675 4,357 -6.8% 4,958 5,202 5,295 21.5%
Renville 2,610 2,470 -5.4% 3,337 3,593 3,589 45.3%
Ward 58,795 61,675 4.9% 73,574 77,682 77,490 25.6%
Minot 36,567 40,888 11.8% 48,632 51,138 50,887 24.5%
TABLE 3. TOTAL HOUSING UNITS, 2000 to 2025 (Building Trends – Model 1)
Area 2000 2010
Change: 2000 to
2010
Projections – Model 1 Change: 2010 to
2025 2015 2020 2025
Region II 41,021 42,435 3.4% 45,860 48,659 51,457 21.3%
Bottineau 4,409 4,362 -1.1% 4,226 4,112 3,998 -8.3%
Burke 1,412 1,251 -11.4% 1,280 1,221 1,162 -7.1%
McHenry 2,983 2,963 -0.7% 2,948 2,948 2,948 -0.5%
Mountrail 3,438 3,949 14.9% 4,743 5,372 6,000 51.9%
Pierce 2,269 2,177 -4.1% 2,149 2,099 2,050 -5.8%
Renville 1,413 1,439 1.8% 1,351 1,316 1,281 -11.0%
Ward 25,097 26,294 4.8% 29,163 31,591 34,018 29.4%
Minot 16,485 18,005 9.2% 20,828 22,912 24,997 38.8%
TABLE 2. POPULATION BY AGE, 2010 and 2025
Area
Less Than 25 Years of Age Ages 25 to 44 Ages 45 to 64 65 Years and Older
2010 2025 Change: 2010
to 2025 2010 2025
Change: 2010 to 2025
2010 2025 Change: 2010
to 2025 2010 2025
Change: 2010 to 2025
Region II 31,237 39,071 25.1% 22,376 36,415 62.7% 22,835 27,232 19.3% 13,519 18,725 38.5%
Bottineau 1,761 2,485 41.1% 1,182 2,953 149.8% 2,104 3,024 43.7% 1,382 2,259 63.5%
Burke 516 855 65.7% 372 664 78.5% 668 890 33.2% 412 580 40.8%
McHenry 1,456 2,012 38.2% 1,143 2,196 92.1% 1,678 2,050 22.2% 1,118 1,526 36.5%
Mountrail 2,611 3,937 50.8% 1,910 4,205 120.2% 2,102 3,617 72.1% 1,050 1,816 73.0%
Pierce 1,186 1,366 15.2% 865 1,214 40.3% 1,277 1,476 15.6% 1,029 1,239 20.4%
Renville 681 1,052 54.5% 538 1,050 95.2% 749 843 12.6% 502 644 28.3%
Ward 23,026 27,364 18.8% 16,366 24,133 47.5% 14,257 15,332 7.5% 8,026 10,661 32.8%
Minot 14,374 16,850 17.2% 10,921 15,867 45.3% 9,480 10,194 7.5% 6,113 7,976 30.5%

2012 NORTH DAKOTA STATEWIDE HOUSING NEEDS ASSESSMENT: HOUSING FORECAST PROFILES – SOURIS BASIN REGION II 52
TABLE 4. TOTAL OCCUPIED HOUSING UNITS, 2000 to 2025
Area 2000 2010
Change: 2000 to
2010
Projections Change: 2010 to
2025 2015 2020 2025
Region II 35,151 36,587 4.1% 47,473 50,735 50,581 38.2%
Bottineau 2,962 3,010 1.6% 4,452 4,870 4,868 61.7%
Burke 1,013 982 -3.1% 1,358 1,367 1,354 37.9%
McHenry 2,526 2,540 0.6% 3,115 3,403 3,443 35.6%
Mountrail 2,560 2,851 11.4% 4,910 5,367 5,469 91.8%
Pierce 1,964 1,847 -6.0% 2,126 2,286 2,338 26.6%
Renville 1,085 1,097 1.1% 1,378 1,496 1,492 36.0%
Ward 23,041 24,260 5.3% 30,134 31,946 31,617 30.3%
Minot 15,523 17,097 10.1% 21,373 22,536 22,277 30.3%
TABLE 5. OCCUPIED HOUSING UNITS BY TENURE, 2010
Area
Total Occupied Housing Units
Owner-Occupied
Renter-Occupied
Number
Percent
Number
Percent
Region II 36,587 24,932 68.1% 11,655 31.9%
Bottineau 3,010 2,346 77.9% 664 22.1%
Burke 982 814 82.9% 168 17.1%
McHenry 2,540 1,954 76.9% 586 23.1%
Mountrail 2,851 2,065 72.4% 786 27.6%
Pierce 1,847 1,304 70.6% 543 29.4%
Renville 1,097 832 75.8% 265 24.2%
Ward 24,260 15,617 64.4% 8,643 35.6%
Minot 17,097 10,641 62.2% 6,456 37.8%
TABLE 6. VACANT HOUSING UNITS BY STATUS, 2010
Area
Total Vacant
Housing Units
For Rent
For Sale Only
Rented or Sold, Not Occupied
For Seasonal, Recreational, or
Occasional Use
For Migrant Workers
Other Vacant
Number
Percent
Number
Percent
Number
Percent
Number
Percent
Number
Percent
Number
Percent
Region II 5,848 474 8.1% 201 3.4% 1,379 23.6% 2,894 49.5% 0 0.0% 900 15.4%
Bottineau 1,352 15 1.1% 37 2.7% 38 2.8% 1,233 91.2% 0 0.0% 29 2.1%
Burke 269 6 2.2% 2 0.7% 9 3.3% 110 40.9% 0 0.0% 142 52.8%
McHenry 423 32 7.6% 9 2.1% 21 5.0% 343 81.1% 0 0.0% 18 4.3%
Mountrail 1,098 60 5.5% 24 2.2% 333 30.3% 501 45.6% 0 0.0% 180 16.4%
Pierce 330 30 9.1% 32 9.7% 0 0.0% 225 68.2% 0 0.0% 43 13.0%
Renville 342 56 16.4% 14 4.1% 22 6.4% 237 69.3% 0 0.0% 13 3.8%
Ward 2,034 275 13.5% 83 4.1% 956 47.0% 245 12.0% 0 0.0% 475 23.4%
Minot 908 204 22.5% 67 7.4% 474 52.2% 29 3.2% 0 0.0% 134 14.8%

2012 NORTH DAKOTA STATEWIDE HOUSING NEEDS ASSESSMENT: HOUSING FORECAST PROFILES – SOURIS BASIN REGION II 53
TABLE 7. SUBSTANDARD OCCUPIED HOUSING UNITS BY TENURE, 2010
Area
Owner-Occupied Housing Units
Renter-Occupied Housing Units
Total
Lacking Complete Plumbing Facilities
Lacking Complete Kitchen Facilities
Overcrowded: 1.01 or More Occupants Per Room
Total
Lacking Complete Plumbing Facilities
Lacking Complete Kitchen Facilities
Overcrowded: 1.01 or More Occupants Per Room
Number Percent Number Percent Number Percent Number Percent Number Percent Number Percent
Region II 24,932 75 0.3% 79 0.3% 132 0.5% 11,655 3 0.0% 128 1.1% 259 2.2%
Bottineau 2,346 12 0.5% 24 1.0% 5 0.2% 664 3 0.5% 20 3.0% 6 0.9%
Burke 814 1 0.1% 0 0.0% 4 0.5% 168 0 0.0% 0 0.0% 7 4.2%
McHenry 1,954 19 1.0% 19 1.0% 11 0.6% 586 0 0.0% 0 0.0% 26 4.4%
Mountrail 2,065 7 0.3% 0 0.0% 28 1.4% 786 0 0.0% 14 1.8% 79 10.1%
Pierce 1,304 0 0.0% 0 0.0% 0 0.0% 543 0 0.0% 0 0.0% 0 0.0%
Renville 832 0 0.0% 0 0.0% 2 0.2% 265 0 0.0% 0 0.0% 12 4.5%
Ward 15,617 36 0.2% 36 0.2% 82 0.5% 8,643 0 0.0% 94 1.1% 129 1.5%
Minot 10,641 32 0.3% 32 0.3% 49 0.5% 6,456 0 0.0% 84 1.3% 116 1.8%
TABLE 8. YEAR OCCUPIED HOUSING UNIT BUILT BY TENURE, 2010
Area
Owner-Occupied Housing Units Renter-Occupied Housing Units
Total
Built 1980 to Present Built 1940 to 1979 Built Prior to 1940
Total
Built 1980 to Present Built 1940 to 1979 Built Prior to 1940
Number Percent Number Percent Number Percent Number Percent Number Percent Number Percent
Region II 24,932 4,336 17.4% 11,241 45.1% 9,355 37.5% 11,655 2,149 18.4% 5,905 50.7% 3,601 30.9%
Bottineau 2,346 265 11.3% 1,041 44.4% 1,040 44.3% 664 52 7.8% 383 57.7% 229 34.5%
Burke 814 70 8.6% 348 42.8% 396 48.6% 168 5 3.0% 80 47.6% 83 49.4%
McHenry 1,954 175 9.0% 746 38.2% 1,033 52.9% 586 32 5.5% 251 42.8% 303 51.7%
Mountrail 2,065 255 12.3% 935 45.3% 875 42.4% 786 44 5.6% 418 53.2% 324 41.2%
Pierce 1,304 139 10.7% 600 46.0% 565 43.3% 543 47 8.7% 177 32.6% 319 58.7%
Renville 832 96 11.5% 383 46.0% 353 42.4% 265 2 0.8% 117 44.2% 146 55.1%
Ward 15,617 3,336 21.4% 7,188 46.0% 5,093 32.6% 8,643 1,967 22.8% 4,479 51.8% 2,197 25.4%
Minot 10,641 2,252 21.2% 4,591 43.1% 3,798 35.7% 6,456 992 15.4% 3,694 57.2% 1,770 27.4%
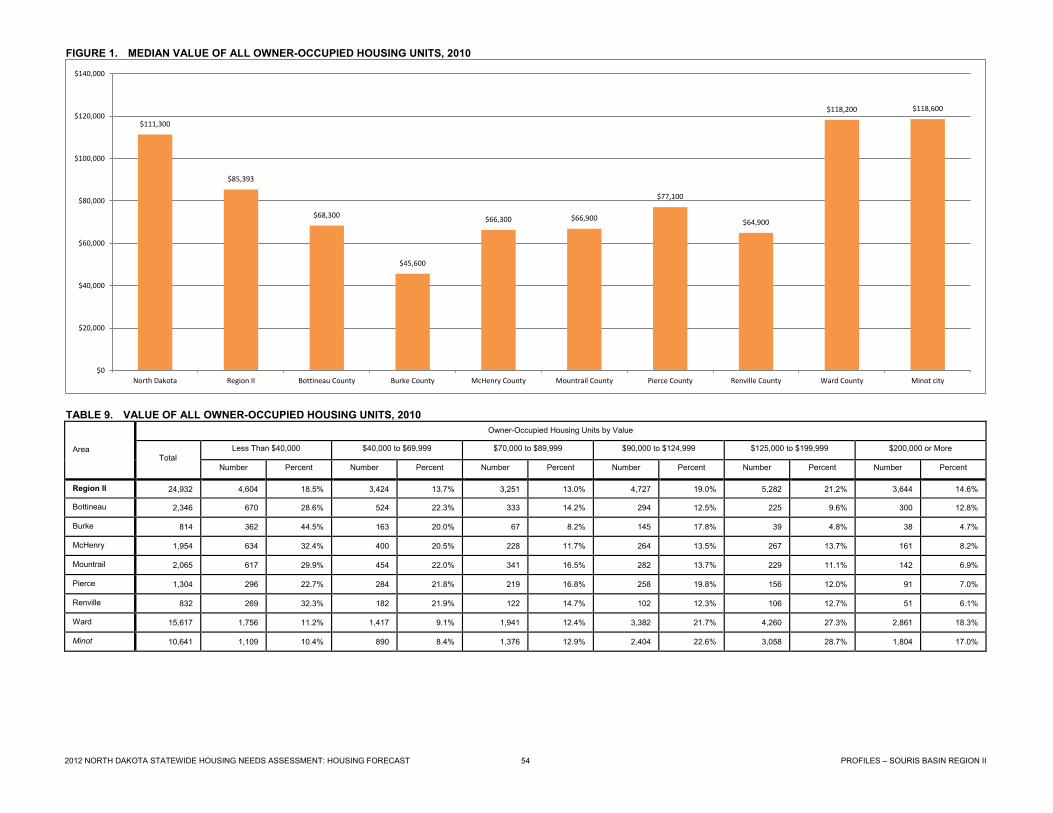
2012 NORTH DAKOTA STATEWIDE HOUSING NEEDS ASSESSMENT: HOUSING FORECAST PROFILES – SOURIS BASIN REGION II 54
FIGURE 1. MEDIAN VALUE OF ALL OWNER-OCCUPIED HOUSING UNITS, 2010
TABLE 9. VALUE OF ALL OWNER-OCCUPIED HOUSING UNITS, 2010
Area
Owner-Occupied Housing Units by Value
Total
Less Than $40,000 $40,000 to $69,999 $70,000 to $89,999 $90,000 to $124,999 $125,000 to $199,999 $200,000 or More
Number Percent Number Percent Number Percent Number Percent Number Percent Number Percent
Region II 24,932 4,604 18.5% 3,424 13.7% 3,251 13.0% 4,727 19.0% 5,282 21.2% 3,644 14.6%
Bottineau 2,346 670 28.6% 524 22.3% 333 14.2% 294 12.5% 225 9.6% 300 12.8%
Burke 814 362 44.5% 163 20.0% 67 8.2% 145 17.8% 39 4.8% 38 4.7%
McHenry 1,954 634 32.4% 400 20.5% 228 11.7% 264 13.5% 267 13.7% 161 8.2%
Mountrail 2,065 617 29.9% 454 22.0% 341 16.5% 282 13.7% 229 11.1% 142 6.9%
Pierce 1,304 296 22.7% 284 21.8% 219 16.8% 258 19.8% 156 12.0% 91 7.0%
Renville 832 269 32.3% 182 21.9% 122 14.7% 102 12.3% 106 12.7% 51 6.1%
Ward 15,617 1,756 11.2% 1,417 9.1% 1,941 12.4% 3,382 21.7% 4,260 27.3% 2,861 18.3%
Minot 10,641 1,109 10.4% 890 8.4% 1,376 12.9% 2,404 22.6% 3,058 28.7% 1,804 17.0%
$111,300
$85,393
$68,300
$45,600
$66,300 $66,900
$77,100
$64,900
$118,200 $118,600
$0
$20,000
$40,000
$60,000
$80,000
$100,000
$120,000
$140,000
North Dakota Region II Bottineau County Burke County McHenry County Mountrail County Pierce County Renville County Ward County Minot city

2012 NORTH DAKOTA STATEWIDE HOUSING NEEDS ASSESSMENT: HOUSING FORECAST PROFILES – SOURIS BASIN REGION II 55
FIGURE 2. MEDIAN GROSS RENT OF RENTER-OCCUPIED HOUSING UNITS PAYING CASH RENT, 2010
TABLE 10. GROSS RENT OF RENTER-OCCUPIED HOUSING UNITS PAYING CASH RENT, 2010
Area
Renter-Occupied Housing Units Paying Cash Rent by Monthly Gross Rent
Total
Less Than $250 $250 to $349 $350 to $449 $450 to $549 $550 to $749 $750 or More
Number Percent Number Percent Number Percent Number Percent Number Percent Number Percent
Region II 9,320 665 7.1% 566 6.1% 1,427 15.3% 2,072 22.2% 2,351 25.2% 2,239 24.0%
Bottineau 477 39 8.2% 60 12.6% 77 16.1% 172 36.1% 36 7.5% 93 19.5%
Burke 117 15 12.8% 30 25.6% 33 28.2% 22 18.8% 4 3.4% 13 11.1%
McHenry 387 50 12.9% 61 15.8% 107 27.6% 36 9.3% 94 24.3% 39 10.1%
Mountrail 677 119 17.6% 13 1.9% 78 11.5% 176 26.0% 188 27.8% 103 15.2%
Pierce 445 42 9.4% 77 17.3% 84 18.9% 61 13.7% 181 40.7% 0 0.0%
Renville 213 6 2.8% 19 8.9% 64 30.0% 39 18.3% 25 11.7% 60 28.2%
Ward 7,004 394 5.6% 306 4.4% 984 14.0% 1,566 22.4% 1,823 26.0% 1,931 27.6%
Minot 6,218 359 5.8% 282 4.5% 814 13.1% 1,463 23.5% 1,623 26.1% 1,677 27.0%
$555 $540
$483
$386
$430
$523 $505
$477
$574 $569
$0
$100
$200
$300
$400
$500
$600
$700
North Dakota Region II Bottineau County Burke County McHenry County Mountrail County Pierce County Renville County Ward County Minot city
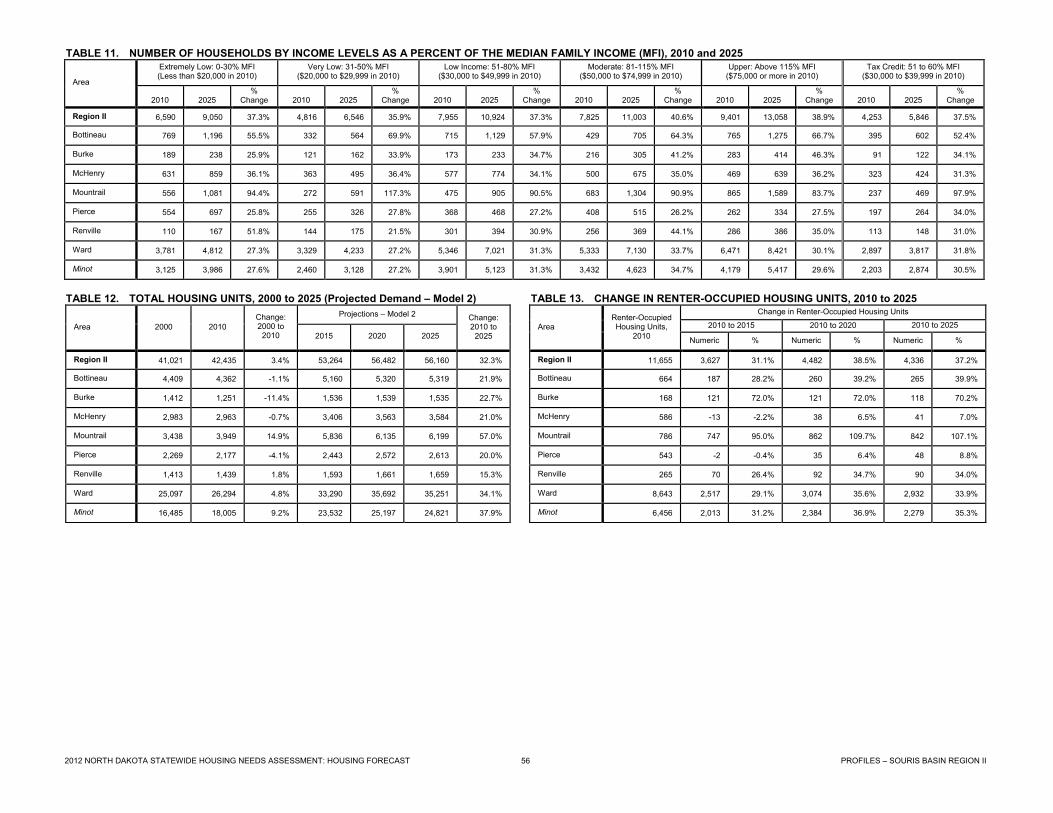
2012 NORTH DAKOTA STATEWIDE HOUSING NEEDS ASSESSMENT: HOUSING FORECAST PROFILES – SOURIS BASIN REGION II 56
TABLE 11. NUMBER OF HOUSEHOLDS BY INCOME LEVELS AS A PERCENT OF THE MEDIAN FAMILY INCOME (MFI), 2010 and 2025
Area
Extremely Low: 0-30% MFI (Less than $20,000 in 2010)
Very Low: 31-50% MFI ($20,000 to $29,999 in 2010)
Low Income: 51-80% MFI ($30,000 to $49,999 in 2010)
Moderate: 81-115% MFI ($50,000 to $74,999 in 2010)
Upper: Above 115% MFI ($75,000 or more in 2010)
Tax Credit: 51 to 60% MFI ($30,000 to $39,999 in 2010)
2010 2025 %
Change 2010 2025 %
Change 2010 2025 %
Change 2010 2025 %
Change 2010 2025 %
Change 2010 2025 %
Change
Region II 6,590 9,050 37.3% 4,816 6,546 35.9% 7,955 10,924 37.3% 7,825 11,003 40.6% 9,401 13,058 38.9% 4,253 5,846 37.5%
Bottineau 769 1,196 55.5% 332 564 69.9% 715 1,129 57.9% 429 705 64.3% 765 1,275 66.7% 395 602 52.4%
Burke 189 238 25.9% 121 162 33.9% 173 233 34.7% 216 305 41.2% 283 414 46.3% 91 122 34.1%
McHenry 631 859 36.1% 363 495 36.4% 577 774 34.1% 500 675 35.0% 469 639 36.2% 323 424 31.3%
Mountrail 556 1,081 94.4% 272 591 117.3% 475 905 90.5% 683 1,304 90.9% 865 1,589 83.7% 237 469 97.9%
Pierce 554 697 25.8% 255 326 27.8% 368 468 27.2% 408 515 26.2% 262 334 27.5% 197 264 34.0%
Renville 110 167 51.8% 144 175 21.5% 301 394 30.9% 256 369 44.1% 286 386 35.0% 113 148 31.0%
Ward 3,781 4,812 27.3% 3,329 4,233 27.2% 5,346 7,021 31.3% 5,333 7,130 33.7% 6,471 8,421 30.1% 2,897 3,817 31.8%
Minot 3,125 3,986 27.6% 2,460 3,128 27.2% 3,901 5,123 31.3% 3,432 4,623 34.7% 4,179 5,417 29.6% 2,203 2,874 30.5%
TABLE 12. TOTAL HOUSING UNITS, 2000 to 2025 (Projected Demand – Model 2)
TABLE 13. CHANGE IN RENTER-OCCUPIED HOUSING UNITS, 2010 to 2025
Area Renter-Occupied Housing Units,
2010
Change in Renter-Occupied Housing Units
2010 to 2015 2010 to 2020 2010 to 2025
3 Numeric % Numeric % Numeric %
Region II 11,655 3,627 31.1% 4,482 38.5% 4,336 37.2%
Bottineau 664 187 28.2% 260 39.2% 265 39.9%
Burke 168 121 72.0% 121 72.0% 118 70.2%
McHenry 586 -13 -2.2% 38 6.5% 41 7.0%
Mountrail 786 747 95.0% 862 109.7% 842 107.1%
Pierce 543 -2 -0.4% 35 6.4% 48 8.8%
Renville 265 70 26.4% 92 34.7% 90 34.0%
Ward 8,643 2,517 29.1% 3,074 35.6% 2,932 33.9%
Minot 6,456 2,013 31.2% 2,384 36.9% 2,279 35.3%
Area 2000 2010
Change: 2000 to
2010
Projections – Model 2 Change: 2010 to
2025 2015 2020 2025
Region II 41,021 42,435 3.4% 53,264 56,482 56,160 32.3%
Bottineau 4,409 4,362 -1.1% 5,160 5,320 5,319 21.9%
Burke 1,412 1,251 -11.4% 1,536 1,539 1,535 22.7%
McHenry 2,983 2,963 -0.7% 3,406 3,563 3,584 21.0%
Mountrail 3,438 3,949 14.9% 5,836 6,135 6,199 57.0%
Pierce 2,269 2,177 -4.1% 2,443 2,572 2,613 20.0%
Renville 1,413 1,439 1.8% 1,593 1,661 1,659 15.3%
Ward 25,097 26,294 4.8% 33,290 35,692 35,251 34.1%
Minot 16,485 18,005 9.2% 23,532 25,197 24,821 37.9%

2012 NORTH DAKOTA STATEWIDE HOUSING NEEDS ASSESSMENT: HOUSING FORECAST PROFILES – NORTH CENTRAL REGION III 57
NORTH CENTRAL REGION III AND ITS COMPONENTS
POPULATION CHANGE
$ Total population in Region III decreased 6 percent from 43,168 in 2000 to 40,672 in 2010. With the
exception of Rolette County, which grew 2 percent over the decade, every county within Region III
decreased in population. Current population projections suggest a 6 percent increase in population
throughout Region III, reaching 43,016 by 2025, with Benson and Rolette counties showing the fastest
growth (15 percent and 12 percent, respectively). Eddy and Cavalier counties are expected to lose
population by 2025.
$ Projections suggest a decrease in pre-retirees (ages 45 to 64) and an increase in elderly (ages 65 and
older) throughout Region III by 2025. This shift is largely a function of the baby boomers (i.e., the large
cohort of people born from 1946 to 1964) turning 65 (a shift which began in 2011). Benson and Cavalier
counties could see an increase of at least 23 percent in their primary workforce (those ages 25 to 44) by
2025.
TRENDS IN HOUSING
$ Region III showed a slight decrease in housing units from 2000 to 2010. Based on historical building
trends (i.e., the basis for Model 1 projections), housing supply in the region is projected to decrease by 4 percent by 2025. Cavalier County could lose one-third of its housing units by
2025. Rolette County is the exception to this trend with a projected increase in housing units of 19 percent over the next 15 years.
$ However, projections based on shifts in population and housing demand (i.e., the basis for Model 2) show a different trend. Based on this model, Region III can expect an increase of 10
percent in housing supply from 2010 to 2025; Rolette County could expect gains of 30 percent.
$ The majority of occupied housing units in Region III were owner-occupied in 2010 (72 percent). Rental units, which captured 28 percent of housing in 2010, could increase 21 percent by
2025; Rolette County could see an increase of nearly 50 percent.
$ Very few owner- or renter-occupied units in Region III were considered substandard (i.e., lacking complete plumbing or kitchen facilities) in 2010. However, at least 10 percent of rental
units in Benson and Rolette counties were overcrowded.
$ The vast majority of owner- and renter-occupied housing units in Region III were built before 1980. More than half of owner-occupied units and nearly half of renter-occupied units in
Eddy and Towner counties were built before 1940.
$ Nearly one-fifth of all housing in Region III was vacant in 2010. Of all the vacant units in the region, 7 percent were for sale; 20 percent were available for rent; and 37 percent were for
seasonal, recreational, or occasional use.
ECONOMICS OF HOUSING
$ According to 2010 data from the U.S. Census Bureau’s American Community Survey, median values of owner-occupied housing units for counties within Region III ranged from $47,800 in
Benson County to $85,300 in Ramsey County. Median gross rents for counties within the region ranged from $331 per month in Rolette County to $431 in Ramsey County.
$ Across the region, at least a third of owner-occupied housing units were valued at less than $40,000 in 2010. Benson and Towner counties had the highest percentages in this category
(44 percent each) and Ramsey had the lowest percentage (22 percent).
$ Nearly one-fourth of renter-occupied housing units in Region III rented for less than $250 per month in 2010; 34 percent rented at this level in Rolette County.
$ Projections indicate that over the next 15 years housing demand in Region III will increase by 20 percent for extremely low-income households, 14 percent for very-low income
households, and 7 percent for low-income households. Projections suggest little change in the number of moderate- and upper-income households in Region III by 2025.

2012 NORTH DAKOTA STATEWIDE HOUSING NEEDS ASSESSMENT: HOUSING FORECAST PROFILES – NORTH CENTRAL REGION III 58
TABLE 1. TOTAL POPULATION, 2000 to 2025
Area 2000 2010
Change: 2000 to
2010
Projections Change: 2010 to
2025 2015 2020 2025
Region III 43,168 40,672 -5.8% 41,434 42,254 43,016 5.8%
Benson 6,964 6,660 -4.4% 6,970 7,322 7,686 15.4%
Cavalier 4,831 3,993 -17.3% 3,909 3,805 3,773 -5.5%
Eddy 2,757 2,385 -13.5% 2,254 2,182 2,139 -10.3%
Ramsey 12,066 11,451 -5.1% 11,428 11,472 11,452 0.0%
Rolette 13,674 13,937 1.9% 14,596 15,172 15,651 12.3%
Towner 2,876 2,246 -21.9% 2,277 2,301 2,315 3.1%
Devils Lake 7,222 7,141 -1.1% 7,146 7,149 7,133 -0.1%
TABLE 3. TOTAL HOUSING UNITS, 2000 to 2025 (Building Trends – Model 1)
Area 2000 2010
Change: 2000 to
2010
Projections – Model 1 Change: 2010 to
2025 2015 2020 2025
Region III 19,389 19,058 -1.7% 18,787 18,559 18,329 -3.8%
Benson 2,932 2,963 1.1% 2,925 2,900 2,875 -3.0%
Cavalier 2,725 2,392 -12.2% 2,054 1,800 1,545 -35.4%
Eddy 1,418 1,300 -8.3% 1,263 1,204 1,145 -11.9%
Ramsey 5,729 5,641 -1.5% 5,505 5,396 5,286 -6.3%
Rolette 5,027 5,301 5.5% 5,675 5,978 6,281 18.5%
Towner 1,558 1,461 -6.2% 1,365 1,281 1,197 -18.1%
Devils Lake 3,524 3,549 0.7% 3,468 3,455 3,442 -3.0%
TABLE 2. POPULATION BY AGE, 2010 and 2025
Area
Less Than 25 Years of Age Ages 25 to 44 Ages 45 to 64 65 Years and Older
2010 2025 Change: 2010
to 2025 2010 2025
Change: 2010 to 2025
2010 2025 Change: 2010
to 2025 2010 2025
Change: 2010 to 2025
Region III 14,529 15,561 7.1% 8,555 9,860 15.3% 11,105 9,249 -16.7% 6,483 8,346 28.7%
Benson 2,821 3,293 16.7% 1,423 1,982 39.3% 1,563 1,542 -1.3% 853 869 1.9%
Cavalier 991 1,025 3.4% 688 843 22.5% 1,292 1,040 -19.5% 1,022 865 -15.4%
Eddy 622 558 -10.3% 425 419 -1.4% 752 490 -34.8% 586 672 14.7%
Ramsey 3,535 3,374 -4.6% 2,460 2,686 9.2% 3,384 2,484 -26.6% 2,072 2,908 40.3%
Rolette 6,014 6,554 9.0% 3,186 3,531 10.8% 3,339 3,086 -7.6% 1,398 2,480 77.4%
Towner 546 757 38.6% 373 399 7.0% 775 607 -21.7% 552 552 0.0%
Devils Lake 2,312 2,191 -5.2% 1,594 1,729 8.5% 1,862 1,362 -26.9% 1,373 1,851 34.8%

2012 NORTH DAKOTA STATEWIDE HOUSING NEEDS ASSESSMENT: HOUSING FORECAST PROFILES – NORTH CENTRAL REGION III 59
TABLE 4. TOTAL OCCUPIED HOUSING UNITS, 2000 to 2025
Area 2000 2010
Change: 2000 to
2010
Projections Change: 2010 to
2025 2015 2020 2025
Region III 16,240 15,574 -4.1% 16,251 16,686 17,000 9.2%
Benson 2,328 2,307 -0.9% 2,332 2,443 2,590 12.3%
Cavalier 2,017 1,760 -12.7% 1,732 1,683 1,669 -5.2%
Eddy 1,164 1,036 -11.0% 981 971 964 -6.9%
Ramsey 4,957 4,762 -3.9% 4,962 5,033 5,015 5.3%
Rolette 4,556 4,653 2.1% 5,219 5,545 5,754 23.7%
Towner 1,218 1,056 -13.3% 1,025 1,011 1,008 -4.5%
Devils Lake 3,145 3,081 -2.0% 3,228 3,261 3,246 5.4%
TABLE 5. OCCUPIED HOUSING UNITS BY TENURE, 2010
Area
Total Occupied Housing Units
Owner-Occupied
Renter-Occupied
Number
Percent
Number
Percent
Region III 15,574 11,148 71.6% 4,426 28.4%
Benson 2,307 1,432 62.1% 875 37.9%
Cavalier 1,760 1,476 83.9% 284 16.1%
Eddy 1,036 845 81.6% 191 18.4%
Ramsey 4,762 3,117 65.5% 1,645 34.5%
Rolette 4,653 3,444 74.0% 1,209 26.0%
Towner 1,056 834 79.0% 222 21.0%
Devils Lake 3,081 1,535 49.8% 1,546 50.2%
TABLE 6. VACANT HOUSING UNITS BY STATUS, 2010
Area
Total Vacant
Housing Units
For Rent
For Sale Only
Rented or Sold, Not Occupied
For Seasonal, Recreational, or
Occasional Use
For Migrant Workers
Other Vacant
Number
Percent
Number
Percent
Number
Percent
Number
Percent
Number
Percent
Number
Percent
Region III 3,484 687 19.7% 253 7.3% 101 2.9% 1,301 37.3% 0 0.0% 1,142 32.8%
Benson 656 83 12.7% 19 2.9% 7 1.1% 401 61.1% 0 0.0% 146 22.3%
Cavalier 632 7 1.1% 59 9.3% 53 8.4% 145 22.9% 0 0.0% 368 58.2%
Eddy 264 26 9.8% 37 14.0% 13 4.9% 48 18.2% 0 0.0% 140 53.0%
Ramsey 879 348 39.6% 55 6.3% 11 1.3% 220 25.0% 0 0.0% 245 27.9%
Rolette 648 143 22.1% 72 11.1% 13 2.0% 204 31.5% 0 0.0% 216 33.3%
Towner 405 80 19.8% 11 2.7% 4 1.0% 283 69.9% 0 0.0% 27 6.7%
Devils Lake 468 294 62.8% 44 9.4% 0 0.0% 76 16.2% 0 0.0% 54 11.5%

2012 NORTH DAKOTA STATEWIDE HOUSING NEEDS ASSESSMENT: HOUSING FORECAST PROFILES – NORTH CENTRAL REGION III 60
TABLE 7. SUBSTANDARD OCCUPIED HOUSING UNITS BY TENURE, 2010
Area
Owner-Occupied Housing Units
Renter-Occupied Housing Units
Total
Lacking Complete Plumbing Facilities
Lacking Complete Kitchen Facilities
Overcrowded: 1.01 or More Occupants Per Room
Total
Lacking Complete Plumbing Facilities
Lacking Complete Kitchen Facilities
Overcrowded: 1.01 or More Occupants Per Room
Number Percent Number Percent Number Percent Number Percent Number Percent Number Percent
Region III 11,148 50 0.4% 39 0.3% 313 2.8% 4,426 17 0.4% 38 0.9% 283 6.4%
Benson 1,432 19 1.3% 17 1.2% 41 2.9% 875 11 1.3% 21 2.4% 113 12.9%
Cavalier 1,476 4 0.3% 4 0.3% 0 0.0% 284 6 2.1% 6 2.1% 0 0.0%
Eddy 845 0 0.0% 0 0.0% 9 1.1% 191 0 0.0% 0 0.0% 0 0.0%
Ramsey 3,117 8 0.3% 0 0.0% 44 1.4% 1,645 0 0.0% 0 0.0% 26 1.6%
Rolette 3,444 19 0.6% 18 0.5% 219 6.4% 1,209 0 0.0% 11 0.9% 128 10.6%
Towner 834 0 0.0% 0 0.0% 0 0.0% 222 0 0.0% 0 0.0% 16 7.2%
Devils Lake 1,535 0 0.0% 0 0.0% 13 0.8% 1,546 0 0.0% 0 0.0% 24 1.6%
TABLE 8. YEAR OCCUPIED HOUSING UNIT BUILT BY TENURE, 2010
Area
Owner-Occupied Housing Units Renter-Occupied Housing Units
Total
Built 1980 to Present Built 1940 to 1979 Built Prior to 1940
Total
Built 1980 to Present Built 1940 to 1979 Built Prior to 1940
Number Percent Number Percent Number Percent Number Percent Number Percent Number Percent
Region III 11,148 1,528 13.7% 5,566 49.9% 4,054 36.4% 4,426 556 12.6% 2,516 56.8% 1,354 30.6%
Benson 1,432 215 15.0% 632 44.1% 585 40.9% 875 75 8.6% 582 66.5% 218 24.9%
Cavalier 1,476 163 11.0% 729 49.4% 584 39.6% 284 26 9.2% 170 59.9% 88 31.0%
Eddy 845 41 4.9% 264 31.2% 540 63.9% 191 1 0.5% 104 54.5% 86 45.0%
Ramsey 3,117 500 16.0% 1,295 41.5% 1,322 42.4% 1,645 290 17.6% 704 42.8% 651 39.6%
Rolette 3,444 585 17.0% 2,285 66.3% 574 16.7% 1,209 131 10.8% 870 72.0% 208 17.2%
Towner 834 24 2.9% 361 43.3% 449 53.8% 222 33 14.9% 86 38.7% 103 46.4%
Devils Lake 1,535 154 10.0% 692 45.1% 689 44.9% 1,546 289 18.7% 664 42.9% 593 38.4%

2012 NORTH DAKOTA STATEWIDE HOUSING NEEDS ASSESSMENT: HOUSING FORECAST PROFILES – NORTH CENTRAL REGION III 61
FIGURE 1. MEDIAN VALUE OF ALL OWNER-OCCUPIED HOUSING UNITS, 2010
TABLE 9. VALUE OF ALL OWNER-OCCUPIED HOUSING UNITS, 2010
Area
Owner-Occupied Housing Units by Value
Total
Less Than $40,000 $40,000 to $69,999 $70,000 to $89,999 $90,000 to $124,999 $125,000 to $199,999 $200,000 or More
Number Percent Number Percent Number Percent Number Percent Number Percent Number Percent
Region III 11,148 3,937 35.3% 2,275 20.4% 1,519 13.6% 1,317 11.8% 1,123 10.1% 977 8.8%
Benson 1,432 637 44.5% 357 24.9% 129 9.0% 94 6.6% 105 7.3% 110 7.7%
Cavalier 1,476 534 36.2% 272 18.4% 191 12.9% 199 13.5% 215 14.6% 65 4.4%
Eddy 845 339 40.1% 224 26.5% 109 12.9% 100 11.8% 41 4.9% 32 3.8%
Ramsey 3,117 697 22.4% 479 15.4% 514 16.5% 456 14.6% 505 16.2% 466 15.0%
Rolette 3,444 1,363 39.6% 739 21.5% 451 13.1% 383 11.1% 236 6.9% 272 7.9%
Towner 834 367 44.0% 204 24.5% 125 15.0% 85 10.2% 21 2.5% 32 3.8%
Devils Lake 1,535 362 23.6% 262 17.1% 325 21.2% 236 15.4% 245 16.0% 105 6.8%
$111,300
$54,478
$47,800
$58,800
$48,900
$85,300
$56,700
$48,800
$80,100
$0
$20,000
$40,000
$60,000
$80,000
$100,000
$120,000
North Dakota Region III Benson County Cavalier County Eddy County Ramsey County Rolette County Towner County Devils Lake city

2012 NORTH DAKOTA STATEWIDE HOUSING NEEDS ASSESSMENT: HOUSING FORECAST PROFILES – NORTH CENTRAL REGION III 62
FIGURE 2. MEDIAN GROSS RENT OF RENTER-OCCUPIED HOUSING UNITS PAYING CASH RENT, 2010
TABLE 10. GROSS RENT OF RENTER-OCCUPIED HOUSING UNITS PAYING CASH RENT, 2010
Area
Renter-Occupied Housing Units Paying Cash Rent by Monthly Gross Rent
Total
Less Than $250 $250 to $349 $350 to $449 $450 to $549 $550 to $749 $750 or More
Number Percent Number Percent Number Percent Number Percent Number Percent Number Percent
Region III 3,927 899 22.9% 767 19.5% 855 21.8% 515 13.1% 533 13.6% 358 9.1%
Benson 712 173 24.3% 150 21.1% 199 27.9% 75 10.5% 95 13.3% 20 2.8%
Cavalier 203 29 14.3% 58 28.6% 67 33.0% 26 12.8% 22 10.8% 1 0.5%
Eddy 129 5 3.9% 49 38.0% 25 19.4% 29 22.5% 5 3.9% 16 12.4%
Ramsey 1,603 299 18.7% 257 16.0% 352 22.0% 273 17.0% 206 12.9% 216 13.5%
Rolette 1,121 376 33.5% 219 19.5% 160 14.3% 103 9.2% 175 15.6% 88 7.9%
Towner 159 17 10.7% 34 21.4% 52 32.7% 9 5.7% 30 18.9% 17 10.7%
Devils Lake 1,520 298 19.6% 236 15.5% 330 21.7% 258 17.0% 188 12.4% 210 13.8%
$555
$371 $362
$376 $379
$431
$331
$412 $430
$0
$100
$200
$300
$400
$500
$600
North Dakota Region III Benson County Cavalier County Eddy County Ramsey County Rolette County Towner County Devils Lake city

2012 NORTH DAKOTA STATEWIDE HOUSING NEEDS ASSESSMENT: HOUSING FORECAST PROFILES – NORTH CENTRAL REGION III 63
TABLE 11. NUMBER OF HOUSEHOLDS BY INCOME LEVELS AS A PERCENT OF THE MEDIAN FAMILY INCOME (MFI), 2010 and 2025
Area
Extremely Low: 0-30% MFI (Less than $20,000 in 2010)
Very Low: 31-50% MFI ($20,000 to $29,999 in 2010)
Low Income: 51-80% MFI ($30,000 to $49,999 in 2010)
Moderate: 81-115% MFI ($50,000 to $74,999 in 2010)
Upper: Above 115% MFI ($75,000 or more in 2010)
Tax Credit: 51 to 60% MFI ($30,000 to $39,999 in 2010)
2010 2025 %
Change 2010 2025 %
Change 2010 2025 %
Change 2010 2025 %
Change 2010 2025 %
Change 2010 2025 %
Change
Region III 4,438 5,326 20.0% 2,069 2,356 13.9% 3,232 3,472 7.4% 2,881 2,932 1.8% 2,954 2,920 -1.2% 1,860 1,998 7.4%
Benson 809 928 14.7% 319 361 13.2% 492 556 13.0% 366 401 9.6% 321 346 7.8% 322 366 13.7%
Cavalier 357 355 -0.6% 133 127 -4.5% 407 380 -6.6% 414 383 -7.5% 449 427 -4.9% 224 208 -7.1%
Eddy 258 274 6.2% 117 122 4.3% 261 222 -14.9% 224 199 -11.2% 176 147 -16.5% 173 148 -14.5%
Ramsey 970 1,142 17.7% 677 731 8.0% 1,037 1,137 9.6% 961 965 0.4% 1,117 1,040 -6.9% 610 675 10.7%
Rolette 1,781 2,342 31.5% 685 891 30.1% 821 986 20.1% 694 772 11.2% 672 763 13.5% 448 528 17.9%
Towner 263 285 8.4% 138 124 -10.1% 214 191 -10.7% 222 212 -4.5% 219 197 -10.0% 83 73 -12.0%
Devils Lake 794 892 12.3% 562 592 5.3% 640 676 5.6% 568 574 1.1% 517 512 -1.0% 391 405 3.6%
TABLE 12. TOTAL HOUSING UNITS, 2000 to 2025 (Projected Demand – Model 2) TABLE 13. CHANGE IN RENTER-OCCUPIED HOUSING UNITS, 2010 to 2025
Area Renter-Occupied Housing Units,
2010
Change in Renter-Occupied Housing Units
2010 to 2015 2010 to 2020 2010 to 2025
3 Numeric % Numeric % Numeric %
Region III 4,426 563 12.7% 749 16.9% 921 20.8%
Benson 875 -112 -12.8% -61 -7.0% 6 0.7%
Cavalier 284 40 14.1% 38 13.4% 37 13.0%
Eddy 191 45 23.6% 48 25.1% 50 26.2%
Ramsey 1,645 145 8.8% 179 10.9% 209 12.7%
Rolette 1,209 425 35.2% 520 43.0% 576 47.6%
Towner 222 20 9.0% 25 11.3% 43 19.4%
Devils Lake 1,546 60 3.9% 76 4.9% 92 6.0%
Area 2000 2010
Change: 2000 to
2010
Projections – Model 2 Change: 2010 to
2025 2015 2020 2025
Region III 19,389 19,058 -1.7% 19,878 20,474 20,870 9.5%
Benson 2,932 2,963 1.1% 2,970 2,991 3,018 1.9%
Cavalier 2,725 2,392 -12.2% 2,391 2,442 2,457 2.7%
Eddy 1,418 1,300 -8.3% 1,392 1,402 1,409 8.4%
Ramsey 5,729 5,641 -1.5% 5,613 5,597 5,601 -0.7%
Rolette 5,027 5,301 5.5% 6,047 6,567 6,908 30.3%
Towner 1,558 1,461 -6.2% 1,465 1,475 1,477 1.1%
Devils Lake 3,524 3,549 0.7% 3,481 3,471 3,476 -2.1%

2012 NORTH DAKOTA STATEWIDE HOUSING NEEDS ASSESSMENT: HOUSING FORECAST PROFILES – RED RIVER REGION IV 64
RED RIVER REGION IV AND ITS COMPONENTS
POPULATION CHANGE
$ Total population in Region IV decreased 3 percent from 90,798 in 2000 to 88,519 in 2010. With the
exception of Grand Forks County, which grew 1 percent over the past decade, Nelson, Pembina and Walsh
counties each lost at least 10 percent of their population during this time. Current projections indicate
an 8 percent increase in population throughout the region, reaching 95,125 by 2025. This growth is
largely a result of changes in Grand Forks County. Nelson, Pembina, and Walsh counties could
potentially lose population over the next 15 years.
$ The elderly population in each county in Region IV is expected to increase by 2025. Beginning in 2011,
baby boomers (i.e., the large cohort of people born from 1946 to 1964) began turning 65. Thus, over the
next 15 years, the number of people ages 65 and older in Region IV is expected to grow by 50 percent
while the population of pre-retirees (people ages 45 to 64) will decrease. The prime workforce age
group (ages 25 to 44) is projected to grow 29 percent in Region IV by 2025, a growth heavily influenced by
Grand Forks County. Projections also suggest a modest growth in people younger than 25 (5 percent).
TRENDS IN HOUSING
$ From 2000 to 2010, the number of housing units increased 3 percent in Region IV. Except for Grand Forks County and the city of Grand Forks, the number of housing units across Region
IV decreased over the past decade. If building trends continue (i.e., the basis for Model 1 projections), similar patterns of growth and decline are expected throughout the region by
2025 (with a 5 percent projected growth region-wide).
$ Using projections based on shifts in population and housing demand (i.e., the basis for Model 2) rather than on historical building trends, Region IV could see an increase of 11 percent in
housing supply by 2025. With the exception of Nelson County which would change little over the next 15 years, Model 2 suggests a growth in housing supply for Grand Forks, Pembina,
and Walsh counties by 2025.
$ The majority of occupied housing units in Region IV were owner-occupied in 2010 (61 percent). While most counties in Region IV had a higher proportion of owners than renters, Grand
Forks County and the city of Grand Forks were nearly evenly split between owner- and renter-occupied housing. Projections suggest an increase in rental units of 21 percent across the
region by 2025. However, Walsh County could see a 9 percent loss in renter-occupied housing over the next 15 years.
$ Very few housing units in Region IV were considered substandard (i.e., lacking complete plumbing or kitchen facilities) or overcrowded in 2010.
$ The vast majority of owner- and renter-occupied housing units in Region IV were built before 1980 (82 percent). Approximately half of owner-occupied housing units in Nelson,
Pembina, and Walsh counties were built before 1940.
$ About one-tenth of all housing in Region IV was vacant in 2010. Of all the vacant units in the region, 7 percent were for sale; 11 percent were for seasonal, recreational, or occasional
use; and 32 percent were for rent.
ECONOMICS OF HOUSING
$ According to 2010 data from the U.S. Census Bureau’s American Community Survey, median values of owner-occupied housing units for counties within Region IV ranged from $51,100 in
Nelson County to $139,100 in Grand Forks County. Median gross rents for counties within the region ranged from $366 per month in Nelson County to $628 in Grand Forks County.
$ The majority of owner-occupied housing units were valued at less than $70,000 in Nelson, Pembina, and Walsh counties in 2010. In contrast, 59 percent of owner-occupied units in
Grand Forks County were valued at $125,000 or more.
$ Three-fourths of renter-occupied housing units in Nelson County (and nearly half of rental units in Pembina and Walsh counties) rented for less than $450 per month in 2010. Nearly
two-thirds of rental units in Grand Forks rented for at least $550 per month in 2010; 31 percent rented for $750 or more.
$ Housing unit projections suggest that the number of lower-income households in Region IV will see larger increases by 2025 than moderate- and upper-income households. Nelson,
Pembina, and Walsh counties could see losses in the number of moderate- and upper-income households over the next 15 years.

2012 NORTH DAKOTA STATEWIDE HOUSING NEEDS ASSESSMENT: HOUSING FORECAST PROFILES – RED RIVER REGION IV 65
TABLE 1. TOTAL POPULATION, 2000 to 2025
Area 2000 2010
Change: 2000 to
2010
Projections Change: 2010 to
2025 2015 2020 2025
Region IV 90,798 88,519 -2.5% 90,506 92,800 95,125 7.5%
Grand Forks 66,109 66,861 1.1% 69,268 72,014 74,894 12.0%
Nelson 3,715 3,126 -15.9% 3,047 2,976 2,857 -8.6%
Pembina 8,585 7,413 -13.7% 7,278 7,174 7,060 -4.8%
Walsh 12,389 11,119 -10.3% 10,913 10,636 10,314 -7.2%
Grand Forks 49,321 52,838 7.1% 54,800 56,859 58,981 11.6%
TABLE 3. TOTAL HOUSING UNITS, 2000 to 2025 (Building Trends – Model 1)
Area 2000 2010
Change: 2000 to
2010
Projections – Model 1 Change: 2010 to
2025 2015 2020 2025
Region IV 39,259 40,436 3.0% 41,195 41,766 42,334 4.7%
Grand Forks 27,373 29,048 6.1% 30,324 31,306 32,287 11.2%
Nelson 2,014 1,952 -3.1% 1,862 1,798 1,733 -11.2%
Pembina 4,115 3,896 -5.3% 3,685 3,512 3,338 -14.3%
Walsh 5,757 5,540 -3.8% 5,324 5,150 4,976 -10.2%
Grand Forks 20,830 23,296 11.8% 24,741 26,033 27,324 17.3%
TABLE 2. POPULATION BY AGE, 2010 and 2025
Area
Less Than 25 Years of Age Ages 25 to 44 Ages 45 to 64 65 Years and Older
2010 2025 Change: 2010
to 2025 2010 2025
Change: 2010 to 2025
2010 2025 Change: 2010
to 2025 2010 2025
Change: 2010 to 2025
Region IV 33,807 35,541 5.1% 20,996 27,118 29.2% 22,229 15,202 -31.6% 11,487 17,264 50.3%
Grand Forks 27,846 29,837 7.2% 16,746 23,036 37.6% 15,366 10,632 -30.8% 6,903 11,389 65.0%
Nelson 721 580 -19.6% 513 511 -0.4% 1,034 558 -46.0% 858 1,208 40.8%
Pembina 2,048 2,174 6.2% 1,491 1,605 7.6% 2,385 1,563 -34.5% 1,489 1,718 15.4%
Walsh 3,192 2,950 -7.6% 2,246 1,966 -12.5% 3,444 2,449 -28.9% 2,237 2,949 31.8%
Grand Forks 22,761 24,191 6.3% 13,266 18,086 36.3% 11,475 7,933 -30.9% 5,336 8,771 64.4%

2012 NORTH DAKOTA STATEWIDE HOUSING NEEDS ASSESSMENT: HOUSING FORECAST PROFILES – RED RIVER REGION IV 66
TABLE 4. TOTAL OCCUPIED HOUSING UNITS, 2000 to 2025
Area 2000 2010
Change: 2000 to
2010
Projections Change: 2010 to
2025 2015 2020 2025
Region IV 35,627 36,007 1.1% 37,949 38,984 39,979 11.0%
Grand Forks 25,435 26,514 4.2% 28,717 29,904 31,039 17.1%
Nelson 1,628 1,448 -11.1% 1,455 1,454 1,429 -1.3%
Pembina 3,535 3,289 -7.0% 3,135 3,066 3,011 -8.5%
Walsh 5,029 4,756 -5.4% 4,642 4,560 4,500 -5.4%
Grand Forks 19,674 21,611 9.8% 23,346 24,264 25,135 16.3%
TABLE 5. OCCUPIED HOUSING UNITS BY TENURE, 2010
Area
Total Occupied Housing Units
Owner-Occupied
Renter-Occupied
Number
Percent
Number
Percent
Region IV 36,007 21,771 60.5% 14,236 39.5%
Grand Forks 26,514 14,426 54.4% 12,088 45.6%
Nelson 1,448 1,196 82.6% 252 17.4%
Pembina 3,289 2,618 79.6% 671 20.4%
Walsh 4,756 3,531 74.2% 1,225 25.8%
Grand Forks 21,611 10,791 49.9% 10,820 50.1%
TABLE 6. VACANT HOUSING UNITS BY STATUS, 2010
Area
Total Vacant
Housing Units
For Rent
For Sale Only
Rented or Sold, Not Occupied
For Seasonal, Recreational, or
Occasional Use
For Migrant Workers
Other Vacant
Number
Percent
Number
Percent
Number
Percent
Number
Percent
Number
Percent
Number
Percent
Region IV 4,429 1,394 31.5% 322 7.3% 302 6.8% 475 10.7% 72 1.6% 1,864 42.1%
Grand Forks 2,534 1,071 42.3% 225 8.9% 192 7.6% 286 11.3% 5 0.2% 755 29.8%
Nelson 504 55 10.9% 10 2.0% 20 4.0% 86 17.1% 0 0.0% 333 66.1%
Pembina 607 131 21.6% 23 3.8% 57 9.4% 41 6.8% 14 2.3% 341 56.2%
Walsh 784 137 17.5% 64 8.2% 33 4.2% 62 7.9% 53 6.8% 435 55.5%
Grand Forks 1,685 976 57.9% 207 12.3% 171 10.1% 159 9.4% 0 0.0% 172 10.2%

2012 NORTH DAKOTA STATEWIDE HOUSING NEEDS ASSESSMENT: HOUSING FORECAST PROFILES – RED RIVER REGION IV 67
TABLE 7. SUBSTANDARD OCCUPIED HOUSING UNITS BY TENURE, 2010
Area
Owner-Occupied Housing Units
Renter-Occupied Housing Units
Total
Lacking Complete Plumbing Facilities
Lacking Complete Kitchen Facilities
Overcrowded: 1.01 or More Occupants Per Room
Total
Lacking Complete Plumbing Facilities
Lacking Complete Kitchen Facilities
Overcrowded: 1.01 or More Occupants Per Room
Number Percent Number Percent Number Percent Number Percent Number Percent Number Percent
Region IV 21,771 33 0.2% 26 0.1% 162 0.7% 14,236 39 0.3% 90 0.6% 121 0.8%
Grand Forks 14,426 5 0.0% 23 0.2% 101 0.7% 12,088 28 0.2% 69 0.6% 99 0.8%
Nelson 1,196 7 0.6% 0 0.0% 2 0.2% 252 0 0.0% 2 0.8% 0 0.0%
Pembina 2,618 8 0.3% 3 0.1% 0 0.0% 671 8 1.2% 16 2.4% 10 1.5%
Walsh 3,531 13 0.4% 0 0.0% 59 1.7% 1,225 3 0.2% 3 0.2% 12 1.0%
Grand Forks 10,791 0 0.0% 18 0.2% 84 0.8% 10,820 18 0.2% 59 0.5% 84 0.8%
TABLE 8. YEAR OCCUPIED HOUSING UNIT BUILT BY TENURE, 2010
Area
Owner-Occupied Housing Units Renter-Occupied Housing Units
Total
Built 1980 to Present Built 1940 to 1979 Built Prior to 1940
Total
Built 1980 to Present Built 1940 to 1979 Built Prior to 1940
Number Percent Number Percent Number Percent Number Percent Number Percent Number Percent
Region IV 21,771 3,866 17.8% 9,051 41.6% 8,854 40.7% 14,236 2,737 19.2% 7,569 53.2% 3,930 27.6%
Grand Forks 14,426 3,284 22.8% 5,863 40.6% 5,279 36.6% 12,088 2,482 20.5% 6,505 53.8% 3,101 25.7%
Nelson 1,196 100 8.4% 422 35.3% 674 56.4% 252 25 9.9% 135 53.6% 92 36.5%
Pembina 2,618 188 7.2% 1,146 43.8% 1,284 49.0% 671 91 13.6% 348 51.9% 232 34.6%
Walsh 3,531 294 8.3% 1,620 45.9% 1,617 45.8% 1,225 139 11.3% 581 47.4% 505 41.2%
Grand Forks 10,791 2,579 23.9% 4,325 40.1% 3,887 36.0% 10,820 2,041 18.9% 6,009 55.5% 2,770 25.6%

2012 NORTH DAKOTA STATEWIDE HOUSING NEEDS ASSESSMENT: HOUSING FORECAST PROFILES – RED RIVER REGION IV 68
FIGURE 1. MEDIAN VALUE OF ALL OWNER-OCCUPIED HOUSING UNITS, 2010
TABLE 9. VALUE OF ALL OWNER-OCCUPIED HOUSING UNITS, 2010
Area
Owner-Occupied Housing Units by Value
Total
Less Than $40,000 $40,000 to $69,999 $70,000 to $89,999 $90,000 to $124,999 $125,000 to $199,999 $200,000 or More
Number Percent Number Percent Number Percent Number Percent Number Percent Number Percent
Region IV 21,771 3,290 15.1% 2,777 12.8% 2,167 10.0% 3,796 17.4% 6,438 29.6% 3,303 15.2%
Grand Forks 14,426 1,231 8.5% 864 6.0% 1,072 7.4% 2,731 18.9% 5,579 38.7% 2,949 20.4%
Nelson 1,196 466 39.0% 308 25.8% 114 9.5% 81 6.8% 174 14.5% 53 4.4%
Pembina 2,618 537 20.5% 731 27.9% 484 18.5% 388 14.8% 332 12.7% 146 5.6%
Walsh 3,531 1,056 29.9% 874 24.8% 497 14.1% 596 16.9% 353 10.0% 155 4.4%
Grand Forks 10,791 823 7.6% 415 3.8% 637 5.9% 2,010 18.6% 4,747 44.0% 2,159 20.0%
$111,300
$88,317
$139,100
$51,100
$71,800
$64,300
$144,300
$0
$20,000
$40,000
$60,000
$80,000
$100,000
$120,000
$140,000
$160,000
North Dakota Region IV Grand Forks County Nelson County Pembina County Walsh County Grand Forks city

2012 NORTH DAKOTA STATEWIDE HOUSING NEEDS ASSESSMENT: HOUSING FORECAST PROFILES – RED RIVER REGION IV 69
FIGURE 2. MEDIAN GROSS RENT OF RENTER-OCCUPIED HOUSING UNITS PAYING CASH RENT, 2010
TABLE 10. GROSS RENT OF RENTER-OCCUPIED HOUSING UNITS PAYING CASH RENT, 2010
Area
Renter-Occupied Housing Units Paying Cash Rent by Monthly Gross Rent
Total
Less Than $250 $250 to $349 $350 to $449 $450 to $549 $550 to $749 $750 or More
Number Percent Number Percent Number Percent Number Percent Number Percent Number Percent
Region IV 12,974 638 4.9% 782 6.0% 1,837 14.2% 2,032 15.7% 4,062 31.3% 3,623 27.9%
Grand Forks 11,180 349 3.1% 605 5.4% 1,405 12.6% 1,666 14.9% 3,740 33.5% 3,415 30.5%
Nelson 184 46 25.0% 31 16.8% 66 35.9% 19 10.3% 8 4.3% 14 7.6%
Pembina 537 73 13.6% 52 9.7% 119 22.2% 144 26.8% 68 12.7% 81 15.1%
Walsh 1,073 170 15.8% 94 8.8% 247 23.0% 203 18.9% 246 22.9% 113 10.5%
Grand Forks 10,553 320 3.0% 536 5.1% 1,365 12.9% 1,569 14.9% 3,580 33.9% 3,183 30.2%
$555 $536
$628
$366
$470 $461
$628
$0
$100
$200
$300
$400
$500
$600
$700
North Dakota Region IV Grand Forks County Nelson County Pembina County Walsh County Grand Forks city
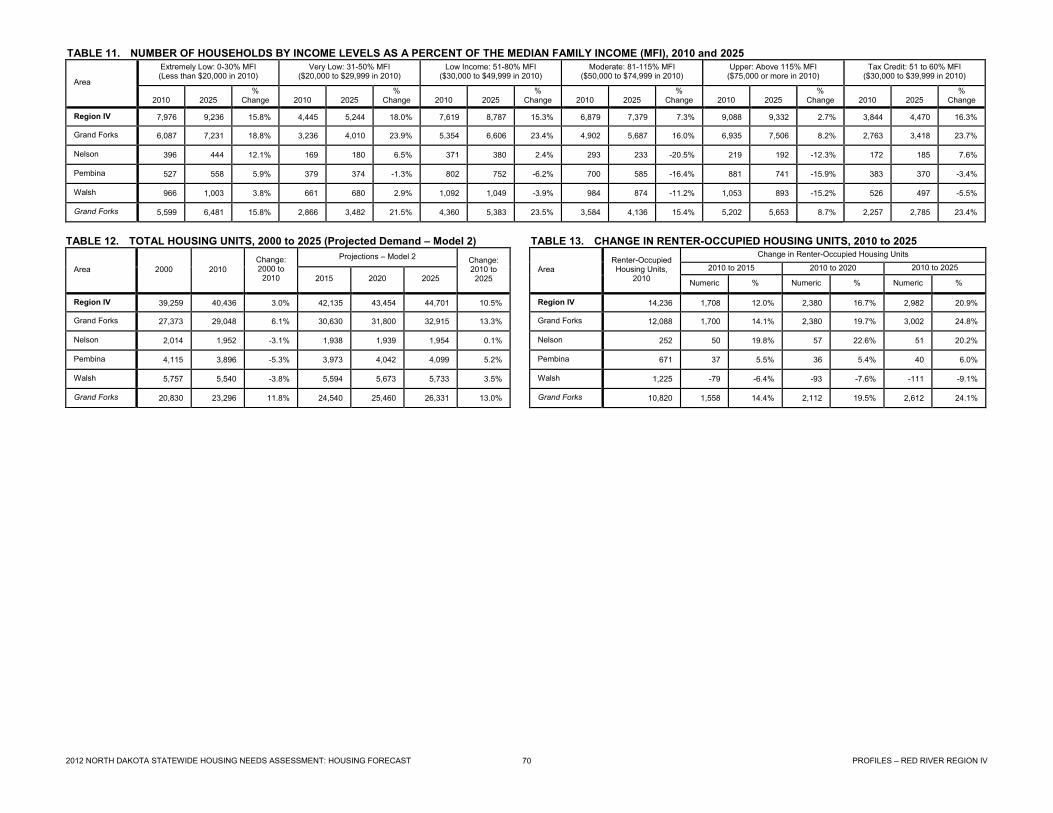
2012 NORTH DAKOTA STATEWIDE HOUSING NEEDS ASSESSMENT: HOUSING FORECAST PROFILES – RED RIVER REGION IV 70
TABLE 11. NUMBER OF HOUSEHOLDS BY INCOME LEVELS AS A PERCENT OF THE MEDIAN FAMILY INCOME (MFI), 2010 and 2025
Area
Extremely Low: 0-30% MFI (Less than $20,000 in 2010)
Very Low: 31-50% MFI ($20,000 to $29,999 in 2010)
Low Income: 51-80% MFI ($30,000 to $49,999 in 2010)
Moderate: 81-115% MFI ($50,000 to $74,999 in 2010)
Upper: Above 115% MFI ($75,000 or more in 2010)
Tax Credit: 51 to 60% MFI ($30,000 to $39,999 in 2010)
2010 2025 %
Change 2010 2025 %
Change 2010 2025 %
Change 2010 2025 %
Change 2010 2025 %
Change 2010 2025 %
Change
Region IV 7,976 9,236 15.8% 4,445 5,244 18.0% 7,619 8,787 15.3% 6,879 7,379 7.3% 9,088 9,332 2.7% 3,844 4,470 16.3%
Grand Forks 6,087 7,231 18.8% 3,236 4,010 23.9% 5,354 6,606 23.4% 4,902 5,687 16.0% 6,935 7,506 8.2% 2,763 3,418 23.7%
Nelson 396 444 12.1% 169 180 6.5% 371 380 2.4% 293 233 -20.5% 219 192 -12.3% 172 185 7.6%
Pembina 527 558 5.9% 379 374 -1.3% 802 752 -6.2% 700 585 -16.4% 881 741 -15.9% 383 370 -3.4%
Walsh 966 1,003 3.8% 661 680 2.9% 1,092 1,049 -3.9% 984 874 -11.2% 1,053 893 -15.2% 526 497 -5.5%
Grand Forks 5,599 6,481 15.8% 2,866 3,482 21.5% 4,360 5,383 23.5% 3,584 4,136 15.4% 5,202 5,653 8.7% 2,257 2,785 23.4%
TABLE 12. TOTAL HOUSING UNITS, 2000 to 2025 (Projected Demand – Model 2) TABLE 13. CHANGE IN RENTER-OCCUPIED HOUSING UNITS, 2010 to 2025
Area Renter-Occupied Housing Units,
2010
Change in Renter-Occupied Housing Units
2010 to 2015 2010 to 2020 2010 to 2025
3 Numeric % Numeric % Numeric %
Region IV 14,236 1,708 12.0% 2,380 16.7% 2,982 20.9%
Grand Forks 12,088 1,700 14.1% 2,380 19.7% 3,002 24.8%
Nelson 252 50 19.8% 57 22.6% 51 20.2%
Pembina 671 37 5.5% 36 5.4% 40 6.0%
Walsh 1,225 -79 -6.4% -93 -7.6% -111 -9.1%
Grand Forks 10,820 1,558 14.4% 2,112 19.5% 2,612 24.1%
Area 2000 2010
Change: 2000 to
2010
Projections – Model 2 Change: 2010 to
2025 2015 2020 2025
Region IV 39,259 40,436 3.0% 42,135 43,454 44,701 10.5%
Grand Forks 27,373 29,048 6.1% 30,630 31,800 32,915 13.3%
Nelson 2,014 1,952 -3.1% 1,938 1,939 1,954 0.1%
Pembina 4,115 3,896 -5.3% 3,973 4,042 4,099 5.2%
Walsh 5,757 5,540 -3.8% 5,594 5,673 5,733 3.5%
Grand Forks 20,830 23,296 11.8% 24,540 25,460 26,331 13.0%

2012 NORTH DAKOTA STATEWIDE HOUSING NEEDS ASSESSMENT: HOUSING FORECAST PROFILES – LAKE AGASSIZ REGION V 71
LAKE AGASSIZ REGION V AND ITS COMPONENTS
POPULATION CHANGE
From 2000 to 2010, population in Region V decreased in five of its six counties. Growth in Cass County,
fed largely by 26,000 additional people in Fargo and West Fargo during the decade, resulted in an overall
population increase in Region V of 14 percent (from 162,127 in 2000 to 185,481 in 2010). Region V is
expected to reach 218,799 people by 2025. Current population projections suggest similar patterns of
population change over the next 15 years, with a projected growth of 24 percent in Cass County and
projected losses in Ransom, Richland, Sargent, Steele, and Traill counties.
The number of elderly throughout Region V is projected to increase substantially from 2010 to 2025.
Beginning in 2011, baby boomers (i.e., the large cohort of people born from 1946 to 1964) began turning
65. Thus, over the next 15 years, the elderly population is expected to increase by nearly three-fourths;
the elderly population in Cass County is anticipated to double. The number of pre-retirees (ages 45 to
64) is set to increase only slightly region-wide, with significant decreases in five of the six counties. The
prime workforce and youth populations are projected to increase by at least 14 percent in the region.
TRENDS IN HOUSING
Total housing units grew by 17 percent in Region V from 2000 to 2010. If historical building trends over the past few years continue (i.e., the basis for Model 1 projections), the housing
supply in Region V is projected to grow 25 percent by 2025. This regional growth is driven largely by increases projected for Cass County; by 2025, Fargo is expected to see a 32 percent
increase in population and West Fargo is expected to see a 40 percent increase.
Housing unit projections based on shifts in population and housing demand (i.e., the basis for Model 2) are very similar to projections based on historical building trends (i.e., Model 1) in
Region V. Both models project a growth in housing supply of 25 percent by 2025, with similar patterns of growth in Cass County.
With the exception of the city of Fargo, the majority of housing in Region V was owner-occupied in 2010. In Fargo, 55 percent of housing was renter-occupied. Rental units are
projected to increase 25 percent in the region by 2025; West Fargo rental units are projected to increase by 59 percent.
Very few housing units in Region V were considered substandard (i.e., lacking complete plumbing or kitchen facilities) or overcrowded in 2010.
One-third of occupied housing in Region V was built in the last 30 years (i.e., since 1980). Rental units are slightly newer construction than owner-occupied units with 18 percent built
prior to 1940 (compared to 32 percent of owner-occupied units built prior to 1940).
In Region V there were 5,361 vacant housing units in 2010; 57 percent of the vacant units were located in Cass County. Approximately one-third of the vacant units in the region were
available for rent.
ECONOMICS OF HOUSING
According to 2010 data from the U.S. Census Bureau’s American Community Survey, median values of owner-occupied housing units for counties within Region V ranged from $63,100 in
Steele County to $93,400 in Richland County. Cass County’s median owner-occupied values were an outlier for the region at $147,900. Median gross rent for counties within the
region ranged from $385 per month in Steele County to $606 in Cass County. Median rental values in Cass County were nearly $100 more per month than the second largest amount for
the region ($514 in Ransom County).
Within Region V, more than half of owner-occupied housing units were valued at $125,000 or more in 2010 (57 percent). Cass County had the highest percentage of owner-occupied
housing in this category (66 percent) and Sargent County had the smallest percentage (19 percent).
The majority of renter-occupied housing units in Region V rented for $550 per month or more in 2010 (58 percent). This proportion is largely influenced by Cass County as the majority
of rental units in the other five counties rented for less than $550 in 2010.
Housing unit projections suggest that housing demand in Region V will increase by at least 18 percent for all income groups by 2025. Again, these numbers are largely influenced by Cass
County. Projections for Ransom, Richland, Sargent, Steele, and Traill counties all show decreases in housing demand for moderate- and upper-income households by 2025.

2012 NORTH DAKOTA STATEWIDE HOUSING NEEDS ASSESSMENT: HOUSING FORECAST PROFILES – LAKE AGASSIZ REGION V 72
TABLE 1. TOTAL POPULATION, 2000 to 2025
Area 2000 2010
Change: 2000 to
2010
Projections Change: 2010 to
2025 2015 2020 2025
Region V 162,127 185,481 14.4% 196,322 207,284 218,799 18.0%
Cass 123,138 149,778 21.6% 161,283 172,921 185,071 23.6%
Ransom 5,890 5,457 -7.4% 5,166 4,907 4,699 -13.9%
Richland 17,998 16,321 -9.3% 16,171 15,971 15,701 -3.8%
Sargent 4,366 3,829 -12.3% 3,794 3,763 3,733 -2.5%
Steele 2,258 1,975 -12.5% 1,824 1,689 1,595 -19.2%
Traill 8,477 8,121 -4.2% 8,084 8,033 8,000 -1.5%
Fargo 90,599 105,549 16.5% 113,539 121,494 130,065 23.2%
Wahpeton 8,586 7,766 -9.6% 7,767 7,699 7,576 -2.4%
West Fargo 14,940 25,830 72.9% 27,843 29,906 31,912 23.5%
TABLE 3. TOTAL HOUSING UNITS, 2000 to 2025 (Building Trends – Model 1)
Area 2000 2010
Change: 2000 to
2010
Projections – Model 1 Change: 2010 to
2025 2015 2020 2025
Region V 70,924 83,159 17.3% 91,529 97,645 103,759 24.8%
Cass 53,790 65,986 22.7% 74,595 80,889 87,182 32.1%
Ransom 2,604 2,676 2.8% 2,581 2,507 2,432 -9.1%
Richland 7,575 7,525 -0.7% 7,488 7,473 7,458 -0.9%
Sargent 2,016 2,017 0.0% 1,944 1,885 1,825 -9.5%
Steele 1,231 1,196 -2.8% 1,131 1,091 1,052 -12.0%
Traill 3,708 3,759 1.4% 3,790 3,800 3,810 1.4%
Fargo 41,277 48,924 18.5% 54,860 59,763 64,667 32.2%
Wahpeton 3,489 3,506 0.5% 3,477 3,473 3,468 -1.1%
West Fargo 5,854 9,991 70.7% 11,836 12,912 13,988 40.0%
TABLE 2. POPULATION BY AGE, 2010 and 2025
Area
Less Than 25 Years of Age Ages 25 to 44 Ages 45 to 64 65 Years and Older
2010 2025 Change: 2010
to 2025 2010 2025
Change: 2010 to 2025
2010 2025 Change: 2010
to 2025 2010 2025
Change: 2010 to 2025
Region V 68,438 77,939 13.9% 51,328 59,249 15.4% 44,968 45,522 1.2% 20,747 36,089 73.9%
Cass 56,882 67,102 18.0% 43,914 52,298 19.1% 34,432 37,380 8.6% 14,550 28,291 94.4%
Ransom 1,556 1,270 -18.4% 1,155 939 -18.7% 1,662 1,143 -31.2% 1,084 1,347 24.3%
Richland 5,812 5,775 -0.6% 3,370 3,101 -8.0% 4,715 3,936 -16.5% 2,424 2,889 19.2%
Sargent 1,065 916 -14.0% 804 816 1.5% 1,233 933 -24.3% 727 1,068 46.9%
Steele 512 445 -13.1% 389 343 -11.8% 633 435 -31.3% 441 372 -15.6%
Traill 2,611 2,431 -6.9% 1,696 1,752 3.3% 2,293 1,695 -26.1% 1,521 2,122 39.5%
Fargo 41,321 48,410 17.2% 30,608 36,287 18.6% 22,927 24,909 8.6% 10,693 20,459 91.3%
Wahpeton 3,297 3,368 2.2% 1,595 1,496 -6.2% 1,894 1,604 -15.3% 980 1,108 13.1%
West Fargo 9,345 11,182 19.7% 8,508 10,193 19.8% 5,961 6,466 8.5% 2,016 4,071 101.9%

2012 NORTH DAKOTA STATEWIDE HOUSING NEEDS ASSESSMENT: HOUSING FORECAST PROFILES – LAKE AGASSIZ REGION V 73
TABLE 4. TOTAL OCCUPIED HOUSING UNITS, 2000 to 2025
Area 2000 2010
Change: 2000 to
2010
Projections Change: 2010 to
2025 2015 2020 2025
Region V 66,600 77,798 16.8% 84,089 89,531 95,115 22.3%
Cass 51,315 62,916 22.6% 69,511 75,067 80,811 28.4%
Ransom 2,350 2,345 -0.2% 2,177 2,107 2,055 -12.4%
Richland 6,885 6,517 -5.3% 6,526 6,489 6,407 -1.7%
Sargent 1,786 1,770 -0.9% 1,672 1,712 1,726 -2.5%
Steele 923 825 -10.6% 800 742 699 -15.3%
Traill 3,341 3,425 2.5% 3,403 3,414 3,417 -0.2%
Fargo 39,351 46,681 18.6% 50,825 54,730 58,895 26.2%
Wahpeton 3,250 3,012 -7.3% 3,113 3,102 3,047 1.2%
West Fargo 5,658 9,595 69.6% 11,289 12,234 13,134 36.9%
TABLE 5. OCCUPIED HOUSING UNITS BY TENURE, 2010
Area
Total Occupied Housing Units
Owner-Occupied
Renter-Occupied
Number
Percent
Number
Percent
Region V 77,798 44,875 57.7% 32,923 42.3%
Cass 62,916 33,712 53.6% 29,204 46.4%
Ransom 2,345 1,752 74.7% 593 25.3%
Richland 6,517 4,800 73.7% 1,717 26.3%
Sargent 1,770 1,375 77.7% 395 22.3%
Steele 825 666 80.7% 159 19.3%
Traill 3,425 2,570 75.0% 855 25.0%
Fargo 46,681 21,007 45.0% 25,674 55.0%
Wahpeton 3,012 1,734 57.6% 1,278 42.4%
West Fargo 9,595 6,795 70.8% 2,800 29.2%
TABLE 6. VACANT HOUSING UNITS BY STATUS, 2010
Area
Total Vacant
Housing Units
For Rent
For Sale Only
Rented or Sold, Not Occupied
For Seasonal, Recreational, or
Occasional Use
For Migrant Workers
Other Vacant
Number
Percent
Number
Percent
Number
Percent
Number
Percent
Number
Percent
Number
Percent
Region V 5,361 2,021 37.7% 665 12.4% 517 9.6% 794 14.8% 17 0.3% 1,347 25.1%
Cass 3,070 1,417 46.2% 471 15.3% 396 12.9% 243 7.9% 0 0.0% 543 17.7%
Ransom 331 89 26.9% 55 16.6% 38 11.5% 64 19.3% 0 0.0% 85 25.7%
Richland 1,008 372 36.9% 113 11.2% 38 3.8% 138 13.7% 0 0.0% 347 34.4%
Sargent 247 31 12.6% 8 3.2% 22 8.9% 48 19.4% 0 0.0% 138 55.9%
Steele 371 17 4.6% 5 1.3% 8 2.2% 232 62.5% 0 0.0% 109 29.4%
Traill 334 95 28.4% 13 3.9% 15 4.5% 69 20.7% 17 5.1% 125 37.4%
Fargo 2,243 1,218 54.3% 251 11.2% 258 11.5% 162 7.2% 0 0.0% 354 15.8%
Wahpeton 494 291 58.9% 52 10.5% 0 0.0% 87 17.6% 0 0.0% 64 13.0%
West Fargo 396 153 38.6% 56 14.1% 115 29.0% 43 10.9% 0 0.0% 29 7.3%

2012 NORTH DAKOTA STATEWIDE HOUSING NEEDS ASSESSMENT: HOUSING FORECAST PROFILES – LAKE AGASSIZ REGION V 74
TABLE 7. SUBSTANDARD OCCUPIED HOUSING UNITS BY TENURE, 2010
Area
Owner-Occupied Housing Units
Renter-Occupied Housing Units
Total
Lacking Complete Plumbing Facilities
Lacking Complete Kitchen Facilities
Overcrowded: 1.01 or More Occupants Per Room
Total
Lacking Complete Plumbing Facilities
Lacking Complete Kitchen Facilities
Overcrowded: 1.01 or More Occupants Per Room
Number Percent Number Percent Number Percent Number Percent Number Percent Number Percent
Region V 44,875 79 0.2% 74 0.2% 234 0.5% 32,923 82 0.2% 707 2.1% 578 1.8%
Cass 33,712 53 0.2% 30 0.1% 189 0.6% 29,204 64 0.2% 658 2.3% 558 1.9%
Ransom 1,752 3 0.2% 8 0.5% 7 0.4% 593 14 2.4% 21 3.5% 9 1.5%
Richland 4,800 18 0.4% 28 0.6% 19 0.4% 1,717 4 0.2% 28 1.6% 11 0.6%
Sargent 1,375 3 0.2% 0 0.0% 4 0.3% 395 0 0.0% 0 0.0% 0 0.0%
Steele 666 2 0.3% 8 1.2% 0 0.0% 159 0 0.0% 0 0.0% 0 0.0%
Traill 2,570 0 0.0% 0 0.0% 15 0.6% 855 0 0.0% 0 0.0% 0 0.0%
Fargo 21,007 53 0.3% 24 0.1% 106 0.5% 25,674 43 0.2% 595 2.3% 433 1.7%
Wahpeton 1,734 0 0.0% 8 0.5% 9 0.5% 1,278 0 0.0% 15 1.2% 11 0.9%
West Fargo 6,795 0 0.0% 0 0.0% 34 0.5% 2,800 21 0.8% 63 2.3% 105 3.8%
TABLE 8. YEAR OCCUPIED HOUSING UNIT BUILT BY TENURE, 2010
Area
Owner-Occupied Housing Units Renter-Occupied Housing Units
Total
Built 1980 to Present Built 1940 to 1979 Built Prior to 1940
Total
Built 1980 to Present Built 1940 to 1979 Built Prior to 1940
Number Percent Number Percent Number Percent Number Percent Number Percent Number Percent
Region V 44,875 13,715 30.6% 16,686 37.2% 14,474 32.3% 32,923 11,989 36.4% 15,018 45.6% 5,916 18.0%
Cass 33,712 12,173 36.1% 12,818 38.0% 8,721 25.9% 29,204 11,314 38.7% 13,112 44.9% 4,778 16.4%
Ransom 1,752 258 14.7% 584 33.3% 910 51.9% 593 192 32.4% 200 33.7% 201 33.9%
Richland 4,800 771 16.1% 1,715 35.7% 2,314 48.2% 1,717 249 14.5% 1,021 59.5% 447 26.0%
Sargent 1,375 205 14.9% 540 39.3% 630 45.8% 395 76 19.2% 180 45.6% 139 35.2%
Steele 666 33 5.0% 210 31.5% 423 63.5% 159 3 1.9% 67 42.1% 89 56.0%
Traill 2,570 275 10.7% 819 31.9% 1,476 57.4% 855 155 18.1% 438 51.2% 262 30.6%
Fargo 21,007 6,745 32.1% 7,843 37.3% 6,419 30.6% 25,674 9,965 38.8% 11,511 44.8% 4,198 16.4%
Wahpeton 1,734 235 13.6% 746 43.0% 753 43.4% 1,278 131 10.3% 882 69.0% 265 20.7%
West Fargo 6,795 3,767 55.4% 2,446 36.0% 582 8.6% 2,800 1,280 45.7% 1,245 44.5% 275 9.8%

2012 NORTH DAKOTA STATEWIDE HOUSING NEEDS ASSESSMENT: HOUSING FORECAST PROFILES – LAKE AGASSIZ REGION V 75
FIGURE 1. MEDIAN VALUE OF ALL OWNER-OCCUPIED HOUSING UNITS, 2010
TABLE 9. VALUE OF ALL OWNER-OCCUPIED HOUSING UNITS, 2010
Area
Owner-Occupied Housing Units by Value
Total
Less Than $40,000 $40,000 to $69,999 $70,000 to $89,999 $90,000 to $124,999 $125,000 to $199,999 $200,000 or More
Number Percent Number Percent Number Percent Number Percent Number Percent Number Percent
Region V 44,875 3,725 8.3% 3,443 7.7% 3,771 8.4% 8,363 18.6% 15,536 34.6% 10,065 22.4%
Cass 33,712 1,769 5.2% 1,271 3.8% 2,057 6.1% 6,245 18.5% 13,515 40.1% 8,883 26.3%
Ransom 1,752 272 15.5% 366 20.9% 274 15.6% 334 19.1% 348 19.9% 158 9.0%
Richland 4,800 692 14.4% 881 18.4% 756 15.8% 854 17.8% 948 19.8% 669 13.9%
Sargent 1,375 400 29.1% 254 18.5% 178 12.9% 284 20.7% 147 10.7% 112 8.1%
Steele 666 201 30.2% 196 29.4% 64 9.6% 60 9.0% 91 13.7% 54 8.1%
Traill 2,570 391 15.2% 475 18.5% 442 17.2% 586 22.8% 487 18.9% 189 7.4%
Fargo 21,007 898 4.3% 666 3.2% 1,292 6.2% 4,218 20.1% 8,692 41.4% 5,241 24.9%
Wahpeton 1,734 143 8.2% 277 16.0% 345 19.9% 365 21.0% 457 26.4% 147 8.5%
West Fargo 6,795 417 6.1% 240 3.5% 334 4.9% 1,167 17.2% 3,171 46.7% 1,466 21.6%
$111,300 $111,627
$147,900
$87,200
$93,400
$74,600
$63,100
$89,000
$146,600
$101,700
$145,600
$0
$20,000
$40,000
$60,000
$80,000
$100,000
$120,000
$140,000
$160,000
North Dakota Region V Cass County Ransom County Richland County Sargent County Steele County Traill County Fargo city Wahpeton city West Fargo city

2012 NORTH DAKOTA STATEWIDE HOUSING NEEDS ASSESSMENT: HOUSING FORECAST PROFILES – LAKE AGASSIZ REGION V 76
FIGURE 2. MEDIAN GROSS RENT OF RENTER-OCCUPIED HOUSING UNITS PAYING CASH RENT, 2010
TABLE 10. GROSS RENT OF RENTER-OCCUPIED HOUSING UNITS PAYING CASH RENT, 2010
Area
Renter-Occupied Housing Units Paying Cash Rent by Monthly Gross Rent
Total
Less Than $250 $250 to $349 $350 to $449 $450 to $549 $550 to $749 $750 or More
Number Percent Number Percent Number Percent Number Percent Number Percent Number Percent
Region V 31,596 1,173 3.7% 1,734 5.5% 3,927 12.4% 6,336 20.1% 10,484 33.2% 7,942 25.1%
Cass 28,425 913 3.2% 1,203 4.2% 3,271 11.5% 5,569 19.6% 9,858 34.7% 7,611 26.8%
Ransom 482 38 7.9% 41 8.5% 114 23.7% 97 20.1% 132 27.4% 60 12.4%
Richland 1,578 106 6.7% 326 20.7% 336 21.3% 417 26.4% 280 17.7% 113 7.2%
Sargent 282 40 14.2% 54 19.1% 47 16.7% 56 19.9% 66 23.4% 19 6.7%
Steele 111 12 10.8% 31 27.9% 38 34.2% 28 25.2% 2 1.8% 0 0.0%
Traill 718 64 8.9% 79 11.0% 121 16.9% 169 23.5% 146 20.3% 139 19.4%
Fargo 25,188 748 3.0% 1,055 4.2% 2,856 11.3% 5,019 19.9% 8,823 35.0% 6,687 26.5%
Wahpeton 1,244 82 6.6% 276 22.2% 252 20.3% 363 29.2% 204 16.4% 67 5.4%
West Fargo 2,698 120 4.4% 102 3.8% 281 10.4% 444 16.5% 952 35.3% 799 29.6%
$555 $555
$606
$514
$454 $450
$385
$504
$606
$452
$626
$0
$100
$200
$300
$400
$500
$600
$700
North Dakota Region V Cass County Ransom County Richland County Sargent County Steele County Traill County Fargo city Wahpeton city West Fargo city

2012 NORTH DAKOTA STATEWIDE HOUSING NEEDS ASSESSMENT: HOUSING FORECAST PROFILES – LAKE AGASSIZ REGION V 77
TABLE 11. NUMBER OF HOUSEHOLDS BY INCOME LEVELS AS A PERCENT OF THE MEDIAN FAMILY INCOME (MFI), 2010 and 2025
Area
Extremely Low: 0-30% MFI (Less than $20,000 in 2010)
Very Low: 31-50% MFI ($20,000 to $29,999 in 2010)
Low Income: 51-80% MFI ($30,000 to $49,999 in 2010)
Moderate: 81-115% MFI ($50,000 to $74,999 in 2010)
Upper: Above 115% MFI ($75,000 or more in 2010)
Tax Credit: 51 to 60% MFI ($30,000 to $39,999 in 2010)
2010 2025 %
Change 2010 2025 %
Change 2010 2025 %
Change 2010 2025 %
Change 2010 2025 %
Change 2010 2025 %
Change
Region V 15,359 19,269 25.5% 8,954 11,293 26.1% 16,386 20,320 24.0% 15,133 18,314 21.0% 21,966 25,918 18.0% 8,972 11,144 24.2%
Cass 12,737 16,437 29.0% 7,145 9,465 32.5% 12,842 16,873 31.4% 12,121 15,569 28.4% 18,071 22,465 24.3% 7,092 9,314 31.3%
Ransom 444 472 6.3% 279 272 -2.5% 557 498 -10.6% 519 404 -22.2% 546 409 -25.1% 279 259 -7.2%
Richland 1,178 1,221 3.7% 797 794 -0.4% 1,462 1,461 -0.1% 1,204 1,167 -3.1% 1,876 1,764 -6.0% 770 779 1.2%
Sargent 300 338 12.7% 207 227 9.7% 387 397 2.6% 434 396 -8.8% 442 369 -16.5% 205 217 5.9%
Steele 89 82 -7.9% 146 123 -15.8% 226 187 -17.3% 151 130 -13.9% 213 178 -16.4% 120 99 -17.5%
Traill 611 719 17.7% 380 412 8.4% 912 904 -0.9% 704 648 -8.0% 818 733 -10.4% 506 476 -5.9%
Fargo 11,097 13,877 25.1% 5,836 7,467 27.9% 9,934 12,758 28.4% 8,261 10,570 28.0% 11,553 14,222 23.1% 5,632 7,207 28.0%
Wahpeton 735 777 5.7% 343 345 0.6% 653 667 2.1% 486 484 -0.4% 795 774 -2.6% 355 364 2.5%
West Fargo 1,164 1,841 58.2% 785 1,195 52.2% 1,858 2,627 41.4% 2,397 3,176 32.5% 3,391 4,295 26.7% 937 1,307 39.5%
TABLE 12. TOTAL HOUSING UNITS, 2000 to 2025 (Projected Demand – Model 2) TABLE 13. CHANGE IN RENTER-OCCUPIED HOUSING UNITS, 2010 to 2025
Area Renter-Occupied Housing Units,
2010
Change in Renter-Occupied Housing Units
2010 to 2015 2010 to 2020 2010 to 2025
3 Numeric % Numeric % Numeric %
Region V 32,923 2,980 9.1% 5,418 16.5% 8,080 24.5%
Cass 29,204 2,755 9.4% 5,175 17.7% 7,814 26.8%
Ransom 593 13 2.2% 1 0.2% -10 -1.7%
Richland 1,717 133 7.7% 150 8.7% 155 9.0%
Sargent 395 -15 -3.8% -2 -0.5% 3 0.8%
Steele 159 -10 -6.3% -19 -11.9% -24 -15.1%
Traill 855 104 12.2% 113 13.2% 142 16.6%
Fargo 25,674 1,645 6.4% 3,587 14.0% 5,759 22.4%
Wahpeton 1,278 157 12.3% 169 13.2% 162 12.7%
West Fargo 2,800 974 34.8% 1,309 46.8% 1,642 58.6%
Area 2000 2010
Change: 2000 to
2010
Projections – Model 2 Change: 2010 to
2025 2015 2020 2025
Region V 70,924 83,159 17.3% 91,346 97,670 104,272 25.4%
Cass 53,790 65,986 22.7% 74,338 80,711 87,335 32.4%
Ransom 2,604 2,676 2.8% 2,477 2,384 2,315 -13.5%
Richland 7,575 7,525 -0.7% 7,542 7,554 7,581 0.7%
Sargent 2,016 2,017 0.0% 2,004 1,999 1,997 -1.0%
Steele 1,231 1,196 -2.8% 1,193 1,215 1,233 3.1%
Traill 3,708 3,759 1.4% 3,792 3,807 3,811 1.4%
Fargo 41,277 48,924 18.5% 54,797 59,530 64,622 32.1%
Wahpeton 3,489 3,506 0.5% 3,478 3,477 3,471 -1.0%
West Fargo 5,854 9,991 70.7% 11,708 12,657 13,559 35.7%
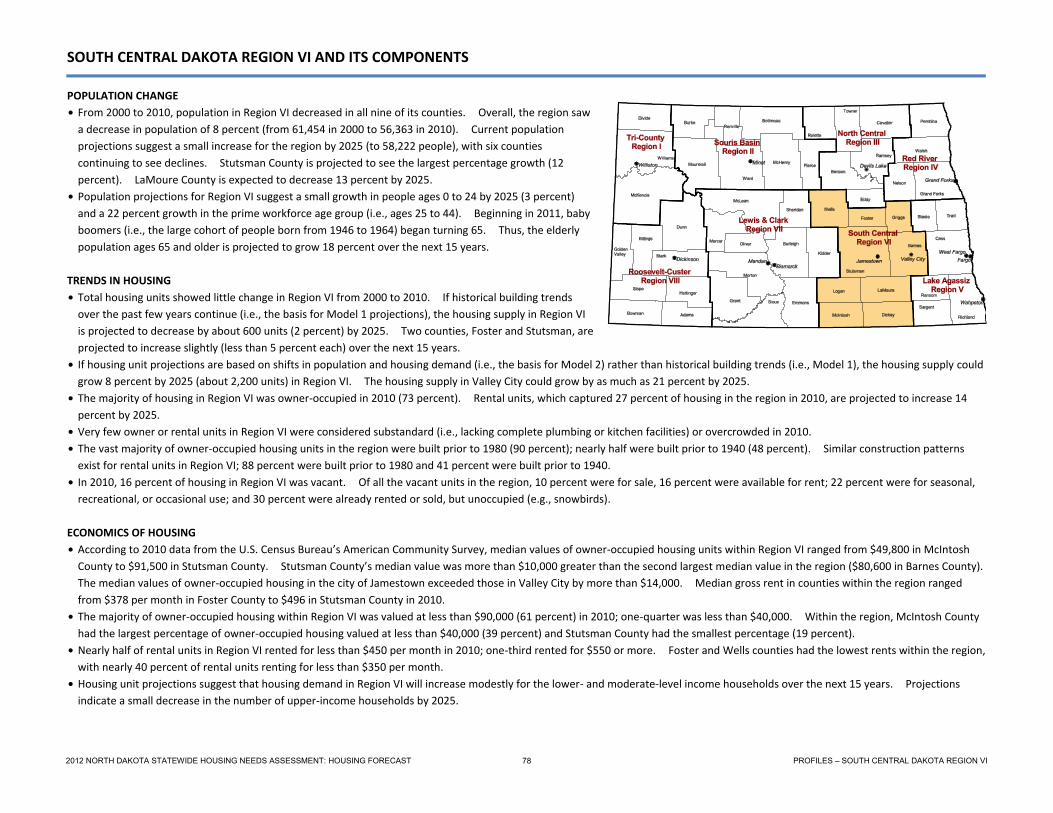
2012 NORTH DAKOTA STATEWIDE HOUSING NEEDS ASSESSMENT: HOUSING FORECAST PROFILES – SOUTH CENTRAL DAKOTA REGION VI 78
SOUTH CENTRAL DAKOTA REGION VI AND ITS COMPONENTS
POPULATION CHANGE
$ From 2000 to 2010, population in Region VI decreased in all nine of its counties. Overall, the region saw
a decrease in population of 8 percent (from 61,454 in 2000 to 56,363 in 2010). Current population
projections suggest a small increase for the region by 2025 (to 58,222 people), with six counties
continuing to see declines. Stutsman County is projected to see the largest percentage growth (12
percent). LaMoure County is expected to decrease 13 percent by 2025.
$ Population projections for Region VI suggest a small growth in people ages 0 to 24 by 2025 (3 percent)
and a 22 percent growth in the prime workforce age group (i.e., ages 25 to 44). Beginning in 2011, baby
boomers (i.e., the large cohort of people born from 1946 to 1964) began turning 65. Thus, the elderly
population ages 65 and older is projected to grow 18 percent over the next 15 years.
TRENDS IN HOUSING
$ Total housing units showed little change in Region VI from 2000 to 2010. If historical building trends
over the past few years continue (i.e., the basis for Model 1 projections), the housing supply in Region VI
is projected to decrease by about 600 units (2 percent) by 2025. Two counties, Foster and Stutsman, are
projected to increase slightly (less than 5 percent each) over the next 15 years.
$ If housing unit projections are based on shifts in population and housing demand (i.e., the basis for Model 2) rather than historical building trends (i.e., Model 1), the housing supply could
grow 8 percent by 2025 (about 2,200 units) in Region VI. The housing supply in Valley City could grow by as much as 21 percent by 2025.
$ The majority of housing in Region VI was owner-occupied in 2010 (73 percent). Rental units, which captured 27 percent of housing in the region in 2010, are projected to increase 14
percent by 2025.
$ Very few owner or rental units in Region VI were considered substandard (i.e., lacking complete plumbing or kitchen facilities) or overcrowded in 2010.
$ The vast majority of owner-occupied housing units in the region were built prior to 1980 (90 percent); nearly half were built prior to 1940 (48 percent). Similar construction patterns
exist for rental units in Region VI; 88 percent were built prior to 1980 and 41 percent were built prior to 1940.
$ In 2010, 16 percent of housing in Region VI was vacant. Of all the vacant units in the region, 10 percent were for sale, 16 percent were available for rent; 22 percent were for seasonal,
recreational, or occasional use; and 30 percent were already rented or sold, but unoccupied (e.g., snowbirds).
ECONOMICS OF HOUSING
$ According to 2010 data from the U.S. Census Bureau’s American Community Survey, median values of owner-occupied housing units within Region VI ranged from $49,800 in McIntosh
County to $91,500 in Stutsman County. Stutsman County’s median value was more than $10,000 greater than the second largest median value in the region ($80,600 in Barnes County).
The median values of owner-occupied housing in the city of Jamestown exceeded those in Valley City by more than $14,000. Median gross rent in counties within the region ranged
from $378 per month in Foster County to $496 in Stutsman County in 2010.
$ The majority of owner-occupied housing within Region VI was valued at less than $90,000 (61 percent) in 2010; one-quarter was less than $40,000. Within the region, McIntosh County
had the largest percentage of owner-occupied housing valued at less than $40,000 (39 percent) and Stutsman County had the smallest percentage (19 percent).
$ Nearly half of rental units in Region VI rented for less than $450 per month in 2010; one-third rented for $550 or more. Foster and Wells counties had the lowest rents within the region,
with nearly 40 percent of rental units renting for less than $350 per month.
$ Housing unit projections suggest that housing demand in Region VI will increase modestly for the lower- and moderate-level income households over the next 15 years. Projections
indicate a small decrease in the number of upper-income households by 2025.

2012 NORTH DAKOTA STATEWIDE HOUSING NEEDS ASSESSMENT: HOUSING FORECAST PROFILES – SOUTH CENTRAL DAKOTA REGION VI 79
TABLE 1. TOTAL POPULATION, 2000 to 2025
Area 2000 2010
Change: 2000 to
2010
Projections Change: 2010 to
2025 2015 2020 2025
Region VI 61,454 56,363 -8.3% 56,813 57,349 58,222 3.3%
Barnes 11,775 11,066 -6.0% 11,372 11,574 11,743 6.1%
Dickey 5,757 5,289 -8.1% 5,315 5,313 5,296 0.1%
Foster 3,759 3,343 -11.1% 3,153 3,018 2,974 -11.0%
Griggs 2,754 2,420 -12.1% 2,393 2,352 2,314 -4.4%
LaMoure 4,701 4,139 -12.0% 3,926 3,771 3,620 -12.5%
Logan 2,308 1,990 -13.8% 1,884 1,861 1,886 -5.2%
McIntosh 3,390 2,809 -17.1% 2,767 2,766 2,747 -2.2%
Stutsman 21,908 21,100 -3.7% 21,861 22,623 23,598 11.8%
Wells 5,102 4,207 -17.5% 4,142 4,071 4,044 -3.9%
Jamestown 15,527 15,427 -0.6% 15,992 16,512 17,224 11.6%
Valley City 6,826 6,585 -3.5% 6,772 6,882 6,994 6.2%
TABLE 3. TOTAL HOUSING UNITS, 2000 to 2025 (Building Trends – Model 1)
Area 2000 2010
Change: 2000 to
2010
Projections – Model 1 Change: 2010 to
2025 2015 2020 2025
Region VI 29,346 29,194 -0.5% 28,981 28,780 28,577 -2.1%
Barnes 5,599 5,694 1.7% 5,619 5,534 5,450 -4.3%
Dickey 2,656 2,650 -0.2% 2,601 2,566 2,531 -4.5%
Foster 1,793 1,837 2.5% 1,826 1,851 1,876 2.1%
Griggs 1,521 1,463 -3.8% 1,411 1,362 1,312 -10.3%
LaMoure 2,271 2,252 -0.8% 2,203 2,168 2,133 -5.3%
Logan 1,193 1,075 -9.9% 1,104 1,065 1,025 -4.7%
McIntosh 1,853 1,931 4.2% 1,833 1,808 1,783 -7.7%
Stutsman 9,817 9,827 0.1% 10,012 10,163 10,313 4.9%
Wells 2,643 2,465 -6.7% 2,372 2,263 2,154 -12.6%
Jamestown 6,972 7,026 0.8% 6,991 6,999 7,007 -0.3%
Valley City 3,245 3,273 0.9% 3,337 3,368 3,398 3.8%
TABLE 2. POPULATION BY AGE, 2010 and 2025
Area
Less Than 25 Years of Age Ages 25 to 44 Ages 45 to 64 65 Years and Older
2010 2025 Change: 2010
to 2025 2010 2025
Change: 2010 to 2025
2010 2025 Change: 2010
to 2025 2010 2025
Change: 2010 to 2025
Region VI 16,117 16,646 3.3% 11,503 14,020 21.9% 16,636 13,300 -20.1% 12,107 14,256 17.8%
Barnes 3,363 3,310 -1.6% 2,252 2,626 16.6% 3,281 2,896 -11.7% 2,170 2,911 34.1%
Dickey 1,673 1,583 -5.4% 1,082 1,061 -1.9% 1,364 1,191 -12.7% 1,170 1,461 24.9%
Foster 930 726 -21.9% 667 876 31.3% 988 562 -43.1% 758 810 6.9%
Griggs 556 480 -13.7% 418 343 -17.9% 809 628 -22.4% 637 863 35.5%
LaMoure 1,065 951 -10.7% 752 705 -6.3% 1,300 837 -35.6% 1,022 1,127 10.3%
Logan 509 509 0.0% 337 526 56.1% 587 480 -18.2% 557 371 -33.4%
McIntosh 614 758 23.5% 470 627 33.4% 771 446 -42.2% 954 916 -4.0%
Stutsman 6,458 7,201 11.5% 4,816 6,386 32.6% 6,208 5,389 -13.2% 3,618 4,622 27.8%
Wells 949 1,128 18.9% 709 870 22.7% 1,328 871 -34.4% 1,221 1,175 -3.8%
Jamestown 4,905 5,423 10.6% 3,677 4,870 32.4% 4,175 3,638 -12.9% 2,670 3,293 23.3%
Valley City 2,104 2,052 -2.5% 1,387 1,604 15.6% 1,647 1,458 -11.5% 1,447 1,880 29.9%

2012 NORTH DAKOTA STATEWIDE HOUSING NEEDS ASSESSMENT: HOUSING FORECAST PROFILES – SOUTH CENTRAL DAKOTA REGION VI 80
TABLE 4. TOTAL OCCUPIED HOUSING UNITS, 2000 to 2025
Area 2000 2010
Change: 2000 to
2010
Projections Change: 2010 to
2025 2015 2020 2025
Region VI 25,426 24,408 -4.0% 24,577 24,914 25,373 4.0%
Barnes 4,884 4,830 -1.1% 4,991 5,138 5,279 9.3%
Dickey 2,283 2,167 -5.1% 2,196 2,243 2,249 3.8%
Foster 1,540 1,506 -2.2% 1,426 1,387 1,373 -8.8%
Griggs 1,178 1,099 -6.7% 1,126 1,132 1,142 3.9%
LaMoure 1,942 1,962 1.0% 1,696 1,655 1,621 -17.4%
Logan 963 815 -15.4% 774 755 775 -4.9%
McIntosh 1,467 1,337 -8.9% 1,241 1,223 1,209 -9.6%
Stutsman 8,954 8,633 -3.6% 9,284 9,595 9,967 15.5%
Wells 2,215 2,059 -7.0% 1,843 1,786 1,758 -14.6%
Jamestown 6,498 6,315 -2.8% 6,803 7,013 7,278 15.2%
Valley City 2,989 2,989 0.0% 3,086 3,174 3,268 9.3%
TABLE 5. OCCUPIED HOUSING UNITS BY TENURE, 2010
Area
Total Occupied Housing Units
Owner-Occupied
Renter-Occupied
Number
Percent
Number
Percent
Region VI 24,408 17,806 73.0% 6,602 27.0%
Barnes 4,830 3,290 68.1% 1,540 31.9%
Dickey 2,167 1,579 72.9% 588 27.1%
Foster 1,506 1,142 75.8% 364 24.2%
Griggs 1,099 868 79.0% 231 21.0%
LaMoure 1,962 1,640 83.6% 322 16.4%
Logan 815 675 82.8% 140 17.2%
McIntosh 1,337 1,113 83.2% 224 16.8%
Stutsman 8,633 5,933 68.7% 2,700 31.3%
Wells 2,059 1,566 76.1% 493 23.9%
Jamestown 6,315 3,890 61.6% 2,425 38.4%
Valley City 2,989 1,662 55.6% 1,327 44.4%
TABLE 6. VACANT HOUSING UNITS BY STATUS, 2010
Area
Total Vacant
Housing Units
For Rent
For Sale Only
Rented or Sold, Not Occupied
For Seasonal, Recreational, or
Occasional Use
For Migrant Workers
Other Vacant
Number
Percent
Number
Percent
Number
Percent
Number
Percent
Number
Percent
Number
Percent
Region VI 4,786 742 15.5% 459 9.6% 1,425 29.8% 1,050 21.9% 49 1.0% 1,061 22.2%
Barnes 864 211 24.4% 96 11.1% 7 0.8% 284 32.9% 0 0.0% 266 30.8%
Dickey 483 32 6.6% 31 6.4% 282 58.4% 74 15.3% 16 3.3% 48 9.9%
Foster 331 56 16.9% 50 15.1% 7 2.1% 112 33.8% 0 0.0% 106 32.0%
Griggs 364 15 4.1% 51 14.0% 2 0.5% 186 51.1% 0 0.0% 110 30.2%
LaMoure 290 46 15.9% 0 0.0% 196 67.6% 14 4.8% 13 4.5% 21 7.2%
Logan 260 20 7.7% 14 5.4% 7 2.7% 166 63.8% 0 0.0% 53 20.4%
McIntosh 594 30 5.1% 46 7.7% 369 62.1% 126 21.2% 0 0.0% 23 3.9%
Stutsman 1,194 260 21.8% 136 11.4% 551 46.1% 48 4.0% 20 1.7% 179 15.0%
Wells 406 72 17.7% 35 8.6% 4 1.0% 40 9.9% 0 0.0% 255 62.8%
Jamestown 711 240 33.8% 126 17.7% 224 31.5% 19 2.7% 0 0.0% 102 14.3%
Valley City 284 177 62.3% 62 21.8% 0 0.0% 0 0.0% 0 0.0% 45 15.8%

2012 NORTH DAKOTA STATEWIDE HOUSING NEEDS ASSESSMENT: HOUSING FORECAST PROFILES – SOUTH CENTRAL DAKOTA REGION VI 81
TABLE 7. SUBSTANDARD OCCUPIED HOUSING UNITS BY TENURE, 2010
Area
Owner-Occupied Housing Units
Renter-Occupied Housing Units
Total
Lacking Complete Plumbing Facilities
Lacking Complete Kitchen Facilities
Overcrowded: 1.01 or More Occupants Per Room
Total
Lacking Complete Plumbing Facilities
Lacking Complete Kitchen Facilities
Overcrowded: 1.01 or More Occupants Per Room
Number Percent Number Percent Number Percent Number Percent Number Percent Number Percent
Region VI 17,806 61 0.3% 34 0.2% 66 0.4% 6,602 48 0.7% 109 1.7% 55 0.8%
Barnes 3,290 14 0.4% 0 0.0% 9 0.3% 1,540 22 1.4% 51 3.3% 14 0.9%
Dickey 1,579 0 0.0% 8 0.5% 11 0.7% 588 0 0.0% 0 0.0% 10 1.7%
Foster 1,142 1 0.1% 1 0.1% 0 0.0% 364 6 1.6% 6 1.6% 0 0.0%
Griggs 868 7 0.8% 7 0.8% 0 0.0% 231 0 0.0% 0 0.0% 0 0.0%
LaMoure 1,640 3 0.2% 3 0.2% 11 0.7% 322 0 0.0% 6 1.9% 6 1.9%
Logan 675 2 0.3% 0 0.0% 2 0.3% 140 0 0.0% 0 0.0% 0 0.0%
McIntosh 1,113 0 0.0% 0 0.0% 6 0.5% 224 3 1.3% 4 1.8% 0 0.0%
Stutsman 5,933 20 0.3% 7 0.1% 9 0.2% 2,700 14 0.5% 42 1.6% 25 0.9%
Wells 1,566 14 0.9% 8 0.5% 18 1.1% 493 3 0.6% 0 0.0% 0 0.0%
Jamestown 3,890 0 0.0% 0 0.0% 0 0.0% 2,425 14 0.6% 40 1.6% 0 0.0%
Valley City 1,662 9 0.5% 0 0.0% 0 0.0% 1,327 22 1.7% 51 3.8% 11 0.8%
TABLE 8. YEAR OCCUPIED HOUSING UNIT BUILT BY TENURE, 2010
Area
Owner-Occupied Housing Units Renter-Occupied Housing Units
Total
Built 1980 to Present Built 1940 to 1979 Built Prior to 1940
Total
Built 1980 to Present Built 1940 to 1979 Built Prior to 1940
Number Percent Number Percent Number Percent Number Percent Number Percent Number Percent
Region VI 17,806 1,785 10.0% 7,565 42.5% 8,456 47.5% 6,602 799 12.1% 3,089 46.8% 2,714 41.1%
Barnes 3,290 299 9.1% 1,242 37.8% 1,749 53.2% 1,540 272 17.7% 629 40.8% 639 41.5%
Dickey 1,579 189 12.0% 711 45.0% 679 43.0% 588 118 20.1% 299 50.9% 171 29.1%
Foster 1,142 101 8.8% 550 48.2% 491 43.0% 364 0 0.0% 258 70.9% 106 29.1%
Griggs 868 63 7.3% 265 30.5% 540 62.2% 231 13 5.6% 92 39.8% 126 54.5%
LaMoure 1,640 195 11.9% 719 43.8% 726 44.3% 322 32 9.9% 150 46.6% 140 43.5%
Logan 675 82 12.1% 298 44.1% 295 43.7% 140 21 15.0% 61 43.6% 58 41.4%
McIntosh 1,113 70 6.3% 451 40.5% 592 53.2% 224 2 0.9% 98 43.8% 124 55.4%
Stutsman 5,933 692 11.7% 2,622 44.2% 2,619 44.1% 2,700 304 11.3% 1,238 45.9% 1,158 42.9%
Wells 1,566 94 6.0% 707 45.1% 765 48.9% 493 37 7.5% 264 53.5% 192 38.9%
Jamestown 3,890 331 8.5% 1,801 46.3% 1,758 45.2% 2,425 273 11.3% 1,146 47.3% 1,006 41.5%
Valley City 1,662 119 7.2% 632 38.0% 911 54.8% 1,327 268 20.2% 582 43.9% 477 35.9%

2012 NORTH DAKOTA STATEWIDE HOUSING NEEDS ASSESSMENT: HOUSING FORECAST PROFILES – SOUTH CENTRAL DAKOTA REGION VI 82
FIGURE 1. MEDIAN VALUE OF ALL OWNER-OCCUPIED HOUSING UNITS, 2010
TABLE 9. VALUE OF ALL OWNER-OCCUPIED HOUSING UNITS, 2010
Area
Owner-Occupied Housing Units by Value
Total
Less Than $40,000 $40,000 to $69,999 $70,000 to $89,999 $90,000 to $124,999 $125,000 to $199,999 $200,000 or More
Number Percent Number Percent Number Percent Number Percent Number Percent Number Percent
Region VI 17,806 4,539 25.5% 3,744 21.0% 2,586 14.5% 2,886 16.2% 2,551 14.3% 1,500 8.4%
Barnes 3,290 681 20.7% 662 20.1% 601 18.3% 459 14.0% 563 17.1% 324 9.8%
Dickey 1,579 514 32.6% 357 22.6% 225 14.2% 184 11.7% 209 13.2% 90 5.7%
Foster 1,142 260 22.8% 236 20.7% 193 16.9% 246 21.5% 127 11.1% 80 7.0%
Griggs 868 303 34.9% 212 24.4% 132 15.2% 103 11.9% 71 8.2% 47 5.4%
LaMoure 1,640 475 29.0% 402 24.5% 229 14.0% 196 12.0% 163 9.9% 175 10.7%
Logan 675 235 34.8% 182 27.0% 86 12.7% 76 11.3% 39 5.8% 57 8.4%
McIntosh 1,113 435 39.1% 273 24.5% 127 11.4% 105 9.4% 66 5.9% 107 9.6%
Stutsman 5,933 1,098 18.5% 1,016 17.1% 787 13.3% 1,302 21.9% 1,188 20.0% 542 9.1%
Wells 1,566 538 34.4% 404 25.8% 206 13.2% 215 13.7% 125 8.0% 78 5.0%
Jamestown 3,890 527 13.5% 667 17.1% 540 13.9% 965 24.8% 936 24.1% 255 6.6%
Valley City 1,662 289 17.4% 345 20.8% 344 20.7% 282 17.0% 296 17.8% 106 6.4%
$111,300
$76,899 $80,600
$61,600
$76,500
$61,200 $63,400
$55,500
$49,800
$91,500
$55,700
$96,300
$82,200
$0
$20,000
$40,000
$60,000
$80,000
$100,000
$120,000
North Dakota Region VI Barnes County Dickey County Foster County Griggs County LaMoure County Logan County McIntosh County Stutsman County Wells County Jamestown city Valley City city

2012 NORTH DAKOTA STATEWIDE HOUSING NEEDS ASSESSMENT: HOUSING FORECAST PROFILES – SOUTH CENTRAL DAKOTA REGION VI 83
FIGURE 2. MEDIAN GROSS RENT OF RENTER-OCCUPIED HOUSING UNITS PAYING CASH RENT, 2010
TABLE 10. GROSS RENT OF RENTER-OCCUPIED HOUSING UNITS PAYING CASH RENT, 2010
Area
Renter-Occupied Housing Units Paying Cash Rent by Monthly Gross Rent
Total
Less Than $250 $250 to $349 $350 to $449 $450 to $549 $550 to $749 $750 or More
Number Percent Number Percent Number Percent Number Percent Number Percent Number Percent
Region VI 5,812 889 15.3% 720 12.4% 1,131 19.5% 1,090 18.8% 1,347 23.2% 635 10.9%
Barnes 1,406 273 19.4% 193 13.7% 195 13.9% 295 21.0% 288 20.5% 162 11.5%
Dickey 511 103 20.2% 31 6.1% 95 18.6% 178 34.8% 75 14.7% 29 5.7%
Foster 304 51 16.8% 69 22.7% 92 30.3% 75 24.7% 14 4.6% 3 1.0%
Griggs 186 24 12.9% 41 22.0% 36 19.4% 22 11.8% 36 19.4% 27 14.5%
LaMoure 270 16 5.9% 67 24.8% 61 22.6% 48 17.8% 42 15.6% 36 13.3%
Logan 92 14 15.2% 8 8.7% 23 25.0% 15 16.3% 25 27.2% 7 7.6%
McIntosh 182 25 13.7% 21 11.5% 38 20.9% 29 15.9% 61 33.5% 8 4.4%
Stutsman 2,522 298 11.8% 250 9.9% 481 19.1% 411 16.3% 764 30.3% 318 12.6%
Wells 339 85 25.1% 40 11.8% 110 32.4% 17 5.0% 42 12.4% 45 13.3%
Jamestown 2,319 278 12.0% 211 9.1% 435 18.8% 391 16.9% 741 32.0% 263 11.3%
Valley City 1,291 266 20.6% 173 13.4% 185 14.3% 257 19.9% 277 21.5% 133 10.3%
$555
$466 $466 $462
$378
$432 $438 $454
$465
$496
$381
$500
$459
$0
$100
$200
$300
$400
$500
$600
North Dakota Region VI Barnes County Dickey County Foster County Griggs County LaMoure County Logan County McIntosh County Stutsman County Wells County Jamestown city Valley City city

2012 NORTH DAKOTA STATEWIDE HOUSING NEEDS ASSESSMENT: HOUSING FORECAST PROFILES – SOUTH CENTRAL DAKOTA REGION VI 84
TABLE 11. NUMBER OF HOUSEHOLDS BY INCOME LEVELS AS A PERCENT OF THE MEDIAN FAMILY INCOME (MFI), 2010 and 2025
Area
Extremely Low: 0-30% MFI (Less than $20,000 in 2010)
Very Low: 31-50% MFI ($20,000 to $29,999 in 2010)
Low Income: 51-80% MFI ($30,000 to $49,999 in 2010)
Moderate: 81-115% MFI ($50,000 to $74,999 in 2010)
Upper: Above 115% MFI ($75,000 or more in 2010)
Tax Credit: 51 to 60% MFI ($30,000 to $39,999 in 2010)
2010 2025 %
Change 2010 2025 %
Change 2010 2025 %
Change 2010 2025 %
Change 2010 2025 %
Change 2010 2025 %
Change
Region VI 5,548 5,994 8.0% 3,073 3,297 7.3% 5,463 5,693 4.2% 4,955 5,096 2.8% 5,369 5,295 -1.4% 2,930 3,086 5.3%
Barnes 1,034 1,178 13.9% 506 585 15.6% 1,174 1,290 9.9% 1,099 1,183 7.6% 1,017 1,044 2.7% 736 817 11.0%
Dickey 595 677 13.8% 259 273 5.4% 477 490 2.7% 386 382 -1.0% 450 428 -4.9% 290 312 7.6%
Foster 362 337 -6.9% 199 164 -17.6% 339 327 -3.5% 268 242 -9.7% 338 303 -10.4% 166 161 -3.0%
Griggs 235 279 18.7% 141 159 12.8% 310 312 0.6% 245 237 -3.3% 168 154 -8.3% 172 174 1.2%
LaMoure 412 385 -6.6% 251 220 -12.4% 416 339 -18.5% 400 309 -22.8% 483 369 -23.6% 220 176 -20.0%
Logan 194 162 -16.5% 93 87 -6.5% 203 196 -3.4% 157 158 0.6% 168 170 1.2% 101 92 -8.9%
McIntosh 388 370 -4.6% 199 172 -13.6% 270 249 -7.8% 236 220 -6.8% 244 198 -18.9% 142 134 -5.6%
Stutsman 1,729 2,092 21.0% 1,225 1,466 19.7% 1,813 2,087 15.1% 1,747 1,997 14.3% 2,119 2,326 9.8% 878 1,030 17.3%
Wells 599 514 -14.2% 200 171 -14.5% 461 403 -12.6% 417 368 -11.8% 382 303 -20.7% 225 190 -15.6%
Jamestown 1,381 1,660 20.2% 924 1,108 19.9% 1,312 1,498 14.2% 1,245 1,423 14.3% 1,453 1,590 9.4% 632 733 16.0%
Valley City 781 856 9.6% 345 393 13.9% 754 825 9.4% 664 723 8.9% 445 469 5.4% 499 555 11.2%
TABLE 12. TOTAL HOUSING UNITS, 2000 to 2025 (Projected Demand – Model 2) TABLE 13. CHANGE IN RENTER-OCCUPIED HOUSING UNITS, 2010 to 2025
Area Renter-Occupied Housing Units,
2010
Change in Renter-Occupied Housing Units
2010 to 2015 2010 to 2020 2010 to 2025
3 Numeric % Numeric % Numeric %
Region VI 6,602 426 6.5% 639 9.7% 907 13.7%
Barnes 1,540 6 0.4% 61 4.0% 122 7.9%
Dickey 588 38 6.5% 50 8.5% 52 8.8%
Foster 364 11 3.0% 6 1.6% 12 3.3%
Griggs 231 37 16.0% 41 17.7% 44 19.0%
LaMoure 322 2 0.6% 1 0.3% 2 0.6%
Logan 140 -9 -6.4% -11 -7.9% -5 -3.6%
McIntosh 224 40 17.9% 46 20.5% 55 24.6%
Stutsman 2,700 396 14.7% 536 19.9% 707 26.2%
Wells 493 -95 -19.3% -91 -18.5% -82 -16.6%
Jamestown 2,425 370 15.3% 479 19.8% 621 25.6%
Valley City 1,327 -15 -1.1% 22 1.7% 69 5.2%
Area 2000 2010
Change: 2000 to
2010
Projections – Model 2 Change: 2010 to
2025 2015 2020 2025
Region VI 29,346 29,194 -0.5% 30,030 30,705 31,398 7.5%
Barnes 5,599 5,694 1.7% 6,012 6,292 6,565 15.3%
Dickey 2,656 2,650 -0.2% 2,633 2,624 2,623 -1.0%
Foster 1,793 1,837 2.5% 1,814 1,822 1,825 -0.7%
Griggs 1,521 1,463 -3.8% 1,467 1,459 1,446 -1.2%
LaMoure 2,271 2,252 -0.8% 2,276 2,289 2,300 2.1%
Logan 1,193 1,075 -9.9% 1,175 1,185 1,175 9.3%
McIntosh 1,853 1,931 4.2% 1,856 1,855 1,854 -4.0%
Stutsman 9,817 9,827 0.1% 10,252 10,595 11,006 12.0%
Wells 2,643 2,465 -6.7% 2,545 2,584 2,604 5.6%
Jamestown 6,972 7,026 0.8% 7,108 7,218 7,354 4.7%
Valley City 3,245 3,273 0.9% 3,529 3,730 3,951 20.7%

2012 NORTH DAKOTA STATEWIDE HOUSING NEEDS ASSESSMENT: HOUSING FORECAST PROFILES – LEWIS AND CLARK REGION VII 85
LEWIS AND CLARK REGION VII AND ITS COMPONENTS
POPULATION CHANGE
The population for Region VII increased 9 percent from 130,418 in 2000 to 141,864 in 2010. However,
this masks an uneven pattern of gains and losses county by county. Seven of the 10 counties in the
region decreased in population; Sheridan County decreased by 23 percent. Burleigh, Morton, and Sioux
counties increased in population; Burleigh County had the largest growth at 17 percent.
Projections for Region VII indicate a potential growth of 28,000 people, reaching 169,993 by 2025 (a 20
percent growth). Beginning in 2011, baby boomers (i.e., the large cohort of people born from 1946 to
1964) began turning 65. Thus, over the next 15 years, the number of people ages 65 and older is
expected to increase by 52 percent, as the number of 45- to 64-year-olds decreases 9 percent in Region
VII. Youth (ages 0 to 24) and the prime workforce (ages 25 to 44) are projected to increase by 21
percent and 33 percent, respectively.
TRENDS IN HOUSING
Total housing units increased 12 percent in Region VII from 2000 to 2010. If historical building trends
continue (i.e., the basis for Model 1 projections), projections indicate an increase of 20 percent by 2025 in
the region (approximately 13,000 units). The city of Bismarck is expected to show the largest growth in the region at 34 percent by 2025.
If housing unit projections are based on shifts in population and housing demand (i.e., the basis for Model 2) rather than historical building trends (i.e., Model 1), housing supply could
grow by 24 percent (a growth of more than 15,000 units by 2025). Emmons and Kidder counties could potentially see a decrease in housing supply over the next 15 years.
The majority of housing in Region VII was owner-occupied in 2010 (74 percent). Rental units, which captured only 26 percent of housing in the region, are projected to increase by
approximately 5,600 units by 2025 (a growth of 37 percent).
With the exception of Sioux County, there was little evidence of owner- or renter-occupied housing that was overcrowded or lacked complete plumbing or kitchen facilities in 2010.
Within Sioux County, overcrowding was reported in 10 percent of owner-occupied housing and in 17 percent of renter-occupied housing.
The majority of owner-occupied housing units in the region were built prior to 1980 (73 percent); one-quarter were built prior to 1940. Similar construction exists for rental units in
Region VII; 80 percent were built prior to 1980 and 24 percent were built prior to 1940.
Increased demand for housing will likely further reduce already low vacancy rates in parts of the region.
ECONOMICS OF HOUSING
According to 2010 data from the U.S. Census Bureau’s American Community Survey, median values of owner-occupied housing units for counties in Region VII ranged from $48,700 in
Sheridan County to $152,900 in Burleigh County. Burleigh County’s median values were more than $42,000 higher than the second highest median value in the region ($110,800 in
Morton County). Median gross rent for counties within the region ranged from $325 per month in Sheridan County to $569 in Burleigh County.
The majority of owner-occupied housing in Region VII was valued at $90,000 or more (68 percent) in 2010; half of the units were valued at $125,000 or more. Within the city of
Bismarck, 63 percent was $125,000 or more.
Nearly half of rental units in Region VII rented for at least $550 per month; 15 percent were at least $750.
Projections indicate an increase of households within each income category for Region VII by 2025. The extremely low- and very low-income household categories are projected to see
the greatest percentage increases (32 percent and 30 percent, respectively). While several counties are projected to decrease in the number of households in the moderate- and
upper-income categories, the regional increases in these income levels are driven by increases in Burleigh, Morton, and Sioux counties. Grant, Kidder, and Sheridan counties are
expected to see a loss of households in all income levels.

2012 NORTH DAKOTA STATEWIDE HOUSING NEEDS ASSESSMENT: HOUSING FORECAST PROFILES – LEWIS AND CLARK REGION VII 86
TABLE 1. TOTAL POPULATION, 2000 to 2025
Area 2000 2010
Change: 2000 to
2010
Projections Change: 2010 to
2025 2015 2020 2025
Region VII 130,418 141,864 8.8% 151,192 160,356 169,993 19.8%
Burleigh 69,416 81,308 17.1% 88,543 96,055 104,154 28.1%
Emmons 4,331 3,550 -18.0% 3,606 3,575 3,593 1.2%
Grant 2,841 2,394 -15.7% 2,291 2,192 2,133 -10.9%
Kidder 2,753 2,435 -11.6% 2,389 2,319 2,246 -7.8%
McLean 9,311 8,962 -3.7% 9,158 9,277 9,237 3.1%
Mercer 8,644 8,424 -2.5% 8,684 8,817 8,927 6.0%
Morton 25,303 27,471 8.6% 29,048 30,498 31,976 16.4%
Oliver 2,065 1,846 -10.6% 1,803 1,747 1,699 -8.0%
Sheridan 1,710 1,321 -22.7% 1,255 1,183 1,091 -17.4%
Sioux 4,044 4,153 2.7% 4,415 4,693 4,937 18.9%
Bismarck 55,532 61,272 10.3% 66,849 72,556 78,731 28.5%
Mandan 16,718 18,331 9.6% 19,390 20,348 21,310 16.3%
TABLE 3. TOTAL HOUSING UNITS, 2000 to 2025 (Building Trends – Model 1)
Area 2000 2010
Change: 2000 to
2010
Projections – Model 1 Change: 2010 to
2025 2015 2020 2025
Region VII 57,799 64,960 12.4% 70,348 74,278 78,208 20.4%
Burleigh 29,003 34,557 19.1% 39,077 42,412 45,747 32.4%
Emmons 2,168 2,099 -3.2% 2,020 1,956 1,891 -9.9%
Grant 1,722 1,721 -0.1% 1,650 1,610 1,571 -8.7%
Kidder 1,610 1,678 4.2% 1,689 1,704 1,719 2.4%
McLean 5,264 5,528 5.0% 5,776 5,962 6,148 11.2%
Mercer 4,402 4,435 0.7% 4,540 4,631 4,721 6.4%
Morton 10,587 11,829 11.7% 12,446 12,813 13,180 11.4%
Oliver 903 887 -1.8% 915 925 935 5.4%
Sheridan 924 919 -0.5% 884 874 864 -6.0%
Sioux 1,216 1,307 7.5% 1,351 1,391 1,432 9.6%
Bismarck 24,162 27,945 15.7% 31,605 34,562 37,519 34.3%
Mandan 6,952 7,973 14.7% 8,492 9,034 9,576 20.1%
TABLE 2. POPULATION BY AGE, 2010 and 2025
Area
Less Than 25 Years of Age Ages 25 to 44 Ages 45 to 64 65 Years and Older
2010 2025 Change: 2010
to 2025 2010 2025
Change: 2010 to 2025
2010 2025 Change: 2010
to 2025 2010 2025
Change: 2010 to 2025
Region VII 44,867 54,047 20.5% 35,015 46,430 32.6% 40,662 37,211 -8.5% 21,320 32,305 51.5%
Burleigh 26,875 33,126 23.3% 21,439 30,212 40.9% 22,081 22,408 1.5% 10,913 18,408 68.7%
Emmons 912 1,055 15.7% 556 774 39.2% 1,111 834 -24.9% 971 930 -4.2%
Grant 551 596 8.2% 397 437 10.1% 801 453 -43.4% 645 647 0.3%
Kidder 679 611 -10.0% 476 568 19.3% 769 479 -37.7% 511 588 15.1%
McLean 2,220 2,380 7.2% 1,737 1,992 14.7% 3,064 2,154 -29.7% 1,941 2,711 39.7%
Mercer 2,282 2,579 13.0% 1,743 2,106 20.8% 3,071 2,223 -27.6% 1,328 2,019 52.0%
Morton 8,569 10,196 19.0% 7,058 8,781 24.4% 7,831 7,120 -9.1% 4,013 5,879 46.5%
Oliver 502 552 10.0% 340 353 3.8% 696 424 -39.1% 308 370 20.1%
Sheridan 276 286 3.6% 210 145 -31.0% 439 295 -32.8% 396 365 -7.8%
Sioux 2,001 2,666 33.2% 1,059 1,062 0.3% 799 821 2.8% 294 388 32.0%
Bismarck 19,477 24,041 23.4% 15,996 22,374 39.9% 16,388 16,632 1.5% 9,411 15,684 66.7%
Mandan 5,884 7,001 19.0% 5,018 6,234 24.2% 5,010 4,547 -9.2% 2,419 3,528 45.8%

2012 NORTH DAKOTA STATEWIDE HOUSING NEEDS ASSESSMENT: HOUSING FORECAST PROFILES – LEWIS AND CLARK REGION VII 87
TABLE 4. TOTAL OCCUPIED HOUSING UNITS, 2000 to 2025
Area 2000 2010
Change: 2000 to
2010
Projections Change: 2010 to
2025 2015 2020 2025
Region VII 51,476 57,714 12.1% 62,849 67,099 71,362 23.6%
Burleigh 27,670 33,001 19.3% 37,165 40,800 44,439 34.7%
Emmons 1,786 1,608 -10.0% 1,551 1,525 1,529 -4.9%
Grant 1,195 1,152 -3.6% 1,052 993 962 -16.5%
Kidder 1,158 1,188 2.6% 1,029 1,014 990 -16.7%
McLean 3,815 3,937 3.2% 3,931 4,034 4,018 2.1%
Mercer 3,346 3,644 8.9% 3,679 3,748 3,795 4.1%
Morton 9,889 10,724 8.4% 11,849 12,423 13,110 22.2%
Oliver 791 762 -3.7% 728 693 672 -11.8%
Sheridan 731 638 -12.7% 602 564 516 -19.1%
Sioux 1,095 1,060 -3.2% 1,263 1,305 1,331 25.6%
Bismarck 23,143 26,726 15.5% 29,845 32,762 35,720 33.7%
Mandan 6,634 7,310 10.2% 7,950 8,394 8,854 21.1%
TABLE 5. OCCUPIED HOUSING UNITS BY TENURE, 2010
Area
Total Occupied Housing Units
Owner-Occupied
Renter-Occupied
Number
Percent
Number
Percent
Region VII 57,714 42,551 73.7% 15,163 26.3%
Burleigh 33,001 23,194 70.3% 9,807 29.7%
Emmons 1,608 1,352 84.1% 256 15.9%
Grant 1,152 942 81.8% 210 18.2%
Kidder 1,188 843 71.0% 345 29.0%
McLean 3,937 3,123 79.3% 814 20.7%
Mercer 3,644 2,870 78.8% 774 21.2%
Morton 10,724 8,494 79.2% 2,230 20.8%
Oliver 762 654 85.8% 108 14.2%
Sheridan 638 549 86.1% 89 13.9%
Sioux 1,060 530 50.0% 530 50.0%
Bismarck 26,726 17,325 64.8% 9,401 35.2%
Mandan 7,310 5,455 74.6% 1,855 25.4%
TABLE 6. VACANT HOUSING UNITS BY STATUS, 2010
Area
Total Vacant
Housing Units
For Rent
For Sale Only
Rented or Sold, Not Occupied
For Seasonal, Recreational, or
Occasional Use
For Migrant Workers
Other Vacant
Number
Percent
Number
Percent
Number
Percent
Number
Percent
Number
Percent
Number
Percent
Region VII 7,246 898 12.4% 510 7.0% 616 8.5% 3,497 48.3% 71 1.0% 1,654 22.8%
Burleigh 1,556 455 29.2% 196 12.6% 261 16.8% 521 33.5% 0 0.0% 123 7.9%
Emmons 491 39 7.9% 38 7.7% 63 12.8% 309 62.9% 0 0.0% 42 8.6%
Grant 569 51 9.0% 3 0.5% 27 4.7% 258 45.3% 0 0.0% 230 40.4%
Kidder 490 29 5.9% 31 6.3% 24 4.9% 364 74.3% 13 2.7% 29 5.9%
McLean 1,591 36 2.3% 81 5.1% 24 1.5% 1,044 65.6% 23 1.4% 383 24.1%
Mercer 791 98 12.4% 16 2.0% 38 4.8% 449 56.8% 35 4.4% 155 19.6%
Morton 1,105 136 12.3% 119 10.8% 158 14.3% 278 25.2% 0 0.0% 414 37.5%
Oliver 125 15 12.0% 0 0.0% 11 8.8% 19 15.2% 0 0.0% 80 64.0%
Sheridan 281 22 7.8% 21 7.5% 0 0.0% 204 72.6% 0 0.0% 34 12.1%
Sioux 247 17 6.9% 5 2.0% 10 4.0% 51 20.6% 0 0.0% 164 66.4%
Bismarck 1,219 391 32.1% 177 14.5% 223 18.3% 328 26.9% 0 0.0% 100 8.2%
Mandan 663 109 16.4% 105 15.8% 100 15.1% 185 27.9% 0 0.0% 164 24.7%

2012 NORTH DAKOTA STATEWIDE HOUSING NEEDS ASSESSMENT: HOUSING FORECAST PROFILES – LEWIS AND CLARK REGION VII 88
TABLE 7. SUBSTANDARD OCCUPIED HOUSING UNITS BY TENURE, 2010
Area
Owner-Occupied Housing Units
Renter-Occupied Housing Units
Total
Lacking Complete Plumbing Facilities
Lacking Complete Kitchen Facilities
Overcrowded: 1.01 or More Occupants Per Room
Total
Lacking Complete Plumbing Facilities
Lacking Complete Kitchen Facilities
Overcrowded: 1.01 or More Occupants Per Room
Number Percent Number Percent Number Percent Number Percent Number Percent Number Percent
Region VII 42,551 86 0.2% 38 0.1% 287 0.7% 15,163 34 0.2% 180 1.2% 258 1.7%
Burleigh 23,194 50 0.2% 9 0.0% 86 0.4% 9,807 31 0.3% 164 1.7% 131 1.3%
Emmons 1,352 6 0.4% 4 0.3% 0 0.0% 256 3 1.2% 0 0.0% 6 2.3%
Grant 942 9 1.0% 10 1.1% 0 0.0% 210 0 0.0% 16 7.6% 9 4.3%
Kidder 843 5 0.6% 5 0.6% 4 0.5% 345 0 0.0% 0 0.0% 0 0.0%
McLean 3,123 3 0.1% 0 0.0% 4 0.1% 814 0 0.0% 0 0.0% 15 1.8%
Mercer 2,870 0 0.0% 0 0.0% 24 0.8% 774 0 0.0% 0 0.0% 0 0.0%
Morton 8,494 4 0.0% 10 0.1% 115 1.4% 2,230 0 0.0% 0 0.0% 0 0.0%
Oliver 654 0 0.0% 0 0.0% 0 0.0% 108 0 0.0% 0 0.0% 9 8.3%
Sheridan 549 0 0.0% 0 0.0% 0 0.0% 89 0 0.0% 0 0.0% 0 0.0%
Sioux 530 9 1.7% 0 0.0% 54 10.2% 530 0 0.0% 0 0.0% 88 16.6%
Bismarck 17,325 47 0.3% 9 0.1% 35 0.2% 9,401 31 0.3% 164 1.7% 98 1.0%
Mandan 5,455 0 0.0% 0 0.0% 75 1.4% 1,855 0 0.0% 0 0.0% 0 0.0%
TABLE 8. YEAR OCCUPIED HOUSING UNIT BUILT BY TENURE, 2010
Area
Owner-Occupied Housing Units Renter-Occupied Housing Units
Total
Built 1980 to Present Built 1940 to 1979 Built Prior to 1940
Total
Built 1980 to Present Built 1940 to 1979 Built Prior to 1940
Number Percent Number Percent Number Percent Number Percent Number Percent Number Percent
Region VII 42,551 11,370 26.7% 20,428 48.0% 10,753 25.3% 15,163 2,977 19.6% 8,515 56.2% 3,671 24.2%
Burleigh 23,194 7,851 33.8% 10,886 46.9% 4,457 19.2% 9,807 2,336 23.8% 5,461 55.7% 2,010 20.5%
Emmons 1,352 141 10.4% 542 40.1% 669 49.5% 256 14 5.5% 119 46.5% 123 48.0%
Grant 942 35 3.7% 400 42.5% 507 53.8% 210 6 2.9% 87 41.4% 117 55.7%
Kidder 843 124 14.7% 370 43.9% 349 41.4% 345 37 10.7% 142 41.2% 166 48.1%
McLean 3,123 368 11.8% 1,598 51.2% 1,157 37.0% 814 62 7.6% 496 60.9% 256 31.4%
Mercer 2,870 257 9.0% 2,140 74.6% 473 16.5% 774 10 1.3% 540 69.8% 224 28.9%
Morton 8,494 2,289 26.9% 3,682 43.3% 2,523 29.7% 2,230 376 16.9% 1,237 55.5% 617 27.7%
Oliver 654 116 17.7% 350 53.5% 188 28.7% 108 0 0.0% 39 36.1% 69 63.9%
Sheridan 549 63 11.5% 204 37.2% 282 51.4% 89 3 3.4% 40 44.9% 46 51.7%
Sioux 530 126 23.8% 256 48.3% 148 27.9% 530 133 25.1% 354 66.8% 43 8.1%
Bismarck 17,325 4,803 27.7% 8,726 50.4% 3,796 21.9% 9,401 2,296 24.4% 5,204 55.4% 1,901 20.2%
Mandan 5,455 1,436 26.3% 2,531 46.4% 1,488 27.3% 1,855 336 18.1% 992 53.5% 527 28.4%

2012 NORTH DAKOTA STATEWIDE HOUSING NEEDS ASSESSMENT: HOUSING FORECAST PROFILES – LEWIS AND CLARK REGION VII 89
FIGURE 1. MEDIAN VALUE OF ALL OWNER-OCCUPIED HOUSING UNITS, 2010
TABLE 9. VALUE OF ALL OWNER-OCCUPIED HOUSING UNITS, 2010
Area
Owner-Occupied Housing Units by Value
Total
Less Than $40,000 $40,000 to $69,999 $70,000 to $89,999 $90,000 to $124,999 $125,000 to $199,999 $200,000 or More
Number Percent Number Percent Number Percent Number Percent Number Percent Number Percent
Region VII 42,551 6,275 14.7% 4,051 9.5% 3,449 8.1% 6,703 15.8% 13,294 31.2% 8,779 20.6%
Burleigh 23,194 2,378 10.3% 867 3.7% 1,274 5.5% 3,357 14.5% 9,270 40.0% 6,048 26.1%
Emmons 1,352 417 30.8% 394 29.1% 145 10.7% 187 13.8% 84 6.2% 125 9.2%
Grant 942 323 34.3% 225 23.9% 92 9.8% 92 9.8% 79 8.4% 131 13.9%
Kidder 843 273 32.4% 225 26.7% 119 14.1% 74 8.8% 102 12.1% 50 5.9%
McLean 3,123 491 15.7% 568 18.2% 431 13.8% 491 15.7% 683 21.9% 459 14.7%
Mercer 2,870 357 12.4% 614 21.4% 390 13.6% 563 19.6% 612 21.3% 334 11.6%
Morton 8,494 1,500 17.7% 872 10.3% 781 9.2% 1,719 20.2% 2,273 26.8% 1,349 15.9%
Oliver 654 100 15.3% 138 21.1% 80 12.2% 136 20.8% 51 7.8% 149 22.8%
Sheridan 549 258 47.0% 73 13.3% 49 8.9% 35 6.4% 67 12.2% 67 12.2%
Sioux 530 178 33.6% 75 14.2% 88 16.6% 49 9.2% 73 13.8% 67 12.6%
Bismarck 17,325 2,028 11.7% 665 3.8% 1,071 6.2% 2,711 15.6% 7,502 43.3% 3,348 19.3%
Mandan 5,455 1,016 18.6% 370 6.8% 448 8.2% 1,217 22.3% 1,652 30.3% 752 13.8%
$111,300 $114,282
$152,900
$59,600 $59,200 $59,400
$94,100 $96,100
$110,800
$92,100
$48,700
$71,800
$144,800
$114,800
$-
$20,000
$40,000
$60,000
$80,000
$100,000
$120,000
$140,000
$160,000
$180,000
North Dakota Region VII Burleigh County Emmons County Grant County Kidder County McLean County Mercer County Morton County Oliver County Sheridan County Sioux County Bismarck city Mandan city

2012 NORTH DAKOTA STATEWIDE HOUSING NEEDS ASSESSMENT: HOUSING FORECAST PROFILES – LEWIS AND CLARK REGION VII 90
FIGURE 2. MEDIAN GROSS RENT OF RENTER-OCCUPIED HOUSING UNITS PAYING CASH RENT, 2010
TABLE 10. GROSS RENT OF RENTER-OCCUPIED HOUSING UNITS PAYING CASH RENT, 2010
Area
Renter-Occupied Housing Units Paying Cash Rent by Monthly Gross Rent
Total
Less Than $250 $250 to $349 $350 to $449 $450 to $549 $550 to $749 $750 or More
Number Percent Number Percent Number Percent Number Percent Number Percent Number Percent
Region VII 13,923 835 6.0% 1,372 9.9% 2,203 15.8% 3,209 23.0% 4,197 30.1% 2,107 15.1%
Burleigh 9,351 351 3.8% 723 7.7% 928 9.9% 2,265 24.2% 3,430 36.7% 1,654 17.7%
Emmons 193 50 25.9% 57 29.5% 38 19.7% 30 15.5% 12 6.2% 6 3.1%
Grant 128 24 18.8% 18 14.1% 27 21.1% 22 17.2% 30 23.4% 7 5.5%
Kidder 238 48 20.2% 65 27.3% 29 12.2% 43 18.1% 23 9.7% 30 12.6%
McLean 678 88 13.0% 144 21.2% 199 29.4% 90 13.3% 111 16.4% 46 6.8%
Mercer 684 13 1.9% 135 19.7% 311 45.5% 126 18.4% 80 11.7% 19 2.8%
Morton 2,073 150 7.2% 95 4.6% 555 26.8% 531 25.6% 425 20.5% 317 15.3%
Oliver 45 2 4.4% 8 17.8% 16 35.6% 13 28.9% 4 8.9% 2 4.4%
Sheridan 67 9 13.4% 32 47.8% 14 20.9% 10 14.9% 0 0.0% 2 3.0%
Sioux 466 100 21.5% 95 20.4% 86 18.5% 79 17.0% 82 17.6% 24 5.2%
Bismarck 9,131 343 3.8% 684 7.5% 901 9.9% 2,238 24.5% 3,408 37.3% 1,557 17.1%
Mandan 1,801 111 6.2% 78 4.3% 491 27.3% 481 26.7% 384 21.3% 256 14.2%
$555
$512
$569
$336
$408
$371
$415 $398
$493
$389
$325
$406
$568
$494
$-
$100
$200
$300
$400
$500
$600
North Dakota Region VII Burleigh County Emmons County Grant County Kidder County McLean County Mercer County Morton County Oliver County Sheridan County Sioux County Bismarck city Mandan city

2012 NORTH DAKOTA STATEWIDE HOUSING NEEDS ASSESSMENT: HOUSING FORECAST PROFILES – LEWIS AND CLARK REGION VII 91
TABLE 11. NUMBER OF HOUSEHOLDS BY INCOME LEVELS AS A PERCENT OF THE MEDIAN FAMILY INCOME (MFI), 2010 and 2025
Area
Extremely Low: 0-30% MFI (Less than $20,000 in 2010)
Very Low: 31-50% MFI ($20,000 to $29,999 in 2010)
Low Income: 51-80% MFI ($30,000 to $49,999 in 2010)
Moderate: 81-115% MFI ($50,000 to $74,999 in 2010)
Upper: Above 115% MFI ($75,000 or more in 2010)
Tax Credit: 51 to 60% MFI ($30,000 to $39,999 in 2010)
2010 2025 %
Change 2010 2025 %
Change 2010 2025 %
Change 2010 2025 %
Change 2010 2025 %
Change 2010 2025 %
Change
Region VII 9,981 13,126 31.5% 6,694 8,727 30.4% 11,427 14,178 24.1% 11,453 14,035 22.5% 18,159 21,298 17.3% 6,092 7,583 24.5%
Burleigh 5,145 7,464 45.1% 3,948 5,546 40.5% 6,312 8,507 34.8% 6,530 8,830 35.2% 11,066 14,092 27.3% 3,424 4,605 34.5%
Emmons 442 419 -5.2% 223 207 -7.2% 405 394 -2.7% 259 262 1.2% 279 247 -11.5% 244 230 -5.7%
Grant 299 276 -7.7% 124 113 -8.9% 288 250 -13.2% 192 136 -29.2% 249 188 -24.5% 158 133 -15.8%
Kidder 345 324 -6.1% 169 126 -25.4% 264 199 -24.6% 180 160 -11.1% 230 179 -22.2% 137 105 -23.4%
McLean 729 859 17.8% 445 507 13.9% 680 724 6.5% 909 872 -4.1% 1,174 1,056 -10.1% 359 388 8.1%
Mercer 613 752 22.7% 345 390 13.0% 556 596 7.2% 758 764 0.8% 1,372 1,294 -5.7% 323 368 13.9%
Morton 1,755 2,288 30.4% 1,167 1,540 32.0% 2,396 2,962 23.6% 2,212 2,616 18.3% 3,194 3,706 16.0% 1,170 1,463 25.0%
Oliver 110 114 3.6% 63 65 3.2% 145 132 -9.0% 144 125 -13.2% 300 237 -21.0% 53 49 -7.5%
Sheridan 164 140 -14.6% 78 73 -6.4% 155 133 -14.2% 125 94 -24.8% 116 75 -35.3% 87 77 -11.5%
Sioux 379 490 29.3% 132 160 21.2% 226 281 24.3% 144 176 22.2% 179 224 25.1% 137 165 20.4%
Bismarck 4,813 6,844 42.2% 3,564 4,967 39.4% 5,437 7,245 33.3% 5,121 6,824 33.3% 7,791 9,839 26.3% 2,993 3,966 32.5%
Mandan 1,179 1,525 29.3% 844 1,090 29.1% 1,706 2,076 21.7% 1,494 1,757 17.6% 2,087 2,407 15.3% 882 1,097 24.4%
TABLE 12. TOTAL HOUSING UNITS, 2000 to 2025 (Projected Demand – Model 2) TABLE 13. CHANGE IN RENTER-OCCUPIED HOUSING UNITS, 2010 to 2025
Area Renter-Occupied Housing Units,
2010
Change in Renter-Occupied Housing Units
2010 to 2015 2010 to 2020 2010 to 2025
3 Numeric % Numeric % Numeric %
Region VII 15,163 2,605 17.2% 4,090 27.0% 5,664 37.4%
Burleigh 9,807 1,777 18.1% 2,973 30.3% 4,276 43.6%
Emmons 256 30 11.7% 31 12.1% 37 14.5%
Grant 210 33 15.7% 26 12.4% 29 13.8%
Kidder 345 -127 -36.8% -122 -35.4% -121 -35.1%
McLean 814 -52 -6.4% -16 -2.0% -13 -1.6%
Mercer 774 -31 -4.0% 3 0.4% 25 3.2%
Morton 2,230 745 33.4% 944 42.3% 1,173 52.6%
Oliver 108 6 5.6% 6 5.6% 4 3.7%
Sheridan 89 32 36.0% 26 29.2% 17 19.1%
Sioux 530 192 36.2% 219 41.3% 237 44.7%
Bismarck 9,401 1,750 18.6% 2,860 30.4% 4,077 43.4%
Mandan 1,855 598 32.2% 803 43.3% 991 53.4%
Area 2000 2010
Change: 2000 to
2010
Projections – Model 2 Change: 2010 to
2025 2015 2020 2025
Region VII 57,799 64,960 12.4% 70,777 75,835 80,494 23.9%
Burleigh 29,003 34,557 19.1% 39,182 43,096 47,022 36.1%
Emmons 2,168 2,099 -3.2% 2,065 2,053 2,055 -2.1%
Grant 1,722 1,721 -0.1% 1,728 1,760 1,778 3.3%
Kidder 1,610 1,678 4.2% 1,652 1,641 1,623 -3.3%
McLean 5,264 5,528 5.0% 5,731 6,164 6,094 10.2%
Mercer 4,402 4,435 0.7% 4,459 4,470 4,477 0.9%
Morton 10,587 11,829 11.7% 12,675 13,286 14,017 18.5%
Oliver 903 887 -1.8% 903 901 900 1.5%
Sheridan 924 919 -0.5% 910 926 948 3.2%
Sioux 1,216 1,307 7.5% 1,472 1,538 1,580 20.9%
Bismarck 24,162 27,945 15.7% 31,437 34,595 37,805 35.3%
Mandan 6,952 7,973 14.7% 8,264 8,701 9,153 14.8%

2012 NORTH DAKOTA STATEWIDE HOUSING NEEDS ASSESSMENT: HOUSING FORECAST PROFILES – ROOSEVELT-CUSTER REGION VIII 92
ROOSEVELT-CUSTER REGION VIII AND ITS COMPONENTS
POPULATION CHANGE
From 2000 to 2010, population in Region VIII decreased in seven of its eight counties. Growth in Stark
County, fed largely by an 11 percent growth in the city of Dickinson, resulted in an overall population
increase of 1 percent for the region during this decade (from 38,365 in 2000 to 38,896 in 2010). Current
population projections indicate a sizeable increase in population throughout Region VIII, reaching 62,058
by 2025 (growing by about 23,000 people). The projections suggest a significant shift in growth patterns
in the region. Stark County is expected to show the largest growth at 74 percent by 2025. However,
with the exception of Adams County which is expected to show little change, all counties within the region
could grow by at least 20 percent by 2025.
Largely as a result of oil field development, the demand for employment will likely result in a doubling of
people ages 25 to 44 in Region VIII by 2025. The number of people ages 45 to 64 is projected to grow 44
percent and youth less than 25 years is expected to increase by 46 percent. Beginning in 2011, baby
boomers (i.e., the large cohort of people born from 1946 to 1964) began turning 65. Thus, over the next
15 years, the number of people ages 65 and older is expected to grow by 48 percent in Region VIII.
TRENDS IN HOUSING
Total housing units grew 5 percent in Region VIII from 2000 to 2010. If historical building trends over the past few years continue (i.e., the basis for Model 1 projections), the housing
supply in Region VIII will grow 15 percent by 2025 (approximately 3,000 units). The city of Dickinson is expected to show the largest growth in the region at 28 percent by 2025.
If housing unit projections are based on shifts in population and housing demand (i.e., the basis for Model 2) rather than historical building trends (i.e., Model 1), the growth in housing
supply will be significant across the region (a growth of nearly 11,000 units by 2025). With the exception of Adams County which is expected to show little change, all counties within
Region VIII could grow by at least 30 percent. The city of Dickinson is expected to show the largest growth in the region at 77 percent by 2025.
The majority of housing in Region VIII was owner-occupied in 2010 (76 percent). While rental units captured only 24 percent of housing in the region according to 2010 data, projections
suggest that rental units could double by 2025 (a growth of nearly 4,000 units).
Very few owner or rental units in Region VIII were considered substandard (i.e., lacking complete plumbing or kitchen facilities) or overcrowded in 2010.
The vast majority of owner-occupied housing units in the region were built prior to 1980 (89 percent); more than one in three were built prior to 1940 (37 percent). Similar construction
exists for rental units in Region VIII; 88 percent were built prior to 1980 and 24 percent were built prior to 1940.
Increased demand for housing will likely further reduce already low vacancy levels.
ECONOMICS OF HOUSING
According to 2010 data from the U.S. Census Bureau’s American Community Survey, median values of owner-occupied housing units for counties within Region VIII ranged from $52,900
in Slope County to $115,300 in Stark County. Stark County’s median value was $30,200 higher than the second largest median value in the region ($85,100 in Bowman County).
Median gross rents within the region ranged from $377 per month in Hettinger County to $574 in Stark County. While Slope County had the lowest median value for owner-occupied
housing, it had one of the highest median values for gross rent. Increased demand for housing will likely result in higher housing values and rents across much of the region.
The majority of owner-occupied housing in Region VIII was valued at $90,000 or more (54 percent) in 2010; one-third was valued at $125,000 or more. Within the city of Dickinson,
nearly half of owner-occupied housing was $125,000 or more.
Nearly half of all rental units in Region VIII rented for at least $550 per month in 2010; 18 percent were at least $750.
Housing unit projections suggest that housing demand will increase significantly by 2025 for all income groups in Region VIII. Projections suggest a 60 percent growth in extremely
low-income households, 57 percent for very low-income households, 68 percent for low-income households, 72 percent for moderate-income households, and 79 percent for
upper-income households.

2012 NORTH DAKOTA STATEWIDE HOUSING NEEDS ASSESSMENT: HOUSING FORECAST PROFILES – ROOSEVELT-CUSTER REGION VIII 93
TABLE 1. TOTAL POPULATION, 2000 to 2025
Area 2000 2010
Change: 2000 to
2010
Projections Change: 2010 to
2025 2015 2020 2025
Region VIII 38,365 38,896 1.4% 48,518 58,135 62,058 59.5%
Adams 2,593 2,343 -9.6% 2,356 2,338 2,360 0.7%
Billings 888 783 -11.8% 997 1,183 1,315 67.9%
Bowman 3,242 3,151 -2.8% 3,357 3,563 3,804 20.7%
Dunn 3,600 3,536 -1.8% 4,550 5,254 5,433 53.6%
Golden Valley 1,924 1,680 -12.7% 1,954 2,205 2,354 40.1%
Hettinger 2,715 2,477 -8.8% 2,920 3,341 3,506 41.5%
Slope 767 727 -5.2% 837 1,056 1,095 50.6%
Stark 22,636 24,199 6.9% 31,547 39,195 42,191 74.4%
Dickinson 16,010 17,787 11.1% 23,121 28,628 30,721 72.7%
TABLE 3. TOTAL HOUSING UNITS, 2000 to 2025 (Building Trends – Model 1)
Area 2000 2010
Change: 2000 to
2010
Projections – Model 1 Change: 2010 to
2025 2015 2020 2025
Region VIII 18,071 19,008 5.2% 20,078 20,930 21,784 14.6%
Adams 1,416 1,353 -4.4% 1,337 1,297 1,258 -7.0%
Billings 529 488 -7.8% 459 434 410 -16.0%
Bowman 1,596 1,636 2.5% 1,759 1,834 1,910 16.7%
Dunn 1,965 2,117 7.7% 2,243 2,354 2,465 16.4%
Golden Valley 973 956 -1.7% 967 967 967 1.2%
Hettinger 1,419 1,460 2.9% 1,399 1,384 1,369 -6.2%
Slope 451 470 4.2% 421 406 391 -16.8%
Stark 9,722 10,528 8.3% 11,493 12,254 13,014 23.6%
Dickinson 7,021 7,844 11.7% 8,580 9,295 10,011 27.6%
TABLE 2. POPULATION BY AGE, 2010 and 2025
Area
Less Than 25 Years of Age Ages 25 to 44 Ages 45 to 64 65 Years and Older
2010 2025 Change: 2010
to 2025 2010 2025
Change: 2010 to 2025
2010 2025 Change: 2010
to 2025 2010 2025
Change: 2010 to 2025
Region VIII 12,077 17,670 46.3% 8,617 17,869 107.4% 11,169 16,095 44.1% 7,033 10,424 48.2%
Adams 578 588 1.7% 427 550 28.8% 770 549 -28.7% 568 673 18.5%
Billings 193 329 70.5% 143 388 171.3% 296 348 17.6% 151 250 65.6%
Bowman 860 1,121 30.3% 642 955 48.8% 957 760 -20.6% 692 968 39.9%
Dunn 1,024 1,241 21.2% 768 1,459 90.0% 1,128 1,819 61.3% 616 914 48.4%
Golden Valley 488 613 25.6% 327 613 87.5% 507 615 21.3% 358 513 43.3%
Hettinger 606 857 41.4% 475 910 91.6% 758 979 29.2% 638 760 19.1%
Slope 181 310 71.3% 139 267 92.1% 272 277 1.8% 135 241 78.5%
Stark 8,147 12,611 54.8% 5,696 12,727 123.4% 6,481 10,748 65.8% 3,875 6,105 57.5%
Dickinson 6,235 9,594 53.9% 4,360 9,624 120.7% 4,329 7,166 65.5% 2,863 4,337 51.5%

2012 NORTH DAKOTA STATEWIDE HOUSING NEEDS ASSESSMENT: HOUSING FORECAST PROFILES – ROOSEVELT-CUSTER REGION VIII 94
TABLE 4. TOTAL OCCUPIED HOUSING UNITS, 2000 to 2025
Area 2000 2010
Change: 2000 to
2010
Projections Change: 2010 to
2025 2015 2020 2025
Region VIII 15,381 15,882 3.3% 20,675 24,981 26,817 68.9%
Adams 1,121 1,015 -9.5% 1,109 1,095 1,101 8.5%
Billings 366 354 -3.3% 444 520 573 61.9%
Bowman 1,358 1,318 -2.9% 1,445 1,538 1,655 25.6%
Dunn 1,378 1,318 -4.4% 1,884 2,241 2,351 78.4%
Golden Valley 761 730 -4.1% 876 1,034 1,114 52.6%
Hettinger 1,152 1,177 2.2% 1,256 1,440 1,511 28.4%
Slope 313 327 4.5% 355 463 478 46.2%
Stark 8,932 9,643 8.0% 13,306 16,650 18,034 87.0%
Dickinson 6,491 7,171 10.5% 9,893 12,336 13,285 85.3%
TABLE 5. OCCUPIED HOUSING UNITS BY TENURE, 2010
Area
Total Occupied Housing Units
Owner-Occupied
Renter-Occupied
Number
Percent
Number
Percent
Region VIII 15,882 11,983 75.5% 3,899 24.5%
Adams 1,015 688 67.8% 327 32.2%
Billings 354 294 83.1% 60 16.9%
Bowman 1,318 1,057 80.2% 261 19.8%
Dunn 1,318 1,119 84.9% 199 15.1%
Golden Valley 730 582 79.7% 148 20.3%
Hettinger 1,177 969 82.3% 208 17.7%
Slope 327 260 79.5% 67 20.5%
Stark 9,643 7,014 72.7% 2,629 27.3%
Dickinson 7,171 4,805 67.0% 2,366 33.0%
TABLE 6. VACANT HOUSING UNITS BY STATUS, 2010
Area
Total Vacant
Housing Units
For Rent
For Sale Only
Rented or Sold, Not Occupied
For Seasonal, Recreational, or
Occasional Use
For Migrant Workers
Other Vacant
Number
Percent
Number
Percent
Number
Percent
Number
Percent
Number
Percent
Number
Percent
Region VIII 3,126 228 7.3% 166 5.3% 216 6.9% 1,233 39.4% 94 3.0% 1,189 38.0%
Adams 338 28 8.3% 9 2.7% 53 15.7% 116 34.3% 9 2.7% 123 36.4%
Billings 134 3 2.2% 6 4.5% 0 0.0% 78 58.2% 0 0.0% 47 35.1%
Bowman 318 25 7.9% 15 4.7% 24 7.5% 80 25.2% 0 0.0% 174 54.7%
Dunn 799 21 2.6% 17 2.1% 4 0.5% 468 58.6% 10 1.3% 279 34.9%
Golden Valley 226 4 1.8% 9 4.0% 8 3.5% 74 32.7% 0 0.0% 131 58.0%
Hettinger 283 23 8.1% 0 0.0% 5 1.8% 214 75.6% 0 0.0% 41 14.5%
Slope 143 0 0.0% 6 4.2% 6 4.2% 64 44.8% 0 0.0% 67 46.9%
Stark 885 124 14.0% 104 11.8% 116 13.1% 139 15.7% 75 8.5% 327 36.9%
Dickinson 673 124 18.4% 82 12.2% 105 15.6% 106 15.8% 75 11.1% 181 26.9%

2012 NORTH DAKOTA STATEWIDE HOUSING NEEDS ASSESSMENT: HOUSING FORECAST PROFILES – ROOSEVELT-CUSTER REGION VIII 95
TABLE 7. SUBSTANDARD OCCUPIED HOUSING UNITS BY TENURE, 2010
Area
Owner-Occupied Housing Units
Renter-Occupied Housing Units
Total
Lacking Complete Plumbing Facilities
Lacking Complete Kitchen Facilities
Overcrowded: 1.01 or More Occupants Per Room
Total
Lacking Complete Plumbing Facilities
Lacking Complete Kitchen Facilities
Overcrowded: 1.01 or More Occupants Per Room
Number Percent Number Percent Number Percent Number Percent Number Percent Number Percent
Region VIII 11,983 32 0.3% 42 0.4% 52 0.4% 3,899 34 0.9% 88 2.3% 23 0.6%
Adams 688 0 0.0% 11 1.6% 0 0.0% 327 0 0.0% 0 0.0% 0 0.0%
Billings 294 12 4.1% 5 1.7% 2 0.7% 60 0 0.0% 0 0.0% 0 0.0%
Bowman 1,057 0 0.0% 0 0.0% 1 0.1% 261 0 0.0% 0 0.0% 0 0.0%
Dunn 1,119 0 0.0% 3 0.3% 17 1.5% 199 3 1.5% 3 1.5% 5 2.5%
Golden Valley 582 6 1.0% 6 1.0% 0 0.0% 148 11 7.4% 11 7.4% 0 0.0%
Hettinger 969 2 0.2% 0 0.0% 3 0.3% 208 0 0.0% 0 0.0% 11 5.3%
Slope 260 8 3.1% 10 3.8% 0 0.0% 67 0 0.0% 0 0.0% 0 0.0%
Stark 7,014 4 0.1% 7 0.1% 29 0.4% 2,629 20 0.8% 74 2.8% 7 0.3%
Dickinson 4,805 0 0.0% 0 0.0% 17 0.4% 2,366 10 0.4% 64 2.7% 7 0.3%
TABLE 8. YEAR OCCUPIED HOUSING UNIT BUILT BY TENURE, 2010
Area
Owner-Occupied Housing Units Renter-Occupied Housing Units
Total
Built 1980 to Present Built 1940 to 1979 Built Prior to 1940
Total
Built 1980 to Present Built 1940 to 1979 Built Prior to 1940
Number Percent Number Percent Number Percent Number Percent Number Percent Number Percent
Region VIII 11,983 1,360 11.3% 6,143 51.3% 4,480 37.4% 3,899 485 12.4% 2,477 63.5% 937 24.0%
Adams 688 55 8.0% 268 39.0% 365 53.1% 327 62 19.0% 107 32.7% 158 48.3%
Billings 294 42 14.3% 140 47.6% 112 38.1% 60 7 11.7% 35 58.3% 18 30.0%
Bowman 1,057 133 12.6% 493 46.6% 431 40.8% 261 14 5.4% 137 52.5% 110 42.1%
Dunn 1,119 88 7.9% 617 55.1% 414 37.0% 199 26 13.1% 118 59.3% 55 27.6%
Golden Valley 582 42 7.2% 180 30.9% 360 61.9% 148 10 6.8% 90 60.8% 48 32.4%
Hettinger 969 36 3.7% 374 38.6% 559 57.7% 208 22 10.6% 122 58.7% 64 30.8%
Slope 260 17 6.5% 80 30.8% 163 62.7% 67 10 14.9% 32 47.8% 25 37.3%
Stark 7,014 947 13.5% 3,991 56.9% 2,076 29.6% 2,629 334 12.7% 1,836 69.8% 459 17.5%
Dickinson 4,805 533 11.1% 2,975 61.9% 1,297 27.0% 2,366 314 13.3% 1,675 70.8% 377 15.9%
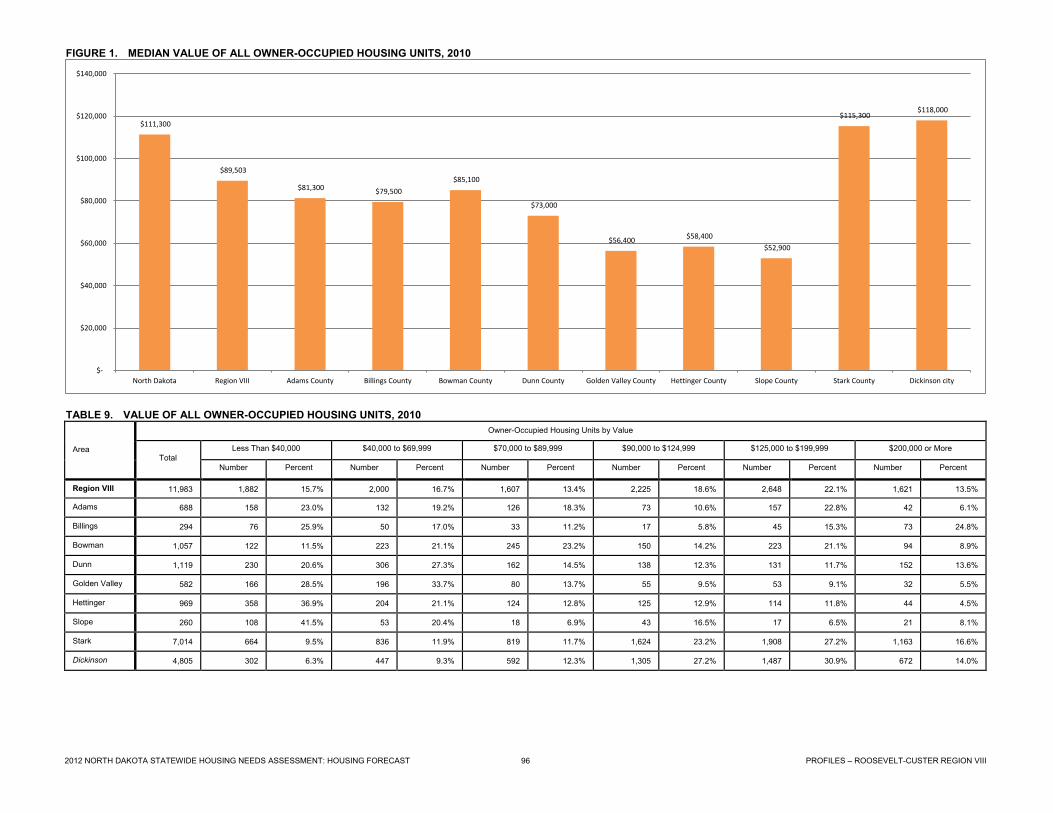
2012 NORTH DAKOTA STATEWIDE HOUSING NEEDS ASSESSMENT: HOUSING FORECAST PROFILES – ROOSEVELT-CUSTER REGION VIII 96
FIGURE 1. MEDIAN VALUE OF ALL OWNER-OCCUPIED HOUSING UNITS, 2010
TABLE 9. VALUE OF ALL OWNER-OCCUPIED HOUSING UNITS, 2010
Area
Owner-Occupied Housing Units by Value
Total
Less Than $40,000 $40,000 to $69,999 $70,000 to $89,999 $90,000 to $124,999 $125,000 to $199,999 $200,000 or More
Number Percent Number Percent Number Percent Number Percent Number Percent Number Percent
Region VIII 11,983 1,882 15.7% 2,000 16.7% 1,607 13.4% 2,225 18.6% 2,648 22.1% 1,621 13.5%
Adams 688 158 23.0% 132 19.2% 126 18.3% 73 10.6% 157 22.8% 42 6.1%
Billings 294 76 25.9% 50 17.0% 33 11.2% 17 5.8% 45 15.3% 73 24.8%
Bowman 1,057 122 11.5% 223 21.1% 245 23.2% 150 14.2% 223 21.1% 94 8.9%
Dunn 1,119 230 20.6% 306 27.3% 162 14.5% 138 12.3% 131 11.7% 152 13.6%
Golden Valley 582 166 28.5% 196 33.7% 80 13.7% 55 9.5% 53 9.1% 32 5.5%
Hettinger 969 358 36.9% 204 21.1% 124 12.8% 125 12.9% 114 11.8% 44 4.5%
Slope 260 108 41.5% 53 20.4% 18 6.9% 43 16.5% 17 6.5% 21 8.1%
Stark 7,014 664 9.5% 836 11.9% 819 11.7% 1,624 23.2% 1,908 27.2% 1,163 16.6%
Dickinson 4,805 302 6.3% 447 9.3% 592 12.3% 1,305 27.2% 1,487 30.9% 672 14.0%
$111,300
$89,503
$81,300 $79,500
$85,100
$73,000
$56,400 $58,400
$52,900
$115,300 $118,000
$-
$20,000
$40,000
$60,000
$80,000
$100,000
$120,000
$140,000
North Dakota Region VIII Adams County Billings County Bowman County Dunn County Golden Valley County Hettinger County Slope County Stark County Dickinson city
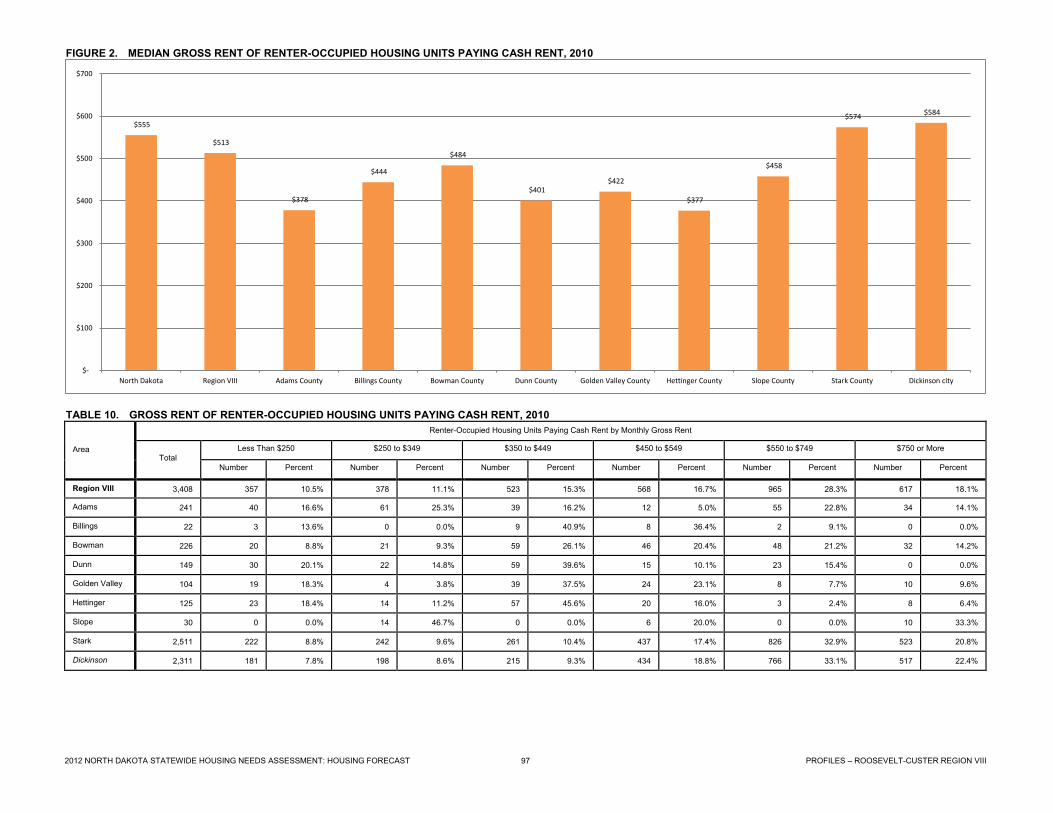
2012 NORTH DAKOTA STATEWIDE HOUSING NEEDS ASSESSMENT: HOUSING FORECAST PROFILES – ROOSEVELT-CUSTER REGION VIII 97
FIGURE 2. MEDIAN GROSS RENT OF RENTER-OCCUPIED HOUSING UNITS PAYING CASH RENT, 2010
TABLE 10. GROSS RENT OF RENTER-OCCUPIED HOUSING UNITS PAYING CASH RENT, 2010
Area
Renter-Occupied Housing Units Paying Cash Rent by Monthly Gross Rent
Total
Less Than $250 $250 to $349 $350 to $449 $450 to $549 $550 to $749 $750 or More
Number Percent Number Percent Number Percent Number Percent Number Percent Number Percent
Region VIII 3,408 357 10.5% 378 11.1% 523 15.3% 568 16.7% 965 28.3% 617 18.1%
Adams 241 40 16.6% 61 25.3% 39 16.2% 12 5.0% 55 22.8% 34 14.1%
Billings 22 3 13.6% 0 0.0% 9 40.9% 8 36.4% 2 9.1% 0 0.0%
Bowman 226 20 8.8% 21 9.3% 59 26.1% 46 20.4% 48 21.2% 32 14.2%
Dunn 149 30 20.1% 22 14.8% 59 39.6% 15 10.1% 23 15.4% 0 0.0%
Golden Valley 104 19 18.3% 4 3.8% 39 37.5% 24 23.1% 8 7.7% 10 9.6%
Hettinger 125 23 18.4% 14 11.2% 57 45.6% 20 16.0% 3 2.4% 8 6.4%
Slope 30 0 0.0% 14 46.7% 0 0.0% 6 20.0% 0 0.0% 10 33.3%
Stark 2,511 222 8.8% 242 9.6% 261 10.4% 437 17.4% 826 32.9% 523 20.8%
Dickinson 2,311 181 7.8% 198 8.6% 215 9.3% 434 18.8% 766 33.1% 517 22.4%
$555
$513
$378
$444
$484
$401 $422
$377
$458
$574 $584
$-
$100
$200
$300
$400
$500
$600
$700
North Dakota Region VIII Adams County Billings County Bowman County Dunn County Golden Valley County Hettinger County Slope County Stark County Dickinson city
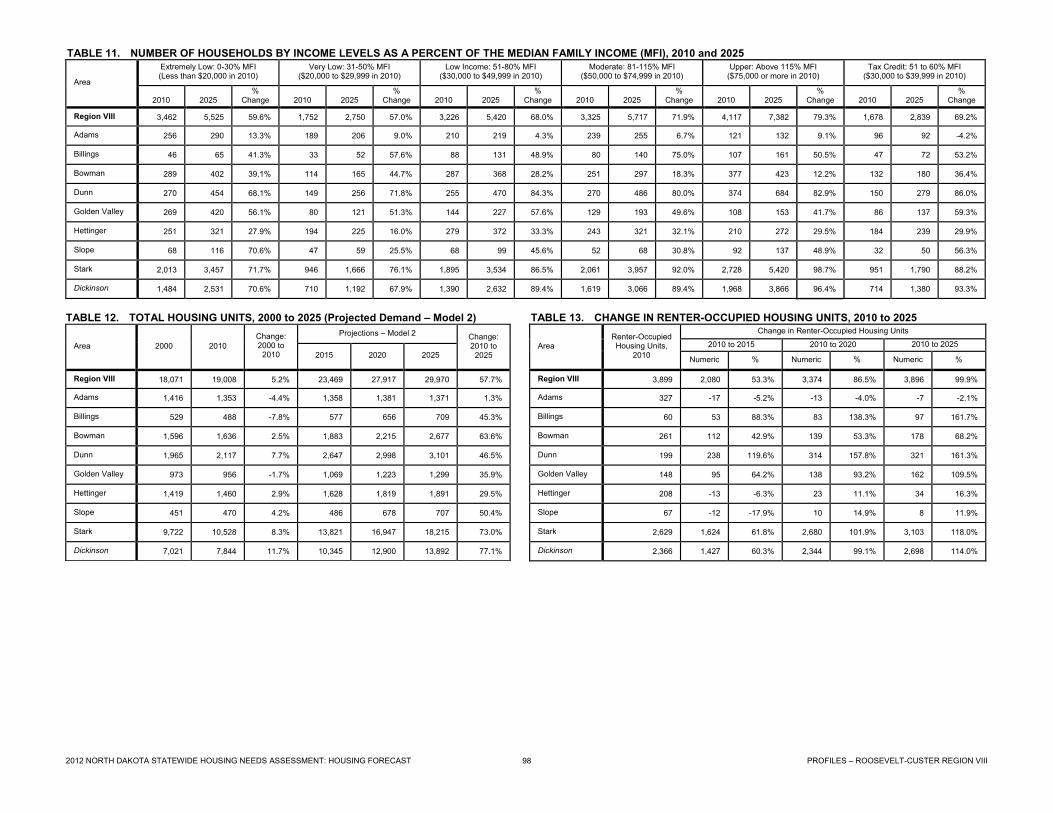
2012 NORTH DAKOTA STATEWIDE HOUSING NEEDS ASSESSMENT: HOUSING FORECAST PROFILES – ROOSEVELT-CUSTER REGION VIII 98
TABLE 11. NUMBER OF HOUSEHOLDS BY INCOME LEVELS AS A PERCENT OF THE MEDIAN FAMILY INCOME (MFI), 2010 and 2025
Area
Extremely Low: 0-30% MFI (Less than $20,000 in 2010)
Very Low: 31-50% MFI ($20,000 to $29,999 in 2010)
Low Income: 51-80% MFI ($30,000 to $49,999 in 2010)
Moderate: 81-115% MFI ($50,000 to $74,999 in 2010)
Upper: Above 115% MFI ($75,000 or more in 2010)
Tax Credit: 51 to 60% MFI ($30,000 to $39,999 in 2010)
2010 2025 %
Change 2010 2025 %
Change 2010 2025 %
Change 2010 2025 %
Change 2010 2025 %
Change 2010 2025 %
Change
Region VIII 3,462 5,525 59.6% 1,752 2,750 57.0% 3,226 5,420 68.0% 3,325 5,717 71.9% 4,117 7,382 79.3% 1,678 2,839 69.2%
Adams 256 290 13.3% 189 206 9.0% 210 219 4.3% 239 255 6.7% 121 132 9.1% 96 92 -4.2%
Billings 46 65 41.3% 33 52 57.6% 88 131 48.9% 80 140 75.0% 107 161 50.5% 47 72 53.2%
Bowman 289 402 39.1% 114 165 44.7% 287 368 28.2% 251 297 18.3% 377 423 12.2% 132 180 36.4%
Dunn 270 454 68.1% 149 256 71.8% 255 470 84.3% 270 486 80.0% 374 684 82.9% 150 279 86.0%
Golden Valley 269 420 56.1% 80 121 51.3% 144 227 57.6% 129 193 49.6% 108 153 41.7% 86 137 59.3%
Hettinger 251 321 27.9% 194 225 16.0% 279 372 33.3% 243 321 32.1% 210 272 29.5% 184 239 29.9%
Slope 68 116 70.6% 47 59 25.5% 68 99 45.6% 52 68 30.8% 92 137 48.9% 32 50 56.3%
Stark 2,013 3,457 71.7% 946 1,666 76.1% 1,895 3,534 86.5% 2,061 3,957 92.0% 2,728 5,420 98.7% 951 1,790 88.2%
Dickinson 1,484 2,531 70.6% 710 1,192 67.9% 1,390 2,632 89.4% 1,619 3,066 89.4% 1,968 3,866 96.4% 714 1,380 93.3%
TABLE 12. TOTAL HOUSING UNITS, 2000 to 2025 (Projected Demand – Model 2) TABLE 13. CHANGE IN RENTER-OCCUPIED HOUSING UNITS, 2010 to 2025
Area Renter-Occupied Housing Units,
2010
Change in Renter-Occupied Housing Units
2010 to 2015 2010 to 2020 2010 to 2025
3 Numeric % Numeric % Numeric %
Region VIII 3,899 2,080 53.3% 3,374 86.5% 3,896 99.9%
Adams 327 -17 -5.2% -13 -4.0% -7 -2.1%
Billings 60 53 88.3% 83 138.3% 97 161.7%
Bowman 261 112 42.9% 139 53.3% 178 68.2%
Dunn 199 238 119.6% 314 157.8% 321 161.3%
Golden Valley 148 95 64.2% 138 93.2% 162 109.5%
Hettinger 208 -13 -6.3% 23 11.1% 34 16.3%
Slope 67 -12 -17.9% 10 14.9% 8 11.9%
Stark 2,629 1,624 61.8% 2,680 101.9% 3,103 118.0%
Dickinson 2,366 1,427 60.3% 2,344 99.1% 2,698 114.0%
Area 2000 2010
Change: 2000 to
2010
Projections – Model 2 Change: 2010 to
2025 2015 2020 2025
Region VIII 18,071 19,008 5.2% 23,469 27,917 29,970 57.7%
Adams 1,416 1,353 -4.4% 1,358 1,381 1,371 1.3%
Billings 529 488 -7.8% 577 656 709 45.3%
Bowman 1,596 1,636 2.5% 1,883 2,215 2,677 63.6%
Dunn 1,965 2,117 7.7% 2,647 2,998 3,101 46.5%
Golden Valley 973 956 -1.7% 1,069 1,223 1,299 35.9%
Hettinger 1,419 1,460 2.9% 1,628 1,819 1,891 29.5%
Slope 451 470 4.2% 486 678 707 50.4%
Stark 9,722 10,528 8.3% 13,821 16,947 18,215 73.0%
Dickinson 7,021 7,844 11.7% 10,345 12,900 13,892 77.1%

2012 NORTH DAKOTA STATEWIDE HOUSING NEEDS ASSESSMENT: HOUSING FORECAST PROFILES – NATIVE AMERICAN INDIAN RESERVATIONS 99
NATIVE AMERICAN INDIAN RESERVATIONS IN NORTH DAKOTA
POPULATION CHANGE
The population grew in three of the four main Native American Indian reservations in North Dakota from
2000 to 2010. Fort Berthold had the largest increase (7 percent); Spirit Lake saw the only decrease in
population in the last decade (4 percent). Population projections indicate that each reservation could
increase by at least 4 percent in the next 15 years, with Fort Berthold expecting the most growth at 11
percent.
Projections for the reservations indicate that the population will grow steadily within all age groups by
2025. Each reservation shows consistent growth, with Fort Berthold expecting the largest growth of 11
percent within each age group.
TRENDS IN HOUSING
Total housing units within North Dakota reservations grew in three out of the four reservations from 2000
to 2010. Fort Berthold saw an increase of 15 percent; Spirit Lake saw the only decrease at 15 percent.
Based on historical building trends (i.e., the basis for Model 1 projections), housing supply for North
Dakota reservations is expected to grow by approximately 2,500 units by 2025. Fort Berthold’s housing
units could increase by half in the next 15 years. In contrast, Spirit Lake could potentially lose 3 percent of its housing supply by 2025.
Using projections based on shifts in population and housing demand (i.e., the basis for Model 2) rather than on historical building trends, each reservation is expected to grow in the next
15 years; however, Model 2 projects slower growth than Model 1 for Fort Berthold, Standing Rock, and Turtle Mountain.
In 2010, owner- and renter-occupied housing units were pretty evenly split within the reservations with the exception of Turtle Mountain where nearly three-fourths of housing was
owner-occupied. Over the next 15 years, rental units are expected to increase by 169 units in Standing Rock and by 297 in Turtle Mountain; Spirit Lake could see a 13 percent loss of
rental units while Fort Berthold may see very little change.
Very few owner- or rental-units in North Dakota’s reservations were considered substandard (i.e., lacking complete plumbing or kitchen facilities) in 2010. Approximately 10 percent of
owner-occupied units in Spirit Lake, Standing Rock, and Turtle Mountain were overcrowded (i.e., more than one person per room) in 2010; rates of overcrowding were higher for rental
units.
The majority of owner- and renter-occupied housing units within North Dakota’s reservations were built prior to 1980; in Fort Berthold, one-third of owner-occupied units were built prior
to 1940 and one-fifth of rental units were built prior to 1940.
There were 2,031 vacant housing units among the four reservations in 2010, 59 percent of which were in Fort Berthold. Among the four reservations, Turtle Mountain had the largest
proportions of vacant units available for sale or rent. The majority of vacant units in Fort Berthold and Spirit Lake were for seasonal, recreational, or occasional use.
ECONOMICS OF HOUSING
According to 2010 data from the U.S. Census Bureau’s American Community Survey, median values of owner-occupied housing units for North Dakota’s reservations ranged from $41,500
for Turtle Mountain to $71,800 for Standing Rock. Median gross rents ranged from $292 per month for Turtle Mountain to $509 for Fort Berthold.
Half of owner-occupied housing units for each reservation were valued at less than $70,000 in 2010; at least one-third were valued at less than $40,000.
At least 42 percent of renter-occupied housing units in Spirit Lake, Standing Rock, and Turtle Mountain rented for less than $350 per month in 2010. Within Fort Berthold, 42 percent of
units rented for at least $550 per month.
Projections for reservations indicate an increase in the number of households within each income category by 2025. Increases for each reservation are fairly consistent across each
income category.

2012 NORTH DAKOTA STATEWIDE HOUSING NEEDS ASSESSMENT: HOUSING FORECAST PROFILES – NATIVE AMERICAN INDIAN RESERVATIONS 100
TABLE 1. TOTAL POPULATION, 2000 to 2025
Area 2000 2010
Change: 2000 to
2010
Projections Change: 2010 to
2025 2015 2020 2025
North Dakota 642,200 672,591 4.7% 750,023 806,541 841,820 25.2%
Fort Berthold 5,915 6,341 7.2% 6,569 6,798 7,026 10.8%
Spirit Lake 4,435 4,238 -4.4% 4,374 4,510 4,646 9.6%
Standing Rock 4,044 4,153 2.7% 4,209 4,265 4,321 4.0%
Turtle Mountain 8,307 8,656 4.2% 8,838 9,020 9,201 6.3%
TABLE 3. TOTAL HOUSING UNITS, 2000 to 2025 (Building Trends – Model 1)
Area 2000 2010
Change: 2000 to
2010
Projections – Model 1 Change: 2010 to
2025 2015 2020 2025
North Dakota 289,677 312,861 8.0% 333,259 348,710 364,153 16.4%
Fort Berthold 2,881 3,322 15.3% 4,074 4,533 4,993 50.3%
Spirit Lake 1,534 1,300 -15.3% 1,364 1,311 1,257 -3.3%
Standing Rock 1,216 1,307 7.5% 1,362 1,413 1,465 12.1%
Turtle Mountain 2,640 2,802 6.1% 3,146 3,328 3,510 25.3%
TABLE 2. POPULATION BY AGE, 2010 and 2030
Area
Less Than 25 Years of Age Ages 25 to 44 Ages 45 to 64 65 Years and Older
2010 2025 Change: 2010
to 2025 2010 2025
Change: 2010 to 2025
2010 2025 Change: 2010
to 2025 2010 2025
Change: 2010 to 2025
North Dakota 230,891 272,286 17.9% 165,747 235,026 41.8% 178,476 186,448 4.5% 97,477 148,060 51.9%
Fort Berthold 2,703 2,995 10.8% 1,464 1,622 10.8% 1,600 1,773 10.8% 574 636 10.8%
Spirit Lake 2,220 2,434 9.6% 979 1,073 9.6% 739 810 9.6% 300 329 9.6%
Standing Rock 2,001 2,082 4.0% 1,059 1,102 4.0% 799 831 4.0% 294 306 4.0%
Turtle Mountain 4,132 4,392 6.3% 2,071 2,202 6.3% 1,885 2,004 6.3% 568 604 6.3%

2012 NORTH DAKOTA STATEWIDE HOUSING NEEDS ASSESSMENT: HOUSING FORECAST PROFILES – NATIVE AMERICAN INDIAN RESERVATIONS 101
TABLE 4. TOTAL OCCUPIED HOUSING UNITS, 2000 to 2025
Area 2000 2010
Change: 2000 to
2010
Projections Change: 2010 to
2025 2015 2020 2025
North Dakota 257,152 276,642 7.6% 315,830 342,933 360,071 30.2%
Fort Berthold 1,894 2,132 12.6% 2,044 2,251 2,326 9.1%
Spirit Lake 1,253 1,082 -13.6% 1,094 1,188 1,224 13.1%
Standing Rock 1,095 1,060 -3.2% 1,090 1,189 1,205 13.7%
Turtle Mountain 2,483 2,426 -2.3% 2,592 2,808 2,866 18.1%
TABLE 5. OCCUPIED HOUSING UNITS BY TENURE, 2010
Area Total Occupied Housing Units
Owner-Occupied
Renter-Occupied
Number
Percent
Number
Percent
North Dakota 276,642 184,117 66.6% 92,525 33.4%
Fort Berthold 2,132 1,157 54.3% 975 45.7%
Spirit Lake 1,082 468 43.3% 614 56.7%
Standing Rock 1,060 530 50.0% 530 50.0%
Turtle Mountain 2,426 1,745 71.9% 681 28.1%
TABLE 6. VACANT HOUSING UNITS BY STATUS, 2010
Area
Total Vacant
Housing Units
For Rent For Sale Only Rented or Sold, Not Occupied For Seasonal, Recreational, or
Occasional Use For Migrant Workers Other Vacant
Number Percent Number Percent Number Percent Number Percent Number Percent Number Percent
North Dakota 36,219 6,499 17.9% 2,623 7.2% 4,660 12.9% 12,327 34.0% 303 0.8% 9,807 27.1%
Fort Berthold 1,190 60 5.0% 20 1.7% 91 7.6% 832 69.9% 0 0.0% 187 15.7%
Spirit Lake 218 22 10.1% 0 0.0% 9 4.1% 149 68.3% 0 0.0% 38 17.4%
Standing Rock 247 17 6.9% 5 2.0% 10 4.0% 51 20.6% 0 0.0% 164 66.4%
Turtle Mountain 376 109 29.0% 52 13.8% 13 3.5% 78 20.7% 0 0.0% 124 33.0%

2012 NORTH DAKOTA STATEWIDE HOUSING NEEDS ASSESSMENT: HOUSING FORECAST PROFILES – NATIVE AMERICAN INDIAN RESERVATIONS 102
TABLE 7. SUBSTANDARD OCCUPIED HOUSING UNITS BY TENURE, 2010
Area
Owner-Occupied Housing Units
Renter-Occupied Housing Units
Total
Lacking Complete Plumbing Facilities
Lacking Complete Kitchen Facilities
Overcrowded: 1.01 or More Occupants Per Room
Total
Lacking Complete Plumbing Facilities
Lacking Complete Kitchen Facilities
Overcrowded: 1.01 or More Occupants Per Room
Number Percent Number Percent Number Percent Number Percent Number Percent Number Percent
North Dakota 184,117 440 0.2% 357 0.2% 1,328 0.7% 92,525 280 0.3% 1,391 1.5% 1,631 1.8%
Fort Berthold 1,157 7 0.6% 0 0.0% 28 2.4% 975 0 0.0% 10 1.0% 129 13.2%
Spirit Lake 468 10 2.1% 13 2.8% 36 7.7% 614 11 1.8% 21 3.4% 111 18.1%
Standing Rock 530 9 1.7% 0 0.0% 54 10.2% 530 0 0.0% 0 0.0% 88 16.6%
Turtle Mountain
1,745 18 1.0% 18 1.0% 196 11.2% 681 0 0.0% 0 0.0% 92 13.5%
TABLE 8. YEAR OCCUPIED HOUSING UNIT BUILT BY TENURE, 2010
Area
Owner-Occupied Housing Units Renter-Occupied Housing Units
Total
Built 1980 to Present Built 1940 to 1979 Built Prior to 1940
Total
Built 1980 to Present Built 1940 to 1979 Built Prior to 1940
Number Percent Number Percent Number Percent Number Percent Number Percent Number Percent
North Dakota 184,117 39,090 21.2% 80,700 43.8% 64,327 34.9% 92,525 22,269 24.1% 47,173 51.0% 23,083 24.9%
Fort Berthold 1,157 214 18.5% 522 45.1% 421 36.4% 975 166 17.0% 624 64.0% 185 19.0%
Spirit Lake 468 114 24.4% 238 50.9% 116 24.8% 614 70 11.4% 445 72.5% 99 16.1%
Standing Rock 530 126 23.8% 256 48.3% 148 27.9% 530 133 25.1% 354 66.8% 43 8.1%
Turtle Mountain
1,745 374 21.4% 1,223 70.1% 148 8.5% 681 60 8.8% 572 84.0% 49 7.2%

2012 NORTH DAKOTA STATEWIDE HOUSING NEEDS ASSESSMENT: HOUSING FORECAST PROFILES – NATIVE AMERICAN INDIAN RESERVATIONS 103
FIGURE 1. MEDIAN VALUE OF ALL OWNER-OCCUPIED HOUSING UNITS, 2010
TABLE 9. VALUE OF ALL OWNER-OCCUPIED HOUSING UNITS, 2010
Area
Owner-Occupied Housing Units by Value
Total
Less Than $40,000 $40,000 to $69,999 $70,000 to $89,999 $90,000 to $124,999 $125,000 to $199,999 $200,000 or More
Number Percent Number Percent Number Percent Number Percent Number Percent Number Percent
North Dakota 184,117 29,852 16.2% 23,312 12.7% 19,741 10.7% 31,397 17.1% 48,782 26.5% 31,033 16.9%
Fort Berthold 1,157 381 32.9% 252 21.8% 189 16.3% 126 10.9% 122 10.5% 87 7.5%
Spirit Lake 468 207 44.2% 67 14.3% 57 12.2% 53 11.3% 45 9.6% 39 8.3%
Standing Rock 530 178 33.6% 75 14.2% 88 16.6% 49 9.2% 73 13.8% 67 12.6%
Turtle Mountain
1,745 861 49.3% 297 17.0% 201 11.5% 191 10.9% 80 4.6% 115 6.6%
$111,300
$57,900
$50,700
$71,800
$41,500
$-
$20,000
$40,000
$60,000
$80,000
$100,000
$120,000
North Dakota Fort Berthold Reservation Spirit Lake Reservation Standing Rock Reservation Turtle Mountain Reservation

2012 NORTH DAKOTA STATEWIDE HOUSING NEEDS ASSESSMENT: HOUSING FORECAST PROFILES – NATIVE AMERICAN INDIAN RESERVATIONS 104
FIGURE 2. MEDIAN GROSS RENT OF RENTER-OCCUPIED HOUSING UNITS PAYING CASH RENT, 2010
TABLE 10. GROSS RENT OF RENTER-OCCUPIED HOUSING UNITS PAYING CASH RENT, 2010
Area
Renter-Occupied Housing Units Paying Cash Rent by Monthly Gross Rent
Total
Less Than $250 $250 to $349 $350 to $449 $450 to $549 $550 to $749 $750 or More
Number Percent Number Percent Number Percent Number Percent Number Percent Number Percent
North Dakota 84,113 5,734 6.8% 6,606 7.9% 12,520 14.9% 16,475 19.6% 24,831 29.5% 17,947 21.3%
Fort Berthold 830 143 17.2% 96 11.6% 107 12.9% 139 16.7% 235 28.3% 110 13.3%
Spirit Lake 509 143 28.1% 84 16.5% 141 27.7% 64 12.6% 74 14.5% 3 0.6%
Standing Rock 466 100 21.5% 95 20.4% 86 18.5% 79 17.0% 82 17.6% 24 5.2%
Turtle Mountain
651 234 35.9% 163 25.0% 105 16.1% 29 4.5% 55 8.4% 65 10.0%
$555
$509
$365
$406
$292
$-
$100
$200
$300
$400
$500
$600
North Dakota Fort Berthold Reservation Spirit Lake Reservation Standing Rock Reservation Turtle Mountain Reservation

2012 NORTH DAKOTA STATEWIDE HOUSING NEEDS ASSESSMENT: HOUSING FORECAST PROFILES – NATIVE AMERICAN INDIAN RESERVATIONS 105
TABLE 11. NUMBER OF HOUSEHOLDS BY INCOME LEVELS AS A PERCENT OF THE MEDIAN FAMILY INCOME (MFI), 2010 and 2025
Area
Extremely Low: 0-30% MFI (Less than $20,000 in 2010)
Very Low: 31-50% MFI ($20,000 to $29,999 in 2010)
Low Income: 51-80% MFI ($30,000 to $49,999 in 2010)
Moderate: 81-115% MFI ($50,000 to $74,999 in 2010)
Upper: Above 115% MFI ($75,000 or more in 2010)
Tax Credit: 51 to 60% MFI ($30,000 to $39,999 in 2010)
2010 2025 %
Change 2010 2025 %
Change 2010 2025 %
Change 2010 2025 %
Change 2010 2025 %
Change 2010 2025 %
Change
North Dakota 55,436 72,699 31.1% 33,078 43,540 31.6% 57,935 75,736 30.7% 55,089 71,784 30.3% 75,104 96,296 28.2% 30,980 40,547 30.9%
Fort Berthold 637 699 9.7% 209 232 11.0% 378 413 9.3% 505 546 8.1% 403 435 7.9% 155 170 9.7%
Spirit Lake 455 532 16.9% 148 158 6.8% 222 249 12.2% 146 162 11.0% 111 122 9.9% 136 146 7.4%
Standing Rock 379 434 14.5% 132 148 12.1% 226 257 13.7% 144 164 13.9% 179 203 13.4% 137 154 12.4%
Turtle Mountain 1,065 1,236 16.1% 427 483 13.1% 440 533 21.1% 273 335 22.7% 221 279 26.2% 260 326 25.4%
TABLE 12. TOTAL HOUSING UNITS, 2000 to 2025 (Projected Demand – Model 2) TABLE 13. CHANGE IN RENTER-OCCUPIED HOUSING UNITS, 2010 to 2025
Area Renter-Occupied Housing Units,
2010
Change in Renter-Occupied Housing Units
2010 to 2015 2010 to 2020 2010 to 2025
3 Numeric % Numeric % Numeric %
North Dakota 92,525 17,296 18.7% 26,929 29.1% 33,412 36.1%
Fort Berthold 975 -35 -3.6% -35 -3.6% -4 -0.4%
Spirit Lake 614 -103 -16.8% -96 -15.6% -81 -13.2%
Standing Rock 530 165 31.1% 160 30.2% 169 31.9%
Turtle Mountain 681 286 42.0% 275 40.4% 297 43.6%
Area 2000 2010
Change: 2000 to
2010
Projections – Model 2 Change: 2010 to
2025 2015 2020 2025
North Dakota 289,677 312,861 8.0% 355,183 384,481 403,330 28.9%
Fort Berthold 2,881 3,322 15.3% 3,391 4,198 4,527 36.3%
Spirit Lake 1,534 1,300 -15.3% 1,433 1,371 1,350 3.8%
Standing Rock 1,216 1,307 7.5% 1,206 1,355 1,380 5.6%
Turtle Mountain 2,640 2,802 6.1% 2,802 3,139 3,233 15.4%