2012 outlook - pwc.com · pdf filecheap, longer term permanent capital with low, fixed rate...
TRANSCRIPT

2012 Outlook Fixed Income – Cyclical Credits
Paper, Packaging and Forest Products
GLOBAL I RESEARCH
RBC Capital Markets, LLC.
Bill Hoffmann (Analyst) (212) 428-2362 [email protected]
May 7, 2012
This report is priced as of market close May 7, 2012
All values are in U.S. dollars unless otherwise noted.
For Required U.S. Analyst and Conflicts Disclosures, please see page 13.

2
Paper and Forest Products – Investment Themes: Looking for Growth
Investment Views – High Yield Overview and Outlook
Fundamental Outlook – Tenuous recovery
Financial Update – Benefits of Consolidation
Growth Strategies – Consolidation and Diversification
Investor Focus - Fixed Income vs Equities
3
Fixed Income – High Yield Market Primer
High Yield – Below Investment Grade Corporate Bonds and Bank Loans
We Specialize in Paper and Forest Products, Packaging and Chemicals.
Bonds – typically 7 to 10 years, few covenants.
Leveraged Bank Loans – typically up to 7 years, include maintenance covenants.
Attractive Asset Class for investors, Focus on Total Return and interest coupon.
Average Yield is currently 7% compared to 5 year Treasuries at 0.78%.
Investment Grade Corporate bonds are currently yielding 4% or 200 basis points over Treasuries.
6% total return YTD for High Yield compared to a 6.4% Equity Return.
Equity Market Volatility remains a concern for Investors.
Investment returns are driven by Capital Flows into and out of the markets and New Issues.
Investment funds include High Yield Mutual Funds, Insurance Companies, Hedge Funds, Equity Income Funds, Bank Loan Funds and now ETFs.
Coupon interest typically builds up in funds, forcing additional investments.
Capital Inflows support market liquidity for Corporations to raise debt capital or refinance loans.
$18.1bn of HY capital inflows year to date in 2012. $10.9bn for all of 2011.
New Issuance in 2012 has been $125.7bn YTD. Total for 2011 was $256bn.
Attractive Financing alternative for Corporations.
Cheap, longer term permanent capital with low, fixed rate interest costs.

4
High Yield Market Outlook
We expect High Yield Markets to be attractive relative to HG Corporate bonds, Treasuries, and Equities.
We are expecting high single digit returns in 2012, following 3 solid years.
2011 Total Return for HY was approximately 4.4% and 14.3% in 2010. Equities returned 5.5% in 2011 and 6.4% YTD.
We remain constructive on the Economic outlook in North America and globally.
However, growth is constrained by government deficits, chronic unemployment, a challenged housing market and headline risk from China and Europe.
Relative Value Analysis:
The Paper and Forest Products Sector has slightly outperformed the market in 2012 after underperforming in 2011.
Average Yield for High Yield is 7.0%, tightening by 100 basis points since the beginning of the year.
10 year Treasury has been volatile and is currently 1.8%.
Source: Bloomberg
Sector Total Return- 2012 YTD
-1.0%
1.0%
3.0%
5.0%
7.0%
01/0
5
01/1
2
01/1
9
01/2
6
02/0
2
02/0
9
02/1
6
02/2
3
03/0
1
03/0
8
03/1
5
03/2
2
03/2
9
04/0
5
04/1
2
04/1
9
04/2
6
05/0
3
HY Index Paper
Paper vs DJIA Perfomance
0%
5%
10%
15%
1/5
1/27
2/16
3/8
3/29
4/16
5/3
Paper Index DJIA
5
Fundamental Outlook – Tenuous Recovery
Paper and Forest Products Outlook
We expect a sluggish, but positive demand recovery for packaging segments in 2012.
GDP growth in the range of 2.0%.
Containerboard remains balanced, with slight discounting but active capacity management.
Paperboard packaging markets sufficiently consolidated to support balanced markets.
Pulp Markets are expected to recover more slowly than normal in 2012, with weak European paper
demand freeing up Market Pulp availability. Prices have troughed and are beginning to improve.
Building Products (lumber and Panels) slow recovery should provide trading opportunities
UFS has lost pricing momentum, but rational industry behaviour should support attractive cash flows.
Coated paper segments begin the year weakly, but should firm in the second half of the year. Further
rationalization will likely be required.
Newsprint and Groundwood Specialties continue to be challenged by secular demand declines. Export
markets have also been weak. Further Rationalization is required.
6
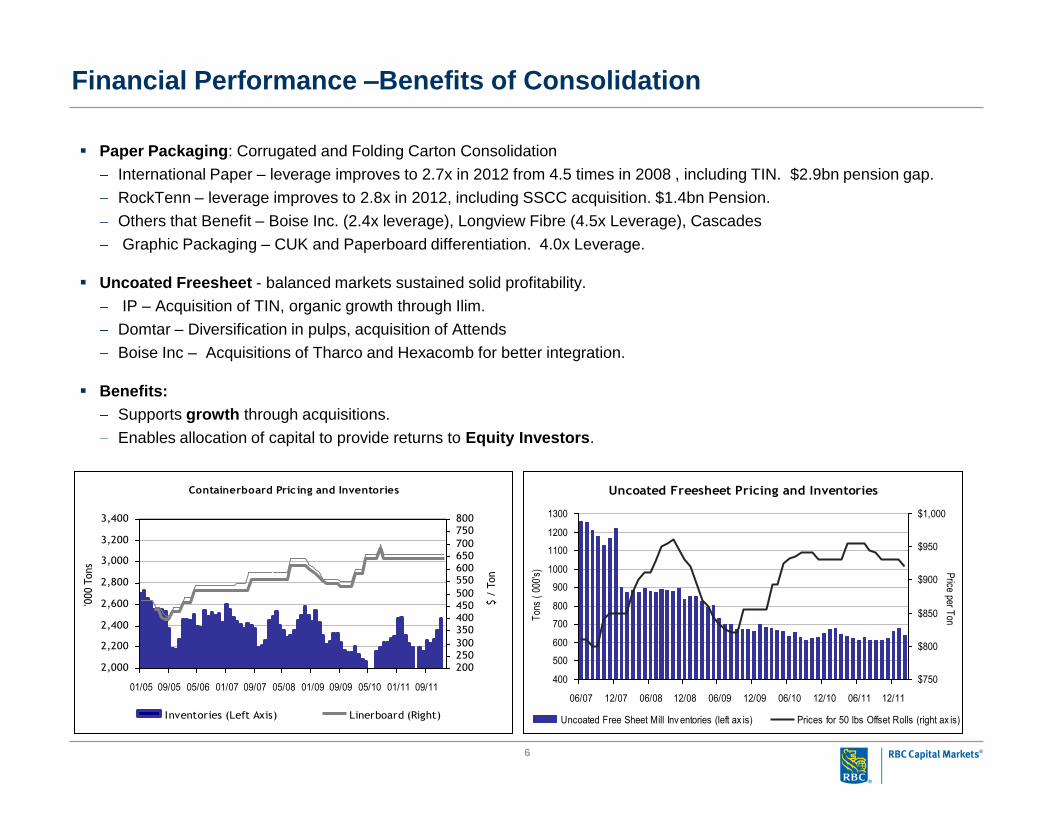
Financial Performance –Benefits of Consolidation
Paper Packaging: Corrugated and Folding Carton Consolidation
International Paper – leverage improves to 2.7x in 2012 from 4.5 times in 2008 , including TIN. $2.9bn pension gap.
RockTenn – leverage improves to 2.8x in 2012, including SSCC acquisition. $1.4bn Pension.
Others that Benefit – Boise Inc. (2.4x leverage), Longview Fibre (4.5x Leverage), Cascades
Graphic Packaging – CUK and Paperboard differentiation. 4.0x Leverage.
Uncoated Freesheet - balanced markets sustained solid profitability.
IP – Acquisition of TIN, organic growth through Ilim.
Domtar – Diversification in pulps, acquisition of Attends
Boise Inc – Acquisitions of Tharco and Hexacomb for better integration.
Benefits:
Supports growth through acquisitions.
Enables allocation of capital to provide returns to Equity Investors.
Containerboard Pric ing and Inventories
2,000
2,200
2,400
2,600
2,800
3,000
3,200
3,400
01/05 09/05 05/06 01/07 09/07 05/08 01/09 09/09 05/10 01/11 09/11
'000 T
ons
200
250
300
350
400
450
500
550
600
650
700
750
800
$ /
Ton
Inventories (Left Axis) Linerboard (Right)
Uncoated Freesheet Pricing and Inventories
400
500
600
700
800
900
1000
1100
1200
1300
06/07 12/07 06/08 12/08 06/09 12/09 06/10 12/10 06/11 12/11
Ton
s (
000'
s)
$750
$800
$850
$900
$950
$1,000
Price per T
on
Uncoated Free Sheet Mill Inv entories (left ax is) Prices for 50 lbs Offset Rolls (right ax is)

7
Financial Performance –Sectors that Need Consolidation
Newsprint and Groundwood Specialties:
Resolute Forest Products (Abitibii Bowater): already restructured, but struggles for growth.
White Birch, Catalyst Paper, SP Newsprint in Bankruptcy.
Coated Paper:
NewPage in bankruptcy
Verso with 7.0 times leverage
Sappi Paper – benefits from its global pulp business.
Forest Products:
Highly Fragmented; especially in lumber
Panel Producers are more concentrated, but with significant excess capacity. (OSB Top 5-75%)
Market Pulp:
Global Consolidation ? – China is pulp short, but works the pricing cycles well
Challenges from Latin American supply and supply from Scandanavia and Russia.
Coated Groundwood Pricing and Inventories
0
50
100
150
200
250
300
350
400
06/0
710
/07
02/0
806
/08
10/0
802
/09
06/0
910
/09
02/1
006
/10
10/1
002
/11
06/1
110
/11
02/1
2
'000
Sho
rt T
ons
600
700
800
900
1000
1100
1200
US
$ /
Sho
rt T
on
Coated Groundw ood Mill Inv entories Price for #5 40 lb rolls CGW (Right Ax is)
Newsprint Pric ing and Inventories
0.0
200.0
400.0
600.0
800.0
1000.0
1200.0
1400.0
1600.0
01/0
501
/06
01/0
701
/08
01/0
901
/10
01/1
101
/12
'000
Ton
nes
200
300
400
500
600
700
800
$ /
Ton
ne
New sprint Inv entories (Left Ax is) New sprint Prices (Right Ax is)
8
Looking for Growth
Paper and Forest Products Companies suffer from a lack of attractive Growth Potential
Strategies:
Acquisitions to gain Scale: Consolidation in Packaging
International Paper, Rock-Tenn, Georgia Pacific, Reynolds Packaging,
Diversification and Integration:
Domtar acquisition of Attends
Boise acquisition of Hexacomb and Tharco.
Mercer, Tembec, Domtar investing in Power Assets
Appleton Paper / Domtar supply agreement.
Organic Growth:
Sappi Paper investing in Pulp Capacity
IP investments in Ilim.
Acquisitions to Rationalize:
Resolute Forest Products (AbitibiBowater)
More needed in Newsprint and Groundwood Specialties.
9
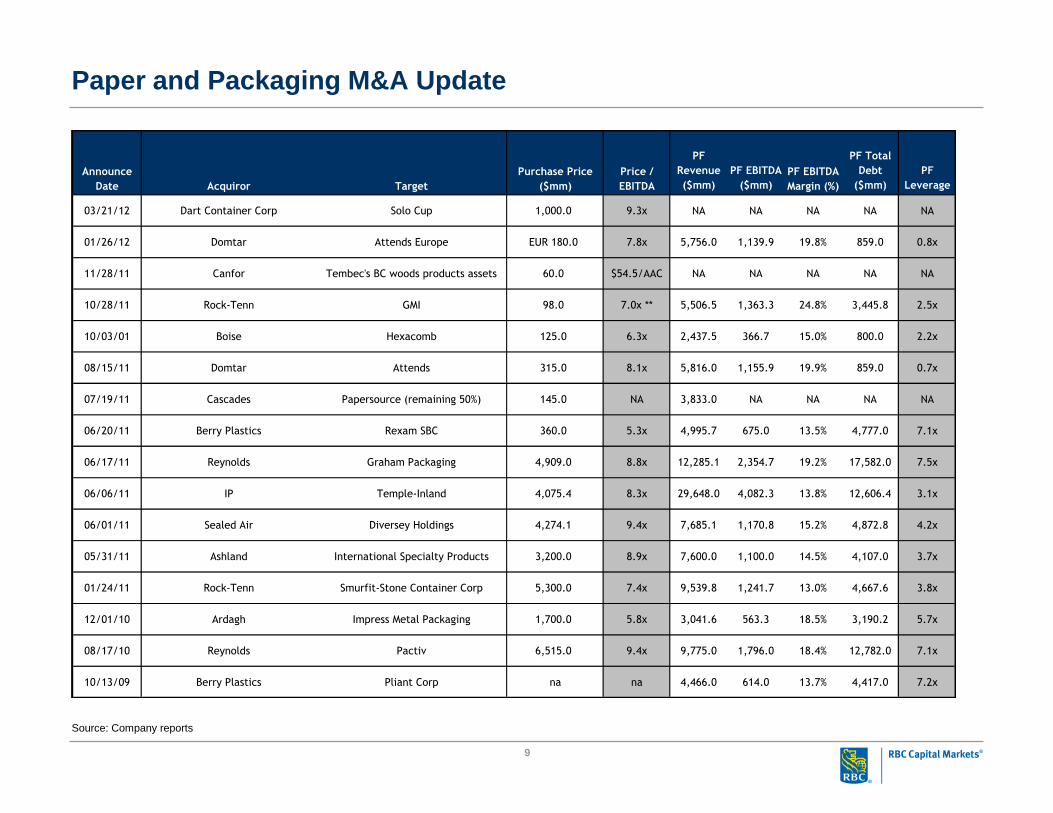
Paper and Packaging M&A Update
Source: Company reports
PF
Revenue
($mm)
PF EBITDA
($mm)
PF Total
Debt
($mm)
PF
Leverage
03/21/12 Dart Container Corp Solo Cup 1,000.0 9.3x NA NA NA NA NA
01/26/12 Domtar Attends Europe EUR 180.0 7.8x 5,756.0 1,139.9 19.8% 859.0 0.8x
11/28/11 Canfor Tembec's BC woods products assets 60.0 $54.5/AAC NA NA NA NA NA
10/28/11 Rock-Tenn GMI 98.0 7.0x ** 5,506.5 1,363.3 24.8% 3,445.8 2.5x
10/03/01 Boise Hexacomb 125.0 6.3x 2,437.5 366.7 15.0% 800.0 2.2x
08/15/11 Domtar Attends 315.0 8.1x 5,816.0 1,155.9 19.9% 859.0 0.7x
07/19/11 Cascades Papersource (remaining 50%) 145.0 NA 3,833.0 NA NA NA NA
06/20/11 Berry Plastics Rexam SBC 360.0 5.3x 4,995.7 675.0 13.5% 4,777.0 7.1x
06/17/11 Reynolds Graham Packaging 4,909.0 8.8x 12,285.1 2,354.7 19.2% 17,582.0 7.5x
06/06/11 IP Temple-Inland 4,075.4 8.3x 29,648.0 4,082.3 13.8% 12,606.4 3.1x
06/01/11 Sealed Air Diversey Holdings 4,274.1 9.4x 7,685.1 1,170.8 15.2% 4,872.8 4.2x
05/31/11 Ashland International Specialty Products 3,200.0 8.9x 7,600.0 1,100.0 14.5% 4,107.0 3.7x
01/24/11 Rock-Tenn Smurfit-Stone Container Corp 5,300.0 7.4x 9,539.8 1,241.7 13.0% 4,667.6 3.8x
12/01/10 Ardagh Impress Metal Packaging 1,700.0 5.8x 3,041.6 563.3 18.5% 3,190.2 5.7x
08/17/10 Reynolds Pactiv 6,515.0 9.4x 9,775.0 1,796.0 18.4% 12,782.0 7.1x
10/13/09 Berry Plastics Pliant Corp na na 4,466.0 614.0 13.7% 4,417.0 7.2x
Announce
Date Acquiror
Price /
EBITDA
Purchase Price
($mm)Target
PF EBITDA
Margin (%)
10
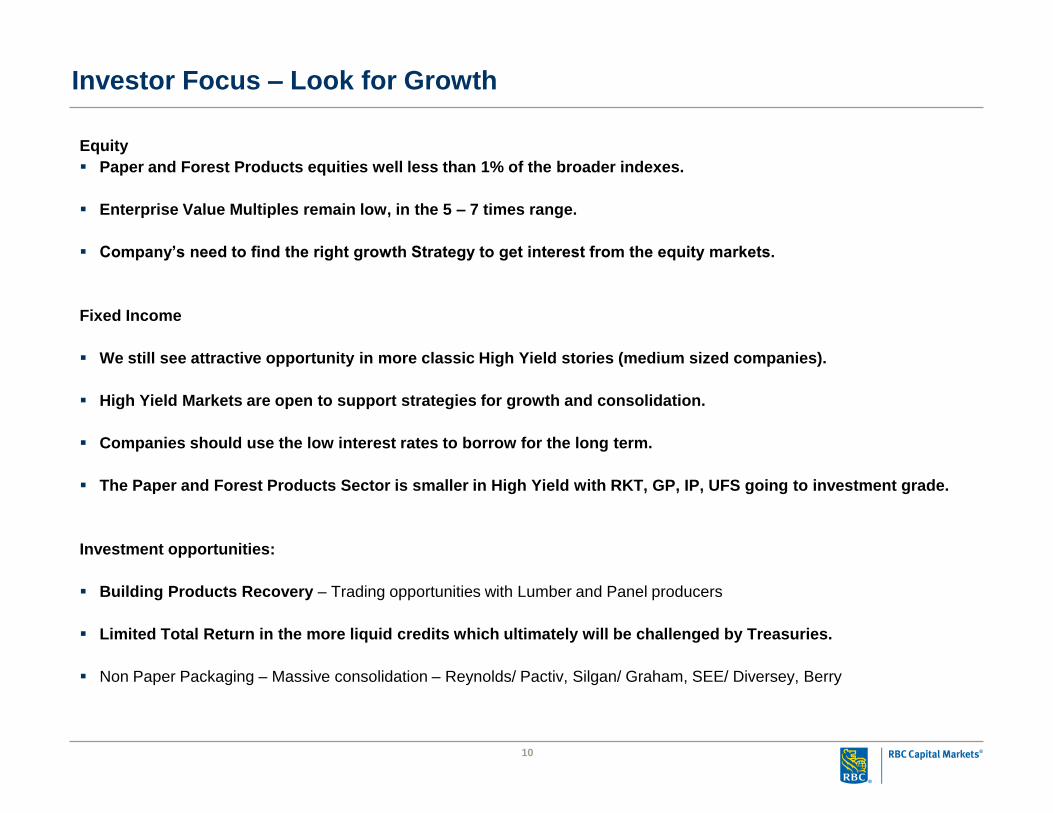
Investor Focus – Look for Growth
Equity
Paper and Forest Products equities well less than 1% of the broader indexes.
Enterprise Value Multiples remain low, in the 5 – 7 times range.
Company’s need to find the right growth Strategy to get interest from the equity markets.
Fixed Income
We still see attractive opportunity in more classic High Yield stories (medium sized companies).
High Yield Markets are open to support strategies for growth and consolidation.
Companies should use the low interest rates to borrow for the long term.
The Paper and Forest Products Sector is smaller in High Yield with RKT, GP, IP, UFS going to investment grade.
Investment opportunities:
Building Products Recovery – Trading opportunities with Lumber and Panel producers
Limited Total Return in the more liquid credits which ultimately will be challenged by Treasuries.
Non Paper Packaging – Massive consolidation – Reynolds/ Pactiv, Silgan/ Graham, SEE/ Diversey, Berry
11
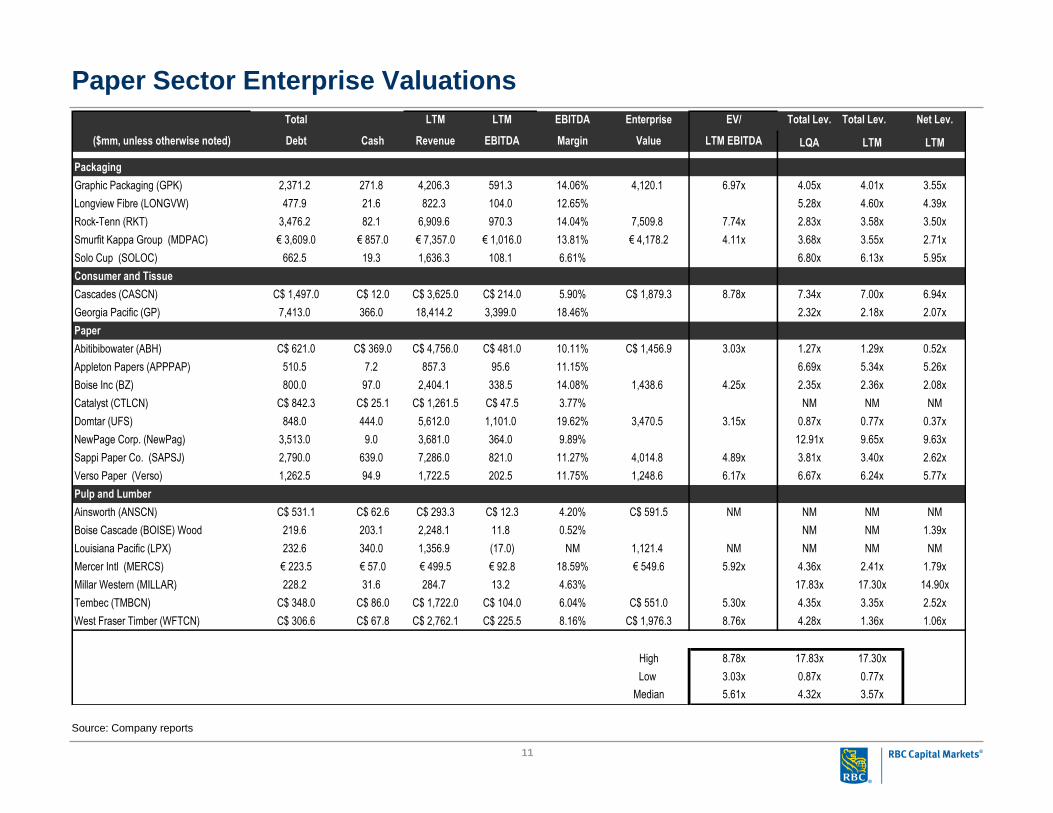
Paper Sector Enterprise Valuations
Source: Company reports
Total LTM LTM EBITDA Enterprise EV/ Total Lev. Total Lev. Net Lev.
($mm, unless otherwise noted) Debt Cash Revenue EBITDA Margin Value LTM EBITDA LQA LTM LTM
Packaging
Graphic Packaging (GPK) 2,371.2 271.8 4,206.3 591.3 14.06% 4,120.1 6.97x 4.05x 4.01x 3.55x
Longview Fibre (LONGVW) 477.9 21.6 822.3 104.0 12.65% 5.28x 4.60x 4.39x
Rock-Tenn (RKT) 3,476.2 82.1 6,909.6 970.3 14.04% 7,509.8 7.74x 2.83x 3.58x 3.50x
Smurfit Kappa Group (MDPAC) € 3,609.0 € 857.0 € 7,357.0 € 1,016.0 13.81% € 4,178.2 4.11x 3.68x 3.55x 2.71x
Solo Cup (SOLOC) 662.5 19.3 1,636.3 108.1 6.61% 6.80x 6.13x 5.95x
Consumer and Tissue
Cascades (CASCN) C$ 1,497.0 C$ 12.0 C$ 3,625.0 C$ 214.0 5.90% C$ 1,879.3 8.78x 7.34x 7.00x 6.94x
Georgia Pacific (GP) 7,413.0 366.0 18,414.2 3,399.0 18.46% 2.32x 2.18x 2.07x
Paper
Abitibibowater (ABH) C$ 621.0 C$ 369.0 C$ 4,756.0 C$ 481.0 10.11% C$ 1,456.9 3.03x 1.27x 1.29x 0.52x
Appleton Papers (APPPAP) 510.5 7.2 857.3 95.6 11.15% 6.69x 5.34x 5.26x
Boise Inc (BZ) 800.0 97.0 2,404.1 338.5 14.08% 1,438.6 4.25x 2.35x 2.36x 2.08x
Catalyst (CTLCN) C$ 842.3 C$ 25.1 C$ 1,261.5 C$ 47.5 3.77% NM NM NM
Domtar (UFS) 848.0 444.0 5,612.0 1,101.0 19.62% 3,470.5 3.15x 0.87x 0.77x 0.37x
NewPage Corp. (NewPag) 3,513.0 9.0 3,681.0 364.0 9.89% 12.91x 9.65x 9.63x
Sappi Paper Co. (SAPSJ) 2,790.0 639.0 7,286.0 821.0 11.27% 4,014.8 4.89x 3.81x 3.40x 2.62x
Verso Paper (Verso) 1,262.5 94.9 1,722.5 202.5 11.75% 1,248.6 6.17x 6.67x 6.24x 5.77x
Pulp and Lumber
Ainsworth (ANSCN) C$ 531.1 C$ 62.6 C$ 293.3 C$ 12.3 4.20% C$ 591.5 NM NM NM NM
Boise Cascade (BOISE) Wood 219.6 203.1 2,248.1 11.8 0.52% NM NM 1.39x
Louisiana Pacific (LPX) 232.6 340.0 1,356.9 (17.0) NM 1,121.4 NM NM NM NM
Mercer Intl (MERCS) € 223.5 € 57.0 € 499.5 € 92.8 18.59% € 549.6 5.92x 4.36x 2.41x 1.79x
Millar Western (MILLAR) 228.2 31.6 284.7 13.2 4.63% 17.83x 17.30x 14.90x
Tembec (TMBCN) C$ 348.0 C$ 86.0 C$ 1,722.0 C$ 104.0 6.04% C$ 551.0 5.30x 4.35x 3.35x 2.52x
West Fraser Timber (WFTCN) C$ 306.6 C$ 67.8 C$ 2,762.1 C$ 225.5 8.16% C$ 1,976.3 8.76x 4.28x 1.36x 1.06x
High 8.78x 17.83x 17.30x
Low 3.03x 0.87x 0.77x
Median 5.61x 4.32x 3.57x

12
Pricing Outlook
Current Previous Last YTD Forecasts
Commodity Price Week Month Year ago 2007 2008 2009 2010 2011 2012 2012E 2013E
Lumber Random Lengths Composite 296 298 285 294 283 252 222 283 272 289 280 320
W. SPF 2x4s #2&btr ($/mfbm) 276 279 264 294 250 221 182 255 255 268 260 285
E.SPF 2x4 G.L. ($/mfbm) 370 374 359 382 329 305 270 341 344 361 345 370
SPF 2x4s 8' KD Studs ($/mfbm) 265 265 249 277 264 212 185 246 243 252 270 295
SYP 2x4 West ($/mfbm) 308 309 303 287 279 298 242 303 279 305 290 325
Panels OSB (7/16", NC, $/msf) 207 202 194 189 160 172 163 219 187 203 200 210
Plywood (3/8", $/msf) 350 351 320 316 344 316 291 324 312 332 320 320
MDF (3/4", West, $/msf) 545 545 535 535 456 513 463 524 535 537 540 540
Pulp NBSK ($/tonne) 870 870 990 824 857 718 960 977 878 910 965
FOEX US NBSK ($/tonne) 895 870 870 979 819 861 715 955 978 875
Fluff ($/tonne) 910 910 1,035 830 908 793 998 1,017 304 950 1,005
Commodity DP ($/tonne) 1,050 1,080 1,255 2,550 1,124 1,131 941 1,706 1,936 1,151 1,150 1,250
Specialty DP [RYN CS] ($/tonne) 1,840 1,840 1,587 1,154 1,272 1,427 1,427 1,636 1,840 1,840 1,900
NBHK ($/tonne) 733 705 820 719 788 608 856 808 714 770 815
Paper Newsprint ($/tonne) 640 640 640 593 701 564 606 640 640 655 665
FOEX US Newsprint ($/tonne) 623 623 623 627 581 672 574 583 625 623
22.5 lb Directory ($/ton) 800 800 730 749 748 708 700 766 800 760 785
35 lb SC-A ($/ton) 840 840 820 751 878 818 791 848 840 845 870
No.5 40 lb LWC ($/ton) 860 860 855 773 950 805 767 886 860 885 900
20lb. Repro bond, 92 cut size ($/ton) 1,035 1,035 1,070 958 1,053 1,025 1,071 1,067 1,038 1,060 1,070
50 lb Offset, Rolls ($/ton) 910 910 920 808 901 836 905 930 913 920 910
Packaging Linerboard ($/ton) 635 635 635 527 577 542 620 635 635 650 675
Medium 26 lb ($/ton) 605 605 605 507 556 512 590 605 605 620 645NBHK (Cdn$/tonne) $732 . . $772 $834
Cdn/US Exchange Rate $1.00 $1.00 $1.00 $0.98 $1.07 $1.06 $1.13 $1.03 $0.99 $1.00 $1.00 $1.00
US/Cdn Exchange Rate $1.00 $1.00 $1.00 $1.02 $0.93 $0.95 $0.88 $0.97 $1.01 $1.00 $1.00 $1.00
Euro/US Exchange Rate € 0.75 € 0.75 € 0.76 € 0.71 € 0.73 € 0.68 € 0.72 € 0.75 € 0.72 € 0.76 € 0.77 € 0.77
Source: Pulp & Paper Week, FOEX Indexes Ltd., Random Lengths, Pacific Exchange Rate Service, RBC Capital Markets estimates

13
RBC Capital Markets Three-Month LIBOR 0.47% Date: 5/4/12
HY Paper Sector Five-Year Treasury 0.84%
cpn Rating Ratings Amt LTM Net EBITDA/ EBITDA/ Total Debt/ Current EV /
Issuer / Rating Coupon Description Maturity Mdy/S&P Outlook (mm) Bid YTW Spread YTW Date Quarter Sales EBITDA Sales Int. Debt EBITDA EV EBITDA
PACKAGING
Graphic Packaging (GPK) LTM 4,206.3 591.3 14.1% 4.1x 4.0x 4120.1 7.0x
Graphic Packaging (GPK) 31-Dec 1,051.7 146.5 13.9% 4.3x 2,371.2 4.0x
Graphic Packaging (GPK) 9.500% Sr. Notes 06/15/17 B2 / BB+ Pos / Stable 425 111.00 3.47% 329 06/15/13
Graphic Packaging (GPK) 7.875% Sr. Notes 10/01/18 B2 / BB+ Pos / Stable 250 111.00 4.54% 424 10/01/14
Longview Fibre (LONGVW) 8.000% Sr. Sec. Notes 06/01/16 B2 / B+ Stable / Stable 480 102.00 7.26% 686 06/01/15 LTM 822.3 104.0 12.6% 4.0x 4.6x
31-Dec 212.6 22.6 10.6% 2.1x 477.9 5.3x
Smurfit Kappa Group (MDPAC) 7.750% Sr. Sub. Notes 04/01/15 B1 / B+ 200 100.00 7.75% 738 06/07/12 LTM Euro 7,357.0 1016.0 13.8% 2.4x 3.6x 4172.6 4.1x
Smurfit Kappa Group (MDPAC) 7.750% 1st Lien Sec. Notes 11/15/19 Ba1 / BB+ NA / Stable € 500.0 99.00 7.93% 696 11/15/14 31-Dec 1,819.0 245.0 13.5% 2.2x 3,609.0 3.6x
Smurfit Kappa Group (MDPAC) 7.250% 1st Lien Sec. Notes 11/15/17 Ba1 / BB+ NA / Stable € 500.0 99.00 7.47% 688 11/15/13
Rock-Tenn (RKT) L +225 Bank Loan TL A 05/27/16 Ba2/BBB- 1475 100.00 2.72% 225 LTM 6,909.6 970.3 14.0% 9.3x 3.6x 7509.8 7.7x
31-Dec 2,267.7 307.1 13.5% 9.4x 3,476.2 2.8x
CONSUMER & TISSUE
Cascades (CASCN) 7.750% Sr Unsecured 12/15/16 Ba3 / B+ Stable / Stable 200 100.00 7.75% 630 12/15/16 LTM 3,625.0 214.0 5.9% 2.1x 7.0x 1879.3 8.8x
Cascades (CASCN) 7.750% Sr Unsecured 12/15/17 Ba3 / B+ Stable / Stable 500 100.00 7.75% 724 12/15/15 31-Dec 913.0 51.0 5.6% 2.0x 1,497.0 7.3x
Cascades (CASCN) 7.875% Sr Unsecured 01/15/20 Ba3 / B+ Stable / Stable 250 99.00 8.05% 661 01/15/18
Georgia Pacific (GP) L + 150 Bank Loan TL A 08/18/16 Baa3/A- 2250 100.00 1.97% 150 LTM 18,414.2 3399.0 18.5% 4.8x 2.2x
Georgia Pacific (GP) 5.400% Sr Gtd 11/01/20 Baa3 / A- Stable / Stable 1250 114.75 3.38% 178 11/01/20 31-Dec 4,065.0 798.0 19.6% 4.7x 7,413.0 2.3x
Georgia Pacific (GP) 8.000% Sr. Notes 01/15/24 Baa3 / A- 500 132.87 4.37% 238 01/15/24
PAPER
Abitibibowater (ABH) 10.250% Sr Sec Notes 10/15/18 B1 / BB- Stable / Stable 850 115.50 5.36% 505 10/15/14 LTM 4,756.0 481.0 10.1% 5.1x 1.3x 1456.9 3.0x
Abitibibowater (ABH) 31-Dec 1,147.0 122.0 10.6% 6.8x 621.0 1.3x
Appleton Papers (APPPAP) L + 463 Bank Loan TL B 6/1/2014 Ba3 / B+ 225 Paid off #VALUE! #VALUE! LTM 857.3 95.6 11.2% 1.6x 5.3x
Appleton Papers (APPPAP) 11.250% 2nd Sr Sec Nts 12/15/15 WR / CCC+ Stable / Stable 161 92.00 14.15% 1365 12/15/15 31-Dec 205.6 19.1 9.3% 1.3x 510.5 6.7x
Appleton Papers (APPPAP) 10.500% 1st Sr Sec Nts 06/15/15 B1 / B+ Stable / Stable 305 102.00 9.23% 899 02/08/14
Boise Inc (BZ) 9.000% Sr Notes 11/01/17 Ba3 / BB NA / NA 300 110.00 4.87% 465 11/01/13 LTM 2,404.1 338.5 14.1% 5.3x 2.4x 1438.6 4.2x
Boise Inc (BZ) 8.000% Sr Notes 04/01/20 Ba3 / BB / NA 300 109.50 5.68% 532 04/01/15 31-Dec 600.4 85.0 14.2% 5.3x 800.0 2.4x
Domtar (UFS) LTM 5,612.0 1101.0 19.6% 12.7x 0.8x 3470.5 3.2x
Domtar (UFS) 9.500% Sr. Notes 08/01/16 Baa3 / BBB- 93 120.00 4.27% 364 08/01/16 31-Dec 1,369.0 243.0 17.7% 12.1x 848.0 0.9x
Domtar (UFS) 10.750% Sr. Notes 06/01/17 Baa3 / BBB- 278 129.75 4.17% 336 06/01/17
Domtar (UFS) 4.400% Sr. Notes 04/01/22 Baa3 / BBB- 300 100.19 4.38% 249 04/01/22
NewPage Corp. (NewPag) 11.375% Sr Sec Notes 12/31/14 WR / NR NA / NA 1700 71.00 27.50% 2716 12/31/14 LTM 3,681.0 364.0 9.9% 1.0x 9.7x Public Equity
NewPage Corp. (NewPag) 10.000% Sr. Notes 05/01/12 WR / NR NA / NA 806 7.00 NM NM 05/01/12 30-Jun 888.0 68.0 7.7% 0.7x 3,513.0 12.9x Lisitng Pending
NewPage Corp. (NewPag) 12.000% Sr. Sub. Notes 05/01/13 WR / NR NA / NA 200
Catalyst (CTLCN) 8.625% Sr. Notes 6/15/2011 WR / NR NA / NA 0 100.00 #VALUE!#N/A Field Not Applicable02/11/11 LTM C$ 1,261.5 47.5 3.8% 0.6x 17.7x
Catalyst (CTLCN) 11.000% Sr. Sec. Notes 12/15/16 WR / NR NA / NA 280 55.00 28.89% 2818 12/15/16 31-Dec 319.8 8.7 2.7% 0.5x 842.3 24.2x
Catalyst (CTLCN) 7.375% Sr. Notes 03/01/14 WR / NR 250 1.65 nm nm 03/01/14
Sappi Paper Co. (SAPSJ) 12.000% 1st Lien Secured 08/01/14 Ba2 / BB 300 107.50 4.81% 473 LTM 7,286.0 821.0 11.3% 2.8x 3.4x 4014.8 4.9x
Sappi Paper Co. (SAPSJ) 6.625% 1st Lien Secured 04/15/21 Ba2 / BB Pos / NA 350 96.00 7.24% 554 04/15/21 31-Dec 1,787.0 183.0 10.2% 3.1x 2,790.0 3.8x
Sappi Paper Co. (SAPSJ) 7.500% Sr. Notes 6/15/2032 B2 / B 221 79.00 9.93% 744 06/15/32
Verso Paper (Verso) 11.750% 1st Sec. Sr. Nts 01/15/19 Ba2 / BB- NA / Neg 345 106.75 10.16% 920 01/15/18 LTM 1,722.5 202.5 11.8% 1.6x 6.2x 1248.6 6.2x
Verso Paper (Verso) 8.750% 2nd Sr. Sec 02/01/19 B2 / B NA / Neg 396 51.50 23.38% 2216 02/01/19 31-Dec 450.3 47.3 10.5% 1.5x 1,262.5 6.7x
Verso Paper (Verso) 11.375% Sr. Sub Notes 8/1/2016 Caa1 / CC NA / Neg 300 68.00 23.75% 2312 08/01/16
PULP & LUMBER
Ainsworth Lumber (ANSCN) L + 500 Bank Term Loan B 06/26/14 Ba3/B+ 103 99.00 5.72% 526 LTM C$ 293.3 12.3 4.2% 0.2x NM 591.5 48.0x
Ainsworth Lumber (ANSCN) 11.000% Senior Notes 07/29/15 Caa1 / B- Stable / Neg 424 82.00 18.17% 1774 07/29/15 31-Dec 69.5 2.7 3.9% 0.2x 531.1 NM
Boise Cascade (BOISE) Wood 7.125% Sr. Sub. Notes 10/15/14 Caa1 / B+ Stable / Neg 220 100.00 7.09% 696 10/15/12 LTM 2,248.1 11.8 0.5% 0.6x NM
Boise Cascade (BOISE) Wood 31-Dec 547.4 0.6 0.1% 0.1x 219.6 NM
Louisiana Pacific (LPX) 13.000% Sr Secured Notes 03/15/17 Ba3 / BBB- Stable / Neg 244 96.00 4.40% 423 03/15/2017 LTM 1,356.9 -17.0 NM -0.3x NM 1121.4 NM
Louisiana Pacific (LPX) 31-Dec 312.2 -13.6 NM -1.0x 232.6 NM
Mercer Intl (MERCS) 9.500% Sr. Notes 12/01/17 B3 / B+ Pos / Stable 286 103.50 8.55% 785 12/01/16 LTM - Euro 499.5 92.8 18.6% 3.3x 2.4x 549.6 5.9x
Mercer Intl (MERCS) 31-Dec 129.7 12.8 9.9% 2.2x 223.5 4.4x
Millar Western (MILLAR) 8.500% Sr. Notes 04/01/21 B3 / B- Stable / Neg 0 84.00 11.41% 971 04/01/21 LTM C$ 284.7 13.2 4.6% 0.8x 17.3x
Millar Western (MILLAR) 31-Dec 71.3 3.2 4.5% 0.7x 228.2 17.8x
Tembec (TMBCN) 11.250% St. Secured Notes 12/15/18 B3 / B- Stable / Neg 255 106.00 9.60% 889 12/15/16 LTM C$ 1,722.0 104.0 6.0% 3.6x 3.3x 551.0 5.3x
Tembec (TMBCN) 31-Dec 401.0 20.0 5.0% 2.5x 348.0 4.4x
West Fraser Timber (WFTCN) 5.200% Sr. Notes 10/15/2014 Ba1 / BB+ Pos / Stable 300 105.50 2.84% 253 10/15/14 LTM C$ 2,762.1 225.5 8.2% 11.2x 1.4x 1976.3 8.8x
14
Required Disclosures
Conflicts Policy
RBC Capital Markets Policy for Managing Conflicts of Interest in Relation to Investment Research is available from us on request. To access our current policy, clients should refer to https://www.rbccm.com/global/file-414164.pdf or send a request to RBC CM Research Publishing, P.O. Box 50, 200 Bay Street, Royal Bank Plaza, 29th Floor, South Tower, Toronto, Ontario M5J 2W7. We reserve the right to amend or supplement this policy at any time.
Dissemination of Research and Short-Term Trade Ideas
RBC Capital Markets endeavors to make all reasonable efforts to provide research simultaneously to all eligible clients, having regard to local time zones in overseas jurisdictions. RBC Capital Markets' research is posted to our proprietary websites to
ensure eligible clients receive coverage initiations and changes in ratings, targets and opinions in a timely manner. Additional distribution may be done by the sales personnel via email, fax or regular mail. Clients may also receive our research via third-party vendors. Please contact your investment advisor or institutional salesperson for more information regarding RBC Capital Markets' research. RBC Capital Markets also provides eligible clients with access to SPARC on its proprietary INSIGHT website. SPARC contains market color and commentary, and may also contain Short-Term Trade Ideas regarding the securities of subject companies discussed in this or other research reports. SPARC may be accessed via the following hyperlink: https://www.rbcinsight.com. A Short-Term Trade Idea reflects the research analyst's directional view regarding the price of the security of a subject company in the coming days or weeks, based on market and trading events. A Short-Term Trade Idea may differ from the price targets and/or recommendations in our published research reports reflecting the research analyst's views of the longer-term (one year) prospects of the subject company, as a result of the differing time horizons, methodologies and/or other factors. Thus, it is possible that the security of a subject company that is considered a long-term 'Sector Perform' or even an 'Underperform' might be a short-term buying opportunity as a result of temporary selling pressure in the market; conversely, the security of a subject company that is rated a long-term 'Outperform' could be considered susceptible to a short-term downward price correction. Short-Term Trade Ideas are not ratings, nor are they part of any ratings system, and RBC Capital Markets generally does not intend, nor undertakes any obligation, to maintain or update Short-Term Trade Ideas. Short-Term Trade Ideas discussed in SPARC may not be suitable for all investors and have not been tailored to individual investor circumstances and objectives, and investors should make their own independent decisions regarding any Short-Term Trade Ideas discussed therein.
Analyst Certification
All of the views expressed in this report accurately reflect the personal views of the responsible analyst(s) about any and all of the subject securities or issuers. No part of the compensation of the responsible analyst(s) named herein is, or will be, directly or indirectly, related to the specific recommendations or views expressed by the responsible analyst(s) in this report.

15
Required High Yield Research Disclosures
Rule 144A securities may only be offered and sold to persons in the U.S. who are Qualified Institutional Buyers within the meaning of Rule 144A under the Securities Act of 1933, as amended.
Conflicts Disclosures
This product constitutes a compendium report (covers six or more subject companies). As such, RBC Capital Markets chooses to provide specific disclosures for the subject companies by reference. To access current disclosures for the subject companies, clients should refer to https://www.rbccm.com/GLDisclosure/PublicWeb/DisclosureLookup.aspx?entityId=1 or send a request to RBC CM Research Publishing, P.O. Box 50, 200 Bay Street, Royal Bank Plaza, 29th Floor, South Tower, Toronto, Ontario M5J 2W7.
The analyst(s) responsible for preparing this research report received compensation that is based upon various factors, including total revenues of the member companies of RBC Capital Markets and its affiliates, a portion of which are or have been generated by investment banking activities of the member companies of RBC Capital Markets and its affiliates.
Distribution of Ratings
For the purpose of ratings distributions, regulatory rules require member firms to assign ratings to one of three rating categories - Buy, Hold/Neutral, or Sell - regardless of a firm's own rating categories. Although RBC Capital Markets' ratings of Top Pick/Outperform, Sector Perform and Underperform most closely correspond to Buy, Hold/Neutral and Sell, respectively, the meanings are not the same because our ratings are determined on a relative basis (as described above).
Conflicts Policy
RBC Capital Markets Policy for Managing Conflicts of Interest in Relation to Investment Research is available from us on request. To access our current policy, clients should refer to https://www.rbccm.com/global/file-414164.pdf or send a request to RBC CM Research Publishing, P.O. Box 50, 200 Bay Street, Royal Bank Plaza, 29th Floor, South Tower, Toronto, Ontario M5J 2W7. We reserve the right to amend or supplement this policy at any time.

16
Required Disclosures
Dissemination of Research and Short-Term Trade Ideas
RBC Capital Markets endeavors to make all reasonable efforts to provide research simultaneously to all eligible clients, having regard to local time zones in overseas jurisdictions. RBC Capital Markets' research is posted to our proprietary websites to ensure eligible clients receive coverage initiations and changes in ratings, targets and opinions in a timely manner. Additional distribution may be done by the sales personnel via email, fax or regular mail. Clients may also receive our research via third-party vendors. Please contact your investment advisor or institutional salesperson for more information regarding RBC Capital Markets' research. RBC Capital Markets also provides eligible clients with access to SPARC on its proprietary INSIGHT website. SPARC contains market color and commentary, and may also contain Short-Term Trade Ideas regarding the securities of subject companies discussed in this or other research reports. SPARC may be accessed via the following hyperlink: https://www.rbcinsight.com. A Short-Term Trade Idea reflects the research analyst's directional view regarding the price of the security of a subject company in the coming days or weeks, based on market and trading events. A Short-Term Trade Idea may differ from the price targets and/or recommendations in our published research reports reflecting the research analyst's views of the longer-term (one year) prospects of the subject company, as a result of the differing time horizons, methodologies and/or other factors. Thus, it is possible that the security of a subject company that is considered a long-term 'Sector Perform' or even an 'Underperform' might be a short-term buying opportunity as a result of temporary selling pressure in the market; conversely, the security of a subject company that is rated a long-term 'Outperform' could be considered susceptible to a short-term downward price correction. Short-Term Trade Ideas are not ratings, nor are they part of any ratings system, and RBC Capital Markets generally does not intend, nor undertakes any obligation, to maintain or update Short-Term Trade Ideas. Short-Term Trade Ideas discussed in SPARC may not be suitable for all investors and have not been tailored to individual investor circumstances and objectives, and investors should make their own independent decisions regarding any Short-Term Trade Ideas discussed therein.
Analyst Certification
All of the views expressed in this report accurately reflect the personal views of the responsible analyst(s) about any and all of the
subject securities or issuers. No part of the compensation of the responsible analyst(s) named herein is, or will be, directly or
indirectly, related to the specific recommendations or views expressed by the responsible analyst(s) in this report.

17
Disclaimer
RBC Capital Markets is the business name used by certain branches and subsidiaries of the Royal Bank of Canada, including RBC Dominion Securities Inc., RBC Capital Markets, LLC, RBC Europe Limited, RBC Capital Markets (Hong Kong) Limited, Royal Bank of Canada, Hong Kong Branch and Royal Bank of Canada, Sydney Branch. The information contained in this report has been compiled by RBC Capital Markets from sources believed to be reliable, but no representation or warranty, express or implied, is made by Royal Bank of Canada, RBC Capital Markets, its affiliates or any other person as to its accuracy, completeness or correctness. All opinions and estimates contained in this report constitute RBC Capital Markets’ judgment as of the date of this report, are subject to change without notice and are provided in good faith but without legal responsibility. Nothing in this report constitutes legal, accounting or tax advice or individually tailored investment advice. This material is prepared for general circulation to clients and has been prepared without regard to the individual financial circumstances and objectives of persons who receive it. The investments or services contained in this report may not be suitable for you and it is recommended that you consult an independent investment advisor if you are in doubt about the suitability of such investments or services. This report is not an offer to sell or a solicitation of an offer to buy any securities. Past performance is not a guide to future performance, future returns are not guaranteed, and a loss of original capital may occur. RBC Capital Markets research analyst compensation is based in part on the overall profitability of RBC Capital Markets, which includes profits attributable to investment banking revenues. Every province in Canada, state in the U.S., and most countries throughout the world have their own laws regulating the types of securities and other investment products which may be offered to their residents, as well as the process for doing so. As a result, the securities discussed in this report may not be eligible for sale in some jurisdictions. This report is not, and under no circumstances should be construed as, a solicitation to act as securities broker or dealer in any jurisdiction by any person or company that is not legally permitted to carry on the business of a securities broker or dealer in that jurisdiction. To the full extent permitted by law neither RBC Capital Markets nor any of its affiliates, nor any other person, accepts any liability whatsoever for any direct or consequential loss arising from any use of this report or the information contained herein. No matter contained in this document may be reproduced or copied by any means without the prior consent of RBC Capital Markets.
Additional information is available on request.
To U.S. Residents: This publication has been approved by RBC Capital Markets, LLC (member FINRA, NYSE, SIPC), which is a U.S. registered broker-dealer and which accepts responsibility for this report and its dissemination in the United States. Any U.S. recipient of this report that is not a registered broker-dealer or a bank acting in a broker or dealer capacity and that wishes further information regarding, or to effect any transaction in, any of the securities discussed in this report, should contact and place orders with RBC Capital Markets, LLC.
To Canadian Residents: This publication has been approved by RBC Dominion Securities Inc. (member of IIROC, CIPF). Any Canadian recipient of this report that is not a Designated Institution in Ontario, an Accredited Investor in British Columbia or Alberta or a Sophisticated Purchaser in Quebec (or similar permitted purchaser in any other province) and that wishes further information regarding, or to effect any transaction in, any of the securities discussed in this report should contact and place orders with RBC Dominion Securities Inc., which, without in any way limiting the foregoing, accepts responsibility for this report and its dissemination in Canada.
To U.K. Residents: This publication has been approved by RBC Europe Limited ('RBCEL') which is authorized and regulated by Financial Services Authority ('FSA'), in connection with its distribution in the United Kingdom. This material is not for general distribution in the United Kingdom to retail clients, as defined under the rules of the FSA. However, targeted distribution may be made to selected retail clients of RBC and its affiliates. RBCEL accepts responsibility for this report and its dissemination in the United Kingdom.
To Persons Receiving This Advice in Australia: This material has been distributed in Australia by Royal Bank of Canada - Sydney Branch (ABN 86 076 940 880, AFSL No. 246521). This material has been prepared for general circulation and does not take into account the objectives, financial situation or needs of any recipient. Accordingly, any recipient should, before acting on this material, consider the appropriateness of this material having regard to their objectives, financial situation and needs. If this material relates to the acquisition or possible acquisition of a particular financial product, a recipient in Australia should obtain any relevant disclosure document prepared in respect of that product and consider that document before making any decision about whether to acquire the product.
To Hong Kong Residents: This publication is distributed in Hong Kong by RBC Investment Services (Asia) Limited, RBC Investment Management (Asia) Limited and RBC Capital Markets (Hong Kong) Limited, licensed corporations under the Securities and Futures Ordinance or, by the Royal Bank of Canada, Hong Kong Branch, a registered institution under the Securities and Futures Ordinance. This material has been prepared for general circulation and does not take into account the objectives, financial situation, or needs of any recipient. Hong Kong persons wishing to obtain further information on any of the securities mentioned in this publication should contact RBC Investment Services (Asia) Limited, RBC Investment Management (Asia) Limited, RBC Capital Markets (Hong Kong) Limited or Royal Bank of Canada, Hong Kong Branch at 17/Floor, Cheung Kong Center, 2 Queen's Road Central, Hong Kong (telephone number is 2848-1388).
To Singapore Residents: This publication is distributed in Singapore by the Royal Bank of Canada, Singapore Branch and Royal Bank of Canada (Asia) Limited, registered entities granted offshore bank and merchant bank status by the Monetary Authority of Singapore, respectively. This material has been prepared for general circulation and does not take into account the objectives, financial situation, or needs of any recipient. You are advised to seek independent advice from a financial adviser before purchasing any product. If you do not obtain independent advice, you should consider whether the product is suitable for you. Past performance is not indicative of future performance. If you have any questions related to this publication, please contact the Royal Bank of Canada, Singapore Branch or Royal Bank of Canada (Asia) Limited.
To Japanese Residents: Unless otherwise exempted by Japanese law, this publication is distributed in Japan by or through RBC Capital Markets (Japan) Ltd., a registered type one financial instruments firm and/or Royal Bank of Canada, Tokyo Branch, a licensed foreign bank.
® Registered trademark of Royal Bank of Canada. RBC Capital Markets is a trademark of Royal Bank of Canada. Used under license. Copyright © RBC Capital Markets, LLC 2012 - Member SIPC
Copyright © RBC Dominion Securities Inc. 2012 - Member CIPF Copyright © RBC Europe Limited 2012
Copyright © Royal Bank of Canada 2012 All rights reserved