2012 sheltered instruction and literacy development ... · research educational program report...
TRANSCRIPT

MEMORANDUM September 12, 2012 TO: Board Members FROM: Terry B. Grier, Ed.D. Superintendent of Schools SUBJECT: 2012 SHELTERED INSTRUCTION AND LITERACY DEVELOPMENT
EVALUATION REPORT CONTACT: Carla Stevens, 713-556-6700 Sheltered instruction training promotes and enhances the use of instructional strategies and modifications that allow English language learners (ELLs) to access an English language curriculum more effectively. The Multilingual Department, in conjunction with the district, has provided training in sheltered instruction for secondary-level teachers and administrators since 2009–2010. During the 2011–2012 school year, the district once again offered training in sheltered instruction methodologies, but supplemented this with additional training in strategies that would facilitate the development of literacy skills in students. The new training was known as Sheltered Instruction and Literacy Development (SILD). The report summarizes data from the SILD training for teachers which occurred in 2011–2012. Included are demographic data for program participants, information on teacher reactions to the training and on their implementation of SILD strategies, as well as data on the impact of SILD training on the academic performance of students of those teachers. A total of 127 secondary-level teachers received SILD training, and most taught reading/ELA, mathematics, or science. Results showed that teachers were satisfied overall with the quality of the SILD training. Teachers reported using most SILD strategies fairly frequently, but did express some concern over the amount of ongoing support they had available. Finally, performance of ESL students whose teachers received SILD training showed little evidence for beneficial effects (i.e., STAAR, Stanford 10, TAKS, TELPAS assessments) compared to ESL students whose teachers did not receive training
__TBG
cc: Superintendent’s Direct Reports Chief School Officers Gracie Guerrero School Improvement Officers Jennifer Alexander Terrie Armstrong

RESEARCHE d u c a t i o n a l P r o g r a m R e p o r t
D e pa r t m e n t o f r e s e a r c h a n D a c c o u n ta b i l i t yh o u s t o n i n D e p e n D e n t s c h o o l D i s t r i c t
Sheltered Instruction & Literacy Development Evaluation Report
2011–2012
2012 Board of Education
Michael L. LuncefordPresident
Anna EastmanFirst Vice President
Juliet Stipechesecond Vice President
Rhonda Skillern-Jonessecretary
Greg Meyersassistant secretary
Paula HarrisLawrence MarshallHarvin C. MooreManuel Rodriguez, Jr.
Terry B. Grier, Ed.D.sUPerintendent oF scHooLs
Carla Stevensassistant sUPerintendentdePartMent oF researcH and accoUntaBiLity
Kevin Briand, Ph.D.researcH sPeciaList
Venita Holmes, Dr.P.H.researcH ManaGer
Houston Independent School DistrictHattie Mae White educational support center4400 West 18th streetHouston, texas 77092-8501
www.houstonisd.org
it is the policy of the Houston independent school district not to discriminate on the basis of age, color, handicap or disability, ancestry, national origin, marital status, race, religion, sex, veteran status, or political affiliation in its educational or employment programs and activities.
Executive Summary
Program Description Sheltered instruction training promotes and enhances the use of instructional strategies and modifica-tions that allow English language learners (ELLs) to access an English language curriculum more effec-tively. The district has provided training in sheltered instruction for secondary-level teachers, administra-tors, and other staff since 2009–2010. During the 2011–2012 school year, the district once again offered training in sheltered instruction methodologies, but supplemented this with additional training in strate-gies that would facilitate the development of literacy skills in students. The new training was known as Sheltered Instruction and Literacy Development (SILD). This effort is relevant to two of the core initia-tives of the district’s strategic direction: putting an effective teacher in every classroom, and adoption of rigorous instructional standards and supports. SILD training consisted of 18 hours over three days. Across the three days, discussion of sheltered in-struction and literacy development strategies were intermixed. An overview of sheltered instruction strategies focused on how to modify content instruction for ELLs in order to make it more comprehensi-ble, without sacrificing rigor. Literacy development covered a number of possible strategies, including student use of information they have in order to interpret text, use of anticipation guides (Tierney, Readance, & Dishner, 1995) and other pre-reading strategies, as well as rereading, thinking aloud (Davey, 1983), and text reformulation. Strategies for improving vocabulary as well as writing skills were also covered. SILD training was conducted by district staff, specifically, a number of Special Populations Specialists. A key component of SILD training was that campuses receiving training had to make a three-year commit-ment to the project, with principals agreeing that they would use a train-the-trainers approach, with teachers and administrators who were initially trained offering to other campus teachers and staff. Highlights A total of 127 teachers received SILD training in 2011–2012, 106 of them during the first semester
and 21 more during the second semester. Thirty-nine other HISD staff received SILD training as well. Teachers who attended SILD training were disproportionately younger than the average HISD
teacher, and had less teaching experience. A survey of teachers who attended SILD training found a high degree of satisfaction with the training
sessions, with 78% of responses being positive. When asked a series of questions concerning how often they used SILD strategies during the year,
and how difficult it was to do so, teachers were generally positive but responses were more mixed.
SHELTERED INSTRUCTION & LITERACY DEVELOPMENT EVALUATION REPORT 2011–2012
2
Performance of ESL students whose teachers received SILD training showed little evidence for beneficial effects.
SILD students showed superior performance to that of non-SILD students on some measures
(STAAR), inferior performance on others (STAAR EOC, TAKS, Stanford 10), and there was no dif-ference between SILD and non-SILD ESL students on TELPAS.
Recommendations 1. If SILD training is to continue, something should be done to increase the number of teachers attend-
ing the complete training (three days). Failing this, sessions should be reorganized to reduce the time requirements while still providing a comprehensive overview of relevant teaching strategies.
2. Long-term effects of SILD or sheltered instruction training on teachers should be examined by fol-
lowing up with teachers trained in 2011–2012 and previous years, both in terms of teachers’ prac-tices and in terms of student performance.
Administrative Response During the first two weeks of August, a large scale teacher training (the Everyday ExcELLence Institute) was held at Hartman Middle School. More than 1,300 elementary and secondary teachers attended. This new training protocol emphasized a small set of general principles that teachers should follow when instructing ELL students. This is in contrast to the SILD training, which provided teachers with as many as 70 different strategies they could use in a classroom. The August training encompassed four eight-hour days, and included a two-day training based on John Seidlitz’ Sheltered Instruction Plus (Seidlitz, 2011, a; b). In addition, participants of this training spent two days learning the Eight Literacy Routines. These research-based routines provide academic support to ELL students. The Eight Routines are: Get to Know Me, Pump Up the Vocabulary, Turn the Lights On, Let’s Talk, Do I Really Get It?, Huddle, Be the Lead Reader, and Pen/cil to Paper. The training institute was developed with key staff members from three departments: Curriculum, Professional Development Services, and Multilingual. Teacher Development Specialists will coach teachers during the school year in the use of these strate-gies and routines, and new principals were provided an overview during the summer administrative training in July. Plans are underway to provide this training to campuses again this fall, as are plans to provide on-line training modules to support teachers.

3
Introduction Sheltered instruction training promotes and enhances the use of instructional strategies and modifica-tions that allow English language learners (ELLs) to access an English language curriculum more effec-tively. The district has provided training in sheltered instruction for secondary-level teachers, administra-tors, and other staff since 2009–2010. During the 2011–2012 school year, the district once again offered training in sheltered instruction methodologies, but supplemented this with additional training in strate-gies that would facilitate the development of literacy skills in students. The new training was known as Sheltered Instruction and Literacy Development (SILD). SILD training consisted of 18 hours spread over three days. Across the three days, discussion of shel-tered instruction and literacy development strategies were intermixed. An overview of sheltered instruc-tion strategies focused on how to modify content instruction for ELLs in order to make it more compre-hensible, without sacrificing rigor. Literacy development covered a number of strategies, including stu-dent use of information they have in order to interpret text, use of anticipation guides (Tierney, Readance, & Dishner, 1995) and other pre-reading strategies, rereading, thinking aloud (Davey, 1983), text reformulation, and others. Strategies for improving vocabulary and writing skills were also covered. SILD training was conducted by Special Populations Specialists from the Multilingual Department. A key component of SILD training was that campuses receiving training had to make a three-year commitment to the project, with principals agreeing that they would use a train-the-trainers approach, with teachers and administrators who were initially trained offering training to other campus teachers and staff. Ap-pendix A (see p 14) provides an overview of topics covered in the SILD training, including expected teacher outcomes, and Appendix B (see p. 16) provides further background on sheltered instruction.
Methods Participants A total of 127 teachers received SILD training in 2011–2012. Most of these (106 teachers) attended training during the first semester, with an additional 21 from Davis High School receiving training in the second semester. All teachers received from one to three days of SILD training as well as ongoing con-sultation with the secondary special population specialists (65% received three days, and 35% received two days or less). Counts of teachers by campus are shown in Table 1. Also included in Table 1 are counts of non-teaching campus staff who attended SILD training.
3 e
Campus #
Teachers #
Others Total Campus #
Teachers #
Others Total Austin HS 10 5 15 Attucks MS 1 0 1 Davis HS 25 1 26 Deady MS 1 1 2 Kashmere HS 0 1 1 Hartman MS 16 1 17 Lee HS 1 0 1 Hogg MS 3 1 4 Madison HS 1 0 1 Ryan MS 1 0 1 Reagan HS 8 1 9 Fondren MS 1 1 2 Sterling HS 1 0 1 Dowling MS 20 1 21 Westbury HS 3 0 3 Key MS 6 0 6 Wheatley HS 4 0 4 Houston MST Center 8 2 10 Sharpstown HS 6 1 7 Liberty HS 2 0 2 Chavez HS 6 0 6 Young Women's College Prep 2 0 2 Westside HS 1 0 1 Teacher Development Spec. 0 23 23
Table 1. Number of Teachers and Other Staff Trained in SILD 2011–2012, by Campus
Source: Training Logs, Chancery
4
Student performance data were analyzed from all ESL students who were in classes taught by teachers who received SILD training. Data for all other ESL students in the district served as a comparison. Data Collection & Analysis
The Multilingual Department provided of a list of teachers receiving SILD training. Teacher’s employee ID codes were retrieved from the district’s Chancery database in order to gather a full list of classes which they taught. Next, teacher demographic information was extracted from Chancery, including years of teaching experience. A list was created of all students in classes taught by SILD teachers. This list was then used to retrieve student performance data on various standardized tests (see below).
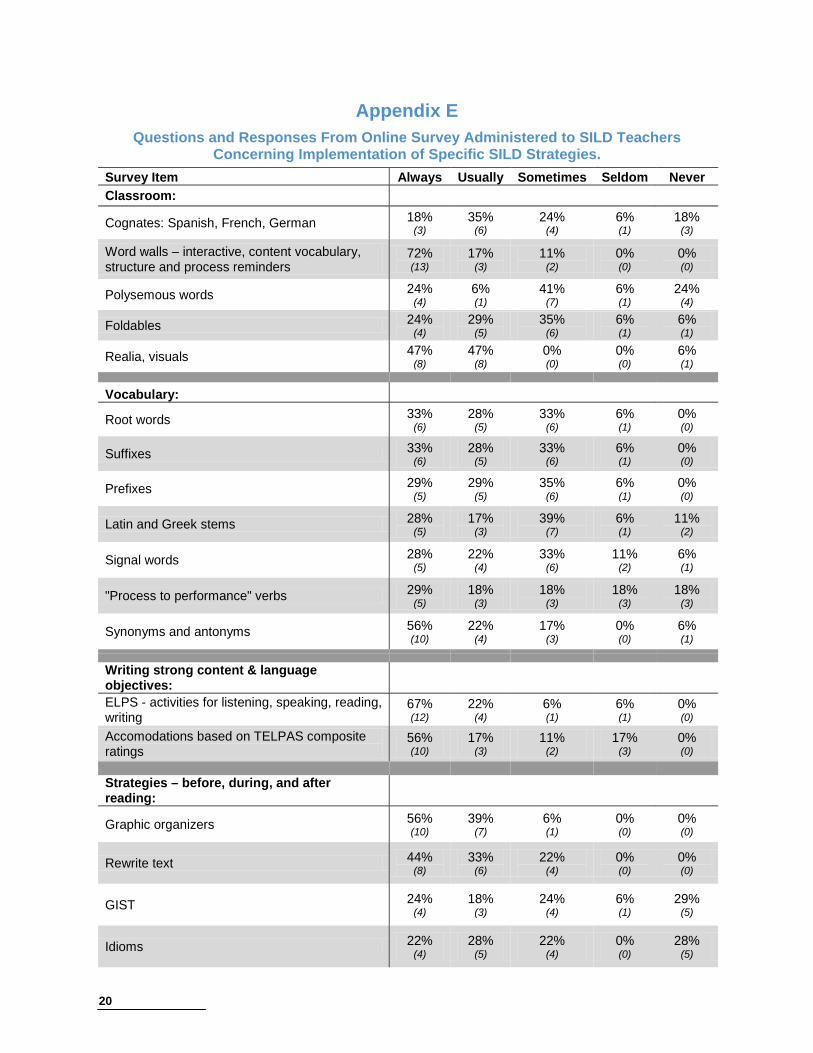
Two surveys were used to collect data from teachers and other staff who received SILD training in 2011–2012. The first one was a satisfaction survey, which sought feedback from the SILD trainees on their reactions to the training, what their experiences had been, what had worked, and what had not. A copy of this online survey, along with responses, is shown in Appendix C (p. 18). A second survey for teach-ers concerned implementation of the various strategies they had used. This survey included questions which inquired about the ease of implementing these methods in the classroom (Appendix D, p. 19), as well as questions concerning their use of specific strategies (Appendix E, p. 20). Teachers completed both surveys online at the end of the school year, and were instructed to base their answers on their overall use of sheltered instruction or literacy development methods during the school year. Appendices D and E also include a summary of responses.
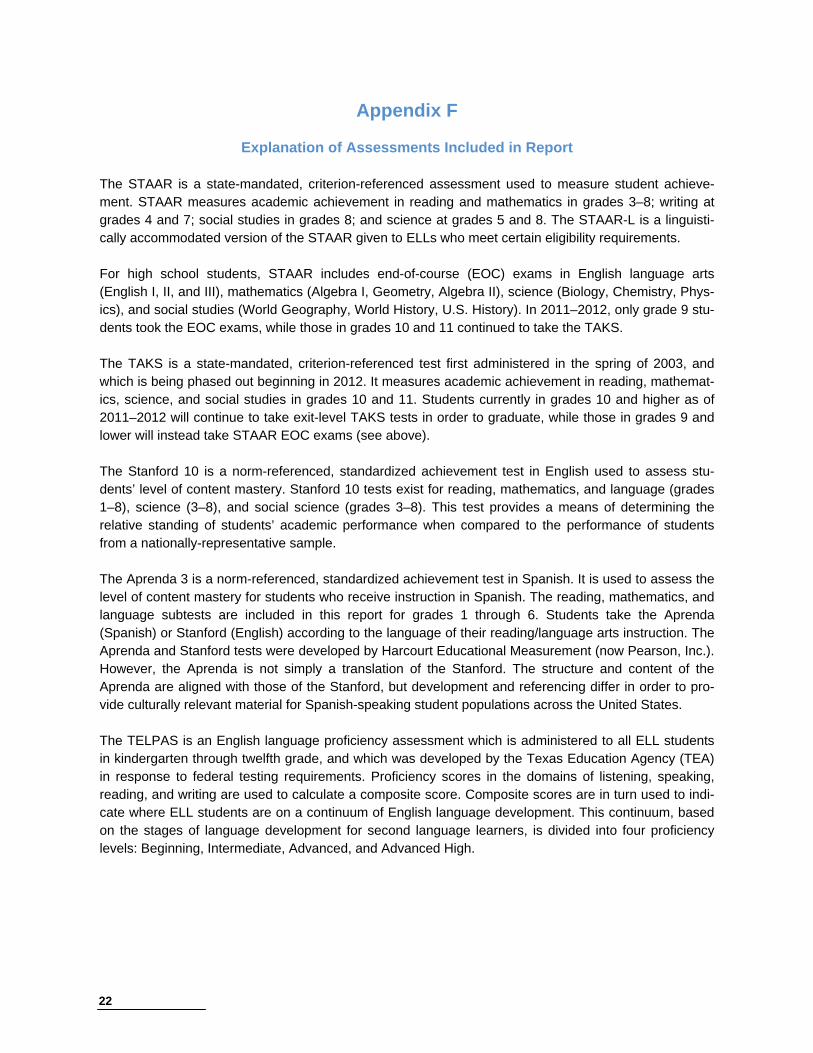
Student performance data were collected from the State of Texas Assessments of Academic Readiness (STAAR and STAAR End-of-Course), the Texas Assessment of Knowledge and Skills (TAKS), Stanford Achievement Test (Stanford 10), and the Texas English Language Proficiency Assessment System (TELPAS). STAAR results are reported for the reading and mathematics tests. For each test, the aver-age percentage of items answered correctly is shown. Note that standards for this new assessments will not be available until later in 2012 and are not yet available at the time of publication of this report. For STAAR EOC, the percent of students who met standard are reported for English I Reading and Writing, Algebra I, Biology, and World Geography. For TAKS, the percent of students meeting standard are re-ported for the reading and mathematics tests. Stanford 10 results are reported (Normal Curve Equiva-lents or NCEs) for reading, mathematics, and language. TELPAS results are reported for two indicators. One indicator reflects attainment, i.e., the overall level of English language proficiency exhibited by ELL students. For this indicator, the percent of students at each proficiency level is presented. The second indicator reflects progress, i.e., whether students gained one or more levels of English language proficiency between testing in 2011 and 2012. For this second TELPAS indicator, the percent gaining one or more proficiency levels in the previous year is reported. Appendix F (see p. 22) provides further details on each of the assessments analyzed for this report.
Results What was the demographic profile of teachers who received SILD training?
Figure 1 (see p. 5) shows the distribution of ages for teachers who received SILD training (shaded
bars). Also included, for comparison, is the relative distribution of ages for teachers in the district (open circles).

5
Seventy-two percent of teachers receiving SILD training were female and 28 percent were male. The mean age of teachers receiving training was 40.2 years (median = 38 years). The distribution of SILD-trained teachers was skewed toward those who were less than 35 years
old. The odds of being younger than 35 years old were almost twice as high for teachers who at-tended SILD training than they were for other teachers in the district (odds ratio = 1.77, z = 3.05, p<.002).
The average amount of prior teaching experience for SILD teachers was 8.6 years (median = 6
years).
Figure 2 shows the distribution of prior experience (SILD as bars, HISD overall as open circles). SILD teachers were more than three times as likely to have one or fewer years of experience as other teachers in the district (odds ratio = 3.48, z = 6.13, p<.00001).
Figure 1. Distribution of SILD-trained teachers by age.
Source: Chancery
Figure 2. Distribution of SILD-trained teachers by years of previous experience teaching overall.
Source: Chancery
1220 19
13 11 11 11
22
0
1,200
2,400
3,600
0
10
20
30
<25 25-29 30-34 35-39 40-44 45-49 50-54 >54
Nu
mb
er o
f H
ISD
Tea
cher
s
Nu
mb
er o
f S
ILD
Tea
cher
s
Age
SILD Teachers HISD
35
716
49
25 23
0
1800
3600
5400
0
20
40
1 or less 2-3 4-5 6-7 8-9 10-15 >15
Nu
mb
er o
f H
ISD
Tea
cher
s
Nu
mb
er o
f S
ILD
Tea
cher
s
Years Prior Teaching Experience
SILD Teachers HISD
6
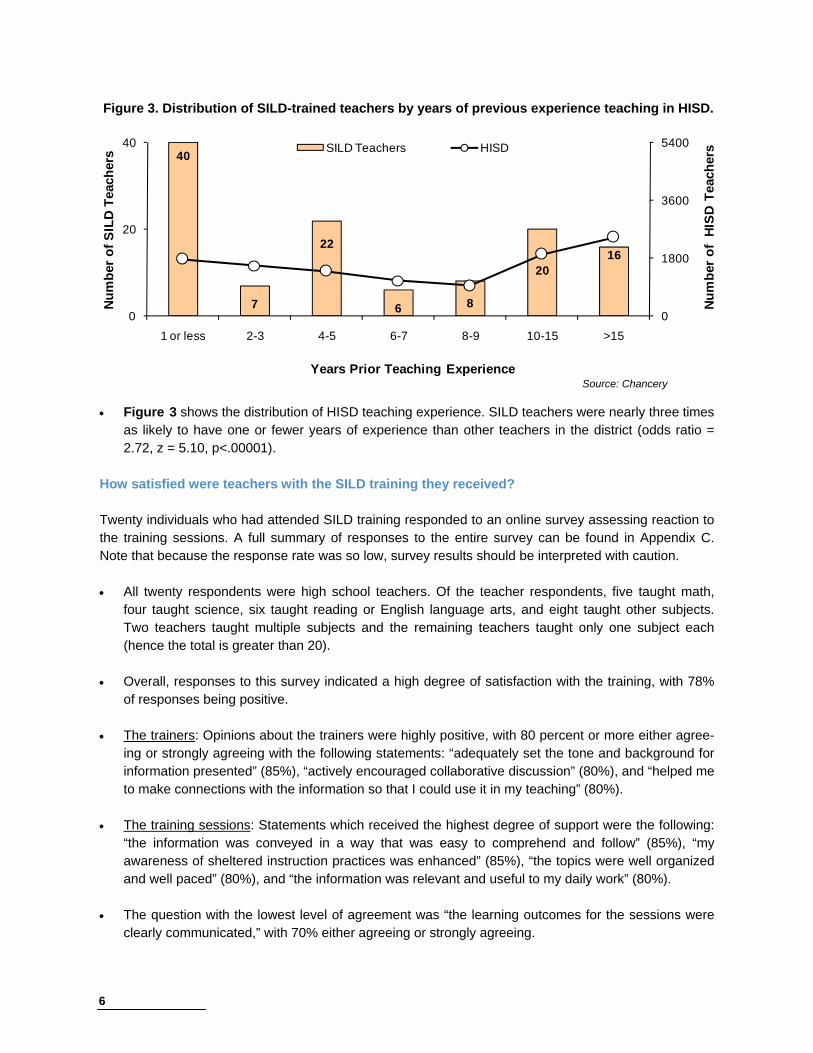
Figure 3 shows the distribution of HISD teaching experience. SILD teachers were nearly three times as likely to have one or fewer years of experience than other teachers in the district (odds ratio = 2.72, z = 5.10, p<.00001).
How satisfied were teachers with the SILD training they received?
Twenty individuals who had attended SILD training responded to an online survey assessing reaction to the training sessions. A full summary of responses to the entire survey can be found in Appendix C. Note that because the response rate was so low, survey results should be interpreted with caution. All twenty respondents were high school teachers. Of the teacher respondents, five taught math,
four taught science, six taught reading or English language arts, and eight taught other subjects. Two teachers taught multiple subjects and the remaining teachers taught only one subject each (hence the total is greater than 20).
Overall, responses to this survey indicated a high degree of satisfaction with the training, with 78%
of responses being positive. The trainers: Opinions about the trainers were highly positive, with 80 percent or more either agree-
ing or strongly agreeing with the following statements: “adequately set the tone and background for information presented” (85%), “actively encouraged collaborative discussion” (80%), and “helped me to make connections with the information so that I could use it in my teaching” (80%).
The training sessions: Statements which received the highest degree of support were the following:
“the information was conveyed in a way that was easy to comprehend and follow” (85%), “my awareness of sheltered instruction practices was enhanced” (85%), “the topics were well organized and well paced” (80%), and “the information was relevant and useful to my daily work” (80%).
The question with the lowest level of agreement was “the learning outcomes for the sessions were
clearly communicated,” with 70% either agreeing or strongly agreeing.
Figure 3. Distribution of SILD-trained teachers by years of previous experience teaching in HISD.
Source: Chancery
40
7
22
6 8
2016
0
1800
3600
5400
0
20
40
1 or less 2-3 4-5 6-7 8-9 10-15 >15
Nu
mb
er o
f H
ISD
Tea
cher
s
Nu
mb
er o
f S
ILD
Tea
cher
s
Years Prior Teaching Experience
SILD Teachers HISD

7
How effectively were SILD strategies implemented by teachers who attended training?
The effectiveness of SILD implementation was assessed via a 38-item online survey completed by teachers who had attended the SILD training sessions (only 13 teachers responded). The first eight items in the survey concerned degree of difficulty faced when trying to implement SILD methods in their classrooms (see Appendix D). As was the case with the other teacher survey, the low response rate suggests that results should be interpreted with caution.
In comparison with the previous survey concerning the reactions to the original training they re-
ceived, attitudes towards implementation of SILD were less positive. Most individual components of SILD were implemented fairly frequently by teachers. However, some
aspects of SILD were used less often, and teachers expressed concern about the amount of con-tinuing support available to them.
The most positive responses were to the item “things I learned in SILD training were easily imple-
mented in the classroom” (75%). Teachers also reported observing positive benefits for students after using SILD strategies in their classroom (70%).
Positive reaction fell off quickly after this, particularly to survey items that concerned support or as-
sistance they had received; “ongoing support was available when I had questions or concerns” (54% agreement), “other district staff facilitated my use of SILD” (58%), and “principals and other adminis-trators facilitated my use of SILD” (39%).
Nearly half of teachers (46%) felt that including SILD strategies in their teaching increased their
workload.
The final 30 items in the survey were organized into the following eight categories referring to spe-cific strategies: preparation, building background, comprehensible input, strategies, interaction, prac-tice/application, lesson delivery, and review/assessment (see Appendix E for responses).
For five of the eight categories of survey items, more than 90% of respondents indicated that they
implemented the SILD methods described either “usually” or “always.” The remaining three catego-ries of items were implemented “usually” or “always” by between 78 and 86 percent of teachers sur-veyed.
Areas that showed the most frequent implementation were “providing comprehensible input” (e.g.,
using speech appropriate for student proficiency level, explaining academic tasks clearly, and using a variety of techniques to make concepts clear), “interaction” (e.g., using group configurations that supported the language and content objectives, and giving students opportunities to clarify key con-cepts in their primary language), and “lesson delivery” (e.g., pacing lessons to student ability level, supporting content and language objectives clearly, engaging students 90-100% of the time).
Methods less frequently used concerned “building background” (e.g., linking concepts to students’ backgrounds/experiences, linking past learning and new concepts, and emphasizing key vocabu-lary), as well as “preparation” (e.g., adapting content to level of proficiency of all students, writing content and language objectives clearly).
8
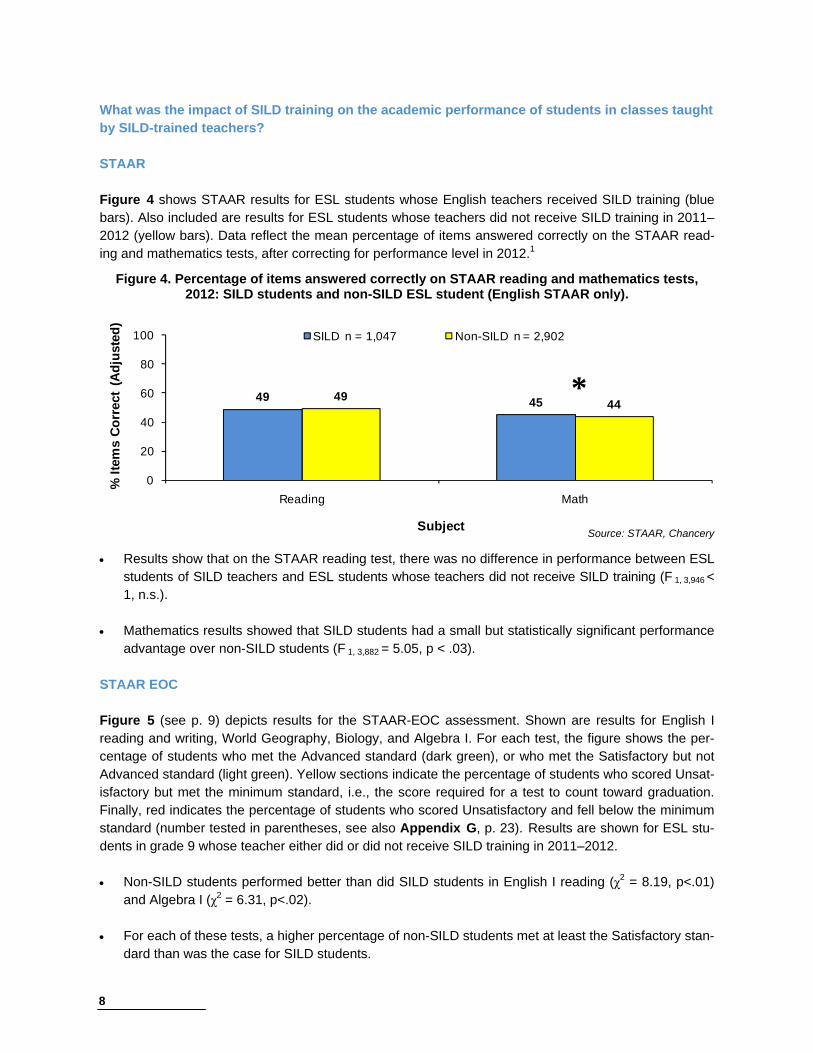
What was the impact of SILD training on the academic performance of students in classes taught by SILD-trained teachers? STAAR
Figure 4 shows STAAR results for ESL students whose English teachers received SILD training (blue bars). Also included are results for ESL students whose teachers did not receive SILD training in 2011–2012 (yellow bars). Data reflect the mean percentage of items answered correctly on the STAAR read-ing and mathematics tests, after correcting for performance level in 2012.1
Results show that on the STAAR reading test, there was no difference in performance between ESL students of SILD teachers and ESL students whose teachers did not receive SILD training (F 1, 3,946 < 1, n.s.).
Mathematics results showed that SILD students had a small but statistically significant performance
advantage over non-SILD students (F 1, 3,882 = 5.05, p < .03). STAAR EOC
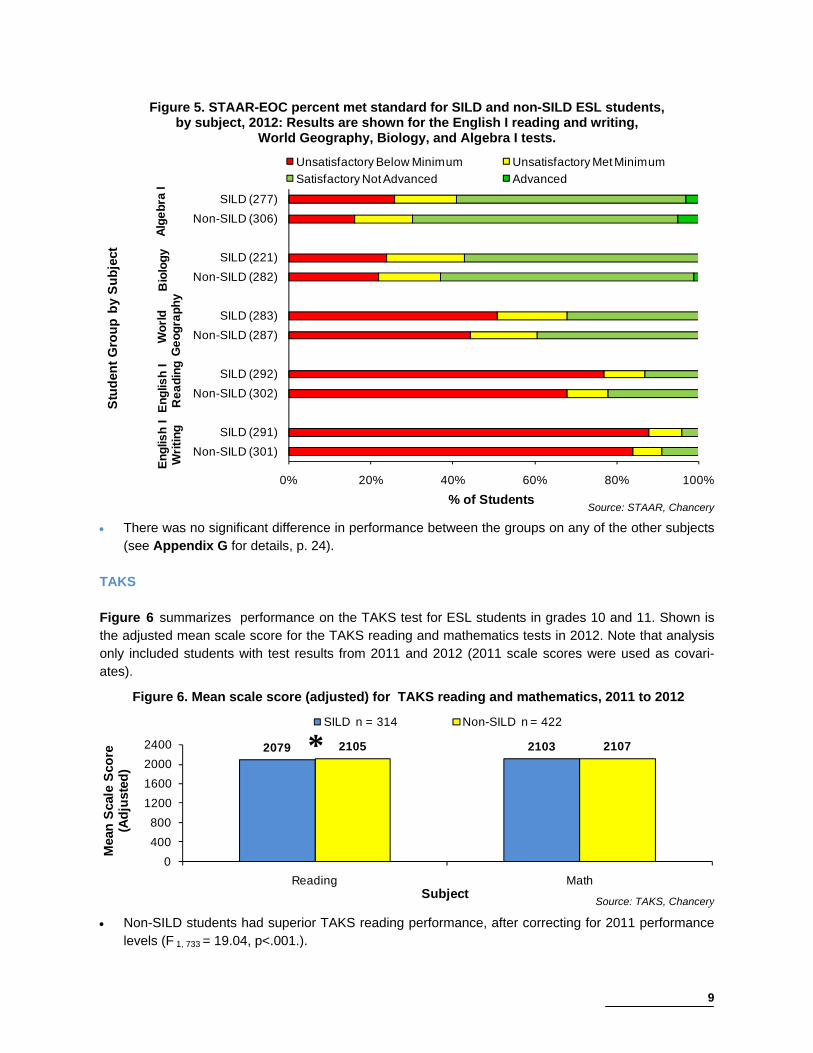
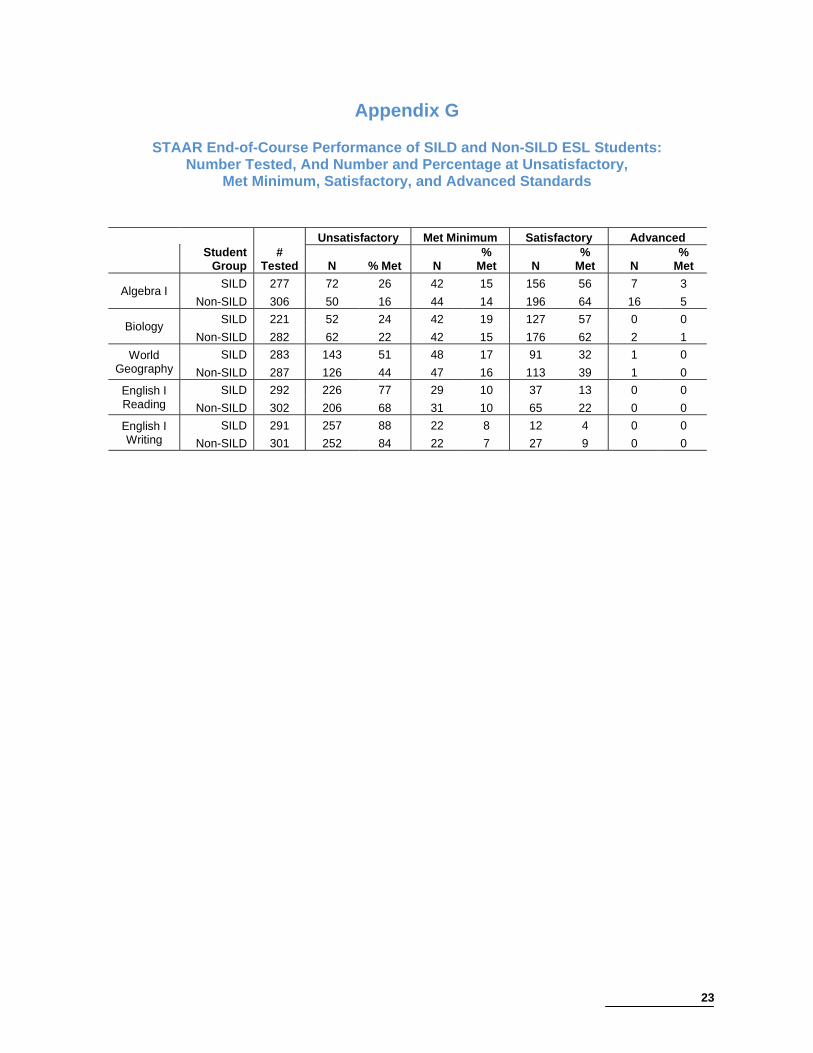
Figure 5 (see p. 9) depicts results for the STAAR-EOC assessment. Shown are results for English I reading and writing, World Geography, Biology, and Algebra I. For each test, the figure shows the per-centage of students who met the Advanced standard (dark green), or who met the Satisfactory but not Advanced standard (light green). Yellow sections indicate the percentage of students who scored Unsat-isfactory but met the minimum standard, i.e., the score required for a test to count toward graduation. Finally, red indicates the percentage of students who scored Unsatisfactory and fell below the minimum standard (number tested in parentheses, see also Appendix G, p. 23). Results are shown for ESL stu-dents in grade 9 whose teacher either did or did not receive SILD training in 2011–2012. Non-SILD students performed better than did SILD students in English I reading (χ2 = 8.19, p<.01)
and Algebra I (χ2 = 6.31, p<.02). For each of these tests, a higher percentage of non-SILD students met at least the Satisfactory stan-
dard than was the case for SILD students.
Figure 4. Percentage of items answered correctly on STAAR reading and mathematics tests, 2012: SILD students and non-SILD ESL student (English STAAR only).
Source: STAAR, Chancery
49 454944
0
20
40
60
80
100
Reading Math
% I
tem
s C
orr
ect
(Ad
just
ed)
Subject
SILD n = 1,047 Non-SILD n = 2,902
*
9
Figure 5. STAAR-EOC percent met standard for SILD and non-SILD ESL students, by subject, 2012: Results are shown for the English I reading and writing,
World Geography, Biology, and Algebra I tests.
Source: STAAR, Chancery
There was no significant difference in performance between the groups on any of the other subjects (see Appendix G for details, p. 24).
TAKS
Figure 6 summarizes performance on the TAKS test for ESL students in grades 10 and 11. Shown is the adjusted mean scale score for the TAKS reading and mathematics tests in 2012. Note that analysis only included students with test results from 2011 and 2012 (2011 scale scores were used as covari-ates).
Non-SILD students had superior TAKS reading performance, after correcting for 2011 performance levels (F 1, 733 = 19.04, p<.001.).
Figure 6. Mean scale score (adjusted) for TAKS reading and mathematics, 2011 to 2012
Source: TAKS, Chancery
0% 20% 40% 60% 80% 100%
SILD (277)
Non-SILD (306)
SILD (221)
Non-SILD (282)
SILD (283)
Non-SILD (287)
SILD (292)
Non-SILD (302)
SILD (291)
Non-SILD (301)
% of Students
Unsatisfactory Below Minimum Unsatisfactory Met Minimum
Satisfactory Not Advanced Advanced
Alg
eb
ra I
Bio
log
yW
orl
d
Ge
og
rap
hy
En
glis
h I
Re
ad
ing
En
glis
h I
Wri
tin
g
Stu
den
t G
rou
p b
y S
ub
ject
2079 21032105 2107
0
400
800
1200
1600
2000
2400
Reading Math
Mea
n S
cale
Sco
re
(Ad
just
ed)
Subject
SILD n = 314 Non-SILD n = 422
*

10
There was no difference between SILD and non-SILD students on TAKS mathematics, after correct-ing for 2011 performance level (F 1, 739 < 1, n.s.).
Stanford 10
Figure 7 summarizes Stanford 10 data for the 2011–2012 school year. Shown are mean adjusted NCE scores for the reading, mathematics, language, science, and social science tests. Results are shown for ESL students whose teachers either did or did not receive SILD training.2
After adjusting for student performance in 2011, there was no difference between SILD and non-SILD students on the reading, mathematics, or language tests of the Stanford 10.
However, non-SILD students did outperform SILD students on the science (F 1, 4,860 = 5.38, p<.03)
and social science tests (F 1, 4,848 = 28.71, p<.001.). What was the impact of SILD training on the English proficiency of students in classes taught by SILD-trained teachers? Figure 8 shows raw TELPAS data for SILD and non-SILD students, both attainment, i.e., the percent-age of students scoring Advanced High on the TELPAS in 2012, and progress, i.e. the percentage of students who made gains in English language proficiency between 2011 and 2012.
Figure 7. Mean adjusted Stanford NCE scores for SILD and non-SILD students, 2012
Source: Stanford, Chancery
Figure 8. TELPAS results for SILD and non-SILD students 2012: Percent of students scoring Ad-vanced High (left side), and percent making gains in English proficiency (right side)
Source: TELPAS, Chancery
28
4332
413329
4333
4335
0
20
40
60
80
100
Reading Math Language Science Social Science
Mea
n A
dju
sted
NC
E
Subject
SILD n = 1,288 Non-SILD n = 3,588
* *
44
6150
64
0
20
40
60
80
100
% AH % Gained
Per
cen
t o
f S
tud
ents
Subject
SILD Non-SILD
**
Source: TELPAS, Chancery
11
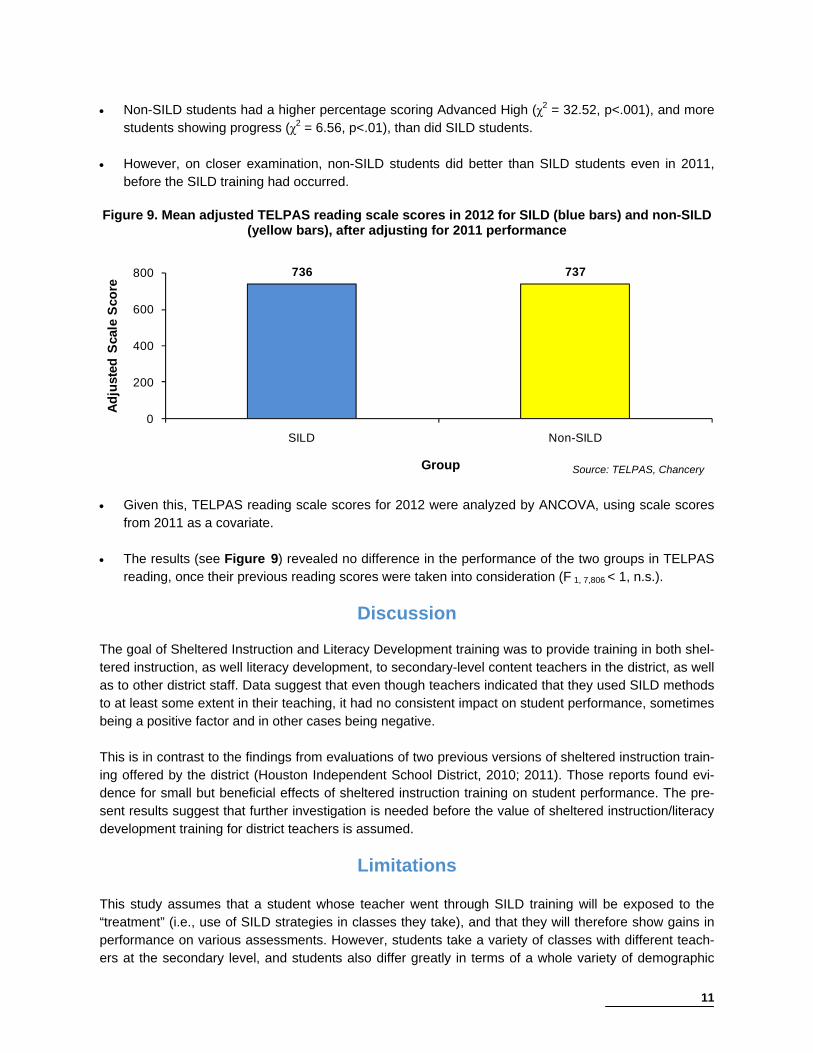
Non-SILD students had a higher percentage scoring Advanced High (χ2 = 32.52, p<.001), and more students showing progress (χ2 = 6.56, p<.01), than did SILD students.
However, on closer examination, non-SILD students did better than SILD students even in 2011,
before the SILD training had occurred.
Given this, TELPAS reading scale scores for 2012 were analyzed by ANCOVA, using scale scores from 2011 as a covariate.
The results (see Figure 9) revealed no difference in the performance of the two groups in TELPAS
reading, once their previous reading scores were taken into consideration (F 1, 7,806 < 1, n.s.).
Discussion
The goal of Sheltered Instruction and Literacy Development training was to provide training in both shel-tered instruction, as well literacy development, to secondary-level content teachers in the district, as well as to other district staff. Data suggest that even though teachers indicated that they used SILD methods to at least some extent in their teaching, it had no consistent impact on student performance, sometimes being a positive factor and in other cases being negative. This is in contrast to the findings from evaluations of two previous versions of sheltered instruction train-ing offered by the district (Houston Independent School District, 2010; 2011). Those reports found evi-dence for small but beneficial effects of sheltered instruction training on student performance. The pre-sent results suggest that further investigation is needed before the value of sheltered instruction/literacy development training for district teachers is assumed.
Limitations This study assumes that a student whose teacher went through SILD training will be exposed to the “treatment” (i.e., use of SILD strategies in classes they take), and that they will therefore show gains in performance on various assessments. However, students take a variety of classes with different teach-ers at the secondary level, and students also differ greatly in terms of a whole variety of demographic
Figure 9. Mean adjusted TELPAS reading scale scores in 2012 for SILD (blue bars) and non-SILD (yellow bars), after adjusting for 2011 performance
Source: TELPAS, Chancery
736 737
0
200
400
600
800
SILD Non-SILD
Ad
just
ed S
cale
Sco
re
Group
12
and personal factors, any of which may mask beneficial effects of the “treatment”. It is also true that benefits from exposure to SILD strategies in the classroom may occur only over the long-term, or follow-ing prolonged exposure to such techniques. Neither of these was possible given the analysis used here. Another limitation of the analyses is that the comparison group may not have been appropriate. Specifi-cally, non-SILD students were those whose teachers did not receive training during 2011–2012. How-ever, some of those students may have been taught by teachers who received similar training in previ-ous years. A more rigorous analysis would require that any such students be removed from the compari-son group, and this was not possible to do with the data available. Finally, data from the teacher surveys is compromised by the fact that response rate was so low.
Endnotes 1. Reading and mathematics were analyzed separately, use TAKS scale scores from 2011 as a covariate.
The dependent variable was the percentage of STAAR items correct from 2012. Percentages correct were subjected to an arsine transformation before being analyzed, and then the resulting group means were than back-transformed to generate the data shown in the chart.
2. Each subject area of the Stanford 10 was analyzed separately. NCE from 2012 was the dependent vari-
able, with NCE from 2011 as the covariate. Data shown in Figure 7 are mean NCEs from 2012 adjusted to account for performance in 2011.,
References August, D., & Hakuta, K. (Eds.) (1997). Improving Schooling for Language Minority Children: A Re-
search Agenda. Washington, DC: National Academy Press. Beers, C. (2003). When Kids Can’t Read: What Teachers Can Do. Portsmouth, NH: Heinemann. Berman, P., McLaughlin, B., Minicucci, C., Nelson, B., & Woodworth, K. (1995). School Reform and Stu-
dent Diversity: Case Studies of Exemplary Practices for LEP Students. Washington, DC: National Clearinghouse for Bilingual Education.
Davey, B. (1983). Think-Aloud: Modeling the Cognitive Processes of Reading Comprehension. Journal
of Reading, 27, pp. 44-47. Echevarria, J., & Graves, A. (1998) Sheltered Content Instruction: Teaching English-Language Learners
With Diverse Abilities. Boston, MA: Allyn & Bacon. Echevarria, J., Vogt, M.E. & Short, D. (2000). Making Content Comprehensible for English Language
Learners: The SIOP Model Boston, MA: Allyn & Bacon. Echevarria, J., Vogt, M.E. & Short, D. (2004). Making Content Comprehensible for English Language
Learners: The SIOP Model, Second Edition. Boston, MA: Allyn & Bacon. Houston Independent School District (2010). SIOP Professional Development Initiative Evaluation Re-
port 2009-2010. HISD, Department of Research & Accountability. Houston Independent School District (2011). SIOP Professional Development Initiative Evaluation Re-
port 2010-2011. HISD, Department of Research & Accountability Kauffman, D., Burkhart, G., Crandall, J., Johnson, D., Peyton, J., Sheppard, K., & Short, D. (1994). Con-
tent-ESL Across the USA. Washington, DC: ERIC Clearinghouse on Languages and Linguistics. Seidlitz, J. (2011) Sheltered Instruction Plus. San Clemente,CA: Seidlitz Education.

13
Seidlitz, J. (2011) Language & Literacy for ELLs. San Clemente,CA: Seidlitz Education. Sheppard, K. (1995) Content-ESL Across the USA. Volume I, Technical Report. Washington, DC: Na-
tional Clearinghouse for Bilingual Education. Short, D. (1998). Social Studies and Assessment: Meeting the Needs of Students Learning English. In
S. Fradd & O. Lee (Eds), Creating Florida’s multilingual global work force, (pp. VI 1-12). Tallahas-see, FL: Florida Department of Education.
Tierney, R.J., Readence, J.E., & Dishner, E.K. (1995). Reading Strategies and Practices: A Compen-
dium, Fourth Edition. Boston, MA: Allyn and Bacon.

14
Appendix A
Sheltered Instruction and Literacy Development (SILD): Overview of 3-Day Training
Day 1 Training Components Day 1 Teacher Outcomes Second Language Acquisition
What is SIOP?
Lesson Preparation/Language Objectives
Academic Vocabulary Strategies
Building Background/ Scaffolding/Inferring
Secondary Programming is linked to Multilingual Department Components: Compliance, Programming, Instruction and Data.
An overview of Second Language Acquisition is explained in relationship to the SIOP Model and its 8 Components and 30 features.
Lesson Preparation and Language Objectives are given equal importance. This is the key distinction between SIOP and regular content instruction.
The distinction of using Academic Vocabulary, Process Word Vocabulary and Content Specific Vocabulary is emphasized. (Marzano’s Six –Step Process for Teaching Vocabulary)
Utilize Second Language Acquisition Research to inform instruction
o Theory o Application
Utilize SIOP Lesson Planning strategies
o Develop lessons that increase Comprehensible Input, Rigor, and Student Engagement
o Plan lessons that highlight Cummins Quadrants (SEE, DO, TALK, TRANSFER)
o Language Objectives (LSRW activities)
Utilize effective Building Background strategies
o Scaffold Instructional strategies
o Vocabulary Development (When Kids Can’t Read)
o Pictorial Word Walls o Cognate Walls o Vocabulary Cards o Process (Signal) words
Day 2 Training Components Day 2 Teacher Outcomes
Comprehensible Input
What’s difficult in Reading, Math, Science, Social Studies?
Strategies‐Social Affective & Metacognitive
Interaction/Group Configurations
Based on the students’ English proficiency levels and the content being taught, different techniques are addressed to incorporate and increase comprehensible input.
A variety of questions or tasks that promote higher‐order thinking skills are presented to support the instructional Techniques and the Learning Strategies implemented in the classroom.
Teachers will check for clear explanation of academic tasks, and identify difficult content for ELL students for their subject area.
Teachers will discuss the differences between learning strategies and instructional techniques.
Teachers will develop higher level questioning techniques differentiated by ESL level ( “Asking the Right Question” article)
Teachers will integrate partner/coop. grouping for instruction with ELL students.
Teachers will utilize Coop. Grouping Strategies
o Think‐Pair‐Share o Numbered Heads
Together
Teachers will develop Pre‐reading strategies that differentiate literacy for ELL students (When Kids Can’t Read).
Teachers will utilize visualization as a pre‐reading strategy.
15
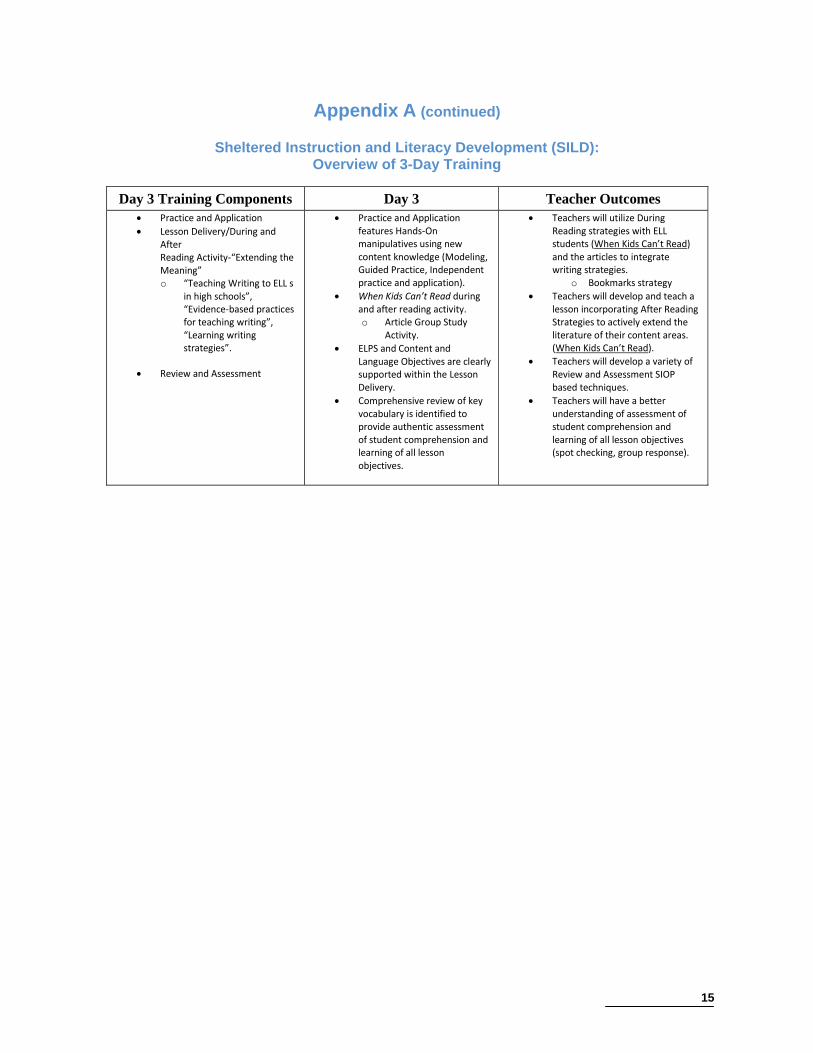
Day 3 Training Components Day 3 Teacher Outcomes Practice and Application
Lesson Delivery/During and After Reading Activity‐“Extending the Meaning” o “Teaching Writing to ELL s
in high schools”, “Evidence‐based practices for teaching writing”, “Learning writing strategies”.
Review and Assessment
Practice and Application features Hands‐On manipulatives using new content knowledge (Modeling, Guided Practice, Independent practice and application).
When Kids Can’t Read during and after reading activity. o Article Group Study
Activity.
ELPS and Content and Language Objectives are clearly supported within the Lesson Delivery.
Comprehensive review of key vocabulary is identified to provide authentic assessment of student comprehension and learning of all lesson objectives.
Teachers will utilize During Reading strategies with ELL students (When Kids Can’t Read) and the articles to integrate writing strategies.
o Bookmarks strategy
Teachers will develop and teach a lesson incorporating After Reading Strategies to actively extend the literature of their content areas. (When Kids Can’t Read).
Teachers will develop a variety of Review and Assessment SIOP based techniques.
Teachers will have a better understanding of assessment of student comprehension and learning of all lesson objectives (spot checking, group response).
Appendix A (continued)
Sheltered Instruction and Literacy Development (SILD): Overview of 3-Day Training
16
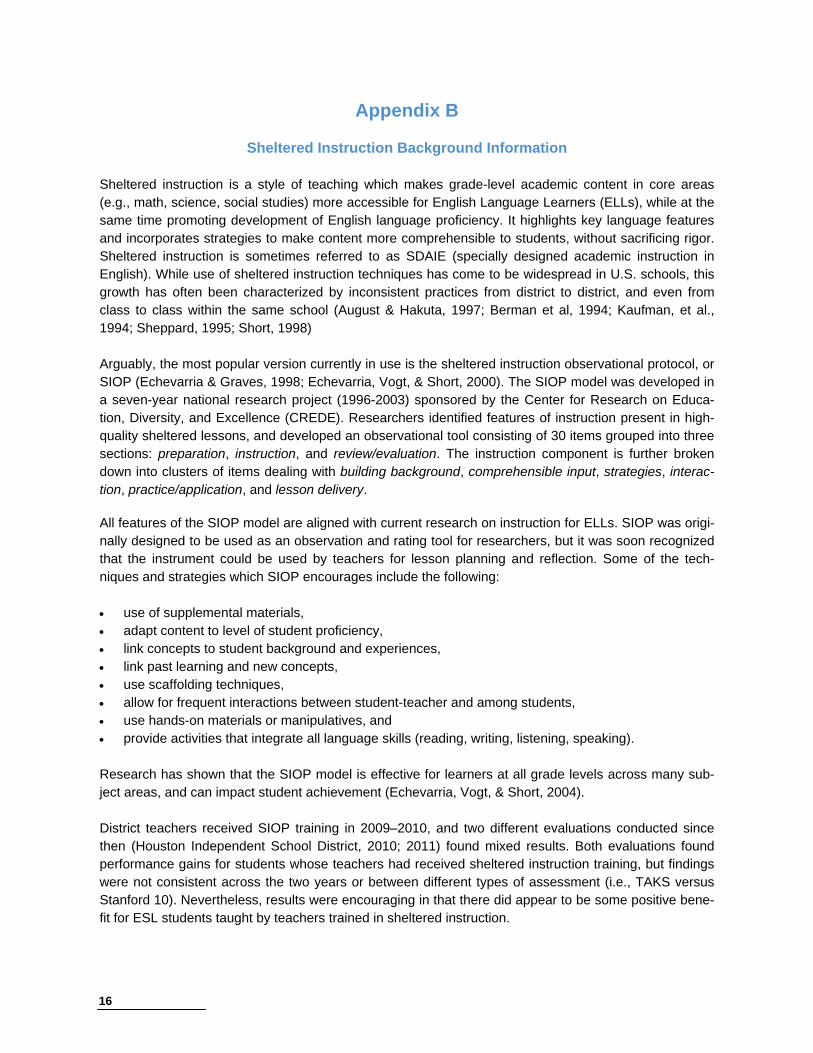
Appendix B
Sheltered Instruction Background Information
Sheltered instruction is a style of teaching which makes grade-level academic content in core areas (e.g., math, science, social studies) more accessible for English Language Learners (ELLs), while at the same time promoting development of English language proficiency. It highlights key language features and incorporates strategies to make content more comprehensible to students, without sacrificing rigor. Sheltered instruction is sometimes referred to as SDAIE (specially designed academic instruction in English). While use of sheltered instruction techniques has come to be widespread in U.S. schools, this growth has often been characterized by inconsistent practices from district to district, and even from class to class within the same school (August & Hakuta, 1997; Berman et al, 1994; Kaufman, et al., 1994; Sheppard, 1995; Short, 1998) Arguably, the most popular version currently in use is the sheltered instruction observational protocol, or SIOP (Echevarria & Graves, 1998; Echevarria, Vogt, & Short, 2000). The SIOP model was developed in a seven-year national research project (1996-2003) sponsored by the Center for Research on Educa-tion, Diversity, and Excellence (CREDE). Researchers identified features of instruction present in high-quality sheltered lessons, and developed an observational tool consisting of 30 items grouped into three sections: preparation, instruction, and review/evaluation. The instruction component is further broken down into clusters of items dealing with building background, comprehensible input, strategies, interac-tion, practice/application, and lesson delivery. All features of the SIOP model are aligned with current research on instruction for ELLs. SIOP was origi-nally designed to be used as an observation and rating tool for researchers, but it was soon recognized that the instrument could be used by teachers for lesson planning and reflection. Some of the tech-niques and strategies which SIOP encourages include the following:
use of supplemental materials, adapt content to level of student proficiency, link concepts to student background and experiences, link past learning and new concepts, use scaffolding techniques, allow for frequent interactions between student-teacher and among students, use hands-on materials or manipulatives, and provide activities that integrate all language skills (reading, writing, listening, speaking).
Research has shown that the SIOP model is effective for learners at all grade levels across many sub-ject areas, and can impact student achievement (Echevarria, Vogt, & Short, 2004). District teachers received SIOP training in 2009–2010, and two different evaluations conducted since then (Houston Independent School District, 2010; 2011) found mixed results. Both evaluations found performance gains for students whose teachers had received sheltered instruction training, but findings were not consistent across the two years or between different types of assessment (i.e., TAKS versus Stanford 10). Nevertheless, results were encouraging in that there did appear to be some positive bene-fit for ESL students taught by teachers trained in sheltered instruction.
17
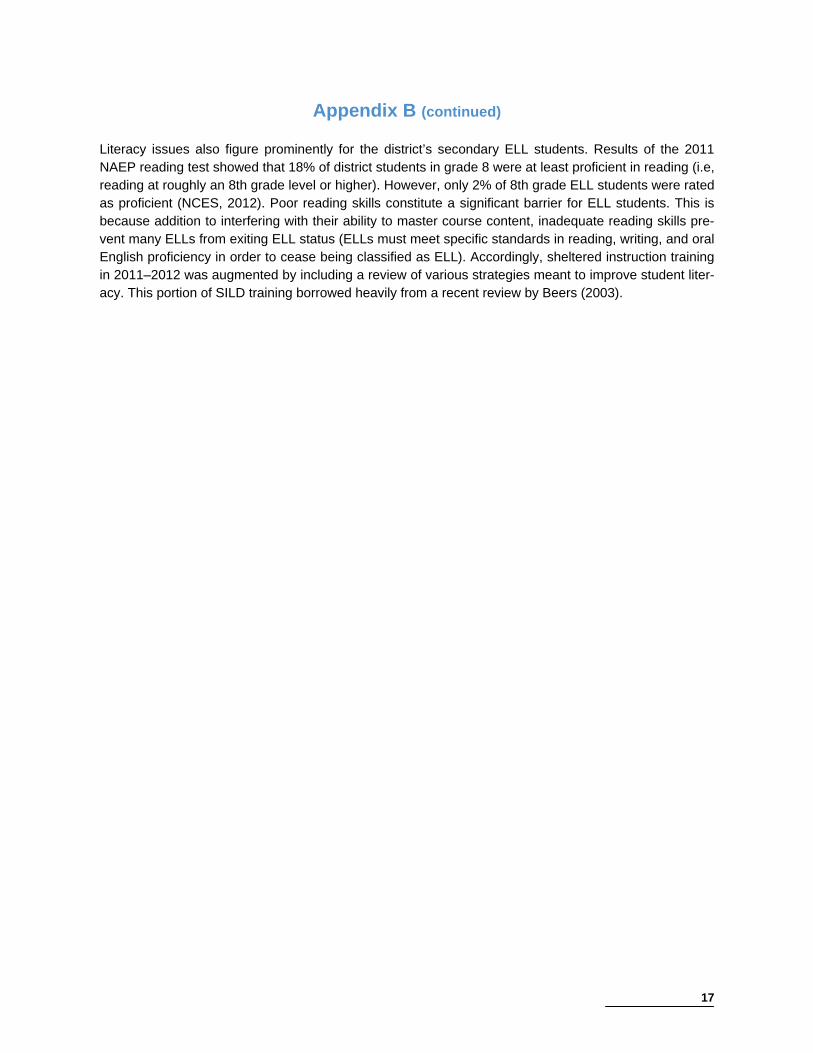
Appendix B (continued) Literacy issues also figure prominently for the district’s secondary ELL students. Results of the 2011 NAEP reading test showed that 18% of district students in grade 8 were at least proficient in reading (i.e, reading at roughly an 8th grade level or higher). However, only 2% of 8th grade ELL students were rated as proficient (NCES, 2012). Poor reading skills constitute a significant barrier for ELL students. This is because addition to interfering with their ability to master course content, inadequate reading skills pre-vent many ELLs from exiting ELL status (ELLs must meet specific standards in reading, writing, and oral English proficiency in order to cease being classified as ELL). Accordingly, sheltered instruction training in 2011–2012 was augmented by including a review of various strategies meant to improve student liter-acy. This portion of SILD training borrowed heavily from a recent review by Beers (2003).

18
Appendix C
Questions and Responses From Online Survey Administered to SILD Training Participants.
Items concerning the trainers/facilitators:
Survey Item Strongly
Agree Agree Neutral Disagree Strongly Disagree
Adequately set the tone and background for information presented in the session(s)
36% (10)
46% (13)
7% (2)
0% (0)
11% (3)
Allowed me to reflect and share my ideas/views about the topics presented
39% (11)
46% (13)
7% (2)
7% (2)
0% (0)
Helped me to make connections with the information so that I could use it in my teaching
32% (9)
54% (15)
7% (2)
7% (2)
0% (0)
Actively encouraged collaborative discussion 43% (12)
39% (11)
11% (3)
4% (1)
4% (1)
Items concerning the sessions themselves:
Survey Item Strongly
Agree Agree Neutral Disagree Strongly Disagree
The information was relevant and useful to my daily teaching/work
37% (10)
44% (12)
11% (3)
4% (1)
4% (1)
The topics were well organized and paced 41% (11)
41% (11)
0% (0)
4% (1)
15% (4)
The learning outcomes for the sessions were clearly communicated
37% (10)
44% (12)
7% (2)
4% (1)
7% (2)
I feel comfortable enough with the information I learned that I could share it with my colleagues
33% (9)
48% (13)
7% (2)
7% (2)
4% (1)
Handouts were useful and adequately supported the information presented
37% (10)
41% (11)
4% (1)
11% (3)
7% (2)
The information was conveyed in a way that was easy to comprehend and follow
33% (9)
56% (15)
4% (1)
7% (2)
0% (0)
My awareness of sheltered instruction practices was enhanced
37% (10)
41% (11)
4% (1)
7% (2)
11% (3)
My awareness of literacy development trategies was enhanced
37% (10)
37% (10)
7% (2)
7% (2)
11% (3)
I am prepared to use sheltered instruction and literacy development strategies in my teaching
37% (10)
48% (13)
7% (2)
7% (2)
0% (0)
Overall, the session(s) was/were relevant to my teaching/work within the school
33% (9)
48% (13)
7% (2)
7% (2)
4% (1)

19
Appendix D
Questions and Responses From Online Survey Administered to SILD Teachers Con-cerning the Overall Ease of Implementing SILD Strategies in Their Classroom.
How easy was it to use SIOP methods in the classroom?
Survey Item Strongly
Agree Agree Neutral Disagree Strongly Disagree
Things I learned during SILD training were easily implemented in the classroom
22% (4)
50% (9)
22% (4)
6% (1)
0% (0)
Including SILD strategies in my teaching increased my workload
11% (2)
39% (7)
44% (8)
0% (0)
6% (1)
Unexpected duties or tasks which came up during the year interfered with my ability to implement SILD strategies
11% (2)
33% (6)
33% (6)
17% (3)
6% (1)
I observed positive benefits for students after using SILD strategies in my classroom
17% (3)
61% (11)
11% (2)
11% (2)
0% (0)
Students appear to like the inclusion of SILD strategies in my classroom
17% (3)
56% (10)
22% (4)
6% (1)
0% (0)
Other district staff (teachers, curriculum specialists, etc.) facilitated my use of SILD strategies
11% (2)
33% (6)
28% (5)
17% (3)
11% (2)
Principals and other administrators facilitated my use of SILD strategies
6% (1)
28% (5)
28% (5)
28% (5)
11% (2)
Ongoing support was available when I had questions or concerns
28% (5)
6% (1)
39% (7)
22% (4)
6% (1)
20
Appendix E
Questions and Responses From Online Survey Administered to SILD Teachers Concerning Implementation of Specific SILD Strategies.
Survey Item Always Usually Sometimes Seldom Never Classroom:
Cognates: Spanish, French, German 18% (3)
35% (6)
24% (4)
6% (1)
18% (3)
Word walls – interactive, content vocabulary, structure and process reminders
72% (13)
17% (3)
11% (2)
0% (0)
0% (0)
Polysemous words 24% (4)
6% (1)
41% (7)
6% (1)
24% (4)
Foldables 24% (4)
29% (5)
35% (6)
6% (1)
6% (1)
Realia, visuals 47% (8)
47% (8)
0% (0)
0% (0)
6% (1)
Vocabulary:
Root words 33% (6)
28% (5)
33% (6)
6% (1)
0% (0)
Suffixes 33% (6)
28% (5)
33% (6)
6% (1)
0% (0)
Prefixes 29% (5)
29% (5)
35% (6)
6% (1)
0% (0)
Latin and Greek stems 28% (5)
17% (3)
39% (7)
6% (1)
11% (2)
Signal words 28% (5)
22% (4)
33% (6)
11% (2)
6% (1)
"Process to performance" verbs 29% (5)
18% (3)
18% (3)
18% (3)
18% (3)
Synonyms and antonyms 56% (10)
22% (4)
17% (3)
0% (0)
6% (1)
Writing strong content & language objectives: ELPS - activities for listening, speaking, reading, writing
67% (12)
22% (4)
6% (1)
6% (1)
0% (0)
Accomodations based on TELPAS composite ratings
56% (10)
17% (3)
11% (2)
17% (3)
0% (0)
Strategies – before, during, and after reading:
Graphic organizers 56% (10)
39% (7)
6% (1)
0% (0)
0% (0)
Rewrite text 44% (8)
33% (6)
22% (4)
0% (0)
0% (0)
GIST 24% (4)
18% (3)
24% (4)
6% (1)
29% (5)
Idioms 22% (4)
28% (5)
22% (4)
0% (0)
28% (5)

21
Appendix E (continued)
Survey Item Always Usually Sometimes Seldom Never Strategies (continued):
Mnemonics 17% (3)
11% (2)
33% (6)
17% (3)
22% (4)
Anticipation guides 50% (9)
22% (4)
22% (4)
0% (0)
6% (1)
"Pattern circles" - (pizza dialog) 22% (4)
22% (4)
33% (6)
6% (1)
17% (3)
Writing:
Semantic mapping 24% (4)
29% (5)
29% (5)
18% (3)
0% (0)
Sentence stem cubes (content specific) 33% (6)
28% (5)
22% (4)
11% (2)
6% (1)
Guided writing techniques (e.g., prompts) 56% (10)
17% (3)
17% (3)
6% (1)
6% (1)
Cooperative pairs 67% (12)
22% (4)
6% (1)
0% (0)
6% (1)
Interactive groups 61% (11)
28% (5)
6% (1)
0% (0)
6% (1)
Summarization - "Somebody wanted but so" 22% (4)
6% (1)
50% (9)
6% (1)
17% (3)
Use of support staff after receiving SILD training:
Very Frequently
Frequently Sometimes Seldom Never
Teacher Development Specialists 17% (3)
17% (3)
11% (2)
17% (3)
39% (7)
Multilingual Department 6% (1)
17% (3)
28% (5)
6% (1)
44% (8)
22
Appendix F
Explanation of Assessments Included in Report
The STAAR is a state-mandated, criterion-referenced assessment used to measure student achieve-ment. STAAR measures academic achievement in reading and mathematics in grades 3–8; writing at grades 4 and 7; social studies in grades 8; and science at grades 5 and 8. The STAAR-L is a linguisti-cally accommodated version of the STAAR given to ELLs who meet certain eligibility requirements.
For high school students, STAAR includes end-of-course (EOC) exams in English language arts (English I, II, and III), mathematics (Algebra I, Geometry, Algebra II), science (Biology, Chemistry, Phys-ics), and social studies (World Geography, World History, U.S. History). In 2011–2012, only grade 9 stu-dents took the EOC exams, while those in grades 10 and 11 continued to take the TAKS.
The TAKS is a state-mandated, criterion-referenced test first administered in the spring of 2003, and which is being phased out beginning in 2012. It measures academic achievement in reading, mathemat-ics, science, and social studies in grades 10 and 11. Students currently in grades 10 and higher as of 2011–2012 will continue to take exit-level TAKS tests in order to graduate, while those in grades 9 and lower will instead take STAAR EOC exams (see above).
The Stanford 10 is a norm-referenced, standardized achievement test in English used to assess stu-dents’ level of content mastery. Stanford 10 tests exist for reading, mathematics, and language (grades 1–8), science (3–8), and social science (grades 3–8). This test provides a means of determining the relative standing of students’ academic performance when compared to the performance of students from a nationally-representative sample.
The Aprenda 3 is a norm-referenced, standardized achievement test in Spanish. It is used to assess the level of content mastery for students who receive instruction in Spanish. The reading, mathematics, and language subtests are included in this report for grades 1 through 6. Students take the Aprenda (Spanish) or Stanford (English) according to the language of their reading/language arts instruction. The Aprenda and Stanford tests were developed by Harcourt Educational Measurement (now Pearson, Inc.). However, the Aprenda is not simply a translation of the Stanford. The structure and content of the Aprenda are aligned with those of the Stanford, but development and referencing differ in order to pro-vide culturally relevant material for Spanish-speaking student populations across the United States.
The TELPAS is an English language proficiency assessment which is administered to all ELL students in kindergarten through twelfth grade, and which was developed by the Texas Education Agency (TEA) in response to federal testing requirements. Proficiency scores in the domains of listening, speaking, reading, and writing are used to calculate a composite score. Composite scores are in turn used to indi-cate where ELL students are on a continuum of English language development. This continuum, based on the stages of language development for second language learners, is divided into four proficiency levels: Beginning, Intermediate, Advanced, and Advanced High.
23
Appendix G
STAAR End-of-Course Performance of SILD and Non-SILD ESL Students: Number Tested, And Number and Percentage at Unsatisfactory,
Met Minimum, Satisfactory, and Advanced Standards
Student
Group #
Tested
Unsatisfactory Met Minimum Satisfactory Advanced
N % Met N %
Met N %
Met N %
Met
Algebra I SILD 277 72 26 42 15 156 56 7 3
Non-SILD 306 50 16 44 14 196 64 16 5
Biology SILD 221 52 24 42 19 127 57 0 0
Non-SILD 282 62 22 42 15 176 62 2 1
World Geography
SILD 283 143 51 48 17 91 32 1 0
Non-SILD 287 126 44 47 16 113 39 1 0
English I Reading
SILD 292 226 77 29 10 37 13 0 0
Non-SILD 302 206 68 31 10 65 22 0 0
English I Writing
SILD 291 257 88 22 8 12 4 0 0
Non-SILD 301 252 84 22 7 27 9 0 0