2012 world investment and political risk · 2012 world investment and political risk world...
TRANSCRIPT

World Investment Trends and Corporate Perspectives
Sovereign Default and Expropriation
The Political Risk Insurance
Industry
2012WORLD INVESTMENT AND POLITICAL RISK
MIGA WIPR REPORT 2012
© 2013 The International Bank for Reconstruction and Development/The World Bank
1818 H Street, NW Washington, DC 20433 t. 202.473.1000 www.worldbank.org [email protected]
Some rights reserved 1 2 3 4 15 14 13 12
This work is a product of the staff of The World Bank with external contributions. Note that The World Bank does not necessarily own each component of the content included in the work. The World Bank therefore does not warrant that the use of the content contained in the work will not infringe on the rights of third parties. The risk of claims resulting from such infringement rests solely with you.
The findings, interpretations, and conclusions expressed in this work do not necessarily reflect the views of The World Bank, its Board of Executive Directors, or the governments they represent. The World Bank does not guarantee the accuracy of the data included in this work. The boundaries, colors, denominations, and other information shown on any map in this work do not imply any judgment on the part of The World Bank con-cerning the legal status of any territory or the endorsement or acceptance of such boundaries.
Nothing herein shall constitute or be considered to be a limitation upon or waiver of the privileges and immu-nities of The World Bank, all of which are specifically reserved.
Rights and Permissions This work is available under the Creative Commons Attribution 3.0 Unported license (CC BY 3.0) http://creativecommons.org/licenses/by/3.0. Under the Creative Commons Attribution license, you are free to copy, distribute, transmit, and adapt this work, including for commercial purposes, under the following conditions:
Attribution—Please cite the work as follows: World Investment and Political Risk 2012. Washington, DC: MIGA, World Bank Group. DOI: 10.1596/978-0-8213-9508-0 License: Creative Commons Attribution CC BY 3.0
Translations—If you create a translation of this work, please add the following disclaimer along with the attri-bution: This translation was not created by The World Bank and should not be considered an official World Bank translation. The World Bank shall not be liable for any content or error in this translation.
All queries on rights and licenses should be addressed to the Office of the Publisher, The World Bank, 1818 H Street NW, Washington, DC 20433, USA; fax: 202-522-2625; e-mail: [email protected].
ISBN (paper): 978-0-8213-9508-0 DOI: 10.1596/978-0-8213-9508-0
Cover art: Shutterstock Design, cover, and document: Suzanne Pelland, MIGA/World Bank Group
2012
WORLD INvESTMENT
AND POLITICAL RISk
World Investment Trends and
Corporate Perspectives
Sovereign Default and
Expropriation
The Political Risk Insurance
Industry
MIGA WIPR REPORT 2012
TABLE OF CONTENTS
FOREWORD ...................................................................................................................................................................1ACkNOWLEDGMENTS ..................................................................................................................................................3SELECTED ABBREvIATIONS .........................................................................................................................................5EXECUTIvE SUMMARY ................................................................................................................................................. 7
CHAPTER ONEWorld Investment Trends and Corporate Perspectives ..............................................................................................12 Prospects for Global Growth ................................................................................................................ 13 Prospects for Private Capital Flows to Developing Countries ..........................................................14 Trends and Prospects for FDI ...............................................................................................................14 MIGA-EIU Political Risk Survey 2012 ...................................................................................................17 FDI Outflows from Developing Countries ...........................................................................................18 Political Risks and Developing Countries ............................................................................................18 Corporate Perceptions of Political Risks in Developing Countries ...................................................20 Spotlight on South-South FDI ............................................................................................................. 22 Spotlight on the Middle East and North Africa ................................................................................. 24 CHAPTER TWOSovereign Default and Expropriation ......................................................................................................................... 28 Sovereign Default and Expropriation .................................................................................................. 28 Historical Trends of Sovereign Default and Expropriation ................................................................ 29 Which Countries are Crisis-Prone? .......................................................................................................33 Corporate-level Political Risk Perceptions for Sovereign Credit Risk ...............................................37 CHAPTER THREEThe Political Risk ......................................................................................................................................................... 42 Demand for PRI .................................................................................................................................... 42 Supply of PRI: Capacity, Pricing, and Products ..................................................................................44 Claims and Recoveries ......................................................................................................................... 47 Corporate Approaches to Political Risk Management .......................................................................49
ENDNOTES .................................................................................................................................................................52
APPENDICES Appendix 1 FDI Inflows, 2004–2011 ...................................................................................................................... 56Appendix 2 MIGA-EIU Political Risk Survey 2012 ...................................................................................................58Appendix 3 Overview of the PRI Market .................................................................................................................80
BOXES Box 2.1 Impact of Sovereign Debt Restructuring on Financial Flows: The Case of Indonesia ............................33Box 2.2 Sovereign Risk and Transfer/Convertibility Risk ......................................................................................... 36Box 3.1 Terrorism Insurance ...................................................................................................................................... 48
TABLES Table 1.1 Global Growth Assumptions ...................................................................................................................... 13Table 2.1 Joint Distribution of Sovereign Default and Expropriation Events ......................................................... 31Table 2.2 Frequency of Sovereign Defaults and Expropriations over 1970-2004 .................................................. 35

MIGA WIPR REPORT 2012
FIGURES Figure 1 Changes in Foreign Investment Plans ..................................................................................................8Figure 2 Primary Reasons for Investing More, or Reinvesting, in the Middle East and North Africa ...........9Figure 3 Risk Mitigation Strategies by Foreign Investors .................................................................................10
Figure 1.1 Net Private Capital Flows to Developing Countries ........................................................................... 15Figure 1.2 Net FDI Inflows to Developing Countries by Region ........................................................................16Figure 1.3 Changes in Foreign Investment Plans ................................................................................................19Figure 1.4 FDI Outflows from Developing Countries ..........................................................................................19Figure 1.5 Ranking of the Most Important Constraints for FDI in Developing Countries ............................... 21Figure 1.6 Types of Political Risk of Most Concern to Investors in Developing Countries .............................. 21Figure 1.7 Proportion of Firms that Have Withdrawn Existing Investments or Cancelled New Investment Plans on Account of Political Risk over the Past 12 Months ........................................23Figure 1.8 Proportion of Firms that Have Suffered Losses Owing to Political Risk over the Past Three Years .....................................................................................................................23Figure 1.9 South-South Outward FDI Stock ......................................................................................................... 25Figure 1.10 South-South Capital Expenditures in Cross-border Greenfield Projects .......................................... 25Figure 1.11 FDI Inflows into the Middle East and North Africa .......................................................................... 26Figure 1.12 How Have the Developments in the Arab World over the Past Year Affected your Current and Future Plans for Investments in the Middle East and North Africa? ...................................... 26Figure 1.13 Primary Reasons for Investing More, or Reinvesting, in the Middle East and North Africa .........27Figure 1.14 Increase in Perceived Political Risks on Account of the Political Turmoil in the Middle East and North Africa........................................................................................................27Figure 2.1 History of Sovereign Default and Expropriation ................................................................................30Figure 2.2 Changes in International Investment Positions, 1995-2010 .............................................................. 32Figure 2.3 Inflows of Debt Securities and FDI ..................................................................................................... 33Figure 2.4 Correlation of Sovereign Credit Rating and Transfer/Convertibility Rating...................................... 37Figure 2.5 Impact of Actual Sovereign Risk Events on Political Risk Perceptions ...........................................38Figure 2.6 Sovereign Credit Risk and its Impact on Political Risk ......................................................................39
Figure 3.1 PRI by Berne Union Members and FDI Flows into Developing Countries .....................................41Figure 3.2 PRI Issuance by Berne Union Members .............................................................................................42Figure 3.3 PRI Issuance by Berne Union Members, by Type of Provider ..........................................................43Figure 3.4 Available Private Market PRI Capacity ................................................................................................ 44Figure 3.5 General Insurance Pricing vs. Private PRI Capacity ...........................................................................45Figure 3.6 Ratio of Premiums to Average PRI Exposure for Berne Union Members ...................................... 46Figure 3.7 Investment Claims Paid by Berne Union Members ......................................................................... 49Figure 3.8 Investment Claims Paid by Berne Union Members, by Type of Provider ....................................... 49Figure 3.9 Recoveries by Berne Union Members, by Type of Provider ..............................................................50Figure 3.10 Risk Mitigation Strategies by Foreign Investors ................................................................................50Figure 3.11 Investors Risk Mitigation Strategies, by Risk Type ............................................................................. 51

MIGA WIPR REPORT 2012

MIGA WIPR REPORT 2012 | 1
FOREWORD
The mission of the Multilateral
Investment Guarantee Agency (MIGA) is
to promote foreign direct investment(FDI)
into developing countries to support
economic growth, reduce poverty, and
improve people’s lives. As part of this
mandate, MIGA seeks to foster a better
understanding of investors’ perceptions of
political risk as they relate to FDI, as well
as the role of the political risk insurance
(PRI) industry in mitigating these risks.
As 2012 draws to a close, the economic turbulence unleashed by the 2008 global financial crisis persists. Although FDI inflows to emerging markets began to recover in the years following the crisis, they are ex-pected to decline this year. The continued high growth in developing countries, however, makes them in-creasingly attractive to foreign investors, who remain optimistic about their intentions to invest there. New challenges, especially the ongoing sovereign debt crisis and recession in the euro zone, have slowed the flow of FDI from traditional sources. However, FDI outflows from new investors from developing countries have risen significantly in recent years, and are expected to reach a record level this year.
This report examines investors’ perceptions and risk-mitigation strategies as they navigate today’s uncertain economic waters. It finds that investors continue to rank political risk as a key obstacle to investing in developing countries and are increas-
ingly turning toward PRI as a risk-mitigation tool. The insurance industry has responded with new products and innovative ways to use existing products as well as substantial capacity to meet the growing demand.
World Investment and Political Risk 2011 examined the triggers of expropriation, and found that authoritar-ian political regimes have been linked to an increased risk of expropriation. This year we look at the risk of sovereign defaults, typically caused by adverse economic shocks, and how it relates to expropriation. Both the risks of sovereign default and expropriation remain significant issues for foreign investors amid the global economic slowdown and continued politi-cal instability.
As we continue to gain a deeper understanding of political risk through our research, we hope that investors will feel more confident in moving forward into new markets. With developing countries becoming the engines of economic growth in today’s multipolar world, the need for investments that generate jobs, transfer technology, and build infra-structure is greater than ever.
Izumi KobayashiExecutive Vice President

2 | MIGA WIPR REPORT 2012

MIGA WIPR REPORT 2012 | 3
This report was prepared by a team led by Daniel villar and Conor Healy, under the overall coordination of Ravi vish, and comprising Persephone Economou and Manabu Nose. Chapter two of the report is based on the research by Aart kraay, Maya Eden, and Rong Qian, as cited in the chapter. Hwee kwan Chow, Professor of Economics and Statistics (Practice) and Associate Dean of the School of Economics at Singapore Management University, and Charles Adams, visiting Professor at the Lee kuan Yew School of Public Policy, National University of Singapore also contributed to the report. Rebecca Post and Cara Santos Pianesi edited; Suzanne Pelland and Antoine Jaoude were in charge of graphic design. Mallory Saleson was the overall coordinator of the editorial and production process. Saodat Ibragimova and vladislav Ostroumov provided administrative support.
This year’s World Investment and Political Risk report benefitted from comments by MIGA’s senior man-agement team and we thank Izumi kobayashi, Michel Wormser, Ana-Mita Betancourt, kevin Lu, Edith Quintrell, Lakshmi Shyam-Sunder, Ravi vish, and Marcus Williams. Within MIGA, Marc Roex and Gero verheyen also provided feedback.
The World Bank’s Development Prospects Group, under the guidance of Andrew Burns, provided the macroeconomic data presented in the report. The investor survey was conducted on behalf of MIGA by the Economist Intelligence Unit. The analysis of
the political risk insurance market benefited from the gracious participation of political risk brokers in a roundtable discussion in London organized by Exporta Publishing and Events Ltd. Arthur J. Gallagher (AJG) International provided data on the private insurance market.
Caroline Freund (Chief Economist, Middle East and North Africa, World Bank), Elena Ianchovichina (Lead Economist, Middle East and North Africa, World Bank), David Rosenblatt (Economic Adviser, World Bank Chief Economist Office), Aart kraay (Lead Economist, Development Research Group), Peter M. Jones (Secretary General, Berne Union), Beat Habegger (Deputy Head of Sustainability and Political Risk, Swiss Re), Daniel Hui (Director of Credit, Surety, and Political Risk, Swiss Re), Moritz Zander (Senior Political Risk Analyst, Swiss Re), Theodore H. Moran (Marcus Wallenberg Chair at Georgetown University’s School of Foreign Service), and Gerald T. West (also at Georgetown University as Adjunct Professor for the School of Foreign Service) provided peer reviews.
ACkNOWLEDGMENTS

4 | MIGA WIPR REPORT 2012

MIGA WIPR REPORT 2012 | 5
BRIC Brazil, Russian Federation, India, and China
EIU Economist Intelligence Unit
EU European Union
FDI Foreign direct investment
GDP Gross domestic product
IMF International Monetary Fund
MIGA Multilateral Investment Guarantee Agency
MNE Multinational enterprise
OECD Organisation for Economic Co-operation and Development
PRI Political risk insurance
UNCTAD United Nations Conference on Trade and Development
Dollars are current U.S. dollars unless otherwise specified.
SELECTED ABBREvIATIONS

6 | MIGA WIPR REPORT 2012

MIGA WIPR REPORT 2012 | 7
EXECUTIvE SUMMARY
Global economic growth estimates for
2012 indicate a continuing fragile recovery.
The ongoing sovereign debt crisis and
recession in the euro zone, curtailed bank
lending and domestic deleveraging, fluc-
tuating but elevated commodity prices,
and the ongoing political turmoil in
the Middle East and North Africa have
slowed the initial rebound that followed
the 2008 global financial crisis. This
slow progress has had an impact on
developing countries, which initially fared
well in terms of rebounding growth rates,
private capital flows, and foreign direct
investment (FDI).
Having fallen sharply after the onset of the crisis, FDI inflows received by developing countries climbed by about $100 billion each subsequent year to reach around $640 billion in 2011. In 2012, however, FDI inflows into developing countries are estimated to fall to just under $600 billion. All developing regions experienced a decline in 2012, except for Latin America and the Caribbean. In contrast to inflows, FDI outflows from developing countries are estimated to have reached nearly $240 billion in 2012, a new record level. The outward FDI stock of developing countries has risen significantly in recent
years, and about a quarter of this stock is destined for other developing countries.
The findings of the MIGA-EIU Political Risk Survey 2012 underscore that the ongoing weakness and instability in the global economy remain a top constraint for foreign investors’ plans to expand in developing countries in the short term. Nevertheless, cognizant of stronger economic growth in developing countries, the survey also finds that foreign investors remain relatively optimistic in their intentions to invest in developing countries in the short term (figure 1). Over the medium term, foreign investors identify political risk as the most significant constraint to investing in developing countries. Notwithstanding this, as concerns about macroeconomic stability and access to finance recede, more foreign investors become optimistic in their intentions to invest in developing countries. Projections of FDI inflows into developing countries support this finding, with estimates for 2013 indi-cating a rebound to nearly $700 billion.
Despite elevated perceptions of political risk, the majority of respondents in the MIGA-EIU Political Risk Survey 2012 have no plans to withdraw or cancel investments in developing countries. Within the range of political risks, adverse regulatory changes are the foremost concern to foreign investors over both the short and medium term, followed by breach of contract. Among those that do plan to withdraw or cancel investments, it is again mostly due to adverse regulatory changes or breach of contract. These two political actions are also responsible for the most losses suffered by foreign investors in developing countries, according to the survey. The political risk that increases the most in perceived significance between the short and medium term is expropriation.
FDI flows into the Middle East and North Africa have been adversely affected by political risk over the past couple of years. Investor perceptions of political risks in the region remain elevated across a range of risks. The Arab Spring countries have

8 | MIGA WIPR REPORT 2012
Figure 1 Changes in Foreign Investment Plans
Percent of respondents
Source: MIGA-EIU Political Risk Survey 2012
turmoil unfolded, and estimates of such investment remained subdued in 2012, especially in cases where significant political instability persists. The MIGA-EIU Political Risk Survey 2012 shows that the majority of foreign investors are not anticipating big changes in their investment plans at present or in the near future in Arab Spring countries, and a slightly higher proportion of foreign investors plan to divest rather than invest. As with all FDI, economic factors will play the most important role in foreign investor re-engagement in the Middle East and North Africa, but political stability is also crucial. The survey shows that investing or reinvesting in the region is conditional first upon more market opportunities, followed by at least one year of political stability, macroeconomic improvements, and reduced corruption (figure 2).
One of the conclusions in World Investment and Political Risk 2011 was that authoritarian political regimes have been linked to an increased risk of expropriation. Sovereign defaults, often caused by adverse economic shocks, are also linked to the political risk of non-honoring of sovereign financial obligations. Both the risks of sovereign default and expropriation remain significant issues for foreign investors amid the global economic slowdown and continued political instability. This raises the question of whether and how sovereign defaults relate to other political risks, in particular expropriation, and this is addressed in chapter two of this report. From a historical perspective, these events have occurred in waves and are usually associated with a shift of a country’s external liability position in the balance between equity and debt. Following the wave of expropriations during the 1970s, a shift to sov-ereign debt as a source of financing for developing countries culminated in sovereign defaults of the 1980s. Subsequently, as countries that defaulted lost access to international capital markets, FDI became the major form of foreign capital into developing countries. In recent years, developing countries have relied more on FDI and portfolio equity than on sovereign debt, which suggests that the “prize” for expropriating private assets is now larger.
According to the analysis presented in this report, sovereign defaults and expropriations rarely occur in one country in the same year. Sovereign default and expropriation coincided in only five out of 5,360 cases; the most notable example of these five cases was Indonesia during the Asian financial crisis. Still, there are several systematic patterns in the occur-rences of sovereign default and expropriation events that are worth highlighting. Typically, sovereign defaults coincide with adverse economic shocks and
Fig 1.3
Over the next 12 months
Increase substantially(20% or more)
Increase moderately(more than 1%
but less than 20%)
Stay unchanged
Decrease moderately(more than 1%
but less than 20%)
Decrease substantially(20% or more)
Don’t know
Over the next three years
Increase substantially(20% or more)
Increase moderately(more than 1%
but less than 20%)
Stay unchanged
Decrease moderately(more than 1%
but less than 20%)
Decrease substantially(20% or more)
Don’t know
0 10 20 30 40
0 10 20 30 40
fared worse than other developing countries in the region. The risk perception of civil disturbance and political violence, but also breach of contract, is especially prominent in Arab Spring countries. These countries saw FDI inflows plummet as political

MIGA WIPR REPORT 2012 | 9
Figure 2 Primary Reasons for Investing more, or Reinvesting, in the Middle East and North Africa
Percent of respondents
Source: MIGA-EIU Political Risk Survey 2012
Over a longer timeframe, however, sovereign defaults and expropriations are related in the sense that the majority of countries either consistently refrain from sovereign default and expropriation, or engage in both. It is perhaps not unexpected that the same types of countries experience both sovereign defaults and expropriations, as is evidenced by the clustering of both types of events in two regions, Africa (both North and sub-Saharan) and Latin America and the Caribbean. The perspectives of foreign investors in the MIGA-EIU Political Risk Survey 2012 underline perceptions of the positive link between sovereign default risk and more generally elevated perceptions of political risk. The survey finds that more than half of the responding foreign investors believed that an increase in sovereign risk increases broader political risk, particularly for civil disturbance and breach of contract. Even a sovereign credit rating downgrade raised concerns for foreign investors about elevated risks of expropriation, breach of contract, and transfer and convertibility restrictions—especially when the new rating was below investment grade and most clearly in the case when the new grade was a result of a sovereign default.
The fact that political risk is perceived as an important constraint to investing in developing countries has been a boon for the political risk insurance (PRI) industry. New issuance of PRI by members of the Berne Union—the leading asso-ciation of public, private, and multilateral insurance providers—increased by 13 percent in 2011, setting a new volume record. Expressed as a ratio of FDI inflows into developing countries, new PRI has risen to 12 percent on average during 2009-2011, compared with a 10 percent average during 2006-2008. As of the first half of 2012, PRI issuance was still growing strongly, with another record level forecast for 2012. The current main drivers of the increased demand have been the events in the Middle East and North Africa, which have raised the specter of unanticipated events in seemingly stable political regimes; recent expropriations in Latin America; contract renegotiations in resource-rich economies; and capital constraints and increased regulation for financial institutions, which make financing with PRI an attractive option.
Notwithstanding increasing covers, the bulk of FDI remains uninsured against political risk. According to the MIGA-EIU Political Risk Survey 2012, only 18 percent of the responding firms use PRI as a risk-mitigation tool, a proportion that has changed only marginally over the past four years. The explanation for this rests partly on the perception that some
Fig 1.14
0 5 10 15 20 25 30 35 40
Increased marketopportunities
One year ofpolitical stability
Improvedmacroeconomic
stability
Decrease in corruption
More favorablegov’t regulations
Increased accessto financing
Improved infrastructurecapacity
Increased accessto qualified staff
Other
higher debt burdens, while the likelihood of expropri-ations is explained by the type of political regime. In addition, sovereign default events are less persistent because it is not possible for a country to default on its debt obligations year after year. In contrast, expropriation events do tend to persist because they are often localized, clustered in specific countries or sectors within a country, and may well be repeated multiple times. Since it is not typically the case that a government will expropriate its private sector all at once, expropriations occur incrementally. For example, from 1970 to 2004, of the 78 countries that expropriated private assets, 70 percent did so two or more times.

10 | MIGA WIPR REPORT 2012
Figure 3 Risk Mitigation Strategies by Foreign Investors
Percent of respondents
Source: MIGA-EIU Political Risk Survey 2012Note: Percentages add up to more than 100 percent
because of multiple selections
political risks (for example, political violence) cannot be effectively mitigated by PRI (figure 3). For other risks, informal political risk mitigation prevails. For breach of contract, bringing in local partners through joint ventures has been the preferred risk-mitigation tool. It is only in the case of expropriations that foreign investors give relatively high marks to PRI; but even for this risk, informal relationships with political leaders continue to be viewed as a more effective approach to risk management.
The increase in demand for PRI has been mostly broad-based across all political risks, while both specialized PRI and broader universal insurance coverage have tended to move largely in parallel. Geographically, there has been considerable demand for PRI in developing Asia, reflecting the sizeable FDI received by that region and the existence of many large infrastructure projects. More recently, there has been a marked increase in inquiries for PRI for investments in the Southern euro-zone countries due to heightened perceptions of political risks resulting from the sovereign debt crisis. This has gone against the earlier conventional wisdom that political risks are present in developing countries alone. Among Berne Union members, demand for coverage from public providers has increased at a faster rate than for private providers. Demand for South-based public PRI providers (among members of the Berne Union) has also increased considerably because of the rapid growth in outward FDI from developing countries in recent years.
The elevated political risk perceptions of investors have revived demand for existing products and have given rise to new product offerings. In light of elevated political risk in the Middle East and North Africa, there has been renewed interest in coverage for existing investments, while concerns about stress on public finances has led public providers to offer coverage for non-honoring of sovereign financial obli-gations. While the Lloyd’s market has been offering this coverage for some time, the entry of public pro-viders has permitted an increase in both capacity and tenors.
The claims picture remains volatile and changing in nature and recoveries have been consistently lower over the past five years. Claims rose sharply in both 2010 and 2011, in the latter year as a result of political upheaval in the Middle East and North Africa. Most claims in terms of value were attributed to political violence in 2011, while the trend until then for the bulk of claims had been for expropriation and breach of contract.
Fig 3 .9
Use of joint venture oralliance with
local company
Political/economicrisk analysis
Invested gradually whiledeveloping familiarity with
the local environment
Use of third-partyconsultants
Scenario planning
Engagement withlocal communities
Engagement withgovernment in
host country
Develop closerelationships
with political leaders
Political risk insurance
Operational hedging(setting up multiple
plants to spread risk)
Engagement withnon-governmental
organizations
Credit default swaps
Provide supportto a well-connected
political figure
Other, please specify
We don’t use any toolsor products to mitigate
political risk
Don’t know
0 20 40 60

MIGA WIPR REPORT 2012 | 11
Despite the growth in demand, capacity in the PRI industry has not been a constraint so far. Estimates place an increase in capacity in the private and Lloyd’s PRI market at 19 percent between January and July 2012, mostly on tenors of 10 years or less. New PRI providers, such as the XL Group and Canopius, have also entered the private and Lloyd’s PRI market, while the public PRI market has expanded with the addition of the Export Insurance Agency of the Russian Federation.
PRI capacity and pricing are not idiosyncratic, but respond to trends in the broader insurance industry and its cycles. Capacity for the PRI industry is therefore affected by factors that influence the broader insurance industry, such as market devel-opments for other insurance lines and new regu-latory changes, such as the new Solvency II rules in the European Union and the Basel III regulatory
framework. The prevailing low interest rate envi-ronment has put downward pressure on financial returns, which are part of the business model of insurance companies, and has led to shifts within the insurance industry into more profitable specialized lines, such as PRI. All of these developments have contributed to the increased capacity in the PRI industry and have also led to the perpetuation of a “soft premium” environment, a trend that does not appear likely to change in the near term.

12 | MIGA WIPR REPORT 2012
CHAPTER ONE
WORLD INvESTMENT TRENDS
AND CORPORATE PERSPECTIvES
r Global economic growth estimates for 2012 indicate a continuing fragile recovery with significant downside risks. Private capital flows to developing countries moderated significantly, while foreign direct investment (FDI) inflows declined across all developing regions, with the exception of Latin America and the Caribbean.
r Despite the decline in FDI inflows to developing countries, they continue to account for a substantial share of global FDI: in 2012 they are estimated to be 36 percent of inflows and 14 percent of outflows.
r FDI inflows to developing countries are expected to rebound in 2013 to just under $700 billion and reach close to $800 billion in 2014. MIGA’s survey of corporate investors corroborates this expectation, with the majority of investors in these markets being moderately opti-mistic about their investment intentions over the next twelve months, but more optimistic over the next three years.
r FDI outflows from developing countries reached a new record in 2012, an estimated $237 billion, continuing the upward trend of recent years. About a quarter of the outward FDI stock of developing countries goes into other developing countries (“South-South” investment).
r While economic instability and access to finance continue to be key concerns of companies investing overseas over the next 12 months, mirroring the state of the global economy, political risk features as the most important concern over the next three years.
r Political instability in the Middle East and North Africa has taken a toll on investment intentions and has elevated perceptions of political risk, not only for the Arab Spring countries, but also for other countries in the region. Political and economic stability are inducements for corporate investors to return, but the findings of MIGA’s survey of corporate investors indicate market opportunities are more important over the medium term for encouraging investor re-engagement.

MIGA WIPR REPORT 2012 | 13
This chapter presents the highlights of recent developments in the global economy; an overview of the principal trends in FDI flows into and from developing countries; the findings of a corporate survey of foreign investors regarding their investment intentions over the next twelve-month and three-year time horizons; and perceptions of the main con-straints to investing overseas. South-South FDI and foreign investor perceptions of risks and conditions for re-engagement in the Middle East and North Africa are also highlighted in this chapter.
Prospects for Global Growth
The world economy weakened in 2011, accentuated by the sovereign debt crisis in Europe, natural disasters in Japan and Thailand, and the effects of
earlier monetary tightening in emerging markets to combat the threat of inflation. Positive economic developments in the first quarter of 2012 gave way to headwinds, as the crisis in the euro zone—coupled with financial sector stress, ongoing regulatory uncer-tainty, and plunging investor confidence—dampened global economic growth forecasts. As a result, these forecasts for 2012 have been continuously revised downward and real GDP growth is not expected to experience an uptick until 2013 (table 1.1).
Among the high-income economies, despite early signs of growth acceleration, the United States appeared to have hit a soft patch in 2012, with downward revisions in its real GDP growth rates and number of jobs created, and only marginal progress in curbing unemployment at a time of falling labor force participation. In Europe, the euro-zone crisis continued to dominate the economic landscape,
Table 1.1 Global Growth Assumptions*
Real GDP growth in percent
2008 2009 2010 2011 2012e 2013f 2014f
World 1.4 -2.2 3.9 2.8 2.3 2.6 3.2
High-income countries 0.1 -3.5 2.8 1.6 1.3 1.5 2.2
Developing countries 5.8 1.9 7.3 6.2 5.1 5.6 5.9
East Asia and Pacific 8.5 7.5 9.7 8.2 7.2 7.6 7.5
Europe and Central Asia 3.9 -6.5 5.4 5.6 3.4 3.9 4.6
Latin America and Caribbean 4.0 -1.9 6.1 4.3 3.2 3.9 4.0
Middle East and North Africa 4.1 3.0 4.1 1.5 0.5 1.9 3.4
South Asia 5.9 5.5 8.1 7.3 6.1 6.1 6.8
Sub-Saharan Africa 5.1 1.9 5.0 4.7 4.8 5.2 5.2
Source: World Bank Global Economic Prospects Group staff estimates Note: e=estimate; f=forecast * As of October 2012
14 | MIGA WIPR REPORT 2012
with growing challenges due partly to continued deleveraging efforts, widening bond spreads, and declining equities. In Japan, reconstruction spending has contributed to a recovery in economic growth in 2012, but prospects going forward indicate a slower rate of expansion in light of the country’s fiscal deficit and debt problem.
In developing countries, real GDP growth is also expected to slow in 2012 and increase only mar-ginally in 2013-2014 (table 1.1). Although continuing to grow at rates much higher than for high-income economies, developing countries are facing several challenges: vulnerability to weak global economic growth prospects and curtailed bank lending in high-income economies; fluctuating commodity prices; volatile capital flows; and adverse political devel-opments. However, for the most part, the danger of inflation has subsided. New challenges are emerging in China, the developing world’s largest economy, as it shifts its focus from an export-oriented to a domestic consumption-driven economy. The evo-lution of the economic and political situation in China will impact growth prospects in a number of developing countries, particularly commodity-exporting ones.
The crisis in the euro zone and intensification of the region’s recession in 2012 are having important effects on today’s intertwined global economy through various channels. These include trade, banking and financial linkages, FDI and the activities of multinational enterprises (MNEs), and workers’ remittances. Contagion from the euro-zone crisis is playing an important role in the projected slowdown in Europe and Central Asia, especially in Southeast Europe. With an economy more driven by natural resources, the Russian Federation is an exception and has maintained elevated real GDP growth projections despite its close economic links with Europe.
Economic growth in the Middle East and North Africa—also dependent on Europe for trade and FDI and still marred by considerable political uncertainty and turmoil—is estimated to have decelerated further in 2012 and is now forecast to rebound in 2013. Economic growth in East Asia and the Pacific and in South Asia is estimated to have also decelerated in 2012, mainly because of a slowdown in China and India. Growth in Latin America and the Caribbean slowed down as well, mostly due to a sharp decel-eration in Brazil. In contrast, sub-Saharan Africa is anticipated to continue its recent strong performance and maintain an elevated rate of real GDP growth of around 5 percent.
In sum, with financial conditions having worsened sharply and increased uncertainty, the global economy is estimated to have slowed down in 2012, and growth rates are expected to remain moderate over the next couple of years. At the same time, the downside risks to the current growth projections have risen, as confidence levels have deteriorated and market turmoil persists. While the effects will be felt more strongly in high-income countries, developing countries will not remain immune to adverse economic fall-out.
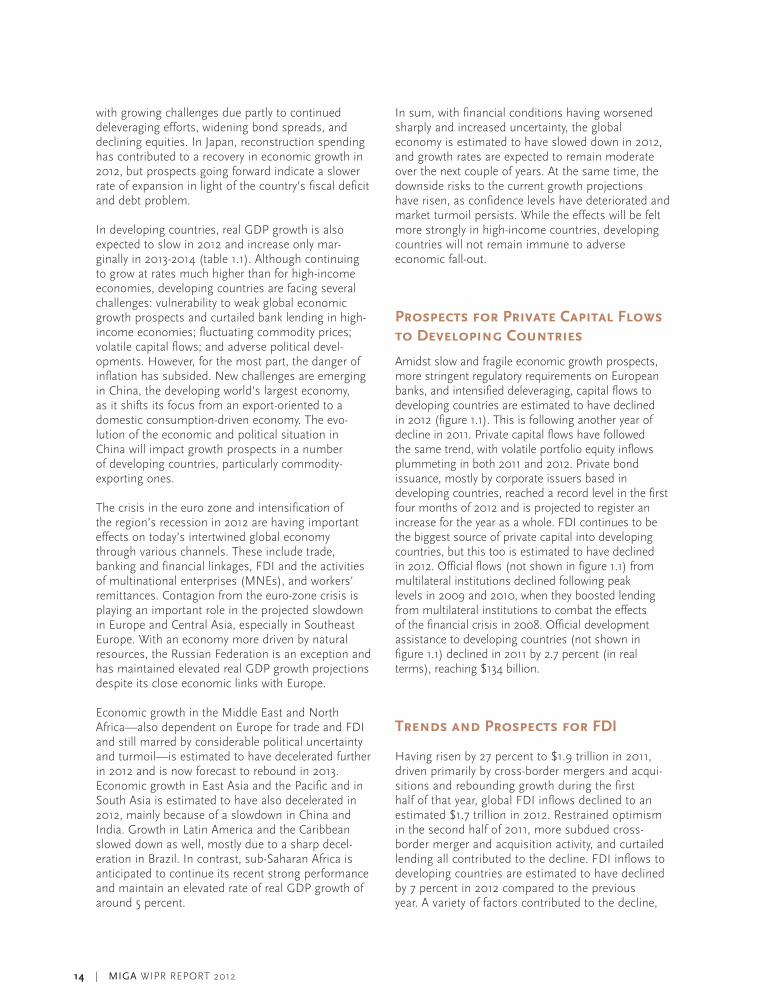
Prospects for Private Capital Flows to Developing Countries
Amidst slow and fragile economic growth prospects, more stringent regulatory requirements on European banks, and intensified deleveraging, capital flows to developing countries are estimated to have declined in 2012 (figure 1.1). This is following another year of decline in 2011. Private capital flows have followed the same trend, with volatile portfolio equity inflows plummeting in both 2011 and 2012. Private bond issuance, mostly by corporate issuers based in developing countries, reached a record level in the first four months of 2012 and is projected to register an increase for the year as a whole. FDI continues to be the biggest source of private capital into developing countries, but this too is estimated to have declined in 2012. Official flows (not shown in figure 1.1) from multilateral institutions declined following peak levels in 2009 and 2010, when they boosted lending from multilateral institutions to combat the effects of the financial crisis in 2008. Official development assistance to developing countries (not shown in figure 1.1) declined in 2011 by 2.7 percent (in real terms), reaching $134 billion.
Trends and Prospects for FDI
Having risen by 27 percent to $1.9 trillion in 2011, driven primarily by cross-border mergers and acqui-sitions and rebounding growth during the first half of that year, global FDI inflows declined to an estimated $1.7 trillion in 2012. Restrained optimism in the second half of 2011, more subdued cross-border merger and acquisition activity, and curtailed lending all contributed to the decline. FDI inflows to developing countries are estimated to have declined by 7 percent in 2012 compared to the previous year. A variety of factors contributed to the decline,

MIGA WIPR REPORT 2012 | 15
Figure 1.1 Net Private Capital Flows to Developing Countries
$ billion and percent
Source: World Banke=estimate; f=forecast
including concerns over spillover effects from the sovereign debt crisis in Europe, deleveraging and reduced bank lending (especially by banks from high-income economies, which continue to be the biggest source of FDI for the developing world), and increased economic uncertainty. Developing countries accounted for an estimated 36 percent of global FDI in 2012.
In 2011, high-income economies were at the forefront of the increase in FDI inflows on account of a sharp rise in cross-border mergers and acquisitions,1 and together received $1.3 trillion. That year, developing economies saw a 10 percent increase in FDI, alto-gether receiving $639 billion, or 34 percent of global FDI inflows. In 2011, the picture for FDI inflows was mixed, driven by a strong rebound in growth in the first half of the year and a sense that the global economy could be on a sustained path to recovery. The Middle East and North Africa experienced the largest decline in light of the political turmoil, while the biggest increase was in Europe and Central Asia, where FDI had been severely affected by the 2008 financial crisis and recession in Western Europe.
In 2012, FDI inflows to both high-income and developing countries contracted as prospects for sustained recovery became more fragile. FDI inflows into developing countries fell to an estimated $594 billion (36 percent of the global total), a decline felt across all regions except Latin America and the Caribbean, where there was a marginal increase. For the largest recipients of FDI in the developing world—Brazil, the Russian Federation, India, and China (the BRICs)—FDI inflows remained mostly flat in 2011, with China leading the way with inflows totaling about $220 billion. Together the BRICs accounted for about three-fifths of FDI inflows to developing countries in 2011, a share in line with their proportion of nominal developing-country GDP. Low-income economies accounted for an estimated 3.2 percent—a share that has been rising slowly over the past few years and is in line with their portion of developing-country GDP.
FDI inflows into developing countries in the Middle East and North Africa declined marginally in 2012, following a sharp decline in 2011 (figure 1.2). FDI in the region remains subdued and well below the levels reached prior to the onset of the Arab Spring events, mostly due to ongoing political instability and uncer-tainty and weakened investor confidence. In Tunisia, FDI inflows declined by 14 percent in 2011, while inflows to Egypt recorded a net divestment (outflow) of $483 million in the same year. The picture emerging in 2012 is quite diverse: countries with
Fig 1.1
0
1
2
3
4
5
6
7
8
9
-200
0
200
400
600
800
1,000
1,200
1,400
200
4
200
5
200
6
200
7
200
8
200
9
2010
2011
2012
e
2013
f
2014
f
Private debtPortfolio equityFDI
Net private capital flows asa share of GDP (right axis)

16 | MIGA WIPR REPORT 2012
Figure 1.2 Net FDI Inflows to Developing Countries by Region
$ billion and percent
Source: World Banke=estimate; f=forecast
0.0
0.5
1.0
1.5
2.0
2.5
3.0
3.5
4.0
4.5
0
100
200
300
400
500
600
700
800
900
200
420
05
200
620
07
200
820
09
2010
2011
2012
e
2013
f
2014
f
Fig 1.2
Sub-Saharan AfricaSouth AsiaMiddle East and North AfricaLatin America and CaribbeanEurope and Central AsiaEast Asia and Pacific
Share of GDP (right axis)
continued political instability, uncertainty, or conflict are seeing FDI inflows plummet, while countries with relative stability are seeing investor confidence return and are experiencing strong rebounds.2 Indeed, a return to stability and reduced uncertainty would con-tribute to FDI inflows rising quickly to the pre-turmoil levels (see Spotlight on the Middle East and North Africa on page 24).
FDI inflows into South Asia declined sharply in 2012 by an estimated 27 percent, having risen by 18 percent the previous year. The increase in 2011 was attributed to more investment flowing into India, the region’s largest recipient, in response to the ongoing but gradual liberalization of the country’s investment policy, some large cross-border acquisitions of Indian firms, and increases in FDI in the services, chemicals, and pharmaceuticals sectors.3 FDI into South Asia is projected to rebound strongly over the next two years. FDI inflows to East Asia and the Pacific declined mar-ginally by an estimated 5 percent in 2012, following another small decline in 2011 as inflows into China, the region’s principal recipient, moderated. The slowdown in China is partly attributed to spending constraints facing investors in high-income economies and mod-erating global demand, negatively affecting manu-facturing FDI. While inflows into China may adjust permanently to levels below their peak, overall FDI for East Asia and the Pacific is projected to increase over the next two years.
FDI inflows into sub-Saharan Africa have been on an upward path over the past decade. On average, they have risen from $13 billion annually during 2000-2005 to $28 billion annually during 2006-2010, and are projected to increase to $38 billion annually during 2011-2014. FDI inflows declined following the financial crisis, but posted a 34 percent increase in 2011 to $36 billion. However, they are estimated to have declined again in 2012, partly due to the adverse economic environment in Europe, historically an important source of investment, and worse FDI performances in selected key recipient countries. Over the next couple of years, FDI is projected to reach new record levels, underscoring the region’s expected high growth as investors seek to take advantage of attractive returns in frontier economies, growing consumer markets, and abundant natural resources.
Europe and Central Asia’s close links with euro-zone members has meant that economies there continue to be adversely affected by the sovereign debt crisis and liquidity problems. FDI inflows declined by an estimated 7 percent in 2012, following an increase

MIGA WIPR REPORT 2012 | 17
of 35 percent in 2011. The increase in 2011 was driven by natural resource-seeking investors into Central Asia, who helped to boost FDI inflows into the Russian Federation, while doubling them into kazakhstan. In Turkey, FDI inflows shot up in 2011, and may well remain elevated in 2012, considering that flows in the first quarter of this year were mar-ginally higher than in the same period in 2011.4 In Southeast Europe, where FDI is heavily dependent on the euro-zone periphery countries, FDI inflows in 2011 were a third of their peak level reached prior to the 2008 financial crisis. Deleveraging by European banks, which has curtailed lending by their affiliates in the region, led to the introduction of the vienna 2.0 Initiative aimed at ensuring orderly credit con-ditions in the region.5
The Latin America and the Caribbean region was somewhat of a bright spot. FDI inflows into the region are estimated to be marginally higher in 2012, following a 26 percent increase in 2011. This was despite moderating growth prospects, deteriorating economic conditions in key FDI source countries in the euro zone, and concerns over elevated political risks in select countries. Although growth slowed sig-nificantly, FDI inflows into Brazil—the region’s largest FDI recipient—increased by a third in 2011, attracted by the country’s long-term growth potential, the size of its domestic market, and natural resources. Over the next year, flows into the region are projected continue to increase sharply.
For 2013, FDI inflows to developing countries are projected to rebound by 17 percent to $697 billion, as global economic growth is anticipated to accelerate modestly. In the longer term, sustained higher economic growth in developing countries compared with high-income economies, a large and growing consumer base, the availability of natural resources, and ongoing improvements in investment climates will continue to improve the attractiveness of developing countries as investment destinations.
MIGA-EIU Political Risk Survey 2012
The anticipated rebound in investment is corrob-orated by the findings of the MIGA-EIU Political Risk Survey 2012 (appendix 2). Now in its fourth year, the 2012 survey gauged the investment intentions of 438 mostly large MNEs with global annual revenues of at least $500 million. The survey, carried out in August and September of 2012, asked MNEs about their plans to invest in developing countries over the next
12 months (compared with the previous 12 months) and over the next three years (compared with the previous three years).
Overall, MNEs remain relatively optimistic, with half of the respondents expressing the intention to increase investment in developing countries over the next 12 months, despite the challenges detailed in this report (figure 1.3). Even though growth prospects in developing countries have also become subdued, these countries are still projected to grow about twice as fast as high-income economies. The expanding market size implied by the higher growth rates continues to improve developing countries’ attractiveness to foreign investors, especially when compared with relatively stagnant markets at home. Importantly, one third of the surveyed MNE respondents remain cautious; the uncertainty sur-rounding the global economy is prompting them to adopt a “wait-and-see” attitude and leave their investment plans unchanged or on hold over the next 12 months. A significant minority of the responding MNEs (13 percent) expressed the intention of reducing investments in developing countries.
Similar to the findings of previous MIGA-EIU Political Risk Surveys, MNEs are more optimistic over the medium term compared with the short term as seen by responses on investment intentions over the next twelve months compared with investment intentions over the next three years (figure 1.3). The share of MNEs that intend to expand into developing countries in the following three years jumps to 70 percent compared with 52 percent in the short term, with only 11 percent of them planning to decrease investments over the medium term. The share of MNEs that continue to adopt a “wait-and-see” approach over the next three years more than halved to 15 percent from those with a cautious stance over the next year. Clearly, MNEs expect the current economic uncertainty to decline in the medium term, thus removing one of the reasons that has held back additional investment flows.
Other surveys reinforce these findings. The 2012 A.T. kearney Foreign Direct Investment Confidence Index6 (based on a survey conducted during July-October 2011) confirmed that investors are finding developing countries to be promising, particularly owing to their large and growing consumer markets, and are assigning high priority to them as investment destinations. However, FDI inflows to developing countries may be dampened by uncertainty in the near term regarding the speed of economic recovery and possible downside risks.

18 | MIGA WIPR REPORT 2012
UNCTAD’s World Investment Prospects Survey 2012-20147 (based on respondents from 174 MNEs and 62 investment promotion agencies during February and May of 2012) supported the findings of investor cautiousness for 2012 and greater optimism for investing overseas over the next two years.
FDI Outflows from Developing Countries
Uninterrupted by the slowdown in the global economy, FDI outflows originating in developing countries increased by an estimated 11 percent in 2012 to reach a new record level of $237 billion, or one percent of their combined GDP (figure 1.4). Since FDI outflows from high-income economies declined because of a sharp fall in cross-border mergers and acquisitions, developing countries’ share of global FDI outflows increased to an estimated 14 percent. In line with their share of developing country GDP, the BRICs accounted once more for the lion’s share: an estimated 64 percent of FDI outflows from all developing countries. The acceleration of developing countries’ investment overseas—especially from China, but also from Brazil, which has a longer history of investing abroad—began in the middle of the last decade. This has been in pursuit of their quest to access new markets, natural resources, and technological and management know-how.
FDI outflows from the BRICs increased marginally by an estimated 3 percent in 2012 as MNEs from these countries continued to forge ahead with their overseas investment plans. China’s outflows are estimated to have reached a new record level in 2012, having declined in 2011. Chinese MNEs, mostly state-owned enterprises, sought to acquire stakes in com-panies based in both high-income and developing countries,8 and continued investing in greenfield projects in the developing world. China continued to reinforce its policy of “going global,”9 targeting a greater balance between inward and outward FDI over the medium term by encouraging the latter. Brazil’s FDI outflows rebounded in 2012 after regis-tering a net divestment in 2011. Indian MNEs held back their overseas investment plans in 2012, with estimated FDI outflows declining by nearly two-fifths. FDI outflows from the Russian Federation, mostly in manufacturing and services, declined by an estimated 11 percent in 2012 to $60 billion from a record level of $67 billion in 2011.
Other developing countries, notably a small group of middle-income or resource-rich economies (Mexico, Colombia, Chile, Indonesia, Malaysia, Thailand, Turkey, and kazakhstan), also expanded their overseas investments, together accounting for 30 percent of estimated FDI outflows from developing countries in 2012.
As corporate sectors become more sophisticated, domestic firms become global players, and outward investment restrictions become more relaxed, FDI outflows from developing countries are expected to continue to increase. In the MIGA-EIU Political Risk Survey 2012, South-based firms were positive about investment prospects in developing countries. Some 62 percent of South-based respondents conveyed the expectation of investment expansions in developing countries over the next three years, a smaller proportion than for foreign investors overall. Outward investment from China is expected to continue growing rapidly as Chinese companies seek to become part of international global pro-duction chains, acquire brands through cross-border mergers and acquisitions, and secure natural resource supplies.
Political Risks and Developing Countries
Strong headwinds facing the world economy, per-sistent uncertainty emanating principally from devel-opments in the euro zone, moderating growth, and turbulence in financial markets have exacerbated foreign investors’ overall concerns regarding gov-ernment actions that could adversely affect the private sector. While, for the most part, developing countries continue to introduce measures that open up domestic markets to FDI and increase transparency for investors,10 a number of adverse government actions have amplified concerns about political risks. For example:
r The desire for increased regulation in the aftermath of the financial crisis has led to the introduction of national and multilateral rules, increased capital requirements under Basel III11 for the banking sector, and Solvency II12 for the insurance industry. More generally, regulatory changes pertaining to all aspects of a country’s investment climate can cause uncertainty and contribute to elevated perceptions of political risk. In a recent survey whose findings are reported in Lloyd’s Risk Index 2011,13 changing legislation

MIGA WIPR REPORT 2012 | 19
Figure 1.4 FDI Outflows from Developing Countries
$ billion and percent
Source: World Banke=estimate
Figure 1.3 Changes in Foreign Investment Plans
Percent of respondents
Source: MIGA-EIU Political Risk Survey 2012
Fig 1.4
200
4
200
5
200
6
200
7
200
8
200
9
2010
2011
2012
e
0.0
0.2
0.4
0.6
0.8
1.0
1.2
1.4
0
50
100
150
200
250
Other developing countriesBRICs Share of GDP
Fig 1.3
Over the next 12 months
Increase substantially(20% or more)
Increase moderately(more than 1%
but less than 20%)
Stay unchanged
Decrease moderately(more than 1%
but less than 20%)
Decrease substantially(20% or more)
Don’t know
Over the next three years
Increase substantially(20% or more)
Increase moderately(more than 1%
but less than 20%)
Stay unchanged
Decrease moderately(more than 1%
but less than 20%)
Decrease substantially(20% or more)
Don’t know
0 10 20 30 40
0 10 20 30 40

20 | MIGA WIPR REPORT 2012
ranked fifth in importance out of fifty risks related to operating an international business.
r Expropriation—which was an important threat to foreign investors in the developing world a few decades ago, but had since abated—is becoming more prevalent.14 The number of direct expropriations (as opposed to indirect and “creeping” expropriations) has been rising since the early 2000s.15 Several new direct expropriations occurred in 2011-2012, notably YPF S.A. in Argentina partly owned by Repsol YMP S.A. (Spain) and Transportadora de Electricidad, a power transmission company in Bolivia owned by Red Electrica Española (Spain), and some local companies in Sri Lanka. Contract renegotiations and resource nationalism in the extractive industries continue in developing and some high-income countries, driven by commodity prices that rebounded quickly following the 2008 financial crisis and have remained elevated since, as well as the ongoing scramble for resources. Several countries have introduced new royalty regimes or taxation rules for mining companies (for example, in Australia, Ghana, and South Africa), or new mining legislation that requires increased state participation in the extractive industries (as in Guinea and Zambia). In Indonesia, new mining regulations require foreign investors to divest at least 51 percent of the total equity share to local investors over a 10 year period. In light of these developments, it is not surprising that a recent survey by Ernst & Young found resource nationalism to be the most important business risk facing the metals and mining sector in 2011-2012.16
r Political violence and unrest have been on the rise. Besides damage to assets and business interruption, political violence can lead to a loss of income for investors not directly affected by it, as other investments may suffer from loss of attraction, as in the case of tourism projects. Growing concerns about jobs, social inequality, elevated food prices, and non-democratic political regimes have given rise to civil distur-bances and political violence, often leading to property damage and business interruptions. This had been accentuated by risk contagion, where changes in the risk profile in one country can be easily transmitted and affect the risk profile of others.
r While increased government involvement in the private sector had been viewed as nec-essary at the height of the financial crisis, the understanding was that it would be a temporary measure to be reversed at a later date. Governments have been winding down their involvement in private sector companies, though some increased presence remains. While this was a concern at the initial phases of the government involvement, the MIGA-EIU Political Risk Survey 2012 found that only a small minority of respondents now consider this to be a constraint to investing in developing countries.
The implications of these trends are profound for the international production used by many MNEs. Such production is characterized by interconnected regional and global supply chains to which political events can cause significant disruptions and costly delays because no particular location carries large inventory to sustain a downturn elsewhere. In Allianz’s ranking of the top 10 business risks based on a worldwide survey of risk management profes-sionals, politically determined business interruption was second.17 The concern in the business com-munity about disruption in the global economy owing to political risk is also evidenced in the World Economic Forum’s Global Confidence Index, which finds a high likelihood of such disruption over the next 12 months.
From a longer-term perspective, political risks are intertwined and likely to be aggravated by a number of global trends. These include rapid population growth coupled with high shares of youth popu-lations and few jobs in developing countries, growing income inequalities, urbanization, water and food supply crises, rising demand for arable land and finite natural resources, volatile commodity prices, poor governance, chronic fiscal imbalances, and the like-lihood of prolonged austerity.18 Together with more widely accessible information and communication technologies, these factors and others can influence political risks and impact corporate investment patterns in turn.
Corporate Perceptions of Political Risks in Developing Countries
The MIGA-EIU Political Risk Survey 2012 sought to gauge the principal constraints to FDI in developing countries over the next 12 months and over the next three years (figure 1.5). Although concerns about

MIGA WIPR REPORT 2012 | 21
Figure 1.5 Ranking of the most Important Constraints for FDI in Developing Countries
Percent of respondents
Source: MIGA-EIU Political Risk Survey 2012
0 10 20 30 40
Fig 1.5
Over the next 12 months
Macroeconomicinstability
Access to financing
Access to qualified staff
Political risk
Infrastructure capacity
Limited marketopportunities
Corruption
Increased governmentregulation in the aftermath
of the global financial crisis
Other
0 10 20 30 40
Over the next three years
Political risk
Macroeconomic instability
Access to qualified staff
Access to financing
Corruption
Infrastructure capacity
Limited marketopportunities
Increased governmentregulation in the aftermathof the global financial crisis
Other
Fig 1.6
In the next 12 monthsIn the next three years
Adverseregulatory
changes
Breach of contract
Transfer andconvertibility
restrictions
Civildisturbance
Non-honoringof government
guarantees
Expropriation/nationalization
Terrorism
War
0 10 20 30 40 50 60
Figure 1.6 Types of Political Risk of most Concern to Investors in Developing Countries
Percent of respondents
Source: MIGA-EIU Political Risk Survey 2012Note: Percentages add up to more than 100 percent
because of multiple selections

22 | MIGA WIPR REPORT 2012
political risks remain elevated, it is the persistent fragility and instability of the global economy, the slow rate of recovery since the 2008 financial crisis coupled with significant downside risks, and the ongoing deleveraging that feature as the most prominent constraints to FDI. As a result, over the next 12 months, macroeconomic instability and access to financing rank in the two top places among the concerns of corporate investors. The weakness of the global economy and difficulties in accessing financing continue to take precedence over political risks and structural constraints such as infrastructure capacity and access to qualified staff in developing countries. This suggests that political risks tend to become more important concerns for investors only insofar as the macroeconomic environment is benign and funds are easily accessible. It also suggests that, since growth rates of the global economy and high-income countries in particular are expected to remain subdued at least over the next year, this ranking of constraints is not likely to change significantly.
Although the three-year ranking (figure 1.5) confirms the persistent concern of investors about the state of the global economy and difficulties in accessing finance, political risk rises to the top of the list of constraints as the most important obstacle for investing in developing countries. This highlights the strong impact that political risk has on the investment decision-making process such that it overshadows the effects of economic weaknesses around the world. The fact that this ranking of political risk matches the findings of previous MIGA-EIU Political Risk Surveys suggests that investors are very cognizant of its presence and view it as a long-term obstacle.
According to the MIGA-EIU Political Risk Survey 2012, adverse regulatory activity within developing countries topped investors’ concerns among different types of political risks (figure 1.6). Regulatory risk—essentially the risks posed by uncertainty regarding regulations or changes in regulations—has risen in importance since the first MIGA-EIU Political Risk Survey in 2009. As in 2011, a greater proportion of investors ranked this risk in top place, followed by breach of contract and transfer or convertibility restrictions.
For the majority of foreign investors, political risks have not forced them to cancel or withdraw existing investments (figure 1.7). In line with the findings of the earlier surveys, only a minority of investors have been driven to do so because of perceived political risk. Nevertheless, for some types of risks such as regulatory risk and breach of contract, just over a
quarter of respondents had to cancel or withdraw investments. This finding is consistent with his-torical data on claims payment by the political risk insurance industry, which indicate that the largest amount of claims paid out to investors is based upon expropriation or breach of contract (see chapter three). Additionally, these types of events tend to be highly publicized. The majority of respondents in the survey listed breach of contract and regulatory risks as those accounting for the largest amount of losses over the past three years (figure 1.8). Thus, risk per-ception and claims data of the political risk insurance industry correspond very closely in terms of the types of political risks that have the greatest impact on foreign investors.
Spotlight on South-South FDI
As of 2010, MNEs from developing countries had amassed a stock of overseas FDI valued at some $1.2 trillion,19 72 percent of which was attributed to the BRICs. Developing countries often invest in other developing countries to take advantage of cultural links, political ties, knowledge of market con-ditions, and familiarity with institutional qualities in countries in near proximity. Examples include MNEs based in Latin America (for example Argentina, Chile, Colombia, and Mexico), that have acquired or invested in manufacturing and financial services firms in neighboring countries20 and companies based in Asia that have been driving the growth of intra-regional investment flows.21
As of 2010, the outward stock of South-South FDI(excluding investment channeled through inter-mediate jurisdictions) was valued at $302 billion. About 56 percent of that stock was accounted for by the BRICs.22 The Russian Federation, China, South Africa, Malaysia, and Mexico ranked in the top five places in terms of the share of South-South investments in their total outward FDI stocks (figure 1.9). Much of that investment is intra-regional: two-thirds of the Russian Federation’s FDI stock in developing countries is in Europe and Central Asia (although, as mentioned above, this trend changed noticeably in 2011); just over half of South Africa’s stock in developing countries is in sub-Saharan Africa; and virtually all of Mexico’s stock in developing countries is in Latin America and the Caribbean.

MIGA WIPR REPORT 2012 | 23
Figure 1.8 Proportion of Firms that have Suffered Losses Owing to Political Risk over the Past Three Years
Percent of respondents
Source: MIGA-EIU Political Risk Survey 2012Note: Percentages add up to more than 100 percent
because of multiple selections
Fig 1.8
Breach ofcontract
Adverseregulatory
changes
Transfer andconvertibility
restrictions
Civildisturbance
Non-honoringof government
guarantees
Expropriation/nationalization
War
Terrorism
0 10 20 30 40 50
Fig 1.7
Transfer and convertibility
restrictions
Breach ofcontract
Non-honoringof government
guarantees
Expropriation/nationalization
Adverseregulatory
changes
War
Terrorism
Civildisturbance
Withdraw existing investmentCancel planned investmentsBoth withdraw and cancelNeither withdraw nor cancelDon’t know
0 20 40 60 80 100
Figure 1.7 Proportion of Firms that have Withdrawn Existing Investments or Cancelled New Investment Plans on Account of Political Risk over the Past 12 Months
Percent of respondents
Source: MIGA-EIU Political Risk Survey 2012

24 | MIGA WIPR REPORT 2012
into the Middle East and North Africa do not plan to change in their current (low) or planned levels of investments in both Arab Spring countries and in the rest of the region (figure 1.12). On a more positive note, 14 percent of respondents plan to invest in Arab Spring countries, a share that is the same as for the rest of the region. These findings highlight that political and economic instability have taken a toll on the region’s investment prospects, especially in the Arab Spring countries, and investors appear likely to continue with a “wait-and-see” approach before re-engaging.
The MIGA-EIU Political Risk Survey 2012 also sought to gauge the importance of different factors that would induce investors to re-engage in the Middle East and North Africa (figure 1.13). Stability—both political and economic—scored high, as did better governance. However, investors’ re-engagement appeared to be driven primarily by the presence of investment opportunities. This suggests that despite the “wait-and-see” approach adopted by many investors, lucrative opportunities could induce them to re-enter.
The high score registered for “one year of political stability” suggests that political risk has been an important factor in the decision of investors to withdraw or not to engage in new investment in the Middle East and North Africa. As expected, political risk perceptions increased more for the Arab Spring countries than for the rest of the countries in the region. Political violence, in particular civil dis-turbance, but also war and terrorism, were the risks that registered major increases in negative risk per-ceptions for the majority of foreign investors. These were more pronounced for the Arab Spring countries across all political risks (figure 1.14), but they also increased in importance for countries in the rest of the region. This suggests that, with regard to political risk perceptions, the ongoing instability in the Arab Spring countries has spilled over to the rest of the region, with potentially ongoing negative effects on investment.
There are some early signs that in countries where political stability is returning and uncertainty is abating, FDI prospects are becoming more positive. For the Middle East and North Africa overall, FDI flows are projected to stay largely flat in 2013 and begin to rebound only in 2014. In Tunisia, for example, during the first five months of 2012, FDI inflows increased by 41 percent compared with the same period in 2011.26 The Central Bank of Tunisia has forecast FDI inflows in 2012 to reach $2 billion,
Based on data from greenfield investments alone, South-South investment flows began to accelerate in the second half of the last decade, coinciding with the acceleration of all FDI outflows from developing countries. On average, the number of South-South projects rose from 590 during 2003-2005 to 996 during 2009-2011. The value of cross-border investments also followed an upward trend, although it has yet to recover from its post-financial crisis decline (figure 1.10).
Spotlight on the Middle East and North Africa
FDI inflows into the Middle East and North Africa were on an upward path during the past decade, but declined initially due to the 2008 financial crisis and subsequently in the aftermath of the political turmoil that began at the end of 2010. Data from greenfield investments show that the decline was dramatic: in 2008 capital expenditures in cross-border greenfield investment projects were $116 billion; in 2011 that figure was only $11 billion and in the first half of 2012 it declined further to $2 billion.23
In 2012, FDI inflows into the region remained subdued and well below recent historical levels. For many of the region’s economies, dependence on FDI from Europe24 has meant that the recession and dele-veraging in the euro zone continue to adversely affect the flow of investment. Developing oil-importing economies, which had enjoyed a rapid increase in FDI inflows (figure 1.11), saw these plummet because of the financial crisis and later due to political insta-bility, civil disturbance, security challenges, and other negative effects stemming from the political events that have unfolded in the region. In Egypt, for example, FDI inflows reached only $218 million during July 2011-March 2012, compared with $2.1 billion during July 2010-March 2011.25 For developing-country oil exporters in the region, the increase in investment was less steep earlier on, and in fact flows have largely remained flat.
In the short term, the dearth of FDI flows into the Middle East and North Africa is likely to continue, especially in those countries where there is still significant political instability. Nearly 20 percent of the foreign investors in the MIGA-EIU Political Risk Survey 2012 plan to withdraw existing investments from the Arab Spring countries. Around half of that share also plan to do so in the rest of the countries in the region. However, the majority of investors
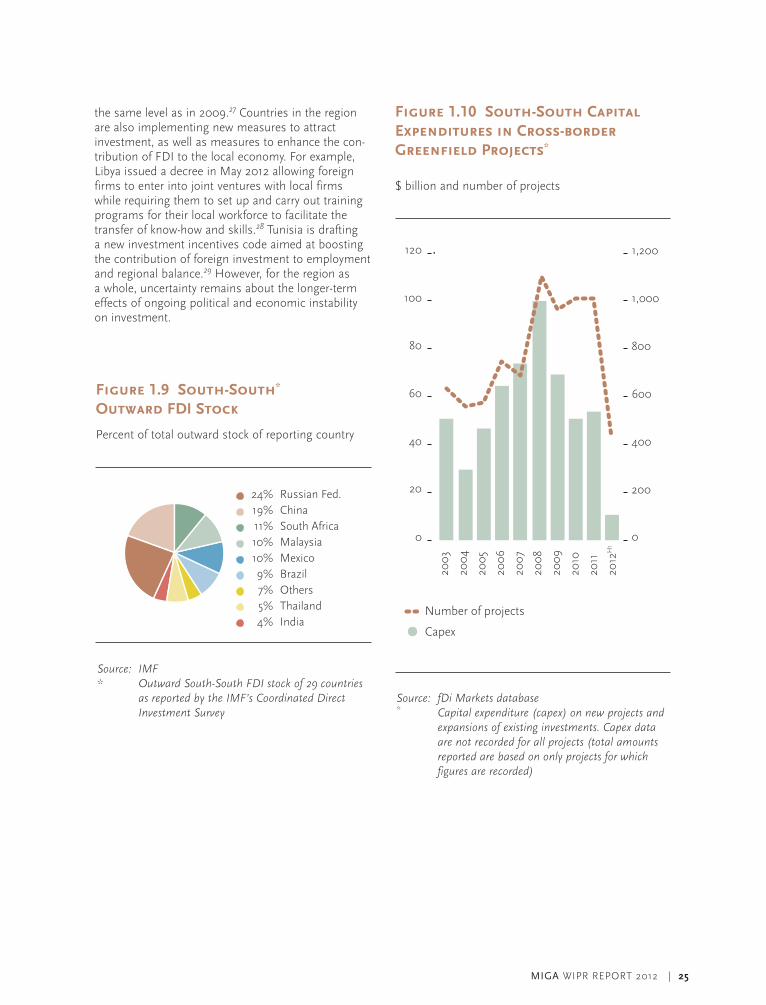
MIGA WIPR REPORT 2012 | 25
Fig 1.11
2003
2004
2005
2006
2007
2008
2009
2010
2011
2012
H1
200
0
400
600
800
1,000
1,200
0
20
40
60
80
100
120
Number of projects
Capex
Figure 1.10 South-South Capital Expenditures in Cross-border Greenfield Projects*
$ billion and number of projects
Source: fDi Markets database* Capital expenditure (capex) on new projects and
expansions of existing investments. Capex data are not recorded for all projects (total amounts reported are based on only projects for which figures are recorded)
Figure 1.9 South-South* Outward FDI Stock
Percent of total outward stock of reporting country
Source: IMF * Outward South-South FDI stock of 29 countries
as reported by the IMF’s Coordinated Direct Investment Survey
Fig 1.10
24% Russian Fed. 19% China 11% South Africa 10% Malaysia 10% Mexico 9% Brazil 7% Others 5% Thailand 4% India
the same level as in 2009.27 Countries in the region are also implementing new measures to attract investment, as well as measures to enhance the con-tribution of FDI to the local economy. For example, Libya issued a decree in May 2012 allowing foreign firms to enter into joint ventures with local firms while requiring them to set up and carry out training programs for their local workforce to facilitate the transfer of know-how and skills.28 Tunisia is drafting a new investment incentives code aimed at boosting the contribution of foreign investment to employment and regional balance.29 However, for the region as a whole, uncertainty remains about the longer-term effects of ongoing political and economic instability on investment.

26 | MIGA WIPR REPORT 2012
Figure 1.11 FDI inflows into the Middle East and North Africa
$ million
Source: World BankNote: Oil importers: Djibouti, Egypt, Jordan, Lebanon,
Morocco, Tunisia Oil exporters: Algeria, Islamic Republic of Iran,
Syrian Arab Republic, Yemen Data for Iraq and Libya are not available
Figure 1.12 How Have the Developments in the Arab World over the Past Year Affected your Current and Future Plans for Investments in the Middle East and North Africa?
Percent of respondents
Source: MIGA-EIU Political Risk Survey 2012
Fig 1.13
Current investments: Arab Spring
countries
Current investments:All other countries
in the region
Planned/futureinvestments:Arab Spring
countries
Planned/futureinvestments:
All other countriesin the region
IncreaseNo changeWithdrewDon't know
0 20 40 60 80 100
Fig 1.12
0
5
10
15
20
25
00 01 02 03 04 05 06 07 08 09 10 11
Oil-importing countriesOil-exporting countries
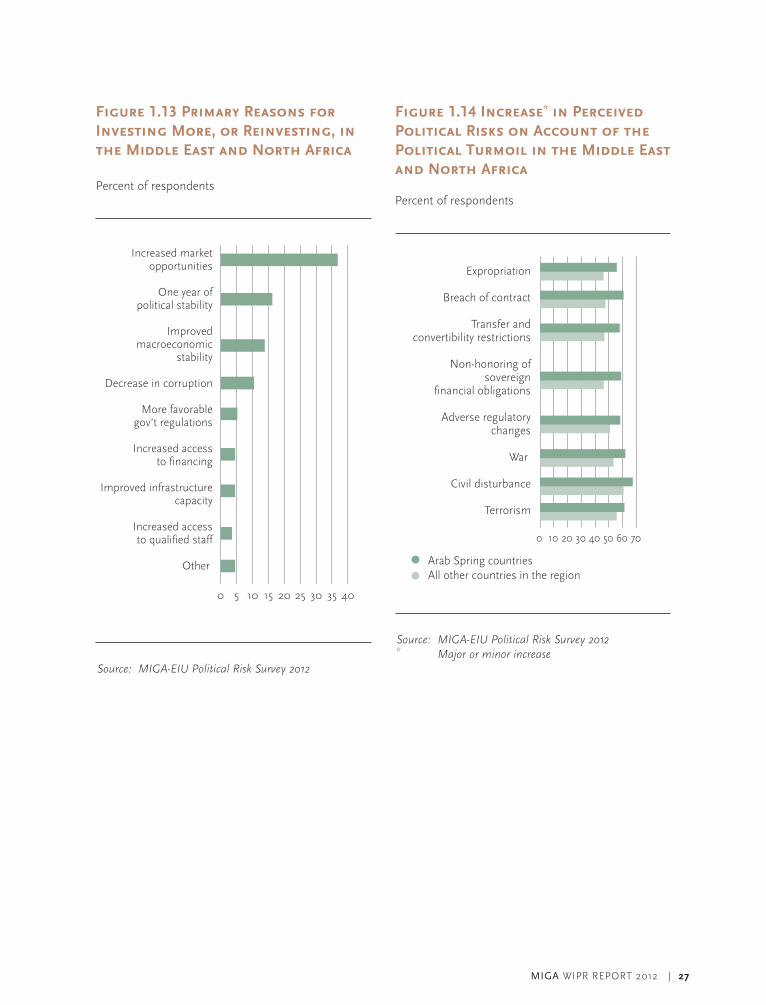
MIGA WIPR REPORT 2012 | 27
Figure 1.13 Primary Reasons for Investing More, or Reinvesting, in the Middle East and North Africa
Percent of respondents
Source: MIGA-EIU Political Risk Survey 2012
Figure 1.14 Increase* in Perceived Political Risks on Account of the Political Turmoil in the Middle East and North Africa
Percent of respondents
Source: MIGA-EIU Political Risk Survey 2012* Major or minor increase
Fig 1.15
Expropriation
Breach of contract
Transfer andconvertibility restrictions
Non-honoring ofsovereign
financial obligations
Adverse regulatorychanges
War
Civil disturbance
Terrorism
Arab Spring countriesAll other countries in the region
0 10 20 30 40 50 60 70
Fig 1.14
0 5 10 15 20 25 30 35 40
Increased marketopportunities
One year ofpolitical stability
Improvedmacroeconomic
stability
Decrease in corruption
More favorablegov’t regulations
Increased accessto financing
Improved infrastructurecapacity
Increased accessto qualified staff
Other

28 | MIGA WIPR REPORT 2012
CHAPTER TWO
SOvEREIGN DEFAULT AND EXPROPRIATION
r As uncertainty remains elevated because of the global economic slowdown and continued political instability, both sovereign default risk and other political risks (in particular expropriation) remain sig-nificant issues for foreign investors deciding their investment plans.
r This chapter looks at the links between sovereign default and expro-priation. It presents the finding that—over longer time horizons—sov-ereign default and expopriation are likely to occur in a similar set of countries. However, sovereign default and expropriation are different in nature and rarely occur in the same year.
r The determinants of sovereign default and expropriation differ. While political regimes marked by poor governance and under the control of political parties conventionally described as “left-wing” explain a higher likelihood of expropriations, transitory economic shocks and debt burdens tend to better predict sovereign default.
r Expropriation is more likely to happen multiple times in countries that have expropriated private assets in the past, whereas sovereign default is a less persistent event.
r From a historical perspective, sovereign default and expropriation have occurred in waves and are usually associated with a shift of a country’s external liability position. Based on trends in the international investment position of countries since 2000, developing economies seem to have higher risks of expropriation compared to sovereign defaults given the composition of their external liabilities.
r Despite differences in the determinants of sovereign default and expropriation, foreign investors in the MIGA-EIU Political Risk Survey 2012 are more likely to identify them as related. In this sense, political risk insurance (PRI) coverage for sovereign credit risk could poten-tially have a positive spillover effect to alleviate broader political risk concerns.

MIGA WIPR REPORT 2012 | 29
This chapter offers an empirical analysis of the relationship between sovereign default and expro-priation over a long and a short time horizon, by using data from 1970-2004.30 Additionally, it looks at how investors perceive these risks and how this might differ from the observed reality.
Currently, there is a growing demand for political risk cover for non-honoring of sovereign or sub-sovereign financial payments. This is a reflection of the constrained financing environment following the 2008 global financial crisis. A key conclusion of the last four MIGA-EIU Political Risk Surveys is that “macroeconomic instability” is a top short-term concern for cross-border investors in developing countries. However, “political risk” remains a larger structural concern for foreign investors in the medium term.
MIGA’s World Investment and Political Risk 2011 report highlighted that the political regime of a host country is the major driver of expropriation, which is a key risk concern for investors in many developing countries. Moreover, as discussed in that report, an adverse economic shock, such as the Asian financial crisis in 1998, raised the number of investment disputes and increased expropriation losses. In terms of sovereign default risk, there is rich empirical literature that outlines how sovereign defaults are caused by negative economic shocks,31 macroeconomic factors,32 and institutional quality.33
However, the causes of expropriation are less explored. In previous studies, kobrin34 found that the likelihood of expropriation is explained by economic shocks, the size of foreign direct investment (FDI), and the sector concentration of FDI. Li35 looked at political factors such as chief executive turnover and political regime type. Guriev et al.36 studied higher oil prices and weak political institutions as determinants of expropriation in oil-exporting countries. The only major study that looks directly at the relationship between sovereign default and expropriation is by Tomz and Wright.37
There has been little academic research on how the determinants of these two events differ from each other. This is particularly important because the risk of loss for insurers is materially different for the two broad branches of PRI coverage—traditional con-fiscation, expropriation, and nationalization covers and the broader coverage related to non-honoring of sovereign financial obligations, which deals with sovereign default risk. While the private market has been offering non-honoring coverage for a long time, public PRI providers have only recently begun to offer this coverage.
Analysis in later sections will show that sovereign default and expropriation are different in nature, but finds several systematic patterns for understanding the relative risk of the two events occurring. The MIGA-EIU Political Risk Survey 2012 also provides corporate-level evidence about how multinational enterprises (MNEs) perceive the correlation between sovereign default risk and political risk when they make investment decisions.
Historical Trends of Sovereign Default and Expropriation
There was a large spike of expropriation events for investors from the United States in the 1970s, followed by an increase in sovereign default events in the 1980s, as shown in the upper panel of figure 2.1. Defaults were more common during the global depression of the 1930s and during the economic crises in developing countries in the 1980s. Such historical patterns of expropriation events is also confirmed based on the Berne Union’s PRI claim payments to investors outside of the United States over 1971-2011, as shown in the bottom panel of figure 2.1.38 The claim payments are clustered in the 1970s and late 2000s. The trend of expropriation events is consistent between two the different data sources.
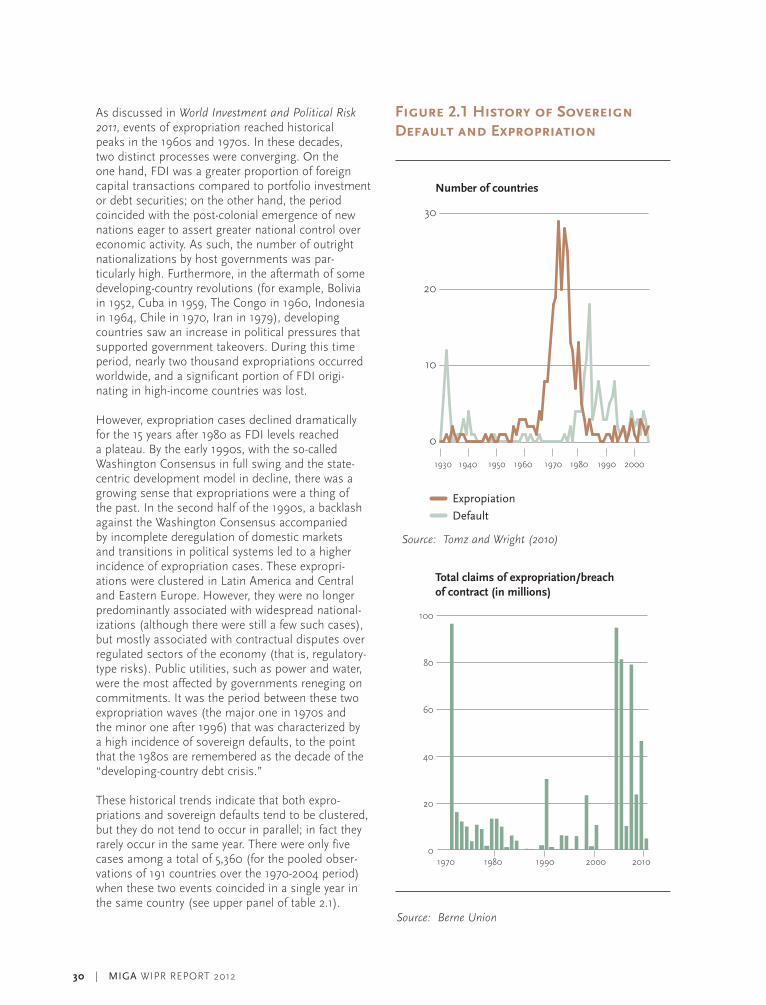
30 | MIGA WIPR REPORT 2012
Figure 2.1 History of Sovereign Default and Expropriation
Source: Berne Union
As discussed in World Investment and Political Risk 2011, events of expropriation reached historical peaks in the 1960s and 1970s. In these decades, two distinct processes were converging. On the one hand, FDI was a greater proportion of foreign capital transactions compared to portfolio investment or debt securities; on the other hand, the period coincided with the post-colonial emergence of new nations eager to assert greater national control over economic activity. As such, the number of outright nationalizations by host governments was par-ticularly high. Furthermore, in the aftermath of some developing-country revolutions (for example, Bolivia in 1952, Cuba in 1959, The Congo in 1960, Indonesia in 1964, Chile in 1970, Iran in 1979), developing countries saw an increase in political pressures that supported government takeovers. During this time period, nearly two thousand expropriations occurred worldwide, and a significant portion of FDI origi-nating in high-income countries was lost.
However, expropriation cases declined dramatically for the 15 years after 1980 as FDI levels reached a plateau. By the early 1990s, with the so-called Washington Consensus in full swing and the state-centric development model in decline, there was a growing sense that expropriations were a thing of the past. In the second half of the 1990s, a backlash against the Washington Consensus accompanied by incomplete deregulation of domestic markets and transitions in political systems led to a higher incidence of expropriation cases. These expropri-ations were clustered in Latin America and Central and Eastern Europe. However, they were no longer predominantly associated with widespread national-izations (although there were still a few such cases), but mostly associated with contractual disputes over regulated sectors of the economy (that is, regulatory-type risks). Public utilities, such as power and water, were the most affected by governments reneging on commitments. It was the period between these two expropriation waves (the major one in 1970s and the minor one after 1996) that was characterized by a high incidence of sovereign defaults, to the point that the 1980s are remembered as the decade of the “developing-country debt crisis.”
These historical trends indicate that both expro-priations and sovereign defaults tend to be clustered, but they do not tend to occur in parallel; in fact they rarely occur in the same year. There were only five cases among a total of 5,360 (for the pooled obser-vations of 191 countries over the 1970-2004 period) when these two events coincided in a single year in the same country (see upper panel of table 2.1).
Expropiation
Default
0
10
20
30
0
20
40
60
80
100
1970 1980 1990 2000 2010
1930 1940 1950 1960 1970 1980 1990 2000
Fig 2.1 part 1
Number of countries
Total claims of expropriation/breachof contract (in millions)
Source: Tomz and Wright (2010)

MIGA WIPR REPORT 2012 | 31
Sovereign default events are less persistent, partly because it is technically difficult for a country to default consecutively on its debt obligations—since default involves action against all debts and there tends to be no additional outstanding debt on which to default after the first wave of defaults has taken place. Sovereign defaults typically coincide with adverse economic conditions, such as shocks to commodity prices and interest rates and have been sensitive to the global capital flow cycle.39 However, expropriation events are found to be more persistent over time, partly because such events are specific to certain strategic sectors (such as water or energy) and they are clustered in specific countries. Expropriation tends to be sectoral and it is rare to find cases of wholesale nationalization of private enterprises. While this raises the risk of expropriation in other sectors of the economy (in fact, this is the main indicator that foreign investors look at in assessing political risk, according to the MIGA-EIU Political Risk Surveys), it does not follow that all foreign assets will necessarily be subject to government takeover.
Despite the lack of correlation between expro-priation and sovereign default in the short term, it is instructive to further investigate why these two events seem to arrive in waves. One hypothesis by Tomz and Wright is that the two events are related, with certain time lags that are distinct to each type of event and specifically to the changing compo-sition of the country’s external liabilities. In other words, the composition of foreign investments, that is, the weight between debt and equity, has been altered in a systematic manner. For example, in the decades following the spike of expropriation in the 1970s, countries relied more on debt financing, culminating in the debt crisis of the 1980s. After the economic crises of 1980s, developing countries broadly lost their access to capital markets, partly in response to this, direct investment and equity investment reemerged as a major financing source for developing countries. An interesting exception would be a case where sovereign default and expro-priation coincided, as was the case in Indonesia with the 1998 Asian financial crisis. As highlighted in Box 2.1, 40 there were immediate drops in debt flows and FDI inflows after 1998. However, in this exceptional context, the weight between debt and equity recovered to the pre-crisis level after the debt crisis ended. Despite such exceptions, the historical evidence suggests that a country’s external liability position can be useful in assessing the host country’s relative riskiness to sovereign default.
Table 2.1 Joint Distribution of Sovereign Default and Expropriation Events
Pooled Observations (1970-2004)
No expropriation
Expropriation Total
No default
4,967 275 5,242
Default 113 5 118
Total 5,080 280 5,360
Per-country Observations (1970-2004)
No expropriation
Expropriation Total
No default
75 34 109
Default 20 62 82
Total 95 96 191
Source: Eden, Kraay, and Qian (2012)Note: The upper panel considers 5,360 pooled
observations of 191 countries during this time period. The lower panel observes those same 191 countries, highlighting where either event occurred during this time period.
Figure 2.2 shows a recent shift of external liability positions (that is, the change in FDI and portfolio investment flows consisting of debt and equity financing) for advanced economies versus developing economies41 and shows a clear contrast between the two. Since the mid-1990s, FDI inflows have increased in developing economies, peaking in 2007, while new FDI inflows to advanced economies continued to shrink. Recently, there has been a clear shift toward equity financing developing economies, while

32 | MIGA WIPR REPORT 2012
Figure 2.2 Changes in International Investment Positions, 1995-2010
In millions
Source: IMF, balance of payment statistics
Fig 2.2b
Net FDI PositionAdvanced Economies
Net FDI PositionEmerging and Developing Countries
-1,000
-800
-600
-400
-200
0
200
400
600
800
-1000
-800
-600
-400
-200
0
200
400
600
800
95 00 05 10 95 00 05 10
Fig 2.2 b
Net debt investment positionAdvanced Economies
Net debt investment positionEmerging and Developing Countries
0
-200
200
400
600
800
1000
1200
1400
-200
0
200
400
600
800
1000
1200
1400
95 00 05 10 95 00 05 10

MIGA WIPR REPORT 2012 | 33
high-income economies have relied more on debt financing. After the 2008 financial crisis, net debt flows for advanced economies dropped sharply, and the weight of equity investments (on shares, stocks, and participations) has increased dramatically.
This figure also shows that developing countries have continued to rely more on FDI and portfolio equity liabilities. In the medium term, despite the reputational cost of expropriation, the shift toward FDI also implies that the “prize” for expro-priating private assets is getting relatively bigger in developing countries. However, in the short term, the ongoing sovereign debt crisis in European countries is a fresh concern, and the adverse spillover impact to developing countries seems to be the larger worry for foreign investors. This is supported by the MIGA-EIU Political Risk Survey 2012, which found that macroeconomic instability and access to financing are the top constraints for foreign investors over the next 12 months, while political risks are the prominent concern for them over the next three years.
Which Countries Are Crisis-Prone?
Although defaults and expropriations rarely coincide in the same year, they are historically related in the sense that the same types of countries seem to engage in both over the long term. This section gathers the empirical findings of past studies to understand the country-specific factors that make the two risk events more likely.
The lower panel of table 2.1 uses the dataset con-structed by Tomz and Wright (2010), and presents a joint distribution of 191 countries showing those that experienced sovereign default and expropriation events during 1970-2004. Countries in the upper-left quadrant neither defaulted nor expropriated at any point in the time period (75 cases), whereas countries in the lower-right quadrant both defaulted and expropriated (62 cases). Nearly 70 percent of countries occupy one of those two quadrants, versus 30 percent that experienced only one of the events during this time period. This indicates there is a strong positive correlation between the two events in the long term.
By looking at the regional distribution of 62 countries that experienced both events over 1970-2004, about half of the expropriation acts occurred in Africa (North and Sub-Saharan) and a third of them in
Latin America and the Caribbean. The expropriations are also clustered in Africa and Latin America in the Berne Union data based on self-reported PRI claim payments (by year of payment, not year of occurrence of the event). Thus, the long-term coincidences of the data suggest a real underlying pattern, even bearing in mind that one of the major difficulties in any empirical analysis of expropriations is the lack of reliable and consistent aggregate data.
In addition to the regional concentrations of expro-priations, an empirical study (Li 2009) shows that the political institutions of the host government are correlated with the likelihood of expropriation. Another study, commissioned by MIGA42 looked at whether two political indicators—the policy envi-ronment of the country and the country’s political ideology (“right-wing” vs. “left-wing,” as defined in the same study)—are also important determinants of the two events. Using Country Policy and Institutional Assessment (CPIA) aggregate scores, a general measure of policy soundness developed by the World Bank, the study found that countries with lower CPIA scores (that is, more challenging governance environments) are more likely to expropriate private assets, although this relationship becomes statis-tically insignificant when controlling for other factors. The study found a stronger relationship with the gov-ernment’s political ideology, reinforcing the conven-tional wisdom that foreign investors who operate in countries with governments described as “left-wing” need to be more concerned about the risk of expro-priations. This finding is also consistent with World Investment and Political Risk 2011, which found that the type of political regime could be a major driver of expropriation.
There is also a tendency that expropriations will repeat multiple times, while sovereign defaults are much rarer events. Among 78 countries that expropriated private assets at least once in this time period, about 70 percent experienced expro-priation two or more times, as shown in the upper panel of table 2.2. A country is more likely to have expropriation events as the number of past expro-priation events increases. It suggests the possibility of reputational spillovers, leading to the conclusion that governments lose incentives to preserve a good reputation by honoring their obligations once they have revealed themselves to be unreliable. As the reputation loss is a critical cost of expropriation, governments that have expropriated private assets in the past (and have therefore already incurred this reputation cost) are more likely to engage in further expropriation.

34 | MIGA WIPR REPORT 2012
Public debt levels of most Asian countries prior to the 1997-98 financial crisis were relatively low. Government debt as a per-centage of GDP in 1996 for China, India, Indonesia, Malaysia, the Philippines, and Thailand were at 16, 69, 23, 41, 47, and 4 percent respectively. Out of the six countries, only Indonesia experienced a sovereign external debt crisis during this period. Meanwhile, Indonesia, Malaysia, the Philippines, and Thailand suffered from currency and banking crises when the financial crisis hit the region. This box focuses on the case of Indonesia to inves-tigate the impact, if any, of its sovereign external debt restructuring on financial flows to the country. This is related to the joint retaliation hypothesis raised in Tomz and Wright concerning whether the non-honoring of debt contracts spills over to spoil relations with other types of investors. If there is cross-retaliation between debt and equity contracts, the government will be excluded from FDI after the outbreak of a sovereign default event. Annual data from 1981 to 2010 on inflows of debt securities and FDI into Indonesia expressed as per-centages of GDP are displayed in Figure 2.3, along with the bar that indicates the onset of the debt crisis.
It is clear from the figure that both debt and FDI inflows tumbled at the onset of the sovereign debt crisis, which in this case also coincided with the expropriation events. The precipitous drop of debt inflows shows that the impact of the debt restructuring on debt securities seems more immediate compared to FDI inflows. Interestingly, both types of capital inflows started to recover when Indonesia was still in the midst of the debt crisis. Indeed, debt and FDI inflows exceeded their pre-crisis levels only two and three years, respectively, after the debt crisis
ended. Undoubtedly, better macroeconomic conditions such as the narrowing of fiscal deficits and higher yields on domestic currency investments during the post-crisis period acted as pull factors that attracted capital flows into the country. Nonetheless, the quick recovery of debt and FDI inflows suggests that the retaliation was modest and does not support the joint retaliation hypothesis. It attests to the short-term memory of foreign creditors and investors as regards the sovereign debt restructuring event that took place in Indonesia during the financial crisis.
Figure 2.3 Inflows of Debt Securities and FDI
Box 2.1 Impact of Sovereign Debt Restructuring on Financial Flows: The Case of Indonesia
Fig 2.3
-4
-3
-2
-1
0
1
2
3
4
81 00959085 05 10
FDI inflows
Debt Inflows
As percentage of GDP

MIGA WIPR REPORT 2012 | 35
The case of sovereign defaults is quite different. The bottom panel of Table 2.2 shows that sovereign defaults occurred only once or twice in 90 percent of the countries. In the MIGA-commissioned empirical study, it was found that the country is less likely to experience another sovereign default episode if it experienced a default in the previous five years. As mentioned previously, it is technically difficult for a country to consecutively default on its debt obli-gations, as debt has to be built up again prior to the next default opportunity.
This finding on the persistence of expropriations provides a good signal for foreign investors that the loss probability of expropriation tends to be higher for countries that experienced the event in the past.
If sovereign default is a more isolated event, how can the risk of sovereign default risk be assessed? In the empirical study (Eden, kraay, and Qian 2012), which defines sovereign defaults as a country’s failure to make required payments to foreign private creditors, the sovereign default event coincided with idiosyncratic economic shocks. In this regard, economic indicators such as higher external debt burden and lower real GDP growth are good pre-dictors of sovereign default. kraay and Nehru (2006) also found that sovereign defaults with official creditors are determined by the quality of policies and institutions, in addition to debt burden and economic shocks.
In summary, sovereign default and expropriation have occurred for somewhat different political and economic reasons and they are different in nature. Expropriations tend to repeat and are more determined by political factors. Sovereign defaults tend to be determined by temporary economic shocks. In the short term, the two events rarely occur in parallel. In the long-run perspective, however, the relative riskiness of the two types of events can be understood by looking at the external liability position of the host country.43 This correlation is unique and more complex in comparison with a perhaps more obvious correlation between sovereign risk and transfer/inconvertibility risk (in box 2.2).
Given that the same countries engage in both sov-ereign defaults and expropriations in the long term, the same country-level expertise that is useful for underwriting traditional PRI may also be relevant for providing non-honoring of sovereign financial obli-gations.
Table 2.2 Frequency of Sovereign Defaults and Expropriations over 1970-2004
Expropriation
Frequency of events
Number of countries
%
1 24 30.77
2 16 20.51
3 13 16.67
4 10 12.82
5 9 11.54
6 4 5.13
7 1 1.28
8 1 1.28
Total 78 100
Sovereign Defaults
Frequency of events
Number of countries
%
1 62 70.45
2 19 21.59
3 4 4.55
4 3 3.41
Total 88 100
Note: Among 191 countries in the total sample, there are 78 countries with expropriation events and 88 countries with sovereign default events during this time period.
Source: Tomz and Wright (2010)

36 | MIGA WIPR REPORT 2012
Box 2.2 Sovereign Risk and Transfer/Convertibility Risk
Besides expropriation, a perhaps more obvious correlation is that between sovereign risk and transfer and convert-ibility risk. The two risks are highly cor-related. Based on Standard &Poor’s (S&P) ratings on the long-term foreign currency (LTFC) and transfer and convertibility as of September 2012, a simple correlation between the two is 0.83. Figure 2.4 plots 128 countries with different LTFC rating (x-axis) and transfer and convertibility rating (y-axis). The fitted line shows this high cor-relation between these two types of risk.
Historically, sovereigns suffering from political and economic pressures have tried to safeguard falling foreign reserves by restricting the ability of residents to convert from local to foreign currency. Fitch previously operated a “sovereign ceiling” approach, whereby LTFC was automatically regarded as the ceiling on the transfer and convertibility rating. This is based on experiences of sovereign debt crises in the 1970s and 1980s, when governments facing default imposed moratoriums or exchange controls and/or took other restrictive measures, such as impeding access and transfer of foreign currency by private entities.
However, as private capital flows and trade have become more globalized, the number of countries that impose capital controls has decreased dramatically. In addition, the experience of sovereign default events since the mid-1990s (for example, the Dominican Republic in 2005) provides some support for the view that governments are less likely than in the past to impose foreign exchange controls and private-sector mora-toriums in order to prevent a sovereign
default. According to Fitch (2004) of the 12 emerging-market sovereign crises, nine resulted in a default but only two resulted in some form of transfer and convertibility event.45 This makes a simple “sovereign ceiling” approach less realistic.
Based on the reduction of transfer and convertibility risk relative to sovereign risk, rating agencies view transfer and convert-ibility risk as lower. As a result, the transfer and convertibility rating exceeds sovereigns’ LTFC ratings in 68 percent of sovereigns that are rated by S&P (2009), while another 32 percent have the same rating for both LTFC and transfer and convertibility. In figure 2.4, countries with a transfer and convertibility rating higher than the LTFC rating are plotted above the 45 degree line. Countries in monetary or currency unions are assigned the same transfer and con-vertibility rating as other union member countries, and dollarized economies have the same transfer and convertibility rating as the United States.46 In such cases, their transfer and convertibility ratings tend to be overrated compared with their LTFC rating, which weakens the correlation between the two risks.
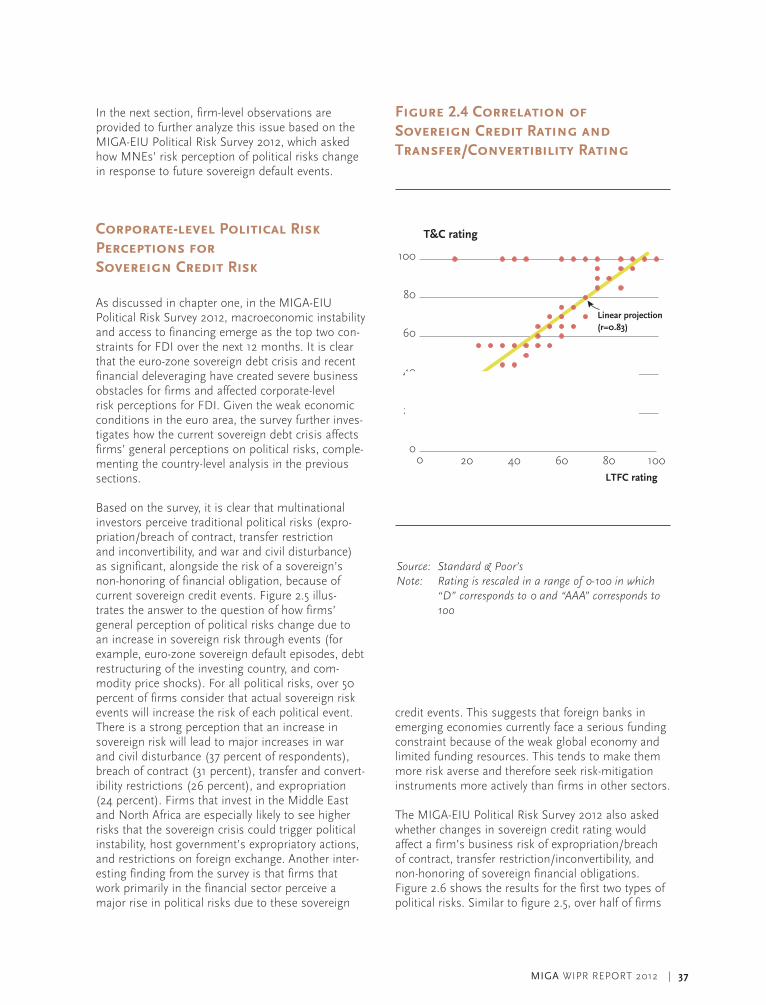
MIGA WIPR REPORT 2012 | 37
Figure 2.4 Correlation of Sovereign Credit Rating and Transfer/Convertibility Rating
Source: Standard & Poor’sNote: Rating is rescaled in a range of 0-100 in which
“D” corresponds to 0 and “AAA” corresponds to 100
In the next section, firm-level observations are provided to further analyze this issue based on the MIGA-EIU Political Risk Survey 2012, which asked how MNEs’ risk perception of political risks change in response to future sovereign default events.
Corporate-level Political Risk Perceptions for Sovereign Credit Risk
As discussed in chapter one, in the MIGA-EIU Political Risk Survey 2012, macroeconomic instability and access to financing emerge as the top two con-straints for FDI over the next 12 months. It is clear that the euro-zone sovereign debt crisis and recent financial deleveraging have created severe business obstacles for firms and affected corporate-level risk perceptions for FDI. Given the weak economic conditions in the euro area, the survey further inves-tigates how the current sovereign debt crisis affects firms’ general perceptions on political risks, comple-menting the country-level analysis in the previous sections.
Based on the survey, it is clear that multinational investors perceive traditional political risks (expro-priation/breach of contract, transfer restriction and inconvertibility, and war and civil disturbance) as significant, alongside the risk of a sovereign’s non-honoring of financial obligation, because of current sovereign credit events. Figure 2.5 illus-trates the answer to the question of how firms’ general perception of political risks change due to an increase in sovereign risk through events (for example, euro-zone sovereign default episodes, debt restructuring of the investing country, and com-modity price shocks). For all political risks, over 50 percent of firms consider that actual sovereign risk events will increase the risk of each political event. There is a strong perception that an increase in sovereign risk will lead to major increases in war and civil disturbance (37 percent of respondents), breach of contract (31 percent), transfer and convert-ibility restrictions (26 percent), and expropriation (24 percent). Firms that invest in the Middle East and North Africa are especially likely to see higher risks that the sovereign crisis could trigger political instability, host government’s expropriatory actions, and restrictions on foreign exchange. Another inter-esting finding from the survey is that firms that work primarily in the financial sector perceive a major rise in political risks due to these sovereign
Fig 2.4
20 40 60 80 1000
0
20
40
60
80
100
T&C rating
LTFC rating
Linear projection (r=0.83)
credit events. This suggests that foreign banks in emerging economies currently face a serious funding constraint because of the weak global economy and limited funding resources. This tends to make them more risk averse and therefore seek risk-mitigation instruments more actively than firms in other sectors.
The MIGA-EIU Political Risk Survey 2012 also asked whether changes in sovereign credit rating would affect a firm’s business risk of expropriation/breach of contract, transfer restriction/inconvertibility, and non-honoring of sovereign financial obligations. Figure 2.6 shows the results for the first two types of political risks. Similar to figure 2.5, over half of firms

38 | MIGA WIPR REPORT 2012
expressed their concerns about the rise in expro-priation and contract violation, as well as foreign currency transfer restriction in the event sovereign debt default should occur. Even under the more realistic situations where the sovereign credit rating would be downgraded below investment grade, they perceive higher risks of both political risk events.
This seems to be somewhat contradictory to the country-level evidence, which shows a lack of cor-relation between actual sovereign default and expropriation events in the short term as well as no spillover effect between two events. As discussed in previous sections, in the past decades there are rarely cases where two extreme events (sovereign default and expropriation) coincide as shown in table 2.1. Although actual events tend not to happen at the same time, this firm-level survey makes clear that the two events are generally perceived by MNEs as strongly correlated in the sample. The survey does not explicitly ask the time period over which the risk was being assessed, but investors tend to have a forward-looking view on political risk, especially for expropriation (figure 1.4 and 1.5). If they have a longer-time horizon when indicating their per-ceptions on political risk, this survey result would be compatible with long-run evidence that a similar set of countries eventually engages in both sovereign default and expropriation.
As investors’ risk perceptions of sovereign default are positively correlated with their perceptions of the risk of expropriation, this implies that the provision of PRI for non-honoring of sovereign financial obli-gation could have some positive spillover effects in mitigating investors’ broader political risk per-ceptions for FDI.
Finally, based on the survey, the sensitivity of political risk perceptions to sovereign risk seems to be higher for specific types of firms—those investing in certain countries in the Middle East and North Africa (such as Egypt) and Latin America (such as Argentina, Brazil, and Mexico). In addition, such region-specific responses by firms could be partly explained by already-elevated perceptions of political risk after the Arab Spring in the Middle East and North Africa, but this should also relate to the country typology dis-cussed in the previous section. Although this requires a more systematic analysis, foreign investors’ political risk perceptions might be more sensitive to a sov-ereign crisis in certain countries. As noted in this section, investors’ risk perceptions might also be more sensitive in countries that face higher con-tagion risks from the global crisis (for example, due
Figure 2.5 Impact of Actual Sovereign Risk Events on Political Risk Perceptions
Percent of respondents
Source: MIGA-EIU Political Risk Survey 2012
Note: In this question, “sovereign risk” includes events such as default episodes in euro-zone, debt restructuring, and commodity price shocks
Fig 2.5
Major increase in perceived riskMinor increase in perceived riskNo impactMinor decrease in perceived riskMajor decrease in perceived riskDon’t know
Expropriation
Breach of contract
Transferand convertibility
restrictions
War and civil disturbance
0 20 40 60 80 100
to weak external liability positions), those with poorer governance, or countries that experienced multiple political risk events in the recent past. These topics too need to be the subject of further research.

MIGA WIPR REPORT 2012 | 39
Figure 2.6 Sovereign Credit Risk and its Impact on Political Risk
Percent of respondents
Source: MIGA-EIU Political Risk Survey 2012
In conclusion, this chapter examined the empirical relationship between sovereign credit risk and political risk over time and highlighted some empirical regularities between the two types of risk. At the country level, it found that the two types of events rarely coincide in the short term, but seem to occur in waves. Because of the current global economic crisis in the advanced economies, foreign investors’ political risk perceptions seem to be elevated for emerging and developing economies. As the emerging economies have relied more on FDI as a substantial source of foreign currency in recent years, expropriation risk seems to be relatively higher. This is in sharp contrast to advanced economies, which are perceived to be more susceptible to sov-ereign debt default risk. Amidst the global economic crisis, PRI for sovereign credit risk seems to play a role in encouraging investments by managing the risk of non-honoring of sovereign financial obligations, but it could also alleviate investors’ broader concerns for other political risks.
Finally, this chapter suggests that a similar set of countries with weak policy environments and gov-ernments conventionally described as “left-wing” have a more persistent risk of expropriation. In terms of PRI coverage for expropriation risks, this finding suggests that it is important to accumulate knowledge of political and economic conditions for a similar set of countries that faced a persistent expro-priation risk in the past. For PRI providers, this infor-mation is useful for providing traditional political risk insurance as well as relevant for providing coverage for non-honoring of sovereign financial obligations.
Major increaseMinor increase No impactMinor decrease Major decrease Don’t know
Expropriation/breach of contract
Transfer restriction/inconvertibility
Sovereigndebt downgrade
(staying aboveinvestment grade)
Sovereigndebt downgrade
(belowinvestment
grade)
Sovereign debt default
Sovereign debt upgrade
(staying above investment grade)
Sovereign debt upgrade
(below investment grade)
Sovereigndebt downgrade
(staying aboveinvestment grade)
Sovereigndebt downgrade
(belowinvestment
grade)
Sovereign debt default
Sovereign debt upgrade
(staying above investment grade)
Sovereign debt upgrade
(below investment grade)
0 20 40 60 80 100
0 20 40 60 80 100
Fig 2.6
40 | MIGA WIPR REPORT 2012
CHAPTER THREE
THE POLITICAL RISk
INSURANCE INDUSTRY
r Between 2008 and 2011, issuance of political risk insurance (PRI)47 has increased by 29 percent for Berne Union members, an increase that has exceeded that of foreign direct investment (FDI) flows into developing countries over the same time period. However, aggregate premium rates have remained remarkably stable.
r Capital availability in PRI, just as in other specialty insurance lines, has increased over the past four years. This trend is driven mainly by devel-opments in the broader insurance market and by the growing demand for PRI.
r As a relatively small specialty line, the PRI market is influenced by developments in the general (property/casualty) and life insurance industry. The capital position of general and life insurers remains strong and new capital requirements contemplated by Solvency II are expected to be met easily. Premium income in general and in life insurance has remained flat.
r At least partially due to trends in the general insurance market, capital has been allocated to specialty lines such as PRI in search of higher income. The growth in PRI has involved both public and private pro-viders, with the proportions of issuance from each roughly stable. In the private and Lloyd’s market, capacity has increased 19 percent in the first half of 2012, with new providers entering the market and existing providers increasing their capacity.
r Claims have increased sharply over the past two years and have tended to be paid out more by private providers than by public ones. Reported recoveries from claims paid by both public and private pro-viders of the Berne Union have been low, though interpretation of this is complicated by the unpredictable lag between claim payments and recoveries.

MIGA WIPR REPORT 2012 | 41
Figure 3.1 PRI by Berne Union Members and FDI Flows into Developing Countries
Sources: Berne Union Secretariat; World Bank
The PRI industry expanded in 2011 and evidence from the first half of 2012 indicates that this trend is continuing. The PRI industry, as a specialized line of insurance, is affected by the demand for PRI itself, as well as by changes in capital availability in the broader insurance market. This chapter explores both of these trends by first focusing on the potential reasons why demand for PRI grew over the past four years and then exploring how trends in the broader insurance market affected PRI’s availability of coverage and pricing.
In 2011, the members of the Berne Union issued $75 billion in investment insurance,48 which represented an increase of 13 percent over the previous year.49 For the first half of 2012, issuance reached $47 billion, with trends suggesting that the uptick could well continue into the second half of the year. Private PRI members outside of the Berne Union have reported similar trends, although the exact amount of issuance is more difficult to determine because of confiden-tiality and other legal reasons.
While volume of new PRI issued by Berne Union members in 2011 is over twice the volume issued in 2005, this needs to be viewed in the context of growing levels of FDI flows into developing countries, including FDI from developing countries themselves. Despite an upward trend, the rate of growth has not been smooth, with a fall-off occurring in 2008. However, since 2009, the cumulative growth rate of PRI issuance has been greater than that of FDI into developing countries (part 2 of figure 3.1). For this reason, on average, new PRI as a proportion of FDI inflows into developing countries has increased from 9.5 percent during 2006-2008 to 11.6 percent during 2009-2011 (part 1 of figure 3.1). Most of this increase took place in 2009 in the aftermath of the global financial crisis and has remained constant since then at 11.6 percent.50 The increase may be a result of either higher global political risk perceptions, or more capital scarcity in the financial sector (as PRI in some cases may relieve capital charges in financial
Fig 3.1
00 01 02 03 04 05 06 07 08 09 10 11
Ratio of PRI to FDI to developing countriesin percent
0
2
4
6
8
10
12
14
0
100
200
300
400
500
600
700
00 01 02 03 04 05 06 07 08 09 10 11
Growth of new PRI vs. FDI flows
New PRIFDI into developing countries

42 | MIGA WIPR REPORT 2012
Figure 3.2 PRI Issuance by Berne Union Members
$ million
Source: Berne Union Secretariat
institutions), or a combination of both. It should be noted that the figures also underscore that the bulk of FDI is not covered by PRI.
Demand for PRI
With trends largely pointing to growth in investment into developing countries and heightening awareness and perceptions of political risk among investors, demand for PRI has increased sharply since 2005. The year 2011 showed the strongest increase in absolute terms since the onset of the financial crisis, with new investment insurance issued by members of the Berne Union reaching a new record (figure 3.2). By the first half of 2012, the Berne Union issuance level was still growing strongly and is expected to reach an even higher level than in 2011. Issuance for the first half of 2012 alone was near the level for the full year in 2009 and higher than the level of each year prior to 2007.
The main developments driving the demand for PRI have been:
r Unexpected events in the Middle East and North Africa have raised the profile of risks associated with seemingly stable regimes.
r Expropriations in Latin America and contract renegotiations in the mining sector in several resource-rich economies over the past few years have brought political risk into the forefront of investors’ consideration.
r Capital constraints and more regulation in financial institutions (for example, Basel II-III, Solvency II) have limited the financing options for foreign investment. PRI may be able to mitigate the perceived risks by regulators and offer capital relief for financial institutions, which makes financing with PRI more attractive.
r In the financial sector, a drop in demand for PRI by banks for shareholder loans to their affiliates has been offset by increased demand from project finance.
More generally, after a rather benevolent period with low levels of political claim losses, there is a growing realization that political risk events are not easily predictable and can adversely affect FDI projects and supply chains.
Fig 3.2
0
20,000
40,000
60,000
80,000
200
020
01
200
220
03
200
420
05
200
620
07
200
820
09
2010
2011
2012
H1
The growing demand for PRI is taking place in the context of the current financial market turmoil and deleveraging by financial institutions in Europe and other high-income economies that are facing new regulatory requirements to bolster their positions. With limited funding available and banks especially cautious, PRI for investment projects is in demand to enable financing to go forward, particularly to obtain capital relief.
As foreign investors look for higher returns, they are turning increasingly to frontier markets where political risks can be significant. New actors in the field of FDI who are less familiar with developing-country environments—especially frontier markets—also look to PRI as a tool to mitigate risks. Demand for PRI is increasing from investors interested in countries that are beginning to encourage FDI, such as Myanmar, or those that have seen a substantial influx of investment in recent years, like Mongolia in natural resources. Finally, events in the Middle East and North Africa contributed to greater awareness of the need to manage political risk by underscoring that investors are not always in a position to take into account unanticipated events in their current risk-mitigation strategies.

MIGA WIPR REPORT 2012 | 43
Figure 3.3 PRI Issuance by Berne Union Members, by Type of Provider
$ million
Source: Berne Union Secretariat
since 2005, while total cover provided by private and multilateral providers was more volatile, actually declining in some years (figure 3.3). In 2008 and 2009, the growth in total cover provided by public providers increased much faster than for private providers that are members of the Berne Union, but this trend is reversing. Among investment insurers based in developing countries that are members of the Berne Union, total cover provided also increased considerably in parallel to the growth in outward FDI from developing countries.
Anecdotal evidence among public issuers confirms this picture of higher than historical growth compared to that of private providers, for which growth in issuance has not been significantly higher than historical trends. These observations, however, exclude Lloyd’s market participants, meaning the relative growth rates and relative shares of public and private issuance may not be as marked as the figure suggests. In a July 2012 roundtable of private insurers and brokers from the London insurance market (Lloyd’s syndicates and other private insurers) hosted by the Exporta Group on behalf of MIGA, participants noted an increase in demand for PRI across all political risks. While noting that regulatory requirements such as Solvency II (the revised capital requirements and risk-management standards for the insurance industry in the European Union) and Basel III (a comprehensive set of reform measures to strengthen the regulation, supervision, and risk management of the banking sector) are increasing the cost of insurance, the broad consensus was that demand is still strong for both specialized and general lines of coverage. In fact, most private market participants noted the overall stability in the market over the past 20 or so years, in the sense that both specialized PRI and broader universal coverage have tended to move in parallel. While there have been periods when one or another type of coverage has been preferred by clients, over the long term the relative share of both types of coverage has remained broadly constant. In the current period of issuance, this growth pattern continues to hold. The expec-tations of market participants are that demand for PRI will continue to increase at rates slightly above those for FDI and that, in the near term, the Solvency II regulatory requirements will not pose a barrier to the pattern of continued growth, at least in the PRI market. As an insurance regulator told MIGA, the capital position of insurers in the United kingdom at this time is significantly stronger than what will be required under the new regulatory framework, so this should not act as a barrier to further growth.
Fig 3.3
200
520
06
200
720
08
200
920
1020
1120
12H
10
10,000
20,000
30,000
40,000
50,000
60,000
70,000
80,000
MultilateralPublicPrivate
While the increase in demand for PRI has been broad-based, demand (in absolute terms) has been particularly strong for investments in Asia. This probably reflects the continued growth in infra-structure projects in the region into 201251 as well as attractive opportunities in countries with large domestic markets that are also continuing to see real GDP growth. However, in relative terms, smaller countries have seen a disproportionate rise in PRI issuance. An interesting development in the market is that—while historically demand for PRI has typically been focused on investments in developing countries—in the past two years there has been a marked increase in inquiries and issuance in some high-income countries, reflecting heightened political risk perceptions there due to the financial and sov-ereign debt crisis.
According to the Berne Union, total PRI cover provided by public providers increased every year
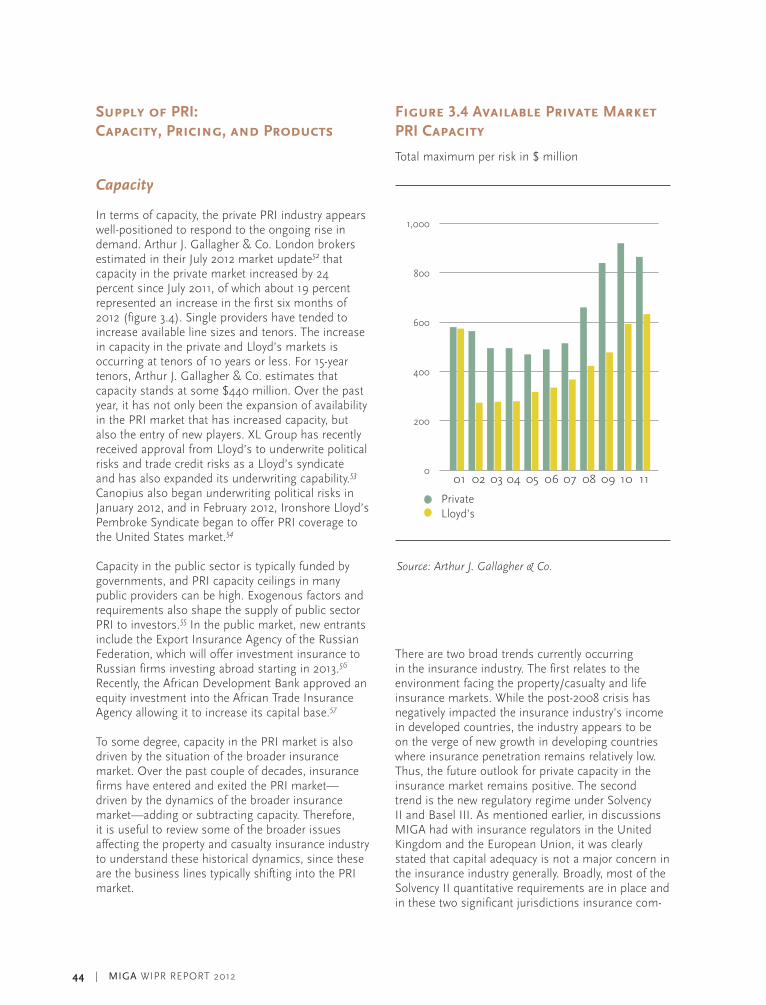
44 | MIGA WIPR REPORT 2012
Supply of PRI: Capacity, Pricing, and Products
Capacity
In terms of capacity, the private PRI industry appears well-positioned to respond to the ongoing rise in demand. Arthur J. Gallagher & Co. London brokers estimated in their July 2012 market update52 that capacity in the private market increased by 24 percent since July 2011, of which about 19 percent represented an increase in the first six months of 2012 (figure 3.4). Single providers have tended to increase available line sizes and tenors. The increase in capacity in the private and Lloyd’s markets is occurring at tenors of 10 years or less. For 15-year tenors, Arthur J. Gallagher & Co. estimates that capacity stands at some $440 million. Over the past year, it has not only been the expansion of availability in the PRI market that has increased capacity, but also the entry of new players. XL Group has recently received approval from Lloyd’s to underwrite political risks and trade credit risks as a Lloyd’s syndicate and has also expanded its underwriting capability.53 Canopius also began underwriting political risks in January 2012, and in February 2012, Ironshore Lloyd’s Pembroke Syndicate began to offer PRI coverage to the United States market.54
Capacity in the public sector is typically funded by governments, and PRI capacity ceilings in many public providers can be high. Exogenous factors and requirements also shape the supply of public sector PRI to investors.55 In the public market, new entrants include the Export Insurance Agency of the Russian Federation, which will offer investment insurance to Russian firms investing abroad starting in 2013.56 Recently, the African Development Bank approved an equity investment into the African Trade Insurance Agency allowing it to increase its capital base.57
To some degree, capacity in the PRI market is also driven by the situation of the broader insurance market. Over the past couple of decades, insurance firms have entered and exited the PRI market—driven by the dynamics of the broader insurance market—adding or subtracting capacity. Therefore, it is useful to review some of the broader issues affecting the property and casualty insurance industry to understand these historical dynamics, since these are the business lines typically shifting into the PRI market.
Figure 3.4 Available Private Market PRI Capacity
Total maximum per risk in $ million
Source: Arthur J. Gallagher & Co.
Fig 3.31
Private Lloyd’s
0
200
400
600
800
1,000
01 02 03 04 05 06 07 08 09 10 11
There are two broad trends currently occurring in the insurance industry. The first relates to the environment facing the property/casualty and life insurance markets. While the post-2008 crisis has negatively impacted the insurance industry’s income in developed countries, the industry appears to be on the verge of new growth in developing countries where insurance penetration remains relatively low. Thus, the future outlook for private capacity in the insurance market remains positive. The second trend is the new regulatory regime under Solvency II and Basel III. As mentioned earlier, in discussions MIGA had with insurance regulators in the United kingdom and the European Union, it was clearly stated that capital adequacy is not a major concern in the insurance industry generally. Broadly, most of the Solvency II quantitative requirements are in place and in these two significant jurisdictions insurance com-

MIGA WIPR REPORT 2012 | 45
Figure 3.5 General Insurance Pricing vs. Private PRI Capacity
$ million per risk
Sources: Gallagher London; Advisen58 Note: The Advisen ADVx™ Composite Commercial
Lines Pricing Index shows the change in the average commercial lines premium in the United States by quarter beginning the first quarter of 2001 (Q4 2000 = 100)
panies are currently well-capitalized. Specialized and general and life firms, as well as major reinsurers, have concluded that Solvency II requirements are not expected to negatively impact capital availability in the next few years. Because of these trends, market conditions in the broader insurance market are “soft” and liquid.59
An important ongoing concern in the broader insurance industry has been the protracted low-interest environment. Given regulatory limits on assets classes allowed for investment, returns from investments have remained low by historical standards with expectations that the situation will
Fig 3.5
01 02 03 04 05 06 07 08 0910 110
200
400
600
800
1,000
0
20
40
60
80
100
120
140
160
PrivateLloyd'sADVx Composite Index
not change in the short term. What this means is that financial returns have been falling. One of the corporate responses to this has been to shift capital into specialized lines, including PRI. This explains to a large degree why capacity in PRI has been growing at rates above those of FDI flows.
Pricing
As noted earlier, PRI is often managed as a specialty line by general insurance companies, so liquidity and pricing of PRI correlate somewhat with the insurance market. Further, as the PRI portfolio is dwarfed by that of general insurance, the supply of PRI also closely follows trends in the insurance cycle. Consequently, notwithstanding the very rapid growth in demand for PRI, capital supply in this line of business has increased equally rapidly leading to continued soft premiums. How much insurance pro-viders in any business segment are willing and able to underwrite is also determined by the availability of reinsurance, which by all accounts remains strong. According to Aon Benfield, reinsurance capacity has been ample, returning to its previous record high of $470 billion at the end of the first quarter of 2012.60
Indeed, PRI market capacity and general insurance pricing have trended together over the past 10 years (figure 3.5). There are several ways to measure the softness of the insurance market, including insurance pricing indexes and the available amount of policy holder surplus (the difference between insurers’ assets and liabilities). Figure 3.5 tracks capacity in the PRI market since 2001 against Advisen insurance consultants’ ADvx composite index of general insurance pricing, a pricing benchmark used in the insurance industry.
For 2012, and looking at the same issue in terms of year-on-year growth rather than absolute dollar figures, Advisen also compared the property and casualty policy holder’s surplus growth with GDP growth and estimated that policyholders’ surplus is still growing ahead of GDP61 and, in fact, ahead of historical growth averages. This would indicate that the forces contributing to premium softness remain in place, and that policyholders’ surplus continues to grow to historic highs.
The current soft insurance market has persisted throughout the credit crisis. Despite the temporary rise in claims in the aftermath of the global financial crisis and the political turmoil in the Middle East and North Africa, premium levels have remained

46 | MIGA WIPR REPORT 2012
Figure 3.6 Ratio of Premiums to Average PRI Exposure for Berne Union Members
Source: Berne Union SecretariatNote: Average rates; weighted average rates are likely
higher
stable as capacity has increased in both the general insurance and PRI markets. Thus the market was confronted with the seeming paradox that benign insurance market conditions held up despite the unfavorable environment in financial markets. It is unclear how long the current soft state of the global insurance market will persist. If predictions of continued sluggish growth in the industrialized world materialize, interest rates and investment income will likely remain subdued for some time. However, lower economic activity will also reduce the real demand for insurance services, although some product lines may experience growing demand in developing countries as insurance penetration increases.
In the PRI market, risk appetite, pricing, and capacity will depend as much on loss events outside the narrow PRI industry as on financial losses within the PRI industry from significant political events. Large catastrophe losses, for example, directly influence reinsurance availability, requiring private insurers to deploy capital across business lines. The PRI industry’s supply cycle therefore also depends as much on events such as natural disasters as it does on political events.
Historically, the ratio of premiums to average PRI exposure has fluctuated within a band. Plentiful capacity in both the general and PRI markets as well as greater flexibility in setting premium rates by pro-viders in the public market helped to hold premiums relatively steady in 2011 (figure 3.6), but it is not certain that this will continue. Potentially, the drivers of the demand for PRI outlined earlier will exert upward pressure on premiums. There are also signs that premiums in some risk categories of the broader insurance market are increasing,62 which would also exert upward pressures on PRI pricing.
In conclusion, in the private sector, PRI is often a specialty line offered by general insurance companies and, as such, developments in the PRI market are influenced by developments in the broader insurance business.63 In recent years, capacity in the general insurance market has increased. At the same time, demand for insurance has been sluggish because of the slow economic recovery following the global financial crisis. Insurers’ capital has continued to grow to new records and currently there appears to be a sufficient supply of reinsurance globally.64 This is reflected in the current soft market, though going forward, increased demand may drive prices higher.
Fig 3.5
92 94 96 98 00 02 04 06 08 10 110.2
0.4
0.6
0.8
1.0
Products
The increased risk perception by investors and con-sequent increase in demand for PRI has resulted in innovative ways to use existing products and increased product offerings. Some public members of the Berne Union (including MIGA) have expanded their offering to respond to different investor needs. For example, the events in the Middle East and North Africa region have engendered an interest for coverage of existing investments, despite the historical requirement of many public providers to cover only new investments. Additionally, the more constrained financing environment since 2008 has resulted in greater need for sovereign or sub-sov-ereign support or direct engagement in financing of projects. This has led to greater interest in coverage of risks such as the non-honoring of sovereign financial obligations. Additionally, the growing stress on public finances in some parts of the world as a result of the crisis has led to an increase in interest

MIGA WIPR REPORT 2012 | 47
by investors in sovereign non-payment insurance. The entry of public providers into these product markets has permitted an increase in volume as well as tenors for these covers.
Overall, risk-mitigation strategies and product mixes within the PRI industry have not changed dramatically. The increase in PRI issuance in the Lloyd’s market this year has not tended to favor any particular coverage. Lloyd’s market participants at the MIGA-sponsored roundtable in July 2012 exten-sively discussed the issue of guarantee product mix. One of the main conclusions was that the relative share of different types of coverage has not changed significantly over the past two decades. While in the short term there may be an increase of one type of coverage—say, non-honoring of sovereign financial obligations—over the longer term the relative shares of different products have remained broadly constant. This impression was reinforced in MIGA’s discussion with reinsurers, who tended to see a broad picture of the PRI industry. Discussants observed that the mix of products may also reflect the relative liquidity position of equity investors and financial institutions, as both tend to favor different insurance products. This would account for short-term differences in the mix of PRI products, but over the medium term the mix has remained remarkably stable.
Guarantee types have also tended to evolve in a somewhat distinct way. On the one hand, events such as those in the Middle East and North Africa have increased investor interest in some specialized lines, like civil unrest and terrorism coverage (box 3.1) And some investors are expanding the use of investment insurance products for assets such as oil rigs, mobile equipment, and personal assets.65 A new development in the realm of specialized war coverage is the emergence of new products covering piracy.66 On the other hand, there has also been an increase in demand for global policies that encompass all risks. With uncertainty as to where the next political risk “event” will occur, there seems to be an increased interest in global PRI coverage.
Claims and Recoveries
Political risk claims, in terms of value, have shown considerable volatility from year to year. They increased sharply in 2010 to $312 million and declined in 2011 to about $191 million. Claims in 2011 resulted overwhelmingly from acts of political
violence (figure 3.7) and were mainly as a result of the turmoil in the Middle East and North Africa. This represents a significant shift in the pattern up until 2010, when most claims were attributed to expropriation or breach of contract. To illustrate this, during 1995-2010, claims resulting from expropriation or breach of contract accounted for 68 percent of all claims in terms of amount paid, but the share of losses under these coverages was only 5 percent in 2011. Typically the size of claims for expropriation or breach of contract tends to be larger than those for political violence because expropriation claims tend to be associated with the total loss of an investment, while political violence claims reflect replacement or repair costs and are only infrequently related to the total abandonment of the project.
Because there are no data available for claims and recoveries in the Lloyd’s market, the discussion in this section will center on the experience of Berne Union members. However, in the yearly roundtable that MIGA sponsors, the impression was that the claims experience in the Lloyd’s market over the past couple of years has mirrored that of the Berne Union, although the share of political violence in 2011 was not as large.
In contrast to previous years, among Berne Union members, private PRI providers bore the brunt of in-vestment claims in 2010, accounting for 54 percent of the total value of investment claims paid by all Berne Union members in that year (figure 3.8). That picture became less pronounced in 2011, when private pro-viders were responsible for about 46 percent of Berne Union claims for investment insurance. The ratio of cumulative claims to cumulative new investment PRI from 2005 to the first half of 2012 was 0.15 percent for public PRI providers, compared with 0.34 percent for private. While claims paid in a particular year are also in response to claims registered at any point in the past, these ratios indicate that there is some differ-ence between public and private providers.
Reported recoveries have been consistently lower over the past five years (figure 3.9), but this pattern may be due to the unpredictable lag in recovery fol-lowing a claim. Furthermore, recoveries differ by type of claim, with no recoveries typically associated with political violence claims.

48 | MIGA WIPR REPORT 2012
Box 3.1 Terrorism Insurance
Following the events of September 11, 2001 in the United States, there has been increased awareness of the risk of ter-rorism, which has been accompanied by a retrenchment in the private provision of insurance for it. In the aftermath of September 11th, about 20 countries worldwide established terrorism insurance schemes as public-private partnerships to help insurers offer adequate capacity, especially in the case of large-scale terrorist events. The aim has been to minimize the impact of a withdrawal of terrorism insurance on businesses and to protect them against losses associated with ter-rorism and business interruption resulting from it.
Terrorism risk is difficult to insure because it is not easily measureable and historical data may not be relevant. There is a great potential for vast losses from large-scale terrorist attacks, especially in urban centers, which reduces the ability of the private sector to offer insurance. This is why a public-private insurance partnership can help create an insurance system that is resilient to the threat of terrorism.
To date about 20 countries have some kind of government-backed terrorism insurance scheme in place. These include Australia, Austria, France, Germany, India, Netherlands, Spain, Switzerland, United kingdom, and the United States—among others. Most schemes were implemented as a temporary measure in response to market failure following the September 11th events
and have been renewed following periodic reviews. In some countries (for example, Belgium and the United States) insurers are required to provide coverage against ter-rorism, while in others (like Germany and the United kingdom) insurer participation is voluntary. In the case of the United States, the Terrorism Risk Insurance Program (Reauthorization Act of 2007), which has been extended to December 2014, offers up to $100 billion in government-backed terrorism coverage to the private sector. However, it is limited. Certain forms of terrorism are exempted (like nuclear or chemical attacks and bioterrorism) and it does not apply to international operations of companies based in the United States.
In general, excluding government-sponsored terrorism insurance schemes, capacity for terrorism insurance remains limited—at around $2-3 billion, according to one estimate. Recent developments regarding the provision of terrorism insurance include Denmark’s Terrorism Insurance Act 2010, a public-private partnership to provide coverage for damages to property, trains, cars, and ships caused by nuclear, chemical, biological, and radiological terrorist acts; Xin, a new insurance consortium launched by Amlin, Market, Canopius, and Argenta (all Lloyd’s syndicates) to offer terrorism insurance to businesses in Asia; and the U.S. subsidiary of Bermuda-based insurer Ironshore, which is bringing Lloyd’s political risk coverage to companies in the United States.
Sources: Swiss Re. “The Economic Case for a Private-public Terrorism Insurance Partnership.” Insights. March 2007; Terrorism Insurance Act Review 2012 (licensed from the Commonwealth of Australia under a Creative Commons Attribution 3.0 Australia License); Lloyd’s. “New Terrorism Consortium to Protect Under-insured.” March 26, 2012; Rick Friedl, “Ironshore Brings Political, War, and Terrorism Coverage to U.S.” The Royal Gazette, April 17, 2012; Wells Fargo Insurance Services.“The Terrorism Risk Insurance Act is Set to Expire in 2014 - What’s Next?” July 2010.
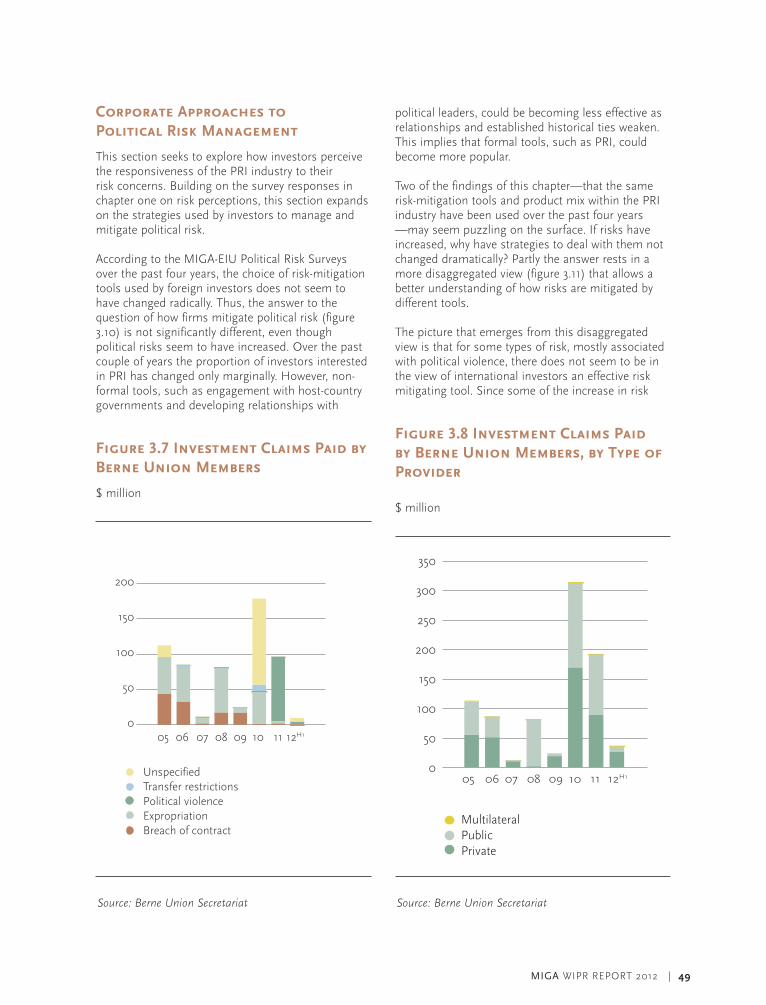
MIGA WIPR REPORT 2012 | 49
Corporate Approaches to Political Risk Management
This section seeks to explore how investors perceive the responsiveness of the PRI industry to their risk concerns. Building on the survey responses in chapter one on risk perceptions, this section expands on the strategies used by investors to manage and mitigate political risk.
According to the MIGA-EIU Political Risk Surveys over the past four years, the choice of risk-mitigation tools used by foreign investors does not seem to have changed radically. Thus, the answer to the question of how firms mitigate political risk (figure 3.10) is not significantly different, even though political risks seem to have increased. Over the past couple of years the proportion of investors interested in PRI has changed only marginally. However, non-formal tools, such as engagement with host-country governments and developing relationships with
Figure 3.7 Investment Claims Paid by Berne Union Members
$ million
Source: Berne Union Secretariat
Figure 3.8 Investment Claims Paid by Berne Union Members, by Type of Provider
$ million
Source: Berne Union Secretariat
Fig 3.6
05 06 07 08 09 10 11 12H1
0
50
100
150
200
UnspecifiedTransfer restrictionsPolitical violenceExpropriationBreach of contract
Fig 3.8
0
50
100
150
200
250
300
350
05 06 07 08 09 10 11 12H1
MultilateralPublic Private
political leaders, could be becoming less effective as relationships and established historical ties weaken. This implies that formal tools, such as PRI, could become more popular.
Two of the findings of this chapter—that the same risk-mitigation tools and product mix within the PRI industry have been used over the past four years —may seem puzzling on the surface. If risks have increased, why have strategies to deal with them not changed dramatically? Partly the answer rests in a more disaggregated view (figure 3.11) that allows a better understanding of how risks are mitigated by different tools.
The picture that emerges from this disaggregated view is that for some types of risk, mostly associated with political violence, there does not seem to be in the view of international investors an effective risk mitigating tool. Since some of the increase in risk

50 | MIGA WIPR REPORT 2012
Figure 3.9 Recoveries by Berne Union Members, by Type of Provider
$ million
Source: Berne Union Secretariat
Figure 3.10 Risk Mitigation Strategies by Foreign Investors
in percent
Source: MIGA-EIU Political Risk Survey 2012
Fig 3 .9
Use of joint venture oralliance with
local company
Political/economicrisk analysis
Invested gradually whiledeveloping familiarity with
the local environment
Use of third-partyconsultants
Scenario planning
Engagement withlocal communities
Engagement withgovernment in
host country
Develop closerelationships
with political leaders
Political risk insurance
Operational hedging(setting up multiple
plants to spread risk)
Engagement withnon-governmental
organizations
Credit default swaps
Provide supportto a well-connected
political figure
Other, please specify
We don’t use any toolsor products to mitigate
political risk
Don’t know
0 20 40 60
perception is associated with an increase in political violence risks, this can explain why PRI’s favorability among investors is little changed. However, those investors who have purchased PRI cover for political violence stand a greater chance of compensation should a covered event occur. Given the recent unpredictable events in the Middle East and North Africa, it is possible that investor perceptions of the value of political violence cover may change. For breach of contract, engaging with local officials has consistently been the preferred strategy of investors over the past four years. Given the rise in regu-latory takings, it is reasonable to assume that this will remain the case. However, risk of expropriation presents an opportunity for the PRI industry, given that investors see PRI as being relatively effective in controlling that risk (figure 3.11).
Fig 3.9
200
520
06
200
720
08
200
920
1020
1120
12H
10
30
60
90
120
150
Public Private

MIGA WIPR REPORT 2012 | 51
Figure 3.11 Investors Risk Mitigation Strategies, by Risk Type
Source: MIGA-EIU Political Risk Survey 2012
In summary, the past four years would appear to have been good years for the PRI industry. The industry’s countercyclical nature has been on display in terms of the return of higher risk perceptions among foreign investors and financial institutions. This has permitted a four-year increase of 29 percent in issuance,67 leading to an aggregate increase in portfolio. While premium rates have remained soft, in aggregate terms, premium income has increased because of increased volume. The availability of capital in the broader commercial insurance market has meant that more has been available to support specialized insurance lines such as political risk. Therefore, even though issuance has grown rapidly and a somewhat higher proportion of new FDI is being insured compared to five years ago, the soft premium environment in PRI persists at least in the short term. Furthermore, as non-life insurance seems poised to grow in developing countries, it may yet be that policyholders’ surplus will continue increasing from its record levels, thus further perpetuating these price levels. Although there have not been sufficient losses in PRI to date to alter this general picture, caution is needed since political risks—real, as well as perceived—remain significant.
Transfer andconvertibility
restrictions
Breach of contract
Non-honoring ofgovernmentguarantees
Expropriation/nationalization
Adverseregulatory changes
War
Terrorism
Civil disturbance
Other
0 20 40 60 80 100
Engage with local public entities Joint venture with local enterprises Risk analysis/monitor Relationships with key political leaders Political risk insurance Risk is not significant for my projects No existing tool can alleviate this risk
3.11

52 | MIGA WIPR REPORT 2012
1 OECD. “International Mergers and Acquisitions Surge in 2011.” Investment News Issue 16. October 2011.
2 Global Arab Network. “Foreign Direct Investment and Tourism Receipts Pick Back Up in Tunisia.” October 7, 2012.
3 The Hindu. “FDI in 2011-12 Rises 34%, a New High.” October 20, 2012.
4 Central Bank of Turkey. Balance of payments sta-tistics.
5 IMF. Statement at the Conclusion of the European Bank Coordination “vienna 2.0” Initiative’s Full Forum. Press Release No. 12/80. March 13, 2012.
6 A.T. kearney FDI Confidence Index 2012: Cautious Investors Feed a Tentative Recovery.
7 UNCTAD. World Investment Report 2012. Chapter 1. 8 In one of the biggest acquisitions in Brazil, Sinopec
purchased a 30 percent stake in Petrogal Brasil.9 ken Davies. “Outward FDI from China and its
Policy Context.” Columbia FDI Profiles. June 7, 2012.
10 OECD and UNCTAD. Seventh Report on G20 Investment Measures (covering the period between October 7, 2011 and May 3, 2012).
11 A global regulatory standard on bank capital adequacy, stress testing, and market liquidity risk agreed upon by the members of the Basel Committee on Banking Supervision. It is scheduled to be introduced from 2013 until 2018.
12 The Solvency II Directive codifies and harmonizes EU insurance regulation, primarily as it concerns the amount of capital that EU insurance companies must hold to reduce the risk of insolvency. Solvency II is expected to come into effect on January 1, 2014.
13 Lloyd’s Risk Index 2011. 14 Clifford Chance. “Resource Nationalism II:
Expropriation – Any Rights or Remedies?” Briefing Note. May 2012.
15 MIGA. World Investment and Political Risk 2011. Chapter 2.Washington DC.
16 Ernst & Young. Business Risks Facing Mining and Metals 2011-2012.
17 Allianz Risk Pulse. December/January 2011-12.18 World Economic Forum. Global Risks 2012.
19 Estimate based on outward stock data for 29 developing countries reported in IMF’s Coordinated Direct Investment Survey. China as estimated by ken Davies, “Outward FDI from China and its Policy Context, 2012,” Columbia FDI Profiles. June 7, 2012.
20 Institute of International Finance. Capital Flows to Emerging Market Economies. June 7, 2012.
21 Anita Prakash and Ikumo Isono. “ASEAN in the Global Economy–An Enhanced Economic and Political Role.” ERIA Policy Brief. No. 2012-01. January 2012.
22 These shares are likely higher since a portion of outward investment is channeled through inter-mediate jurisdictions, which do not constitute the ultimate destination of the investment. For example, for China, Hong kong, SAR China accounts for 63 percent of its outward stock and for the Russian Federation, Cyprus accounts for 42 percent of its outward stock.
23 fDi Markets database. 24 The European Union accounts for 80 percent of
FDI flows in Morocco and 58 percent in Tunisia. See De Bock, Reinout, Florea, Daniel, and Toujas-Bernate Joël, “Spillovers from Europe into Morocco and Tunisia,” IMF Working Paper No. 10/238, October 1, 2010.
25 Central Bank of Egypt. “BOP Performance in July/March 2011/2012.”
26 Tunisia’s foreign investment promotion agency. See also “Foreign investment in Tunisia recovers to pre-revolt levels,” Reuters, August 2, 2012.
27 Central Bank of Tunisia. 53rd Annual Report: Fiscal Year 2011. August 2012. p. 49.
28 Tripoli Post. “Decree Allows Foreign Investors to Enter Joint ventures in Libya.” June 8, 2012.
29 AllAfrica.com. “Tunisia: New Investment Code to Be Submitted to NCA Late December.”
30 Eden, kraay, and Qian. “Sovereign Defaults and Expropriations: Empirical Regularities.” Policy Research Working Paper 6218. The World Bank. 2012.
ENDNOTES

MIGA WIPR REPORT 2012 | 53
31 Michael Tomz and Mark L. J. Wright. “Do Countries Default in ‘Bad Times’?” Journal of the European Economic Association. 5(2–3): 352–60.2007.
32 William R. Cline. “International Debt: Systemic Risk and Policy Response.” Institute for International Economics. 1984. See also Daniel McFadden, Richard Eckaus, Gershon Feder, vassilis A. Hajivassiliou, and Stephen O’Connell. “Is There Life after Debt? An Econometric Analysis of the Creditworthiness of Developing Countries.” International Debt and the Developing Countries.179–209. World Bank.1985. See also Andrew Berg and Jeffrey Sachs. “The Debt Crisis: Structural Explanations of Country Performance.” Journal of Development Economics. 29(3):271-306. 1988.
33 Aart kraay and vikram Nehru. “When Is External Debt Sustainable?” World Bank Economic Review. 20 (3): 341-365.2006. See also Daron Acemoglu, Simon Johnson, James A. Robinson, and Yunyong Thaicharoen.”Institutional Causes, Macroeconomic Symptoms: volatility, Crises and Growth.” Journal of Monetary Economics 50: 49-123. 2003.
34 Stephen J. kobrin. “Foreign Enterprise and Forced Divestment in LDCs.” International Organization, vol. 34, No. 1, pp. 65-88. 1980.
35 Quan Li. “Democracy, Autocracy, and Expropriation of Foreign Direct Investment.” Comparative Political Studies. vol. 42 no. 8. 2009.
36 Guriev, kolotilin, and Sonin. “Determinants of Expropriation in the Oil Sector: A Theory and Evidence from Panel Data.” CEPR Discussion Paper no. 6755. Centre for Economic Policy Research. 2008.
37 In “Sovereign Theft: Theory and Evidence about Sovereign Default and Expropriation” (2010) Tomz and Wright study the effect of two political risks (default and expropriation) on foreign investments (debt and FDI). They provide a theoretical model to understand how a government’s incentives to take two political actions (repudiate debt contract and/or expropriate private assets) are determined by the state of economy, the nature of punishments from investors, and the type of political leaders. Their
empirical analysis highlights the historical pattern that two events have occurred in alternating waves
which seemed to accompany the shifts in the com-position of external liabilities between equity and debt.
38 Berne Union dataset covers the expropriation and breach of contract claims paid to non-U.S. foreign direct investors from insurers that are the member of the Berne Union. The Berne Union is the inter-national organization and community for the global export credit and investment insurance industry.
39 Carmen Reinhart and kenneth Rogoff. This Time is Different: Eight Centuries of Financial Folly. Princeton University Press. 2009.
40 This box is prepared in collaboration with Chow Hwee kwan, Singapore Management University.
41 The group categorization of advanced economy and emerging and developing economy aligns with the IMF’s World Economic Outlook. The definition is found on the website (http://www.imf.org/external/pubs/ft/weo/2012/01/weodata/groups.htm).
42 Eden, kraay, and Qian. “Sovereign Defaults and Expropriations: Empirical Regularities.” World Bank Policy Research Working Paper #6218. 2012.
43 Net FDI flow includes direct foreign investment flows (inward minus outward investment) and net re-invested earnings. Net debt investment is the net portfolio investment of debt securities, such as bonds, notes, and money market instruments.
44 This chapter focuses on the sovereign default event and does not consider the sub-sovereign default event. According to Moody’s (2009), sub-sovereign defaults rates are found to be heavily concentrated during the first two years of sovereign crisis in the emerging markets. Given this evidence, we expect that sub-sovereign default event is similarly cor-related with the country’s expropriation events.
45 During 1998-1999 Russian crisis, the government tightened capital controls and imposed a formal 90-day moratorium on servicing external debt. Also, during Argentina’s financial crisis in 2001, the central bank was very selective in granting per-mission to transfer foreign currency and imposed exchange control regulations.
(cont’d)

54 | MIGA WIPR REPORT 2012
46 Transfer and convertibility of monetary or currency union members are rated based on the past and current policy soundness of those union’s monetary authorities. For example, all members of the European Economic and Monetary Union have a transfer and convertibility rating of “AAA.” All members of the Central African Economic and Monetary Community, the West African Economic and Monetary Union , and the Eastern Caribbean Currency Union have “BBB-”. Transfer and con-vertibility ratings for dollarized economies are the same as those for the United States (for example, Panama is rated “AAA”).
47 For the purposes of this report, PRI refers to investment insurance.
48 Investment insurance figures are for both developing and high-income economies and might include business that does not fit into any other category.
49 This figure includes a large amount of issuance in 2009 to support Japanese investor activities in the United States at that time.
50 It is important to realize that this figure understates the actual level of PRI coverage as it only refers to Berne Union members who report PRI issuance. However, MIGA’s consultations with Lloyd’s market participants (the major private player, whose activities and figures are not reported in Berne Union data) and underwriters have confirmed that the trends the Berne Union faces are similar to the ones they face. So while the actual amount of FDI covered may be somewhat higher (estimates place it between the 16 percent and 18 percent) the story of issuance growth and level of coverage remains valid.
51 Marsh. “U.S. Insurance Market Report 2012: Political Risk and Structured Credit.” February 2012.
52 Gallagher London. Credit and Political Risk – PRI Report and Market Update. July 2012.
53 Insurance Journal. “XL Political Risk, Trade Credit Unit Gets Approval for Lloyd’s Expansion.” June 11, 2012.
54 Ironshore. “Ironshore enters war, political violence and stand-alone terrorism business to meet pro-tection needs of U.S. companies”, April 16, 2012.
55 For an extensive discussion of the drivers of capacity in the private, public, and multilateral PRI market, see Gerald T. West and kristofer Hamel, “Whither the Political Risk Insurance Industry?”, in Theodore H. Moran and Gerald T. West, eds. International Political Risk Management: Looking to the Future (Washington, DC: World Bank).
56 See Export Insurance Agency of Russia website http://www.exiar.ru.
57 African Trade Insurance Agency. “A Strategy to Dampen Effects of the Global Downturn Sees African Development Bank Invest ksh1.2 billion in ATI.” Press release. August 2, 2012.
58 Advisen. “State of the Market April 2011: Is a Market Shift on the Horizon?”
59 Advisen, ibid. 60 Aon Benfield, Reinsurance Market Outlook. June
and July 2012 Update.61 Advisen, op. cit.62 Marsh. Global Insurance Market Quarterly Briefing:
Q1 2012.63 MIGA. World Investment and Political Risk 2011.
Chapter three.64 Aon Benfield, op. cit.65 Michael D. Nolan, Frederic Gilles Sourgens, and
Christina Totino. “Recent Trends in Public Political Risk Insurance Coverage.” Corporate Finance Review. May/June 2011.
66 Insurance Daily .“Beazley Unveils Combined War/piracy Cover.”July 11, 2012.
67 This data are only available for Berne Union members, but a similar trend holds for the Lloyd’s market.

MIGA WIPR REPORT 2012 | 55

56 | MIGA WIPR REPORT 2012
Appendix 1 FDI Inflows, 2004–2011 $ billion
2004 2005 2006 2007 2008 2009 2010 2011
World 767 1,175 1,565 2,320 1,924 1,366 1,500 1,904
Developed countries 551 869 1,167 1,761 1,287 938 917 1,265
Developing countries 216 307 398 559 637 428 583 639
Latin America and the Caribbean 66.8 74.8 74.4 126.4 137.2 84.9 125.3 158.3
Argentina 4.12 5.27 5.54 6.47 9.73 4.02 7.06 7.08
Brazil 18.17 15.46 19.38 44.58 50.72 31.48 53.34 71.54
Chile 7.17 6.98 7.30 12.53 15.15 12.89 15.37 17.30
Colombia 3.02 10.25 6.66 9.49 10.18 7.14 6.90 13.23
Costa Rica 0.79 0.86 1.47 1.90 2.08 1.35 1.47 2.18
Dominican Republic 0.91 1.12 1.53 2.25 2.73 1.70 2.09 2.30
Mexico 24.83 24.41 20.12 31.49 27.14 16.12 20.71 19.55
Nicaragua 0.25 0.24 0.29 0.38 0.63 0.43 0.51 0.97
Panama 1.02 1.10 2.94 2.02 2.53 1.09 2.18 3.26
Peru 1.60 2.58 3.47 5.49 6.92 6.43 8.45 8.23
Uruguay 0.33 0.83 1.51 1.36 2.14 1.60 2.19 2.18
venezuela, R.B. de 1.48 2.71 0.20 2.59 0.41 (3.05) 0.78 5.32
East Asia and the Pacific 77.6 129.1 153.0 196.4 211.2 154.5 290.0 274.9 China 62.11 104.11 124.08 156.25 171.53 131.06 243.70 220.14 Indonesia 1.90 8.34 4.91 6.93 9.32 4.88 13.77 18.16 Malaysia 4.62 3.92 7.69 9.07 7.57 0.11 9.17 10.78 Philippines 0.69 1.66 2.71 3.25 1.44 2.71 1.64 1.87 Thailand 5.86 8.06 9.45 11.33 8.54 4.85 9.68 9.52 vietnam 1.61 1.95 2.40 6.70 9.58 7.60 8.00 7.43
South Asia 7.8 10.9 25.8 32.4 50.8 39.3 30.4 35.7 Bangladesh 0.45 0.81 0.70 0.65 1.01 0.73 0.92 0.80 India 5.77 7.27 20.03 25.23 43.41 35.58 26.50 32.19 Pakistan 1.12 2.20 4.27 5.59 5.44 2.34 2.02 1.31 Sri Lanka 0.23 0.27 0.48 0.60 0.75 0.40 0.48 0.96
Source: World Bank Note: Figures in parentheses represent negative numbers
APPENDICES

MIGA WIPR REPORT 2012 | 57
Appendix 1 FDI Inflows, 2004–2011 (cont’d) $ billion
2004 2005 2006 2007 2008 2009 2010 2011
Europe and Central Asia 42.6 55.8 101.3 148.4 169.0 90.4 88.0 118.7
Azerbaijan 3.56 4.48 4.49 4.36 3.99 2.90 3.35 4.49 Belarus 0.16 0.31 0.36 1.81 2.19 1.88 1.39 4.00 Bulgaria 2.66 4.10 7.87 13.88 10.30 3.90 1.94 1.98 Georgia 0.49 0.45 1.17 1.88 1.59 0.65 0.87 1.15 kazakhstan 4.16 2.55 7.61 11.97 16.82 14.28 6.63 13.23 Romania 6.44 6.87 11.45 10.29 13.85 4.93 3.20 3.04 Russian Federation 15.44 12.89 29.70 55.07 75.00 36.50 43.29 52.88 Serbia 1.03 2.05 4.97 3.43 3.00 1.94 1.34 2.70 Turkey 2.79 10.03 20.19 22.05 19.50 8.41 9.04 15.87 Turkmenistan 0.35 0.42 0.73 0.86 1.28 4.55 3.63 3.19 Ukraine 1.72 7.81 5.60 10.19 10.70 4.77 6.45 7.21 Uzbekistan 0.18 0.19 0.17 0.71 0.71 0.84 1.63 1.40
Middle East and North Africa
9.7 16.9 27.3 28.1 29.6 26.3 22.3 15.4
Algeria 0.88 1.16 1.84 1.83 2.68 3.05 2.33 2.72
Egypt, Arab Rep. 1.25 5.38 10.04 11.58 9.49 6.71 6.39 (0.48)
Iran, Islamic Rep. 2.86 3.14 1.65 2.01 1.91 3.05 3.65 4.15
Jordan 0.94 1.98 3.54 2.62 2.83 2.41 1.65 1.47
Lebanon 1.90 2.62 2.67 3.38 4.33 4.80 4.28 3.48
Morocco 0.79 1.67 2.46 2.83 2.47 1.97 1.24 2.52
Syrian Arab Republic 0.28 0.50 0.66 1.24 1.47 2.57 1.47 1.06
Tunisia 0.59 0.71 3.24 1.52 2.60 1.53 1.33 1.14
Sub-Saharan Africa 11.4 19.1 16.1 27.8 39.1 32.5 26.7 35.7
Angola 1.45 (1.30) (0.04) (0.89) 1.68 2.21 (3.23) (5.58)
Botswana 0.75 0.49 0.75 0.65 0.90 0.82 0.26 0.59
Chad 0.47 (0.10) (0.28) (0.07) 0.23 1.11 1.94 1.85
Congo, Dem. Rep. 0.41 0.17 0.24 1.79 1.67 (0.28) 2.73 1.60
Congo, Rep. (0.01) 0.80 1.49 2.64 2.53 1.86 2.21 2.93
Ghana 0.14 0.14 0.64 1.38 2.71 2.37 2.53 3.22
Liberia 0.08 0.08 0.11 0.13 0.28 0.13 0.45 0.51
Madagascar 0.05 0.09 0.29 0.77 1.17 1.07 0.86 0.91
Mozambique 0.24 0.12 0.19 0.42 0.56 0.90 1.01 2.08
Niger 0.03 0.05 0.04 0.10 0.28 0.63 0.94 1.01
Nigeria 1.87 4.98 4.85 6.03 8.20 8.55 6.05 8.84
Seychelles 0.04 0.09 0.15 0.13 0.13 0.12 0.17 0.14
South Africa 0.70 6.52 (0.18) 5.74 9.64 5.35 1.22 5.72
Sudan 1.51 2.30 3.53 2.43 2.60 1.82 2.06 1.94
Tanzania 0.44 0.94 0.40 0.58 1.38 0.95 1.02 1.10
Uganda 0.30 0.38 0.64 0.79 0.73 0.84 0.54 0.80
Zambia 0.39 0.36 0.62 1.32 0.94 0.69 1.73 1.98

58 | MIGA WIPR REPORT 2012
Question 1. In which country are you personally located? Percent of respondents
1. In which country are you personally located?Question 1
United StatesUnited Kingdom
CanadaIndiaItaly
GermanySpainChina
SingaporeSwitzerland
FranceRussian Federation
TurkeyAustraliaBelgiumFinland
PortugalDenmark
Hong Kong, SAR ChinaNetherlands
0 5 10 15 20 25
Others: Poland, Greece, Malaysia, Nigeria, Sweden, United Arab Emirates, Austria, Czech Republic, Ireland, Japan, South Africa, Angola, Brazil, Chile, Colombia, Croatia, Cyprus, Egypt, Hungary, Indonesia, Kenya, Oman, Pakistan, Peru, Romania, Saudi Arabia, Slovenia, Tanzania, Thailand, Azerbaijan, Bahrain, Belarus, Brunei Darussalam, Bulgaria, Ecuador, Estonia, Gibraltar, Guadeloupe, Islamic Republic of Iran, Isle of Man, Kazakhstan, Malawi, Malta, Mexico, Morocco, Mozambique, Norway, Paraguay, Sri Lanka, Ukraine, Vietnam
Appendix 2 MIGA-EIU Political Risk Survey 2012
The data provided herein are based on a survey conducted on behalf of MIGA by the Economist Intelligence Unit (EIU). The survey, which was carried out in July/August 2012, contains the responses of 438 senior exec-utives from multinational enterprises investing in developing countries. Quota sampling was used to ensure that the industry and geographic composition of the survey sample approximates the composition of actual FDI outflows to developing countries: following a first round of responses to the questionnaire, additional email campaigns targeting respondents in specific industries or geographic locations were conducted until all demographic quotas were met. For some questions, percentages add up to more than 100 percent because of multiple selections.

MIGA WIPR REPORT 2012 | 59
2. What is your primary industry?
Financial sector
Business activities
Other services
Mining, quarrying, and petroleum
Utilities, transport, storage, and communications
Food, beverages, and tobacco
Electrical and electronic equipment
Other manufacturing
Electricity, gas, and water
Machinery and equipment
Chemicals and chemical products
Construction
Rubber and plastic products
Metals and metal products
Agriculture, hunting, forestry, and fishing
Health and social services
Motor vehicles and other transport equipment
Trade
Hotels and restaurants
Education
Wood and wood products
Textiles, clothing, and leather
Coke, petroleum products, and nuclear fuel
Public administration and defense
Community, social, and personal service activities
Publishing, printing, and reproduction of recorded media
Precision instruments
Non-metallic mineral products
0 10 20 30 40 50
Question 2. What is your primary industry?
Percent of respondents

60 | MIGA WIPR REPORT 2012
3. What are your organisation’s global annual revenues in US dollars?
$500m or less
$500m to $1bn
$1bn to $5bn
$5bn to $10bn
$10bn or more
0 10 20 30 40 50
Question 3. What are your organization’s global annual revenues?
Percent of respondents
Question 4a. In which region is your company headquarters located?
Percent of respondents
In which region is your company headquarters located?
Western Europe
North America
Asia-Pacific
Middle East and Africa
Eastern Europe
Latin America
0 10 20 30 40 50

MIGA WIPR REPORT 2012 | 61
Question 4b. In which country is your company headquarters located?
Percent of respondents
In which region is your company headquarters located?
United StatesUnited Kingdom
CanadaGermany
IndiaItaly
SwitzerlandFranceSpain
NetherlandsSingapore
BelgiumSweden
DenmarkFinland
PortugalChina
Hong Kong, SAR ChinaJapan
Malaysia
0 5 10 15 20 25
Others: Russian Federation, Australia, Greece, United Arab Emirates, Austria, Chile, Cyprus, Ireland, Poland, Turkey, Brazil, Croatia, Czech Republic, Indonesia, Islamic Republic of Iran, Nigeria, Norway, Oman, Pakistan, Romania, South Africa, Algeria, Azerbaijan, Bahrain, Belarus, British Virgin Islands, Brunei Darussalam, Cape Verde, Ecuador, Estonia, Isle of Man, Israel, Jamaica, Kenya, Luxembourg, Malta, Mauritius, Mexico, Monaco, Peru, Saudi Arabia, Seychelles, Slovenia, Sri Lanka, Tanzania, Thailand

62 | MIGA WIPR REPORT 2012
6. What are your main functional roles? Choose up to three.
General management
Strategy and business development
Finance
Risk
Operations and production
Marketing and sales
IT
Information and research
Customer service
Legal
R&D
Supply-chain management
Procurement
Human resources
Other
0 10 20 30 40 50
5. Which of the following best describes your job title
Board member
CEO/President/Managing director
CFO/Treasurer/Comptroller
CIO/Technology director
Other C-level executive
SVP/VP/Director
Head of business unit
Head of department
Manager
Other
0 10 20 30 40 50
Question 5. Which of the following best describes your job title?
Percent of respondents
Question 6. What are your main functional roles? Choose up to three.
Percent of respondents

MIGA WIPR REPORT 2012 | 63
7. In which developing countries is your firm presently investing?
ChinaIndiaBrazil
Russian FederationTurkey
MexicoSouth Africa
IndonesiaVietnamThailandMalaysia
ArgentinaPhilippines
ChileUkraine
Saudi ArabiaRomania
ColombiaEgypt, Arab Rep.
NigeriaPeru
KazakhstanPakistanBulgaria
SerbiaGhana
TanzaniaMorocco
KuwaitAlgeria
BahrainTunisia
Others*
0 10 20 30 40 50
* Others receiving five or more responses include: Iraq, Jordan, Angola, Bangladesh, Cambodia, Lebanon, Uruguay, Oman, Dominican Republic, Georgia, Guatemala, Panama, Lithuania, Belarus, Costa Rica, Jamaica, Albania, Honduras, Montenegro, Turkmenistan, Uganda, Bosnia and Herzegovina, El Salvador, Democratic Republic of Congo, Sudan, Uzbekistan, Armenia, Islamic Republic of Iran, Zambia, Yemen, Republic of Congo, Syrian Arab Republic, Madagascar
Question 7. In which developing countries is your firm presently investing?
Percent of respondents

64 | MIGA WIPR REPORT 2012
Question 8. In your opinion, which of the following factors in the next 12 months and in the next three years will pose the greatest constraint on investments by your company in developing countries?
Percent of respondentsQ8 on constraints to FDI rankings
0 10 20 30 40
12 months
Macroeconomic instability
Access to financing
Access to qualified staff
Political risk
Infrastructure capacity
Limited market opportunities
Corruption
Increased government regulationin the aftermath of the global financial crisis
Other
0 10 20 30 40
three years
Political risk
Macroeconomic instability
Access to qualified staff
Access to financing
Corruption
Infrastructure capacity
Limited marketopportunities
Increased government regulationin the aftermath of the global financial crisis
Other

MIGA WIPR REPORT 2012 | 65
Question 9b. How do you expect your company’s planned investments in emerging markets to change over the next three years compared with the previous three years?
Percent of respondents
9b. How do you expect your company’s planned investments in emerging markets to change over the next three years compared with the previous three years?
Increase substantially
(increase 20% or more)
Increase moderately
(increase more than 1% but less than 20%)
Stay unchanged
Decrease moderately
(decrease more than 1% but less than 20%)
Decrease substantially (decrease 20% or more)
Don’t know
0 10 20 30 40 50
Question 9a. How do you expect your company’s planned investments in emerging markets to change this year compared with last year?
Percent of respondents
9a. How do you expect your company’s planned investments in emerging markets to change this year compared with last year?
0 10 20 30 40 50
Increase substantially
(increase 20% or more)
Increase moderately
(increase more than 1% but less than 20%)
Stay unchanged
Decrease moderately
(decrease more than 1% but less than 20%)
Decrease substantially (decrease 20% or more)
Don’t know

66 | MIGA WIPR REPORT 2012
Question 10. In your opinion, which types of political risk are of most concern to your company when investing in emerging markets in the next 12 months and in the next three years?
Percent of respondents
10a. In your opinion, which types of political risk are of most concern to your company when investing in emerging markets in the next twelve months? Select up to three.
12 months
Adverse regulatory changes
Breach of contract
Transfer and convertibility restrictions
Civil disturbance
Non-honoring of government guarantees
Expropriation/nationalization
Terrorism
War
0 20 40 60 80 100
three years
Adverse regulatory changes
Breach of contract
Transfer and convertibility restrictions
Civil disturbance
Non-honoring of government guarantees
Expropriation/nationalization
Terrorism
War
0 20 40 60

MIGA WIPR REPORT 2012 | 67
Question 11. In your opinion, in the developing countries where your firm invests presently, how do each of the risks listed below affect your company?
Percent of respondents
11. In your opinion, in the developing countries where your firm invests presently, how do each of the risks listed below affect your company? Rate each risk on a scale of 1 to 5 where 1=Very high impact and 5=No impact
Transfer and convertibility restrictions
Breach of contract
Non-honoring of government guarantees
Expropriation/nationalization
Adverse regulatory changes
War
Terrorism
Civil disturbance
0 20 40 60 80 100
1 (Very high impact)2 3 4 5 (No impact)

68 | MIGA WIPR REPORT 2012
Question 12. In the past three years has your company experienced financial losses due to any of the following risks?
Percent of respondents
12. In the past 3 years has your company experienced financial losses due to any of the following risks? Select all that apply.
Breach of contract
Adverse regulatory changes
Transfer and convertibility restrictions
Civil disturbance
Non-honoring of government guarantees
Expropriation/nationalization
War
Terrorism
0 10 20 30 40 50
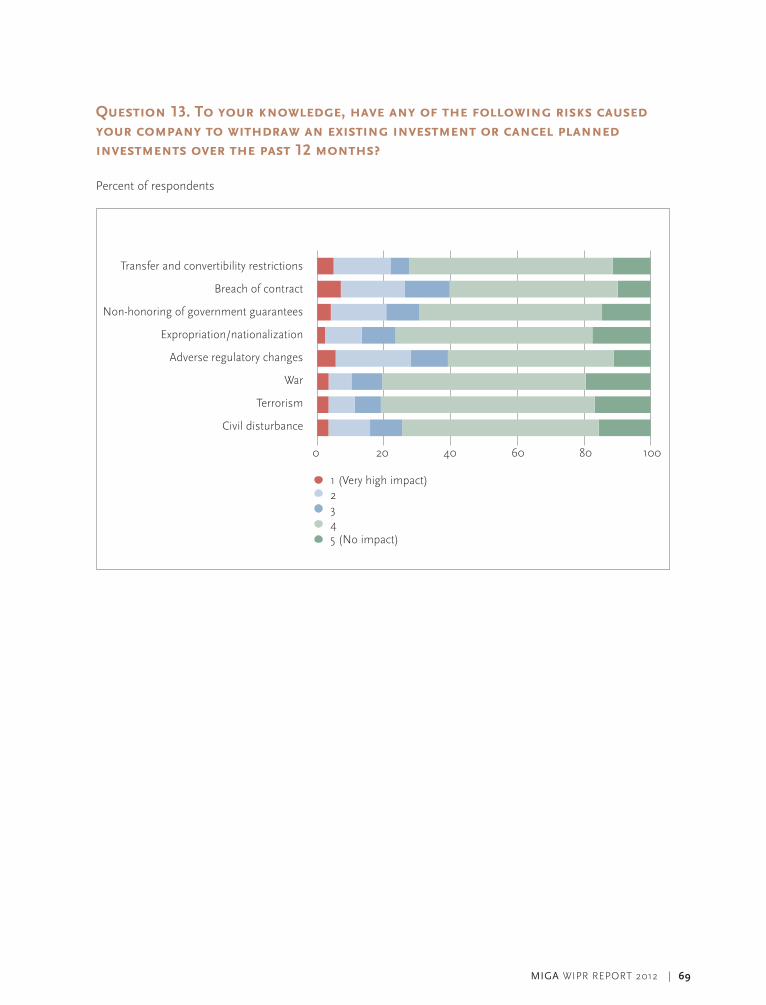
MIGA WIPR REPORT 2012 | 69
Question 13. To your knowledge, have any of the following risks caused your company to withdraw an existing investment or cancel planned investments over the past 12 months?
Percent of respondents
13. To your knowledge, have any of the following risks caused your company to withdraw an existing investment or cancel planned investments over the past 12 months? Select one answer for each risk.
Transfer and convertibility restrictions
Breach of contract
Non-honoring of government guarantees
Expropriation/nationalization
Adverse regulatory changes
War
Terrorism
Civil disturbance
0 20 40 60 80 100
1 (Very high impact)2 3 4 5 (No impact)

70 | MIGA WIPR REPORT 2012
Question 14. What tools/mechanisms does your company use to mitigate political risk when investing in developing countries? Select all that apply.
Percent of respondents14. What tools / mechanisms does your company use to mitigate political risk when investing in developing countries? Select all that apply.
Use of joint venture or alliance with local company
Political/economic risk analysis
Invested gradually while developing familiarity with the local environment
Use of third-party consultants
Scenario planning
Engagement with local communities
Engagement with government in host country
Develop close relationships with political leaders
Political risk insurance
Operational hedging (setting up multiple plants to spread risk)
Engagement with non-governmental organizations
Credit default swaps
Provide support to a well-connected political figure
Other
We don’t use any tools or products to mitigate political risk
Don’t know
0 20 40 60

MIGA WIPR REPORT 2012 | 71
Question 15. In your opinion, in the countries where your company invests, what are the most effective tools/mechanisms available to your firm for alleviating each of the following risks?
Percent of respondents
15. In your opinion, in the countries where your company invests, what are the most effective tools / mechanisms available to your firm for alleviating each of the following risks? Select one tool for each risk.
Transfer and convertibility restrictions
Breach of contract
Non-honoring of government guarantees
Expropriation/nationalization
Adverse regulatory changes
War
Terrorism
Civil disturbance
Other
0 20 40 60 80 100
Engage with local public entities Joint venture with local enterprises Risk analysis/monitor Relationships with key political leaders Political risk insurance Risk is not significant for my projects No existing tool can alleviate this risk

72 | MIGA WIPR REPORT 2012
Question 16. How would the following events affect your business’s risk of expropriation/breach of contract?
Percent of respondents
16. How would the following events affect your business’s risk of expropriation/breach of contract?
Sovereign debt downgrade(staying above investment grade)
Sovereign debt downgrade(below investment grade)
Sovereign debt default
Sovereign debt upgrade(staying above investment grade)
Sovereign debt upgrade(below investment grade)
0 20 40 60 80 100
Major increaseMinor increaseNo impactMinor decreaseMajor decreaseDon't know

MIGA WIPR REPORT 2012 | 73
Question 17. How would the following events affect your business’s risk of transfer restrictions/inconvertibility?
Percent of respondents
17. How would the following events affect your business’s risk of transfer restrictions/inconvertibility?
Sovereign debt downgrade(staying above investment grade)
Sovereign debt downgrade(below investment grade)
Sovereign debt default
Sovereign debt upgrade (staying above investment grade)
Sovereign debt upgrade (below investment grade)
0 20 40 60 80 100
Major increaseMinor increaseNo impactMinor decreaseMajor decreaseDon't know

74 | MIGA WIPR REPORT 2012
Question 18. How would the following events affect your business’s risk of non-honoring of sovereign financial obligations?
Percent of respondents
18. How would the following events affect your business’s risk of non-honouring sovereign financial obligations?
0 20 40 60 80 100
Sovereign debt downgrade(staying above investment grade)
Sovereign debt downgrade(below investment grade)
Sovereign debt default
Sovereign debt upgrade (staying above investment grade)
Sovereign debt upgrade (below investment grade)
Major increaseMinor increaseNo impactMinor decreaseMajor decreaseDon't know

MIGA WIPR REPORT 2012 | 75
Question 19. How does an increase in sovereign risk through other events (such as default episodes in euro zone, debt restructuring, commodity price shocks, etc.) affect your perception of the following political risks? When sovereign risk increases through other events (such as default episodes in euro-zone, debt restructuring, commodity price shocks, etc.), how does it generally affect your perception of risk in each of the fol-lowing areas?
Percent of respondents
19. How does an increase in sovereign risk through other events (eg, default episodes in euro-zone, debt restructuring, commodity price shocks, etc,) affect your perception of the following political risks? When sover-eign risk increases through other events (eg, default episodes in euro-zone, debt restructuring, commodity price shocks, etc,), how does it generally affect your perception of risk in each of the following areas?
Expropriation
Breach of contract
Transfer and convertibility restrictions
War and civil disturbance
0 20 40 60 80 100
Major increaseMinor increaseNo impactMinor decreaseMajor decreaseDon't know

76 | MIGA WIPR REPORT 2012
Question 20. How have the developments in the Arab World over the past year affected your current and future plans for investments in the Middle East and North Africa region?
Percent of respondents
20. How have the developments in the Arab World over the past year affected your current and future plans for investments in the Middle East and North Africa (MENA) region? Select one for each
Current investments:Arab Spring countries
Current investments:All other Middle East
and North Africa
Planned/future investments:Arab Spring countries
Planned/future investments:All other Middle East
and North Africa
0 20 40 60 80 100
IncreaseNo changeWithdrewDon't know

MIGA WIPR REPORT 2012 | 77
Question 21a. How have the developments in the Arab World over the past year changed your perception of the following types of political risk in the Arab Spring countries?
Percent of respondents
21a
0 10
Major increase in perceived riskMinor increase in perceived riskNo impactMinor decrease in perceived riskMajor decrease in perceived riskDon't know
3020 40 50 60 70 80 90 100
Expropriation
Breach of contract
Transfer andInconvertibility restrictions
Non-honoring ofsovereign financial
obligations
Adverse regulatorychanges
War
Civil disturbance
Terrorism

78 | MIGA WIPR REPORT 2012
Question 21b. How have the developments in the Arab World over the past year changed your perception of the following types of political risk in the Middle East and North African region? - All other Middle East and North African Countries
Percent of respondents
21bin percentage
0 10 20 30 40 50 60 70 80 90 100
Major increaseMinor increaseNo impactMinor decreaseMajor decreaseDon't know
Expropriation
Breach of contract
Transfer andconvertibility restrictions
Non-honoring ofsovereign financial
obligations
Adverse regulatorychanges
War
Civil disturbance
Terrorism

MIGA WIPR REPORT 2012 | 79
Question 22. Which of the following would be your primary reason for investing more or reinvesting in the Middle East and North Africa?
Percent of respondents
22
Increased marketopportunities
One year of political stability
Improvedmacroeconomic stability
Decrease in corruption
More favorablegov't regulations
Increased access tofinancing
Improvedinfrastructure capacity
Increased access toqualified staff
Other
50 10 15 20 25 30 35 40

80 | MIGA WIPR REPORT 2012
Appendix 3 Overview of the PRI Market
The PRI market includes three broad categories of providers and covers both export or trade credit and investment insurance. For the purposes of this report, PRI refers to investment insurance. The public PRI market comprises both national and multilateral PRI providers. The private market’s PRI falls into two main categories: (i) political risk activities similar to those of public and multilateral insurers, such as coverage for investments in developing countries against expropriation, political violence, and other such risks; and (ii) developing-country non-payment insurance covering contract frustration and default by governments.
Public PRI Providers: They comprise national export credit agencies and investment insurance entities. They focus on cross-border trade and investment, generally for constituents in their own countries.
Multilaterals: These include the African Trade Insurance Agency, the Asian Development Bank, the Inter-American Development Bank, the Inter-Arab Investment Guarantee Corporation, the Islamic Corporation for the Insurance of Investments and Export Credit, and MIGA. The World Bank, the Asian Development Bank, and the Inter-American Development Bank also provide risk-mitigation instruments, such as partial risk guarantees.a
Private PRI Providers: The majority of private insurers are based in three insurance centers—London, Bermuda, and the United States (primarily New York City)—and several of the larger insurers have offices in Singapore; Hong kong SAR, China; and Australia (Sydney), among other places. As well as traditional PRI for equity investment, the private market offers protection for a wide variety of payment risks in developing countries, either for political perils alone, or comprehensive non-payment cover. Brokers play an important role in pro-moting and sourcing PRI for the private market. This market segment is dynamic: over the past year, some players have exited the PRI market, while new entrants have appeared.
The Reinsurers: Reinsurance companies write PRI-related coverage for both trade and investment. Reinsurance is an underlying factor driving both pricing and capacity in the private market. Some of the top reinsurers include Munich Re and Hannover Re of Germany, Swiss Re of Switzerland, and Berkshire Hathaway/General Re of the United States. Export credit agencies and multilaterals also participate as reinsurers of PRI, although on a smaller scale.
The Berne Union: The Berne Union was founded in 1934 in order to promote international acceptance of sound principles in export credit and investment insurance and to exchange information relating to these activities. Today, the Berne Union has 86 members, including Prague Club members, comprising mainly export credit agencies, multilateral organizations, and private insurers.
The Berne Union plays an important role in bringing together the public and private insurers to enhance coop-eration and information sharing. Members meet on a regular basis to discuss industry trends and challenges. In recent years, there has been a concerted effort on the part of the Berne Union Secretariat to promote trans-parency and disclosure in the industry and to represent member interests in order to promote global trade and investment.
Lloyd’s: An insurance “marketplace” where members join together to insure political risks for cross-border investment, such as confiscation of property, inconvertibility of currency, and political violence. Only a small number of Lloyd’s syndicates offer investment insurance.
a A partial risk guarantee covers private lenders against the risk of government failure to honor contractual obligations relating to private projects.
b The Berne Union’s Prague Club was started in 1993 with funding from the European Bank for Reconstruction and Development. It is an information exchange network for new and maturing insurers of export credit and investment. The Prague Club supports members’ efforts to develop their export credit and investment insurance facilities by hosting technical discussions at twice-yearly meetings, as well as ad hoc information exchanges. A number of Prague Club members have gone on to meet the requirement for full Berne Union membership.
Sources: Berne Union; Lloyd’s

MIGA WIPR REPORT 2012 | 81
Berne Union Members
Company CountryYear
joined
ASEI Indonesia 1999
ASHRA Israel 1958
CESCE Spain 1972
COFACE France 1948
COSEC Portugal 1977
ECGC India 1957
ECIC, SA South Africa 2004
EDC Canada 1947
EFIC Australia 1957
EGAP Czech Republic 1996
EkF Denmark 1997
EkN Sweden 1947
EXIMBANkA SR Slovak Republic 2004
EXIM J Jamaica 1983
FINNvERA Finland 1964
GIEk Norway 1951
HkEC Hong kong SAR, China 1969
kSURE korea, Rep. of 1977
kUkE Poland 1999
MEHIB Hungary 2000
MEXIM Malaysia 1985
NEXI Japan 1970
ODL Luxembourg 2011
OEkB Austria 1955
ONDD Belgium 1954
OPIC United States 1974
PWC Germany 1974
SACE Italy 1959
SBCE Brazil 2001
SERv Switzerland 1956
SID Slovenia 1998
SINOSURE China 1996
SLECIC Sri Lanka 1984
TEBC Taiwan, Rep. of China 1996
THAI EXIMBANk Thailand 2003
TURk EXIMBANk Turkey 1992
US EXIMBANk United States 1962
Uk Export Finance United kingdom 1934
Company CountryYear
joined
Private
ATRADIUS Netherlands 1953
CGIC South Africa 1958
AIG United States 1999
ECICS Singapore 1979
EH GERMANY Germany 1953
FCIA United States 1963
HISCOX Bermuda 2008
SOvEREIGN Bermuda 2001
ZURICH United States 2001
Multilateral
ICIEC Multilateral 2007
MIGA Multilateral 1992
ATI Multilateral 2012
Berne Union and Prague Club Members
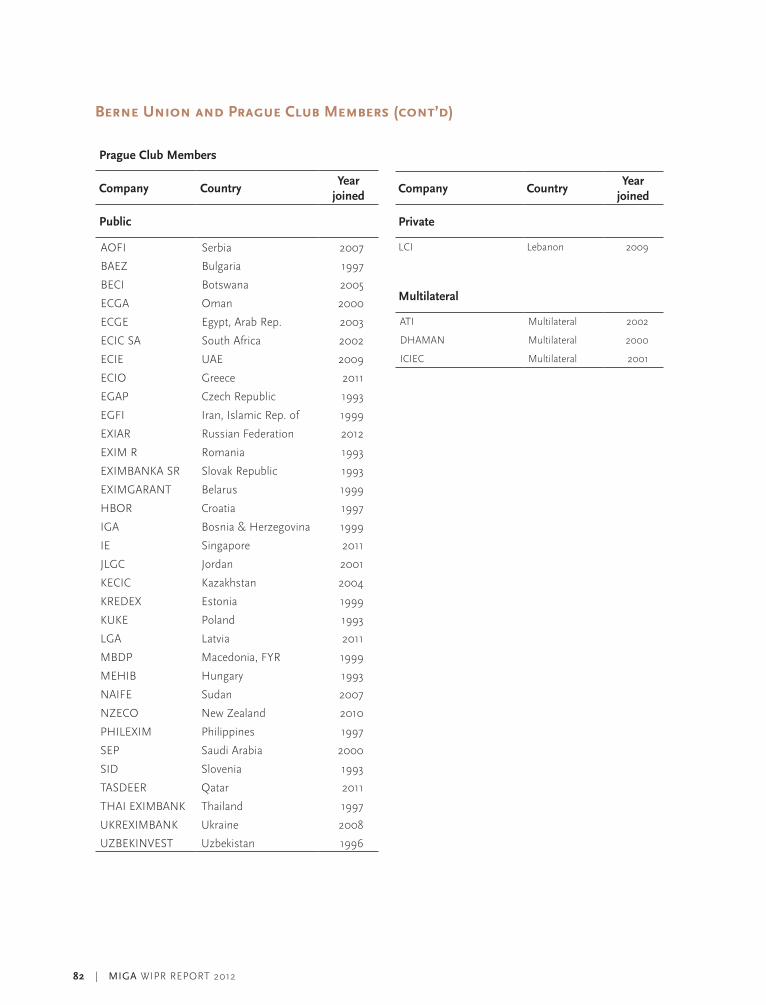
82 | MIGA WIPR REPORT 2012
Berne Union and Prague Club Members (cont’d)
Prague Club Members
Company CountryYear
joined
Public
AOFI Serbia 2007
BAEZ Bulgaria 1997
BECI Botswana 2005
ECGA Oman 2000
ECGE Egypt, Arab Rep. 2003
ECIC SA South Africa 2002
ECIE UAE 2009
ECIO Greece 2011
EGAP Czech Republic 1993
EGFI Iran, Islamic Rep. of 1999
EXIAR Russian Federation 2012
EXIM R Romania 1993
EXIMBANkA SR Slovak Republic 1993
EXIMGARANT Belarus 1999
HBOR Croatia 1997
IGA Bosnia & Herzegovina 1999
IE Singapore 2011
JLGC Jordan 2001
kECIC kazakhstan 2004
kREDEX Estonia 1999
kUkE Poland 1993
LGA Latvia 2011
MBDP Macedonia, FYR 1999
MEHIB Hungary 1993
NAIFE Sudan 2007
NZECO New Zealand 2010
PHILEXIM Philippines 1997
SEP Saudi Arabia 2000
SID Slovenia 1993
TASDEER Qatar 2011
THAI EXIMBANk Thailand 1997
UkREXIMBANk Ukraine 2008
UZBEkINvEST Uzbekistan 1996
Company CountryYear
joined
Private
LCI Lebanon 2009
Multilateral
ATI Multilateral 2002
DHAMAN Multilateral 2000
ICIEC Multilateral 2001
MIGA WIPR REPORT 2012 | 83
Lloyd’s Syndicates
Lloyd’s Syndicates
Company
ACE Global Markets
Amlin
Ark
Ascot
AspenBeazley
Canopius
Catlin
Chaucer
Hardy
Hiscox
Jubilee
kiln
Liberty Syn. Mgmt.
Markel
Marketform
MAP
Novae
Starr PFR Consortium
O'Farrell
Pembroke
Talbot
XL

84 | MIGA WIPR REPORT 2012
InsurIng Investments r ensurIng opportunItIes

Multilateral Investment Guarantee Agency World Bank Group1818 H Street, NW Washington, DC 20433 USA
t. 202.458.2538f. 202.522.0316
www.miga.org/wipr