2013 14 annual accountability report florida agricultural ... · this ui wage data does not ... bog...
TRANSCRIPT

2013‐14
Annual Accountability Report
STATE UNIVERSITY SYSTEM of FLORIDA Board of Governors
FLORIDA AGRICULTURAL
AND MECHANICAL
UNIVERSITY

1
Annual Accountability Report 2013-2014
FLORIDA A&M UNIVERSITY
APPROVED BY BOT 1‐14‐2015
TABLE OF CONTENTS EXECUTIVE SUMMARY DASHBOARD p. 2 KEY ACHIEVEMENTS p. 5 NARRATIVE p. 6
DATA TABLES SECTION 1. FINANCIAL RESOURCES p. 16 SECTION 2. PERSONNEL p. 20 SECTION 3. ENROLLMENT p. 21 SECTION 4. UNDERGRADUATE EDUCATION p. 25 SECTION 5. GRADUATE EDUCATION p. 34 SECTION 6. RESEARCH & ECONOMIC DEVELOPMENT p. 37

2
Annual Accountability Report 2013-2014
FLORIDA A&M UNIVERSITY
APPROVED BY BOT 1‐14‐2015
Dashboard
Headcount Enrollments
Fall 2013
% Total
2012-2013 % Change Degree Programs Offered 2012 Carnegie Classifications
TOTAL 10,738 100% -11% TOTAL (as of Spring 2014) 95 Basic:
Doctoral/Research Universities White 525 5% -13% Baccalaureate 52
Hispanic 514 2% -6% Master’s 28 Undergraduate Instructional Program:
Professions plus arts & sciences, some graduate Black 9,711 90% -11% Research Doctorate 12
Other 288 3% 1% Professional Doctorate 3 Graduate Instructional Program:
Doctoral, professions dominant Full-Time 9,572 89% -11% Faculty
(Fall 2013) Full-Time
Part- Time Part-Time 1,166 11% -7%
Size and Setting: Large four-year, highly residential Undergraduate 8,819 82% -11% TOTAL 550 1
Graduate 1,779 17% -10% Tenure & Ten. Track 388 0 Community Engagement:
n/a Unclassified 140 1% -5% Non-Tenured Faculty 162 1
DEGREE PRODUCTIVITY AND PROGRAM EFFICIENCY
1,243
1,560
0200400600800
1,0001,2001,4001,6001,800
2009-10 2013-14
Bachelor's Degrees Awarded
348312280
335
050
100150200250300350400450
2009-10 2013-14
Graduate Degrees Awarded
Master's Doctoral
77%
1%
96%
68%
1%
95%
0% 20% 40% 60% 80% 100%
Pell
Hispanic
Black
2009-10 2013-14
Bachelor's Degrees by Group
41% 39%
61%
55%47%
60%
30%35%40%45%50%55%60%65%70%75%
2010 2011 2012 2013 2014*
6yr FTIC 4yr AA Transfers 5yr Other Transfers
Graduation Rates by Student Type
LAST YEAR OF COHORT
COHORT SIZES FOR COHORTS ENDING IN 2014
33% 35%
0%
25%
50%
2012-13 2013-14
Bachelor's Degrees Without Excess Hours
Note*: 2014 data is preliminary until March 1st.

3
Annual Accountability Report 2013-2014
FLORIDA A&M UNIVERSITY
APPROVED BY BOT 1‐14‐2015
Dashboard DEGREES AWARDED IN PROGRAMS OF STRATEGIC EMPHASIS
RESEARCH AND COMMERCIALIZATION ACTIVITY
RESOURCES
6
71
114
304
314
5
80
97
220
210
0 100 200 300 400
Global
Education
Gap Analysis
STEM
Health
2009-10 2013-14
Bachelor's Degrees Awarded inAreas of Strategic Emphasis
0
0
11
48
207
0
0
21
57
207
0 100 200 300
Global
Gap Analysis
Education
STEM
Health
2009-10 2013-14
Graduate Degrees Awarded inAreas of Strategic Emphasis
98%90% 88% 86% 80%
$27.0
$53.5 $53.3 $52.3 $51.1
$0$10$20$30$40$50$60
2008-09 2009-10 2010-11 2011-12 2012-13
EXTERNAL INTERNAL (State & Univ.)
Total R&D Expenditures ($ Millions)with Percent Funded Externally
$7.5
0
2
4
6
8
10
$0$1$2$3$4$5$6$7$8
2008-09 2009-10 2010-11 2011-12 2012-13
Lice
nses
Exe
cute
d
Lice
nsin
g R
even
ue ($
1000
s)
Licensing Income Licenses
Licenses and Licensing Revenue
2009-10 2010-11 2011-12 2012-13 2013-14
TOTAL $14,850 $14,515 $13,897 $14,013 $17,803
TUITION $5,144 $4,917 $5,501 $6,751 $7,528
STATE $9,706 $9,599 $8,396 $7,262 $10,274
65% 66% 60% 52% 58%
$14,850 $14,515 $13,897 $14,013 $17,803
$0
$5,000
$10,000
$15,000
$20,000
Appropriated Funding Per Actual US FTE
Note: The Programs of Strategic Emphasis were revised by the Board of Governors (11/2013), these graphs report the new categories.
Note: Tuition is the appropriated budget authority, not the amount actually collected. This tuition data includes state supported financial aid and does not include non-instructional local fees. State includes General Revenues, Lottery and Other Trust funds (i.e., Federal Stimulus for 2010-11 and 2011-12 only). Student FTE are actual (not funded) and based on the national definition.

4
Annual Accountability Report 2013-2014
FLORIDA A&M UNIVERSITY
APPROVED BY BOT 1‐14‐2015
Dashboard POST-GRADUATION METRICS
65% 69%
0%
20%
40%
60%
80%
2011-12GRADUATES
2012-13GRADUATES
Percent of Bachelor's Graduates EmployedFull-time in Florida or Continuing their Education
One Year After Graduation
$22,300 $23,300 $22,900
$28,400 $30,000 $28,800
$38,100 $39,400 $38,600
$0
$10,000
$20,000
$30,000
$40,000
$50,000
2010-11GRADUATES
2011-12GRADUATES
2012-13GRADUATES
Wages of Full-time Employed in FloridaBaccalaureates One Year After Graduation
25th, 50th and 75th PercentilesNotes: Wage data is based on Florida’s annualized Unemployment Insurance (UI) wage data for those graduates who earned more than a full-time employee making minimum wage in the fiscal quarter a full year after graduation. This wage data includes graduates who were both employed and enrolled. This UI wage data does not include individuals who are self-employed, employed out of state, employed by the military or federal government, or those without a valid social security number. These data account for 42%, 39% and 39% of the total graduating class for 2010-11, 2011-12, and 2012-13 respectively. Wages rounded to nearest hundreds.
Notes: Percentages are based on the number of recent baccalaureate graduates who are either employed full-time in Florida (based on FETPIP data) or continuing their education in the U.S. (based on the National Student Clearinghouse data). Full-time employment is based on those who earned more than a full-time (40hrs a week) worker making minimum wage. Due to limitations in the data, the continuing enrollment data includes any enrollment the following year regardless of whether the enrollment was post-baccalaureate or not. These data account for 89% and 90% of the total graduating class for 2011-12 and 2012-13, respectively. BOG staff are actively working on adding non-Florida employment data to this measure for future reports.

5
Annual Accountability Report 2013-2014
FLORIDA A&M UNIVERSITY
APPROVED BY BOT 1‐14‐2015
Key Achievements (2013 –2014)
STUDENT AWARDS/ACHIEVEMENTS
1. Renee Gordon, a senior mechanical engineering doctoral student, received the prestigious Fulbright award to study sustainability in Nigeria.
2. The student publication Journey magazine was named “Best College Magazine of the South” by the Southeastern Journalism Conference.
3. Jan Wishart, senior Health Informatics and Information Management student, received the American Health Informatics and Information Management Association Student Triumph Award which recognizes the top student in the nation who has made a significant difference in the health information management profession.
FACULTY AWARDS/ACHIEVEMENTS 1. Biochemistry professor Ngozi Ugochukwu, Ph.D., was named a Fulbright Scholar. She will conduct
research in Nigeria on bioactive compounds and their role as leads for drug discovery, and uses for traditional medicine in diabetes therapy.
2. Kinfe Redda, Ph.D., Vice President for Research and Professor of Medicinal Chemistry in the College of Pharmacy and Pharmaceutical Sciences, was named HBCU Male Faculty of the Year, July, 2013.
3. David H. Jackson, Jr., Ph.D., Professor of History in the College of Social Sciences, Arts and Humanities was honored with the American Historical Association’s 2013 Equity Award.
PROGRAM AWARDS/ACHIEVEMENTS 1. The School of Journalism & Graphic Communication entered into an agreement with a private entity
operating the nation’s only black-owned cable news network to host The Black Television News Channel. 2. Licensure exam pass rates in two programs are particularly noteworthy. The Institute of Public Health
secured a 100 percent pass rate on the 2013 Certified Education Health Specialist credentialing exam and surpassed the national average score of 71.56 percent and the Occupational Therapy licensure exam first time pass rate increased from 40 percent in 2012 to 92 percent in 2013.
3. The College of Law was recognized as Number One among the "10 Best Bargain Law Schools" by On Being a Black Lawyer in the 2013 edition of The Black Student's Guide to Law Schools.
RESEARCH AWARDS/ACHIEVEMENTS 1. College of Pharmacy and Pharmaceutical Sciences Associate Dean for Research and Graduate Studies,
Karam F.A. Soliman, Ph.D., secured a five-year grant totaling more than $14 million to support the Research Centers in Minority Institutions.
2. The College of Science and Technology recently received a $1.6 million grant from the National Science Foundation to redesign the instructional approaches used to teach the undergraduate STEM courses.
3. FAMU received a $1,351,400 grant from the National Cancer Institute and the National Institute of General Medical Sciences of the National Institutes of Health to support groundbreaking research that is poised to uncover a more direct and effective method for treating lung cancer.
INSTITUTIONAL AWARDS/ACHIEVEMENTS 1. FAMU was named a “Best in the Southeast College” by the Princeton Review for 2014. 2. FAMU was recognized by U.S. News & World Report as number one among public Historically Black
Colleges in Universities (HBCUs). 3. FAMU ranked #3 in the nation in the New Social Mobility Index for Facilitating Economic Opportunity for
Underserved Students, ahead of institutions such as the University of California (UC)-Berkley and UC-Davis.

6
Annual Accountability Report 2013-2014
FLORIDA A&M UNIVERSITY
APPROVED BY BOT 1‐14‐2015
Narrative Removal of SACSCOC Probation – December 2013 At its annual meeting in Atlanta, Georgia in December 2013, the Southern Association of Colleges and Schools Commission on Colleges (SACSCOC) lifted the 12-month probation status placed upon Florida Agricultural and Mechanical University (FAMU) in December 2012. Additionally, no further reports or follow-ups are required from the university by the Commission. The decision by SACSCOC to remove the probation sanction signifies that FAMU is in compliance with all the standards of the regional accrediting body. The University worked hard to eradicate problems and to put in place measures to improve its operational processes.
Teaching and Learning STRENGTHEN QUALITY AND REPUTATION OF ACADEMIC PROGRAMS AND UNIVERSITIES
During the 2013-14 academic year, Florida Agricultural and Mechanical University (FAMU) continued to focus on its top priority to enhance teaching and learning, thus increasing student retention and graduation rates. Since the University’s Student Retention and Debt Reduction Action Plan was approved by the FAMU Board of Trustees and Florida Board of Governors in September 2013, the University has fully implemented all initiatives. The following are a few of the achievements resulting from these initiatives, during the 2013-14 academic year:
o Freshmen Students Retained with 2.0 GPA: The percent of freshmen students retained by the University with a GPA of 2.0 or higher increased from 54% in 2010-11 to 69% in 2012-13, to 70% in 2013-14.
o Student Debt/Financial Literacy Initiative: Three (3) year Student Default Rate declined from 18.9 (2011) to 14.6 (2014).
o Career Development Initiative: First-time-in-college (FTIC) students without a declared major reduced from 361 for Fall 2013 to 76 for Spring 2014.
o Academic Advisement: Academic Advisors within the Office of University Retention had a total of 67,061 times of contact with their advisees via e-mail, voice or face-to-face during the 2013-14 academic year. The advisors also utilized new academic technologies (i.e., Black Board Analytics, Black Board Connect, Academic Advisement Module) in retention efforts. o Tutorial Services: All Tutorial Labs - In Fall 2013, a total of 1,757 first-time in-
college students utilized the tutorial labs and their overall course passing rate was 82.4%, which was a statistically significant higher passing rate than the first-time in college students who did not utilize tutorial labs.
o Academic Success Course: The Academic Success Course (SLS-1122) was implemented in Spring 2014 to provide assistance to students who have difficulties achieving academic success.
o Academic Success Live Television Show – The Academic Success Live television show (FAMU TV 20) was created to increase student awareness regarding the Office of University Retention’s academic support programs and services.
The College of Agriculture and Food Sciences Veterinary Technology Program received initial accreditation by the American Veterinary Medical Association Committee on Veterinary Technician Education and Activities (CVTEA) in June 2014.

7
Annual Accountability Report 2013-2014
FLORIDA A&M UNIVERSITY
APPROVED BY BOT 1‐14‐2015
In 2013-14, FAMU programs in Cardiopulmonary Science (B), Computer Science (B) and Doctor of Physical Therapy (DPT) were reaccredited. FAMU percentage of eligible programs with specialized accreditation is 86.4%.
In 2013-14, the Board of Trustees approved two new baccalaureate level programs in Environmental Studies (BA/BS), and Interdisciplinary Studies (BA/BS), and one new graduate program in Curriculum and Instruction (M.Ed.). The BS in Physical Education was redesigned as the Health, Leisure, and Fitness Studies (BS) with concentrations in Aquatics Management, Dance Studies, Exercise Science & Coaching, and Health Promotion. Physical Education teacher certification remained as a track under the new degree.
FAMU received an $85 million donation of state-of-the-art software technology from Siemens, targeted primarily for students in the FAMU-FSU College of Engineering. This technology will allow students to train using the same technology as major manufacturers around the world.
The School of Allied Health Sciences Division of Occupational Therapy implemented a variety of new strategies to increase the success of graduates as they enter the profession. As a result, the first time occupational therapy licensure exam rate pass rate increased from 40% in 2012 to 92% in 2013.
To contribute to the various efforts at FAMU in reducing student debt, the University was awarded a grant by the Council of Graduate Schools (CGS) to participate as a research partner in the initiative “Enhancing Student Financial Education”, co-sponsored by TIAA-CREF. The FAMU SFE Program will train and mentor graduate students across a variety of disciplines to conduct research in the areas of financial literacy, debt management, paying for college, and financial decision-making within minority and low-income communities. FAMU was one of fifteen universities funded.
INCREASE DEGREE PRODUCITIVITY AND PROGRAM EFFICIENCY
The University continued to build upon its initiatives to significantly increase online courses and academic degree offerings. Strategies included incentivizing and supporting faculty in offering additional distance learning courses and programs, as well as partnering with experienced vendors for marketing and other support. During the 2013 - 2014 academic year, the fully online degree programs yielded retention rates of 75 percent for the MPH and 100 percent for both the MSN and MBA programs. FAMU offered ten general education courses online with a total enrollment of 613 students for the 2013-2014 academic year. The University received a non-recurring legislative allocation of $1 million for the 2014-2015 academic year. The allocation is allowing the institution to make significant investments in faculty development for online course conversion, online student support services, technology and personnel. The funds will also allow the institution to increase its online course offerings in the STEM and liberal arts disciplines by converting approximately fifty high demand courses to the online modality of instruction, as well as strengthening marketing efforts.
In its initial cohort, the College of Pharmacy and Pharmaceutical Sciences, Crestview, Florida instructional site, 27 students were accepted into the entire first professional year curriculum in the PharmD program and 18 students were offered the entire second professional year curriculum.
The FAMU-FSU College of Engineering ranked #12 in the nation for bachelor degrees awarded to African Americans, 26th in the nation for Number of Civil Engineering degrees awarded and #5 in the nation for African American tenured/tenure track faculty as reported by ASEE Engineering by the Numbers 2013 with 357 schools reporting.
The School of Allied Health Sciences continues to be one of the largest producers of African American baccalaureate degree graduates in Cardiopulmonary Science, Health Care Management, Health Informatics and Information Management and Occupational Therapy.

8
Annual Accountability Report 2013-2014
FLORIDA A&M UNIVERSITY
APPROVED BY BOT 1‐14‐2015
INCREASE THE NUMBER OF DEGREES AWARDED IN S.T.E.M. AND OTHER PROGRAMS OF STRATEGIC EMPHASIS
FAMU and FSU were awarded a combined $2.9 million in April 2014 as part of the Florida Board of Governors (BOG) Targeted Educational Attainment (TEAm) Grant Program for the project entitled “Expanding North Florida’s IT Career Pathways” in collaboration with FSU. FAMU’s portion of the award ($770,000) will be used by the College of Science and Technology to support initiatives to recruit and graduate increased numbers of students in the high-demand areas of computer science and information technology (IT).
The College of Science and Technology (CST) established a STEM Faculty Development Program (FDP) where six on-campus workshops were held during the 2013-14 year to increase faculty use of effective instructional methods, such as using active learning strategies. The FDP had a positive impact on faculty teaching during the 2013-14 year as evidenced by an overall 12% increase in faculty use of active learning strategies in comparison to the previous year.
The College of Science and Technology implemented a Science Seminar Series for undergraduate STEM students during the 2013-14 academic year. Two seminars were held during the year in which external speakers visited the campus to speak with the students about pursuing graduate STEM degrees and STEM careers in industry. Student Survey Results:
o Ninety-six percent (96%) of students surveyed indicated the activity had a positive impression on their perception of science.
o Seventy-eight percent (78%) of students surveyed indicated the activity increased their interest in pursuing a STEM career.
FAMU and Tallahassee Community College (TCC) have partnered for a $2,193,365 grant from the National Institutes of Health Bridges to the Baccalaureate Program in Biomedical Sciences. The goal of the FAMU-TCC Bridges project is to cultivate a program that increases the number of underrepresented minorities — African Americans, Latinos and Native Americans — attending TCC, and equips them with the knowledge and skills necessary to attain an Associate in Arts degree. Additionally, the program seeks to propel these students toward obtaining an entry-level degree in the biomedical sciences at FAMU.
The College of Science and Technology (CST) was awarded $1.6M in August 2013 from the National Science Foundation to implement the project entitled “Student-Centered Active Learning and Assessment Reform (SCALAR)”. The CST is using the SCALAR project to implement a series of innovative curricular and co-curricular initiatives that will ultimately position FAMU as a national leader in STEM education. Project highlights from 2013-14 include:
o Eight (8) lower-division STEM courses (biology, chemistry, computer science, and physics disciplines) were redesigned to include effective student learning outcomes, active learning instructional methods, and effective strategies for assessing critical thinking skills.
o A Learning Assistant (LA) program was established to provide students with additional tutorial assistance and academic support.
Dr. Charles Magee, Professor in the College of Agriculture and Food Sciences, secured an $800,000 grant to award student scholarships in the Biological and Agricultural Systems Engineering program from the Natural Resources Conservation Services (NRCS) for the next four years (2014-2018), one of the largest awards given to a program by NRCS.
Three FAMU professors, FAMU-FSU College of Engineering Associate Professor Clayton Clark, Ph.D., School of Business and Industry’s Assistant Professor Jason Black, Ph.D., and College of Pharmacy’s Associate Professor Tiffany Wilson-Ardley secured a three-year grant for more than $700,000 from the U.S. Department of Education to assist FAMU in attracting underrepresented high school students into its Program of Excellence in Science, Technology, Engineering and Mathematics or PE-STEM.

9
Annual Accountability Report 2013-2014
FLORIDA A&M UNIVERSITY
APPROVED BY BOT 1‐14‐2015
Scholarship, Research and Innovation STRENGTHEN QUALITY AND REPUTATION OF SCHOLARSHIP, RESEARCH AND INNOVATION
Dr. Karam Soliman, Professor and Associate Dean for Research and Graduate Studies in the College of Pharmacy and Pharmaceutical Sciences secured a five‐year grant totaling more than $14 million to support FAMU Research Centers in Minority Institutions (RCMI). The grant was awarded by the U.S. Department of Health & Human Service’s National Institute of Health. The FAMU RCMI was originally established in 1985, and serves as a hub for drug research and discovery with a mission of inventing and improving methods to close the gap in health disparities among minorities, and more specifically the African‐American community. The grant dollars will help FAMU, through the RCMI, continue its role as a top producer of patents among historically black colleges and universities (HBCUs), and will also play a significant role in supporting on going innovations related to cancer treatment, prognosis and prevention, as well as treatments for degenerative diseases.
Three grants worth more than $1.3 million from the United States Department of Agriculture (USDA) National Institute of Food and Agriculture (NIFA) was awarded to three FAMU investigators. FAMU was among a select group of land-grant institutions whose proposals were accepted under the grant program.
FAMU has been awarded a $100,000 grant by the National Science Foundation (NSF) Division of Materials Research to fund a project entitled “EAGER: Magnetic Interrogation of Mesoscale Materials,” pilot program housed at the National High Magnetic Field Laboratory, Tallahassee, FL. EAGER is a materials research program that brings together the disciplines of physics, chemistry, biology and engineering.
Three top researchers at FAMU have learnt that their federal funding to study health disparities — one of the largest grants in university history — has been renewed for another year. To date, FAMU has received almost $69 million since 1985 from the U.S. Department of Health & Human Services' National Institutes of Health to fund the university's Research Center in Minority Institutions. FAMU is one of 20 schools nationwide participating in the funded research.
Below are just a few of the highlights of FAMU faculty and student research efforts during the 2013-14 academic year:
o Yuch-Ping Hsieh, Ph.D., a professor of Wetland Ecology in the Center for Water and Air Quality at the College of Agriculture and Food Sciences (CAFS), most recent research effort is in the study of forest fire on air quality. Hsieh is one of only two members among the faculty of the universities in the Southeastern U.S. selected to serve on the Agricultural Air Quality Task Force of the United States Department of Agriculture (USDA). Hsieh is the inventor of the diffusion method for reduced sulfur analysis, direct organic sulfur analysis in environmental samples, multi-element (C, N, S and H) scanning thermal analysis and other ecological methods that is now used by many ecologists and biogeochemists and holds the patent of the co-invention of the MicroRespirometer technology.
o Research team of Viticulture & Product Development Lab at the Center for Viticulture and Small Fruit Research (Faculty: Dr. Anthony Ananga, Dr. Vasil Gorgiev and Dr. Violeta Tsolova; Graduate student: Ms. Lillian Oglesby; Undergraduate students: Jasmine Hall and Philip Corbiere) cloned and deposited in the public gene bank eight new gene sequences from muscadine grapes.
o FAMU-FSU College of Engineering student, Barry Darius was one of ten students selected from nation-wide applicants to participate in the California Polytechnic University’s 2013 summer REU program. REU is Research for Undergraduate Experience program, funded by the National Science Foundation. It was held at California

10
Annual Accountability Report 2013-2014
FLORIDA A&M UNIVERSITY
APPROVED BY BOT 1‐14‐2015
Polytechnic University in San Luis Obispo, California. This was a ten week internship that focused its work on projects at the Global Waste Research Institute.
o Graduate student, Latasha Tanner, in the College of Agriculture and Food Sciences ranked No. 3 in the nation in the MANRRS graduate poster competition for her research on the impact of invasive beetles in the Apalachicola National Forest. Her research uncovered millions of dollars’ worth of possible damage to Florida’s forestry and agricultural industries.
o Doctoral candidate, Daryl Sibble, in the School of the Environment, was awarded a $45,000 scholarship from the National Oceanic and Atmospheric Administration (NOAA) to conduct research on the application of fertilizer in agriculture, specifically fertilizer that uses ammonium nitrate, which can be a threat to human health. Sibble was one of only two students to receive NOAA’s first Educational Partnership Program Graduate Research and Training Scholarship.
INCREASE RESEARCH AND COMMERCIALIZATION ACTIVITY
The FAMU Division of Research (DoR) provided guidance and facilitated the process, management and commercialization of intellectual property generated by faculty, staff and students. In 2013-14, the following research efforts assisted the University’s approach to address and help resolve national and global challenges in medicine, science, agriculture and the environment:
Five Patents Awarded Dr. Seth Ablordeppey, Professor, College of Pharmacy and Pharmaceutical Sciences
received a patent for the Antifungal and Antiparasitic Indoloquinoline Derivatives. Drs. Mandip Sachdeva, Professor, and Punit Shah, Researcher in the College of Pharmacy
and Pharmaceutical Sciences received a patent for ReSurface Modified Multilayered Nanostructures for Dermal Delivery.
Drs. Kinfe Redda, Professor and Madhavi Gangapuram, Research Associate, in the College of Pharmacy and Pharmaceutical Sciences, received a patent for N-Aminotetrahydroisoquinolines as Anti-Cancer Agents.
Drs. Kinfe Redda, Professor and Madhavi Gangapuram, Research Associate, in the College of Pharmacy and Pharmaceutical Sciences, received a patent for N-Aminopyrrolylmethylterrahydropyridiens as Anti-Cancer Agents.
Drs. Karam Soliman, Professor Associate Dean for Research and Graduate Studies and Elizabeth Mazzio, Research Associate, in the College of Pharmacy and Pharmaceutical Sciences, received a patent for Herbal Composition and Method of Use for the Treatment of Cancer.
Recognizing Innovation and Commercialization In order to increase and recognize accomplishments in the research arena, FAMU now has two awards to encourage innovative research:
iSHOW. The Division of Research (FAMU-DOR) has sought to increase research and commercialization activity at FAMU by hosting its inaugural innovation showcase (iSHOW) on Friday, November 15, 2013 showcasing faculty, staff and students who are “innovating today for a better tomorrow.” This platform displayed extraordinary innovations from agriculture, human resources, natural, health, environmental, pharmaceutical and social sciences. November has been designated as Entrepreneurship Month with the growth of the nation’s economy linked in business start-ups by entrepreneurs being responsible for most of the new jobs created in the country.

11
Annual Accountability Report 2013-2014
FLORIDA A&M UNIVERSITY
APPROVED BY BOT 1‐14‐2015
Annual Principal Investigators’ Appreciation and Research of the Year Awards. As part of its efforts to enhance research activity, FAMU continues to recognize faculty for their respective research accomplishments annually at its Annual Principal Investigators’ Appreciation and Research of The Year Awards luncheon. During the 2013-14 event, the following faculty were recognized:
o Dr. Huijun Li, assistant professor, Department of Psychology, College of Social Sciences, Arts and Humanities received the Emerging Researcher Award.
o Dr. John Copperwood, associate professor of Medicinal Chemistry, College of Pharmacy and Pharmaceutical Sciences received the Research Excellence Award.
INCREASE COLLABORATION AND EXTERNAL SUPPORT FOR RESEARCH ACTIVITY
In 2013-14, the University received 192 awards totaling $42.5M and submitted 168 proposals totaling $83.3M from federal, state and private sponsors. FAMU research faculty has a network of collaborators and partners across various disciplines between academia, city, federal, industry, private and state entities. The FAMU Division of Research (DoR) continues to seek increase collaboration and external support for research activity through the formation of “Research Focus Groups” and invited company representatives to campus to explore collaborations with FAMU faculty, staff and students.
Ramesh Katam, Ph.D., assistant professor in the Molecular and Cellular Plan Biology Department in the College of Science and Technology collaborated research efforts with the National Institute of Genetics in Mishima City, Japan on Applications of Proteomics Research in Agricultural Crops. FAMU and the Japanese Institute collaborate with other institutions to conduct and discuss their diverse yet related research topics.
The School of the Environment (SoE) entered into MOUs with the University of Botswana’s International University of Science and Technology and The University of Miskolc, Hungary. The MOUs would enable the institutions to: 1) establish academic and scholarly cooperative linkage and collaboration that would be of mutual benefit to the two universities; 2) extend cooperation to academic areas that can support each other’s mandates and to promote scientific and technological development of the two universities as well as the sub-region, especially in the areas of energy, water, and the environment as a whole; 3) write joint proposals to support student training, faculty research activities, which may be supported by the exchange of scientists, scholars and technical staff members; 4) facilitate access to funds from international organizations and foundations for collaborative research activities to enhance teaching and research development; 5) organize joint summits, conferences, seminars, symposia, special short-term academic programs, cultural, and tourism programs; 6) exchange of publications for scientific, scholarly, teaching and information purposes, in order to strengthen existing friendly relationships between the two universities; and 7) undertake joint supervision of undergraduate and graduate student research.

12
Annual Accountability Report 2013-2014
FLORIDA A&M UNIVERSITY
APPROVED BY BOT 1‐14‐2015
Community and Business Engagement STRENGTHEN QUALITY AND REPUTATION OF COMMITMENT TO COMMUNITY AND BUSINESS ENGAGEMENT
In 2013-14, the FAMU Small Business Development Regional Center (FSBDC) delivered 3,364 direct consulting hours (prep + contact). This was nearly double the amount than the previous year and above the total hour goal of 2,227 consulting hours for 2013-14 (151.08%). There was a significant increase in consulting hours for Small and Medium Enterprises (SME’s) (1,899 hours achieved against a goal of 557 hours – 341%). This reflects the change towards a greater percentage of Micro and SME clients and a focus on declining the percentage of Pre-Venture and Start-up businesses. The main areas of consulting are Market Growth (market study analysis, social media, SWOT / Space Analysis, competitive metrics). The FSDBC employed a strategy for elected official stakeholders, which includes regular formal visits (scheduled two times a year) and informal “touches” with State Senators and House of Representatives, County Commissioners, City Officials, Mayor, as well as developed relationships with local Senators and House of Representative members.
The FAMU College of Pharmacy and Pharmaceutical Sciences hosted hundreds of Leon County citizens during its community health fair. The health fair included: free back-to-school immunizations and screening for blood pressure, blood sugar and cholesterol. The event also included heart-health, nutrition and prescription education, as well as exercise lessons and voter registration.
The College of Engineering hosted Transportation Day as part of community outreach for a US Department of Transportation grant involving FAMU and FSU.
INCREASE LEVELS OF COMMUNITY AND BUSINESS ENGAGEMENT
The College of Pharmacy and Pharmaceutical Sciences initiated activities in its Center for Health Equity to further the College of Pharmacy and Pharmaceutical Sciences’ mission by improving the health care of medically underserved populations through research, education, community intervention and service. This cutting-edge center represents a new inter-professional approach to identifying and solving problems related to health disparities on a local, statewide, national, and global scale and involves pharmacy faculty working cooperatively with nursing, psychology, social work, medicine and public health faculty at FAMU. This initiative provides education to community health professionals and community services to address and solve problems related to diseases commonly associated with health disparities (e.g. Diabetes, HIV/AIDS, cardiovascular disease, asthma). In addition, faculty working through the Center will secure grants and conduct research on issues related to health disparities. Furthermore, inter-professional elective courses are being designed to create future professionals capable of working together to solve problems related to disparities in health care.
Nursing students engaged in numerous initiatives to address the health needs of the Tallahassee community: volunteering with Tallahassee Cares, an alliance devoted to improving the health and safety of South side residents, participating in the University ‘s “Relay for Life”, “Heat Stroke Prevention” and “Press the Chest” events, walking with March of Dime-Tallahassee; and sponsoring breast cancer awareness and obesity and fitness programs.
The School of Allied Health Sciences received a Health and Wellness grant from the Florida Department of Health to improve the overall health and wellness on FAMU’s campus. One of the goals of the grant is to have FAMU become a tobacco free and smoke free campus. Additionally, funding was received from the University Transportation Center to conduct research on psychosocial factors contributing to car crashes in older adults in the state of Florida.

13
Annual Accountability Report 2013-2014
FLORIDA A&M UNIVERSITY
APPROVED BY BOT 1‐14‐2015
As indicated in the Key Achievements section, the FAMU’s School of Journalism & Graphic Communication (SJGC) signed into a partnership with the Black Television News Channel (BTNC) making the university home to the nation’s only black-owned cable news network. BTNC’s mission is to produce programming that is informative, educational, entertaining, inspiring and empowering to the black viewing audience. The 11-year contractual partnership will position FAMU to be the home of the 24-hour, multi-platform news network. Heralding of Tallahassee’s and FAMU’s first 24-hour news and educational cable news network will provide:
o Improvements to the University’s property that include construction, cabling and equipment integration in an active newsroom.
o Career counseling and job placement for journalism and visual communication students. o Enhancement of the School of Journalism & Graphic Communication’s curricula. o Financial contributions to FAMU of more than $10 million over an 11-year period, and
more than $4 million in initial equipment donated to the FAMU School of Journalism & Graphic Communication via SONY.
o Annual contribution of some $34 million in goods and services will be added to the Tallahassee metro area economy when BTNC is fully operational (Source: 2012 Economic Development Council of Tallahassee/Leon County, Inc.).
o An initial addition of 117 new positions created through salaried employees, commission sales persons and contract/professionals.
FAMU Cooperative Extension Program made 234,662 connections with farmers, families and individuals, including field or site visits, office, telephone and email consultations, group learning activities and other direct contacts to enhance the 1890 Land-Grant mission of Florida A&M University. Assessments performed with those to whom services are provided found that the vast majority of them indicated increased levels of knowledge and changes in behavior as a result. The Program also received over $2.5 million in federal formula and competitive external funding which will enable the University to further increase its assistance to Florida farmers and citizens.
FAMU Cooperative Extension Program offered a variety of services to many communities, farmers, and agricultural entrepreneurs throughout the State in 2013-14, including:
o Programs/Workshops/Forums/Conferences: Master Farmer Program, Mortality Composting Workshop, New & Beginning Farmers Program, 4-H Youth Garden Program, County Extension Programs, Statewide Small Farm Program, National Goat Conference, the Food Science Forum, partnered with the Havana Community Development Corporation to train residents in job development, health and wellness, and citizen programs, as well as aquaculture, gardening and youth entrepreneurship.
o Certification and Training Programs: Master Goat and Sheep Certification Program, ISA Arborist Certification exam two-day training class and USDA organic certification training for farmers.
INCREASE COMMUNITY AND BUSINESS WORKFORCE
The FAMU Small Business Development Center (FSBDC) experienced an increase in the number of economic development activities (95% over a three-year period) and funding from State and Federal sources (29% over a three-year period) serving 465 small businesses in Franklin, Liberty, Taylor, Madison, Leon, Gadsden, Jefferson and Wakulla Counties.
FAMU partnered with the Charles E. Schmidt College of Medicine at Florida Atlantic University (FAU) to establish the FAMU/FSU Medical Scholars Program (MSP). The goal of the program is to successfully equip students, starting as freshmen, with the tools and knowledge necessary to enter medical school, thus expanding access to underrepresented minorities to medical school and ultimately to our healthcare workforce.

14
Annual Accountability Report 2013-2014
FLORIDA A&M UNIVERSITY
APPROVED BY BOT 1‐14‐2015
FAMU signed a Memorandum of Understanding (MOU) with the Chicago School of Professional Psychology (TCSPP) to provide for the development of an articulation agreement to bridge student into the community psychology master’s program and the counseling psychology doctorate program.
In September 2013, NASA’s Marshall Space Flight Center in Huntsville, Alabama hosted a “Mentor-Protégé” signing agreement with FAMU. The agreement with ATK Aerospace Systems provides incentives for NASA prime contractors to assist eligible small businesses in enhancing their capabilities to perform as prime and sub-contractors. The agreement’s mission is to allow small businesses to become viable suppliers, maintain long-term relationships, enhance technical capabilities and gain the ability to successfully compete for larger, more complex prime contract and subcontract awards.
FAMU continues to be a top producer of African American graduates at the baccalaureate degree level based data published by the Diverse Issues in Higher Education, Top 100 Producers, 2014. According to the report, FAMU is ranked as one of the top 10 producers of African American graduates in the nation in 2012-13 for the following fields: Allied Health Diagnostic, Intervention, and Treatment Professions (#2); Architecture and Related Services (#2); Agriculture, Agriculture Operations, and Related Sciences (#4); Biological and Biomedical Services (#4); Visual and Performing Arts (#4); Engineering Technologies and Engineering-Related Fields (#5); Health and Medical Administrative Services (#6); Health Professions and Related Programs (#6); Homeland Security, Law Enforcement, Firefighting and Related Protective Services (#6);; Communication, Journalism and Related Programs (#7); Accounting and Related Services (#8); Public Administration and Social Service Professions (#8);Philosophy and Religious Studies (#9); and Social Sciences (#9). FAMU continues to rank 4th in the nation in the number of baccalaureate degrees awarded to African American graduates in All Disciplines Combined. For doctoral and professional degrees, Diverse Issues in Higher Education, Top 100 Producers, 2014 also shows that FAMU is ranked as one of the top 10 producers of African American graduates in the nation for the following fields: Pharmacy, Pharmaceutical Sciences and Administration (#1); Rehabilitation and Therapeutic Professions (#2); and Law (#4). For all disciplines combined, FAMU ranked number two for the total number of doctoral and professional degrees awarded to African Americans in the 2012-13 academic year and number seven in Law for degrees awarded to Total Minorities. FAMU also ranked number nine in Total Minority doctoral degrees awarded in Pharmacy, Pharmaceutical Sciences, and Administration. Source: Diverse Issues in Higher Education, Top 100 Producers, 2014. For the same academic year 2012-13, IPEDS data shows that FAMU is ranked as a Top 10 producer of graduate degree awarded to African Americans in STEM, law, and health. FAMU had 10 of its master’s degree programs ranked in the top 10, four doctoral programs, and three professional degrees in the production of degrees awarded to African Americans. The 10 master’s level programs were: Environmental Science (#2), Architecture (#2), Chemistry (#2), Pharmaceutical Sciences (#2), Occupational Therapy (#4), Computer Science (#5), Mechanical Engineering (#5), Civil Engineering (#6), Industrial Engineering (#7) and Electrical Engineering (#9). The doctoral programs were: Environmental Science (#1), Pharmaceutical Sciences (#1), Civil Engineering (#2) and Public Health (#4). Lastly, the first professional degrees shown as ranked in the Top 10 producers of degrees awarded to African Americans as reported by IPEDS were: PharmD (#1), Physical Therapy (#2), and Law (#4).

15
Annual Accountability Report 2013-2014
FLORIDA A&M UNIVERSITY
APPROVED BY BOT 1‐14‐2015
Data Tables
FINANCIAL RESOURCES Table 1A. Education and General Revenues Table 1B. Education and General Expenditures
Table 1C. Funding per Student FTE
Table 1D. Other Budget Entities
Table 1E. Voluntary Support of Higher Education
Table 1F. Tuition Differential Fee
PERSONNEL Table 2A. Personnel Headcount
ENROLLMENT Table 3A. Headcount Enrollment by Student Type Table 3B. Full-time Equivalent (FTE) Enrollment
Table 3C. Enrollment by Method of Instruction
Table 3D. Headcount Enrollment by Military Status and Student Level
Table 3E. University Access Rate: Undergraduate Enrollment with Pell Grant
UNDERGRADUATE EDUCATION Table 4A. Baccalaureate Degree Program Changes in AY 2013-2014 Table 4B. Retention Rates
Table 4C. Full-time, First-Time-in-College (FTIC) Six-Year Graduation Rates
Table 4D. Full- and Part-time FTIC Graduation Rates
Table 4E. AA Transfers Graduation Rates
Table 4F. Other Transfers Graduation Rates
Table 4G. Baccalaureate Degrees Awarded
Table 4H. Baccalaureate Degrees Awarded in Areas of Strategic Emphasis
Table 4I. Baccalaureate Degrees Awarded to Underrepresented Groups
Table 4J. Baccalaureate Degrees Without Excess Credit Hours
Table 4K. Undergraduate Course Offerings
Table 4L. Faculty Teaching Undergraduates
Table 4M. Student/Faculty Ratio
Table 4N. Licensure/Certification Exam: Nursing (NCLEX)
Table 4O. Post-Graduation Metrics
GRADUATE EDUCATION Table 5A. Graduate Degree Program Changes in AY 2013-2014 Table 5B. Graduate Degrees Awarded
Table 5C. Graduate Degrees Awarded in Areas of Strategic Emphasis
Table 5D. Licensure/Certification Exams for Graduate Programs
RESEARCH & ECONOMIC DEVELOPMENT Table 6A. Research and Development Expenditures Table 6B. Centers of Excellence

16
Annual Accountability Report 2013-2014
FLORIDA A&M UNIVERSITY
APPROVED BY BOT 1‐14‐2015
Section 1 – Financial Resources
TABLE 1A. University Education and General Revenues
2010-11 Actual
2011-12 Actual
2012-13 Actual
2013-14 Actual
2014-15 Estimates
MAIN OPERATIONS
Recurring State Funds $101,521,534 $91,821,312 $92,309,490 $96,977,120 $109,885,100
Non-Recurring State Funds $6,379,472 $6,000,982 -$14,850,901 $2,655,777 $2,501,329
Tuition $66,438,001 $69,519,546 $64,620,473 $57,711,385 $63,417,964
Tuition Differential Fee $3,245,773 $5,840,726 $9,317,774 $8,558,070 $7,424,483
Misc. Fees & Fines $973,993 $716,105 $853,415 $829,453 $1,604,485
Phosphate Research TF $0 $0 $0 $0 $0
Federal Stimulus Funds $8,460,902 $0 $0 $0 $0 TOTAL $187,019,675 $173,898,671 $152,250,251 $166,731,805 $184,833,361 Recurring State Funds: State recurring funds include general revenue and lottery education & general (E&G) appropriations and any administered funds provided by the state, including annual adjustments of risk management insurance premiums for the estimated year. This does not include technical adjustments or transfers made by universities after the appropriation. In 2013-2014, $15 million in non-recurring state support was provided to the Board to provide grants to address targeted program areas as identified in the GAP Analysis Report prepared by the Commission on Florida Higher Education Access & Attainment. For FY 2014-2015, these funds were reallocated to the institutions as recurring dollars to support the performance funding initiative. Source: For actual years, SUS Final Amendment Packages; for estimated year the 2013-14 Allocation Summary and Workpapers (Total E&G general revenue & lottery minus non-recurring) and Board of Governors staff calculations for risk management insurance adjustments. Non-Recurring State Funds: State non-recurring funds include general revenue and lottery education & general appropriations and any administered funds provided by the state. This does not include technical adjustments or transfers made by Universities after the appropriation - Source: non-recurring appropriations section of the annual Allocation Summary and Workpapers document and all other non-recurring budget amendments allocated later in the fiscal year. Tuition: Actual resident & non-resident tuition revenues collected from students, net of fee waivers. - Source: Operating Budget, Report 625 – Schedule I-A. Tuition Differential Fee: Actual tuition differential revenues collected from undergraduate students - Source: Operating Budget, Report 625 – Schedule I-A. Miscellaneous Fees & Fines: Other revenue collections include items such as application fees, late registration fees, library fines, miscellaneous revenues. This is the total revenue from Report 625 minus tuition and tuition differential fee revenues. This does not include local fees - Source: Operating Budget, Report 625 – Schedule I-A. Phosphate Research Trust Fund: State appropriation for the Florida Industrial and Phosphate Research Institute at the University of South Florida (for history years through 2012-13); beginning 2013-14 the Phosphate Research Trust Fund is appropriated through Florida Polytechnic University. Source: Final Amendment Package. Federal Stimulus Funds: Non-recurring American Recovery and Reinvestment Act funds appropriated by the state - Source: SUS Final Amendment Package.

17
Annual Accountability Report 2013-2014
FLORIDA A&M UNIVERSITY
APPROVED BY BOT 1‐14‐2015
Section 1 – Financial Resources (continued) TABLE 1B. University Education and General Expenditures
2009-10 2010-11 2011-12 2012-13 2013-14 Actual Actual Actual Actual* Actual*
MAIN OPERATIONS
Instruction/Research $93,846,937 $98,191,207 $83,721,468 $91,404,242 $96,558,261
Administration and Support $26,852,328 $26,150,741 $26,165,237 $27,370,987 $30,578,609
PO&M $20,330,222 $18,401,551 $17,016,571 $19,149,283 $21,970,828
Student Services $12,050,479 $11,846,764 $10,663,345 $11,465,614 $12,769,627
Library/Audio Visual $5,929,520 $5,943,759 $5,469,947 $6,441,462 $6,820,172
Other $542,843 $583,670 $682,058 $797,118 $583,551
TOTAL $159,552,329 $161,117,692 $143,718,626 $156,628,706 $169,281,048
The table reports the actual and estimated amount of expenditures from revenues appropriated by the legislature for each fiscal year. The expenditures are classified by Program Component (i.e., Instruction/Research, PO&M, Administration, etc...) for activities directly related to instruction, research and public service. The table does not include expenditures classified as non-operating expenditures (i.e., to service asset-related debts), and therefore excludes a small portion of the amount appropriated each year by the legislature. Note*: FY 2012-2013 reflects a change in reporting expenditures from prior years due to the new carry-forward reporting requirement as reflected in the 2013-2014 SUS Operating Budget Reports. Since these expenditures will now include carry-forward expenditures, these data are no longer comparable to the current-year revenues reported in table 1A, or prior year expenditures in table 1B. Instruction & Research: Includes expenditures for state services related to the instructional delivery system for advanced and professional education. Includes functions such as; all activities related to credit instruction that may be applied toward a postsecondary degree or certificate; non-project research and service performed to maintain professional effectives; individual or project research; academic computing support; academic source or curriculum development. Source: Operating Budget Summary - Expenditures by Program Activity (or Report 645). Administration & Support Services: Expenditures related to the executive direction and leadership for university operations and those internal management services which assist and support the delivery of academic programs. Source: Operating Budget Summary - Expenditures by Program Activity (or Report 645). PO&M: Plant Operations & Maintenance expenditures related to the cleaning and maintenance of existing grounds, the providing of utility services, and the planning and design of future plant expansion and modification. Student Services: Includes resources related to physical, psychological, and social well-being of the student. Includes student service administration, social and cultural development, counseling and career guidance, financial aid, and student admissions and records. Other: includes Institutes and Research Centers, Radio/TV, Museums and Galleries, Intercollegiate Athletics, Academic Infrastructure Support Organizations. Source: Operating Budget Summary - Expenditures by Program Activity (or Report 645).

18
Annual Accountability Report 2013-2014
FLORIDA A&M UNIVERSITY
APPROVED BY BOT 1‐14‐2015
Section 1 – Financial Resources (continued) TABLE 1C. State Funding per Full-Time Equivalent (FTE) Student
2009-10 Actual
2010-11 Actual
2011-12 Actual
2012-13 Actual
2013-14 Actual
Appropriated Funding per FTE General Revenue $8,075 $7,934 $7,284 $6,332 $9,043 Lottery Funds $917 $967 $1,112 $930 $1,231 Tuition & Fees $5,144 $4,917 $5,501 $6,751 $7,528 Other Trust Funds $714 $698 $0 $0 $0 TOTAL $14,850 $14,515 $13,897 $14,013 $17,803
Actual Funding per FTE Tuition & Fees $5,226 $5,828 $6,530 $7,012 $6,920 TOTAL $14,932 $15,427 $14,926 $14,274 $17,194 Notes: (1) FTE is based on actual FTE, not funded FTE; (2) does not include Health-Science Center funds or FTE; (3) FTE for these metrics uses the standard IPEDS definition of FTE, equal to 30 credit hours for undergraduates and 24 for graduates; and (4) actual funding per student is based on actual tuition and E&G fees (does not include local fees) collected. Sources: Appropriated totals from the annual Final Amendment Package data. Actual Student Fees from the Operating Budget 625 reports. This does not include appropriations for special units (i.e., IFAS, Health Science Centers, and Medical Schools). Tuition and fee revenues include tuition and tuition differential fee and E&G fees (i.e., application, late registration, and library fees/fines). Other local fees that do not support E&G activities are not included here (see Board of Governors Regulation 7.003). This data is not adjusted for inflation. FAMU and BOG staff are working to finalize the data identified in red font.
TABLE 1D. University Other Budget Entities 2009-10
Actual 2010-11 Actual
2011-12 Actual
2012-13 Actual
2013-14 Actual
Auxiliary Enterprises Revenues $22,808,023 $25,267,943 $25,552,427 $25,213,058 $24,762,746 Expenditures $20,755,632 $20,695,955 $22,200,051 $23,852,343 $31,469,452 Contracts & Grants Revenues $52,808,492 $56,742,558 $53,333,017 $44,847,891 $51,417,860 Expenditures $54,634,109 $55,271,357 $54,064,567 $46,859,000 $44,863,222 Local Funds Revenues $63,365,611 $78,439,036 $69,027,997 $62,875,392 $57,399,650 Expenditures $60,432,397 $75,777,718 $67,413,694 $63,055,801 $56,416,417 Faculty Practice Plans Revenues $0 $0 $0 $0 $0 Expenditures $0 $0 $0 $0 $0 Notes: Revenues do not include transfers. Expenditures do not include non-operating expenditures. Auxiliary Enterprises are self supported through fees, payments and charges. Examples include housing, food services, bookstores, parking services, health centers. Contract & Grants resources are received from federal, state or private sources for the purposes of conducting research and public service activities. Local Funds are associated with student activity (supported by the student activity fee), student financial aid, concessions, intercollegiate athletics, technology fee, green fee, and student life & services fee. Faculty Practice Plan revenues/receipts are funds generated from faculty practice plan activities. Faculty Practice Plan expenditures include all expenditures relating to the faculty practice plans, including transfers between other funds and/or entities. This may result in double counting in information presented within the annual report. Source: Operating Budget, Report 615.

19
Annual Accountability Report 2013-2014
FLORIDA A&M UNIVERSITY
APPROVED BY BOT 1‐14‐2015
Section 1 – Financial Resources (continued)
TABLE 1E. Voluntary Support of Higher Education
2009-10 2010-11 2011-12 2012-13 2013-14
Endowment Value ($1000s) $96,154 $111,516 $107,743 $115,281 $127,185
Gifts Received ($1000s) $3,795 $4,291 $3,198 $3,226 $3,300
Percentage of Alumni Donors
4.5% 9.7% 5.8% 4.4% 3.3%
Notes: Endowment value at the end of the fiscal year, as reported in the annual NACUBO Endowment Study. Gifts Received as reported in the Council for Aid to Education’s Voluntary Support of Education (VSE) survey in the section entitled “Gift Income Summary,” this is the sum of the present value of all gifts (including outright and deferred gifts) received for any purpose and from all sources during the fiscal year, excluding pledges and bequests. (There’s a deferred gift calculator at www.cae.org/vse.) The present value of non-cash gifts is defined as the tax deduction to the donor as allowed by the IRS. Percentage of Alumni Donors as reported in the Council for Aid to Education’s Voluntary Support of Education (VSE) survey in the section entitled “Additional Details,” this is the number of alumni donors divided by the total number of alumni, as of the end of the fiscal year. “Alumni,” as defined in this survey, include those holding a degree from the institution as well as those who attended the institution but did not earn a degree.
TABLE 1F. Tuition Differential Fees (TDF)
2011-12 2012-13 2013-14 TDF Revenues Generated $5,840,726 $9,317,774 $8,558,688
Students Receiving TDF Funded Award 1,593 1,993 1,611
Total Value of TDF Funded Financial Aid Awards $1,209 $1,404 $1,455
Florida Student Assistance Grant (FSAG) Eligible Students
Number of Eligible Students 5,215 4,495 3,108
Number Receiving a TDF Waiver 2 1 0
Total Value of TDF Waivers $1,285 $546 $0 Note: Revenues Generated refers to actual tuition differential revenues collected from undergraduate students as reported on the Operating Budget, Report 625 – Schedule I-A. TDF Students Receiving TDF Funded Award reports the number of unduplicated students who have received a financial aid award that was funded by tuition differential revenues. Value of TDF Funded Award refers to the average value of financial aid awards funded by the Tuition Differential Fee funds. Florida Student Assistance Grant (FSAG) Eligible Students: Number of Eligible Students refers to total annual unduplicated count of undergraduates at the institution who are eligible for FSAG in the academic year, whether or not they received FSAG awards. Number Receiving a TDF Waiver refers to annual unduplicated count of FSAG-eligible students receiving a waiver, partial or full, of the tuition differential fees at the institution during the academic year, regardless of the reason for the waiver. Value of TDF Waivers refers to the average value of waivers provided to FSAG-eligible undergraduates at the institution during the academic year, regardless of the reason for the waiver.

20
Annual Accountability Report 2013-2014
FLORIDA A&M UNIVERSITY
APPROVED BY BOT 1‐14‐2015
Section 2 – Personnel
TABLE 2A. Personnel Headcount (in Fall term only)
2009 2010 2011 2012 2013 Full-time Employees
Tenured Faculty 297 281 276 268 253
Tenure-track Faculty 161 153 131 130 135
Non-Tenure Track Faculty 165 142 130 154 162
Instructors Without Faculty Status 0 38 40 41 38
Graduate Assistants/Associates 0 0 0 0 0
Non-Instructional Employees 1,285 1,244 1,141 1,142 1,203
FULL-TIME SUBTOTAL 1,908 1,858 1,718 1,735 1,753
Part-time Employees
Tenured Faculty 0 0 0 3 0 Tenure-track Faculty 1 1 1 3 0 Non-Tenure Track Faculty 0 0 1 9 1 Instructors Without Faculty Status 139 148 164 130 157 Graduate Assistants/Associates 253 236 231 241 185 Non-Instructional Employees 7 6 7 5 6
PART-TIME SUBTOTAL 400 391 404 391 349
TOTAL 2,308 2,249 2,122 2,126 2,102 Note: This table is based on the annual IPEDS Human Resources Survey, and provides full- and part-time medical and non-medical staff by faculty status and primary function/occupational activity. Tenured and Tenure-Track Faculty include those categorized within instruction, research, or public service. Non-Tenure Track Faculty includes adjunct faculty (on annual and less than annual contracts) and faculty on multi-year contracts categorized within instruction, research, or public service. Instructors Without Faculty Status includes postdoctoral research associates, and individuals hired as a staff member primarily to do research on a 3-year contract without tenure eligibility categorized within instruction, research, or public service. Non-Instructional Employees includes all executive, administrative and managerial positions regardless of faculty status; as well as, other support and service positions regardless of faculty status. Note: The universities vary on how they classify adjuncts (some include them as non-tenure track faculty while others do not consider them faculty and report them as instructors without faculty status) and part-time non-instructional employees.

21
Annual Accountability Report 2013-2014
FLORIDA A&M UNIVERSITY
APPROVED BY BOT 1‐14‐2015
Section 3 – Enrollment
TABLE 3A. Headcount Enrollment by Student Type and Level
Fall 2009 Fall 2010 Fall 2011 Fall 2012 Fall 2013
TOTAL 12,261 13,277 13,207 12,051 10,738
UNDERGRADUATE
FTIC (Regular Admit) 3,274 3,186 2,918 2,724 2,730 FTIC (Profile Admit) 4,787 5,734 5,520 4,772 3,902 AA Transfers 548 764 813 830 796 Other Transfers 1,147 1,152 1,084 940 781 Subtotal 9,756 10,836 10,335 9,266 8,209
GRADUATE
Master's 892 813 823 727 620 Research Doctoral 153 148 158 147 158 Professional Doctoral 1,194 1,231 1,648 1,697 1,537
Dentistry 0 0 0 0 0 Law 607 671 714 662 518 Medicine 0 0 0 0 0 Nursing Practice 0 0 0 0 0 Pharmacy 587 560 934 926 902 Physical Therapist 109 117 Veterinary Medicine 0 0 0 0 0 Other 0 0 0 0 0
Subtotal 2,239 2,192 2,629 2,571 2,315
UNCLASSIFIED
266 249 243 214 214
Note: This table reports the number of students enrolled at the university by student type categories. The determination for undergraduate, graduate and unclassified is based on the institutional class level values. Unclassified refers to a student who has not yet been formally admitted into a degree program but is enrolled. The student type for undergraduates is based on the Type of Student at Time of Most Recent Admission. The student type for graduates is based on the degree that is sought and the student CIP code.

22
Annual Accountability Report 2013-2014
FLORIDA A&M UNIVERSITY
APPROVED BY BOT 1‐14‐2015
Section 3 – Enrollment (continued)
TABLE 3B. Full-Time Equivalent (FTE) Enrollment [State Fundable only] 2011-12 2012-13 2013-14
State-
Funded Actual
State- Funded
Actual State-
Funded Actual
FLORIDA RESIDENTS
Lower-Division 3,601 3,860 3,601 3,285 . 2,837 Upper-Division 2,868 2,764 2,868 2,707 . 2,584 Master’s (GRAD I) 651 433 651 374 . 328 Doctoral (GRAD II) 627 867 627 913 . 850 Subtotal 7,747 7,924 7,747 7,279 . 6,599
NON-FLORIDA RESIDENTS Lower-Division . 345 . 326 . 283 Upper-Division . 235 . 235 . 252 Master’s (GRAD I) . 84 . 40 . 47 Doctoral (GRAD II) . 150 . 119 . 92 Subtotal 1,119 814 1,119 719 . 674
TOTAL FTE Lower-Division . 4,205 . 3,611 4,150 3,120 Upper-Division . 2,999 . 2,942 3,307 2,836 Master’s (GRAD I) . 518 . 415 773 376 Doctoral (GRAD II) . 1,017 . 1,032 636 941 Total 8,866 8,738 8,866 7,999 8,866 7,273
Total (US Definition) 11,821 11,651 11,821 10,666 11,821 9,697 Notes: Full-time Equivalent (FTE) student is a measure of instructional effort (and student activity) that is based on the number of credit hours that students enroll by course level. FTE is based on the Florida definition, which divides undergraduate credit hours by 40 and graduate credit hours by 32 (US definition based on Undergraduate FTE = 30 and Graduate FTE = 24 credit hours). In 2013-14, the Florida Legislature chose to no longer separate funded non-resident FTE from funded resident FTE. Funded enrollment as reported in the General Appropriations Act and Board of Governors’ Allocation Summary. Actual enrollment only reports ‘state-fundable’ FTE as reported by Universities to the Board of Governors in the Student Instruction File (SIF). Totals are actual and may not equal sum of reported student levels due to rounding of student level FTE. Total FTE are equal in tables 3B and 3C.

23
Annual Accountability Report 2013-2014
FLORIDA A&M UNIVERSITY
APPROVED BY BOT 1‐14‐2015
Section 3 – Enrollment (continued) TABLE 3C. Full-Time Equivalent (FTE) Enrollment by Method of Instruction
2010-11 2011-12 2012-13 2013-14 TRADITIONAL
Lower-Division 4,616 4,191 3,579 3,077 Upper-Division 2,965 2,997 2,937 2,825 Master’s (GRAD 1) 553 517 415 376 Doctoral (GRAD 2) 954 1,017 1,032 941 Total 9,088 8,722 7,963 7,219
HYBRID
Lower-Division 3 0 0 0 Upper-Division 0 0 0 0 Master’s (GRAD 1) 0 0 0 0 Doctoral (GRAD 2) 0 0 0 0 Total 3 0 0 0
DISTANCE LEARNING Lower-Division 0 13 31 43 Upper-Division 0 2 4 11 Master’s (GRAD 1) 0 0 0 0 Doctoral (GRAD 2) 0 0 0 0 Total 0 15 36 54
TOTAL
Lower-Division 4,405 4,066 3,610 3,120 Upper-Division 2,965 2,999 2,942 2,836 Master’s (GRAD 1) 553 518 415 376 Doctoral (GRAD 2) 954 1,017 1,032 941 Total 9,091 8,737 7,999 7,273
Note: Full-time Equivalent (FTE) student is a measure of instructional effort (and student activity) that is based on the number of credit hours that students enroll by course level. FTE is based on the Florida definition, which divides undergraduate credit hours by 40 and graduate credit hours by 32. Distance Learning is a course in which at least 80 percent of the direct instruction of the course is delivered using some form of technology when the student and instructor are separated by time or space, or both (per 1009.24(17), F.S.). Hybrid is a course where 50% to 79% of the instruction is delivered using some form of technology, when the student and instructor are separated by time or space, or both (per SUDS data element 2052). Traditional (and Technology Enhanced) refers to primarily face to face instruction utilizing some form of technology for delivery of supplemental course materials for no more than 49% of instruction (per SUDS data element 2052). Totals are actual and may not equal sum of reported student levels due to rounding of student level FTE. Total FTE are equal in tables 3B and 3C.

24
Annual Accountability Report 2013-2014
FLORIDA A&M UNIVERSITY
APPROVED BY BOT 1‐14‐2015
Section 3 – Enrollment (continued) TABLE 3D. Headcount Enrollment by Military Status and Student Level
Fall 2010 Fall 2011 Fall 2012 Fall 2013
MILITARY Unclassified 1 1 0 0 Undergraduate 36 22 8 57 Master’s (GRAD 1) 9 4 5 9 Doctoral (GRAD 2) 0 0 0 0 Subtotal 46 27 13 66
ELIGIBLE DEPENDENT
Unclassified 0 1 1 0 Undergraduate 2 130 78 149 Master’s (GRAD 1) 0 7 8 13 Doctoral (GRAD 2) 0 0 0 0 Subtotal 2 138 87 162
NON-MILITARY
Unclassified 170 174 146 140 Undergraduate 11,109 10,870 9,842 8,613 Master’s (GRAD 1) 1,845 1,886 1,838 1,622 Doctoral (GRAD 2) 105 112 125 135 Subtotal 13,229 13,042 11,951 10,510
TOTAL 13,277 13,207 12,051 10,738 Note: This table provides trend data on the number of students enrolled based on their military status. Military includes students who were classified as Active Duty, Veterans, National Guard, or Reservist.. Eligible Dependents includes students who were classified as eligible dependents (dependents who received veteran’s benefits). Non-Military includes all other students.
TABLE 3E. University Access Rate: Undergraduate Enrollment with Pell Grant
Fall 2009 Fall 2010 Fall 2011 Fall 2012 Fall 2013
Pell Grant Recipients 6,118 7,505 7,502 6,481 5,389
Percent with Pell Grant 61% 68% 69% 66% 62%
Note: This table reports the University’s Access Rate, which is a measure of the percentage of undergraduate students who have received a federal Pell grant award during a given Fall term (excludes non-resident aliens). The top row reports the number of students who received a Pell Grant award. The bottom row provides the percentage of eligible students that received a Pell Grant award.

25
Annual Accountability Report 2013-2014
FLORIDA A&M UNIVERSITY
APPROVED BY BOT 1‐14‐2015
Section 4 – Undergraduate Education
TABLE 4A. Baccalaureate Degree Program Changes in AY 2013-14
Title of Program
Six-digit
CIP
Code
Degree
Level
Date of
UBOT
Action
Starting
or Ending
Term
Comments
New Programs
None
Terminated Programs
None
Programs Suspended for New Enrollments
None
New Programs Considered By University But Not Approved
BS/BA Environmental Studies – Returned for Significant Revisions BS Food Science – Returned for Significant Revisions
Note: This table does not include new majors or concentrations added under an existing degree program CIP Code. This table reports the new and terminated program changes based on Board action dates between May 5, 2013 and May 4, 2014. New Programs are proposed new degree programs that have been completely through the approval process at the university and, if appropriate, the Board of Governors. Does not include new majors or concentrations added under an existing degree program CIP Code. Terminated Programs are degree programs for which the entire CIP Code has been terminated and removed from the university’s inventory of degree programs. Does not include majors or concentrations terminated under an existing degree program CIP Code if the code is to remain active on the academic degree inventory. Programs Suspended for New Enrollments are degree programs for which enrollments have been temporarily suspended for the entire CIP Code, but the program CIP Code has not been terminated. Does not include majors or concentrations suspended under an existing degree program CIP Code if the code is to remain active on the academic degree inventory and new enrollments in any active major will be reported. Programs included in this list may have been suspended for new enrollments sometime in the past and have continued to be suspended at least one term of this academic year. New Programs Considered by University But Not Approved includes any programs considered by the university board of trustees, or any committee of the board, but not approved for implementation. Also include any programs that were returned prior to board consideration by the university administration for additional development, significant revisions, or re-conceptualization; regardless of whether the proposal was eventually taken to the university board for approval. Count the returns once per program, not multiple times the proposal was returned for revisions, unless there is a total re-conceptualization that brings forward a substantially different program in a different CIP Code.

26
Annual Accountability Report 2013-2014
FLORIDA A&M UNIVERSITY
APPROVED BY BOT 1‐14‐2015
Section 4 – Undergraduate Education (continued)
TABLE 4B. Full-time, First-Time-in-College (FTIC) Retention Rates Retained in the Second Fall Term at Same University
2009-10 2010-11 2011-12 2012-13
2013-14 Preliminary
Cohort Size 2,330 2,685 1,975 1,498 1,272
% Retained 81% 79% 80% 82% 81%
% Retained with GPA of 2.0 or higher
57% 54% 64% 69% 70%*
Notes: Cohorts are based on undergraduate students who enter the institution in the Fall term (or Summer term and continue into the Fall term). Percent Retained is based on student enrollment in the Fall term following their first year. Percent Retained with GPA Above 2.0 is based on student enrollment in the Fall term following their first years for those students with a GPA of 2.0 or higher at the end of their first year (Fall, Spring, and Summer). The historical data for Retention Above 2.0 GPA has been revised since the 2012-13 Accountability Report to fix an error in the GPA calculation. The most recent year of Retention data is based on preliminary data (SIFP file) that is comparable to the final data (SIF file) but may be revised in the following years based on changes in student cohorts. The data shown above is based on queries by the Board of Governors staff of the State University Database System (SUDS). However, FAMU staff have calculated that the 2013-14 rate as 71%. The BOG and university staff will continue to work to resolve this discrepancy before the March 1st deadline for Performance Based Funding.
TABLE 4C. Full-time, First-Time-in-College (FTIC) Six-Year Graduation Rates
Term of Entry 2004-10 2005-11 2006-12 2007-13 2008-14 Preliminary
Cohort Size 2,203 1,637 1,614 1,854 2,046*
% Graduated 42% 40% 40% 41% 39%
% Still Enrolled 13% 15% 16% 15% 11%*
% Success Rate 55% 55% 56% 56% 51%*
Notes: Cohorts are based on undergraduate students who enter the institution in the Fall term (or Summer term and continue into the Fall term). Percent Graduated is based on federal rate and does not include students who originally enroll as part-time students, or who transfer into the institution. This metric complies with the requirements of the federal Student Right to Know Act that requires institutions to report the completion status at 150% of normal time (or six years). Success Rate measures the percentage of an initial cohort of students who have either graduated or are still enrolled at the same university. Since degrees can be awarded after the last semester of coursework, the most recent year of data in this table provides preliminary data that may change with the addition of “late degrees”. Late degrees reported in conjunction with the IPEDS Graduation Rate Survey due in mid-April will be reflected in the following year. The data shown above is based on queries by the Board of Governors staff of the State University Database System (SUDS). However, FAMU staff have calculated a different 2008-14 still enrolled rate (of 12%) and a different success rate (of 52%). The BOG and university staff will continue to work to resolve this discrepancy before the March 1st deadline for Performance Based Funding.

27
Annual Accountability Report 2013-2014
FLORIDA A&M UNIVERSITY
APPROVED BY BOT 1‐14‐2015
Section 4 – Undergraduate Education (continued) TABLE 4D. FTIC Graduation Rates (includes Full- and Part-time students)
4 – Year Rates 2006-10 2007-11 2008-12 2009-13
2010-14 Preliminary
Cohort Size 1,641 1,869 2,067 2,352 2,729*
Same University 10% 12% 12% 11% 12%
Other SUS University 0% 0% 1% 1% 1%
Total from System 10% 12% 13% 12% 13%
6 – Year Rates 2004-10 2005-11 2006-12 2007-13
2008-14 Preliminary
Cohort Size 2,245 1,674 1,641 1,869 2,067*
Same University 41% 40% 39% 41% 39%
Other SUS University 2% 2% 2% 2% 2%
Total from System 44% 42% 41% 43% 41%
Notes: (1) Cohorts are based on undergraduate students who enter the institution in the Fall term (or Summer term and continue into the Fall term). First-time-in-college (FTIC) cohort is defined as undergraduates entering in fall term (or summer continuing to fall) with fewer than 12 hours earned after high school graduation. Students of degree programs longer than four years (eg, PharmD) are included in the cohorts. The initial cohorts can be revised to remove students, who have allowable exclusions as defined by IPEDS, from the cohort. (2) Graduates are students in the cohort who have graduated by the summer term in their fourth or sixth year. Degree data often includes 'late degrees' which are degrees that were awarded in a previous term, but reported to SUDS later; so, the most recent year of data in this table only provides preliminary graduation rate data that may change with the addition of “late degrees”. Late degrees reported in conjunction with the IPEDS Graduation Rate Survey due in mid-February will be reflected in the following year. Same University provides data for students in the cohort who graduated from the same institution. Other SUS University provides data for students in the cohort who graduated from a different State University System of Florida institution. These data do not report students in the cohort who did not graduate from the SUS, but did graduate from another institution outside the State University System of Florida. Totals are accurate, but may not equal sum of subtotal due to rounding. The data shown above is based on queries by the Board of Governors staff of the State University Database System (SUDS). However, FAMU staff have calculated a different 2010-14 cohort (of 2,756) and a different 2008-14 cohort (of 2,129), however, the graduation rates are the same when rounded to the nearest whole number. The BOG and university staff will continue to work to resolve this discrepancy before the March 1st deadline for Performance Based Funding.

28
Annual Accountability Report 2013-2014
FLORIDA A&M UNIVERSITY
APPROVED BY BOT 1‐14‐2015
Section 4 – Undergraduate Education (continued)
TABLE 4E. AA Transfer Graduation Rates
2 – Year Rates 2008-10 2009-11 2010-12 2011-13 2012-14
Preliminary
Cohort Size 106 116 192 175 161*
Same University 30% 25% 17% 24% 22%*
Other University in SUS 2% 0% 0% 0% 1%
Total from System 32% 25% 17% 24% 23%
4 – Year Rates 2006-10 2007-11 2008-12 2009-13 2010-14
Preliminary
Cohort Size 92 81 106 116 192*
Same University 61% 67% 63% 61% 55%*
Other University in SUS 4% 2% 2% 1% 3%
Total from System 65% 69% 65% 62% 58% Notes: AA Transfer cohort is defined as undergraduates entering in the fall term (or summer continuing to fall) and having earned an AA degree from an institution in the Florida College System. (1) Cohorts are based on undergraduate students who enter the institution in the Fall term (or Summer term and continue into the Fall term); (2) Success Rate measures the percentage of an initial cohort of students who have either graduated or are still enrolled; (3) since degrees can be awarded after the last semester of coursework, the most recent year of data in this table provides preliminary graduation rate data that may change with the addition of “late degrees”. Late degrees reported in conjunction with the IPEDS Graduation Rate Survey due in mid-April will be reflected in the following year. The data shown above is based on queries by the Board of Governors staff of the State University Database System (SUDS). However, FAMU staff have calculated a different 2012-14 cohort (of 169) and grad rate (of 21%) and a different 2010-14 cohort (of 214) and grad rate (of 57%). The BOG and university staff will continue to work to resolve this discrepancy before the March 1st deadline for Performance Based Funding.
TABLE 4F. Other Transfer Graduation Rates
5 – Year Rates 2005-10 2006-11 2007-12 2008-13 2008-14 Preliminary
Cohort Size 270 377 353 397 509*
Same University 47% 68% 68% 63% 60%*
Other University in SUS 4% 2% 2% 2% 4%
Total from System 51% 70% 70% 65% 63%
Notes: (1) Cohorts are based on undergraduate students who enter the institution in the Fall term (or Summer term and continue into the Fall term); (2) Success Rate measures the percentage of an initial cohort of students who have either graduated or are still enrolled; (3) since degrees can be awarded after the last semester of coursework, the most recent year of data in this table provides preliminary graduation rate data that may change with the addition of “late degrees”. Late degrees reported in conjunction with the IPEDS Graduation Rate Survey due in mid-April will be reflected in the following year. The data shown above is based on queries by the Board of Governors staff of the State University Database System (SUDS). However, FAMU staff have calculated a different 2008-14 cohort (of 537) and grad rate (of 59%). The BOG and university staff will continue to work to resolve this discrepancy before the March 1st deadline for Performance Based Funding.
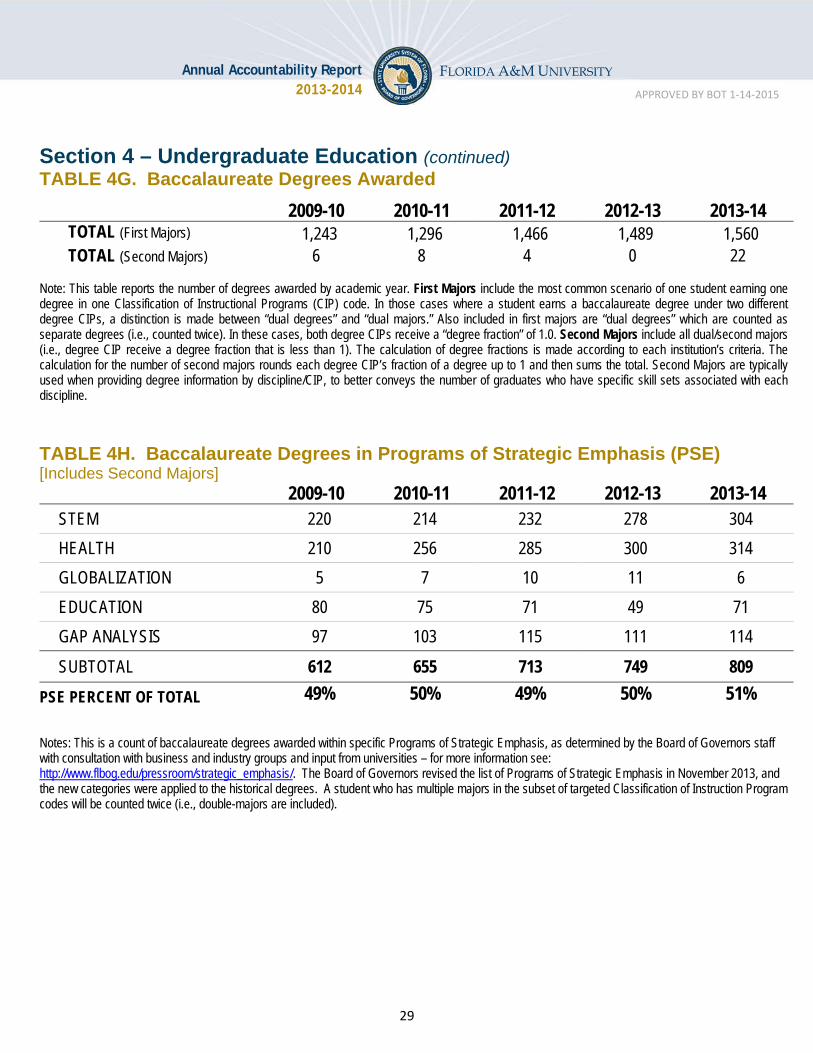
29
Annual Accountability Report 2013-2014
FLORIDA A&M UNIVERSITY
APPROVED BY BOT 1‐14‐2015
Section 4 – Undergraduate Education (continued)
TABLE 4G. Baccalaureate Degrees Awarded
2009-10 2010-11 2011-12 2012-13 2013-14 TOTAL (First Majors) 1,243 1,296 1,466 1,489 1,560 TOTAL (Second Majors) 6 8 4 0 22
Note: This table reports the number of degrees awarded by academic year. First Majors include the most common scenario of one student earning one degree in one Classification of Instructional Programs (CIP) code. In those cases where a student earns a baccalaureate degree under two different degree CIPs, a distinction is made between “dual degrees” and “dual majors.” Also included in first majors are “dual degrees” which are counted as separate degrees (i.e., counted twice). In these cases, both degree CIPs receive a “degree fraction” of 1.0. Second Majors include all dual/second majors (i.e., degree CIP receive a degree fraction that is less than 1). The calculation of degree fractions is made according to each institution’s criteria. The calculation for the number of second majors rounds each degree CIP’s fraction of a degree up to 1 and then sums the total. Second Majors are typically used when providing degree information by discipline/CIP, to better conveys the number of graduates who have specific skill sets associated with each discipline.
TABLE 4H. Baccalaureate Degrees in Programs of Strategic Emphasis (PSE) [Includes Second Majors]
2009-10 2010-11 2011-12 2012-13 2013-14 STEM 220 214 232 278 304
HEALTH 210 256 285 300 314
GLOBALIZATION 5 7 10 11 6
EDUCATION 80 75 71 49 71
GAP ANALYSIS 97 103 115 111 114
SUBTOTAL 612 655 713 749 809
PSE PERCENT OF TOTAL
49% 50% 49% 50% 51%
Notes: This is a count of baccalaureate degrees awarded within specific Programs of Strategic Emphasis, as determined by the Board of Governors staff with consultation with business and industry groups and input from universities – for more information see: http://www.flbog.edu/pressroom/strategic_emphasis/. The Board of Governors revised the list of Programs of Strategic Emphasis in November 2013, and the new categories were applied to the historical degrees. A student who has multiple majors in the subset of targeted Classification of Instruction Program codes will be counted twice (i.e., double-majors are included).

30
Annual Accountability Report 2013-2014
FLORIDA A&M UNIVERSITY
APPROVED BY BOT 1‐14‐2015
Section 4 – Undergraduate Education (continued)
TABLE 4I. Baccalaureate Degrees Awarded to Underrepresented Groups
2009-10 2010-11 2011-12 2012-13 2013-14
Non-Hispanic Black
Number of Degrees 1,166 1,224 1,382 1,404 1,475
Percentage of Degrees 95% 95% 95% 96% 96%
Hispanic
Number of Degrees 12 16 21 14 14
Percentage of Degrees 1% 1% 1% 1% 1%
Pell-Grant Recipients
Number of Degrees 841 917 1,098 1,125 1,204
Percentage of Degrees 68% 71% 76% 77% 78% Note: Non-Hispanic Black and Hispanic do not include students classified as Non-Resident Alien or students with a missing race code. Students who earn two distinct degrees in the same term are counted twice – whether their degrees are from the same six-digit CIP code or different CIP codes. Students who earn only one degree are counted once – even if they completed multiple majors or tracks. Percentage of Degrees is based on the number of baccalaureate degrees awarded to non-Hispanic Black and Hispanic students divided by the total degrees awarded - excluding those awarded to non-resident aliens and unreported. Pell-Grant recipients are defined as those students who have received a Pell grant from any SUS Institution within six years of graduation - excluding those awarded to non-resident aliens, who are only eligible for Pell grants in special circumstances. Percentage of Degrees is based on the number of baccalaureate degrees awarded to Pell recipients, as shown above, divided by the total degrees awarded - excluding those awarded to non-resident aliens. Notes on Trends: In 2007, the US Department of Education re-classified the taxonomy for self-reported race/ethnicity categories and allowed universities a two-year phase-in process before all institutions were required to report based on the new categories for the 2011-12 academic year. This reclassification will impact trends.

31
Annual Accountability Report 2013-2014
FLORIDA A&M UNIVERSITY
APPROVED BY BOT 1‐14‐2015
Section 4 – Undergraduate Education (continued) TABLE 4J. Baccalaureate Degrees Without Excess Credit Hours
2009-10 2010-11 2011-12 2012-13* 2013-14 FTIC 17% 18% 21% 26% 29%
AA Transfers 47% 45% 44% 58% 60%
Other Transfers 35% 27% 36% 39% 45%
TOTAL 23% 23% 27% 33% 35% Notes: This table is based on statute 1009.286 (see link), and excludes certain types of student credits (ie, accelerated mechanisms, remedial coursework, non-native credit hours that are not used toward the degree, non-native credit hours from failed, incomplete, withdrawn, or repeated courses, credit hours from internship programs, credit hours up to 10 foreign language credit hours, and credit hours earned in military science courses that are part of the Reserve Officers’ Training Corps (ROTC) program). This metric is not the same as the Excess Hours Surcharge, which has multiple cohorts with varying fee rates. This table reports the percentage of baccalaureate degrees awarded within 110% of the catalog hours required for a degree based on the Board of Governors Academic Program Inventory. This calculation is based on Hours To Degree data submitted by universities to the Board of Governors and excludes recent graduates who have already earned a baccalaureate degree. Note*: Improvements were made to data collection process beginning with 2012-13 data to better account for high school dual enrolled credits that are exempt from the excess hour calculation. Also, 2012-13 data marked a slight methodological change in how the data is calculated. Each CIP code’s required number of ‘catalog hours’ was switched to the officially approved hours as reported within the Board of Governors’ Academic Program Inventory – instead of the catalog hours reported by the university on the HTD files. The data shown above is based on queries by the Board of Governors staff of the State University Database System (SUDS). However, FAMU staff have calculated a different 2012-13 rate (of 31%), and a different 2013-14 rate (of 34%). The BOG and university staff will continue to work to resolve this discrepancy before the March 1st deadline for Performance Based Funding.
TABLE 4K. Undergraduate Course Offerings
Fall 2009 Fall 2010 Fall 2011 Fall 2012 Fall 2013
Number of Course Sections
1,361 1,430 1,422 1,383 1,328
Percentage of Undergraduate Course Sections by Class Size Fewer than 30 Students 53% 50% 48% 51% 55% 30 to 49 Students 29% 30% 33% 33% 32% 50 to 99 Students 17% 16% 15% 15% 11% 100 or More Students 1% 4% 4% 2% 1%
Notes: This data is based on Common Data Set (CDS) definitions. According to CDS, a “class section is an organized course offered for credit, identified by discipline and number, meeting at a stated time or times in a classroom or similar setting, and not a subsection such as a laboratory or discussion session. Undergraduate class sections are defined as any sections in which at least one degree-seeking undergraduate student is enrolled for credit. Exclude distance learning classes and noncredit classes and individual instruction such as dissertation or thesis research, music instruction, or one-to-one readings. Exclude students in independent study, co-operative programs, internships, foreign language taped tutor sessions, practicums, and all students in one-on-one classes.

32
Annual Accountability Report 2013-2014
FLORIDA A&M UNIVERSITY
APPROVED BY BOT 1‐14‐2015
Section 4 – Undergraduate Education (continued)
TABLE 4L. Percentage of Undergraduate Credit Hours Taught by Instructor Type
2009-10 2010-11 2011-12 2012-13 2013-14 Faculty 78% 73% 72% 76% 77% Adjunct Faculty 19% 26% 27% 18% 22% Graduate Students 3% 0% 0% 0% 0% Other Instructors 1% 1% 1% 6% 1% Note: The total number of undergraduate state fundable credit hours taught will be divided by the undergraduate credit hours taught by each instructor type to create a distribution of the percentage taught by each instructor type. Four instructor types are defined as faculty (pay plans 01, 02, and 22), OPS faculty (pay plan 06), graduate student instructors (pay plan 05), and others (all other pay plans). If a course has more than one instructor, then the university’s reported allocation of section effort will determine the allocation of the course’s total credit hours to each instructor. The definition of faculty varies for Tables 4L, 4M and 4N. For Faculty Teaching Undergraduates, the definition of faculty is based on pay plans 01, 02, and 22.
TABLE 4M. Student/Faculty Ratio
Fall 2009 Fall 2010 Fall 2011 Fall 2012 Fall 2013
Ratio 18.3 20.0 21.3 19.0 16.9
Note: This data is based on Common Data Set (CDS) definitions. This is the Fall ratio of full-time equivalent students (full-time plus 1/3 part time) to full-time equivalent instructional faculty (full time plus 1/3 part time). The ratio calculations, exclude both faculty and students in stand-alone graduate or professional programs such as medicine, law, veterinary, dentistry, social work, business, or public health in which faculty teach virtually only graduate-level students. Undergraduate or graduate student teaching assistants are not counted as faculty.
TABLE 4N. Professional Licensure/Certification Exams for Undergraduates
Nursing: National Council Licensure Examination for Registered Nurses
2009 2010 2011 2012 2013 Examinees 70 72 73 84 82 First-time Pass Rate 90% 85% 85% 90% 74% National Benchmark 90% 89% 89% 92% 85%
Note: Pass rate for first-time examinees for the National Council Licensure Examination for Registered Nurses (NCLEX-RN) are based on the performance of graduates of baccalaureate nursing programs. National benchmark data is based on Jan-Dec NCLEX-RN results for first-time examinees from students in US-educated baccalaureate degree programs as published by the National Council of State Boards of Nursing.

33
Annual Accountability Report 2013-2014
FLORIDA A&M UNIVERSITY
APPROVED BY BOT 1‐14‐2015
Section 4 – Undergraduate Education (continued)
TABLE 4O. Post-Graduation Metrics
Percent of Bachelor’s Graduates Employed Full-time or Continuing their Education, One Year After Graduation
2008-09 2009-10 2010-11* 2011-12 2012-13 Percent Found Employed or Enrolled n/a n/a 63% 65% 69% Percent Found n/a n/a 90% 89% 90%
Notes: Percent Found Employed or Enrolled is based on the number of recent baccalaureate graduates who are either employed full-time or continuing their education within one year after graduation. The employed data now includes non-Florida data that is available from the Wage Record Interchange System 2 (known as “WRIS 2”) and Federal employee and military data that is available from the Federal Employment Data Exchange System (FEDES) initiative. Full-time employment is based on those who earned more than a full-time (40hrs a week) worker making minimum wage. Due to limitations in the data, the continuing enrollment data includes any enrollment the following year regardless of whether the enrollment was post-baccalaureate or not. Note: In 2010-11, non-Florida employment data was not included in the calculation. Percent Found refers to the percentage of graduates found in the dataset – including those that did not earn wages above the full-time threshold and those who were found outside of the one-year window. For more information about the methodology see: http://www.flbog.edu/about/budget/performance_funding.php. For more information about WRIS2 see: http://www.doleta.gov/performance/wris_2.cfm. For more information about FEDES see: http://www.ubalt.edu/jfi/fedes/.
Median Wages of Bachelor’s Graduates Employed Full-time in Florida, One Year After Graduation
2008-09 2009-10 2010-11 2011-12 2012-13 Median Wage n/a n/a $28,400 $30,000 $28,800 Percent Found n/a n/a 42% 39% 40%
Notes: Median Wage data is based on Florida’s annualized Unemployment Insurance (UI) wage data for those graduates who earned more than a full-time employee making minimum wage in the fiscal quarter a full year after graduation. This UI wage data does not include individuals who are self-employed, employed out of state, employed by the military or federal government, or those without a valid social security number. This wage data includes graduates who were both employed and enrolled. Wages rounded to nearest hundreds. Percent Found refers to the percentage of graduates found in the dataset – including those that did not earn wages above the full-time threshold and those who were found outside of the one-year window.

34
Annual Accountability Report 2013-2014
FLORIDA A&M UNIVERSITY
APPROVED BY BOT 1‐14‐2015
Section 5 – Graduate Education
TABLE 5A. Graduate Degree Program Changes in AY 2013-14
Title of Program
Six-digit
CIP
Code
Degree
Level
Date of
UBOT
Action
Starting
or Ending
Term
Date of
Board of
Governors Action
Comments
New Programs
Curriculum and Instruction 13.0301 Masters 6-Mar-14 FALL 2014
Terminated Programs
none
Programs Suspended for New Enrollments Trade and Industrial Teacher Education 13.132 Masters - SUMMER
2011
New Programs Considered By University But Not Approved
PhD School Psychology - Returned for Significant Revisions and Reconsideration of Degree MS Rehabilitation Studies - Returned for Significant Revisions and Reconsideration of Degree
Note: This table does not include new majors or concentrations added under an existing degree program CIP Code. This table reports the new and terminated program changes based on Board action dates between May 5, 2013 and May 4, 2014. New Programs are proposed new degree programs that have been completely through the approval process at the university and, if appropriate, the Board of Governors. Does not include new majors or concentrations added under an existing degree program CIP Code. Terminated Programs are degree programs for which the entire CIP Code has been terminated and removed from the university’s inventory of degree programs. Does not include majors or concentrations terminated under an existing degree program CIP Code if the code is to remain active on the academic degree inventory. Programs Suspended for New Enrollments are degree programs for which enrollments have been temporarily suspended for the entire CIP Code, but the program CIP Code has not been terminated. Does not include majors or concentrations suspended under an existing degree program CIP Code if the code is to remain active on the academic degree inventory and new enrollments in any active major will be reported. Programs included in this list may have been suspended for new enrollments sometime in the past and have continued to be suspended at least one term of this academic year. New Programs Considered by University But Not Approved includes any programs considered by the university board of trustees, or any committee of the board, but not approved for implementation. Also include any programs that were returned prior to board consideration by the university administration for additional development, significant revisions, or re-conceptualization; regardless of whether the proposal was eventually taken to the university board for approval. Count the returns once per program, not multiple times the proposal was returned for revisions, unless there is a total re-conceptualization that brings forward a substantially different program in a different CIP Code.

35
Annual Accountability Report 2013-2014
FLORIDA A&M UNIVERSITY
APPROVED BY BOT 1‐14‐2015
Section 5 – Graduate Education (continued) TABLE 5B. Graduate Degrees Awarded
2009-10 2010-11 2011-12 2012-13 2013-14
TOTAL (First Majors) 660 630 607 678 615 TOTAL (Second majors) 0 0 0 0 0 Masters and Specialist (first majors) 348 298 276 277 280
Research Doctoral (first majors) 15 22 23 23 23
Professional Doctoral (first majors) 297 310 308 378 312 Dentistry 0 0 0 0 0 Law 143 158 152 224 176 Medicine 0 0 0 0 0 Nursing Practice 0 0 0 0 0 Pharmacy 140 139 135 131 108 Physical Therapist 14 13 21 23 28 Veterinary Medicine 0 0 0 0 0 Other 0 0 0 0 0
Note: This table reports the total number of graduate level degrees that were awarded by academic year as well as the number by level. The table provides a breakout for the Professional Doctoral degrees.
TABLE 5C. Graduate Degrees Awarded in Areas of Strategic Emphasis [Includes Second Majors]
2009-10 2010-11 2011-12 2012-13 2013-14
STEM 57 50 68 62 48
HEALTH 207 205 202 219 207
GLOBALIZATION 0 0 0 0 0
EDUCATION 21 31 26 14 11
GAP ANALYSIS 0 0 0 0 0
SUBTOTAL 285 286 296 295 266
PSE PERCENT OF TOTAL 43% 45% 49% 44% 43%
Notes: This is a count of graduate degrees awarded within specific Programs of Strategic Emphasis, as determined by the Board of Governors staff with consultation with business and industry groups and input from universities – for more information see: http://www.flbog.edu/pressroom/strategic_emphasis/. The Board of Governors revised the list of Programs of Strategic Emphasis in November 2013, and the new categories were applied to the historical degrees. A student who has multiple majors in the subset of targeted Classification of Instruction Program codes will be counted twice (i.e., double-majors are included). Note: The denominator used in the percentage includes second majors.

36
Annual Accountability Report 2013-2014
FLORIDA A&M UNIVERSITY
APPROVED BY BOT 1‐14‐2015
Section 5 – Graduate Education (continued) TABLE 5D. Professional Licensure Exams for Graduate Programs
Law: Florida Bar Exam
2010 2011 2012 2013 2014
Examinees 108 144 123 175 157 First-time Pass Rate 61% 63% 67% 73% 73% State Benchmark 79% 82% 81% 80% 74%
Pharmacy: North American Pharmacist Licensure Exam
2009 2010 2011 2012 2013
Examinees 116 133 142 130 123
First-time Pass Rate 82% 72% 87% 88% 85% National Benchmark 97% 94% 96% 97% 96% Physical Therapy: National Physical Therapy Examinations
2007-09 2008-10 2009-11 2010-12 2011-13
Examinees 58 59 40 44 58 First-time Pass Rate 40% 45% 48% 47% 46% National Benchmark 87% 87% 89% 89% 89% Occupational Therapy: National Board for Certification in Occupational Therapy Exam
2009 2010 2011 2012 2013
Examinees . . . . 13
First-time Pass Rate . . . . 92% National Benchmark . . . . 80% Note: We have chosen to compute a three-year average pass rate for first-time examinees on the National Physical Therapy Examinations by exam year, rather than report the annual averages, because of the relatively small cohort sizes. Due to changes in accreditation policy, the National Board for Certification in Occupational Therapy (OTR) Examinations no longer report first-time pass rates. The pass rates are now ‘New Graduates’ pass rates and represent the ultimate pass rate, or the percentage of students who passed regardless of how many times the exam was taken. The Occupational Therapy exam is a national standardized examination. The passing score on the exam is used by states to award a license to a graduate wishing to practice as an occupational therapist in that state.

37
Annual Accountability Report 2013-2014
FLORIDA A&M UNIVERSITY
APPROVED BY BOT 1‐14‐2015
Section 6 – Research and Economic Development
TABLE 6A. Research and Development
2008-09 2009-10 2010-11 2011-12 2012-13
R&D Expenditures Total (S&E and non-S&E) ($ 1,000s)
$27,018 $53,474 $53,326 $52,263 $51,149
Federally Funded ($ 1,000s)
$23,535 $45,856 $44,905 $44,343 $39,675
Percent Funded From External Sources 98% 90% 88% 86% 80%
Total R&D Expenditures Per Full-Time, Tenured, Tenure-Earning Faculty Member ($)
$57,731 $116,755 $122,871 $128,410 $128,515
Technology Transfer
Invention Disclosures 16 13 12 31 11
U.S. Patents Issued 0 6 2 5 5
Patents Issued Per 1,000 Full-Time, Tenured and Tenure-Earning Faculty
0 12 5 12 5
Licenses/ Options Executed 0 0 0 0 0
Licensing Income Received ($) $7,500 $0 $0 $0 $0
Number of Start-Up Companies 0 0 0 0 0
Note: R&D Expenditures are based on the National Science Foundation’s annual Survey of R&D Expenditures at Universities and Colleges (data include Science & Engineering and non-Science & Engineering awards). Percent Funded from External Sources is defined as funds from federal, private industry and other sources (non-state and non-institutional funds). Total R&D expenditures are divided by fall, full-time tenured/tenure-track faculty as reported to IPEDS (FGCU includes both tenured/tenure-track and non-tenure/track faculty). The fall faculty year used will align with the beginning of the fiscal year, so that (e.g.) 2007 FY R&D expenditures are divided by fall 2006 faculty. Technology Transfer data are based on the Association of University Technology Managers Annual Licensing Survey. Licensing Income Received refers to license issue fees, payments under options, annual minimums, running royalties, termination payments, amount of equity received when cashed-in, and software and biological material end-user license fees of $1,000 or more, but not research funding, patent expense reimbursement, valuation of equity not cashed-in, software and biological material end-user license fees of less than $1,000, or trademark licensing royalties from university insignia. Number of Start-up Companies that were dependent upon the licensing of University technology for initiation.