2013 accountability system design assessment & accountability, plano isd
TRANSCRIPT
2013 Accountability System Design
Assessment & Accountability, Plano ISD
State Accountability Development 2013 ...2
2013 Accountability Goals
12/12/2012
Improving student achievement at all levels in the core subjects of the state curriculum.*
Ensuring the progress of all students toward achieving Advanced Academic Performance.*
Closing Advanced Academic Performance level gaps among groups.*
Closing gaps among groups in the percentage of students graduating under the recommended high school program and advanced high school program.*
Rewarding excellence based on other indicators in addition to state assessment results.
* These goals are specified in Chapter 39.053(f) of the Texas Education Code.
State Accountability Development 2013 ...3
Indicators Used in Accountability
12/12/2012
STAAR grades 3-8 English,
STAAR grades 3-5 Spanish,
STAAR End-of-Course (EOC) assessments* including retests,
Dropout Rates grades 9-12 or district completion rates, and
High School Graduation Rates.
Grade 11 TAKS performance must also be included in the 2013 ratings.
EOC results for students enrolled below grade 9 must be combined with assessment results for other students in the same grade.
State Accountability Development 2013 ...4
Assessment Indicators Must Evaluate
12/12/2012
Level II performance, and for students who do not meet the Level II standard, progress toward the Level II standard.
Level III performance, and for students who do not meet the Level III standard, progress toward the Level III standard.
Level III performance cannot be evaluated in 2013.
Assessment indicators must combine performance across grades for each subject area.
Indicators must be based on information that is disaggregated by race, ethnicity, and socioeconomic status.
State Accountability Development 2013 ...5
Performance Index Framework
12/12/2012
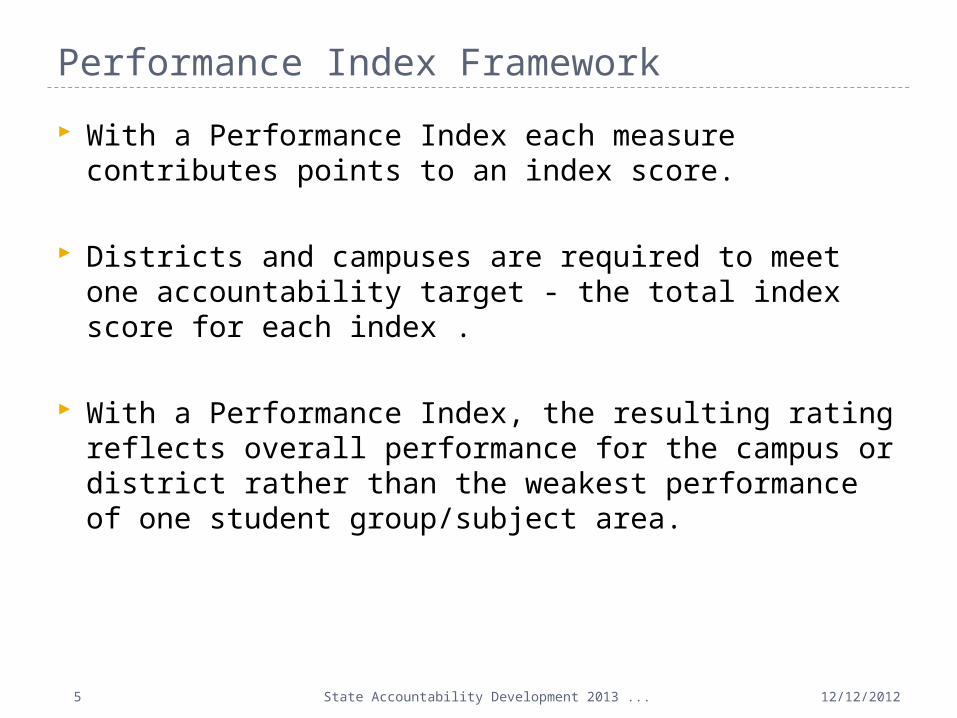
With a Performance Index each measure contributes points to an index score.
Districts and campuses are required to meet one accountability target - the total index score for each index .
With a Performance Index, the resulting rating reflects overall performance for the campus or district rather than the weakest performance of one student group/subject area.
State Accountability Development 2013 ...6
Performance Index Framework
12/12/2012
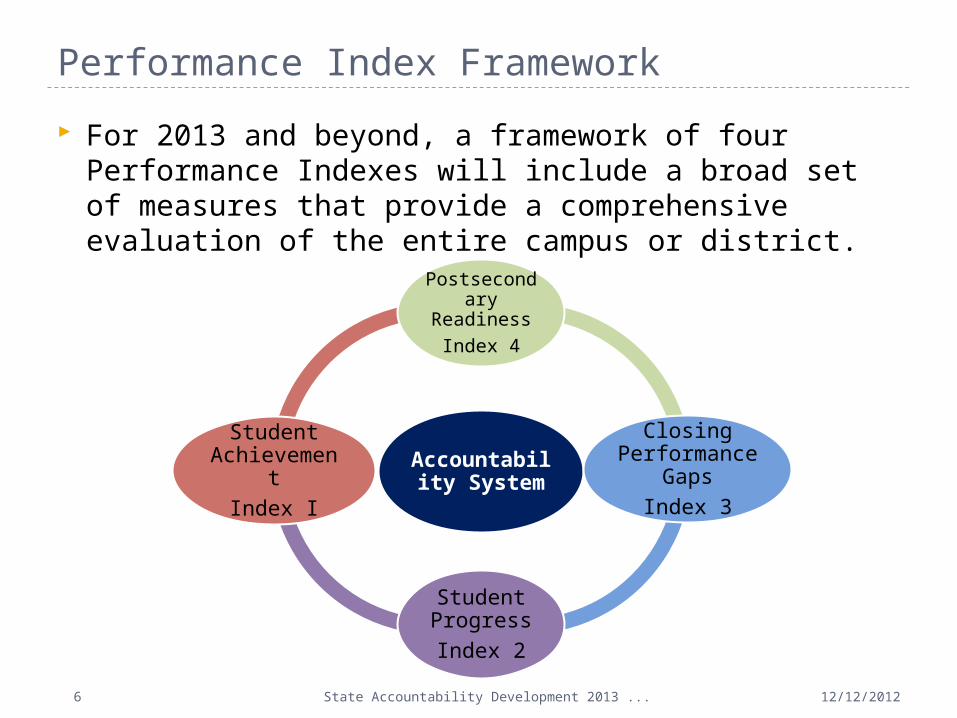
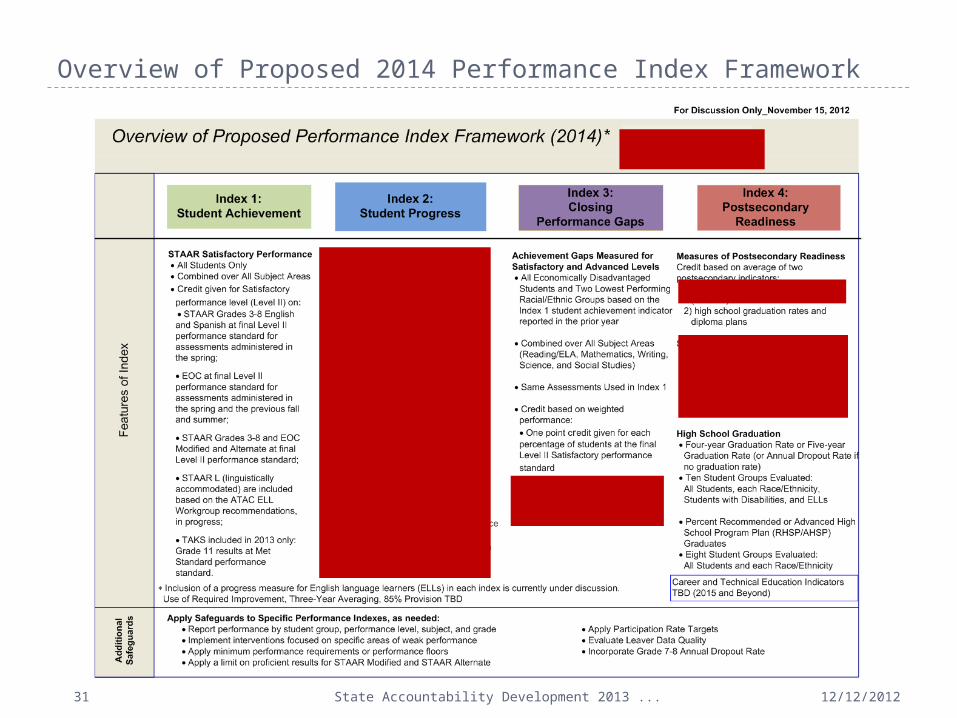
For 2013 and beyond, a framework of four Performance Indexes will include a broad set of measures that provide a comprehensive evaluation of the entire campus or district.
Accountability System
Postsecondary
ReadinessIndex 4
Closing Performance
GapsIndex 3
Student ProgressIndex 2
Student Achievement
Index I
State Accountability Development 2013 ...7
Index 1: Student Achievement
12/12/2012
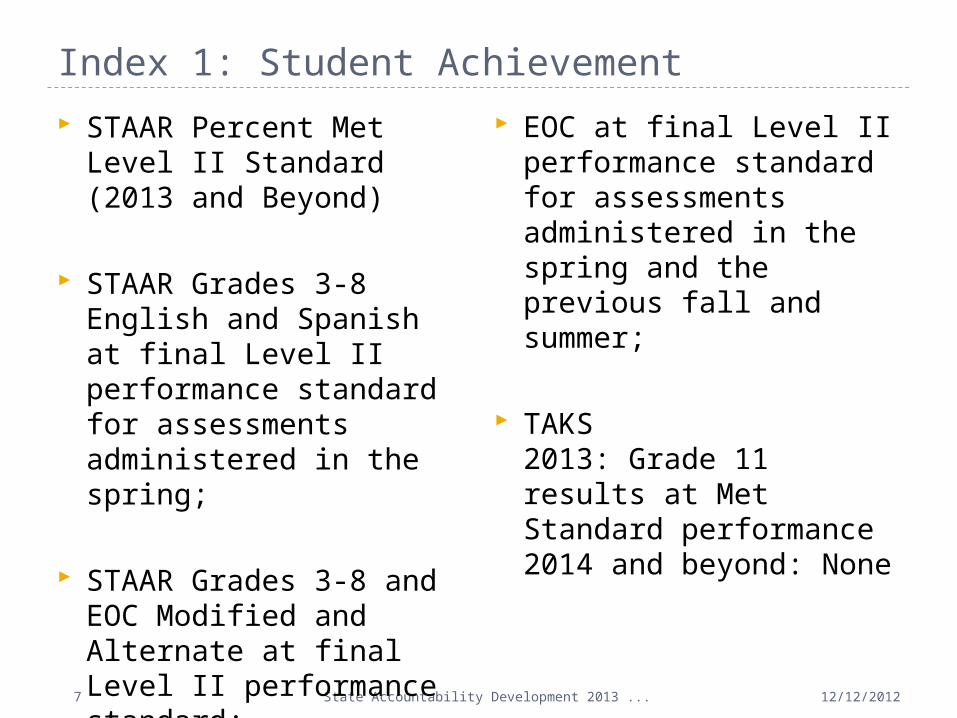
STAAR Percent Met Level II Standard (2013 and Beyond)
STAAR Grades 3-8 English and Spanish at final Level II performance standard for assessments administered in the spring;
STAAR Grades 3-8 and EOC Modified and Alternate at final Level II performance standard;
EOC at final Level II performance standard for assessments administered in the spring and the previous fall and summer;
TAKS2013: Grade 11 results at Met Standard performance2014 and beyond: None
State Accountability Development 2013 ...8
Index 1: Student Achievement
12/12/2012
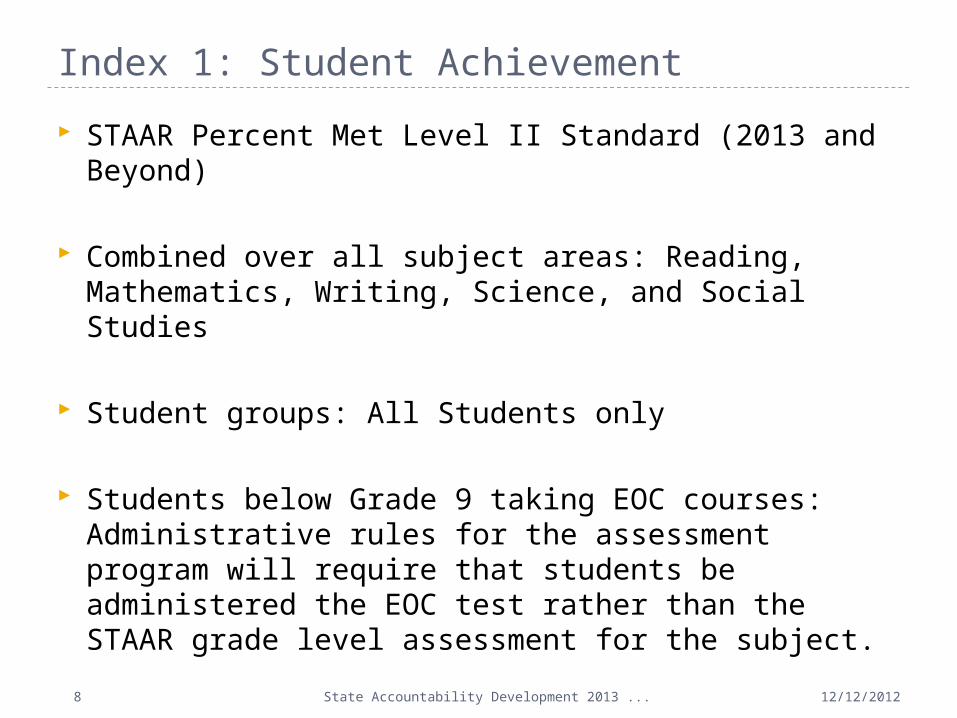
STAAR Percent Met Level II Standard (2013 and Beyond)
Combined over all subject areas: Reading, Mathematics, Writing, Science, and Social Studies
Student groups: All Students only
Students below Grade 9 taking EOC courses: Administrative rules for the assessment program will require that students be administered the EOC test rather than the STAAR grade level assessment for the subject.
State Accountability Development 2013 ...9
Index 1: Student Achievement
12/12/2012
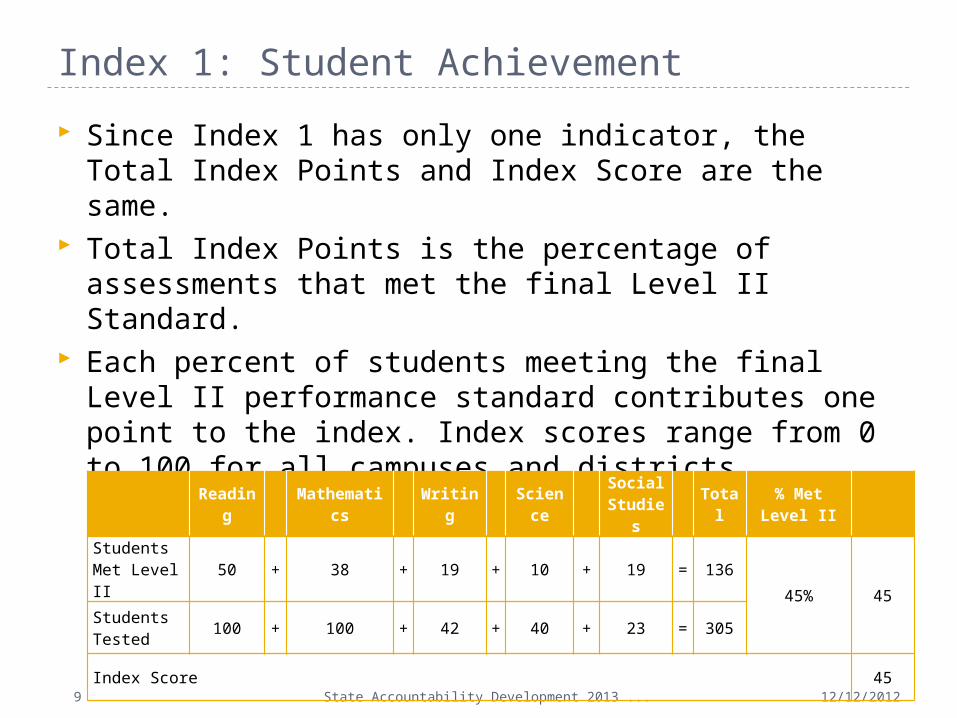
Since Index 1 has only one indicator, the Total Index Points and Index Score are the same.
Total Index Points is the percentage of assessments that met the final Level II Standard.
Each percent of students meeting the final Level II performance standard contributes one point to the index. Index scores range from 0 to 100 for all campuses and districts.
Reading Mathematics Writing Science SocialStudies Total % Met Level
II
Students Met Level II 50 + 38 + 19 + 10 + 19 = 136
45% 45Students Tested 100 + 100 + 42 + 40 + 23 = 305
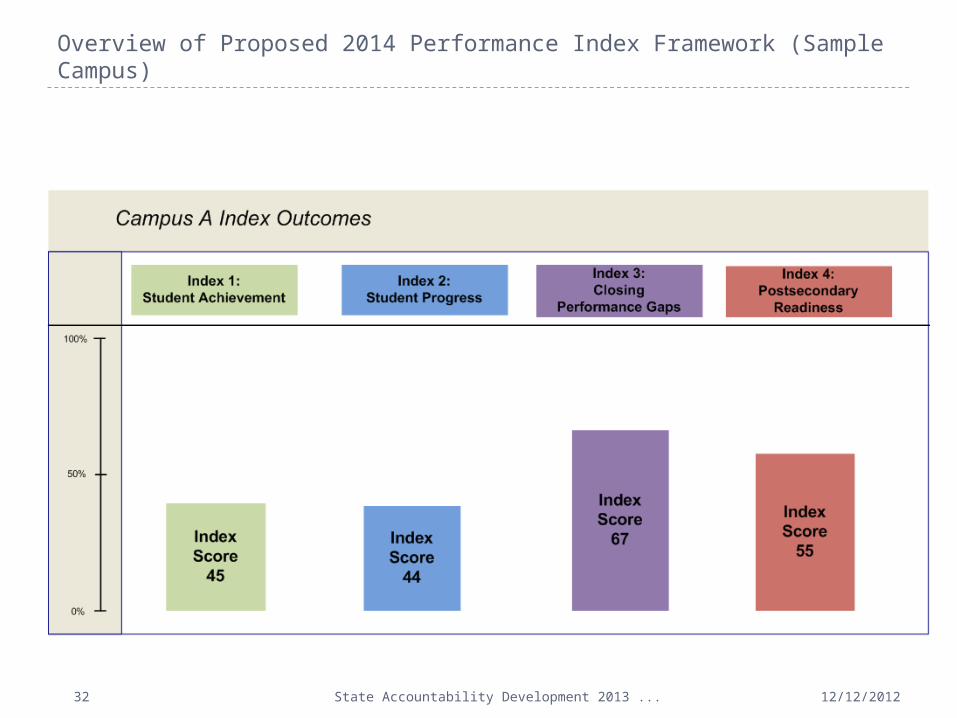
Index Score 45
State Accountability Development 2013 ...10
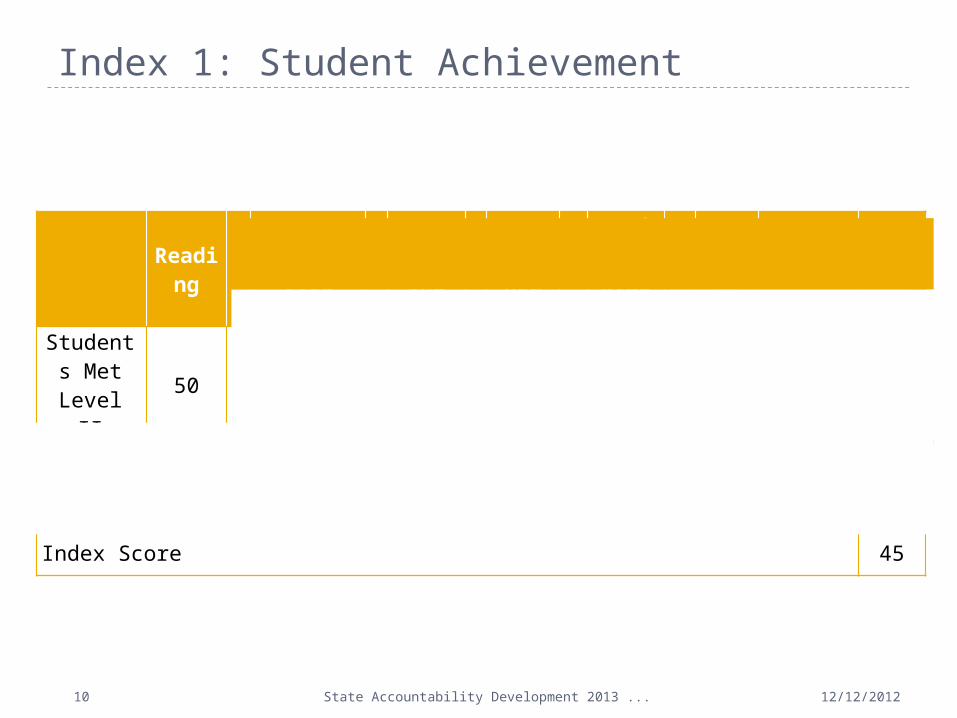
Reading
Mathematics
Writing
Science
SocialStudie
sTotal % Met
Level IIStudents Met Level
II50 + 38 + 19 + 10 + 19 = 136
45% 45Students
Tested 100 + 100 + 42 + 40 + 23 = 305
Index Score 45
Index 1: Student Achievement
12/12/2012
State Accountability Development 2013 ...11
Index 1: Student Achievement - ELL
12/12/2012
2013: Students in U.S. schools Year 1 through Year 3 excluded Students in U.S. schools Year 4 and beyond
- Included at final Level II performance standard Exceptions: asylees/refugees in U.S. schools Year 1 through Year
5 excluded; immigrants entering at Grade 9 or above excluded
2014 and beyond: Students in U.S. schools Year 1 excluded Students in U.S. schools Year 2 through Year 4:
- English-version tests included using ELL Development Model; - Spanish-version tests TBD
Students in U.S. schools Year 5 and beyond included at final Level II performance standard
Exceptions: asylees/refugees in U.S. schools Year 1 through Year 5 excluded; immigrants entering at Grade 9 or above excluded
State Accountability Development 2013 ...12
Index 2: Student Progress
12/12/2012
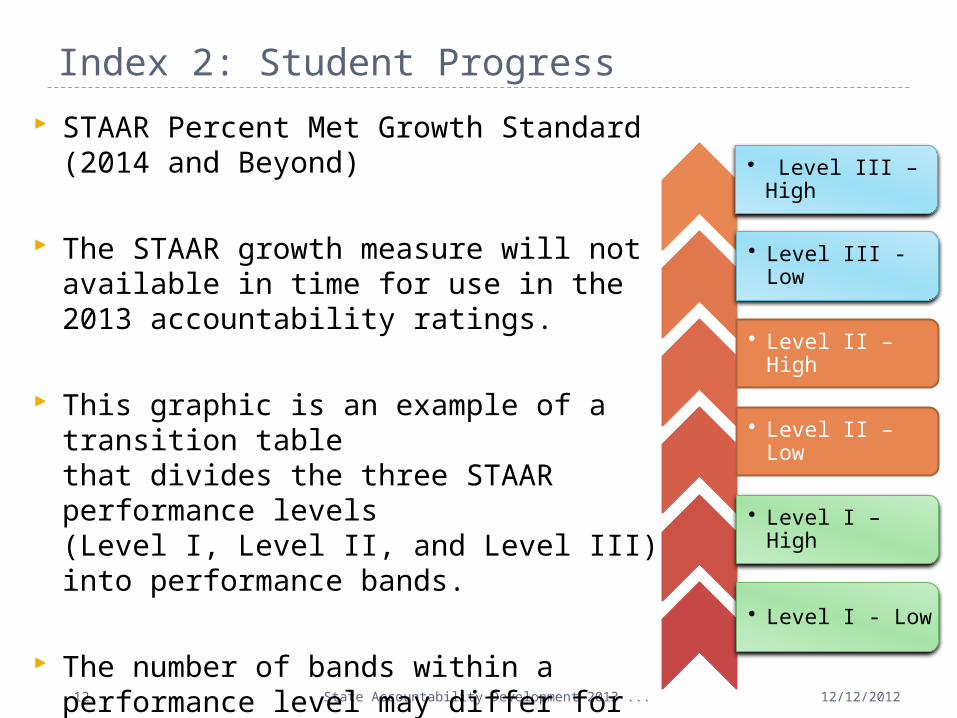
STAAR Percent Met Growth Standard (2014 and Beyond)
The STAAR growth measure will not available in time for use in the 2013 accountability ratings.
This graphic is an example of a transition table that divides the three STAAR performance levels (Level I, Level II, and Level III) into performance bands.
The number of bands within a performance level may differ for the final growth measure adopted.
• Level III – High
• Level III - Low
• Level II – High
• Level II – Low
• Level I – High
• Level I - Low
State Accountability Development 2013 ...13
Index 2: Student Progress
12/12/2012
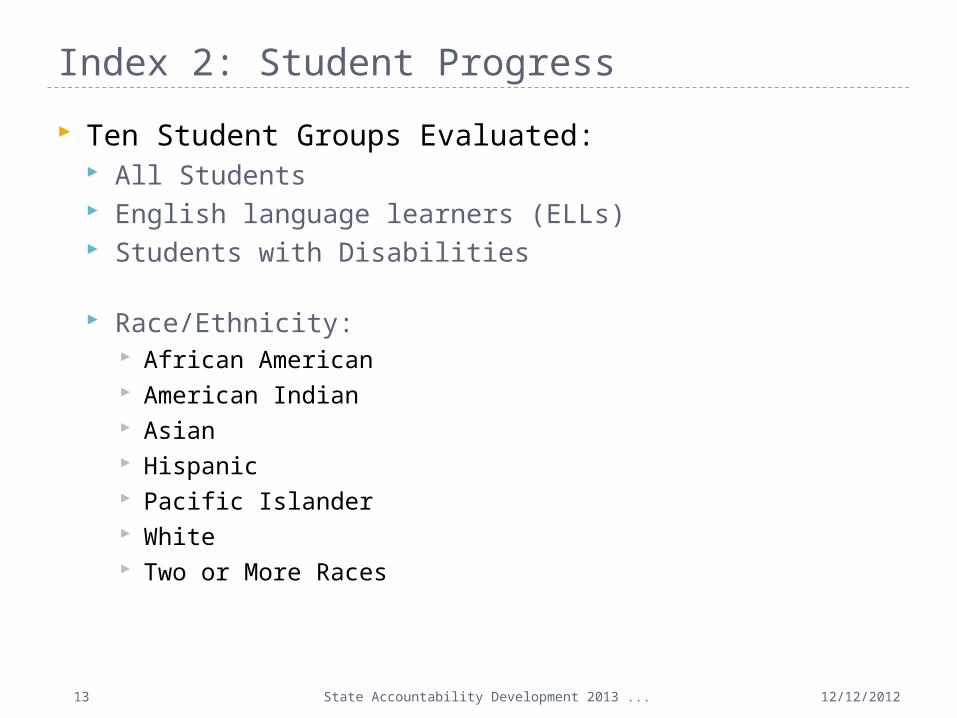
Ten Student Groups Evaluated: All Students English language learners (ELLs) Students with Disabilities
Race/Ethnicity: African American American Indian Asian Hispanic Pacific Islander White Two or More Races
State Accountability Development 2013 ...14
Index 2: Student Progress
12/12/2012
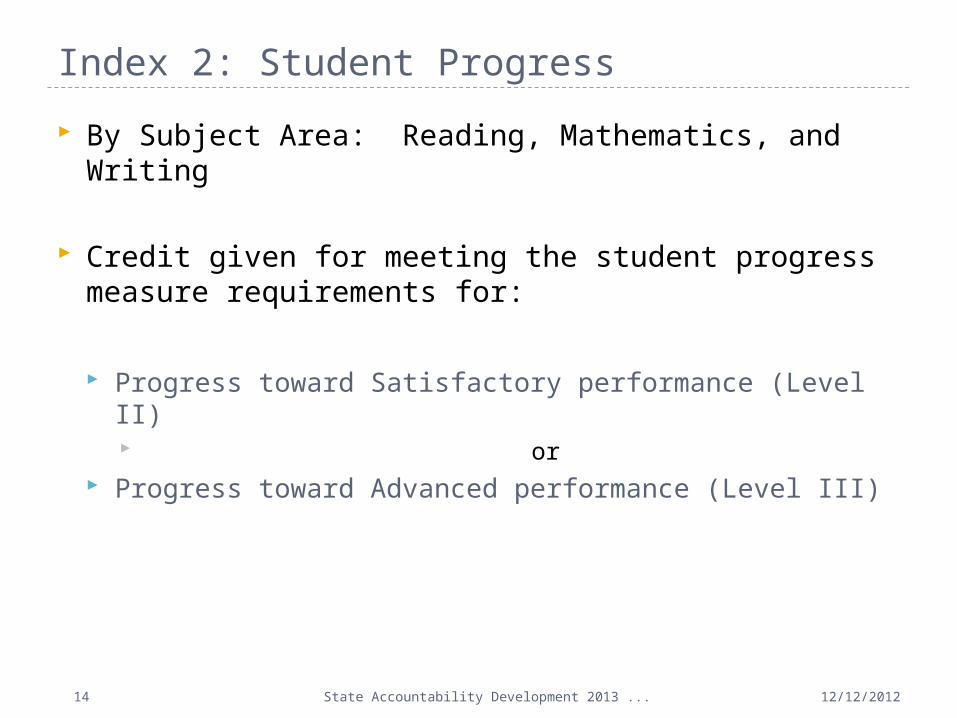
By Subject Area: Reading, Mathematics, and Writing
Credit given for meeting the student progress measure requirements for:
Progress toward Satisfactory performance (Level II) or
Progress toward Advanced performance (Level III)
State Accountability Development 2013 ...16
Indicator All African Amer.
Amer. Indian Asian Hispan
icPacific Island
erWhite Two or
More ELL Special Ed.
Total Points
Max.Points
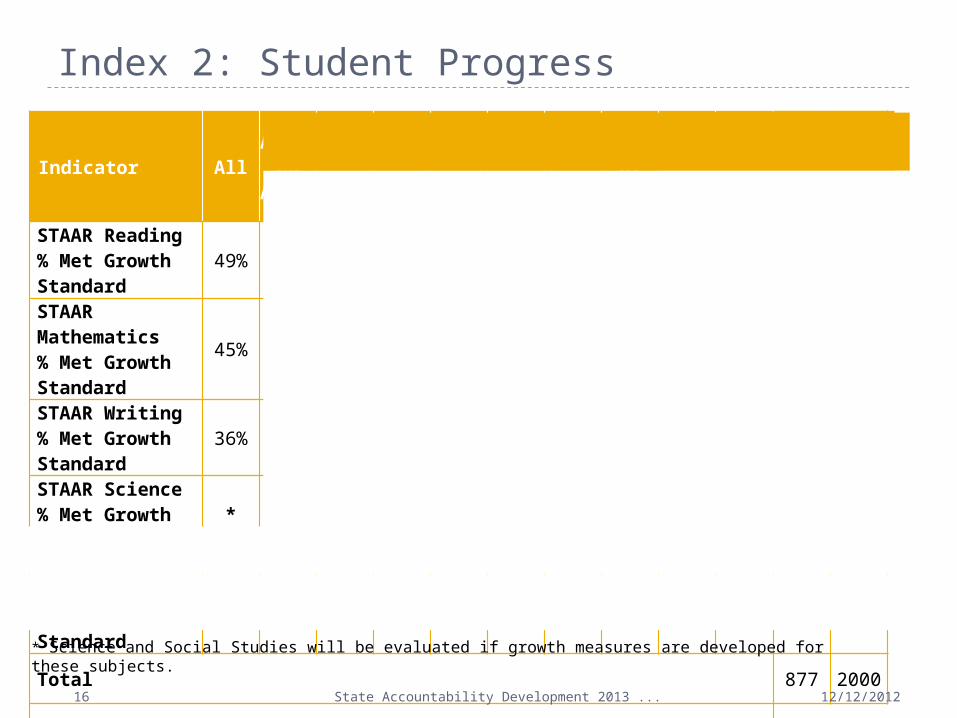
STAAR Reading% Met Growth Standard
49% 36% 60% 43% 58% 40% 35% 56% 377 800
STAAR Mathematics% Met Growth Standard
45% 31% 65% 48% 52% 45% 30% 50% 366 800
STAAR Writing% Met Growth Standard
36% 30% 40% 28% 134 400
STAAR Science% Met Growth Standard
* * * * * * * * * * * *
STAAR Social Studies% Met Growth Standard
* * * * * * * * * * * *
Total 877 2000
Index Score (total points divided by maximum points) 44
Index 2: Student Progress
12/12/2012
* Science and Social Studies will be evaluated if growth measures are developed for these subjects.
State Accountability Development 2013 ...17
Index 3: Closing Performance Gaps
12/12/2012
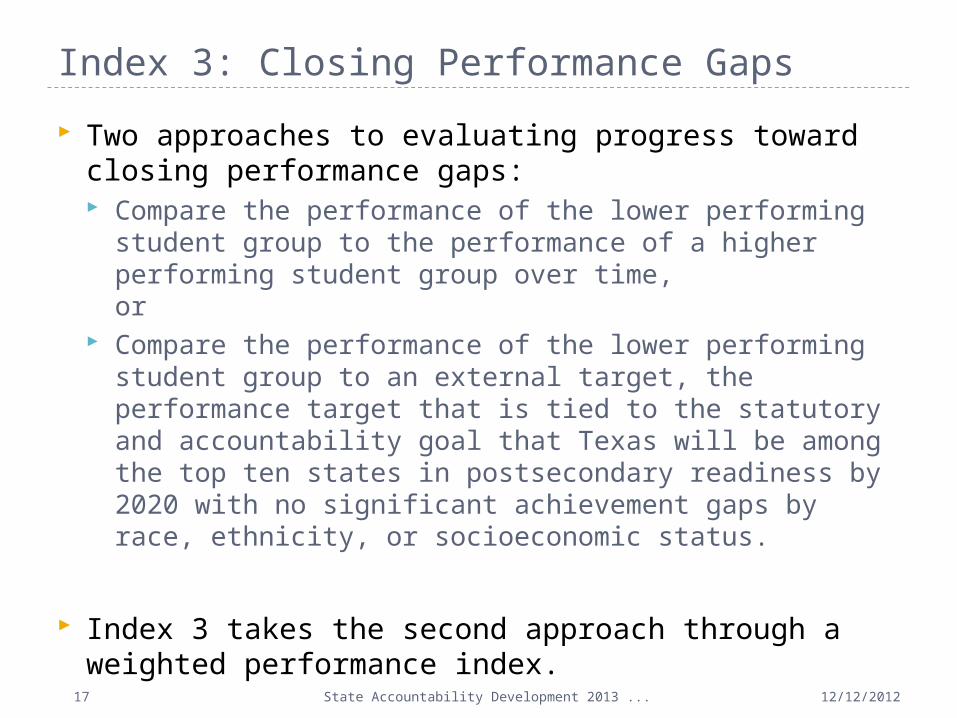
Two approaches to evaluating progress toward closing performance gaps: Compare the performance of the lower performing
student group to the performance of a higher performing student group over time, or
Compare the performance of the lower performing student group to an external target, the performance target that is tied to the statutory and accountability goal that Texas will be among the top ten states in postsecondary readiness by 2020 with no significant achievement gaps by race, ethnicity, or socioeconomic status.
Index 3 takes the second approach through a weighted performance index.
State Accountability Development 2013 ...18
Index 3: Closing Performance Gaps
12/12/2012
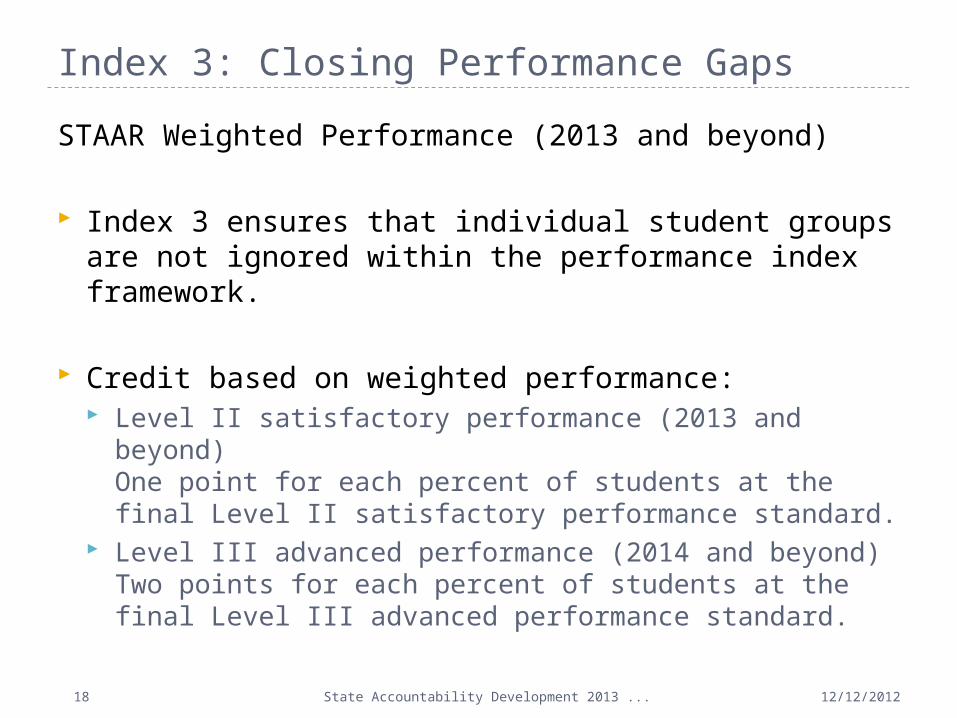
STAAR Weighted Performance (2013 and beyond)
Index 3 ensures that individual student groups are not ignored within the performance index framework.
Credit based on weighted performance: Level II satisfactory performance (2013 and beyond)
One point for each percent of students at the final Level II satisfactory performance standard.
Level III advanced performance (2014 and beyond) Two points for each percent of students at the final Level III advanced performance standard.
State Accountability Development 2013 ...19
Index 3: Closing Performance Gaps
12/12/2012
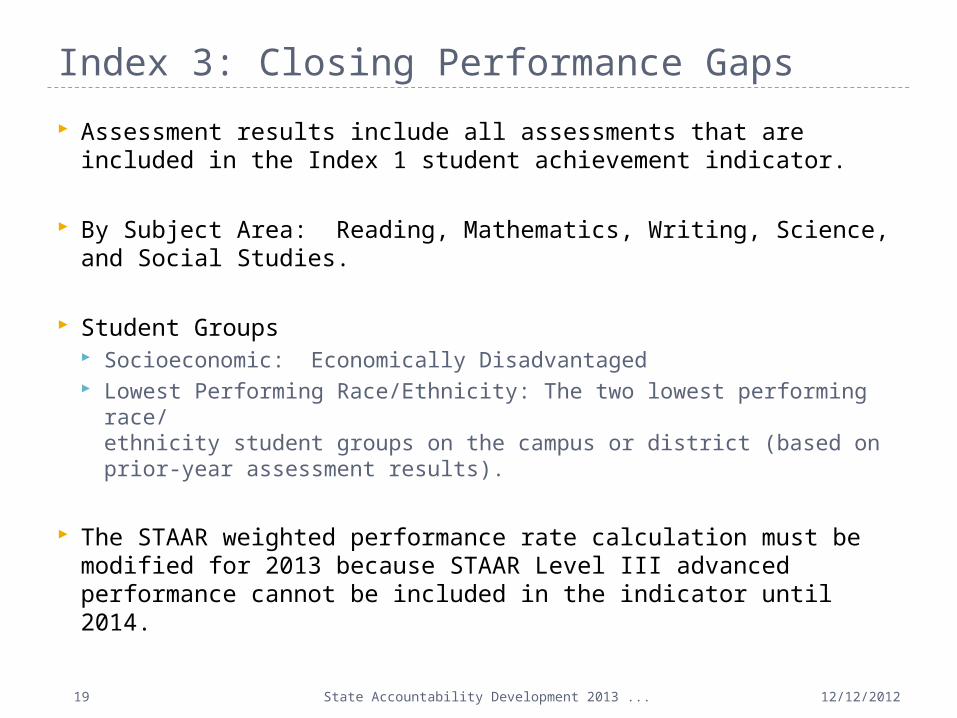
Assessment results include all assessments that are included in the Index 1 student achievement indicator.
By Subject Area: Reading, Mathematics, Writing, Science, and Social Studies.
Student Groups Socioeconomic: Economically Disadvantaged Lowest Performing Race/Ethnicity: The two lowest performing
race/ethnicity student groups on the campus or district (based on prior-year assessment results).
The STAAR weighted performance rate calculation must be modified for 2013 because STAAR Level III advanced performance cannot be included in the indicator until 2014.
State Accountability Development 2013 ...20
STAAR Reading Weighted Performance Rate
Economically Disadvantaged
Lowest Performing Race/Ethnic
Group - 1
Lowest Performing Race/Ethnic
Group - 2
Total Points
MaximumPoints
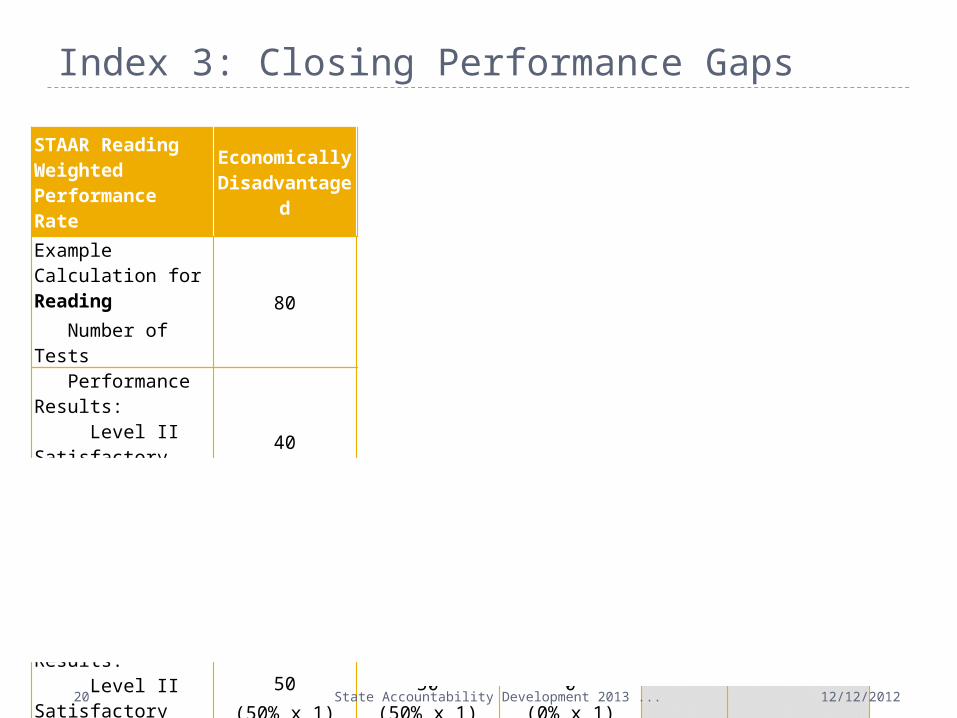
Example Calculation for Reading Number of Tests
80 40 20
Performance Results: Level II Satisfactory Number Percent
4050%
2050%
00%
Level III Advanced Number Percent
4050%
00%
20100%
Weighted Results: Level II Satisfactory (one point credit)
50(50% x 1)
50(50% x 1)
0(0% x 1)
Level III Advanced (two point credit)
100(50% x 2)
0(0% x 2)
200(100% x 2)
Reading Weighted Performance Rate 150 50 200 400 600
Index 3: Closing Performance Gaps
12/12/2012
State Accountability Development 2013 ...21
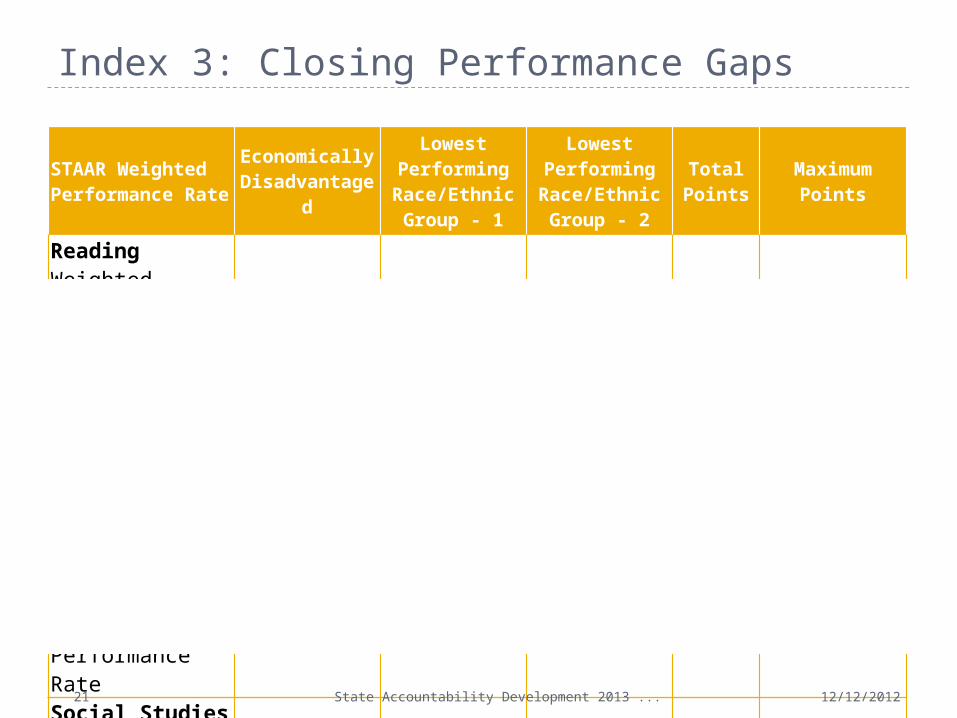
STAAR Weighted Performance Rate
Economically Disadvantaged
Lowest Performing Race/Ethnic
Group - 1
Lowest Performing Race/Ethnic
Group - 2
Total Points
MaximumPoints
Reading Weighted Performance Rate 150 50 200 400 600
Mathematics Weighted Performance Rate
125 100 90 315 600
Writing Weighted Performance Rate 80 90 125 295 600
Science Weighted Performance Rate 120 40 90 250 600
Social Studies Weighted Performance Rate
50 40 80 170 600
Total 1430 3000
Index Score (total points divided by maximum points) 48
Index 3: Closing Performance Gaps
12/12/2012
State Accountability Development 2013 ...22
Index 4: Postsecondary Readiness
12/12/2012
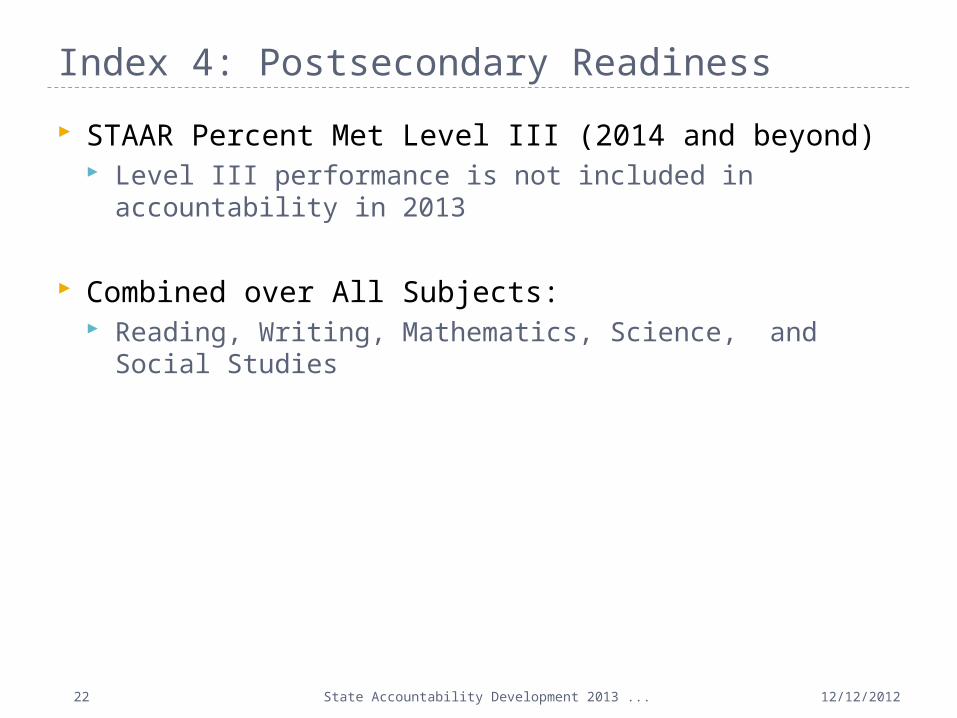
STAAR Percent Met Level III (2014 and beyond) Level III performance is not included in accountability in
2013
Combined over All Subjects: Reading, Writing, Mathematics, Science, and Social
Studies
State Accountability Development 2013 ...23
Index 4: Postsecondary Readiness
12/12/2012
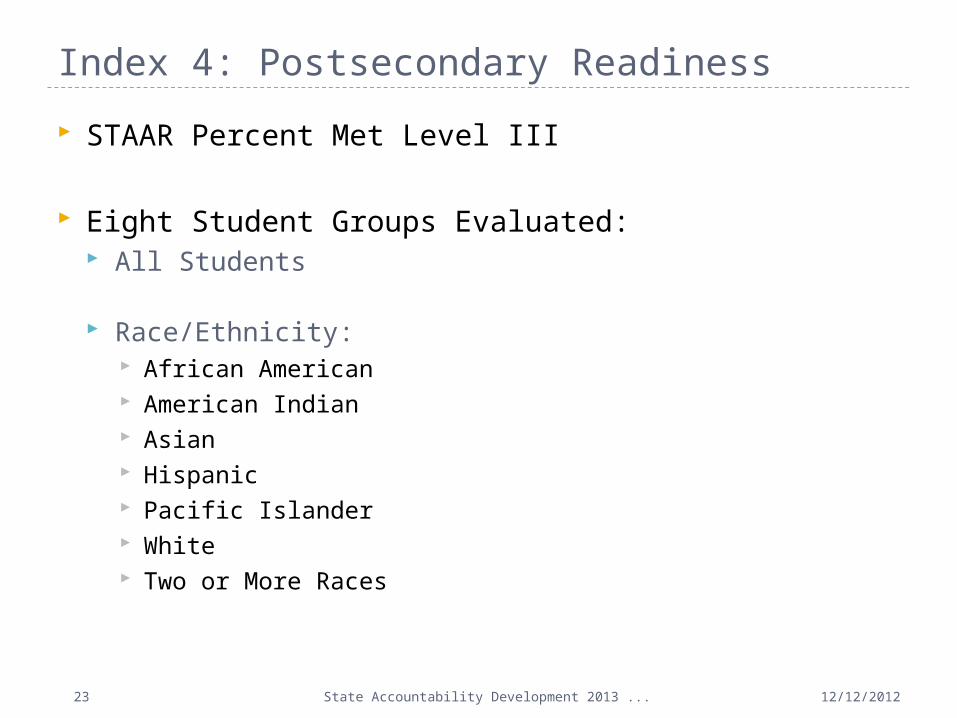
STAAR Percent Met Level III
Eight Student Groups Evaluated: All Students
Race/Ethnicity: African American American Indian Asian Hispanic Pacific Islander White Two or More Races
State Accountability Development 2013 ...24
Index 4: Postsecondary Readiness
12/12/2012
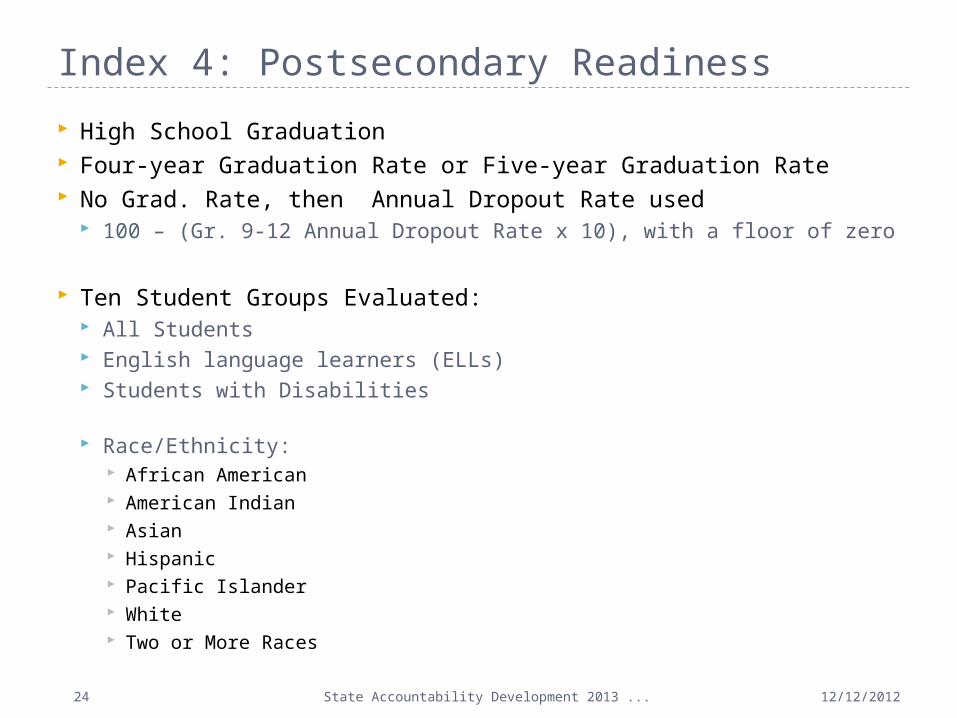
High School Graduation Four-year Graduation Rate or Five-year Graduation Rate No Grad. Rate, then Annual Dropout Rate used
100 – (Gr. 9-12 Annual Dropout Rate x 10), with a floor of zero
Ten Student Groups Evaluated: All Students English language learners (ELLs) Students with Disabilities
Race/Ethnicity: African American American Indian Asian Hispanic Pacific Islander White Two or More Races
State Accountability Development 2013 ...25
Index 4: Postsecondary Readiness
12/12/2012
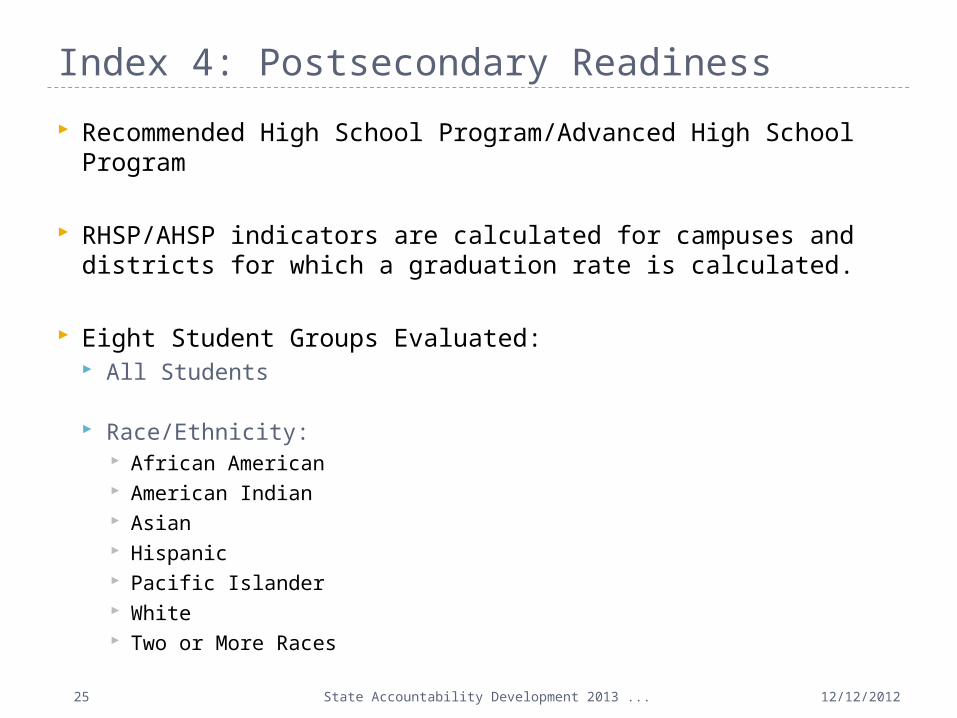
Recommended High School Program/Advanced High School Program
RHSP/AHSP indicators are calculated for campuses and districts for which a graduation rate is calculated.
Eight Student Groups Evaluated: All Students
Race/Ethnicity: African American American Indian Asian Hispanic Pacific Islander White Two or More Races
State Accountability Development 2013 ...26
Index 4: Postsecondary Readiness
12/12/2012
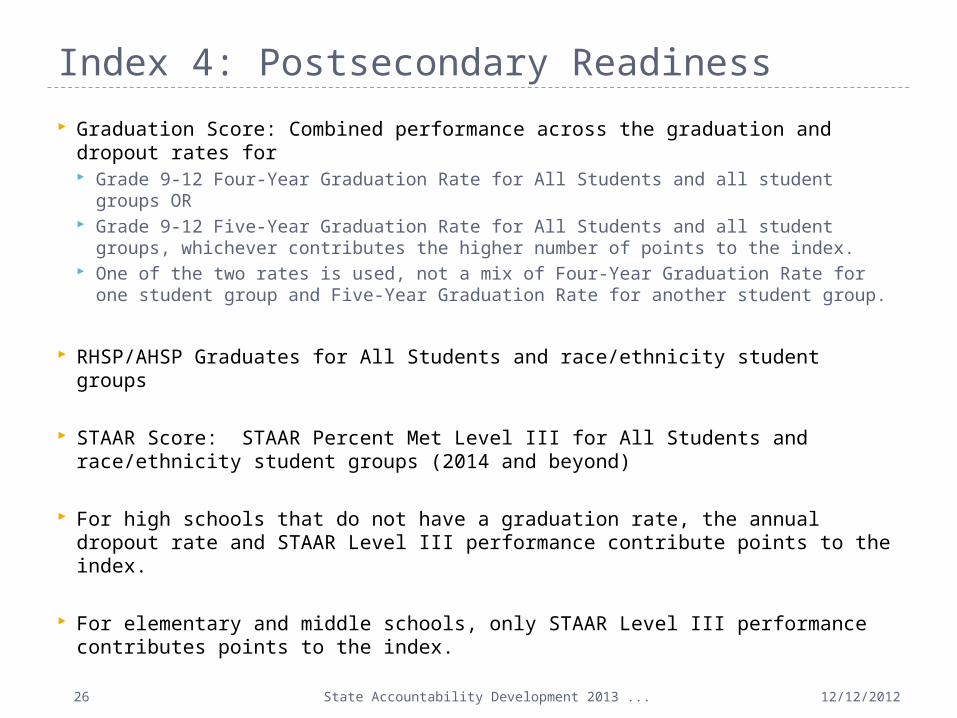
Graduation Score: Combined performance across the graduation and dropout rates for Grade 9-12 Four-Year Graduation Rate for All Students and all student groups
OR Grade 9-12 Five-Year Graduation Rate for All Students and all student groups,
whichever contributes the higher number of points to the index. One of the two rates is used, not a mix of Four-Year Graduation Rate for one
student group and Five-Year Graduation Rate for another student group.
RHSP/AHSP Graduates for All Students and race/ethnicity student groups
STAAR Score: STAAR Percent Met Level III for All Students and race/ethnicity student groups (2014 and beyond)
For high schools that do not have a graduation rate, the annual dropout rate and STAAR Level III performance contribute points to the index.
For elementary and middle schools, only STAAR Level III performance contributes points to the index.
State Accountability Development 2013 ...27
Index 4: Postsecondary Readiness
12/12/2012
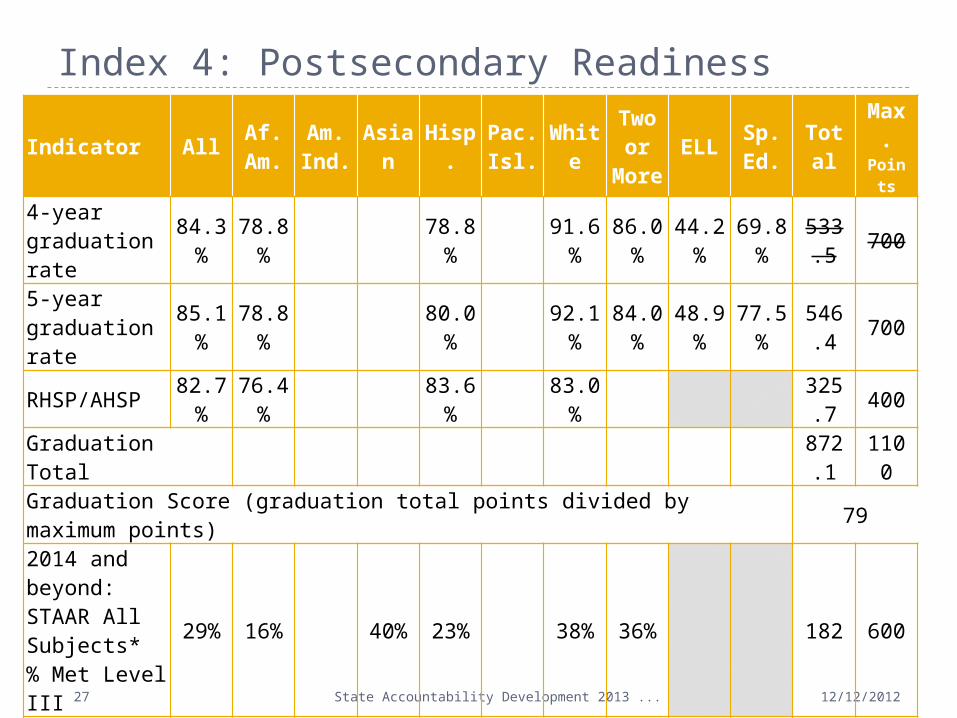
Indicator All Af. Am.
Am. Ind. Asian Hisp. Pac.
Isl. WhiteTwo or
MoreELL Sp.
Ed. Total Max.Points
4-year graduation rate 84.3% 78.8% 78.8% 91.6% 86.0% 44.2% 69.8% 533.
5 700
5-year graduation rate 85.1% 78.8% 80.0% 92.1% 84.0% 48.9% 77.5% 546.
4 700
RHSP/AHSP 82.7% 76.4% 83.6% 83.0% 325.7 400
Graduation Total 872.1 1100
Graduation Score (graduation total points divided by maximum points) 79
2014 and beyond:STAAR All Subjects*% Met Level III
29% 16% 40% 23% 38% 36% 182 600
STAAR Score (STAAR total points divided by maximum points) 30
Index Score (average of Graduation Score and STAAR Score: 79 + 30 / 2 = 55) 55
State Accountability Development 2013 ...29
Index 4: Postsecondary Readiness
12/12/2012
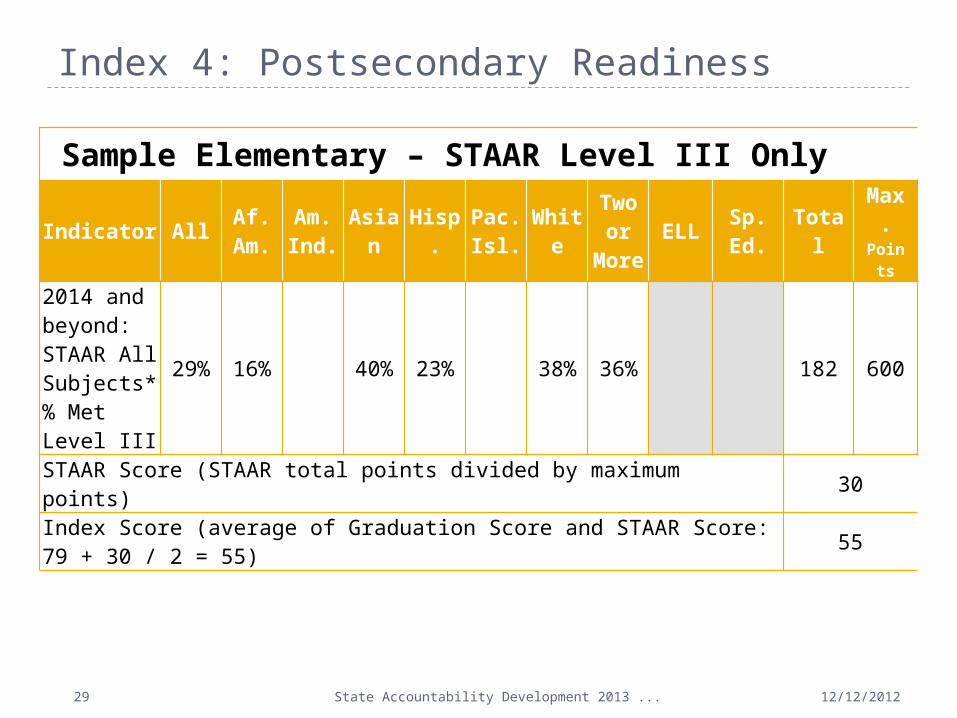
Sample Elementary – STAAR Level III Only
Indicator All Af. Am.
Am. Ind. Asian Hisp. Pac.
Isl. WhiteTwo or
MoreELL Sp.
Ed. Total Max.Points
2014 and beyond:STAAR All Subjects*% Met Level III
29% 16% 40% 23% 38% 36% 182 600
STAAR Score (STAAR total points divided by maximum points) 30
Index Score (average of Graduation Score and STAAR Score: 79 + 30 / 2 = 55) 55
State Accountability Development 2013 ...30
Index 4: Postsecondary Readiness- ELL
12/12/2012
2013: STAAR Level III not included in 2013
2014 and beyond: Students in U.S. schools Year 1 through Year 4 excluded Students in U.S. schools Year 5 and beyond included at
final Level III performance standard Exceptions: asylees/refugees excluded; immigrants
entering at Grade 9 or above excluded
State Accountability Development 2013 ...31
Overview of Proposed 2014 Performance Index Framework
12/12/2012
State Accountability Development 2013 ...32
Overview of Proposed 2014 Performance Index Framework (Sample Campus)
12/12/2012
State Accountability Development 2013 ...33
Apply Safeguards to Specific Performance Indexes
12/12/2012
Ensure reporting system disaggregates performance by student group, performance level, subject area, and grade,
Implement interventions focused on specific areas of weak performance,
Apply minimum performance requirements or performance floors,
Apply a limit on proficient results to STAAR Modified and STAAR Alternate, (CAP)
Apply Participation Rate Targets,
Ensure Leaver Data Quality,
Incorporate Grade 7 – 8 Annual Dropout Rate.
State Accountability Development 2013 ...34
Pending Issues For Consideration
12/12/2012
Evaluation of the four indexes to produce single accountability rating for campus or district,
Rating levels and labels,
Application of system safeguards,
Evaluation of alternative education campuses,
Transition Issues between 2013 and 2014,
Inclusion of a performance measure for English Language Learners (ELLs),
State and federal reporting.
State Accountability Development 2013 ...35
Federal Accountability for 2013
12/12/2012
TEA plans to submit a waiver request to the United States Department of Education (USDE) in January or February 2013.
The waiver will include a request to use the new state accountability system to evaluate campuses and districts in place of federal Adequate Yearly Progress (AYP) evaluations.
If denied, augment the proposed state accountability system to meet federal requirements.
If denied, use components (Reading and Mathematics) of the proposed performance index developed for state accountability to meet federal requirements.
State Accountability Development 2013 ...36
Academic Achievement Distinction Designations
State Accountability Ratings and Distinction Designations
12/12/2012
State Accountability Development 2013 ...37
Accountability Rating Labels
12/12/2012
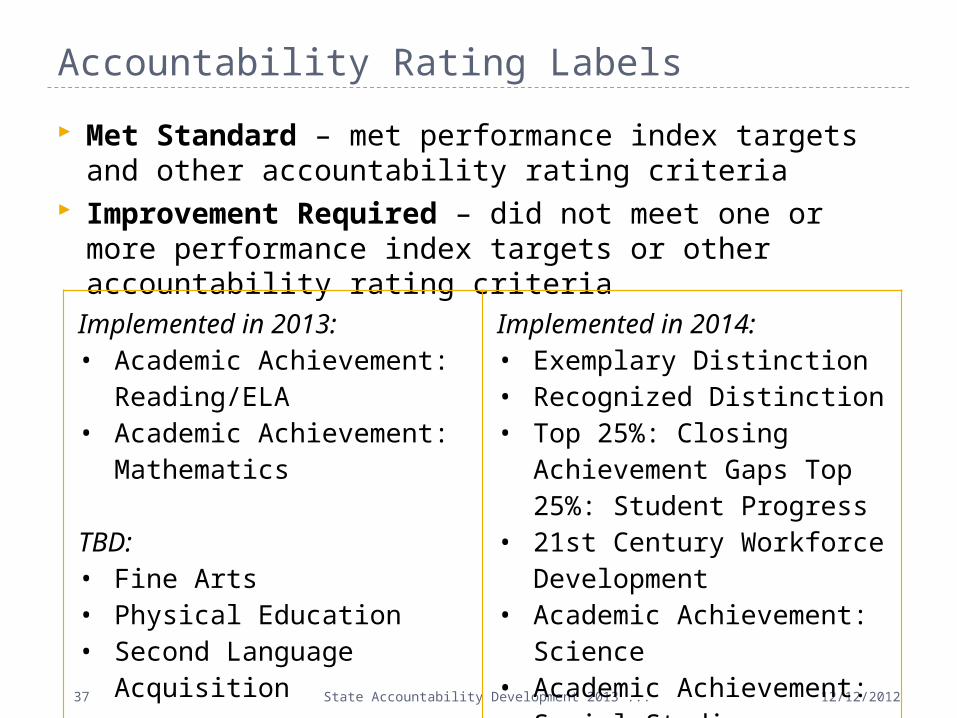
Met Standard – met performance index targets and other accountability rating criteria
Improvement Required – did not meet one or more performance index targets or other accountability rating criteriaImplemented in 2013:• Academic Achievement:
Reading/ELA• Academic Achievement:
Mathematics
TBD:• Fine Arts• Physical Education• Second Language
Acquisition
Implemented in 2014:• Exemplary Distinction• Recognized Distinction• Top 25%: Closing
Achievement Gaps Top 25%: Student Progress
• 21st Century Workforce Development
• Academic Achievement: Science
• Academic Achievement: Social Studies
State Accountability Development 2013 ...38
Distinction Labels
12/12/2012
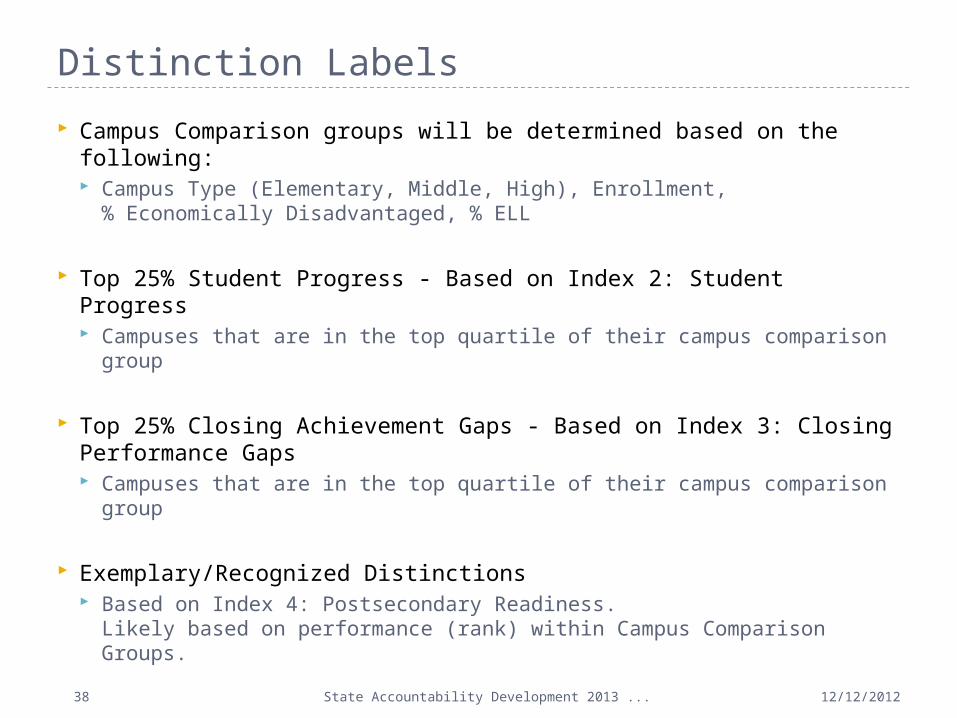
Campus Comparison groups will be determined based on the following: Campus Type (Elementary, Middle, High), Enrollment,
% Economically Disadvantaged, % ELL
Top 25% Student Progress - Based on Index 2: Student Progress Campuses that are in the top quartile of their campus comparison
group
Top 25% Closing Achievement Gaps - Based on Index 3: Closing Performance Gaps Campuses that are in the top quartile of their campus comparison
group
Exemplary/Recognized Distinctions Based on Index 4: Postsecondary Readiness.
Likely based on performance (rank) within Campus Comparison Groups.
State Accountability Development 2013 ...39
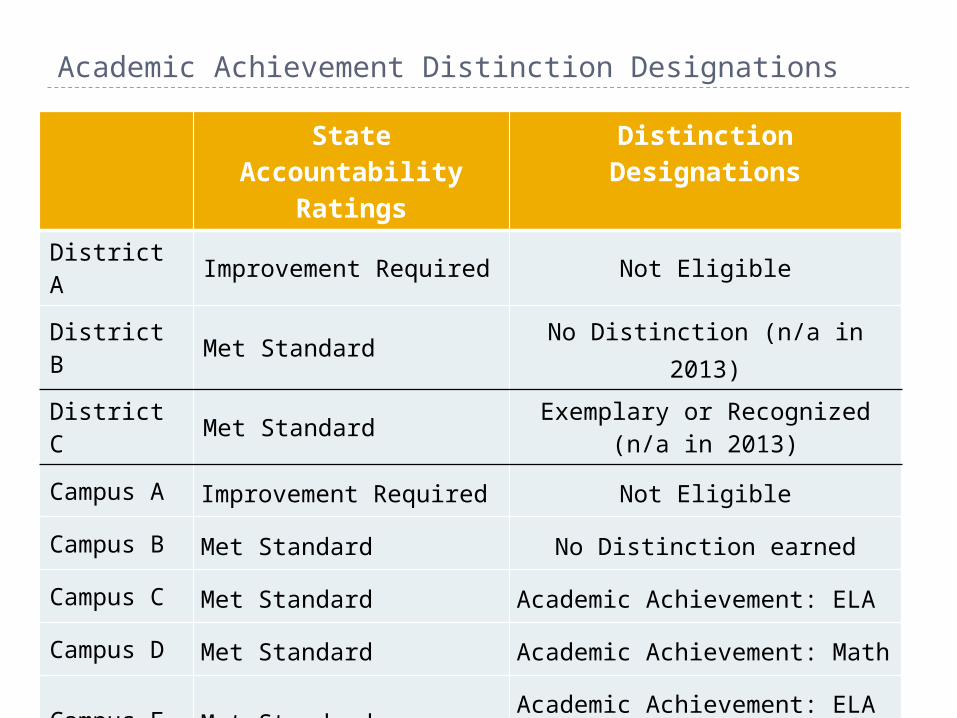
Academic Achievement Distinction Designations
12/12/2012
State Accountability
Ratings
Distinction Designations
District A Improvement Required Not Eligible
District B Met Standard No Distinction (n/a in 2013)
District C Met Standard Exemplary or Recognized(n/a in 2013)
Campus A Improvement Required Not Eligible
Campus B Met Standard No Distinction earned
Campus C Met Standard Academic Achievement: ELA
Campus D Met Standard Academic Achievement: Math
Campus E Met StandardAcademic Achievement: ELAAcademic Achievement: Math
State Accountability Development 2013 ...40
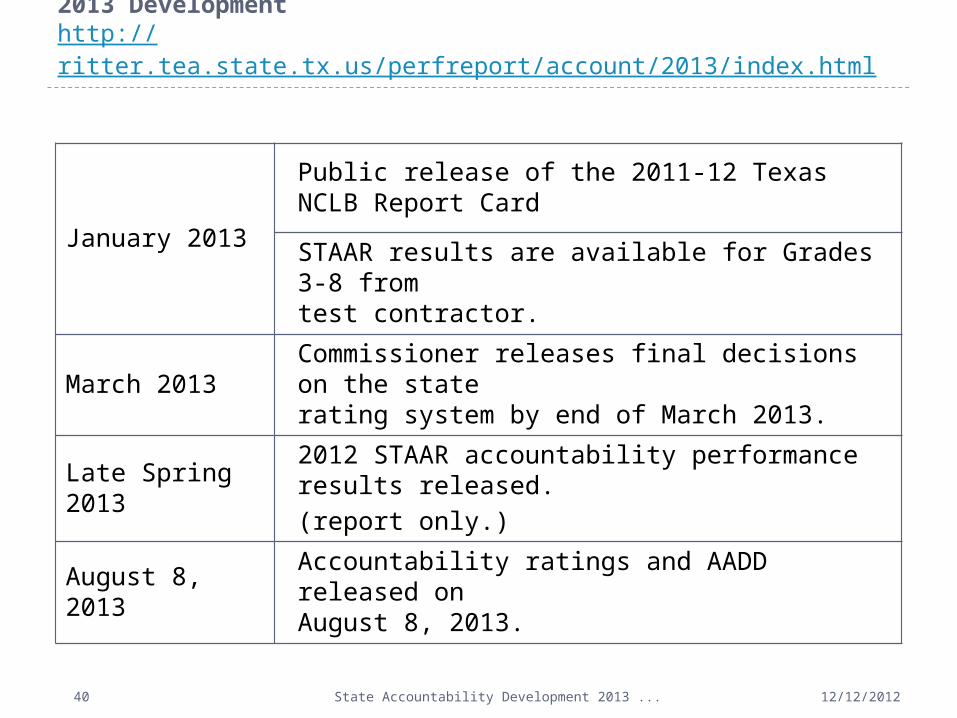
2013 Developmenthttp://ritter.tea.state.tx.us/perfreport/account/2013/index.html
12/12/2012
January 2013
Public release of the 2011-12 Texas NCLB Report Card
STAAR results are available for Grades 3-8 from test contractor.
March 2013 Commissioner releases final decisions on the state rating system by end of March 2013.
Late Spring 20132012 STAAR accountability performance results released.(report only.)
August 8, 2013 Accountability ratings and AADD released on August 8, 2013.