2013 consolidated financial statements - carrefour consolidated financial... · consolidated...
TRANSCRIPT
CONSOLIDATED FINANCIAL
STATEMENTS Year Ended December 31, 2013
Contents Consolidated Income Statement 2 Consolidated Statement of Comprehensive Income 3 Consolidated Statement of Financial Position 4 Consolidated Statement of Cash Flows 5 Consolidated Statement of Changes in Shareholders’ Equity 6 Notes to the Consolidated Financial Statements 7
Note 1: Basis of preparation of the consolidated financial statements 7 Note 2: Summary of significant accounting policies 9 Note 3: Significant events of the year 23 Note 4: Restatement of comparative information 25 Note 5: Segment information 30 Notes 6 to 14: Notes to the consolidated income statement 32 Note 15: Earnings per share 37 Note 16: Other comprehensive income 38 Notes 17 to 37: Notes to the consolidated statement of financial position 39 Note 38: Change in working capital requirement 71 Note 39: Off-balance sheet commitments 71 Note 40: Employee information 72 Note 41: Related parties 73 Note 42: Management compensation 73 Note 43: Subsequent events 74 Note 44: Fees paid to the Auditors 74 Note 45: Scope of consolidation 75
This is a free translation in English of the Carrefour Group’s 2013 Consolidated Financial Statements issued in the French language, provided solely for the convenience of English speaking users.
Consolidated Financial Statements, Year Ended December 31, 2013
2
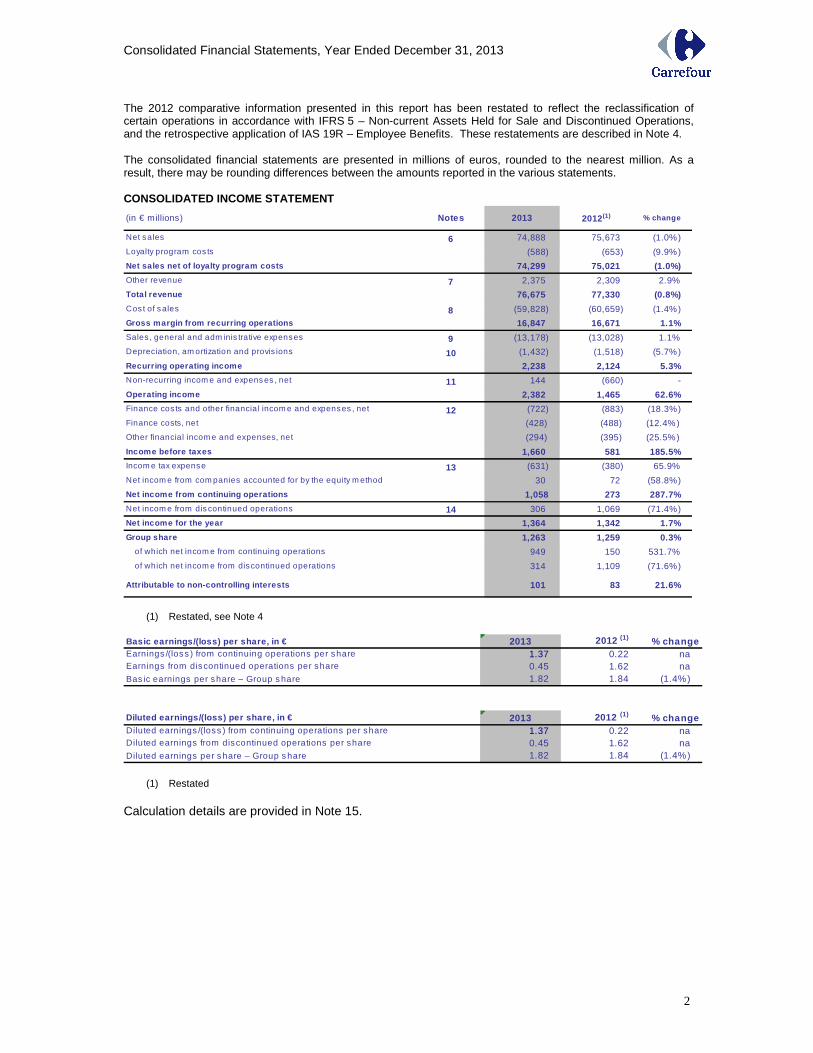
The 2012 comparative information presented in this report has been restated to reflect the reclassification of certain operations in accordance with IFRS 5 – Non-current Assets Held for Sale and Discontinued Operations, and the retrospective application of IAS 19R – Employee Benefits. These restatements are described in Note 4. The consolidated financial statements are presented in millions of euros, rounded to the nearest million. As a result, there may be rounding differences between the amounts reported in the various statements. CONSOLIDATED INCOME STATEMENT
(in € millions) Notes 2013 2012(1) % change
Net sales 6 74,888 75,673 (1.0%)
Loyalty program cos ts (588) (653) (9.9%)
Net sales net of loyalty program costs 74,299 75,021 (1.0%)
Other revenue 7 2,375 2,309 2.9%
Total revenue 76,675 77,330 (0.8%)
Cost of s ales 8 (59,828) (60,659) (1.4%)
Gross margin from recurring operations 16,847 16,671 1.1%
Sales , general and adm inis trative expenses 9 (13,178) (13,028) 1.1%
Depreciation, am ortization and provis ions 10 (1,432) (1,518) (5.7%)
Recurring operating income 2,238 2,124 5.3%
Non-recurring incom e and expens es , net 11 144 (660) -
Operating income 2,382 1,465 62.6%
Finance cos ts and other financial incom e and expenses , net 12 (722) (883) (18.3%)
Finance costs, net (428) (488) (12.4%)
Other financial incom e and expenses, net (294) (395) (25.5%)
Income before taxes 1,660 581 185.5%
Incom e tax expense 13 (631) (380) 65.9%
Net incom e from com panies accounted for by the equity m ethod 30 72 (58.8%)
Net income from continuing operations 1,058 273 287.7%
Net incom e from dis continued operations 14 306 1,069 (71.4%)
Net income for the year 1,364 1,342 1.7%
Group share 1,263 1,259 0.3%
of which net incom e from continuing operations 949 150 531.7%
of which net incom e from discontinued operations 314 1,109 (71.6%)
Attributable to non-controlling interests 101 83 21.6%
(1) Restated, see Note 4
Basic earnings/(loss) per share, in € 2013 2012 (1) % changeEarnings /(loss ) from continuing operations per share 1.37 0.22 naEarnings from discontinued operations per share 0.45 1.62 naBas ic earnings per share – Group s hare 1.82 1.84 (1.4%)
Diluted earnings/(loss) per share, in € 2013 2012 (1) % changeDiluted earnings /(loss ) from continuing operations per share 1.37 0.22 naDiluted earnings from discontinued operations per share 0.45 1.62 naDiluted earnings per s hare – Group s hare 1.82 1.84 (1.4%)
(1) Restated
Calculation details are provided in Note 15.
Consolidated Financial Statements, Year Ended December 31, 2013
3
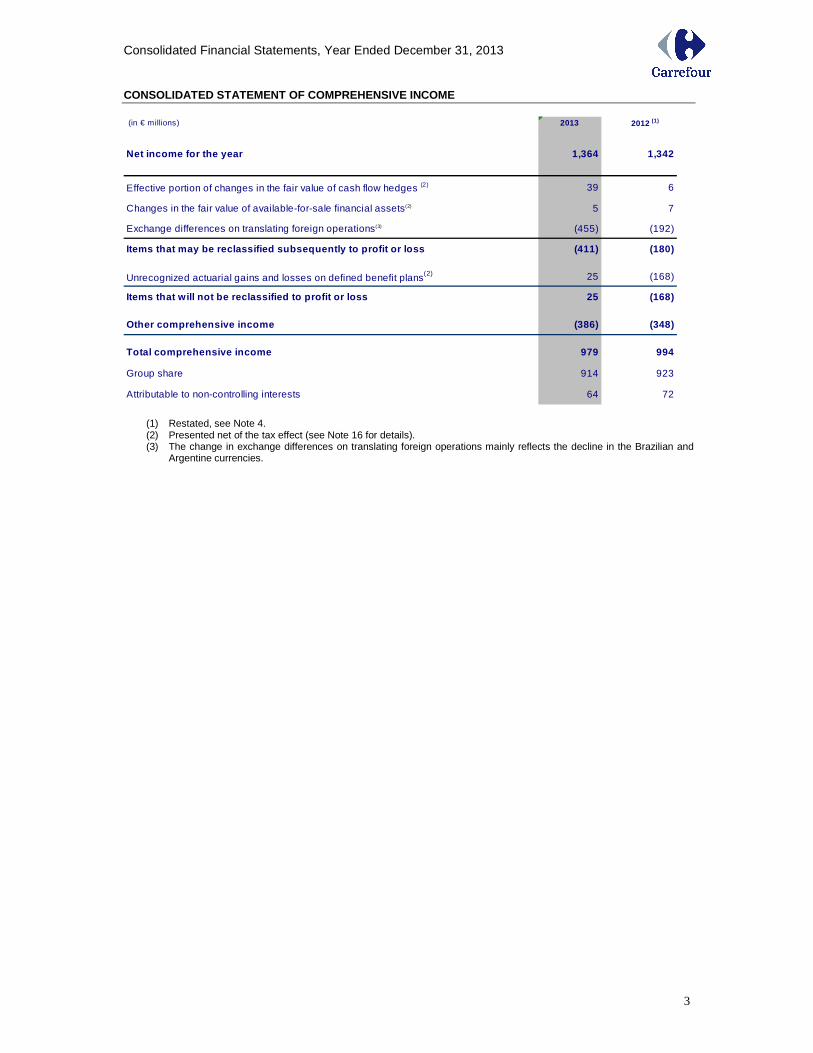
CONSOLIDATED STATEMENT OF COMPREHENSIVE INCOME (in € millions) 2013 2012 (1)
Net income for the year 1,364 1,342
Effective portion of changes in the fair value of cash flow hedges (2) 39 6
Changes in the fair value of available-for-sale financial assets(2) 5 7
Exchange differences on translating foreign operations(3) (455) (192)
Items that may be reclassified subsequently to prof it or loss (411) (180)
Unrecognized actuarial gains and losses on defined benefit plans(2) 25 (168)
Items that will not be reclassified to profit or lo ss 25 (168)
Other comprehensive income (386) (348)
Total comprehensive income 979 994
Group share 914 923
Attributable to non-controlling interests 64 72
(1) Restated, see Note 4. (2) Presented net of the tax effect (see Note 16 for details). (3) The change in exchange differences on translating foreign operations mainly reflects the decline in the Brazilian and
Argentine currencies.
Consolidated Financial Statements, Year Ended December 31, 2013
4
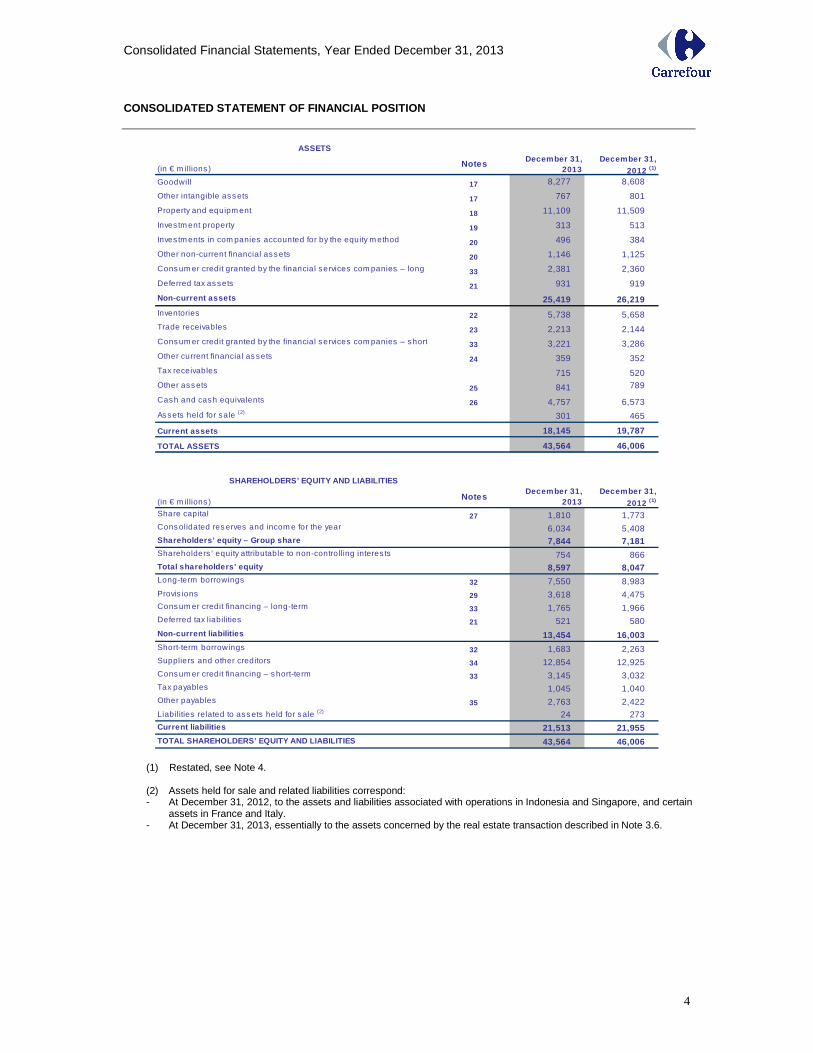
CONSOLIDATED STATEMENT OF FINANCIAL POSITION
ASSETS
(in € m illions )Notes December 31,
2013December 31,
2012 (1)
Goodwill 17 8,277 8,608
17 767 801
18 11,109 11,509
19 313 513
20 496 384
20 1,146 1,125
33 2,381 2,360
21 931 919
25,419 26,219
Inventories 22 5,738 5,658
23 2,213 2,144
33 3,221 3,286
24 359 352
715 520
25 841 789
26 4,757 6,573
301 465
Current assets 18,145 19,787
TOTAL ASSETS 43,564 46,006
SHAREHOLDERS’ EQUITY AND LIABILITIES
(in € m illions )Notes
December 31, 2013
December 31,
2012 (1)
27 1,810 1,773
6,034 5,408
7,844 7,181
754 866
8,597 8,047
32 7,550 8,983 Provis ions 29 3,618 4,475
33 1,765 1,966
21 521 580
13,454 16,003
32 1,683 2,263
34 12,854 12,925
33 3,145 3,032
1,045 1,040
35 2,763 2,422
24 273
21,513 21,955
43,564 46,006
Current liabilities
TOTAL SHAREHOLDERS’ EQUITY AND LIABILITIES
Short-term borrowings
Suppliers and other creditors
Cons um er credit financing – s hort-term
Tax payables
Other payables
Liabilities related to ass ets held for s ale (2)
Shareholders ’ equity attributable to non-controlling interes ts
Total shareholders' equity
Long-term borrowings
Cons um er credit financing – long-term
Deferred tax liabilities
Non-current liabilities
Other ass ets
Cash and cash equivalents
As sets held for sale (2)
Share capital
Cons olidated res erves and incom e for the year
Shareholders’ equity – Group share
Deferred tax as sets
Non-current assets
Trade receivables
Cons um er credit granted by the financial services com panies – short-term
Other current financial as sets
Tax receivables
Other intangible ass ets
Property and equipm ent
Inves tm ent property
Inves tm ents in com panies accounted for by the equity m ethod
Other non-current financial ass ets
Cons um er credit granted by the financial services com panies – long term
(1) Restated, see Note 4. (2) Assets held for sale and related liabilities correspond: - At December 31, 2012, to the assets and liabilities associated with operations in Indonesia and Singapore, and certain
assets in France and Italy. - At December 31, 2013, essentially to the assets concerned by the real estate transaction described in Note 3.6.
Consolidated Financial Statements, Year Ended December 31, 2013
5
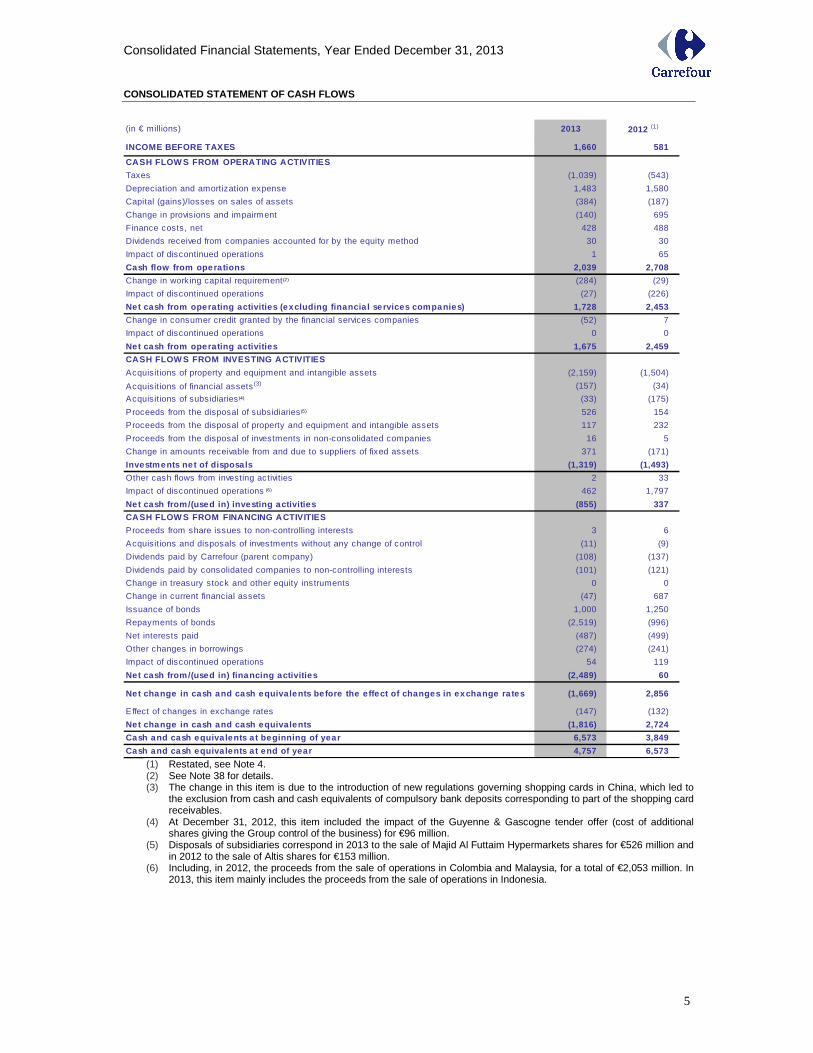
CONSOLIDATED STATEMENT OF CASH FLOWS
(in € millions) 2013 2012 (1)
INCOME BEFORE TAXES 1,660 581
CASH FLOW S FROM OPERATING ACTIVITIES
Taxes (1,039) (543)
Depreciation and amortization expense 1,483 1,580
Capital (gains)/losses on sales of assets (384) (187)
Change in provis ions and impairment (140) 695
Finance costs, net 428 488
Dividends received from companies accounted for by the equity method 30 30
Impact of discontinued operations 1 65
Cash flow from opera tions 2,039 2,708
Change in working capital requirement (2) (284) (29)
Impact of discontinued operations (27) (226)
Net cash from operating activities (excluding finan cia l services companies) 1,728 2,453
Change in consumer credit granted by the financial services companies (52) 7
Impact of discontinued operations 0 0
Net cash from operating activities 1,675 2,459
CASH FLOW S FROM INVESTING ACTIVITIES
Acquisitions of property and equipment and intangible assets (2,159) (1,504)
Acquisitions of financial assets (3) (157) (34)
Acquisitions of subsidiaries (4) (33) (175)
Proceeds from the disposal of subsidiaries (5) 526 154
Proceeds from the disposal of property and equipment and intangible assets 117 232
Proceeds from the disposal of investments in non-consolidated companies 16 5
Change in amounts receivable from and due to suppliers of fixed assets 371 (171)
Investments net of disposa ls (1,319) (1,493)
Other cash flows from investing activities 2 33
Impact of discontinued operations (6) 462 1,797
Net cash from/(used in) investing activities (855) 337
CASH FLOW S FROM FINANCING ACTIVITIES
Proceeds from share issues to non-controlling interests 3 6
Acquisitions and disposals of investments without any change of control (11) (9)
Dividends paid by Carrefour (parent company) (108) (137)
Dividends paid by consolidated companies to non-controlling interests (101) (121)
Change in treasury stock and other equity instruments 0 0
Change in current financial assets (47) 687
Issuance of bonds 1,000 1,250
Repayments of bonds (2,519) (996)
Net interests paid (487) (499)
Other changes in borrowings (274) (241)
Impact of discontinued operations 54 119
Net cash from/(used in) financing activities (2,489) 60
Net change in cash and cash equivalents before the e ffect of changes in exchange ra tes (1,669) 2,856
Effect of changes in exchange rates (147) (132)
Net change in cash and cash equivalents (1,816) 2,724
Cash and cash equiva lents a t beginning of year 6,573 3,849
Cash and cash equiva lents a t end of year 4,757 6,573 (1) Restated, see Note 4. (2) See Note 38 for details. (3) The change in this item is due to the introduction of new regulations governing shopping cards in China, which led to
the exclusion from cash and cash equivalents of compulsory bank deposits corresponding to part of the shopping card receivables.
(4) At December 31, 2012, this item included the impact of the Guyenne & Gascogne tender offer (cost of additional shares giving the Group control of the business) for €96 million.
(5) Disposals of subsidiaries correspond in 2013 to the sale of Majid Al Futtaim Hypermarkets shares for €526 million and in 2012 to the sale of Altis shares for €153 million.
(6) Including, in 2012, the proceeds from the sale of operations in Colombia and Malaysia, for a total of €2,053 million. In 2013, this item mainly includes the proceeds from the sale of operations in Indonesia.
Consolidated Financial Statements, Year Ended December 31, 2013
6
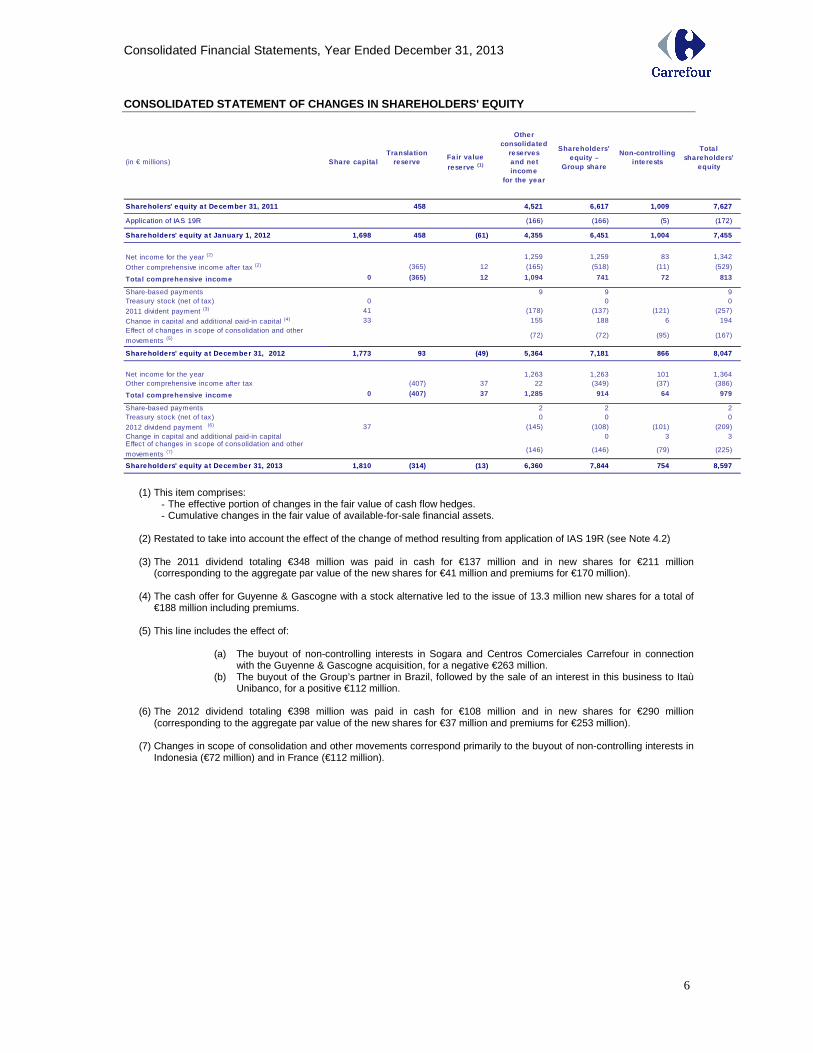
CONSOLIDATED STATEMENT OF CHANGES IN SHAREHOLDERS' EQUITY
(in € millions) Share capita lTransla tion
reserveFa ir va lue reserve (1)
Other consolidated
reserves and net income
for the year
Shareholders’ equity –
Group share
Non-controlling inte rests
Tota l shareholde rs’
equity
Shareholers' equity a t December 31, 2011 458 4,521 6,617 1,009 7,627
Application of IAS 19R (166) (166) (5) (172)
Shareholders' equity a t January 1, 2012 1,698 458 (61) 4,355 6,451 1,004 7,455
Net income for the year (2) 1,259 1,259 83 1,342
Other comprehensive income after tax (2) (365) 12 (165) (518) (11) (529)
Tota l comprehensive income 0 (365) 12 1,094 741 72 813
Share-based payments 9 9 9Treasury stock (net of tax) 0 0 0
2011 divident payment (3) 41 (178) (137) (121) (257)
Change in capital and additional paid-in capital (4) 33 155 188 6 194
Effect of changes in scope of consolidation and other
movements (5) (72) (72) (95) (167)
Shareholders' equity a t December 31, 2012 1,773 93 (4 9) 5,364 7,181 866 8,047
Net income for the year 1,263 1,263 101 1,364Other comprehensive income after tax (407) 37 22 (349) (37) (386)
Tota l comprehensive income 0 (407) 37 1,285 914 64 979
Share-based payments 2 2 2Treasury stock (net of tax) 0 0 0
2012 dividend payment (6) 37 (145) (108) (101) (209)Change in capital and additional paid-in capital 0 3 3Effect of changes in scope of consolidation and other
movements (7) (146) (146) (79) (225)
Shareholders' equity a t December 31, 2013 1,810 (314) (13) 6,360 7,844 754 8,597
(1) This item comprises:
- The effective portion of changes in the fair value of cash flow hedges. - Cumulative changes in the fair value of available-for-sale financial assets.
(2) Restated to take into account the effect of the change of method resulting from application of IAS 19R (see Note 4.2)
(3) The 2011 dividend totaling €348 million was paid in cash for €137 million and in new shares for €211 million
(corresponding to the aggregate par value of the new shares for €41 million and premiums for €170 million).
(4) The cash offer for Guyenne & Gascogne with a stock alternative led to the issue of 13.3 million new shares for a total of €188 million including premiums.
(5) This line includes the effect of:
(a) The buyout of non-controlling interests in Sogara and Centros Comerciales Carrefour in connection
with the Guyenne & Gascogne acquisition, for a negative €263 million. (b) The buyout of the Group’s partner in Brazil, followed by the sale of an interest in this business to Itaù
Unibanco, for a positive €112 million.
(6) The 2012 dividend totaling €398 million was paid in cash for €108 million and in new shares for €290 million (corresponding to the aggregate par value of the new shares for €37 million and premiums for €253 million).
(7) Changes in scope of consolidation and other movements correspond primarily to the buyout of non-controlling interests in Indonesia (€72 million) and in France (€112 million).
Consolidated Financial Statements, Year Ended December 31, 2013
7
NOTE 1: BASIS OF PREPARATION OF THE CONSOLIDATED FI NANCIAL STATEMENTS 1.1 Accounting principles and statement of compliance The consolidated financial statements for the year ended December 31, 2013 were approved for publication by the Board of Directors on March 4, 2014. They will be submitted to shareholders for final approval at the Annual General Meeting on April 15, 2014. Carrefour (the “Company”) is domiciled in France. The consolidated financial statements for the year ended December 31, 2013 comprise the financial statements of the Company and its subsidiaries (together the “Group”) and the Group’s share of the profits and losses, assets and liabilities of associated and jointly controlled companies. The presentation currency of the consolidated financial statements is the euro, which is the Company’s functional currency. In accordance with European Regulation (EC) 1606/2002 dated July 19, 2002, the 2013 consolidated financial statements have been prepared in compliance with the international accounting standards adopted for use in the European Union as of December 31, 2013 and applicable at that date, with 2012 comparative information prepared using the same standards. International accounting standards comprise International Financial Reporting Standards (IFRSs), International Accounting Standards (IASs), International Financial Reporting Standards Interpretation Committee (IFRIC) Interpretations and Standing Interpretations Committee (SIC) Interpretations. All of the standards and interpretations adopted for use in the European Union are available on the European Commission’s website, http://ec.europa.eu/internal_market/accounting/ias/index_en.htm At December 31, 2013, the standards and interpretations adopted for use in the European Union were the same as those published by the IASB and applicable at that date, except for:
• IAS 39, which had been only partly adopted; the unadopted provisions of IAS 39 have no impact on the Group’s consolidated financial statements.
• IFRS 10 – Consolidated Financial Statements, IFRS 11 – Joint Arrangements, IFRS 12 – Disclosure of Interests in Other Entities, IAS 27R – Separate Financial Statements and IAS 28R – Investments in Associates and Joint Ventures. These new and revised standards have been adopted for use in the European Union for annual periods beginning on or after January 1, 2014. The Group has decided not to early adopt them and will therefore apply them as from that date. These new and revised standards will not have any material impact on the consolidated financial statements
1.2 IFRSs and interpretations applied by the Group The accounting and calculation methods used to prepare the 2013 consolidated financial statements are the same as those used in 2012, except for:
• Amendments to IAS 19 – Employee Benefits. One of the main amendments eliminates the use of the corridor method previously applied by the Group. Under IAS 19R, changes in actuarial gains and losses are recognized systematically in “Other comprehensive income” and past service costs are recognized in full in profit or loss. The impact of retrospectively applying IAS 19R to comparative information is presented in Notes 4.2 and 4.4.
• IFRS 13 – Fair Value Measurement. This standard provides a single IFRS framework for measuring fair value that is applicable to all IFRSs that require or permit fair value measurements or disclosures. Its application had no material impact on the Group’s published consolidated financial statements.
• Amendment to IAS 1 – Presentation of Other Comprehensive Income, which notably requires items that may be reclassified subsequently to profit or loss to be presented separately from items that will not be reclassified.
• Amendment to IAS 12 – Deferred Tax: Recovery of Underlying Assets. • Amendment to IFRS 7 – Disclosures: Offsetting Financial Assets and Financial Liabilities.
Consolidated Financial Statements, Year Ended December 31, 2013
8
• 2009-2011 annual improvements.
The Group decided not to early adopt the following standards and interpretations that were not applicable as of January 1, 2013:
Adopted for use in the European Union: • Standards dealing with consolidation (IFRS 10 – Consolidated Financial Statements, IFRS 11
– Joint Arrangements, IFRS 12 – Disclosure of Interests in Other Entities), their amended transition guidance, and the resulting revisions to IAS 27 and IAS 28 (applicable for annual periods beginning on or after January 1, 2014). Application of IFRS 11, which eliminates proportionate consolidation as a method of accounting for jointly controlled entities, should not have any impact on the consolidated financial statements as the Group already uses the equity method to account for these entities.
• Amendment to IAS 32 – Offsetting Financial Assets and Financial Liabilities Not yet adopted for use in the European Union: • IFRS 9 – Financial Instruments: Classification and Measurement of Assets and Liabilities. • IFRIC 21 – Levies, an Interpretation on the accounting for levies imposed by governments • 2010-2012 and 2011-2013 annual improvements
The possible impact on the consolidated financial statements of applying these new and amended standards is currently being assessed. 1.3 Use of estimates Preparation of consolidated financial statements involves the use of management estimates and assumptions that may affect the reported amounts of certain assets, liabilities, income and expenses, as well as the disclosures contained in the notes. These estimates and assumptions are reviewed at regular intervals to ensure that they are reasonable in light of past experience and the current economic situation. Actual results may differ from current estimates. The main management estimates used in the preparation of the consolidated financial statements concern the useful lives of operating assets, the recoverable amount of goodwill and other intangible assets (Note 17) and property and equipment (Note 18), and the amount of provisions for contingencies and other business-related provisions (Note 29). The main assumptions concern pension and other post-employment benefit obligations (Note 30) and recognized deferred taxes (Note 21). IAS 32 requires the recognition of a financial liability for put options written over non-controlling interests (“NCI puts”). The Group has chosen to apply a differentiated treatment depending on whether the puts were written before or after the first-time adoption of IAS 27R on January 1, 2010, as explained in Note 2 – Summary of significant accounting policies (paragraph “Put options written over non-controlling interests”).
Consolidated Financial Statements, Year Ended December 31, 2013
9
NOTE 2: SUMMARY OF SIGNIFICANT ACCOUNTING POLICIES The accounting policies described below have been applied consistently in all periods presented in the consolidated financial statements and by all Group entities. 2.1 Basis of consolidation Companies over which the Group exercises exclusive control, directly or indirectly, are fully consolidated. Control is the power to govern the financial and operating policies of an entity so as to obtain benefits from its activities. The existence and effects of potential voting rights that are currently exercisable or convertible are considered when assessing whether control exists. Investments in associates – defined as entities over which the Group has significant influence – and joint ventures are accounted for by the equity method. This method consists of recognizing in the consolidated financial statements the Group’s share of the total profits and losses recorded by the associate or joint venture as adjusted to comply with Group accounting policies, for the period from the date when significant influence or joint control is acquired until the date when it is lost. Investments in companies where the Group does not exercise control or significant influence over financial and operating policy decisions are reported under “Non-current financial assets”. The accounting treatment of these investments is described in the paragraph “Financial assets and liabilities”. Control over special purpose entities (SPEs), as defined in SIC 12, is determined based on an assessment of whether the Group obtains the majority of the benefits of the SPE and therefore may be exposed to risks incident to the SPE’s activities. An SPE is consolidated when the substance of the relationship between the Group and the SPE indicates that the SPE is controlled by the Group. This is considered to be the case, for example, when:
• In substance, the activities of the SPE are being conducted on behalf of the Group according to its specific business needs so that the Group obtains benefits from the SPE’s operations.
• In substance, the Group has the decision-making powers to obtain the majority of the benefits of the SPE’s activities or, by setting up an “autopilot” mechanism, the Group has delegated these decision-making powers.
• In substance, the Group has rights to obtain the majority of the benefits of the SPE and therefore may be exposed to risks incident to the SPE’s activities.
• In substance, the Group retains the majority of the residual or ownership risks related to the SPE or its assets in order to obtain benefits from its activities.
2.2 Segment information IFRS 8 – Operating Segments requires the disclosure of information about an entity’s operating segments extracted from the internal reporting system and used by the entity’s chief operating decision-maker to make decisions about resources to be allocated to the segment and assess its performance. The Carrefour Group’s operating segments consist of the countries in which it conducts its business through consolidated stores, as each country's results are reviewed monthly by the Group's Chief Executive Officer who is the chief operating decision-maker within the meaning of IFRS 8. Countries located in the same region are considered as having similar characteristics and have been combined to create four geographical segments, as allowed by IFRS 8.
• France • Rest of Europe: Spain, Italy, Belgium, Poland and Romania • Latin America: Brazil and Argentina • Asia: China and Taiwan
Consolidated Financial Statements, Year Ended December 31, 2013
10
Effective January 1, 2012, the income and expenses of certain support entities are allocated to the various countries proportionately to the services provided to each, with any unallocated revenue and expenses reported under “Global functions”. In prior periods, these entities were allocated to the geographical segment corresponding to the country where they were located. 2.3 Business combinations At the IFRS transition date, the Group elected not to apply IFRS 3 to business combinations carried out prior to that date, in line with the option available to first-time adopters under IFRS 1. Whenever the Group acquires control of an entity or group of entities, the identifiable assets acquired and liabilities assumed are recognized and measured at fair value. The difference between the consideration transferred (i.e. the acquisition cost) and the fair value of the identifiable assets acquired, net of the liabilities and contingent liabilities assumed, is recognized as goodwill. Goodwill is recorded directly in the statement of financial position of the acquired entity, in the entity's functional currency. Its recoverable amount is subsequently monitored at the level of the cash-generating unit to which the entity belongs. Since the adoption of IFRS 3 (revised) on January 1, 2010, the Group applies the following principles:
• Transaction costs are recorded directly as an operating expense for the period in which they are incurred.
• For each business combination, the Group determines whether to apply the full goodwill or partial goodwill method:
o The full goodwill method consists of measuring non-controlling interests in the acquiree at fair value and allocating to these interests part of the goodwill recognized at the time of the business combination.
o Under the partial goodwill method, non-controlling interests are measured at their proportionate share of the acquiree’s identifiable net assets and no goodwill is allocated to these interests.
• Any contingent consideration is measured at its acquisition-date fair value. Any subsequent change in fair value during the 12-month measurement period is recognized by adjusting goodwill only if it results from additional information about facts and circumstances that existed at the acquisition date. If this criterion is not met or the change in fair value arises after the measurement period, it is recorded in other comprehensive income.
• For a business combination achieved in stages (step acquisition), when control is acquired the previously held equity interest is remeasured at fair value through profit. In the case of a reduction in the Group’s equity interest resulting in a loss of control, the remaining interest is also remeasured at fair value through profit.
• In the case of a bargain purchase, the gain is recognized immediately in profit. • Any acquisition or disposal of equity interests that does not result in control being acquired or
lost is treated as a transaction between owners and recognized directly in shareholders’ equity in accordance with IAS 27R.
For entities or additional equity interests acquired during the year, the Group’s share or increased share of the entity’s profit or loss for the period from the transaction date is recognized in the consolidated income statement. For entities sold or or for which control was lost during the year, the Group’s share of the entity’s profit or loss for the period up to the transaction date is recognized in the consolidated income statement. 2.4 Translation of the financial statements of fore ign operations The consolidated financial statements are presented in euros. An entity's functional currency is the currency of the primary economic environment in which the entity operates. The functional currency of Group entities is the currency of their home country.
Consolidated Financial Statements, Year Ended December 31, 2013
11
The financial statements of entities whose functional currency is not the euro and is not the currency of a hyperinflationary economy are translated into euros as follows:
• Assets and liabilities are translated at the period-end closing rate. • Income and expenses are translated at the weighted average exchange rate for the period. • All resulting exchange differences are recognized in other comprehensive income and are
taken into account in the calculation of any gain or loss realized on the subsequent disposal of the foreign operation.
• Items in the statement of cash flows are translated at the average rate for the period unless the rate on the transaction date is materially different.
No Group companies operated in a hyperinflationary economy in either 2013 or 2012. 2.5 Translation of foreign currency transactions Transactions by Group entities in a currency other than their functional currency are initially translated at the exchange rate on the transaction date. At each period-end, monetary assets and liabilities denominated in foreign currency are translated at the period-end closing rate and the resulting exchange gain or loss is recorded in the income statement. Intra-group loans to certain foreign operations are treated as part of the net investment in that operation if settlement of the loan is neither planned nor likely to occur. The gains or losses arising from translation of the loan at each successive period-end are recorded directly in other comprehensive income in accordance with IAS 21. 2.6 Intangible assets and property and equipment 2.6.1 Goodwill In accordance with IAS 36 – Impairment of Assets, goodwill recognized on business combinations is not amortized but is tested for impairment every year, at December 31. Additional tests are performed at interim period-ends when there is an indication that it may be impaired. The main impairment indicators used by the Group are as follows:
• Internal indicator: a material deterioration in the ratio of recurring operating income before depreciation, amortization and provision expense to net revenues excluding gasoline between the budget and the most recent forecast.
• External indicators: a material increase in the discount rate and/or a severe downgrade in the IMF’s GDP growth forecast.
Impairment losses recognized on goodwill are irreversible, including those recorded at an interim period-end. Impairment methods are described in Note 2.6.4 "Impairment tests". 2.6.2 Other intangible assets Other intangible assets consist mainly of software, which is amortized over periods ranging from one to eight years.
2.6.3 Property and equipment
In accordance with IAS 16 – Property, Plant and Equipment, land, buildings and equipment are stated at cost less accumulated depreciation and any accumulated impairment losses. Borrowing costs that are directly attributable to the acquisition, construction or production of a qualifying asset (defined in
Consolidated Financial Statements, Year Ended December 31, 2013
12
IAS 23 – Borrowing Costs as an asset that necessarily takes a substantial period of time to get ready for its intended use or sale), are capitalized as part of the cost of the asset. Assets under construction are recognized at cost less any identified impairment losses. Depreciation of property and equipment begins when the asset is available for use and ends when the asset is sold, scrapped or reclassified as held for sale in accordance with IFRS 5. Property and equipment, or each significant part of an item of property or equipment, are depreciated by the straight-line method over the following estimated useful lives:
Buildings
� Building
� Site improvements
� Car parks
40 years
10 years
6 years
Equipment, fixtures and fittings 6 to 8 years
Other 4 to 10 years
In light of the nature of its business, the Group considers that its property and equipment have no residual value. Depreciation methods and periods are reviewed at each period-end and, where appropriate, adjusted prospectively. New long-term leases – particularly property leases – are analyzed to determine whether they represent operating leases or finance leases, i.e. leases that transfer substantially all the risks and rewards incidental to ownership of the asset to the lessee. For property leases, the analysis is performed separately for the land on the one hand and the building on the other. Finance leases are accounted for as follows:
• The leased assets are recognized in the statement of financial position at fair value or, if lower, the present value of the minimum lease payments. They are depreciated over their useful life, in the same way as assets owned outright, or, if shorter, over the lease term.
• The liability for the future lease payments is recognized in the statement of financial position under liabilities.
• Lease payments are apportioned between the finance charge and the reduction of the outstanding liability. 2.6.4 Impairment tests
In accordance with IAS 36 – Impairment of Assets, intangible assets and property and equipment are tested for impairment whenever events or changes in the market environment indicate that the recoverable amount of an individual asset and/or a cash-generating unit (CGU) may be less than its carrying amount. For assets with an indefinite useful life – mainly goodwill in the case of the Carrefour Group – the test is performed at least once a year. Individual assets or groups of assets are tested for impairment by comparing their carrying amount to their recoverable amount, defined as the higher of their fair value less costs of disposal and their value in use. Value in use is the present value of the future cash flows expected to be derived from the asset. If the recoverable amount is less than the carrying amount, an impairment loss is recognized for the difference. Impairment losses on property and equipment and intangible assets (other than goodwill) may be reversed in future periods provided that the asset’s increased carrying amount attributable to
Consolidated Financial Statements, Year Ended December 31, 2013
13
the reversal does not exceed the carrying amount that would have been determined, net of depreciation or amortization, had no impairment loss been recognized for the asset in prior years.
2.6.4.1 Impairment of intangible assets other than goodwill and property and equipment
Impairment tests on property and equipment are performed at the level of the individual stores, for all formats. In accordance with IAS 36, intangible assets (other than goodwill) and property and equipment are tested for impairment whenever there is an indication that their recoverable amount may be less than their carrying amount. All stores that report a recurring operating loss before depreciation and amortization in two consecutive years (after the start-up period) are tested. Intangible assets with an indefinite useful life such as brands are tested at least once a year. Value in use is considered as being equal to the store’s discounted future cash flows over a period of up to five years plus a terminal value. Fair value is estimated based on the prices of recent transactions, industry practice, independent valuations or the estimated price at which the store could be sold to a competitor. The discount rate applied is the same as for impairment tests on goodwill.
2.6.4.2 Impairment of goodwill
IAS 36 – Impairment of Assets requires impairment tests to be performed annually at the level of each CGU or group of CGUs to which the goodwill is allocated. According to the standard, goodwill is allocated to the CGU or group of CGUs that is expected to benefit from the synergies of the business combination. Each unit or group of units to which the goodwill is so allocated should represent the lowest level within the entity at which the goodwill is monitored for internal management purposes and should not be larger than an operating segment as defined in IFRS 8 before aggregation. For the purpose of analyzing the recoverable amount of goodwill, each individual country is considered as representing a separate CGU. The choice of this level is based on a combination of organizational and strategic criteria:
• Operations within each country (hypermarkets, supermarkets, etc.) use shared resources (country-level centralized purchasing organization, marketing systems, headquarters functions, etc.) that represent an essential source of synergies between the various operations.
• Decisions to dispose of business portfolios are generally made at country level and it is rare for just a single store to be sold.
Value in use is considered as corresponding to the sum of discounted future cash flows for a period generally not exceeding five years, plus a terminal value calculated by projecting data for the final year to perpetuity at a perpetual growth rate. A specific discount rate by country is used for the calculation. Future cash flows are estimated based on the 3-year business plan drawn up by country management and approved by Group management. The discount rate for each country corresponds to the weighted average cost of equity and debt, determined using the median gearing rate for the sector. Each country’s cost of equity is determined based on local parameters (risk-free interest rate and market premium). The cost of debt is determined by applying the same logic. The main assumptions used for impairment testing purposes are presented in Note 17.
Consolidated Financial Statements, Year Ended December 31, 2013
14
2.7 Financial assets and liabilities (excluding ban king activities)
2.7.1. Non-derivative financial assets
2.7.1.1 Accounting policy In accordance with IAS 39, the main financial assets are classified in one of the following four categories:
• Financial assets at fair value through profit or loss • Loans and receivables • Held-to-maturity investments • Available-for-sale financial assets.
The classification of these assets determines their accounting treatment. Classification is determined by the Group upon initial recognition, based on the type of asset and the purpose for which it was acquired. Purchases and sales of financial assets are recognized on the trade date, defined as the date on which the Group is committed to buying or selling the asset. Financial assets at fair value through profit or lo ss These are financial assets held for trading, i.e. assets acquired principally for the purpose of selling them at a profit in the short term, or financial assets designated at the outset as at fair value through profit or loss. They are measured at fair value with changes in fair value recognized in the income statement, under financial income or expense. Loans and receivables Loans and receivables are non-derivative financial assets with fixed or determinable payments that are not quoted in an active market and that do not meet the criteria for classification as either held for trading or available for sale. They are initially recognized at fair value and are subsequently measured at amortized cost by the effective interest method. For short-term receivables with no specified interest rate, fair value is considered as being equal to the original invoice amount. These assets are tested for impairment when there is an indication that their recoverable amount may be less than their carrying amount. If this is found to be the case, an impairment loss is recorded. This category includes receivables from non-consolidated companies, other loans and receivables and trade receivables. They are reported under “Other financial assets” or “Trade receivables”. Held-to-maturity investments Held-to-maturity investments are non-derivative financial assets other than loans and receivables with fixed or determinable payments and a fixed maturity that the Group has the positive intention and ability to hold to maturity. They are initially recognized at fair value and are subsequently measured at amortized cost by the effective interest method. These assets are tested for impairment when there is an indication that their recoverable amount may be less than their carrying amount. If this is found to be the case, an impairment loss is recorded. Held-to-maturity investments are reported under “Other financial assets”. The Group did not hold any assets classified as held-to-maturity at December 31, 2013 or December 31, 2012. Available-for-sale financial assets Available-for-sale financial assets are financial assets that do not meet the criteria for classification in any of the other three categories. They consist mainly of shares in non-consolidated companies. Available-for-sale financial assets are measured at fair value, with changes in fair value recognized in other comprehensive income, under “Changes in the fair value of available-for-sale financial assets”. When the assets are sold, the gains and losses accumulated in shareholders’ equity are reclassified to the income statement.
Consolidated Financial Statements, Year Ended December 31, 2013
15
However, in the event of a prolonged or significant fall in value of an equity instrument or a decline in estimated cash flows from a debt instrument, an impairment loss is recognized in the income statement. If, in a subsequent period, the impairment loss decreases, the previously recognized impairment loss is released:
• For equity instruments (equities and other): through other comprehensive income. • For debt instruments (bonds, notes and other) where an increase is observed in estimated
future cash flows: through profit or loss for an amount not exceeding the previously recognized impairment loss.
The fair value of listed securities corresponds to their market price. For unlisted securities, fair value is determined by reference to recent transactions or by using valuation techniques based on reliable and observable market data. When it is impossible to obtain a reasonable estimate of an asset’s fair value, it is measured at historical cost.
2.7.1.2 Non-derivative financial assets held by the Group The main non-derivative financial assets held by the Group are as follows: Non-current financial assets This line item mainly comprises investments in non-consolidated companies and long-term loans. Trade receivables Trade receivables include amounts receivable from suppliers and franchisees and rent receivable from tenants of shopping mall units. Impairment losses are recognized where necessary, based on an estimate of the debtor’s ability to pay the amount due and the age of the receivable. Current financial assets Current financial assets consist mainly of available-for-sale financial assets, measured at fair value, and short-term loans and deposits. Cash and cash equivalents Cash equivalents are highly liquid investments with an original maturity of less than three months that are readily convertible to a known amount of cash and are subject to an insignificant risk of changes in value. Cash includes cash on hand and demand deposits.
2.7.2. Non-derivative financial liabilities
2.7.2.1 Accounting policy Non-derivative financial liabilities are initially recognized at fair value plus transaction costs and premiums directly attributable to their issue. They are subsequently measured at amortized cost.
2.7.2.2 Non-derivative financial liabilities held b y the Group The main financial liabilities held by the Group are as follows: Borrowings “Long-term borrowings” and “Short-term borrowings” include bonds and notes issued by the Group, finance lease liabilities, other bank loans, financial liabilities for put options written over non-controlling interests in subsidiaries, and financial liabilities related to securitized receivables for which the credit risk is retained by the Group. Suppliers and other creditors This line corresponds to trade payables.
Consolidated Financial Statements, Year Ended December 31, 2013
16
Other payables Other payables classified in current liabilities correspond to all other operating payables (mainly accrued employee benefits expense and amounts due to suppliers of non-current assets) and miscellaneous liabilities.
2.7.2.3 Put options written over non-controlling in terests in subsidiaries (“NCI puts”)
The Group has written put options over certain non-controlling interests in fully consolidated subsidiaries. The option exercise price may be fixed or it may be determined according to a predefined formula, and the options may be exercisable at any time or on a fixed date. IAS 27R, which has been applied by the Group since January 1, 2010, describes the accounting treatment of purchases of additional shares in controlled subsidiaries. The Group has decided to apply two different accounting methods to these puts, depending on whether they were written before or after first-time adoption of the amended standard. NCI puts written prior to January 1, 2010: continued application of the partial goodwill method
• A financial liability was recognized for NCI puts. • The liability, initially recognized at the present value of the exercise price, is remeasured at
each period-end at the fair value of the shares that would be purchased if the exercise price were to be based on fair value.
• The initial liability was recognized by recording a deduction from non-controlling interests and, if necessary, goodwill.
• Subsequent changes in the value of the liability are recognized by adjusting non-controlling interests and goodwill (except for discounting adjustments, which are recognized in financial income and expense).
• “Income – Group share” continues to be calculated based on the Group's percent interest in the subsidiary, without taking into account the percent interest represented by the NCI puts.
NCI puts written since January 1, 2010: IAS 27R stipulates that transactions in equity instruments with non-controlling interest shareholders that do not result in a change of control should be recognized by adjusting shareholders’ equity. The Group therefore considers that the NCI puts written after the date of first-time adoption of the amended standard should only affect consolidated shareholders’ equity. Accordingly:
• A financial liability is recognized for NCI puts. • The liability is initially recognized at the present value of the exercise price and is subsequently
measured at each period-end at the fair value of the shares that would be purchased if the exercise price were to be based on fair value.
• The initial liability is recognized by recording a deduction from non-controlling interests and, if necessary, “Shareholders’ equity – Group share”.
• Subsequent changes in the value of the liability are recognized by adjusting non-controlling interests and “Shareholders’ equity – Group share” (except for discounting adjustments, which are recognized in financial income and expense).
• “Income – Group share” continues to be calculated based on the Group's percent interest in the subsidiary, without taking into account the percent interest represented by the NCI puts.
Consolidated Financial Statements, Year Ended December 31, 2013
17
2.7.3 Derivative financial instruments
The Group uses derivative financial instruments to hedge its exposure to risks arising in the course of business, mainly currency and interest rate risks. Exceptionally, the risk of changes in the prices of certain commodities – mainly diesel – may also be hedged. Derivatives are initially recognized at fair value. They are subsequently measured at fair value with the resulting unrealized gains and losses recorded as explained below.
2.7.3.1 Derivatives designated as hedging instrumen ts Hedge accounting is applied if, and only if, the following conditions are met:
• At the inception of the hedge, there is formal designation and documentation of the hedging relationship.
• The effectiveness of the hedge is demonstrated at inception. The derivatives used by the Group may be qualified as either cash flow hedges or fair value hedges. The Group does not currently hedge its net investment in foreign operations. Cash flow hedges For instruments qualified as cash flow hedges, the portion of the change in fair value determined to be an effective hedge is recognized directly in other comprehensive income and accumulated in shareholders’ equity until the hedged transaction affects profit. The ineffective portion of the change in fair value is recognized in the income statement, under “Financial income and expense”. The main cash flow hedges consist of interest rate swaps that convert variable rate debt to fixed rate, and forward purchases of foreign currencies that hedge future goods purchases in foreign currency. Fair value hedges Changes in fair value of instruments qualified as fair value hedges are recognized in the income statement, with the effective portion offsetting changes in the fair value of the hedged item. Examples of fair value hedges include swaps set up at the time of issue of fixed rate bonds and notes. The hedged portion of the underlying financial liability is remeasured at fair value. Changes in fair value are recognized in the income statement and are offset by the effective portion of symmetrical changes in the fair value of the interest rate swaps.
2.7.3.2 Other derivative instruments
Other derivative instruments are measured at fair value, with changes in fair value recognized in profit or loss. Hedging instruments used by the Group include interest rate swaps and vanilla interest rate options.
2.7.4 Fair value calculation method The fair values of currency and interest rate instruments are determined using market-recognized pricing models or prices quoted by external financial institutions. Values estimated using pricing models are based on discounted future cash flows for futures and forward contracts or, for options, the Black & Scholes option pricing model. The models are calibrated using market data such as yield curves and exchange rates obtained from recognized financial data services. The fair value of long-term borrowings is estimated based on the quoted market price for bonds and notes or the value of future cash flows discounted at the interest rate for similar instruments (in terms of currency, maturity, interest rate and other characteristics).
Consolidated Financial Statements, Year Ended December 31, 2013
18
Fair value measurements of derivative financial instruments incorporate counterparty risk in the case of instruments with a positive fair value, and own credit risk for instruments with a negative fair value. Credit risk is measured using the mathematical models commonly used by market analysts. At December 31, 2013, the effect of incorporating these two types of risk was not material. 2.8 Banking activities To support its core retailing business, the Group offers banking and insurance services to customers through Carrefour Banque and other subsidiaries. Due to its specific financial structure, this secondary business is presented separately in the consolidated financial statements:
• Consumer credit granted by the financial services companies (payment card receivables, personal loans, etc.) is presented in the statement of financial position under “Consumer credit granted by the financial services companies - long-term” and “Consumer credit granted by the financial services companies - short-term”, as appropriate.
• Financing for these loans is presented under “Consumer credit financing – long-term” and “Consumer credit financing – short-term”, as appropriate.
• The other assets and liabilities of the banking activities (property and equipment, intangible assets, cash and cash equivalents, accrued taxes and payroll costs, etc.) are presented on the corresponding lines of the statement of financial position.
• Revenues from banking activities are reported in the income statement under “Other revenue”. • Cash flows generated by banking activities are reported in the statement of cash flows under
“Change in consumer credit granted by the financial services companies”. 2.9 Investment property IAS 40 defines investment property as property (land or a building or both) held to earn rentals or for capital appreciation or both. Based on this definition, investment property held by the Group consists of shopping malls (retail and service units located behind the stores’ check-out area) that are exclusively or jointly owned and represent a surface area of at least 2,500 square meters. Investment property is recognized at cost and is depreciated over the same period as owner-occupied property. The properties’ fair value is measured twice a year:
• by applying a multiple that is a function of (i) each shopping mall’s profitability and (ii) a country-specific capitalization rate, to the gross annualized rental revenue generated by each property, or
• based on independent valuations performed using two methods, the discounted cash flows method and the yield method. Valuers generally also compare the results of applying these methods to market values per square meter and to recent transaction values.
In view of the limited external data available, particularly concerning capitalization rates, the complexity of the property valuation process and the fact that valuations are based on passing rents for the Group’s own properties, the fair value of investment property is considered as being determined on the basis of level 3 inputs. The fair value of investment property is presented in Note 19.
Consolidated Financial Statements, Year Ended December 31, 2013
19
2.10 Inventories In accordance with IAS 2 – Inventories, goods inventories are measured at the lower of cost and net realizable value. Cost corresponds to the latest purchase price plus all related expenses. This method is appropriate given the rapid inventory turnover, and the resulting values are close to those obtained by the FIFO method. The cost of inventories includes all components of the purchase cost of goods sold (with the exception of exchange gains and losses) and takes into account the purchasing terms negotiated with suppliers. Net realizable value corresponds to the estimated selling price in the ordinary course of business, less the estimated costs necessary to make the sale. 2.11 Provisions In accordance with IAS 37 - Provisions, Contingent Liabilities and Contingent Assets, a provision is recorded when, at the period-end, the Group has a present obligation (legal or constructive) as a result of a past event, it is probable that an outflow of resources embodying economic benefits will be required to settle the obligation, and a reliable estimate can be made of the amount of the obligation. The amount of the provision is estimated based on the nature of the obligation and the most probable assumptions. Provisions are discounted when the effect of the time value of money is material. 2.12 Employee benefits Group employees receive short-term benefits (such as paid vacation, paid sick leave, statutory profit-sharing bonuses), long-term benefits (such as long-service awards, seniority bonuses) and post-employment benefits (such as length-of-service awards and supplementary pension benefits). Post-employment benefits may be paid under defined contribution or defined benefit plans. a) Defined contribution plans Defined contribution plans are post-employment benefit plans under which the Group pays fixed contributions into a separate entity that is responsible for the plan’s administrative and financial management as well as for the payment of benefits, such that the Group has no obligation to pay further contributions if the plan assets are insufficient. Examples include government-sponsored pension schemes, defined contribution supplementary pension plans and defined contribution pension funds. The contributions are recorded as an expense for the period in which they become due.
b) Defined benefit and long-term benefit plans A liability is recognized for defined benefit obligations that are determined by reference to the plan participants’ years of service with the Group. The defined benefit obligation is calculated annually using the projected unit credit method, taking into account actuarial assumptions concerning future salary levels, retirement age, mortality and staff turnover rates. The discount rate corresponds to the interest rate observed at the period-end for investment grade corporate bonds with a maturity close to that of the defined benefit obligation. The calculations are performed by a qualified actuary.
Consolidated Financial Statements, Year Ended December 31, 2013
20
c) Share-based payments Two types of share-based payment plans have been set up for management and selected employees – stock option plans and stock grant plans. As allowed under IFRS 1, upon first-time adoption of IFRS the Group elected to apply IFRS 2 – Share-based Payment only to equity-settled stock options granted after November 7, 2002 that had not yet vested as of January 1, 2004. This had no impact on opening shareholders’ equity at January 1, 2004. All subsequent share-based payment plans have been accounted for in accordance with IFRS 2. As the plans are equity-settled, the benefit represented by the share-based payment is recorded in employee benefits expense with a corresponding increase in shareholders’ equity. The amount recorded in employee benefits expense corresponds to the recognition over the vesting period of the benefit’s fair value. Fair value is the value determined using the Black & Scholes option pricing model at the grant date in the case of options or the share price at the grant date in the case of stock grants. In accordance with IFRS 2, performance conditions that are not market conditions are not taken into account to estimate the fair value of stock grants and stock options at the measurement date. 2.13 Income tax expense Income tax expense includes current taxes and deferred taxes. Deferred taxes are calculated on all temporary differences between the carrying amount of assets and liabilities and their tax basis (except in the specific cases referred to in IAS 12). They are measured at the tax rates that are expected to apply to the period when the asset will be realized or the liability will be settled, based on tax rates and tax laws that have been enacted or substantively enacted by the end of the reporting period. Deferred tax assets and liabilities are not discounted and are classified in the statement of financial position under “Non-current assets” and “Non-current liabilities”. The recoverability of deferred tax assets is assessed separately for each tax entity, based on business plan estimates of future taxable profits and the amount of deferred tax liabilities at the period-end. A valuation allowance is recorded to write down deferred tax assets whose recovery is not considered probable The CVAE local business tax in France, which is assessed on the basis of the value-added generated by the business, is reported under income tax expense because the Group considers that it meets the definition of a tax on income contained in IAS 12. 2.14 Treasury stock Treasury stock is recorded as a deduction from shareholders’ equity, at cost. Gains and losses from sales of treasury stock (and the related tax effect) are recorded directly in shareholders’ equity without affecting income for the period. 2.15 Non-current assets and disposal groups held fo r sale and discontinued operations A discontinued operation is a component of an entity that has been either disposed of or classified as held for sale, and:
• represents a separate major line of business or geographical area of operations, and • is part of a single coordinated plan to dispose of a separate major line of business or
geographical area of operations, or • is a subsidiary acquired exclusively with a view to resale.
It is classified as a discontinued operation at the time of sale or earlier if its assets and liabilities meet the criteria for classification as "held for sale". When a component of an entity is classified as a discontinued operation, comparative income statement and cash flow information are restated as if the
Consolidated Financial Statements, Year Ended December 31, 2013
21
entity had met the criteria for classification as a discontinued operation on the first day of the comparative period. In addition, all the assets and liabilities of the discontinued operation are presented on separate lines on each side of the statement of financial position, for the amounts at which they would be reported at the time of sale after eliminating intra-group items. 2.16 Net sales net of loyalty program costs Net sales correspond exclusively to sales realized in the Group's stores and cash and carry outlets. In accordance with IFRIC 13 – Customer Loyalty Programmes, which describes the accounting treatment of loyalty award credits granted to customers as part of a sales transaction, award credits are considered as a separately identifiable component of the sales transaction and are deducted from the amount of the sale at fair value. 2.17 Other revenue Other revenue, corresponding mainly to sales of financial services and travel, rental revenues and franchise fees, is reported on a separate line below "Net sales" in the income statement. Financial services revenues correspond mainly to bank card fees and arranging fees for traditional and revolving credit facilities, which are recognized over the life of the contract. 2.18 Gross margin from recurring operations Gross margin from recurring operations corresponds to the sum of net sales and other revenue less cost of sales as defined in Note 8. 2.19 Recurring operating income Recurring operating income corresponds to gross margin from recurring operations less sales, general and administrative expenses and depreciation, amortization and provisions. 2.20 Non-recurring income and expenses In accordance with the recommendation of the French accounting authorities (Autorité des Normes Comptables recommendation 2013-03 dated November 7, 2013), non-recurring income and expenses are reported on a separate line of the income statement. Non-recurring items are defined as “items that are limited in number, clearly identifiable and non-recurring that have a material impact on consolidated results”. This classification is applied to certain material items of income and expense that are unusual in terms of their nature and frequency, such as impairment charges, restructuring costs and provision charges recorded to reflect revised estimates of risks provided for or that arose in prior periods, based on information that came to the Group's attention during the reporting year. They are presented separately in the income statement to “help users of the financial statements to better understand the Group's underlying operating performance and provide them with useful information to assess the earnings outlook”. 2.21 Earnings per share Basic earnings per share is calculated by dividing consolidated income – Group share by the weighted average number of shares outstanding during the period. Treasury stock is not considered as being outstanding and is therefore deducted from the number of shares used for the calculation. Contingently
Consolidated Financial Statements, Year Ended December 31, 2013
22
issuable shares are treated as outstanding and included in the calculation only from the date when all necessary conditions are satisfied. Diluted earnings per share is calculated by adjusting consolidated income – Group share and the weighted average number of shares outstanding for the effects of all dilutive potential ordinary shares (if any). Dilutive potential ordinary shares correspond mainly to convertible bonds and employee stock options. Stock options are considered as potentially dilutive if they are in the money (based on the sum of the exercise price and the fair value of the services rendered by the grantee, in accordance with IFRS 2 – Share-based Payment). Stock grants are considered as potentially dilutive if the vesting conditions have been fulfilled.
Consolidated Financial Statements, Year Ended December 31, 2013
23
NOTE 3: SIGNIFICANT EVENTS OF THE YEAR 3.1 Reorganization of the partnership in Turkey On April 30, 2013, Carrefour announced that it had reached an agreement with its Turkish partner Sabanci Holding to reorganize the governance of their joint venture, CarrefourSA. Under the terms of the agreement, Sabanci Holding will become the majority shareholder by acquiring an additional 12% of the capital of CarrefourSA from Carrefour Group for a total consideration of TRY 141 million (approximately €60 million), while Carrefour will retain a 46.2% stake, allowing it to exercise significant influence over the joint venture. Following the lifting of all the conditions precedent, including approval of CarrefourSA’s new bylaws by Turkey’s securities regulator (CMB) on July 2, 2013, the sale of part of Carrefour’s stake in CarrefourSA was completed on July 25, 2013. In accordance with IAS 27, as the transaction resulted in the loss of control of CarrefourSA, it has been treated in the consolidated financial statements as the sale of the total pre-transaction interest (58.2%) followed by the purchase of the post-transaction interest (46.2%), accounted for at fair value by the equity method. After taking into account the €81 million in negative cumulative exchange differences recycled to the income statement, the loss of control led to the recognition of a loss of approximately €41 million in the income statement, on the line “Net income from discontinued operations”. In accordance with IFRS 5, the following reclassifications have been made in the financial statements at December 31, 2013:
• CarrefourSA's results up to the date when control was lost have been presented under “Net income from discontinued operations” with the portion attributable to non-controlling interests shown separately in accordance with IAS 27. To permit period-on-period comparisons, CarrefourSA’s 2012 results have been presented on the same basis.
• In the statement of cash flows, all of the Turkish entity’s cash flows for 2013 are presented on the lines “Impact of discontinued operations”, with 2012 cash flows reclassified accordingly.
3.2 Reorganization of the partnership with Majid Al Futtaim On May 22, 2013, Carrefour announced that it was selling its 25% stake in Majid Al Futtaim Hypermarkets to its partner, Majid Al Futtaim Holding, for €530 million. At the same time, the exclusive partnership agreement with the Carrefour Group is being rolled over until 2025 and extended to include new formats and new countries. The transaction was completed on June 23, 2013, after being approved by the relevant authorities, leading to the recognition of a €426 million disposal gain in non-recurring income. Majid Al Futtaim Hypermarkets was accounted for by the equity method up to the completion date. 3.3 Bond buybacks On June 5, 2013, Carrefour announced that it was launching a €1,350 million bond buyback program. The three issues concerned were as follows:
• €1,500 million 5.125% issue due October 2014 • €1,000 million 5.375% issue due June 2015 • €1,100 million 4.375% issue due November 2016
Consolidated Financial Statements, Year Ended December 31, 2013
24
The offer closed on June 12 and on June 18, the Group bought back €1,293.7 million worth of bonds (excluding accrued interest), as follows:
• €601 million worth of 5.125% bonds due October 2014 • €356.1 million worth of 5.375% bonds due June 2015 • €336.6 million worth of 4.375% bonds due November 2016.
The cost of the buyback program, reported in financial expense, amounted to €119 million. 3.4 Disposal of operations in Indonesia At the end of November 2012, Carrefour announced the sale of its 60% stake in Carrefour Indonesia to its local partner, CT Corp, which has become Carrefour’s exclusive franchisee in this country. The sale was agreed at a price of €525 million. The transaction was completed on January 16, 2013 and the €396 million capital gain has therefore been reported in the 2013 income statement, on the line "Net income from discontinued operations”. 3.5 2012 dividend reinvestment option At the Annual General Meeting held on April 23, 2013, shareholders decided to set the 2012 dividend at €0.58 per share with an option to receive the dividend in shares. The issue price of the new shares was set at €19.62 per share, representing 95% of the average of the opening prices quoted on NYSE Euronext Paris during the 20 trading days preceding the date of the Annual General Meeting, less the net amount of the dividend of €0.58 per share and rounded up to the nearest euro cent. The option period was open from May 2 to 23, 2013. At the end of this period, shareholders owning 72.06% of Carrefour's shares had elected to reinvest their 2012 dividends. June 7, 2013 was set as the date for:
• Settlement/delivery of the 14,769,539 new shares corresponding to reinvested dividends, leading to a total capital increase of €290 million.
• Payment of the cash dividend to shareholders who chose not to reinvest their dividends, representing a total payout of €108 million.
3.6 Creation of a company for shopping malls adjoi ning the Group’s hypermarkets in Europe On December 16, 2013, Carrefour announced that it had signed a memorandum of understanding with Klépierre for the purchase of 127 shopping malls. The project will lead to the creation of a company that will include 172 shopping malls originating from:
- Firstly, the acquisition from Klepierre for €2.0 billion of 127 sites in France, Spain and Italy with gross annual rental income of around €135 million.
- Secondly, the contribution by Carrefour of 45 shopping malls in France with a value of €0.7 billion and gross annual rental income of around €45 million.
The company will be financed through €1.8 billion in equity, 42% held by Carrefour with the remainder held by institutional investors, as well as through €900 million in debt. The parties reached a final agreement on January 24, 2014. The transaction is still subject to the approval of the relevant regulatory authorities. It will be submitted for consultation to employee representative bodies and should close in the first half of 2014. At December 31, 2013, the properties at the 45 sites concerned were reclassified as held for sale, in accordance with IFRS 5 – Non-current Assets Held for Sale and Discontinued Operations.
Consolidated Financial Statements, Year Ended December 31, 2013
25
In 2014, in application of the consolidation standards applicable as from that year (IFRS 10, IFRS 11 and IAS 28R), the new company will be accounted for by the equity method as it will be jointly controlled by Carrefour and its co-investors.
Consolidated Financial Statements, Year Ended December 31, 2013
26
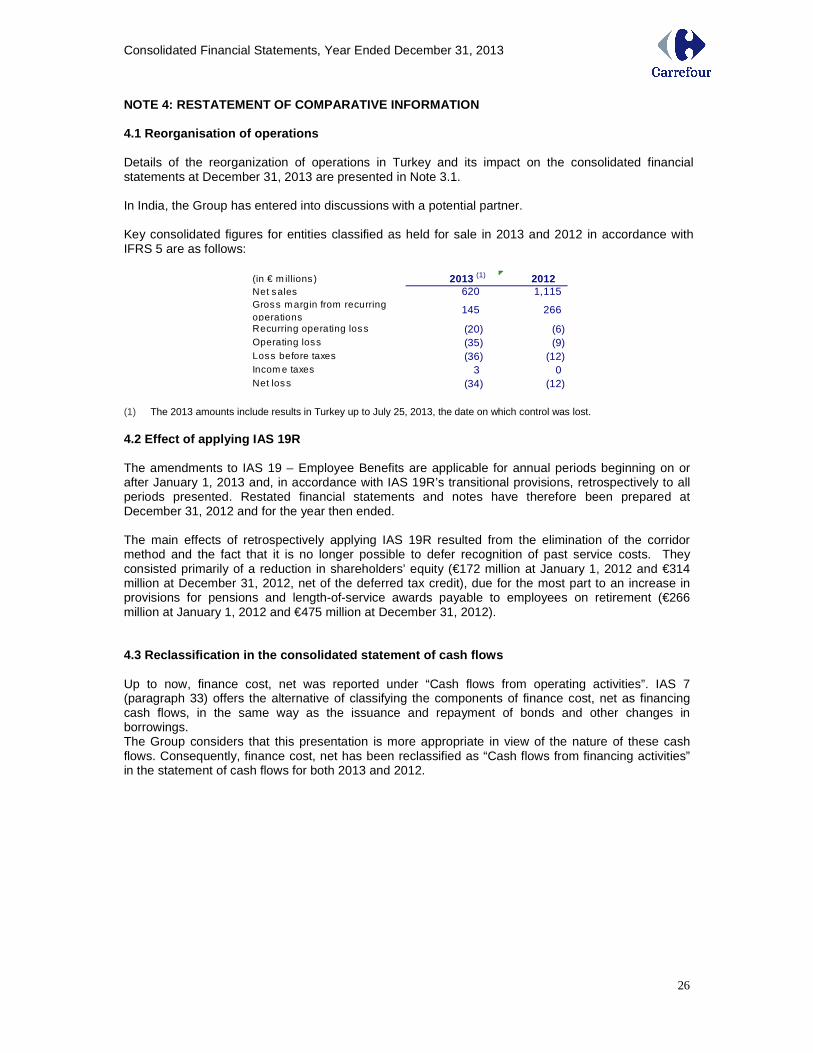
NOTE 4: RESTATEMENT OF COMPARATIVE INFORMATION 4.1 Reorganisation of operations Details of the reorganization of operations in Turkey and its impact on the consolidated financial statements at December 31, 2013 are presented in Note 3.1. In India, the Group has entered into discussions with a potential partner. Key consolidated figures for entities classified as held for sale in 2013 and 2012 in accordance with IFRS 5 are as follows:
(in € m illions ) 2013 (1) 2012Net sales 620 1,115 Gross m argin from recurring operations
145 266
Recurring operating loss (20) (6)Operating loss (35) (9)Loss before taxes (36) (12)Incom e taxes 3 0 Net loss (34) (12)
(1) The 2013 amounts include results in Turkey up to July 25, 2013, the date on which control was lost. 4.2 Effect of applying IAS 19R The amendments to IAS 19 – Employee Benefits are applicable for annual periods beginning on or after January 1, 2013 and, in accordance with IAS 19R’s transitional provisions, retrospectively to all periods presented. Restated financial statements and notes have therefore been prepared at December 31, 2012 and for the year then ended. The main effects of retrospectively applying IAS 19R resulted from the elimination of the corridor method and the fact that it is no longer possible to defer recognition of past service costs. They consisted primarily of a reduction in shareholders’ equity (€172 million at January 1, 2012 and €314 million at December 31, 2012, net of the deferred tax credit), due for the most part to an increase in provisions for pensions and length-of-service awards payable to employees on retirement (€266 million at January 1, 2012 and €475 million at December 31, 2012). 4.3 Reclassification in the consolidated statement of cash flows Up to now, finance cost, net was reported under “Cash flows from operating activities”. IAS 7 (paragraph 33) offers the alternative of classifying the components of finance cost, net as financing cash flows, in the same way as the issuance and repayment of bonds and other changes in borrowings. The Group considers that this presentation is more appropriate in view of the nature of these cash flows. Consequently, finance cost, net has been reclassified as “Cash flows from financing activities” in the statement of cash flows for both 2013 and 2012.
Consolidated Financial Statements, Year Ended December 31, 2013
27
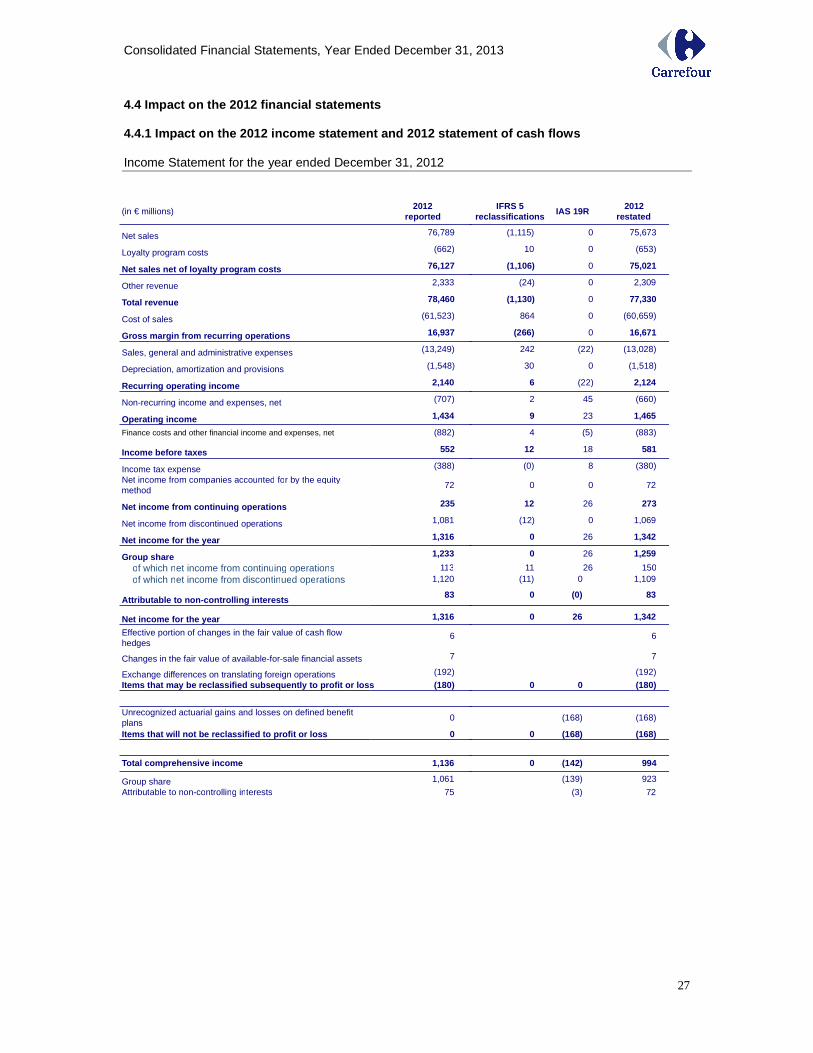
4.4 Impact on the 2012 financial statements 4.4.1 Impact on the 2012 income statement and 2012 statement of cash flows Income Statement for the year ended December 31, 2012
(in € millions)2012
reported
Net sales 76,789
Loyalty program costs (662)
Net sales net of loyalty program costs 76,127
Other revenue 2,333
Total revenue 78,460
Cost of sales (61,523)
Gross margin from recurring operations 16,937
Sales, general and administrative expenses (13,249)
Depreciation, amortization and provisions (1,548)
Recurring operating income 2,140
Non-recurring income and expenses, net (707)
Operating income 1,434
Finance costs and other financial income and expenses, net (882)
Income before taxes 552
Income tax expense (388)
Net income from companies accounted for by the equity method
72
Net income from continuing operations 235
Net income from discontinued operations 1,081
Net income for the year 1,316
Group share 1,233
of which net income from continuing operations 113 of which net income from discontinued operations 1,120
Attributable to non-controlling interests83
Net income for the year 1,316
Effective portion of changes in the fair value of cash flow hedges
6
Changes in the fair value of available-for-sale financial assets 7
Exchange differences on translating foreign operations (192)
Items that may be reclassified subsequently to prof it or loss (180)
Unrecognized actuarial gains and losses on defined benefit plans
0
Items that will not be reclassified to profit or lo ss 0
Total comprehensive income 1,136
Group share 1,061
Attributable to non-controlling interests 75
IFRS 5 reclassifications
IAS 19R2012
restated
(1,115) 0 75,673
10 0 (653)
(1,106) 0 75,021
(24) 0 2,309
(1,130) 0 77,330
864 0 (60,659)
(266) 0 16,671
242 (22) (13,028)
30 0 (1,518)
6 (22) 2,124
2 45 (660)
9 23 1,465
4 (5) (883)
12 18 581
(0) 8 (380)
0 0 72
12 26 273
(12) 0 1,069
0 26 1,342
0 26 1,259
11 26 150(11) 0 1,109
0 (0) 83
0 26 1,342
6
7
(192)
0 0 (180)
(168) (168)
0 (168) (168)
0 (142) 994
(139) 923
(3) 72
Consolidated Financial Statements, Year Ended December 31, 2013
28
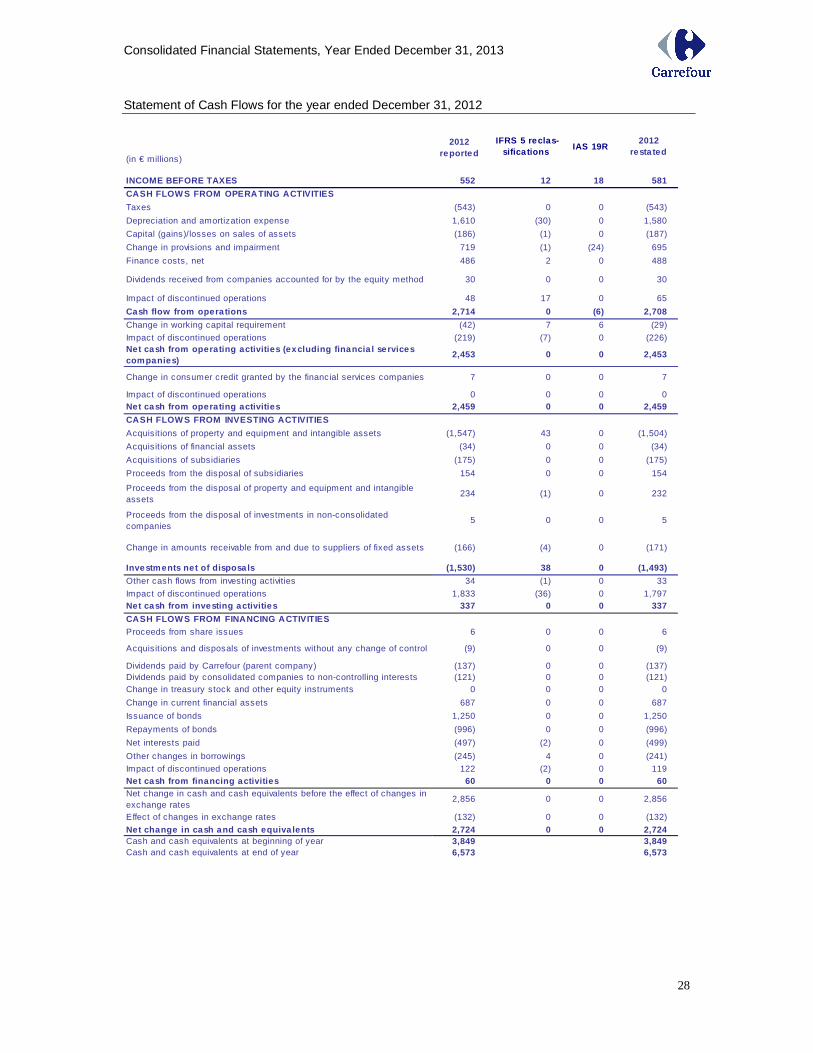
Statement of Cash Flows for the year ended December 31, 2012
(in € millions)
IFRS 5 reclas-sifica tions
IAS 19R2012
resta ted
INCOME BEFORE TAXES 552 12 18 581
CASH FLOW S FROM OPERATING ACTIVITIES
Taxes (543) 0 0 (543)
Depreciation and amortization expense 1,610 (30) 0 1,580
Capital (gains)/losses on sales of assets (186) (1) 0 (187)
Change in provisions and impairment 719 (1) (24) 695
Finance costs, net 486 2 0 488
Dividends received from companies accounted for by the equity method 30 0 0 30
Impact of discontinued operations 48 17 0 65
Cash flow from opera tions 2,714 0 (6) 2,708
Change in working capital requirement (42) 7 6 (29)
Impact of discontinued operations (219) (7) 0 (226)Net cash from operating activities (excluding finan cia l se rvices companies)
2,453 0 0 2,453
Change in consumer credit granted by the financial services companies 7 0 0 7
Impact of discontinued operations 0 0 0 0Net cash from operating activities 2,459 0 0 2,459
CASH FLOW S FROM INVESTING ACTIVITIES
Acquisitions of property and equipment and intangible assets (1,547) 43 0 (1,504)
Acquisitions of financial assets (34) 0 0 (34)
Acquisitions of subsidiaries (175) 0 0 (175)
Proceeds from the disposal of subsidiaries 154 0 0 154
Proceeds from the disposal of property and equipment and intangible assets
234 (1) 0 232
Proceeds from the disposal of investments in non-consolidated companies
5 0 0 5
Change in amounts receivable from and due to suppliers of fixed assets (166) (4) 0 (171)
Investments net of disposa ls (1,530) 38 0 (1,493)
Other cash flows from investing activities 34 (1) 0 33
Impact of discontinued operations 1,833 (36) 0 1,797Net cash from investing activities 337 0 0 337
CASH FLOW S FROM FINANCING ACTIVITIESProceeds from share issues 6 0 0 6
Acquisitions and disposals of investments without any change of control (9) 0 0 (9)
Dividends paid by Carrefour (parent company) (137) 0 0 (137)Dividends paid by consolidated companies to non-controlling interests (121) 0 0 (121)Change in treasury stock and other equity instruments 0 0 0 0
Change in current financial assets 687 0 0 687
Issuance of bonds 1,250 0 0 1,250
Repayments of bonds (996) 0 0 (996)
Net interests paid (497) (2) 0 (499)
Other changes in borrowings (245) 4 0 (241)
Impact of discontinued operations 122 (2) 0 119Net cash from financing activities 60 0 0 60Net change in cash and cash equivalents before the effect of changes in exchange rates
2,856 0 0 2,856
Effect of changes in exchange rates (132) 0 0 (132)
Net change in cash and cash equiva lents 2,724 0 0 2,72 4Cash and cash equivalents at beginning of year 3,849 3,849Cash and cash equivalents at end of year 6,573 6,573
2012 reported
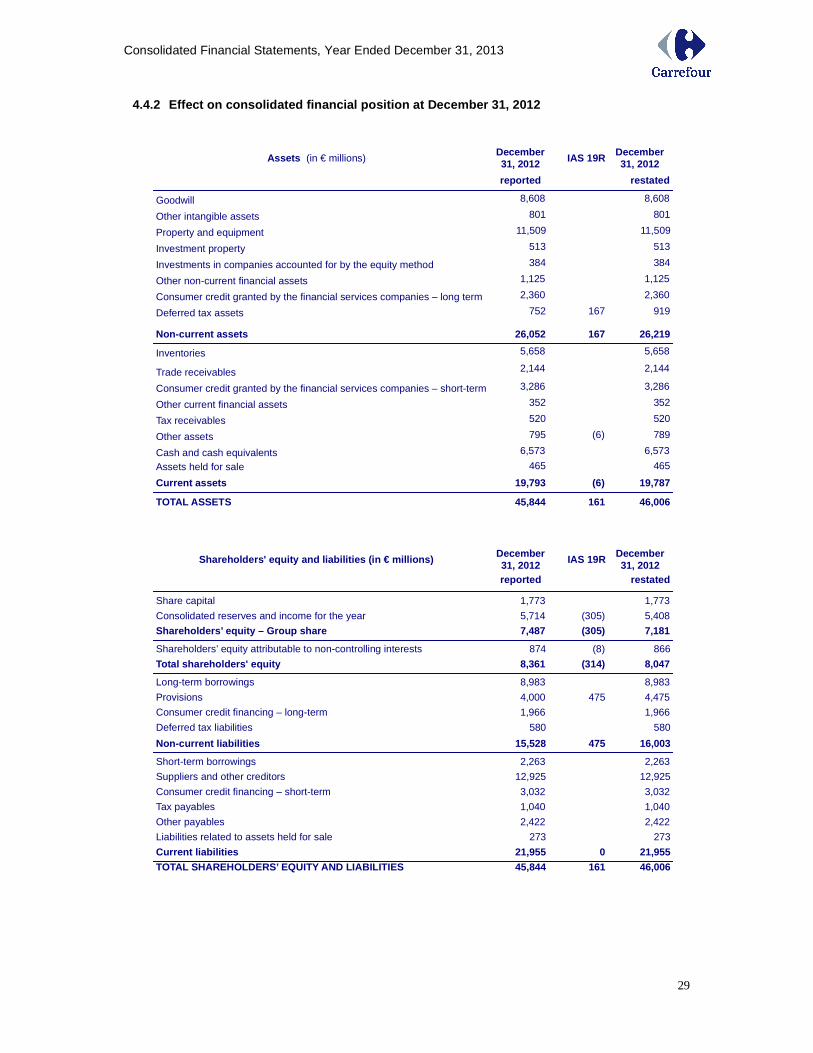
Consolidated Financial Statements, Year Ended December 31, 2013
29
4.4.2 Effect on consolidated financial position at December 31, 2012
December 31, 2012 IAS 19R
December 31, 2012
reported restated
Goodwill 8,608 8,608
Other intangible assets 801 801
Property and equipment 11,509 11,509
Investment property 513 513
Investments in companies accounted for by the equity method 384 384
Other non-current financial assets 1,125 1,125
Consumer credit granted by the financial services companies – long term 2,360 2,360
Deferred tax assets 752 167 919
Non-current assets 26,052 167 26,219
Inventories 5,658 5,658
Trade receivables 2,144 2,144
Consumer credit granted by the financial services companies – short-term 3,286 3,286
Other current financial assets 352 352
Tax receivables 520 520
Other assets 795 (6) 789
Cash and cash equivalents 6,573 6,573
Assets held for sale 465 465
Current assets 19,793 (6) 19,787
TOTAL ASSETS 45,844 161 46,006
Assets (in € millions)
December 31, 2012 IAS 19R
December 31, 2012
reported restated
Share capital 1,773 1,773
Consolidated reserves and income for the year 5,714 (305) 5,408
Shareholders’ equity – Group share 7,487 (305) 7,181
Shareholders’ equity attributable to non-controlling interests 874 (8) 866
Total shareholders' equity 8,361 (314) 8,047
Long-term borrowings 8,983 8,983
Provisions 4,000 475 4,475
Consumer credit financing – long-term 1,966 1,966
Deferred tax liabilities 580 580
Non-current liabilities 15,528 475 16,0030
Short-term borrowings 2,263 2,263
Suppliers and other creditors 12,925 12,925
Consumer credit financing – short-term 3,032 3,032
Tax payables 1,040 1,040
Other payables 2,422 2,422
Liabilities related to assets held for sale 273 273
Current liabilities 21,955 0 21,955TOTAL SHAREHOLDERS’ EQUITY AND LIABILITIES 45,844 161 46,006
Shareholders' equity and liabilities (in € millions )
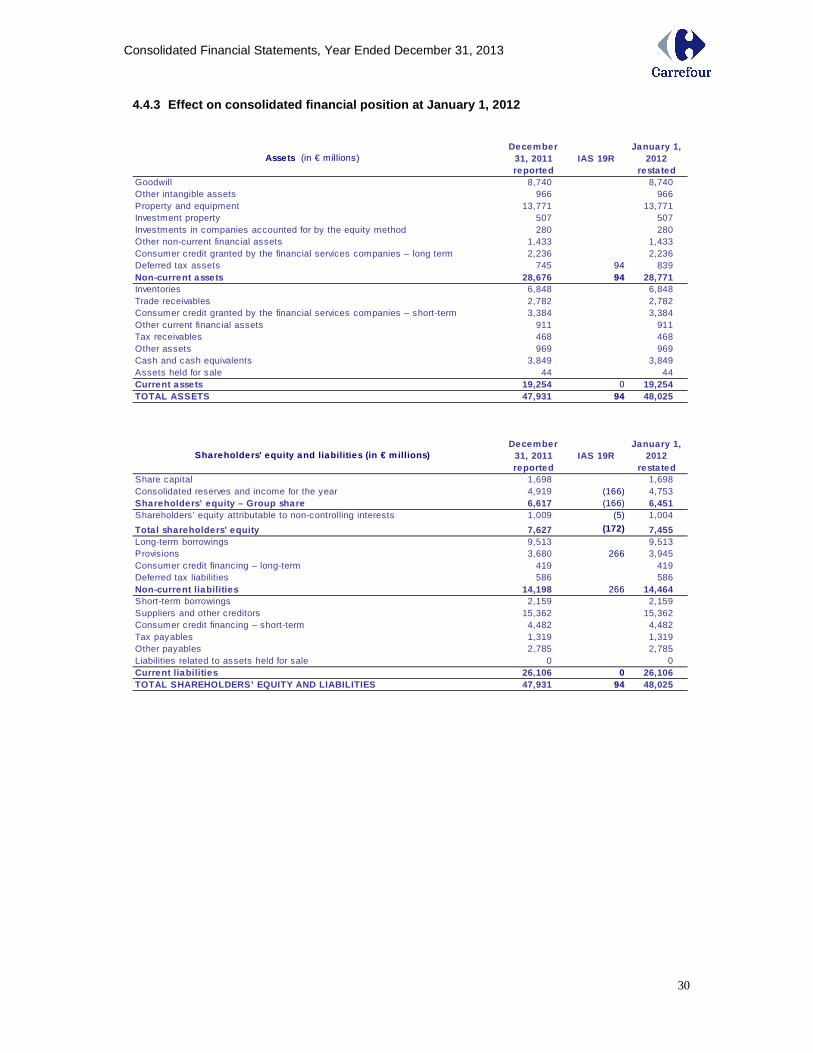
Consolidated Financial Statements, Year Ended December 31, 2013
30
4.4.3 Effect on consolidated financial position at January 1, 2012
December 31, 2011reported
IAS 19RJanuary 1,
2012restated
Goodwill 8,740 8,740 Other intangible assets 966 966 Property and equipment 13,771 13,771 Investment property 507 507 Investments in companies accounted for by the equity method 280 280 Other non-current financial assets 1,433 1,433 Consumer credit granted by the financial services companies – long term 2,236 2,236 Deferred tax assets 745 94 839 Non-current assets 28,676 94 28,771 Inventories 6,848 6,848 Trade receivables 2,782 2,782 Consumer credit granted by the financial services companies – short-term 3,384 3,384 Other current financial assets 911 911 Tax receivables 468 468 Other assets 969 969 Cash and cash equivalents 3,849 3,849 Assets held for sale 44 44 Current assets 19,254 0 19,254 TOTAL ASSETS 47,931 94 48,025
December 31, 2011reported
IAS 19RJanuary 1,
2012restated
Share capital 1,698 1,698 Consolidated reserves and income for the year 4,919 (166) 4,753 Shareholders’ equity – Group share 6,617 (166) 6,451 Shareholders’ equity attributable to non-controlling interests 1,009 (5) 1,004
Tota l shareholders' equity 7,627 (172) 7,455 Long-term borrowings 9,513 9,513 Provisions 3,680 266 3,945 Consumer credit financing – long-term 419 419 Deferred tax liabilities 586 586 Non-current liabilities 14,198 266 14,464 Short-term borrowings 2,159 2,159 Suppliers and other creditors 15,362 15,362 Consumer credit financing – short-term 4,482 4,482 Tax payables 1,319 1,319 Other payables 2,785 2,785 Liabilities related to assets held for sale 0 0 Current liabilities 26,106 0 26,106 TOTAL SHAREHOLDERS’ EQUITY AND LIABILITIES 47,931 94 48,025
Shareholders' equity and liabilities (in € millions )
Assets (in € millions)
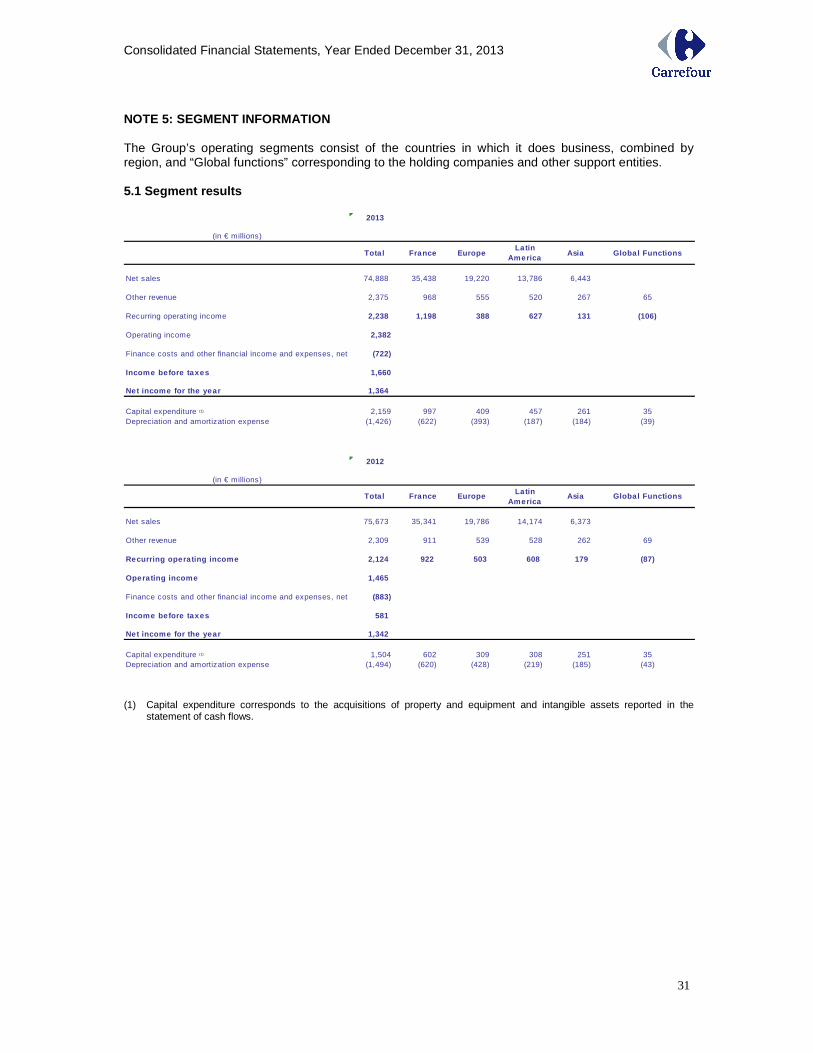
Consolidated Financial Statements, Year Ended December 31, 2013
31
NOTE 5: SEGMENT INFORMATION The Group’s operating segments consist of the countries in which it does business, combined by region, and “Global functions” corresponding to the holding companies and other support entities. 5.1 Segment results
2013
(in € millions)
Tota l France EuropeLatin
AmericaAsia Global Functions
Net sales 74,888 35,438 19,220 13,786 6,443
Other revenue 2,375 968 555 520 267 65
Recurring operating income 2,238 1,198 388 627 131 (106)
Operating income 2,382
Finance costs and other financial income and expenses, net (722)
Income before taxes 1,660
Net income for the year 1,364
Capital expenditure (1) 2,159 997 409 457 261 35Depreciation and amortization expense (1,426) (622) (393) (187) (184) (39)
2012
(in € millions)
Tota l France EuropeLatin
AmericaAsia Global Functions
Net sales 75,673 35,341 19,786 14,174 6,373
Other revenue 2,309 911 539 528 262 69
Recurring operating income 2,124 922 503 608 179 (87)
Operating income 1,465
Finance costs and other financial income and expenses, net (883)
Income before taxes 581
Net income for the year 1,342
Capital expenditure (1) 1,504 602 309 308 251 35Depreciation and amortization expense (1,494) (620) (428) (219) (185) (43)
(1) Capital expenditure corresponds to the acquisitions of property and equipment and intangible assets reported in the
statement of cash flows.
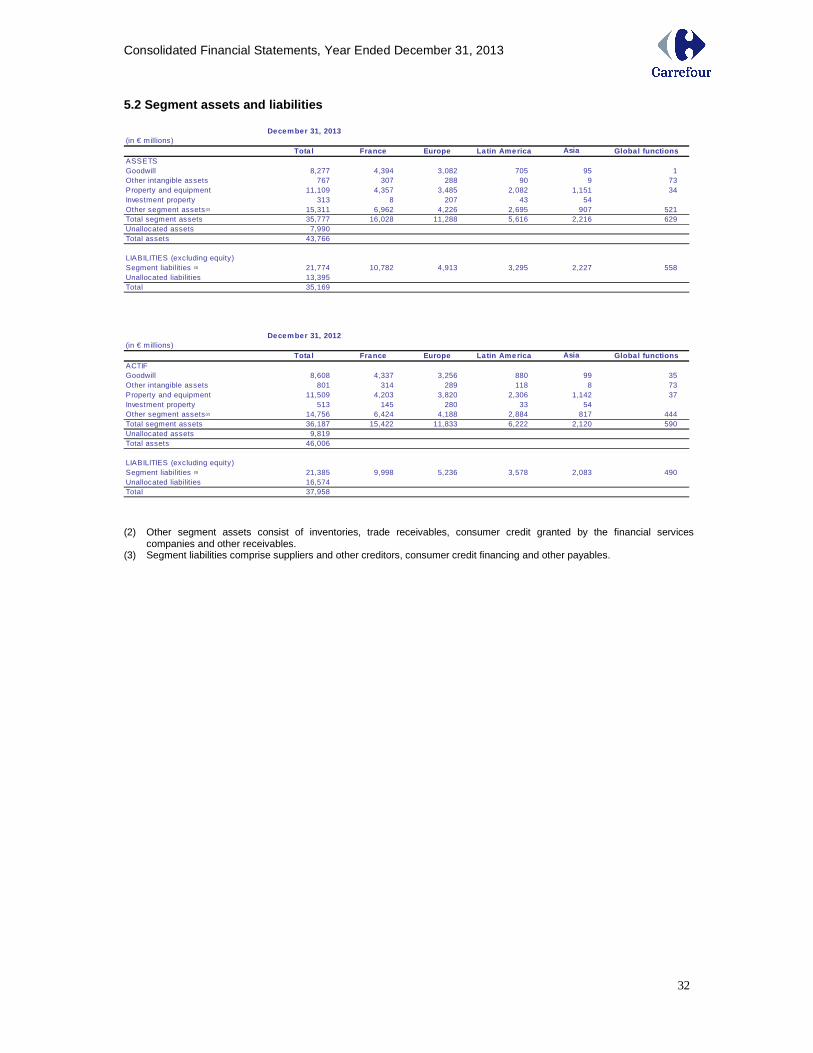
Consolidated Financial Statements, Year Ended December 31, 2013
32
5.2 Segment assets and liabilities
December 31, 2013(in € millions)
Tota l France Europe Latin America Asi a Global functionsASSETSGoodwill 8,277 4,394 3,082 705 95 1 Other intangible assets 767 307 288 90 9 73 Property and equipment 11,109 4,357 3,485 2,082 1,151 34 Investment property 313 8 207 43 54 Other segment assets (2) 15,311 6,962 4,226 2,695 907 521 Total segment assets 35,777 16,028 11,288 5,616 2,216 629 Unallocated assets 7,990 Total assets 43,766
LIABILITIES (excluding equity)Segment liabilities (3) 21,774 10,782 4,913 3,295 2,227 558 Unallocated liabilities 13,395 Total 35,169
December 31, 2012(in € millions)
Tota l France Europe Latin America Asi a Global functionsACTIFGoodwill 8,608 4,337 3,256 880 99 35 Other intangible assets 801 314 289 118 8 73 Property and equipment 11,509 4,203 3,820 2,306 1,142 37 Investment property 513 145 280 33 54 Other segment assets (2) 14,756 6,424 4,188 2,884 817 444 Total segment assets 36,187 15,422 11,833 6,222 2,120 590 Unallocated assets 9,819 Total assets 46,006
LIABILITIES (excluding equity)Segment liabilities (3) 21,385 9,998 5,236 3,578 2,083 490 Unallocated liabilities 16,574 Total 37,958
(2) Other segment assets consist of inventories, trade receivables, consumer credit granted by the financial services companies and other receivables.
(3) Segment liabilities comprise suppliers and other creditors, consumer credit financing and other payables.
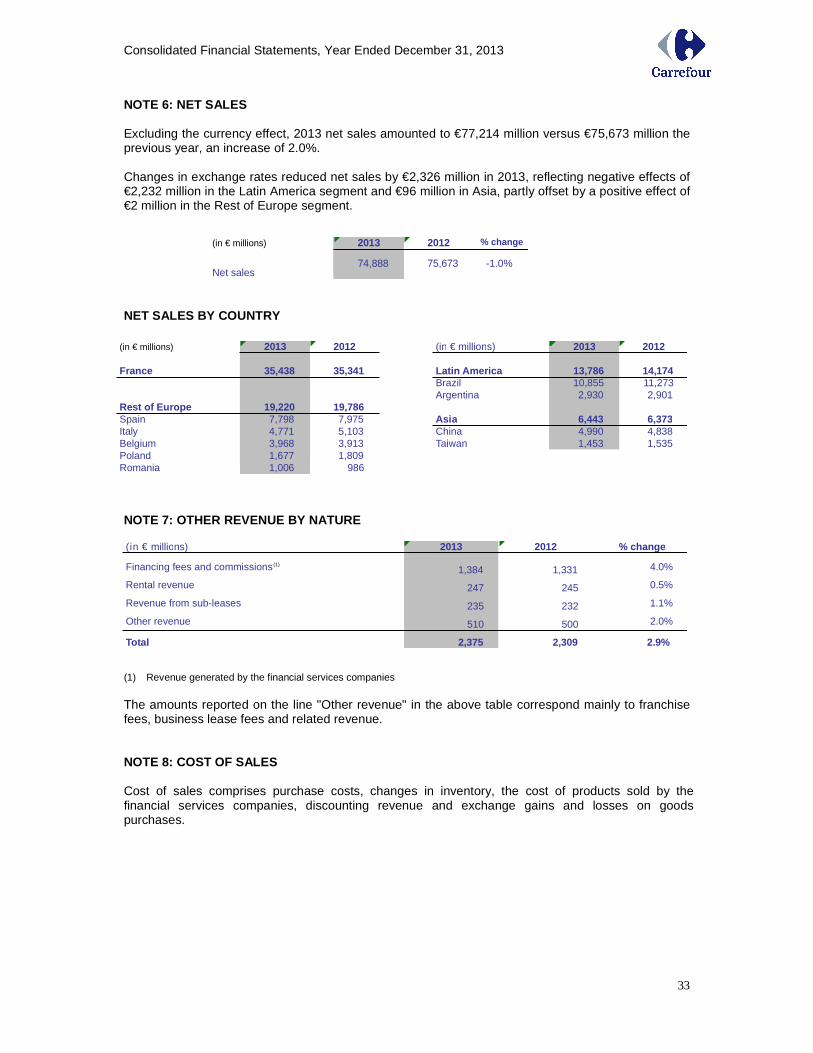
Consolidated Financial Statements, Year Ended December 31, 2013
33
NOTE 6: NET SALES Excluding the currency effect, 2013 net sales amounted to €77,214 million versus €75,673 million the previous year, an increase of 2.0%. Changes in exchange rates reduced net sales by €2,326 million in 2013, reflecting negative effects of €2,232 million in the Latin America segment and €96 million in Asia, partly offset by a positive effect of €2 million in the Rest of Europe segment.
NET SALES BY COUNTRY
NOTE 7: OTHER REVENUE BY NATURE
(1) Revenue generated by the financial services companies
The amounts reported on the line "Other revenue" in the above table correspond mainly to franchise fees, business lease fees and related revenue. NOTE 8: COST OF SALES Cost of sales comprises purchase costs, changes in inventory, the cost of products sold by the financial services companies, discounting revenue and exchange gains and losses on goods purchases.
(in € millions) 2013 2012 % change
Net sales74,888 75,673 -1.0%
(in € millions) 2013 2012 (in € millions) 2013 2012
France 35,438 35,341 Latin America 13,786 14,174Brazil 10,855 11,273Argentina 2,930 2,901
Rest of Europe 19,220 19,786Spain 7,798 7,975 Asi a 6,443 6,373Italy 4,771 5,103 China 4,990 4,838Belgium 3,968 3,913 Taiwan 1,453 1,535Poland 1,677 1,809Romania 1,006 986
(in € millions) 2013 2012 % change
Financing fees and commissions (1)1,384 1,331 4.0%
Rental revenue 247 245 0.5%
Revenue from sub-leases 235 232 1.1%
Other revenue 510 500 2.0%
Total 2,375 2,309 2.9%
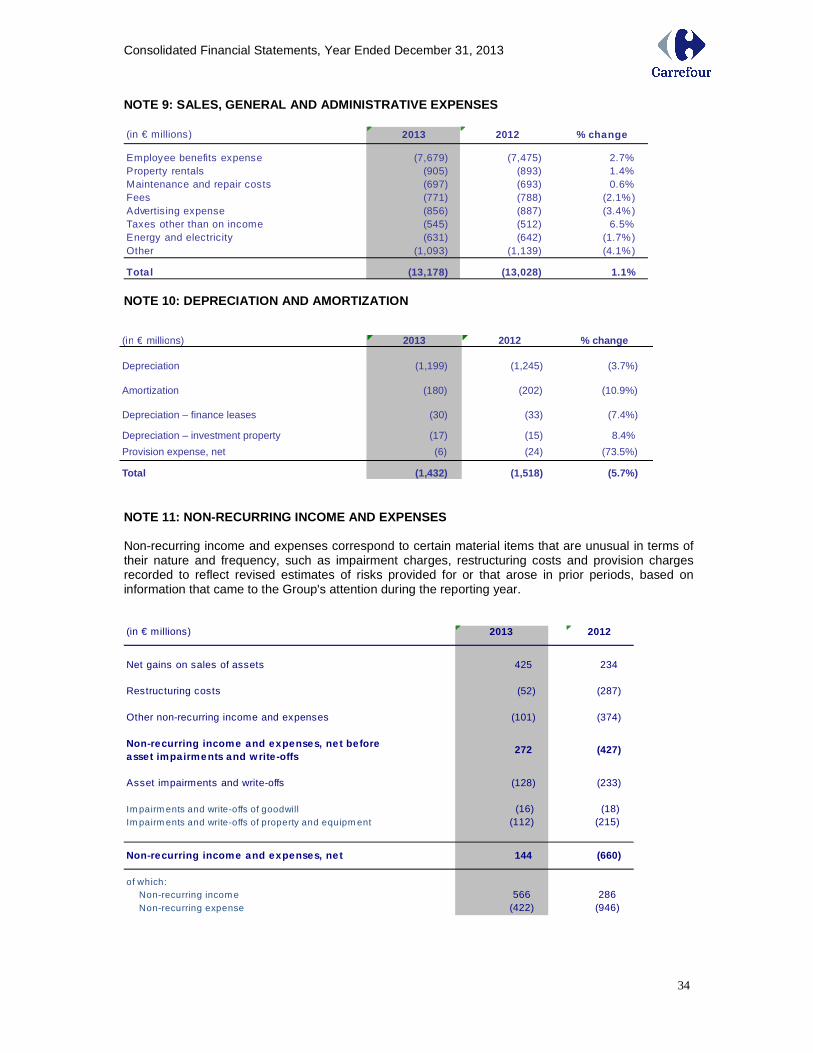
Consolidated Financial Statements, Year Ended December 31, 2013
34
NOTE 9: SALES, GENERAL AND ADMINISTRATIVE EXPENSES (in € millions) 2013 2012 % change
Employee benefits expense (7,679) (7,475) 2.7%Property rentals (905) (893) 1.4%Maintenance and repair costs (697) (693) 0.6%Fees (771) (788) (2.1%)Advertising expense (856) (887) (3.4%)Taxes other than on income (545) (512) 6.5%Energy and electricity (631) (642) (1.7%)Other (1,093) (1,139) (4.1%)
Total (13,178) (13,028) 1.1% NOTE 10: DEPRECIATION AND AMORTIZATION
NOTE 11: NON-RECURRING INCOME AND EXPENSES Non-recurring income and expenses correspond to certain material items that are unusual in terms of their nature and frequency, such as impairment charges, restructuring costs and provision charges recorded to reflect revised estimates of risks provided for or that arose in prior periods, based on information that came to the Group's attention during the reporting year. (in € millions) 2013 2012
Net gains on sales of assets 425 234
Restructuring costs (52) (287)
Other non-recurring income and expenses (101) (374)
Non-recurring income and expenses, ne t before asset impairments and w rite-offs
272 (427)
Asset impairments and write-offs (128) (233)
Im pairm ents and write-offs of goodwill (16) (18)Im pairm ents and write-offs of property and equipm ent (112) (215)
Non-recurring income and expenses, ne t 144 (660)
of which: Non-recurring incom e 566 286 Non-recurring expense (422) (946)
(in € millions) 2013 2012 % change
Depreciation (1,199) (1,245) (3.7%)
Amortization (180) (202) (10.9%)
Depreciation – finance leases (30) (33) (7.4%)
Depreciation – investment property (17) (15) 8.4%
Provision expense, net (6) (24) (73.5%)
Total (1,432) (1,518) (5.7%)
Consolidated Financial Statements, Year Ended December 31, 2013
35
Net gains on sales of assets In 2013, the Group sold its 25% interest in Majid Al Futtaim Hypermarkets, realizing a capital gain of €426 million. In 2012, the Group sold its 50% interest in Altis (and its subsidiaries) to Eroski, realizing a pre-tax gain of €111 million. Other asset sales during the period, mainly in France, generated total gains of €123 million. Restructuring costs: The final cost of the voluntary separation plan carried out between January and July 2013 to reduce support staff numbers in France was less than the related provision, as a higher-than-expected number of employees were transferred within the organization. Restructuring costs recorded in 2012 mainly concerned reorganization plans in Europe, including the voluntary separation plan announced during the year to reduce support staff numbers in France. Other non-recurring income and expenses In 2013, the Group revised its estimates of the potential costs associated with certain risks provided for in prior periods, based on information that came to the Group's attention during the year. Other non-recurring income and expenses for 2012 included various special taxes introduced in France’s amended Finance Act for a total of €51 million, including a €36 million retroactive levy on the value of gasoline inventories held in the fourth quarter of 2011. Impairment losses and asset write-offs Impairment losses of €60 million were recorded in 2013, mainly in Spain and Italy, and assets totaling €43 million were written off. In 2012, an €18 million impairment loss was recorded on Polish goodwill following the decision to close the Group’s stores in that country to which the goodwill was allocated. Impairment losses recorded on property and equipment in 2012 totaled €155 million. The write-downs mainly concerned Spain, Italy and France and reflected the fall in value of certain assets used in environments that were severely affected by the economic crisis.
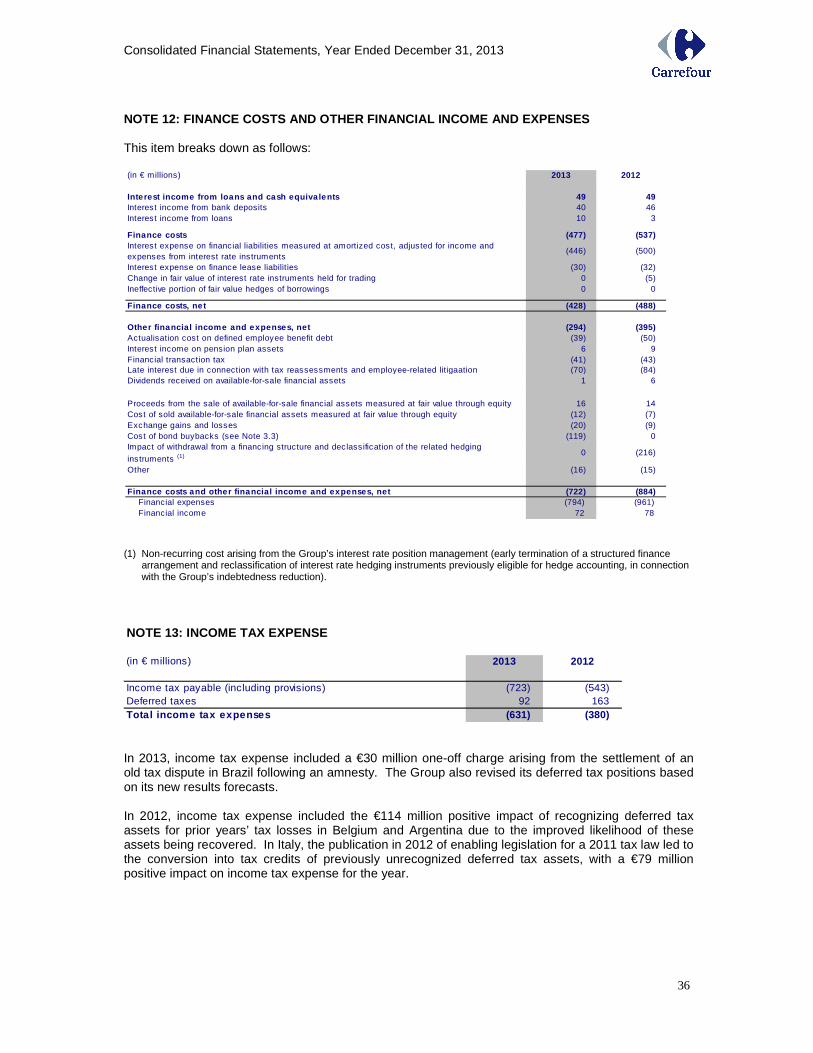
Consolidated Financial Statements, Year Ended December 31, 2013
36
NOTE 12: FINANCE COSTS AND OTHER FINANCIAL INCOME A ND EXPENSES This item breaks down as follows: (in € millions) 2013 2012
Interest income from loans and cash equiva lents 49 49Interest income from bank deposits 40 46Interest income from loans 10 3
Finance costs (477) (537)Interest expense on financial liabilities measured at amortized cost, adjusted for income and expenses from interest rate instruments
(446) (500)
Interest expense on finance lease liabilities (30) (32)Change in fair value of interest rate instruments held for trading 0 (5)Ineffective portion of fair value hedges of borrowings 0 0
Finance costs, ne t (428) (488)
Other financial income and expenses, net (294) (395)Actualisation cost on defined employee benefit debt (39) (50)Interest income on pension plan assets 6 9Financial transaction tax (41) (43)Late interest due in connection with tax reassessments and employee-related litigaation (70) (84)Dividends received on available-for-sale financial assets 1 6
Proceeds from the sale of available-for-sale financial assets measured at fair value through equity 16 14Cost of sold available-for-sale financial assets measured at fair value through equity (12) (7)Exchange gains and losses (20) (9)Cost of bond buybacks (see Note 3.3) (119) 0Impact of withdrawal from a financing structure and declassification of the related hedging
instruments (1) 0 (216)
Other (16) (15)
Finance costs and other financial income and expens es, net (722) (884) Financial expenses (794) (961) Financial income 72 78 (1) Non-recurring cost arising from the Group’s interest rate position management (early termination of a structured finance
arrangement and reclassification of interest rate hedging instruments previously eligible for hedge accounting, in connection with the Group’s indebtedness reduction).
NOTE 13: INCOME TAX EXPENSE (in € millions) 2013 2012
Income tax payable (including provisions) (723) (543)Deferred taxes 92 163Total income tax expenses (631) (380) In 2013, income tax expense included a €30 million one-off charge arising from the settlement of an old tax dispute in Brazil following an amnesty. The Group also revised its deferred tax positions based on its new results forecasts. In 2012, income tax expense included the €114 million positive impact of recognizing deferred tax assets for prior years’ tax losses in Belgium and Argentina due to the improved likelihood of these assets being recovered. In Italy, the publication in 2012 of enabling legislation for a 2011 tax law led to the conversion into tax credits of previously unrecognized deferred tax assets, with a €79 million positive impact on income tax expense for the year.
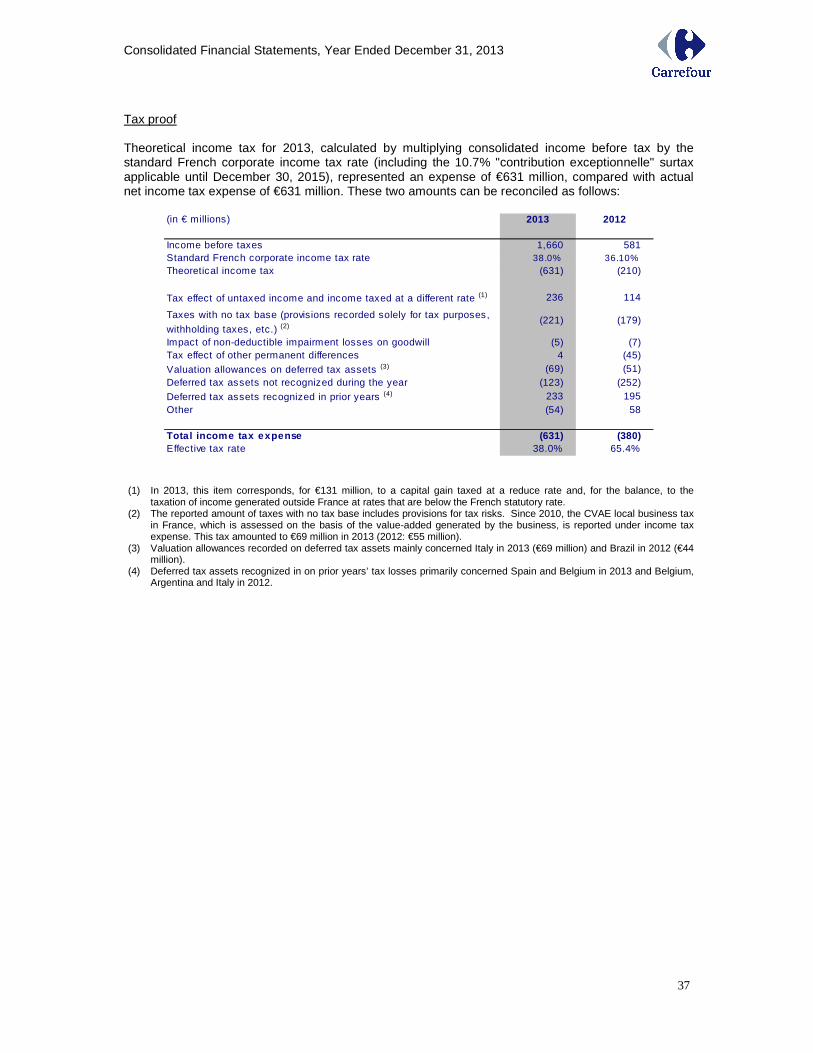
Consolidated Financial Statements, Year Ended December 31, 2013
37
Tax proof Theoretical income tax for 2013, calculated by multiplying consolidated income before tax by the standard French corporate income tax rate (including the 10.7% "contribution exceptionnelle" surtax applicable until December 30, 2015), represented an expense of €631 million, compared with actual net income tax expense of €631 million. These two amounts can be reconciled as follows:
(in € millions) 2013 2012
Income before taxes 1,660 581Standard French corporate income tax rate 38.0% 36.10%Theoretical income tax (631) (210)
Tax effect of untaxed income and income taxed at a different rate (1) 236 114
Taxes with no tax base (provisions recorded solely for tax purposes,
withholding taxes, etc.) (2)(221) (179)
Impact of non-deductible impairment losses on goodwill (5) (7)Tax effect of other permanent differences 4 (45)
Valuation allowances on deferred tax assets (3) (69) (51)Deferred tax assets not recognized during the year (123) (252)
Deferred tax assets recognized in prior years (4) 233 195Other (54) 58
Tota l income tax expense (631) (380)Effective tax rate 38.0% 65.4%
(1) In 2013, this item corresponds, for €131 million, to a capital gain taxed at a reduce rate and, for the balance, to the taxation of income generated outside France at rates that are below the French statutory rate.
(2) The reported amount of taxes with no tax base includes provisions for tax risks. Since 2010, the CVAE local business tax in France, which is assessed on the basis of the value-added generated by the business, is reported under income tax expense. This tax amounted to €69 million in 2013 (2012: €55 million).
(3) Valuation allowances recorded on deferred tax assets mainly concerned Italy in 2013 (€69 million) and Brazil in 2012 (€44 million).
(4) Deferred tax assets recognized in on prior years’ tax losses primarily concerned Spain and Belgium in 2013 and Belgium, Argentina and Italy in 2012.
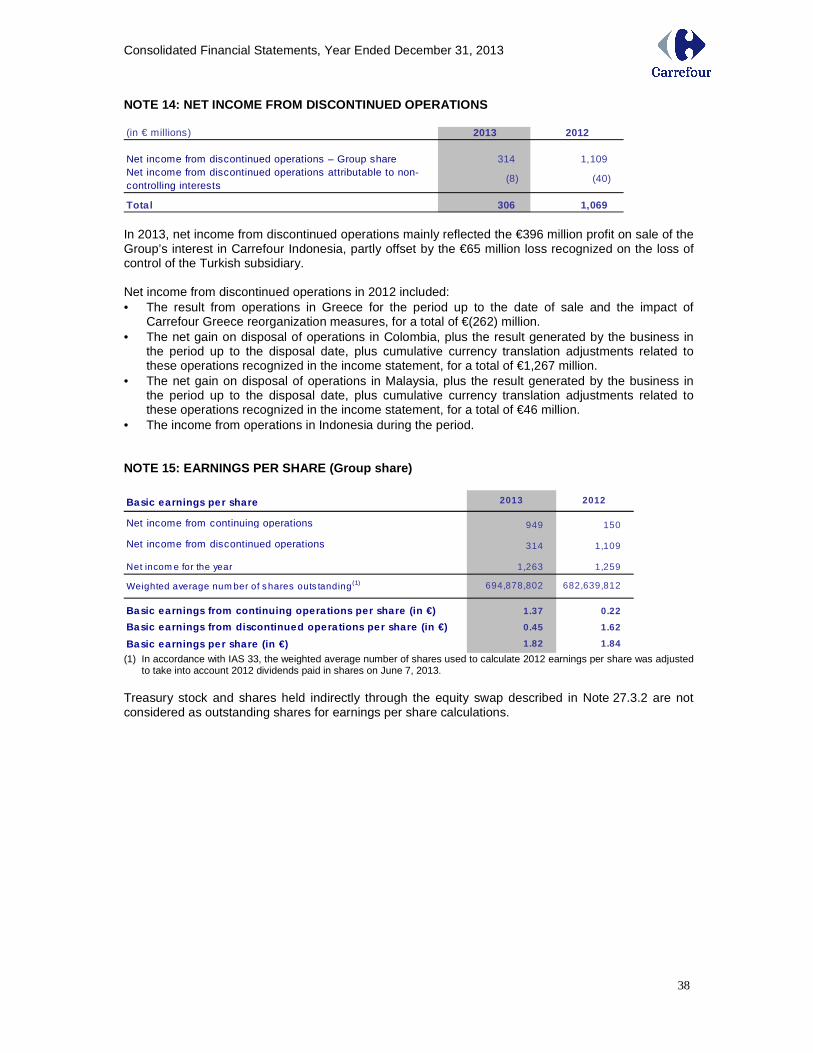
Consolidated Financial Statements, Year Ended December 31, 2013
38
NOTE 14: NET INCOME FROM DISCONTINUED OPERATIONS (in € millions) 2013 2012
Net income from discontinued operations – Group share 314 1,109 Net income from discontinued operations attributable to non-controlling interests
(8) (40)
Total 306 1,069 In 2013, net income from discontinued operations mainly reflected the €396 million profit on sale of the Group’s interest in Carrefour Indonesia, partly offset by the €65 million loss recognized on the loss of control of the Turkish subsidiary. Net income from discontinued operations in 2012 included: • The result from operations in Greece for the period up to the date of sale and the impact of
Carrefour Greece reorganization measures, for a total of €(262) million. • The net gain on disposal of operations in Colombia, plus the result generated by the business in
the period up to the disposal date, plus cumulative currency translation adjustments related to these operations recognized in the income statement, for a total of €1,267 million.
• The net gain on disposal of operations in Malaysia, plus the result generated by the business in the period up to the disposal date, plus cumulative currency translation adjustments related to these operations recognized in the income statement, for a total of €46 million.
• The income from operations in Indonesia during the period. NOTE 15: EARNINGS PER SHARE (Group share)
Basic earnings per share 2013 2012
Net income from continuing operations 949 150
Net income from discontinued operations 314 1,109
Net incom e for the year 1,263 1,259
Weighted average num ber of shares outs tanding (1) 694,878,802 682,639,812
Basic earnings from continuing opera tions per share (in €) 1.37 0.22
Basic earnings from discontinued opera tions per sha re (in €) 0.45 1.62
Basic earnings per share (in €) 1.82 1.84
(1) In accordance with IAS 33, the weighted average number of shares used to calculate 2012 earnings per share was adjusted to take into account 2012 dividends paid in shares on June 7, 2013.
Treasury stock and shares held indirectly through the equity swap described in Note 27.3.2 are not considered as outstanding shares for earnings per share calculations.
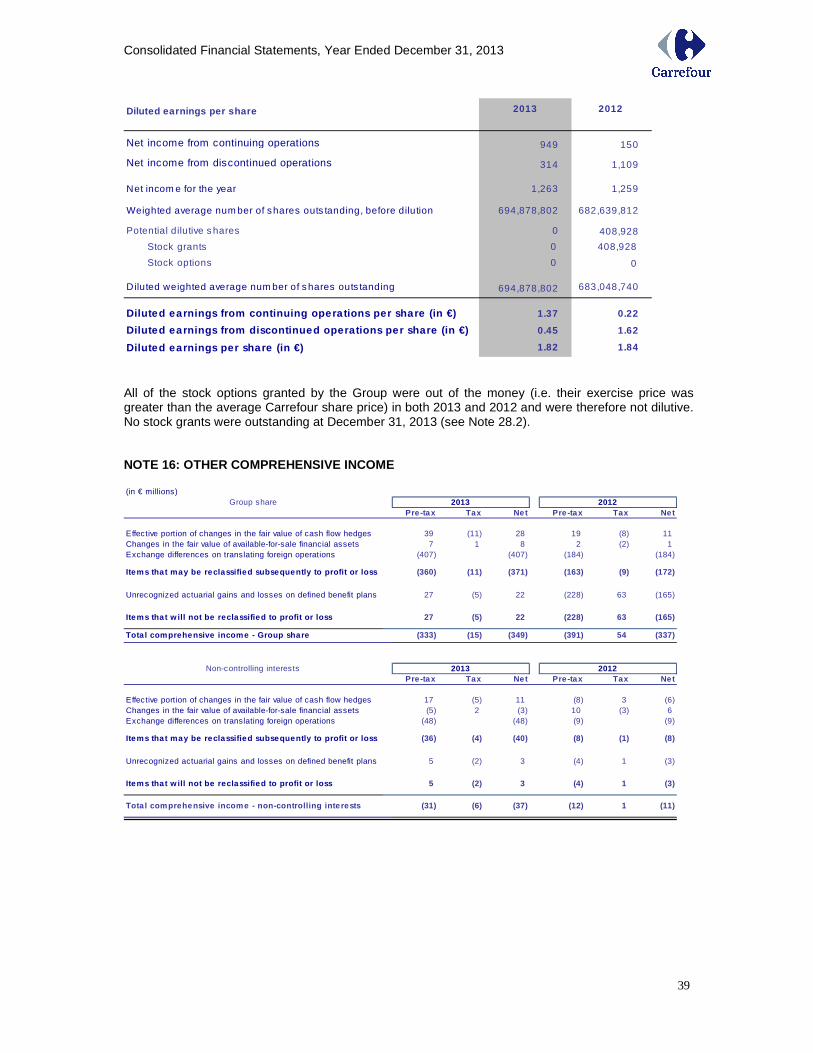
Consolidated Financial Statements, Year Ended December 31, 2013
39
Diluted earnings per share 2013 2012
Net income from continuing operations 949 150
Net income from discontinued operations 314 1,109
Net incom e for the year 1,263 1,259
Weighted average num ber of shares outs tanding, before dilution 694,878,802 682,639,812
Potential dilutive s hares 0 408,928
Stock grants 0 408,928
Stock options 0 00 1E-14
Diluted weighted average num ber of s hares outs tanding 694,878,802 683,048,740
Diluted earnings from continuing opera tions per sha re (in €) 1.37 0.22
Diluted earnings from discontinued operations per s hare (in €) 0.45 1.62
Diluted earnings per share (in €) 1.82 1.84 All of the stock options granted by the Group were out of the money (i.e. their exercise price was greater than the average Carrefour share price) in both 2013 and 2012 and were therefore not dilutive. No stock grants were outstanding at December 31, 2013 (see Note 28.2). NOTE 16: OTHER COMPREHENSIVE INCOME (in € millions)
Group sharePre-tax Tax Net Pre-tax Tax Net
Effective portion of changes in the fair value of cash flow hedges 39 (11) 28 19 (8) 11Changes in the fair value of available-for-sale financial assets 7 1 8 2 (2) 1Exchange differences on translating foreign operations (407) (407) (184) (184)
Items tha t may be reclassified subsequently to prof it or loss (360) (11) (371) (163) (9) (172)
Unrecognized actuarial gains and losses on defined benefit plans 27 (5) 22 (228) 63 (165)
Items tha t w ill not be reclassified to profit or lo ss 27 (5) 22 (228) 63 (165)
Tota l comprehensive income - Group share (333) (15) (349) (391) 54 (337)
Non-controlling interestsPre-tax Tax Net Pre-tax Tax Net
Effective portion of changes in the fair value of cash flow hedges 17 (5) 11 (8) 3 (6)Changes in the fair value of available-for-sale financial assets (5) 2 (3) 10 (3) 6Exchange differences on translating foreign operations (48) (48) (9) (9)
Items tha t may be reclassified subsequently to prof it or loss (36) (4) (40) (8) (1) (8)
Unrecognized actuarial gains and losses on defined benefit plans 5 (2) 3 (4) 1 (3)
Items tha t w ill not be reclassified to profit or lo ss 5 (2) 3 (4) 1 (3)
Tota l comprehensive income - non-controlling inte re sts (31) (6) (37) (12) 1 (11)
2013 2012
2013 2012
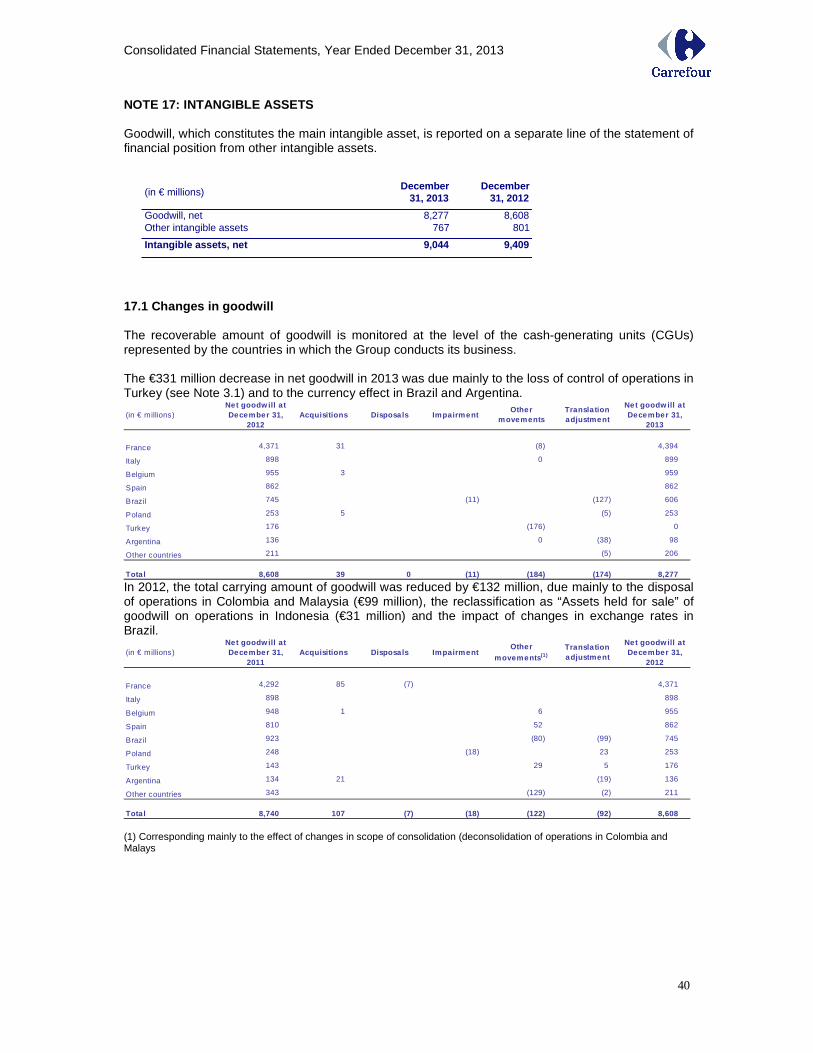
Consolidated Financial Statements, Year Ended December 31, 2013
40
NOTE 17: INTANGIBLE ASSETS Goodwill, which constitutes the main intangible asset, is reported on a separate line of the statement of financial position from other intangible assets.
17.1 Changes in goodwill The recoverable amount of goodwill is monitored at the level of the cash-generating units (CGUs) represented by the countries in which the Group conducts its business. The €331 million decrease in net goodwill in 2013 was due mainly to the loss of control of operations in Turkey (see Note 3.1) and to the currency effect in Brazil and Argentina.
(in € millions)Net goodw ill at December 31,
2012Acquisitions Disposa ls Impairment
Other movements
Transla tion adjustment
Net goodw ill at December 31,
2013
France 4,371 31 (8) 4,394
Italy 898 0 899
Belgium 955 3 959
Spain 862 862
Brazil 745 (11) (127) 606
Poland 253 5 (5) 253
Turkey 176 (176) 0
Argentina 136 0 (38) 98
Other countries 211 (5) 206
Tota l 8,608 39 0 (11) (184) (174) 8,277 In 2012, the total carrying amount of goodwill was reduced by €132 million, due mainly to the disposal of operations in Colombia and Malaysia (€99 million), the reclassification as “Assets held for sale” of goodwill on operations in Indonesia (€31 million) and the impact of changes in exchange rates in Brazil.
(in € millions)Net goodw ill at December 31,
2011Acquisitions Disposals Impairment
Other movements (1)
Transla tion adjustment
Net goodw ill at December 31,
2012
France 4,292 85 (7) 4,371
Italy 898 898
Belgium 948 1 6 955
Spain 810 52 862
Brazil 923 (80) (99) 745
Poland 248 (18) 23 253
Turkey 143 29 5 176
Argentina 134 21 (19) 136
Other countries 343 (129) (2) 211
Tota l 8,740 107 (7) (18) (122) (92) 8,608 (1) Corresponding mainly to the effect of changes in scope of consolidation (deconsolidation of operations in Colombia and Malays
(in € millions)December
31, 2013December
31, 2012
Goodwill, net 8,277 8,608Other intangible assets 767 801
Intangible assets, net 9,044 9,409
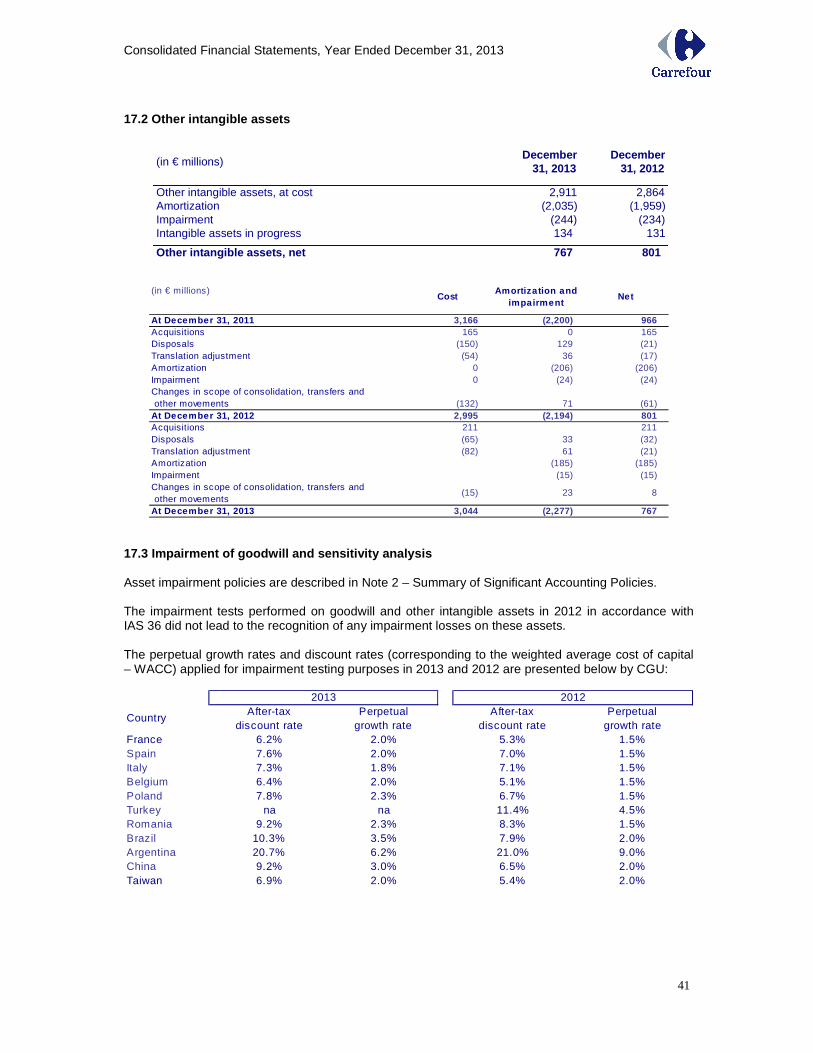
Consolidated Financial Statements, Year Ended December 31, 2013
41
17.2 Other intangible assets
(in € millions)Cost
Amortization and impairment
Net
At December 31, 2011 3,166 (2,200) 966Acquisitions 165 0 165Disposals (150) 129 (21)Translation adjustment (54) 36 (17)Amortization 0 (206) (206)Impairment 0 (24) (24)Changes in scope of consolidation, transfers and other movements (132) 71 (61)At December 31, 2012 2,995 (2,194) 801Acquisitions 211 211Disposals (65) 33 (32)Translation adjustment (82) 61 (21)Amortization (185) (185)Impairment (15) (15)Changes in scope of consolidation, transfers and other movements
(15) 23 8
At December 31, 2013 3,044 (2,277) 767 17.3 Impairment of goodwill and sensitivity analysi s Asset impairment policies are described in Note 2 – Summary of Significant Accounting Policies. The impairment tests performed on goodwill and other intangible assets in 2012 in accordance with IAS 36 did not lead to the recognition of any impairment losses on these assets.
The perpetual growth rates and discount rates (corresponding to the weighted average cost of capital – WACC) applied for impairment testing purposes in 2013 and 2012 are presented below by CGU:
After-tax Perpetual After-tax Perpetual discount rate growth rate discount rate growth rate
France 6.2% 2.0% 5.3% 1.5%Spain 7.6% 2.0% 7.0% 1.5%Italy 7.3% 1.8% 7.1% 1.5%Belgium 6.4% 2.0% 5.1% 1.5%Poland 7.8% 2.3% 6.7% 1.5%Turkey na na 11.4% 4.5%Romania 9.2% 2.3% 8.3% 1.5%Brazil 10.3% 3.5% 7.9% 2.0%Argentina 20.7% 6.2% 21.0% 9.0%China 9.2% 3.0% 6.5% 2.0%Taiwan 6.9% 2.0% 5.4% 2.0%
Country
2013 2012
(in € millions)December
31, 2013December
31, 2012
Other intangible assets, at cost 2,911 2,864Amortization (2,035) (1,959)Impairment (244) (234)Intangible assets in progress 134 131
Other intangible assets, net 767 801
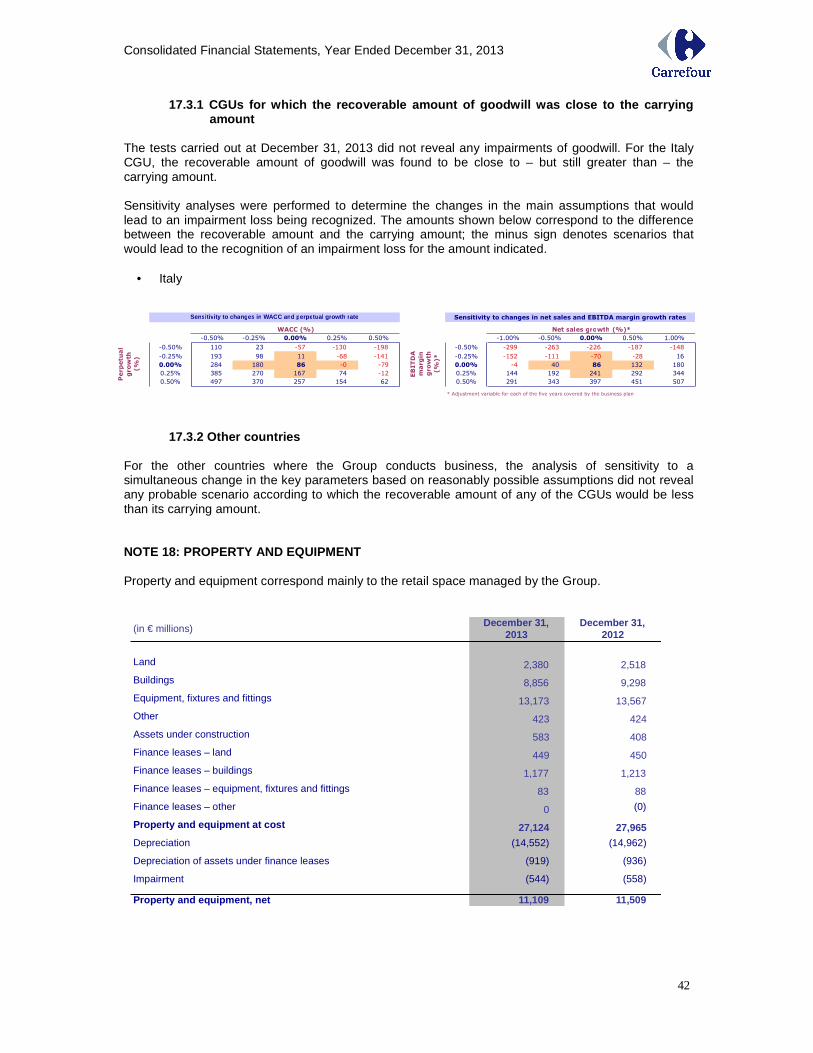
Consolidated Financial Statements, Year Ended December 31, 2013
42
17.3.1 CGUs for which the recoverable amount of goo dwill was close to the carrying amount
The tests carried out at December 31, 2013 did not reveal any impairments of goodwill. For the Italy CGU, the recoverable amount of goodwill was found to be close to – but still greater than – the carrying amount. Sensitivity analyses were performed to determine the changes in the main assumptions that would lead to an impairment loss being recognized. The amounts shown below correspond to the difference between the recoverable amount and the carrying amount; the minus sign denotes scenarios that would lead to the recognition of an impairment loss for the amount indicated.
• Italy
17.3.2 Other countries For the other countries where the Group conducts business, the analysis of sensitivity to a simultaneous change in the key parameters based on reasonably possible assumptions did not reveal any probable scenario according to which the recoverable amount of any of the CGUs would be less than its carrying amount. NOTE 18: PROPERTY AND EQUIPMENT Property and equipment correspond mainly to the retail space managed by the Group.
-0.50% -0.25% 0.00% 0.25% 0.50% -1.00% -0.50% 0.00% 0.50% 1.00%
-0.50% 110 23 -57 -130 -198 -0.50% -299 -263 -226 -187 -148
-0.25% 193 98 11 -68 -141 -0.25% -152 -111 -70 -28 16
0.00% 284 180 86 -0 -79 0.00% -4 40 86 132 180
0.25% 385 270 167 74 -12 0.25% 144 192 241 292 344
0.50% 497 370 257 154 62 0.50% 291 343 397 451 507
* Adjustment variable for each of the five years covered by the business plan
Perpetual
growth
(%)
Sensitivity to changes in net sales and EBITDA margin growth rates
Net sales growth (%)*
EBITDA
margin
growth
(%)*
Sensiti vity to changes in WACC and perpetual growth rate
WACC (%)
(in € millions)December 31,
2013December 31,
2012
Land 2,380 2,518
Buildings 8,856 9,298
Equipment, fixtures and fittings 13,173 13,567
Other 423 424
Assets under construction 583 408
Finance leases – land 449 450
Finance leases – buildings 1,177 1,213
Finance leases – equipment, fixtures and fittings 83 88
Finance leases – other 0 (0)
Property and equipment at cost 27,124 27,965
Depreciation (14,552) (14,962)
Depreciation of assets under finance leases (919) (936)
Impairment (544) (558)
Property and equipment, net 11,109 11,509
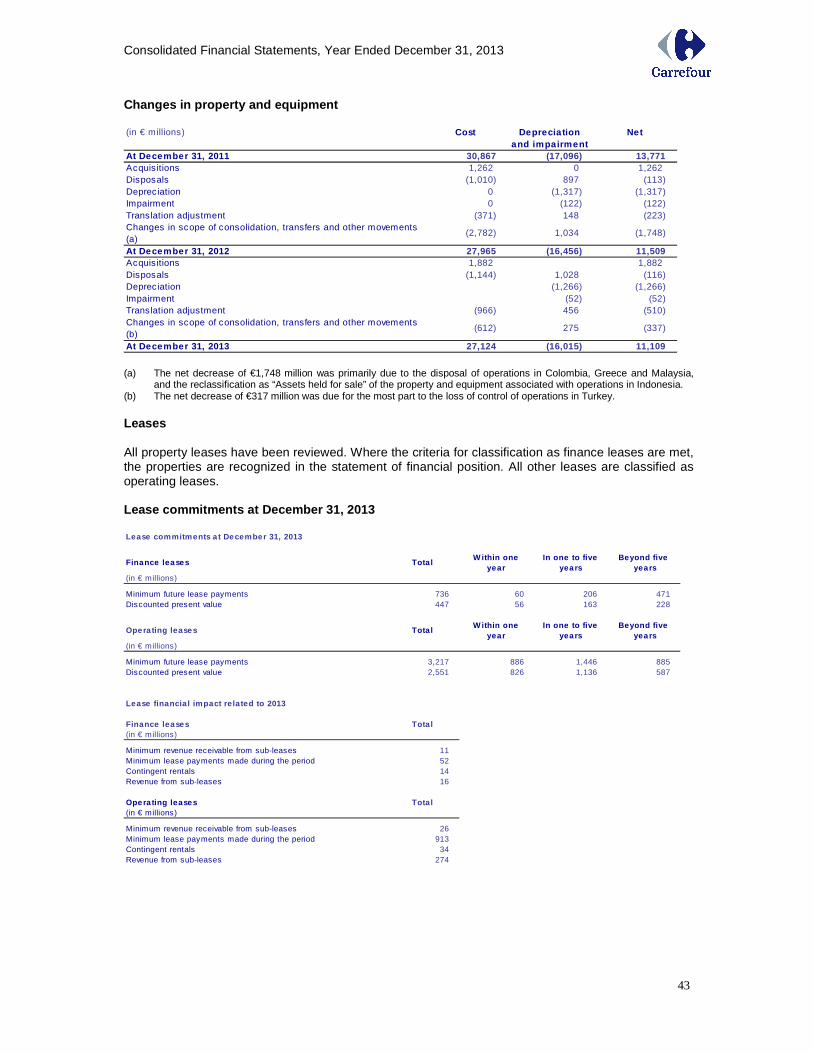
Consolidated Financial Statements, Year Ended December 31, 2013
43
Changes in property and equipment (in € millions) Cost Deprecia tion Net
and impairmentAt December 31, 2011 30,867 (17,096) 13,771Acquisitions 1,262 0 1,262 Disposals (1,010) 897 (113)Depreciation 0 (1,317) (1,317)Impairment 0 (122) (122)Translation adjustment (371) 148 (223)Changes in scope of consolidation, transfers and other movements (a)
(2,782) 1,034 (1,748)
At December 31, 2012 27,965 (16,456) 11,509Acquisitions 1,882 1,882 Disposals (1,144) 1,028 (116)Depreciation (1,266) (1,266)Impairment (52) (52)Translation adjustment (966) 456 (510)Changes in scope of consolidation, transfers and other movements (b)
(612) 275 (337)
At December 31, 2013 27,124 (16,015) 11,109 (a) The net decrease of €1,748 million was primarily due to the disposal of operations in Colombia, Greece and Malaysia,
and the reclassification as “Assets held for sale” of the property and equipment associated with operations in Indonesia. (b) The net decrease of €317 million was due for the most part to the loss of control of operations in Turkey. Leases All property leases have been reviewed. Where the criteria for classification as finance leases are met, the properties are recognized in the statement of financial position. All other leases are classified as operating leases. Lease commitments at December 31, 2013 Lease commitments a t December 31, 2013
Finance leases Tota lW ithin one
year In one to five
yearsBeyond five
years(in € millions)
Minimum future lease payments 736 60 206 471Discounted present value 447 56 163 228
Opera ting leases Tota lW ithin one
year In one to five
yearsBeyond five
years(in € millions)
Minimum future lease payments 3,217 886 1,446 885Discounted present value 2,551 826 1,136 587
Lease financia l impact re lated to 2013
Finance leases Tota l(in € millions)
Minimum revenue receivable from sub-leases 11Minimum lease payments made during the period 52Contingent rentals 14Revenue from sub-leases 16
Opera ting leases Tota l(in € millions)
Minimum revenue receivable from sub-leases 26Minimum lease payments made during the period 913Contingent rentals 34Revenue from sub-leases 274
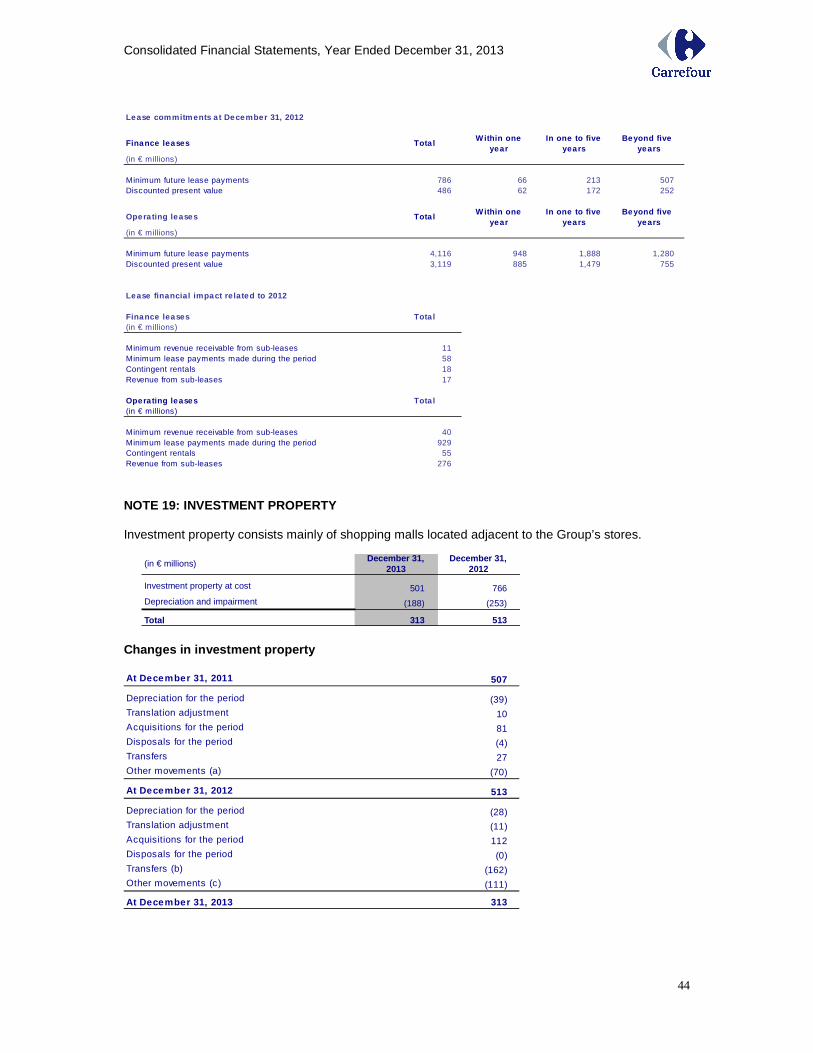
Consolidated Financial Statements, Year Ended December 31, 2013
44
Lease commitments a t December 31, 2012
Finance leases Tota lW ithin one
year In one to five
yearsBeyond five
years(in € millions)
Minimum future lease payments 786 66 213 507Discounted present value 486 62 172 252
Opera ting leases Tota lW ithin one
year In one to five
yearsBeyond five
years(in € millions)
Minimum future lease payments 4,116 948 1,888 1,280Discounted present value 3,119 885 1,479 755
Lease financial impact re lated to 2012
Finance leases Tota l(in € millions)
Minimum revenue receivable from sub-leases 11Minimum lease payments made during the period 58Contingent rentals 18Revenue from sub-leases 17
Opera ting leases Tota l(in € millions)
Minimum revenue receivable from sub-leases 40Minimum lease payments made during the period 929Contingent rentals 55Revenue from sub-leases 276 NOTE 19: INVESTMENT PROPERTY Investment property consists mainly of shopping malls located adjacent to the Group’s stores.
Changes in investment property At December 31, 2011 507
Depreciation for the period (39)Translation adjustment 10Acquisitions for the period 81Disposals for the period (4)Transfers 27Other movements (a) (70)
At December 31, 2012 513
Depreciation for the period (28)Translation adjustment (11)Acquisitions for the period 112Disposals for the period (0)Transfers (b) (162)Other movements (c) (111)
At December 31, 2013 313
(in € millions)December 31,
2013December 31,
2012
Investment property at cost 501 766
Depreciation and impairment (188) (253)
Total 313 513
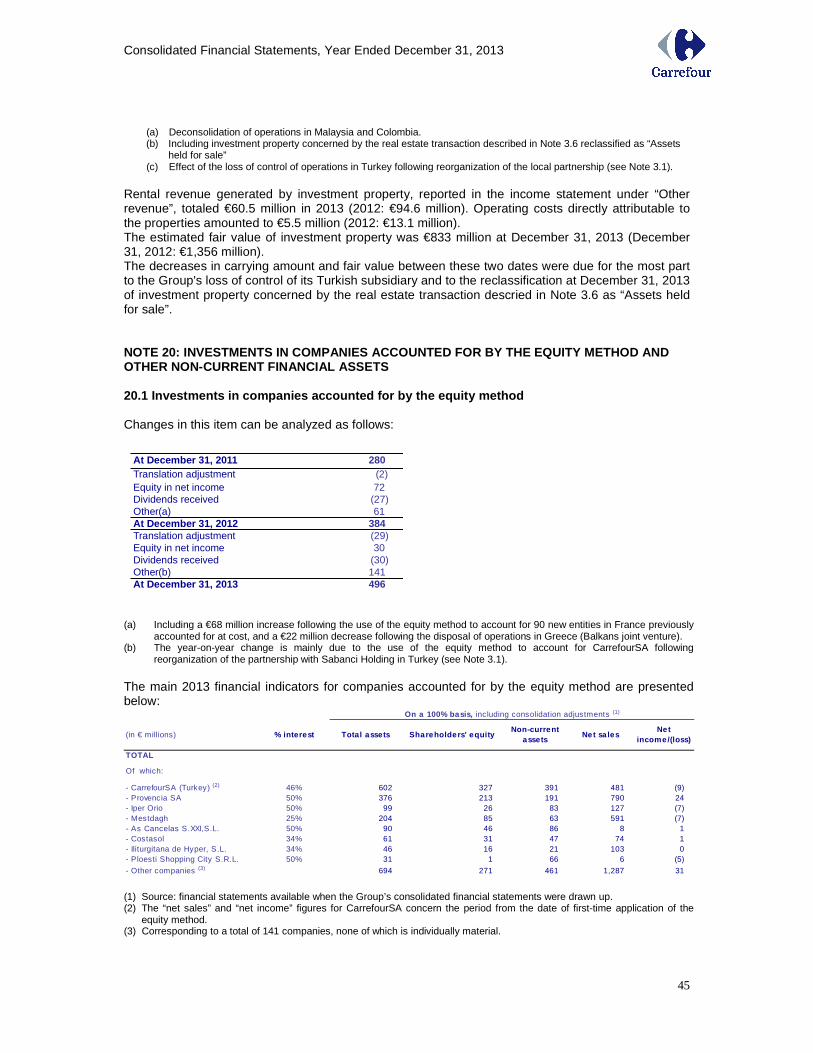
Consolidated Financial Statements, Year Ended December 31, 2013
45
(a) Deconsolidation of operations in Malaysia and Colombia. (b) Including investment property concerned by the real estate transaction described in Note 3.6 reclassified as “Assets
held for sale” (c) Effect of the loss of control of operations in Turkey following reorganization of the local partnership (see Note 3.1).
Rental revenue generated by investment property, reported in the income statement under “Other revenue”, totaled €60.5 million in 2013 (2012: €94.6 million). Operating costs directly attributable to the properties amounted to €5.5 million (2012: €13.1 million). The estimated fair value of investment property was €833 million at December 31, 2013 (December 31, 2012: €1,356 million). The decreases in carrying amount and fair value between these two dates were due for the most part to the Group's loss of control of its Turkish subsidiary and to the reclassification at December 31, 2013 of investment property concerned by the real estate transaction descried in Note 3.6 as “Assets held for sale”. NOTE 20: INVESTMENTS IN COMPANIES ACCOUNTED FOR BY THE EQUITY METHOD AND OTHER NON-CURRENT FINANCIAL ASSETS 20.1 Investments in companies accounted for by the equity method Changes in this item can be analyzed as follows:
(a) Including a €68 million increase following the use of the equity method to account for 90 new entities in France previously
accounted for at cost, and a €22 million decrease following the disposal of operations in Greece (Balkans joint venture). (b) The year-on-year change is mainly due to the use of the equity method to account for CarrefourSA following
reorganization of the partnership with Sabanci Holding in Turkey (see Note 3.1). The main 2013 financial indicators for companies accounted for by the equity method are presented below:
(in € millions) % interest Total assets Shareholders' equityNon-current
assetsNet sa les
Net income/(loss)
TOTAL
Of which:
- CarrefourSA (Turkey) (2) 46% 602 327 391 481 (9)- Provencia SA 50% 376 213 191 790 24- Iper Orio 50% 99 26 83 127 (7)- Mestdagh 25% 204 85 63 591 (7)- As Cancelas S.XXI,S.L. 50% 90 46 86 8 1- Costasol 34% 61 31 47 74 1- Iliturgitana de Hyper, S.L. 34% 46 16 21 103 0- Ploesti Shopping City S.R.L. 50% 31 1 66 6 (5)
- Other companies (3) 694 271 461 1,287 31
On a 100% basis, including consolidation adjustments (1)
(1) Source: financial statements available when the Group’s consolidated financial statements were drawn up. (2) The “net sales” and “net income” figures for CarrefourSA concern the period from the date of first-time application of the
equity method. (3) Corresponding to a total of 141 companies, none of which is individually material.
At December 31, 2011 280 Translation adjustment (2)Equity in net income 72 Dividends received (27)Other(a) 61 At December 31, 2012 384 Translation adjustment (29)Equity in net income 30 Dividends received (30)Other(b) 141 At December 31, 2013 496
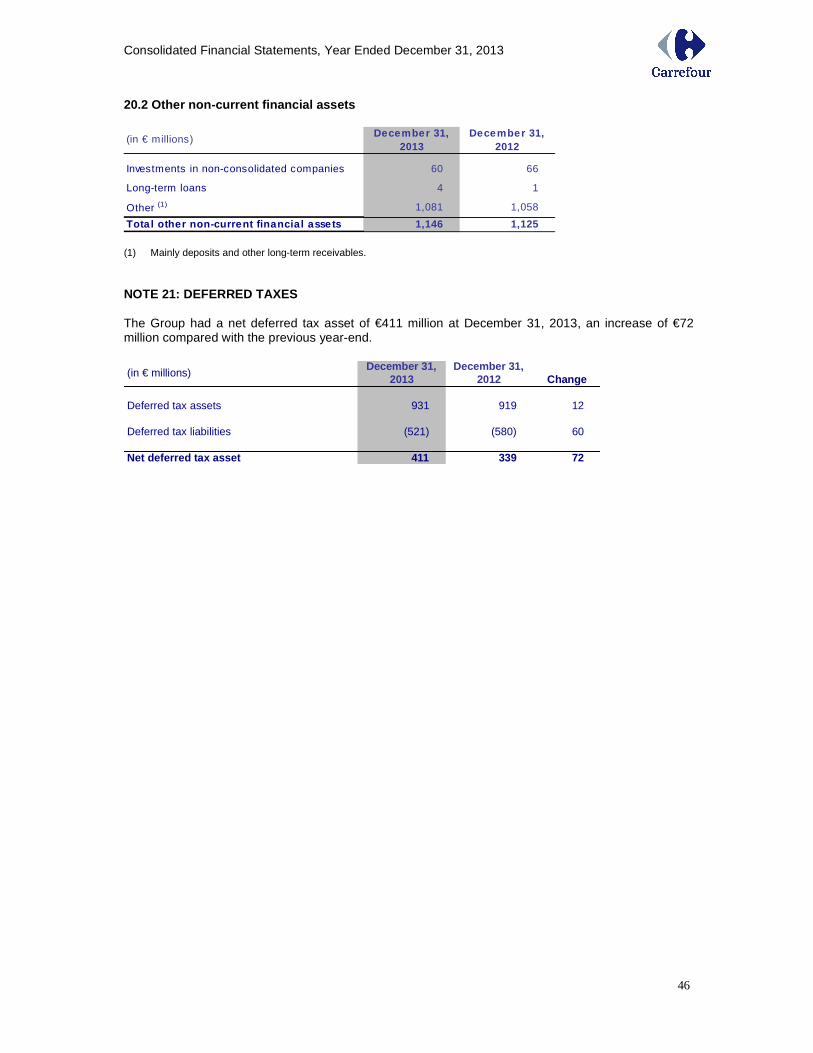
Consolidated Financial Statements, Year Ended December 31, 2013
46
20.2 Other non-current financial assets
(in € millions)December 31,
2013December 31,
2012
Investments in non-consolidated companies 60 66
Long-term loans 4 1
Other (1) 1,081 1,058
Tota l other non-current financia l asse ts 1,146 1,125 (1) Mainly deposits and other long-term receivables. NOTE 21: DEFERRED TAXES The Group had a net deferred tax asset of €411 million at December 31, 2013, an increase of €72 million compared with the previous year-end.
(in € millions)December 31,
2013December 31,
2012 Change
Deferred tax assets 931 919 12
Deferred tax liabilities (521) (580) 60
Net deferred tax asset 411 339 72
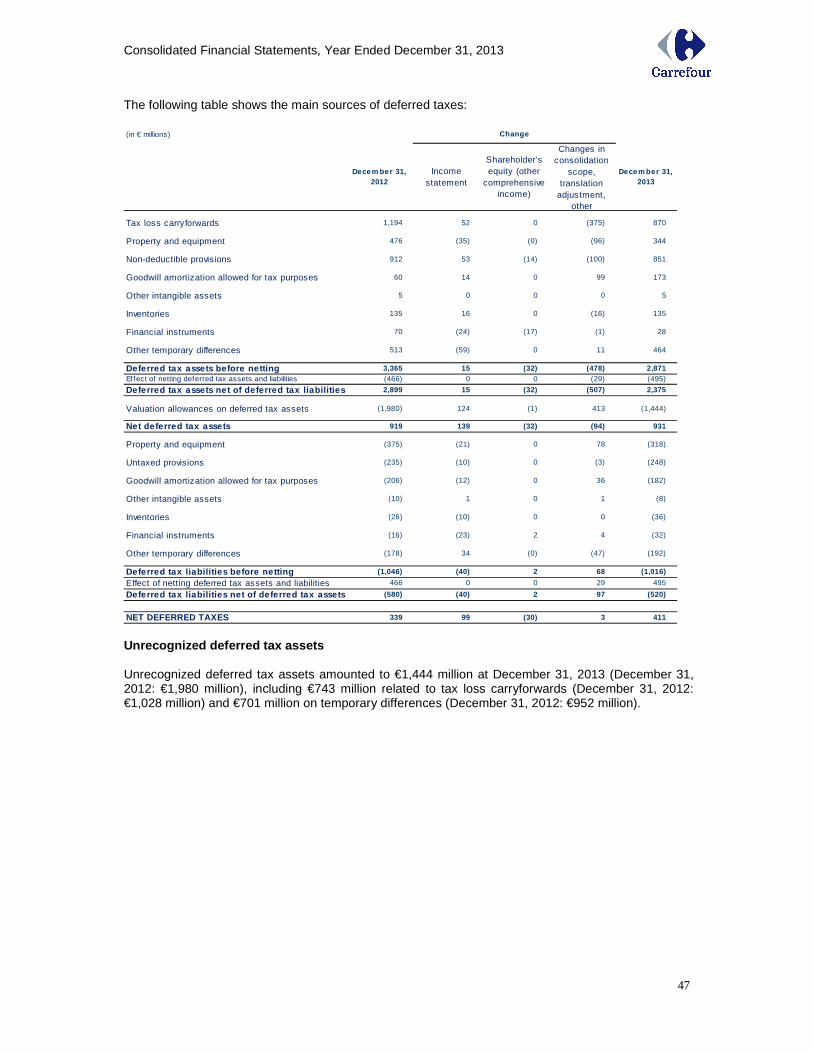
Consolidated Financial Statements, Year Ended December 31, 2013
47
The following table shows the main sources of deferred taxes: (in € millions)
Decem ber 31, 2012
Income statement
Shareholder’s equity (other
comprehensive income)
Changes in consolidation
scope, translation
adjustment, other
Decem ber 31, 2013
Tax loss carryforwards 1,194 52 0 (375) 870
Property and equipment 476 (35) (0) (96) 344
Non-deductible provisions 912 53 (14) (100) 851
Goodwill amortization allowed for tax purposes 60 14 0 99 173
Other intangible assets 5 0 0 0 5
Inventories 135 16 0 (16) 135
Financial instruments 70 (24) (17) (1) 28
Other temporary differences 513 (59) 0 11 464
Deferred tax assets before netting 3,365 15 (32) (478) 2,871Effect of netting deferred tax assets and liabilities (466) 0 0 (29) (495)
Deferred tax assets net of deferred tax liabilities 2,899 15 (32) (507) 2,375
Valuation allowances on deferred tax assets (1,980) 124 (1) 413 (1,444)
Net deferred tax assets 919 139 (32) (94) 931
Property and equipment (375) (21) 0 78 (318)
Untaxed provisions (235) (10) 0 (3) (248)
Goodwill amortization allowed for tax purposes (206) (12) 0 36 (182)
Other intangible assets (10) 1 0 1 (8)
Inventories (26) (10) 0 0 (36)
Financial instruments (16) (23) 2 4 (32)
Other temporary differences (178) 34 (0) (47) (192)
Deferred tax liabilities before netting (1,046) (40) 2 68 (1,016)
Effect of netting deferred tax assets and liabilities 466 0 0 29 495
Deferred tax liabilities net of deferred tax assets (580) (40) 2 97 (520)
NET DEFERRED TAXES 339 99 (30) 3 411
Change
Unrecognized deferred tax assets Unrecognized deferred tax assets amounted to €1,444 million at December 31, 2013 (December 31, 2012: €1,980 million), including €743 million related to tax loss carryforwards (December 31, 2012: €1,028 million) and €701 million on temporary differences (December 31, 2012: €952 million).
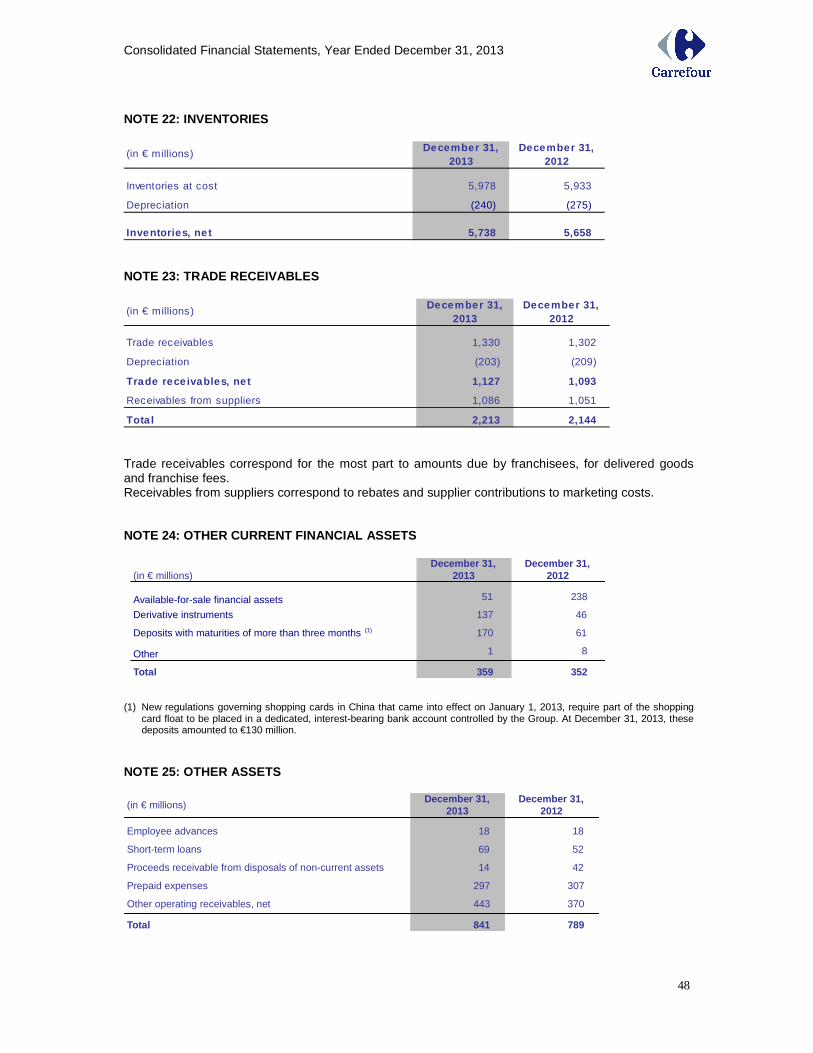
Consolidated Financial Statements, Year Ended December 31, 2013
48
NOTE 22: INVENTORIES
(in € millions)December 31,
2013December 31,
2012
Inventories at cost 5,978 5,933
Depreciation (240) (275)
Inventories, ne t 5,738 5,658 NOTE 23: TRADE RECEIVABLES
(in € millions)December 31,
2013December 31,
2012
Trade receivables 1,330 1,302
Depreciation (203) (209)
Trade rece ivables, net 1,127 1,093
Receivables from suppliers 1,086 1,051
Tota l 2,213 2,144 Trade receivables correspond for the most part to amounts due by franchisees, for delivered goods and franchise fees. Receivables from suppliers correspond to rebates and supplier contributions to marketing costs. NOTE 24: OTHER CURRENT FINANCIAL ASSETS
(1) New regulations governing shopping cards in China that came into effect on January 1, 2013, require part of the shopping
card float to be placed in a dedicated, interest-bearing bank account controlled by the Group. At December 31, 2013, these deposits amounted to €130 million.
NOTE 25: OTHER ASSETS
(in € millions)December 31,
2013December 31,
2012
Available-for-sale financial assets 51 238
Derivative instruments 137 46
Deposits with maturities of more than three months (1) 170 61
Other 1 8
Total 359 352
(in € millions)December 31,
2013December 31,
2012
Employee advances 18 18
Short-term loans 69 52
Proceeds receivable from disposals of non-current assets 14 42
Prepaid expenses 297 307
Other operating receivables, net 443 370
Total 841 789
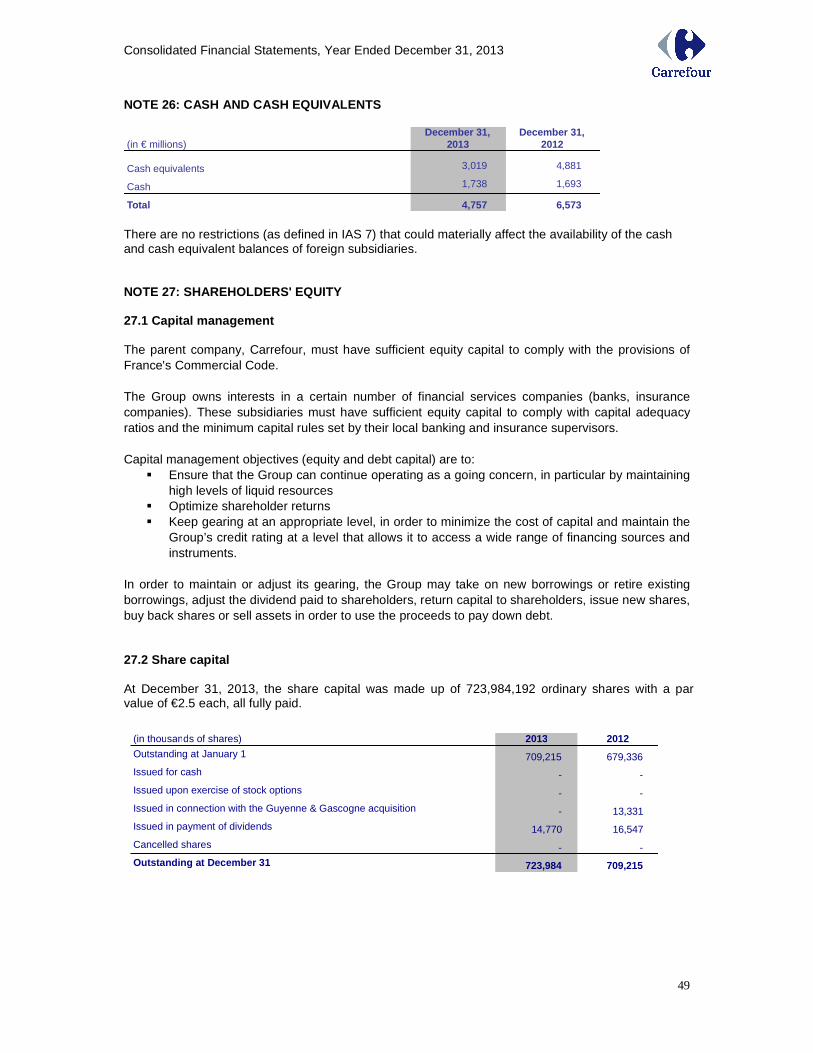
Consolidated Financial Statements, Year Ended December 31, 2013
49
NOTE 26: CASH AND CASH EQUIVALENTS
There are no restrictions (as defined in IAS 7) that could materially affect the availability of the cash and cash equivalent balances of foreign subsidiaries. NOTE 27: SHAREHOLDERS' EQUITY 27.1 Capital management The parent company, Carrefour, must have sufficient equity capital to comply with the provisions of France's Commercial Code. The Group owns interests in a certain number of financial services companies (banks, insurance companies). These subsidiaries must have sufficient equity capital to comply with capital adequacy ratios and the minimum capital rules set by their local banking and insurance supervisors. Capital management objectives (equity and debt capital) are to:
� Ensure that the Group can continue operating as a going concern, in particular by maintaining high levels of liquid resources
� Optimize shareholder returns � Keep gearing at an appropriate level, in order to minimize the cost of capital and maintain the
Group’s credit rating at a level that allows it to access a wide range of financing sources and instruments.
In order to maintain or adjust its gearing, the Group may take on new borrowings or retire existing borrowings, adjust the dividend paid to shareholders, return capital to shareholders, issue new shares, buy back shares or sell assets in order to use the proceeds to pay down debt. 27.2 Share capital At December 31, 2013, the share capital was made up of 723,984,192 ordinary shares with a par value of €2.5 each, all fully paid.
(in € millions)December 31,
2013December 31,
2012
Cash equivalents 3,019 4,881
Cash 1,738 1,693
Total 4,757 6,573
(in thousands of shares) 2013 2012
Outstanding at January 1 709,215 679,336
Issued for cash - -
Issued upon exercise of stock options - -
Issued in connection with the Guyenne & Gascogne acquisition - 13,331
Issued in payment of dividends 14,770 16,547
Cancelled shares - -
Outstanding at December 31 723,984 709,215
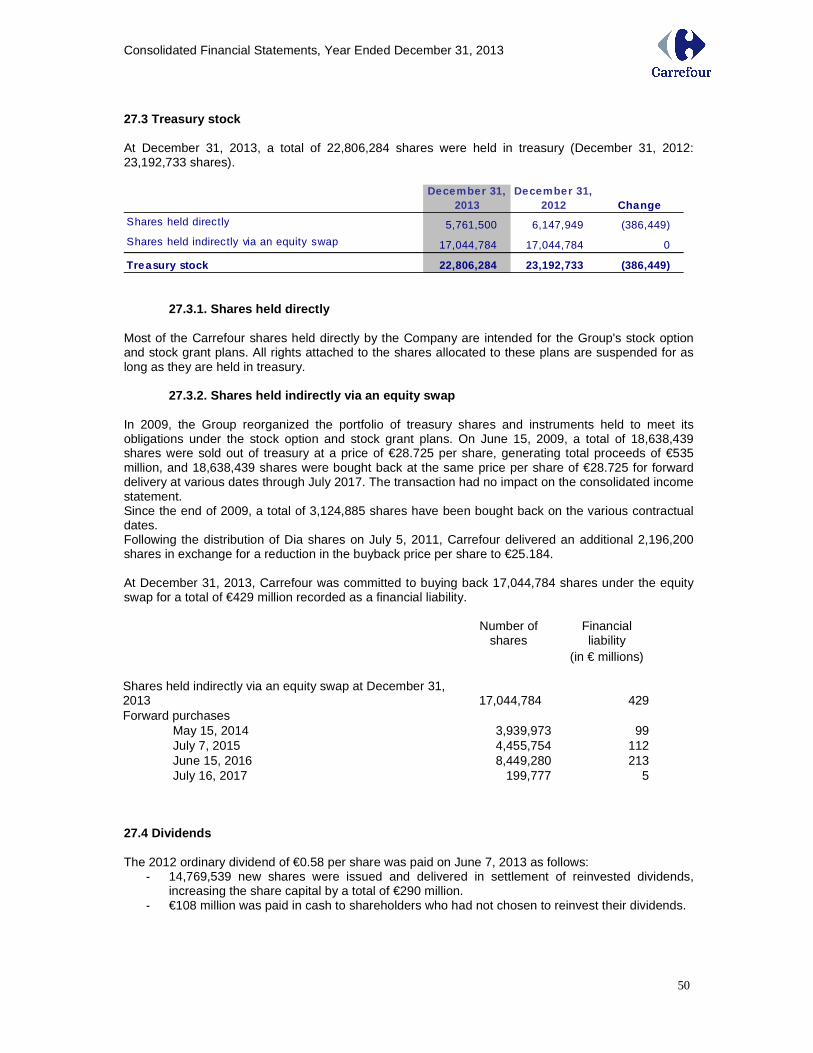
Consolidated Financial Statements, Year Ended December 31, 2013
50
27.3 Treasury stock At December 31, 2013, a total of 22,806,284 shares were held in treasury (December 31, 2012: 23,192,733 shares).
December 31, 2013
December 31, 2012 Change
Shares held directly 5,761,500 6,147,949 (386,449)
Shares held indirectly via an equity swap 17,044,784 17,044,784 0
Treasury stock 22,806,284 23,192,733 (386,449)
27.3.1. Shares held directly Most of the Carrefour shares held directly by the Company are intended for the Group's stock option and stock grant plans. All rights attached to the shares allocated to these plans are suspended for as long as they are held in treasury.
27.3.2. Shares held indirectly via an equity swap In 2009, the Group reorganized the portfolio of treasury shares and instruments held to meet its obligations under the stock option and stock grant plans. On June 15, 2009, a total of 18,638,439 shares were sold out of treasury at a price of €28.725 per share, generating total proceeds of €535 million, and 18,638,439 shares were bought back at the same price per share of €28.725 for forward delivery at various dates through July 2017. The transaction had no impact on the consolidated income statement. Since the end of 2009, a total of 3,124,885 shares have been bought back on the various contractual dates. Following the distribution of Dia shares on July 5, 2011, Carrefour delivered an additional 2,196,200 shares in exchange for a reduction in the buyback price per share to €25.184. At December 31, 2013, Carrefour was committed to buying back 17,044,784 shares under the equity swap for a total of €429 million recorded as a financial liability.
Number of shares
Financial liability
(in € millions)
Shares held indirectly via an equity swap at December 31, 2013 17,044,784 429 Forward purchases
May 15, 2014 3,939,973 99 July 7, 2015 4,455,754 112 June 15, 2016 8,449,280 213 July 16, 2017 199,777 5
27.4 Dividends The 2012 ordinary dividend of €0.58 per share was paid on June 7, 2013 as follows:
- 14,769,539 new shares were issued and delivered in settlement of reinvested dividends, increasing the share capital by a total of €290 million.
- €108 million was paid in cash to shareholders who had not chosen to reinvest their dividends.
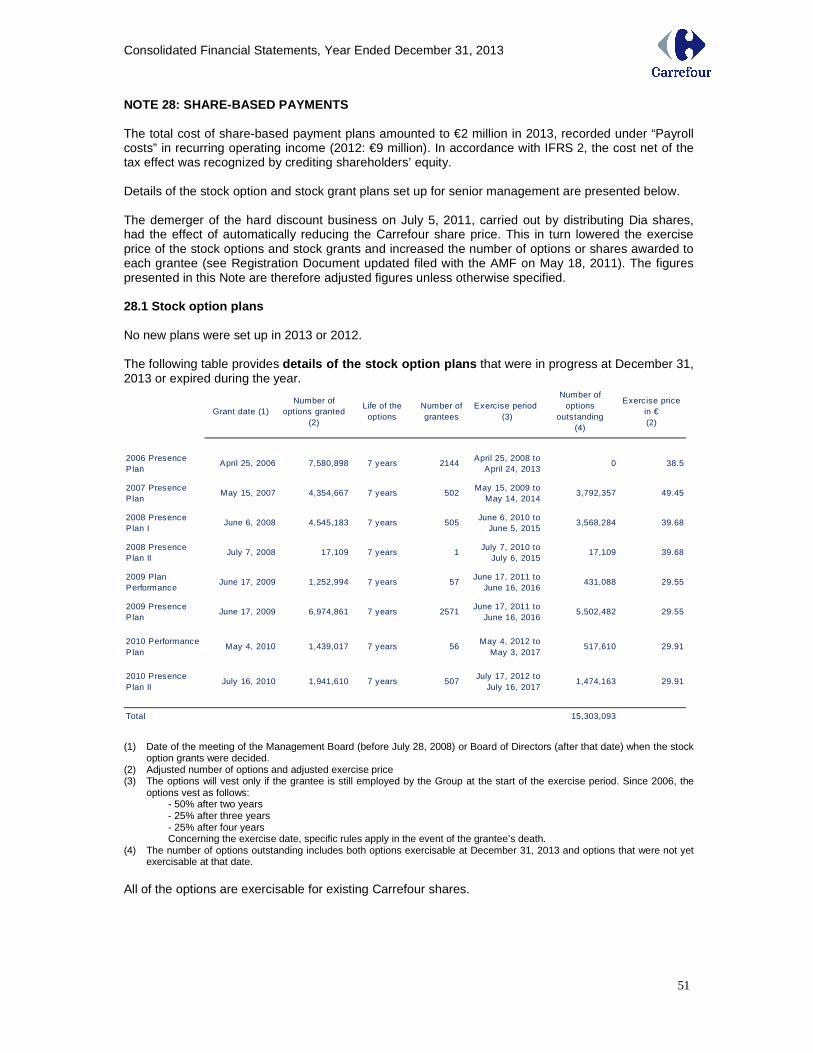
Consolidated Financial Statements, Year Ended December 31, 2013
51
NOTE 28: SHARE-BASED PAYMENTS The total cost of share-based payment plans amounted to €2 million in 2013, recorded under “Payroll costs” in recurring operating income (2012: €9 million). In accordance with IFRS 2, the cost net of the tax effect was recognized by crediting shareholders’ equity. Details of the stock option and stock grant plans set up for senior management are presented below. The demerger of the hard discount business on July 5, 2011, carried out by distributing Dia shares, had the effect of automatically reducing the Carrefour share price. This in turn lowered the exercise price of the stock options and stock grants and increased the number of options or shares awarded to each grantee (see Registration Document updated filed with the AMF on May 18, 2011). The figures presented in this Note are therefore adjusted figures unless otherwise specified. 28.1 Stock option plans
No new plans were set up in 2013 or 2012. The following table provides details of the stock option plans that were in progress at December 31, 2013 or expired during the year.
Grant date (1) Number of
options granted(2)
Life of the options
Number of grantees
Exercise period (3)
Number of options
outstanding(4)
Exercise price in €(2)
2006 Presence Plan
April 25, 2006 7,580,898 7 years 2144April 25, 2008 to
April 24, 20130 38.5
2007 Presence Plan
May 15, 2007 4,354,667 7 years 502May 15, 2009 to
May 14, 20143,792,357 49.45
2008 Presence Plan I
June 6, 2008 4,545,183 7 years 505June 6, 2010 to
June 5, 20153,568,284 39.68
2008 Presence Plan II
July 7, 2008 17,109 7 years 1July 7, 2010 to
July 6, 201517,109 39.68
2009 Plan Performance
June 17, 2009 1,252,994 7 years 57June 17, 2011 to
June 16, 2016431,088 29.55
2009 Presence Plan
June 17, 2009 6,974,861 7 years 2571June 17, 2011 to
June 16, 20165,502,482 29.55
2010 Performance Plan
May 4, 2010 1,439,017 7 years 56May 4, 2012 to
May 3, 2017517,610 29.91
2010 Presence Plan II
July 16, 2010 1,941,610 7 years 507July 17, 2012 to
July 16, 20171,474,163 29.91
Total 15,303,093
(1) Date of the meeting of the Management Board (before July 28, 2008) or Board of Directors (after that date) when the stock option grants were decided.
(2) Adjusted number of options and adjusted exercise price (3) The options will vest only if the grantee is still employed by the Group at the start of the exercise period. Since 2006, the
options vest as follows: - 50% after two years - 25% after three years - 25% after four years Concerning the exercise date, specific rules apply in the event of the grantee’s death.
(4) The number of options outstanding includes both options exercisable at December 31, 2013 and options that were not yet exercisable at that date.
All of the options are exercisable for existing Carrefour shares.
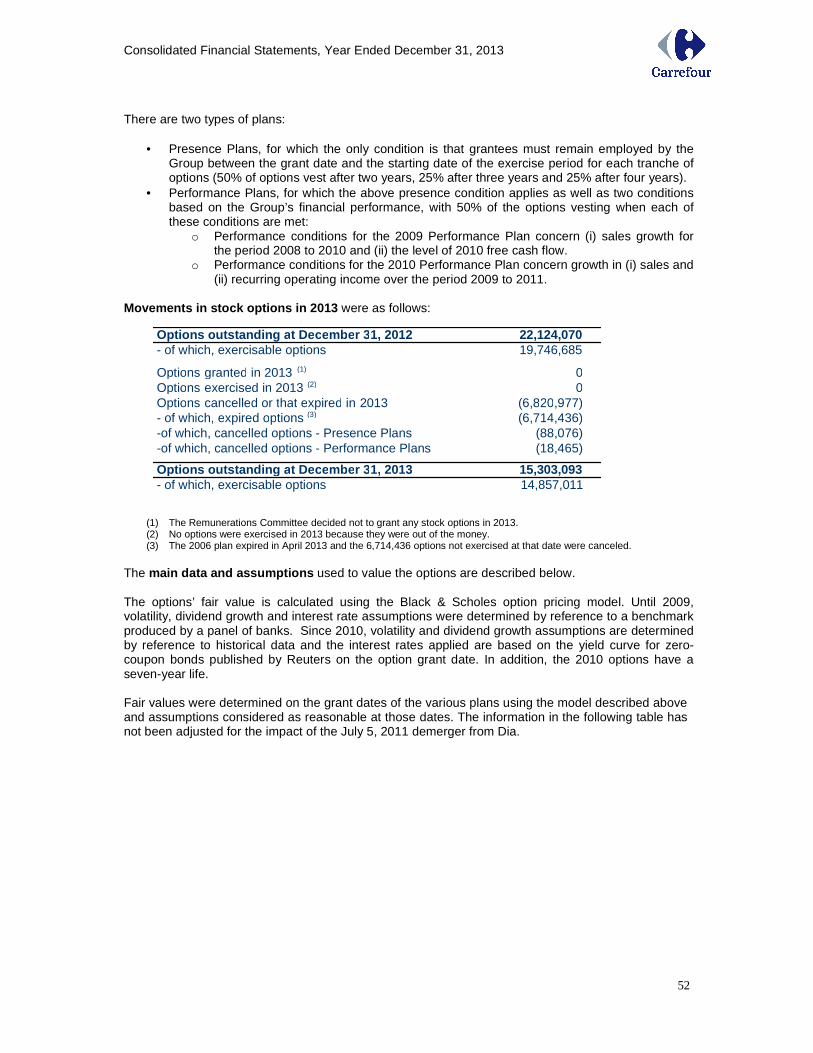
Consolidated Financial Statements, Year Ended December 31, 2013
52
There are two types of plans:
• Presence Plans, for which the only condition is that grantees must remain employed by the Group between the grant date and the starting date of the exercise period for each tranche of options (50% of options vest after two years, 25% after three years and 25% after four years).
• Performance Plans, for which the above presence condition applies as well as two conditions based on the Group’s financial performance, with 50% of the options vesting when each of these conditions are met:
o Performance conditions for the 2009 Performance Plan concern (i) sales growth for the period 2008 to 2010 and (ii) the level of 2010 free cash flow.
o Performance conditions for the 2010 Performance Plan concern growth in (i) sales and (ii) recurring operating income over the period 2009 to 2011.
Movements in stock options in 2013 were as follows:
(1) The Remunerations Committee decided not to grant any stock options in 2013. (2) No options were exercised in 2013 because they were out of the money. (3) The 2006 plan expired in April 2013 and the 6,714,436 options not exercised at that date were canceled.
The main data and assumptions used to value the options are described below. The options’ fair value is calculated using the Black & Scholes option pricing model. Until 2009, volatility, dividend growth and interest rate assumptions were determined by reference to a benchmark produced by a panel of banks. Since 2010, volatility and dividend growth assumptions are determined by reference to historical data and the interest rates applied are based on the yield curve for zero-coupon bonds published by Reuters on the option grant date. In addition, the 2010 options have a seven-year life.
Fair values were determined on the grant dates of the various plans using the model described above and assumptions considered as reasonable at those dates. The information in the following table has not been adjusted for the impact of the July 5, 2011 demerger from Dia.
Options outs tanding at December 31, 2012 22,124,070- of which, exercisable options 19,746,685
Options granted in 2013 (1) 0Options exercised in 2013 (2) 0Options cancelled or that expired in 2013 (6,820,977)- of which, expired options (3) (6,714,436)-of which, cancelled options - Presence Plans (88,076)-of which, cancelled options - Performance Plans (18,465)
Options outs tanding at December 31, 2013 15,303,093- of which, exercisable options 14,857,011
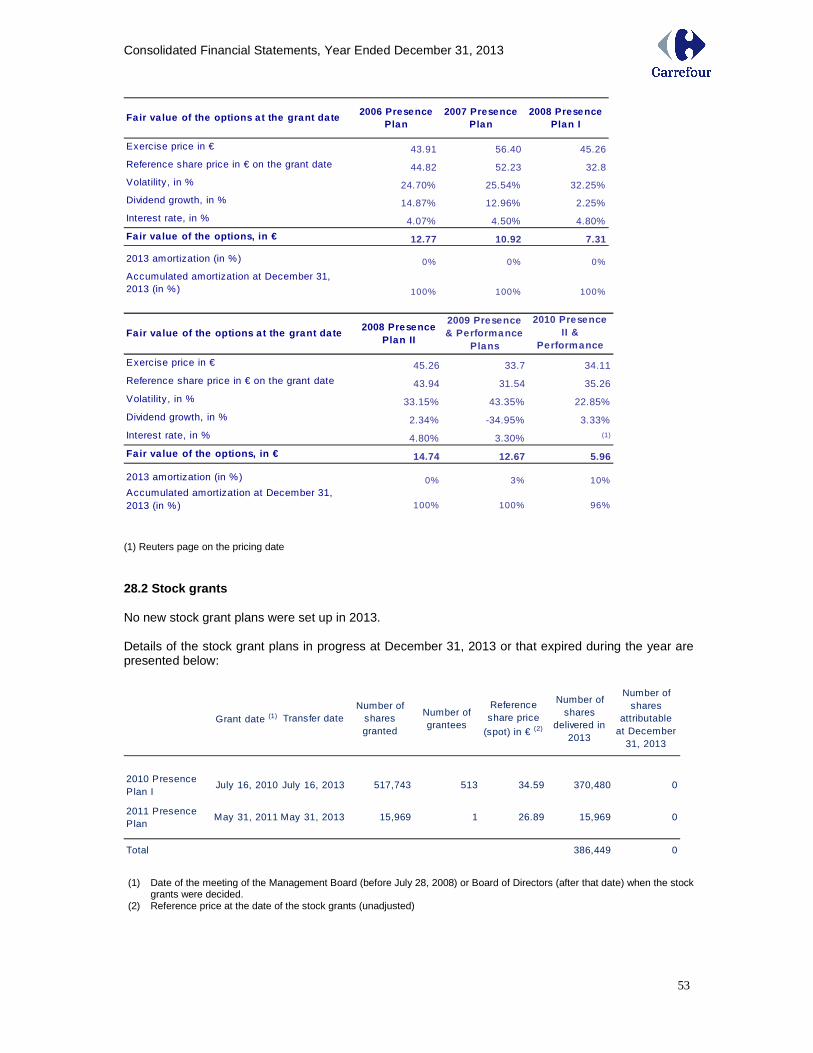
Consolidated Financial Statements, Year Ended December 31, 2013
53
Fair va lue of the options a t the grant da te2006 Presence
Plan2007 Presence
Plan2008 Presence
Plan I
Exercise price in € 43.91 56.40 45.26
Reference share price in € on the grant date 44.82 52.23 32.8
Volatility, in % 24.70% 25.54% 32.25%
Dividend growth, in % 14.87% 12.96% 2.25%
Interest rate, in % 4.07% 4.50% 4.80%
Fair va lue of the options, in € 12.77 10.92 7.31
2013 amortization (in %) 0% 0% 0%
Accumulated amortization at December 31, 2013 (in %) 100% 100% 100%
Fair va lue of the options at the grant date2008 Presence
Plan II
2009 Presence & Performance
Plans
2010 Presence II &
Performance PlansExercise price in € 45.26 33.7 34.11
Reference share price in € on the grant date 43.94 31.54 35.26
Volatility, in % 33.15% 43.35% 22.85%
Dividend growth, in % 2.34% -34.95% 3.33%
Interest rate, in % 4.80% 3.30% (1)
Fair va lue of the options, in € 14.74 12.67 5.96
2013 amortization (in %) 0% 3% 10%Accumulated amortization at December 31, 2013 (in %) 100% 100% 96% (1) Reuters page on the pricing date 28.2 Stock grants No new stock grant plans were set up in 2013. Details of the stock grant plans in progress at December 31, 2013 or that expired during the year are presented below:
Grant date (1) Transfer dateNumber of
shares granted
Number of grantees
Reference share price
(spot) in € (2)
Number of shares
delivered in 2013
Number of shares
attributable at December
31, 2013
2010 Presence Plan I
July 16, 2010 July 16, 2013 517,743 513 34.59 370,480 0
2011 Presence Plan
May 31, 2011 May 31, 2013 15,969 1 26.89 15,969 0
Total 386,449 0
(1) Date of the meeting of the Management Board (before July 28, 2008) or Board of Directors (after that date) when the stock
grants were decided. (2) Reference price at the date of the stock grants (unadjusted)
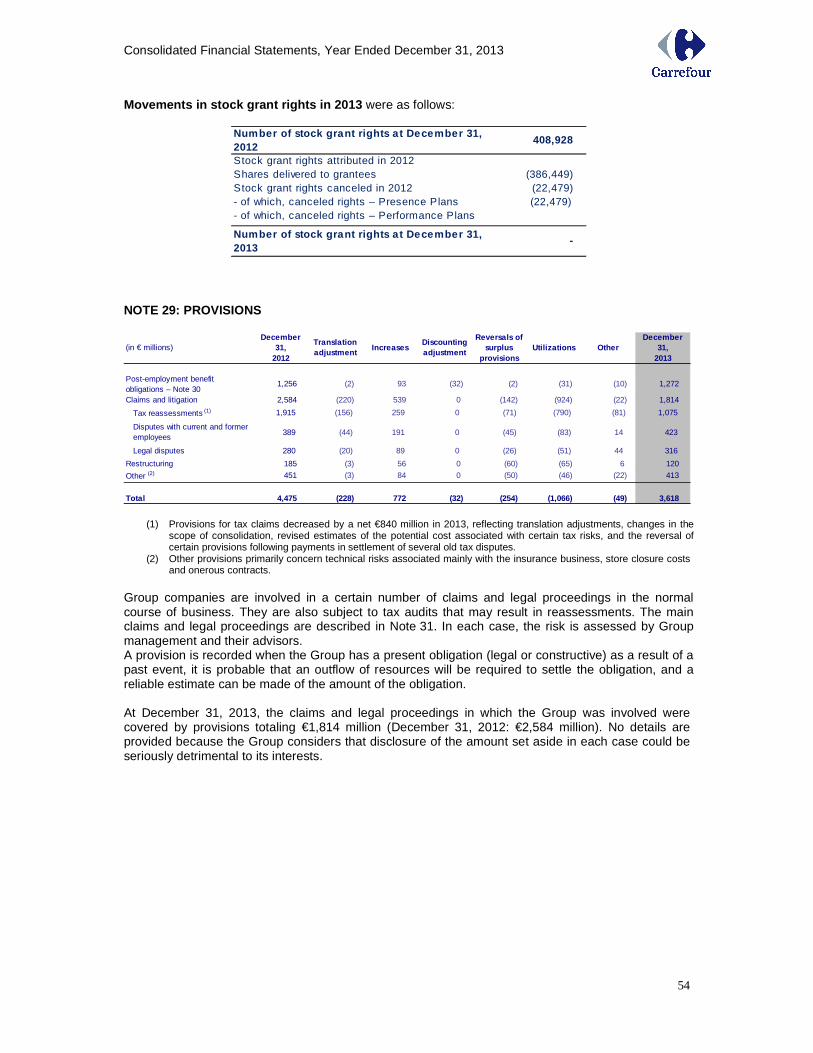
Consolidated Financial Statements, Year Ended December 31, 2013
54
Movements in stock grant rights in 2013 were as follows:
Number of stock grant rights a t December 31, 2012
408,928
Stock grant rights attributed in 2012Shares delivered to grantees (386,449)Stock grant rights canceled in 2012 (22,479)- of which, canceled rights – Presence Plans (22,479)- of which, canceled rights – Performance Plans
Number of stock grant rights a t December 31, 2013
-
NOTE 29: PROVISIONS
(in € millions)December
31, 2012
Translation adjustment
IncreasesDiscounting adjustment
Reversals of surplus
provisionsUtilizations Other
December 31,
2013
Post-employment benefit obligations – Note 30
1,256 (2) 93 (32) (2) (31) (10) 1,272
Claims and litigation 2,584 (220) 539 0 (142) (924) (22) 1,814
Tax reassessments (1) 1,915 (156) 259 0 (71) (790) (81) 1,075
Disputes with current and former employees
389 (44) 191 0 (45) (83) 14 423
Legal disputes 280 (20) 89 0 (26) (51) 44 316
Restructuring 185 (3) 56 0 (60) (65) 6 120
Other (2) 451 (3) 84 0 (50) (46) (22) 413
Total 4,475 (228) 772 (32) (254) (1,066) (49) 3,618
(1) Provisions for tax claims decreased by a net €840 million in 2013, reflecting translation adjustments, changes in the scope of consolidation, revised estimates of the potential cost associated with certain tax risks, and the reversal of certain provisions following payments in settlement of several old tax disputes.
(2) Other provisions primarily concern technical risks associated mainly with the insurance business, store closure costs and onerous contracts.
Group companies are involved in a certain number of claims and legal proceedings in the normal course of business. They are also subject to tax audits that may result in reassessments. The main claims and legal proceedings are described in Note 31. In each case, the risk is assessed by Group management and their advisors. A provision is recorded when the Group has a present obligation (legal or constructive) as a result of a past event, it is probable that an outflow of resources will be required to settle the obligation, and a reliable estimate can be made of the amount of the obligation. At December 31, 2013, the claims and legal proceedings in which the Group was involved were covered by provisions totaling €1,814 million (December 31, 2012: €2,584 million). No details are provided because the Group considers that disclosure of the amount set aside in each case could be seriously detrimental to its interests.
Consolidated Financial Statements, Year Ended December 31, 2013
55
NOTE 30: POST-EMPLOYMENT BENEFIT OBLIGATIONS The cost of defined benefit plans is determined at each period-end by the projected unit credit method. The calculation is performed using an actuarial method that takes into account in particular future salary levels and retirement ages. 30.1 Description of the main defined benefit plans The main defined benefit plans concern supplementary pension benefits paid annually in some countries to retired employees of the Group, and length-of-service awards provided for in collective bargaining agreements that are paid to employees upon retirement. The plans, which are presented below, mainly concern France, Belgium and Italy. French plans Group employees in France are entitled to a length-of-service award when they retire, determined in accordance with the law and the applicable collective bargaining agreement. The award is measured as a multiple of the individual’s monthly salary for the last twelve months before retirement, determined by reference to his or her years of service. The impact at January 1, 2012 of applying IAS 19R included incorporating new retirement age assumptions taking into account the consequences of France’s 2008 Act on the modernization of the job market.
In 2009, the Group set up a supplementary pension plan. The main terms of this defined benefit plan are as follows:
• Plan participants must have completed at least three years’ service at the time of retirement, their annual compensation must be greater than 16 times the annual ceiling for Social Security contributions and they must still be employed by the Group at the time of retirement.
• Plan participants hired at age 45 or over are credited with up to 10 years’ service as follows: age 45 = 0 year; age 46 = 1 year; age 47 = 2 years, etc.
• Years of service taken into account for the calculation of plan benefits are capped at 20 years. • Benefits are calculated as 1.5% of the “reference compensation” per year of service. The
reference compensation corresponds to the average of the last three years’ salary and bonus or 60 times the annual ceiling for Social Security contributions whichever is lower.
• Maximum replacement rate: the benefits are capped so that total pension benefits received by the individual from all sources do not exceed 50% of the reference compensation.
• The annual benefit is capped at 25% of the participant’s compensation for the last full year of service.
• Upon the participant's death, a reversionary pension is payable to the surviving spouse in an amount equal to 50% of the original benefit.
Belgian plans The Group’s main commitments in Belgium concern “prepensions” and the “solidarity fund”. Until the end of 2014, the prepension scheme provides for the payment of unemployment benefits during the period from the retirement age proposed in the collective bargaining agreement (58, or 52 for employees concerned by the downsizing plan set up in 2010) and the legal retirement age (65). Carrefour is committed to topping up the benefits paid by the Belgian State, so that the individuals concerned receive 95% of their final net salary. New legislation that came into effect in Belgium on January 1, 2012 has pushed back the retirement age and increased the number of years that will have to be worked to qualify for the scheme as from January 1, 2015. Under the collective bargaining agreement applicable to Carrefour, employees will be eligible for prepension benefits from the age of 60 provided they have worked for 40 years, versus age 58 and 38 years’ work previously.
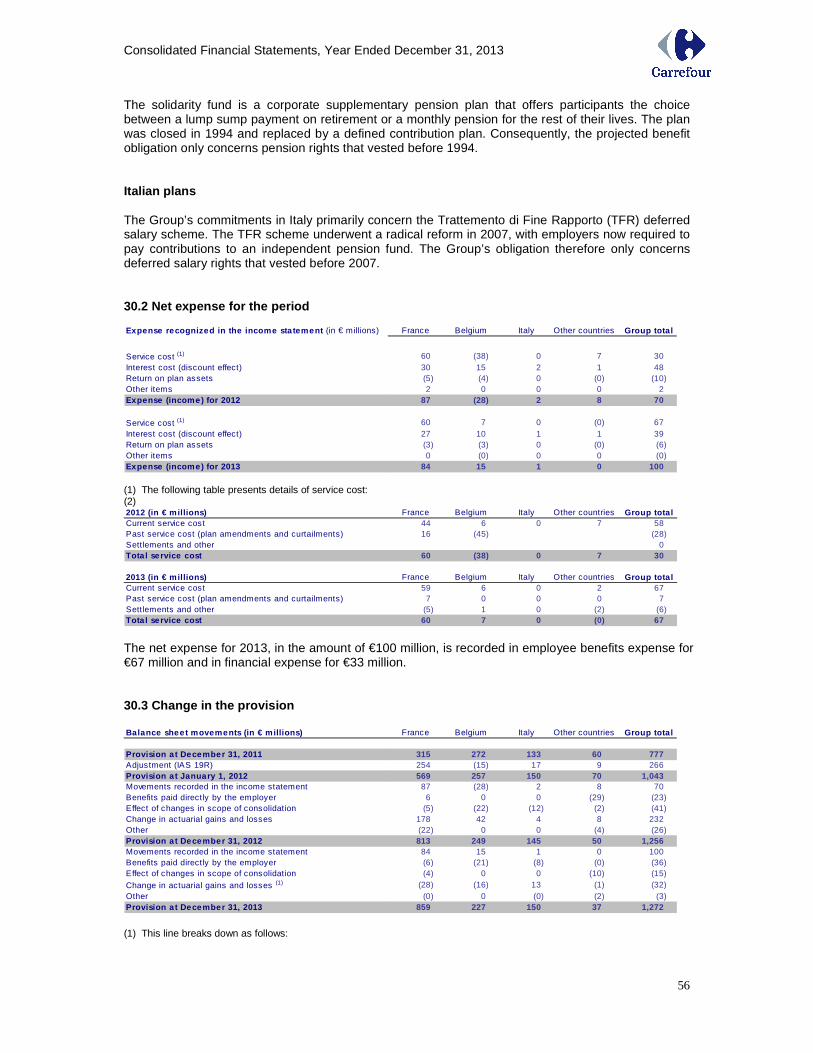
Consolidated Financial Statements, Year Ended December 31, 2013
56
The solidarity fund is a corporate supplementary pension plan that offers participants the choice between a lump sump payment on retirement or a monthly pension for the rest of their lives. The plan was closed in 1994 and replaced by a defined contribution plan. Consequently, the projected benefit obligation only concerns pension rights that vested before 1994. Italian plans The Group’s commitments in Italy primarily concern the Trattemento di Fine Rapporto (TFR) deferred salary scheme. The TFR scheme underwent a radical reform in 2007, with employers now required to pay contributions to an independent pension fund. The Group’s obligation therefore only concerns deferred salary rights that vested before 2007. 30.2 Net expense for the period Expense recognized in the income sta tement (in € millions) France Belgium Italy Other countries Group total
Service cost (1) 60 (38) 0 7 30 Interest cost (discount effect) 30 15 2 1 48 Return on plan assets (5) (4) 0 (0) (10)Other items 2 0 0 0 2 Expense (income) for 2012 87 (28) 2 8 70
Service cost (1) 60 7 0 (0) 67 Interest cost (discount effect) 27 10 1 1 39 Return on plan assets (3) (3) 0 (0) (6)Other items 0 (0) 0 0 (0)Expense (income) for 2013 84 15 1 0 100 (1) The following table presents details of service cost: (2) 2012 (in € millions) France Belgium Italy Other countries Group tota lCurrent service cost 44 6 0 7 58 Past service cost (plan amendments and curtailments) 16 (45) (28)Settlements and other 0 Tota l se rvice cost 60 (38) 0 7 30
2013 (in € millions) France Belgium Italy Other countries Group tota lCurrent service cost 59 6 0 2 67 Past service cost (plan amendments and curtailments) 7 0 0 0 7 Settlements and other (5) 1 0 (2) (6)Tota l se rvice cost 60 7 0 (0) 67 The net expense for 2013, in the amount of €100 million, is recorded in employee benefits expense for €67 million and in financial expense for €33 million. 30.3 Change in the provision Balance sheet movements (in € millions) France Belgium Italy Other countries Group total
Provision a t December 31, 2011 315 272 133 60 777 Adjustment (IAS 19R) 254 (15) 17 9 266 Provision a t January 1, 2012 569 257 150 70 1,043 Movements recorded in the income statement 87 (28) 2 8 70 Benefits paid directly by the employer 6 0 0 (29) (23)Effect of changes in scope of consolidation (5) (22) (12) (2) (41)Change in actuarial gains and losses 178 42 4 8 232 Other (22) 0 0 (4) (26)Provision a t December 31, 2012 813 249 145 50 1,256 Movements recorded in the income statement 84 15 1 0 100 Benefits paid directly by the employer (6) (21) (8) (0) (36)Effect of changes in scope of consolidation (4) 0 0 (10) (15)Change in actuarial gains and losses (1) (28) (16) 13 (1) (32)Other (0) 0 (0) (2) (3)Provision a t December 31, 2013 859 227 150 37 1,272 (1) This line breaks down as follows:
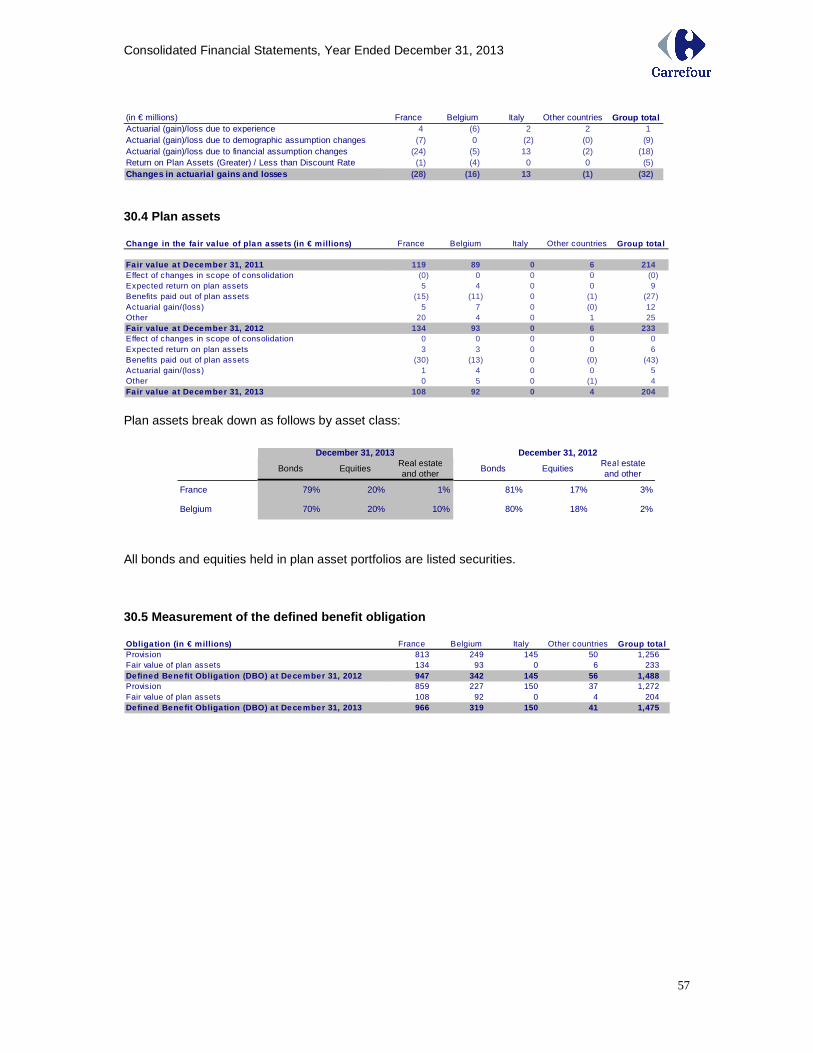
Consolidated Financial Statements, Year Ended December 31, 2013
57
(in € millions) France Belgium Italy Other countries Group totalActuarial (gain)/loss due to experience 4 (6) 2 2 1 Actuarial (gain)/loss due to demographic assumption changes (7) 0 (2) (0) (9)Actuarial (gain)/loss due to financial assumption changes (24) (5) 13 (2) (18)Return on Plan Assets (Greater) / Less than Discount Rate (1) (4) 0 0 (5)Changes in actuarial gains and losses (28) (16) 13 (1) (32) 30.4 Plan assets Change in the fa ir va lue of plan assets (in € milli ons) France Belgium Italy Other countries Group tota l
Fa ir va lue a t December 31, 2011 119 89 0 6 214 Effect of changes in scope of consolidation (0) 0 0 0 (0)Expected return on plan assets 5 4 0 0 9 Benefits paid out of plan assets (15) (11) 0 (1) (27)Actuarial gain/(loss) 5 7 0 (0) 12 Other 20 4 0 1 25 Fair va lue a t December 31, 2012 134 93 0 6 233 Effect of changes in scope of consolidation 0 0 0 0 0 Expected return on plan assets 3 3 0 0 6 Benefits paid out of plan assets (30) (13) 0 (0) (43)Actuarial gain/(loss) 1 4 0 0 5 Other 0 5 0 (1) 4 Fair va lue a t December 31, 2013 108 92 0 4 204 Plan assets break down as follows by asset class:
All bonds and equities held in plan asset portfolios are listed securities. 30.5 Measurement of the defined benefit obligation Obligation (in € millions) France Belgium Italy Other countries Group tota lProvision 813 249 145 50 1,256Fair value of plan assets 134 93 0 6 233Defined Bene fit Obligation (DBO) a t December 31, 20 12 947 342 145 56 1,488Provision 859 227 150 37 1,272Fair value of plan assets 108 92 0 4 204Defined Bene fit Obligation (DBO) a t December 31, 20 13 966 319 150 41 1,475
Bonds EquitiesReal estate and other
Bonds EquitiesReal estate and other
France 79% 20% 1% 81% 17% 3%
Belgium 70% 20% 10% 80% 18% 2%
December 31, 2013 December 31, 2012
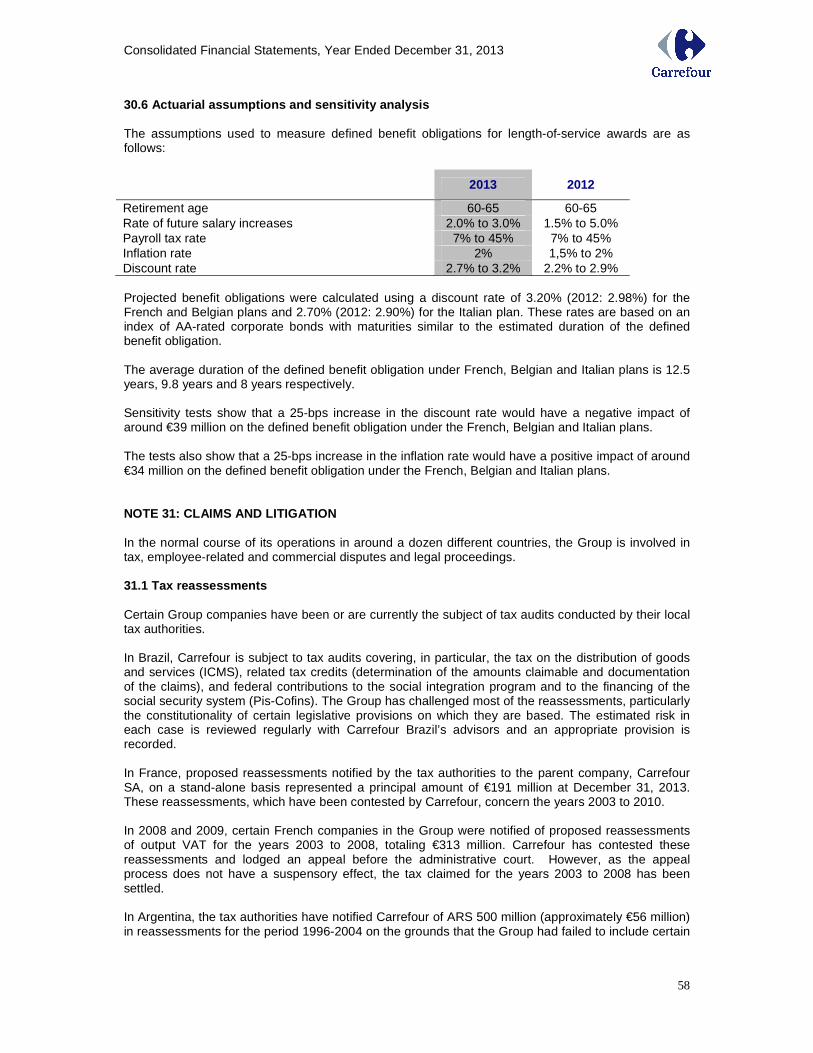
Consolidated Financial Statements, Year Ended December 31, 2013
58
30.6 Actuarial assumptions and sensitivity analysis The assumptions used to measure defined benefit obligations for length-of-service awards are as follows:
Projected benefit obligations were calculated using a discount rate of 3.20% (2012: 2.98%) for the French and Belgian plans and 2.70% (2012: 2.90%) for the Italian plan. These rates are based on an index of AA-rated corporate bonds with maturities similar to the estimated duration of the defined benefit obligation. The average duration of the defined benefit obligation under French, Belgian and Italian plans is 12.5 years, 9.8 years and 8 years respectively. Sensitivity tests show that a 25-bps increase in the discount rate would have a negative impact of around €39 million on the defined benefit obligation under the French, Belgian and Italian plans. The tests also show that a 25-bps increase in the inflation rate would have a positive impact of around €34 million on the defined benefit obligation under the French, Belgian and Italian plans. NOTE 31: CLAIMS AND LITIGATION In the normal course of its operations in around a dozen different countries, the Group is involved in tax, employee-related and commercial disputes and legal proceedings. 31.1 Tax reassessments Certain Group companies have been or are currently the subject of tax audits conducted by their local tax authorities. In Brazil, Carrefour is subject to tax audits covering, in particular, the tax on the distribution of goods and services (ICMS), related tax credits (determination of the amounts claimable and documentation of the claims), and federal contributions to the social integration program and to the financing of the social security system (Pis-Cofins). The Group has challenged most of the reassessments, particularly the constitutionality of certain legislative provisions on which they are based. The estimated risk in each case is reviewed regularly with Carrefour Brazil’s advisors and an appropriate provision is recorded. In France, proposed reassessments notified by the tax authorities to the parent company, Carrefour SA, on a stand-alone basis represented a principal amount of €191 million at December 31, 2013. These reassessments, which have been contested by Carrefour, concern the years 2003 to 2010. In 2008 and 2009, certain French companies in the Group were notified of proposed reassessments of output VAT for the years 2003 to 2008, totaling €313 million. Carrefour has contested these reassessments and lodged an appeal before the administrative court. However, as the appeal process does not have a suspensory effect, the tax claimed for the years 2003 to 2008 has been settled. In Argentina, the tax authorities have notified Carrefour of ARS 500 million (approximately €56 million) in reassessments for the period 1996-2004 on the grounds that the Group had failed to include certain
2013 2012
Retirement age 60-65 60-65 Rate of future salary increases 2.0% to 3.0% 1.5% to 5.0% Payroll tax rate 7% to 45% 7% to 45% Inflation rate 2% 1,5% to 2% Discount rate 2.7% to 3.2% 2.2% to 2.9%
Consolidated Financial Statements, Year Ended December 31, 2013
59
categories of supplier rebates in the calculation of sales tax. The Group has contested the tax authorities’ interpretation. In France, up until 2003, Carrefour paid a rendering levy (“taxe d’équarrissage”) on its meat purchases. In 2003, the Court of Justice of the European Union ruled that this levy, which was paid over by the French State to abattoirs, constituted State aid awarded in breach of EU rules. As a result of this ruling, the rendering levy paid for the years 1997 to 2003 was refunded to the Group. In 2004, however, the French tax authorities reversed their decision and instructed the Group to repay the refunded amounts for the years 2001 to 2003, totaling €145 million. Although this amount was paid by Carrefour in 2012, the Group has contested the validity of the claim and the case is currently pending before the tax courts. 31.2 Disputes with current and former employees As a major employer, the Group is regularly involved in disputes with current or former employees. From time to time, disputes may also arise with a large group of current or former employees. In Brazil, many former employees have initiated legal proceedings against the Group, claiming overtime pay that they allege is due to them. 31.3 Legal and commercial disputes The Group is subject to regular audits by the authorities responsible for overseeing compliance with the laws applicable to the retail industry and by the competition authorities. Disputes may also arise with suppliers as a result of differing interpretations of legal or contractual provisions. On October 1, 2012, a report on the price increases applied by major retailers for “household and personal care” products was handed to the Belgian competition authorities. The report alleges that between 2002 and 2007, the leading retailers coordinated price increases for these products with the help of the products' suppliers. The matter is currently under review by the Belgian competition authorities, who will decide whether competition law has been breached and, if so, the amount of the fine.
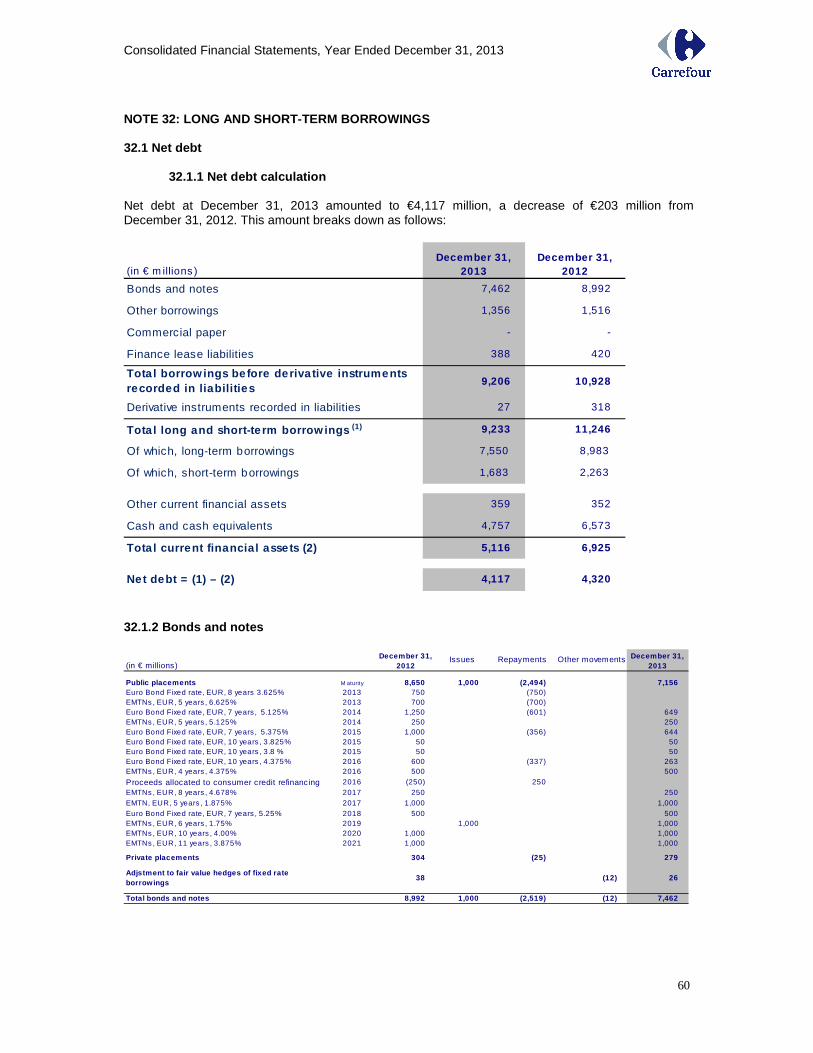
Consolidated Financial Statements, Year Ended December 31, 2013
60
NOTE 32: LONG AND SHORT-TERM BORROWINGS 32.1 Net debt
32.1.1 Net debt calculation Net debt at December 31, 2013 amounted to €4,117 million, a decrease of €203 million from December 31, 2012. This amount breaks down as follows:
(in € m illions )December 31,
2013December 31,
2012
Bonds and notes 7,462 8,992
Other borrowings 1,356 1,516
Commercial paper - -
Finance lease liabilities 388 420
Tota l borrow ings be fore deriva tive instruments recorded in liabilities
9,206 10,928
Derivative instruments recorded in liabilities 27 318
Tota l long and short-te rm borrow ings (1) 9,233 11,246
Of which, long-term borrowings 7,550 8,983
Of which, short-term borrowings 1,683 2,263
Other current financial assets 359 352
Cash and cash equivalents 4,757 6,573
Tota l current financia l asse ts (2) 5,116 6,925
Net debt = (1) – (2) 4,117 4,320
32.1.2 Bonds and notes
(in € millions)December 31,
2012Issues Repayments Other movements December 31,
2013
Public placements M aturity 8,650 1,000 (2,494) 7,156Euro Bond Fixed rate, EUR, 8 years 3.625% 2013 750 (750)EMTNs , EUR, 5 years , 6.625% 2013 700 (700)Euro Bond Fixed rate, EUR, 7 years , 5.125% 2014 1,250 (601) 649EMTNs , EUR, 5 years , 5.125% 2014 250 250Euro Bond Fixed rate, EUR, 7 years , 5.375% 2015 1,000 (356) 644Euro Bond Fixed rate, EUR, 10 years , 3.825% 2015 50 50Euro Bond Fixed rate, EUR, 10 years , 3.8 % 2015 50 50Euro Bond Fixed rate, EUR, 10 years , 4.375% 2016 600 (337) 263EMTNs , EUR, 4 years , 4.375% 2016 500 500
Proceeds allocated to consumer credit refinancing 2016 (250) 250EMTNs , EUR, 8 years , 4.678% 2017 250 250EMTN, EUR, 5 years , 1.875% 2017 1,000 1,000Euro Bond Fixed rate, EUR, 7 years , 5.25% 2018 500 500EMTNs , EUR, 6 years , 1.75% 2019 1,000 1,000EMTNs , EUR, 10 years , 4.00% 2020 1,000 1,000EMTNs , EUR, 11 years , 3.875% 2021 1,000 1,000
Private placements 304 (25) 279
Adjstment to fair value hedges of fixed rate borrow ings
38 (12) 26
Total bonds and notes 8,992 1,000 (2,519) (12) 7,462
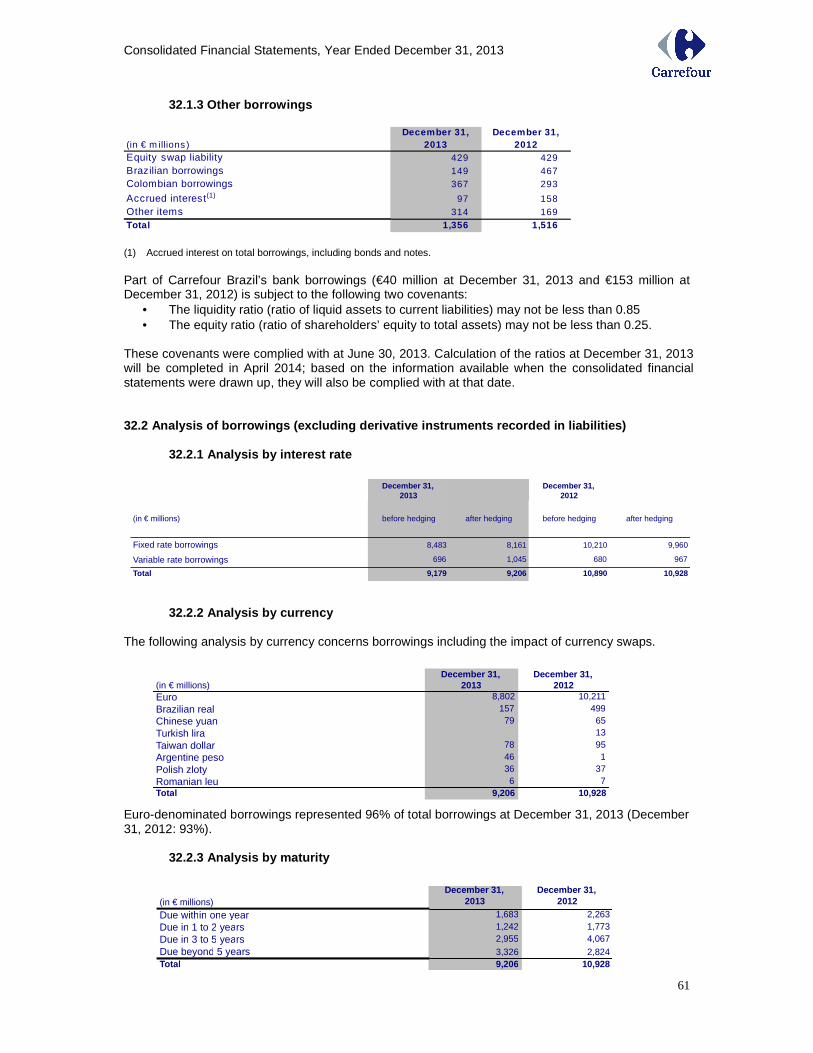
Consolidated Financial Statements, Year Ended December 31, 2013
61
32.1.3 Other borrowings
(in € m illions )December 31,
2013December 31,
2012Equity swap liability 429 429Brazilian borrowings 149 467Colombian borrowings 367 293
Accrued interest(1) 97 158Other items 314 169Total 1,356 1,516 (1) Accrued interest on total borrowings, including bonds and notes. Part of Carrefour Brazil’s bank borrowings (€40 million at December 31, 2013 and €153 million at December 31, 2012) is subject to the following two covenants:
• The liquidity ratio (ratio of liquid assets to current liabilities) may not be less than 0.85 • The equity ratio (ratio of shareholders’ equity to total assets) may not be less than 0.25.
These covenants were complied with at June 30, 2013. Calculation of the ratios at December 31, 2013 will be completed in April 2014; based on the information available when the consolidated financial statements were drawn up, they will also be complied with at that date. 32.2 Analysis of borrowings (excluding derivative i nstruments recorded in liabilities)
32.2.1 Analysis by interest rate
32.2.2 Analysis by currency
The following analysis by currency concerns borrowings including the impact of currency swaps. Euro-denominated borrowings represented 96% of total borrowings at December 31, 2013 (December 31, 2012: 93%).
32.2.3 Analysis by maturity
December 31, 2013
December 31, 2012
(in € millions) before hedging after hedging before hedging after hedging
Fixed rate borrowings 8,483 8,161 10,210 9,960
Variable rate borrowings 696 1,045 680 967
Total 9,179 9,206 10,890 10,928
(in € millions)December 31,
2013December 31,
2012Euro 8,802 10,211
Brazilian real 157 499Chinese yuan 79 65Turkish lira 13
Taiwan dollar 78 95Argentine peso 46 1Polish zloty 36 37
Romanian leu 6 7Total 9,206 10,928
(in € millions)December 31,
2013December 31,
2012
Due within one year 1,683 2,263Due in 1 to 2 years 1,242 1,773Due in 3 to 5 years 2,955 4,067Due beyond 5 years 3,326 2,824Total 9,206 10,928
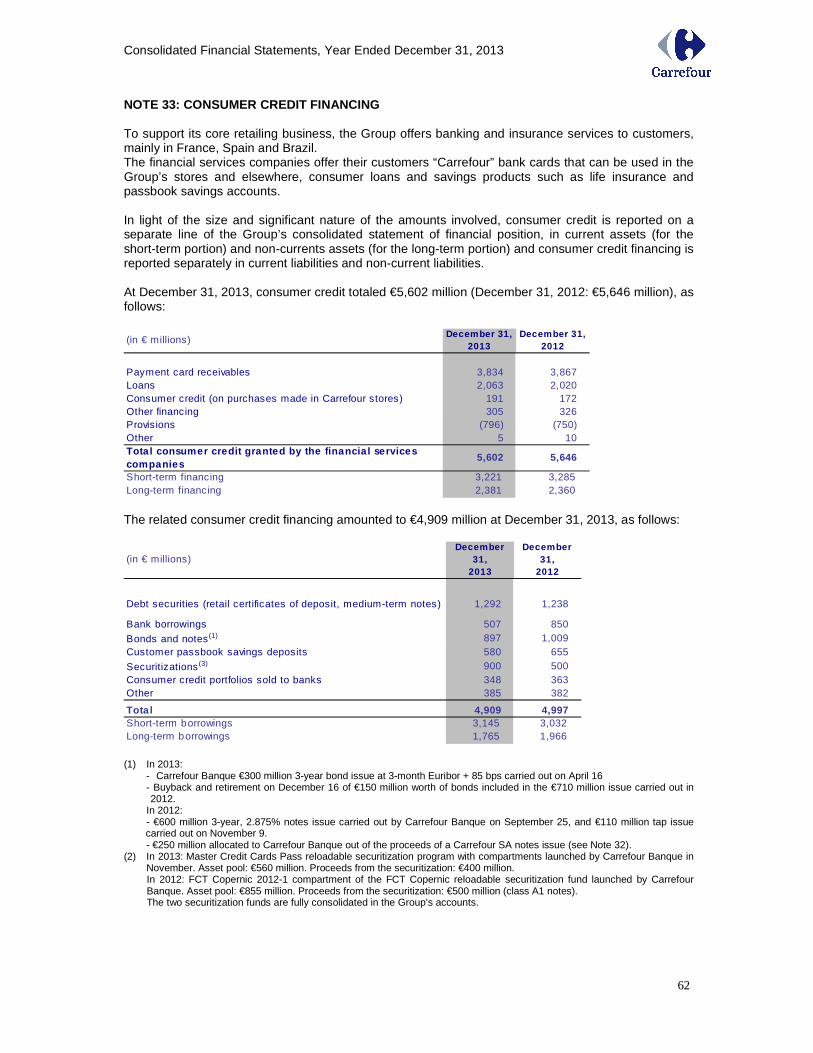
Consolidated Financial Statements, Year Ended December 31, 2013
62
NOTE 33: CONSUMER CREDIT FINANCING To support its core retailing business, the Group offers banking and insurance services to customers, mainly in France, Spain and Brazil. The financial services companies offer their customers “Carrefour” bank cards that can be used in the Group’s stores and elsewhere, consumer loans and savings products such as life insurance and passbook savings accounts. In light of the size and significant nature of the amounts involved, consumer credit is reported on a separate line of the Group’s consolidated statement of financial position, in current assets (for the short-term portion) and non-currents assets (for the long-term portion) and consumer credit financing is reported separately in current liabilities and non-current liabilities. At December 31, 2013, consumer credit totaled €5,602 million (December 31, 2012: €5,646 million), as follows:
(in € millions)December 31,
2013December 31,
2012
Payment card receivables 3,834 3,867Loans 2,063 2,020Consumer credit (on purchases made in Carrefour stores) 191 172Other financing 305 326Provisions (796) (750)Other 5 10Tota l consumer credit granted by the financia l serv ices companies
5,602 5,646
Short-term financing 3,221 3,285Long-term financing 2,381 2,360 The related consumer credit financing amounted to €4,909 million at December 31, 2013, as follows:
(in € millions)December
31, 2013
December 31,
2012
Debt securities (retail certificates of deposit, medium-term notes) 1,292 1,238
Bank borrowings 507 850
Bonds and notes (1) 897 1,009Customer passbook savings deposits 580 655
Securitizations (3) 900 500Consumer credit portfolios sold to banks 348 363Other 385 382
Tota l 4,909 4,997Short-term borrowings 3,145 3,032Long-term borrowings 1,765 1,966 (1) In 2013:
- Carrefour Banque €300 million 3-year bond issue at 3-month Euribor + 85 bps carried out on April 16 - Buyback and retirement on December 16 of €150 million worth of bonds included in the €710 million issue carried out in 2012.
In 2012: - €600 million 3-year, 2.875% notes issue carried out by Carrefour Banque on September 25, and €110 million tap issue carried out on November 9. - €250 million allocated to Carrefour Banque out of the proceeds of a Carrefour SA notes issue (see Note 32).
(2) In 2013: Master Credit Cards Pass reloadable securitization program with compartments launched by Carrefour Banque in November. Asset pool: €560 million. Proceeds from the securitization: €400 million. In 2012: FCT Copernic 2012-1 compartment of the FCT Copernic reloadable securitization fund launched by Carrefour Banque. Asset pool: €855 million. Proceeds from the securitization: €500 million (class A1 notes). The two securitization funds are fully consolidated in the Group’s accounts.
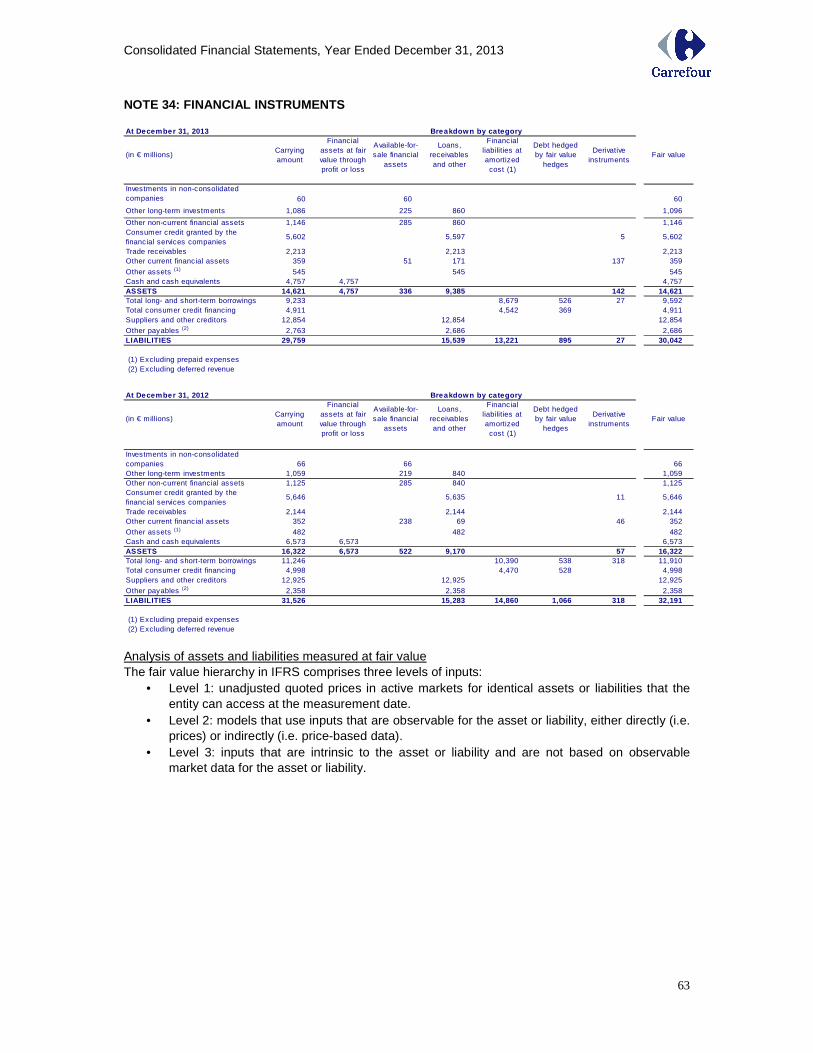
Consolidated Financial Statements, Year Ended December 31, 2013
63
NOTE 34: FINANCIAL INSTRUMENTS At December 31, 2013 Breakdown by category
(in € millions)Carrying amount
Financial assets at fair value through profit or loss
Available-for-sale financial
assets
Loans, receivables and other
Financial liabilities at amortized
cost (1)
Debt hedged by fair value
hedges
Derivative instruments
Fair value
Investments in non-consolidated companies 60 60 60
Other long-term investments 1,086 225 860 1,096
Other non-current financial assets 1,146 285 860 1,146 Consumer credit granted by the financial services companies
5,602 5,597 5 5,602
Trade receivables 2,213 2,213 2,213 Other current financial assets 359 51 171 137 359
Other assets (1) 545 545 545 Cash and cash equivalents 4,757 4,757 4,757 ASSETS 14,621 4,757 336 9,385 142 14,621 Total long- and short-term borrowings 9,233 8,679 526 27 9,592 Total consumer credit financing 4,911 4,542 369 4,911 Suppliers and other creditors 12,854 12,854 12,854
Other payables (2) 2,763 2,686 2,686 LIABILITIES 29,759 15,539 13,221 895 27 30,042
(1) Excluding prepaid expenses (2) Excluding deferred revenue At December 31, 2012 Breakdown by category
(in € millions)Carrying amount
Financial assets at fair value through profit or loss
Available-for-sale financial
assets
Loans, receivables and other
Financial liabilities at amortized
cost (1)
Debt hedged by fair value
hedges
Derivative instruments
Fair value
Investments in non-consolidated companies 66 66 66 Other long-term investments 1,059 219 840 1,059 Other non-current financial assets 1,125 285 840 1,125 Consumer credit granted by the financial services companies
5,646 5,635 11 5,646
Trade receivables 2,144 2,144 2,144 Other current financial assets 352 238 69 46 352
Other assets (1) 482 482 482 Cash and cash equivalents 6,573 6,573 6,573 ASSETS 16,322 6,573 522 9,170 57 16,322 Total long- and short-term borrowings 11,246 10,390 538 318 11,910 Total consumer credit financing 4,998 4,470 528 4,998 Suppliers and other creditors 12,925 12,925 12,925
Other payables (2) 2,358 2,358 2,358 LIABILITIES 31,526 15,283 14,860 1,066 318 32,191
(1) Excluding prepaid expenses (2) Excluding deferred revenue
Analysis of assets and liabilities measured at fair value The fair value hierarchy in IFRS comprises three levels of inputs:
• Level 1: unadjusted quoted prices in active markets for identical assets or liabilities that the entity can access at the measurement date.
• Level 2: models that use inputs that are observable for the asset or liability, either directly (i.e. prices) or indirectly (i.e. price-based data).
• Level 3: inputs that are intrinsic to the asset or liability and are not based on observable market data for the asset or liability.
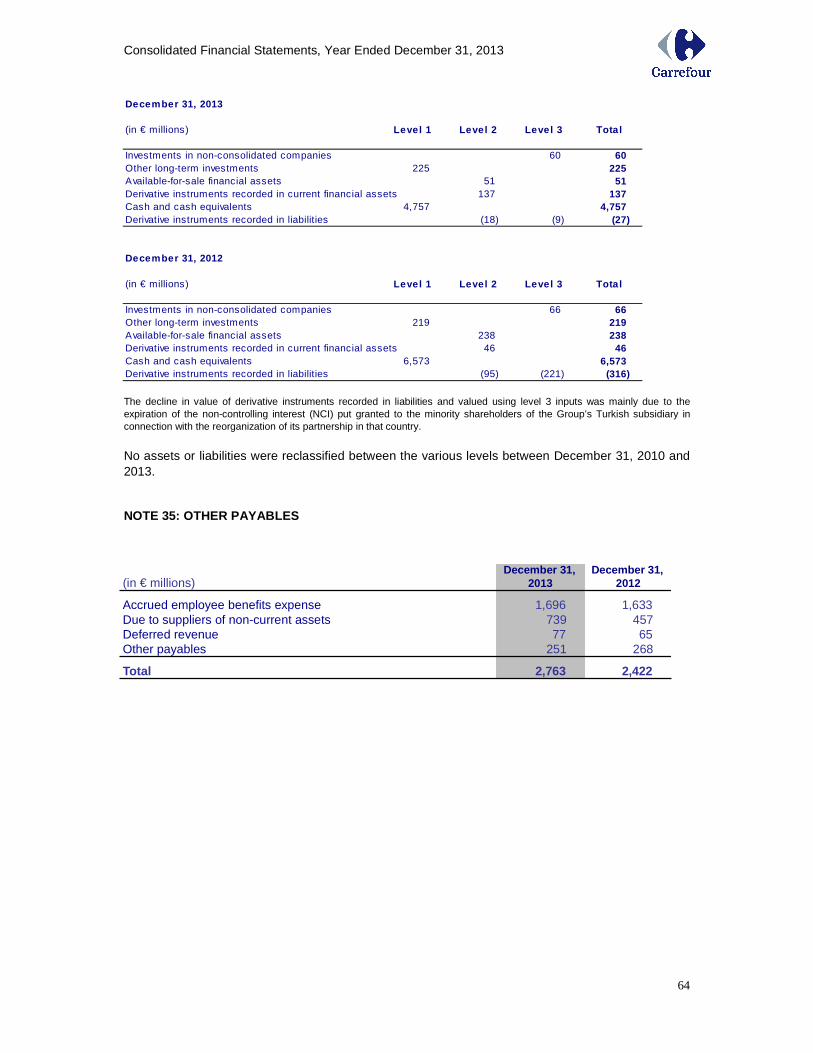
Consolidated Financial Statements, Year Ended December 31, 2013
64
December 31, 2013
(in € millions) Level 1 Level 2 Level 3 Tota l
Investments in non-consolidated companies 60 60 Other long-term investments 225 225 Available-for-sale financial assets 51 51 Derivative instruments recorded in current financial assets 137 137 Cash and cash equivalents 4,757 4,757 Derivative instruments recorded in liabilities (18) (9) (27)
December 31, 2012
(in € millions) Level 1 Level 2 Level 3 Tota l
Investments in non-consolidated companies 66 66 Other long-term investments 219 219 Available-for-sale financial assets 238 238 Derivative instruments recorded in current financial assets 46 46 Cash and cash equivalents 6,573 6,573 Derivative instruments recorded in liabilities (95) (221) (316) The decline in value of derivative instruments recorded in liabilities and valued using level 3 inputs was mainly due to the expiration of the non-controlling interest (NCI) put granted to the minority shareholders of the Group’s Turkish subsidiary in connection with the reorganization of its partnership in that country.
No assets or liabilities were reclassified between the various levels between December 31, 2010 and 2013. NOTE 35: OTHER PAYABLES
(in € millions)December 31,
2013December 31,
2012
Accrued employee benefits expense 1,696 1,633Due to suppliers of non-current assets 739 457Deferred revenue 77 65Other payables 251 268
Total 2,763 2,422
Consolidated Financial Statements, Year Ended December 31, 2013
65
NOTE 36: RISK MANAGEMENT The main risks associated with the financial instruments used by the Group are liquidity, interest rate, currency, credit and equity risks. The Group's policy for managing these risks is described below. Due to the differing natures of the various businesses, financial risks arising from the bancassurance business (including Carrefour Banque in particular) are managed separately from those related to the retail business. An organization has been set up around a cash-pooling system to track financial risks. The Corporate Treasury and Financing Department based in Brussels manages the treasury and financing needs of all retail subsidiaries, on the instructions of Group senior management. A reporting system ensures that Group senior management can oversee the department’s implementation of the approved management strategies. The risks associated with the consumer credit business are managed and tracked directly by the entities concerned. Corporate Treasury and Financing oversees the proper implementation of the rules governing the consumer credit business, jointly with the other investors in the business where applicable. A reporting system exists between local teams and Corporate Treasury and Financing.
1. Liquidity risk 1.1 Retail business
Liquidity risk is the risk that Carrefour will be unable to settle its financial liabilities when they fall due. The Group manages its liquidity risk by ensuring, to the extent possible, that it has sufficient liquid assets at all times to settle its liabilities when they fall due, whatever the conditions in the market. A Liquidity Committee meets at monthly intervals to check that the Group’s financing needs are covered by its available resources. The meetings are attended by the Group’s Chief Financial Officer and by a representative of Carrefour Banque. Corporate Treasury and Financing's liquidity management strategy consists of:
- Promoting conservative financing strategies in order to ensure that the Group’s credit rating allows it to raise funds on the bond and commercial paper markets.
- Maintaining a presence in the debt market through regular debt issuance programs, mainly in euros, in order to create a balanced maturity profile. The Group’s issuance capacity under its Euro Medium-Term Notes (EMTN) program totals €12 billion. Since 2007, the loan agreements for the EMTN program include a soft change of control clause that would be triggered in the event that a change of control led to Carrefour losing its investment grade rating. In this case, the notes would not become immediately repayable but the interest rate would increase.
- Using the €5 billion commercial paper program on NYSE Euronext Paris, described in a prospectus filed with the Banque de France.
- Maintaining undrawn medium-term bank facilities that can be drawn down at any time according to the Group’s needs. At December 31, 2013, the Group had three undrawn syndicated lines of credit obtained from a pool of leading banks for a total of €4,149 million. Group policy consists of keeping these facilities on stand-by to support the commercial paper program. The loan agreements for the syndicated lines of credit include the usual commitments and default clauses, including pari passu, negative pledge, change of control and cross-default clauses and a clause restricting substantial sales of assets. They do not include any rating trigger, although they do allow for the pricing grid to be adjusted up or down to reflect changes in the long-term credit rating. None of the agreements contains a material adverse change clause.
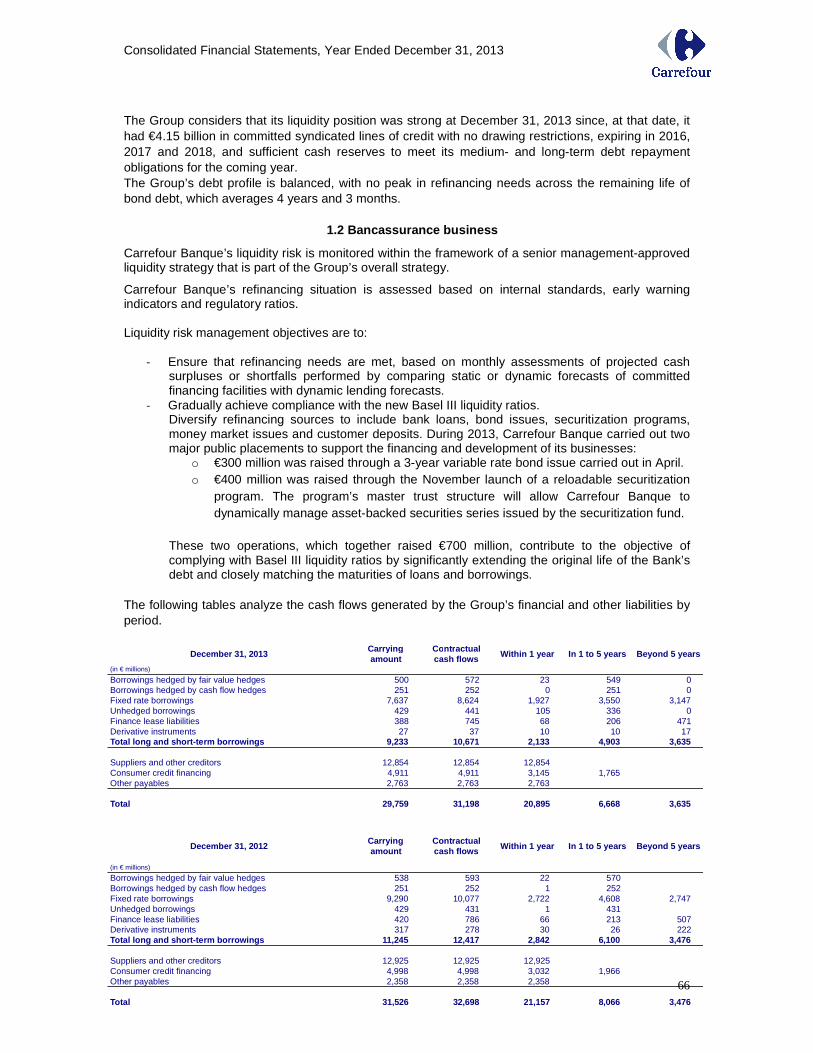
Consolidated Financial Statements, Year Ended December 31, 2013
66
The Group considers that its liquidity position was strong at December 31, 2013 since, at that date, it had €4.15 billion in committed syndicated lines of credit with no drawing restrictions, expiring in 2016, 2017 and 2018, and sufficient cash reserves to meet its medium- and long-term debt repayment obligations for the coming year. The Group’s debt profile is balanced, with no peak in refinancing needs across the remaining life of bond debt, which averages 4 years and 3 months.
1.2 Bancassurance business
Carrefour Banque’s liquidity risk is monitored within the framework of a senior management-approved liquidity strategy that is part of the Group’s overall strategy.
Carrefour Banque’s refinancing situation is assessed based on internal standards, early warning indicators and regulatory ratios. Liquidity risk management objectives are to:
- Ensure that refinancing needs are met, based on monthly assessments of projected cash surpluses or shortfalls performed by comparing static or dynamic forecasts of committed financing facilities with dynamic lending forecasts.
- Gradually achieve compliance with the new Basel III liquidity ratios. Diversify refinancing sources to include bank loans, bond issues, securitization programs, money market issues and customer deposits. During 2013, Carrefour Banque carried out two major public placements to support the financing and development of its businesses:
o €300 million was raised through a 3-year variable rate bond issue carried out in April. o €400 million was raised through the November launch of a reloadable securitization
program. The program’s master trust structure will allow Carrefour Banque to dynamically manage asset-backed securities series issued by the securitization fund.
These two operations, which together raised €700 million, contribute to the objective of complying with Basel III liquidity ratios by significantly extending the original life of the Bank’s debt and closely matching the maturities of loans and borrowings.
The following tables analyze the cash flows generated by the Group’s financial and other liabilities by period.
December 31, 2013Carrying amount
Contractual cash flows Within 1 year In 1 to 5 years Beyond 5 years
(in € millions)
Borrowings hedged by fair value hedges 500 572 23 549 0Borrowings hedged by cash flow hedges 251 252 0 251 0Fixed rate borrowings 7,637 8,624 1,927 3,550 3,147Unhedged borrowings 429 441 105 336 0Finance lease liabilities 388 745 68 206 471Derivative instruments 27 37 10 10 17Total long and short-term borrowings 9,233 10,671 2,133 4,903 3,635
Suppliers and other creditors 12,854 12,854 12,854Consumer credit financing 4,911 4,911 3,145 1,765Other payables 2,763 2,763 2,763
Total 29,759 31,198 20,895 6,668 3,635
December 31, 2012Carrying amount
Contractual cash flows Within 1 year In 1 to 5 years Beyond 5 years
(in € millions)
Borrowings hedged by fair value hedges 538 593 22 570Borrowings hedged by cash flow hedges 251 252 1 252Fixed rate borrowings 9,290 10,077 2,722 4,608 2,747Unhedged borrowings 429 431 1 431Finance lease liabilities 420 786 66 213 507Derivative instruments 317 278 30 26 222Total long and short-term borrowings 11,245 12,417 2,842 6,100 3,476
Suppliers and other creditors 12,925 12,925 12,925Consumer credit financing 4,998 4,998 3,032 1,966Other payables 2,358 2,358 2,358
Total 31,526 32,698 21,157 8,066 3,476
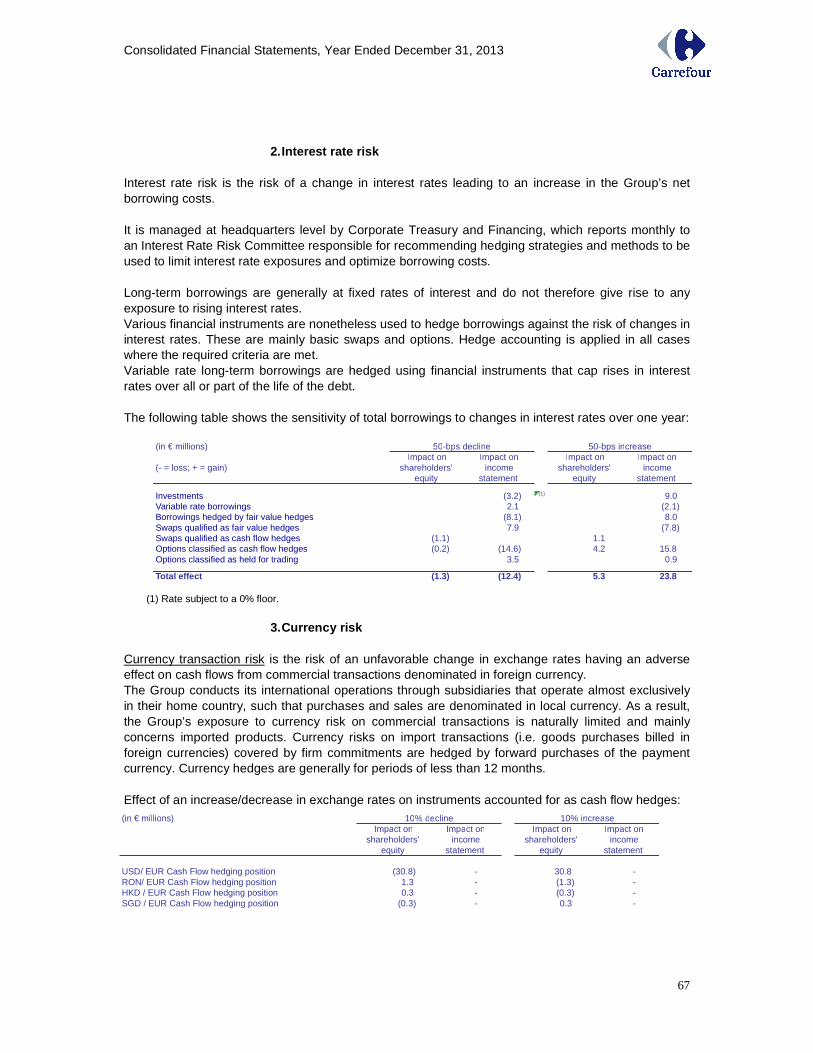
Consolidated Financial Statements, Year Ended December 31, 2013
67
2. Interest rate risk
Interest rate risk is the risk of a change in interest rates leading to an increase in the Group’s net borrowing costs. It is managed at headquarters level by Corporate Treasury and Financing, which reports monthly to an Interest Rate Risk Committee responsible for recommending hedging strategies and methods to be used to limit interest rate exposures and optimize borrowing costs. Long-term borrowings are generally at fixed rates of interest and do not therefore give rise to any exposure to rising interest rates. Various financial instruments are nonetheless used to hedge borrowings against the risk of changes in interest rates. These are mainly basic swaps and options. Hedge accounting is applied in all cases where the required criteria are met. Variable rate long-term borrowings are hedged using financial instruments that cap rises in interest rates over all or part of the life of the debt. The following table shows the sensitivity of total borrowings to changes in interest rates over one year:
(1) Rate subject to a 0% floor.
3. Currency risk Currency transaction risk is the risk of an unfavorable change in exchange rates having an adverse effect on cash flows from commercial transactions denominated in foreign currency. The Group conducts its international operations through subsidiaries that operate almost exclusively in their home country, such that purchases and sales are denominated in local currency. As a result, the Group’s exposure to currency risk on commercial transactions is naturally limited and mainly concerns imported products. Currency risks on import transactions (i.e. goods purchases billed in foreign currencies) covered by firm commitments are hedged by forward purchases of the payment currency. Currency hedges are generally for periods of less than 12 months. Effect of an increase/decrease in exchange rates on instruments accounted for as cash flow hedges:
(in € millions) 50-bps decline 50-bps increase
(- = loss; + = gain)Impact on
shareholders' equity
Impact on income
statement
Impact on shareholders'
equity
Impact on income
statement
Investments (3.2) (1) 9.0 Variable rate borrowings 2.1 (2.1)Borrowings hedged by fair value hedges (8.1) 8.0 Swaps qualified as fair value hedges 7.9 (7.8)Swaps qualified as cash flow hedges (1.1) 1.1 Options classified as cash flow hedges (0.2) (14.6) 4.2 15.8 Options classified as held for trading 3.5 0.9
Total effect (1.3) (12.4) 5.3 23.8
(in € millions) 10% decline 10% increaseImpact on
shareholders' equity
Impact on income
statement
Impact on shareholders'
equity
Impact on income
statement
USD/ EUR Cash Flow hedging position (30.8) - 30.8 -RON/ EUR Cash Flow hedging position 1.3 - (1.3) -HKD / EUR Cash Flow hedging position 0.3 - (0.3) -SGD / EUR Cash Flow hedging position (0.3) - 0.3 -
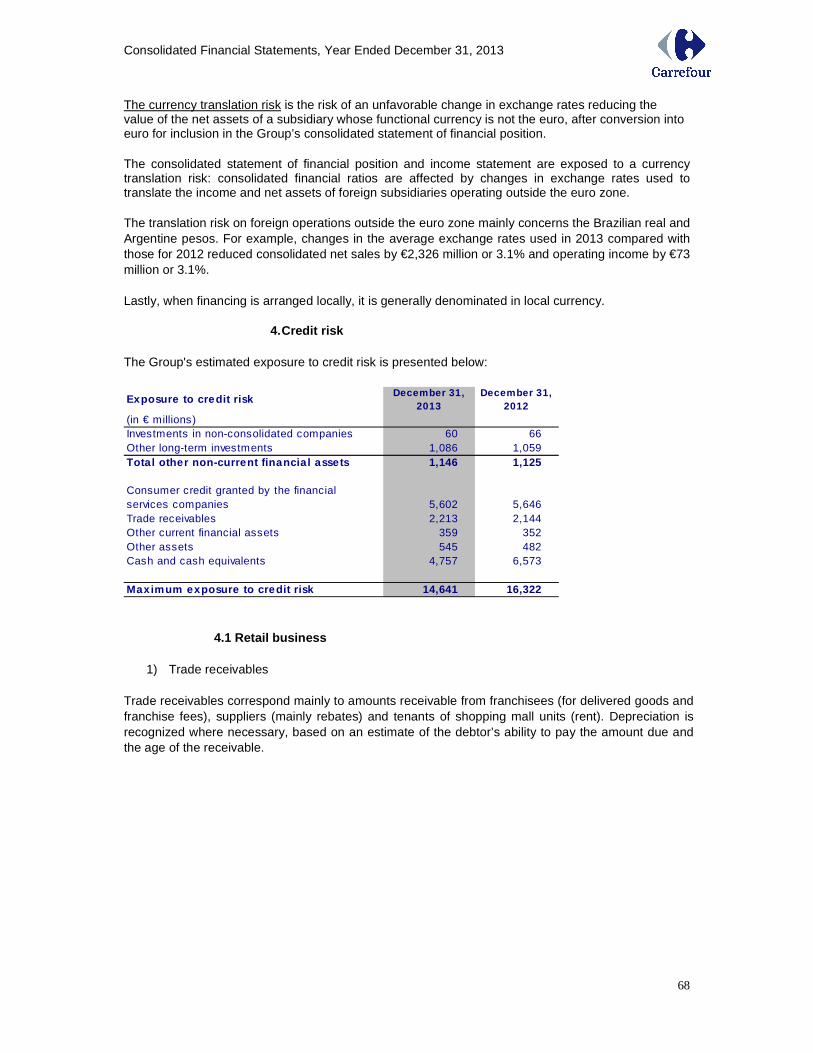
Consolidated Financial Statements, Year Ended December 31, 2013
68
The currency translation risk is the risk of an unfavorable change in exchange rates reducing the value of the net assets of a subsidiary whose functional currency is not the euro, after conversion into euro for inclusion in the Group’s consolidated statement of financial position. The consolidated statement of financial position and income statement are exposed to a currency translation risk: consolidated financial ratios are affected by changes in exchange rates used to translate the income and net assets of foreign subsidiaries operating outside the euro zone. The translation risk on foreign operations outside the euro zone mainly concerns the Brazilian real and Argentine pesos. For example, changes in the average exchange rates used in 2013 compared with those for 2012 reduced consolidated net sales by €2,326 million or 3.1% and operating income by €73 million or 3.1%. Lastly, when financing is arranged locally, it is generally denominated in local currency.
4. Credit risk The Group's estimated exposure to credit risk is presented below:
Exposure to credit riskDecember 31,
2013December 31,
2012(in € millions)Investments in non-consolidated companies 60 66Other long-term investments 1,086 1,059Tota l other non-current financia l assets 1,146 1,125
Consumer credit granted by the financial services companies 5,602 5,646Trade receivables 2,213 2,144Other current financial assets 359 352Other assets 545 482Cash and cash equivalents 4,757 6,573
Maximum exposure to credit risk 14,641 16,322
4.1 Retail business
1) Trade receivables Trade receivables correspond mainly to amounts receivable from franchisees (for delivered goods and franchise fees), suppliers (mainly rebates) and tenants of shopping mall units (rent). Depreciation is recognized where necessary, based on an estimate of the debtor’s ability to pay the amount due and the age of the receivable.
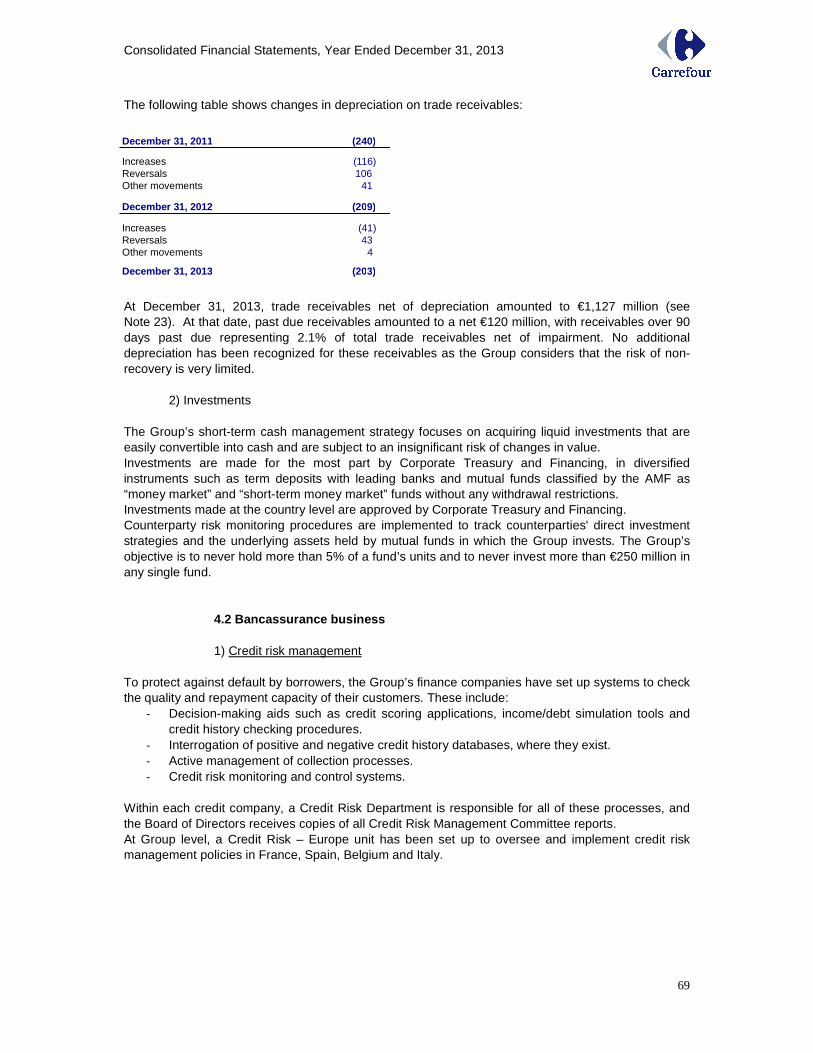
Consolidated Financial Statements, Year Ended December 31, 2013
69
The following table shows changes in depreciation on trade receivables:
At December 31, 2013, trade receivables net of depreciation amounted to €1,127 million (see Note 23). At that date, past due receivables amounted to a net €120 million, with receivables over 90 days past due representing 2.1% of total trade receivables net of impairment. No additional depreciation has been recognized for these receivables as the Group considers that the risk of non-recovery is very limited.
2) Investments The Group’s short-term cash management strategy focuses on acquiring liquid investments that are easily convertible into cash and are subject to an insignificant risk of changes in value. Investments are made for the most part by Corporate Treasury and Financing, in diversified instruments such as term deposits with leading banks and mutual funds classified by the AMF as “money market” and “short-term money market” funds without any withdrawal restrictions. Investments made at the country level are approved by Corporate Treasury and Financing. Counterparty risk monitoring procedures are implemented to track counterparties' direct investment strategies and the underlying assets held by mutual funds in which the Group invests. The Group’s objective is to never hold more than 5% of a fund’s units and to never invest more than €250 million in any single fund.
4.2 Bancassurance business
1) Credit risk management
To protect against default by borrowers, the Group’s finance companies have set up systems to check the quality and repayment capacity of their customers. These include:
- Decision-making aids such as credit scoring applications, income/debt simulation tools and credit history checking procedures.
- Interrogation of positive and negative credit history databases, where they exist. - Active management of collection processes. - Credit risk monitoring and control systems.
Within each credit company, a Credit Risk Department is responsible for all of these processes, and the Board of Directors receives copies of all Credit Risk Management Committee reports. At Group level, a Credit Risk – Europe unit has been set up to oversee and implement credit risk management policies in France, Spain, Belgium and Italy.
December 31, 201 1 (240)
Increases (116)Reversals 106Other movements 41
December 31, 2012 (209)
Increases (41)Reversals 43Other movements 4
December 31, 2013 (203)
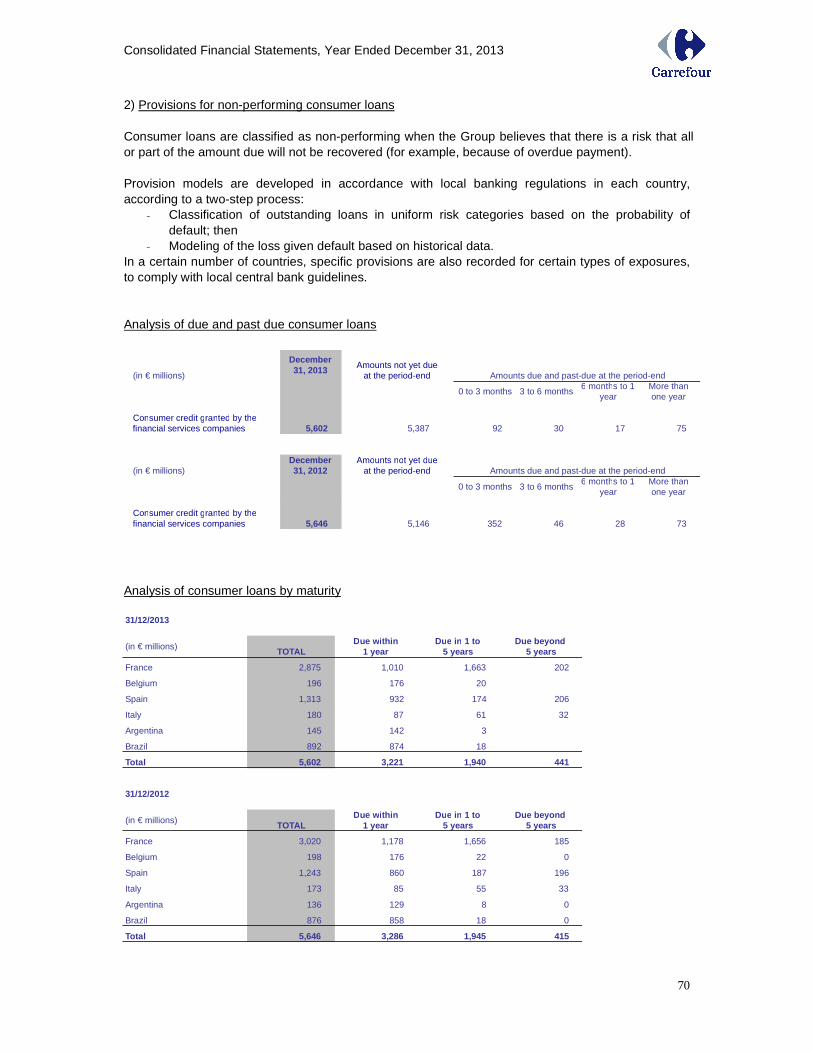
Consolidated Financial Statements, Year Ended December 31, 2013
70
2) Provisions for non-performing consumer loans Consumer loans are classified as non-performing when the Group believes that there is a risk that all or part of the amount due will not be recovered (for example, because of overdue payment). Provision models are developed in accordance with local banking regulations in each country, according to a two-step process:
- Classification of outstanding loans in uniform risk categories based on the probability of default; then
- Modeling of the loss given default based on historical data. In a certain number of countries, specific provisions are also recorded for certain types of exposures, to comply with local central bank guidelines. Analysis of due and past due consumer loans
Analysis of consumer loans by maturity
(in € millions)
December 31, 2013 Amounts not yet due
at the period-end Amounts due and past-due at the period-end
0 to 3 months 3 to 6 months6 months to 1
yearMore than one year
Consumer credit granted by the financial services companies 5,602 5,387 92 30 17 75
(in € millions)December 31, 2012
Amounts not yet due at the period-end Amounts due and past-due at the period-end
0 to 3 months 3 to 6 months6 months to 1
yearMore than one year
Consumer credit granted by the financial services companies 5,646 5,146 352 46 28 73
31/12/2013
(in € millions)TOTAL
Due with in 1 year
Due in 1 to 5 years
Due beyond 5 years
France 2,875 1,010 1,663 202
Belgium 196 176 20
Spain 1,313 932 174 206
Italy 180 87 61 32
Argentina 145 142 3
Brazil 892 874 18
Total 5,602 3,221 1,940 441
31/12/2012
(in € millions)TOTAL
Due with in 1 year
Due in 1 to 5 years
Due beyond 5 years
France 3,020 1,178 1,656 185
Belgium 198 176 22 0
Spain 1,243 860 187 196
Italy 173 85 55 33
Argentina 136 129 8 0
Brazil 876 858 18 0
Total 5,646 3,286 1,945 415
Consolidated Financial Statements, Year Ended December 31, 2013
71
5. Equity risk Equity risk corresponds to the potential impact of changes in the Carrefour share price on its share-based payment commitments and on treasury stock. Group policy is to avoid taking positions on its own shares or those of other companies, except in response to particular circumstances or needs. From time to time, the Group buys back its shares on the market or purchases call options on its shares, mainly in connection with its stock grant and stock option plans. The frequency and size of these purchases depend on the share price. At December 31, 2013, shares and options held directly or indirectly by the Group covered its total commitments under outstanding stock option and stock grant plans. Marketable securities portfolios and other financial investments held by the Group consist for the most part of money market instruments that do not expose the Group to any material equity risk. NOTE 37: CONTINGENT LIABILITIES Group companies are subject to regular tax, customs and administrative audits in the normal course of business. They are also involved in various claims and legal proceedings. A provision is recorded when the Group has a present obligation (legal or constructive) as a result of a past event, it is probable that an outflow of resources embodying economic benefits will be required to settle the obligation, and a reliable estimate can be made of the amount of the obligation (see Notes 29 and 31). No provisions are recorded for future operating losses. Contingent liabilities, which are not recognized in the statement of financial position, are defined as:
� Possible obligations that arise from past events and whose existence will be confirmed only by the occurrence or non-occurrence of one or more uncertain future events not wholly within the control of the Group; or
� Present obligations that arise from past events but are not recognized because (i) it is not probable that an outflow of resources embodying economic benefits will be required to settle the obligation or (ii) the amount of the obligation cannot be measured with sufficient reliability.
To the best of the Group's knowledge, there are no contingent liabilities that may be considered as being likely to have a material impact on the Group’s results, financial position, assets and liabilities or business.
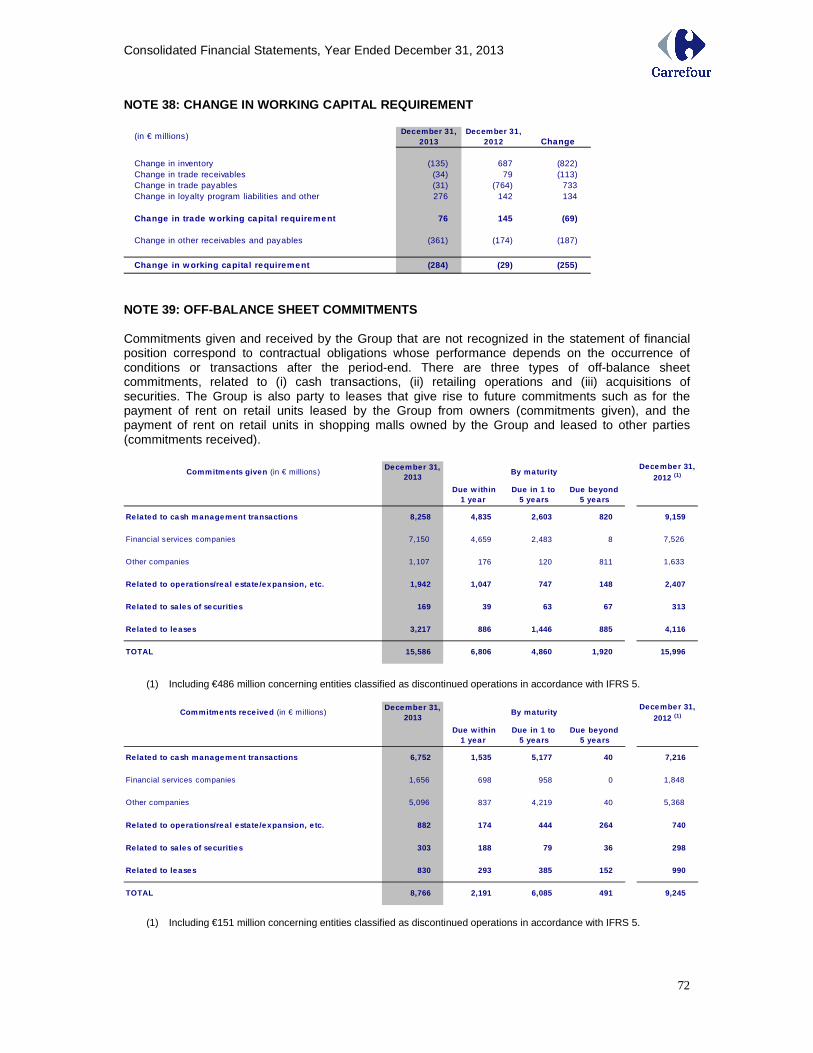
Consolidated Financial Statements, Year Ended December 31, 2013
72
NOTE 38: CHANGE IN WORKING CAPITAL REQUIREMENT
(in € millions)December 31,
2013December 31,
2012 Change
Change in inventory (135) 687 (822) Change in trade receivables (34) 79 (113) Change in trade payables (31) (764) 733Change in loyalty program liabilities and other 276 142 134
Change in trade w orking capita l requirement 76 145 (69)
Change in other receivables and payables (361) (174) (187)
Change in w orking capita l requirement (284) (29) (255) NOTE 39: OFF-BALANCE SHEET COMMITMENTS Commitments given and received by the Group that are not recognized in the statement of financial position correspond to contractual obligations whose performance depends on the occurrence of conditions or transactions after the period-end. There are three types of off-balance sheet commitments, related to (i) cash transactions, (ii) retailing operations and (iii) acquisitions of securities. The Group is also party to leases that give rise to future commitments such as for the payment of rent on retail units leased by the Group from owners (commitments given), and the payment of rent on retail units in shopping malls owned by the Group and leased to other parties (commitments received).
Commitments given (in € millions)December 31,
2013By maturity
December 31, 2012 (1)
Due w ithin 1 year
Due in 1 to 5 years
Due beyond 5 yea rs
Related to cash management transactions 8,258 4,835 2,603 820 9,159
Financial services companies 7,150 4,659 2,483 8 7,526
Other companies 1,107 176 120 811 1,633
Related to opera tions/real estate /expansion, e tc. 1,942 1,047 747 148 2,407
Related to sa les of securities 169 39 63 67 313
Related to leases 3,217 886 1,446 885 4,116
TOTAL 15,586 6,806 4,860 1,920 15,996
(1) Including €486 million concerning entities classified as discontinued operations in accordance with IFRS 5.
Commitments rece ived (in € millions)December 31,
2013By maturity
December 31, 2012 (1)
Due w ithin 1 year
Due in 1 to 5 years
Due beyond 5 years
Related to cash management transactions 6,752 1,535 5,177 40 7,216
Financial services companies 1,656 698 958 0 1,848
Other companies 5,096 837 4,219 40 5,368
Related to opera tions/real estate/expansion, e tc. 882 174 444 264 740
Related to sa les of securities 303 188 79 36 298
Related to leases 830 293 385 152 990
TOTAL 8,766 2,191 6,085 491 9,245
(1) Including €151 million concerning entities classified as discontinued operations in accordance with IFRS 5.
Consolidated Financial Statements, Year Ended December 31, 2013
73
Off-balance sheet commitments related to cash transactions include:
- Credit commitments given to customers by the financial services companies in the course of their operating activities, and credit commitments received from banks.
- Mortgages and other guarantees given or received, mainly in connection with the Group’s real estate activities.
- Committed lines of credit available to the Group but not drawn down at the period-end. Off-balance sheet commitments related to operations include:
- Commitments to purchase land given in connection with the Group’s expansion programs. - Miscellaneous commitments arising from commercial contracts. - Performance bonds issued in connection with the Group’s expansion programs. - Rent guarantees and guarantees from shopping mall operators. - Guarantees for the payment of receivables. - Other commitments given or received.
Off-balance sheet commitments related to purchases and sales of securities consist of firm commitments to purchase and sell securities received from third parties:
- For the most part in France, in connection with the Group’s franchising activities. - Including immediately exercisable put and call options and sellers’ warranties given to third
parties. No value is attributed to sellers’ warranties received by the Group. Off-balance sheet commitments related to leases:
At December 31, 2013, 692 hypermarket properties and 530 supermarket properties were owned outright out of a total consolidated store base of 1,168 hypermarkets and 1,274 supermarkets.
Rent on store properties not owned by the Group totaled €905 million in 2013 (see Note 9).
Of total future minimum rentals, 24% are due within one year, 42% in one to five years and 34% beyond five years.
Future minimum rentals under operating leases – determined based on the Group’s maximum commitment in terms of both duration and amount for each of the property leases in progress at the period-end – amounted to €3,217 million, or €2,551 million after discounting.
The Group also owns various shopping malls, mainly built on the same sites as its hypermarkets and supermarkets. Rental of the retail units in these malls generated revenues of €247 million in 2013. Future minimum rentals receivable from these retail units – determined based on the tenants’ maximum commitment in terms of both duration and amount for each of the leases in progress at the period-end – amounted to €830 million, or €678 million after discounting. NOTE 40: EMPLOYEE INFORMATION
December 31, 2013
December 31,
2012 (1)
Average number of Group employees 351,463 349,776Number of Group employees at the period-end 363,989 357,342 (1) To permit meaningful comparisons, employee numbers for 2012 have been restated to take into account the loss of control
of operations in Turkey and the reclassification of the Indian subsidiary as a discontinued operation in accordance with IFRS 5.
Consolidated Financial Statements, Year Ended December 31, 2013
74
NOTE 41: RELATED PARTIES 41.1 Related party transactions The following table presents the main related party transactions carried out in 2013 with companies over which the Group exercised significant influence or joint control at December 31, 2013. (in € millions) Carre fourSA Provencia Mestdagh
Net sales (sales of goods) 0 556 125 Franchise fees 1 8 7
Receivables at December 31 2 36 12 41.2 Other related party transactions Massy building leased off-plan from the Colony Group
The 12-year lease came into effect on delivery of the building, on December 20, 2013. The annual rent for the entire building is set at €21 million. The rent paid by Carrefour depends on the actual surface area leased and is subject to an escalation clause based on France’s INSEE construction cost index. Carrefour has negotiated an initial rent-free period of 12 months. NOTE 42: MANAGEMENT COMPENSATION The following table shows the compensation paid by the Group to serving members of the Management team and the Board of Directors during 2013 and 2012. Comparative information for 2012 has been restated on the same basis. (in € millions) 2013 2012
Compensation for the period 4.3 5.5 Prior year bonus 4.7 3.4 Benefits in kind (accommodation and company car) 0.2 0.1 Tota l compensation pa id during the period 9.2 9.0
Employer payroll taxes 3.2 4.2
Termination benefits 0.4 3.8 Other management benefit plans are as follows:
- Defined benefit pension plan described in Note 30. - Stock option and stock grant plans. At December 31, 2013, serving members of Group
management held 142,575 stock options (at December 31, 2012, serving members of Group management held 511,845 stock options and 4,107 stock grant rights).
Directors’ attendance fees paid to members of the Board of Directors amounted to €0.8 million in 2013 (2012: €0.8 million).
Consolidated Financial Statements, Year Ended December 31, 2013
75
NOTE 43: SUBSEQUENT EVENTS No events have occurred since the year-end that would have a material impact on the consolidated financial statements. NOTE 44: FEES PAID TO THE AUDITORS
Deloitte KPMG Mazars Tota l Deloitte KPMG Mazars Total
(in € millions) & Associés & Associés
Audit services 2.3 9.1 2.5 13.9 2.7 9.8 2.9 15.4
Other services 0.7 0.5 0.1 1.3 0.3 0.2 0.0 0.5
TOTAL 3.0 9.6 2.6 15.2 3.0 10.0 2.9 15.9
20122013
Consolidated Financial Statements, Year Ended December 31, 2013
76
NOTE 45: Scope of consolidation
45.1 Fully consolidated companies at December 31, 2 013
Percent interest used in consolidation
FRANCEACTIS 100.0AJACCIO DISTRIBUTION 100.0ALFROY 100.0ALODIS 100.0ARIGE 100.0AVENUE 52.0BELLEVUE DISTRIBUTION 100.0BLO DISTRIBUTION 100.0BOEDIM 100.0BPJ 100.0BREM 63 51.0CADS 97.0CALLOUETS 51.0CARAUTOROUTES 100.0CARCOOP 50.0CARCOOP STATIONS SERVICE 50.0CARDADEL 100.0CARFUEL 100.0CARIMA 100.0CARLIER 100.0CARMA 30.4CARMA COURTAGE 30.4CARMA VIE 30.4CARREFOUR ADMINISTRATIF FRANCE 100.0CARREFOUR BANQUE (Ex S2P - SOCIETE DES PAIEMENTS PASS ) 60.8CARREFOUR DRIVE 100.0CARREFOUR FORMATION HYPERMARCHES FRANCE (CFHF) 100.0CARREFOUR FRANCE 100.0CARREFOUR France PARTICIPATION 100.0CARREFOUR HYPERMARCHES 100.0CARREFOUR IMPORT SAS ( EX CRFP2) 100.0CARREFOUR MANAGEMENT 100.0CARREFOUR MARCHANDISES INTERNATIONALES 100.0CARREFOUR MONACO 100.0CARREFOUR PARTENARIAT INTERNATIONAL 100.0CARREFOUR PROPERTY 100.0CARREFOUR PROPERTY DEVELOPPEMENT 100.0CARREFOUR PROPERTY GESTION 100.0CARREFOUR PROPERTY INTERNATIONAL 100.0CARREFOUR PROXIMITE France 100.0CARREFOUR SA 100.0CARREFOUR SERVICES CLIENTS 100.0CARREFOUR STATION SERVICE (ex PARIDIS 75) 100.0CARREFOUR SYSTEMES D'INFORMATIONS FRANCE 100.0CARREFOUR VOYAGES 100.0CARVILLENEUVE 100.0CASCH 100.0CENTRE COMMERCIAL DE LESCAR 99.5CHALLENGER 100.0CHAMNORD 59.6CHAMPION SUPERMARCHES FRANCE (C.S.F) 100.0CHRISTHALIE 100.0CLAIREFONTAINE 100.0COMPAGNIE D'ACTIVITE ET DE COMMERCE INTERNATIONAL -CACI- 100.0CONTINENT 2001 100.0COSG 100.0COVICAR 23 100.0COVIAM 8 100.0COVICAR 2 100.0CP TRANSACTIONS 100.0CPF ASSET MANAGEMENT 100.0
CRF REGIE PUBLICITAIRE 100.0
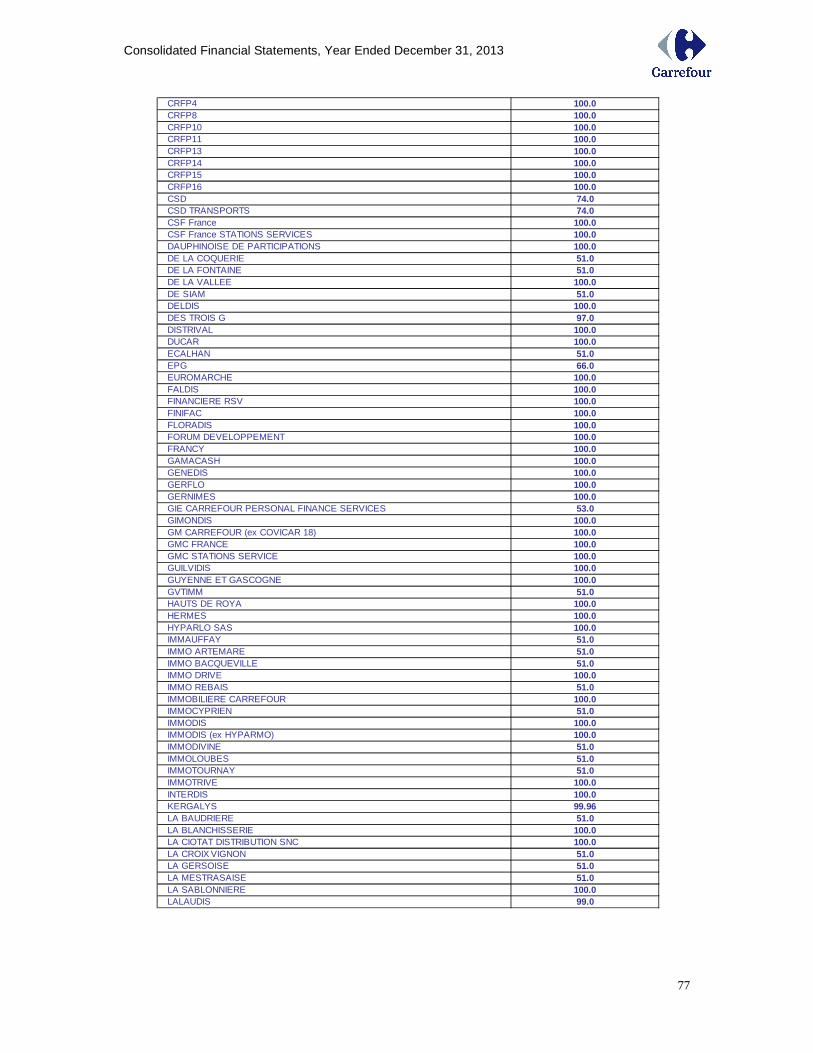
Consolidated Financial Statements, Year Ended December 31, 2013
77
CRFP4 100.0CRFP8 100.0CRFP10 100.0CRFP11 100.0CRFP13 100.0CRFP14 100.0CRFP15 100.0CRFP16 100.0CSD 74.0CSD TRANSPORTS 74.0CSF France 100.0CSF France STATIONS SERVICES 100.0DAUPHINOISE DE PARTICIPATIONS 100.0DE LA COQUERIE 51.0DE LA FONTAINE 51.0DE LA VALLEE 100.0DE SIAM 51.0DELDIS 100.0DES TROIS G 97.0DISTRIVAL 100.0DUCAR 100.0ECALHAN 51.0EPG 66.0EUROMARCHE 100.0FALDIS 100.0FINANCIERE RSV 100.0FINIFAC 100.0FLORADIS 100.0FORUM DEVELOPPEMENT 100.0FRANCY 100.0GAMACASH 100.0GENEDIS 100.0GERFLO 100.0GERNIMES 100.0GIE CARREFOUR PERSONAL FINANCE SERVICES 53.0GIMONDIS 100.0GM CARREFOUR (ex COVICAR 18) 100.0GMC FRANCE 100.0GMC STATIONS SERVICE 100.0GUILVIDIS 100.0GUYENNE ET GASCOGNE 100.0GVTIMM 51.0HAUTS DE ROYA 100.0HERMES 100.0HYPARLO SAS 100.0IMMAUFFAY 51.0IMMO ARTEMARE 51.0IMMO BACQUEVILLE 51.0IMMO DRIVE 100.0IMMO REBAIS 51.0IMMOBILIERE CARREFOUR 100.0IMMOCYPRIEN 51.0IMMODIS 100.0IMMODIS (ex HYPARMO) 100.0IMMODIVINE 51.0IMMOLOUBES 51.0IMMOTOURNAY 51.0IMMOTRIVE 100.0INTERDIS 100.0KERGALYS 99.96LA BAUDRIERE 51.0LA BLANCHISSERIE 100.0LA CIOTAT DISTRIBUTION SNC 100.0LA CROIX VIGNON 51.0LA GERSOISE 51.0LA MESTRASAISE 51.0LA SABLONNIERE 100.0LALAUDIS 99.0
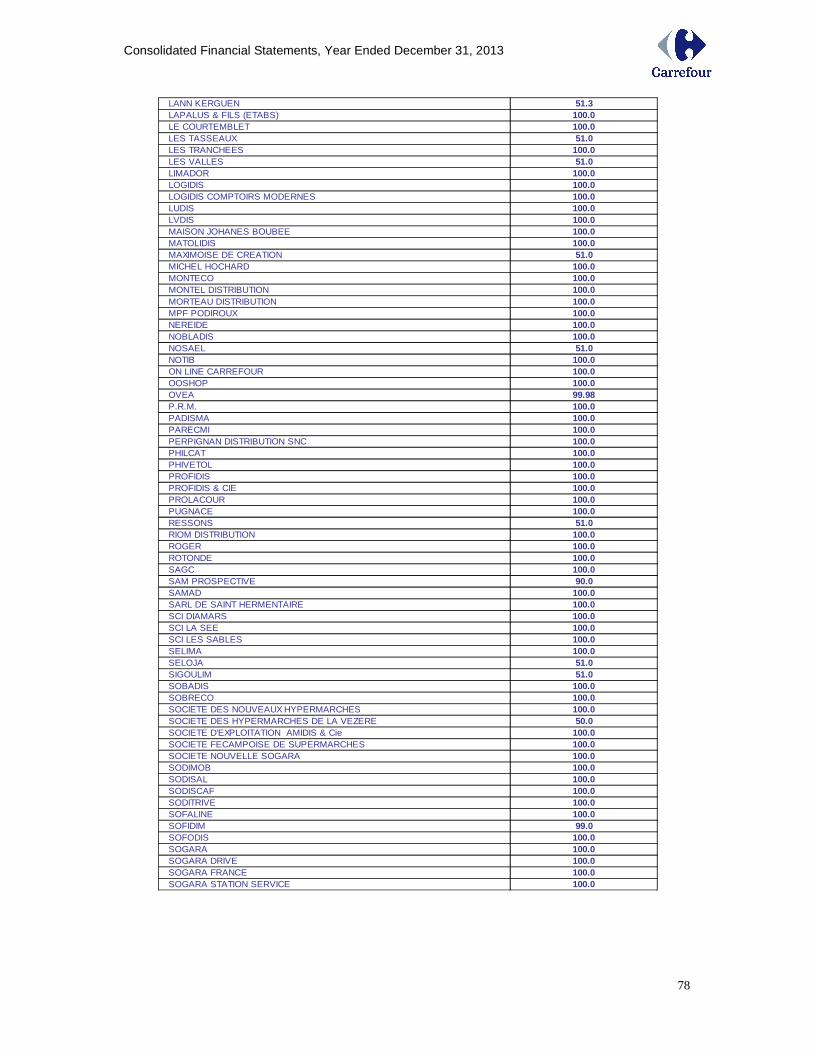
Consolidated Financial Statements, Year Ended December 31, 2013
78
LANN KERGUEN 51.3LAPALUS & FILS (ETABS) 100.0LE COURTEMBLET 100.0LES TASSEAUX 51.0LES TRANCHEES 100.0LES VALLES 51.0LIMADOR 100.0LOGIDIS 100.0LOGIDIS COMPTOIRS MODERNES 100.0LUDIS 100.0LVDIS 100.0MAISON JOHANES BOUBEE 100.0MATOLIDIS 100.0MAXIMOISE DE CREATION 51.0MICHEL HOCHARD 100.0MONTECO 100.0MONTEL DISTRIBUTION 100.0MORTEAU DISTRIBUTION 100.0MPF PODIROUX 100.0NEREIDE 100.0NOBLADIS 100.0NOSAEL 51.0NOTIB 100.0ON LINE CARREFOUR 100.0OOSHOP 100.0OVEA 99.98P.R.M. 100.0PADISMA 100.0PARECMI 100.0PERPIGNAN DISTRIBUTION SNC 100.0PHILCAT 100.0PHIVETOL 100.0PROFIDIS 100.0PROFIDIS & CIE 100.0PROLACOUR 100.0PUGNACE 100.0RESSONS 51.0RIOM DISTRIBUTION 100.0ROGER 100.0ROTONDE 100.0SAGC 100.0SAM PROSPECTIVE 90.0SAMAD 100.0SARL DE SAINT HERMENTAIRE 100.0SCI DIAMARS 100.0SCI LA SEE 100.0SCI LES SABLES 100.0SELIMA 100.0SELOJA 51.0SIGOULIM 51.0SOBADIS 100.0SOBRECO 100.0SOCIETE DES NOUVEAUX HYPERMARCHES 100.0SOCIETE DES HYPERMARCHES DE LA VEZERE 50.0SOCIETE D'EXPLOITATION AMIDIS & Cie 100.0SOCIETE FECAMPOISE DE SUPERMARCHES 100.0SOCIETE NOUVELLE SOGARA 100.0SODIMOB 100.0SODISAL 100.0SODISCAF 100.0SODITRIVE 100.0SOFALINE 100.0SOFIDIM 99.0SOFODIS 100.0SOGARA 100.0SOGARA DRIVE 100.0SOGARA FRANCE 100.0SOGARA STATION SERVICE 100.0
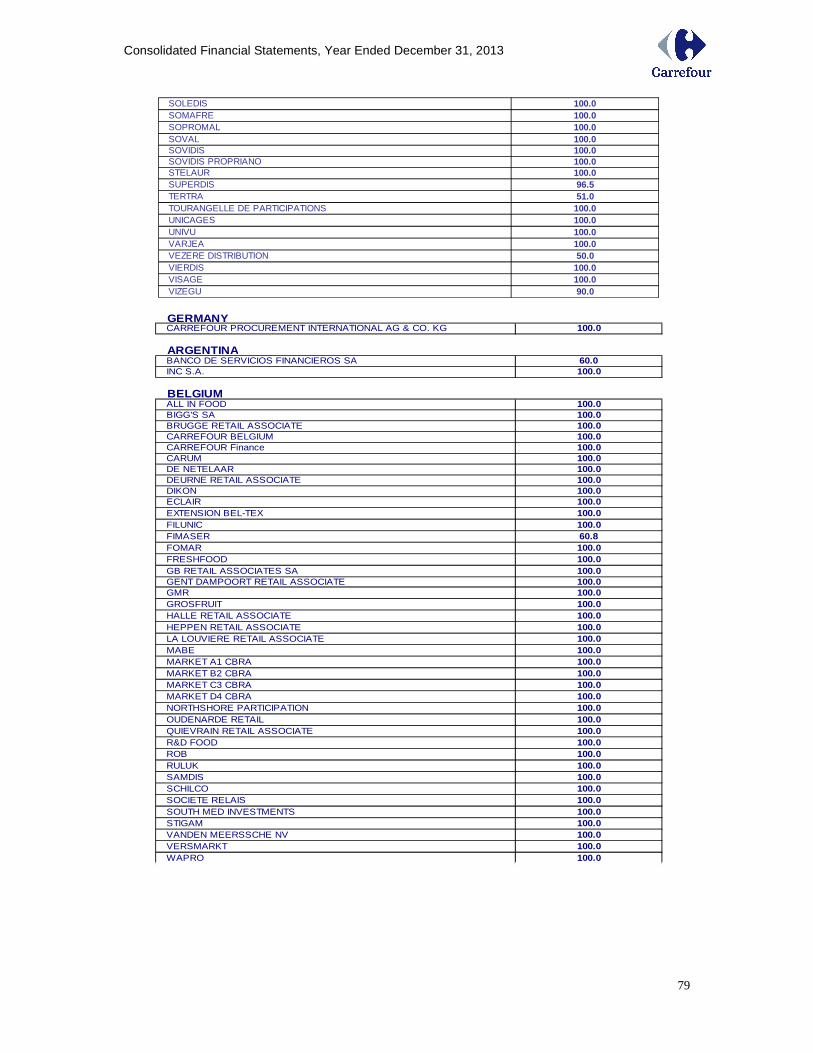
Consolidated Financial Statements, Year Ended December 31, 2013
79
SOLEDIS 100.0SOMAFRE 100.0SOPROMAL 100.0SOVAL 100.0SOVIDIS 100.0SOVIDIS PROPRIANO 100.0STELAUR 100.0SUPERDIS 96.5TERTRA 51.0TOURANGELLE DE PARTICIPATIONS 100.0UNICAGES 100.0UNIVU 100.0VARJEA 100.0VEZERE DISTRIBUTION 50.0VIERDIS 100.0VISAGE 100.0VIZEGU 90.0
GERMANYCARREFOUR PROCUREMENT INTERNATIONAL AG & CO. KG 100.0
ARGENTINABANCO DE SERVICIOS FINANCIEROS SA 60.0INC S.A. 100.0
BELGIUMALL IN FOOD 100.0BIGG'S SA 100.0BRUGGE RETAIL ASSOCIATE 100.0CARREFOUR BELGIUM 100.0CARREFOUR Finance 100.0CARUM 100.0DE NETELAAR 100.0DEURNE RETAIL ASSOCIATE 100.0DIKON 100.0ECLAIR 100.0EXTENSION BEL-TEX 100.0FILUNIC 100.0FIMASER 60.8FOMAR 100.0FRESHFOOD 100.0GB RETAIL ASSOCIATES SA 100.0GENT DAMPOORT RETAIL ASSOCIATE 100.0GMR 100.0GROSFRUIT 100.0HALLE RETAIL ASSOCIATE 100.0HEPPEN RETAIL ASSOCIATE 100.0LA LOUVIERE RETAIL ASSOCIATE 100.0MABE 100.0MARKET A1 CBRA 100.0MARKET B2 CBRA 100.0MARKET C3 CBRA 100.0MARKET D4 CBRA 100.0NORTHSHORE PARTICIPATION 100.0OUDENARDE RETAIL 100.0QUIEVRAIN RETAIL ASSOCIATE 100.0R&D FOOD 100.0ROB 100.0RULUK 100.0SAMDIS 100.0SCHILCO 100.0SOCIETE RELAIS 100.0SOUTH MED INVESTMENTS 100.0STIGAM 100.0VANDEN MEERSSCHE NV 100.0VERSMARKT 100.0WAPRO 100.0
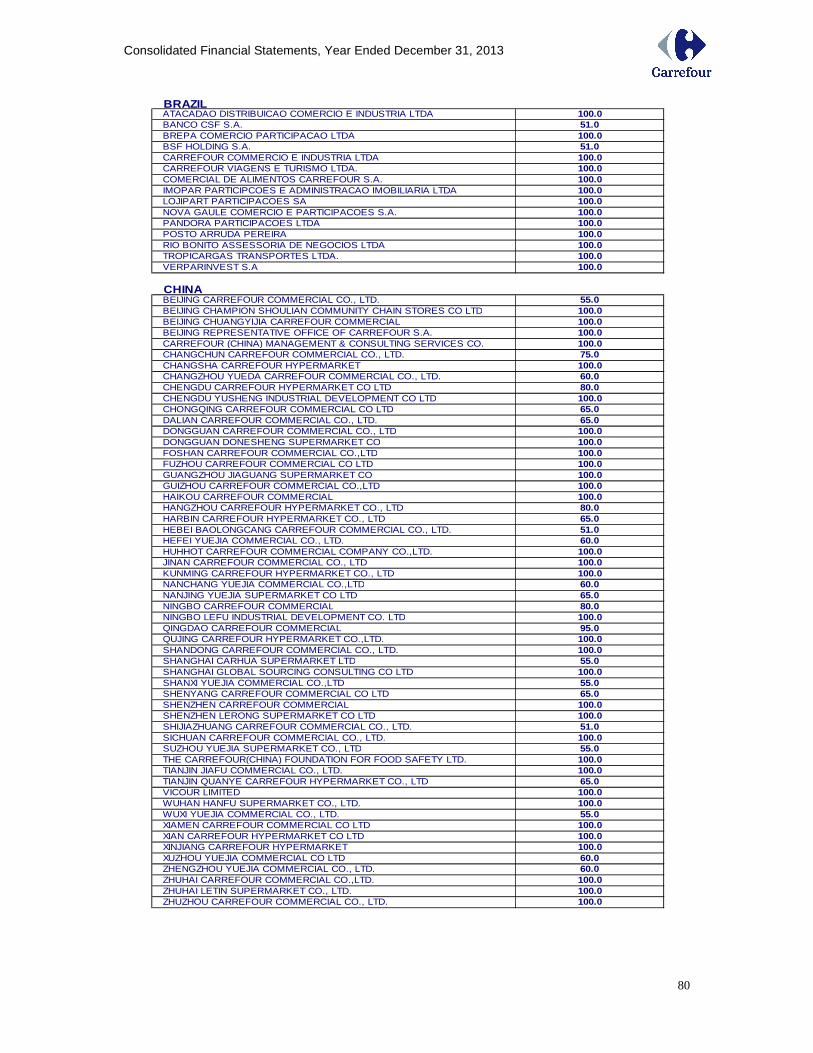
Consolidated Financial Statements, Year Ended December 31, 2013
80
BRAZILATACADAO DISTRIBUICAO COMERCIO E INDUSTRIA LTDA 100.0BANCO CSF S.A. 51.0BREPA COMERCIO PARTICIPACAO LTDA 100.0BSF HOLDING S.A. 51.0CARREFOUR COMMERCIO E INDUSTRIA LTDA 100.0CARREFOUR VIAGENS E TURISMO LTDA. 100.0COMERCIAL DE ALIMENTOS CARREFOUR S.A. 100.0IMOPAR PARTICIPCOES E ADMINISTRACAO IMOBILIARIA LTDA 100.0LOJIPART PARTICIPACOES SA 100.0NOVA GAULE COMERCIO E PARTICIPACOES S.A. 100.0PANDORA PARTICIPACOES LTDA 100.0POSTO ARRUDA PEREIRA 100.0RIO BONITO ASSESSORIA DE NEGOCIOS LTDA 100.0TROPICARGAS TRANSPORTES LTDA. 100.0VERPARINVEST S.A 100.0
CHINABEIJING CARREFOUR COMMERCIAL CO., LTD. 55.0BEIJING CHAMPION SHOULIAN COMMUNITY CHAIN STORES CO LTD 100.0BEIJING CHUANGYIJIA CARREFOUR COMMERCIAL 100.0BEIJING REPRESENTATIVE OFFICE OF CARREFOUR S.A. 100.0CARREFOUR (CHINA) MANAGEMENT & CONSULTING SERVICES CO. 100.0CHANGCHUN CARREFOUR COMMERCIAL CO., LTD. 75.0CHANGSHA CARREFOUR HYPERMARKET 100.0CHANGZHOU YUEDA CARREFOUR COMMERCIAL CO., LTD. 60.0CHENGDU CARREFOUR HYPERMARKET CO LTD 80.0CHENGDU YUSHENG INDUSTRIAL DEVELOPMENT CO LTD 100.0CHONGQING CARREFOUR COMMERCIAL CO LTD 65.0DALIAN CARREFOUR COMMERCIAL CO., LTD. 65.0DONGGUAN CARREFOUR COMMERCIAL CO., LTD 100.0DONGGUAN DONESHENG SUPERMARKET CO 100.0FOSHAN CARREFOUR COMMERCIAL CO.,LTD 100.0FUZHOU CARREFOUR COMMERCIAL CO LTD 100.0GUANGZHOU JIAGUANG SUPERMARKET CO 100.0GUIZHOU CARREFOUR COMMERCIAL CO.,LTD 100.0HAIKOU CARREFOUR COMMERCIAL 100.0HANGZHOU CARREFOUR HYPERMARKET CO., LTD 80.0HARBIN CARREFOUR HYPERMARKET CO., LTD 65.0HEBEI BAOLONGCANG CARREFOUR COMMERCIAL CO., LTD. 51.0HEFEI YUEJIA COMMERCIAL CO., LTD. 60.0HUHHOT CARREFOUR COMMERCIAL COMPANY CO.,LTD. 100.0JINAN CARREFOUR COMMERCIAL CO., LTD 100.0KUNMING CARREFOUR HYPERMARKET CO., LTD 100.0NANCHANG YUEJIA COMMERCIAL CO.,LTD 60.0NANJING YUEJIA SUPERMARKET CO LTD 65.0NINGBO CARREFOUR COMMERCIAL 80.0NINGBO LEFU INDUSTRIAL DEVELOPMENT CO. LTD 100.0QINGDAO CARREFOUR COMMERCIAL 95.0QUJING CARREFOUR HYPERMARKET CO.,LTD. 100.0SHANDONG CARREFOUR COMMERCIAL CO., LTD. 100.0SHANGHAI CARHUA SUPERMARKET LTD 55.0SHANGHAI GLOBAL SOURCING CONSULTING CO LTD 100.0SHANXI YUEJIA COMMERCIAL CO.,LTD 55.0SHENYANG CARREFOUR COMMERCIAL CO LTD 65.0SHENZHEN CARREFOUR COMMERCIAL 100.0SHENZHEN LERONG SUPERMARKET CO LTD 100.0SHIJIAZHUANG CARREFOUR COMMERCIAL CO., LTD. 51.0SICHUAN CARREFOUR COMMERCIAL CO., LTD. 100.0SUZHOU YUEJIA SUPERMARKET CO., LTD 55.0THE CARREFOUR(CHINA) FOUNDATION FOR FOOD SAFETY LTD. 100.0TIANJIN JIAFU COMMERCIAL CO., LTD. 100.0TIANJIN QUANYE CARREFOUR HYPERMARKET CO., LTD 65.0VICOUR LIMITED 100.0WUHAN HANFU SUPERMARKET CO., LTD. 100.0WUXI YUEJIA COMMERCIAL CO., LTD. 55.0XIAMEN CARREFOUR COMMERCIAL CO LTD 100.0XIAN CARREFOUR HYPERMARKET CO LTD 100.0XINJIANG CARREFOUR HYPERMARKET 100.0XUZHOU YUEJIA COMMERCIAL CO LTD 60.0ZHENGZHOU YUEJIA COMMERCIAL CO., LTD. 60.0ZHUHAI CARREFOUR COMMERCIAL CO.,LTD. 100.0ZHUHAI LETIN SUPERMARKET CO., LTD. 100.0ZHUZHOU CARREFOUR COMMERCIAL CO., LTD. 100.0
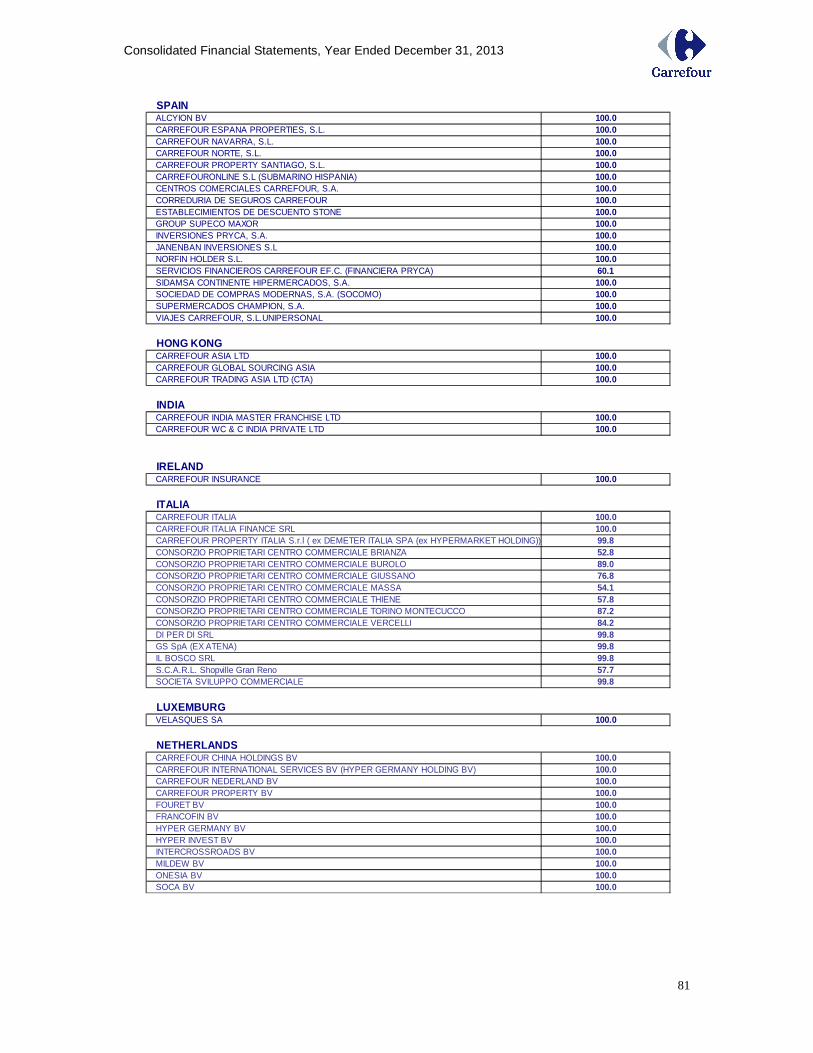
Consolidated Financial Statements, Year Ended December 31, 2013
81
SPAINALCYION BV 100.0CARREFOUR ESPANA PROPERTIES, S.L. 100.0CARREFOUR NAVARRA, S.L. 100.0CARREFOUR NORTE, S.L. 100.0CARREFOUR PROPERTY SANTIAGO, S.L. 100.0CARREFOURONLINE S.L (SUBMARINO HISPANIA) 100.0CENTROS COMERCIALES CARREFOUR, S.A. 100.0CORREDURIA DE SEGUROS CARREFOUR 100.0ESTABLECIMIENTOS DE DESCUENTO STONE 100.0GROUP SUPECO MAXOR 100.0INVERSIONES PRYCA, S.A. 100.0JANENBAN INVERSIONES S.L 100.0NORFIN HOLDER S.L. 100.0SERVICIOS FINANCIEROS CARREFOUR EF.C. (FINANCIERA PRYCA) 60.1SIDAMSA CONTINENTE HIPERMERCADOS, S.A. 100.0SOCIEDAD DE COMPRAS MODERNAS, S.A. (SOCOMO) 100.0SUPERMERCADOS CHAMPION, S.A. 100.0VIAJES CARREFOUR, S.L.UNIPERSONAL 100.0
HONG KONGCARREFOUR ASIA LTD 100.0CARREFOUR GLOBAL SOURCING ASIA 100.0CARREFOUR TRADING ASIA LTD (CTA) 100.0
INDIACARREFOUR INDIA MASTER FRANCHISE LTD 100.0CARREFOUR WC & C INDIA PRIVATE LTD 100.0
IRELANDCARREFOUR INSURANCE 100.0
ITALIACARREFOUR ITALIA 100.0CARREFOUR ITALIA FINANCE SRL 100.0CARREFOUR PROPERTY ITALIA S.r.l ( ex DEMETER ITALIA SPA (ex HYPERMARKET HOLDING)) 99.8CONSORZIO PROPRIETARI CENTRO COMMERCIALE BRIANZA 52.8CONSORZIO PROPRIETARI CENTRO COMMERCIALE BUROLO 89.0CONSORZIO PROPRIETARI CENTRO COMMERCIALE GIUSSANO 76.8CONSORZIO PROPRIETARI CENTRO COMMERCIALE MASSA 54.1CONSORZIO PROPRIETARI CENTRO COMMERCIALE THIENE 57.8CONSORZIO PROPRIETARI CENTRO COMMERCIALE TORINO MONTECUCCO 87.2CONSORZIO PROPRIETARI CENTRO COMMERCIALE VERCELLI 84.2DI PER DI SRL 99.8GS SpA (EX ATENA) 99.8IL BOSCO SRL 99.8S.C.A.R.L. Shopville Gran Reno 57.7SOCIETA SVILUPPO COMMERCIALE 99.8
LUXEMBURGVELASQUES SA 100.0
NETHERLANDSCARREFOUR CHINA HOLDINGS BV 100.0CARREFOUR INTERNATIONAL SERVICES BV (HYPER GERMANY HOLDING BV) 100.0CARREFOUR NEDERLAND BV 100.0CARREFOUR PROPERTY BV 100.0FOURET BV 100.0FRANCOFIN BV 100.0HYPER GERMANY BV 100.0HYPER INVEST BV 100.0INTERCROSSROADS BV 100.0MILDEW BV 100.0ONESIA BV 100.0SOCA BV 100.0
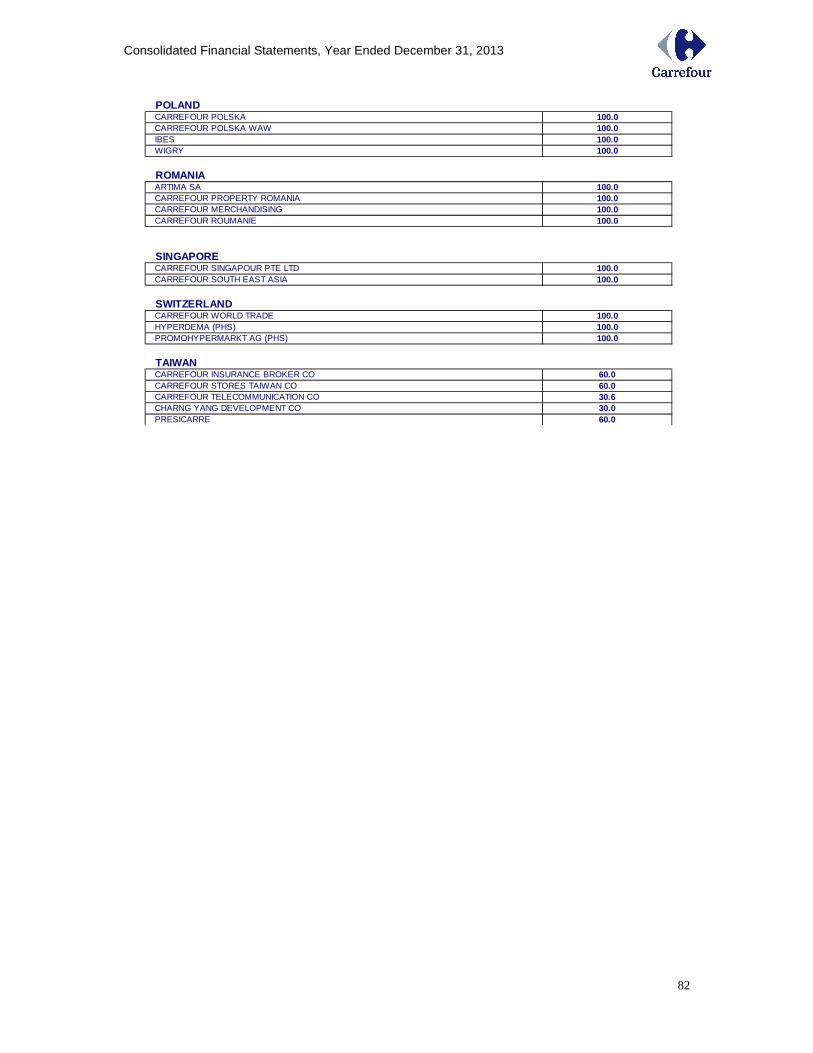
Consolidated Financial Statements, Year Ended December 31, 2013
82
POLANDCARREFOUR POLSKA 100.0CARREFOUR POLSKA WAW 100.0IBES 100.0WIGRY 100.0
ROMANIAARTIMA SA 100.0CARREFOUR PROPERTY ROMANIA 100.0CARREFOUR MERCHANDISING 100.0CARREFOUR ROUMANIE 100.0
SINGAPORECARREFOUR SINGAPOUR PTE LTD 100.0CARREFOUR SOUTH EAST ASIA 100.0
SWITZERLANDCARREFOUR WORLD TRADE 100.0HYPERDEMA (PHS) 100.0PROMOHYPERMARKT AG (PHS) 100.0
TAIWANCARREFOUR INSURANCE BROKER CO 60.0CARREFOUR STORES TAIWAN CO 60.0CARREFOUR TELECOMMUNICATION CO 30.6CHARNG YANG DEVELOPMENT CO 30.0PRESICARRE 60.0
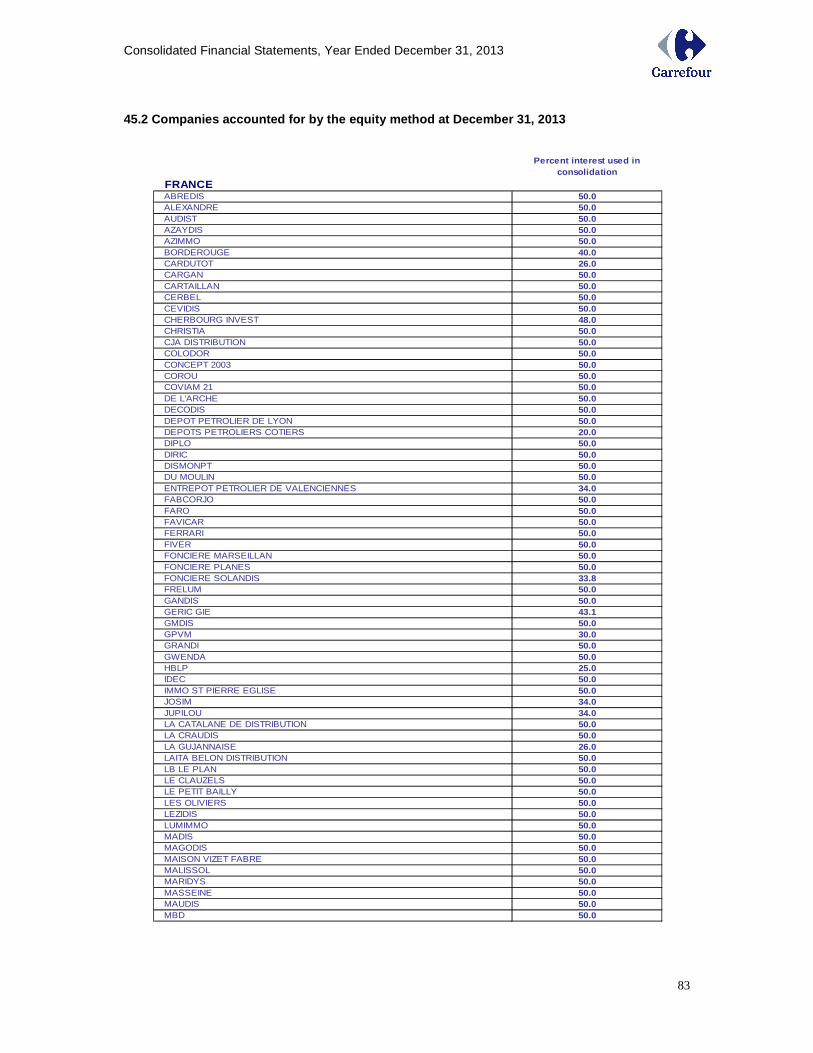
Consolidated Financial Statements, Year Ended December 31, 2013
83
45.2 Companies accounted for by the equity method a t December 31, 2013
Percent interest used in consolidation
FRANCEABREDIS 50.0ALEXANDRE 50.0AUDIST 50.0AZAYDIS 50.0AZIMMO 50.0BORDEROUGE 40.0CARDUTOT 26.0CARGAN 50.0CARTAILLAN 50.0CERBEL 50.0CEVIDIS 50.0CHERBOURG INVEST 48.0CHRISTIA 50.0CJA DISTRIBUTION 50.0COLODOR 50.0CONCEPT 2003 50.0COROU 50.0COVIAM 21 50.0DE L'ARCHE 50.0DECODIS 50.0DEPOT PETROLIER DE LYON 50.0DEPOTS PETROLIERS COTIERS 20.0DIPLO 50.0DIRIC 50.0DISMONPT 50.0DU MOULIN 50.0ENTREPOT PETROLIER DE VALENCIENNES 34.0FABCORJO 50.0FARO 50.0FAVICAR 50.0FERRARI 50.0FIVER 50.0FONCIERE MARSEILLAN 50.0FONCIERE PLANES 50.0FONCIERE SOLANDIS 33.8FRELUM 50.0GANDIS 50.0GERIC GIE 43.1GMDIS 50.0GPVM 30.0GRANDI 50.0GWENDA 50.0HBLP 25.0IDEC 50.0IMMO ST PIERRE EGLISE 50.0JOSIM 34.0JUPILOU 34.0LA CATALANE DE DISTRIBUTION 50.0LA CRAUDIS 50.0LA GUJANNAISE 26.0LAITA BELON DISTRIBUTION 50.0LB LE PLAN 50.0LE CLAUZELS 50.0LE PETIT BAILLY 50.0LES OLIVIERS 50.0LEZIDIS 50.0LUMIMMO 50.0MADIS 50.0MAGODIS 50.0MAISON VIZET FABRE 50.0MALISSOL 50.0MARIDYS 50.0MASSEINE 50.0MAUDIS 50.0MBD 50.0
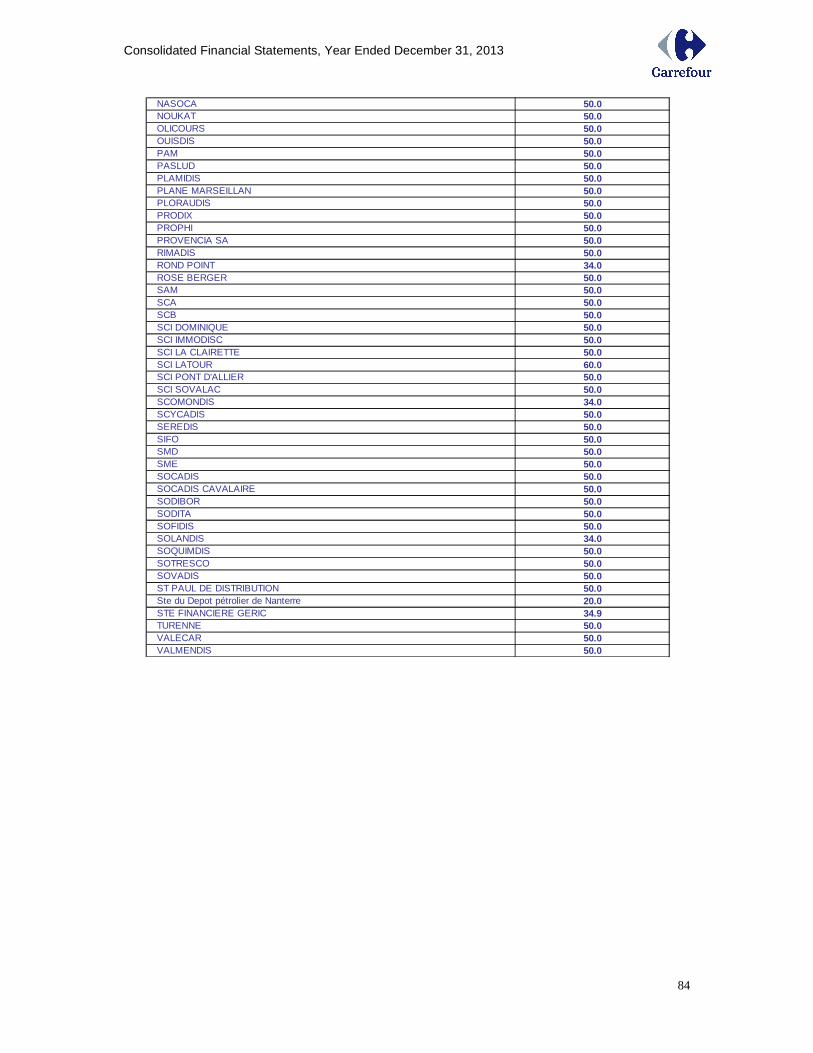
Consolidated Financial Statements, Year Ended December 31, 2013
84
NASOCA 50.0NOUKAT 50.0OLICOURS 50.0OUISDIS 50.0PAM 50.0PASLUD 50.0PLAMIDIS 50.0PLANE MARSEILLAN 50.0PLORAUDIS 50.0PRODIX 50.0PROPHI 50.0PROVENCIA SA 50.0RIMADIS 50.0ROND POINT 34.0ROSE BERGER 50.0SAM 50.0SCA 50.0SCB 50.0SCI DOMINIQUE 50.0SCI IMMODISC 50.0SCI LA CLAIRETTE 50.0SCI LATOUR 60.0SCI PONT D'ALLIER 50.0SCI SOVALAC 50.0SCOMONDIS 34.0SCYCADIS 50.0SEREDIS 50.0SIFO 50.0SMD 50.0SME 50.0SOCADIS 50.0SOCADIS CAVALAIRE 50.0SODIBOR 50.0SODITA 50.0SOFIDIS 50.0SOLANDIS 34.0SOQUIMDIS 50.0SOTRESCO 50.0SOVADIS 50.0ST PAUL DE DISTRIBUTION 50.0Ste du Depot pétrolier de Nanterre 20.0STE FINANCIERE GERIC 34.9TURENNE 50.0VALECAR 50.0VALMENDIS 50.0
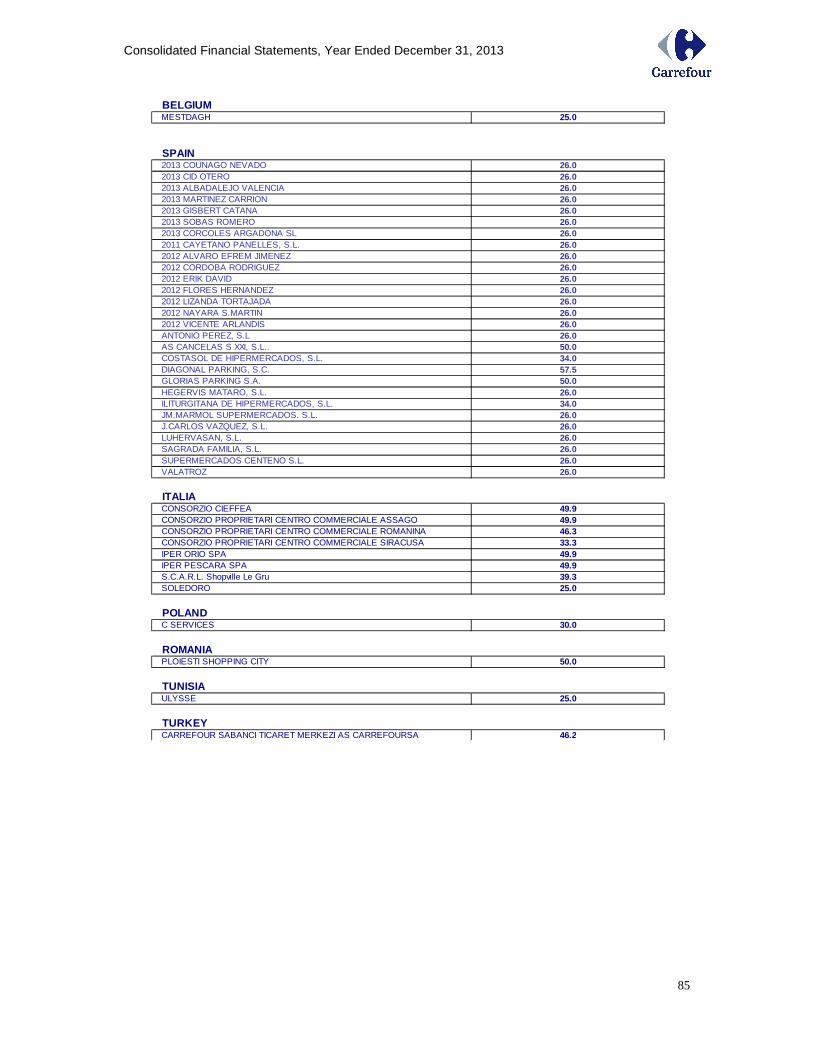
Consolidated Financial Statements, Year Ended December 31, 2013
85
BELGIUMMESTDAGH 25.0
SPAIN2013 COUNAGO NEVADO 26.02013 CID OTERO 26.02013 ALBADALEJO VALENCIA 26.02013 MARTINEZ CARRION 26.02013 GISBERT CATANA 26.02013 SOBAS ROMERO 26.02013 CORCOLES ARGADONA SL 26.02011 CAYETANO PANELLES, S.L. 26.02012 ALVARO EFREM JIMENEZ 26.02012 CORDOBA RODRIGUEZ 26.02012 ERIK DAVID 26.02012 FLORES HERNANDEZ 26.02012 LIZANDA TORTAJADA 26.02012 NAYARA S.MARTIN 26.02012 VICENTE ARLANDIS 26.0ANTONIO PEREZ, S.L 26.0AS CANCELAS S XXI, S.L.. 50.0COSTASOL DE HIPERMERCADOS, S.L. 34.0DIAGONAL PARKING, S.C. 57.5GLORIAS PARKING S.A. 50.0HEGERVIS MATARO, S.L. 26.0ILITURGITANA DE HIPERMERCADOS, S.L. 34.0JM.MARMOL SUPERMERCADOS. S.L. 26.0J.CARLOS VAZQUEZ, S.L. 26.0LUHERVASAN, S.L. 26.0SAGRADA FAMILIA, S.L. 26.0SUPERMERCADOS CENTENO S.L. 26.0VALATROZ 26.0
ITALIACONSORZIO CIEFFEA 49.9CONSORZIO PROPRIETARI CENTRO COMMERCIALE ASSAGO 49.9CONSORZIO PROPRIETARI CENTRO COMMERCIALE ROMANINA 46.3CONSORZIO PROPRIETARI CENTRO COMMERCIALE SIRACUSA 33.3IPER ORIO SPA 49.9IPER PESCARA SPA 49.9S.C.A.R.L. Shopville Le Gru 39.3SOLEDORO 25.0
POLANDC SERVICES 30.0
ROMANIAPLOIESTI SHOPPING CITY 50.0
TUNISIAULYSSE 25.0
TURKEYCARREFOUR SABANCI TICARET MERKEZI AS CARREFOURSA 46.2