2013 crop market outlook
DESCRIPTION
2013 Crop Market Outlook. Coleman Research Group Presentation May 23, 2013 Chad Hart Associate Professor/Crop Markets Specialist [email protected] 515-294-9911. U.S. Corn Supply and Use. Source: USDA-WAOB. U.S. Soybean Supply and Use. Source: USDA-WAOB. U.S. Wheat Supply and Use. - PowerPoint PPT PresentationTRANSCRIPT

Extension and Outreach/Department of Economics
2013 Crop Market Outlook
Coleman Research Group PresentationMay 23, 2013
Chad HartAssociate Professor/Crop Markets Specialist

Extension and Outreach/Department of Economics
U.S. Corn Supply and Use2009 2010 2011 2012 2013
Area Planted (mil. acres) 86.4 88.2 91.9 97.2 97.3
Yield (bu./acre) 164.7 152.8 147.2 123.4 158.0
Production (mil. bu.) 13,092 12,447 12,360 10,780 14,140
Beg. Stocks (mil. bu.) 1,673 1,708 1,128 989 759
Imports (mil. bu.) 8 28 29 125 25
Total Supply (mil. bu.) 14,774 14,182 13,516 11,894 14,924
Feed & Residual (mil. bu.) 5,125 4,795 4,545 4,400 5,325
Ethanol (mil. bu.) 4,591 5,019 5,011 4,600 4,850
Food, Seed, & Other (mil. bu.) 1,370 1,407 1,428 1,385 1,445
Exports (mil. bu.) 1,980 1,834 1,543 750 1,300
Total Use (mil. bu.) 13,066 13,055 12,527 11,135 12,920
Ending Stocks (mil. bu.) 1,708 1,128 989 759 2,004
Season-Average Price ($/bu.) 3.55 5.18 6.22 6.90 4.70
Source: USDA-WAOB

Extension and Outreach/Department of Economics
U.S. Soybean Supply and Use2009 2010 2011 2012 2013
Area Planted (mil. acres) 77.5 77.4 75.0 77.2 77.1
Yield (bu./acre) 44.0 43.5 41.9 39.6 44.5
Production (mil. bu.) 3,359 3,329 3,094 3,015 3,390
Beg. Stocks (mil. bu.) 138 151 215 169 125
Imports (mil. bu.) 15 14 16 20 15
Total Supply (mil. bu.) 3,512 3,495 3,325 3,204 3,530
Crush (mil. bu.) 1,752 1,648 1,703 1,635 1,695
Seed & Residual (mil. bu.) 110 130 90 95 120
Exports (mil. bu.) 1,499 1,501 1,362 1,350 1,450
Total Use (mil. bu.) 3,361 3,280 3,155 3,080 3,264
Ending Stocks (mil. bu.) 151 215 169 125 265
Season-Average Price ($/bu.) 9.59 11.30 12.50 14.30 10.50
Source: USDA-WAOB

Extension and Outreach/Department of Economics
U.S. Wheat Supply and Use2009 2010 2011 2012 2013
Area Planted (mil. acres) 59.2 53.6 54.4 55.7 56.4
Yield (bu./acre) 44.5 46.3 43.7 46.3 44.1
Production (mil. bu.) 2,218 2,207 1,999 2,269 2,057
Beg. Stocks (mil. bu.) 657 976 862 743 731
Imports (mil. bu.) 119 97 112 125 130
Total Supply (mil. bu.) 2,993 3,279 2,974 3,137 2,917
Food (mil. bu.) 919 926 941 945 958
Seed (mil. bu.) 69 71 76 76 74
Feed & Residual (mil. bu.) 150 132 164 360 290
Exports (mil. bu.) 879 1,289 1,050 1,025 925
Total Use (mil. bu.) 2,018 2,417 2,231 2,406 2,247
Ending Stocks (mil. bu.) 976 862 743 731 670
Season-Average Price ($/bu.) 4.87 5.70 7.24 7.80 6.80
Source: USDA-WAOB

Extension and Outreach/Department of Economics
Corn Planting Stats
Source: USDA-NASS

Extension and Outreach/Department of Economics
Corn Yields
80
90
100
110
120
130
140
150
160
170
Yie
ld (
bu
/acr
e)
Actual 20-yr Trend
Year with slow planting progress, like this year

Extension and Outreach/Department of Economics
Soybean Planting Stats
Source: USDA-NASS

Extension and Outreach/Department of Economics
Soybean YieldsYear with slow planting progress, like this year

Extension and Outreach/Department of Economics

Extension and Outreach/Department of Economics
Extension and Outreach/Department of Economics
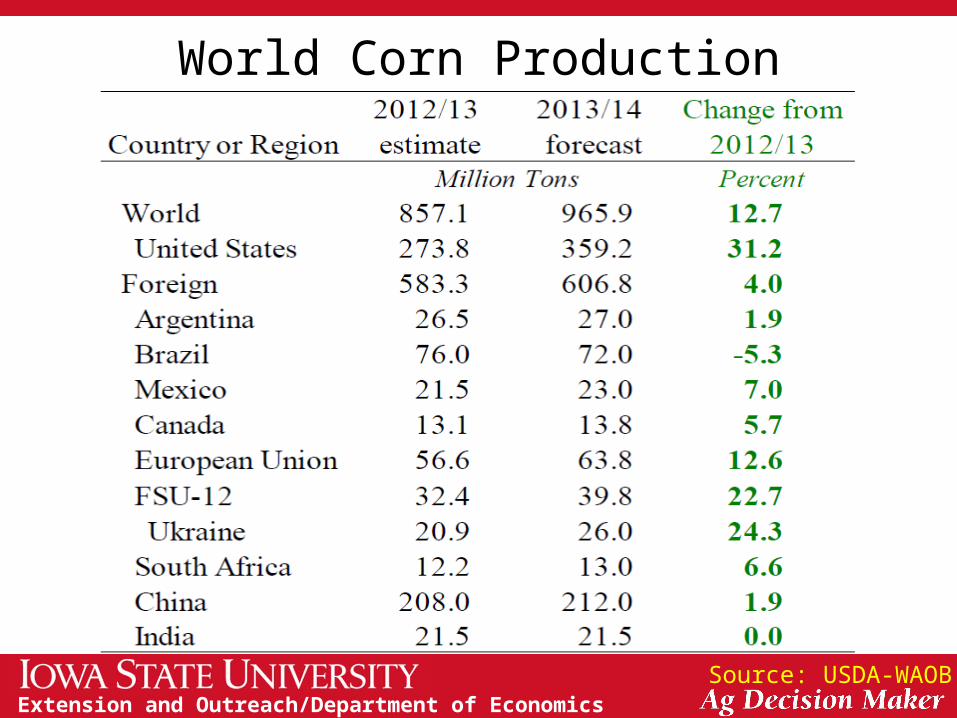
World Corn Production
Source: USDA-WAOB

Extension and Outreach/Department of Economics
World Soybean Production
Source: USDA-WAOB

Extension and Outreach/Department of Economics
World Wheat Production
Source: USDA-WAOB

Extension and Outreach/Department of Economics
Hog Crush Margin
Source: ISU Extension
The Crush Margin is the return after the pig, corn and soybean meal costs.Carcass weight: 200 pounds Pig price: 50% of 5 mth out lean hog futuresCorn: 10 bushels per pig Soybean meal: 150 pounds per pig

Extension and Outreach/Department of Economics
Cattle Crush Margin
Source: ISU Extension
The Crush Margin is the return after the feeder steer and corn costs.Live weight: 1250 pounds Feeder weight: 750 pounds Corn: 50 bushels per head

Extension and Outreach/Department of Economics
U.S. Meat Production & Prices
Source: USDA-WAOB

Extension and Outreach/Department of Economics
Corn Export Shifts
Source: USDA-FAS

Extension and Outreach/Department of Economics
Soy Export Shifts
Source: USDA-FAS

Extension and Outreach/Department of Economics
Wheat Export Shifts
Source: USDA-FAS

Extension and Outreach/Department of Economics
Corn Grind for Ethanol

Extension and Outreach/Department of Economics
Ethanol Stocks

Extension and Outreach/Department of EconomicsSource: DOE-EIA, Annual Energy Outlook

Extension and Outreach/Department of Economics
Current Corn Futures
Source: CME Group, 5/22/2013
5.00 5.06

Extension and Outreach/Department of Economics
Current Soybean Futures
Source: CME Group, 5/22/2013
11.79 11.69

Extension and Outreach/Department of Economics
Current Wheat Futures
Source: KCBOT, 5/22/2013
6.93

Extension and Outreach/Department of Economics

Extension and Outreach/Department of Economics
3 Month Outlook - Temps

Extension and Outreach/Department of Economics
3 Month Outlook - Precip
Extension and Outreach/Department of Economics
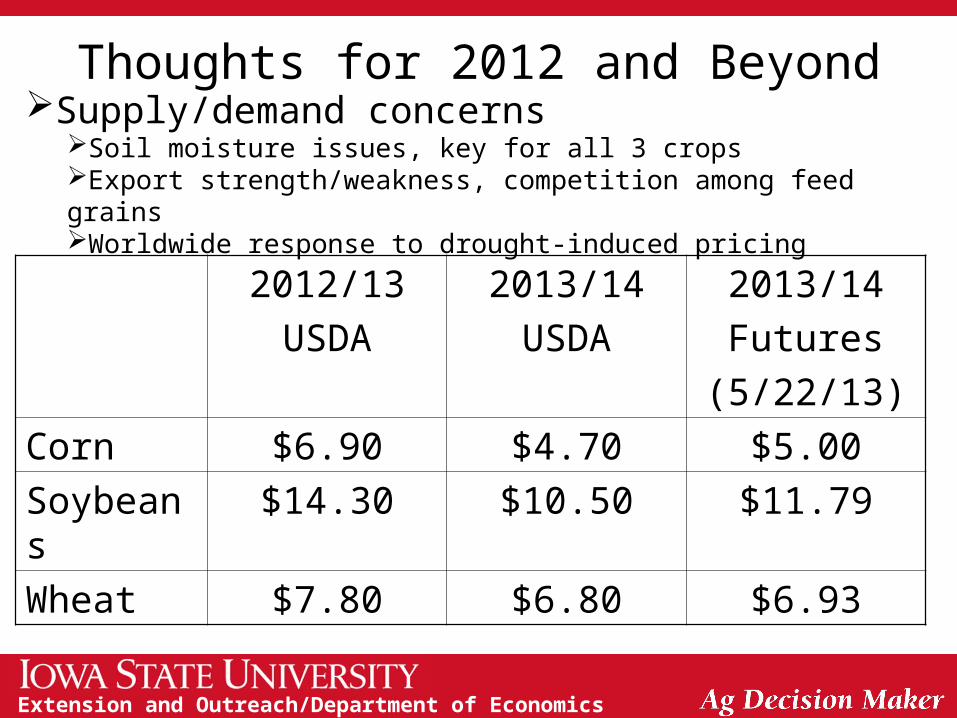
Thoughts for 2012 and BeyondSupply/demand concerns
Soil moisture issues, key for all 3 cropsExport strength/weakness, competition among feed grainsWorldwide response to drought-induced pricing
2012/13
USDA
2013/14
USDA
2013/14
Futures
(5/22/13)
Corn $6.90 $4.70 $5.00
Soybeans $14.30 $10.50 $11.79
Wheat $7.80 $6.80 $6.93

Extension and Outreach/Department of Economics
Thank you for your time!
Any questions?
My web site:http://www.econ.iastate.edu/~chart/
Iowa Farm Outlook:http://www.econ.iastate.edu/ifo/
Ag Decision Maker:http://www.extension.iastate.edu/agdm/