2013 enmax corporate responsibility gri … · and in consideration of the gri electric utility...
TRANSCRIPT

2013 Corporate Responsibility Report 1
This report was prepared in alignment with the Global Reporting Initiative (GRI) Third Generation (G3) Guidelines and in consideration of the GRI Electric Utility Sector Supplement, and discloses data from January through December 2013. The GRI is the world’s most widely used sustainability reporting framework and guides corporate disclosure of environmental, social and governance performance. In this, our seventh annual Corporate Responsibility (CR) Report, we are reporting to the GRI at an ‘A’ Application Level. This means we are reporting on each of the Core GRI Indicators of our CR performance, as well as each of the performance indicators referenced in the Electric Utility Sector Supplement (EUSS) where data is available. This GRI report should be read in conjunction with the accompanying notes which follow, and the information presented throughout our Corporate Responsibility webpages. We have included a three-year summary of the quantitative data where possible and continue to progress upon this in future reports.
A team of subject matter experts from various areas across our organization made every effort to ensure the data is accurate and complete throughout this report. The data and calculations provided are sourced from various data storage systems and applications. In some instances, estimations may be drawn based on best available information and records at the time of writing. All financial data is presented in Canadian dollars unless otherwise stated and numerical data is presented using the metric system. Specific portions of this report were reviewed by the Safety, Environment and Sustainability Committee of ENMAX’s Board of Directors. The full GRI Report was reviewed and approved by ENMAX’s Executive Corporate Responsibility Committee. Please email any comments on our CR Program and GRI report to [email protected].
STANDARD DISCLOSURES: PROFILE
Strategy and Analysis
1.1 Statement from the most senior decision-maker of the organization
Message from the President & CEO
1.2 Description of key impacts, risks and opportunities Strategy & Objectives CR Objectives Materiality 2013 Financial Report
Organizational Profile
2.1 Name of the Organization ENMAX Corporation
2.2 Primary brands, products and/or services ENMAX Group of Companies
2.3 Operational Structure of the organization ENMAX Group of Companies
2.4 Location of organization’s headquarters Calgary, Alberta
2.5 Number of countries where organization operates One – Canada
2.6 Nature of ownership and legal form ENMAX Corporation is wholly owned by The City of Calgary
2.7 Markets served Alberta
2.8 Scale of the reporting organization Economic; Employees; Infographic
2.9 Significant changes during the reporting period regarding size, structure or ownership
In April 2013 we entered into an agreement for the sale of a subsidiary, Envision, for $221.9 million net of adjustments. The sale transaction closed on April 30, 2013 and resulted in net gain of $175.9 million.
2.10 Awards received during the reporting period (Note 1)
EU1 Installed capacity by source and regime (Note 2)
EU2 Net energy output by source and regime (Note 3)
2013 ENMAX CORPORATE RESPONSIBILITY GRI REPORT
2
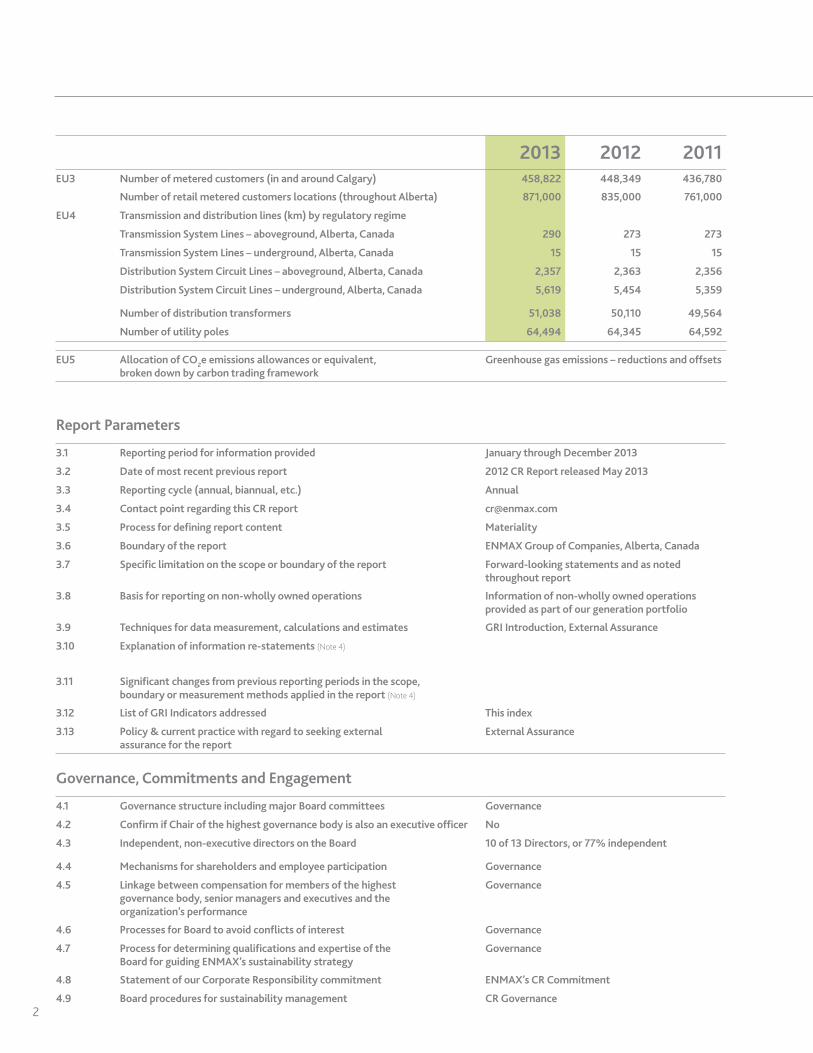
2013 2012 2011EU3 Number of metered customers (in and around Calgary) 458,822 448,349 436,780
Number of retail metered customers locations (throughout Alberta) 871,000 835,000 761,000
EU4 Transmission and distribution lines (km) by regulatory regime
Transmission System Lines – aboveground, Alberta, Canada 290 273 273
Transmission System Lines – underground, Alberta, Canada 15 15 15
Distribution System Circuit Lines – aboveground, Alberta, Canada 2,357 2,363 2,356
Distribution System Circuit Lines – underground, Alberta, Canada 5,619 5,454 5,359
Number of distribution transformers 51,038 50,110 49,564
Number of utility poles 64,494 64,345 64,592
EU5 Allocation of CO2e emissions allowances or equivalent, broken down by carbon trading framework
Greenhouse gas emissions – reductions and offsets
Report Parameters
3.1 Reporting period for information provided January through December 2013
3.2 Date of most recent previous report 2012 CR Report released May 2013
3.3 Reporting cycle (annual, biannual, etc.) Annual
3.4 Contact point regarding this CR report [email protected]
3.5 Process for defining report content Materiality
3.6 Boundary of the report ENMAX Group of Companies, Alberta, Canada
3.7 Specific limitation on the scope or boundary of the report Forward-looking statements and as noted throughout report
3.8 Basis for reporting on non-wholly owned operations Information of non-wholly owned operations provided as part of our generation portfolio
3.9 Techniques for data measurement, calculations and estimates GRI Introduction, External Assurance
3.10 Explanation of information re-statements (Note 4)
3.11 Significant changes from previous reporting periods in the scope, boundary or measurement methods applied in the report (Note 4)
3.12 List of GRI Indicators addressed This index
3.13 Policy & current practice with regard to seeking external assurance for the report
External Assurance
Governance, Commitments and Engagement
4.1 Governance structure including major Board committees Governance
4.2 Confirm if Chair of the highest governance body is also an executive officer No
4.3 Independent, non-executive directors on the Board 10 of 13 Directors, or 77% independent
4.4 Mechanisms for shareholders and employee participation Governance
4.5 Linkage between compensation for members of the highest governance body, senior managers and executives and the organization’s performance
Governance
4.6 Processes for Board to avoid conflicts of interest Governance
4.7 Process for determining qualifications and expertise of the Board for guiding ENMAX’s sustainability strategy
Governance
4.8 Statement of our Corporate Responsibility commitment ENMAX’s CR Commitment
4.9 Board procedures for sustainability management CR Governance
2013 Corporate Responsibility Report 3
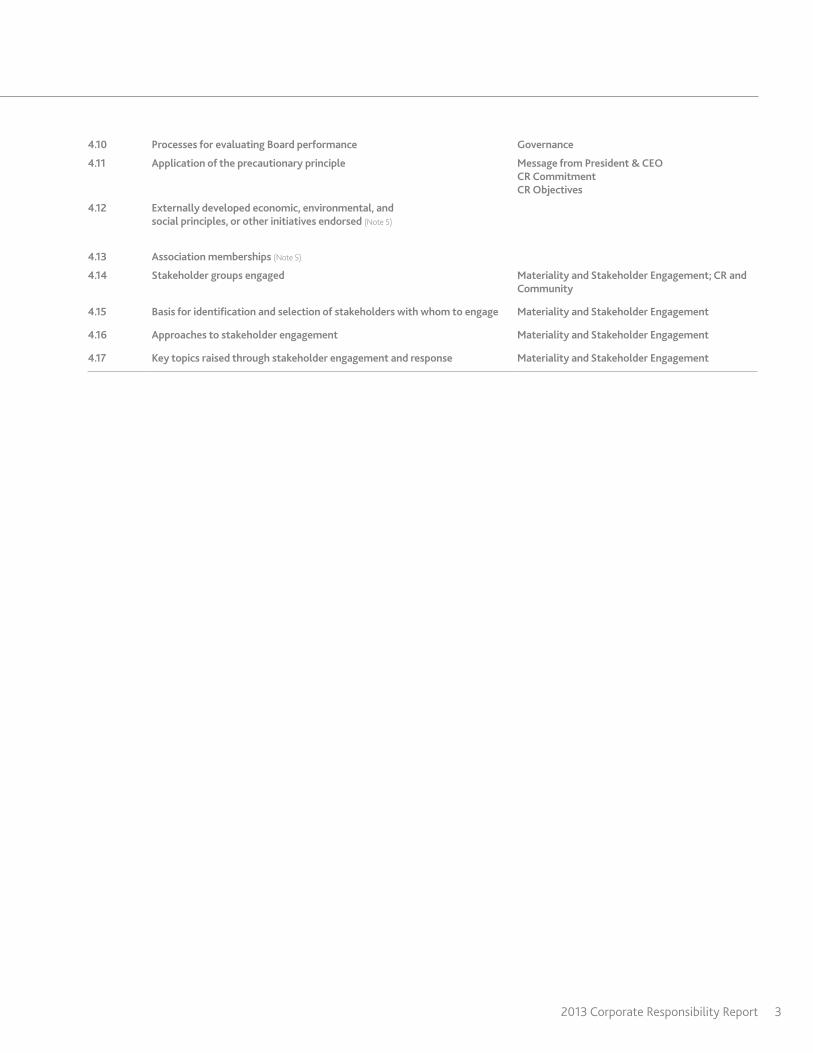
4.10 Processes for evaluating Board performance Governance
4.11 Application of the precautionary principle Message from President & CEO CR Commitment CR Objectives
4.12 Externally developed economic, environmental, and social principles, or other initiatives endorsed (Note 5)
4.13 Association memberships (Note 5)
4.14 Stakeholder groups engaged Materiality and Stakeholder Engagement; CR and Community
4.15 Basis for identification and selection of stakeholders with whom to engage Materiality and Stakeholder Engagement
4.16 Approaches to stakeholder engagement Materiality and Stakeholder Engagement
4.17 Key topics raised through stakeholder engagement and response Materiality and Stakeholder Engagement

4
STANDARD DISCLOSURES: PERFORMANCE INDICATORS
EconomicManagement approach (Note 6)
2013 2012 2011EC1 Direct economic value generated and distributed
Revenue (millions of dollars) 3,364.1 3,160.1 3,109.1
OM&A costs 255.9 241.3 223.2
Costs of service 2,991.5 2,731.5 2,694.9
Capital investment 502.3 647.2 606.3
Employee compensation 223.9 205.2 197.0
Community investment (Note 6) 3.7 3.3 2.8
Net earnings 352.5 225.0 184.6
Dividend payment to The City of Calgary 67.5 56.0 55.6
EC2 Financial implications and other risks and opportunities for the organization’s activities due to climate change
2013 Financial Report
EC3 Coverage of the organization’s defined benefit plan obligations 2013 Financial Report
EC4 Significant financial assistance received from government 2013 Financial Report
EC6 Policy, practices and proportion of spending on locally based suppliers at signification locations of operation (Note 7)
EC7 Procedures for local hiring and proportion of senior management hired from the local community (Note 8)
EC8 Infrastructure investments Community
EU6 Management approach electricity availability and reliability (Note 9) Customer CR Objective: Customer
EU7 Demand side management programs (Note 10)
EU8 Research and development activity and expenditure on providing reliable electricity and sustainable development (Note 11)
Community; 2013 Financial Report
EU9 Provisions for decommissioning of nuclear power sites Not applicable
EU10 Planned capacity against projected electricity demand (Note 12)
EU11 Average generation efficiency of thermal plants by energy source and regulatory regime
Information not available
2013 2012 2011EU12 Transmission losses as a percentage of total energy (Note 13) 0.72 0.79 0.8
Distribution losses as a percentage of total energy 2.58* 2.52 2.7
*based load settlement data as of February 18, 2014

2013 Corporate Responsibility Report 5
Environment
Management approach (Note 14)
2013 2012 2011EN1 Materials used (tonnes)
Copper Wire 876 1,449 1,246
Aluminum 437 381 291
Steel 80 68 15
Transformers 551 580 490
Wood Poles 552 721 906
Total 2,496 3198 2,948
PCB – In use high level (tonnes) 0.0 0.0 0.0
PCB – In use low level (tonnes) 0.0 0.0 0.0
Mineral Oil (litres) 269,938 277,014 236,189
EN2 Percentage of materials used that are recycled input materials
Mineral Oil 45,737 64,018 63,388
Paper purchased with 50% recycled content (sheets) as managed by Facilities
6,340,751 6,803,524 6,285,596
EN3 Direct energy consumption, owned generation (GWh)
Calgary Energy Centre – natural gas 33.83 37.07 33.27
Crossfield Energy Centre – natural gas 7.28 7.46 6.92
McBride – wind 1.34 1.53 1.43
Taber – wind 0.19 0.16 0.08
Kettles Hill – wind 1.03 1.04 1.10
Corporate Facilities – natural gas (GJ) (Note 15) 52,631 55,322 55,683
EN4 Indirect energy consumption (corporate) by primary source (Note 15)
Electricity (kWh) 11,312,690 11,918,906 12,076,060
EN6 Initiatives to provide energy-efficient or renewable energy-based services (Note 16)
2013 2012 2011EN8 Total water withdrawals by source (m3) (Note 17)
Calgary Energy Centre 1,015,440 1,029,304 1,101,042
Crossfield Energy Centre 9,521 5,544 8,872
Corporate Facilities, Calgary 44,318 37,796 20,785
EN11 Locations in, or adjacent to, high biodiversity areas (Note 18)
EN12 Description of significant impacts on biodiversity (Note 18) Flood Clean Up at Fish Creek Park
6
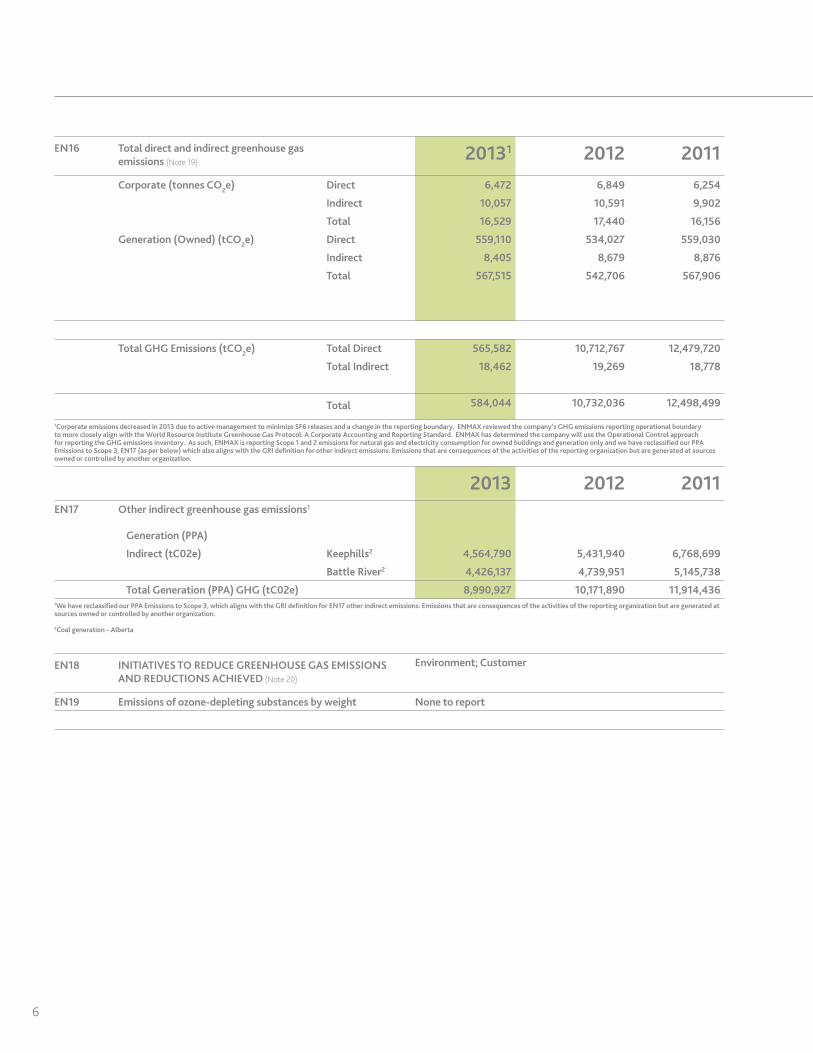
EN16 Total direct and indirect greenhouse gas emissions (Note 19)
20131 2012 2011Corporate (tonnes CO2e) Direct 6,472 6,849 6,254
Indirect 10,057 10,591 9,902
Total 16,529 17,440 16,156
Generation (Owned) (tCO2e) Direct 559,110 534,027 559,030
Indirect 8,405 8,679 8,876
Total 567,515 542,706 567,906
Total GHG Emissions (tCO2e) Total Direct 565,582 10,712,767 12,479,720
Total Indirect 18,462 19,269 18,778
Total 584,044 10,732,036 12,498,499
1Corporate emissions decreased in 2013 due to active management to minimize SF6 releases and a change in the reporting boundary. ENMAX reviewed the company’s GHG emissions reporting operational boundary to more closely align with the World Resource Institute Greenhouse Gas Protocol: A Corporate Accounting and Reporting Standard. ENMAX has determined the company will use the Operational Control approach for reporting the GHG emissions inventory. As such, ENMAX is reporting Scope 1 and 2 emissions for natural gas and electricity consumption for owned buildings and generation only and we have reclassified our PPA Emissions to Scope 3, EN17 (as per below) which also aligns with the GRI definition for other indirect emissions: Emissions that are consequences of the activities of the reporting organization but are generated at sources owned or controlled by another organization.
2013 2012 2011EN17 Other indirect greenhouse gas emissions1
Generation (PPA)
Indirect (tC02e) Keephills2 4,564,790 5,431,940 6,768,699
Battle River2 4,426,137 4,739,951 5,145,738
Total Generation (PPA) GHG (tC02e) 8,990,927 10,171,890 11,914,4361We have reclassified our PPA Emissions to Scope 3, which aligns with the GRI definition for EN17 other indirect emissions: Emissions that are consequences of the activities of the reporting organization but are generated at sources owned or controlled by another organization.
2Coal generation – Alberta
EN18 INITIATIVES TO REDUCE GREENHOUSE GAS EMISSIONS AND REDUCTIONS ACHIEVED (Note 20)
Environment; Customer
EN19 Emissions of ozone-depleting substances by weight None to report

2013 Corporate Responsibility Report 7
2013 2012 2011EN20 NOx air emissions (tonnes) (Note 21)
Calgary Energy Centre 74.9 61.5 69.9
Crossfield Energy Centre 68.7 46.4 55.9
EN21 Total water discharge by quality and destination (m3) (Note 17)
Calgary Energy Centre 235,365 133,746 239,838
Crossfield Energy Centre 259 456 762
EN22 Total weight of waste by type and disposal method (ENMAX Power Corp waste only)
Total Recycled Solids (tonnes) 732.8 562 1,569.1
Total Recycled Contaminated Solids (tonnes) 24.8 136.6 58
Solid Waste to Landfill (tonnes) 1,418 3,416.6 14,825
Solid Waste Incinerated (tonnes) 0.0 0.66 0.2
Liquid Waste Incinerated (litres) 0.41 0.21 0.21
Total Recycled Liquid Waste (tonnes) 160.7 192.04 192.04
EN23 Total number and volume of significant spills (Note 22)
Total number of significant spills 16 15 13
Total volume (litres) 2,569 2,612 3,520
EN26 Initiatives to mitigate environmental impacts of products and services
CR Objective: Emissions, Environment, Customer
EN27 Percentage of products sold and their packaging materials that were reclaimed by category
Information currently not measured
2013 2012 2011EN28 Non-compliance with environmental laws and regulations (Note
23)
Monetary value of significant fines ($) 0 0 0
Total number non-monetary sanctions for non-compliance 0 0 0
EN30 Total environmental protection expenditures and investments by type ($ million) (Note 23)
2.51 1.41 2.61
1Expenditures exclude GHG compliance costs
EU13 Biodiversity of offset habitats compared to the biodiversity of the affected areas
Information currently not measured
8
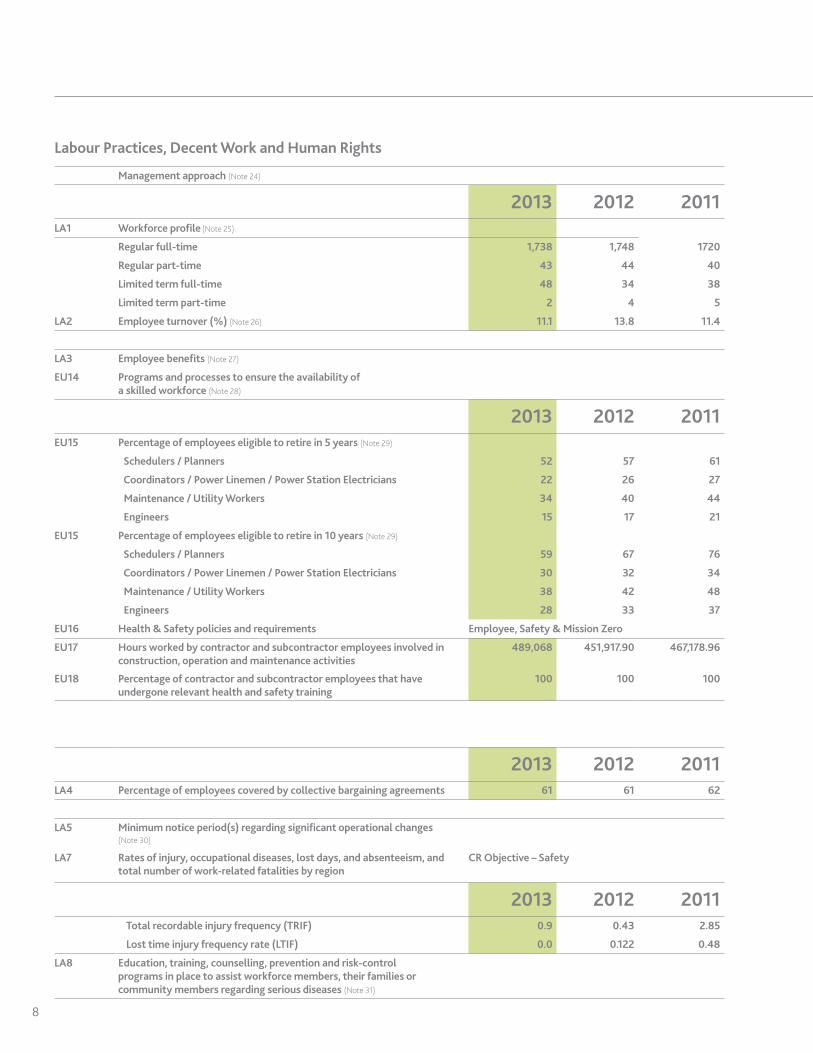
Labour Practices, Decent Work and Human Rights
Management approach (Note 24)
2013 2012 2011LA1 Workforce profile (Note 25)
Regular full-time 1,738 1,748 1720
Regular part-time 43 44 40
Limited term full-time 48 34 38
Limited term part-time 2 4 5
LA2 Employee turnover (%) (Note 26) 11.1 13.8 11.4
LA3 Employee benefits (Note 27)
EU14 Programs and processes to ensure the availability of a skilled workforce (Note 28)
2013 2012 2011EU15 Percentage of employees eligible to retire in 5 years (Note 29)
Schedulers / Planners 52 57 61
Coordinators / Power Linemen / Power Station Electricians 22 26 27
Maintenance / Utility Workers 34 40 44
Engineers 15 17 21
EU15 Percentage of employees eligible to retire in 10 years (Note 29)
Schedulers / Planners 59 67 76
Coordinators / Power Linemen / Power Station Electricians 30 32 34
Maintenance / Utility Workers 38 42 48
Engineers 28 33 37
EU16 Health & Safety policies and requirements Employee, Safety & Mission Zero
EU17 Hours worked by contractor and subcontractor employees involved in construction, operation and maintenance activities
489,068 451,917.90 467,178.96
EU18 Percentage of contractor and subcontractor employees that have undergone relevant health and safety training
100 100 100
2013 2012 2011LA4 Percentage of employees covered by collective bargaining agreements 61 61 62
LA5 Minimum notice period(s) regarding significant operational changes (Note 30)
LA7 Rates of injury, occupational diseases, lost days, and absenteeism, and total number of work-related fatalities by region
CR Objective – Safety
2013 2012 2011Total recordable injury frequency (TRIF) 0.9 0.43 2.85
Lost time injury frequency rate (LTIF) 0.0 0.122 0.48
LA8 Education, training, counselling, prevention and risk-control programs in place to assist workforce members, their families or community members regarding serious diseases (Note 31)
2013 Corporate Responsibility Report 9
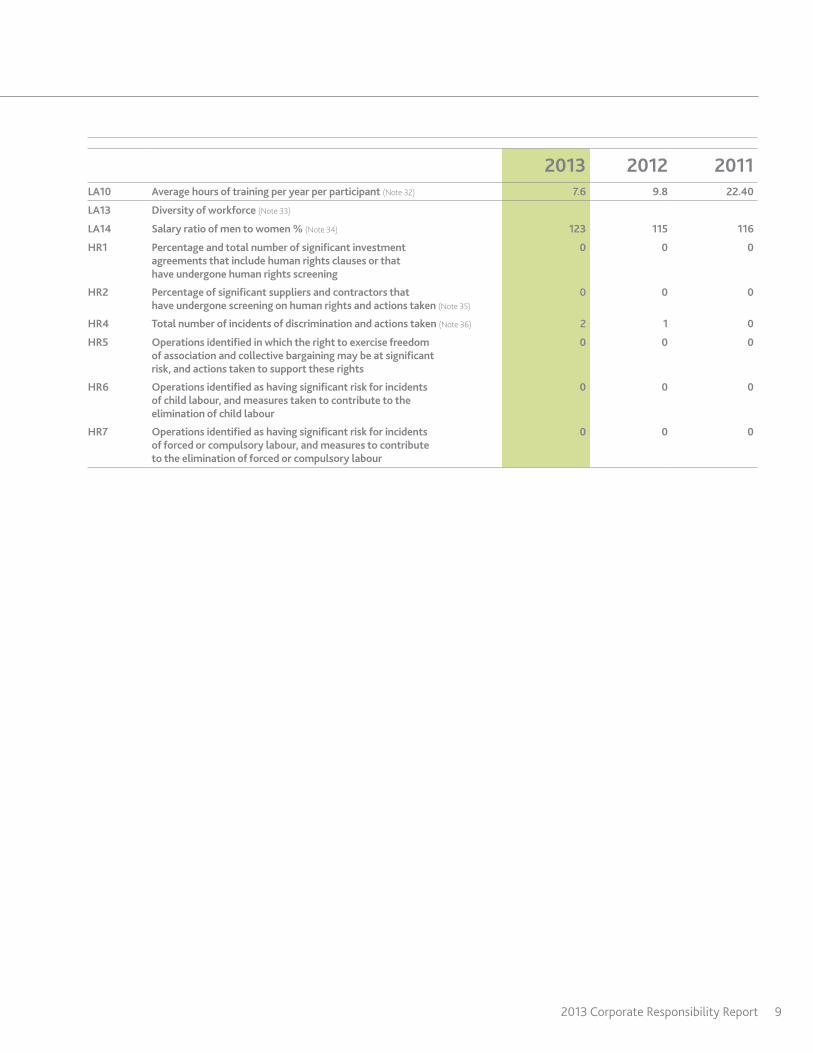
2013 2012 2011LA10 Average hours of training per year per participant (Note 32) 7.6 9.8 22.40
LA13 Diversity of workforce (Note 33)
LA14 Salary ratio of men to women % (Note 34) 123 115 116
HR1 Percentage and total number of significant investment agreements that include human rights clauses or that have undergone human rights screening
0 0 0
HR2 Percentage of significant suppliers and contractors that have undergone screening on human rights and actions taken (Note 35)
0 0 0
HR4 Total number of incidents of discrimination and actions taken (Note 36) 2 1 0
HR5 Operations identified in which the right to exercise freedom of association and collective bargaining may be at significant risk, and actions taken to support these rights
0 0 0
HR6 Operations identified as having significant risk for incidents of child labour, and measures taken to contribute to the elimination of child labour
0 0 0
HR7 Operations identified as having significant risk for incidents of forced or compulsory labour, and measures to contribute to the elimination of forced or compulsory labour
0 0 0
10
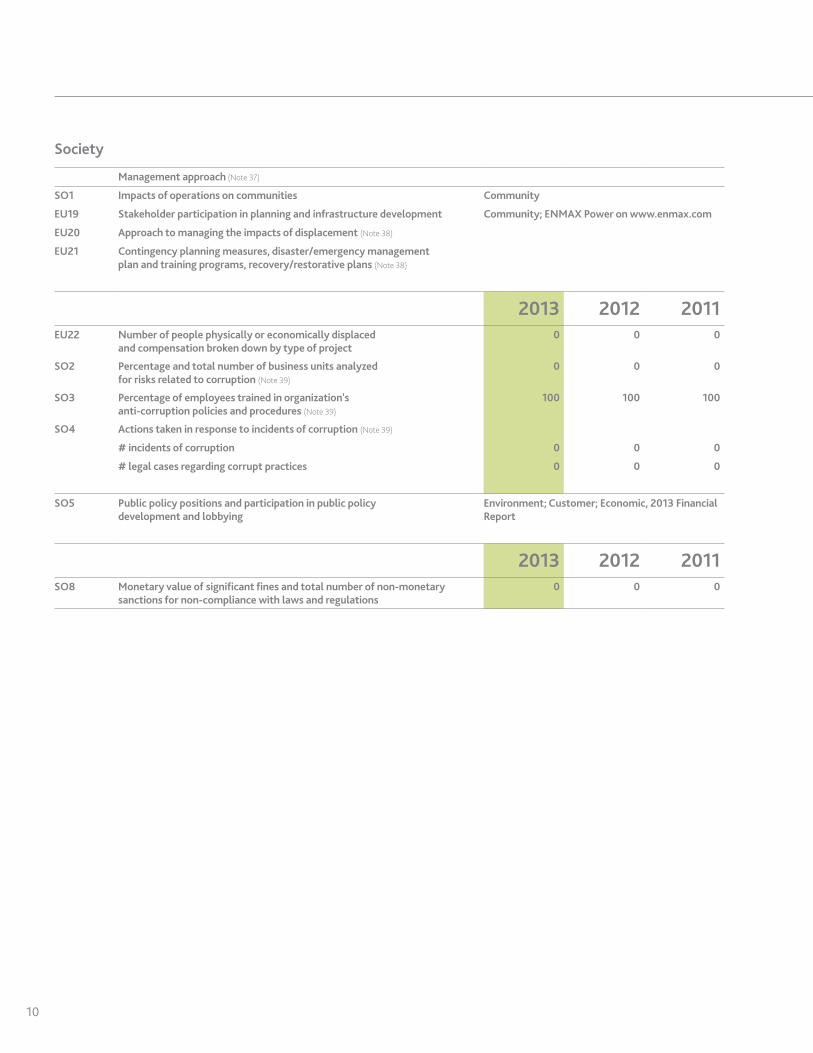
Society
Management approach (Note 37)
SO1 Impacts of operations on communities Community
EU19 Stakeholder participation in planning and infrastructure development Community; ENMAX Power on www.enmax.com
EU20 Approach to managing the impacts of displacement (Note 38)
EU21 Contingency planning measures, disaster/emergency management plan and training programs, recovery/restorative plans (Note 38)
2013 2012 2011EU22 Number of people physically or economically displaced
and compensation broken down by type of project0 0 0
SO2 Percentage and total number of business units analyzed for risks related to corruption (Note 39)
0 0 0
SO3 Percentage of employees trained in organization's anti-corruption policies and procedures (Note 39)
100 100 100
SO4 Actions taken in response to incidents of corruption (Note 39)
# incidents of corruption 0 0 0
# legal cases regarding corrupt practices 0 0 0
SO5 Public policy positions and participation in public policy development and lobbying
Environment; Customer; Economic, 2013 Financial Report
2013 2012 2011SO8 Monetary value of significant fines and total number of non-monetary
sanctions for non-compliance with laws and regulations0 0 0
2013 Corporate Responsibility Report 11
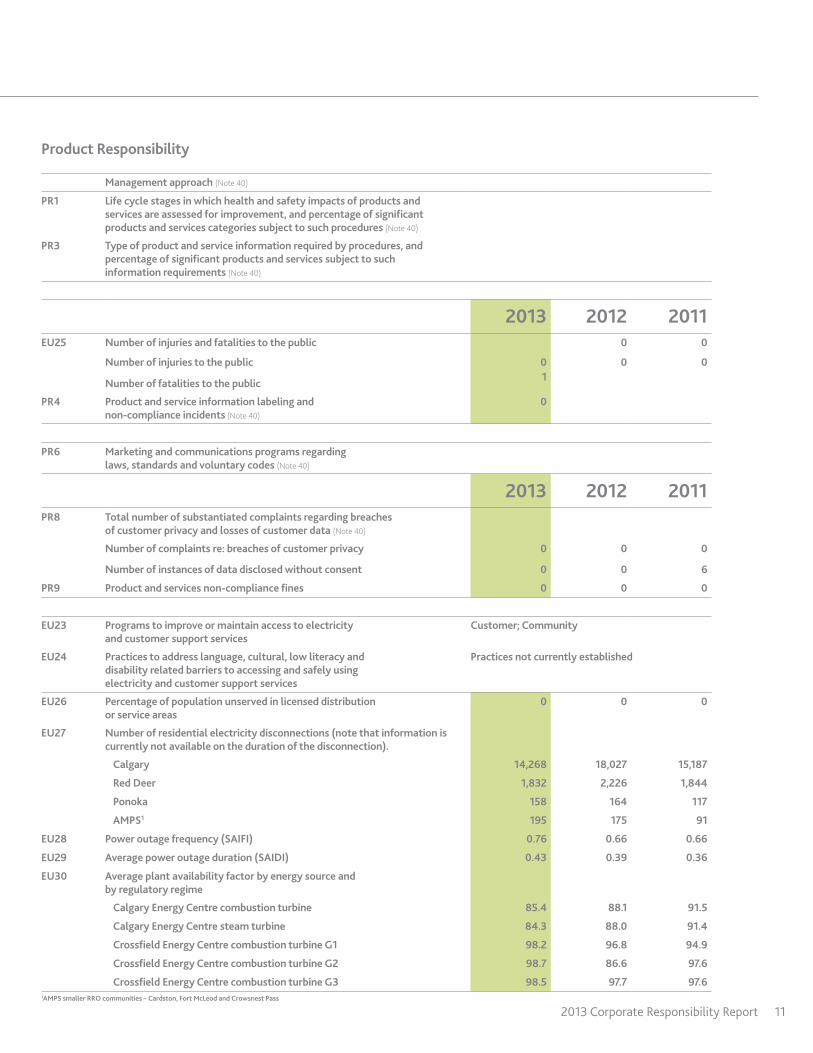
Product Responsibility
Management approach (Note 40)
PR1 Life cycle stages in which health and safety impacts of products and services are assessed for improvement, and percentage of significant products and services categories subject to such procedures (Note 40)
PR3 Type of product and service information required by procedures, and percentage of significant products and services subject to such information requirements (Note 40)
2013 2012 2011EU25 Number of injuries and fatalities to the public 0 0
Number of injuries to the public
Number of fatalities to the public
01
0 0
PR4 Product and service information labeling and non-compliance incidents (Note 40)
0
PR6 Marketing and communications programs regarding laws, standards and voluntary codes (Note 40)
2013 2012 2011PR8 Total number of substantiated complaints regarding breaches
of customer privacy and losses of customer data (Note 40)
Number of complaints re: breaches of customer privacy 0 0 0
Number of instances of data disclosed without consent 0 0 6
PR9 Product and services non-compliance fines 0 0 0
EU23 Programs to improve or maintain access to electricity and customer support services
Customer; Community
EU24 Practices to address language, cultural, low literacy and disability related barriers to accessing and safely using electricity and customer support services
Practices not currently established
EU26 Percentage of population unserved in licensed distribution or service areas
0 0 0
EU27 Number of residential electricity disconnections (note that information is currently not available on the duration of the disconnection).
Calgary 14,268 18,027 15,187
Red Deer 1,832 2,226 1,844
Ponoka 158 164 117
AMPS1 195 175 91
EU28 Power outage frequency (SAIFI) 0.76 0.66 0.66
EU29 Average power outage duration (SAIDI) 0.43 0.39 0.36
EU30 Average plant availability factor by energy source and by regulatory regime
Calgary Energy Centre combustion turbine 85.4 88.1 91.5
Calgary Energy Centre steam turbine 84.3 88.0 91.4
Crossfield Energy Centre combustion turbine G1 98.2 96.8 94.9
Crossfield Energy Centre combustion turbine G2 98.7 86.6 97.6
Crossfield Energy Centre combustion turbine G3 98.5 97.7 97.61AMPS smaller RRO communities – Cardston, Fort McLeod and Crowsnest Pass
12
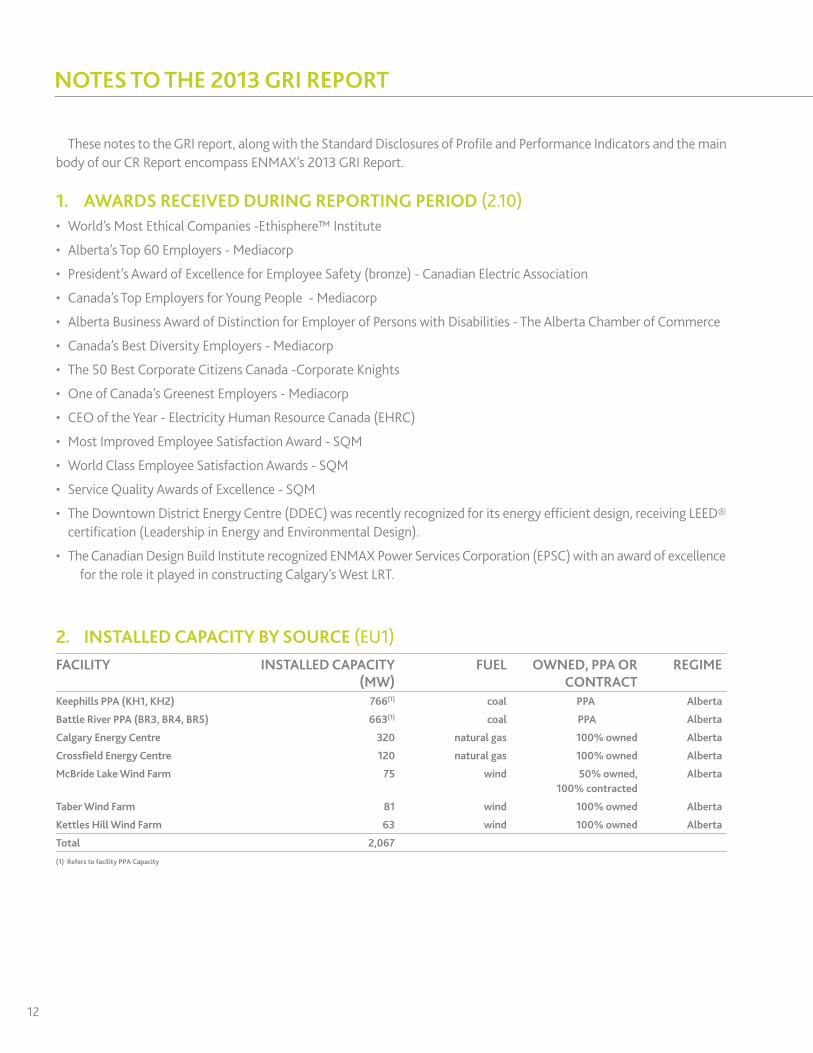
These notes to the GRI report, along with the Standard Disclosures of Profile and Performance Indicators and the main body of our CR Report encompass ENMAX’s 2013 GRI Report.
1. AWARDS RECEIVED DURING REPORTING PERIOD (2.10)• World’sMostEthicalCompanies-Ethisphere™Institute
• Alberta’sTop60Employers-Mediacorp
• President’sAwardofExcellenceforEmployeeSafety(bronze)-CanadianElectricAssociation
• Canada’sTopEmployersforYoungPeople-Mediacorp
• AlbertaBusinessAwardofDistinctionforEmployerofPersonswithDisabilities-TheAlbertaChamberofCommerce
• Canada’sBestDiversityEmployers-Mediacorp
• The50BestCorporateCitizensCanada-CorporateKnights
• OneofCanada’sGreenestEmployers-Mediacorp
• CEOoftheYear-ElectricityHumanResourceCanada(EHRC)
• MostImprovedEmployeeSatisfactionAward-SQM
• WorldClassEmployeeSatisfactionAwards-SQM
• ServiceQualityAwardsofExcellence-SQM
• TheDowntownDistrictEnergyCentre(DDEC)wasrecentlyrecognizedforitsenergyefficientdesign,receivingLEED®certification (Leadership in Energy and Environmental Design).
• The Canadian Design Build Institute recognized ENMAX Power Services Corporation (EPSC) with an award of excellence for the role it played in constructing Calgary’s West LRT.
2. INSTALLED CAPACITY BY SOURCE (EU1)FACILITY INSTALLED CAPACITY
(MW)FUEL OWNED, PPA OR
CONTRACTREGIME
Keephills PPA (KH1, KH2) 766(1) coal PPA Alberta
Battle River PPA (BR3, BR4, BR5) 663(1) coal PPA Alberta
Calgary Energy Centre 320 natural gas 100% owned Alberta
Crossfield Energy Centre 120 natural gas 100% owned Alberta
McBride Lake Wind Farm 75 wind 50% owned, 100% contracted
Alberta
Taber Wind Farm 81 wind 100% owned Alberta
Kettles Hill Wind Farm 63 wind 100% owned Alberta
Total 2,067
(1) Refers to facility PPA Capacity
NOTES TO THE 2013 GRI REPORT

2013 Corporate Responsibility Report 13
3. NET ENERGY OUTPUT BY SOURCE (EU2)NET ENERGY PRODUCTION/ OUTPUT (MWH)
2013 2012 2011
Keephills 4,302,194 5,254,694 6,075,844
Battle River 4,257,111 4,604,515 5,080,380
Calgary Energy Centre 1,000,529 1,115,128 1,071,956
Crossfield Energy Centre 273,067 190,297 249,645
McBride Lake Wind Farm 216,802 221,178 235,553
Taber Wind Farm 215,436 221,247 249,139
Kettles Hill Wind Farm 194,917 200,706 213,732
Total 10,460,056 11,807,765 13,176,249
4. SIGNIFICANT CHANGES FROM PREVIOUS REPORTING PERIODS (3.11)
GRIPerformanceIndicator,EN16:Adecreaseisnotedinourcorporategreenhousegas(GHG)emissionsin2013due to active management to minimize SF6 releases, and as well, a change in the reporting boundary of our inventory. ENMAXreviewedthecompany’sGHGemissionsreportingoperationalboundarytomorecloselyalignwiththeWorld Resource Institute Greenhouse Gas Protocol: A Corporate Accounting and Reporting Standard. ENMAX has determinedthecompanywillusetheOperationalControlapproachforreportingtheGHGemissionsinventory.Assuch, ENMAX is reporting Scope 1 and 2 emissions for natural gas and electricity consumption for owned buildings and generation only and we have reclassified our PPA Emissions to Scope 3, EN17 which also aligns with the GRI definition for other indirect emissions: Emissions that are consequences of the activities of the reporting organization but are generated at sources owned or controlled by another organization.
In 2013 SF6 emissions originating from ENMAX Energy’s equipment are identified as part of our Generation (owned). This is a change from 2012 wherein the greenhouse gas emissions associated with SF6 maintenance activities for ENMAX Energy’s owned generation and ENMAX Power Corporation were totalled together in the corporate GHGemissionscompilation.Aswell,withrespecttoourownedgeneration,thedirectGHGemissionscalculationmethodology for Calgary Energy Centre and Crossfield Energy Centre underwent a change to the emissions factors as part of the update to the quantification methodology for reporting under the Alberta Specified Gas Emitter Regulation (SGER). If the current methodology is applied to the 2012 direct emission inventory, the revised values for last year wouldbe476,240tonnesCO2eand91,318tonnesCO2efortheCalgaryEnergyCentreandCrossfieldEnergyCentre,respectively.
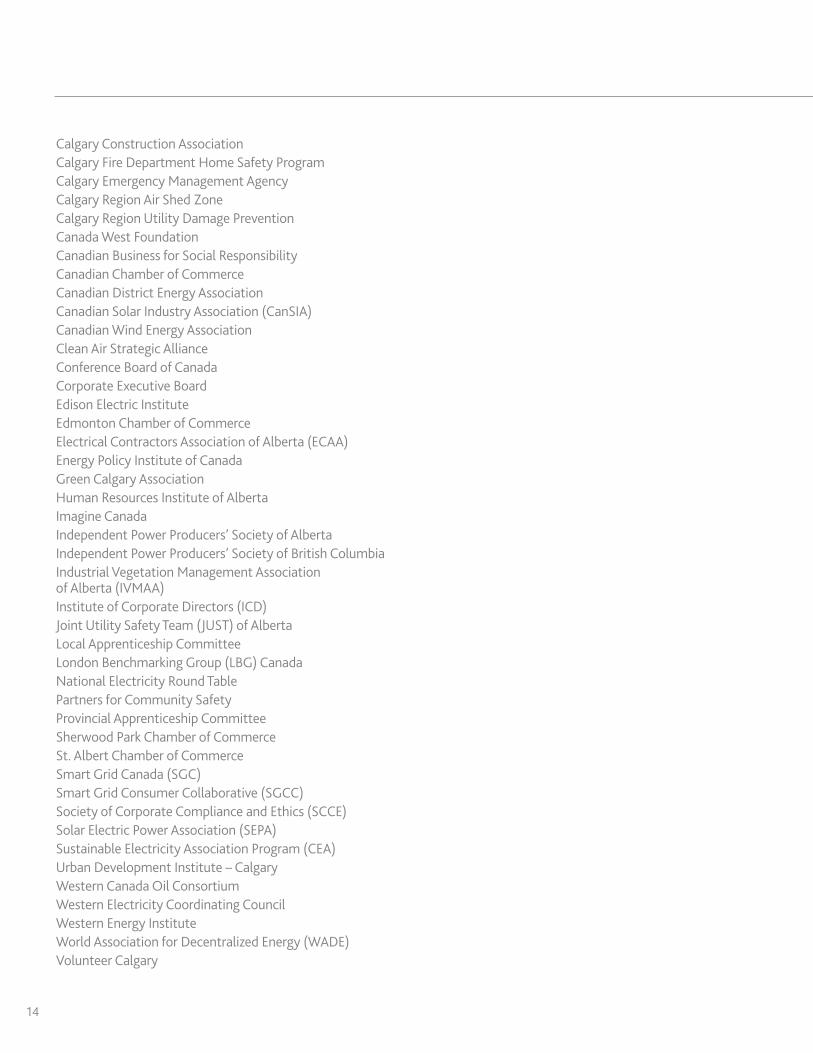
5. CORPORATE MEMBERSHIPS AND ASSOCIATIONS (4.12, 4.13)ENMAX is a Canadian Electric Association (CEA) member and helps advance the work of Canada’s electricity business.
OtherassociationswhichENMAXbelongstoinclude:Air & Waste Management AssociationAlberta Common Ground Alliance (ABCGA)Alberta Electric Utility Safety AssociationAlberta Energy Efficiency Alliance (AEEA)AlbertaOne-CallCorporationAssociation of Professional Engineers and Geoscientists of Alberta (APEGA)BuildingOwnersandManagersAssociation(BOMA)Calgary Chamber of Commerce
14
Calgary Construction AssociationCalgaryFireDepartmentHomeSafetyProgramCalgary Emergency Management Agency Calgary Region Air Shed ZoneCalgary Region Utility Damage PreventionCanada West FoundationCanadian Business for Social ResponsibilityCanadian Chamber of CommerceCanadian District Energy AssociationCanadian Solar Industry Association (CanSIA)Canadian Wind Energy AssociationClean Air Strategic AllianceConference Board of CanadaCorporate Executive BoardEdison Electric InstituteEdmonton Chamber of CommerceElectrical Contractors Association of Alberta (ECAA)Energy Policy Institute of CanadaGreen Calgary AssociationHumanResourcesInstituteofAlbertaImagine CanadaIndependent Power Producers’ Society of AlbertaIndependent Power Producers’ Society of British ColumbiaIndustrial Vegetation Management Association of Alberta (IVMAA)Institute of Corporate Directors (ICD)Joint Utility Safety Team (JUST) of Alberta Local Apprenticeship CommitteeLondon Benchmarking Group (LBG) Canada National Electricity Round TablePartners for Community SafetyProvincial Apprenticeship CommitteeSherwood Park Chamber of CommerceSt. Albert Chamber of CommerceSmart Grid Canada (SGC)Smart Grid Consumer Collaborative (SGCC)Society of Corporate Compliance and Ethics (SCCE)Solar Electric Power Association (SEPA)Sustainable Electricity Association Program (CEA)Urban Development Institute – CalgaryWesternCanadaOilConsortiumWestern Electricity Coordinating CouncilWestern Energy InstituteWorld Association for Decentralized Energy (WADE)Volunteer Calgary
2013 Corporate Responsibility Report 15
ECONOMIC6. MANAGEMENT DISCLOSURE
In accordance with requirements of the GRI, the disclosure that follows describes our overarching management approach related to the key aspect of economy.
• Organizational responsibility -TheExecutiveVicePresident,FinanceandPlanning,ChiefFinancialOfficerandChiefRiskOfficerisalsoresponsibleforareasincludingriskmanagement,treasury,financialreporting,internalcontrolsandprocedures around financial reporting.
• Policy - ENMAX takes pride in our strong commitment to financial disclosure and corporate governance. We comply with Canadian Securities Administrators (CSA) standards related to financial reporting with the exception of the standardized format of CSA reports, a restricted scope certification process on key risks and limiting disclosure of forward-looking information that would prejudice our competitive position.
• Economic performance – in order to meet the energy needs of our customers and to provide dividends to our Shareholder, ENMAX is required to be a financially strong organization. We define and manage our economic value not only in terms of our financial performance, but also how we run our business and the impact of our activities on others as we grow our business. We know that providing cost-competitive electricity is good for our customers, which is good for our business. We also create value through the jobs we create, the materials we purchase, our community investment and the annual dividend we pay to our Shareholder.
• Market presence and indirect economic impacts – our economic development strategy is to provide high quality service to customers, balance the risks of the energy industry and generate economic benefits through the generation, transmission and sale of electricity. Part of our strategy is to own generation facilities in order to reduce the risk of exposure to volatile energy markets, thereby providing ENMAX Energy and its customers with access to a secure, cost-effective source of electricity.
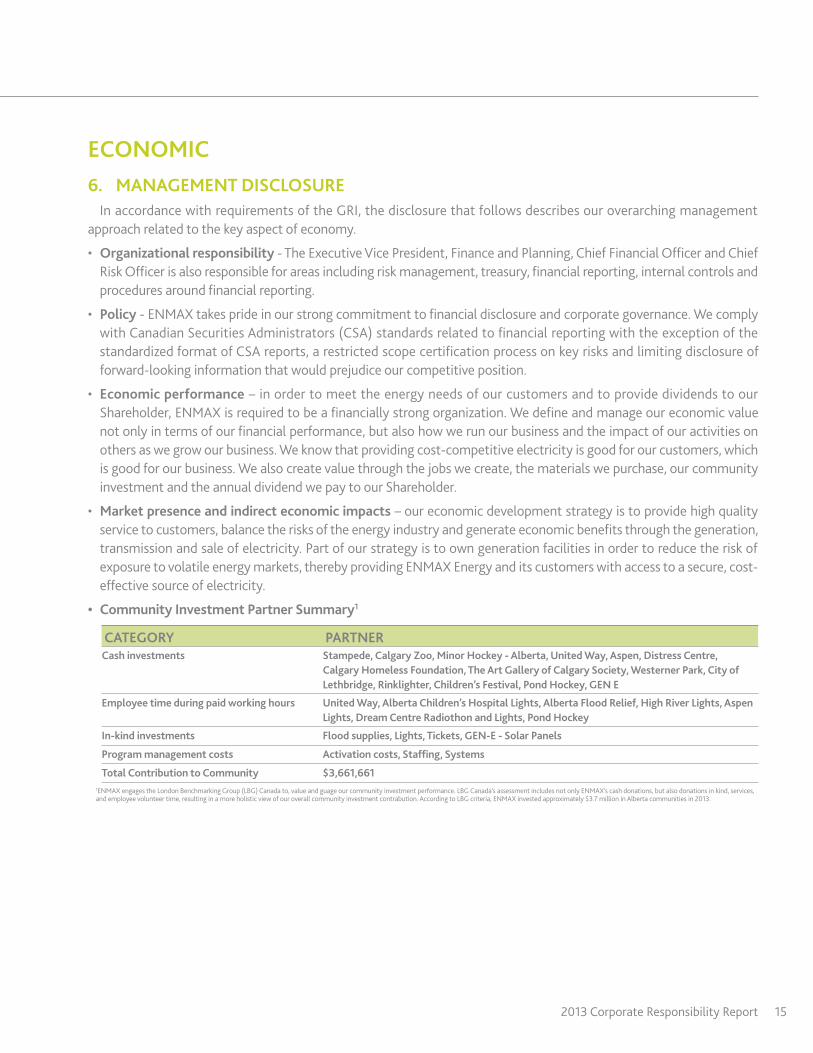
• CommunityInvestmentPartnerSummary1
CATEGORY PARTNERCash investments Stampede, Calgary Zoo, Minor Hockey - Alberta, United Way, Aspen, Distress Centre,
Calgary Homeless Foundation, The Art Gallery of Calgary Society, Westerner Park, City of Lethbridge, Rinklighter, Children’s Festival, Pond Hockey, GEN E
Employee time during paid working hours United Way, Alberta Children’s Hospital Lights, Alberta Flood Relief, High River Lights, Aspen Lights, Dream Centre Radiothon and Lights, Pond Hockey
In-kind investments Flood supplies, Lights, Tickets, GEN-E - Solar Panels
Program management costs Activation costs, Staffing, Systems
Total Contribution to Community $3,661,661 1ENMAX engages the London Benchmarking Group (LBG) Canada to, value and guage our community investment performance. LBG Canada’s assessment includes not only ENMAX’s cash donations, but also donations in kind, services, and employee volunteer time, resulting in a more holistic view of our overall community investment contrabution. According to LBG criteria, ENMAX invested approximately $3.7 million in Alberta communities in 2013.
16
7. POLICY PRACTICES AND PROPORTION OF SPENDING ON LOCALLY BASED SUPPLIERS (EC6)
ENMAX supports the development of local suppliers in the markets we serve when it’s practical to do so. In 2013, 78 percent of the goods and services purchased were from Canadian suppliers, of which, 67 per cent was spent with Alberta-based suppliers.
OurprocurementmustbedoneethicallyinaccordancewithENMAX’sPrinciplesofBusinessEthics,onanarm’s-length basis free from real or perceived conflict of interest on the part of Employees. This is supported by the Supply Chain Management (SCM) Standard which outlines the objectives, roles, responsibilities and tasks relating to ENMAX purchasing activities to ensure consistency across the organization. SCM utilizes competitive sourcing processes to ensure procurement activities are performed in a prudent and ethical manner, and suppliers are treated fairly.
8. PROCEDURES FOR LOCAL HIRING AND PROPORTION OF SENIOR MANAGEMENT HIRED FROM THE LOCAL COMMUNITY (EC7)
ENMAXhasarecruitmentstrategyinplacetopursuelocalhiringfirst.Ofthe560positionsfilledin2013,262wereexternalhires,with23involvingrelocation.Oftheeightseniormanagementrolesfilled(DirectorLevelandabove), five were internal promotions, two were local Calgarians and one was hired from outside Calgary.
9. MANAGEMENT APPROACH TO ENSURE LONG-TERM AND SHORT-TERM ELECTRICITY AVAILABILITY AND RELIABILITY (EU6)
ENMAX actively manages assets to match generation to consumption volumes and has peaking facilities that allow quick reaction to unexpected supply and demand factors.
ENMAX Power makes the reliability of the electrical system for Calgarians its priority. Field crews are on call 24 hours a day to resolve outages, whether a result of wind storms or downed power lines. And while weather conditions play a role in power service interruptions, our commitment to consistently maintain and upgrade the electricity infrastructure inCalgaryisexemplifiedinourCRObjective:Customerandplacesusinthetopquartilefor2012forreliabilitycomparedto most other Canadian utilities, and we expect to see a similar performance for 2013 once that information is available. See our SAIDI / SAIFI chart in the Customer section.
Refer to our 2013 Financial Report for further details on our strategic management approach to ensuring electricity availability and reliability.
10. DEMAND SIDE MANAGEMENT PROGRAMS (EU7)Demand side management is the electricity industry’s term for the efforts we make to reduce total demand for
electricity, as well as shift demand from peak periods to other times of the day. Reducing total demand for electricity helps the entire provincial grid operate more efficiently and reduces the need for new power plants and transmission lines, as well as reduces the size and complexity of integrated electricity systems.
ThroughourEnergyManagementOffice,ENMAXhasbeenactiveinsupportingenergyefficiencyanddemandsidemanagementprojectswithkeycustomerssuchasTheCityofCalgaryandtheCityofEdmonton.Oureffortsincludeadvanced metering to better understand how and where electricity is used, as well as technology upgrades such as more efficient lighting in public spaces. These actions have lead directly to the more efficient use of energy and reductions in greenhouse gas emissions.
2013 Corporate Responsibility Report 17
As a founding member of the Alberta Energy Efficiency Alliance (the AEEA), ENMAX continued its support in 2013 to further the discussion on energy efficiency across the province. Activities have included supporting municipalities in their assessment of energy efficiency options for their communities, as well as participating in a citizen’s dialogue program on energy efficiency knowledge and awareness.
11. RESEARCH AND DEVELOPMENT ACTIVITY AIMED AT RELIABLE ELECTRICITY AND SUSTAINABLE DEVELOPMENT (EU8)
ENMAX is supported by the Climate Change and Emissions Management Corporation (CCEMC) to build confidence in the renewable energy industry and reduce barriers in the deployment of technology. ENMAX applied for and was awarded funding of $14.5 million from the CCEMC Technology Fund to support a portion of our micro-generation solar and wind program. This support has allowed ENMAX to take a leadership role in building micro-generation capacity in Alberta through efforts in training, municipal permitting, and deployment of renewable micro-generation systems. With theprojectsdeployedtodate,itisestimatedthatover19,000tonnesofCO2ereductionswillbeachievedacrosstheprovince. The CCEMC is an independent not-for-profit organization in Alberta with a mandate to expand climate change knowledge, develop new ‘clean’ technologies, and explore practical ways of implementing them.
During the summer 2013 we installed a 50-kilowatt solar photovoltaic array on ENMAX Place as part of a microgeneration pilot program. Click here for information about this pilot program in our Environment section.
ENMAX/Schulich Chair in Renewable Energy
In September 2011, the University of Calgary and the Natural Science and Engineering Research Council (NSERC) announced David Wood, professor in the mechanical and manufacturing engineering department, as the new NSERC/ENMAX Industrial Research Chair in Renewable Energy at the Schulich School of Engineering. This Chair is focused on researching, developing and integrating renewable energy sources within the context of Alberta’s existing electricity infrastructure.
Dr. Wood’s research explores ways to implement renewable energy solutions at the household level, including small windturbines.Heisstudyingtheeffectsofwindonsolarpanelsandhemonitoringtheperformanceofthesolarthermalsystem at Calgary’s Southland Leisure Centre, where 150 solar panels were installed on the roof to provide heat for pools and showers.
Total funding for the research chair is $2.25 million from 2012 to 2016, coming from the Schulich School of Engineering, NSERC and ENMAX. We expect to use the research results to enhance our understanding of solar and wind facilities, knowledge we can pass on to customers of our solar program.
12. PLANNED CAPACITY AGAINST PROJECTED ELECTRICITY DEMAND (EU10)OurjointventurewithCapitalPower,theShepardEnergyCentre(Shepard)insoutheastCalgarywillbeAlberta’s
largest natural gas-fuelled power facility when completed in 2015. It will add 800 megawatts (MW) to the provincial power grid, while producing about half the carbon emissions of a conventional coal plant. With increased supply comes increasing reliability, and there will be less vulnerability associated with outages and facility shutdowns. With the facility located close to the population it serves, Shepard will not create significant stress on the Alberta-wide transmission line infrastructure. When the facility becomes operational in 2015, it will not only be the largest facility of its kind in Alberta, but also one of the most state-of-the art and efficient facilities.
18
The Calgary Energy Centre and Crossfield Energy Centre, ENMAX Energy’s existing natural gas-fueled facilities, lie on the outskirts of Calgary. Together, these facilities have the capacity to produce 420 MW. The Calgary Energy Centre is a combined-cycle generation facility, and the Crossfield Energy Centre is a peaking facility designed to produce electricity for Alberta’s grid during high power consumption periods, such as during the day or during low winter temperatures. By locating these facilities close to where power is most needed, they help make Alberta’s system more efficient.
13. TRANSMISSION LOSSES (EU12)HourlydataontransmissionlossesisavailablefromtheAlbertaElectricSystemOperator(AESO),whichaggregates
losses across all wire owners’ facilities. ENMAX’s portion of the overall transmission system losses is considerably below the system-wide average because as an urban utility ENMAX’s lines are very short compared to those with more rural operations. The percentage of our annual average energy loss is 0.72 per cent for our transmission system. In 2013, peakenergyconsumptionwas9,705gigawatthours(GWh).TheAESOaggregatedsystem-wideaveragefor2013was3.83percentaspertheAESOdocumenthttp://www.aeso.ca/downloads/Final_Alberta_Loss_Factors_for_2013.pdf.
ENVIRONMENT14. MANAGEMENT APPROACH
The disclosure that follows describes our overarching management approach related to the key aspect of environment.
Organizational responsibility -OurVicePresident,HumanResources,SafetyandFacilities,supportedbytheEnvironment,HealthandSafetyteam,isresponsibleforourEnvironmentPolicy,itsongoinginterpretationanditsintegration into day-to-day practices. Business units and their respective executive team leaders are responsible for implementing our Environment Policy and conducting their operations in accordance with the policy.
Policy - ENMAX’s Environment Policy requires compliance with legal and other requirements including our own standards and operating procedures and conformance with our environmental management system (EMS). The policy commits ENMAX employees and contractors to “make a PACCT” with the environment as spelled out below:
• Prevent pollution
• Awareness of environmental issues
• Compliance with relevant laws, regulations, policies and procedures
• Continual improvement of environmental performance
• Training of employees to minimize environmental impacts.
Training and awareness - A mandatory General Environmental Awareness Training module has been in place since 2006 for employees to annually review how our operations interact with the environment and how we mitigate impacts. Environmental Affairs has also developed a more comprehensive environmental training curriculum for field staff that covers waste management, spill response, working around water bodies, avian nest management and other environmental aspects.
Monitoring and follow-up -OneofthecriticalwaysENMAXshowsenvironmentalduediligenceandmanagesouroverall environmental performance is through the continual strengthening of our Environmental Management System (EMS). The EMS sets out our environmental policy, operational objectives and the required processes to ensure that issues having the potential for adverse environmental impacts are identified and managed. Since 2002, the ENMAX corporate EMShasbeencompliantwiththeInternationalStandardsOrganization(ISO)standard14001.WesupporttheEMSbyallocating resources, setting goals, providing training and striving to continually improve performance. The corporate EMS is audited internally on an annual basis and by a third party every three years. Regular audits enable us to remain ISO14001compliantandtomeasurecontinuousimprovement.
2013 Corporate Responsibility Report 19
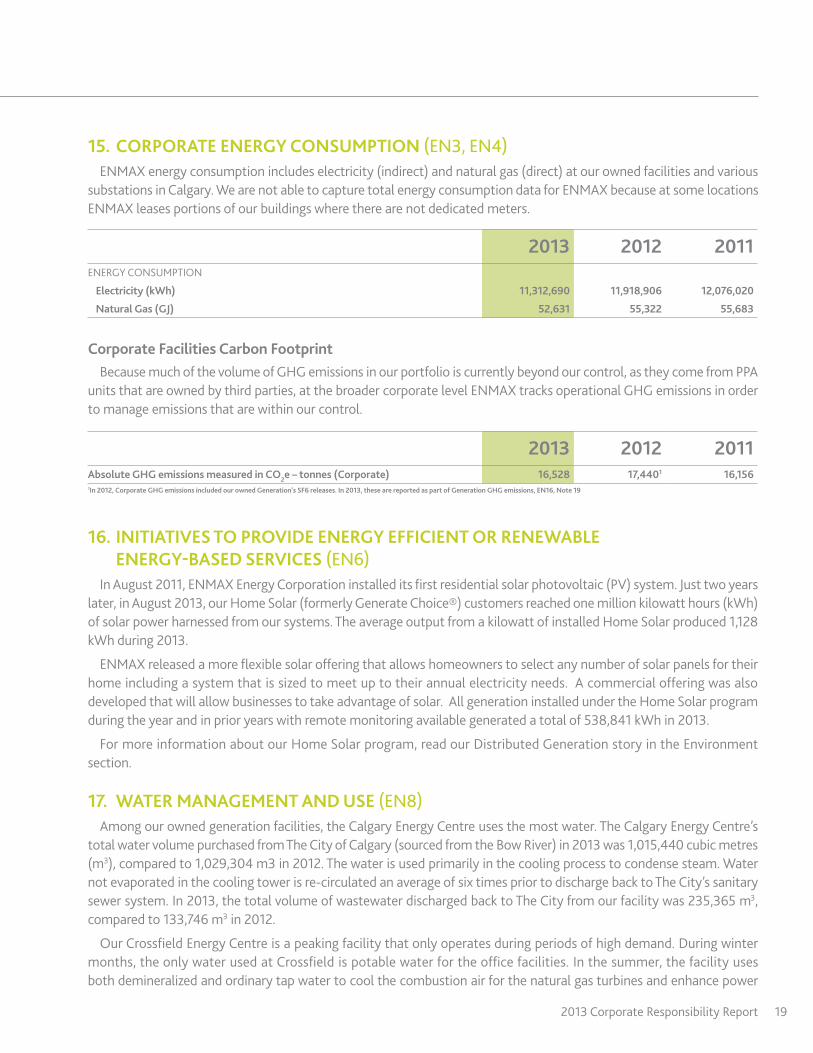
15. CORPORATE ENERGY CONSUMPTION (EN3, EN4)ENMAX energy consumption includes electricity (indirect) and natural gas (direct) at our owned facilities and various
substations in Calgary. We are not able to capture total energy consumption data for ENMAX because at some locations ENMAX leases portions of our buildings where there are not dedicated meters.
2013 2012 2011ENERGYCONSUMPTION
Electricity (kWh) 11,312,690 11,918,906 12,076,020
Natural Gas (GJ) 52,631 55,322 55,683
Corporate Facilities Carbon FootprintBecausemuchofthevolumeofGHGemissionsinourportfolioiscurrentlybeyondourcontrol,astheycomefromPPA
unitsthatareownedbythirdparties,atthebroadercorporatelevelENMAXtracksoperationalGHGemissionsinorderto manage emissions that are within our control.
2013 2012 2011Absolute GHG emissions measured in CO2e – tonnes (Corporate) 16,528 17,4401 16,1561In 2012, Corporate GHG emissions included our owned Generation’s SF6 releases. In 2013, these are reported as part of Generation GHG emissions, EN16, Note 19
16. INITIATIVES TO PROVIDE ENERGY EFFICIENT OR RENEWABLE ENERGY-BASED SERVICES (EN6)
In August 2011, ENMAX Energy Corporation installed its first residential solar photovoltaic (PV) system. Just two years later,inAugust2013,ourHomeSolar(formerlyGenerateChoice®)customersreachedonemillionkilowatthours(kWh)ofsolarpowerharnessedfromoursystems.TheaverageoutputfromakilowattofinstalledHomeSolarproduced1,128kWh during 2013.
ENMAX released a more flexible solar offering that allows homeowners to select any number of solar panels for their home including a system that is sized to meet up to their annual electricity needs. A commercial offering was also developedthatwillallowbusinessestotakeadvantageofsolar.AllgenerationinstalledundertheHomeSolarprogramduring the year and in prior years with remote monitoring available generated a total of 538,841 kWh in 2013.
FormoreinformationaboutourHomeSolarprogram,readourDistributedGenerationstoryintheEnvironmentsection.
17. WATER MANAGEMENT AND USE (EN8)Among our owned generation facilities, the Calgary Energy Centre uses the most water. The Calgary Energy Centre’s
total water volume purchased from The City of Calgary (sourced from the Bow River) in 2013 was 1,015,440 cubic metres (m3), compared to 1,029,304 m3 in 2012. The water is used primarily in the cooling process to condense steam. Water not evaporated in the cooling tower is re-circulated an average of six times prior to discharge back to The City’s sanitary sewer system. In 2013, the total volume of wastewater discharged back to The City from our facility was 235,365 m3, compared to 133,746 m3 in 2012.
OurCrossfieldEnergyCentreisapeakingfacilitythatonlyoperatesduringperiodsofhighdemand.Duringwintermonths, the only water used at Crossfield is potable water for the office facilities. In the summer, the facility uses both demineralized and ordinary tap water to cool the combustion air for the natural gas turbines and enhance power

20
production. The water comes from the Mountain View regional water services, or is pumped via pipeline from a nearby gas plant. Demineralized water may also be trucked in from the Calgary Energy Centre during high demand periods. After use, the water is blown down to an on-site storage tank, then trucked to a suitable sewage disposal facility. Crossfield used 9,521 m3 of water in 2013 with 259 m3 of water disposed, compared to 5,544 m3 of water in 2012 and 456 m3 of wastewater disposed.
When it comes into operation in 2015, our Shepard Energy Centre will also require cooling water, which will be sourced from The City’s Bonnybrook sewage treatment facility. Fit-for-use grey water will be piped to Shepard and cycled through the cooling and other process water systems several times before being returned to Bonnybrook for treatment and discharge to the Bow River.
18. BIODIVERSITY (EN11, EN12)
Avian management programBirds perching and nesting on power poles or substation equipment creates a risk of fires and power outages, as well as
harm to the birds themselves. For this reason, ENMAX has developed an avian management program to mitigate these risks and protect birds while ensuring the reliability of our services. Prevention is the first approach – Environmental Affairs works with our field crews to identify high risk areas, and install perching and nesting deterrents prior to the breeding season to prevent birds from using ENMAX infrastructure.
Training courses and detailed procedures are provided to field crews to guide their actions when birds and or nests are discovered. Environmental Affairs is on call 24 hours a day to help identify the species of bird and recommend the appropriate action. In cases where the risk to the birds or infrastructure is significant, the nest can be removed or relocated if it is inactive. Active nests found on power poles, substations and construction sites are protected and monitored until the young birds leave the nest. All nest platforms are monitored by Environmental Affairs to ensure continued safety and success of these nesting sites.
ENMAX operates a video camera that provides live streaming of an osprey pair using a nest platform at the Calgary Zoo as part of a public awareness and education service. The camera is activated in early spring when the pair begin to build their nest, and remains focused on the nest site until the birds depart in September. Viewers can watch as the parents care for the eggs until they hatch, and witness the young birds growing from fluffy chicks to sleek predators on a diet of fresh fish delivered by diligent parents through the entire summer. The webcam can be accessed through our website, enmax.com. In June of 2013 the fibre optic line to the camera was damaged during the flood, preventing the feed from reachingviewers.Howevertheospreycamerapagewasstillviewedover75,000times.Thecamerawasre-establishedfor spring 2014, in time for the birds arrival.
For more information on our corporate responsibility programs in environment, follow this link.
Bird watching at Substation 162
When ENMAX first began preparations to expand Substation 162 to service the growing airport, the land around it was a dry pasture. But following the expansion of Stony Trail, the area became a class four semi-permanent wetland before we broke ground. This presented a number of environmental considerations.
Onehectareofwetlandneededtobepumpedoutfortheexpansion.ENMAXcompensatedDucksUnlimitedaspartof this process and then installed a turbidity curtain to prevent sediment from seeping in to the remaining wetland while water was being extracted. A more difficult challenge was protecting birds in the area and convincing them the site wasn’t an inviting spot to nest.
2013 Corporate Responsibility Report 21
“I walked around the site each day for a couple of months to make sure there were no birds nesting there,” said Alison Anaka, Environmental Specialist. “We also took preventative measures such as trimming grass and using a noisemaking gun to keep birds out of the area.”
Nonetheless, just before construction started, ENMAX employees found four nests buried in tall grass next to the wetland, each containing four eggs. It wasn’t long before sixteen spotted sandpipers hatched, all but one surviving birth.
As the little grey chicks began hopping around and testing their wings, ENMAX Environment installed a snow fence to prevent them from straying onto the busy access road a few metres from their nests. “Their nests were marked with flags and everyone on site looked out for them,” said Allison. “As soon as they were strong enough they all safely flew away.”
Work on the expansion of Substation 162 started in spring 2013 and is scheduled for completion by March 2015.
For more information on our corporate responsibility programs in environment follow this link.
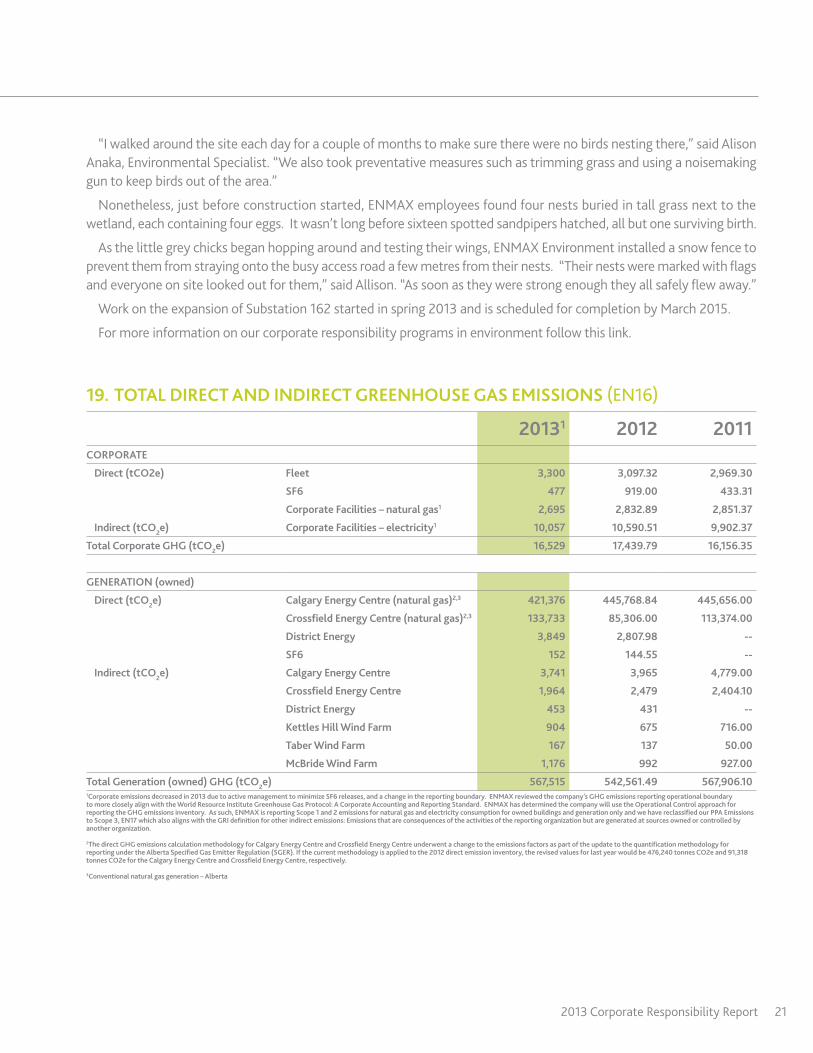
19. TOTAL DIRECT AND INDIRECT GREENHOUSE GAS EMISSIONS (EN16)
20131 2012 2011CORPORATE
Direct (tCO2e) Fleet 3,300 3,097.32 2,969.30
SF6 477 919.00 433.31
Corporate Facilities – natural gas1 2,695 2,832.89 2,851.37
Indirect (tCO2e) Corporate Facilities – electricity1 10,057 10,590.51 9,902.37
Total Corporate GHG (tCO2e) 16,529 17,439.79 16,156.35
GENERATION (owned)
Direct (tCO2e) Calgary Energy Centre (natural gas)2,3 421,376 445,768.84 445,656.00
Crossfield Energy Centre (natural gas)2,3 133,733 85,306.00 113,374.00
District Energy 3,849 2,807.98 --
SF6 152 144.55 --
Indirect (tCO2e) Calgary Energy Centre 3,741 3,965 4,779.00
Crossfield Energy Centre 1,964 2,479 2,404.10
District Energy 453 431 --
Kettles Hill Wind Farm 904 675 716.00
Taber Wind Farm 167 137 50.00
McBride Wind Farm 1,176 992 927.00
Total Generation (owned) GHG (tCO2e) 567,515 542,561.49 567,906.101Corporate emissions decreased in 2013 due to active management to minimize SF6 releases, and a change in the reporting boundary. ENMAX reviewed the company’s GHG emissions reporting operational boundary to more closely align with the World Resource Institute Greenhouse Gas Protocol: A Corporate Accounting and Reporting Standard. ENMAX has determined the company will use the Operational Control approach for reporting the GHG emissions inventory. As such, ENMAX is reporting Scope 1 and 2 emissions for natural gas and electricity consumption for owned buildings and generation only and we have reclassified our PPA Emissions to Scope 3, EN17 which also aligns with the GRI definition for other indirect emissions: Emissions that are consequences of the activities of the reporting organization but are generated at sources owned or controlled by another organization.
2The direct GHG emissions calculation methodology for Calgary Energy Centre and Crossfield Energy Centre underwent a change to the emissions factors as part of the update to the quantification methodology for reporting under the Alberta Specified Gas Emitter Regulation (SGER). If the current methodology is applied to the 2012 direct emission inventory, the revised values for last year would be 476,240 tonnes CO2e and 91,318 tonnes CO2e for the Calgary Energy Centre and Crossfield Energy Centre, respectively.
3Conventional natural gas generation – Alberta

22
20. INITIATIVES TO REDUCE GREENHOUSE GAS EMISSIONS AND REDUCTIONS ACHIEVED (EN18)
ThroughtheENMAXEnergyHomeSolarprogramasdescribedinNote16previously,allgenerationinstalledundertheHomeSolarprogramduringtheyearandinprioryearswithremotemonitoringavailablegeneratedatotalof538,841kWh in 2013 (2012 total, 412,867 kWh).
In June 2013 ENMAX’s EcoRebate pilot program, initiated in 2009 came to end. The program provided rebates to employees on the purchase and installation of energy and water efficient technologies. ENMAX collaborated with Climate Change Central (C3) to manage the program including performance tracking data control on ENMAX’s behalf. C3 is a not-for-profit organization focused on reducing greenhouse gas emissions by empowering Albertans to take action.
In their final summary report to ENMAX C3 concluded that the EcoRebate program has culminated in an estimated savings of 320 tonnes of greenhouse gas emissions, 173 MWh of electricity; 2,972 GJ of natural gas and 8,168 m3 of water since the program’s inception. According to C3[1], ENMAX was one of the first companies in Canada to work with C3 to develop and implement an employee benefit program such as this. This program assisted and supported employees to not only feel valued as an employee of ENMAX, but to make wise decisions about the energy and environmental considerations we make in our life outside the corporation. “This was a successful pilot program that started in 2009. Sinceitslaunch,ENMAXhasgivenoutmorethan$300,000inrebatestoemployees,”saidErinKurchina,VicePresidentofHumanResources,ENMAXCorporation.“Wearepleasedtoseethatmorethan700employeestookadvantageofthe program and made their homes more energy efficient.”
Declining participation rates, and an increased focus on cost-control, led to a review of the program and the decision that it is no longer financially sustainable. ENMAX remains committed to other environmental initiatives, such as our HomeSolarproductsandrelationshipwiththeClimateChangeandEmissionsManagementCorporation(CCEMC).
21. NITROGEN OXIDE AIR EMISSIONS (EN20)OurCalgaryEnergyCentreappliesSelectiveCatalyticReductiontechnologytoreduceournitrogenoxide(NOx)
emissions of which we continue to have the lowest intensity in the province at 0.07 kg/MW.
22. ENVIRONMENTAL INCIDENTS AND ACTIONS (EN23)All releases to the environment must be reported to ENMAX’s Environmental Affairs department, who ensure that
significant events are reported to Alberta Environment. ENMAX defines a significant release as: a spill greater than 100 litres; a release in excess of one gram of Polychlorinated Biphenyls (PCB) concentration from in-service equipment or two parts per million (ppm) or greater of PCB from stored equipment; or any release that has the potential to affect environmentally sensitive areas and / or private property.
Due to the 2013 flood in Calgary, the river bank downstream of Pine Creek Water Facility and adjacent to Deerfoot Trail was severely scoured away removing two transformers (both non-PCB), one pole and adjoining wire. Equipment has since been located and salvaged, and no loss of oil was identified. This incident was reported to the regulators.
ENMAX has been proactively removing PCB-containing equipment from its system over the past 10 years. Prior to the development of the new Federal PCB Regulation in 2008, ENMAX tested and removed all transformers containing PCB oil greater than or equal to 50 parts per million (ppm) from the electrical system, including pole mounted transformers which are permitted to operate without any restrictions until 2025.
In 2013, 259 kg of low level PCB-containing material was sent for disposal and 30 L liquid PCB and 173 kg of low level PCB-containing material sent for destruction.
2013 Corporate Responsibility Report 23
In 2013, ENMAX had 16 significant releases, all of which involved non-PCB-containing transformer oil. Spills do occur across the ENMAX system, for example transformers will release their oil contents either due to a slow leak from aging equipment or some form of third party interaction such as being struck by a vehicle. All significant spills were reported to Alberta Environment and no enforcement action, charge or penalty was rendered against ENMAX in relation to any of these matters. ENMAX has an active leak management program to help prevent the release of oil from faulty equipment.
23. ENVIRONMENTAL COMPLIANCE (EN28)In 2013, ENMAX’s total environmental protection expenditures in 2013 was $2.5 Million ($2 534 101). This is an increase
from the $1.4 million reported in 2012. This increase can be attributed to the $1.1 Million ENMAX Corporate spent on the reclamation of the Storm Water Pond at South Service Centre. The next largest expense was in Waste Management, whereatotalof$395541wasspent(79%ofwhichwasoperatingcost).OthernotablechangesincludeanincreaseinEPC’s reclamation expenditures due to the 2013 flood.
ENMAX regularly completes the biannual Statistic Canada report on Environmental Expenditures. This data is then culminated and reported publicly by Statistics Canada at: http://www40.statcan.gc.ca/l01/cst01/envi28a-eng.htm.
LABOUR PRACTICES, DECENT WORK AND HUMAN RIGHTS 24. MANAGEMENT APPROACH
In accordance with requirements of the GRI, the disclosure that follows describes our overarching management approaches related to the key aspects of labour practices, decent work and human rights.
Organizational responsibility
OurVicePresident,HumanResources,SafetyandFacilitiesisresponsibleforallaspectsrelatedtolabourpracticesanddecent work and several human rights aspects, including collective bargaining and security practices. Executive leaders ofeachbusinessunitaredirectlyresponsibleforimplementationofpoliciesandpractices.TheyaresupportedbyHumanResourcesBusinessPartners.HumanrightsaspectsrelatedtoourinvestmentsaretheresponsibilityoftheExecutiveVicePresident,FinanceandPlanning,ChiefFinancialOfficerandChiefRiskOfficer.Humanrightsaspectsrelatedtoprocurement practices are the responsibility of all executive team members, supported by the Director, Supply Chain Management.
Policy
The ENMAX Principles of Business Ethics provides a framework to cultivate a safe, respectful and ethical workplace and to ensure employees operate with integrity in purchasing goods and services and when conducting business. In addition, ENMAX has policies and practices related to employee relations, including:
• OccupationalHealthandSafety
• RespectfulWorkplace
• AlcoholandDrug
• HumanResources
• Learning,DevelopmentandTrainingStandard
Goals and Performance
• Employment – ENMAX’s standard for compensation is to ensure that we are competitive within the market in whichweworkandcompetefortalent.Overall,wetargettopayatthemedian(50thpercentile),howeverindividual
24
compensation levels may vary based on qualifications and experience. ENMAX believes benefit programs are a significant part of an employee’s overall compensation and we strive to offer competitive, innovative options that provide employees with meaningful choices and flexibility.
• Occupational health and safety – Mission Zero is ENMAX’S long-term safety vision designed to drive continued examination and improvement of ENMAX’s safety culture and safety management systems. Launched in 2009, this program established a common set of safety beliefs to set the tone and expectations for safety at ENMAX. More information can be found here.
• Labour/management relations and freedom of association – With more than 60 per cent of ENMAX employees being union members of the International Brotherhood of Electrical Workers (IBEW) or the Canadian Union of Public Employees (CUPE), we welcome the contributions of organized labour and the right of our employees to associate for our mutual benefit.
• Training and awareness –HowwedealwithworkforcetrainingandawarenessisdiscussedinNotes28and32.
• Diversity and equal opportunity - We highly value the backgrounds, experience, viewpoints and talents of our employees, and recognize the diversity of our employees is critical to our business success. We do not discriminate in hiring and employment practices on the basis of race, gender, culture, origin, age, religion, marital and family status, physical disabilities or sexual orientation.
• Investment and procurement practices - ENMAX is committed to fair competition in all its dealings with suppliers. Employees are to use good judgment and act in the best interests of ENMAX to ensure transparency, prudence, accountability and corporate responsibility in all spending decisions.
Monitoring and Follow-Up
At ENMAX, each employee must go through performance measurement, goal setting and evaluation. Performance goals are vitally important to our business success, as they ensure all employees are working toward common business objectives. Development goals are also included within this process as they help employees build the skills and experience they need for personal and career development.
Best practices and standards for employee compensation, benefits and programs are continually monitored, and our programs are improved upon as necessary to maintain and retain our highly skilled workforce.
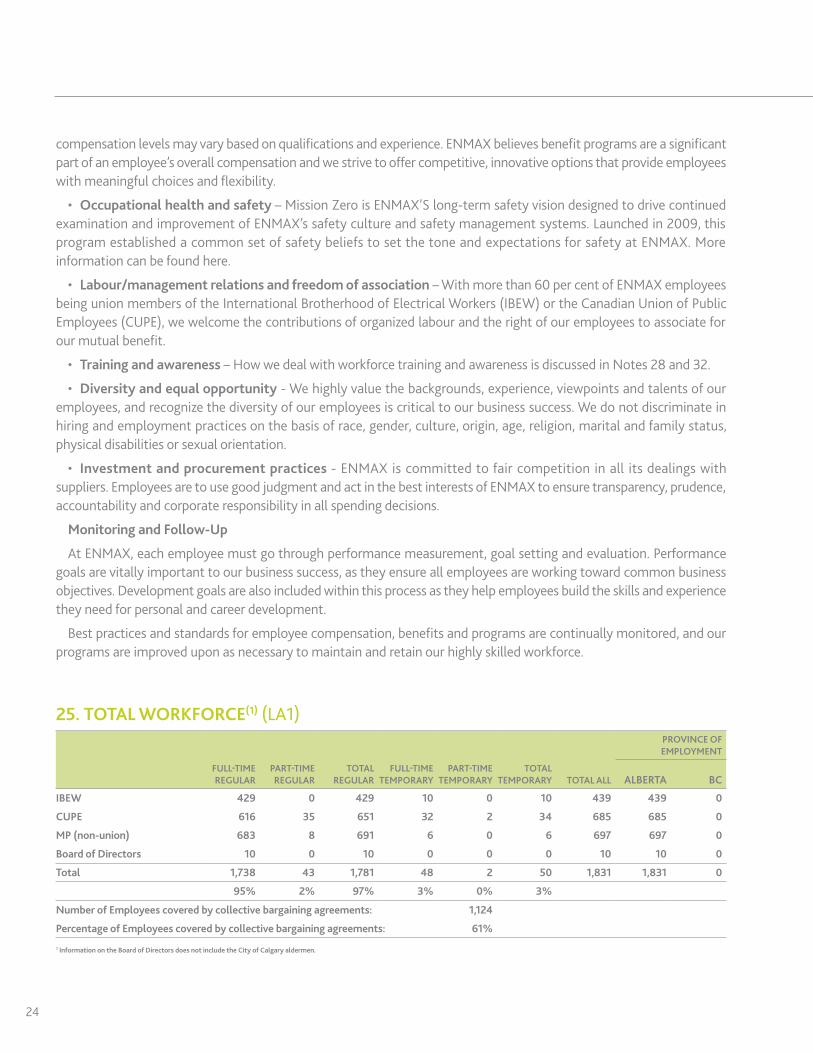
25. TOTAL WORKFORCE(1) (LA1)PROVINCE OF EMPLOYMENT
FULL-TIME REGULAR
PART-TIME REGULAR
TOTAL REGULAR
FULL-TIME TEMPORARY
PART-TIME TEMPORARY
TOTAL TEMPORARY TOTAL ALL ALBERTA BC
IBEW 429 0 429 10 0 10 439 439 0
CUPE 616 35 651 32 2 34 685 685 0
MP (non-union) 683 8 691 6 0 6 697 697 0
Board of Directors 10 0 10 0 0 0 10 10 0
Total 1,738 43 1,781 48 2 50 1,831 1,831 0
95% 2% 97% 3% 0% 3%
Number of Employees covered by collective bargaining agreements: 1,124
Percentage of Employees covered by collective bargaining agreements: 61%
1 Information on the Board of Directors does not include the City of Calgary aldermen.
2013 Corporate Responsibility Report 25
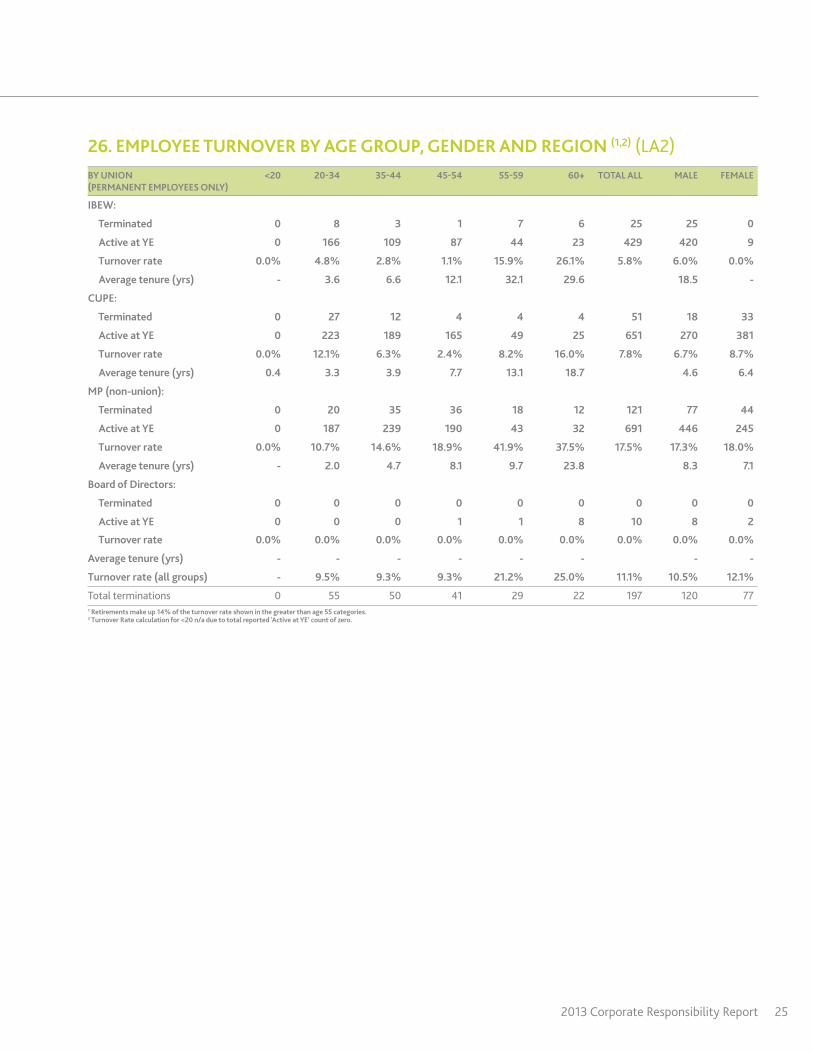
26. EMPLOYEE TURNOVER BY AGE GROUP, GENDER AND REGION (1,2) (LA2)BY UNION (PERMANENT EMPLOYEES ONLY)
<20 20-34 35-44 45-54 55-59 60+ TOTAL ALL MALE FEMALE
IBEW:
Terminated 0 8 3 1 7 6 25 25 0
Active at YE 0 166 109 87 44 23 429 420 9
Turnover rate 0.0% 4.8% 2.8% 1.1% 15.9% 26.1% 5.8% 6.0% 0.0%
Average tenure (yrs) - 3.6 6.6 12.1 32.1 29.6 18.5 -
CUPE:
Terminated 0 27 12 4 4 4 51 18 33
Active at YE 0 223 189 165 49 25 651 270 381
Turnover rate 0.0% 12.1% 6.3% 2.4% 8.2% 16.0% 7.8% 6.7% 8.7%
Average tenure (yrs) 0.4 3.3 3.9 7.7 13.1 18.7 4.6 6.4
MP (non-union):
Terminated 0 20 35 36 18 12 121 77 44
Active at YE 0 187 239 190 43 32 691 446 245
Turnover rate 0.0% 10.7% 14.6% 18.9% 41.9% 37.5% 17.5% 17.3% 18.0%
Average tenure (yrs) - 2.0 4.7 8.1 9.7 23.8 8.3 7.1
Board of Directors:
Terminated 0 0 0 0 0 0 0 0 0
Active at YE 0 0 0 1 1 8 10 8 2
Turnover rate 0.0% 0.0% 0.0% 0.0% 0.0% 0.0% 0.0% 0.0% 0.0%
Average tenure (yrs) - - - - - - - -
Turnover rate (all groups) - 9.5% 9.3% 9.3% 21.2% 25.0% 11.1% 10.5% 12.1%
Total terminations 0 55 50 41 29 22 197 120 771 Retirements make up 14% of the turnover rate shown in the greater than age 55 categories. 2 Turnover Rate calculation for <20 n/a due to total reported ‘Active at YE’ count of zero.
26
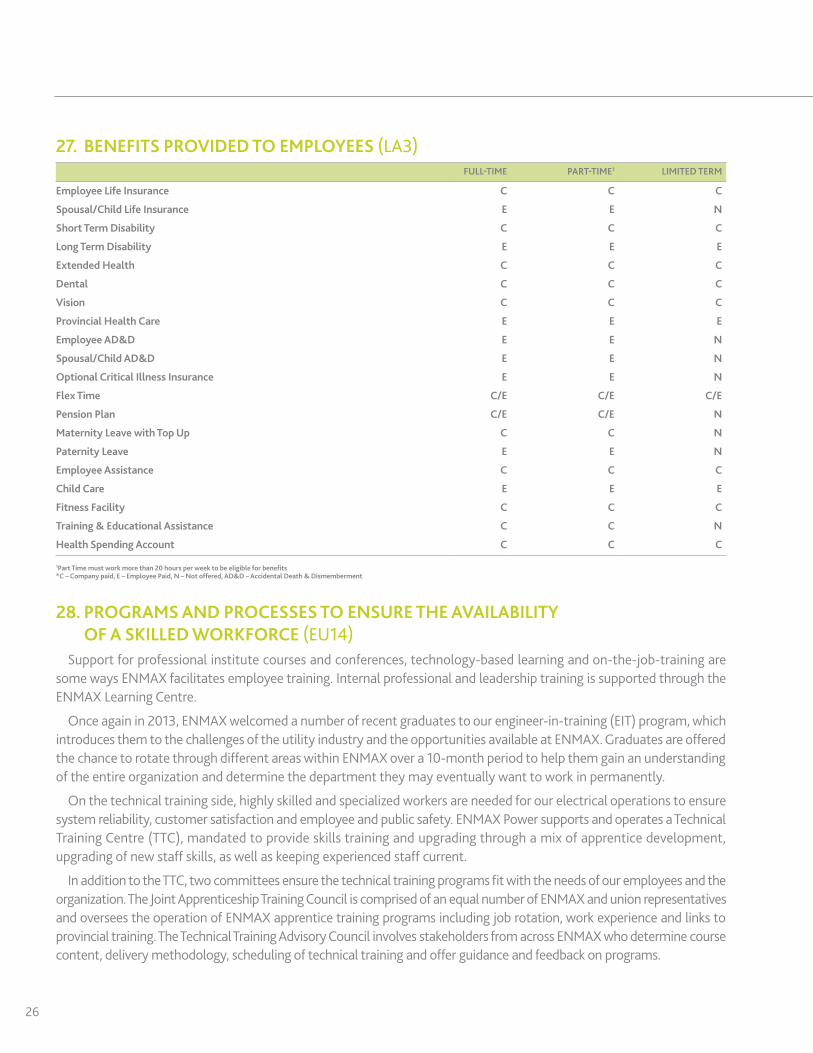
27. BENEFITS PROVIDED TO EMPLOYEES (LA3)FULL-TIME PART-TIME1 LIMITED TERM
Employee Life Insurance C C C
Spousal/Child Life Insurance E E N
Short Term Disability C C C
Long Term Disability E E E
Extended Health C C C
Dental C C C
Vision C C C
Provincial Health Care E E E
Employee AD&D E E N
Spousal/Child AD&D E E N
Optional Critical Illness Insurance E E N
Flex Time C/E C/E C/E
Pension Plan C/E C/E N
Maternity Leave with Top Up C C N
Paternity Leave E E N
Employee Assistance C C C
Child Care E E E
Fitness Facility C C C
Training & Educational Assistance C C N
Health Spending Account C C C
1Part Time must work more than 20 hours per week to be eligible for benefits *C – Company paid, E – Employee Paid, N – Not offered, AD&D – Accidental Death & Dismemberment
28. PROGRAMS AND PROCESSES TO ENSURE THE AVAILABILITY OF A SKILLED WORKFORCE (EU14)
Support for professional institute courses and conferences, technology-based learning and on-the-job-training are some ways ENMAX facilitates employee training. Internal professional and leadership training is supported through the ENMAX Learning Centre.
Onceagainin2013,ENMAXwelcomedanumberofrecentgraduatestoourengineer-in-training(EIT)program,whichintroduces them to the challenges of the utility industry and the opportunities available at ENMAX. Graduates are offered the chance to rotate through different areas within ENMAX over a 10-month period to help them gain an understanding of the entire organization and determine the department they may eventually want to work in permanently.
Onthetechnicaltrainingside,highlyskilledandspecializedworkersareneededforourelectricaloperationstoensuresystem reliability, customer satisfaction and employee and public safety. ENMAX Power supports and operates a Technical Training Centre (TTC), mandated to provide skills training and upgrading through a mix of apprentice development, upgrading of new staff skills, as well as keeping experienced staff current.
In addition to the TTC, two committees ensure the technical training programs fit with the needs of our employees and the organization. The Joint Apprenticeship Training Council is comprised of an equal number of ENMAX and union representatives and oversees the operation of ENMAX apprentice training programs including job rotation, work experience and links to provincial training. The Technical Training Advisory Council involves stakeholders from across ENMAX who determine course content, delivery methodology, scheduling of technical training and offer guidance and feedback on programs.
2013 Corporate Responsibility Report 27
The Learning andKnowledgeManagementteamatourCustomerCareCentre is responsible for learning,communications and process documentation for these teams. In 2013 we found ways to improve the learning experience for our Customer Service Representatives by developing innovative and efficient ways to communicate. We transformed how we deliver internal communications and training by using video, screen casts and eLearning. This has decreased classroom-training time while improving learning retention. All of our training programs are designed with the customer in mind, ensuring the customer experience remains paramount in all of our business transactions. See Note 32 for details on our corporate-wide training.
All employees participate in mandatory training in the areas of safety, environment, code of conduct and ethics.
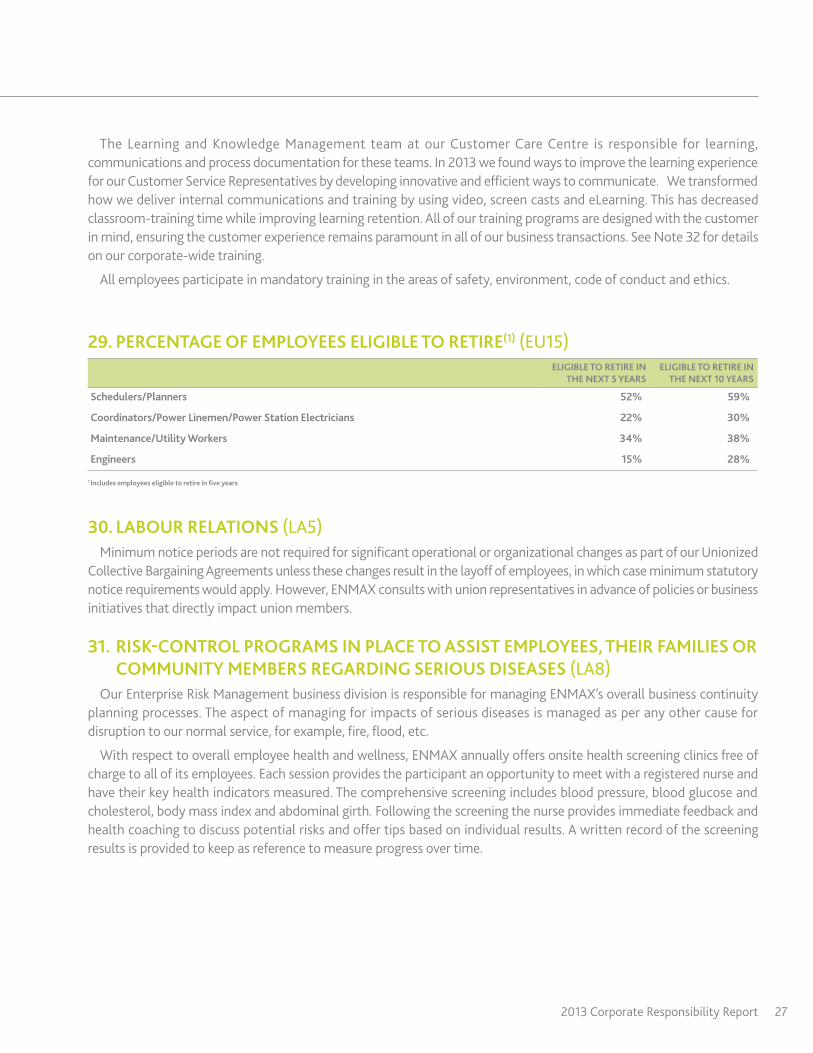
29. PERCENTAGE OF EMPLOYEES ELIGIBLE TO RETIRE(1) (EU15) ELIGIBLE TO RETIRE IN
THE NEXT 5 YEARSELIGIBLE TO RETIRE IN
THE NEXT 10 YEARS
Schedulers/Planners 52% 59%
Coordinators/Power Linemen/Power Station Electricians 22% 30%
Maintenance/Utility Workers 34% 38%
Engineers 15% 28%
1 Includes employees eligible to retire in five years
30. LABOUR RELATIONS (LA5)Minimum notice periods are not required for significant operational or organizational changes as part of our Unionized
Collective Bargaining Agreements unless these changes result in the layoff of employees, in which case minimum statutory noticerequirementswouldapply.However,ENMAXconsultswithunionrepresentativesinadvanceofpoliciesorbusinessinitiatives that directly impact union members.
31. RISK-CONTROL PROGRAMS IN PLACE TO ASSIST EMPLOYEES, THEIR FAMILIES OR COMMUNITY MEMBERS REGARDING SERIOUS DISEASES (LA8)
OurEnterpriseRiskManagementbusinessdivisionisresponsibleformanagingENMAX’soverallbusinesscontinuityplanning processes. The aspect of managing for impacts of serious diseases is managed as per any other cause for disruption to our normal service, for example, fire, flood, etc.
With respect to overall employee health and wellness, ENMAX annually offers onsite health screening clinics free of charge to all of its employees. Each session provides the participant an opportunity to meet with a registered nurse and have their key health indicators measured. The comprehensive screening includes blood pressure, blood glucose and cholesterol, body mass index and abdominal girth. Following the screening the nurse provides immediate feedback and health coaching to discuss potential risks and offer tips based on individual results. A written record of the screening results is provided to keep as reference to measure progress over time.
28
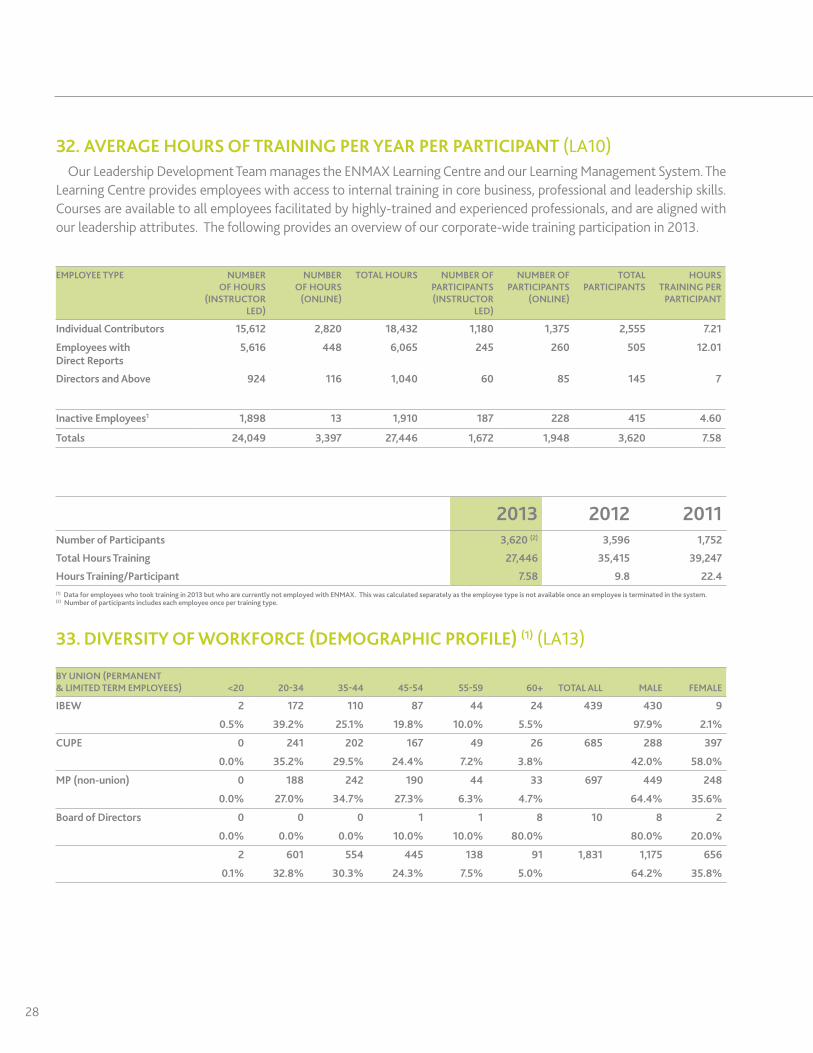
32. AVERAGE HOURS OF TRAINING PER YEAR PER PARTICIPANT (LA10)OurLeadershipDevelopmentTeammanagestheENMAXLearningCentreandourLearningManagementSystem.The
Learning Centre provides employees with access to internal training in core business, professional and leadership skills. Courses are available to all employees facilitated by highly-trained and experienced professionals, and are aligned with our leadership attributes. The following provides an overview of our corporate-wide training participation in 2013.
EMPLOYEE TYPE NUMBER OF HOURS
(INSTRUCTOR LED)
NUMBER OF HOURS
(ONLINE)
TOTAL HOURS NUMBER OF PARTICIPANTS (INSTRUCTOR
LED)
NUMBER OF PARTICIPANTS
(ONLINE)
TOTAL PARTICIPANTS
HOURS TRAINING PER
PARTICIPANT
Individual Contributors 15,612 2,820 18,432 1,180 1,375 2,555 7.21
Employees with Direct Reports
5,616 448 6,065 245 260 505 12.01
Directors and Above 924 116 1,040 60 85 145 7
Inactive Employees1 1,898 13 1,910 187 228 415 4.60
Totals 24,049 3,397 27,446 1,672 1,948 3,620 7.58
2013 2012 2011Number of Participants 3,620 (2) 3,596 1,752
Total Hours Training 27,446 35,415 39,247
Hours Training/Participant 7.58 9.8 22.4(1) Data for employees who took training in 2013 but who are currently not employed with ENMAX. This was calculated separately as the employee type is not available once an employee is terminated in the system.(2) Number of participants includes each employee once per training type.
33. DIVERSITY OF WORKFORCE (DEMOGRAPHIC PROFILE) (1) (LA13)
BY UNION (PERMANENT & LIMITED TERM EMPLOYEES) <20 20-34 35-44 45-54 55-59 60+ TOTAL ALL MALE FEMALE
IBEW 2 172 110 87 44 24 439 430 9
0.5% 39.2% 25.1% 19.8% 10.0% 5.5% 97.9% 2.1%
CUPE 0 241 202 167 49 26 685 288 397
0.0% 35.2% 29.5% 24.4% 7.2% 3.8% 42.0% 58.0%
MP (non-union) 0 188 242 190 44 33 697 449 248
0.0% 27.0% 34.7% 27.3% 6.3% 4.7% 64.4% 35.6%
Board of Directors 0 0 0 1 1 8 10 8 2
0.0% 0.0% 0.0% 10.0% 10.0% 80.0% 80.0% 20.0%
2 601 554 445 138 91 1,831 1,175 656
0.1% 32.8% 30.3% 24.3% 7.5% 5.0% 64.2% 35.8%
2013 Corporate Responsibility Report 29
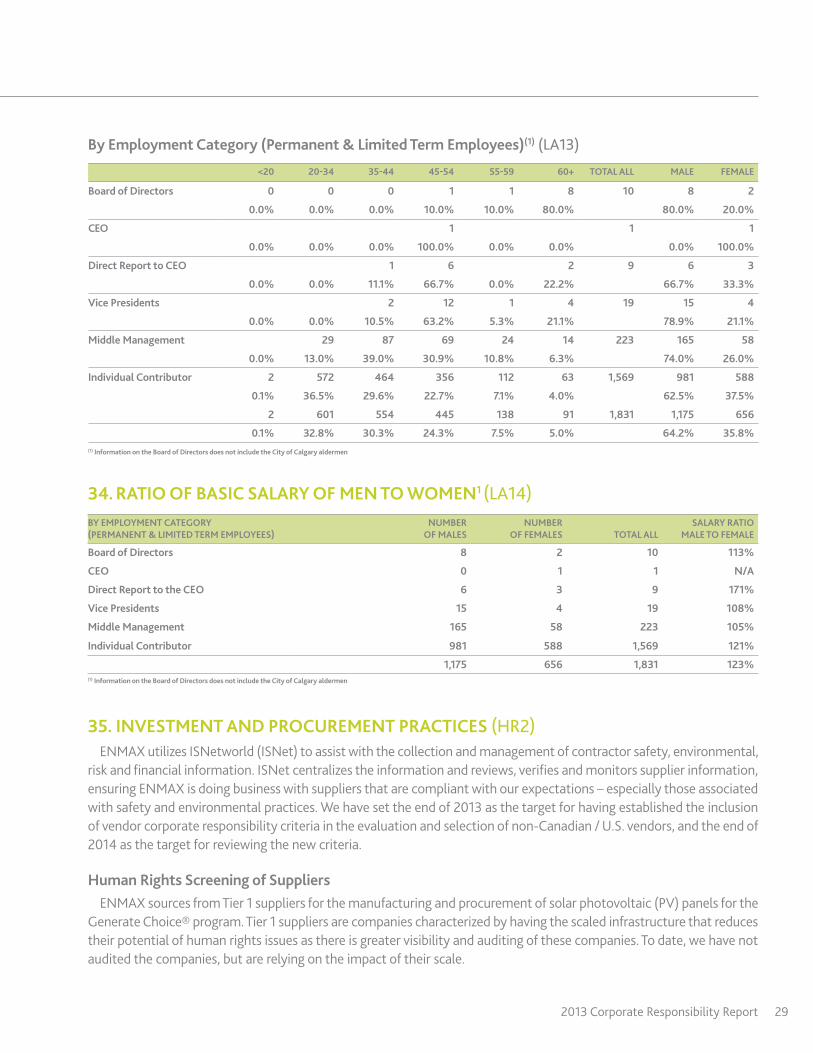
By Employment Category (Permanent & Limited Term Employees)(1) (LA13)
<20 20-34 35-44 45-54 55-59 60+ TOTAL ALL MALE FEMALE
Board of Directors 0 0 0 1 1 8 10 8 2
0.0% 0.0% 0.0% 10.0% 10.0% 80.0% 80.0% 20.0%
CEO 1 1 1
0.0% 0.0% 0.0% 100.0% 0.0% 0.0% 0.0% 100.0%
Direct Report to CEO 1 6 2 9 6 3
0.0% 0.0% 11.1% 66.7% 0.0% 22.2% 66.7% 33.3%
Vice Presidents 2 12 1 4 19 15 4
0.0% 0.0% 10.5% 63.2% 5.3% 21.1% 78.9% 21.1%
Middle Management 29 87 69 24 14 223 165 58
0.0% 13.0% 39.0% 30.9% 10.8% 6.3% 74.0% 26.0%
Individual Contributor 2 572 464 356 112 63 1,569 981 588
0.1% 36.5% 29.6% 22.7% 7.1% 4.0% 62.5% 37.5%
2 601 554 445 138 91 1,831 1,175 656
0.1% 32.8% 30.3% 24.3% 7.5% 5.0% 64.2% 35.8%(1) Information on the Board of Directors does not include the City of Calgary aldermen
34. RATIO OF BASIC SALARY OF MEN TO WOMEN1 (LA14)BY EMPLOYMENT CATEGORY (PERMANENT & LIMITED TERM EMPLOYEES)
NUMBER OF MALES
NUMBER OF FEMALES TOTAL ALL
SALARY RATIO MALE TO FEMALE
Board of Directors 8 2 10 113%
CEO 0 1 1 N/A
Direct Report to the CEO 6 3 9 171%
Vice Presidents 15 4 19 108%
Middle Management 165 58 223 105%
Individual Contributor 981 588 1,569 121%
1,175 656 1,831 123%(1) Information on the Board of Directors does not include the City of Calgary aldermen
35. INVESTMENT AND PROCUREMENT PRACTICES (HR2)ENMAX utilizes ISNetworld (ISNet) to assist with the collection and management of contractor safety, environmental,
risk and financial information. ISNet centralizes the information and reviews, verifies and monitors supplier information, ensuring ENMAX is doing business with suppliers that are compliant with our expectations – especially those associated with safety and environmental practices. We have set the end of 2013 as the target for having established the inclusion of vendor corporate responsibility criteria in the evaluation and selection of non-Canadian / U.S. vendors, and the end of 2014 as the target for reviewing the new criteria.
Human Rights Screening of SuppliersENMAX sources from Tier 1 suppliers for the manufacturing and procurement of solar photovoltaic (PV) panels for the
GenerateChoice®program.Tier1suppliersarecompaniescharacterizedbyhavingthescaledinfrastructurethatreducestheir potential of human rights issues as there is greater visibility and auditing of these companies. To date, we have not audited the companies, but are relying on the impact of their scale.
30
36. NON-DISCRIMINATION (HR4)ENMAX strives to be an employer of choice in our communities by offering a work environment that is healthy, secure
andrespectful.OurRespectfulWorkplacePolicysupportsthiscommitment.
Therewasoneincidentofdiscriminationmadelatein2012thatisstillbeforetheAlbertaHumanRightsandCitizenshipCommission. No incidents of violations of the rights of indigenous people or displacement occurred. In 2013 there were twodiscriminationcomplaintsreportedandwhicharestillbeforetheAlbertaHumanRightsandCitizenshipCommission.
37. SOCIETY
Management Approach
In accordance with requirements of the GRI, the disclosure that follows describes our overarching management approaches related to the key aspects of community investment, communications and public relations.
Organizational responsibility
OurVicePresident,CommunicationsandPublicRelations,withsupportfromtheSponsorshipandCommunityInvestment team, oversees our investments and donations in the community and our corporate sponsorships. The Director, Stakeholder and Aboriginal Relations supports our Generation and Transmission and Distribution business units to manage community and stakeholder relations aspects of our facilities.
The Executive Vice President, Regulatory and Legal Services oversees our energy policy development activities. Each business unit and its executive team leader, supported by our Vice President, Corporate Responsibility, are responsible for compliance with competition and privacy laws, as well as other legislation governing every aspect of ENMAX operations.
Policy
OurpoliciesgoverningsocietalaspectsincludetheCodeofConductCompliancePolicyandtheSponsorships,Donationsand Tickets Standard.
Goals and Performance• Community – Through the generation projects we develop, the electrical infrastructure we manage and the products
and services we sell, we know our customers and community are counting on us to be consultative and transparent. Ourcorporatevaluesandourcorporateresponsibilityvisionguideouremployeesastheymakedecisionsthatimpactour community.
As we plan and manage our operations, we take a proactive, solutions-focused approach based on open two-way dialogue that promotes consultative and respectful relationships with our stakeholders. We commit to keep stakeholders informed through tools such as websites, email, newsletters, in-person meetings and open-houses to maintain dialogue.
ENMAX invests in community initiatives to help make Alberta a better place to live, work and play. We focus on three primarysectors:youth,environmentandsafety.Ouronlineapplicationsystemhelpsustoevaluatefundingrequestsfairly and consistently; we also look to our community investment policy when evaluating requests.
ENMAX developed and launched a new corporate brand strategy in 2011, and in 2013 aligned our community investment and sponsorship strategy to our brand.
• Corruption – To ensure our employees have the means and confidence to report compliance concerns, we established aconfidentialSafetyandEthicsHelpLinein2004.ThishelplineisavailabletoENMAXemployeesandsupplierstomakegood faith reports of suspected inappropriate or unethical behaviour. Employees are also encouraged to speak to their
2013 Corporate Responsibility Report 31
leaderoranymemberofmanagementiftheysuspectinappropriateorunethicalbehaviour.UseoftheHelpLinein2013 was consistent with previous years, with an average of nine calls. We believe these results indicate that employees feel they can resolve issues expediently by speaking with supervisors or leaders rather than through the anonymous HelpLine.SeeNote39.
• Public policy – ENMAX is unique in Alberta by the fact that we are involved in all parts of the electricity industry, including generation, transmission, distribution and retail operations. This allows us to make a unique contribution on the public policy stage. We have aligned our business strategy with interest of consumers in mind and believe we are standing up for consumers through our presentations and ongoing advocacy.
• Anti-Competitive Behaviour and Compliance – ENMAX is subject to two codes of conduct: a regulation overseen by the Market Surveillance Administrator (MSA) that ensures a level playing field for customers and competitive electricity retailers; and an order of the Alberta Utility Commission (AUC) that ensures utilities do not favour their affiliates. Each code has similar compliance obligations: to have compliance plans, to report quarterly and annually on compliance and to undergo compliance audits. To support these obligations, ENMAX has a Code of Conduct Compliance Policy, provides mandatory training annually to all employees including officers, directors, and affected contractors, and has appointed a Conduct Committee to manage compliance activities.
ENMAX participates in the wholesale electricity market in Alberta and therefore must comply with market trading legislationandrulesoftheAlbertaElectricSystemOperator(AESO).
TheAESOalsomonitorsAlbertaelectricitymarketparticipantstoensureparticipantsfollowallapplicablerequirementsunder the Alberta Reliability Standards (ARS). The ARS are a means to ensure that sufficient and continuous supply of electricity is available during expected and unforeseen circumstances that reduce the amount of total available electricity. Meeting these standards also helps ensure reliable electricity is available in the North American bulk electric system, even in the event of unexpected equipment failures or other factors that could impact the amount of available electricity. The MSA has authority to issue specified penalties to market participants for non-compliance with ARS. The first ARS was applied in 2009 and another ten standards came into force in 2010. Additional ARS requirements are expected to become effective in 2013 and 2014. ARS applies to the operations of both ENMAX Power and ENMAX Energy.
Training and AwarenessSee the discussion under Goals and Performance.
Monitoring and Follow UpSee the discussion under Goals and Performance.
38. CUSTOMER AND PUBLIC HEALTH AND SAFETYManaging Impacts to Displacement (EU20)
Todate,ENMAXhasnothadtomanageanyimpactstodisplacement.However,shouldsuchanincidentarisewithrespect to our generation facilities, ENMAX is required by law to defer all aspects of management to the Calgary Emergency Management Agency (CEMA).
Emergency Response Planning (EU21)
ENMAX ensures that a large number of employees are trained in the emergency response procedures (ERP) using the Incident Command System (ICS). The Incident Command System establishes standardized incident management protocols that all incident responders should use to enable a coordinated response. Generation personnel are trained in ERPs specific to the facility at which they work. Both Generation and Transmission and Distribution Services (T&Ds) include day-to-day operational training, in addition to exercises, to ensure our plant, field and control centre employees
32
are equipped with the necessary knowledge and resources to respond safely, while maintaining continued operation of the Alberta Interconnected Electrical System (AIES) and compliance to all legislative requirements.
The exercise portion of the Emergency Response Programs includes both discussion-based and operations-based exercises which vary from table tops to full scale exercises. In 2013, multiple ERP and procedural training sessions were held, concluding with tabletops. The Generation response team was further developed and tested through three live scenariosfocusingontheCalgaryEnergyCentre,CrossfieldEnergyCentre,andKettlesHillWindFarm.TheGenerationEmergencyOperationsCentreparticipatedineachexercise.TheirmandateregardingERPistoensuresufficientresourcesare deployed to manage emergency situations while working collaboratively with all stakeholders to ensure efficient, effective and timely response.
The flood response to the Calgary Downtown District Energy Centre tested the program and the teams in a real emergency response. All performed well during the response and lessons learned were gathered to further enhance the program.
Should there be a need for community alerts, in accordance with the City of Calgary Emergency Management bylaw, ENMAX’s Generation groups will work with Calgary Emergency Management Agency (CEMA) and Calgary Emergency Services to conduct proper notification and ensure evacuation procedures are completed by Calgary Emergency Services asrequired.TransmissionandDistributionServices(T&Ds)alsointeractswiththeAESOforprovincialoperationsandhas agreements of mutual emergency assistance with other utilities and entities. Similar to Generation, T&D works in alignmentwithCEMAandisrepresentedatTheCity’sEmergencyOperationsCentre.Thiscollaborationprovedtobeeffective as we all came together to respond to the June 2013 flooding.
Additional table-top and full scale exercises are to be completed in 2014 to support continued program development and preparedness measures. While construction is ongoing at Shepard, ENMAX is developing emergency response plans for the facility in accordance with Alberta Utility Commission requirements. As part of these preparation activities, the planning team consults with our Stakeholder Relations and Regulatory Affairs department to identify a list of directly and indirectly affected residents and businesses in the area. As well, our customers are provided with a 24-hour number direct to our Control Centre should they encounter any problems with their electricity service and are able to contact Calgary Emergency Services through 911 should the problem be of an emergency nature.
Both Generation and T&D are also coordinating plans with The City of Calgary emergency planners and first responders, todevelopplansandexercises.ThreeTableTopexerciseswerecompletedatShepardinQ42013withafurther5exercisesplanned for 2014. The final exercise, a full-scale exercise involving Police, Fire, EMS and third party contractors that would be involved in the designated incident response for Shepard, is currently scheduled for April 10, 2014.
ENMAXPowerCorporationparticipatesinayearlyexercisewithEPCOR,oneofitspartneragencies,allowingthetwoutilities to learn each other’s processes and procedures so they are ready to respond if their mutual emergency assistance agreement is activated, as it was during the June 2013 flooding. With the return of power to the residents of Calgary, there were many great successes celebrated as well as some lessons learned. We will draw from both the successes and lessons learned as we move into 2014 to enhance the resilience of our operations. These lessons have led to updates in processes and procedures. Exercises to test these emergency response protocols will occur throughout 2014. These exercises will focus our response to the catastrophic failure of oil-filled equipment at a substation, our preparation for the 2014 poles fire season, our preparation for the 2014 flood season, ensuring that members of our Incident Management Team are proficient in the use of emergency response systems and technologies such as the E2C2 SharePoint Site, the TFCC Alert Notification System, the Geographic Information System maps for poles fire, etc.
2013 Corporate Responsibility Report 33
Trouble call response
When trouble occurs, such as downed lines from a storm or a vehicle collision with a power pole, ENMAX Power relies on our First Line Response (FLR) Trouble Response (TR) Linemen to get the power up and running for customers as soon as possible. FLR TR crews are the first on the scene and it’s their job to secure the site, make the area electrically safe and restore power, if possible.
Because of their important role in maintaining reliability, ENMAX Power makes sure we have sufficient crews to maintain high-level response times. Staffing levels are driven in part by tracking response times, which may indicate whether more personnel may be required. In 2013, call response time averaged 28.1 minutes.
39. ANTI-CORRUPTION PRACTICES AND PROGRAMS (SO2, SO3, SO4)
Risk Analysis Related to CorruptionENMAX does not currently conduct a formal risk assessment focused on corruption or include corruption as a risk
factorinoverallriskassessments.However,theorganizationdoesconductaquarterlyenterprise-wideriskassessmentprocess of all business units. This process identified a low risk of a material ethical breach resulting from the lack of an appropriate ethics management system. By operating primarily within Alberta, we are not exposed to foreign corruption risk and we have policies, training and internal controls to address conflicts of interest and procurement practices. Additionally, Internal Audit considers fraud risk as part of all of its engagements.
All employees are required to take training on the ENMAX Principles of Business Ethics upon hiring. The training is available online to all employees at all times and, of the 275 employees who took the training in 2013, 23 (8 per cent) were management with direct reports (39 people or 11 per cent in 2012), and 252 (92 per cent) were non-management with no direct reports (320 people or 89 per cent in 2012).
In 2013, there were zero incidents of corruption and zero concluded legal cases regarding corrupt practices. Instances ofcorruptionwouldbedetectedinanumberofways:byanonymousreportingtotheSafetyandEthicsHelpLine;through direct reporting to management or members of the Compliance department; or through detection by audit and finance staff.
40. PRODUCT RESPONSIBILITYManagement Approach
The disclosure that follows describes our overarching management approach related to the key aspects of our product. Follow this link for further disclosure details.
Organizational responsibility-OversightofthemanagementofaspectsassociatedwithENMAXproductsissegmentedbycustomertype.OurVicePresident,CustomerExperience,andVicePresident,BillingandOperationsoversee the billing and management of Encompass, our customer care centre, which serves our residential and small business customers. ENMAX Energy’s Commercial Markets group manages their customer relationships directly under theoversightofourVicePresident,CommercialandIndustrialMarkets.OurHomeServicesproductsareoverseenbytheDirector,ResidentialMarketDevelopment.TheVicePresidentsofFieldServices,andSystemOperations,areaccountablefor ENMAX Power’s customers.
Policy - ENMAX has policies in place to ensure our service delivery is responsible and respectful, including the Code of ConductCompliancePolicy,thePrivacyPolicyandtheOccupationalHealthandSafetyPolicy.

34
Goals and Performance
• Customer health and safety (PR1) – We ensure the infrastructure, systems and people are in place to provide high quality and safe service to our customers and we count on our rigorous adherence to processes and procedures to keep this commitment. We also respond to customer inquiries regarding electric and magnetic fields (EMF), including on-site EMF measurement. A performance indicator for Transmission and Distribution Services includes response times, in particular first-line response to urgent dispatch requests such as lights out, lines down or vehicle collisions with poles or streetlights. We also monitor response times for new connections, both residential and commercial. Staffing levels are driven in part by increasing response times, which indicates that more personnel may be required.
• Product and service information required by procedures (PR3) – The ENMAX Group of Companies do not sell any products that are banned in certain markets or the subject of stakeholder questions or public debate.
• Product and service labeling (PR4) – None of the products and services provided are subject to labeling laws. We follow both internal and external service quality standards and try to use clear language on our bills and contracts.
• Marketing communications programs (PR6) – ENMAX adheres to the rules related to marketing communications set out in the Code of Conduct Regulation, the Fair Trading Act and the Competition Act. All marketing communications are to be reviewed for compliance with these rules by ENMAX’s Compliance and Legal Services groups. In accordance with the Code of Conduct Regulation, reviews of compliance with these standards are undertaken quarterly and non-compliances are reported to the Market Surveillance Administrator.
• Customer Privacy (PR8) – Alberta’s Personal Information Protection Act (PIPA) came into force in 2004 and sets the standard for how businesses in Alberta should handle personal information. Requirements under ENMAX’s Code of Conduct regarding protection of customer information are more stringent than those set out in PIPA, so PIPA compliance is generally inherent in code of conduct compliance. In addition to the code of conduct compliance structure, ENMAX’s PIPA compliance structure includes a Privacy Policy, a personal information commitment brochure (available online athttps://www.enmax.com/Legal/privacy)andthedesignationofaPrivacyOfficerinestablishingandmanagingPIPAcompliance mechanisms.
Training and awareness – every customer service representative in our Customer Care Centre receives in-depth market, business and service training when hired. They are also provided with regular training updates, as well as quality assurance reviews and coaching opportunities on a monthly basis.
Monitoring and follow-up – Instance of disclosure of customer data without consent contrary to the Code of Conduct Regulation are self-reported to the Market Surveillance Administrator quarterly. In addition to its responsibilities under the Code of Conduct Regulation, the Market Surveillance Administrator is charged with investigative authority over market participants who may be behaving in a way contrary to the “fair, efficient and openly competitive operation of the market”. The Corporate Responsibility team supports the Vice President, Wholesale Energy in managing compliance with market rules.
2013 Corporate Responsibility Report 35
ACFA – Alberta Capital Finance Authority
AESO–AlbertaElectricSystemOperator
ARS – Alberta Reliability Standards
AUC – Alberta Utilities Commission
Biomass – Carbon-based biological material including wood, waste, landfill gases and alcohol fuels. Biomass is increasingly being used to generate renewable energy.
Canadian Union of Public Employees (CUPE) – Represents 600,000 working men and women across Canada in health care, education, municipalities, libraries, universities, social services, public utilities, transportation, emergency services and airlines.
Carbon offsets – Carbon offsets are the reductions, removals or avoidance ofemissionsofgreenhousegases,measuredinCO2e, into the atmosphere from business as usual conditions. The reductions should be real, permanent, measurableandunique.Theseoffsetsarequantifiedintonnes:onetonneofGHGreduction creates one tonne of carbon offset.
Carbon dioxide (CO2) – Carbon dioxide is generated primarily as a by-product of fossil fuel combustion during organic decomposition and during respiration. Initsgaseousform,CO2isacolourless,odourless,incombustiblegas.CO2 is a greenhouse gas and in the atmosphere can contribute to climate change. Coal-firedpowergenerationemitsovertwotimestheamountofCO2e as gas-fuelled generation.
Carbon dioxide equivalent (CO2e) – Carbon dioxide equivalent is the unit of measurement used to show the global warming potential (GWP) of each greenhouse gas. Because carbon dioxide has the lowest GWP, it is used as the reference against which all other greenhouse gases are measured.
CEA – Canadian Electricity Association
CI&S – Community Investment and Sponsorship
Corporate responsibility (CR) – Also known as corporate social responsibility, this is a commitment to behave ethically, operate transparently and provide products and services in a manner that mitigates environmental impacts and promotes the public good.
Demand side management – A term for the electricity industry’s efforts to reduce total demand for electricity, as well as shift demand from peak periods to other times of the day, thereby reducing the need for new power plants and transmission lines and reducing the size of integrated electricity systems.
Distribution – The delivery of electricity to homes and businesses within local areas using relatively low-voltage power lines. Distributors carry electricity from substations to distribution transformers, which further reduce or step down the voltage for supply to local customers.
Distributed generation – Distributed energy generation, (also known as micro-generation) is smaller scale power generation, typically between three to 10,000 kilowatts. Distributed generation makes use of locally produced power generation technologies such as solar photovoltaic systems, micro-wind turbines and combined-cycle natural gas turbines as alternatives to large-scale conventional coal-fired plants.
District energy – A heat distribution system that uses hot water, heated in a central facility, to heat a number of other buildings or facilities.
EasyMax® –Launchedin2005,theEasyMax®byENMAXEnergyprogramoffersresidential and small business customers competitive electricity rates, without complex contracts, or cancellation penalties.
* Consumers can choose any retailer listed at www.ucahelps.gov.ab.ca or at 310-4822. Electricity delivered to a home or business is not affect by choice of retailer.
Electrical load – The power demand on an electrical circuit.
Emissions – The release of gases, such as carbon dioxide and nitrogen oxides, from the combustion of fossil fuels and other industrial processes.
Emissions intensity – The amount of emissions generated by a specific activity normalized by unit of production, typically by megawatt in power production.
Employee turnover rate – A measure of the loss of employees that creates job openings that may need to be filled.
Environmental remediation – The removal of pollution or contaminants from soil, surface or ground water.
Energy efficiency – Using less energy to achieve an equivalent amount of energy service.
Generation – The production of electricity at generating stations or via distributed generation using fossil fuels, hydro, wind, solar or other resources (e.g. biomass, plasma arc technology).
GHG – greenhouse gas, such as carbon dioxide or methane. See “Greenhouse Gases” below.
Gigajoule (GJ) – A gigajoule is equivalent to one billion joules and is a term used in the energy industry, particularly when referring to the heating potential and / or volume of natural gas.
Gigawatt (GW) – A gigawatt is equivalent to one billion watts.
Global Reporting Initiative (GRI) – The Global Reporting Initiative (GRI) is a network-based organization that has pioneered the development of the world’s most widely used sustainability reporting framework.
Greenhouse gases (GHGs) – These are the gases in the atmosphere (naturally occurring or anthropogenic) that absorb the reflected heat from Earth and warm theplanet.TherearesixGHGsthatareidentifiedbyscientists,including:carbondioxide(CO2),methane(CH4),nitrousoxide(NOx),hydrofluorocarbons(HFCs),chlorofluorocarbons (CFCs) and sulphur hexafluoride (SF5).
Heating, ventilation and air conditioning (HVAC)–HVACisanindustryacronym describing heating, ventilation and air condition services, all of which involve mechanical systems promoting comfortable indoor air quality.
ImagineCalgary – An 18-month project which launched in January 2005 with thegoalofproducingalong-rangeurbansustainabilityplanforCalgary.Over18,000 Calgarians added their voice to a City-led, community-owned initiative. The City of Calgary provided project staff and resources to support over 150 active and committed stakeholders who were responsible for developing the plan. The plan includes a long-range vision and goals which reflect the diversity of aspirations and interests of the community for the future. It also includes a series of targets which provide useful reference points for organizations and individuals to determine what action can be taken to reach the goals.
ISO –The InternationalOrganization for Standardization is a non-governmental organization and the world’s largest developer and publisher of international standards.
International Brotherhood of Electrical Workers (IBEW) – Represents approximately 725,000 members who work in a wide variety of fields, including utilities, construction, telecommunications, broadcasting, manufacturing, railroads and government.
Key performance indicators (KPI) – Performance targets which are set annually by ENMAX executive and management. ENMAX employee compensation is linked to the achievement of these performance targets.
Kilovolt (kV) – A kilovolt is equivalent to one thousand volts of electricity.
Kilowatt (kW) – A kilowatt is equivalent to one thousand watts.
Kilowatt hours (kWh) – A kilowatt hour is equivalent to one thousand watt hours of electricity. It is the most commonly used billing unit by utilities that deliver electricity to consumers.
GLOSSARY OF TERMS
36
Lost Time Injury Frequency Rate (LTIFR) – The number of lost time injuries or illnesses that occur during a calendar year for every 200,000 hours worked.
Lost Time Injury Severity Rate (LTISR) – A measure of the severity of injuries and is based on the number of days lost to injury.
Low tillage – An agriculture practice where soil disturbance is kept to a minimum byavoidingtillingoftheland,therebyreducingGHGemissions.ENMAXEnergyhas a long-term agreement in place to purchase carbon credits from an agri-business, which aggregates carbon offset credits from Alberta farmers.
Megawatt (MW)–Onemegawattisequivalenttoonemillionwattsandisameasurement used by the utility industry to evaluate the productive capacity ofelectricalgenerators.Onewattisequaltoonejouleofenergypersecond.
Megawatt hour (MWh) – A megawatt hour is equivalent to one thousand kilowatts of electricity used continuously for a one-hour period.
Micro-generation – See distributed generation.
Micro-wind turbines – Micro-wind turbines are small-scale turbines that convert wind energy into electricity in direct current (DC) form. An inverter is then used to transform DC output into alternating current (AC) form for regular residential and commercial use.
MSA – Market Surveillance Administrator
Nitrogen oxides (NOX) – Nitrogen oxides are chemical compounds of oxygen and nitrogen. They are produced during the combustion of fossil fuels, particularly at high temperatures and contribute to ground-level ozone.
OHSAS 18001 – The internationally recognized assessment specifications for occupational health and safety management systems.
Parts per million (ppm) – A scientific measurement used to report minute concentrations of a substance.
Polychlorinated biphenyls (PCBs) – A group of chemical compounds formerly used as coolants and lubricants in electrical equipment. Production of equipment with these chemicals was banned in the early 1980s as they were found to bio-accumulate and are toxic in high concentrations.
Power Purchase Arrangements (PPAs) – Long-term contract-like instruments under which the rights to the output from some large generating units in Alberta were transferred from the plant owner to another party that purchased
that right, such as ENMAX, in return for a formula-based revenue stream. ENMAX obtains most of the electricity we sell to customers through the KeephillsandBattleRiverPPAs.
Peaking facility – A power generation facility designed to supplement generation capacity during periods of high electrical demand.
RRO – Regulated rate option
Solar hot water – Solar thermal technology, which converts solar energy into heated water that can be used for domestic use or space heating.
Solar photovoltaic panels system – Solar photovoltaic (PV) panels convert the sun’s energy into electricity. There are different types of PV panels, differentiated largely by the manufacturing process, materials used and end function.
Stakeholders – ENMAX stakeholders include customers, First Nations, residents, landowners and businesses impacted by capital projects, government, community associations, business associations, synergy groups, non-governmental organization, special interest groups and industry members.
Sulphur dioxide – Sulphur dioxide is a gas that is a by-product of combusting fossilfuelscontainingsulphur,suchascoalorsournaturalgas.SO2 is a primary cause of acid rain. ENMAX’s natural gas-fuelled generation facilities donotemitSO2.
System Average Interruption Frequency Index (SAIFI) – SAIFI is the average number of power service interruptions greater than or equal to one minute that a customer experiences over the course of a year.
System Average Interruption Duration Index (SAIDI) – SAIDI is the average duration of a power service interruption that a customer experiences over the course of a year.
Tonne – A unit of mass equivalent to 1,000 kilograms.
Total Recordable Injury Frequency (TRIF) – The total number of recordable injuries that occur during a calendar year for every 200,000 hours worked, not just those that result in lost time.
Transmission – The transfer of electricity from generating stations to substations in local areas using large, high-voltage power line.
2013 Corporate Responsibility Report 37
Our corporate headquarters are located at: 141 - 50 Avenue SE Calgary, Alberta T2G 4S7
Contact our reception at: Phone: 403-514-3000 Fax: 403-514-3365
Please direct corporate responsibility inquiries or comment about our 2013 CR report to:LaurieHealey CorporateResponsibilityOffice 403-514-2895 [email protected]
Please direct financial inquiries to: DavidHalford Executive Vice President, Finance and Planning, ChiefFinancialOfficerandChiefRiskOfficer 403-514-3000
Please direct media inquiries to: DorisKaufmannWoodrock Senior Media Relations Advisor 403-689-6150
Shopping for retail energy offers? The latest prices and packages are listed on our website at enmax.com or by calling toll-free across Alberta at 310-2010.
Youcanchooseanyretailerlistedatwww.ucahelps.gov.ab.ca or at 310-4822. Electricity delivery to your home or business is not affected by your choice of retailer.
Learn more about smarter energy options: Smart choices start here. Visit generatechoice.ca.
Join our Facebook group at facebook.com/enmaxenergy
Follow us on Twitter at twitter.com/enmax
Find additional information relating to ENMAX at enmax.com.
Thank you ENMAX extends a sincere thank you to the customers and employees who participated in this year’s report.
CORPORATE INFORMATION
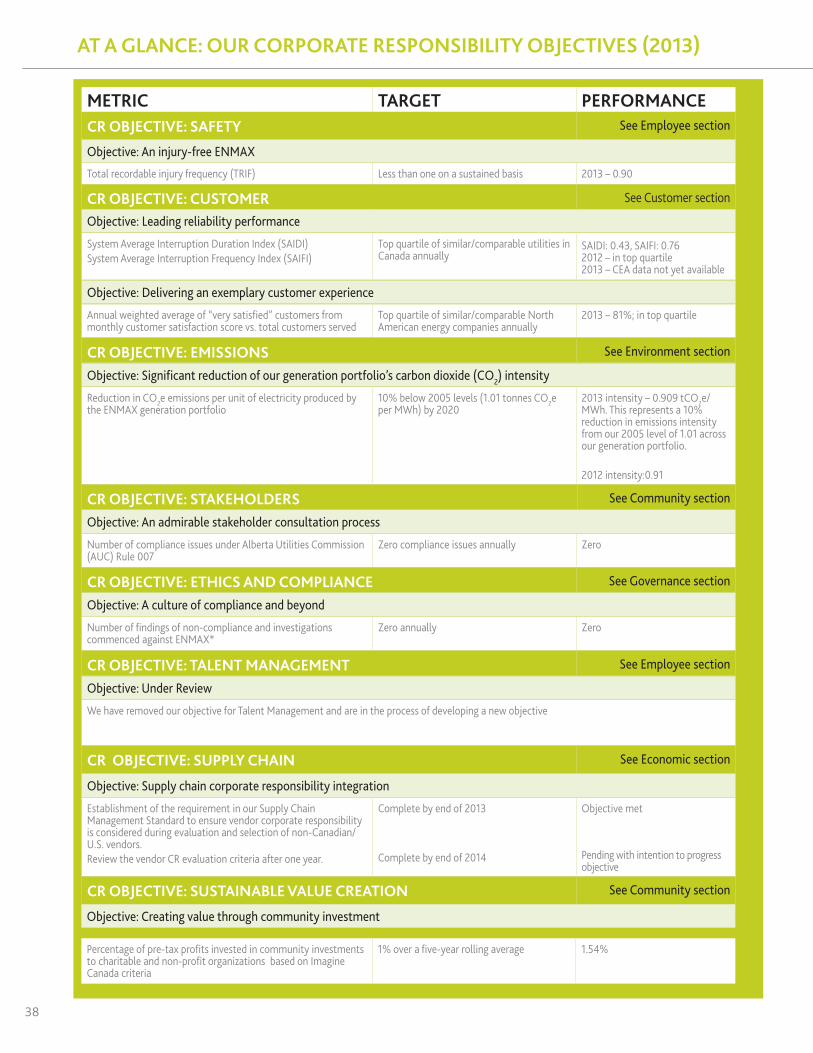
38
AT A GLANCE: OUR CORPORATE RESPONSIBILITY OBJECTIVES (2013)
METRIC TARGET PERFORMANCECR OBJECTIVE: SAFETY See Employee section
Objective: An injury-free ENMAX
Total recordable injury frequency (TRIF) Less than one on a sustained basis 2013 – 0.90
CR OBJECTIVE: CUSTOMER See Customer section
Objective: Leading reliability performance
System Average Interruption Duration Index (SAIDI) System Average Interruption Frequency Index (SAIFI)
Top quartile of similar/comparable utilities in Canada annually
SAIDI: 0.43, SAIFI: 0.762012 – in top quartile 2013 – CEA data not yet available
Objective: Delivering an exemplary customer experience
Annual weighted average of “very satisfied” customers from monthly customer satisfaction score vs. total customers served
Top quartile of similar/comparable North American energy companies annually
2013 – 81%; in top quartile
CR OBJECTIVE: EMISSIONS See Environment section
Objective: Significant reduction of our generation portfolio’s carbon dioxide (CO2) intensity
ReductioninCO2e emissions per unit of electricity produced by the ENMAX generation portfolio
10%below2005levels(1.01tonnesCO2e per MWh) by 2020
2013intensity–0.909tCO2e/MWh. This represents a 10% reduction in emissions intensity from our 2005 level of 1.01 across our generation portfolio.
2012 intensity:0.91
CR OBJECTIVE: STAKEHOLDERS See Community section
Objective: An admirable stakeholder consultation process
Number of compliance issues under Alberta Utilities Commission (AUC) Rule 007
Zero compliance issues annually Zero
CR OBJECTIVE: ETHICS AND COMPLIANCE See Governance section
Objective: A culture of compliance and beyond
Number of findings of non-compliance and investigations commenced against ENMAX*
Zero annually Zero
CR OBJECTIVE: TALENT MANAGEMENT See Employee section
Objective: Under Review
We have removed our objective for Talent Management and are in the process of developing a new objective
CR OBJECTIVE: SUPPLY CHAIN See Economic section
Objective: Supply chain corporate responsibility integration
Establishment of the requirement in our Supply Chain Management Standard to ensure vendor corporate responsibility is considered during evaluation and selection of non-Canadian/U.S. vendors. Review the vendor CR evaluation criteria after one year.
Complete by end of 2013
Complete by end of 2014
Objectivemet
Pending with intention to progress objective
CR OBJECTIVE: SUSTAINABLE VALUE CREATION See Community section
Objective: Creating value through community investment
Percentage of pre-tax profits invested in community investments to charitable and non-profit organizations based on Imagine Canada criteria
1% over a five-year rolling average 1.54%