2013 maryland report card - ccps · report card state of maryland ... “na” indicates too few...
TRANSCRIPT

Ch
arle
s C
oun
ty2013Report Card
State of Maryland and Charles County Public Schools
P.O. Box 2770, 5980 Radio Station Road, La Plata, Maryland 20646301-932-6610, 301-870-3814www.ccboe.com

Visit MdReportCard.org for up-to-date and disaggregated information. For definitions, see school system report pages.
“na” indicates too few students for School Progress rules. “*” indicates no students or fewer than 10 students in category.
2013 School Progress
All StudentsAmerican Indian or
Alaska NativeAsian
Black or African American
Hispanic/Latino of any raceNative Hawaiian or
Other Pacific Islander White
Two or more races
Free/Reduced Meals
Special Education
Limited English Proficient
School ProgressWith the new accountability program approved under Maryland’s Elementary and Secondary Education Act (ESEA) Flexibility Application, Annual Yearly Progress (AYP) status is no longer being used or reported for accountability. Student achievement on reading and mathematics, and other academic indicators of attendance rate and graduation rate are measured under School Progress. The Annual Measurable Objectives (AMOs) have been changed to reflect school specific new baseline data (2011) and a new target year (2017).
Annual Measurable Objectives (AMOs)The AMOs are on a trajectory toward 2017, the time by which each individual school is expected to reduce its percent of non-proficient students for each of its subgroups and overall by half. The progress of each school toward meeting its own unique targets provides valuable information over time on the effectiveness of instructional strategies, the inherent needs of the students, and the extent to which the school is fulfilling those needs.
Participation RateParticipation Rate is based on the number of students enrolled on the day of testing. Federal regulations require that at least 95 percent of the students enrolled on the testing day take the test. Students who are unable to take the test at the regular time or during the make-up time because of a medical emergency do not count against the school’s participation rate.
Attendance RateAttendance Rate is the percentage of students in school for at least half of the average school day during the school year. Attendance is a school accountability measure for elementary and middle schools. Yearly targets are set for attendance so that by the end of school year 2013-14, the State, schools, and school systems will achieve and maintain an attendance rate of at least 94 percent.
Teacher QualificationsThe percentage of teachers in each category is based on the number of teachers who have credentials and are teaching core academic subjects as defined by the federal government under the No Child Left Behind Act. The core academic subjects are English, reading or language arts, mathematics, science, foreign languages, civics and government, economics, arts, history, and geography. Teachers who are teaching other subjects are not included in the totals.
Standard Professional Certificate: A Standard Professional Certificate indicates the teacher meets all certification requirements.
Advanced Professional Certificate: The Advanced Professional Certificate requires three years of satisfactory professional school-related experience, and a master’s degree or a minimum of 36 semester hours of post baccalaureate course work.
Resident Teacher Certificate: The Resident Teacher Certificate is issued to a teacher in an approved alternative preparation program at the request of a local school system superintendent.
Conditional Certificate: The Conditional Certificate is issued only at the request of a local school system superintendent to an applicant who has a bachelor’s degree but does not meet all certification requirements.
Highly Qualified Teachers: “Highly qualified” is specifically defined by federal law. Teachers must meet minimum requirements both in content knowledge and teaching skills. Teachers must have a bachelor’s degree, full State certification, and demonstrate content knowledge in the subjects they teach.
Cohort Graduation RateThe U.S. Department of Education now requires each state to use an adjusted cohort graduation rate for school accountability. The adjusted cohort graduation rate ensures that all students who entered 9th grade together are counted in the graduation rate at the end of 4 years and at the end of 5 years.
The cohort graduation rate data for 2012 is the 4-year rate for the student cohort entering grade nine for the first time in fall 2008 and graduating no later than 2012; the 2012 5-year rate is the same cohort graduating no later than 2013.
All Students Attendance Rate:
Charles County
Met
Percent Proficient Participation Rate Graduation
Reading Math Reading Math
Not Met Not Met Met Met Met
Met Met Met Met na
Met Met Met Met Met
Not Met Not Met Met Met Met
Not Met Met Met Met Met
Met Met na na na
Not Met Not Met Met Met Met
Not Met Not Met Met Met Not Met
Not Met Not Met Met Met Met
Not Met Not Met Met Met Met
Met Met Met Met na
Attendance Rate %County
2013County
2012State 2013
State 2012
Elementary ≥95.0 ≥95.0 95.5 95.9Middle ≥95.0 ≥95.0 95.1 95.4High 93.9 93.8 92.5 92.2
Teacher Qualifications% of certificates:
Standard Professional 38.4 41.0 28.4 29.0Advanced Professional 58.0 57.0 65.1 65.2Resident Teacher 0.0 0.0 0.8 0.9Conditional Teacher 0.9 1.1 0.9 0.9
% of classes NOT taught by highly qualified teachers:All Quartiles 3.9 4.5 6.2 6.9Elementary Low Poverty 1.1 0.5 2.4 2.3Elementary High Poverty * * 6.6 12.1Secondary Low Poverty 3.2 3.8 5.6 5.4Secondary High Poverty 22.9 24.1 14.0 16.1
Cohort Graduation Rate %Class of 2012 (4-Yr Rate) 89.76 83.57Class of 2012 (5-Yr Rate) 92.42 86.32

Basic % Proficient % Advanced %Proficient % Advanced %
Maryland School Assessment (MSA)The MSA measures what
students in grades 3-8
know about reading and
mathematics. High school
performance is measured
by the English and Algebra/
Data Analysis High School
Assessment (HSA). Science was
measured in grades 5 and 8
and by the Biology HSA starting
in 2012. Science is not part of
School Progress. Performance
is reported as the percent of
students in each grade who
achieved the Basic, Proficient,
or Advanced standard. All
students should be achieving
at the Proficient or Advanced
standard. High school special
education students working
on grade level content who
may need an assessment
that is more accessible for a
student with disabilities may
be eligible to take the Mod-
HSA. This is determined by
the Individualized Education
Program (IEP) Team.
MSA Proficiency Levels Approximately 99% of Maryland students take MSA. The Basic Level is below the goal set for all students.
Visit MdReportCard.org for up-to-date and disaggregated information. For definitions, see school system report pages.
Reading: English: Mathematics: Algebra/Data Analysis: Science: Biology:
Basi
c %
Students are unable to read and understand literature and passages of information that are written for students in their grade.
Students have difficulty comprehending grade-appropriate literature and applying language choices when writing.
Students show they have only partially mastered the skills and concepts that Maryland expects students to know and be able to do at this grade level.
Students show they have only partially mastered the skills and concepts defined in the Maryland Algebra/Data Analysis Core Learning Goals.
Students show they need more work to attain proficiency. They use minimal supporting evidence, and responses provide little or no synthesis of information.
Students demonstrate a minimal understanding of biology concepts, principles, and/or skills. Student responses indicate limited synthesis of information and understanding of scientific terminology.
Profi
cien
t %
Students can read text written for students in their grade, and they can demonstrate the ability to understand literature and passages of information.
Students can comprehend grade-appropriate literature and apply appropriate language choices when writing.
Students show they have an understanding of fundamental grade level skills and concepts and can generally solve entry-level problems in mathematics.
Students show they have an understanding of fundamental algebra/data analysis skills and concepts and can generally solve entry-level problems in algebra/data analysis.
Students use supporting evidence that is generally complete with some integration of scientific concepts, principles, and/or skills.
Students demonstrate a realistic and rigorous level of achievement by providing evidence of an understanding of biology concepts and the ability to use scientific evidence to generally integrate scientific concepts, principles, and/or skills. Student responses indicate some synthesis of information and understanding of scientific terminology.
Adva
nced
%
Students can regularly read text that is above their grade level, and they can demonstrate the ability to understand complex literature and passages of information.
Students can regularly comprehend and interpret complex literature and consistently apply appropriate language choices to write effectively.
Students show they can regularly solve complex problems in mathematics and demonstrate superior ability to reason mathematically.
Students can regularly solve complex algebra/data analysis problems and demonstrate superior ability to reason mathematically.
Students use scientific evidence to demonstrate a full integration of scientific concepts, principles, and/or skills.
Students demonstrate an exemplary level of achievement by providing evidence of a complete understanding of biology concepts and the ability to use scientific evidence to fully integrate scientific concepts, principles, and/or skills. Student responses indicate a complete synthesis of information and understanding of scientific terminology.
Description of MSA Proficiency Levels
Mat
hem
atic
sRe
adin
gSc
ienc
e
•A 2013
2012
2012
8 2013
20127 2013
20126 2013
2012
5 2013
2012
4 2013
2012
3 2013
•E 2013
2012
8 2013
20127 2013
20126 2013
2012
5 2013
2012
4 2013
2012
3 2013
2012
5 2013
•B 2013
2012
8 2013
2012
2012
“*” indicates no students or fewer than 10 students in category. • E: English; • A: Algebra/Data Analysis; • B: Biology
100 50 0 50 100
22.1
20.6
29.8
34.2
56.6
55.1
43.5
41.8
48.1
45.7
46.1
44.2
27.8
28.2
28.9
38.7
46.7
51.2
25.3
30.5
29.1
35.5
23.3
26.9
30.6
33.1
30.8
30.8
10.611.1
6.7
21.9
7.4
22.1
60.5
64.4
58.4
55.6
31.8
34.9
40.6
42.7
36.9
35.5
34.9
36.6
55.3
54.9
17.4
15.0
11.8
10.2
11.6
10.1
15.9
15.5
15.0
18.8
19.0
19.2
17.0
16.9
53.3
49.0
42.1
38.6
55.5
54.8
48.0
47.6
49.3
49.5
36.4
36.2
53.4
53.1
17.8
12.2
11.2
10.1
19.1
14.7
22.9
17.0
27.4
23.7
33.0
30.7
15.8
16.1
56.457.5
64.6
60.7
63.3
59.6
33.031.5
28.6
17.4
29.3
18.3
20.0
16.4
27.8
29.9
49.7
51.5
37.7
39.7
47.2
41.8
40.7
41.5
23.0
23.0
26.0
32.2
43.7
47.1
20.4
24.5
33.0
36.8
25.2
26.2
33.9
38.5
28.2
25.8
8.27.0
≤5.0
16.9
≤5.0
18.1
60.6
66.3
59.1
58.3
35.1
37.8
45.2
46.0
36.5
38.5
37.5
41.0
66.6
65.7
19.4
17.3
13.1
11.8
15.2
10.7
17.1
14.2
16.3
19.8
21.8
17.4
10.4
11.3
53.2
52.5
43.0
41.5
55.6
58.4
46.8
51.0
53.5
52.1
38.3
37.2
62.0
64.5
20.8
15.3
13.3
11.4
24.0
17.1
20.1
12.2
21.3
21.7
27.9
24.4
9.7
9.7
56.356.1
64.9
71.5
64.9
66.9
35.637.0
31.6
11.6
32.7
15.0
100 50 0 50 100
Charles County
Basic % Proficient % Advanced %Proficient % Advanced %
Mat
hem
atic
sRe
adin
gSc
ienc
e
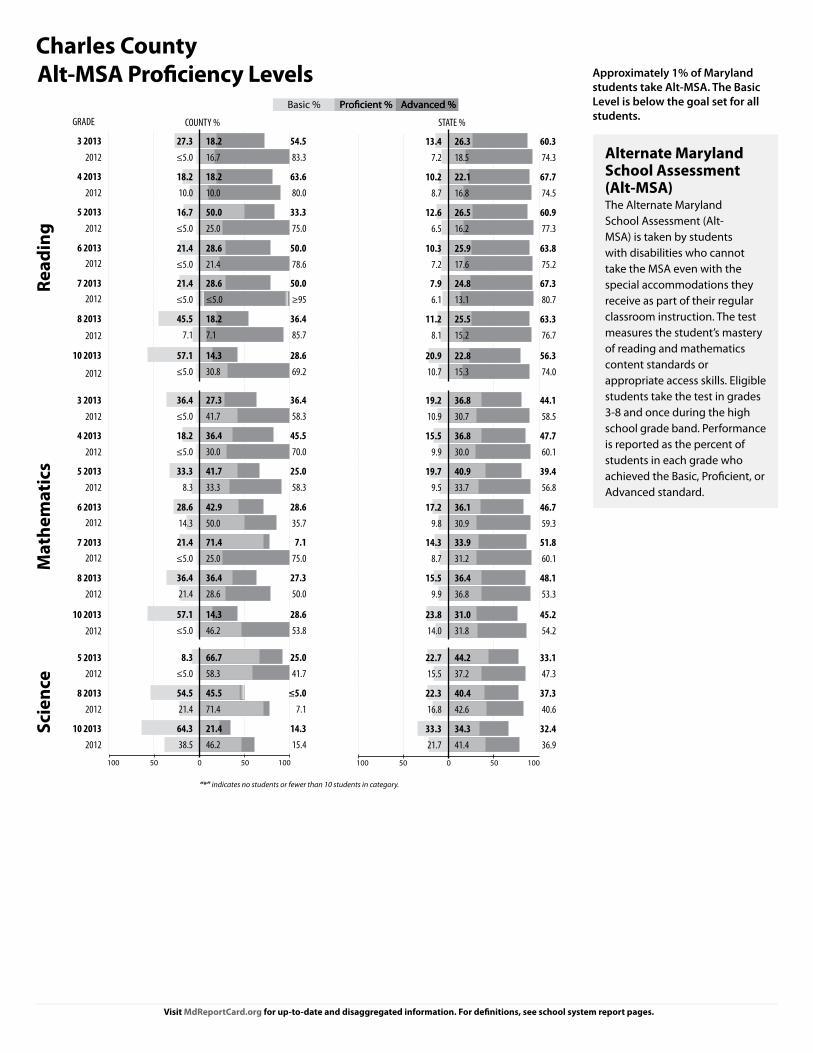
Alternate Maryland School Assessment (Alt-MSA) The Alternate Maryland School Assessment (Alt-MSA) is taken by students with disabilities who cannot take the MSA even with the special accommodations they receive as part of their regular classroom instruction. The test measures the student’s mastery of reading and mathematics content standards or appropriate access skills. Eligible students take the test in grades 3-8 and once during the high school grade band. Performance is reported as the percent of students in each grade who achieved the Basic, Proficient, or Advanced standard.
Alt-MSA Proficiency Levels Approximately 1% of Maryland students take Alt-MSA. The Basic Level is below the goal set for all students.
10 2013
2012
8 2013
20127 2013
20126 2013
2012
5 2013
2012
4 2013
2012
3 2013
2012
10 2013
2012
8 2013
20127 2013
20126 2013
2012
5 2013
2012
4 2013
2012
3 2013
2012
5 2013
10 2013
2012
8 2013
2012
2012
“*” indicates no students or fewer than 10 students in category.
Visit MdReportCard.org for up-to-date and disaggregated information. For definitions, see school system report pages.
100 50 0 50 100
60.3
74.3
67.7
74.5
60.9
77.3
63.8
75.2
67.3
80.7
63.3
76.7
56.3
74.0
44.1
58.5
47.7
60.1
39.4
56.8
46.7
59.3
51.8
60.1
48.1
53.3
45.2
54.2
33.147.3
40.6
37.3
32.4
36.9
26.3
18.5
22.1
16.8
26.5
16.2
25.9
17.6
24.8
13.1
25.5
15.2
22.8
15.3
13.4
7.2
10.2
8.7
12.6
6.5
10.3
7.2
7.9
6.1
11.2
8.1
20.9
10.7
36.8
30.7
36.8
30.0
40.9
33.7
36.1
30.9
33.9
31.2
36.4
36.8
31.0
31.8
19.2
10.9
15.5
9.9
19.7
9.5
17.2
9.8
14.3
8.7
15.5
9.9
23.8
14.0
44.237.2
42.6
40.4
34.3
41.4
22.715.5
16.8
22.3
33.3
21.7
54.5
83.3
63.6
80.0
33.3
75.0
50.0
78.6
50.0
≥95
36.4
85.7
28.6
69.2
36.4
58.3
45.5
70.0
25.0
58.3
28.6
35.7
7.1
75.0
27.3
50.0
28.6
53.8
25.041.7
7.1
≤5.0
14.3
15.4
18.2
16.7
18.2
10.0
50.0
25.0
28.6
21.4
28.6
≤5.0
18.2
7.1
14.3
30.8
27.3
≤5.0
18.2
10.0
16.7
≤5.0
21.4
≤5.0
21.4
≤5.0
45.5
7.1
57.1
≤5.0
27.3
41.7
36.4
30.0
41.7
33.3
42.9
50.0
71.4
25.0
36.4
28.6
14.3
46.2
36.4
≤5.0
18.2
≤5.0
33.3
8.3
28.6
14.3
21.4
≤5.0
36.4
21.4
57.1
≤5.0
66.758.3
71.4
45.5
21.4
46.2
8.3≤5.0
21.4
54.5
64.3
38.5
100 50 0 50 100
Charles County
Visit MdReportCard.org for up-to-date and disaggregated information. For definitions, see school system report pages.
†College and Career Preparation (CCP) - 2011 ††Data from 2012
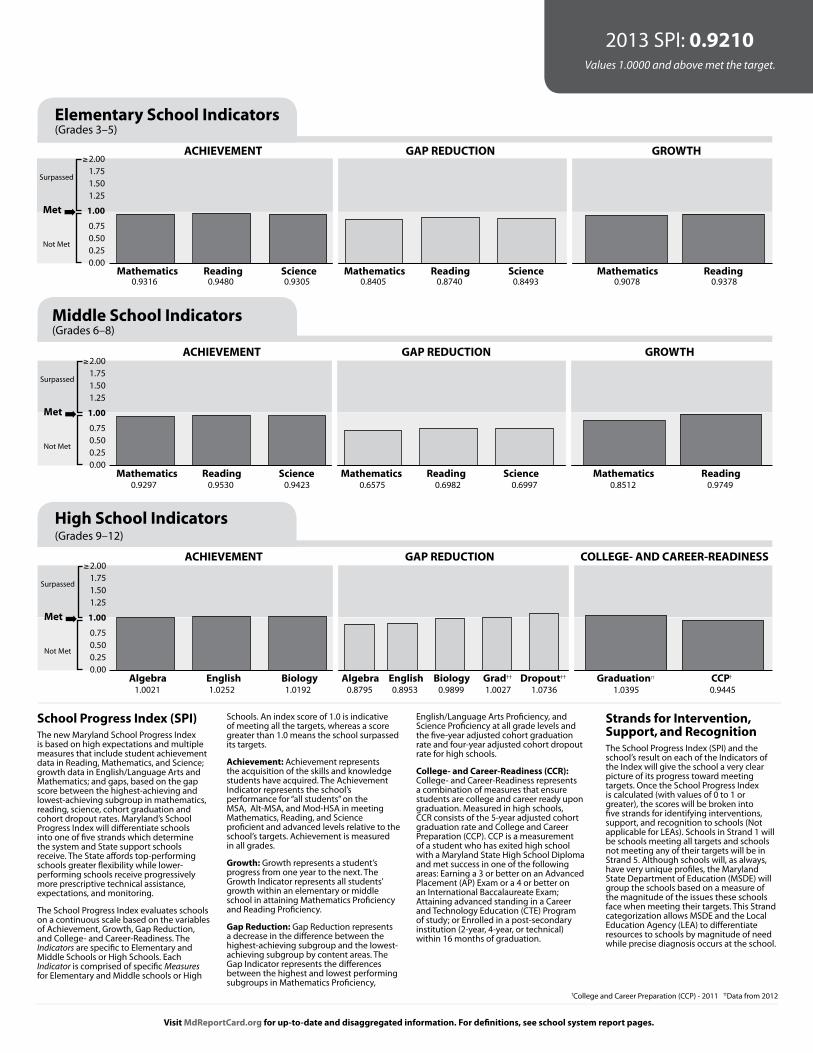
2013 SPI: 0.9210Values 1.0000 and above met the target.
School Progress Index (SPI) The new Maryland School Progress Index is based on high expectations and multiple measures that include student achievement data in Reading, Mathematics, and Science; growth data in English/Language Arts and Mathematics; and gaps, based on the gap score between the highest-achieving and lowest-achieving subgroup in mathematics, reading, science, cohort graduation and cohort dropout rates. Maryland’s School Progress Index will differentiate schools into one of five strands which determine the system and State support schools receive. The State affords top-performing schools greater flexibility while lower-performing schools receive progressively more prescriptive technical assistance, expectations, and monitoring.
The School Progress Index evaluates schools on a continuous scale based on the variables of Achievement, Growth, Gap Reduction, and College- and Career-Readiness. The Indicators are specific to Elementary and Middle Schools or High Schools. Each Indicator is comprised of specific Measures for Elementary and Middle schools or High
Schools. An index score of 1.0 is indicative of meeting all the targets, whereas a score greater than 1.0 means the school surpassed its targets.
Achievement: Achievement represents the acquisition of the skills and knowledge students have acquired. The Achievement Indicator represents the school’s performance for “all students” on the MSA, Alt-MSA, and Mod-HSA in meeting Mathematics, Reading, and Science proficient and advanced levels relative to the school’s targets. Achievement is measured in all grades.
Growth: Growth represents a student’s progress from one year to the next. The Growth Indicator represents all students’ growth within an elementary or middle school in attaining Mathematics Proficiency and Reading Proficiency.
Gap Reduction: Gap Reduction represents a decrease in the difference between the highest-achieving subgroup and the lowest-achieving subgroup by content areas. The Gap Indicator represents the differences between the highest and lowest performing subgroups in Mathematics Proficiency,
English/Language Arts Proficiency, and Science Proficiency at all grade levels and the five-year adjusted cohort graduation rate and four-year adjusted cohort dropout rate for high schools.
College- and Career-Readiness (CCR): College- and Career-Readiness represents a combination of measures that ensure students are college and career ready upon graduation. Measured in high schools, CCR consists of the 5-year adjusted cohort graduation rate and College and Career Preparation (CCP). CCP is a measurement of a student who has exited high school with a Maryland State High School Diploma and met success in one of the following areas: Earning a 3 or better on an Advanced Placement (AP) Exam or a 4 or better on an International Baccalaureate Exam; Attaining advanced standing in a Career and Technology Education (CTE) Program of study; or Enrolled in a post-secondary institution (2-year, 4-year, or technical) within 16 months of graduation.
Strands for Intervention, Support, and Recognition The School Progress Index (SPI) and the school’s result on each of the Indicators of the Index will give the school a very clear picture of its progress toward meeting targets. Once the School Progress Index is calculated (with values of 0 to 1 or greater), the scores will be broken into five strands for identifying interventions, support, and recognition to schools (Not applicable for LEAs). Schools in Strand 1 will be schools meeting all targets and schools not meeting any of their targets will be in Strand 5. Although schools will, as always, have very unique profiles, the Maryland State Department of Education (MSDE) will group the schools based on a measure of the magnitude of the issues these schools face when meeting their targets. This Strand categorization allows MSDE and the Local Education Agency (LEA) to differentiate resources to schools by magnitude of need while precise diagnosis occurs at the school.
Surpassed
≥2.001.751.501.25
Met ➡ 1.00
Not Met
0.750.500.250.00
Surpassed
≥2.001.751.501.25
Met ➡ 1.00
Not Met
0.750.500.250.00
ACHIEVEMENT GAP REDUCTION GROWTH
Mathematics Reading Science Mathematics Reading Science Mathematics Reading
ACHIEVEMENT GAP REDUCTION GROWTH
Mathematics Reading Science Mathematics Reading Science Mathematics Reading
Middle School Indicators (Grades 6–8)
Surpassed
≥2.001.751.501.25
Met ➡ 1.00
Not Met
0.750.500.250.00
ACHIEVEMENT GAP REDUCTION COLLEGE- AND CAREER-READINESS
Algebra English Biology Algebra English Biology Grad†† Dropout†† Graduation†† CCP†
High School Indicators (Grades 9–12)
0.9297
0.9316
1.0021
0.9530
0.9480
1.0252
0.9423
0.9305
1.0192
0.6575
0.8405
0.8795
0.6982
0.8740
0.8953
0.6997
0.8493
0.9899 1.0027 1.0736
0.8512
0.9078
1.0395
0.9749
0.9378
0.9445
Elementary School Indicators (Grades 3–5)

Basic % Proficient % Advanced %
MSA Proficiency LevelsApproximately 99% of Maryland students take MSA. The Basic Level is below the goal set for all students.
Alt-MSA Proficiency LevelsApproximately 1% of Maryland students take Alt-MSA. The Basic Level is below the goal set for all students.
Visit MdReportCard.org for up-to-date and disaggregated information. For definitions, see school system report pages.
Read
ing
Mat
hem
atic
sSc
ienc
e
17.4 60.5 22.115.0 64.4 20.6
11.8 58.4 29.810.2 55.6 34.2
11.6 31.8 56.610.1 34.9 55.1
15.9 40.6 43.515.5 42.7 41.8
15.0 36.9 48.118.8 35.5 45.7
19.0 34.9 46.119.2 36.6 44.2
17.0 55.3 27.816.9 54.9 28.2
17.8 53.3 28.912.2 49.0 38.7
11.2 42.1 46.710.1 38.6 51.2
19.1 55.5 25.314.7 54.8 30.5
22.9 48.0 29.117.0 47.6 35.5
27.4 49.3 23.323.7 49.5 26.9
33.0 36.4 30.630.7 36.2 33.1
15.8 53.4 30.816.1 53.1 30.8
33.0 56.4 10.631.5 57.5 11.1
28.6 64.6 6.729.3 63.3 7.4
17.4 60.7 21.918.3 59.6 22.1
13.4 26.3 60.37.2 18.5 74.3
10.2 22.1 67.78.7 16.8 74.5
12.6 26.5 60.96.5 16.2 77.3
10.3 25.9 63.87.2 17.6 75.2
7.9 24.8 67.36.1 13.1 80.7
11.2 25.5 63.38.1 15.2 76.7
20.9 22.8 56.310.7 15.3 74.0
19.2 36.8 44.110.9 30.7 58.5
15.5 36.8 47.79.9 30.0 60.1
19.7 40.9 39.49.5 33.7 56.8
17.2 36.1 46.79.8 30.9 59.3
14.3 33.9 51.88.7 31.2 60.1
15.5 36.4 48.19.9 36.8 53.3
23.8 31.0 45.214.0 31.8 54.2
22.7 44.2 33.115.5 37.2 47.3
22.3 40.4 37.316.8 42.6 40.6
33.3 34.3 32.421.7 41.4 36.9
“na” indicates too few students for School Progress rules. “*” indicates no students or fewer than 10 students in category. • E: English; • A: Algebra/Data Analysis; • B: Biology
3 20132012
4 20132012
5 20132012
6 20132012
7 20132012
8 20132012
10 20132012
3 20132012
4 20132012
5 20132012
6 20132012
7 20132012
8 20132012
10 20132012
5 20132012
8 20132012
10 20132012
3 20132012
4 20132012
5 20132012
6 20132012
7 20132012
8 20132012
•E 20132012
3 20132012
4 20132012
5 20132012
6 20132012
7 20132012
8 20132012
•A 20132012
5 20132012
8 20132012
•B 20132012
All Students Attendance Rate: Met
19.4 60.6 20.017.3 66.3 16.4
13.1 59.1 27.811.8 58.3 29.9
15.2 35.1 49.710.7 37.8 51.5
17.1 45.2 37.714.2 46.0 39.7
16.3 36.5 47.219.8 38.5 41.8
21.8 37.5 40.717.4 41.0 41.5
10.4 66.6 23.011.3 65.7 23.0
20.8 53.2 26.015.3 52.5 32.2
13.3 43.0 43.711.4 41.5 47.1
24.0 55.6 20.417.1 58.4 24.5
20.1 46.8 33.012.2 51.0 36.8
21.3 53.5 25.221.7 52.1 26.2
27.9 38.3 33.924.4 37.2 38.5
9.7 62.0 28.29.7 64.5 25.8
35.6 56.3 8.237.0 56.1 7.0
31.6 64.9 ≤5.032.7 64.9 ≤5.0
11.6 71.5 16.915.0 66.9 18.1
27.3 18.2 54.5≤5.0 16.7 83.3
18.2 18.2 63.610.0 10.0 80.0
16.7 50.0 33.3≤5.0 25.0 75.0
21.4 28.6 50.0≤5.0 21.4 78.6
21.4 28.6 50.0≤5.0 ≤5.0 ≥95.0
45.5 18.2 36.47.1 7.1 85.7
57.1 14.3 28.6≤5.0 30.8 69.2
36.4 27.3 36.4≤5.0 41.7 58.3
18.2 36.4 45.5≤5.0 30.0 70.0
33.3 41.7 25.08.3 33.3 58.3
28.6 42.9 28.614.3 50.0 35.7
21.4 71.4 7.1≤5.0 25.0 75.0
36.4 36.4 27.321.4 28.6 50.0
57.1 14.3 28.6≤5.0 46.2 53.8
8.3 66.7 25.0≤5.0 58.3 41.7
54.5 45.5 ≤5.021.4 71.4 7.1
64.3 21.4 14.338.5 46.2 15.4
Arthur Middleton Elementary School 0612
23.7 62.7 13.630.0 62.9 7.1
16.4 61.2 22.47.9 64.5 27.6
11.7 39.0 49.414.1 38.0 47.9
* * ** * *
* * ** * *
* * ** * *
* * ** * *
28.8 61.0 10.231.4 58.6 10.0
20.3 47.8 31.914.5 48.7 36.8
38.5 48.7 12.823.9 60.6 15.5
* * ** * *
* * ** * *
* * ** * *
* * ** * *
39.0 54.5 6.552.1 45.1 ≤5.0
* * ** * *
* * ** * *
* * ** * *
* * ** * *
* * ** * *
* * ** * *
* * ** * *
* * ** * *
* * ** * *
* * ** * *
* * ** * *
* * ** * *
* * ** * *
* * ** * *
* * ** * *
* * ** * *
* * ** * *
* * ** * *
* * ** * *
2013 School Progress
All StudentsAmerican Indian or
Alaska NativeAsian
Black or African American
Hispanic/Latino of any raceNative Hawaiian or
Other Pacific Islander White
Two or more races
Free/Reduced Meals
Special Education
Limited English Proficient
Percent Proficient Participation RateReading Math Reading Math
Met Not Met Met Met
na na na na
Not Met Not Met na na
Met Not Met Met Met
Met Met na na
* * * *
Met Met na na
Met Met na na
Met Not Met Met Met
Not Met Not Met na na
na na na na
2013 School Progress Index SPI: 0.8748 Strand: 5 Values 1.0000 and above met the target.
Achievement Gap Red. GrowthElementary
Math 0.8561 0.6491 0.8486Reading 0.9376 0.7108 0.9676Science 1.0719 1.0084
Attendance Rate %School
2013School
2012County
2013County
2012State 2013
State 2012
Elementary ≥95.0 ≥95.0 ≥95.0 ≥95.0 95.5 95.9
Middle * * ≥95.0 ≥95.0 95.1 95.4
High * * 93.9 93.8 92.5 92.2Teacher Qualifications% of certificates:
Standard Professional 35.0 38.1 38.4 41.0 28.4 29.0
Advanced Professional 65.0 61.9 58.0 57.0 65.1 65.2
Resident Teacher 0.0 0.0 0.0 0.0 0.8 0.9
Conditional Teacher 0.0 0.0 0.9 1.1 0.9 0.9
% of classes NOT taught by:Highly Qualified Teachers 0.0 0.0 3.9 4.5 6.2 6.9

Basic % Proficient % Advanced %
MSA Proficiency LevelsApproximately 99% of Maryland students take MSA. The Basic Level is below the goal set for all students.
Alt-MSA Proficiency LevelsApproximately 1% of Maryland students take Alt-MSA. The Basic Level is below the goal set for all students.
Visit MdReportCard.org for up-to-date and disaggregated information. For definitions, see school system report pages.
Read
ing
Mat
hem
atic
sSc
ienc
e
“na” indicates too few students for School Progress rules. “*” indicates no students or fewer than 10 students in category. • E: English; • A: Algebra/Data Analysis; • B: Biology
3 20132012
4 20132012
5 20132012
6 20132012
7 20132012
8 20132012
10 20132012
3 20132012
4 20132012
5 20132012
6 20132012
7 20132012
8 20132012
10 20132012
5 20132012
8 20132012
10 20132012
3 20132012
4 20132012
5 20132012
6 20132012
7 20132012
8 20132012
•E 20132012
3 20132012
4 20132012
5 20132012
6 20132012
7 20132012
8 20132012
•A 20132012
5 20132012
8 20132012
•B 20132012
All Students Attendance Rate: Met
17.4 60.5 22.115.0 64.4 20.6
11.8 58.4 29.810.2 55.6 34.2
11.6 31.8 56.610.1 34.9 55.1
15.9 40.6 43.515.5 42.7 41.8
15.0 36.9 48.118.8 35.5 45.7
19.0 34.9 46.119.2 36.6 44.2
17.0 55.3 27.816.9 54.9 28.2
17.8 53.3 28.912.2 49.0 38.7
11.2 42.1 46.710.1 38.6 51.2
19.1 55.5 25.314.7 54.8 30.5
22.9 48.0 29.117.0 47.6 35.5
27.4 49.3 23.323.7 49.5 26.9
33.0 36.4 30.630.7 36.2 33.1
15.8 53.4 30.816.1 53.1 30.8
33.0 56.4 10.631.5 57.5 11.1
28.6 64.6 6.729.3 63.3 7.4
17.4 60.7 21.918.3 59.6 22.1
13.4 26.3 60.37.2 18.5 74.3
10.2 22.1 67.78.7 16.8 74.5
12.6 26.5 60.96.5 16.2 77.3
10.3 25.9 63.87.2 17.6 75.2
7.9 24.8 67.36.1 13.1 80.7
11.2 25.5 63.38.1 15.2 76.7
20.9 22.8 56.310.7 15.3 74.0
19.2 36.8 44.110.9 30.7 58.5
15.5 36.8 47.79.9 30.0 60.1
19.7 40.9 39.49.5 33.7 56.8
17.2 36.1 46.79.8 30.9 59.3
14.3 33.9 51.88.7 31.2 60.1
15.5 36.4 48.19.9 36.8 53.3
23.8 31.0 45.214.0 31.8 54.2
22.7 44.2 33.115.5 37.2 47.3
22.3 40.4 37.316.8 42.6 40.6
33.3 34.3 32.421.7 41.4 36.9
19.4 60.6 20.017.3 66.3 16.4
13.1 59.1 27.811.8 58.3 29.9
15.2 35.1 49.710.7 37.8 51.5
17.1 45.2 37.714.2 46.0 39.7
16.3 36.5 47.219.8 38.5 41.8
21.8 37.5 40.717.4 41.0 41.5
10.4 66.6 23.011.3 65.7 23.0
20.8 53.2 26.015.3 52.5 32.2
13.3 43.0 43.711.4 41.5 47.1
24.0 55.6 20.417.1 58.4 24.5
20.1 46.8 33.012.2 51.0 36.8
21.3 53.5 25.221.7 52.1 26.2
27.9 38.3 33.924.4 37.2 38.5
9.7 62.0 28.29.7 64.5 25.8
35.6 56.3 8.237.0 56.1 7.0
31.6 64.9 ≤5.032.7 64.9 ≤5.0
11.6 71.5 16.915.0 66.9 18.1
27.3 18.2 54.5≤5.0 16.7 83.3
18.2 18.2 63.610.0 10.0 80.0
16.7 50.0 33.3≤5.0 25.0 75.0
21.4 28.6 50.0≤5.0 21.4 78.6
21.4 28.6 50.0≤5.0 ≤5.0 ≥95.0
45.5 18.2 36.47.1 7.1 85.7
57.1 14.3 28.6≤5.0 30.8 69.2
36.4 27.3 36.4≤5.0 41.7 58.3
18.2 36.4 45.5≤5.0 30.0 70.0
33.3 41.7 25.08.3 33.3 58.3
28.6 42.9 28.614.3 50.0 35.7
21.4 71.4 7.1≤5.0 25.0 75.0
36.4 36.4 27.321.4 28.6 50.0
57.1 14.3 28.6≤5.0 46.2 53.8
8.3 66.7 25.0≤5.0 58.3 41.7
54.5 45.5 ≤5.021.4 71.4 7.1
64.3 21.4 14.338.5 46.2 15.4
Benjamin Stoddert Middle School 0613
* * ** * *
* * ** * *
* * ** * *
27.4 44.3 28.315.4 55.4 29.2
17.3 43.7 39.031.1 41.0 27.9
33.8 44.1 22.121.5 46.0 32.5
* * ** * *
* * ** * *
* * ** * *
* * ** * *
28.1 46.4 25.520.7 53.3 26.0
30.0 49.6 20.436.7 55.7 7.7
39.7 42.6 17.638.6 31.8 29.5
* * ** * *
* * ** * *
45.5 53.5 ≤5.038.9 59.9 ≤5.0
* * ** * *
* * ** * *
* * ** * *
* * ** * *
* * ** * *
* * ** * *
* * ** * *
* * ** * *
* * ** * *
* * ** * *
* * ** * *
* * ** * *
* * ** * *
* * ** * *
* * ** * *
* * ** * *
* * ** * *
* * ** * *
2013 School Progress
All StudentsAmerican Indian or
Alaska NativeAsian
Black or African American
Hispanic/Latino of any raceNative Hawaiian or
Other Pacific Islander White
Two or more races
Free/Reduced Meals
Special Education
Limited English Proficient
Percent Proficient Participation RateReading Math Reading Math
Not Met Not Met Met Met
Met Met na na
Met Met na na
Not Met Not Met Met Met
Met Met na na
* * * *
Met Met Met Met
Met Met na na
Met Not Met Met Met
Not Met Met Met Met
Met Met na na
2013 School Progress Index SPI: 0.7484 Strand: 5 Values 1.0000 and above met the target.
Achievement Gap Red. GrowthMiddle
Math 0.8521 0.7726 0.8429Reading 0.9179 0.5510 0.9571Science 0.8272 0.3161
Attendance Rate %School
2013School
2012County
2013County
2012State 2013
State 2012
Elementary * * ≥95.0 ≥95.0 95.5 95.9
Middle ≥95.0 ≥95.0 ≥95.0 ≥95.0 95.1 95.4
High * * 93.9 93.8 92.5 92.2Teacher Qualifications% of certificates:
Standard Professional 63.2 57.1 38.4 41.0 28.4 29.0
Advanced Professional 36.8 40.5 58.0 57.0 65.1 65.2
Resident Teacher 0.0 0.0 0.0 0.0 0.8 0.9
Conditional Teacher 0.0 2.4 0.9 1.1 0.9 0.9
% of classes NOT taught by:Highly Qualified Teachers 2.4 5.0 3.9 4.5 6.2 6.9
Basic % Proficient % Advanced %
MSA Proficiency LevelsApproximately 99% of Maryland students take MSA. The Basic Level is below the goal set for all students.
Alt-MSA Proficiency LevelsApproximately 1% of Maryland students take Alt-MSA. The Basic Level is below the goal set for all students.
Visit MdReportCard.org for up-to-date and disaggregated information. For definitions, see school system report pages.
Read
ing
Mat
hem
atic
sSc
ienc
e
17.4 60.5 22.115.0 64.4 20.6
11.8 58.4 29.810.2 55.6 34.2
11.6 31.8 56.610.1 34.9 55.1
15.9 40.6 43.515.5 42.7 41.8
15.0 36.9 48.118.8 35.5 45.7
19.0 34.9 46.119.2 36.6 44.2
17.0 55.3 27.816.9 54.9 28.2
17.8 53.3 28.912.2 49.0 38.7
11.2 42.1 46.710.1 38.6 51.2
19.1 55.5 25.314.7 54.8 30.5
22.9 48.0 29.117.0 47.6 35.5
27.4 49.3 23.323.7 49.5 26.9
33.0 36.4 30.630.7 36.2 33.1
15.8 53.4 30.816.1 53.1 30.8
33.0 56.4 10.631.5 57.5 11.1
28.6 64.6 6.729.3 63.3 7.4
17.4 60.7 21.918.3 59.6 22.1
13.4 26.3 60.37.2 18.5 74.3
10.2 22.1 67.78.7 16.8 74.5
12.6 26.5 60.96.5 16.2 77.3
10.3 25.9 63.87.2 17.6 75.2
7.9 24.8 67.36.1 13.1 80.7
11.2 25.5 63.38.1 15.2 76.7
20.9 22.8 56.310.7 15.3 74.0
19.2 36.8 44.110.9 30.7 58.5
15.5 36.8 47.79.9 30.0 60.1
19.7 40.9 39.49.5 33.7 56.8
17.2 36.1 46.79.8 30.9 59.3
14.3 33.9 51.88.7 31.2 60.1
15.5 36.4 48.19.9 36.8 53.3
23.8 31.0 45.214.0 31.8 54.2
22.7 44.2 33.115.5 37.2 47.3
22.3 40.4 37.316.8 42.6 40.6
33.3 34.3 32.421.7 41.4 36.9
“na” indicates too few students for School Progress rules. “*” indicates no students or fewer than 10 students in category. • E: English; • A: Algebra/Data Analysis; • B: Biology
3 20132012
4 20132012
5 20132012
6 20132012
7 20132012
8 20132012
10 20132012
3 20132012
4 20132012
5 20132012
6 20132012
7 20132012
8 20132012
10 20132012
5 20132012
8 20132012
10 20132012
3 20132012
4 20132012
5 20132012
6 20132012
7 20132012
8 20132012
•E 20132012
3 20132012
4 20132012
5 20132012
6 20132012
7 20132012
8 20132012
•A 20132012
5 20132012
8 20132012
•B 20132012
All Students Attendance Rate: Met
19.4 60.6 20.017.3 66.3 16.4
13.1 59.1 27.811.8 58.3 29.9
15.2 35.1 49.710.7 37.8 51.5
17.1 45.2 37.714.2 46.0 39.7
16.3 36.5 47.219.8 38.5 41.8
21.8 37.5 40.717.4 41.0 41.5
10.4 66.6 23.011.3 65.7 23.0
20.8 53.2 26.015.3 52.5 32.2
13.3 43.0 43.711.4 41.5 47.1
24.0 55.6 20.417.1 58.4 24.5
20.1 46.8 33.012.2 51.0 36.8
21.3 53.5 25.221.7 52.1 26.2
27.9 38.3 33.924.4 37.2 38.5
9.7 62.0 28.29.7 64.5 25.8
35.6 56.3 8.237.0 56.1 7.0
31.6 64.9 ≤5.032.7 64.9 ≤5.0
11.6 71.5 16.915.0 66.9 18.1
27.3 18.2 54.5≤5.0 16.7 83.3
18.2 18.2 63.610.0 10.0 80.0
16.7 50.0 33.3≤5.0 25.0 75.0
21.4 28.6 50.0≤5.0 21.4 78.6
21.4 28.6 50.0≤5.0 ≤5.0 ≥95.0
45.5 18.2 36.47.1 7.1 85.7
57.1 14.3 28.6≤5.0 30.8 69.2
36.4 27.3 36.4≤5.0 41.7 58.3
18.2 36.4 45.5≤5.0 30.0 70.0
33.3 41.7 25.08.3 33.3 58.3
28.6 42.9 28.614.3 50.0 35.7
21.4 71.4 7.1≤5.0 25.0 75.0
36.4 36.4 27.321.4 28.6 50.0
57.1 14.3 28.6≤5.0 46.2 53.8
8.3 66.7 25.0≤5.0 58.3 41.7
54.5 45.5 ≤5.021.4 71.4 7.1
64.3 21.4 14.338.5 46.2 15.4
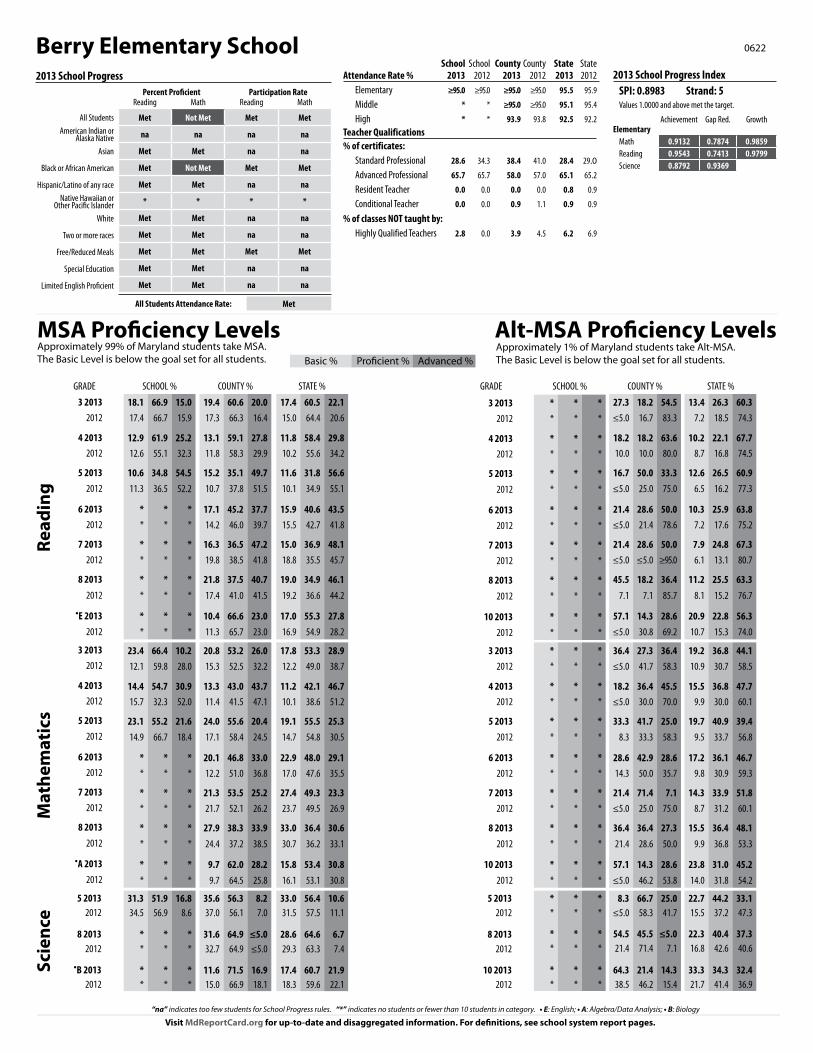
Berry Elementary School 0622
18.1 66.9 15.017.4 66.7 15.9
12.9 61.9 25.212.6 55.1 32.3
10.6 34.8 54.511.3 36.5 52.2
* * ** * *
* * ** * *
* * ** * *
* * ** * *
23.4 66.4 10.212.1 59.8 28.0
14.4 54.7 30.915.7 32.3 52.0
23.1 55.2 21.614.9 66.7 18.4
* * ** * *
* * ** * *
* * ** * *
* * ** * *
31.3 51.9 16.834.5 56.9 8.6
* * ** * *
* * ** * *
* * ** * *
* * ** * *
* * ** * *
* * ** * *
* * ** * *
* * ** * *
* * ** * *
* * ** * *
* * ** * *
* * ** * *
* * ** * *
* * ** * *
* * ** * *
* * ** * *
* * ** * *
* * ** * *
* * ** * *
2013 School Progress
All StudentsAmerican Indian or
Alaska NativeAsian
Black or African American
Hispanic/Latino of any raceNative Hawaiian or
Other Pacific Islander White
Two or more races
Free/Reduced Meals
Special Education
Limited English Proficient
Percent Proficient Participation RateReading Math Reading Math
Met Not Met Met Met
na na na na
Met Met na na
Met Not Met Met Met
Met Met na na
* * * *
Met Met na na
Met Met na na
Met Met Met Met
Met Met na na
Met Met na na
2013 School Progress Index SPI: 0.8983 Strand: 5 Values 1.0000 and above met the target.
Achievement Gap Red. GrowthElementary
Math 0.9132 0.7874 0.9859Reading 0.9543 0.7413 0.9799Science 0.8792 0.9369
Attendance Rate %School
2013School
2012County
2013County
2012State 2013
State 2012
Elementary ≥95.0 ≥95.0 ≥95.0 ≥95.0 95.5 95.9
Middle * * ≥95.0 ≥95.0 95.1 95.4
High * * 93.9 93.8 92.5 92.2Teacher Qualifications% of certificates:
Standard Professional 28.6 34.3 38.4 41.0 28.4 29.0
Advanced Professional 65.7 65.7 58.0 57.0 65.1 65.2
Resident Teacher 0.0 0.0 0.0 0.0 0.8 0.9
Conditional Teacher 0.0 0.0 0.9 1.1 0.9 0.9
% of classes NOT taught by:Highly Qualified Teachers 2.8 0.0 3.9 4.5 6.2 6.9
Basic % Proficient % Advanced %
MSA Proficiency LevelsApproximately 99% of Maryland students take MSA. The Basic Level is below the goal set for all students.
Alt-MSA Proficiency LevelsApproximately 1% of Maryland students take Alt-MSA. The Basic Level is below the goal set for all students.
Visit MdReportCard.org for up-to-date and disaggregated information. For definitions, see school system report pages.
Read
ing
Mat
hem
atic
sSc
ienc
e
“na” indicates too few students for School Progress rules. “*” indicates no students or fewer than 10 students in category. • E: English; • A: Algebra/Data Analysis; • B: Biology
3 20132012
4 20132012
5 20132012
6 20132012
7 20132012
8 20132012
10 20132012
3 20132012
4 20132012
5 20132012
6 20132012
7 20132012
8 20132012
10 20132012
5 20132012
8 20132012
10 20132012
3 20132012
4 20132012
5 20132012
6 20132012
7 20132012
8 20132012
•E 20132012
3 20132012
4 20132012
5 20132012
6 20132012
7 20132012
8 20132012
•A 20132012
5 20132012
8 20132012
•B 20132012
All Students Attendance Rate: Met
17.4 60.5 22.115.0 64.4 20.6
11.8 58.4 29.810.2 55.6 34.2
11.6 31.8 56.610.1 34.9 55.1
15.9 40.6 43.515.5 42.7 41.8
15.0 36.9 48.118.8 35.5 45.7
19.0 34.9 46.119.2 36.6 44.2
17.0 55.3 27.816.9 54.9 28.2
17.8 53.3 28.912.2 49.0 38.7
11.2 42.1 46.710.1 38.6 51.2
19.1 55.5 25.314.7 54.8 30.5
22.9 48.0 29.117.0 47.6 35.5
27.4 49.3 23.323.7 49.5 26.9
33.0 36.4 30.630.7 36.2 33.1
15.8 53.4 30.816.1 53.1 30.8
33.0 56.4 10.631.5 57.5 11.1
28.6 64.6 6.729.3 63.3 7.4
17.4 60.7 21.918.3 59.6 22.1
13.4 26.3 60.37.2 18.5 74.3
10.2 22.1 67.78.7 16.8 74.5
12.6 26.5 60.96.5 16.2 77.3
10.3 25.9 63.87.2 17.6 75.2
7.9 24.8 67.36.1 13.1 80.7
11.2 25.5 63.38.1 15.2 76.7
20.9 22.8 56.310.7 15.3 74.0
19.2 36.8 44.110.9 30.7 58.5
15.5 36.8 47.79.9 30.0 60.1
19.7 40.9 39.49.5 33.7 56.8
17.2 36.1 46.79.8 30.9 59.3
14.3 33.9 51.88.7 31.2 60.1
15.5 36.4 48.19.9 36.8 53.3
23.8 31.0 45.214.0 31.8 54.2
22.7 44.2 33.115.5 37.2 47.3
22.3 40.4 37.316.8 42.6 40.6
33.3 34.3 32.421.7 41.4 36.9
19.4 60.6 20.017.3 66.3 16.4
13.1 59.1 27.811.8 58.3 29.9
15.2 35.1 49.710.7 37.8 51.5
17.1 45.2 37.714.2 46.0 39.7
16.3 36.5 47.219.8 38.5 41.8
21.8 37.5 40.717.4 41.0 41.5
10.4 66.6 23.011.3 65.7 23.0
20.8 53.2 26.015.3 52.5 32.2
13.3 43.0 43.711.4 41.5 47.1
24.0 55.6 20.417.1 58.4 24.5
20.1 46.8 33.012.2 51.0 36.8
21.3 53.5 25.221.7 52.1 26.2
27.9 38.3 33.924.4 37.2 38.5
9.7 62.0 28.29.7 64.5 25.8
35.6 56.3 8.237.0 56.1 7.0
31.6 64.9 ≤5.032.7 64.9 ≤5.0
11.6 71.5 16.915.0 66.9 18.1
27.3 18.2 54.5≤5.0 16.7 83.3
18.2 18.2 63.610.0 10.0 80.0
16.7 50.0 33.3≤5.0 25.0 75.0
21.4 28.6 50.0≤5.0 21.4 78.6
21.4 28.6 50.0≤5.0 ≤5.0 ≥95.0
45.5 18.2 36.47.1 7.1 85.7
57.1 14.3 28.6≤5.0 30.8 69.2
36.4 27.3 36.4≤5.0 41.7 58.3
18.2 36.4 45.5≤5.0 30.0 70.0
33.3 41.7 25.08.3 33.3 58.3
28.6 42.9 28.614.3 50.0 35.7
21.4 71.4 7.1≤5.0 25.0 75.0
36.4 36.4 27.321.4 28.6 50.0
57.1 14.3 28.6≤5.0 46.2 53.8
8.3 66.7 25.0≤5.0 58.3 41.7
54.5 45.5 ≤5.021.4 71.4 7.1
64.3 21.4 14.338.5 46.2 15.4
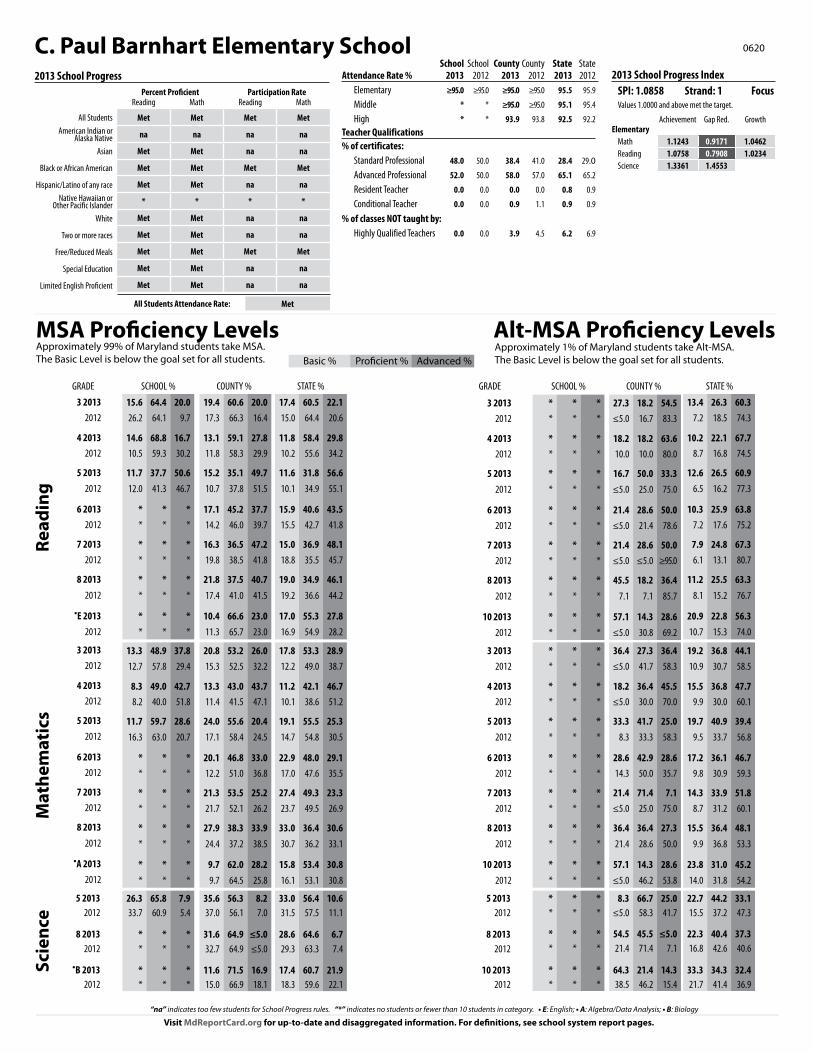
C. Paul Barnhart Elementary School 0620
15.6 64.4 20.026.2 64.1 9.7
14.6 68.8 16.710.5 59.3 30.2
11.7 37.7 50.612.0 41.3 46.7
* * ** * *
* * ** * *
* * ** * *
* * ** * *
13.3 48.9 37.812.7 57.8 29.4
8.3 49.0 42.78.2 40.0 51.8
11.7 59.7 28.616.3 63.0 20.7
* * ** * *
* * ** * *
* * ** * *
* * ** * *
26.3 65.8 7.933.7 60.9 5.4
* * ** * *
* * ** * *
* * ** * *
* * ** * *
* * ** * *
* * ** * *
* * ** * *
* * ** * *
* * ** * *
* * ** * *
* * ** * *
* * ** * *
* * ** * *
* * ** * *
* * ** * *
* * ** * *
* * ** * *
* * ** * *
* * ** * *
2013 School Progress
All StudentsAmerican Indian or
Alaska NativeAsian
Black or African American
Hispanic/Latino of any raceNative Hawaiian or
Other Pacific Islander White
Two or more races
Free/Reduced Meals
Special Education
Limited English Proficient
Percent Proficient Participation RateReading Math Reading Math
Met Met Met Met
na na na na
Met Met na na
Met Met Met Met
Met Met na na
* * * *
Met Met na na
Met Met na na
Met Met Met Met
Met Met na na
Met Met na na
2013 School Progress Index SPI: 1.0858 Strand: 1 FocusValues 1.0000 and above met the target.
Achievement Gap Red. GrowthElementary
Math 1.1243 0.9171 1.0462Reading 1.0758 0.7908 1.0234Science 1.3361 1.4553
Attendance Rate %School
2013School
2012County
2013County
2012State 2013
State 2012
Elementary ≥95.0 ≥95.0 ≥95.0 ≥95.0 95.5 95.9
Middle * * ≥95.0 ≥95.0 95.1 95.4
High * * 93.9 93.8 92.5 92.2Teacher Qualifications% of certificates:
Standard Professional 48.0 50.0 38.4 41.0 28.4 29.0
Advanced Professional 52.0 50.0 58.0 57.0 65.1 65.2
Resident Teacher 0.0 0.0 0.0 0.0 0.8 0.9
Conditional Teacher 0.0 0.0 0.9 1.1 0.9 0.9
% of classes NOT taught by:Highly Qualified Teachers 0.0 0.0 3.9 4.5 6.2 6.9

Basic % Proficient % Advanced %
MSA Proficiency LevelsApproximately 99% of Maryland students take MSA. The Basic Level is below the goal set for all students.
Alt-MSA Proficiency LevelsApproximately 1% of Maryland students take Alt-MSA. The Basic Level is below the goal set for all students.
Visit MdReportCard.org for up-to-date and disaggregated information. For definitions, see school system report pages.
Read
ing
Mat
hem
atic
sSc
ienc
e
17.4 60.5 22.115.0 64.4 20.6
11.8 58.4 29.810.2 55.6 34.2
11.6 31.8 56.610.1 34.9 55.1
15.9 40.6 43.515.5 42.7 41.8
15.0 36.9 48.118.8 35.5 45.7
19.0 34.9 46.119.2 36.6 44.2
17.0 55.3 27.816.9 54.9 28.2
17.8 53.3 28.912.2 49.0 38.7
11.2 42.1 46.710.1 38.6 51.2
19.1 55.5 25.314.7 54.8 30.5
22.9 48.0 29.117.0 47.6 35.5
27.4 49.3 23.323.7 49.5 26.9
33.0 36.4 30.630.7 36.2 33.1
15.8 53.4 30.816.1 53.1 30.8
33.0 56.4 10.631.5 57.5 11.1
28.6 64.6 6.729.3 63.3 7.4
17.4 60.7 21.918.3 59.6 22.1
13.4 26.3 60.37.2 18.5 74.3
10.2 22.1 67.78.7 16.8 74.5
12.6 26.5 60.96.5 16.2 77.3
10.3 25.9 63.87.2 17.6 75.2
7.9 24.8 67.36.1 13.1 80.7
11.2 25.5 63.38.1 15.2 76.7
20.9 22.8 56.310.7 15.3 74.0
19.2 36.8 44.110.9 30.7 58.5
15.5 36.8 47.79.9 30.0 60.1
19.7 40.9 39.49.5 33.7 56.8
17.2 36.1 46.79.8 30.9 59.3
14.3 33.9 51.88.7 31.2 60.1
15.5 36.4 48.19.9 36.8 53.3
23.8 31.0 45.214.0 31.8 54.2
22.7 44.2 33.115.5 37.2 47.3
22.3 40.4 37.316.8 42.6 40.6
33.3 34.3 32.421.7 41.4 36.9
“na” indicates too few students for School Progress rules. “*” indicates no students or fewer than 10 students in category. • E: English; • A: Algebra/Data Analysis; • B: Biology
3 20132012
4 20132012
5 20132012
6 20132012
7 20132012
8 20132012
10 20132012
3 20132012
4 20132012
5 20132012
6 20132012
7 20132012
8 20132012
10 20132012
5 20132012
8 20132012
10 20132012
3 20132012
4 20132012
5 20132012
6 20132012
7 20132012
8 20132012
•E 20132012
3 20132012
4 20132012
5 20132012
6 20132012
7 20132012
8 20132012
•A 20132012
5 20132012
8 20132012
•B 20132012
All Students Attendance Rate: Met
19.4 60.6 20.017.3 66.3 16.4
13.1 59.1 27.811.8 58.3 29.9
15.2 35.1 49.710.7 37.8 51.5
17.1 45.2 37.714.2 46.0 39.7
16.3 36.5 47.219.8 38.5 41.8
21.8 37.5 40.717.4 41.0 41.5
10.4 66.6 23.011.3 65.7 23.0
20.8 53.2 26.015.3 52.5 32.2
13.3 43.0 43.711.4 41.5 47.1
24.0 55.6 20.417.1 58.4 24.5
20.1 46.8 33.012.2 51.0 36.8
21.3 53.5 25.221.7 52.1 26.2
27.9 38.3 33.924.4 37.2 38.5
9.7 62.0 28.29.7 64.5 25.8
35.6 56.3 8.237.0 56.1 7.0
31.6 64.9 ≤5.032.7 64.9 ≤5.0
11.6 71.5 16.915.0 66.9 18.1
27.3 18.2 54.5≤5.0 16.7 83.3
18.2 18.2 63.610.0 10.0 80.0
16.7 50.0 33.3≤5.0 25.0 75.0
21.4 28.6 50.0≤5.0 21.4 78.6
21.4 28.6 50.0≤5.0 ≤5.0 ≥95.0
45.5 18.2 36.47.1 7.1 85.7
57.1 14.3 28.6≤5.0 30.8 69.2
36.4 27.3 36.4≤5.0 41.7 58.3
18.2 36.4 45.5≤5.0 30.0 70.0
33.3 41.7 25.08.3 33.3 58.3
28.6 42.9 28.614.3 50.0 35.7
21.4 71.4 7.1≤5.0 25.0 75.0
36.4 36.4 27.321.4 28.6 50.0
57.1 14.3 28.6≤5.0 46.2 53.8
8.3 66.7 25.0≤5.0 58.3 41.7
54.5 45.5 ≤5.021.4 71.4 7.1
64.3 21.4 14.338.5 46.2 15.4
Daniel of St. Thomas Jenifer Elementary School 0617
30.2 54.2 15.619.6 70.7 9.8
18.4 62.1 19.418.9 49.5 31.6
22.5 43.1 34.315.8 36.6 47.5
* * ** * *
* * ** * *
* * ** * *
* * ** * *
29.2 58.3 12.519.8 62.6 17.6
16.5 57.3 26.216.8 42.1 41.1
34.3 51.0 14.725.7 55.4 18.8
* * ** * *
* * ** * *
* * ** * *
* * ** * *
58.3 38.8 ≤5.058.8 40.2 ≤5.0
* * ** * *
* * ** * *
* * ** * *
* * ** * *
* * ** * *
* * ** * *
* * ** * *
* * ** * *
* * ** * *
* * ** * *
* * ** * *
* * ** * *
* * ** * *
* * ** * *
* * ** * *
* * ** * *
* * ** * *
* * ** * *
* * ** * *
2013 School Progress
All StudentsAmerican Indian or
Alaska NativeAsian
Black or African American
Hispanic/Latino of any raceNative Hawaiian or
Other Pacific Islander White
Two or more races
Free/Reduced Meals
Special Education
Limited English Proficient
Percent Proficient Participation RateReading Math Reading Math
Not Met Not Met Met Met
na na na na
Met Met na na
Not Met Not Met Met Met
Not Met Met na na
na na na na
Not Met Met na na
Met Not Met na na
Not Met Not Met Met Met
Met Met na na
Met Met na na
2013 School Progress Index SPI: 0.9319 Strand: 3 Values 1.0000 and above met the target.
Achievement Gap Red. GrowthElementary
Math 0.8950 0.8122 0.9456Reading 0.8773 0.7881 0.8928Science 0.6952 1.4699
Attendance Rate %School
2013School
2012County
2013County
2012State 2013
State 2012
Elementary ≥95.0 ≥95.0 ≥95.0 ≥95.0 95.5 95.9
Middle * * ≥95.0 ≥95.0 95.1 95.4
High * * 93.9 93.8 92.5 92.2Teacher Qualifications% of certificates:
Standard Professional 55.6 57.7 38.4 41.0 28.4 29.0
Advanced Professional 40.7 38.5 58.0 57.0 65.1 65.2
Resident Teacher 0.0 0.0 0.0 0.0 0.8 0.9
Conditional Teacher 0.0 0.0 0.9 1.1 0.9 0.9
% of classes NOT taught by:Highly Qualified Teachers 0.0 0.0 3.9 4.5 6.2 6.9

Basic % Proficient % Advanced %
MSA Proficiency LevelsApproximately 99% of Maryland students take MSA. The Basic Level is below the goal set for all students.
Alt-MSA Proficiency LevelsApproximately 1% of Maryland students take Alt-MSA. The Basic Level is below the goal set for all students.
Visit MdReportCard.org for up-to-date and disaggregated information. For definitions, see school system report pages.
Read
ing
Mat
hem
atic
sSc
ienc
e
“na” indicates too few students for School Progress rules. “*” indicates no students or fewer than 10 students in category. • E: English; • A: Algebra/Data Analysis; • B: Biology
3 20132012
4 20132012
5 20132012
6 20132012
7 20132012
8 20132012
10 20132012
3 20132012
4 20132012
5 20132012
6 20132012
7 20132012
8 20132012
10 20132012
5 20132012
8 20132012
10 20132012
3 20132012
4 20132012
5 20132012
6 20132012
7 20132012
8 20132012
•E 20132012
3 20132012
4 20132012
5 20132012
6 20132012
7 20132012
8 20132012
•A 20132012
5 20132012
8 20132012
•B 20132012
All Students Attendance Rate: Met
17.4 60.5 22.115.0 64.4 20.6
11.8 58.4 29.810.2 55.6 34.2
11.6 31.8 56.610.1 34.9 55.1
15.9 40.6 43.515.5 42.7 41.8
15.0 36.9 48.118.8 35.5 45.7
19.0 34.9 46.119.2 36.6 44.2
17.0 55.3 27.816.9 54.9 28.2
17.8 53.3 28.912.2 49.0 38.7
11.2 42.1 46.710.1 38.6 51.2
19.1 55.5 25.314.7 54.8 30.5
22.9 48.0 29.117.0 47.6 35.5
27.4 49.3 23.323.7 49.5 26.9
33.0 36.4 30.630.7 36.2 33.1
15.8 53.4 30.816.1 53.1 30.8
33.0 56.4 10.631.5 57.5 11.1
28.6 64.6 6.729.3 63.3 7.4
17.4 60.7 21.918.3 59.6 22.1
13.4 26.3 60.37.2 18.5 74.3
10.2 22.1 67.78.7 16.8 74.5
12.6 26.5 60.96.5 16.2 77.3
10.3 25.9 63.87.2 17.6 75.2
7.9 24.8 67.36.1 13.1 80.7
11.2 25.5 63.38.1 15.2 76.7
20.9 22.8 56.310.7 15.3 74.0
19.2 36.8 44.110.9 30.7 58.5
15.5 36.8 47.79.9 30.0 60.1
19.7 40.9 39.49.5 33.7 56.8
17.2 36.1 46.79.8 30.9 59.3
14.3 33.9 51.88.7 31.2 60.1
15.5 36.4 48.19.9 36.8 53.3
23.8 31.0 45.214.0 31.8 54.2
22.7 44.2 33.115.5 37.2 47.3
22.3 40.4 37.316.8 42.6 40.6
33.3 34.3 32.421.7 41.4 36.9
19.4 60.6 20.017.3 66.3 16.4
13.1 59.1 27.811.8 58.3 29.9
15.2 35.1 49.710.7 37.8 51.5
17.1 45.2 37.714.2 46.0 39.7
16.3 36.5 47.219.8 38.5 41.8
21.8 37.5 40.717.4 41.0 41.5
10.4 66.6 23.011.3 65.7 23.0
20.8 53.2 26.015.3 52.5 32.2
13.3 43.0 43.711.4 41.5 47.1
24.0 55.6 20.417.1 58.4 24.5
20.1 46.8 33.012.2 51.0 36.8
21.3 53.5 25.221.7 52.1 26.2
27.9 38.3 33.924.4 37.2 38.5
9.7 62.0 28.29.7 64.5 25.8
35.6 56.3 8.237.0 56.1 7.0
31.6 64.9 ≤5.032.7 64.9 ≤5.0
11.6 71.5 16.915.0 66.9 18.1
27.3 18.2 54.5≤5.0 16.7 83.3
18.2 18.2 63.610.0 10.0 80.0
16.7 50.0 33.3≤5.0 25.0 75.0
21.4 28.6 50.0≤5.0 21.4 78.6
21.4 28.6 50.0≤5.0 ≤5.0 ≥95.0
45.5 18.2 36.47.1 7.1 85.7
57.1 14.3 28.6≤5.0 30.8 69.2
36.4 27.3 36.4≤5.0 41.7 58.3
18.2 36.4 45.5≤5.0 30.0 70.0
33.3 41.7 25.08.3 33.3 58.3
28.6 42.9 28.614.3 50.0 35.7
21.4 71.4 7.1≤5.0 25.0 75.0
36.4 36.4 27.321.4 28.6 50.0
57.1 14.3 28.6≤5.0 46.2 53.8
8.3 66.7 25.0≤5.0 58.3 41.7
54.5 45.5 ≤5.021.4 71.4 7.1
64.3 21.4 14.338.5 46.2 15.4
Dr. Gustavus Brown Elementary 0611
28.1 57.8 14.122.2 70.8 6.9
25.0 57.5 17.520.0 54.5 25.5
18.2 39.4 42.414.7 48.5 36.8
* * ** * *
* * ** * *
* * ** * *
* * ** * *
28.1 54.7 17.223.6 58.3 18.1
29.5 43.6 26.914.5 47.3 38.2
27.3 56.1 16.725.0 60.3 14.7
* * ** * *
* * ** * *
* * ** * *
* * ** * *
41.3 55.6 ≤5.050.0 48.5 ≤5.0
* * ** * *
* * ** * *
* * ** * *
* * ** * *
* * ** * *
* * ** * *
* * ** * *
* * ** * *
* * ** * *
* * ** * *
* * ** * *
* * ** * *
* * ** * *
* * ** * *
* * ** * *
* * ** * *
* * ** * *
* * ** * *
* * ** * *
2013 School Progress
All StudentsAmerican Indian or
Alaska NativeAsian
Black or African American
Hispanic/Latino of any raceNative Hawaiian or
Other Pacific Islander White
Two or more races
Free/Reduced Meals
Special Education
Limited English Proficient
Percent Proficient Participation RateReading Math Reading Math
Met Not Met Met Met
na na na na
na na na na
Met Not Met Met Met
Met Met na na
* * * *
Met Met na na
Met Not Met na na
Met Not Met Met Met
Met Not Met na na
na na na na
2013 School Progress Index SPI: 0.8329 Strand: 5 Values 1.0000 and above met the target.
Achievement Gap Red. GrowthElementary
Math 0.8173 0.4259 1.0124Reading 0.9273 0.6252 0.9676Science 0.8852 0.9954
Attendance Rate %School
2013School
2012County
2013County
2012State 2013
State 2012
Elementary ≥95.0 ≥95.0 ≥95.0 ≥95.0 95.5 95.9
Middle * * ≥95.0 ≥95.0 95.1 95.4
High * * 93.9 93.8 92.5 92.2Teacher Qualifications% of certificates:
Standard Professional 35.0 30.0 38.4 41.0 28.4 29.0
Advanced Professional 65.0 70.0 58.0 57.0 65.1 65.2
Resident Teacher 0.0 0.0 0.0 0.0 0.8 0.9
Conditional Teacher 0.0 0.0 0.9 1.1 0.9 0.9
% of classes NOT taught by:Highly Qualified Teachers 0.0 0.0 3.9 4.5 6.2 6.9
Basic % Proficient % Advanced %
MSA Proficiency LevelsApproximately 99% of Maryland students take MSA. The Basic Level is below the goal set for all students.
Alt-MSA Proficiency LevelsApproximately 1% of Maryland students take Alt-MSA. The Basic Level is below the goal set for all students.
Visit MdReportCard.org for up-to-date and disaggregated information. For definitions, see school system report pages.
Read
ing
Mat
hem
atic
sSc
ienc
e
17.4 60.5 22.115.0 64.4 20.6
11.8 58.4 29.810.2 55.6 34.2
11.6 31.8 56.610.1 34.9 55.1
15.9 40.6 43.515.5 42.7 41.8
15.0 36.9 48.118.8 35.5 45.7
19.0 34.9 46.119.2 36.6 44.2
17.0 55.3 27.816.9 54.9 28.2
17.8 53.3 28.912.2 49.0 38.7
11.2 42.1 46.710.1 38.6 51.2
19.1 55.5 25.314.7 54.8 30.5
22.9 48.0 29.117.0 47.6 35.5
27.4 49.3 23.323.7 49.5 26.9
33.0 36.4 30.630.7 36.2 33.1
15.8 53.4 30.816.1 53.1 30.8
33.0 56.4 10.631.5 57.5 11.1
28.6 64.6 6.729.3 63.3 7.4
17.4 60.7 21.918.3 59.6 22.1
13.4 26.3 60.37.2 18.5 74.3
10.2 22.1 67.78.7 16.8 74.5
12.6 26.5 60.96.5 16.2 77.3
10.3 25.9 63.87.2 17.6 75.2
7.9 24.8 67.36.1 13.1 80.7
11.2 25.5 63.38.1 15.2 76.7
20.9 22.8 56.310.7 15.3 74.0
19.2 36.8 44.110.9 30.7 58.5
15.5 36.8 47.79.9 30.0 60.1
19.7 40.9 39.49.5 33.7 56.8
17.2 36.1 46.79.8 30.9 59.3
14.3 33.9 51.88.7 31.2 60.1
15.5 36.4 48.19.9 36.8 53.3
23.8 31.0 45.214.0 31.8 54.2
22.7 44.2 33.115.5 37.2 47.3
22.3 40.4 37.316.8 42.6 40.6
33.3 34.3 32.421.7 41.4 36.9
“na” indicates too few students for School Progress rules. “*” indicates no students or fewer than 10 students in category. • E: English; • A: Algebra/Data Analysis; • B: Biology
3 20132012
4 20132012
5 20132012
6 20132012
7 20132012
8 20132012
10 20132012
3 20132012
4 20132012
5 20132012
6 20132012
7 20132012
8 20132012
10 20132012
5 20132012
8 20132012
10 20132012
3 20132012
4 20132012
5 20132012
6 20132012
7 20132012
8 20132012
•E 20132012
3 20132012
4 20132012
5 20132012
6 20132012
7 20132012
8 20132012
•A 20132012
5 20132012
8 20132012
•B 20132012
All Students Attendance Rate: Met
19.4 60.6 20.017.3 66.3 16.4
13.1 59.1 27.811.8 58.3 29.9
15.2 35.1 49.710.7 37.8 51.5
17.1 45.2 37.714.2 46.0 39.7
16.3 36.5 47.219.8 38.5 41.8
21.8 37.5 40.717.4 41.0 41.5
10.4 66.6 23.011.3 65.7 23.0
20.8 53.2 26.015.3 52.5 32.2
13.3 43.0 43.711.4 41.5 47.1
24.0 55.6 20.417.1 58.4 24.5
20.1 46.8 33.012.2 51.0 36.8
21.3 53.5 25.221.7 52.1 26.2
27.9 38.3 33.924.4 37.2 38.5
9.7 62.0 28.29.7 64.5 25.8
35.6 56.3 8.237.0 56.1 7.0
31.6 64.9 ≤5.032.7 64.9 ≤5.0
11.6 71.5 16.915.0 66.9 18.1
27.3 18.2 54.5≤5.0 16.7 83.3
18.2 18.2 63.610.0 10.0 80.0
16.7 50.0 33.3≤5.0 25.0 75.0
21.4 28.6 50.0≤5.0 21.4 78.6
21.4 28.6 50.0≤5.0 ≤5.0 ≥95.0
45.5 18.2 36.47.1 7.1 85.7
57.1 14.3 28.6≤5.0 30.8 69.2
36.4 27.3 36.4≤5.0 41.7 58.3
18.2 36.4 45.5≤5.0 30.0 70.0
33.3 41.7 25.08.3 33.3 58.3
28.6 42.9 28.614.3 50.0 35.7
21.4 71.4 7.1≤5.0 25.0 75.0
36.4 36.4 27.321.4 28.6 50.0
57.1 14.3 28.6≤5.0 46.2 53.8
8.3 66.7 25.0≤5.0 58.3 41.7
54.5 45.5 ≤5.021.4 71.4 7.1
64.3 21.4 14.338.5 46.2 15.4
Dr. James Craik Elementary School 0609
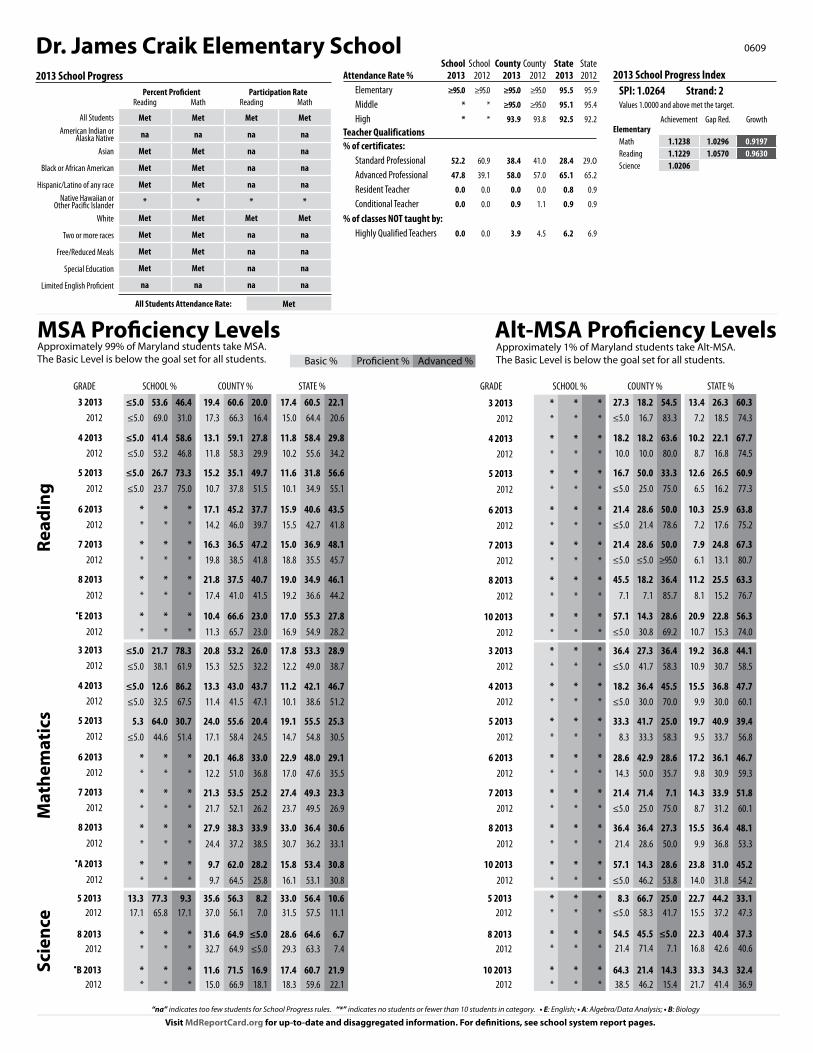
≤5.0 53.6 46.4≤5.0 69.0 31.0
≤5.0 41.4 58.6≤5.0 53.2 46.8
≤5.0 26.7 73.3≤5.0 23.7 75.0
* * ** * *
* * ** * *
* * ** * *
* * ** * *
≤5.0 21.7 78.3≤5.0 38.1 61.9
≤5.0 12.6 86.2≤5.0 32.5 67.5
5.3 64.0 30.7≤5.0 44.6 51.4
* * ** * *
* * ** * *
* * ** * *
* * ** * *
13.3 77.3 9.317.1 65.8 17.1
* * ** * *
* * ** * *
* * ** * *
* * ** * *
* * ** * *
* * ** * *
* * ** * *
* * ** * *
* * ** * *
* * ** * *
* * ** * *
* * ** * *
* * ** * *
* * ** * *
* * ** * *
* * ** * *
* * ** * *
* * ** * *
* * ** * *
2013 School Progress
All StudentsAmerican Indian or
Alaska NativeAsian
Black or African American
Hispanic/Latino of any raceNative Hawaiian or
Other Pacific Islander White
Two or more races
Free/Reduced Meals
Special Education
Limited English Proficient
Percent Proficient Participation RateReading Math Reading Math
Met Met Met Met
na na na na
Met Met na na
Met Met na na
Met Met na na
* * * *
Met Met Met Met
Met Met na na
Met Met na na
Met Met na na
na na na na
2013 School Progress Index SPI: 1.0264 Strand: 2 Values 1.0000 and above met the target.
Achievement Gap Red. GrowthElementary
Math 1.1238 1.0296 0.9197Reading 1.1229 1.0570 0.9630Science 1.0206
Attendance Rate %School
2013School
2012County
2013County
2012State 2013
State 2012
Elementary ≥95.0 ≥95.0 ≥95.0 ≥95.0 95.5 95.9
Middle * * ≥95.0 ≥95.0 95.1 95.4
High * * 93.9 93.8 92.5 92.2Teacher Qualifications% of certificates:
Standard Professional 52.2 60.9 38.4 41.0 28.4 29.0
Advanced Professional 47.8 39.1 58.0 57.0 65.1 65.2
Resident Teacher 0.0 0.0 0.0 0.0 0.8 0.9
Conditional Teacher 0.0 0.0 0.9 1.1 0.9 0.9
% of classes NOT taught by:Highly Qualified Teachers 0.0 0.0 3.9 4.5 6.2 6.9

Basic % Proficient % Advanced %
MSA Proficiency LevelsApproximately 99% of Maryland students take MSA. The Basic Level is below the goal set for all students.
Alt-MSA Proficiency LevelsApproximately 1% of Maryland students take Alt-MSA. The Basic Level is below the goal set for all students.
Visit MdReportCard.org for up-to-date and disaggregated information. For definitions, see school system report pages.
Read
ing
Mat
hem
atic
sSc
ienc
e
“na” indicates too few students for School Progress rules. “*” indicates no students or fewer than 10 students in category. • E: English; • A: Algebra/Data Analysis; • B: Biology
3 20132012
4 20132012
5 20132012
6 20132012
7 20132012
8 20132012
10 20132012
3 20132012
4 20132012
5 20132012
6 20132012
7 20132012
8 20132012
10 20132012
5 20132012
8 20132012
10 20132012
3 20132012
4 20132012
5 20132012
6 20132012
7 20132012
8 20132012
•E 20132012
3 20132012
4 20132012
5 20132012
6 20132012
7 20132012
8 20132012
•A 20132012
5 20132012
8 20132012
•B 20132012
All Students Attendance Rate: Met
17.4 60.5 22.115.0 64.4 20.6
11.8 58.4 29.810.2 55.6 34.2
11.6 31.8 56.610.1 34.9 55.1
15.9 40.6 43.515.5 42.7 41.8
15.0 36.9 48.118.8 35.5 45.7
19.0 34.9 46.119.2 36.6 44.2
17.0 55.3 27.816.9 54.9 28.2
17.8 53.3 28.912.2 49.0 38.7
11.2 42.1 46.710.1 38.6 51.2
19.1 55.5 25.314.7 54.8 30.5
22.9 48.0 29.117.0 47.6 35.5
27.4 49.3 23.323.7 49.5 26.9
33.0 36.4 30.630.7 36.2 33.1
15.8 53.4 30.816.1 53.1 30.8
33.0 56.4 10.631.5 57.5 11.1
28.6 64.6 6.729.3 63.3 7.4
17.4 60.7 21.918.3 59.6 22.1
13.4 26.3 60.37.2 18.5 74.3
10.2 22.1 67.78.7 16.8 74.5
12.6 26.5 60.96.5 16.2 77.3
10.3 25.9 63.87.2 17.6 75.2
7.9 24.8 67.36.1 13.1 80.7
11.2 25.5 63.38.1 15.2 76.7
20.9 22.8 56.310.7 15.3 74.0
19.2 36.8 44.110.9 30.7 58.5
15.5 36.8 47.79.9 30.0 60.1
19.7 40.9 39.49.5 33.7 56.8
17.2 36.1 46.79.8 30.9 59.3
14.3 33.9 51.88.7 31.2 60.1
15.5 36.4 48.19.9 36.8 53.3
23.8 31.0 45.214.0 31.8 54.2
22.7 44.2 33.115.5 37.2 47.3
22.3 40.4 37.316.8 42.6 40.6
33.3 34.3 32.421.7 41.4 36.9
19.4 60.6 20.017.3 66.3 16.4
13.1 59.1 27.811.8 58.3 29.9
15.2 35.1 49.710.7 37.8 51.5
17.1 45.2 37.714.2 46.0 39.7
16.3 36.5 47.219.8 38.5 41.8
21.8 37.5 40.717.4 41.0 41.5
10.4 66.6 23.011.3 65.7 23.0
20.8 53.2 26.015.3 52.5 32.2
13.3 43.0 43.711.4 41.5 47.1
24.0 55.6 20.417.1 58.4 24.5
20.1 46.8 33.012.2 51.0 36.8
21.3 53.5 25.221.7 52.1 26.2
27.9 38.3 33.924.4 37.2 38.5
9.7 62.0 28.29.7 64.5 25.8
35.6 56.3 8.237.0 56.1 7.0
31.6 64.9 ≤5.032.7 64.9 ≤5.0
11.6 71.5 16.915.0 66.9 18.1
27.3 18.2 54.5≤5.0 16.7 83.3
18.2 18.2 63.610.0 10.0 80.0
16.7 50.0 33.3≤5.0 25.0 75.0
21.4 28.6 50.0≤5.0 21.4 78.6
21.4 28.6 50.0≤5.0 ≤5.0 ≥95.0
45.5 18.2 36.47.1 7.1 85.7
57.1 14.3 28.6≤5.0 30.8 69.2
36.4 27.3 36.4≤5.0 41.7 58.3
18.2 36.4 45.5≤5.0 30.0 70.0
33.3 41.7 25.08.3 33.3 58.3
28.6 42.9 28.614.3 50.0 35.7
21.4 71.4 7.1≤5.0 25.0 75.0
36.4 36.4 27.321.4 28.6 50.0
57.1 14.3 28.6≤5.0 46.2 53.8
8.3 66.7 25.0≤5.0 58.3 41.7
54.5 45.5 ≤5.021.4 71.4 7.1
64.3 21.4 14.338.5 46.2 15.4
Dr. Samuel A. Mudd Elementary School 0604
26.2 63.9 9.822.2 63.0 14.8
17.0 60.4 22.614.5 74.5 10.9
14.5 36.4 49.121.1 50.9 28.1
* * ** * *
* * ** * *
* * ** * *
* * ** * *
26.2 63.9 9.820.4 53.7 25.9
5.7 45.3 49.18.9 48.2 42.9
23.2 64.3 12.519.3 64.9 15.8
* * ** * *
* * ** * *
* * ** * *
* * ** * *
47.3 50.9 ≤5.052.6 43.9 ≤5.0
* * ** * *
* * ** * *
* * ** * *
* * ** * *
* * ** * *
* * ** * *
* * ** * *
* * ** * *
* * ** * *
* * ** * *
* * ** * *
* * ** * *
* * ** * *
* * ** * *
* * ** * *
* * ** * *
* * ** * *
* * ** * *
* * ** * *
2013 School Progress
All StudentsAmerican Indian or
Alaska NativeAsian
Black or African American
Hispanic/Latino of any raceNative Hawaiian or
Other Pacific Islander White
Two or more races
Free/Reduced Meals
Special Education
Limited English Proficient
Percent Proficient Participation RateReading Math Reading Math
Met Met Met Met
* * * *
na na na na
Met Met Met Met
Met Met na na
* * * *
Met Met na na
Met Met na na
Met Met Met Met
Met Met na na
Met Met na na
2013 School Progress Index SPI: 0.9479 Strand: 3 FocusValues 1.0000 and above met the target.
Achievement Gap Red. GrowthElementary
Math 0.9854 0.8464 0.8105Reading 0.9930 0.7234 0.8973Science 0.8704 1.4814
Attendance Rate %School
2013School
2012County
2013County
2012State 2013
State 2012
Elementary ≥95.0 ≥95.0 ≥95.0 ≥95.0 95.5 95.9
Middle * * ≥95.0 ≥95.0 95.1 95.4
High * * 93.9 93.8 92.5 92.2Teacher Qualifications% of certificates:
Standard Professional 35.3 50.0 38.4 41.0 28.4 29.0
Advanced Professional 64.7 50.0 58.0 57.0 65.1 65.2
Resident Teacher 0.0 0.0 0.0 0.0 0.8 0.9
Conditional Teacher 0.0 0.0 0.9 1.1 0.9 0.9
% of classes NOT taught by:Highly Qualified Teachers 0.0 0.0 3.9 4.5 6.2 6.9

Basic % Proficient % Advanced %
MSA Proficiency LevelsApproximately 99% of Maryland students take MSA. The Basic Level is below the goal set for all students.
Alt-MSA Proficiency LevelsApproximately 1% of Maryland students take Alt-MSA. The Basic Level is below the goal set for all students.
Visit MdReportCard.org for up-to-date and disaggregated information. For definitions, see school system report pages.
Read
ing
Mat
hem
atic
sSc
ienc
e
17.4 60.5 22.115.0 64.4 20.6
11.8 58.4 29.810.2 55.6 34.2
11.6 31.8 56.610.1 34.9 55.1
15.9 40.6 43.515.5 42.7 41.8
15.0 36.9 48.118.8 35.5 45.7
19.0 34.9 46.119.2 36.6 44.2
17.0 55.3 27.816.9 54.9 28.2
17.8 53.3 28.912.2 49.0 38.7
11.2 42.1 46.710.1 38.6 51.2
19.1 55.5 25.314.7 54.8 30.5
22.9 48.0 29.117.0 47.6 35.5
27.4 49.3 23.323.7 49.5 26.9
33.0 36.4 30.630.7 36.2 33.1
15.8 53.4 30.816.1 53.1 30.8
33.0 56.4 10.631.5 57.5 11.1
28.6 64.6 6.729.3 63.3 7.4
17.4 60.7 21.918.3 59.6 22.1
13.4 26.3 60.37.2 18.5 74.3
10.2 22.1 67.78.7 16.8 74.5
12.6 26.5 60.96.5 16.2 77.3
10.3 25.9 63.87.2 17.6 75.2
7.9 24.8 67.36.1 13.1 80.7
11.2 25.5 63.38.1 15.2 76.7
20.9 22.8 56.310.7 15.3 74.0
19.2 36.8 44.110.9 30.7 58.5
15.5 36.8 47.79.9 30.0 60.1
19.7 40.9 39.49.5 33.7 56.8
17.2 36.1 46.79.8 30.9 59.3
14.3 33.9 51.88.7 31.2 60.1
15.5 36.4 48.19.9 36.8 53.3
23.8 31.0 45.214.0 31.8 54.2
22.7 44.2 33.115.5 37.2 47.3
22.3 40.4 37.316.8 42.6 40.6
33.3 34.3 32.421.7 41.4 36.9
“na” indicates too few students for School Progress rules. “*” indicates no students or fewer than 10 students in category. • E: English; • A: Algebra/Data Analysis; • B: Biology
3 20132012
4 20132012
5 20132012
6 20132012
7 20132012
8 20132012
10 20132012
3 20132012
4 20132012
5 20132012
6 20132012
7 20132012
8 20132012
10 20132012
5 20132012
8 20132012
10 20132012
3 20132012
4 20132012
5 20132012
6 20132012
7 20132012
8 20132012
•E 20132012
3 20132012
4 20132012
5 20132012
6 20132012
7 20132012
8 20132012
•A 20132012
5 20132012
8 20132012
•B 20132012
All Students Attendance Rate: Met
19.4 60.6 20.017.3 66.3 16.4
13.1 59.1 27.811.8 58.3 29.9
15.2 35.1 49.710.7 37.8 51.5
17.1 45.2 37.714.2 46.0 39.7
16.3 36.5 47.219.8 38.5 41.8
21.8 37.5 40.717.4 41.0 41.5
10.4 66.6 23.011.3 65.7 23.0
20.8 53.2 26.015.3 52.5 32.2
13.3 43.0 43.711.4 41.5 47.1
24.0 55.6 20.417.1 58.4 24.5
20.1 46.8 33.012.2 51.0 36.8
21.3 53.5 25.221.7 52.1 26.2
27.9 38.3 33.924.4 37.2 38.5
9.7 62.0 28.29.7 64.5 25.8
35.6 56.3 8.237.0 56.1 7.0
31.6 64.9 ≤5.032.7 64.9 ≤5.0
11.6 71.5 16.915.0 66.9 18.1
27.3 18.2 54.5≤5.0 16.7 83.3
18.2 18.2 63.610.0 10.0 80.0
16.7 50.0 33.3≤5.0 25.0 75.0
21.4 28.6 50.0≤5.0 21.4 78.6
21.4 28.6 50.0≤5.0 ≤5.0 ≥95.0
45.5 18.2 36.47.1 7.1 85.7
57.1 14.3 28.6≤5.0 30.8 69.2
36.4 27.3 36.4≤5.0 41.7 58.3
18.2 36.4 45.5≤5.0 30.0 70.0
33.3 41.7 25.08.3 33.3 58.3
28.6 42.9 28.614.3 50.0 35.7
21.4 71.4 7.1≤5.0 25.0 75.0
36.4 36.4 27.321.4 28.6 50.0
57.1 14.3 28.6≤5.0 46.2 53.8
8.3 66.7 25.0≤5.0 58.3 41.7
54.5 45.5 ≤5.021.4 71.4 7.1
64.3 21.4 14.338.5 46.2 15.4
Dr. Thomas L. Higdon Elementary 0501
7.3 54.5 38.214.7 67.6 17.6
8.5 56.3 35.215.7 47.1 37.1
11.8 36.8 51.59.8 36.1 54.1
* * ** * *
* * ** * *
* * ** * *
* * ** * *
8.9 33.9 57.18.8 39.7 51.5
8.3 33.3 58.38.6 32.9 58.6
13.2 55.9 30.913.1 54.1 32.8
* * ** * *
* * ** * *
* * ** * *
* * ** * *
20.6 66.2 13.229.5 62.3 8.2
* * ** * *
* * ** * *
* * ** * *
* * ** * *
* * ** * *
* * ** * *
* * ** * *
* * ** * *
* * ** * *
* * ** * *
* * ** * *
* * ** * *
* * ** * *
* * ** * *
* * ** * *
* * ** * *
* * ** * *
* * ** * *
* * ** * *
2013 School Progress
All StudentsAmerican Indian or
Alaska NativeAsian
Black or African American
Hispanic/Latino of any raceNative Hawaiian or
Other Pacific Islander White
Two or more races
Free/Reduced Meals
Special Education
Limited English Proficient
Percent Proficient Participation RateReading Math Reading Math
Met Met Met Met
na na na na
* * * *
Met Met na na
na na na na
* * * *
Met Met Met Met
Met Met na na
Met Met na na
Met Met na na
na na na na
2013 School Progress Index SPI: 1.0159 Strand: 2 Values 1.0000 and above met the target.
Achievement Gap Red. GrowthElementary
Math 0.9786 0.9180 1.1063Reading 1.0162 0.9409 0.9907Science 1.0423 1.1231
Attendance Rate %School
2013School
2012County
2013County
2012State 2013
State 2012
Elementary 94.7 ≥95.0 ≥95.0 ≥95.0 95.5 95.9
Middle * * ≥95.0 ≥95.0 95.1 95.4
High * * 93.9 93.8 92.5 92.2Teacher Qualifications% of certificates:
Standard Professional 26.3 26.3 38.4 41.0 28.4 29.0
Advanced Professional 73.7 73.7 58.0 57.0 65.1 65.2
Resident Teacher 0.0 0.0 0.0 0.0 0.8 0.9
Conditional Teacher 0.0 0.0 0.9 1.1 0.9 0.9
% of classes NOT taught by:Highly Qualified Teachers 0.0 0.0 3.9 4.5 6.2 6.9

Basic % Proficient % Advanced %
MSA Proficiency LevelsApproximately 99% of Maryland students take MSA. The Basic Level is below the goal set for all students.
Alt-MSA Proficiency LevelsApproximately 1% of Maryland students take Alt-MSA. The Basic Level is below the goal set for all students.
Visit MdReportCard.org for up-to-date and disaggregated information. For definitions, see school system report pages.
Read
ing
Mat
hem
atic
sSc
ienc
e
“na” indicates too few students for School Progress rules. “*” indicates no students or fewer than 10 students in category. • E: English; • A: Algebra/Data Analysis; • B: Biology
3 20132012
4 20132012
5 20132012
6 20132012
7 20132012
8 20132012
10 20132012
3 20132012
4 20132012
5 20132012
6 20132012
7 20132012
8 20132012
10 20132012
5 20132012
8 20132012
10 20132012
3 20132012
4 20132012
5 20132012
6 20132012
7 20132012
8 20132012
•E 20132012
3 20132012
4 20132012
5 20132012
6 20132012
7 20132012
8 20132012
•A 20132012
5 20132012
8 20132012
•B 20132012
All Students Attendance Rate: Met
17.4 60.5 22.115.0 64.4 20.6
11.8 58.4 29.810.2 55.6 34.2
11.6 31.8 56.610.1 34.9 55.1
15.9 40.6 43.515.5 42.7 41.8
15.0 36.9 48.118.8 35.5 45.7
19.0 34.9 46.119.2 36.6 44.2
17.0 55.3 27.816.9 54.9 28.2
17.8 53.3 28.912.2 49.0 38.7
11.2 42.1 46.710.1 38.6 51.2
19.1 55.5 25.314.7 54.8 30.5
22.9 48.0 29.117.0 47.6 35.5
27.4 49.3 23.323.7 49.5 26.9
33.0 36.4 30.630.7 36.2 33.1
15.8 53.4 30.816.1 53.1 30.8
33.0 56.4 10.631.5 57.5 11.1
28.6 64.6 6.729.3 63.3 7.4
17.4 60.7 21.918.3 59.6 22.1
13.4 26.3 60.37.2 18.5 74.3
10.2 22.1 67.78.7 16.8 74.5
12.6 26.5 60.96.5 16.2 77.3
10.3 25.9 63.87.2 17.6 75.2
7.9 24.8 67.36.1 13.1 80.7
11.2 25.5 63.38.1 15.2 76.7
20.9 22.8 56.310.7 15.3 74.0
19.2 36.8 44.110.9 30.7 58.5
15.5 36.8 47.79.9 30.0 60.1
19.7 40.9 39.49.5 33.7 56.8
17.2 36.1 46.79.8 30.9 59.3
14.3 33.9 51.88.7 31.2 60.1
15.5 36.4 48.19.9 36.8 53.3
23.8 31.0 45.214.0 31.8 54.2
22.7 44.2 33.115.5 37.2 47.3
22.3 40.4 37.316.8 42.6 40.6
33.3 34.3 32.421.7 41.4 36.9
19.4 60.6 20.017.3 66.3 16.4
13.1 59.1 27.811.8 58.3 29.9
15.2 35.1 49.710.7 37.8 51.5
17.1 45.2 37.714.2 46.0 39.7
16.3 36.5 47.219.8 38.5 41.8
21.8 37.5 40.717.4 41.0 41.5
10.4 66.6 23.011.3 65.7 23.0
20.8 53.2 26.015.3 52.5 32.2
13.3 43.0 43.711.4 41.5 47.1
24.0 55.6 20.417.1 58.4 24.5
20.1 46.8 33.012.2 51.0 36.8
21.3 53.5 25.221.7 52.1 26.2
27.9 38.3 33.924.4 37.2 38.5
9.7 62.0 28.29.7 64.5 25.8
35.6 56.3 8.237.0 56.1 7.0
31.6 64.9 ≤5.032.7 64.9 ≤5.0
11.6 71.5 16.915.0 66.9 18.1
27.3 18.2 54.5≤5.0 16.7 83.3
18.2 18.2 63.610.0 10.0 80.0
16.7 50.0 33.3≤5.0 25.0 75.0
21.4 28.6 50.0≤5.0 21.4 78.6
21.4 28.6 50.0≤5.0 ≤5.0 ≥95.0
45.5 18.2 36.47.1 7.1 85.7
57.1 14.3 28.6≤5.0 30.8 69.2
36.4 27.3 36.4≤5.0 41.7 58.3
18.2 36.4 45.5≤5.0 30.0 70.0
33.3 41.7 25.08.3 33.3 58.3
28.6 42.9 28.614.3 50.0 35.7
21.4 71.4 7.1≤5.0 25.0 75.0
36.4 36.4 27.321.4 28.6 50.0
57.1 14.3 28.6≤5.0 46.2 53.8
8.3 66.7 25.0≤5.0 58.3 41.7
54.5 45.5 ≤5.021.4 71.4 7.1
64.3 21.4 14.338.5 46.2 15.4
Eva Turner Elementary School 0616
43.1 48.6 8.333.3 56.1 10.5
23.7 59.2 17.122.4 61.2 16.3
19.1 41.2 39.725.0 39.6 35.4
* * ** * *
* * ** * *
* * ** * *
* * ** * *
45.8 44.4 9.730.4 51.8 17.9
31.6 36.8 31.616.3 51.0 32.7
36.2 53.6 10.129.2 54.2 16.7
* * ** * *
* * ** * *
* * ** * *
* * ** * *
52.2 43.5 ≤5.068.8 31.3 ≤5.0
* * ** * *
* * ** * *
* * ** * *
* * ** * *
* * ** * *
* * ** * *
* * ** * *
* * ** * *
* * ** * *
* * ** * *
* * ** * *
* * ** * *
* * ** * *
* * ** * *
* * ** * *
* * ** * *
* * ** * *
* * ** * *
* * ** * *
2013 School Progress
All StudentsAmerican Indian or
Alaska NativeAsian
Black or African American
Hispanic/Latino of any raceNative Hawaiian or
Other Pacific Islander White
Two or more races
Free/Reduced Meals
Special Education
Limited English Proficient
Percent Proficient Participation RateReading Math Reading Math
Not Met Not Met Met Met
na na na na
na na na na
Not Met Not Met Met Met
Met Met na na
* * * *
Met Not Met na na
Met Not Met na na
Not Met Not Met Met Met
Met Not Met na na
na na na na
2013 School Progress Index SPI: 0.8746 Strand: 5 Values 1.0000 and above met the target.
Achievement Gap Red. GrowthElementary
Math 0.7341 0.7198 0.7403Reading 0.8767 1.0050 0.9414Science 0.9898 0.9924
Attendance Rate %School
2013School
2012County
2013County
2012State 2013
State 2012
Elementary ≥95.0 ≥95.0 ≥95.0 ≥95.0 95.5 95.9
Middle * * ≥95.0 ≥95.0 95.1 95.4
High * * 93.9 93.8 92.5 92.2Teacher Qualifications% of certificates:
Standard Professional 47.8 41.2 38.4 41.0 28.4 29.0
Advanced Professional 47.8 58.8 58.0 57.0 65.1 65.2
Resident Teacher 0.0 0.0 0.0 0.0 0.8 0.9
Conditional Teacher 0.0 0.0 0.9 1.1 0.9 0.9
% of classes NOT taught by:Highly Qualified Teachers 4.2 0.0 3.9 4.5 6.2 6.9

Basic % Proficient % Advanced %
MSA Proficiency LevelsApproximately 99% of Maryland students take MSA. The Basic Level is below the goal set for all students.
Alt-MSA Proficiency LevelsApproximately 1% of Maryland students take Alt-MSA. The Basic Level is below the goal set for all students.
Visit MdReportCard.org for up-to-date and disaggregated information. For definitions, see school system report pages.
Read
ing
Mat
hem
atic
sSc
ienc
e
17.4 60.5 22.115.0 64.4 20.6
11.8 58.4 29.810.2 55.6 34.2
11.6 31.8 56.610.1 34.9 55.1
15.9 40.6 43.515.5 42.7 41.8
15.0 36.9 48.118.8 35.5 45.7
19.0 34.9 46.119.2 36.6 44.2
17.0 55.3 27.816.9 54.9 28.2
17.8 53.3 28.912.2 49.0 38.7
11.2 42.1 46.710.1 38.6 51.2
19.1 55.5 25.314.7 54.8 30.5
22.9 48.0 29.117.0 47.6 35.5
27.4 49.3 23.323.7 49.5 26.9
33.0 36.4 30.630.7 36.2 33.1
15.8 53.4 30.816.1 53.1 30.8
33.0 56.4 10.631.5 57.5 11.1
28.6 64.6 6.729.3 63.3 7.4
17.4 60.7 21.918.3 59.6 22.1
13.4 26.3 60.37.2 18.5 74.3
10.2 22.1 67.78.7 16.8 74.5
12.6 26.5 60.96.5 16.2 77.3
10.3 25.9 63.87.2 17.6 75.2
7.9 24.8 67.36.1 13.1 80.7
11.2 25.5 63.38.1 15.2 76.7
20.9 22.8 56.310.7 15.3 74.0
19.2 36.8 44.110.9 30.7 58.5
15.5 36.8 47.79.9 30.0 60.1
19.7 40.9 39.49.5 33.7 56.8
17.2 36.1 46.79.8 30.9 59.3
14.3 33.9 51.88.7 31.2 60.1
15.5 36.4 48.19.9 36.8 53.3
23.8 31.0 45.214.0 31.8 54.2
22.7 44.2 33.115.5 37.2 47.3
22.3 40.4 37.316.8 42.6 40.6
33.3 34.3 32.421.7 41.4 36.9
“na” indicates too few students for School Progress rules. “*” indicates no students or fewer than 10 students in category. • E: English; • A: Algebra/Data Analysis; • B: Biology
3 20132012
4 20132012
5 20132012
6 20132012
7 20132012
8 20132012
10 20132012
3 20132012
4 20132012
5 20132012
6 20132012
7 20132012
8 20132012
10 20132012
5 20132012
8 20132012
10 20132012
3 20132012
4 20132012
5 20132012
6 20132012
7 20132012
8 20132012
•E 20132012
3 20132012
4 20132012
5 20132012
6 20132012
7 20132012
8 20132012
•A 20132012
5 20132012
8 20132012
•B 20132012
All Students Attendance Rate: *
†College and Career Preparation (CCP) - 2011 ††Data from 2012
19.4 60.6 20.017.3 66.3 16.4
13.1 59.1 27.811.8 58.3 29.9
15.2 35.1 49.710.7 37.8 51.5
17.1 45.2 37.714.2 46.0 39.7
16.3 36.5 47.219.8 38.5 41.8
21.8 37.5 40.717.4 41.0 41.5
10.4 66.6 23.011.3 65.7 23.0
20.8 53.2 26.015.3 52.5 32.2
13.3 43.0 43.711.4 41.5 47.1
24.0 55.6 20.417.1 58.4 24.5
20.1 46.8 33.012.2 51.0 36.8
21.3 53.5 25.221.7 52.1 26.2
27.9 38.3 33.924.4 37.2 38.5
9.7 62.0 28.29.7 64.5 25.8
35.6 56.3 8.237.0 56.1 7.0
31.6 64.9 ≤5.032.7 64.9 ≤5.0
11.6 71.5 16.915.0 66.9 18.1
27.3 18.2 54.5≤5.0 16.7 83.3
18.2 18.2 63.610.0 10.0 80.0
16.7 50.0 33.3≤5.0 25.0 75.0
21.4 28.6 50.0≤5.0 21.4 78.6
21.4 28.6 50.0≤5.0 ≤5.0 ≥95.0
45.5 18.2 36.47.1 7.1 85.7
57.1 14.3 28.6≤5.0 30.8 69.2
36.4 27.3 36.4≤5.0 41.7 58.3
18.2 36.4 45.5≤5.0 30.0 70.0
33.3 41.7 25.08.3 33.3 58.3
28.6 42.9 28.614.3 50.0 35.7
21.4 71.4 7.1≤5.0 25.0 75.0
36.4 36.4 27.321.4 28.6 50.0
57.1 14.3 28.6≤5.0 46.2 53.8
8.3 66.7 25.0≤5.0 58.3 41.7
54.5 45.5 ≤5.021.4 71.4 7.1
64.3 21.4 14.338.5 46.2 15.4
F. B. Gwynn Educational Center 0107
* * ** * *
* * ** * *
* * ** * *
* * ** * *
* * ** * *
* * ** * *
* * ** * *
* * ** * *
* * ** * *
* * ** * *
* * ** * *
* * ** * *
* * ** * *
* * ** * *
* * ** * *
* * ** * *
* * ** * *
* * ** * *
* * ** * *
* * ** * *
* * ** * *
* * ** * *
* * ** * *
* * ** * *
* * ** * *
* * ** * *
* * ** * *
* * ** * *
* * ** * *
* * ** * *
* * ** * *
* * ** * *
* * ** * *
* * ** * *
2013 School Progress
All StudentsAmerican Indian or
Alaska NativeAsian
Black or African American
Hispanic/Latino of any raceNative Hawaiian or
Other Pacific Islander White
Two or more races
Free/Reduced Meals
Special Education
Limited English Proficient
Percent Proficient Participation Rate GraduationReading Math Reading Math
* * * * *
* * * * *
* * * * *
* * * * *
* * * * *
* * * * *
* * * * *
* * * * *
* * * * *
* * * * *
* * * * *
2013 School Progress Index SPI: * Strand: * Values 1.0000 and above met the target.
Achievement Gap Red. GrowthElementary
Math * * *Reading * * *Science * *
MiddleMath * * *Reading * * *Science * *
High Achievement Gap Red. CCRAlgebra * *English * *Biology * *
††Dropout *††Grad * *
†CCP *
Attendance Rate %School
2013School
2012County
2013County
2012State 2013
State 2012
Elementary * * ≥95.0 ≥95.0 95.5 95.9
Middle * * ≥95.0 ≥95.0 95.1 95.4
High * * 93.9 93.8 92.5 92.2Teacher Qualifications% of certificates:
Standard Professional * * 38.4 41.0 28.4 29.0
Advanced Professional * * 58.0 57.0 65.1 65.2
Resident Teacher * * 0.0 0.0 0.8 0.9
Conditional Teacher * * 0.9 1.1 0.9 0.9
% of classes NOT taught by:Highly Qualified Teachers * * 3.9 4.5 6.2 6.9
Cohort Graduation Rate %Class of 2012 (4-Yr Rate) * 89.76 83.57
Class of 2012 (5-Yr Rate) * 92.42 86.32

Basic % Proficient % Advanced %
MSA Proficiency LevelsApproximately 99% of Maryland students take MSA. The Basic Level is below the goal set for all students.
Alt-MSA Proficiency LevelsApproximately 1% of Maryland students take Alt-MSA. The Basic Level is below the goal set for all students.
Visit MdReportCard.org for up-to-date and disaggregated information. For definitions, see school system report pages.
Read
ing
Mat
hem
atic
sSc
ienc
e
“na” indicates too few students for School Progress rules. “*” indicates no students or fewer than 10 students in category. • E: English; • A: Algebra/Data Analysis; • B: Biology
3 20132012
4 20132012
5 20132012
6 20132012
7 20132012
8 20132012
10 20132012
3 20132012
4 20132012
5 20132012
6 20132012
7 20132012
8 20132012
10 20132012
5 20132012
8 20132012
10 20132012
3 20132012
4 20132012
5 20132012
6 20132012
7 20132012
8 20132012
•E 20132012
3 20132012
4 20132012
5 20132012
6 20132012
7 20132012
8 20132012
•A 20132012
5 20132012
8 20132012
•B 20132012
All Students Attendance Rate: Met
17.4 60.5 22.115.0 64.4 20.6
11.8 58.4 29.810.2 55.6 34.2
11.6 31.8 56.610.1 34.9 55.1
15.9 40.6 43.515.5 42.7 41.8
15.0 36.9 48.118.8 35.5 45.7
19.0 34.9 46.119.2 36.6 44.2
17.0 55.3 27.816.9 54.9 28.2
17.8 53.3 28.912.2 49.0 38.7
11.2 42.1 46.710.1 38.6 51.2
19.1 55.5 25.314.7 54.8 30.5
22.9 48.0 29.117.0 47.6 35.5
27.4 49.3 23.323.7 49.5 26.9
33.0 36.4 30.630.7 36.2 33.1
15.8 53.4 30.816.1 53.1 30.8
33.0 56.4 10.631.5 57.5 11.1
28.6 64.6 6.729.3 63.3 7.4
17.4 60.7 21.918.3 59.6 22.1
13.4 26.3 60.37.2 18.5 74.3
10.2 22.1 67.78.7 16.8 74.5
12.6 26.5 60.96.5 16.2 77.3
10.3 25.9 63.87.2 17.6 75.2
7.9 24.8 67.36.1 13.1 80.7
11.2 25.5 63.38.1 15.2 76.7
20.9 22.8 56.310.7 15.3 74.0
19.2 36.8 44.110.9 30.7 58.5
15.5 36.8 47.79.9 30.0 60.1
19.7 40.9 39.49.5 33.7 56.8
17.2 36.1 46.79.8 30.9 59.3
14.3 33.9 51.88.7 31.2 60.1
15.5 36.4 48.19.9 36.8 53.3
23.8 31.0 45.214.0 31.8 54.2
22.7 44.2 33.115.5 37.2 47.3
22.3 40.4 37.316.8 42.6 40.6
33.3 34.3 32.421.7 41.4 36.9
19.4 60.6 20.017.3 66.3 16.4
13.1 59.1 27.811.8 58.3 29.9
15.2 35.1 49.710.7 37.8 51.5
17.1 45.2 37.714.2 46.0 39.7
16.3 36.5 47.219.8 38.5 41.8
21.8 37.5 40.717.4 41.0 41.5
10.4 66.6 23.011.3 65.7 23.0
20.8 53.2 26.015.3 52.5 32.2
13.3 43.0 43.711.4 41.5 47.1
24.0 55.6 20.417.1 58.4 24.5
20.1 46.8 33.012.2 51.0 36.8
21.3 53.5 25.221.7 52.1 26.2
27.9 38.3 33.924.4 37.2 38.5
9.7 62.0 28.29.7 64.5 25.8
35.6 56.3 8.237.0 56.1 7.0
31.6 64.9 ≤5.032.7 64.9 ≤5.0
11.6 71.5 16.915.0 66.9 18.1
27.3 18.2 54.5≤5.0 16.7 83.3
18.2 18.2 63.610.0 10.0 80.0
16.7 50.0 33.3≤5.0 25.0 75.0
21.4 28.6 50.0≤5.0 21.4 78.6
21.4 28.6 50.0≤5.0 ≤5.0 ≥95.0
45.5 18.2 36.47.1 7.1 85.7
57.1 14.3 28.6≤5.0 30.8 69.2
36.4 27.3 36.4≤5.0 41.7 58.3
18.2 36.4 45.5≤5.0 30.0 70.0
33.3 41.7 25.08.3 33.3 58.3
28.6 42.9 28.614.3 50.0 35.7
21.4 71.4 7.1≤5.0 25.0 75.0
36.4 36.4 27.321.4 28.6 50.0
57.1 14.3 28.6≤5.0 46.2 53.8
8.3 66.7 25.0≤5.0 58.3 41.7
54.5 45.5 ≤5.021.4 71.4 7.1
64.3 21.4 14.338.5 46.2 15.4
Gale-Bailey Elementary School 1001
17.6 60.8 21.619.4 61.3 19.4
19.0 49.2 31.712.5 56.9 30.6
21.3 30.0 48.810.2 37.3 52.5
* * ** * *
* * ** * *
* * ** * *
* * ** * *
13.7 70.6 15.714.5 66.1 19.4
9.4 45.3 45.311.3 46.5 42.3
23.8 56.3 20.018.6 50.8 30.5
* * ** * *
* * ** * *
* * ** * *
* * ** * *
36.3 58.8 ≤5.033.9 61.0 5.1
* * ** * *
* * ** * *
* * ** * *
* * ** * *
* * ** * *
* * ** * *
* * ** * *
* * ** * *
* * ** * *
* * ** * *
* * ** * *
* * ** * *
* * ** * *
* * ** * *
* * ** * *
* * ** * *
* * ** * *
* * ** * *
* * ** * *
2013 School Progress
All StudentsAmerican Indian or
Alaska NativeAsian
Black or African American
Hispanic/Latino of any raceNative Hawaiian or
Other Pacific Islander White
Two or more races
Free/Reduced Meals
Special Education
Limited English Proficient
Percent Proficient Participation RateReading Math Reading Math
Not Met Met Met Met
na na na na
na na na na
Met Met Met Met
na na na na
* * * *
Met Met Met Met
Met Met na na
Met Met Met Met
Not Met Met na na
* * * *
2013 School Progress Index SPI: 0.8836 Strand: 5 Values 1.0000 and above met the target.
Achievement Gap Red. GrowthElementary
Math 1.0204 0.6790 0.9766Reading 0.9197 0.6949 0.9978Science 0.9567 0.8595
Attendance Rate %School
2013School
2012County
2013County
2012State 2013
State 2012
Elementary ≥95.0 ≥95.0 ≥95.0 ≥95.0 95.5 95.9
Middle * * ≥95.0 ≥95.0 95.1 95.4
High * * 93.9 93.8 92.5 92.2Teacher Qualifications% of certificates:
Standard Professional 47.4 60.0 38.4 41.0 28.4 29.0
Advanced Professional 52.6 40.0 58.0 57.0 65.1 65.2
Resident Teacher 0.0 0.0 0.0 0.0 0.8 0.9
Conditional Teacher 0.0 0.0 0.9 1.1 0.9 0.9
% of classes NOT taught by:Highly Qualified Teachers 0.0 0.0 3.9 4.5 6.2 6.9

Basic % Proficient % Advanced %
MSA Proficiency LevelsApproximately 99% of Maryland students take MSA. The Basic Level is below the goal set for all students.
Alt-MSA Proficiency LevelsApproximately 1% of Maryland students take Alt-MSA. The Basic Level is below the goal set for all students.
Visit MdReportCard.org for up-to-date and disaggregated information. For definitions, see school system report pages.
Read
ing
Mat
hem
atic
sSc
ienc
e
17.4 60.5 22.115.0 64.4 20.6
11.8 58.4 29.810.2 55.6 34.2
11.6 31.8 56.610.1 34.9 55.1
15.9 40.6 43.515.5 42.7 41.8
15.0 36.9 48.118.8 35.5 45.7
19.0 34.9 46.119.2 36.6 44.2
17.0 55.3 27.816.9 54.9 28.2
17.8 53.3 28.912.2 49.0 38.7
11.2 42.1 46.710.1 38.6 51.2
19.1 55.5 25.314.7 54.8 30.5
22.9 48.0 29.117.0 47.6 35.5
27.4 49.3 23.323.7 49.5 26.9
33.0 36.4 30.630.7 36.2 33.1
15.8 53.4 30.816.1 53.1 30.8
33.0 56.4 10.631.5 57.5 11.1
28.6 64.6 6.729.3 63.3 7.4
17.4 60.7 21.918.3 59.6 22.1
13.4 26.3 60.37.2 18.5 74.3
10.2 22.1 67.78.7 16.8 74.5
12.6 26.5 60.96.5 16.2 77.3
10.3 25.9 63.87.2 17.6 75.2
7.9 24.8 67.36.1 13.1 80.7
11.2 25.5 63.38.1 15.2 76.7
20.9 22.8 56.310.7 15.3 74.0
19.2 36.8 44.110.9 30.7 58.5
15.5 36.8 47.79.9 30.0 60.1
19.7 40.9 39.49.5 33.7 56.8
17.2 36.1 46.79.8 30.9 59.3
14.3 33.9 51.88.7 31.2 60.1
15.5 36.4 48.19.9 36.8 53.3
23.8 31.0 45.214.0 31.8 54.2
22.7 44.2 33.115.5 37.2 47.3
22.3 40.4 37.316.8 42.6 40.6
33.3 34.3 32.421.7 41.4 36.9
“na” indicates too few students for School Progress rules. “*” indicates no students or fewer than 10 students in category. • E: English; • A: Algebra/Data Analysis; • B: Biology
3 20132012
4 20132012
5 20132012
6 20132012
7 20132012
8 20132012
10 20132012
3 20132012
4 20132012
5 20132012
6 20132012
7 20132012
8 20132012
10 20132012
5 20132012
8 20132012
10 20132012
3 20132012
4 20132012
5 20132012
6 20132012
7 20132012
8 20132012
•E 20132012
3 20132012
4 20132012
5 20132012
6 20132012
7 20132012
8 20132012
•A 20132012
5 20132012
8 20132012
•B 20132012
All Students Attendance Rate: Met
19.4 60.6 20.017.3 66.3 16.4
13.1 59.1 27.811.8 58.3 29.9
15.2 35.1 49.710.7 37.8 51.5
17.1 45.2 37.714.2 46.0 39.7
16.3 36.5 47.219.8 38.5 41.8
21.8 37.5 40.717.4 41.0 41.5
10.4 66.6 23.011.3 65.7 23.0
20.8 53.2 26.015.3 52.5 32.2
13.3 43.0 43.711.4 41.5 47.1
24.0 55.6 20.417.1 58.4 24.5
20.1 46.8 33.012.2 51.0 36.8
21.3 53.5 25.221.7 52.1 26.2
27.9 38.3 33.924.4 37.2 38.5
9.7 62.0 28.29.7 64.5 25.8
35.6 56.3 8.237.0 56.1 7.0
31.6 64.9 ≤5.032.7 64.9 ≤5.0
11.6 71.5 16.915.0 66.9 18.1
27.3 18.2 54.5≤5.0 16.7 83.3
18.2 18.2 63.610.0 10.0 80.0
16.7 50.0 33.3≤5.0 25.0 75.0
21.4 28.6 50.0≤5.0 21.4 78.6
21.4 28.6 50.0≤5.0 ≤5.0 ≥95.0
45.5 18.2 36.47.1 7.1 85.7
57.1 14.3 28.6≤5.0 30.8 69.2
36.4 27.3 36.4≤5.0 41.7 58.3
18.2 36.4 45.5≤5.0 30.0 70.0
33.3 41.7 25.08.3 33.3 58.3
28.6 42.9 28.614.3 50.0 35.7
21.4 71.4 7.1≤5.0 25.0 75.0
36.4 36.4 27.321.4 28.6 50.0
57.1 14.3 28.6≤5.0 46.2 53.8
8.3 66.7 25.0≤5.0 58.3 41.7
54.5 45.5 ≤5.021.4 71.4 7.1
64.3 21.4 14.338.5 46.2 15.4
General Smallwood Middle School 0705
* * ** * *
* * ** * *
* * ** * *
17.6 50.5 31.919.5 51.0 29.5
26.3 40.9 32.721.7 49.1 29.2
20.0 46.5 33.524.2 42.2 33.5
* * ** * *
* * ** * *
* * ** * *
* * ** * *
26.6 46.3 27.115.4 52.3 32.2
26.9 56.7 16.417.4 55.3 27.3
30.0 48.8 21.223.3 50.9 25.8
* * ** * *
* * ** * *
32.9 64.1 ≤5.044.2 55.2 ≤5.0
* * ** * *
* * ** * *
* * ** * *
* * ** * *
* * ** * *
* * ** * *
* * ** * *
* * ** * *
* * ** * *
* * ** * *
* * ** * *
* * ** * *
* * ** * *
* * ** * *
* * ** * *
* * ** * *
* * ** * *
* * ** * *
2013 School Progress
All StudentsAmerican Indian or
Alaska NativeAsian
Black or African American
Hispanic/Latino of any raceNative Hawaiian or
Other Pacific Islander White
Two or more races
Free/Reduced Meals
Special Education
Limited English Proficient
Percent Proficient Participation RateReading Math Reading Math
Not Met Not Met Met Met
na na na na
Met Met na na
Met Not Met Met Met
Met Met na na
* * * *
Met Met Met Met
Met Met na na
Not Met Met Met Met
Not Met Met Met Met
na na na na
2013 School Progress Index SPI: 0.9074 Strand: 4 Values 1.0000 and above met the target.
Achievement Gap Red. GrowthMiddle
Math 0.9271 0.7413 0.7957Reading 0.9424 0.7418 0.9040Science 1.0218 1.2416
Attendance Rate %School
2013School
2012County
2013County
2012State 2013
State 2012
Elementary * * ≥95.0 ≥95.0 95.5 95.9
Middle 94.5 ≥95.0 ≥95.0 ≥95.0 95.1 95.4
High * * 93.9 93.8 92.5 92.2Teacher Qualifications% of certificates:
Standard Professional 60.6 48.4 38.4 41.0 28.4 29.0
Advanced Professional 39.4 51.6 58.0 57.0 65.1 65.2
Resident Teacher 0.0 0.0 0.0 0.0 0.8 0.9
Conditional Teacher 0.0 0.0 0.9 1.1 0.9 0.9
% of classes NOT taught by:Highly Qualified Teachers 8.0 3.0 3.9 4.5 6.2 6.9

Basic % Proficient % Advanced %
MSA Proficiency LevelsApproximately 99% of Maryland students take MSA. The Basic Level is below the goal set for all students.
Alt-MSA Proficiency LevelsApproximately 1% of Maryland students take Alt-MSA. The Basic Level is below the goal set for all students.
Visit MdReportCard.org for up-to-date and disaggregated information. For definitions, see school system report pages.
Read
ing
Mat
hem
atic
sSc
ienc
e
“na” indicates too few students for School Progress rules. “*” indicates no students or fewer than 10 students in category. • E: English; • A: Algebra/Data Analysis; • B: Biology
3 20132012
4 20132012
5 20132012
6 20132012
7 20132012
8 20132012
10 20132012
3 20132012
4 20132012
5 20132012
6 20132012
7 20132012
8 20132012
10 20132012
5 20132012
8 20132012
10 20132012
3 20132012
4 20132012
5 20132012
6 20132012
7 20132012
8 20132012
•E 20132012
3 20132012
4 20132012
5 20132012
6 20132012
7 20132012
8 20132012
•A 20132012
5 20132012
8 20132012
•B 20132012
17.4 60.5 22.115.0 64.4 20.6
11.8 58.4 29.810.2 55.6 34.2
11.6 31.8 56.610.1 34.9 55.1
15.9 40.6 43.515.5 42.7 41.8
15.0 36.9 48.118.8 35.5 45.7
19.0 34.9 46.119.2 36.6 44.2
17.0 55.3 27.816.9 54.9 28.2
17.8 53.3 28.912.2 49.0 38.7
11.2 42.1 46.710.1 38.6 51.2
19.1 55.5 25.314.7 54.8 30.5
22.9 48.0 29.117.0 47.6 35.5
27.4 49.3 23.323.7 49.5 26.9
33.0 36.4 30.630.7 36.2 33.1
15.8 53.4 30.816.1 53.1 30.8
33.0 56.4 10.631.5 57.5 11.1
28.6 64.6 6.729.3 63.3 7.4
17.4 60.7 21.918.3 59.6 22.1
13.4 26.3 60.37.2 18.5 74.3
10.2 22.1 67.78.7 16.8 74.5
12.6 26.5 60.96.5 16.2 77.3
10.3 25.9 63.87.2 17.6 75.2
7.9 24.8 67.36.1 13.1 80.7
11.2 25.5 63.38.1 15.2 76.7
20.9 22.8 56.310.7 15.3 74.0
19.2 36.8 44.110.9 30.7 58.5
15.5 36.8 47.79.9 30.0 60.1
19.7 40.9 39.49.5 33.7 56.8
17.2 36.1 46.79.8 30.9 59.3
14.3 33.9 51.88.7 31.2 60.1
15.5 36.4 48.19.9 36.8 53.3
23.8 31.0 45.214.0 31.8 54.2
22.7 44.2 33.115.5 37.2 47.3
22.3 40.4 37.316.8 42.6 40.6
33.3 34.3 32.421.7 41.4 36.9
†College and Career Preparation (CCP) - 2011 ††Data from 2012
19.4 60.6 20.017.3 66.3 16.4
13.1 59.1 27.811.8 58.3 29.9
15.2 35.1 49.710.7 37.8 51.5
17.1 45.2 37.714.2 46.0 39.7
16.3 36.5 47.219.8 38.5 41.8
21.8 37.5 40.717.4 41.0 41.5
10.4 66.6 23.011.3 65.7 23.0
20.8 53.2 26.015.3 52.5 32.2
13.3 43.0 43.711.4 41.5 47.1
24.0 55.6 20.417.1 58.4 24.5
20.1 46.8 33.012.2 51.0 36.8
21.3 53.5 25.221.7 52.1 26.2
27.9 38.3 33.924.4 37.2 38.5
9.7 62.0 28.29.7 64.5 25.8
35.6 56.3 8.237.0 56.1 7.0
31.6 64.9 ≤5.032.7 64.9 ≤5.0
11.6 71.5 16.915.0 66.9 18.1
27.3 18.2 54.5≤5.0 16.7 83.3
18.2 18.2 63.610.0 10.0 80.0
16.7 50.0 33.3≤5.0 25.0 75.0
21.4 28.6 50.0≤5.0 21.4 78.6
21.4 28.6 50.0≤5.0 ≤5.0 ≥95.0
45.5 18.2 36.47.1 7.1 85.7
57.1 14.3 28.6≤5.0 30.8 69.2
36.4 27.3 36.4≤5.0 41.7 58.3
18.2 36.4 45.5≤5.0 30.0 70.0
33.3 41.7 25.08.3 33.3 58.3
28.6 42.9 28.614.3 50.0 35.7
21.4 71.4 7.1≤5.0 25.0 75.0
36.4 36.4 27.321.4 28.6 50.0
57.1 14.3 28.6≤5.0 46.2 53.8
8.3 66.7 25.0≤5.0 58.3 41.7
54.5 45.5 ≤5.021.4 71.4 7.1
64.3 21.4 14.338.5 46.2 15.4
Henry E. Lackey High School 1002
* * ** * *
* * ** * *
* * ** * *
* * ** * *
* * ** * *
* * ** * *
11.7 68.7 19.612.9 72.0 15.1
* * ** * *
* * ** * *
* * ** * *
* * ** * *
* * ** * *
* * ** * *
13.9 70.7 15.416.7 66.3 17.0
* * ** * *
* * ** * *
16.7 74.1 9.220.1 67.0 12.9
* * ** * *
* * ** * *
* * ** * *
* * ** * *
* * ** * *
* * ** * *
* * ** * *
* * ** * *
* * ** * *
* * ** * *
* * ** * *
* * ** * *
* * ** * *
* * ** * *
* * ** * *
* * ** * *
* * ** * *
2013 School Progress
All StudentsAmerican Indian or
Alaska NativeAsian
Black or African American
Hispanic/Latino of any raceNative Hawaiian or
Other Pacific Islander White
Two or more races
Free/Reduced Meals
Special Education
Limited English Proficient
Percent Proficient Participation Rate GraduationReading Math Reading Math
Met Met Met Met Met
na na na na na
na na na na na
Met Met Met Met Met
Met Met na na na
na * na * na
Met Met Met Met Met
Met Met na na na
Met Met Met Met Met
Met Met na na na
* * * * *
2013 School Progress Index SPI: 0.9454 Strand: 3 Values 1.0000 and above met the target.
High Achievement Gap Red. CCRAlgebra 1.0175 0.6407English 1.0714 0.8723Biology 0.9930 0.8853
††Dropout 0.9816††Grad 0.8895 1.0115
†CCP 0.8946
Attendance Rate %School
2013School
2012County
2013County
2012State 2013
State 2012
Elementary * * ≥95.0 ≥95.0 95.5 95.9
Middle * * ≥95.0 ≥95.0 95.1 95.4
High 92.1 92.2 93.9 93.8 92.5 92.2Teacher Qualifications% of certificates:
Standard Professional 34.9 41.3 38.4 41.0 28.4 29.0
Advanced Professional 52.4 54.0 58.0 57.0 65.1 65.2
Resident Teacher 0.0 0.0 0.0 0.0 0.8 0.9
Conditional Teacher 6.3 4.8 0.9 1.1 0.9 0.9
% of classes NOT taught by:Highly Qualified Teachers 10.1 10.8 3.9 4.5 6.2 6.9
Cohort Graduation Rate %Class of 2012 (4-Yr Rate) 85.35 89.76 83.57
Class of 2012 (5-Yr Rate) 89.84 92.42 86.32

Basic % Proficient % Advanced %
MSA Proficiency LevelsApproximately 99% of Maryland students take MSA. The Basic Level is below the goal set for all students.
Alt-MSA Proficiency LevelsApproximately 1% of Maryland students take Alt-MSA. The Basic Level is below the goal set for all students.
Visit MdReportCard.org for up-to-date and disaggregated information. For definitions, see school system report pages.
Read
ing
Mat
hem
atic
sSc
ienc
e
17.4 60.5 22.115.0 64.4 20.6
11.8 58.4 29.810.2 55.6 34.2
11.6 31.8 56.610.1 34.9 55.1
15.9 40.6 43.515.5 42.7 41.8
15.0 36.9 48.118.8 35.5 45.7
19.0 34.9 46.119.2 36.6 44.2
17.0 55.3 27.816.9 54.9 28.2
17.8 53.3 28.912.2 49.0 38.7
11.2 42.1 46.710.1 38.6 51.2
19.1 55.5 25.314.7 54.8 30.5
22.9 48.0 29.117.0 47.6 35.5
27.4 49.3 23.323.7 49.5 26.9
33.0 36.4 30.630.7 36.2 33.1
15.8 53.4 30.816.1 53.1 30.8
33.0 56.4 10.631.5 57.5 11.1
28.6 64.6 6.729.3 63.3 7.4
17.4 60.7 21.918.3 59.6 22.1
13.4 26.3 60.37.2 18.5 74.3
10.2 22.1 67.78.7 16.8 74.5
12.6 26.5 60.96.5 16.2 77.3
10.3 25.9 63.87.2 17.6 75.2
7.9 24.8 67.36.1 13.1 80.7
11.2 25.5 63.38.1 15.2 76.7
20.9 22.8 56.310.7 15.3 74.0
19.2 36.8 44.110.9 30.7 58.5
15.5 36.8 47.79.9 30.0 60.1
19.7 40.9 39.49.5 33.7 56.8
17.2 36.1 46.79.8 30.9 59.3
14.3 33.9 51.88.7 31.2 60.1
15.5 36.4 48.19.9 36.8 53.3
23.8 31.0 45.214.0 31.8 54.2
22.7 44.2 33.115.5 37.2 47.3
22.3 40.4 37.316.8 42.6 40.6
33.3 34.3 32.421.7 41.4 36.9
“na” indicates too few students for School Progress rules. “*” indicates no students or fewer than 10 students in category. • E: English; • A: Algebra/Data Analysis; • B: Biology
3 20132012
4 20132012
5 20132012
6 20132012
7 20132012
8 20132012
10 20132012
3 20132012
4 20132012
5 20132012
6 20132012
7 20132012
8 20132012
10 20132012
5 20132012
8 20132012
10 20132012
3 20132012
4 20132012
5 20132012
6 20132012
7 20132012
8 20132012
•E 20132012
3 20132012
4 20132012
5 20132012
6 20132012
7 20132012
8 20132012
•A 20132012
5 20132012
8 20132012
•B 20132012
All Students Attendance Rate: Met
19.4 60.6 20.017.3 66.3 16.4
13.1 59.1 27.811.8 58.3 29.9
15.2 35.1 49.710.7 37.8 51.5
17.1 45.2 37.714.2 46.0 39.7
16.3 36.5 47.219.8 38.5 41.8
21.8 37.5 40.717.4 41.0 41.5
10.4 66.6 23.011.3 65.7 23.0
20.8 53.2 26.015.3 52.5 32.2
13.3 43.0 43.711.4 41.5 47.1
24.0 55.6 20.417.1 58.4 24.5
20.1 46.8 33.012.2 51.0 36.8
21.3 53.5 25.221.7 52.1 26.2
27.9 38.3 33.924.4 37.2 38.5
9.7 62.0 28.29.7 64.5 25.8
35.6 56.3 8.237.0 56.1 7.0
31.6 64.9 ≤5.032.7 64.9 ≤5.0
11.6 71.5 16.915.0 66.9 18.1
27.3 18.2 54.5≤5.0 16.7 83.3
18.2 18.2 63.610.0 10.0 80.0
16.7 50.0 33.3≤5.0 25.0 75.0
21.4 28.6 50.0≤5.0 21.4 78.6
21.4 28.6 50.0≤5.0 ≤5.0 ≥95.0
45.5 18.2 36.47.1 7.1 85.7
57.1 14.3 28.6≤5.0 30.8 69.2
36.4 27.3 36.4≤5.0 41.7 58.3
18.2 36.4 45.5≤5.0 30.0 70.0
33.3 41.7 25.08.3 33.3 58.3
28.6 42.9 28.614.3 50.0 35.7
21.4 71.4 7.1≤5.0 25.0 75.0
36.4 36.4 27.321.4 28.6 50.0
57.1 14.3 28.6≤5.0 46.2 53.8
8.3 66.7 25.0≤5.0 58.3 41.7
54.5 45.5 ≤5.021.4 71.4 7.1
64.3 21.4 14.338.5 46.2 15.4
Indian Head Elementary School 0710
22.6 66.1 11.333.3 59.3 7.4
21.5 62.4 16.131.8 54.5 13.6
26.8 30.4 42.915.5 46.5 38.0
* * ** * *
* * ** * *
* * ** * *
* * ** * *
35.5 48.4 16.140.7 43.2 16.0
22.6 50.5 26.922.7 54.5 22.7
33.3 52.6 14.019.7 59.2 21.1
* * ** * *
* * ** * *
* * ** * *
* * ** * *
41.8 49.1 9.145.7 41.4 12.9
* * ** * *
* * ** * *
* * ** * *
* * ** * *
* * ** * *
* * ** * *
* * ** * *
* * ** * *
* * ** * *
* * ** * *
* * ** * *
* * ** * *
* * ** * *
* * ** * *
* * ** * *
* * ** * *
* * ** * *
* * ** * *
* * ** * *
2013 School Progress
All StudentsAmerican Indian or
Alaska NativeAsian
Black or African American
Hispanic/Latino of any raceNative Hawaiian or
Other Pacific Islander White
Two or more races
Free/Reduced Meals
Special Education
Limited English Proficient
Percent Proficient Participation RateReading Math Reading Math
Met Not Met Met Met
na na na na
Not Met Met na na
Not Met Met Met Met
Met Met na na
na na na na
Met Met Met Met
Met Met na na
Met Met Met Met
Met Not Met na na
na na na na
2013 School Progress Index SPI: 0.8731 Strand: 5 Values 1.0000 and above met the target.
Achievement Gap Red. GrowthElementary
Math 0.8962 0.5165 0.9387Reading 0.9329 0.6397 0.9986Science 0.9444 1.1326
Attendance Rate %School
2013School
2012County
2013County
2012State 2013
State 2012
Elementary ≥95.0 ≥95.0 ≥95.0 ≥95.0 95.5 95.9
Middle * * ≥95.0 ≥95.0 95.1 95.4
High * * 93.9 93.8 92.5 92.2Teacher Qualifications% of certificates:
Standard Professional 61.9 84.2 38.4 41.0 28.4 29.0
Advanced Professional 33.3 15.8 58.0 57.0 65.1 65.2
Resident Teacher 0.0 0.0 0.0 0.0 0.8 0.9
Conditional Teacher 0.0 0.0 0.9 1.1 0.9 0.9
% of classes NOT taught by:Highly Qualified Teachers 0.0 0.0 3.9 4.5 6.2 6.9

Basic % Proficient % Advanced %
MSA Proficiency LevelsApproximately 99% of Maryland students take MSA. The Basic Level is below the goal set for all students.
Alt-MSA Proficiency LevelsApproximately 1% of Maryland students take Alt-MSA. The Basic Level is below the goal set for all students.
Visit MdReportCard.org for up-to-date and disaggregated information. For definitions, see school system report pages.
Read
ing
Mat
hem
atic
sSc
ienc
e
“na” indicates too few students for School Progress rules. “*” indicates no students or fewer than 10 students in category. • E: English; • A: Algebra/Data Analysis; • B: Biology
3 20132012
4 20132012
5 20132012
6 20132012
7 20132012
8 20132012
10 20132012
3 20132012
4 20132012
5 20132012
6 20132012
7 20132012
8 20132012
10 20132012
5 20132012
8 20132012
10 20132012
3 20132012
4 20132012
5 20132012
6 20132012
7 20132012
8 20132012
•E 20132012
3 20132012
4 20132012
5 20132012
6 20132012
7 20132012
8 20132012
•A 20132012
5 20132012
8 20132012
•B 20132012
All Students Attendance Rate: Met
17.4 60.5 22.115.0 64.4 20.6
11.8 58.4 29.810.2 55.6 34.2
11.6 31.8 56.610.1 34.9 55.1
15.9 40.6 43.515.5 42.7 41.8
15.0 36.9 48.118.8 35.5 45.7
19.0 34.9 46.119.2 36.6 44.2
17.0 55.3 27.816.9 54.9 28.2
17.8 53.3 28.912.2 49.0 38.7
11.2 42.1 46.710.1 38.6 51.2
19.1 55.5 25.314.7 54.8 30.5
22.9 48.0 29.117.0 47.6 35.5
27.4 49.3 23.323.7 49.5 26.9
33.0 36.4 30.630.7 36.2 33.1
15.8 53.4 30.816.1 53.1 30.8
33.0 56.4 10.631.5 57.5 11.1
28.6 64.6 6.729.3 63.3 7.4
17.4 60.7 21.918.3 59.6 22.1
13.4 26.3 60.37.2 18.5 74.3
10.2 22.1 67.78.7 16.8 74.5
12.6 26.5 60.96.5 16.2 77.3
10.3 25.9 63.87.2 17.6 75.2
7.9 24.8 67.36.1 13.1 80.7
11.2 25.5 63.38.1 15.2 76.7
20.9 22.8 56.310.7 15.3 74.0
19.2 36.8 44.110.9 30.7 58.5
15.5 36.8 47.79.9 30.0 60.1
19.7 40.9 39.49.5 33.7 56.8
17.2 36.1 46.79.8 30.9 59.3
14.3 33.9 51.88.7 31.2 60.1
15.5 36.4 48.19.9 36.8 53.3
23.8 31.0 45.214.0 31.8 54.2
22.7 44.2 33.115.5 37.2 47.3
22.3 40.4 37.316.8 42.6 40.6
33.3 34.3 32.421.7 41.4 36.9
19.4 60.6 20.017.3 66.3 16.4
13.1 59.1 27.811.8 58.3 29.9
15.2 35.1 49.710.7 37.8 51.5
17.1 45.2 37.714.2 46.0 39.7
16.3 36.5 47.219.8 38.5 41.8
21.8 37.5 40.717.4 41.0 41.5
10.4 66.6 23.011.3 65.7 23.0
20.8 53.2 26.015.3 52.5 32.2
13.3 43.0 43.711.4 41.5 47.1
24.0 55.6 20.417.1 58.4 24.5
20.1 46.8 33.012.2 51.0 36.8
21.3 53.5 25.221.7 52.1 26.2
27.9 38.3 33.924.4 37.2 38.5
9.7 62.0 28.29.7 64.5 25.8
35.6 56.3 8.237.0 56.1 7.0
31.6 64.9 ≤5.032.7 64.9 ≤5.0
11.6 71.5 16.915.0 66.9 18.1
27.3 18.2 54.5≤5.0 16.7 83.3
18.2 18.2 63.610.0 10.0 80.0
16.7 50.0 33.3≤5.0 25.0 75.0
21.4 28.6 50.0≤5.0 21.4 78.6
21.4 28.6 50.0≤5.0 ≤5.0 ≥95.0
45.5 18.2 36.47.1 7.1 85.7
57.1 14.3 28.6≤5.0 30.8 69.2
36.4 27.3 36.4≤5.0 41.7 58.3
18.2 36.4 45.5≤5.0 30.0 70.0
33.3 41.7 25.08.3 33.3 58.3
28.6 42.9 28.614.3 50.0 35.7
21.4 71.4 7.1≤5.0 25.0 75.0
36.4 36.4 27.321.4 28.6 50.0
57.1 14.3 28.6≤5.0 46.2 53.8
8.3 66.7 25.0≤5.0 58.3 41.7
54.5 45.5 ≤5.021.4 71.4 7.1
64.3 21.4 14.338.5 46.2 15.4
J. C. Parks Elementary School 0703
34.6 55.6 9.832.6 57.9 9.5
18.5 52.9 28.618.9 58.5 22.6
28.9 33.1 38.011.6 43.8 44.6
* * ** * *
* * ** * *
* * ** * *
* * ** * *
36.1 48.9 15.028.4 57.9 13.7
16.8 40.3 42.919.8 48.1 32.1
38.0 52.1 9.931.3 55.4 13.4
* * ** * *
* * ** * *
* * ** * *
* * ** * *
51.3 42.9 5.946.4 46.4 7.3
* * ** * *
* * ** * *
* * ** * *
* * ** * *
* * ** * *
* * ** * *
* * ** * *
* * ** * *
* * ** * *
* * ** * *
* * ** * *
* * ** * *
* * ** * *
* * ** * *
* * ** * *
* * ** * *
* * ** * *
* * ** * *
* * ** * *
2013 School Progress
All StudentsAmerican Indian or
Alaska NativeAsian
Black or African American
Hispanic/Latino of any raceNative Hawaiian or
Other Pacific Islander White
Two or more races
Free/Reduced Meals
Special Education
Limited English Proficient
Percent Proficient Participation RateReading Math Reading Math
Not Met Not Met Met Met
na na na na
na na na na
Not Met Not Met Met Met
Met Met na na
* * * *
Met Met na na
Met Met na na
Not Met Not Met Met Met
Not Met Not Met na na
na na na na
2013 School Progress Index SPI: 0.8211 Strand: 5 Values 1.0000 and above met the target.
Achievement Gap Red. GrowthElementary
Math 0.8518 0.7204 0.9282Reading 0.8548 0.5886 0.9501Science 0.6551 0.9652
Attendance Rate %School
2013School
2012County
2013County
2012State 2013
State 2012
Elementary ≥95.0 ≥95.0 ≥95.0 ≥95.0 95.5 95.9
Middle * * ≥95.0 ≥95.0 95.1 95.4
High * * 93.9 93.8 92.5 92.2Teacher Qualifications% of certificates:
Standard Professional 46.9 55.2 38.4 41.0 28.4 29.0
Advanced Professional 50.0 44.8 58.0 57.0 65.1 65.2
Resident Teacher 0.0 0.0 0.0 0.0 0.8 0.9
Conditional Teacher 0.0 0.0 0.9 1.1 0.9 0.9
% of classes NOT taught by:Highly Qualified Teachers 0.0 0.0 3.9 4.5 6.2 6.9

Basic % Proficient % Advanced %
MSA Proficiency LevelsApproximately 99% of Maryland students take MSA. The Basic Level is below the goal set for all students.
Alt-MSA Proficiency LevelsApproximately 1% of Maryland students take Alt-MSA. The Basic Level is below the goal set for all students.
Visit MdReportCard.org for up-to-date and disaggregated information. For definitions, see school system report pages.
Read
ing
Mat
hem
atic
sSc
ienc
e
17.4 60.5 22.115.0 64.4 20.6
11.8 58.4 29.810.2 55.6 34.2
11.6 31.8 56.610.1 34.9 55.1
15.9 40.6 43.515.5 42.7 41.8
15.0 36.9 48.118.8 35.5 45.7
19.0 34.9 46.119.2 36.6 44.2
17.0 55.3 27.816.9 54.9 28.2
17.8 53.3 28.912.2 49.0 38.7
11.2 42.1 46.710.1 38.6 51.2
19.1 55.5 25.314.7 54.8 30.5
22.9 48.0 29.117.0 47.6 35.5
27.4 49.3 23.323.7 49.5 26.9
33.0 36.4 30.630.7 36.2 33.1
15.8 53.4 30.816.1 53.1 30.8
33.0 56.4 10.631.5 57.5 11.1
28.6 64.6 6.729.3 63.3 7.4
17.4 60.7 21.918.3 59.6 22.1
13.4 26.3 60.37.2 18.5 74.3
10.2 22.1 67.78.7 16.8 74.5
12.6 26.5 60.96.5 16.2 77.3
10.3 25.9 63.87.2 17.6 75.2
7.9 24.8 67.36.1 13.1 80.7
11.2 25.5 63.38.1 15.2 76.7
20.9 22.8 56.310.7 15.3 74.0
19.2 36.8 44.110.9 30.7 58.5
15.5 36.8 47.79.9 30.0 60.1
19.7 40.9 39.49.5 33.7 56.8
17.2 36.1 46.79.8 30.9 59.3
14.3 33.9 51.88.7 31.2 60.1
15.5 36.4 48.19.9 36.8 53.3
23.8 31.0 45.214.0 31.8 54.2
22.7 44.2 33.115.5 37.2 47.3
22.3 40.4 37.316.8 42.6 40.6
33.3 34.3 32.421.7 41.4 36.9
“na” indicates too few students for School Progress rules. “*” indicates no students or fewer than 10 students in category. • E: English; • A: Algebra/Data Analysis; • B: Biology
3 20132012
4 20132012
5 20132012
6 20132012
7 20132012
8 20132012
10 20132012
3 20132012
4 20132012
5 20132012
6 20132012
7 20132012
8 20132012
10 20132012
5 20132012
8 20132012
10 20132012
3 20132012
4 20132012
5 20132012
6 20132012
7 20132012
8 20132012
•E 20132012
3 20132012
4 20132012
5 20132012
6 20132012
7 20132012
8 20132012
•A 20132012
5 20132012
8 20132012
•B 20132012
All Students Attendance Rate: Met
19.4 60.6 20.017.3 66.3 16.4
13.1 59.1 27.811.8 58.3 29.9
15.2 35.1 49.710.7 37.8 51.5
17.1 45.2 37.714.2 46.0 39.7
16.3 36.5 47.219.8 38.5 41.8
21.8 37.5 40.717.4 41.0 41.5
10.4 66.6 23.011.3 65.7 23.0
20.8 53.2 26.015.3 52.5 32.2
13.3 43.0 43.711.4 41.5 47.1
24.0 55.6 20.417.1 58.4 24.5
20.1 46.8 33.012.2 51.0 36.8
21.3 53.5 25.221.7 52.1 26.2
27.9 38.3 33.924.4 37.2 38.5
9.7 62.0 28.29.7 64.5 25.8
35.6 56.3 8.237.0 56.1 7.0
31.6 64.9 ≤5.032.7 64.9 ≤5.0
11.6 71.5 16.915.0 66.9 18.1
27.3 18.2 54.5≤5.0 16.7 83.3
18.2 18.2 63.610.0 10.0 80.0
16.7 50.0 33.3≤5.0 25.0 75.0
21.4 28.6 50.0≤5.0 21.4 78.6
21.4 28.6 50.0≤5.0 ≤5.0 ≥95.0
45.5 18.2 36.47.1 7.1 85.7
57.1 14.3 28.6≤5.0 30.8 69.2
36.4 27.3 36.4≤5.0 41.7 58.3
18.2 36.4 45.5≤5.0 30.0 70.0
33.3 41.7 25.08.3 33.3 58.3
28.6 42.9 28.614.3 50.0 35.7
21.4 71.4 7.1≤5.0 25.0 75.0
36.4 36.4 27.321.4 28.6 50.0
57.1 14.3 28.6≤5.0 46.2 53.8
8.3 66.7 25.0≤5.0 58.3 41.7
54.5 45.5 ≤5.021.4 71.4 7.1
64.3 21.4 14.338.5 46.2 15.4
J. P. Ryon Elementary School 0606
22.8 62.0 15.28.8 79.4 11.8
6.9 76.4 16.77.0 70.9 22.1
20.9 37.4 41.811.3 38.0 50.7
* * ** * *
* * ** * *
* * ** * *
* * ** * *
28.3 53.3 18.55.9 52.9 41.2
11.1 51.4 37.510.5 41.9 47.7
39.1 53.3 7.615.5 60.6 23.9
* * ** * *
* * ** * *
* * ** * *
* * ** * *
48.9 47.8 ≤5.035.2 57.7 7.0
* * ** * *
* * ** * *
* * ** * *
* * ** * *
* * ** * *
* * ** * *
* * ** * *
* * ** * *
* * ** * *
* * ** * *
* * ** * *
* * ** * *
* * ** * *
* * ** * *
* * ** * *
* * ** * *
* * ** * *
* * ** * *
* * ** * *
2013 School Progress
All StudentsAmerican Indian or
Alaska NativeAsian
Black or African American
Hispanic/Latino of any raceNative Hawaiian or
Other Pacific Islander White
Two or more races
Free/Reduced Meals
Special Education
Limited English Proficient
Percent Proficient Participation RateReading Math Reading Math
Not Met Not Met Met Met
na na na na
Met Met na na
Not Met Not Met Met Met
Met Met na na
* * * *
Met Met na na
Met Met na na
Not Met Not Met Met Met
Met Met na na
Met Met na na
2013 School Progress Index SPI: 0.8092 Strand: 5 Values 1.0000 and above met the target.
Achievement Gap Red. GrowthElementary
Math 0.8742 0.7576 0.5181Reading 0.9298 0.7928 0.9402Science 0.7849 0.9363
Attendance Rate %School
2013School
2012County
2013County
2012State 2013
State 2012
Elementary ≥95.0 ≥95.0 ≥95.0 ≥95.0 95.5 95.9
Middle * * ≥95.0 ≥95.0 95.1 95.4
High * * 93.9 93.8 92.5 92.2Teacher Qualifications% of certificates:
Standard Professional 41.7 31.8 38.4 41.0 28.4 29.0
Advanced Professional 50.0 68.2 58.0 57.0 65.1 65.2
Resident Teacher 0.0 0.0 0.0 0.0 0.8 0.9
Conditional Teacher 0.0 0.0 0.9 1.1 0.9 0.9
% of classes NOT taught by:Highly Qualified Teachers 0.0 0.0 3.9 4.5 6.2 6.9

Basic % Proficient % Advanced %
MSA Proficiency LevelsApproximately 99% of Maryland students take MSA. The Basic Level is below the goal set for all students.
Alt-MSA Proficiency LevelsApproximately 1% of Maryland students take Alt-MSA. The Basic Level is below the goal set for all students.
Visit MdReportCard.org for up-to-date and disaggregated information. For definitions, see school system report pages.
Read
ing
Mat
hem
atic
sSc
ienc
e
“na” indicates too few students for School Progress rules. “*” indicates no students or fewer than 10 students in category. • E: English; • A: Algebra/Data Analysis; • B: Biology
3 20132012
4 20132012
5 20132012
6 20132012
7 20132012
8 20132012
10 20132012
3 20132012
4 20132012
5 20132012
6 20132012
7 20132012
8 20132012
10 20132012
5 20132012
8 20132012
10 20132012
3 20132012
4 20132012
5 20132012
6 20132012
7 20132012
8 20132012
•E 20132012
3 20132012
4 20132012
5 20132012
6 20132012
7 20132012
8 20132012
•A 20132012
5 20132012
8 20132012
•B 20132012
All Students Attendance Rate: Met
17.4 60.5 22.115.0 64.4 20.6
11.8 58.4 29.810.2 55.6 34.2
11.6 31.8 56.610.1 34.9 55.1
15.9 40.6 43.515.5 42.7 41.8
15.0 36.9 48.118.8 35.5 45.7
19.0 34.9 46.119.2 36.6 44.2
17.0 55.3 27.816.9 54.9 28.2
17.8 53.3 28.912.2 49.0 38.7
11.2 42.1 46.710.1 38.6 51.2
19.1 55.5 25.314.7 54.8 30.5
22.9 48.0 29.117.0 47.6 35.5
27.4 49.3 23.323.7 49.5 26.9
33.0 36.4 30.630.7 36.2 33.1
15.8 53.4 30.816.1 53.1 30.8
33.0 56.4 10.631.5 57.5 11.1
28.6 64.6 6.729.3 63.3 7.4
17.4 60.7 21.918.3 59.6 22.1
13.4 26.3 60.37.2 18.5 74.3
10.2 22.1 67.78.7 16.8 74.5
12.6 26.5 60.96.5 16.2 77.3
10.3 25.9 63.87.2 17.6 75.2
7.9 24.8 67.36.1 13.1 80.7
11.2 25.5 63.38.1 15.2 76.7
20.9 22.8 56.310.7 15.3 74.0
19.2 36.8 44.110.9 30.7 58.5
15.5 36.8 47.79.9 30.0 60.1
19.7 40.9 39.49.5 33.7 56.8
17.2 36.1 46.79.8 30.9 59.3
14.3 33.9 51.88.7 31.2 60.1
15.5 36.4 48.19.9 36.8 53.3
23.8 31.0 45.214.0 31.8 54.2
22.7 44.2 33.115.5 37.2 47.3
22.3 40.4 37.316.8 42.6 40.6
33.3 34.3 32.421.7 41.4 36.9
19.4 60.6 20.017.3 66.3 16.4
13.1 59.1 27.811.8 58.3 29.9
15.2 35.1 49.710.7 37.8 51.5
17.1 45.2 37.714.2 46.0 39.7
16.3 36.5 47.219.8 38.5 41.8
21.8 37.5 40.717.4 41.0 41.5
10.4 66.6 23.011.3 65.7 23.0
20.8 53.2 26.015.3 52.5 32.2
13.3 43.0 43.711.4 41.5 47.1
24.0 55.6 20.417.1 58.4 24.5
20.1 46.8 33.012.2 51.0 36.8
21.3 53.5 25.221.7 52.1 26.2
27.9 38.3 33.924.4 37.2 38.5
9.7 62.0 28.29.7 64.5 25.8
35.6 56.3 8.237.0 56.1 7.0
31.6 64.9 ≤5.032.7 64.9 ≤5.0
11.6 71.5 16.915.0 66.9 18.1
27.3 18.2 54.5≤5.0 16.7 83.3
18.2 18.2 63.610.0 10.0 80.0
16.7 50.0 33.3≤5.0 25.0 75.0
21.4 28.6 50.0≤5.0 21.4 78.6
21.4 28.6 50.0≤5.0 ≤5.0 ≥95.0
45.5 18.2 36.47.1 7.1 85.7
57.1 14.3 28.6≤5.0 30.8 69.2
36.4 27.3 36.4≤5.0 41.7 58.3
18.2 36.4 45.5≤5.0 30.0 70.0
33.3 41.7 25.08.3 33.3 58.3
28.6 42.9 28.614.3 50.0 35.7
21.4 71.4 7.1≤5.0 25.0 75.0
36.4 36.4 27.321.4 28.6 50.0
57.1 14.3 28.6≤5.0 46.2 53.8
8.3 66.7 25.0≤5.0 58.3 41.7
54.5 45.5 ≤5.021.4 71.4 7.1
64.3 21.4 14.338.5 46.2 15.4
John Hanson Middle School 0608
* * ** * *
* * ** * *
* * ** * *
20.5 41.8 37.816.3 47.3 36.3
20.0 37.5 42.522.5 39.5 38.0
17.9 41.5 40.720.7 35.5 43.8
* * ** * *
* * ** * *
* * ** * *
* * ** * *
18.1 51.4 30.514.3 51.6 34.0
26.7 52.5 20.820.8 52.3 26.9
27.9 37.7 34.433.5 30.2 36.3
* * ** * *
* * ** * *
29.6 68.4 ≤5.033.6 65.3 ≤5.0
* * ** * *
* * ** * *
* * ** * *
* * ** * *
* * ** * *
* * ** * *
* * ** * *
* * ** * *
* * ** * *
* * ** * *
* * ** * *
* * ** * *
* * ** * *
* * ** * *
* * ** * *
* * ** * *
* * ** * *
* * ** * *
2013 School Progress
All StudentsAmerican Indian or
Alaska NativeAsian
Black or African American
Hispanic/Latino of any raceNative Hawaiian or
Other Pacific Islander White
Two or more races
Free/Reduced Meals
Special Education
Limited English Proficient
Percent Proficient Participation RateReading Math Reading Math
Met Met Met Met
na na na na
Met Met na na
Met Met Met Met
Met Met na na
* * * *
Met Met Met Met
Met Met na na
Met Met Met Met
Met Met Met Met
Met Met na na
2013 School Progress Index SPI: 0.9178 Strand: 4 Values 1.0000 and above met the target.
Achievement Gap Red. GrowthMiddle
Math 0.9668 0.8889 0.8154Reading 0.9858 0.7891 0.9910Science 0.9897 0.9665
Attendance Rate %School
2013School
2012County
2013County
2012State 2013
State 2012
Elementary * * ≥95.0 ≥95.0 95.5 95.9
Middle 94.8 ≥95.0 ≥95.0 ≥95.0 95.1 95.4
High * * 93.9 93.8 92.5 92.2Teacher Qualifications% of certificates:
Standard Professional 33.3 33.3 38.4 41.0 28.4 29.0
Advanced Professional 57.8 64.6 58.0 57.0 65.1 65.2
Resident Teacher 0.0 0.0 0.0 0.0 0.8 0.9
Conditional Teacher 4.4 2.1 0.9 1.1 0.9 0.9
% of classes NOT taught by:Highly Qualified Teachers 7.4 6.2 3.9 4.5 6.2 6.9

Basic % Proficient % Advanced %
MSA Proficiency LevelsApproximately 99% of Maryland students take MSA. The Basic Level is below the goal set for all students.
Alt-MSA Proficiency LevelsApproximately 1% of Maryland students take Alt-MSA. The Basic Level is below the goal set for all students.
Visit MdReportCard.org for up-to-date and disaggregated information. For definitions, see school system report pages.
Read
ing
Mat
hem
atic
sSc
ienc
e
17.4 60.5 22.115.0 64.4 20.6
11.8 58.4 29.810.2 55.6 34.2
11.6 31.8 56.610.1 34.9 55.1
15.9 40.6 43.515.5 42.7 41.8
15.0 36.9 48.118.8 35.5 45.7
19.0 34.9 46.119.2 36.6 44.2
17.0 55.3 27.816.9 54.9 28.2
17.8 53.3 28.912.2 49.0 38.7
11.2 42.1 46.710.1 38.6 51.2
19.1 55.5 25.314.7 54.8 30.5
22.9 48.0 29.117.0 47.6 35.5
27.4 49.3 23.323.7 49.5 26.9
33.0 36.4 30.630.7 36.2 33.1
15.8 53.4 30.816.1 53.1 30.8
33.0 56.4 10.631.5 57.5 11.1
28.6 64.6 6.729.3 63.3 7.4
17.4 60.7 21.918.3 59.6 22.1
13.4 26.3 60.37.2 18.5 74.3
10.2 22.1 67.78.7 16.8 74.5
12.6 26.5 60.96.5 16.2 77.3
10.3 25.9 63.87.2 17.6 75.2
7.9 24.8 67.36.1 13.1 80.7
11.2 25.5 63.38.1 15.2 76.7
20.9 22.8 56.310.7 15.3 74.0
19.2 36.8 44.110.9 30.7 58.5
15.5 36.8 47.79.9 30.0 60.1
19.7 40.9 39.49.5 33.7 56.8
17.2 36.1 46.79.8 30.9 59.3
14.3 33.9 51.88.7 31.2 60.1
15.5 36.4 48.19.9 36.8 53.3
23.8 31.0 45.214.0 31.8 54.2
22.7 44.2 33.115.5 37.2 47.3
22.3 40.4 37.316.8 42.6 40.6
33.3 34.3 32.421.7 41.4 36.9
“na” indicates too few students for School Progress rules. “*” indicates no students or fewer than 10 students in category. • E: English; • A: Algebra/Data Analysis; • B: Biology
3 20132012
4 20132012
5 20132012
6 20132012
7 20132012
8 20132012
10 20132012
3 20132012
4 20132012
5 20132012
6 20132012
7 20132012
8 20132012
10 20132012
5 20132012
8 20132012
10 20132012
3 20132012
4 20132012
5 20132012
6 20132012
7 20132012
8 20132012
•E 20132012
3 20132012
4 20132012
5 20132012
6 20132012
7 20132012
8 20132012
•A 20132012
5 20132012
8 20132012
•B 20132012
†College and Career Preparation (CCP) - 2011 ††Data from 2012
19.4 60.6 20.017.3 66.3 16.4
13.1 59.1 27.811.8 58.3 29.9
15.2 35.1 49.710.7 37.8 51.5
17.1 45.2 37.714.2 46.0 39.7
16.3 36.5 47.219.8 38.5 41.8
21.8 37.5 40.717.4 41.0 41.5
10.4 66.6 23.011.3 65.7 23.0
20.8 53.2 26.015.3 52.5 32.2
13.3 43.0 43.711.4 41.5 47.1
24.0 55.6 20.417.1 58.4 24.5
20.1 46.8 33.012.2 51.0 36.8
21.3 53.5 25.221.7 52.1 26.2
27.9 38.3 33.924.4 37.2 38.5
9.7 62.0 28.29.7 64.5 25.8
35.6 56.3 8.237.0 56.1 7.0
31.6 64.9 ≤5.032.7 64.9 ≤5.0
11.6 71.5 16.915.0 66.9 18.1
27.3 18.2 54.5≤5.0 16.7 83.3
18.2 18.2 63.610.0 10.0 80.0
16.7 50.0 33.3≤5.0 25.0 75.0
21.4 28.6 50.0≤5.0 21.4 78.6
21.4 28.6 50.0≤5.0 ≤5.0 ≥95.0
45.5 18.2 36.47.1 7.1 85.7
57.1 14.3 28.6≤5.0 30.8 69.2
36.4 27.3 36.4≤5.0 41.7 58.3
18.2 36.4 45.5≤5.0 30.0 70.0
33.3 41.7 25.08.3 33.3 58.3
28.6 42.9 28.614.3 50.0 35.7
21.4 71.4 7.1≤5.0 25.0 75.0
36.4 36.4 27.321.4 28.6 50.0
57.1 14.3 28.6≤5.0 46.2 53.8
8.3 66.7 25.0≤5.0 58.3 41.7
54.5 45.5 ≤5.021.4 71.4 7.1
64.3 21.4 14.338.5 46.2 15.4
La Plata High School 0106
* * ** * *
* * ** * *
* * ** * *
* * ** * *
* * ** * *
* * ** * *
≤5.0 61.3 33.66.3 60.9 32.8
* * ** * *
* * ** * *
* * ** * *
* * ** * *
* * ** * *
* * ** * *
≤5.0 51.5 44.4≤5.0 59.4 37.1
* * ** * *
* * ** * *
5.6 64.4 29.96.9 69.2 24.0
* * ** * *
* * ** * *
* * ** * *
* * ** * *
* * ** * *
* * ** * *
* * ** * *
* * ** * *
* * ** * *
* * ** * *
* * ** * *
* * ** * *
* * ** * *
* * ** * *
* * ** * *
* * ** * *
* * ** * *
2013 School Progress
All StudentsAmerican Indian or
Alaska NativeAsian
Black or African American
Hispanic/Latino of any raceNative Hawaiian or
Other Pacific Islander White
Two or more races
Free/Reduced Meals
Special Education
Limited English Proficient
Percent Proficient Participation Rate GraduationReading Math Reading Math
Met Met Met Met Met
na na na na na
Met Met na na na
Met Met Met Met Met
Met Met na na na
* * * * *
Met Met Met Met Met
Met Met na na na
Met Met Met Met Met
Met Met na na na
* * * * *
2013 School Progress Index SPI: 1.0754 Strand: 1 Values 1.0000 and above met the target.
High Achievement Gap Red. CCRAlgebra 1.0914 1.2112English 1.1040 1.0414Biology 1.1054 1.0353
††Dropout 0.9798††Grad 1.0102 1.1070
†CCP 1.0035
Attendance Rate %School
2013School
2012County
2013County
2012State 2013
State 2012
Elementary * * ≥95.0 ≥95.0 95.5 95.9
Middle * * ≥95.0 ≥95.0 95.1 95.4
High 93.8 93.9 93.9 93.8 92.5 92.2Teacher Qualifications% of certificates:
Standard Professional 32.8 27.3 38.4 41.0 28.4 29.0
Advanced Professional 65.7 71.2 58.0 57.0 65.1 65.2
Resident Teacher 0.0 0.0 0.0 0.0 0.8 0.9
Conditional Teacher 0.0 1.5 0.9 1.1 0.9 0.9
% of classes NOT taught by:Highly Qualified Teachers 2.8 3.5 3.9 4.5 6.2 6.9
Cohort Graduation Rate %Class of 2012 (4-Yr Rate) 93.48 89.76 83.57
Class of 2012 (5-Yr Rate) 94.90 92.42 86.32

Basic % Proficient % Advanced %
MSA Proficiency LevelsApproximately 99% of Maryland students take MSA. The Basic Level is below the goal set for all students.
Alt-MSA Proficiency LevelsApproximately 1% of Maryland students take Alt-MSA. The Basic Level is below the goal set for all students.
Visit MdReportCard.org for up-to-date and disaggregated information. For definitions, see school system report pages.
Read
ing
Mat
hem
atic
sSc
ienc
e
“na” indicates too few students for School Progress rules. “*” indicates no students or fewer than 10 students in category. • E: English; • A: Algebra/Data Analysis; • B: Biology
3 20132012
4 20132012
5 20132012
6 20132012
7 20132012
8 20132012
10 20132012
3 20132012
4 20132012
5 20132012
6 20132012
7 20132012
8 20132012
10 20132012
5 20132012
8 20132012
10 20132012
3 20132012
4 20132012
5 20132012
6 20132012
7 20132012
8 20132012
•E 20132012
3 20132012
4 20132012
5 20132012
6 20132012
7 20132012
8 20132012
•A 20132012
5 20132012
8 20132012
•B 20132012
All Students Attendance Rate: Met
17.4 60.5 22.115.0 64.4 20.6
11.8 58.4 29.810.2 55.6 34.2
11.6 31.8 56.610.1 34.9 55.1
15.9 40.6 43.515.5 42.7 41.8
15.0 36.9 48.118.8 35.5 45.7
19.0 34.9 46.119.2 36.6 44.2
17.0 55.3 27.816.9 54.9 28.2
17.8 53.3 28.912.2 49.0 38.7
11.2 42.1 46.710.1 38.6 51.2
19.1 55.5 25.314.7 54.8 30.5
22.9 48.0 29.117.0 47.6 35.5
27.4 49.3 23.323.7 49.5 26.9
33.0 36.4 30.630.7 36.2 33.1
15.8 53.4 30.816.1 53.1 30.8
33.0 56.4 10.631.5 57.5 11.1
28.6 64.6 6.729.3 63.3 7.4
17.4 60.7 21.918.3 59.6 22.1
13.4 26.3 60.37.2 18.5 74.3
10.2 22.1 67.78.7 16.8 74.5
12.6 26.5 60.96.5 16.2 77.3
10.3 25.9 63.87.2 17.6 75.2
7.9 24.8 67.36.1 13.1 80.7
11.2 25.5 63.38.1 15.2 76.7
20.9 22.8 56.310.7 15.3 74.0
19.2 36.8 44.110.9 30.7 58.5
15.5 36.8 47.79.9 30.0 60.1
19.7 40.9 39.49.5 33.7 56.8
17.2 36.1 46.79.8 30.9 59.3
14.3 33.9 51.88.7 31.2 60.1
15.5 36.4 48.19.9 36.8 53.3
23.8 31.0 45.214.0 31.8 54.2
22.7 44.2 33.115.5 37.2 47.3
22.3 40.4 37.316.8 42.6 40.6
33.3 34.3 32.421.7 41.4 36.9
19.4 60.6 20.017.3 66.3 16.4
13.1 59.1 27.811.8 58.3 29.9
15.2 35.1 49.710.7 37.8 51.5
17.1 45.2 37.714.2 46.0 39.7
16.3 36.5 47.219.8 38.5 41.8
21.8 37.5 40.717.4 41.0 41.5
10.4 66.6 23.011.3 65.7 23.0
20.8 53.2 26.015.3 52.5 32.2
13.3 43.0 43.711.4 41.5 47.1
24.0 55.6 20.417.1 58.4 24.5
20.1 46.8 33.012.2 51.0 36.8
21.3 53.5 25.221.7 52.1 26.2
27.9 38.3 33.924.4 37.2 38.5
9.7 62.0 28.29.7 64.5 25.8
35.6 56.3 8.237.0 56.1 7.0
31.6 64.9 ≤5.032.7 64.9 ≤5.0
11.6 71.5 16.915.0 66.9 18.1
27.3 18.2 54.5≤5.0 16.7 83.3
18.2 18.2 63.610.0 10.0 80.0
16.7 50.0 33.3≤5.0 25.0 75.0
21.4 28.6 50.0≤5.0 21.4 78.6
21.4 28.6 50.0≤5.0 ≤5.0 ≥95.0
45.5 18.2 36.47.1 7.1 85.7
57.1 14.3 28.6≤5.0 30.8 69.2
36.4 27.3 36.4≤5.0 41.7 58.3
18.2 36.4 45.5≤5.0 30.0 70.0
33.3 41.7 25.08.3 33.3 58.3
28.6 42.9 28.614.3 50.0 35.7
21.4 71.4 7.1≤5.0 25.0 75.0
36.4 36.4 27.321.4 28.6 50.0
57.1 14.3 28.6≤5.0 46.2 53.8
8.3 66.7 25.0≤5.0 58.3 41.7
54.5 45.5 ≤5.021.4 71.4 7.1
64.3 21.4 14.338.5 46.2 15.4
Malcolm Elementary School 0902
7.8 67.5 24.712.2 64.9 23.0
≤5.0 59.0 38.57.5 57.5 35.0
16.0 32.0 52.09.3 36.0 54.7
* * ** * *
* * ** * *
* * ** * *
* * ** * *
10.4 55.8 33.813.5 51.4 35.1
≤5.0 34.6 61.510.0 25.0 65.0
16.0 56.0 28.010.7 54.7 34.7
* * ** * *
* * ** * *
* * ** * *
* * ** * *
19.7 67.1 13.217.3 66.7 16.0
* * ** * *
* * ** * *
* * ** * *
* * ** * *
* * ** * *
* * ** * *
* * ** * *
* * ** * *
* * ** * *
* * ** * *
* * ** * *
* * ** * *
* * ** * *
* * ** * *
* * ** * *
* * ** * *
* * ** * *
* * ** * *
* * ** * *
2013 School Progress
All StudentsAmerican Indian or
Alaska NativeAsian
Black or African American
Hispanic/Latino of any raceNative Hawaiian or
Other Pacific Islander White
Two or more races
Free/Reduced Meals
Special Education
Limited English Proficient
Percent Proficient Participation RateReading Math Reading Math
Met Met Met Met
na na na na
na na na na
Met Met Met Met
Met Met na na
* * * *
Met Met Met Met
Met Met na na
Met Met na na
Not Met Not Met na na
na na na na
2013 School Progress Index SPI: 0.9012 Strand: 4 Values 1.0000 and above met the target.
Achievement Gap Red. GrowthElementary
Math 0.9866 0.7010 1.0254Reading 1.0276 0.7132 0.9210Science 0.8718 0.9907
Attendance Rate %School
2013School
2012County
2013County
2012State 2013
State 2012
Elementary ≥95.0 ≥95.0 ≥95.0 ≥95.0 95.5 95.9
Middle * * ≥95.0 ≥95.0 95.1 95.4
High * * 93.9 93.8 92.5 92.2Teacher Qualifications% of certificates:
Standard Professional 14.3 22.7 38.4 41.0 28.4 29.0
Advanced Professional 85.7 77.3 58.0 57.0 65.1 65.2
Resident Teacher 0.0 0.0 0.0 0.0 0.8 0.9
Conditional Teacher 0.0 0.0 0.9 1.1 0.9 0.9
% of classes NOT taught by:Highly Qualified Teachers 0.0 0.0 3.9 4.5 6.2 6.9
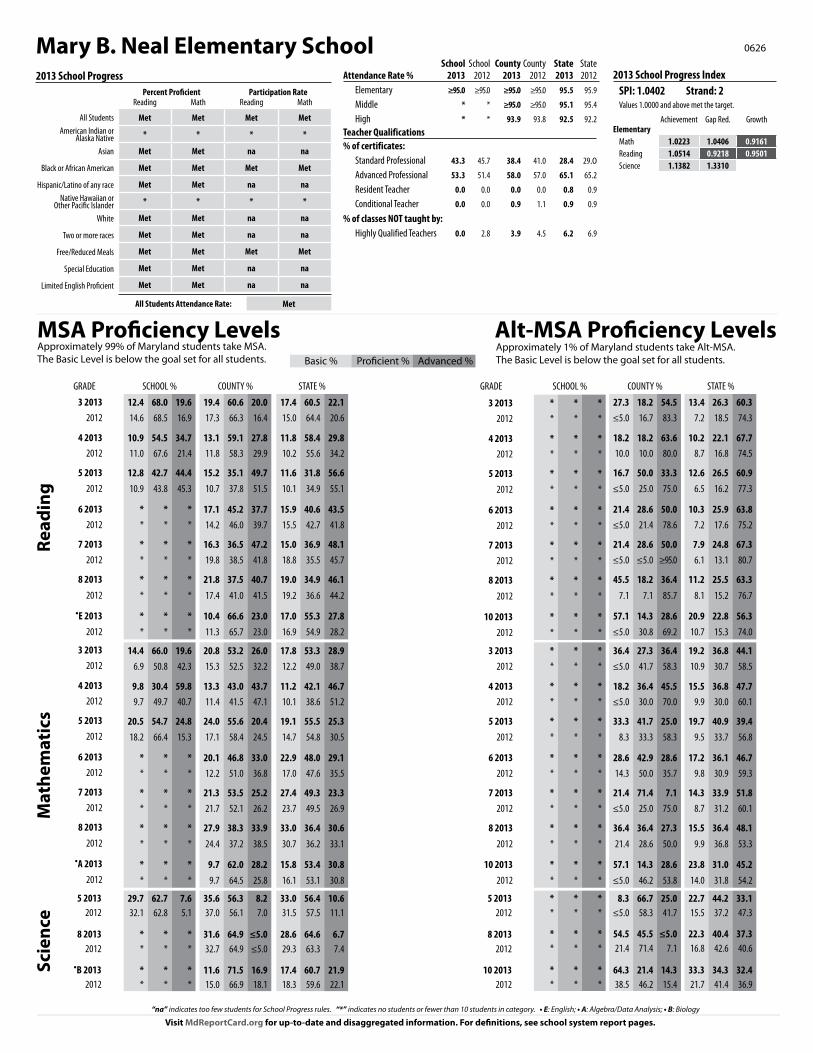
Basic % Proficient % Advanced %
MSA Proficiency LevelsApproximately 99% of Maryland students take MSA. The Basic Level is below the goal set for all students.
Alt-MSA Proficiency LevelsApproximately 1% of Maryland students take Alt-MSA. The Basic Level is below the goal set for all students.
Visit MdReportCard.org for up-to-date and disaggregated information. For definitions, see school system report pages.
Read
ing
Mat
hem
atic
sSc
ienc
e
17.4 60.5 22.115.0 64.4 20.6
11.8 58.4 29.810.2 55.6 34.2
11.6 31.8 56.610.1 34.9 55.1
15.9 40.6 43.515.5 42.7 41.8
15.0 36.9 48.118.8 35.5 45.7
19.0 34.9 46.119.2 36.6 44.2
17.0 55.3 27.816.9 54.9 28.2
17.8 53.3 28.912.2 49.0 38.7
11.2 42.1 46.710.1 38.6 51.2
19.1 55.5 25.314.7 54.8 30.5
22.9 48.0 29.117.0 47.6 35.5
27.4 49.3 23.323.7 49.5 26.9
33.0 36.4 30.630.7 36.2 33.1
15.8 53.4 30.816.1 53.1 30.8
33.0 56.4 10.631.5 57.5 11.1
28.6 64.6 6.729.3 63.3 7.4
17.4 60.7 21.918.3 59.6 22.1
13.4 26.3 60.37.2 18.5 74.3
10.2 22.1 67.78.7 16.8 74.5
12.6 26.5 60.96.5 16.2 77.3
10.3 25.9 63.87.2 17.6 75.2
7.9 24.8 67.36.1 13.1 80.7
11.2 25.5 63.38.1 15.2 76.7
20.9 22.8 56.310.7 15.3 74.0
19.2 36.8 44.110.9 30.7 58.5
15.5 36.8 47.79.9 30.0 60.1
19.7 40.9 39.49.5 33.7 56.8
17.2 36.1 46.79.8 30.9 59.3
14.3 33.9 51.88.7 31.2 60.1
15.5 36.4 48.19.9 36.8 53.3
23.8 31.0 45.214.0 31.8 54.2
22.7 44.2 33.115.5 37.2 47.3
22.3 40.4 37.316.8 42.6 40.6
33.3 34.3 32.421.7 41.4 36.9
“na” indicates too few students for School Progress rules. “*” indicates no students or fewer than 10 students in category. • E: English; • A: Algebra/Data Analysis; • B: Biology
3 20132012
4 20132012
5 20132012
6 20132012
7 20132012
8 20132012
10 20132012
3 20132012
4 20132012
5 20132012
6 20132012
7 20132012
8 20132012
10 20132012
5 20132012
8 20132012
10 20132012
3 20132012
4 20132012
5 20132012
6 20132012
7 20132012
8 20132012
•E 20132012
3 20132012
4 20132012
5 20132012
6 20132012
7 20132012
8 20132012
•A 20132012
5 20132012
8 20132012
•B 20132012
All Students Attendance Rate: Met
19.4 60.6 20.017.3 66.3 16.4
13.1 59.1 27.811.8 58.3 29.9
15.2 35.1 49.710.7 37.8 51.5
17.1 45.2 37.714.2 46.0 39.7
16.3 36.5 47.219.8 38.5 41.8
21.8 37.5 40.717.4 41.0 41.5
10.4 66.6 23.011.3 65.7 23.0
20.8 53.2 26.015.3 52.5 32.2
13.3 43.0 43.711.4 41.5 47.1
24.0 55.6 20.417.1 58.4 24.5
20.1 46.8 33.012.2 51.0 36.8
21.3 53.5 25.221.7 52.1 26.2
27.9 38.3 33.924.4 37.2 38.5
9.7 62.0 28.29.7 64.5 25.8
35.6 56.3 8.237.0 56.1 7.0
31.6 64.9 ≤5.032.7 64.9 ≤5.0
11.6 71.5 16.915.0 66.9 18.1
27.3 18.2 54.5≤5.0 16.7 83.3
18.2 18.2 63.610.0 10.0 80.0
16.7 50.0 33.3≤5.0 25.0 75.0
21.4 28.6 50.0≤5.0 21.4 78.6
21.4 28.6 50.0≤5.0 ≤5.0 ≥95.0
45.5 18.2 36.47.1 7.1 85.7
57.1 14.3 28.6≤5.0 30.8 69.2
36.4 27.3 36.4≤5.0 41.7 58.3
18.2 36.4 45.5≤5.0 30.0 70.0
33.3 41.7 25.08.3 33.3 58.3
28.6 42.9 28.614.3 50.0 35.7
21.4 71.4 7.1≤5.0 25.0 75.0
36.4 36.4 27.321.4 28.6 50.0
57.1 14.3 28.6≤5.0 46.2 53.8
8.3 66.7 25.0≤5.0 58.3 41.7
54.5 45.5 ≤5.021.4 71.4 7.1
64.3 21.4 14.338.5 46.2 15.4
Mary B. Neal Elementary School 0626
12.4 68.0 19.614.6 68.5 16.9
10.9 54.5 34.711.0 67.6 21.4
12.8 42.7 44.410.9 43.8 45.3
* * ** * *
* * ** * *
* * ** * *
* * ** * *
14.4 66.0 19.66.9 50.8 42.3
9.8 30.4 59.89.7 49.7 40.7
20.5 54.7 24.818.2 66.4 15.3
* * ** * *
* * ** * *
* * ** * *
* * ** * *
29.7 62.7 7.632.1 62.8 5.1
* * ** * *
* * ** * *
* * ** * *
* * ** * *
* * ** * *
* * ** * *
* * ** * *
* * ** * *
* * ** * *
* * ** * *
* * ** * *
* * ** * *
* * ** * *
* * ** * *
* * ** * *
* * ** * *
* * ** * *
* * ** * *
* * ** * *
2013 School Progress
All StudentsAmerican Indian or
Alaska NativeAsian
Black or African American
Hispanic/Latino of any raceNative Hawaiian or
Other Pacific Islander White
Two or more races
Free/Reduced Meals
Special Education
Limited English Proficient
Percent Proficient Participation RateReading Math Reading Math
Met Met Met Met
* * * *
Met Met na na
Met Met Met Met
Met Met na na
* * * *
Met Met na na
Met Met na na
Met Met Met Met
Met Met na na
Met Met na na
2013 School Progress Index SPI: 1.0402 Strand: 2 Values 1.0000 and above met the target.
Achievement Gap Red. GrowthElementary
Math 1.0223 1.0406 0.9161Reading 1.0514 0.9218 0.9501Science 1.1382 1.3310
Attendance Rate %School
2013School
2012County
2013County
2012State 2013
State 2012
Elementary ≥95.0 ≥95.0 ≥95.0 ≥95.0 95.5 95.9
Middle * * ≥95.0 ≥95.0 95.1 95.4
High * * 93.9 93.8 92.5 92.2Teacher Qualifications% of certificates:
Standard Professional 43.3 45.7 38.4 41.0 28.4 29.0
Advanced Professional 53.3 51.4 58.0 57.0 65.1 65.2
Resident Teacher 0.0 0.0 0.0 0.0 0.8 0.9
Conditional Teacher 0.0 0.0 0.9 1.1 0.9 0.9
% of classes NOT taught by:Highly Qualified Teachers 0.0 2.8 3.9 4.5 6.2 6.9

Basic % Proficient % Advanced %
MSA Proficiency LevelsApproximately 99% of Maryland students take MSA. The Basic Level is below the goal set for all students.
Alt-MSA Proficiency LevelsApproximately 1% of Maryland students take Alt-MSA. The Basic Level is below the goal set for all students.
Visit MdReportCard.org for up-to-date and disaggregated information. For definitions, see school system report pages.
Read
ing
Mat
hem
atic
sSc
ienc
e
“na” indicates too few students for School Progress rules. “*” indicates no students or fewer than 10 students in category. • E: English; • A: Algebra/Data Analysis; • B: Biology
3 20132012
4 20132012
5 20132012
6 20132012
7 20132012
8 20132012
10 20132012
3 20132012
4 20132012
5 20132012
6 20132012
7 20132012
8 20132012
10 20132012
5 20132012
8 20132012
10 20132012
3 20132012
4 20132012
5 20132012
6 20132012
7 20132012
8 20132012
•E 20132012
3 20132012
4 20132012
5 20132012
6 20132012
7 20132012
8 20132012
•A 20132012
5 20132012
8 20132012
•B 20132012
All Students Attendance Rate: Met
17.4 60.5 22.115.0 64.4 20.6
11.8 58.4 29.810.2 55.6 34.2
11.6 31.8 56.610.1 34.9 55.1
15.9 40.6 43.515.5 42.7 41.8
15.0 36.9 48.118.8 35.5 45.7
19.0 34.9 46.119.2 36.6 44.2
17.0 55.3 27.816.9 54.9 28.2
17.8 53.3 28.912.2 49.0 38.7
11.2 42.1 46.710.1 38.6 51.2
19.1 55.5 25.314.7 54.8 30.5
22.9 48.0 29.117.0 47.6 35.5
27.4 49.3 23.323.7 49.5 26.9
33.0 36.4 30.630.7 36.2 33.1
15.8 53.4 30.816.1 53.1 30.8
33.0 56.4 10.631.5 57.5 11.1
28.6 64.6 6.729.3 63.3 7.4
17.4 60.7 21.918.3 59.6 22.1
13.4 26.3 60.37.2 18.5 74.3
10.2 22.1 67.78.7 16.8 74.5
12.6 26.5 60.96.5 16.2 77.3
10.3 25.9 63.87.2 17.6 75.2
7.9 24.8 67.36.1 13.1 80.7
11.2 25.5 63.38.1 15.2 76.7
20.9 22.8 56.310.7 15.3 74.0
19.2 36.8 44.110.9 30.7 58.5
15.5 36.8 47.79.9 30.0 60.1
19.7 40.9 39.49.5 33.7 56.8
17.2 36.1 46.79.8 30.9 59.3
14.3 33.9 51.88.7 31.2 60.1
15.5 36.4 48.19.9 36.8 53.3
23.8 31.0 45.214.0 31.8 54.2
22.7 44.2 33.115.5 37.2 47.3
22.3 40.4 37.316.8 42.6 40.6
33.3 34.3 32.421.7 41.4 36.9
19.4 60.6 20.017.3 66.3 16.4
13.1 59.1 27.811.8 58.3 29.9
15.2 35.1 49.710.7 37.8 51.5
17.1 45.2 37.714.2 46.0 39.7
16.3 36.5 47.219.8 38.5 41.8
21.8 37.5 40.717.4 41.0 41.5
10.4 66.6 23.011.3 65.7 23.0
20.8 53.2 26.015.3 52.5 32.2
13.3 43.0 43.711.4 41.5 47.1
24.0 55.6 20.417.1 58.4 24.5
20.1 46.8 33.012.2 51.0 36.8
21.3 53.5 25.221.7 52.1 26.2
27.9 38.3 33.924.4 37.2 38.5
9.7 62.0 28.29.7 64.5 25.8
35.6 56.3 8.237.0 56.1 7.0
31.6 64.9 ≤5.032.7 64.9 ≤5.0
11.6 71.5 16.915.0 66.9 18.1
27.3 18.2 54.5≤5.0 16.7 83.3
18.2 18.2 63.610.0 10.0 80.0
16.7 50.0 33.3≤5.0 25.0 75.0
21.4 28.6 50.0≤5.0 21.4 78.6
21.4 28.6 50.0≤5.0 ≤5.0 ≥95.0
45.5 18.2 36.47.1 7.1 85.7
57.1 14.3 28.6≤5.0 30.8 69.2
36.4 27.3 36.4≤5.0 41.7 58.3
18.2 36.4 45.5≤5.0 30.0 70.0
33.3 41.7 25.08.3 33.3 58.3
28.6 42.9 28.614.3 50.0 35.7
21.4 71.4 7.1≤5.0 25.0 75.0
36.4 36.4 27.321.4 28.6 50.0
57.1 14.3 28.6≤5.0 46.2 53.8
8.3 66.7 25.0≤5.0 58.3 41.7
54.5 45.5 ≤5.021.4 71.4 7.1
64.3 21.4 14.338.5 46.2 15.4
Mary Matula Elementary School 0109
15.9 53.4 30.710.8 66.3 22.9
7.3 61.5 31.36.9 54.2 38.9
14.3 29.8 56.010.6 35.1 54.3
* * ** * *
* * ** * *
* * ** * *
* * ** * *
9.1 52.3 38.69.8 47.6 42.7
10.4 44.8 44.8≤5.0 23.6 72.2
8.3 57.1 34.513.8 57.4 28.7
* * ** * *
* * ** * *
* * ** * *
* * ** * *
28.6 59.5 11.941.5 51.1 7.4
* * ** * *
* * ** * *
* * ** * *
* * ** * *
* * ** * *
* * ** * *
* * ** * *
* * ** * *
* * ** * *
* * ** * *
* * ** * *
* * ** * *
* * ** * *
* * ** * *
* * ** * *
* * ** * *
* * ** * *
* * ** * *
* * ** * *
2013 School Progress
All StudentsAmerican Indian or
Alaska NativeAsian
Black or African American
Hispanic/Latino of any raceNative Hawaiian or
Other Pacific Islander White
Two or more races
Free/Reduced Meals
Special Education
Limited English Proficient
Percent Proficient Participation RateReading Math Reading Math
Met Met Met Met
* * * *
Met Met na na
Met Met Met Met
Met Met na na
* * * *
Met Met Met Met
Met Met na na
Met Met Met Met
Met Met na na
na na na na
2013 School Progress Index SPI: 0.9366 Strand: 4 Values 1.0000 and above met the target.
Achievement Gap Red. GrowthElementary
Math 1.0380 1.0207 0.9329Reading 0.9543 0.9129 0.9266Science 0.9403 0.7996
Attendance Rate %School
2013School
2012County
2013County
2012State 2013
State 2012
Elementary ≥95.0 ≥95.0 ≥95.0 ≥95.0 95.5 95.9
Middle * * ≥95.0 ≥95.0 95.1 95.4
High * * 93.9 93.8 92.5 92.2Teacher Qualifications% of certificates:
Standard Professional 36.0 24.0 38.4 41.0 28.4 29.0
Advanced Professional 64.0 72.0 58.0 57.0 65.1 65.2
Resident Teacher 0.0 0.0 0.0 0.0 0.8 0.9
Conditional Teacher 0.0 0.0 0.9 1.1 0.9 0.9
% of classes NOT taught by:Highly Qualified Teachers 0.0 15.7 3.9 4.5 6.2 6.9

Basic % Proficient % Advanced %
MSA Proficiency LevelsApproximately 99% of Maryland students take MSA. The Basic Level is below the goal set for all students.
Alt-MSA Proficiency LevelsApproximately 1% of Maryland students take Alt-MSA. The Basic Level is below the goal set for all students.
Visit MdReportCard.org for up-to-date and disaggregated information. For definitions, see school system report pages.
Read
ing
Mat
hem
atic
sSc
ienc
e
17.4 60.5 22.115.0 64.4 20.6
11.8 58.4 29.810.2 55.6 34.2
11.6 31.8 56.610.1 34.9 55.1
15.9 40.6 43.515.5 42.7 41.8
15.0 36.9 48.118.8 35.5 45.7
19.0 34.9 46.119.2 36.6 44.2
17.0 55.3 27.816.9 54.9 28.2
17.8 53.3 28.912.2 49.0 38.7
11.2 42.1 46.710.1 38.6 51.2
19.1 55.5 25.314.7 54.8 30.5
22.9 48.0 29.117.0 47.6 35.5
27.4 49.3 23.323.7 49.5 26.9
33.0 36.4 30.630.7 36.2 33.1
15.8 53.4 30.816.1 53.1 30.8
33.0 56.4 10.631.5 57.5 11.1
28.6 64.6 6.729.3 63.3 7.4
17.4 60.7 21.918.3 59.6 22.1
13.4 26.3 60.37.2 18.5 74.3
10.2 22.1 67.78.7 16.8 74.5
12.6 26.5 60.96.5 16.2 77.3
10.3 25.9 63.87.2 17.6 75.2
7.9 24.8 67.36.1 13.1 80.7
11.2 25.5 63.38.1 15.2 76.7
20.9 22.8 56.310.7 15.3 74.0
19.2 36.8 44.110.9 30.7 58.5
15.5 36.8 47.79.9 30.0 60.1
19.7 40.9 39.49.5 33.7 56.8
17.2 36.1 46.79.8 30.9 59.3
14.3 33.9 51.88.7 31.2 60.1
15.5 36.4 48.19.9 36.8 53.3
23.8 31.0 45.214.0 31.8 54.2
22.7 44.2 33.115.5 37.2 47.3
22.3 40.4 37.316.8 42.6 40.6
33.3 34.3 32.421.7 41.4 36.9
“na” indicates too few students for School Progress rules. “*” indicates no students or fewer than 10 students in category. • E: English; • A: Algebra/Data Analysis; • B: Biology
3 20132012
4 20132012
5 20132012
6 20132012
7 20132012
8 20132012
10 20132012
3 20132012
4 20132012
5 20132012
6 20132012
7 20132012
8 20132012
10 20132012
5 20132012
8 20132012
10 20132012
3 20132012
4 20132012
5 20132012
6 20132012
7 20132012
8 20132012
•E 20132012
3 20132012
4 20132012
5 20132012
6 20132012
7 20132012
8 20132012
•A 20132012
5 20132012
8 20132012
•B 20132012
All Students Attendance Rate: Met
19.4 60.6 20.017.3 66.3 16.4
13.1 59.1 27.811.8 58.3 29.9
15.2 35.1 49.710.7 37.8 51.5
17.1 45.2 37.714.2 46.0 39.7
16.3 36.5 47.219.8 38.5 41.8
21.8 37.5 40.717.4 41.0 41.5
10.4 66.6 23.011.3 65.7 23.0
20.8 53.2 26.015.3 52.5 32.2
13.3 43.0 43.711.4 41.5 47.1
24.0 55.6 20.417.1 58.4 24.5
20.1 46.8 33.012.2 51.0 36.8
21.3 53.5 25.221.7 52.1 26.2
27.9 38.3 33.924.4 37.2 38.5
9.7 62.0 28.29.7 64.5 25.8
35.6 56.3 8.237.0 56.1 7.0
31.6 64.9 ≤5.032.7 64.9 ≤5.0
11.6 71.5 16.915.0 66.9 18.1
27.3 18.2 54.5≤5.0 16.7 83.3
18.2 18.2 63.610.0 10.0 80.0
16.7 50.0 33.3≤5.0 25.0 75.0
21.4 28.6 50.0≤5.0 21.4 78.6
21.4 28.6 50.0≤5.0 ≤5.0 ≥95.0
45.5 18.2 36.47.1 7.1 85.7
57.1 14.3 28.6≤5.0 30.8 69.2
36.4 27.3 36.4≤5.0 41.7 58.3
18.2 36.4 45.5≤5.0 30.0 70.0
33.3 41.7 25.08.3 33.3 58.3
28.6 42.9 28.614.3 50.0 35.7
21.4 71.4 7.1≤5.0 25.0 75.0
36.4 36.4 27.321.4 28.6 50.0
57.1 14.3 28.6≤5.0 46.2 53.8
8.3 66.7 25.0≤5.0 58.3 41.7
54.5 45.5 ≤5.021.4 71.4 7.1
64.3 21.4 14.338.5 46.2 15.4
Mattawoman Middle School 0621
* * ** * *
* * ** * *
* * ** * *
18.6 48.7 32.614.8 48.6 36.7
16.9 37.5 45.621.6 41.2 37.2
28.7 37.5 33.821.8 43.7 34.5
* * ** * *
* * ** * *
* * ** * *
* * ** * *
24.3 47.5 28.29.9 57.7 32.4
21.9 51.6 26.621.8 55.4 22.8
29.0 32.3 38.732.4 31.2 36.4
* * ** * *
* * ** * *
37.9 58.1 ≤5.034.1 63.8 ≤5.0
* * ** * *
* * ** * *
* * ** * *
* * ** * *
* * ** * *
* * ** * *
* * ** * *
* * ** * *
* * ** * *
* * ** * *
* * ** * *
* * ** * *
* * ** * *
* * ** * *
* * ** * *
* * ** * *
* * ** * *
* * ** * *
2013 School Progress
All StudentsAmerican Indian or
Alaska NativeAsian
Black or African American
Hispanic/Latino of any raceNative Hawaiian or
Other Pacific Islander White
Two or more races
Free/Reduced Meals
Special Education
Limited English Proficient
Percent Proficient Participation RateReading Math Reading Math
Not Met Met Met Met
na na na na
Met Met na na
Met Met Met Met
Met Met na na
na na na na
Met Met Met Met
Met Met na na
Met Met Met Met
Met Not Met Met Met
Met Met na na
2013 School Progress Index SPI: 0.8222 Strand: 5 Values 1.0000 and above met the target.
Achievement Gap Red. GrowthMiddle
Math 0.9592 0.6657 0.8928Reading 0.9492 0.7007 0.9877Science 0.8297 0.6312
Attendance Rate %School
2013School
2012County
2013County
2012State 2013
State 2012
Elementary * * ≥95.0 ≥95.0 95.5 95.9
Middle ≥95.0 ≥95.0 ≥95.0 ≥95.0 95.1 95.4
High * * 93.9 93.8 92.5 92.2Teacher Qualifications% of certificates:
Standard Professional 45.6 52.5 38.4 41.0 28.4 29.0
Advanced Professional 50.9 45.8 58.0 57.0 65.1 65.2
Resident Teacher 0.0 0.0 0.0 0.0 0.8 0.9
Conditional Teacher 0.0 1.7 0.9 1.1 0.9 0.9
% of classes NOT taught by:Highly Qualified Teachers 4.6 6.4 3.9 4.5 6.2 6.9

Basic % Proficient % Advanced %
MSA Proficiency LevelsApproximately 99% of Maryland students take MSA. The Basic Level is below the goal set for all students.
Alt-MSA Proficiency LevelsApproximately 1% of Maryland students take Alt-MSA. The Basic Level is below the goal set for all students.
Visit MdReportCard.org for up-to-date and disaggregated information. For definitions, see school system report pages.
Read
ing
Mat
hem
atic
sSc
ienc
e
“na” indicates too few students for School Progress rules. “*” indicates no students or fewer than 10 students in category. • E: English; • A: Algebra/Data Analysis; • B: Biology
3 20132012
4 20132012
5 20132012
6 20132012
7 20132012
8 20132012
10 20132012
3 20132012
4 20132012
5 20132012
6 20132012
7 20132012
8 20132012
10 20132012
5 20132012
8 20132012
10 20132012
3 20132012
4 20132012
5 20132012
6 20132012
7 20132012
8 20132012
•E 20132012
3 20132012
4 20132012
5 20132012
6 20132012
7 20132012
8 20132012
•A 20132012
5 20132012
8 20132012
•B 20132012
All Students Attendance Rate: Met
17.4 60.5 22.115.0 64.4 20.6
11.8 58.4 29.810.2 55.6 34.2
11.6 31.8 56.610.1 34.9 55.1
15.9 40.6 43.515.5 42.7 41.8
15.0 36.9 48.118.8 35.5 45.7
19.0 34.9 46.119.2 36.6 44.2
17.0 55.3 27.816.9 54.9 28.2
17.8 53.3 28.912.2 49.0 38.7
11.2 42.1 46.710.1 38.6 51.2
19.1 55.5 25.314.7 54.8 30.5
22.9 48.0 29.117.0 47.6 35.5
27.4 49.3 23.323.7 49.5 26.9
33.0 36.4 30.630.7 36.2 33.1
15.8 53.4 30.816.1 53.1 30.8
33.0 56.4 10.631.5 57.5 11.1
28.6 64.6 6.729.3 63.3 7.4
17.4 60.7 21.918.3 59.6 22.1
13.4 26.3 60.37.2 18.5 74.3
10.2 22.1 67.78.7 16.8 74.5
12.6 26.5 60.96.5 16.2 77.3
10.3 25.9 63.87.2 17.6 75.2
7.9 24.8 67.36.1 13.1 80.7
11.2 25.5 63.38.1 15.2 76.7
20.9 22.8 56.310.7 15.3 74.0
19.2 36.8 44.110.9 30.7 58.5
15.5 36.8 47.79.9 30.0 60.1
19.7 40.9 39.49.5 33.7 56.8
17.2 36.1 46.79.8 30.9 59.3
14.3 33.9 51.88.7 31.2 60.1
15.5 36.4 48.19.9 36.8 53.3
23.8 31.0 45.214.0 31.8 54.2
22.7 44.2 33.115.5 37.2 47.3
22.3 40.4 37.316.8 42.6 40.6
33.3 34.3 32.421.7 41.4 36.9
19.4 60.6 20.017.3 66.3 16.4
13.1 59.1 27.811.8 58.3 29.9
15.2 35.1 49.710.7 37.8 51.5
17.1 45.2 37.714.2 46.0 39.7
16.3 36.5 47.219.8 38.5 41.8
21.8 37.5 40.717.4 41.0 41.5
10.4 66.6 23.011.3 65.7 23.0
20.8 53.2 26.015.3 52.5 32.2
13.3 43.0 43.711.4 41.5 47.1
24.0 55.6 20.417.1 58.4 24.5
20.1 46.8 33.012.2 51.0 36.8
21.3 53.5 25.221.7 52.1 26.2
27.9 38.3 33.924.4 37.2 38.5
9.7 62.0 28.29.7 64.5 25.8
35.6 56.3 8.237.0 56.1 7.0
31.6 64.9 ≤5.032.7 64.9 ≤5.0
11.6 71.5 16.915.0 66.9 18.1
27.3 18.2 54.5≤5.0 16.7 83.3
18.2 18.2 63.610.0 10.0 80.0
16.7 50.0 33.3≤5.0 25.0 75.0
21.4 28.6 50.0≤5.0 21.4 78.6
21.4 28.6 50.0≤5.0 ≤5.0 ≥95.0
45.5 18.2 36.47.1 7.1 85.7
57.1 14.3 28.6≤5.0 30.8 69.2
36.4 27.3 36.4≤5.0 41.7 58.3
18.2 36.4 45.5≤5.0 30.0 70.0
33.3 41.7 25.08.3 33.3 58.3
28.6 42.9 28.614.3 50.0 35.7
21.4 71.4 7.1≤5.0 25.0 75.0
36.4 36.4 27.321.4 28.6 50.0
57.1 14.3 28.6≤5.0 46.2 53.8
8.3 66.7 25.0≤5.0 58.3 41.7
54.5 45.5 ≤5.021.4 71.4 7.1
64.3 21.4 14.338.5 46.2 15.4
Matthew Henson Middle School 0701
* * ** * *
* * ** * *
* * ** * *
18.3 46.0 35.723.3 44.4 32.2
20.3 36.1 43.625.0 32.8 42.2
28.6 31.6 39.721.0 42.0 37.0
* * ** * *
* * ** * *
* * ** * *
* * ** * *
20.4 48.9 30.621.5 55.8 22.7
26.7 53.5 19.827.1 46.4 26.5
35.5 38.9 25.618.7 45.1 36.3
* * ** * *
* * ** * *
37.9 57.8 ≤5.036.3 62.6 ≤5.0
* * ** * *
* * ** * *
* * ** * *
* * ** * *
* * ** * *
* * ** * *
* * ** * *
* * ** * *
* * ** * *
* * ** * *
* * ** * *
* * ** * *
* * ** * *
* * ** * *
* * ** * *
* * ** * *
* * ** * *
* * ** * *
2013 School Progress
All StudentsAmerican Indian or
Alaska NativeAsian
Black or African American
Hispanic/Latino of any raceNative Hawaiian or
Other Pacific Islander White
Two or more races
Free/Reduced Meals
Special Education
Limited English Proficient
Percent Proficient Participation RateReading Math Reading Math
Not Met Not Met Met Met
Met Met na na
Met Met na na
Met Not Met Met Met
Met Met na na
na na na na
Met Met Met Met
Met Met na na
Not Met Not Met Met Met
Not Met Not Met na na
na na na na
2013 School Progress Index SPI: 0.7848 Strand: 5 Values 1.0000 and above met the target.
Achievement Gap Red. GrowthMiddle
Math 0.9051 0.4210 0.8332Reading 0.9436 0.4711 0.9972Science 0.9475 0.8375
Attendance Rate %School
2013School
2012County
2013County
2012State 2013
State 2012
Elementary * * ≥95.0 ≥95.0 95.5 95.9
Middle ≥95.0 ≥95.0 ≥95.0 ≥95.0 95.1 95.4
High * * 93.9 93.8 92.5 92.2Teacher Qualifications% of certificates:
Standard Professional 30.0 37.8 38.4 41.0 28.4 29.0
Advanced Professional 65.0 59.5 58.0 57.0 65.1 65.2
Resident Teacher 0.0 0.0 0.0 0.0 0.8 0.9
Conditional Teacher 0.0 0.0 0.9 1.1 0.9 0.9
% of classes NOT taught by:Highly Qualified Teachers 6.1 5.1 3.9 4.5 6.2 6.9

Basic % Proficient % Advanced %
MSA Proficiency LevelsApproximately 99% of Maryland students take MSA. The Basic Level is below the goal set for all students.
Alt-MSA Proficiency LevelsApproximately 1% of Maryland students take Alt-MSA. The Basic Level is below the goal set for all students.
Visit MdReportCard.org for up-to-date and disaggregated information. For definitions, see school system report pages.
Read
ing
Mat
hem
atic
sSc
ienc
e
17.4 60.5 22.115.0 64.4 20.6
11.8 58.4 29.810.2 55.6 34.2
11.6 31.8 56.610.1 34.9 55.1
15.9 40.6 43.515.5 42.7 41.8
15.0 36.9 48.118.8 35.5 45.7
19.0 34.9 46.119.2 36.6 44.2
17.0 55.3 27.816.9 54.9 28.2
17.8 53.3 28.912.2 49.0 38.7
11.2 42.1 46.710.1 38.6 51.2
19.1 55.5 25.314.7 54.8 30.5
22.9 48.0 29.117.0 47.6 35.5
27.4 49.3 23.323.7 49.5 26.9
33.0 36.4 30.630.7 36.2 33.1
15.8 53.4 30.816.1 53.1 30.8
33.0 56.4 10.631.5 57.5 11.1
28.6 64.6 6.729.3 63.3 7.4
17.4 60.7 21.918.3 59.6 22.1
13.4 26.3 60.37.2 18.5 74.3
10.2 22.1 67.78.7 16.8 74.5
12.6 26.5 60.96.5 16.2 77.3
10.3 25.9 63.87.2 17.6 75.2
7.9 24.8 67.36.1 13.1 80.7
11.2 25.5 63.38.1 15.2 76.7
20.9 22.8 56.310.7 15.3 74.0
19.2 36.8 44.110.9 30.7 58.5
15.5 36.8 47.79.9 30.0 60.1
19.7 40.9 39.49.5 33.7 56.8
17.2 36.1 46.79.8 30.9 59.3
14.3 33.9 51.88.7 31.2 60.1
15.5 36.4 48.19.9 36.8 53.3
23.8 31.0 45.214.0 31.8 54.2
22.7 44.2 33.115.5 37.2 47.3
22.3 40.4 37.316.8 42.6 40.6
33.3 34.3 32.421.7 41.4 36.9
“na” indicates too few students for School Progress rules. “*” indicates no students or fewer than 10 students in category. • E: English; • A: Algebra/Data Analysis; • B: Biology
3 20132012
4 20132012
5 20132012
6 20132012
7 20132012
8 20132012
10 20132012
3 20132012
4 20132012
5 20132012
6 20132012
7 20132012
8 20132012
10 20132012
5 20132012
8 20132012
10 20132012
3 20132012
4 20132012
5 20132012
6 20132012
7 20132012
8 20132012
•E 20132012
3 20132012
4 20132012
5 20132012
6 20132012
7 20132012
8 20132012
•A 20132012
5 20132012
8 20132012
•B 20132012
†College and Career Preparation (CCP) - 2011 ††Data from 2012
19.4 60.6 20.017.3 66.3 16.4
13.1 59.1 27.811.8 58.3 29.9
15.2 35.1 49.710.7 37.8 51.5
17.1 45.2 37.714.2 46.0 39.7
16.3 36.5 47.219.8 38.5 41.8
21.8 37.5 40.717.4 41.0 41.5
10.4 66.6 23.011.3 65.7 23.0
20.8 53.2 26.015.3 52.5 32.2
13.3 43.0 43.711.4 41.5 47.1
24.0 55.6 20.417.1 58.4 24.5
20.1 46.8 33.012.2 51.0 36.8
21.3 53.5 25.221.7 52.1 26.2
27.9 38.3 33.924.4 37.2 38.5
9.7 62.0 28.29.7 64.5 25.8
35.6 56.3 8.237.0 56.1 7.0
31.6 64.9 ≤5.032.7 64.9 ≤5.0
11.6 71.5 16.915.0 66.9 18.1
27.3 18.2 54.5≤5.0 16.7 83.3
18.2 18.2 63.610.0 10.0 80.0
16.7 50.0 33.3≤5.0 25.0 75.0
21.4 28.6 50.0≤5.0 21.4 78.6
21.4 28.6 50.0≤5.0 ≤5.0 ≥95.0
45.5 18.2 36.47.1 7.1 85.7
57.1 14.3 28.6≤5.0 30.8 69.2
36.4 27.3 36.4≤5.0 41.7 58.3
18.2 36.4 45.5≤5.0 30.0 70.0
33.3 41.7 25.08.3 33.3 58.3
28.6 42.9 28.614.3 50.0 35.7
21.4 71.4 7.1≤5.0 25.0 75.0
36.4 36.4 27.321.4 28.6 50.0
57.1 14.3 28.6≤5.0 46.2 53.8
8.3 66.7 25.0≤5.0 58.3 41.7
54.5 45.5 ≤5.021.4 71.4 7.1
64.3 21.4 14.338.5 46.2 15.4
Maurice J. McDonough High School 0108
* * ** * *
* * ** * *
* * ** * *
* * ** * *
* * ** * *
* * ** * *
11.7 67.2 21.113.3 69.4 17.3
* * ** * *
* * ** * *
* * ** * *
* * ** * *
* * ** * *
* * ** * *
8.7 61.2 30.18.9 63.6 27.5
* * ** * *
* * ** * *
17.4 68.8 13.823.6 60.5 15.9
* * ** * *
* * ** * *
* * ** * *
* * ** * *
* * ** * *
* * ** * *
* * ** * *
* * ** * *
* * ** * *
* * ** * *
* * ** * *
* * ** * *
* * ** * *
* * ** * *
* * ** * *
* * ** * *
* * ** * *
2013 School Progress
All StudentsAmerican Indian or
Alaska NativeAsian
Black or African American
Hispanic/Latino of any raceNative Hawaiian or
Other Pacific Islander White
Two or more races
Free/Reduced Meals
Special Education
Limited English Proficient
Percent Proficient Participation Rate GraduationReading Math Reading Math
Met Met Met Met Not Met
na na na na na
Met Met na na na
Met Met Met Met Not Met
Met Met na na na
* * * * *
Met Met Met Met Met
Met Met na na na
Met Met Met Met Not Met
Met Met na na na
na na na na na
2013 School Progress Index SPI: 1.0242 Strand: 2 Values 1.0000 and above met the target.
High Achievement Gap Red. CCRAlgebra 1.0443 1.1604English 1.0659 1.1146Biology 1.0364 1.1269
††Dropout 1.0024††Grad 0.7335 0.9841
†CCP 0.9442
Attendance Rate %School
2013School
2012County
2013County
2012State 2013
State 2012
Elementary * * ≥95.0 ≥95.0 95.5 95.9
Middle * * ≥95.0 ≥95.0 95.1 95.4
High 93.5 93.8 93.9 93.8 92.5 92.2Teacher Qualifications% of certificates:
Standard Professional 42.1 39.3 38.4 41.0 28.4 29.0
Advanced Professional 54.4 54.1 58.0 57.0 65.1 65.2
Resident Teacher 0.0 0.0 0.0 0.0 0.8 0.9
Conditional Teacher 1.8 1.6 0.9 1.1 0.9 0.9
% of classes NOT taught by:Highly Qualified Teachers 5.2 9.0 3.9 4.5 6.2 6.9
Cohort Graduation Rate %Class of 2012 (4-Yr Rate) 86.11 89.76 83.57
Class of 2012 (5-Yr Rate) 88.62 92.42 86.32

Basic % Proficient % Advanced %
MSA Proficiency LevelsApproximately 99% of Maryland students take MSA. The Basic Level is below the goal set for all students.
Alt-MSA Proficiency LevelsApproximately 1% of Maryland students take Alt-MSA. The Basic Level is below the goal set for all students.
Visit MdReportCard.org for up-to-date and disaggregated information. For definitions, see school system report pages.
Read
ing
Mat
hem
atic
sSc
ienc
e
“na” indicates too few students for School Progress rules. “*” indicates no students or fewer than 10 students in category. • E: English; • A: Algebra/Data Analysis; • B: Biology
3 20132012
4 20132012
5 20132012
6 20132012
7 20132012
8 20132012
10 20132012
3 20132012
4 20132012
5 20132012
6 20132012
7 20132012
8 20132012
10 20132012
5 20132012
8 20132012
10 20132012
3 20132012
4 20132012
5 20132012
6 20132012
7 20132012
8 20132012
•E 20132012
3 20132012
4 20132012
5 20132012
6 20132012
7 20132012
8 20132012
•A 20132012
5 20132012
8 20132012
•B 20132012
All Students Attendance Rate: Met
17.4 60.5 22.115.0 64.4 20.6
11.8 58.4 29.810.2 55.6 34.2
11.6 31.8 56.610.1 34.9 55.1
15.9 40.6 43.515.5 42.7 41.8
15.0 36.9 48.118.8 35.5 45.7
19.0 34.9 46.119.2 36.6 44.2
17.0 55.3 27.816.9 54.9 28.2
17.8 53.3 28.912.2 49.0 38.7
11.2 42.1 46.710.1 38.6 51.2
19.1 55.5 25.314.7 54.8 30.5
22.9 48.0 29.117.0 47.6 35.5
27.4 49.3 23.323.7 49.5 26.9
33.0 36.4 30.630.7 36.2 33.1
15.8 53.4 30.816.1 53.1 30.8
33.0 56.4 10.631.5 57.5 11.1
28.6 64.6 6.729.3 63.3 7.4
17.4 60.7 21.918.3 59.6 22.1
13.4 26.3 60.37.2 18.5 74.3
10.2 22.1 67.78.7 16.8 74.5
12.6 26.5 60.96.5 16.2 77.3
10.3 25.9 63.87.2 17.6 75.2
7.9 24.8 67.36.1 13.1 80.7
11.2 25.5 63.38.1 15.2 76.7
20.9 22.8 56.310.7 15.3 74.0
19.2 36.8 44.110.9 30.7 58.5
15.5 36.8 47.79.9 30.0 60.1
19.7 40.9 39.49.5 33.7 56.8
17.2 36.1 46.79.8 30.9 59.3
14.3 33.9 51.88.7 31.2 60.1
15.5 36.4 48.19.9 36.8 53.3
23.8 31.0 45.214.0 31.8 54.2
22.7 44.2 33.115.5 37.2 47.3
22.3 40.4 37.316.8 42.6 40.6
33.3 34.3 32.421.7 41.4 36.9
19.4 60.6 20.017.3 66.3 16.4
13.1 59.1 27.811.8 58.3 29.9
15.2 35.1 49.710.7 37.8 51.5
17.1 45.2 37.714.2 46.0 39.7
16.3 36.5 47.219.8 38.5 41.8
21.8 37.5 40.717.4 41.0 41.5
10.4 66.6 23.011.3 65.7 23.0
20.8 53.2 26.015.3 52.5 32.2
13.3 43.0 43.711.4 41.5 47.1
24.0 55.6 20.417.1 58.4 24.5
20.1 46.8 33.012.2 51.0 36.8
21.3 53.5 25.221.7 52.1 26.2
27.9 38.3 33.924.4 37.2 38.5
9.7 62.0 28.29.7 64.5 25.8
35.6 56.3 8.237.0 56.1 7.0
31.6 64.9 ≤5.032.7 64.9 ≤5.0
11.6 71.5 16.915.0 66.9 18.1
27.3 18.2 54.5≤5.0 16.7 83.3
18.2 18.2 63.610.0 10.0 80.0
16.7 50.0 33.3≤5.0 25.0 75.0
21.4 28.6 50.0≤5.0 21.4 78.6
21.4 28.6 50.0≤5.0 ≤5.0 ≥95.0
45.5 18.2 36.47.1 7.1 85.7
57.1 14.3 28.6≤5.0 30.8 69.2
36.4 27.3 36.4≤5.0 41.7 58.3
18.2 36.4 45.5≤5.0 30.0 70.0
33.3 41.7 25.08.3 33.3 58.3
28.6 42.9 28.614.3 50.0 35.7
21.4 71.4 7.1≤5.0 25.0 75.0
36.4 36.4 27.321.4 28.6 50.0
57.1 14.3 28.6≤5.0 46.2 53.8
8.3 66.7 25.0≤5.0 58.3 41.7
54.5 45.5 ≤5.021.4 71.4 7.1
64.3 21.4 14.338.5 46.2 15.4
Milton M. Somers Middle School 0104
* * ** * *
* * ** * *
* * ** * *
11.9 36.2 51.99.2 35.7 55.1
9.6 29.4 61.112.1 38.6 49.3
13.1 34.6 52.37.2 36.6 56.2
* * ** * *
* * ** * *
* * ** * *
* * ** * *
13.9 39.1 46.96.6 44.3 49.1
9.6 54.6 35.816.9 54.4 28.7
18.6 42.8 38.612.5 36.7 50.8
* * ** * *
* * ** * *
20.6 75.4 ≤5.019.0 75.4 5.6
* * ** * *
* * ** * *
* * ** * *
* * ** * *
* * ** * *
* * ** * *
* * ** * *
* * ** * *
* * ** * *
* * ** * *
* * ** * *
* * ** * *
* * ** * *
* * ** * *
* * ** * *
* * ** * *
* * ** * *
* * ** * *
2013 School Progress
All StudentsAmerican Indian or
Alaska NativeAsian
Black or African American
Hispanic/Latino of any raceNative Hawaiian or
Other Pacific Islander White
Two or more races
Free/Reduced Meals
Special Education
Limited English Proficient
Percent Proficient Participation RateReading Math Reading Math
Met Not Met Met Met
Met Met na na
Met Met na na
Not Met Not Met Met Met
Met Met na na
na na na na
Met Met Met Met
Met Met na na
Not Met Not Met Met Met
Not Met Not Met na na
na na na na
2013 School Progress Index SPI: 0.8496 Strand: 5 Values 1.0000 and above met the target.
Achievement Gap Red. GrowthMiddle
Math 0.9537 0.6431 0.8950Reading 1.0385 0.5214 0.9826Science 0.9527 0.8864
Attendance Rate %School
2013School
2012County
2013County
2012State 2013
State 2012
Elementary * * ≥95.0 ≥95.0 95.5 95.9
Middle ≥95.0 ≥95.0 ≥95.0 ≥95.0 95.1 95.4
High * * 93.9 93.8 92.5 92.2Teacher Qualifications% of certificates:
Standard Professional 12.7 14.5 38.4 41.0 28.4 29.0
Advanced Professional 85.5 85.5 58.0 57.0 65.1 65.2
Resident Teacher 0.0 0.0 0.0 0.0 0.8 0.9
Conditional Teacher 0.0 0.0 0.9 1.1 0.9 0.9
% of classes NOT taught by:Highly Qualified Teachers 5.9 4.5 3.9 4.5 6.2 6.9

Basic % Proficient % Advanced %
MSA Proficiency LevelsApproximately 99% of Maryland students take MSA. The Basic Level is below the goal set for all students.
Alt-MSA Proficiency LevelsApproximately 1% of Maryland students take Alt-MSA. The Basic Level is below the goal set for all students.
Visit MdReportCard.org for up-to-date and disaggregated information. For definitions, see school system report pages.
Read
ing
Mat
hem
atic
sSc
ienc
e
17.4 60.5 22.115.0 64.4 20.6
11.8 58.4 29.810.2 55.6 34.2
11.6 31.8 56.610.1 34.9 55.1
15.9 40.6 43.515.5 42.7 41.8
15.0 36.9 48.118.8 35.5 45.7
19.0 34.9 46.119.2 36.6 44.2
17.0 55.3 27.816.9 54.9 28.2
17.8 53.3 28.912.2 49.0 38.7
11.2 42.1 46.710.1 38.6 51.2
19.1 55.5 25.314.7 54.8 30.5
22.9 48.0 29.117.0 47.6 35.5
27.4 49.3 23.323.7 49.5 26.9
33.0 36.4 30.630.7 36.2 33.1
15.8 53.4 30.816.1 53.1 30.8
33.0 56.4 10.631.5 57.5 11.1
28.6 64.6 6.729.3 63.3 7.4
17.4 60.7 21.918.3 59.6 22.1
13.4 26.3 60.37.2 18.5 74.3
10.2 22.1 67.78.7 16.8 74.5
12.6 26.5 60.96.5 16.2 77.3
10.3 25.9 63.87.2 17.6 75.2
7.9 24.8 67.36.1 13.1 80.7
11.2 25.5 63.38.1 15.2 76.7
20.9 22.8 56.310.7 15.3 74.0
19.2 36.8 44.110.9 30.7 58.5
15.5 36.8 47.79.9 30.0 60.1
19.7 40.9 39.49.5 33.7 56.8
17.2 36.1 46.79.8 30.9 59.3
14.3 33.9 51.88.7 31.2 60.1
15.5 36.4 48.19.9 36.8 53.3
23.8 31.0 45.214.0 31.8 54.2
22.7 44.2 33.115.5 37.2 47.3
22.3 40.4 37.316.8 42.6 40.6
33.3 34.3 32.421.7 41.4 36.9
“na” indicates too few students for School Progress rules. “*” indicates no students or fewer than 10 students in category. • E: English; • A: Algebra/Data Analysis; • B: Biology
3 20132012
4 20132012
5 20132012
6 20132012
7 20132012
8 20132012
10 20132012
3 20132012
4 20132012
5 20132012
6 20132012
7 20132012
8 20132012
10 20132012
5 20132012
8 20132012
10 20132012
3 20132012
4 20132012
5 20132012
6 20132012
7 20132012
8 20132012
•E 20132012
3 20132012
4 20132012
5 20132012
6 20132012
7 20132012
8 20132012
•A 20132012
5 20132012
8 20132012
•B 20132012
All Students Attendance Rate: Met
19.4 60.6 20.017.3 66.3 16.4
13.1 59.1 27.811.8 58.3 29.9
15.2 35.1 49.710.7 37.8 51.5
17.1 45.2 37.714.2 46.0 39.7
16.3 36.5 47.219.8 38.5 41.8
21.8 37.5 40.717.4 41.0 41.5
10.4 66.6 23.011.3 65.7 23.0
20.8 53.2 26.015.3 52.5 32.2
13.3 43.0 43.711.4 41.5 47.1
24.0 55.6 20.417.1 58.4 24.5
20.1 46.8 33.012.2 51.0 36.8
21.3 53.5 25.221.7 52.1 26.2
27.9 38.3 33.924.4 37.2 38.5
9.7 62.0 28.29.7 64.5 25.8
35.6 56.3 8.237.0 56.1 7.0
31.6 64.9 ≤5.032.7 64.9 ≤5.0
11.6 71.5 16.915.0 66.9 18.1
27.3 18.2 54.5≤5.0 16.7 83.3
18.2 18.2 63.610.0 10.0 80.0
16.7 50.0 33.3≤5.0 25.0 75.0
21.4 28.6 50.0≤5.0 21.4 78.6
21.4 28.6 50.0≤5.0 ≤5.0 ≥95.0
45.5 18.2 36.47.1 7.1 85.7
57.1 14.3 28.6≤5.0 30.8 69.2
36.4 27.3 36.4≤5.0 41.7 58.3
18.2 36.4 45.5≤5.0 30.0 70.0
33.3 41.7 25.08.3 33.3 58.3
28.6 42.9 28.614.3 50.0 35.7
21.4 71.4 7.1≤5.0 25.0 75.0
36.4 36.4 27.321.4 28.6 50.0
57.1 14.3 28.6≤5.0 46.2 53.8
8.3 66.7 25.0≤5.0 58.3 41.7
54.5 45.5 ≤5.021.4 71.4 7.1
64.3 21.4 14.338.5 46.2 15.4
Mt Hope/Nanjemoy Elementary School 0302
22.0 53.7 24.417.0 66.0 17.0
9.3 70.4 20.410.9 67.2 21.9
8.6 39.7 51.79.5 50.0 40.5
* * ** * *
* * ** * *
* * ** * *
* * ** * *
19.5 48.8 31.79.4 58.5 32.1
7.4 46.3 46.310.9 39.1 50.0
15.5 63.8 20.721.4 52.4 26.2
* * ** * *
* * ** * *
* * ** * *
* * ** * *
27.6 65.5 6.944.2 48.8 7.0
* * ** * *
* * ** * *
* * ** * *
* * ** * *
* * ** * *
* * ** * *
* * ** * *
* * ** * *
* * ** * *
* * ** * *
* * ** * *
* * ** * *
* * ** * *
* * ** * *
* * ** * *
* * ** * *
* * ** * *
* * ** * *
* * ** * *
2013 School Progress
All StudentsAmerican Indian or
Alaska NativeAsian
Black or African American
Hispanic/Latino of any raceNative Hawaiian or
Other Pacific Islander White
Two or more races
Free/Reduced Meals
Special Education
Limited English Proficient
Percent Proficient Participation RateReading Math Reading Math
Met Met Met Met
na na na na
* * * *
Met Met na na
na na na na
* * * *
Met Met Met Met
Met Met na na
Met Met Met Met
Met Met na na
* * * *
2013 School Progress Index SPI: 0.9519 Strand: 3 FocusValues 1.0000 and above met the target.
Achievement Gap Red. GrowthElementary
Math 1.0400 0.9604 0.8969Reading 1.0491 0.7981 0.9238Science 1.2726 0.8115
Attendance Rate %School
2013School
2012County
2013County
2012State 2013
State 2012
Elementary ≥95.0 ≥95.0 ≥95.0 ≥95.0 95.5 95.9
Middle * * ≥95.0 ≥95.0 95.1 95.4
High * * 93.9 93.8 92.5 92.2Teacher Qualifications% of certificates:
Standard Professional 35.3 47.1 38.4 41.0 28.4 29.0
Advanced Professional 64.7 47.1 58.0 57.0 65.1 65.2
Resident Teacher 0.0 0.0 0.0 0.0 0.8 0.9
Conditional Teacher 0.0 0.0 0.9 1.1 0.9 0.9
% of classes NOT taught by:Highly Qualified Teachers 0.0 0.0 3.9 4.5 6.2 6.9

Basic % Proficient % Advanced %
MSA Proficiency LevelsApproximately 99% of Maryland students take MSA. The Basic Level is below the goal set for all students.
Alt-MSA Proficiency LevelsApproximately 1% of Maryland students take Alt-MSA. The Basic Level is below the goal set for all students.
Visit MdReportCard.org for up-to-date and disaggregated information. For definitions, see school system report pages.
Read
ing
Mat
hem
atic
sSc
ienc
e
“na” indicates too few students for School Progress rules. “*” indicates no students or fewer than 10 students in category. • E: English; • A: Algebra/Data Analysis; • B: Biology
3 20132012
4 20132012
5 20132012
6 20132012
7 20132012
8 20132012
10 20132012
3 20132012
4 20132012
5 20132012
6 20132012
7 20132012
8 20132012
10 20132012
5 20132012
8 20132012
10 20132012
3 20132012
4 20132012
5 20132012
6 20132012
7 20132012
8 20132012
•E 20132012
3 20132012
4 20132012
5 20132012
6 20132012
7 20132012
8 20132012
•A 20132012
5 20132012
8 20132012
•B 20132012
17.4 60.5 22.115.0 64.4 20.6
11.8 58.4 29.810.2 55.6 34.2
11.6 31.8 56.610.1 34.9 55.1
15.9 40.6 43.515.5 42.7 41.8
15.0 36.9 48.118.8 35.5 45.7
19.0 34.9 46.119.2 36.6 44.2
17.0 55.3 27.816.9 54.9 28.2
17.8 53.3 28.912.2 49.0 38.7
11.2 42.1 46.710.1 38.6 51.2
19.1 55.5 25.314.7 54.8 30.5
22.9 48.0 29.117.0 47.6 35.5
27.4 49.3 23.323.7 49.5 26.9
33.0 36.4 30.630.7 36.2 33.1
15.8 53.4 30.816.1 53.1 30.8
33.0 56.4 10.631.5 57.5 11.1
28.6 64.6 6.729.3 63.3 7.4
17.4 60.7 21.918.3 59.6 22.1
13.4 26.3 60.37.2 18.5 74.3
10.2 22.1 67.78.7 16.8 74.5
12.6 26.5 60.96.5 16.2 77.3
10.3 25.9 63.87.2 17.6 75.2
7.9 24.8 67.36.1 13.1 80.7
11.2 25.5 63.38.1 15.2 76.7
20.9 22.8 56.310.7 15.3 74.0
19.2 36.8 44.110.9 30.7 58.5
15.5 36.8 47.79.9 30.0 60.1
19.7 40.9 39.49.5 33.7 56.8
17.2 36.1 46.79.8 30.9 59.3
14.3 33.9 51.88.7 31.2 60.1
15.5 36.4 48.19.9 36.8 53.3
23.8 31.0 45.214.0 31.8 54.2
22.7 44.2 33.115.5 37.2 47.3
22.3 40.4 37.316.8 42.6 40.6
33.3 34.3 32.421.7 41.4 36.9
†College and Career Preparation (CCP) - 2011 ††Data from 2012
19.4 60.6 20.017.3 66.3 16.4
13.1 59.1 27.811.8 58.3 29.9
15.2 35.1 49.710.7 37.8 51.5
17.1 45.2 37.714.2 46.0 39.7
16.3 36.5 47.219.8 38.5 41.8
21.8 37.5 40.717.4 41.0 41.5
10.4 66.6 23.011.3 65.7 23.0
20.8 53.2 26.015.3 52.5 32.2
13.3 43.0 43.711.4 41.5 47.1
24.0 55.6 20.417.1 58.4 24.5
20.1 46.8 33.012.2 51.0 36.8
21.3 53.5 25.221.7 52.1 26.2
27.9 38.3 33.924.4 37.2 38.5
9.7 62.0 28.29.7 64.5 25.8
35.6 56.3 8.237.0 56.1 7.0
31.6 64.9 ≤5.032.7 64.9 ≤5.0
11.6 71.5 16.915.0 66.9 18.1
27.3 18.2 54.5≤5.0 16.7 83.3
18.2 18.2 63.610.0 10.0 80.0
16.7 50.0 33.3≤5.0 25.0 75.0
21.4 28.6 50.0≤5.0 21.4 78.6
21.4 28.6 50.0≤5.0 ≤5.0 ≥95.0
45.5 18.2 36.47.1 7.1 85.7
57.1 14.3 28.6≤5.0 30.8 69.2
36.4 27.3 36.4≤5.0 41.7 58.3
18.2 36.4 45.5≤5.0 30.0 70.0
33.3 41.7 25.08.3 33.3 58.3
28.6 42.9 28.614.3 50.0 35.7
21.4 71.4 7.1≤5.0 25.0 75.0
36.4 36.4 27.321.4 28.6 50.0
57.1 14.3 28.6≤5.0 46.2 53.8
8.3 66.7 25.0≤5.0 58.3 41.7
54.5 45.5 ≤5.021.4 71.4 7.1
64.3 21.4 14.338.5 46.2 15.4
North Point High School 0623
* * ** * *
* * ** * *
* * ** * *
* * ** * *
* * ** * *
* * ** * *
7.7 64.8 27.57.3 57.5 35.3
* * ** * *
* * ** * *
* * ** * *
* * ** * *
* * ** * *
* * ** * *
≤5.0 59.4 35.6≤5.0 61.2 34.6
* * ** * *
* * ** * *
7.6 68.3 24.15.8 64.4 29.8
* * ** * *
* * ** * *
* * ** * *
* * ** * *
* * ** * *
* * ** * *
* * ** * *
* * ** * *
* * ** * *
* * ** * *
* * ** * *
* * ** * *
* * ** * *
* * ** * *
* * ** * *
* * ** * *
* * ** * *
2013 School Progress
All StudentsAmerican Indian or
Alaska NativeAsian
Black or African American
Hispanic/Latino of any raceNative Hawaiian or
Other Pacific Islander White
Two or more races
Free/Reduced Meals
Special Education
Limited English Proficient
Percent Proficient Participation Rate GraduationReading Math Reading Math
Met Met Met Met Met
na na na na na
Met Met na na Met
Met Met Met Met Met
Met Met na na na
* * * * na
Met Met Met Met Met
Met Met na na na
Met Met Met Met Met
Met Met na na na
Met Met na na na
2013 School Progress Index SPI: 1.0038 Strand: 2 Values 1.0000 and above met the target.
High Achievement Gap Red. CCRAlgebra 1.0747 0.8769English 1.0698 0.8426Biology 1.0798 0.8326
††Dropout 0.9602††Grad 1.0417 1.1232
†CCP 0.9353
Attendance Rate %School
2013School
2012County
2013County
2012State 2013
State 2012
Elementary * * ≥95.0 ≥95.0 95.5 95.9
Middle * * ≥95.0 ≥95.0 95.1 95.4
High ≥95.0 ≥95.0 93.9 93.8 92.5 92.2Teacher Qualifications% of certificates:
Standard Professional 40.4 47.3 38.4 41.0 28.4 29.0
Advanced Professional 55.1 48.4 58.0 57.0 65.1 65.2
Resident Teacher 0.0 0.0 0.0 0.0 0.8 0.9
Conditional Teacher 2.2 3.3 0.9 1.1 0.9 0.9
% of classes NOT taught by:Highly Qualified Teachers 3.5 4.5 3.9 4.5 6.2 6.9
Cohort Graduation Rate %Class of 2012 (4-Yr Rate) ≥95.0 89.76 83.57
Class of 2012 (5-Yr Rate) ≥95.0 92.42 86.32

Basic % Proficient % Advanced %
MSA Proficiency LevelsApproximately 99% of Maryland students take MSA. The Basic Level is below the goal set for all students.
Alt-MSA Proficiency LevelsApproximately 1% of Maryland students take Alt-MSA. The Basic Level is below the goal set for all students.
Visit MdReportCard.org for up-to-date and disaggregated information. For definitions, see school system report pages.
Read
ing
Mat
hem
atic
sSc
ienc
e
17.4 60.5 22.115.0 64.4 20.6
11.8 58.4 29.810.2 55.6 34.2
11.6 31.8 56.610.1 34.9 55.1
15.9 40.6 43.515.5 42.7 41.8
15.0 36.9 48.118.8 35.5 45.7
19.0 34.9 46.119.2 36.6 44.2
17.0 55.3 27.816.9 54.9 28.2
17.8 53.3 28.912.2 49.0 38.7
11.2 42.1 46.710.1 38.6 51.2
19.1 55.5 25.314.7 54.8 30.5
22.9 48.0 29.117.0 47.6 35.5
27.4 49.3 23.323.7 49.5 26.9
33.0 36.4 30.630.7 36.2 33.1
15.8 53.4 30.816.1 53.1 30.8
33.0 56.4 10.631.5 57.5 11.1
28.6 64.6 6.729.3 63.3 7.4
17.4 60.7 21.918.3 59.6 22.1
13.4 26.3 60.37.2 18.5 74.3
10.2 22.1 67.78.7 16.8 74.5
12.6 26.5 60.96.5 16.2 77.3
10.3 25.9 63.87.2 17.6 75.2
7.9 24.8 67.36.1 13.1 80.7
11.2 25.5 63.38.1 15.2 76.7
20.9 22.8 56.310.7 15.3 74.0
19.2 36.8 44.110.9 30.7 58.5
15.5 36.8 47.79.9 30.0 60.1
19.7 40.9 39.49.5 33.7 56.8
17.2 36.1 46.79.8 30.9 59.3
14.3 33.9 51.88.7 31.2 60.1
15.5 36.4 48.19.9 36.8 53.3
23.8 31.0 45.214.0 31.8 54.2
22.7 44.2 33.115.5 37.2 47.3
22.3 40.4 37.316.8 42.6 40.6
33.3 34.3 32.421.7 41.4 36.9
“na” indicates too few students for School Progress rules. “*” indicates no students or fewer than 10 students in category. • E: English; • A: Algebra/Data Analysis; • B: Biology
3 20132012
4 20132012
5 20132012
6 20132012
7 20132012
8 20132012
10 20132012
3 20132012
4 20132012
5 20132012
6 20132012
7 20132012
8 20132012
10 20132012
5 20132012
8 20132012
10 20132012
3 20132012
4 20132012
5 20132012
6 20132012
7 20132012
8 20132012
•E 20132012
3 20132012
4 20132012
5 20132012
6 20132012
7 20132012
8 20132012
•A 20132012
5 20132012
8 20132012
•B 20132012
All Students Attendance Rate: Met
19.4 60.6 20.017.3 66.3 16.4
13.1 59.1 27.811.8 58.3 29.9
15.2 35.1 49.710.7 37.8 51.5
17.1 45.2 37.714.2 46.0 39.7
16.3 36.5 47.219.8 38.5 41.8
21.8 37.5 40.717.4 41.0 41.5
10.4 66.6 23.011.3 65.7 23.0
20.8 53.2 26.015.3 52.5 32.2
13.3 43.0 43.711.4 41.5 47.1
24.0 55.6 20.417.1 58.4 24.5
20.1 46.8 33.012.2 51.0 36.8
21.3 53.5 25.221.7 52.1 26.2
27.9 38.3 33.924.4 37.2 38.5
9.7 62.0 28.29.7 64.5 25.8
35.6 56.3 8.237.0 56.1 7.0
31.6 64.9 ≤5.032.7 64.9 ≤5.0
11.6 71.5 16.915.0 66.9 18.1
27.3 18.2 54.5≤5.0 16.7 83.3
18.2 18.2 63.610.0 10.0 80.0
16.7 50.0 33.3≤5.0 25.0 75.0
21.4 28.6 50.0≤5.0 21.4 78.6
21.4 28.6 50.0≤5.0 ≤5.0 ≥95.0
45.5 18.2 36.47.1 7.1 85.7
57.1 14.3 28.6≤5.0 30.8 69.2
36.4 27.3 36.4≤5.0 41.7 58.3
18.2 36.4 45.5≤5.0 30.0 70.0
33.3 41.7 25.08.3 33.3 58.3
28.6 42.9 28.614.3 50.0 35.7
21.4 71.4 7.1≤5.0 25.0 75.0
36.4 36.4 27.321.4 28.6 50.0
57.1 14.3 28.6≤5.0 46.2 53.8
8.3 66.7 25.0≤5.0 58.3 41.7
54.5 45.5 ≤5.021.4 71.4 7.1
64.3 21.4 14.338.5 46.2 15.4
Piccowaxen Middle School 0503
* * ** * *
* * ** * *
* * ** * *
6.3 53.2 40.57.1 44.7 48.2
9.1 37.1 53.811.2 39.2 49.6
13.4 37.3 49.310.2 41.7 48.1
* * ** * *
* * ** * *
* * ** * *
* * ** * *
6.3 40.5 53.2≤5.0 37.6 61.0
7.7 57.3 35.0≤5.0 55.2 41.6
12.5 38.2 49.37.6 43.2 49.2
* * ** * *
* * ** * *
15.8 78.2 6.020.9 73.3 5.9
* * ** * *
* * ** * *
* * ** * *
* * ** * *
* * ** * *
* * ** * *
* * ** * *
* * ** * *
* * ** * *
* * ** * *
* * ** * *
* * ** * *
* * ** * *
* * ** * *
* * ** * *
* * ** * *
* * ** * *
* * ** * *
2013 School Progress
All StudentsAmerican Indian or
Alaska NativeAsian
Black or African American
Hispanic/Latino of any raceNative Hawaiian or
Other Pacific Islander White
Two or more races
Free/Reduced Meals
Special Education
Limited English Proficient
Percent Proficient Participation RateReading Math Reading Math
Met Met Met Met
na na na na
Met Met na na
Met Met na na
Met Met na na
* * * *
Met Met Met Met
Met Met na na
Met Met Met Met
Not Met Met na na
na na na na
2013 School Progress Index SPI: 0.9439 Strand: 3 Values 1.0000 and above met the target.
Achievement Gap Red. GrowthMiddle
Math 1.1736 0.7856 0.8069Reading 1.0588 0.8070 0.9356Science 0.9909 1.1090
Attendance Rate %School
2013School
2012County
2013County
2012State 2013
State 2012
Elementary * * ≥95.0 ≥95.0 95.5 95.9
Middle ≥95.0 ≥95.0 ≥95.0 ≥95.0 95.1 95.4
High * * 93.9 93.8 92.5 92.2Teacher Qualifications% of certificates:
Standard Professional 22.2 29.0 38.4 41.0 28.4 29.0
Advanced Professional 74.1 71.0 58.0 57.0 65.1 65.2
Resident Teacher 0.0 0.0 0.0 0.0 0.8 0.9
Conditional Teacher 0.0 0.0 0.9 1.1 0.9 0.9
% of classes NOT taught by:Highly Qualified Teachers 0.8 0.7 3.9 4.5 6.2 6.9

Basic % Proficient % Advanced %
MSA Proficiency LevelsApproximately 99% of Maryland students take MSA. The Basic Level is below the goal set for all students.
Alt-MSA Proficiency LevelsApproximately 1% of Maryland students take Alt-MSA. The Basic Level is below the goal set for all students.
Visit MdReportCard.org for up-to-date and disaggregated information. For definitions, see school system report pages.
Read
ing
Mat
hem
atic
sSc
ienc
e
“na” indicates too few students for School Progress rules. “*” indicates no students or fewer than 10 students in category. • E: English; • A: Algebra/Data Analysis; • B: Biology
3 20132012
4 20132012
5 20132012
6 20132012
7 20132012
8 20132012
10 20132012
3 20132012
4 20132012
5 20132012
6 20132012
7 20132012
8 20132012
10 20132012
5 20132012
8 20132012
10 20132012
3 20132012
4 20132012
5 20132012
6 20132012
7 20132012
8 20132012
•E 20132012
3 20132012
4 20132012
5 20132012
6 20132012
7 20132012
8 20132012
•A 20132012
5 20132012
8 20132012
•B 20132012
All Students Attendance Rate: *
17.4 60.5 22.115.0 64.4 20.6
11.8 58.4 29.810.2 55.6 34.2
11.6 31.8 56.610.1 34.9 55.1
15.9 40.6 43.515.5 42.7 41.8
15.0 36.9 48.118.8 35.5 45.7
19.0 34.9 46.119.2 36.6 44.2
17.0 55.3 27.816.9 54.9 28.2
17.8 53.3 28.912.2 49.0 38.7
11.2 42.1 46.710.1 38.6 51.2
19.1 55.5 25.314.7 54.8 30.5
22.9 48.0 29.117.0 47.6 35.5
27.4 49.3 23.323.7 49.5 26.9
33.0 36.4 30.630.7 36.2 33.1
15.8 53.4 30.816.1 53.1 30.8
33.0 56.4 10.631.5 57.5 11.1
28.6 64.6 6.729.3 63.3 7.4
17.4 60.7 21.918.3 59.6 22.1
13.4 26.3 60.37.2 18.5 74.3
10.2 22.1 67.78.7 16.8 74.5
12.6 26.5 60.96.5 16.2 77.3
10.3 25.9 63.87.2 17.6 75.2
7.9 24.8 67.36.1 13.1 80.7
11.2 25.5 63.38.1 15.2 76.7
20.9 22.8 56.310.7 15.3 74.0
19.2 36.8 44.110.9 30.7 58.5
15.5 36.8 47.79.9 30.0 60.1
19.7 40.9 39.49.5 33.7 56.8
17.2 36.1 46.79.8 30.9 59.3
14.3 33.9 51.88.7 31.2 60.1
15.5 36.4 48.19.9 36.8 53.3
23.8 31.0 45.214.0 31.8 54.2
22.7 44.2 33.115.5 37.2 47.3
22.3 40.4 37.316.8 42.6 40.6
33.3 34.3 32.421.7 41.4 36.9
†College and Career Preparation (CCP) - 2011 ††Data from 2012
19.4 60.6 20.017.3 66.3 16.4
13.1 59.1 27.811.8 58.3 29.9
15.2 35.1 49.710.7 37.8 51.5
17.1 45.2 37.714.2 46.0 39.7
16.3 36.5 47.219.8 38.5 41.8
21.8 37.5 40.717.4 41.0 41.5
10.4 66.6 23.011.3 65.7 23.0
20.8 53.2 26.015.3 52.5 32.2
13.3 43.0 43.711.4 41.5 47.1
24.0 55.6 20.417.1 58.4 24.5
20.1 46.8 33.012.2 51.0 36.8
21.3 53.5 25.221.7 52.1 26.2
27.9 38.3 33.924.4 37.2 38.5
9.7 62.0 28.29.7 64.5 25.8
35.6 56.3 8.237.0 56.1 7.0
31.6 64.9 ≤5.032.7 64.9 ≤5.0
11.6 71.5 16.915.0 66.9 18.1
27.3 18.2 54.5≤5.0 16.7 83.3
18.2 18.2 63.610.0 10.0 80.0
16.7 50.0 33.3≤5.0 25.0 75.0
21.4 28.6 50.0≤5.0 21.4 78.6
21.4 28.6 50.0≤5.0 ≤5.0 ≥95.0
45.5 18.2 36.47.1 7.1 85.7
57.1 14.3 28.6≤5.0 30.8 69.2
36.4 27.3 36.4≤5.0 41.7 58.3
18.2 36.4 45.5≤5.0 30.0 70.0
33.3 41.7 25.08.3 33.3 58.3
28.6 42.9 28.614.3 50.0 35.7
21.4 71.4 7.1≤5.0 25.0 75.0
36.4 36.4 27.321.4 28.6 50.0
57.1 14.3 28.6≤5.0 46.2 53.8
8.3 66.7 25.0≤5.0 58.3 41.7
54.5 45.5 ≤5.021.4 71.4 7.1
64.3 21.4 14.338.5 46.2 15.4
Robert D. Stethem Educational Center 0708
* * ** * *
* * ** * *
* * ** * *
* * ** * *
* * ** * *
65.0 35.0 ≤5.0* * *
* * ** * *
* * ** * *
* * ** * *
* * ** * *
* * ** * *
* * ** * *
76.2 23.8 ≤5.0* * *
* * ** * *
* * ** * *
94.4 5.6 ≤5.0* * *
* * ** * *
* * ** * *
* * ** * *
* * ** * *
* * ** * *
* * ** * *
* * ** * *
* * ** * *
* * ** * *
* * ** * *
* * ** * *
* * ** * *
* * ** * *
* * ** * *
* * ** * *
* * ** * *
* * ** * *
* * ** * *
2013 School Progress
All StudentsAmerican Indian or
Alaska NativeAsian
Black or African American
Hispanic/Latino of any raceNative Hawaiian or
Other Pacific Islander White
Two or more races
Free/Reduced Meals
Special Education
Limited English Proficient
Percent Proficient Participation Rate GraduationReading Math Reading Math
* * * * *
* * * * *
* * * * *
* * * * *
* * * * *
* * * * *
* * * * *
* * * * *
* * * * *
* * * * *
* * * * *
2013 School Progress Index SPI: * Strand: * Values 1.0000 and above met the target.
Achievement Gap Red. GrowthElementary
Math * * *Reading * * *Science * *
MiddleMath * * *Reading * * *Science * *
High Achievement Gap Red. CCRAlgebra * *English * *Biology * *
††Dropout *††Grad * *
†CCP *
Attendance Rate %School
2013School
2012County
2013County
2012State 2013
State 2012
Elementary * * ≥95.0 ≥95.0 95.5 95.9
Middle 83.5 85.3 ≥95.0 ≥95.0 95.1 95.4
High 84.0 83.3 93.9 93.8 92.5 92.2Teacher Qualifications% of certificates:
Standard Professional 33.3 26.7 38.4 41.0 28.4 29.0
Advanced Professional 60.0 60.0 58.0 57.0 65.1 65.2
Resident Teacher 0.0 0.0 0.0 0.0 0.8 0.9
Conditional Teacher 6.7 6.7 0.9 1.1 0.9 0.9
% of classes NOT taught by:Highly Qualified Teachers 22.9 24.1 3.9 4.5 6.2 6.9
Cohort Graduation Rate %Class of 2012 (4-Yr Rate) * 89.76 83.57
Class of 2012 (5-Yr Rate) * 92.42 86.32

Basic % Proficient % Advanced %
MSA Proficiency LevelsApproximately 99% of Maryland students take MSA. The Basic Level is below the goal set for all students.
Alt-MSA Proficiency LevelsApproximately 1% of Maryland students take Alt-MSA. The Basic Level is below the goal set for all students.
Visit MdReportCard.org for up-to-date and disaggregated information. For definitions, see school system report pages.
Read
ing
Mat
hem
atic
sSc
ienc
e
17.4 60.5 22.115.0 64.4 20.6
11.8 58.4 29.810.2 55.6 34.2
11.6 31.8 56.610.1 34.9 55.1
15.9 40.6 43.515.5 42.7 41.8
15.0 36.9 48.118.8 35.5 45.7
19.0 34.9 46.119.2 36.6 44.2
17.0 55.3 27.816.9 54.9 28.2
17.8 53.3 28.912.2 49.0 38.7
11.2 42.1 46.710.1 38.6 51.2
19.1 55.5 25.314.7 54.8 30.5
22.9 48.0 29.117.0 47.6 35.5
27.4 49.3 23.323.7 49.5 26.9
33.0 36.4 30.630.7 36.2 33.1
15.8 53.4 30.816.1 53.1 30.8
33.0 56.4 10.631.5 57.5 11.1
28.6 64.6 6.729.3 63.3 7.4
17.4 60.7 21.918.3 59.6 22.1
13.4 26.3 60.37.2 18.5 74.3
10.2 22.1 67.78.7 16.8 74.5
12.6 26.5 60.96.5 16.2 77.3
10.3 25.9 63.87.2 17.6 75.2
7.9 24.8 67.36.1 13.1 80.7
11.2 25.5 63.38.1 15.2 76.7
20.9 22.8 56.310.7 15.3 74.0
19.2 36.8 44.110.9 30.7 58.5
15.5 36.8 47.79.9 30.0 60.1
19.7 40.9 39.49.5 33.7 56.8
17.2 36.1 46.79.8 30.9 59.3
14.3 33.9 51.88.7 31.2 60.1
15.5 36.4 48.19.9 36.8 53.3
23.8 31.0 45.214.0 31.8 54.2
22.7 44.2 33.115.5 37.2 47.3
22.3 40.4 37.316.8 42.6 40.6
33.3 34.3 32.421.7 41.4 36.9
“na” indicates too few students for School Progress rules. “*” indicates no students or fewer than 10 students in category. • E: English; • A: Algebra/Data Analysis; • B: Biology
3 20132012
4 20132012
5 20132012
6 20132012
7 20132012
8 20132012
10 20132012
3 20132012
4 20132012
5 20132012
6 20132012
7 20132012
8 20132012
10 20132012
5 20132012
8 20132012
10 20132012
3 20132012
4 20132012
5 20132012
6 20132012
7 20132012
8 20132012
•E 20132012
3 20132012
4 20132012
5 20132012
6 20132012
7 20132012
8 20132012
•A 20132012
5 20132012
8 20132012
•B 20132012
All Students Attendance Rate: Met
19.4 60.6 20.017.3 66.3 16.4
13.1 59.1 27.811.8 58.3 29.9
15.2 35.1 49.710.7 37.8 51.5
17.1 45.2 37.714.2 46.0 39.7
16.3 36.5 47.219.8 38.5 41.8
21.8 37.5 40.717.4 41.0 41.5
10.4 66.6 23.011.3 65.7 23.0
20.8 53.2 26.015.3 52.5 32.2
13.3 43.0 43.711.4 41.5 47.1
24.0 55.6 20.417.1 58.4 24.5
20.1 46.8 33.012.2 51.0 36.8
21.3 53.5 25.221.7 52.1 26.2
27.9 38.3 33.924.4 37.2 38.5
9.7 62.0 28.29.7 64.5 25.8
35.6 56.3 8.237.0 56.1 7.0
31.6 64.9 ≤5.032.7 64.9 ≤5.0
11.6 71.5 16.915.0 66.9 18.1
27.3 18.2 54.5≤5.0 16.7 83.3
18.2 18.2 63.610.0 10.0 80.0
16.7 50.0 33.3≤5.0 25.0 75.0
21.4 28.6 50.0≤5.0 21.4 78.6
21.4 28.6 50.0≤5.0 ≤5.0 ≥95.0
45.5 18.2 36.47.1 7.1 85.7
57.1 14.3 28.6≤5.0 30.8 69.2
36.4 27.3 36.4≤5.0 41.7 58.3
18.2 36.4 45.5≤5.0 30.0 70.0
33.3 41.7 25.08.3 33.3 58.3
28.6 42.9 28.614.3 50.0 35.7
21.4 71.4 7.1≤5.0 25.0 75.0
36.4 36.4 27.321.4 28.6 50.0
57.1 14.3 28.6≤5.0 46.2 53.8
8.3 66.7 25.0≤5.0 58.3 41.7
54.5 45.5 ≤5.021.4 71.4 7.1
64.3 21.4 14.338.5 46.2 15.4
T. C. Martin Elementary School 0801
12.7 60.8 26.69.8 72.0 18.3
11.0 57.0 32.011.2 49.4 39.3
14.4 29.9 55.7≤5.0 30.7 64.8
* * ** * *
* * ** * *
* * ** * *
* * ** * *
11.4 46.8 41.87.3 39.0 53.7
9.0 42.0 49.012.4 32.6 55.1
21.4 55.1 23.58.0 55.7 36.4
* * ** * *
* * ** * *
* * ** * *
* * ** * *
29.2 60.4 10.422.7 72.7 ≤5.0
* * ** * *
* * ** * *
* * ** * *
* * ** * *
* * ** * *
* * ** * *
* * ** * *
* * ** * *
* * ** * *
* * ** * *
* * ** * *
* * ** * *
* * ** * *
* * ** * *
* * ** * *
* * ** * *
* * ** * *
* * ** * *
* * ** * *
2013 School Progress
All StudentsAmerican Indian or
Alaska NativeAsian
Black or African American
Hispanic/Latino of any raceNative Hawaiian or
Other Pacific Islander White
Two or more races
Free/Reduced Meals
Special Education
Limited English Proficient
Percent Proficient Participation RateReading Math Reading Math
Met Met Met Met
na na na na
Met Met na na
Met Met na na
Met Met na na
* * * *
Met Met Met Met
Met Met na na
Met Met na na
Met Met na na
na na na na
2013 School Progress Index SPI: 0.9210 Strand: 4 Values 1.0000 and above met the target.
Achievement Gap Red. GrowthElementary
Math 1.0002 0.9147 0.9547Reading 1.0116 0.8047 0.9367Science 0.9228
Attendance Rate %School
2013School
2012County
2013County
2012State 2013
State 2012
Elementary ≥95.0 ≥95.0 ≥95.0 ≥95.0 95.5 95.9
Middle * * ≥95.0 ≥95.0 95.1 95.4
High * * 93.9 93.8 92.5 92.2Teacher Qualifications% of certificates:
Standard Professional 26.9 25.9 38.4 41.0 28.4 29.0
Advanced Professional 73.1 74.1 58.0 57.0 65.1 65.2
Resident Teacher 0.0 0.0 0.0 0.0 0.8 0.9
Conditional Teacher 0.0 0.0 0.9 1.1 0.9 0.9
% of classes NOT taught by:Highly Qualified Teachers 3.7 0.0 3.9 4.5 6.2 6.9

Basic % Proficient % Advanced %
MSA Proficiency LevelsApproximately 99% of Maryland students take MSA. The Basic Level is below the goal set for all students.
Alt-MSA Proficiency LevelsApproximately 1% of Maryland students take Alt-MSA. The Basic Level is below the goal set for all students.
Visit MdReportCard.org for up-to-date and disaggregated information. For definitions, see school system report pages.
Read
ing
Mat
hem
atic
sSc
ienc
e
“na” indicates too few students for School Progress rules. “*” indicates no students or fewer than 10 students in category. • E: English; • A: Algebra/Data Analysis; • B: Biology
3 20132012
4 20132012
5 20132012
6 20132012
7 20132012
8 20132012
10 20132012
3 20132012
4 20132012
5 20132012
6 20132012
7 20132012
8 20132012
10 20132012
5 20132012
8 20132012
10 20132012
3 20132012
4 20132012
5 20132012
6 20132012
7 20132012
8 20132012
•E 20132012
3 20132012
4 20132012
5 20132012
6 20132012
7 20132012
8 20132012
•A 20132012
5 20132012
8 20132012
•B 20132012
All Students Attendance Rate: Met
17.4 60.5 22.115.0 64.4 20.6
11.8 58.4 29.810.2 55.6 34.2
11.6 31.8 56.610.1 34.9 55.1
15.9 40.6 43.515.5 42.7 41.8
15.0 36.9 48.118.8 35.5 45.7
19.0 34.9 46.119.2 36.6 44.2
17.0 55.3 27.816.9 54.9 28.2
17.8 53.3 28.912.2 49.0 38.7
11.2 42.1 46.710.1 38.6 51.2
19.1 55.5 25.314.7 54.8 30.5
22.9 48.0 29.117.0 47.6 35.5
27.4 49.3 23.323.7 49.5 26.9
33.0 36.4 30.630.7 36.2 33.1
15.8 53.4 30.816.1 53.1 30.8
33.0 56.4 10.631.5 57.5 11.1
28.6 64.6 6.729.3 63.3 7.4
17.4 60.7 21.918.3 59.6 22.1
13.4 26.3 60.37.2 18.5 74.3
10.2 22.1 67.78.7 16.8 74.5
12.6 26.5 60.96.5 16.2 77.3
10.3 25.9 63.87.2 17.6 75.2
7.9 24.8 67.36.1 13.1 80.7
11.2 25.5 63.38.1 15.2 76.7
20.9 22.8 56.310.7 15.3 74.0
19.2 36.8 44.110.9 30.7 58.5
15.5 36.8 47.79.9 30.0 60.1
19.7 40.9 39.49.5 33.7 56.8
17.2 36.1 46.79.8 30.9 59.3
14.3 33.9 51.88.7 31.2 60.1
15.5 36.4 48.19.9 36.8 53.3
23.8 31.0 45.214.0 31.8 54.2
22.7 44.2 33.115.5 37.2 47.3
22.3 40.4 37.316.8 42.6 40.6
33.3 34.3 32.421.7 41.4 36.9
19.4 60.6 20.017.3 66.3 16.4
13.1 59.1 27.811.8 58.3 29.9
15.2 35.1 49.710.7 37.8 51.5
17.1 45.2 37.714.2 46.0 39.7
16.3 36.5 47.219.8 38.5 41.8
21.8 37.5 40.717.4 41.0 41.5
10.4 66.6 23.011.3 65.7 23.0
20.8 53.2 26.015.3 52.5 32.2
13.3 43.0 43.711.4 41.5 47.1
24.0 55.6 20.417.1 58.4 24.5
20.1 46.8 33.012.2 51.0 36.8
21.3 53.5 25.221.7 52.1 26.2
27.9 38.3 33.924.4 37.2 38.5
9.7 62.0 28.29.7 64.5 25.8
35.6 56.3 8.237.0 56.1 7.0
31.6 64.9 ≤5.032.7 64.9 ≤5.0
11.6 71.5 16.915.0 66.9 18.1
27.3 18.2 54.5≤5.0 16.7 83.3
18.2 18.2 63.610.0 10.0 80.0
16.7 50.0 33.3≤5.0 25.0 75.0
21.4 28.6 50.0≤5.0 21.4 78.6
21.4 28.6 50.0≤5.0 ≤5.0 ≥95.0
45.5 18.2 36.47.1 7.1 85.7
57.1 14.3 28.6≤5.0 30.8 69.2
36.4 27.3 36.4≤5.0 41.7 58.3
18.2 36.4 45.5≤5.0 30.0 70.0
33.3 41.7 25.08.3 33.3 58.3
28.6 42.9 28.614.3 50.0 35.7
21.4 71.4 7.1≤5.0 25.0 75.0
36.4 36.4 27.321.4 28.6 50.0
57.1 14.3 28.6≤5.0 46.2 53.8
8.3 66.7 25.0≤5.0 58.3 41.7
54.5 45.5 ≤5.021.4 71.4 7.1
64.3 21.4 14.338.5 46.2 15.4
Theodore G. Davis Middle School 0625
* * ** * *
* * ** * *
* * ** * *
12.1 47.4 40.411.4 44.2 44.4
12.6 33.4 53.915.1 31.5 53.4
14.5 32.8 52.715.2 41.6 43.1
* * ** * *
* * ** * *
* * ** * *
* * ** * *
18.8 52.2 29.09.6 50.8 39.6
19.6 54.3 26.221.9 46.1 32.0
23.8 32.5 43.820.8 39.5 39.7
* * ** * *
* * ** * *
26.1 69.6 ≤5.036.2 61.8 ≤5.0
* * ** * *
* * ** * *
* * ** * *
* * ** * *
* * ** * *
* * ** * *
* * ** * *
* * ** * *
* * ** * *
* * ** * *
* * ** * *
* * ** * *
* * ** * *
* * ** * *
* * ** * *
* * ** * *
* * ** * *
* * ** * *
2013 School Progress
All StudentsAmerican Indian or
Alaska NativeAsian
Black or African American
Hispanic/Latino of any raceNative Hawaiian or
Other Pacific Islander White
Two or more races
Free/Reduced Meals
Special Education
Limited English Proficient
Percent Proficient Participation RateReading Math Reading Math
Met Not Met Met Met
na na na na
Met Met na na
Met Not Met Met Met
Met Met na na
* * * *
Met Met Met Met
Met Met Met Met
Met Met Met Met
Not Met Not Met Met Met
Met Met na na
2013 School Progress Index SPI: 0.8251 Strand: 5 Values 1.0000 and above met the target.
Achievement Gap Red. GrowthMiddle
Math 0.9381 0.6175 0.8716Reading 0.9796 0.6966 0.9873Science 1.0078 0.5891
Attendance Rate %School
2013School
2012County
2013County
2012State 2013
State 2012
Elementary * * ≥95.0 ≥95.0 95.5 95.9
Middle ≥95.0 ≥95.0 ≥95.0 ≥95.0 95.1 95.4
High * * 93.9 93.8 92.5 92.2Teacher Qualifications% of certificates:
Standard Professional 33.3 37.7 38.4 41.0 28.4 29.0
Advanced Professional 59.3 59.0 58.0 57.0 65.1 65.2
Resident Teacher 0.0 0.0 0.0 0.0 0.8 0.9
Conditional Teacher 0.0 0.0 0.9 1.1 0.9 0.9
% of classes NOT taught by:Highly Qualified Teachers 5.3 3.1 3.9 4.5 6.2 6.9

Basic % Proficient % Advanced %
MSA Proficiency LevelsApproximately 99% of Maryland students take MSA. The Basic Level is below the goal set for all students.
Alt-MSA Proficiency LevelsApproximately 1% of Maryland students take Alt-MSA. The Basic Level is below the goal set for all students.
Visit MdReportCard.org for up-to-date and disaggregated information. For definitions, see school system report pages.
Read
ing
Mat
hem
atic
sSc
ienc
e
17.4 60.5 22.115.0 64.4 20.6
11.8 58.4 29.810.2 55.6 34.2
11.6 31.8 56.610.1 34.9 55.1
15.9 40.6 43.515.5 42.7 41.8
15.0 36.9 48.118.8 35.5 45.7
19.0 34.9 46.119.2 36.6 44.2
17.0 55.3 27.816.9 54.9 28.2
17.8 53.3 28.912.2 49.0 38.7
11.2 42.1 46.710.1 38.6 51.2
19.1 55.5 25.314.7 54.8 30.5
22.9 48.0 29.117.0 47.6 35.5
27.4 49.3 23.323.7 49.5 26.9
33.0 36.4 30.630.7 36.2 33.1
15.8 53.4 30.816.1 53.1 30.8
33.0 56.4 10.631.5 57.5 11.1
28.6 64.6 6.729.3 63.3 7.4
17.4 60.7 21.918.3 59.6 22.1
13.4 26.3 60.37.2 18.5 74.3
10.2 22.1 67.78.7 16.8 74.5
12.6 26.5 60.96.5 16.2 77.3
10.3 25.9 63.87.2 17.6 75.2
7.9 24.8 67.36.1 13.1 80.7
11.2 25.5 63.38.1 15.2 76.7
20.9 22.8 56.310.7 15.3 74.0
19.2 36.8 44.110.9 30.7 58.5
15.5 36.8 47.79.9 30.0 60.1
19.7 40.9 39.49.5 33.7 56.8
17.2 36.1 46.79.8 30.9 59.3
14.3 33.9 51.88.7 31.2 60.1
15.5 36.4 48.19.9 36.8 53.3
23.8 31.0 45.214.0 31.8 54.2
22.7 44.2 33.115.5 37.2 47.3
22.3 40.4 37.316.8 42.6 40.6
33.3 34.3 32.421.7 41.4 36.9
“na” indicates too few students for School Progress rules. “*” indicates no students or fewer than 10 students in category. • E: English; • A: Algebra/Data Analysis; • B: Biology
3 20132012
4 20132012
5 20132012
6 20132012
7 20132012
8 20132012
10 20132012
3 20132012
4 20132012
5 20132012
6 20132012
7 20132012
8 20132012
10 20132012
5 20132012
8 20132012
10 20132012
3 20132012
4 20132012
5 20132012
6 20132012
7 20132012
8 20132012
•E 20132012
3 20132012
4 20132012
5 20132012
6 20132012
7 20132012
8 20132012
•A 20132012
5 20132012
8 20132012
•B 20132012
†College and Career Preparation (CCP) - 2011 ††Data from 2012
19.4 60.6 20.017.3 66.3 16.4
13.1 59.1 27.811.8 58.3 29.9
15.2 35.1 49.710.7 37.8 51.5
17.1 45.2 37.714.2 46.0 39.7
16.3 36.5 47.219.8 38.5 41.8
21.8 37.5 40.717.4 41.0 41.5
10.4 66.6 23.011.3 65.7 23.0
20.8 53.2 26.015.3 52.5 32.2
13.3 43.0 43.711.4 41.5 47.1
24.0 55.6 20.417.1 58.4 24.5
20.1 46.8 33.012.2 51.0 36.8
21.3 53.5 25.221.7 52.1 26.2
27.9 38.3 33.924.4 37.2 38.5
9.7 62.0 28.29.7 64.5 25.8
35.6 56.3 8.237.0 56.1 7.0
31.6 64.9 ≤5.032.7 64.9 ≤5.0
11.6 71.5 16.915.0 66.9 18.1
27.3 18.2 54.5≤5.0 16.7 83.3
18.2 18.2 63.610.0 10.0 80.0
16.7 50.0 33.3≤5.0 25.0 75.0
21.4 28.6 50.0≤5.0 21.4 78.6
21.4 28.6 50.0≤5.0 ≤5.0 ≥95.0
45.5 18.2 36.47.1 7.1 85.7
57.1 14.3 28.6≤5.0 30.8 69.2
36.4 27.3 36.4≤5.0 41.7 58.3
18.2 36.4 45.5≤5.0 30.0 70.0
33.3 41.7 25.08.3 33.3 58.3
28.6 42.9 28.614.3 50.0 35.7
21.4 71.4 7.1≤5.0 25.0 75.0
36.4 36.4 27.321.4 28.6 50.0
57.1 14.3 28.6≤5.0 46.2 53.8
8.3 66.7 25.0≤5.0 58.3 41.7
54.5 45.5 ≤5.021.4 71.4 7.1
64.3 21.4 14.338.5 46.2 15.4
Thomas Stone High School 0605
* * ** * *
* * ** * *
* * ** * *
* * ** * *
* * ** * *
* * ** * *
9.6 71.6 18.810.8 73.5 15.7
* * ** * *
* * ** * *
* * ** * *
* * ** * *
* * ** * *
* * ** * *
10.1 67.1 22.78.1 71.2 20.7
* * ** * *
* * ** * *
10.5 79.0 10.514.2 73.5 12.3
* * ** * *
* * ** * *
* * ** * *
* * ** * *
* * ** * *
* * ** * *
* * ** * *
* * ** * *
* * ** * *
* * ** * *
* * ** * *
* * ** * *
* * ** * *
* * ** * *
* * ** * *
* * ** * *
* * ** * *
2013 School Progress
All StudentsAmerican Indian or
Alaska NativeAsian
Black or African American
Hispanic/Latino of any raceNative Hawaiian or
Other Pacific Islander White
Two or more races
Free/Reduced Meals
Special Education
Limited English Proficient
Percent Proficient Participation Rate GraduationReading Math Reading Math
Met Met Met Met Met
na na na na na
na na na na na
Met Met Met Met Met
Met Met na na na
* * * * *
Met Met Met Met Met
Met Met na na na
Met Met Met Met Met
Met Met na na Met
na na na na *
2013 School Progress Index SPI: 0.9790 Strand: 3 Values 1.0000 and above met the target.
High Achievement Gap Red. CCRAlgebra 0.9896 0.8179English 1.0297 0.9325Biology 1.0629 0.7535
††Dropout 1.1824††Grad 0.9814 1.0185
†CCP 0.9043
Attendance Rate %School
2013School
2012County
2013County
2012State 2013
State 2012
Elementary * * ≥95.0 ≥95.0 95.5 95.9
Middle * * ≥95.0 ≥95.0 95.1 95.4
High 92.8 93.1 93.9 93.8 92.5 92.2Teacher Qualifications% of certificates:
Standard Professional 31.9 38.4 38.4 41.0 28.4 29.0
Advanced Professional 65.2 60.3 58.0 57.0 65.1 65.2
Resident Teacher 0.0 0.0 0.0 0.0 0.8 0.9
Conditional Teacher 0.0 1.4 0.9 1.1 0.9 0.9
% of classes NOT taught by:Highly Qualified Teachers 3.9 5.4 3.9 4.5 6.2 6.9
Cohort Graduation Rate %Class of 2012 (4-Yr Rate) 88.65 89.76 83.57
Class of 2012 (5-Yr Rate) 90.97 92.42 86.32

Basic % Proficient % Advanced %
MSA Proficiency LevelsApproximately 99% of Maryland students take MSA. The Basic Level is below the goal set for all students.
Alt-MSA Proficiency LevelsApproximately 1% of Maryland students take Alt-MSA. The Basic Level is below the goal set for all students.
Visit MdReportCard.org for up-to-date and disaggregated information. For definitions, see school system report pages.
Read
ing
Mat
hem
atic
sSc
ienc
e
“na” indicates too few students for School Progress rules. “*” indicates no students or fewer than 10 students in category. • E: English; • A: Algebra/Data Analysis; • B: Biology
3 20132012
4 20132012
5 20132012
6 20132012
7 20132012
8 20132012
10 20132012
3 20132012
4 20132012
5 20132012
6 20132012
7 20132012
8 20132012
10 20132012
5 20132012
8 20132012
10 20132012
3 20132012
4 20132012
5 20132012
6 20132012
7 20132012
8 20132012
•E 20132012
3 20132012
4 20132012
5 20132012
6 20132012
7 20132012
8 20132012
•A 20132012
5 20132012
8 20132012
•B 20132012
All Students Attendance Rate: Met
17.4 60.5 22.115.0 64.4 20.6
11.8 58.4 29.810.2 55.6 34.2
11.6 31.8 56.610.1 34.9 55.1
15.9 40.6 43.515.5 42.7 41.8
15.0 36.9 48.118.8 35.5 45.7
19.0 34.9 46.119.2 36.6 44.2
17.0 55.3 27.816.9 54.9 28.2
17.8 53.3 28.912.2 49.0 38.7
11.2 42.1 46.710.1 38.6 51.2
19.1 55.5 25.314.7 54.8 30.5
22.9 48.0 29.117.0 47.6 35.5
27.4 49.3 23.323.7 49.5 26.9
33.0 36.4 30.630.7 36.2 33.1
15.8 53.4 30.816.1 53.1 30.8
33.0 56.4 10.631.5 57.5 11.1
28.6 64.6 6.729.3 63.3 7.4
17.4 60.7 21.918.3 59.6 22.1
13.4 26.3 60.37.2 18.5 74.3
10.2 22.1 67.78.7 16.8 74.5
12.6 26.5 60.96.5 16.2 77.3
10.3 25.9 63.87.2 17.6 75.2
7.9 24.8 67.36.1 13.1 80.7
11.2 25.5 63.38.1 15.2 76.7
20.9 22.8 56.310.7 15.3 74.0
19.2 36.8 44.110.9 30.7 58.5
15.5 36.8 47.79.9 30.0 60.1
19.7 40.9 39.49.5 33.7 56.8
17.2 36.1 46.79.8 30.9 59.3
14.3 33.9 51.88.7 31.2 60.1
15.5 36.4 48.19.9 36.8 53.3
23.8 31.0 45.214.0 31.8 54.2
22.7 44.2 33.115.5 37.2 47.3
22.3 40.4 37.316.8 42.6 40.6
33.3 34.3 32.421.7 41.4 36.9
19.4 60.6 20.017.3 66.3 16.4
13.1 59.1 27.811.8 58.3 29.9
15.2 35.1 49.710.7 37.8 51.5
17.1 45.2 37.714.2 46.0 39.7
16.3 36.5 47.219.8 38.5 41.8
21.8 37.5 40.717.4 41.0 41.5
10.4 66.6 23.011.3 65.7 23.0
20.8 53.2 26.015.3 52.5 32.2
13.3 43.0 43.711.4 41.5 47.1
24.0 55.6 20.417.1 58.4 24.5
20.1 46.8 33.012.2 51.0 36.8
21.3 53.5 25.221.7 52.1 26.2
27.9 38.3 33.924.4 37.2 38.5
9.7 62.0 28.29.7 64.5 25.8
35.6 56.3 8.237.0 56.1 7.0
31.6 64.9 ≤5.032.7 64.9 ≤5.0
11.6 71.5 16.915.0 66.9 18.1
27.3 18.2 54.5≤5.0 16.7 83.3
18.2 18.2 63.610.0 10.0 80.0
16.7 50.0 33.3≤5.0 25.0 75.0
21.4 28.6 50.0≤5.0 21.4 78.6
21.4 28.6 50.0≤5.0 ≤5.0 ≥95.0
45.5 18.2 36.47.1 7.1 85.7
57.1 14.3 28.6≤5.0 30.8 69.2
36.4 27.3 36.4≤5.0 41.7 58.3
18.2 36.4 45.5≤5.0 30.0 70.0
33.3 41.7 25.08.3 33.3 58.3
28.6 42.9 28.614.3 50.0 35.7
21.4 71.4 7.1≤5.0 25.0 75.0
36.4 36.4 27.321.4 28.6 50.0
57.1 14.3 28.6≤5.0 46.2 53.8
8.3 66.7 25.0≤5.0 58.3 41.7
54.5 45.5 ≤5.021.4 71.4 7.1
64.3 21.4 14.338.5 46.2 15.4
Walter J. Mitchell Elementary 0105
14.2 63.7 22.18.0 69.0 23.0
13.6 56.3 30.16.7 54.8 38.5
11.2 33.6 55.1≤5.0 30.5 64.8
* * ** * *
* * ** * *
* * ** * *
* * ** * *
14.9 52.6 32.59.0 50.0 41.0
14.3 43.8 41.911.5 40.4 48.1
15.7 61.1 23.17.6 57.1 35.2
* * ** * *
* * ** * *
* * ** * *
* * ** * *
27.1 59.8 13.120.0 64.8 15.2
* * ** * *
* * ** * *
* * ** * *
* * ** * *
* * ** * *
* * ** * *
* * ** * *
* * ** * *
* * ** * *
* * ** * *
* * ** * *
* * ** * *
* * ** * *
* * ** * *
* * ** * *
* * ** * *
* * ** * *
* * ** * *
* * ** * *
2013 School Progress
All StudentsAmerican Indian or
Alaska NativeAsian
Black or African American
Hispanic/Latino of any raceNative Hawaiian or
Other Pacific Islander White
Two or more races
Free/Reduced Meals
Special Education
Limited English Proficient
Percent Proficient Participation RateReading Math Reading Math
Met Met Met Met
* * * *
Met Met na na
Met Met na na
Met Met na na
na na na na
Met Not Met Met Met
Met Met na na
Not Met Met na na
Met Met na na
na na na na
2013 School Progress Index SPI: 0.8646 Strand: 5 Values 1.0000 and above met the target.
Achievement Gap Red. GrowthElementary
Math 0.9859 0.8326 0.7683Reading 0.9743 0.8854 0.8432Science 0.8326
Attendance Rate %School
2013School
2012County
2013County
2012State 2013
State 2012
Elementary ≥95.0 ≥95.0 ≥95.0 ≥95.0 95.5 95.9
Middle * * ≥95.0 ≥95.0 95.1 95.4
High * * 93.9 93.8 92.5 92.2Teacher Qualifications% of certificates:
Standard Professional 36.7 42.9 38.4 41.0 28.4 29.0
Advanced Professional 63.3 57.1 58.0 57.0 65.1 65.2
Resident Teacher 0.0 0.0 0.0 0.0 0.8 0.9
Conditional Teacher 0.0 0.0 0.9 1.1 0.9 0.9
% of classes NOT taught by:Highly Qualified Teachers 0.0 0.0 3.9 4.5 6.2 6.9
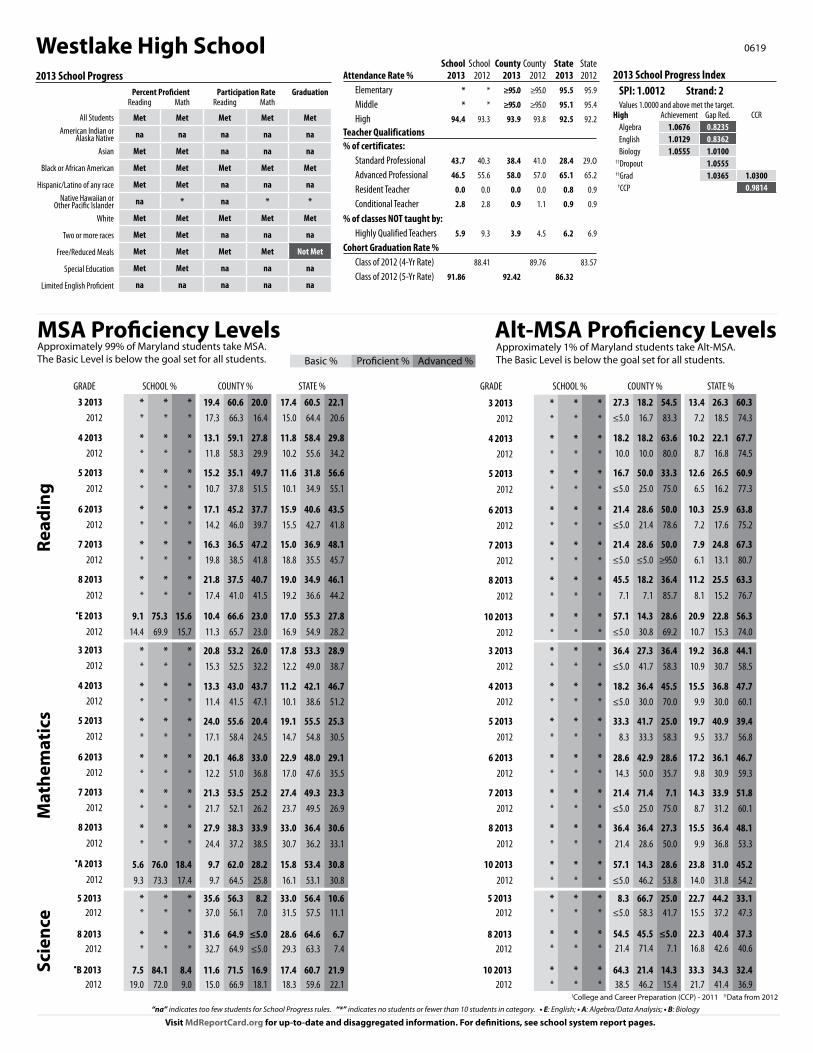
Basic % Proficient % Advanced %
MSA Proficiency LevelsApproximately 99% of Maryland students take MSA. The Basic Level is below the goal set for all students.
Alt-MSA Proficiency LevelsApproximately 1% of Maryland students take Alt-MSA. The Basic Level is below the goal set for all students.
Visit MdReportCard.org for up-to-date and disaggregated information. For definitions, see school system report pages.
Read
ing
Mat
hem
atic
sSc
ienc
e
17.4 60.5 22.115.0 64.4 20.6
11.8 58.4 29.810.2 55.6 34.2
11.6 31.8 56.610.1 34.9 55.1
15.9 40.6 43.515.5 42.7 41.8
15.0 36.9 48.118.8 35.5 45.7
19.0 34.9 46.119.2 36.6 44.2
17.0 55.3 27.816.9 54.9 28.2
17.8 53.3 28.912.2 49.0 38.7
11.2 42.1 46.710.1 38.6 51.2
19.1 55.5 25.314.7 54.8 30.5
22.9 48.0 29.117.0 47.6 35.5
27.4 49.3 23.323.7 49.5 26.9
33.0 36.4 30.630.7 36.2 33.1
15.8 53.4 30.816.1 53.1 30.8
33.0 56.4 10.631.5 57.5 11.1
28.6 64.6 6.729.3 63.3 7.4
17.4 60.7 21.918.3 59.6 22.1
13.4 26.3 60.37.2 18.5 74.3
10.2 22.1 67.78.7 16.8 74.5
12.6 26.5 60.96.5 16.2 77.3
10.3 25.9 63.87.2 17.6 75.2
7.9 24.8 67.36.1 13.1 80.7
11.2 25.5 63.38.1 15.2 76.7
20.9 22.8 56.310.7 15.3 74.0
19.2 36.8 44.110.9 30.7 58.5
15.5 36.8 47.79.9 30.0 60.1
19.7 40.9 39.49.5 33.7 56.8
17.2 36.1 46.79.8 30.9 59.3
14.3 33.9 51.88.7 31.2 60.1
15.5 36.4 48.19.9 36.8 53.3
23.8 31.0 45.214.0 31.8 54.2
22.7 44.2 33.115.5 37.2 47.3
22.3 40.4 37.316.8 42.6 40.6
33.3 34.3 32.421.7 41.4 36.9
“na” indicates too few students for School Progress rules. “*” indicates no students or fewer than 10 students in category. • E: English; • A: Algebra/Data Analysis; • B: Biology
3 20132012
4 20132012
5 20132012
6 20132012
7 20132012
8 20132012
10 20132012
3 20132012
4 20132012
5 20132012
6 20132012
7 20132012
8 20132012
10 20132012
5 20132012
8 20132012
10 20132012
3 20132012
4 20132012
5 20132012
6 20132012
7 20132012
8 20132012
•E 20132012
3 20132012
4 20132012
5 20132012
6 20132012
7 20132012
8 20132012
•A 20132012
5 20132012
8 20132012
•B 20132012
†College and Career Preparation (CCP) - 2011 ††Data from 2012
19.4 60.6 20.017.3 66.3 16.4
13.1 59.1 27.811.8 58.3 29.9
15.2 35.1 49.710.7 37.8 51.5
17.1 45.2 37.714.2 46.0 39.7
16.3 36.5 47.219.8 38.5 41.8
21.8 37.5 40.717.4 41.0 41.5
10.4 66.6 23.011.3 65.7 23.0
20.8 53.2 26.015.3 52.5 32.2
13.3 43.0 43.711.4 41.5 47.1
24.0 55.6 20.417.1 58.4 24.5
20.1 46.8 33.012.2 51.0 36.8
21.3 53.5 25.221.7 52.1 26.2
27.9 38.3 33.924.4 37.2 38.5
9.7 62.0 28.29.7 64.5 25.8
35.6 56.3 8.237.0 56.1 7.0
31.6 64.9 ≤5.032.7 64.9 ≤5.0
11.6 71.5 16.915.0 66.9 18.1
27.3 18.2 54.5≤5.0 16.7 83.3
18.2 18.2 63.610.0 10.0 80.0
16.7 50.0 33.3≤5.0 25.0 75.0
21.4 28.6 50.0≤5.0 21.4 78.6
21.4 28.6 50.0≤5.0 ≤5.0 ≥95.0
45.5 18.2 36.47.1 7.1 85.7
57.1 14.3 28.6≤5.0 30.8 69.2
36.4 27.3 36.4≤5.0 41.7 58.3
18.2 36.4 45.5≤5.0 30.0 70.0
33.3 41.7 25.08.3 33.3 58.3
28.6 42.9 28.614.3 50.0 35.7
21.4 71.4 7.1≤5.0 25.0 75.0
36.4 36.4 27.321.4 28.6 50.0
57.1 14.3 28.6≤5.0 46.2 53.8
8.3 66.7 25.0≤5.0 58.3 41.7
54.5 45.5 ≤5.021.4 71.4 7.1
64.3 21.4 14.338.5 46.2 15.4
Westlake High School 0619
* * ** * *
* * ** * *
* * ** * *
* * ** * *
* * ** * *
* * ** * *
9.1 75.3 15.614.4 69.9 15.7
* * ** * *
* * ** * *
* * ** * *
* * ** * *
* * ** * *
* * ** * *
5.6 76.0 18.49.3 73.3 17.4
* * ** * *
* * ** * *
7.5 84.1 8.419.0 72.0 9.0
* * ** * *
* * ** * *
* * ** * *
* * ** * *
* * ** * *
* * ** * *
* * ** * *
* * ** * *
* * ** * *
* * ** * *
* * ** * *
* * ** * *
* * ** * *
* * ** * *
* * ** * *
* * ** * *
* * ** * *
2013 School Progress
All StudentsAmerican Indian or
Alaska NativeAsian
Black or African American
Hispanic/Latino of any raceNative Hawaiian or
Other Pacific Islander White
Two or more races
Free/Reduced Meals
Special Education
Limited English Proficient
Percent Proficient Participation Rate GraduationReading Math Reading Math
Met Met Met Met Met
na na na na na
Met Met na na na
Met Met Met Met Met
Met Met na na na
na * na * *
Met Met Met Met Met
Met Met na na na
Met Met Met Met Not Met
Met Met na na na
na na na na na
2013 School Progress Index SPI: 1.0012 Strand: 2 Values 1.0000 and above met the target.
High Achievement Gap Red. CCRAlgebra 1.0676 0.8235English 1.0129 0.8362Biology 1.0555 1.0100
††Dropout 1.0555††Grad 1.0365 1.0300
†CCP 0.9814
Attendance Rate %School
2013School
2012County
2013County
2012State 2013
State 2012
Elementary * * ≥95.0 ≥95.0 95.5 95.9
Middle * * ≥95.0 ≥95.0 95.1 95.4
High 94.4 93.3 93.9 93.8 92.5 92.2Teacher Qualifications% of certificates:
Standard Professional 43.7 40.3 38.4 41.0 28.4 29.0
Advanced Professional 46.5 55.6 58.0 57.0 65.1 65.2
Resident Teacher 0.0 0.0 0.0 0.0 0.8 0.9
Conditional Teacher 2.8 2.8 0.9 1.1 0.9 0.9
% of classes NOT taught by:Highly Qualified Teachers 5.9 9.3 3.9 4.5 6.2 6.9
Cohort Graduation Rate %Class of 2012 (4-Yr Rate) 88.41 89.76 83.57
Class of 2012 (5-Yr Rate) 91.86 92.42 86.32
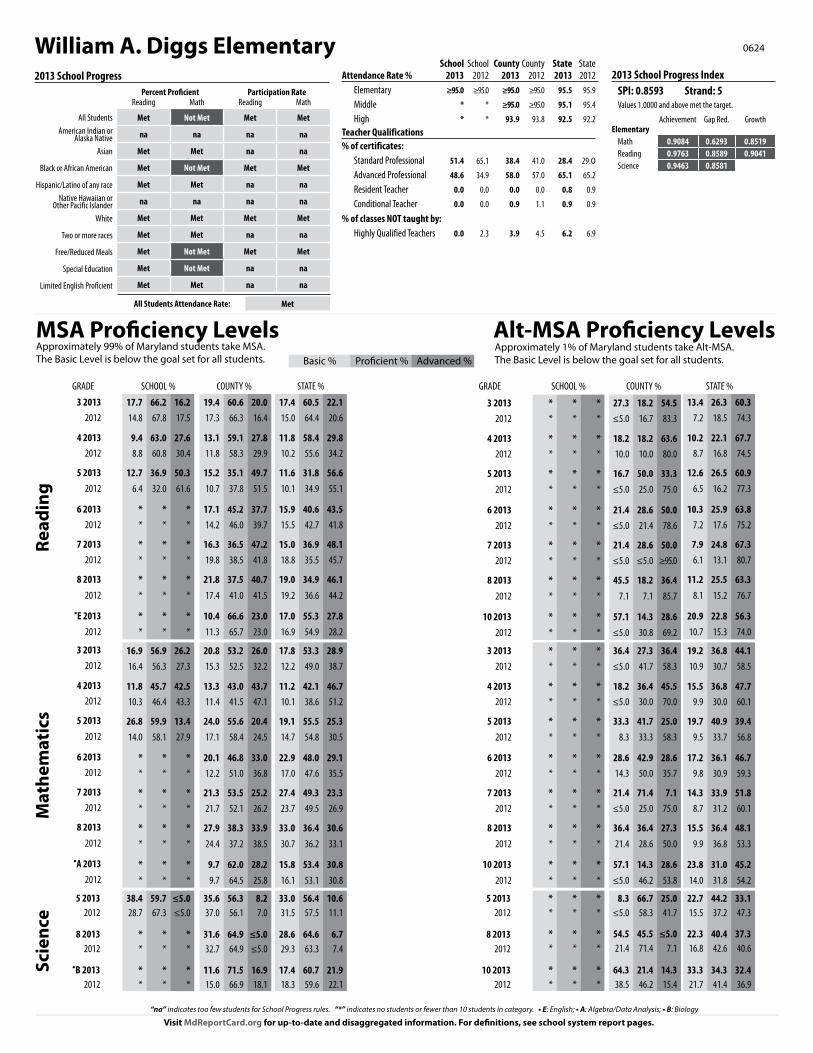
Basic % Proficient % Advanced %
MSA Proficiency LevelsApproximately 99% of Maryland students take MSA. The Basic Level is below the goal set for all students.
Alt-MSA Proficiency LevelsApproximately 1% of Maryland students take Alt-MSA. The Basic Level is below the goal set for all students.
Visit MdReportCard.org for up-to-date and disaggregated information. For definitions, see school system report pages.
Read
ing
Mat
hem
atic
sSc
ienc
e
“na” indicates too few students for School Progress rules. “*” indicates no students or fewer than 10 students in category. • E: English; • A: Algebra/Data Analysis; • B: Biology
3 20132012
4 20132012
5 20132012
6 20132012
7 20132012
8 20132012
10 20132012
3 20132012
4 20132012
5 20132012
6 20132012
7 20132012
8 20132012
10 20132012
5 20132012
8 20132012
10 20132012
3 20132012
4 20132012
5 20132012
6 20132012
7 20132012
8 20132012
•E 20132012
3 20132012
4 20132012
5 20132012
6 20132012
7 20132012
8 20132012
•A 20132012
5 20132012
8 20132012
•B 20132012
All Students Attendance Rate: Met
17.4 60.5 22.115.0 64.4 20.6
11.8 58.4 29.810.2 55.6 34.2
11.6 31.8 56.610.1 34.9 55.1
15.9 40.6 43.515.5 42.7 41.8
15.0 36.9 48.118.8 35.5 45.7
19.0 34.9 46.119.2 36.6 44.2
17.0 55.3 27.816.9 54.9 28.2
17.8 53.3 28.912.2 49.0 38.7
11.2 42.1 46.710.1 38.6 51.2
19.1 55.5 25.314.7 54.8 30.5
22.9 48.0 29.117.0 47.6 35.5
27.4 49.3 23.323.7 49.5 26.9
33.0 36.4 30.630.7 36.2 33.1
15.8 53.4 30.816.1 53.1 30.8
33.0 56.4 10.631.5 57.5 11.1
28.6 64.6 6.729.3 63.3 7.4
17.4 60.7 21.918.3 59.6 22.1
13.4 26.3 60.37.2 18.5 74.3
10.2 22.1 67.78.7 16.8 74.5
12.6 26.5 60.96.5 16.2 77.3
10.3 25.9 63.87.2 17.6 75.2
7.9 24.8 67.36.1 13.1 80.7
11.2 25.5 63.38.1 15.2 76.7
20.9 22.8 56.310.7 15.3 74.0
19.2 36.8 44.110.9 30.7 58.5
15.5 36.8 47.79.9 30.0 60.1
19.7 40.9 39.49.5 33.7 56.8
17.2 36.1 46.79.8 30.9 59.3
14.3 33.9 51.88.7 31.2 60.1
15.5 36.4 48.19.9 36.8 53.3
23.8 31.0 45.214.0 31.8 54.2
22.7 44.2 33.115.5 37.2 47.3
22.3 40.4 37.316.8 42.6 40.6
33.3 34.3 32.421.7 41.4 36.9
19.4 60.6 20.017.3 66.3 16.4
13.1 59.1 27.811.8 58.3 29.9
15.2 35.1 49.710.7 37.8 51.5
17.1 45.2 37.714.2 46.0 39.7
16.3 36.5 47.219.8 38.5 41.8
21.8 37.5 40.717.4 41.0 41.5
10.4 66.6 23.011.3 65.7 23.0
20.8 53.2 26.015.3 52.5 32.2
13.3 43.0 43.711.4 41.5 47.1
24.0 55.6 20.417.1 58.4 24.5
20.1 46.8 33.012.2 51.0 36.8
21.3 53.5 25.221.7 52.1 26.2
27.9 38.3 33.924.4 37.2 38.5
9.7 62.0 28.29.7 64.5 25.8
35.6 56.3 8.237.0 56.1 7.0
31.6 64.9 ≤5.032.7 64.9 ≤5.0
11.6 71.5 16.915.0 66.9 18.1
27.3 18.2 54.5≤5.0 16.7 83.3
18.2 18.2 63.610.0 10.0 80.0
16.7 50.0 33.3≤5.0 25.0 75.0
21.4 28.6 50.0≤5.0 21.4 78.6
21.4 28.6 50.0≤5.0 ≤5.0 ≥95.0
45.5 18.2 36.47.1 7.1 85.7
57.1 14.3 28.6≤5.0 30.8 69.2
36.4 27.3 36.4≤5.0 41.7 58.3
18.2 36.4 45.5≤5.0 30.0 70.0
33.3 41.7 25.08.3 33.3 58.3
28.6 42.9 28.614.3 50.0 35.7
21.4 71.4 7.1≤5.0 25.0 75.0
36.4 36.4 27.321.4 28.6 50.0
57.1 14.3 28.6≤5.0 46.2 53.8
8.3 66.7 25.0≤5.0 58.3 41.7
54.5 45.5 ≤5.021.4 71.4 7.1
64.3 21.4 14.338.5 46.2 15.4
William A. Diggs Elementary 0624
17.7 66.2 16.214.8 67.8 17.5
9.4 63.0 27.68.8 60.8 30.4
12.7 36.9 50.36.4 32.0 61.6
* * ** * *
* * ** * *
* * ** * *
* * ** * *
16.9 56.9 26.216.4 56.3 27.3
11.8 45.7 42.510.3 46.4 43.3
26.8 59.9 13.414.0 58.1 27.9
* * ** * *
* * ** * *
* * ** * *
* * ** * *
38.4 59.7 ≤5.028.7 67.3 ≤5.0
* * ** * *
* * ** * *
* * ** * *
* * ** * *
* * ** * *
* * ** * *
* * ** * *
* * ** * *
* * ** * *
* * ** * *
* * ** * *
* * ** * *
* * ** * *
* * ** * *
* * ** * *
* * ** * *
* * ** * *
* * ** * *
* * ** * *
2013 School Progress
All StudentsAmerican Indian or
Alaska NativeAsian
Black or African American
Hispanic/Latino of any raceNative Hawaiian or
Other Pacific Islander White
Two or more races
Free/Reduced Meals
Special Education
Limited English Proficient
Percent Proficient Participation RateReading Math Reading Math
Met Not Met Met Met
na na na na
Met Met na na
Met Not Met Met Met
Met Met na na
na na na na
Met Met Met Met
Met Met na na
Met Not Met Met Met
Met Not Met na na
Met Met na na
2013 School Progress Index SPI: 0.8593 Strand: 5 Values 1.0000 and above met the target.
Achievement Gap Red. GrowthElementary
Math 0.9084 0.6293 0.8519Reading 0.9763 0.8589 0.9041Science 0.9463 0.8581
Attendance Rate %School
2013School
2012County
2013County
2012State 2013
State 2012
Elementary ≥95.0 ≥95.0 ≥95.0 ≥95.0 95.5 95.9
Middle * * ≥95.0 ≥95.0 95.1 95.4
High * * 93.9 93.8 92.5 92.2Teacher Qualifications% of certificates:
Standard Professional 51.4 65.1 38.4 41.0 28.4 29.0
Advanced Professional 48.6 34.9 58.0 57.0 65.1 65.2
Resident Teacher 0.0 0.0 0.0 0.0 0.8 0.9
Conditional Teacher 0.0 0.0 0.9 1.1 0.9 0.9
% of classes NOT taught by:Highly Qualified Teachers 0.0 2.3 3.9 4.5 6.2 6.9

Basic % Proficient % Advanced %
MSA Proficiency LevelsApproximately 99% of Maryland students take MSA. The Basic Level is below the goal set for all students.
Alt-MSA Proficiency LevelsApproximately 1% of Maryland students take Alt-MSA. The Basic Level is below the goal set for all students.
Visit MdReportCard.org for up-to-date and disaggregated information. For definitions, see school system report pages.
Read
ing
Mat
hem
atic
sSc
ienc
e
17.4 60.5 22.115.0 64.4 20.6
11.8 58.4 29.810.2 55.6 34.2
11.6 31.8 56.610.1 34.9 55.1
15.9 40.6 43.515.5 42.7 41.8
15.0 36.9 48.118.8 35.5 45.7
19.0 34.9 46.119.2 36.6 44.2
17.0 55.3 27.816.9 54.9 28.2
17.8 53.3 28.912.2 49.0 38.7
11.2 42.1 46.710.1 38.6 51.2
19.1 55.5 25.314.7 54.8 30.5
22.9 48.0 29.117.0 47.6 35.5
27.4 49.3 23.323.7 49.5 26.9
33.0 36.4 30.630.7 36.2 33.1
15.8 53.4 30.816.1 53.1 30.8
33.0 56.4 10.631.5 57.5 11.1
28.6 64.6 6.729.3 63.3 7.4
17.4 60.7 21.918.3 59.6 22.1
13.4 26.3 60.37.2 18.5 74.3
10.2 22.1 67.78.7 16.8 74.5
12.6 26.5 60.96.5 16.2 77.3
10.3 25.9 63.87.2 17.6 75.2
7.9 24.8 67.36.1 13.1 80.7
11.2 25.5 63.38.1 15.2 76.7
20.9 22.8 56.310.7 15.3 74.0
19.2 36.8 44.110.9 30.7 58.5
15.5 36.8 47.79.9 30.0 60.1
19.7 40.9 39.49.5 33.7 56.8
17.2 36.1 46.79.8 30.9 59.3
14.3 33.9 51.88.7 31.2 60.1
15.5 36.4 48.19.9 36.8 53.3
23.8 31.0 45.214.0 31.8 54.2
22.7 44.2 33.115.5 37.2 47.3
22.3 40.4 37.316.8 42.6 40.6
33.3 34.3 32.421.7 41.4 36.9
“na” indicates too few students for School Progress rules. “*” indicates no students or fewer than 10 students in category. • E: English; • A: Algebra/Data Analysis; • B: Biology
3 20132012
4 20132012
5 20132012
6 20132012
7 20132012
8 20132012
10 20132012
3 20132012
4 20132012
5 20132012
6 20132012
7 20132012
8 20132012
10 20132012
5 20132012
8 20132012
10 20132012
3 20132012
4 20132012
5 20132012
6 20132012
7 20132012
8 20132012
•E 20132012
3 20132012
4 20132012
5 20132012
6 20132012
7 20132012
8 20132012
•A 20132012
5 20132012
8 20132012
•B 20132012
All Students Attendance Rate: Met
19.4 60.6 20.017.3 66.3 16.4
13.1 59.1 27.811.8 58.3 29.9
15.2 35.1 49.710.7 37.8 51.5
17.1 45.2 37.714.2 46.0 39.7
16.3 36.5 47.219.8 38.5 41.8
21.8 37.5 40.717.4 41.0 41.5
10.4 66.6 23.011.3 65.7 23.0
20.8 53.2 26.015.3 52.5 32.2
13.3 43.0 43.711.4 41.5 47.1
24.0 55.6 20.417.1 58.4 24.5
20.1 46.8 33.012.2 51.0 36.8
21.3 53.5 25.221.7 52.1 26.2
27.9 38.3 33.924.4 37.2 38.5
9.7 62.0 28.29.7 64.5 25.8
35.6 56.3 8.237.0 56.1 7.0
31.6 64.9 ≤5.032.7 64.9 ≤5.0
11.6 71.5 16.915.0 66.9 18.1
27.3 18.2 54.5≤5.0 16.7 83.3
18.2 18.2 63.610.0 10.0 80.0
16.7 50.0 33.3≤5.0 25.0 75.0
21.4 28.6 50.0≤5.0 21.4 78.6
21.4 28.6 50.0≤5.0 ≤5.0 ≥95.0
45.5 18.2 36.47.1 7.1 85.7
57.1 14.3 28.6≤5.0 30.8 69.2
36.4 27.3 36.4≤5.0 41.7 58.3
18.2 36.4 45.5≤5.0 30.0 70.0
33.3 41.7 25.08.3 33.3 58.3
28.6 42.9 28.614.3 50.0 35.7
21.4 71.4 7.1≤5.0 25.0 75.0
36.4 36.4 27.321.4 28.6 50.0
57.1 14.3 28.6≤5.0 46.2 53.8
8.3 66.7 25.0≤5.0 58.3 41.7
54.5 45.5 ≤5.021.4 71.4 7.1
64.3 21.4 14.338.5 46.2 15.4
William B. Wade Elementary School 0618
11.1 58.6 30.39.3 65.1 25.6
10.2 54.2 35.610.1 53.6 36.2
10.7 28.2 61.19.2 36.2 54.6
* * ** * *
* * ** * *
* * ** * *
* * ** * *
17.2 51.5 31.312.4 45.7 41.9
13.6 40.7 45.86.5 47.1 46.4
22.9 46.6 30.516.2 61.5 22.3
* * ** * *
* * ** * *
* * ** * *
* * ** * *
32.8 53.4 13.739.8 53.4 6.8
* * ** * *
* * ** * *
* * ** * *
* * ** * *
* * ** * *
* * ** * *
* * ** * *
* * ** * *
* * ** * *
* * ** * *
* * ** * *
* * ** * *
* * ** * *
* * ** * *
* * ** * *
* * ** * *
* * ** * *
* * ** * *
* * ** * *
2013 School Progress
All StudentsAmerican Indian or
Alaska NativeAsian
Black or African American
Hispanic/Latino of any raceNative Hawaiian or
Other Pacific Islander White
Two or more races
Free/Reduced Meals
Special Education
Limited English Proficient
Percent Proficient Participation RateReading Math Reading Math
Met Not Met Met Met
* * * *
Met Met na na
Met Not Met Met Met
Met Met na na
* * * *
Met Met Met Met
Met Met na na
Met Not Met Met Met
Not Met Met na na
na na na na
2013 School Progress Index SPI: 0.8721 Strand: 5 Values 1.0000 and above met the target.
Achievement Gap Red. GrowthElementary
Math 0.9286 0.7547 0.9457Reading 0.9957 0.8333 0.8747Science 0.8480 0.8252
Attendance Rate %School
2013School
2012County
2013County
2012State 2013
State 2012
Elementary ≥95.0 ≥95.0 ≥95.0 ≥95.0 95.5 95.9
Middle * * ≥95.0 ≥95.0 95.1 95.4
High * * 93.9 93.8 92.5 92.2Teacher Qualifications% of certificates:
Standard Professional 20.0 19.4 38.4 41.0 28.4 29.0
Advanced Professional 77.1 77.8 58.0 57.0 65.1 65.2
Resident Teacher 0.0 0.0 0.0 0.0 0.8 0.9
Conditional Teacher 2.9 0.0 0.9 1.1 0.9 0.9
% of classes NOT taught by:Highly Qualified Teachers 2.8 5.4 3.9 4.5 6.2 6.9

Visit MdReportCard.org for up-to-date and disaggregated information.
Allegany County (1)Cash Valley Elementary*Baltimore City (6)Wolfe Street Academy*John Eager Howard Elementary*Liberty Elementary*Mary Ann Winterling Elementary at Bentalou*Govans Elementary*New Song Academy*
Baltimore County (5)Chadwick Elementary*Lansdowne Elementary*Chase Elementary*Sandalwood Elementary**Milbrook Elementary**Dorchester (1) Hurlock Elementary**Garrett County (1)Crellin Elementary*
Kent County (1) Millington Elementary*Prince George’s County (1)Robert R. Gray Elementary**Worcester (2)Pocomoke Elementary*Snow Hill Elementary*
*Highest Performing Reward**Highest Progress Reward
Priority Schools (16)Priority Schools are 5 percent of all Title I schools that are the lowest achieving on MSA or Tier I or Tier II School Improvement 1003(g) Grant (SIG) schools. These schools have not reached adequate performance standards in reading and mathematics for the “all students” subgroup, not just for low-performing subgroup populations. Schools or local education agencies have the option to use one of the USDE approved “turnaround models” or they can develop their own measures to implement to improve the school. If a school chooses to use its own model it must address a number of turnaround principles including strong leadership, effective teachers and instruction, additional time for student learning, school instructional programs, a safe school environment, and family and community engagement.Priority Schools are identified every three years.
Focus Schools (41)
Focus Schools are 10 percent of all Title I schools having the largest gap between the “all students” subgroup and the lowest-performing subgroup or a Title I eligible high school with graduation rates 60 percent or lower. These schools are unique in that they do not require whole school reform measures, rather school interventions will focus on one or two subgroups that are low achieving and contribute to an increased achievement gap between other subgroups of students in the school. Focus schools will be expected to collect and analyze data to identify problematic areas of instruction and learning. This will allow schools and LEAs to address their identified areas of need through professional development, parental involvement, instructional teams, and the development of other specialized strategies that they deem necessary. These measures will be monitored by LEAs and MSDE to ensure that they effectively work to close the gaps between subgroups and all students within the school, thus improving the overall performance of the school. Focus Schools are identified every three years.
Baltimore City (10)Augusta Fells Savage Institute of Visual Arts HighBaltimore Civitas Middle/HighBaltimore IT Academy Middle/HighBenjamin Franklin @ Masonville Cove Middle/HighBooker T. Washington MiddleCalverton Elementary/Middle
Cherry Hill Elementary/MiddleCommodore John Rogers Elementary/MiddleFrederick Douglass HighSteuart Hill Academy Middle/High
Prince George’s County (6)Benjamin Stoddert MiddleDrew-Freeman MiddleG. James Gholson MiddleOxon Hill MiddleThomas Johnson MiddleThurgood Marshall Middle
Anne Arundel County (1)Georgetown East ElementaryBaltimore City (13)Dallas F. Nicholas Sr. ElementaryFrancis Scott Key Elementary/ MiddleGlenmont Elementary/MiddleGraceland Park/O’Donnell Heights ElementaryHampstead Hill AcademyHazelwood ElementaryHighlandtown Elementary Langston Hughes ElementaryMargaret Brent ElementaryMoravia Park Elementary/ MiddleNortheast Middle
Robert W. Coleman ElementarySouthwest Baltimore Charter Baltimore County (4)Featherbed Lane ElementaryRiverview ElementarySandy Plains ElementaryWinfield ElementaryCarroll County (1)Robert Moton ElementaryCharles County (3)C. Paul Barnhart ElementaryDr. Samuel A. Mudd ElementaryMt. Hope/Nanjemoy ElementaryDorchester County (1)Choptank Elementary
Harford County (1)William Paca/Old Post Rd ElementaryHoward County (4)Bryant Woods ElementaryGuilford ElementaryLaurel Woods ElementarySwansfield Elementary Kent County (1)Kent County MiddleMontgomery County (2)Brookhaven ElementaryKemp Mill ElementaryPrince George’s County (5)Andrew Jackson Academy
Carrollton ElementaryCharles Carroll MiddleGaywood ElementaryWilliam Wirt MiddleSt. Mary’s County (2)George Washington Carver ElementaryPark Hall ElementaryTalbot County (1)Easton ElementaryWashington County (1)Eastern ElementaryWicomico County (1)Prince Street Elementary
REWARD, PRIORITY, FOCUS SCHOOLSThe flexibility Maryland received in May 2012 from the U. S. Department of Education from some provisions of No Child Left Behind (NCLB), the most recent version of the federal government’s Elementary and Secondary Education Act (ESEA), does not retreat from Maryland’s long-standing work to improve schools through accountability. However, it does make some fundamental changes to the way the State implements accountability measures going forward. The NCLB continuum of sanctions known as the School Improvement Process and its measuring system, known as Adequate Yearly Progress (AYP), are no longer part of Maryland’s accountability system. As part of the new accountability system, Maryland has identified three groups of Title I schools (Reward, Priority, and Focus) to allow for the most specialized attention and support for each specific school and to focus on closing the achievement gaps within all schools.
Reward Schools (18)
• Reward Schools are recognized in two categories: Title I Highest Performing Reward Schools (Category 1) and Title I Highest Progress Reward Schools (Category 2). Reward Schools are identified annually and this year there are 18 schools statewide that meet the criteria for Reward Schools as defined in the ESEA Flexibility document. Maryland has 14 schools that have been identified as Highest Performing Reward Schools and 4 schools that have been identified as Highest Progress Reward Schools.
Category 1 Schools• Title I Highest Performing Reward Schools will have met the AMOs for “all students” and all subgroups for two consecutive years and have a 10 percent or less achievement gap
between “all students” and subgroups and the school is designated in Strand 1 or 2 for two consecutive years. For this school year, all 14 Category 1 schools are identified as Highest Performing Rewards Schools.
• Of the schools that are considered Highest Performing Reward Schools, those that are additionally in the top 10 percent of all Title I schools, indicating the maximum amount of improvement in student performance on MSA tests from 2009-2013, will be designated as Distinguished Highest Performing Reward Schools. No schools met the criteria for this school year.
• In addition, if a Highest Performing Reward School has improved its “all students” performance by at least 10 percentage points and the school is made up of 50 percent or more economically disadvantaged students, it will receive the title of a Superlative Highest Performing Reward School. No schools met the criteria for this school year.
Category 2 SchoolsHighest Progress Reward Schools are those Title I schools that have significantly reduced the gap in achievement between the subgroups from 2009-2013. These schools must have made at least 10 percentage point gain in the “all students” and have a 10 percent or less gap between the performance of “all students” and that of any other performing subgroup.