2013 retail trade analysis jackson county
TRANSCRIPT
EXTENSION CENTER FOR COMMUNITY VITALITY
2013 Retail Trade Analysis Jackson County
A TOOL USED TO MEASURE THE ECONOMIC HEALTH OF THE LOCAL RETAIL ECONOMY Authored by Bruce W. Schwartau, University of Minnesota Extension Educator
PROGRAM SPONSORS: CITY OF JACKSON & THE JACKSON BUSINESS DEVELOPMENT COMMITTEE

2013 Retail Trade Analysis 2
Report Reviewers: Sue Pirsig, Economic Development Coordinator, City of Jackson Neil Linscheid, University of Minnesota Extension Educator
Partners/Sponsors: City of Jackson Jackson Business Development Committee
2013 Retail Trade Analysis Jackson County A TOOL USED TO MEASURE THE ECONOMIC HEALTH OF THE LOCAL RETAIL ECONOMY
June 30, 2015
Authored by Bruce W. Schwartau, University of Minnesota Extension Educator
Editors: Rani Bhattacharyya, University of Minnesota Extension Educator
© 2015 Regents of the University of Minnesota. All rights reserved. University of Minnesota Extension is an equal opportunity educator and employer. In accordance with the Americans with Disabilities Act, this material is available in alternative formats upon request. Direct requests to the Extension Store at 800‐876‐8636.

© 2015 Regents of the University of Minnesota. All rights reserved. University of Minnesota Extension is an equal opportunity educator and employer. In accordance with the Americans with Disabilities Act, this material is available in alternative formats upon request. Direct requests to 612‐625‐8233.Printed on recycled and recyclable paper with at least 10 percent postconsumer waste material.
EXECUTIVE SUMMARY
Retail Trade Analysis for Jackson County, MN
STEADY SALES
The Minnesota Department of Revenue releases
sales tax information each spring for the year
that ended about 15 months earlier. The latest
information indicates that Jackson County’s
taxable retail and service sales increased over
12.4% between 2010 and 2013, reaching an
estimated total of $40.15 million.
The largest increase in dollar sales was in the
business category miscellaneous retail which
includes any retail business category that did not have four businesses. Leisure goods stores
had the largest measured sales growth percentage (83%) between 2010 and 2013 but it makes
up less than 1% of the county’s taxable sales. Note: The data in this summary are not adjusted
for inflation.
Comparisons with Other Area Counties There are several ways to measure
performance other than dollars of sales.
Economists expect cities of larger populations
to have more sales since their potential
customer base is larger. A way to compensate
for that in a retail trade analysis is to measure
the pull factor, which compares the local
taxable sales per capita to that of the state. A
pull factor index less than 1.0 indicates that
people generally spend less locally due to
lower prices, modest living, or traveling to
make purchases in other locations. In 2013,
Jackson County had a pull factor of 0.45. Per capita taxable sales in 2013 were estimated to be
$3,915 locally and $8,617 for Minnesota.
+$0.60
NA NA +$0.05+$0.15
NA
+$0.40
-$0.03
+$0.02 NA
+$1.13
+$0.14+$0.20
Dollar Changes by Category (in Millions)2010 - 2013
0.20
0.30
0.40
0.50
0.60
0.70
03 06 09 12
Pull Factors
Jackson County Cottonwood CountyFaribault County Martin CountyNobles County Rock County
Page 3

© 2015 Regents of the University of Minnesota. All rights reserved. University of Minnesota Extension is an equal opportunity educator and employer. In accordance with the Americans with Disabilities Act, this material is available in alternative formats upon request. Direct requests to 612‐625‐8233.Printed on recycled and recyclable paper with at least 10 percent postconsumer waste material.
Capturing the Potential Market The following table provides information on retail sales by merchandise category. "Potential sales"
is a standard to which actual performance is compared. In calculating potential sales, population
and income characteristics are taken into account. Potential sales can be used as a guideline or
"par value" in analyzing retail strength.
Deviations from these norms can be analyzed to first judge whether they should be considered
relevant. Categories with undesirable performance may be further examined for potential
corrective action. It is also important to determine whether or not the situation is relatively
uncontrollable due to external or extenuating circumstances. In cases of favorable differences
from expectations, the positive aspects should be identified and built upon.
Category Potential
Sales
(millions)
Actual
Sales
(millions)
Variance As
% of
Expected
Trade Area’s
Estimated Customer
Gain (or Loss)
Vehicles & Parts $4.77 $2.24 -53.0% - 5,436
Food, Groceries $6.61 $3.29 -50.2% - 5,156
Gasoline Stations $2.10 $5.18 +146.2% + 15,004
Eating & Drinking Places $15.28 $6.59 -56.9% - 5,840
Repair, Maintenance $2.60 $2.26 -12.9% - 1,326
Total Taxable Retail & Service $91.88 $40.15 -56.3% - 5,779
The Bottom Line
The pull factor for Jackson County has an upward trend since 2003. Retail taxable sales, adjusted
for inflation increased by almost $5 million between 2012 and 2013, however, the long term
trend has been very level since 1990.
Author: Bruce Schwartau, University of Minnesota Extension Educator, Community Economics
THE EXTENSION CENTER FOR COMMUNITY VITALITY makes a difference by engaging Minnesotans to strengthen the social, civic, economic and technological capacity of their communities. To read more, visit: www.extension.umn.edu/community
Page 4

YearEstimated Population
Gross Sales*
($millions)
Taxable Sales
($millions)
Gross Sales*
($millions)
Taxable Sales
($millions)Number of Firms
Per Capita Sales
Pull Factor
1990 11,677 $59.04 $21.07 $105.43 $37.62 317 $1,804 0.41
1995 11,686 $78.01 $22.68 $120.01 $34.89 257 $1,941 0.34
2000 11,268 $62.96 $24.06 $85.08 $32.51 275 $2,135 0.28
2003 11,170 $84.44 $25.47 $108.25 $32.66 285 $2,280 0.26
2004 11,234 $101.49 $28.66 $126.87 $35.83 294 $2,551 0.28
2005 11,182 $111.47 $31.48 $134.30 $37.92 278 $2,815 0.30
2006 11,150 $142.19 $32.85 $165.33 $38.20 276 $2,946 0.31
2007 10,883 $122.28 $34.76 $138.95 $39.50 283 $3,194 0.33
2008 10,734 $138.51 $35.43 $150.55 $38.51 274 $3,301 0.35
2009 10,786 $121.38 $32.85 $133.38 $36.10 270 $3,046 0.34
2010 10,270 $135.58 $35.73 $145.79 $38.42 269 $3,479 0.39
2011 10,203 $147.66 $37.99 $152.23 $39.16 269 $3,723 0.40
2012 10,279 $146.92 $34.92 $148.41 $35.28 252 $3,398 0.35
2013 10,265 $149.60 $40.15 $149.60 $40.15 277 $3,912 0.457 yr Change
'06 to '13 -7.9% 5.2% 22.2% -9.5% 5.1% 0.4% 32.8% 48.0%3 yr Change
'10 to '13 0.0% 10.3% 12.4% 2.6% 4.5% 3.0% 12.4% 17.7%
*Gross sales figures are self-reported by firms and not audited by the Dept. of Revenue for accuracy.
Jackson County Retail Trade OverviewTotal Taxable and Gross Retail Sales
The table below presents gross and taxable retail and services sales for Jackson County from 1990 through 2013. Taxable sales in Jackson County increased 22.2 percent from 2006 to 2013, while the number of firms fell 0.4 percent. Statewide, taxable sales increased 8.7 percent over the same time period and the number of firms increased 1.4 percent. The per capita sales and pull factor data in this table are based on taxable sales, the more verified sales measure.
The table also presents sales data in constant 2013 dollars. These figures have been adjusted for inflation to reflect their value 2013. For example, in 1990, taxable sales in Jackson County totaled $21.07 million, an amount worth $37.62 million in 2013 dollars. In constant dollars, gross sales fell 9.5 percent between 2006 and 2013. Constant dollar taxable sales increased 5.1 percent over the same time period.
Current Dollars Constant 2013 Dollars
$0
$20
$40
$60
$80
$100
$120
$140
$160
$180
$Millions
Year
Total Sales: Gross & Taxable
Constant $ Gross Sales Constant $ Taxable Sales
Jackson County: Retail/Service Sales in Constant Dollars
Page 5

Jackson CountySelected Components of Change*, 2010 to 2013
CategoryTaxable Sales
2010Taxable Sales
2013Dollar
ChangePercentChange
Vehicles & Parts $1,640,737 $2,242,587 +$601,850 +36.68%
Furniture Stores NA NA NA NA
Electronics NA NA NA NA
Building Materials $6,213,394 $6,266,614 +$53,220 +0.86%
Food, Groceries $3,135,100 $3,289,441 +$154,341 +4.92%
Health, Personal Stores $186,642 NA NA NA
Gas/Convenience Store $4,776,227 $5,178,054 +$401,827 +8.41%
Clothing $55,906 $30,082 -$25,824 -46.19%
Leisure Goods $18,521 $33,898 +$15,377 +83.02%
General Merchandise Stores NA NA NA NA
Miscellaneous Retail $3,689,404 $4,822,557 +$1,133,153 +30.71%
Accommodations $2,462,400 $2,598,925 +$136,525 +5.54%
Eating & Drinking Places $6,385,608 $6,587,644 +$202,036 +3.16%
Total Retail and Services Sales $35,732,792 $40,152,306 +$4,419,514 +12.37% * Figures not adjusted for inflation.
+$0.60
NA NA+$0.05
+$0.15
NA
+$0.40
-$0.03
+$0.02 NA
+$1.13
+$0.14+$0.20
Parts Furn. Elect. Bldg. Food Health C-Store Clothes Leis. GenMer. Misc. Accom. Eat
Dollar Changes by Category (in Millions)2010 - 2013
Page 6

NAICS Category Descriptions
Apparel: New clothing and accessories, jewelry, shoes, bridal shops, clock shops, and luggage stores.
Furniture: Stores that sell furniture, beds, carpeting, window coverings, lamps, china, kitchenware, & woodburning stoves.
Leisure Goods: Sporting goods, books, music, hobby stores, fabric shops, and toy stores.
*Caution should be used when comparing pull factors before 2003 to those in later years due to the switch from SIC to NAICS.
Health & Personal: Pharmacies, food supplements, vision supplies, cosmetics, & hearing aid stores.
Building Materials: Establishments that sell lumber, hardware, paint, wallpaper, tile, hardwood floors, roofing, fencing, ceiling fans, lawn equipment, and garden centers.
Electronics: Establishments primarily engaged in retailing household-type appliances, sewing machines, cameras, computers, and other electronic goods.
Pull Factors By Merchandise Category
The following tables and charts depict pull factors in Jackson County from 2003 to 2013* by merchandise category. Pull factors are a measure of trade area size that provide a useful measure of changes over time because they account for changes in population and state-wide industry trends.
Jackson County
Gas and Convenience Store: Retailers that sell fuel along with convenience store items.
Motor Vehicles & Parts: Establishments that sell new & used autos, boats, motorcycles, golf carts, RV's, campers, trailers, tires, and parts.
Food: Grocery stores, deli's, bakery, & butcher shops that sell food to be prepared at home. Liquor stores.
Vehicles& Parts
FurnitureElec-
tronicsBuildingMaterials
FoodHealth &Personal
Gas &Conven.
ClothingLeisureGoods
2003 0.37 0.04 0.30 0.73 0.48 1.23 0.07 0.12
2004 0.36 0.05 0.28 0.56 0.48 1.32 0.05 0.12
2005 0.36 0.45 0.57 0.40 1.43 0.03 0.12
2006 0.39 0.51 0.48 0.28 1.72 0.04 0.09
2007 0.37 0.05 0.61 0.45 0.33 2.00 0.03 0.11
2008 0.43 0.65 0.47 0.31 2.35 0.03 0.04
2009 0.39 0.70 0.48 0.18 2.04 0.02 0.03
2010 0.45 0.74 0.53 0.16 2.66 0.03 0.01
2011 0.46 0.72 0.52 2.61 0.02 0.01
2012 0.41 0.68 0.50 2.39 0.02 0.01
2013 0.49 0.64 0.52 2.56 0.02 0.01
0.00
0.50
1.00
1.50
2.00
2.50
3.00
Pu
ll F
ac
tors
Pull Factors by NAICS Merchandise Category (1 of 2)
Page 7

NAICS Category Descriptions
Recent Trends By Merchandise CategoryJackson County
The following tables and charts depict pull factors in Jackson County from 2003 to 2013* by merchandise category. Pull factors are a measure of trade area size that provide a useful measure of changes over time because they account for changes in population and state-wide industry trends.
General Merchandise: Establishments that sell a mixed line of goods. Examples are department stores, supercenters, and dollar stores. Miscellaneous Store Retailers: Stores not covered in other categories such as florists, office supplies, pets, antiques, tobacco, art, used merchandise, and trophies.
Non-Store Retail: Retailers that do not use stores. This includes mail order, internet selling, bazaars, vending machines, fuel oil dealers, firewood dealers, door-to-door sales, and produce stands.Amusement: Establishments such as golf courses, bowling lanes, marinas, amusement parks, water parks, shooting ranges, pool halls, horseback riding, ballrooms, health club facilities, ski hills, and casinos.
*Caution should be used when comparing pull factors before 2003 to those in later years due to the switch from SIC to NAICS.
Lodging: Seasonal resorts, hotels, boarding houses, bed & breakfast, campgrounds, and RV parks.
Eating & Drinking: Restaurants, donut shops, coffee house, cafeteria, caterers, taverns, and nightclubs, Repair: Businesses that return equipment to working order. Examples: cars, lawnmowers, small engines, knives, shoes, computers, furniture, and appliances.Personal Services: Barbers, beauty salons, tanning facilities, funeral homes, laundromats, dry cleaners, pet groomers, and kennels.
Gen.Merch.
Misc. StoreNon-Store
RetailAmuse-
mentLodging
Eating &Drinking
RepairPersonalServices
2003 0.46 0.01 0.24 0.66 0.41 0.81 0.14
2004 0.72 0.03 0.17 0.59 0.42 0.78 0.15
2005 0.76 0.10 0.24 0.56 0.42 0.83 0.18
2006 1.03 0.10 0.15 0.49 0.44 0.90 0.16
2007 1.04 0.09 0.20 0.56 0.45 0.91 0.15
2008 1.34 0.07 0.17 0.61 0.42 1.01 0.09
2009 1.15 0.14 0.16 0.58 0.43 1.01 0.12
2010 1.21 0.03 0.18 0.79 0.49 1.03 0.13
2011 1.42 0.02 0.17 0.77 0.48 1.11 0.12
2012 1.42 0.02 0.19 0.72 0.44 1.01 0.12
2013 1.62 0.22 0.20 0.72 0.45 0.90 0.14
0.000.200.400.600.801.001.201.401.601.80
Pu
ll F
ac
tors
Pull Factors by NAICS Merchandise Category (2 of 2)
Page 8
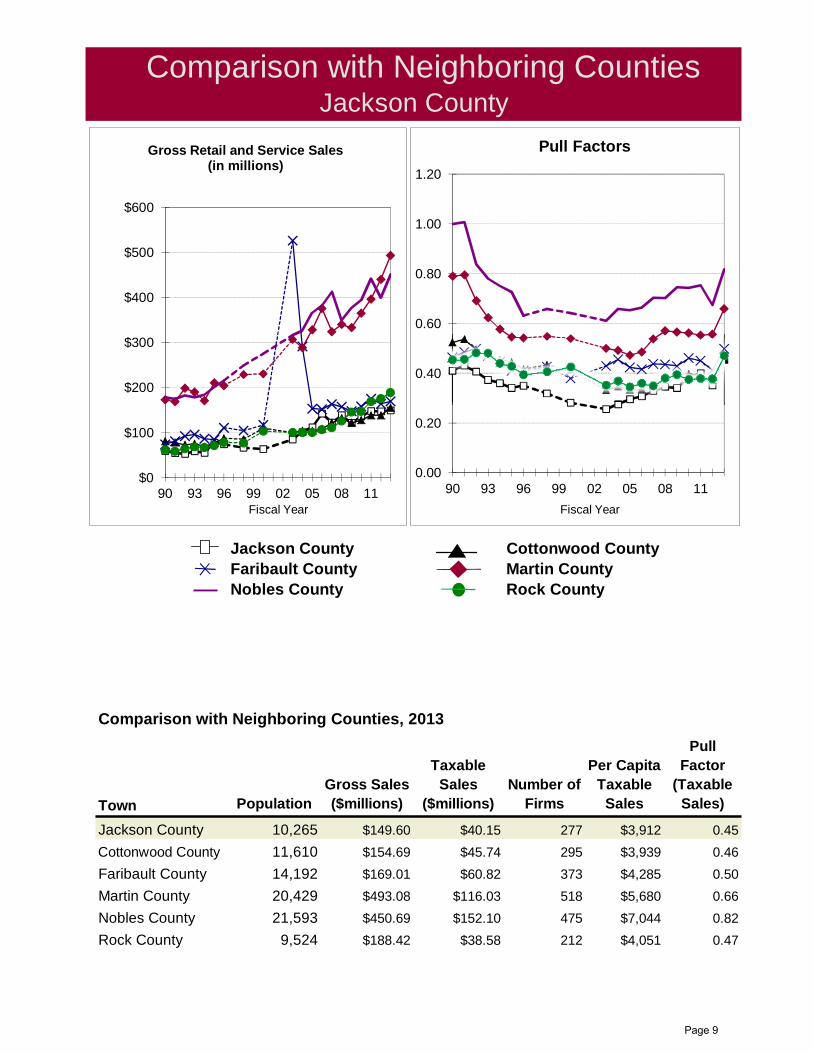
Jackson County Cottonwood CountyFaribault County Martin CountyNobles County Rock County
Comparison with Neighboring Counties, 2013
PopulationGross Sales ($millions)
Taxable Sales
($millions)Number of
Firms
Per Capita Taxable
Sales
Pull Factor
(Taxable Sales)
10,265 $149.60 $40.15 277 $3,912 0.45
11,610 $154.69 $45.74 295 $3,939 0.46
14,192 $169.01 $60.82 373 $4,285 0.50
20,429 $493.08 $116.03 518 $5,680 0.66
21,593 $450.69 $152.10 475 $7,044 0.82
9,524 $188.42 $38.58 212 $4,051 0.47
Jackson County
Nobles County
Rock County
Comparison with Neighboring Counties
Faribault County
Cottonwood County
Martin County
Town
Jackson County
$0
$100
$200
$300
$400
$500
$600
90 93 96 99 02 05 08 11Fiscal Year
Gross Retail and Service Sales(in millions)
0.00
0.20
0.40
0.60
0.80
1.00
1.20
90 93 96 99 02 05 08 11
Fiscal Year
Pull Factors
Page 9
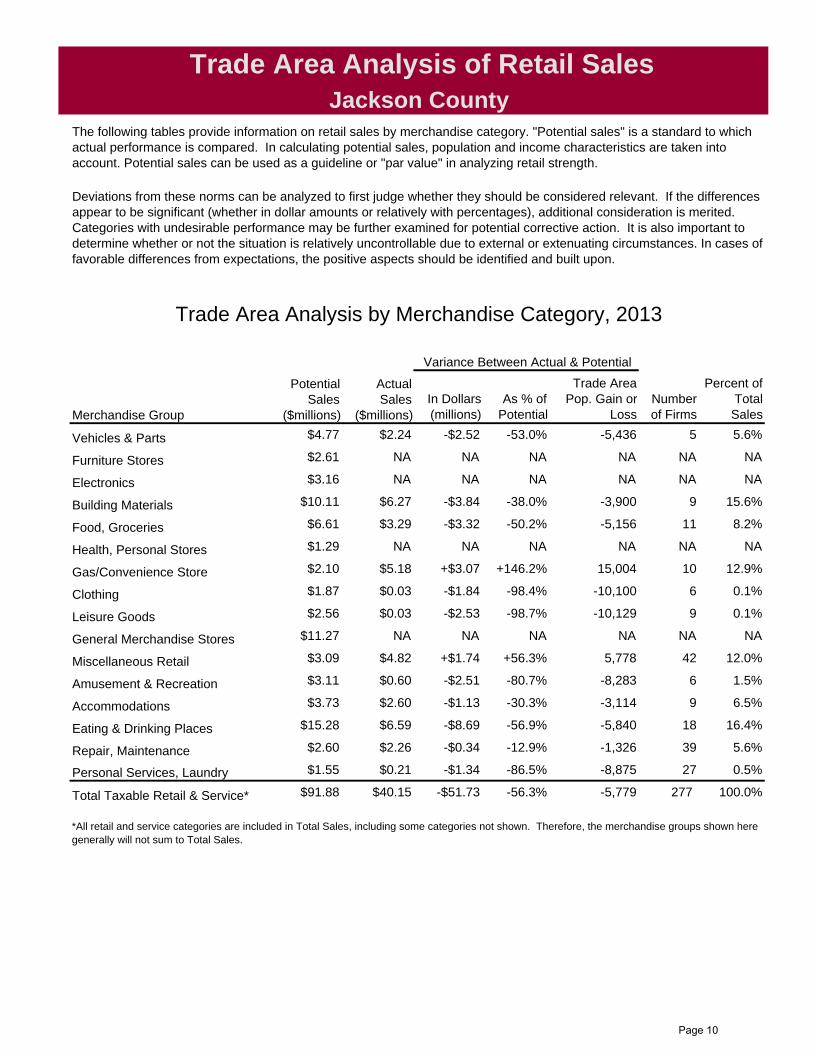
In Dollars(millions)
As % of Potential
Trade Area Pop. Gain or
LossNumberof Firms
Percent of Total Sales
$4.77 $2.24 -$2.52 -53.0% -5,436 5 5.6%
$2.61 NA NA NA NA NA NA
$3.16 NA NA NA NA NA NA
$10.11 $6.27 -$3.84 -38.0% -3,900 9 15.6%
$6.61 $3.29 -$3.32 -50.2% -5,156 11 8.2%
$1.29 NA NA NA NA NA NA
$2.10 $5.18 +$3.07 +146.2% 15,004 10 12.9%
$1.87 $0.03 -$1.84 -98.4% -10,100 6 0.1%
$2.56 $0.03 -$2.53 -98.7% -10,129 9 0.1%
$11.27 NA NA NA NA NA NA
$3.09 $4.82 +$1.74 +56.3% 5,778 42 12.0%
$3.11 $0.60 -$2.51 -80.7% -8,283 6 1.5%
$3.73 $2.60 -$1.13 -30.3% -3,114 9 6.5%
$15.28 $6.59 -$8.69 -56.9% -5,840 18 16.4%
$2.60 $2.26 -$0.34 -12.9% -1,326 39 5.6%
$1.55 $0.21 -$1.34 -86.5% -8,875 27 0.5%
$91.88 $40.15 -$51.73 -56.3% -5,779 277 100.0%
Vehicles & Parts
Furniture Stores
Electronics
Building Materials
Food, Groceries
Health, Personal Stores
Clothing
*All retail and service categories are included in Total Sales, including some categories not shown. Therefore, the merchandise groups shown here generally will not sum to Total Sales.
Personal Services, Laundry
Total Taxable Retail & Service*
Accommodations
Eating & Drinking Places
Repair, Maintenance
Leisure Goods
General Merchandise Stores
Miscellaneous Retail
Trade Area Analysis of Retail SalesJackson County
Trade Area Analysis by Merchandise Category, 2013
PotentialSales
($millions)
ActualSales
($millions)
Variance Between Actual & Potential
The following tables provide information on retail sales by merchandise category. "Potential sales" is a standard to which actual performance is compared. In calculating potential sales, population and income characteristics are taken into account. Potential sales can be used as a guideline or "par value" in analyzing retail strength.
Deviations from these norms can be analyzed to first judge whether they should be considered relevant. If the differences appear to be significant (whether in dollar amounts or relatively with percentages), additional consideration is merited. Categories with undesirable performance may be further examined for potential corrective action. It is also important to determine whether or not the situation is relatively uncontrollable due to external or extenuating circumstances. In cases of favorable differences from expectations, the positive aspects should be identified and built upon.
Merchandise Group
Gas/Convenience Store
Amusement & Recreation
Page 10

Jackson County Retail Trade Performance in Percentages
The chart below depicts the percentage amount Jackson County's actual sales were above or below potential sales in 2013 by merchandise group. Of the 12 merchandise categories with reported data, sales in 2 of the categories were above what would be expected based on the county's population and income characteristics as well as statewide spending patterns. The strongest merchandise group by this standard is the Gasoline Stations category, which has a 146.2 percent surplus. Overall, Jackson County had a retail sales leakage of 56.3 percent.
It is important to note that variations in a county's relative retail performance may occur for a variety of reasons, some of which are beyond the control of local policy. Proximity to larger population centers and transportation patterns, as well as the individual retailer's management and marketing, can cause the retail sales of a particular county to deviate substantially from potential sales. It is important that decision-makers consider these influences when constructing policies, plans, or projects.
-53.0%
NA
NA
-38.0%
-50.2%
NA
+146.2%
-98.4%
-98.7%
NA
+56.3%
-80.7%
-30.3%
-56.9%
-12.9%
-86.5%
-56.3%
-150% -100% -50% 0% 50% 100% 150% 200%
Vehicles & Parts
Furniture Stores
Electronics
Building Materials
Food, Groceries
Health, Personal Stores
Gas/Convenience Store
Clothing
Leisure Goods
General Merchandise Stores
Miscellaneous Retail
Amusement & Recreation
Accommodations
Eating & Drinking Places
Repair, Maintenance
Personal Services, Laundry
Total Taxable Retail & Service*
Percentage Above or Below Potential Sales, 2013
Page 11

Jackson County Retail Trade Performance in Dollars
The chart below depicts the dollar amount Jackson County's actual sales were above or below potential sales in 2013 by merchandise group. Of the 12 merchandise categories with reported data, sales in 2 of the categories were above the calculated potential. The strongest merchandise group by this standard is the Gasoline Stations category, which has a $3.1 million surplus. Overall, Jackson County had a retail sales leakage of $51.7 million in 2013.
It is important to note that variations in a county's relative retail performance may occur for a variety of reasons, some of which are beyond the control of local policy. Proximity to larger population centers, management, marketing, and transportation patterns are just a few factors that can cause the retail sales of a particular county to deviate substantially from potential sales. It is important that decision-makers consider these influences when constructing policies, plans, or projects.
-$2.52
+$0.00
+$0.00
-$3.84
-$3.32
+$0.00
+$3.07
-$1.84
-$2.53
+$0.00
+$1.74
-$2.51
-$1.13
-$8.69
-$0.34
-$1.34
-$10 -$8 -$6 -$4 -$2 $0 $2 $4
Vehicles & Parts
Furniture Stores
Electronics
Building Materials
Food, Groceries
Health, Personal Stores
Gas/Convenience Store
Clothing
Leisure Goods
General Merchandise Stores
Miscellaneous Retail
Amusement & Recreation
Accommodations
Eating & Drinking Places
Repair, Maintenance
Personal Services, Laundry
Millions of $ Above or Below Potential Sales, 2013
Page 12
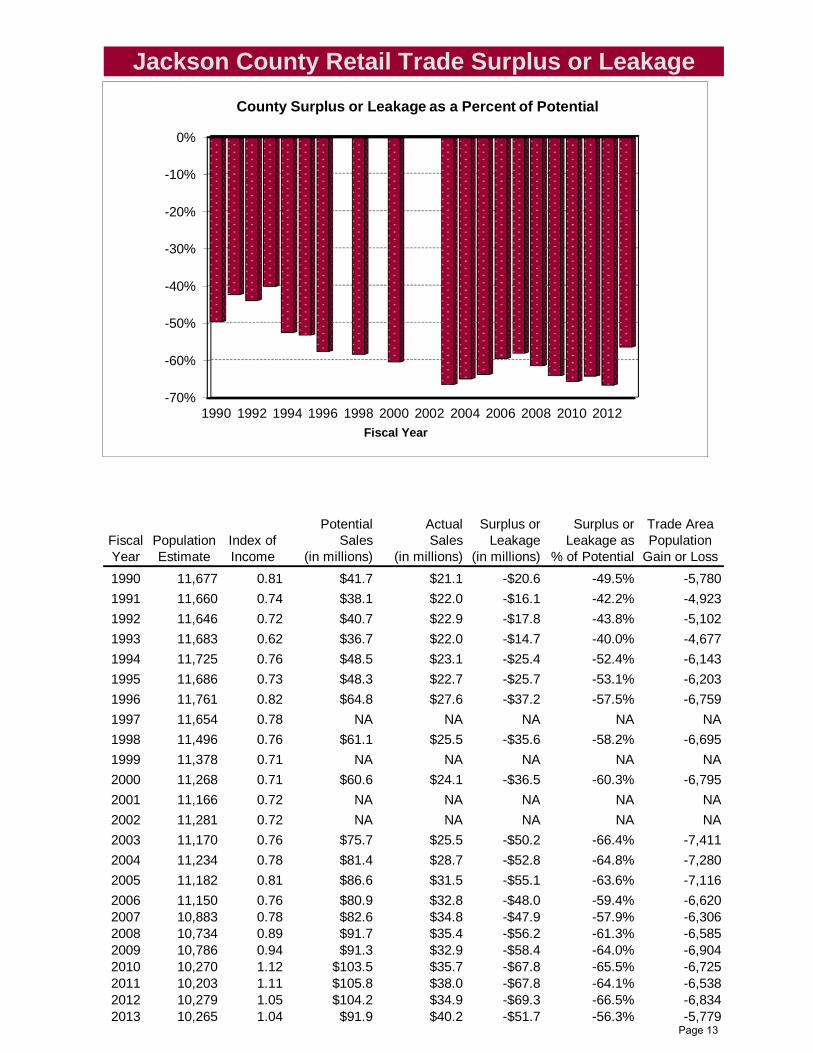
Jackson County Retail Trade Surplus or Leakage
Fiscal Year
Population Estimate
Index of Income
PotentialSales
(in millions)
ActualSales
(in millions)
Surplus or Leakage
(in millions)
Surplus orLeakage as
% of Potential
Trade Area Population
Gain or Loss
1990 11,677 0.81 $41.7 $21.1 -$20.6 -49.5% -5,780
1991 11,660 0.74 $38.1 $22.0 -$16.1 -42.2% -4,923
1992 11,646 0.72 $40.7 $22.9 -$17.8 -43.8% -5,102
1993 11,683 0.62 $36.7 $22.0 -$14.7 -40.0% -4,677
1994 11,725 0.76 $48.5 $23.1 -$25.4 -52.4% -6,143
1995 11,686 0.73 $48.3 $22.7 -$25.7 -53.1% -6,203
1996 11,761 0.82 $64.8 $27.6 -$37.2 -57.5% -6,759
1997 11,654 0.78 NA NA NA NA NA
1998 11,496 0.76 $61.1 $25.5 -$35.6 -58.2% -6,695
1999 11,378 0.71 NA NA NA NA NA
2000 11,268 0.71 $60.6 $24.1 -$36.5 -60.3% -6,795
2001 11,166 0.72 NA NA NA NA NA
2002 11,281 0.72 NA NA NA NA NA
2003 11,170 0.76 $75.7 $25.5 -$50.2 -66.4% -7,411
2004 11,234 0.78 $81.4 $28.7 -$52.8 -64.8% -7,280
2005 11,182 0.81 $86.6 $31.5 -$55.1 -63.6% -7,116
2006 11,150 0.76 $80.9 $32.8 -$48.0 -59.4% -6,6202007 10,883 0.78 $82.6 $34.8 -$47.9 -57.9% -6,3062008 10,734 0.89 $91.7 $35.4 -$56.2 -61.3% -6,5852009 10,786 0.94 $91.3 $32.9 -$58.4 -64.0% -6,9042010 10,270 1.12 $103.5 $35.7 -$67.8 -65.5% -6,7252011 10,203 1.11 $105.8 $38.0 -$67.8 -64.1% -6,5382012 10,279 1.05 $104.2 $34.9 -$69.3 -66.5% -6,8342013 10,265 1.04 $91.9 $40.2 -$51.7 -56.3% -5,779
-70%
-60%
-50%
-40%
-30%
-20%
-10%
0%
1990 1992 1994 1996 1998 2000 2002 2004 2006 2008 2010 2012
Fiscal Year
County Surplus or Leakage as a Percent of Potential
Page 13

NAICS State Non-Metro State Non-Metro Jackson Co.
RETAIL TRADE441 Vehicles, Parts 1,970 1,421 $447.06 $448.88 218.47$ 442 Furniture Stores 3,018 2,889 $244.64 $166.36443 Electronics 3,915 4,011 $296.62 $185.89444 Building Materials 2,687 1,801 $947.91 $1,029.43 $610.48445 Food and Beverage Stores 1,567 1,383 $619.84 $514.84 $320.45446 Health, Personal Stores 3,304 3,484 $121.18 $78.90447 Gas/Conveniene Stores 2,634 1,941 $197.28 $238.05 $504.44448 Clothing & Accessory Stores 1,573 1,788 $175.11 $87.18 $2.93451 Leisure Goods 1,470 1,307 $240.57 $173.38 $3.30452 General Merchandise 4,939 3,655 $1,056.87 $1,119.90453 Miscellaneous Merchandise 480 407 $289.40 $209.26 $469.81454 Non-store Retail 973 930 $98.26 $91.02 $21.26
Retail Total $4,734.73 $4,343.10 $2,151.14
INFORMATION511 Publishing Industry 10,520 13,335 $3.88 $1.41512 Movie & Recording Industry 11,907 21,452 $32.92 $21.12515 Broadcasting 45,149 30,085 $12.07 $7.55516 Info -Internet Publ/Brcst 235,558 205,579 $0.02 $0.00517 Telecommunications 9,472 8,906 $351.37 $241.20518 Internet Service 12,341 23,721 $15.96 $1.48519 Other Information Services 4,907 5,129 $96.02 $39.98
FINANCE AND INSURANCE522 Credit Intermediation 8,400 6,632 $27.47 $6.96523 Securities, Commodities 22,114 41,813 $2.07 $0.53524 Insurance Carriers 10,967 15,614 $1.05 $0.78525 Funds, Trusts 180,595 189,766 $0.42 $0.60
REAL ESTATE AND RENTAL AND LEASING531 Real Estate 2,850 3,644 $33.11 $26.23532 Rental, Leasing Services 3,706 3,534 $152.45 $59.97533 Lessors Nonfinancial Assets 416,757 308,369 $0.42 $0.77
PROFESSIONAL, SCIENTIFIC, AND TECHNICAL SERVICES541 Prof, Scientific, Technical Services 492 736 $169.71 $73.98551 Mgmt Of Companies 26,821 50,346 $29.88 $4.55
ADMINISTRATIVE & SUPPORT; WASTE MGMT & REMEDIATION SVCS561 Admin, Support Services 568 594 $263.07 $132.24562 Waste Mgmt, Remediation 13,647 9,599 $1.59 $1.27
EDUCATIONAL SVCS; HEALTH & SOCIAL ASSISTANCE611 Educational Services 4,463 4,726 $17.11 $16.02621 Health -Ambulatory Care 1,090 1,342 $15.78 $10.37622 Health -Hospitals 36,361 24,919 $14.70 $14.54623 Health -Nursing,Residential Care 11,454 8,626 $2.59 $2.70624 Health -Social Assistance 12,369 12,523 $3.13 $4.20
ARTS, ENTERTAINMENT & RECREATION711 Performing Art, Spectator Sports 2,519 2,926 $65.12 $11.70712 Museums, Historical Sites 30,959 20,558 $3.91 $1.34713 Amusement, Gambling, Recr 2,378 1,906 $291.38 $137.81 $58.45
ACCOMMODATION & FOOD SERVICES721 Accommodation 2,146 1,193 $349.88 $335.54 $253.18722 Food Services, Drinking Places 483 461 $1,433.26 $1,071.90 $641.76
OTHER SERVICES811 Repair, Maintenance 624 448 $243.40 $255.44 $220.15812 Personal, Laundry Service 632 552 $145.10 $51.75 $20.40813 Religious, Civic, Professional Orgs 2,634 2,138 $32.37 $36.28814 Private Households 83,351 102,790 $0.17 $0.12921 Exec., Legisla., Other Govt 7,341 4,275 $71.22 $72.18
TOTAL RETAIL AND SERVICES $8,617.31 $7,104.90
State of Minnesota Per Capita Taxable Retail Sales &Threshold Levels for Selected Goods and Services
2013
Business Activity / Store Type People Per Business Sales Per Capita
Threshold level refers to the number of people per business, which can be used as a general guide for determining the "critical mass" necessary to support a business. These are broad averages for the state as a whole and do not reflect differences in income, tourism, agglomeration, establishment, etc. Further, the business counts are based on the number of sales tax returns filed and are converted to "full-time equivalents." Multiplying people per business by sales per capita yields average sales per firm. In addition to state averages, averages for the non-metropolitan regions were calculated by excluding the seven county Minneapolis-St. Paul metropolitan region.
Page 14
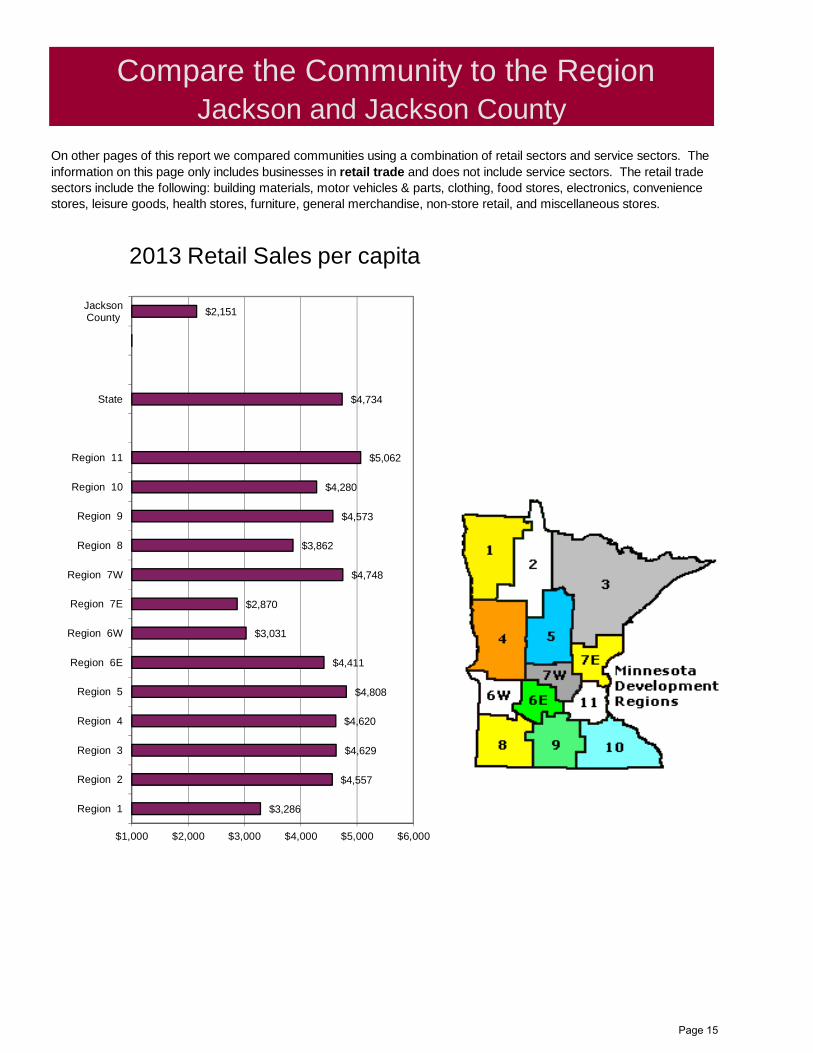
Region 1 3,286$
Region 2 4,557$
Region 3 4,629$
Region 4 4,620$
Region 5 4,808$
Region 6E 4,411$
Region 6W 3,031$
Region 7E 2,870$
Region 7W 4,748$
Region 8 3,862$
Region 9 4,573$
Region 10 4,280$
Region 11 5,062$
State 4,734$
Jackson -
Jackson County 2,151
Retail Sales Per Capita
Compare the Community to the RegionJackson and Jackson County
On other pages of this report we compared communities using a combination of retail sectors and service sectors. The information on this page only includes businesses in retail trade and does not include service sectors. The retail trade sectors include the following: building materials, motor vehicles & parts, clothing, food stores, electronics, convenience stores, leisure goods, health stores, furniture, general merchandise, non-store retail, and miscellaneous stores.
$3,286
$4,557
$4,629
$4,620
$4,808
$4,411
$3,031
$2,870
$4,748
$3,862
$4,573
$4,280
$5,062
$4,734
$2,151
$1,000 $2,000 $3,000 $4,000 $5,000 $6,000
Region 1
Region 2
Region 3
Region 4
Region 5
Region 6E
Region 6W
Region 7E
Region 7W
Region 8
Region 9
Region 10
Region 11
State
JacksonCounty
2013 Retail Sales per capita
Page 15

‐100
100
300
500
700
900
1100
1300
1500
2003 2004 2005 2006 2007 2008 2009 2010 2011 2012 2013
Minnesota Taxable Sales per Capita, 2003 to 2013Selected Categories
Adjusted for Inflation
Gen. Merchandise
Building Materials
Food
Vehicles & Parts
Misc. Store
Electronics
Furniture
Leisure Goods
Gas/Convenience
Clothing
Health & Personal
Page 16

Retail Trade Analysis Definitions page 1
Data Sources and Definitions
The University of Minnesota Extension has developed this retail trade analysis program to assist in the economic development of Minnesota towns and cities. These reports are available for all Minnesota counties, for most cities above 5,000 populations and for a few cities smaller than 5,000 population. The retail sector of each jurisdiction can be evaluated by comparing its trends to those of other similar jurisdictions. Business people and economic development officials can use measures such as pull factors and leakages to determine the need and feasibility of new retail businesses.
DATA SOURCES
Most of the data in the analysis are based on annual reports of Minnesota retail and use tax, published by the Minnesota Department of Revenue. The Department of Revenue published an annual report of sales and use tax by jurisdiction until 1996, at which time the reports were released biannually due to budget constraints. This analysis uses the available reports from 1990-1996, 1998, 2000, and 2003 through 2013. The reports interpolate data for the years in which data are not available. See http://www.revenue.state.mn.us/research_stats/Pages/Sales-and-Use-Tax-Statistics-and-Annual-Reports.aspx . The income data in this report are obtained from reports by Bureau of Economic Analysis (BEA). (See http://www.bea.gov/iTable/index_regional.cfm) Population data after 2009 are derived from the state demographic center. (See http://mn.gov/admin/demography/data-by-topic/population-data/our-estimates/index.jsp )
Sales and use tax permit holders file returns and remit taxes on a monthly, quarterly or annual basis. Large businesses such as discount department stores whose tax is more than $500 per month are required to file on a monthly basis, while medium-sized businesses whose sales tax collections are less than $500 per month, are required to file on a quarterly basis and small businesses with sales tax collections less than $100 per month would most likely file on an annual basis.
DEFINITION OF TERMS
Gross Sales
Gross sales include taxable sales and exempt sales for businesses holding sales and use tax permits. This is the most inclusive indicator of business activity for the reporting jurisdictions but it can be misleading when used in comparisons. At times commodity items (like gasoline) that are not taxable can have large price variations, creating huge swings in gross sales.
Taxable Sales
Taxable sales are the amount of sales subject to sales tax. Taxable sales exclude exempt items, items sold for resale, items sold for exempt purposes and items sold to exempt organizations. For more information on what is taxed in Minnesota, see "Minnesota Sales and Use Tax Instruction Booklet" available on the web at http://www.revenue.state.mn.us/Forms_and_Instructions/sales_tax_booklet.pdf .
Retail Trade Analysis Definitions page 2
Current and Constant Dollar Sales
Current dollar (or "nominal dollar") sales are sales as reported by the state. No adjustment has been made for price inflation. In general this measure of sales is not satisfactory for comparisons over long periods of time since it does not account for changes in population, inflation, or the state's economy. Constant dollar (or "real dollar") sales reflect changes in price inflation by adjusting current dollar sales with the Consumer Price Index (CPI). Constant dollar sales indicate the real sales level with respect to a base year. This is a more realistic method of evaluating sales over time than current dollar comparisons, but still does not take into consideration changes in population or changes in the state's economy.
Number of Businesses
The number of sales and use tax permit holders who filed one or more tax returns for the year are reported as the number of businesses.
Reporting Period
The reporting periods though 2005 in this report are calendar years. For example, the sales reported for the year 2000 are for the period, January 1, 2000 to December 31, 2000. The Sales and Use Tax Statistics reports for 2006 and 2007 use a slightly different methodology than in previous years. Rather than basing the report on the year in which sales were made (as was true in earlier reports), the 2006 and 2007 reports were based on when returns were processed. Starting in 2008, the reports are again based on the calendar year when the sales occurred.
Per Capita Sales
Per capita (or “per person”) sales are calculated by dividing current dollar sales by the population estimate. In areas where population is subject to substantial change, this is a more satisfactory measure of sales activity than sales alone. However, it still does not reflect changes in the state economy.
Number of Businesses
The number of sales and use tax permit holders who filed one or more tax returns for the year are reported as the number of businesses.
Pull Factor
The pull factor was developed by Dr. Ken Stone, an economist from Iowa State University Extension Service, to provide a precise measure of sales activity in a locality. It is derived by dividing the per capita current dollar sales of a city or county by the per capita sales for the state. For example, if a city's per capita sales are $20,000 per year and the state per capita sales are $10,000 per year, the pull factor is 2.0 ($20,000 ÷ $10,000). The interpretation is that the city is selling to 200 percent of the city population. Worth noting that local consumption patterns or local average prices may skew pull factors. As example, a city may not have enough people willing to buy $35 steak dinners to support restaurants that typically carry expensive selections.
Pull factors are good measures of sales activity because they reflect changes in population, inflation, and the state economy. Pull factors are available through the University of Minnesota Extension for total taxable sales for all cities with reported sales (generally, cities with a population of 5,000 or more) since 1990. The pull factors listed in this report are not adjusted for differing income levels in different communities; they are simply the ratio of local per person sales to the state average.
Income levels are accounted for in the expected sales and potential sales formulas, described below.
Retail Trade Analysis Definitions page 3
Typical Pull Factor
The typical pull factor is a pull factor that represents the “norm” for cities within a population group. It is an average for cities within a population group excluding some of the outliers in the group.
Personal Income
Personal income is defined as the income received by, or on behalf of, all the residents of the county (state) from all sources. Personal income is the estimated sum of wage and salary earnings, supplements to wages and salaries (e.g.. contributions to retirement funds, health plans, life insurance policies), proprietors' income, rental income, personal dividend income, personal interest income, and personal current transfer receipts to persons (e.g. receipts of Social Security, disability, worker's compensation, Medicare/Medicaid, food stamps, etc.) less contributions for government social insurance (e.g. Social Security, Medicare).
Index of Income
This index provides a measure of income, relative to the state, which is calculated by dividing local per capita income by state per capita income. The base is 1.00. For example, an index of income of
1.20 indicates that per capita income in the area is 20 percent above the state average.
Expected Sales
Expected sales are a retail performance benchmark. It is an estimate of the sales level a city would achieve if it were performing on par with Minnesota cities of a similar size. In addition to population and income variables, expected sales incorporate the typical strength of comparable communities via the typical pull factor. Expected sales are the product of city population, state per capita sales, the index of income and the typical pull factor. For example, if a city has a population of 5,000, the state per capita sales are $9,000, the typical pull factor is 1.30, and the index of income is 1.03, expected sales are approximately $60 million per year (5,000 x $9,000 x 1.30 x 1.03). This provides a means of comparing what is expected for a city of a certain size to what is actually happening.
Potential Sales
Potential sales are an estimate of the amount of money that is spent on retail goods and services by residents of a county. It is the product of county population, state per capita sales and the index of income. The potential sales concept for counties is similar to the expected sales calculations for cities. However, potential sales do not utilize a measure of average pulling power (like the typical pull factor that is used in the expected sales equation). Since a county is a relatively large region within which retail business takes place, counties are compared without adjustments for trade area size.
Variance between Actual and Expected Sales (Surplus or Leakage)
The variance between actual and expected sales is how much retail sales differ from the “norm” (i.e., the amount above or below the standard established by the expected sales formula). When actual sales exceed expected sales, we say the city has a "surplus" of retail sales. When actual sales fall short of expected sales, we say the city has a retail sales "leakage". The set of similarly-sized cities in Minnesota is the peer group to which the comparison is being made. Discrepancies between expected and actual sales occur for a variety of reasons.

Retail Trade Analysis Definitions page 4
Trade Area Population Gain or Loss
The trade area population gain or loss translates the percentage amount of surplus or leakage of retail sales into an estimate of the number of customers gained or lost in the trade area. It is calculated by multiplying the percent surplus or leakage by the population estimate for the city or county. For example, if a city with 10,000 residents had a retail sales surplus of 20%, the trade area population gain would be 2,000. Adding this number to the city's population gives an estimate of the population size of the city's trade area.
Calculating Expected Sales Using Comparisons with Other Rural Cities
Beginning in the middle of 2013, Retail Trade Analysis reports for cities outside of the 7-county Twin Cities area contained new Rural Community Trade Area Analysis pages. The earlier paragraph of how Expected Sales are calculated explained that a typical pull factor of similar-sized cities was used in the formula. These new pages for rural communities only use similar cities that meet the following three criteria: 1) within approximately 30% of similar population; 2) located outside of the 7-county metro area; 3) have a similar location on the trade-center hierarchy scale. Cities with a similar trade center hierarchy have a history of similar total taxable retail and service sales. This method will keep the pull factors from metro cities like Mendota Heights and Little Canada being used in calculations for rural cities like Fairmont and Grand Rapids. More information on trade center hierarchy can be found in the article Trade-Center Hierarchy in Greater Minnesota authored by Craig and Schwartau at http://www.cura.umn.edu/publications/catalog/reporter-41-3-4-2. This article noted there was little relative movement in any one city’s hierarchy ranking with just a few exceptions where dramatic economic changes occurred. CAUTIONS
Gross Sales
Gross sales are a comprehensive measure of business activity, but readers should be aware that the numbers in this report are self-reported by holders of sales and use tax reports. Furthermore, the gross sales are not audited by the State of Minnesota. It is believed that the gross sales figures are generally reliable, but there is the possibility of distortions, especially in smaller cities where misreporting may have occurred.
Misclassification
Holders of sales and use tax permits select the North American Industry Classification System (NAICS) category that best fits their business. Regardless of who makes this classification, errors are occasionally made. Also, sometimes a business will start out as one type of business, but may evolve over time to a considerably different type of business. Misclassifications can distort sales among business categories, especially in smaller cities. For example, a furniture store that is classified as a general merchandise store, will under-report the sales in the furniture store category and over-report the sales in the general merchandise category.
Suppressed Data
The sales data for merchandise categories that have less than four reporting firms are not reported. This is a measure taken by most states to protect the confidentiality of sales tax permit holders. The sales for suppressed retail categories are placed into the miscellaneous category and are included in total sales. The sales for suppressed service categories are placed into the NAICS 999 category and are not included in total sales.
Retail Trade Analysis Definitions page 5
Consolidated Reporting
Vendors doing business at more than one location in Minnesota have the option of filing a separate return for each location or filing one consolidated return for all locations. The consolidated return shows, for each business establishment, the sales made, tax due and location by city and county. Data for the establishments of consolidated filers are combined with data for single-location filers to produce the figures in this report. Occasionally consolidated reports may not be properly deconstructed and all the sales for a company may be reported for one city. Whenever misreporting is discovered, contacts are made by the Minnesota Revenue Department to clarify the situation.
Changes between 2000 and 2003
For fiscal year 2003, the Minnesota Department of Revenue implemented two major changes to improve their reporting of sales and use tax data. First, they adopted a geo-coding system, which accurately identifies the location of all business reporting sales and use tax to the state rather than relying on the businesses' postal addresses. One effect of this change is a movement of sales between neighboring cities (and in some cases, counties) in the year 2003. Thus, in several of the suburbs of Minneapolis and St.Paul and in cities such as Hermantown, which is adjacent to Duluth, the data show large increases in retail sales between 2000 and 2003, a substantial portion of which is due to the re-coding of business location and not to actual growth in sales.
The second change implemented by the Department of Revenue in 2003 was a shift from the Standard Industrial Classification system (SIC codes) to the 2002 North American Industry Classification System (NAICS codes). This switch does affect the comparability of the data series prior to 2000 with that of 2003 (and beyond), especially for merchandise categories. Overall retail and services sales are highly comparable over time. In many cases, the merchandise categories for the data prior to 2003 are very closely related to the new categories. For example, approximately 97% of the 2003 statewide sales in the general merchandise category were accounted for by firms also classified as general merchandise under the SIC system. In other cases, the correspondence is less straightforward. For example, only 56% of 2003 statewide sales in the Food and Beverage store category were accounted for by firms classified as Food Stores under the older classification system; 41% of 2003 Food store sales were accounted for by firms previously categorized as Miscellaneous Retail.
The 2002 NAICS system does provide greater detail and introduces some new sectors, such as Retail Electronics. Over time, these changes will improve the information available for retail trade analysis.
Pull Factor Changes in 2013 Data
The calculation for pull factor, as described on Definitions page 2, uses the divisor “state sales per capita.” Prior to 2013, the state taxable sales amount was obtained from the Minnesota Department of Revenue “Statewide by 3-Digit Industrial Code” sales tax report. However, certain retail and service categories have a large portion of their sales occurring from businesses outside of Minnesota. These include non-store retailers and the information service NAICS categories (telecommunications, publications, and broadcasting). Beginning with the 2013 data, the Minnesota sales from out-of-state businesses are no longer included in the calculation for the pull factor. While the individual retail and service sector pull factors in this report are not greatly affected by this change (except for non-store retail), the overall pull factor for the city may be increased by 8 to 14% depending on the amount of internet, mail order, and phone sales each year.