2013 samsung electronics annual reportimages.samsung.com/is/content/samsung/p5/sg/ir/... · 2 2013...
TRANSCRIPT
2013 SAMSUNG ELECTRONICS ANNUAL REPORT
By welcoming challenges of the new,
creativity that pushes the possible
and close and efficient collaboration,
Samsung Electronics leads
the astonishing evolution of
technology, producing positive
change for the world.
We continue to dream big about
forging new paths and ideas.
Focused on the excitement of
challenge, the anticipation of
creative discovery and the joys of
warm-hearted collaboration,
we are inspiring the future and
inventing new tomorrows.
Challenge,
Creativity,
Collaboration
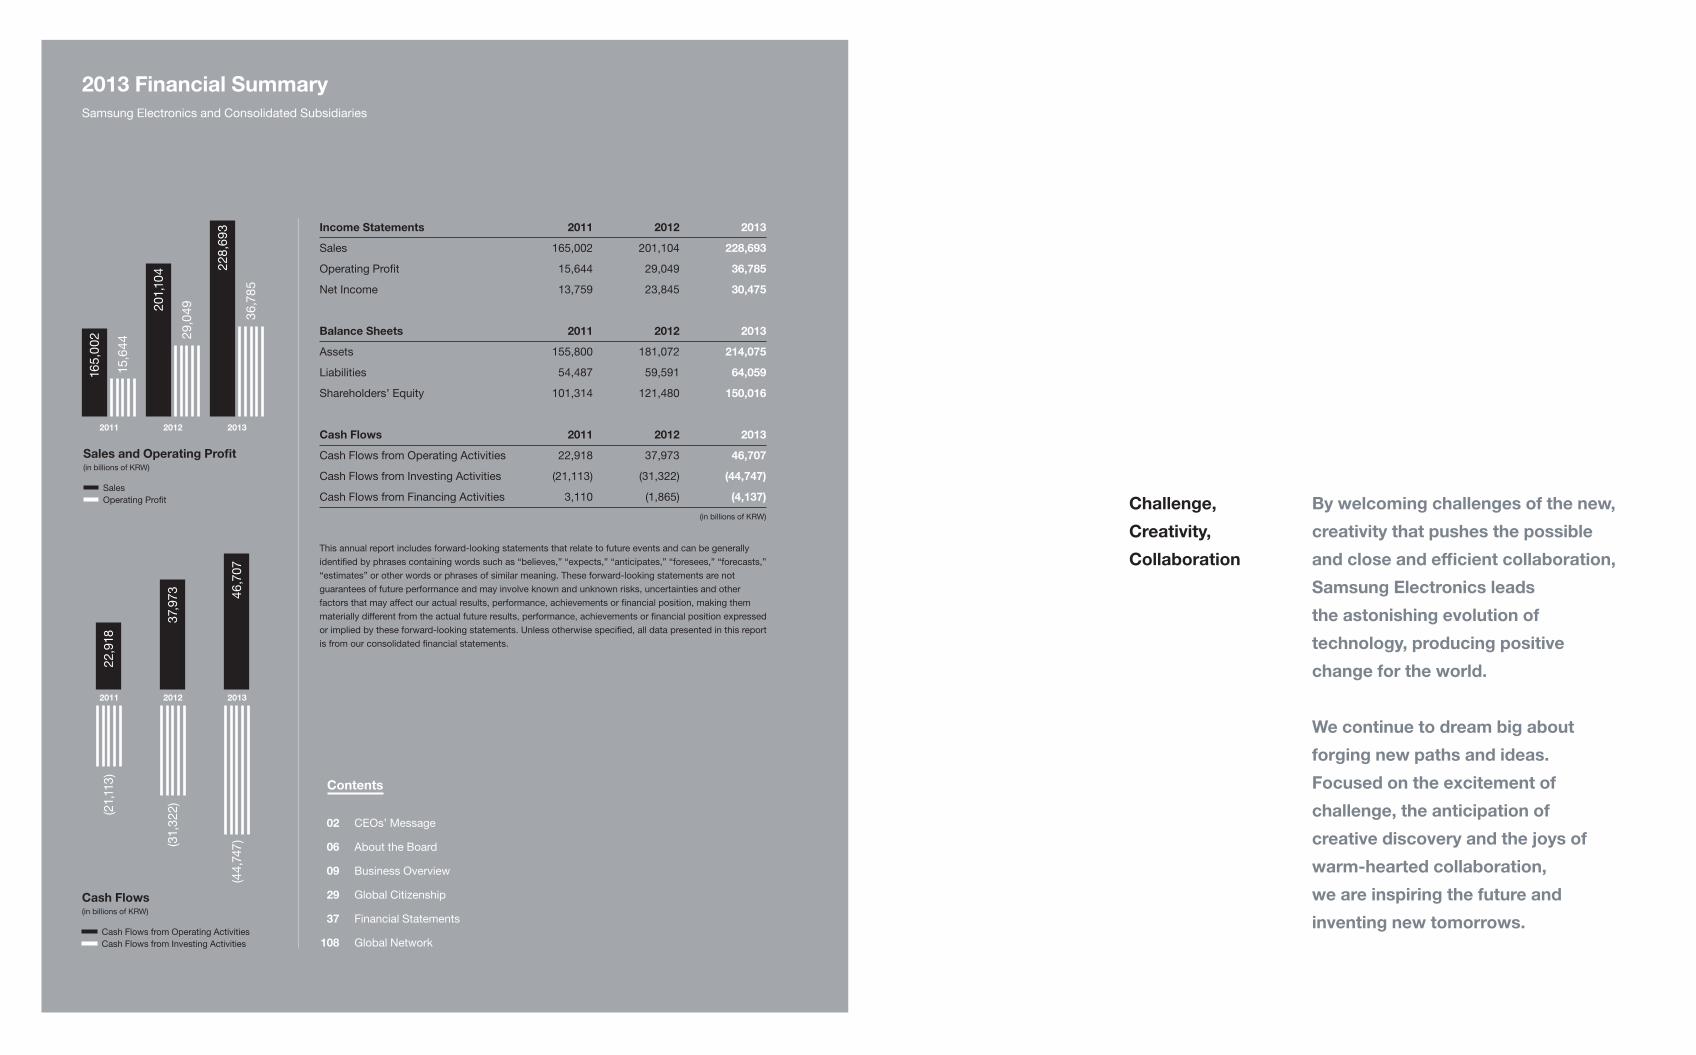
2013 Financial Summary
Samsung Electronics and Consolidated Subsidiaries
CEOs’ Message
About the Board
Business Overview
Global Citizenship
Financial Statements
Global Network
02
06
09
29
37
108
Contents
Sales and Operating Profit (in billions of KRW)
Sales
Operating Profit
2011 2012 2013
15,6
44 2
9,0
49
36
,78
5
201,1
04 2
28
,69
3
16
5,0
02
Cash Flows (in billions of KRW)
Cash Flows from Operating Activities
Cash Flows from Investing Activities
2011 2012 2013
(21,1
13)
(31,3
22)
(44,7
47
)
22,9
18
37,
973 46
,707
Income Statements 2011 2012 2013
Sales 165,002 201,104 228,693
Operating Profit 15,644 29,049 36,785
Net Income 13,759 23,845 30,475
Balance Sheets 2011 2012 2013
Assets 155,800 181,072 214,075
Liabilities 54,487 59,591 64,059
Shareholders’ Equity 101,314 121,480 150,016
Cash Flows 2011 2012 2013
Cash Flows from Operating Activities 22,918 37,973 46,707
Cash Flows from Investing Activities (21,113) (31,322) (44,747)
Cash Flows from Financing Activities 3,110 (1,865) (4,137)
(in billions of KRW)
This annual report includes forward-looking statements that relate to future events and can be generally
identified by phrases containing words such as “believes,” “expects,” “anticipates,” “foresees,” “forecasts,”
“estimates” or other words or phrases of similar meaning. These forward-looking statements are not
guarantees of future performance and may involve known and unknown risks, uncertainties and other
factors that may affect our actual results, performance, achievements or financial position, making them
materially different from the actual future results, performance, achievements or financial position expressed
or implied by these forward-looking statements. Unless otherwise specified, all data presented in this report
is from our consolidated financial statements.
2 32013 SAMSUNG ELECTRONICS ANNUAL REPORT
Dear Samsung Electronics Stakeholder:
Throughout 2013, we pursued growth and innovation,
despite facing challenges in the global economy, by
continuing to identify new opportunities and possibilities
through our transformative technologies and innovation.
As a result, we recorded historically high sales and profit
to cement our leadership in the global electronics industry.
Based on consolidated financial statements, we realized
sales revenue of KRW 229 trillion, operating profit of KRW
37 trillion and net profit of KRW 30 trillion, increases of
14%, 27% and 28%, respectively, over the previous year.
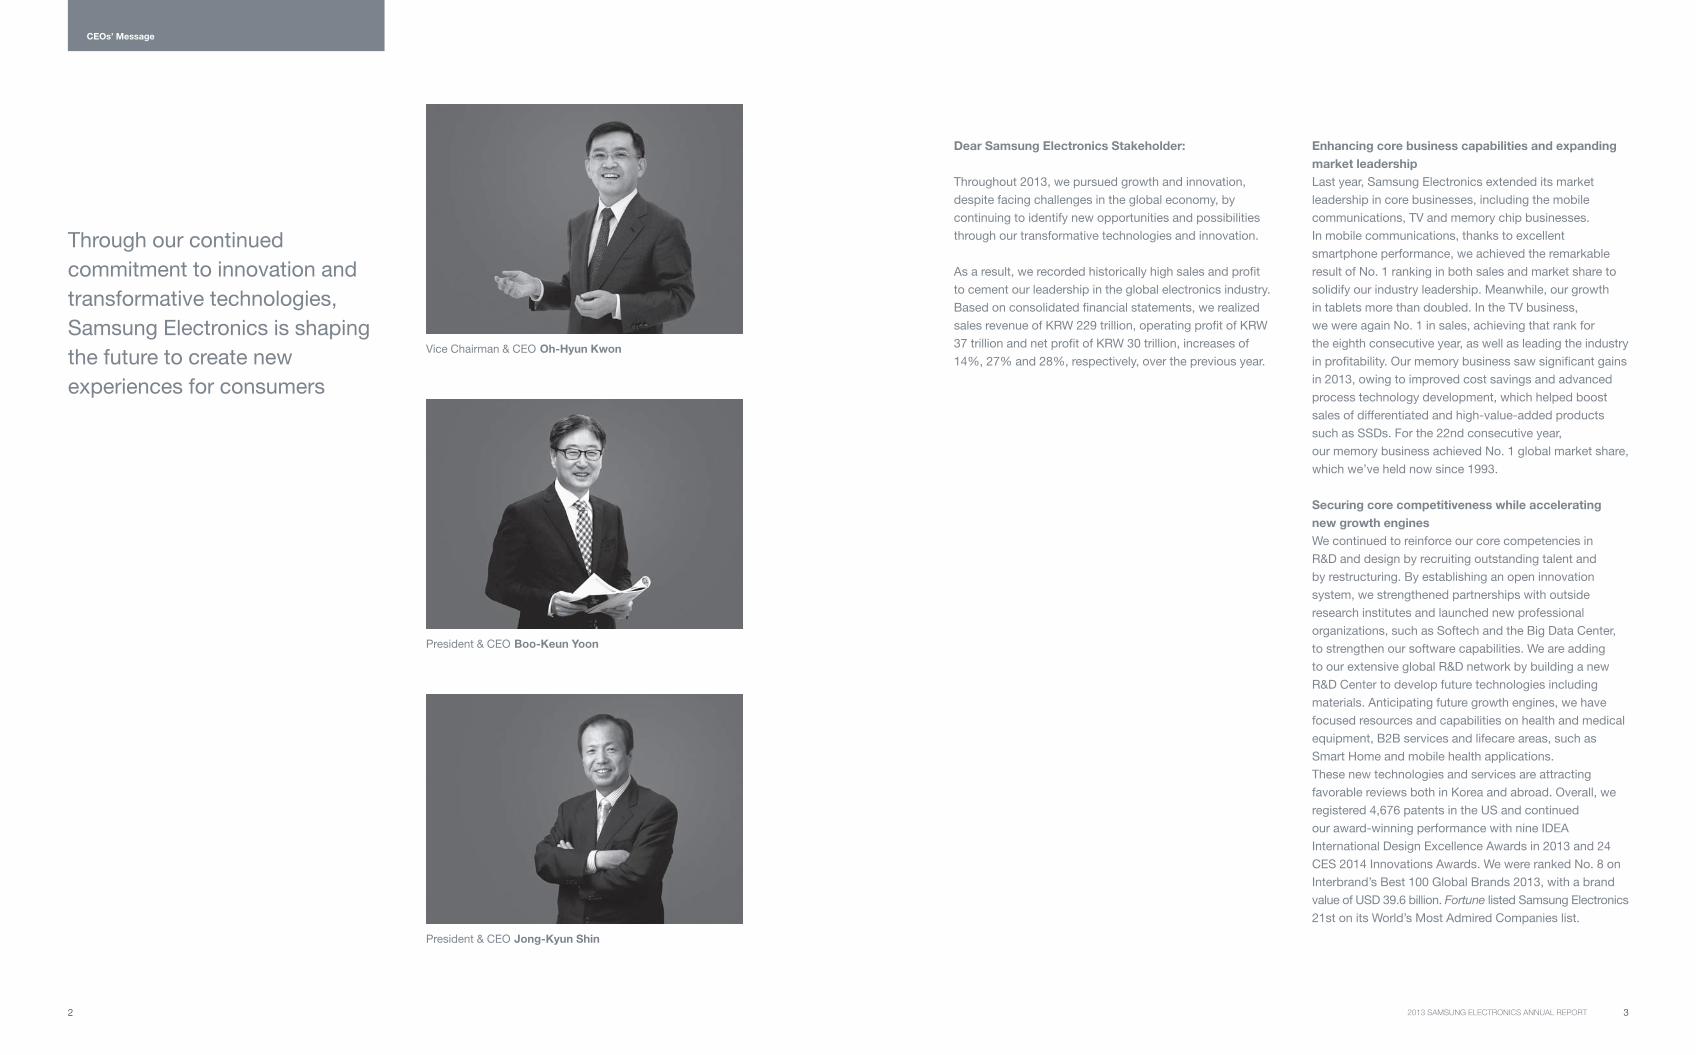
Through our continued
commitment to innovation and
transformative technologies,
Samsung Electronics is shaping
the future to create new
experiences for consumers
Vice Chairman & CEO Oh-Hyun Kwon
President & CEO Boo-Keun Yoon
President & CEO Jong-Kyun Shin
Enhancing core business capabilities and expanding
market leadership
Last year, Samsung Electronics extended its market
leadership in core businesses, including the mobile
communications, TV and memory chip businesses.
In mobile communications, thanks to excellent
smartphone performance, we achieved the remarkable
result of No. 1 ranking in both sales and market share to
solidify our industry leadership. Meanwhile, our growth
in tablets more than doubled. In the TV business,
we were again No. 1 in sales, achieving that rank for
the eighth consecutive year, as well as leading the industry
in profitability. Our memory business saw significant gains
in 2013, owing to improved cost savings and advanced
process technology development, which helped boost
sales of differentiated and high-value-added products
such as SSDs. For the 22nd consecutive year,
our memory business achieved No. 1 global market share,
which we’ve held now since 1993.
Securing core competitiveness while accelerating
new growth engines
We continued to reinforce our core competencies in
R&D and design by recruiting outstanding talent and
by restructuring. By establishing an open innovation
system, we strengthened partnerships with outside
research institutes and launched new professional
organizations, such as Softech and the Big Data Center,
to strengthen our software capabilities. We are adding
to our extensive global R&D network by building a new
R&D Center to develop future technologies including
materials. Anticipating future growth engines, we have
focused resources and capabilities on health and medical
equipment, B2B services and lifecare areas, such as
Smart Home and mobile health applications.
These new technologies and services are attracting
favorable reviews both in Korea and abroad. Overall, we
registered 4,676 patents in the US and continued
our award-winning performance with nine IDEA
International Design Excellence Awards in 2013 and 24
CES 2014 Innovations Awards. We were ranked No. 8 on
Interbrand’s Best 100 Global Brands 2013, with a brand
value of USD 39.6 billion. Fortune listed Samsung Electronics
21st on its World’s Most Admired Companies list.
CEOs’ Message
4 52013 SAMSUNG ELECTRONICS ANNUAL REPORT
Vice Chairman & CEO Oh-Hyun Kwon
President & CEO Boo-Keun Yoon
President & CEO Jong-Kyun Shin
Creating new experiences beyond the known limits of
markets and technology
In 2014, although we anticipate steady global economic
recovery, market uncertainty will linger. Competition in
the electronics industry will intensify as growth in
the smartphone and TV markets slows. But despite such
challenges, we will continue to grow. In 2013, we will
embrace challenges to pursue innovation and bring new
experiences to consumers beyond the current limits of
markets and technology.
First, we will consolidate our electronics industry
leadership by sharpening competition in our businesses.
Our core areas, including mobile phones, TVs and
memory chips, will sustain their market leadership
as we develop premium products and differentiated
technologies. In mobile communications, we will broaden
our product lines and lead the LTE market to maintain
our leading smartphone position. At the same time,
we will more aggressively pursue the tablet market.
In TVs, we will focus on high value-added premium
product sales, including the UHD/Curved TV and ultra
sized TV. Our leadership in the memory business will
be strengthened as we expand cutting-edge process
technology and push forward with high function and high
value-added products and solution mixed strategies.
Additionally, we are moving ahead with mass production
of next-generation V-NAND fl ash memory. We are also
preparing for growth by securing core technologies and
expanding retail networks in our developing businesses,
such as digital appliances, networks, printing solutions
and LED.
Next, we will focus on sound management to increase
profi tability. We expect to fortify resource management
effi ciency companywide, including in investments and
global SCM capability, which will result in improved
performance. We expect to reorganize systems in order
to enhance response time, minimize management risk or
uncertainty and monitor ongoing compliance.
Third, we will secure the future with sustainable growth.
To maximize competitiveness in our diverse value chains,
including components, sets, solutions and services,
we will develop innovative technology and new categories
of products that encourage future core technology.
We also will accelerate new growth engines, such as
electronic materials and our B2B business.
Upholding corporate citizenship and social responsibility
As a leading global company, Samsung aims to create
positive change for people everywhere and help them to
live a better life full of possibilities. We believe in growing
alongside communities by creating socially shared value.
We are focusing on education, professional training and
healthcare. Individual programs are informed by regional
characteristics in order to respect and resolve local issues.
We also support a range of green management and
environmental activities, including green products and
workplaces and reducing greenhouse gas emissions.
We will strive to maintain safe and pleasant work
environments for our employees through preventive
measures and risk management. As always, we support
our partners worldwide and promote their competitiveness
as we forge win-win partnerships for shared and
sustainable growth.
The theme that connects all of our technology, products,
solutions and services is our dream of improving people’s
lives and making a better world. As we move into 2014,
we are working to realize that dream with ceaseless
challenge and continuous innovation. We know that
continuing to grow as a global top-tier company depends
on the care and support of our customers and shareholders.
Samsung Electronics will make every effort to perform
as a world-class company as we deliver deep value and
heartfelt experiences to customers and society. The return
of that love and respect is the fuel that allows us to grow.
Thank you.
CEOs’ Message
6 72013 SAMSUNG ELECTRONICS ANNUAL REPORT
About the Board
At Samsung Electronics, our board consists of
nine members, including five outside directors.
In 2013, we convened eight board meetings
and proposed and addressed 23 motions.
We manage six board committees, including
the Management Committee, the Audit Committee,
the Outside Director Candidate Recommendation
Committee, the Internal Transaction Committee,
the Compensation Committee and the CSR
Committee. Our Management Committee hosted
16 meetings that deliberated and resolved
the delegated issues. Comprised of three outside
directors appointed to provide checks and balances
while monitoring and supporting company operations,
the Audit Committee had five meetings in 2013.
The Internal Transaction Committee, established to
enhance transparency in management, has three
outside directors and had five meetings in 2013.
To ensure fairness and independence, three of
the four members of the Outside Director Candidate
Recommendation Committee are outside directors.
With three outside directors, the Compensation
Committee also ensures objectivity and transparency
in determining director remuneration.
The CSR Committee, established in 2013 to
monitor and advise on CSR-related activities,
has five outside directors committed to corporate
responsibility and the public interest.
Boo-Keun Yoon
President & CEO (2013~Present)
President & Head, Consumer Electronics
Division (2012~Present)
Head, Consumer Electronics Division
(2011~2012)
Head, Visual Display Business (2007~2011)
Head, R&D Team, Visual Display Business
(2003~2007)
Sang-Hoon Lee
President & CFO, Corporate Management
Office (2012~Present)
Head, Strategy Team 1, Samsung
Corporate Strategy Office (2010~2012)
Head, Corporate Management Support
Team (2008~2010)
Strategy & Planning Office (2006~2008)
In-Ho Lee
Independent Director (2010~Present)
Corporate Advisor, Shinhan Bank
(2009~2011)
Chief Executive Officer, Shinhan Financial
Group (2005~2009)
President & Chief Executive Officer,
Shinhan Bank (1999~2003)
Director & Deputy President (Executive
Vice President), Shinhan Bank (1991~1999)
Kwang-Soo Song
Independent Director (2013~Present)
Advisor, Kim & Chang Law Office
(2007~Present)
Prosecutor General, Supreme Prosecutors’
Office (2003~2005)
Chief Prosecutor, Daegu High Prosecutors’
Office (2002~2003)
Senior Prosecutor, Director of Prosecution
Bureau, Ministry of Justice (2001~2002)
Byeong-Gi Lee
Independent Director (2012~Present)
Professor of Electrical Engineering,
Seoul National University (1986~Present)
President, IEEE Communications Society
(2010~2011)
Commissioner, Korea Communications
Commission (2008~2010)
President, Korea Information and
Communication Society (KICS) (2007~2007)
President, Korea Society of Engineering
Education (KSEE) (2003~2004)
Vice Chancellor for Research Affairs,
Seoul National University (2000~2002)
Member of Technical Staff, AT&T Bell
Laboratories (1984~1986)
Oh-Hyun Kwon
Vice Chairman & CEO (2012~Present)
Vice Chairman & Head, Samsung Advanced
Institute of Technology (2013~Present)
Vice Chairman & Head, Device Solutions
Division (2011~Present)
President & Head, Device Solutions Division
(2011~2011)
President & Head, Semiconductor Business
(2008~2011)
President & Head, System LSI Business
(2004~2008)
Head, LSI Technology (2000~2004)
Head, ASIC Business (1998~2000)
Jong-Kyun Shin
President & CEO (2013~Present)
President & Head, IT & Mobile
Communications Division (2012~Present)
Head, IT & Mobile Communications
Division (2011~2012)
Head, Mobile Communications Business
(2009~2011)
Head, R&D Team, Mobile Communications
Business (2006~2009)
Han-Joong Kim
Independent Director (2012~Present)
Chairman, CHA Strategy Committee,
CHA Health Systems (2012~Present)
Professor Emeritus, Yonsei University
(2012~Present)
Chairman, Korea University Sport
Federation (2010~2012)
Trustee, Korean Council for University
Education (2008~2012)
President, Yonsei University (2008~2012)
Chairman, Board of Directors, The Korean
Society for Preventive Medicine (2006~2008)
Professor, Department of Preventive
Medicine & Public Health (1982~2012)
Eun-Mee Kim
Independent Director (2013~Present)
Dean, Graduate School of International Studies,
Ewha Womans University (2011~Present)
Professor, Graduate School of International
Studies, Ewha Womans University (1997~Present)
President, Korea Association of International
Development and Cooperation (KAIDEC)
(2011~2012)
Dean, Graduate School of International Studies,
Ewha Womans University (2005~2007)
Visiting Scholar, Brown University (2003~2004)
Visiting Scholar, Harvard University (1994~1994)
Professor, Department of Sociology, University of
Southern California (1987~1997)
Our board of directors conducts
transparent and responsible
management based on board-
centered corporate governance
to enhance corporate value
8
Device
Solutions
Memory
Business
System LSI
Business
LED
Business
IT & Mobile
Communications
Mobile Communications
Business
Networks
Business
Consumer
Electronics
Visual Display
Business
Digital Appliances
Business
Printing Solutions
Business
Health & Medical
Equipment Business
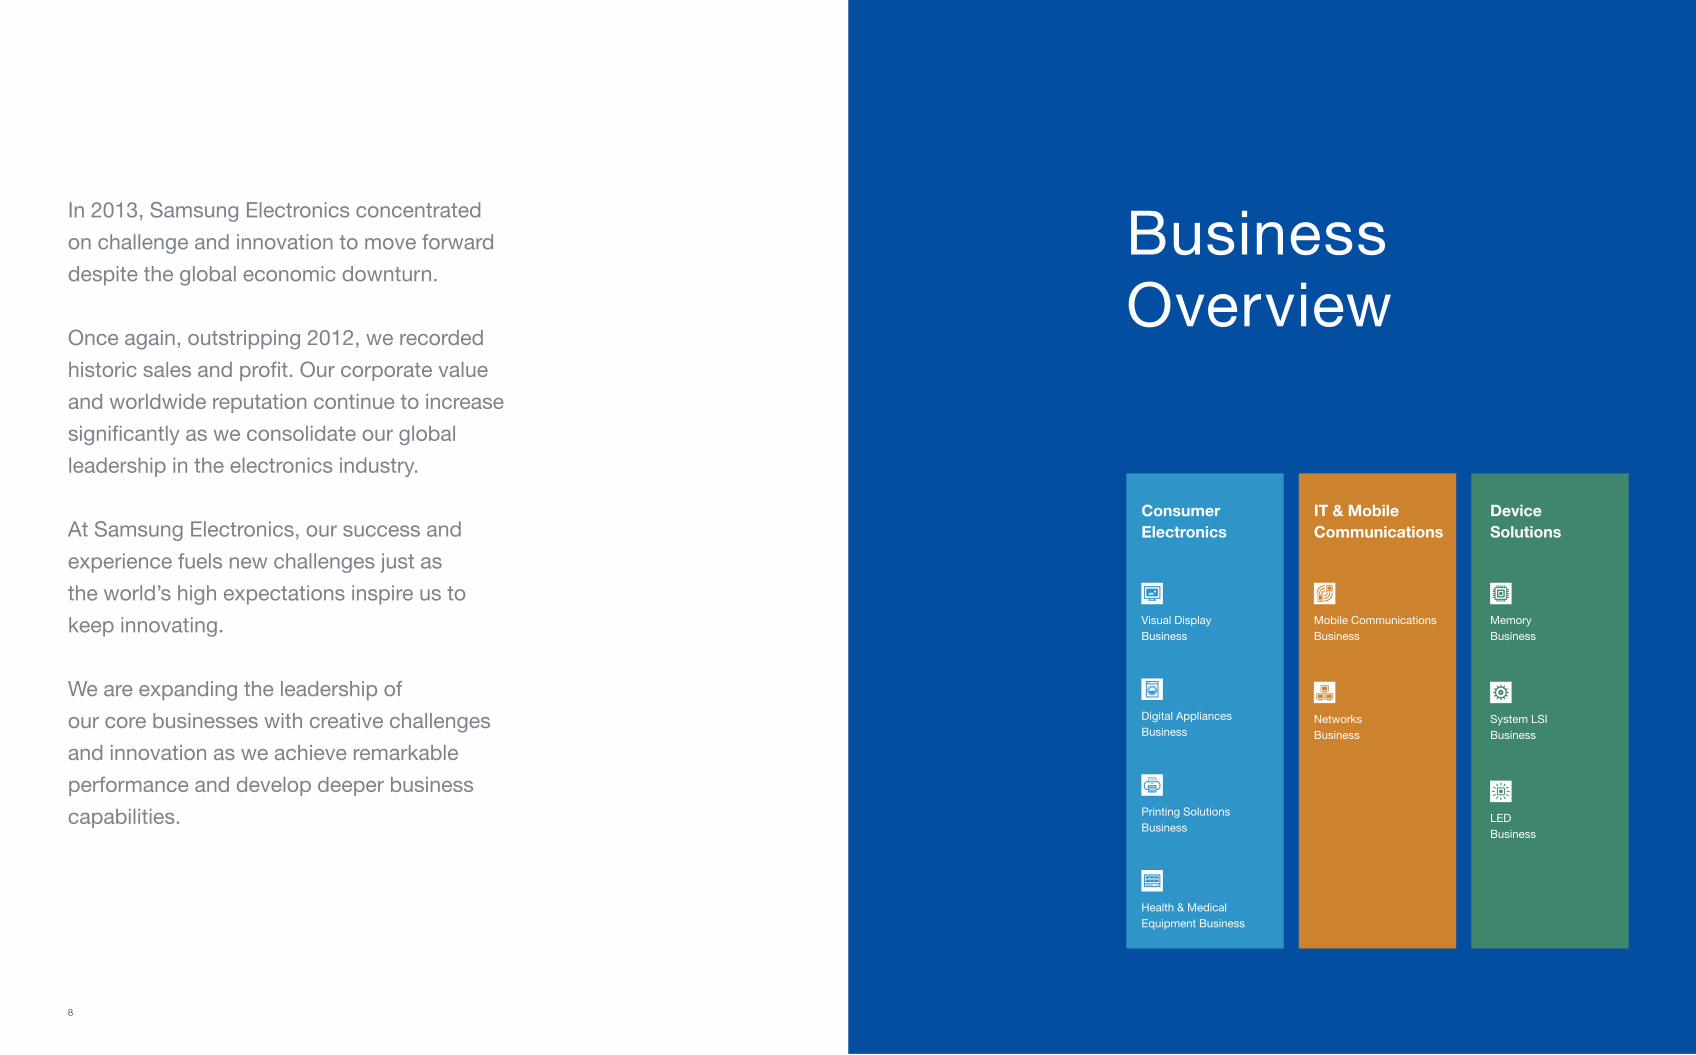
In 2013, Samsung Electronics concentrated
on challenge and innovation to move forward
despite the global economic downturn.
Once again, outstripping 2012, we recorded
historic sales and profit. Our corporate value
and worldwide reputation continue to increase
significantly as we consolidate our global
leadership in the electronics industry.
At Samsung Electronics, our success and
experience fuels new challenges just as
the world’s high expectations inspire us to
keep innovating.
We are expanding the leadership of
our core businesses with creative challenges
and innovation as we achieve remarkable
performance and develop deeper business
capabilities.
Business Overview
10 112013 SAMSUNG ELECTRONICS ANNUAL REPORT
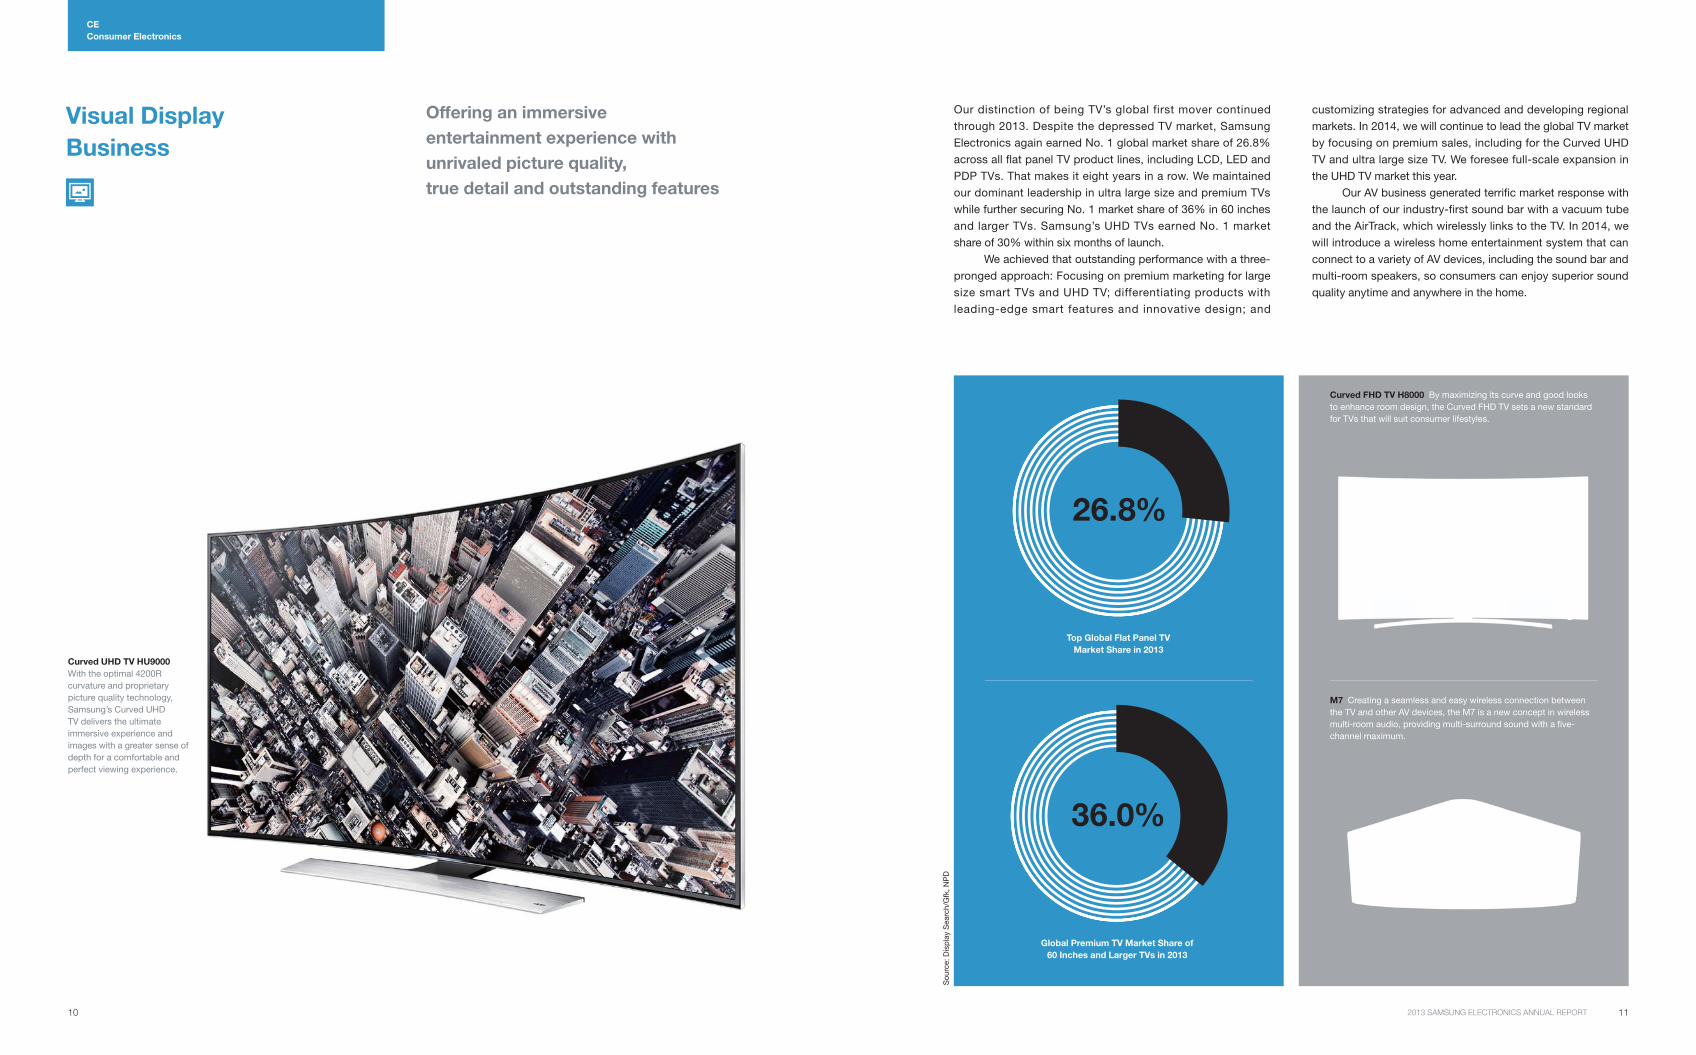
Curved FHD TV H8000 By maximizing its curve and good looks
to enhance room design, the Curved FHD TV sets a new standard
for TVs that will suit consumer lifestyles.
CE
Consumer Electronics
Our distinction of being TV’s global first mover continued
through 2013. Despite the depressed TV market, Samsung
Electronics again earned No. 1 global market share of 26.8%
across all fl at panel TV product lines, including LCD, LED and
PDP TVs. That makes it eight years in a row. We maintained
our dominant leadership in ultra large size and premium TVs
while further securing No. 1 market share of 36% in 60 inches
and larger TVs. Samsung’s UHD TVs earned No. 1 market
share of 30% within six months of launch.
We achieved that outstanding performance with a three-
pronged approach: Focusing on premium marketing for large
size smart TVs and UHD TV; differentiating products with
leading-edge smart features and innovative design; and
customizing strategies for advanced and developing regional
markets. In 2014, we will continue to lead the global TV market
by focusing on premium sales, including for the Curved UHD
TV and ultra large size TV. We foresee full-scale expansion in
the UHD TV market this year.
Our AV business generated terrifi c market response with
the launch of our industry-first sound bar with a vacuum tube
and the AirTrack, which wirelessly links to the TV. In 2014, we
will introduce a wireless home entertainment system that can
connect to a variety of AV devices, including the sound bar and
multi-room speakers, so consumers can enjoy superior sound
quality anytime and anywhere in the home.
Top Global Flat Panel TV
Market Share in 2013
Curved UHD TV HU9000
With the optimal 4200R
curvature and proprietary
picture quality technology,
Samsung’s Curved UHD
TV delivers the ultimate
immersive experience and
images with a greater sense of
depth for a comfortable and
perfect viewing experience.
M7 Creating a seamless and easy wireless connection between
the TV and other AV devices, the M7 is a new concept in wireless
multi-room audio, providing multi-surround sound with a fi ve-
channel maximum.
26.8%
Global Premium TV Market Share of
60 Inches and Larger TVs in 2013
36.0%
So
urc
e: D
isp
lay S
earc
h/G
fk, N
PD
Offering an immersive
entertainment experience with
unrivaled picture quality,
true detail and outstanding features
Visual Display
Business
12 132013 SAMSUNG ELECTRONICS ANNUAL REPORT
CE
Consumer Electronics
Digital Appliances
Business
Empowering consumer lives
by turning every moment into
an enjoyable experience
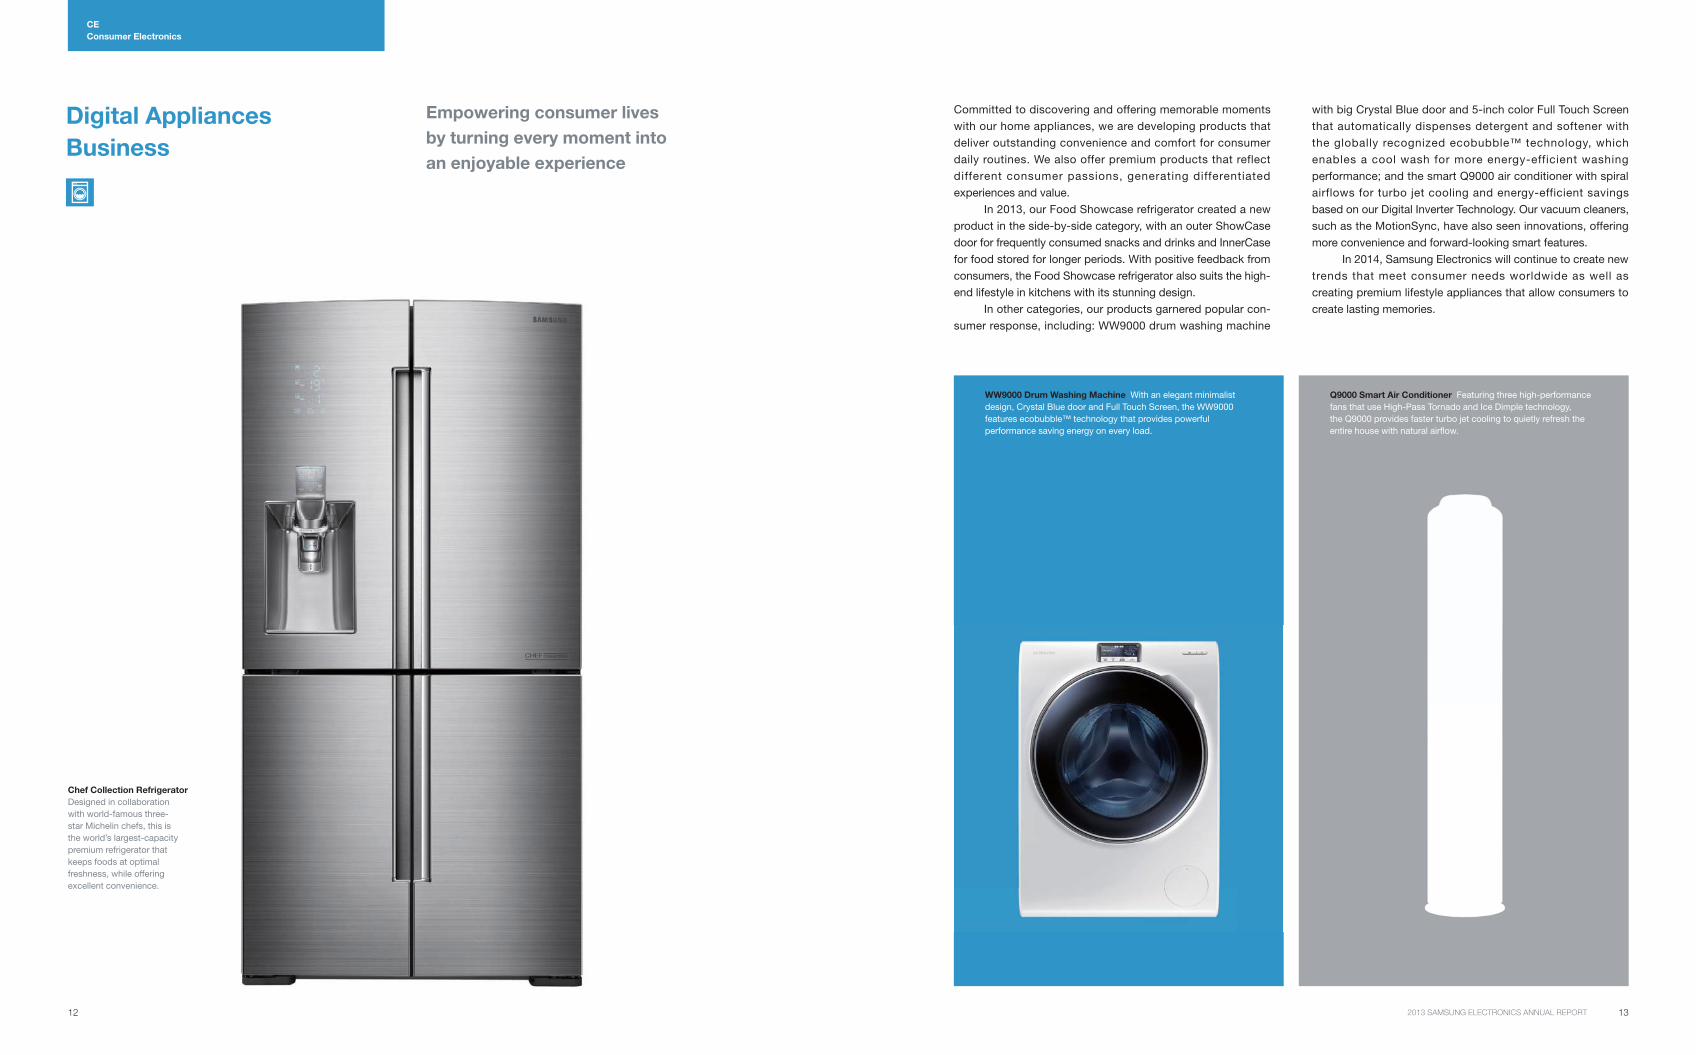
Committed to discovering and offering memorable moments
with our home appliances, we are developing products that
deliver outstanding convenience and comfort for consumer
daily routines. We also offer premium products that reflect
different consumer passions, generating differentiated
experiences and value.
In 2013, our Food Showcase refrigerator created a new
product in the side-by-side category, with an outer ShowCase
door for frequently consumed snacks and drinks and InnerCase
for food stored for longer periods. With positive feedback from
consumers, the Food Showcase refrigerator also suits the high-
end lifestyle in kitchens with its stunning design.
In other categories, our products garnered popular con-
sumer response, including: WW9000 drum washing machine
with big Crystal Blue door and 5-inch color Full Touch Screen
that automatically dispenses detergent and softener with
the globally recognized ecobubble™ technology, which
enables a cool wash for more energy-efficient washing
performance; and the smart Q9000 air conditioner with spiral
airflows for turbo jet cooling and energy-efficient savings
based on our Digital Inverter Technology. Our vacuum cleaners,
such as the MotionSync, have also seen innovations, offering
more convenience and forward-looking smart features.
In 2014, Samsung Electronics will continue to create new
trends that meet consumer needs worldwide as well as
creating premium lifestyle appliances that allow consumers to
create lasting memories.
Chef Collection Refrigerator
Designed in collaboration
with world-famous three-
star Michelin chefs, this is
the world’s largest-capacity
premium refrigerator that
keeps foods at optimal
freshness, while offering
excellent convenience.
WW9000 Drum Washing Machine With an elegant minimalist
design, Crystal Blue door and Full Touch Screen, the WW9000
features ecobubble™ technology that provides powerful
performance saving energy on every load.
Q9000 Smart Air Conditioner Featuring three high-performance
fans that use High-Pass Tornado and Ice Dimple technology,
the Q9000 provides faster turbo jet cooling to quietly refresh the
entire house with natural airfl ow.
14 152013 SAMSUNG ELECTRONICS ANNUAL REPORT
CE
Consumer Electronics
Improving work effi ciency
and opportunities with
inventive mobile printing
technology and solutions
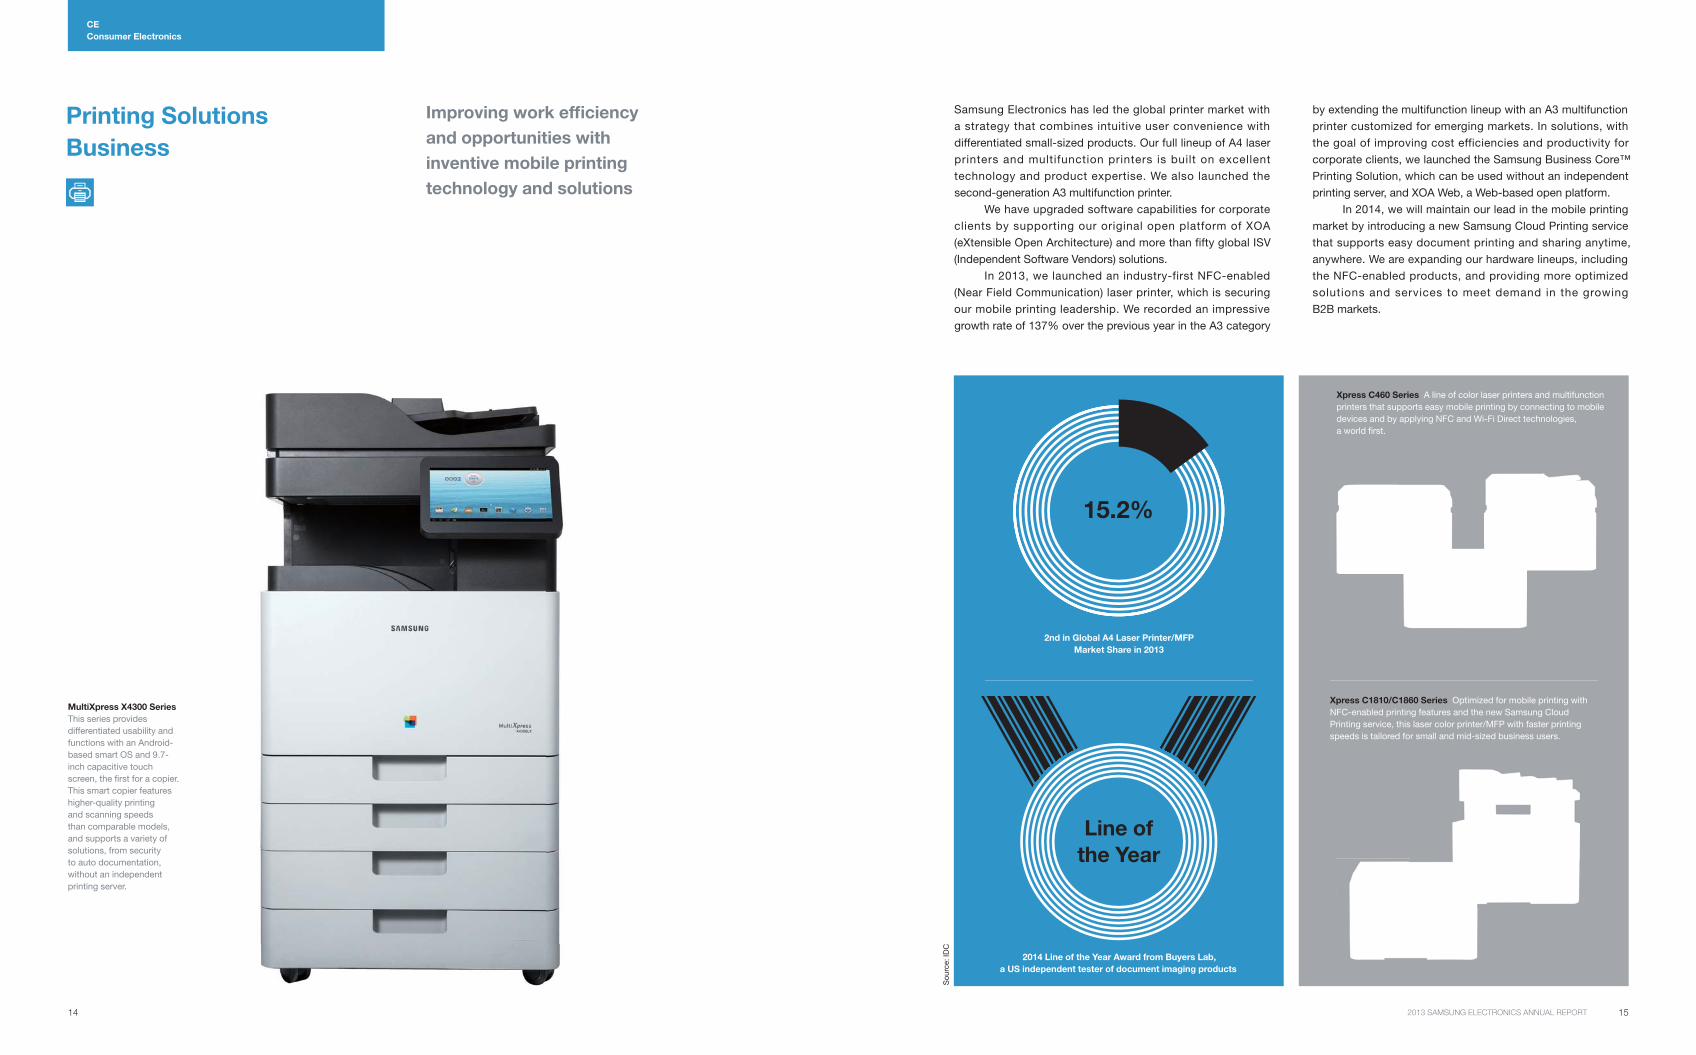
Samsung Electronics has led the global printer market with
a strategy that combines intuitive user convenience with
differentiated small-sized products. Our full lineup of A4 laser
printers and multifunction printers is built on excellent
technology and product expertise. We also launched the
second-generation A3 multifunction printer.
We have upgraded software capabilities for corporate
clients by supporting our original open platform of XOA
(eXtensible Open Architecture) and more than fifty global ISV
(Independent Software Vendors) solutions.
In 2013, we launched an industry-first NFC-enabled
(Near Field Communication) laser printer, which is securing
our mobile printing leadership. We recorded an impressive
growth rate of 137% over the previous year in the A3 category
by extending the multifunction lineup with an A3 multifunction
printer customized for emerging markets. In solutions, with
the goal of improving cost efficiencies and productivity for
corporate clients, we launched the Samsung Business Core™
Printing Solution, which can be used without an independent
printing server, and XOA Web, a Web-based open platform.
In 2014, we will maintain our lead in the mobile printing
market by introducing a new Samsung Cloud Printing service
that supports easy document printing and sharing anytime,
anywhere. We are expanding our hardware lineups, including
the NFC-enabled products, and providing more optimized
solutions and services to meet demand in the growing
B2B markets.
2nd in Global A4 Laser Printer/MFP
Market Share in 2013
15.2%
Xpress C460 Series A line of color laser printers and multifunction
printers that supports easy mobile printing by connecting to mobile
devices and by applying NFC and Wi-Fi Direct technologies,
a world fi rst.
Xpress C1810/C1860 Series Optimized for mobile printing with
NFC-enabled printing features and the new Samsung Cloud
Printing service, this laser color printer/MFP with faster printing
speeds is tailored for small and mid-sized business users.
Line of
the Year
2014 Line of the Year Award from Buyers Lab,
a US independent tester of document imaging products
MultiXpress X4300 Series
This series provides
differentiated usability and
functions with an Android-
based smart OS and 9.7-
inch capacitive touch
screen, the fi rst for a copier.
This smart copier features
higher-quality printing
and scanning speeds
than comparable models,
and supports a variety of
solutions, from security
to auto documentation,
without an independent
printing server.
Printing Solutions
Business
So
urc
e: ID
C
16 172013 SAMSUNG ELECTRONICS ANNUAL REPORT
CE
Consumer Electronics
Health & Medical
Equipment Business
Expanding healthcare and
medical services with advanced
diagnostic equipment and
convergence technology
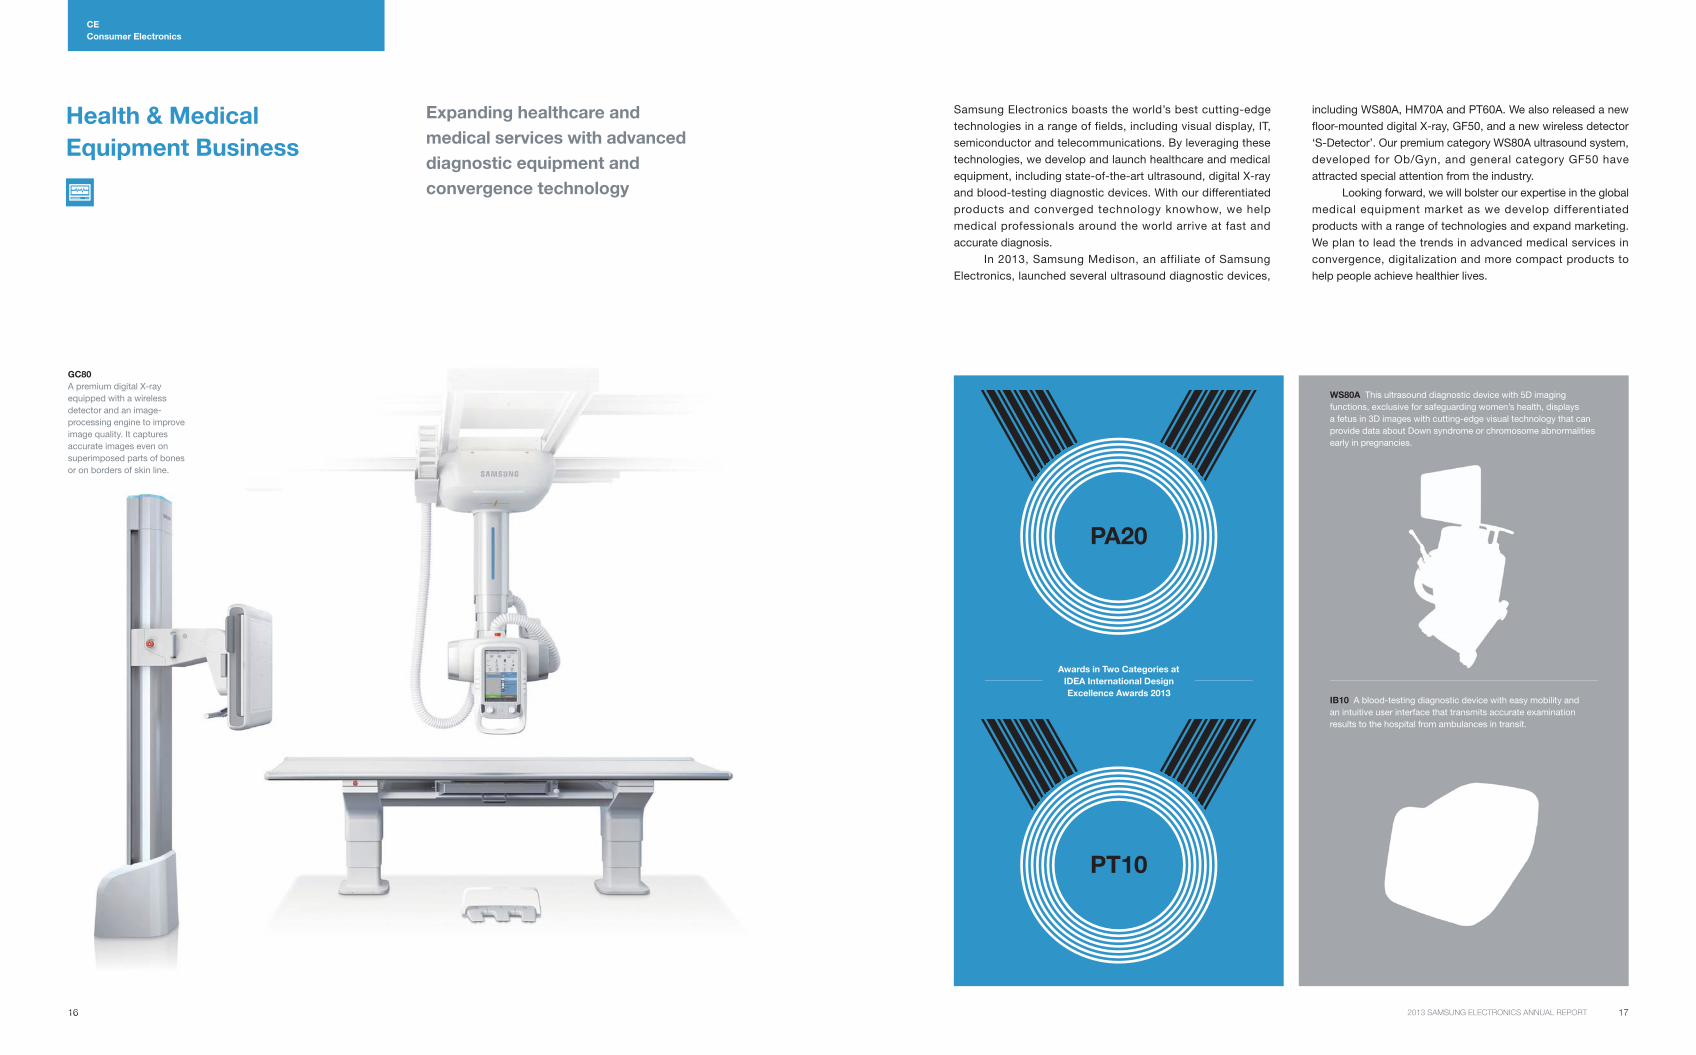
Samsung Electronics boasts the world’s best cutting-edge
technologies in a range of fields, including visual display, IT,
semiconductor and telecommunications. By leveraging these
technologies, we develop and launch healthcare and medical
equipment, including state-of-the-art ultrasound, digital X-ray
and blood-testing diagnostic devices. With our differentiated
products and converged technology knowhow, we help
medical professionals around the world arrive at fast and
accurate diagnosis.
In 2013, Samsung Medison, an affiliate of Samsung
Electronics, launched several ultrasound diagnostic devices,
including WS80A, HM70A and PT60A. We also released a new
fl oor-mounted digital X-ray, GF50, and a new wireless detector
‘S-Detector’. Our premium category WS80A ultrasound system,
developed for Ob/Gyn, and general category GF50 have
attracted special attention from the industry.
Looking forward, we will bolster our expertise in the global
medical equipment market as we develop differentiated
products with a range of technologies and expand marketing.
We plan to lead the trends in advanced medical services in
convergence, digitalization and more compact products to
help people achieve healthier lives.
GC80
A premium digital X-ray
equipped with a wireless
detector and an image-
processing engine to improve
image quality. It captures
accurate images even on
superimposed parts of bones
or on borders of skin line.
WS80A This ultrasound diagnostic device with 5D imaging
functions, exclusive for safeguarding women’s health, displays
a fetus in 3D images with cutting-edge visual technology that can
provide data about Down syndrome or chromosome abnormalities
early in pregnancies.
IB10 A blood-testing diagnostic device with easy mobility and
an intuitive user interface that transmits accurate examination
results to the hospital from ambulances in transit.
PA20
PT10
Awards in Two Categories at
IDEA International Design
Excellence Awards 2013
16
192013 SAMSUNG ELECTRONICS ANNUAL REPORT
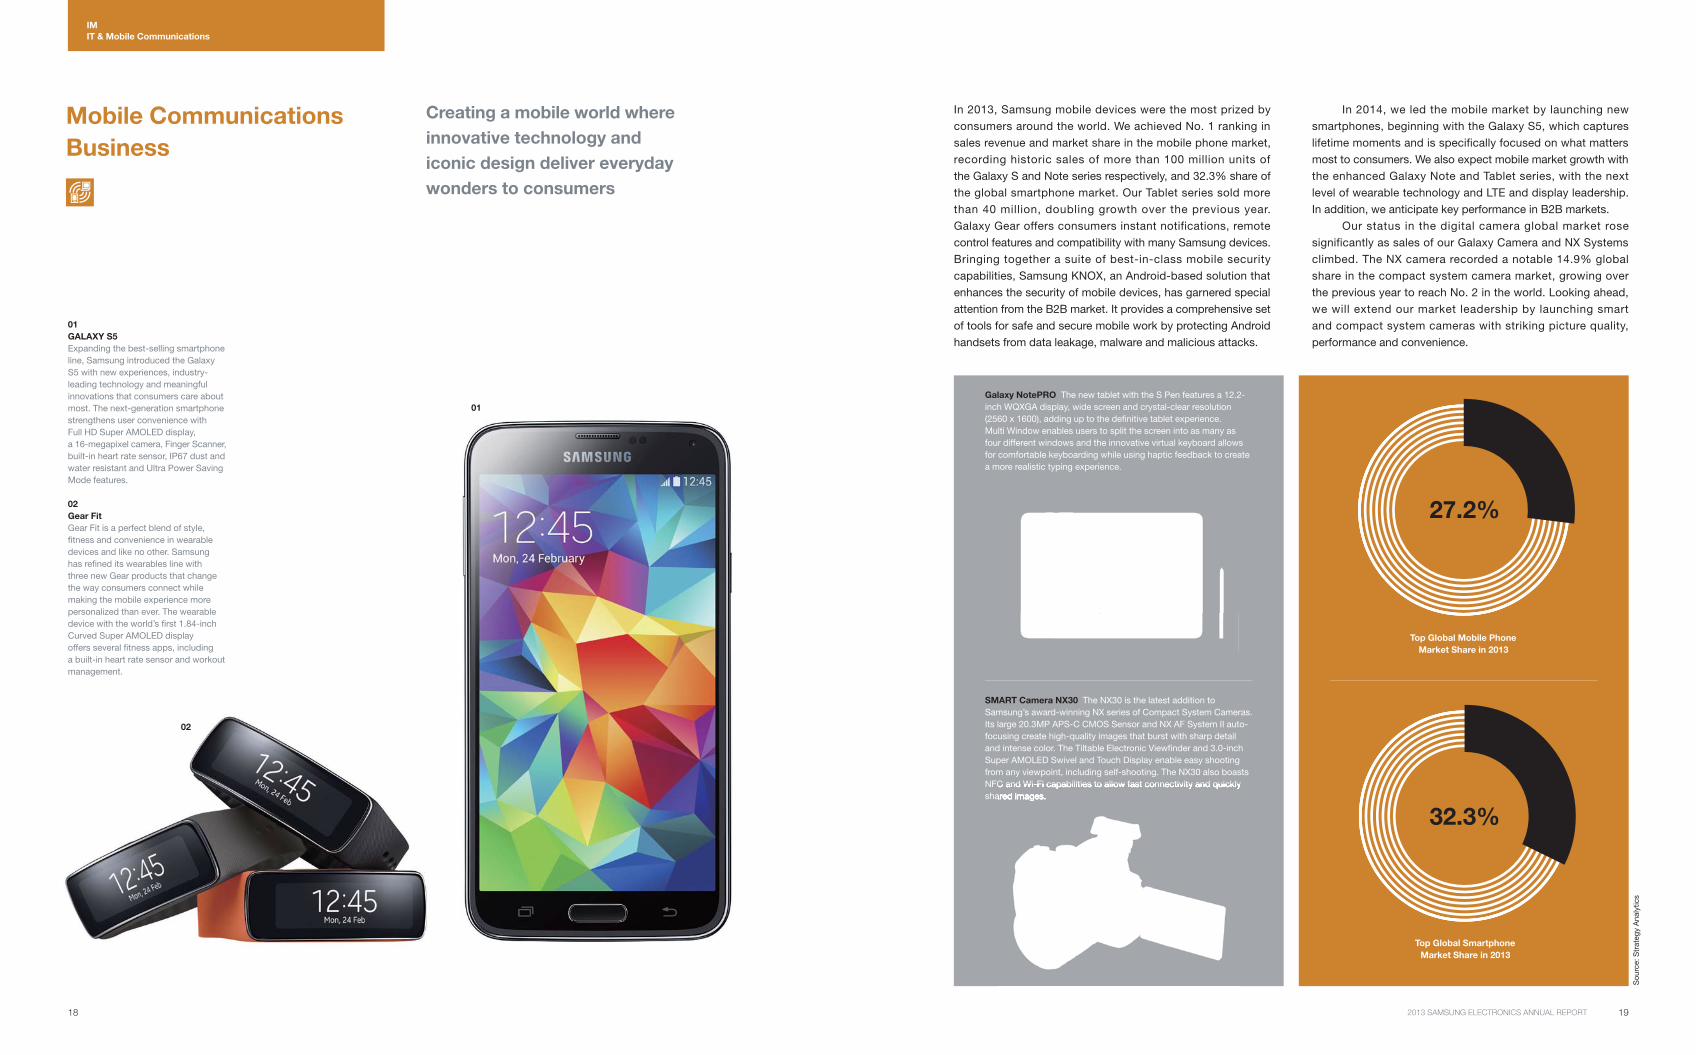
In 2013, Samsung mobile devices were the most prized by
consumers around the world. We achieved No. 1 ranking in
sales revenue and market share in the mobile phone market,
recording historic sales of more than 100 million units of
the Galaxy S and Note series respectively, and 32.3% share of
the global smartphone market. Our Tablet series sold more
than 40 million, doubling growth over the previous year.
Galaxy Gear offers consumers instant notifications, remote
control features and compatibility with many Samsung devices.
Bringing together a suite of best-in-class mobile security
capabilities, Samsung KNOX, an Android-based solution that
enhances the security of mobile devices, has garnered special
attention from the B2B market. It provides a comprehensive set
of tools for safe and secure mobile work by protecting Android
handsets from data leakage, malware and malicious attacks.
Top Global Mobile Phone
Market Share in 2013
So
urc
e: S
trate
gy A
naly
tics
27.2%
32.3%
In 2014, we led the mobile market by launching new
smartphones, beginning with the Galaxy S5, which captures
lifetime moments and is specifically focused on what matters
most to consumers. We also expect mobile market growth with
the enhanced Galaxy Note and Tablet series, with the next
level of wearable technology and LTE and display leadership.
In addition, we anticipate key performance in B2B markets.
Our status in the digital camera global market rose
significantly as sales of our Galaxy Camera and NX Systems
climbed. The NX camera recorded a notable 14.9% global
share in the compact system camera market, growing over
the previous year to reach No. 2 in the world. Looking ahead,
we will extend our market leadership by launching smart
and compact system cameras with striking picture quality,
performance and convenience.
Galaxy NotePRO The new tablet with the S Pen features a 12.2-
inch WQXGA display, wide screen and crystal-clear resolution
(2560 x 1600), adding up to the defi nitive tablet experience.
Multi Window enables users to split the screen into as many as
four different windows and the innovative virtual keyboard allows
for comfortable keyboarding while using haptic feedback to create
a more realistic typing experience.
01
GALAXY S5
Expanding the best-selling smartphone
line, Samsung introduced the Galaxy
S5 with new experiences, industry-
leading technology and meaningful
innovations that consumers care about
most. The next-generation smartphone
strengthens user convenience with
Full HD Super AMOLED display,
a 16-megapixel camera, Finger Scanner,
built-in heart rate sensor, IP67 dust and
water resistant and Ultra Power Saving
Mode features.
02
Gear Fit
Gear Fit is a perfect blend of style,
fi tness and convenience in wearable
devices and like no other. Samsung
has refi ned its wearables line with
three new Gear products that change
the way consumers connect while
making the mobile experience more
personalized than ever. The wearable
device with the world’s fi rst 1.84-inch
Curved Super AMOLED display
offers several fi tness apps, including
a built-in heart rate sensor and workout
management.
Top Global Smartphone
Market Share in 2013
02
SMART Camera NX30 The NX30 is the latest addition to
Samsung’s award-winning NX series of Compact System Cameras.
Its large 20.3MP APS-C CMOS Sensor and NX AF System II auto-
focusing create high-quality images that burst with sharp detail
and intense color. The Tiltable Electronic Viewfi nder and 3.0-inch
Super AMOLED Swivel and Touch Display enable easy shooting
from any viewpoint, including self-shooting. The NX30 also boasts
NFC and Wi-Fi capabilities to allow fast connectivity and quickly
shared images.
01
18
IM
IT & Mobile Communications
Mobile Communications
Business
Creating a mobile world where
innovative technology and
iconic design deliver everyday
wonders to consumers
20 212013 SAMSUNG ELECTRONICS ANNUAL REPORT
IM
IT & Mobile Communications
Leading next-generation mobile
networks with differentiated
technology and experience
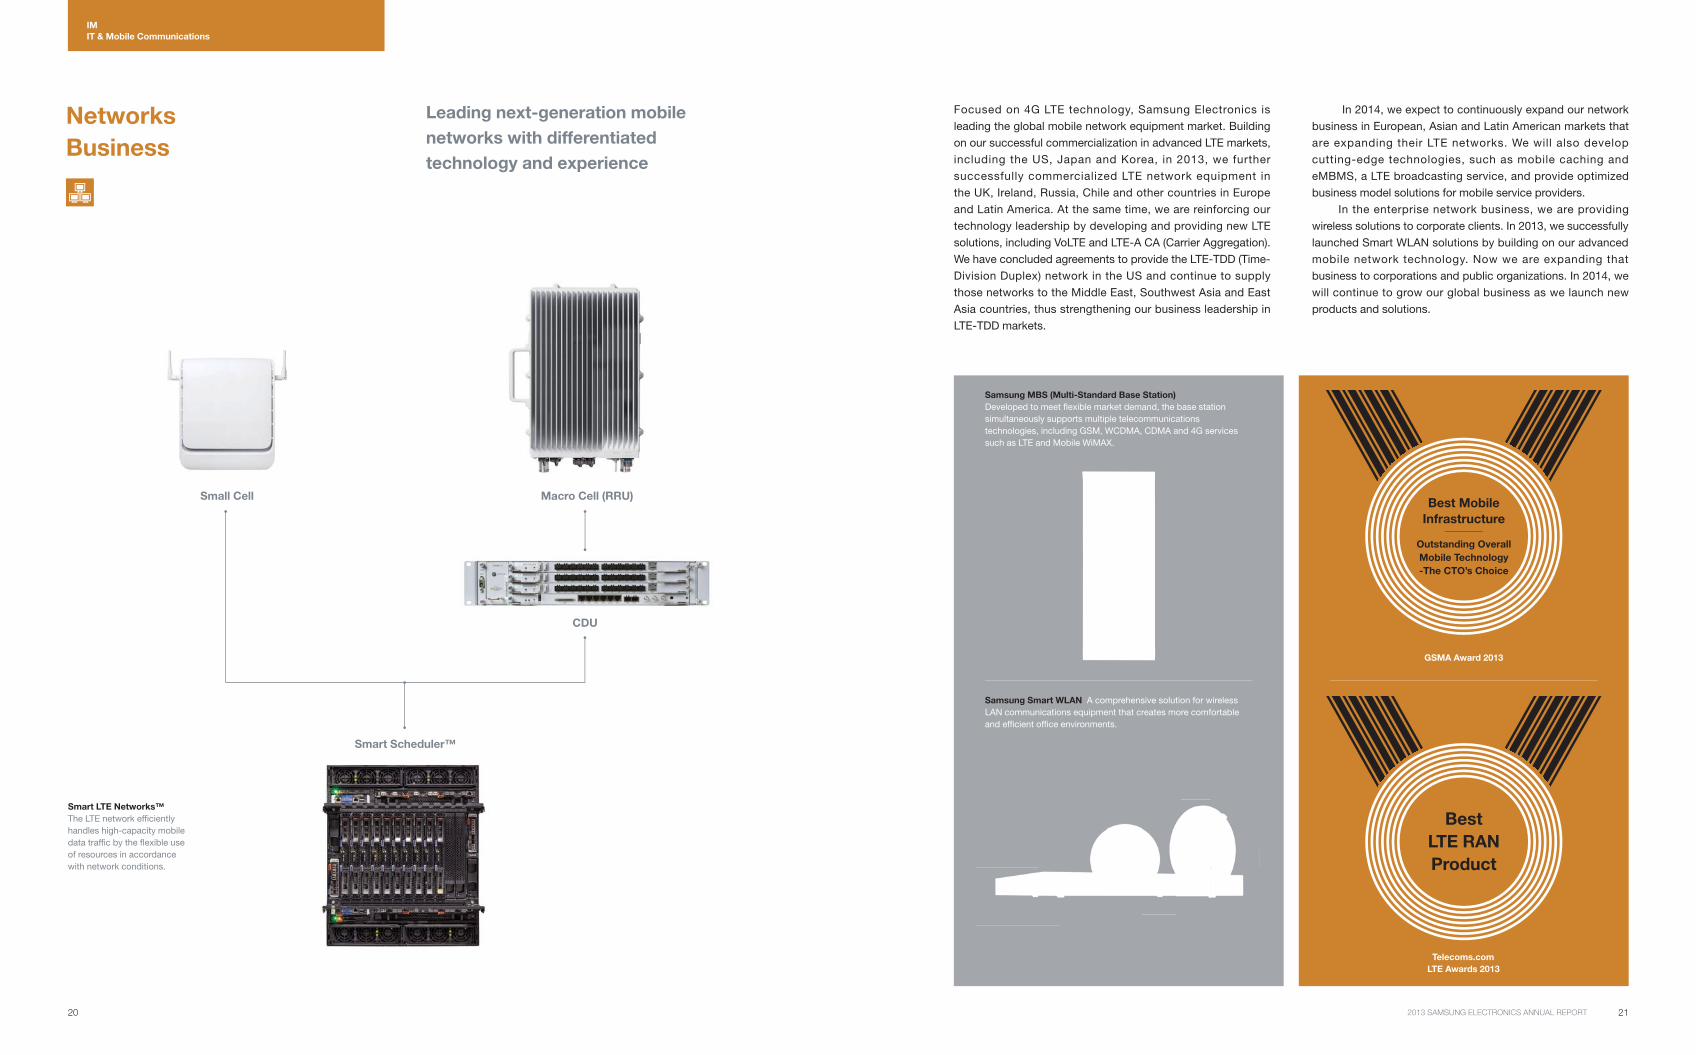
Focused on 4G LTE technology, Samsung Electronics is
leading the global mobile network equipment market. Building
on our successful commercialization in advanced LTE markets,
including the US, Japan and Korea, in 2013, we further
successfully commercialized LTE network equipment in
the UK, Ireland, Russia, Chile and other countries in Europe
and Latin America. At the same time, we are reinforcing our
technology leadership by developing and providing new LTE
solutions, including VoLTE and LTE-A CA (Carrier Aggregation).
We have concluded agreements to provide the LTE-TDD (Time-
Division Duplex) network in the US and continue to supply
those networks to the Middle East, Southwest Asia and East
Asia countries, thus strengthening our business leadership in
LTE-TDD markets.
In 2014, we expect to continuously expand our network
business in European, Asian and Latin American markets that
are expanding their LTE networks. We will also develop
cutting-edge technologies, such as mobile caching and
eMBMS, a LTE broadcasting service, and provide optimized
business model solutions for mobile service providers.
In the enterprise network business, we are providing
wireless solutions to corporate clients. In 2013, we successfully
launched Smart WLAN solutions by building on our advanced
mobile network technology. Now we are expanding that
business to corporations and public organizations. In 2014, we
will continue to grow our global business as we launch new
products and solutions.
Smart LTE Networks™
The LTE network effi ciently
handles high-capacity mobile
data traffi c by the fl exible use
of resources in accordance
with network conditions.
Smart Scheduler™
CDU
Macro Cell (RRU)Small Cell
Samsung Smart WLAN A comprehensive solution for wireless
LAN communications equipment that creates more comfortable
and effi cient offi ce environments.
Samsung MBS (Multi-Standard Base Station)
Developed to meet fl exible market demand, the base station
simultaneously supports multiple telecommunications
technologies, including GSM, WCDMA, CDMA and 4G services
such as LTE and Mobile WiMAX.
GSMA Award 2013
Best
LTE RAN
Product
Telecoms.com
LTE Awards 2013
Best Mobile
Infrastructure
Outstanding Overall
Mobile Technology
-The CTO’s Choice
Networks
Business
232013 SAMSUNG ELECTRONICS ANNUAL REPORT
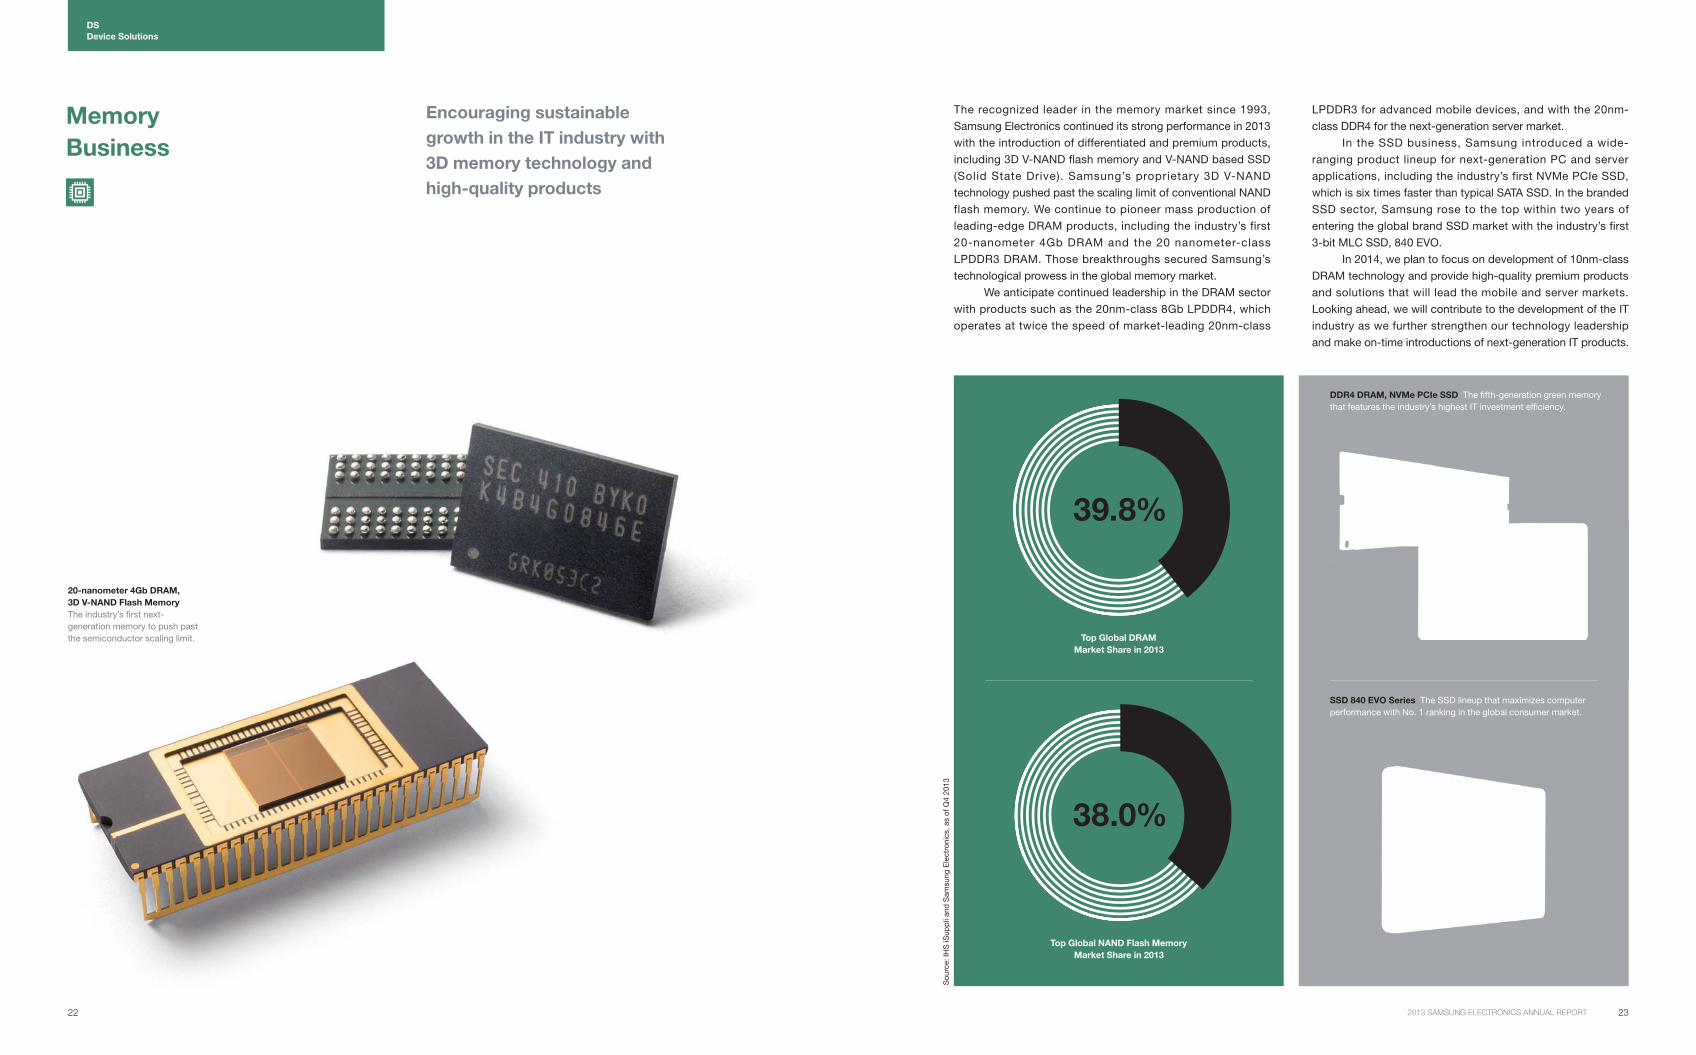
39.8%
38.0%
SSD 840 EVO Series The SSD lineup that maximizes computer
performance with No. 1 ranking in the global consumer market.
Top Global DRAM
Market Share in 2013
Top Global NAND Flash Memory
Market Share in 2013
So
urc
e: IH
S iS
up
pli
and
Sam
su
ng
Ele
ctr
on
ics, as o
f Q
4 2
01
3
The recognized leader in the memory market since 1993,
Samsung Electronics continued its strong performance in 2013
with the introduction of differentiated and premium products,
including 3D V-NAND flash memory and V-NAND based SSD
(Solid State Drive). Samsung’s proprietary 3D V-NAND
technology pushed past the scaling limit of conventional NAND
flash memory. We continue to pioneer mass production of
leading-edge DRAM products, including the industry’s first
20-nanometer 4Gb DRAM and the 20 nanometer-class
LPDDR3 DRAM. Those breakthroughs secured Samsung’s
technological prowess in the global memory market.
We anticipate continued leadership in the DRAM sector
with products such as the 20nm-class 8Gb LPDDR4, which
operates at twice the speed of market-leading 20nm-class
LPDDR3 for advanced mobile devices, and with the 20nm-
class DDR4 for the next-generation server market.
In the SSD business, Samsung introduced a wide-
ranging product lineup for next-generation PC and server
applications, including the industry’s first NVMe PCIe SSD,
which is six times faster than typical SATA SSD. In the branded
SSD sector, Samsung rose to the top within two years of
entering the global brand SSD market with the industry’s first
3-bit MLC SSD, 840 EVO.
In 2014, we plan to focus on development of 10nm-class
DRAM technology and provide high-quality premium products
and solutions that will lead the mobile and server markets.
Looking ahead, we will contribute to the development of the IT
industry as we further strengthen our technology leadership
and make on-time introductions of next-generation IT products.
DDR4 DRAM, NVMe PCIe SSD The fi fth-generation green memory
that features the industry’s highest IT investment effi ciency.
Encouraging sustainable
growth in the IT industry with
3D memory technology and
high-quality products
22
DS
Device Solutions
Memory
Business
20-nanometer 4Gb DRAM,
3D V-NAND Flash Memory
The industry’s fi rst next-
generation memory to push past
the semiconductor scaling limit.
24 252013 SAMSUNG ELECTRONICS ANNUAL REPORT
crosstalk. Other key accomplishments include the successful
development of 14-nanometer FinFET logic process and
design infrastructure for advanced mobi le SoCs and
development of the industry’s first 45-nanometer eFlash
process technology.
In 2014, we will focus on improving product competitive-
ness while setting the groundwork for next-generation
14-nanometer process technology. To meet market demand
for advanced system semiconductor products, we will
continue to provide Total Mobile Solution, including APs,
ModAPs* and CMOS image sensors with the industry’s highest
performance and energy efficiency. We will also strengthen
support for our foundry customers.
DS
Device Solutions
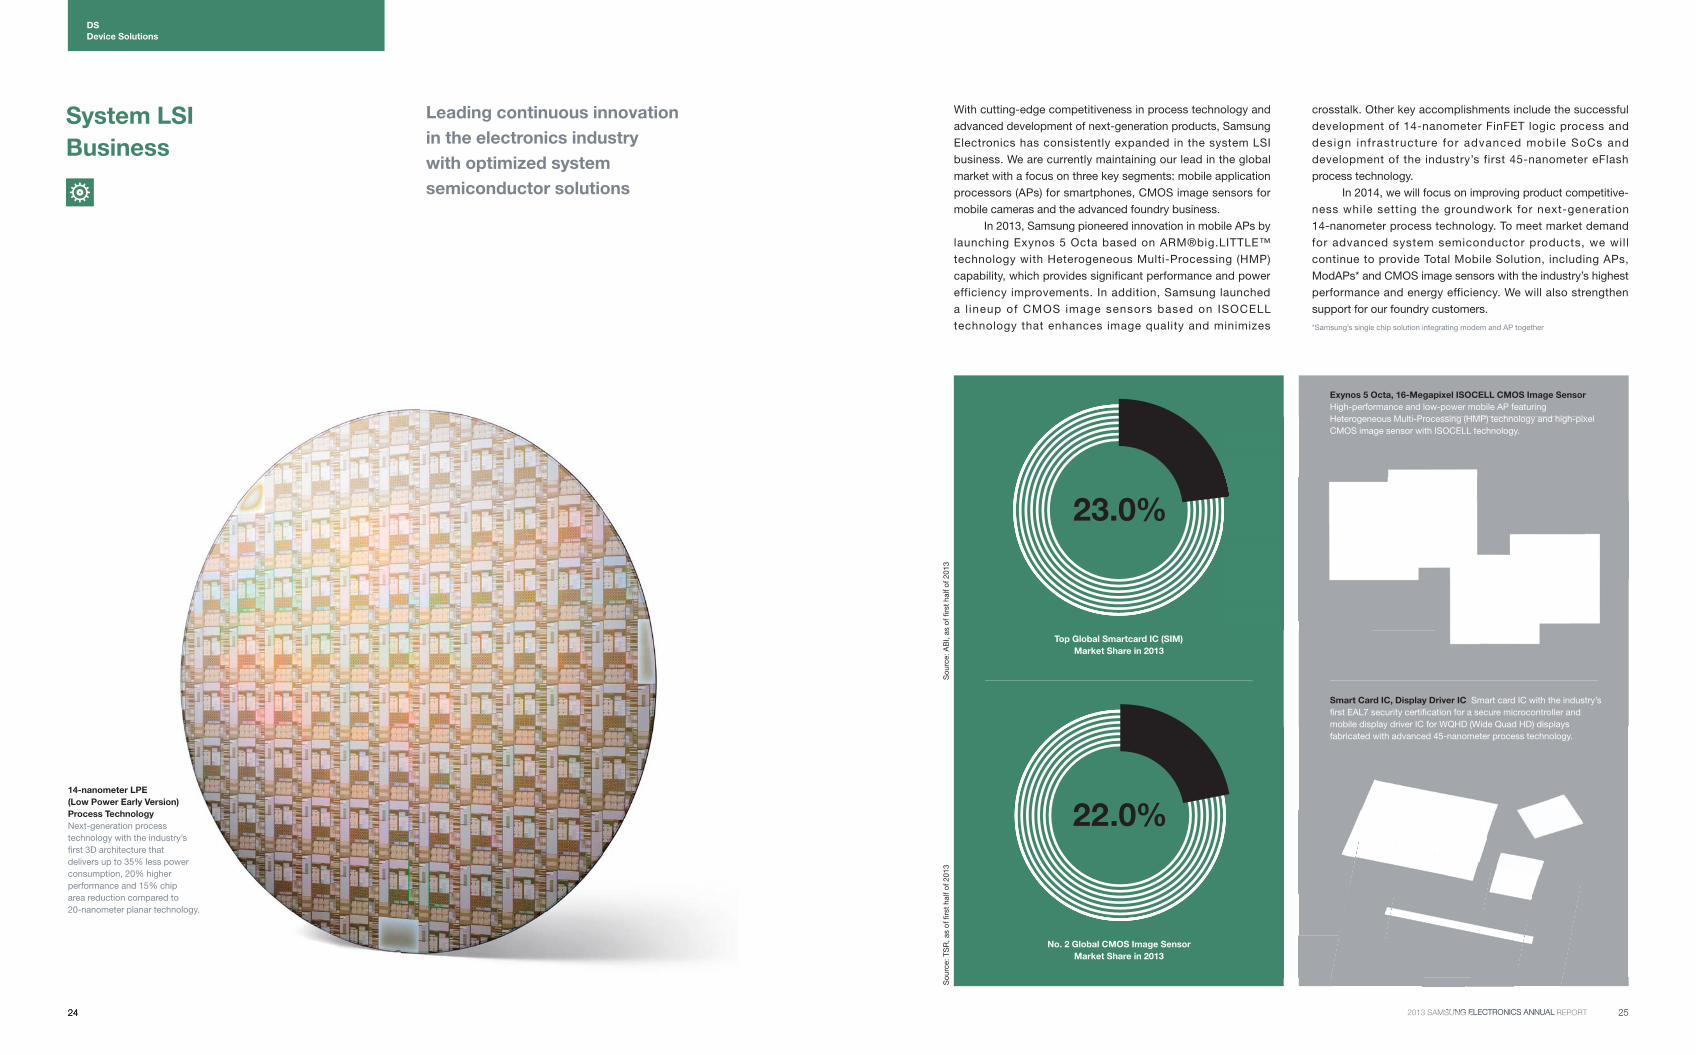
With cutting-edge competitiveness in process technology and
advanced development of next-generation products, Samsung
Electronics has consistently expanded in the system LSI
business. We are currently maintaining our lead in the global
market with a focus on three key segments: mobile application
processors (APs) for smartphones, CMOS image sensors for
mobile cameras and the advanced foundry business.
In 2013, Samsung pioneered innovation in mobile APs by
launching Exynos 5 Octa based on ARM®big.LITTLE™
technology with Heterogeneous Multi-Processing (HMP)
capability, which provides significant performance and power
efficiency improvements. In addition, Samsung launched
a l ineup of CMOS image sensors based on ISOCELL
technology that enhances image quality and minimizes
Top Global Smartcard IC (SIM)
Market Share in 2013
No. 2 Global CMOS Image Sensor
Market Share in 2013
23.0%
22.0%
So
urc
e: T
SR
, as o
f fi rs
t half o
f 2
01
3S
ourc
e: A
BI, a
s o
f fi rs
t half o
f 2013
*Samsung’s single chip solution integrating modem and AP together
Leading continuous innovation
in the electronics industry
with optimized system
semiconductor solutions
System LSI
Business
Smart Card IC, Display Driver IC Smart card IC with the industry’s
fi rst EAL7 security certifi cation for a secure microcontroller and
mobile display driver IC for WQHD (Wide Quad HD) displays
fabricated with advanced 45-nanometer process technology.
Exynos 5 Octa, 16-Megapixel ISOCELL CMOS Image Sensor
High-performance and low-power mobile AP featuring
Heterogeneous Multi-Processing (HMP) technology and high-pixel
CMOS image sensor with ISOCELL technology.
14-nanometer LPE
(Low Power Early Version)
Process Technology
Next-generation process
technology with the industry’s
fi rst 3D architecture that
delivers up to 35% less power
consumption, 20% higher
performance and 15% chip
area reduction compared to
20-nanometer planar technology.
26 272013 SAMSUNG ELECTRONICS ANNUAL REPORT
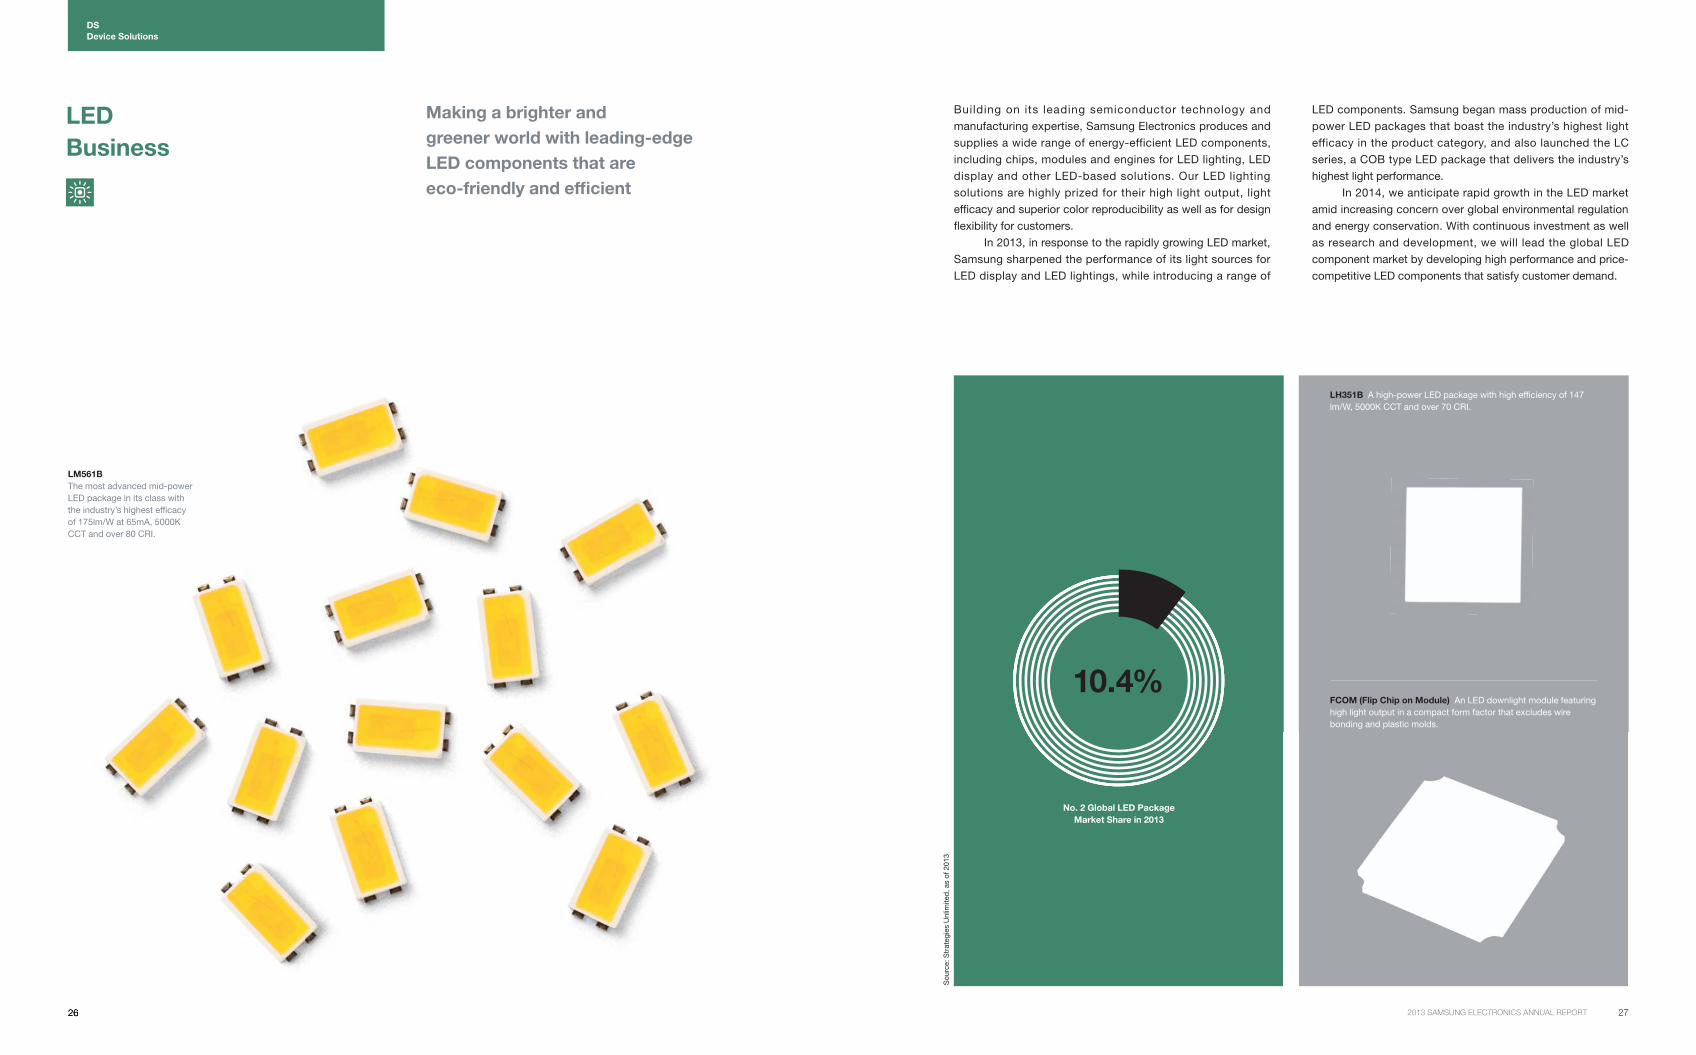
Building on its leading semiconductor technology and
manufacturing expertise, Samsung Electronics produces and
supplies a wide range of energy-efficient LED components,
including chips, modules and engines for LED lighting, LED
display and other LED-based solutions. Our LED lighting
solutions are highly prized for their high light output, light
effi cacy and superior color reproducibility as well as for design
fl exibility for customers.
In 2013, in response to the rapidly growing LED market,
Samsung sharpened the performance of its light sources for
LED display and LED lightings, while introducing a range of
LED components. Samsung began mass production of mid-
power LED packages that boast the industry’s highest light
efficacy in the product category, and also launched the LC
series, a COB type LED package that delivers the industry’s
highest light performance.
In 2014, we anticipate rapid growth in the LED market
amid increasing concern over global environmental regulation
and energy conservation. With continuous investment as well
as research and development, we will lead the global LED
component market by developing high performance and price-
competitive LED components that satisfy customer demand.
LH351B A high-power LED package with high effi ciency of 147
lm/W, 5000K CCT and over 70 CRI.
FCOM (Flip Chip on Module) An LED downlight module featuring
high light output in a compact form factor that excludes wire
bonding and plastic molds.
DS
Device Solutions
No. 2 Global LED Package
Market Share in 2013
10.4%
So
urc
e: S
trate
gie
s U
nlim
ited
, as o
f 2013
Making a brighter and
greener world with leading-edge
LED components that are
eco-friendly and effi cient
LED
Business
LM561B
The most advanced mid-power
LED package in its class with
the industry’s highest effi cacy
of 175lm/W at 65mA, 5000K
CCT and over 80 CRI.
28
Global Citizenship
Sharing and
Volunteering to
Support Hope
Green Management
Considering
the Planet
Measures That
Ensure Employee
Health and Safety
Expansion of
Win-Win
Partnerships to
Share Growth
We envision days that begin with amazing
surprises and everyday lives informed by
wonderful change. The more we increase
joyous moments, the more we gain indelible
memories. By living and working more
efficiently, we build both health and energy.
Samsung Electronics creates that value for
our customers and the world with
our advanced technology, wide range of
products and differentiated solutions.
We answer to the needs of our time while
responding to customer expectation.
From semiconductors to visual display,
digital appliances to business, medical
equipment and IT to mobile communications,
we are providing happier todays and
more creative tomorrows.
Samsung Electronics has long
invested in global corporate
citizenship. We continually
investigate ways to grow together,
care for local communities,
protect the planet, ensure safe
workplaces and support business
partners for mutual benefit.
We put the results of study into
action. We are connected with
everyone around the world who
dreams of being a good neighbor
and trustworthy companion as
we create a better world.
30 312013 SAMSUNG ELECTRONICS ANNUAL REPORT
Around the globe, Samsung Electronics has developed
Corporate Citizenship programs that focus on education,
professional training and healthcare, while also reflecting
the needs and characteristics of the region. We work to
improve education in disadvantaged areas by offering
educational infrastructure and e-learning opportunities to
students. We expand job opportunities for young adults with IT
vocational training. We improve the health and quality of lives
in disadvantaged regions with high-tech medical equipment.
Our specialized programs are co-developed and implemented
with regional NGO partners so we best understand and
address local issues.
Samsung Tech Institute
Samsung Tech Institute develops the independence and self-
reliance of young adults with systematic vocational education.
Programs vary with location. We train software engineers in
advanced countries and offer computer science classes in
developing countries. We nurture talent and create jobs by
operating 23 institutes in Europe, Central and Latin America,
Southeast Asia, the Middle East, Africa and more.
Samsung Smart School
Samsung Smart School works to bridge the global education
gap by improving educational environments for students in
disadvantaged areas. Tailored to regional needs, Smart School
Solutions include IT training curriculum for advanced countries
and basic educational infrastructure, such as buildings,
educational materials and books, for developing countries.
Begun in Korea and expanded to Europe and Southwest Asia,
there are now 383 Smart Schools worldwide.
Samsung Solve for Tomorrow
This is a global competition of students and teachers for ideas
that will solve social issues with STEM (Science, Technology,
Engineering and Math) knowhow. We present a social issue in
need of a solution, solicit ideas through the competition and
hold a workshop for selected winners to investigate how to
develop and implement a resolution. The program has spread
from North America and China to contests around the world.
Samsung Care Drive
Samsung Electronics first began supporting healthcare
programs in China, Russia and Africa with its advanced
medical equipment technology, products and services,
including ultrasonic diagnostic equipment and medical training
for local medical associations. We operate a mobile medical
center in areas that lack medical facilities and professionals to
promote health and quality of life for local residents.
The program will be expanded worldwide in the future.
Samsung Nanum Village
By contributing to local community development, Samsung
Nanum Village aims to target the roots of poverty and build
self-reliance. We provide comprehensive infrastructure, critical
basic services to socially disadvantaged populations.
In partnership with national governments, we select candidate
regions and offer support for education infrastructure, medical
facilities, clean water and the construction of community centers.
Samsung Employee Donations and Volunteering
Samsung Electronics employees have a long tradition of
helping neighbors at home and abroad. In Korea, we raise
social funds from employee donations and company matching
funds while most employees actively volunteer their time and
skills. In our workplaces around the world, we host volunteer
services that care for neighbors in need, address local issues
with IT classes and other education, participate in Habitat for
Humanity, mentor youth and disabled children and support
social welfare groups.
Sharing and Volunteering to
Support Hope
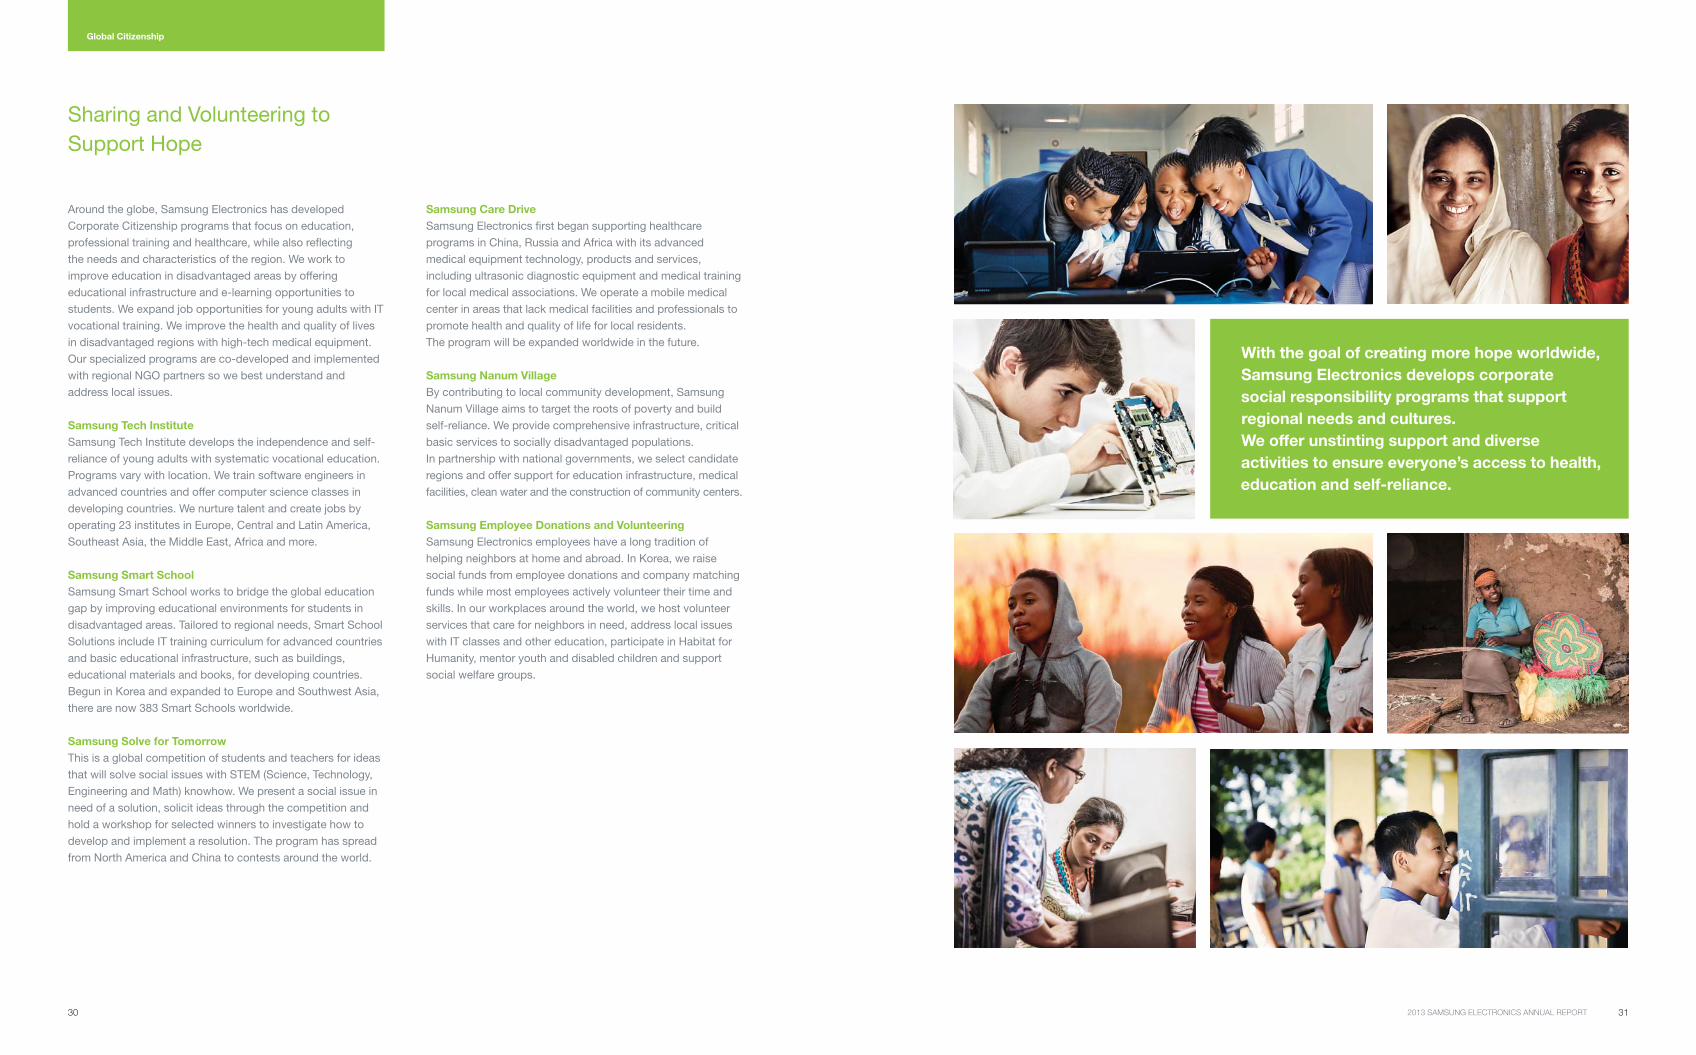
With the goal of creating more hope worldwide,
Samsung Electronics develops corporate
social responsibility programs that support
regional needs and cultures.
We offer unstinting support and diverse
activities to ensure everyone’s access to health,
education and self-reliance.
Global Citizenship
32 332013 SAMSUNG ELECTRONICS ANNUAL REPORT
Since the announcement of the Eco-Management 2013
strategy, a mid-term Green Management policy announced in
2009, we have successfully launched eco-friendly products,
developed green workplaces and reduced greenhouse gas
(GHG) emissions. As of 2013, we fulfilled its key goals of
a 50% reduction in GHG emissions intensity (tons per revenue
in KRW) and a 100% launch of eco-friendly products that are
eligible for global eco marks. In 2014, we are setting new goals
for green management to help realize a sustainable global
environment where nature, people and business can grow
in harmony.
Developing Green Products
We are focused on developing green technology and products
based on our main principles of minimizing environmental
impact across the entire product life cycle, from procurement,
manufacturing, distribution, usage to disposal. We are
launching products that embody the environmental values
of reducing energy consumption, resources and hazardous
substances, protecting water resources and leveraging green
wherever possible.
Operating Green Manufacturing Sites
All of our manufacturing sites practice systematic green
management and have earned ISO 14001 and ISO 50001
certifications, the recognized international standards for
environmental systems and energy management.
We monitor and control emissions of air and water pollutants
as well as ozone-depleting substances in accordance with
legal requirements and our stricter internal standards. We also
promote extensive programs to enhance efficiencies in using
water and raw materials.
Reducing Greenhouse Gas Emissions
We actively reduce greenhouse gas emissions from
our manufacturing sites and the use of our products by
improving the energy efficiency of manufacturing facilities
and by producing energy-efficient products. We are broading
the scope of GHG inventory management to include more
awareness on employee business trips, logistics and supplier
business activities.
Green Management
Considering the Planet
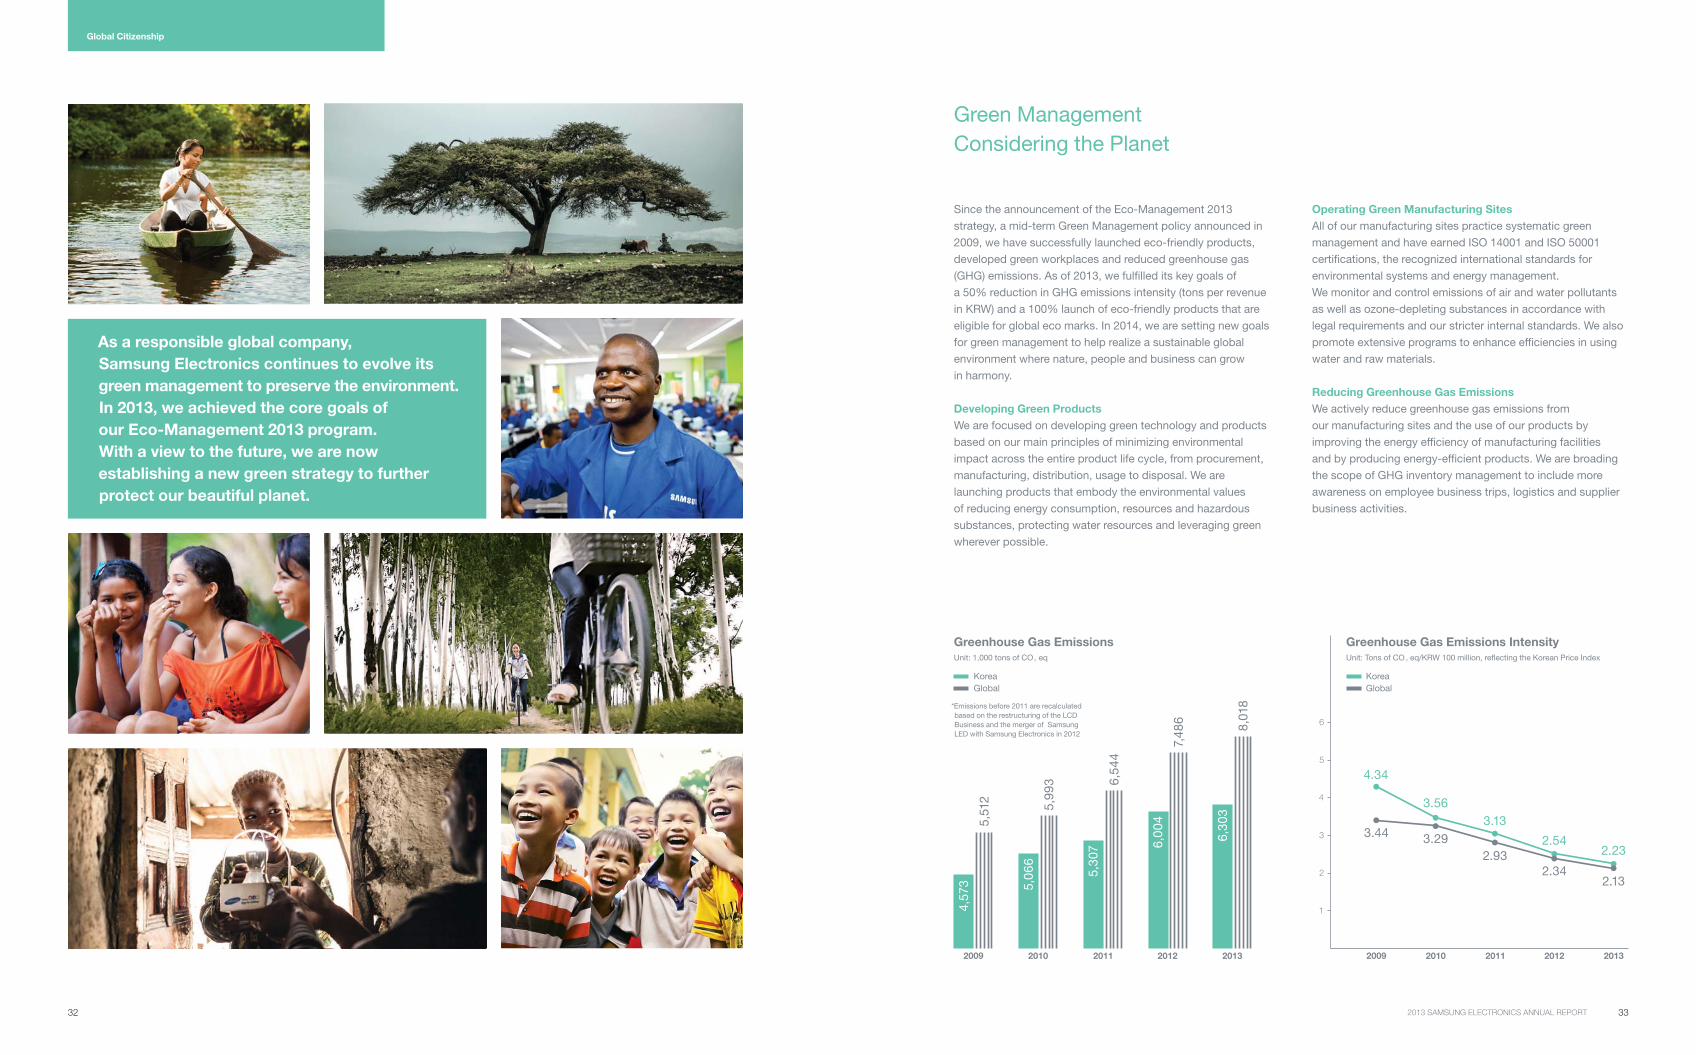
Greenhouse Gas EmissionsUnit: 1,000 tons of CO eq
Korea
Global
Greenhouse Gas Emissions Intensity Unit: Tons of CO eq/KRW 100 million, reflecting the Korean Price Index
Korea
Global
4.34
3.44 3.29
2.93
2.342.13
3.56
3.13
2.542.23
4,5
73
5,5
12
5,9
93
5,0
66
6,5
44
5,3
07
7,4
86
8,0
18
6,0
04
6,3
03
2009 2010 2011 2012 2013 2009
1
2
3
4
5
6
2010 2011 2012 2013
*Emissions before 2011 are recalculated
based on the restructuring of the LCD
Business and the merger of Samsung
LED with Samsung Electronics in 2012
As a responsible global company,
Samsung Electronics continues to evolve its
green management to preserve the environment.
In 2013, we achieved the core goals of
our Eco-Management 2013 program.
With a view to the future, we are now
establishing a new green strategy to further
protect our beautiful planet.
Global Citizenship
34 352013 SAMSUNG ELECTRONICS ANNUAL REPORT
Global Citizenship Global Citizenship
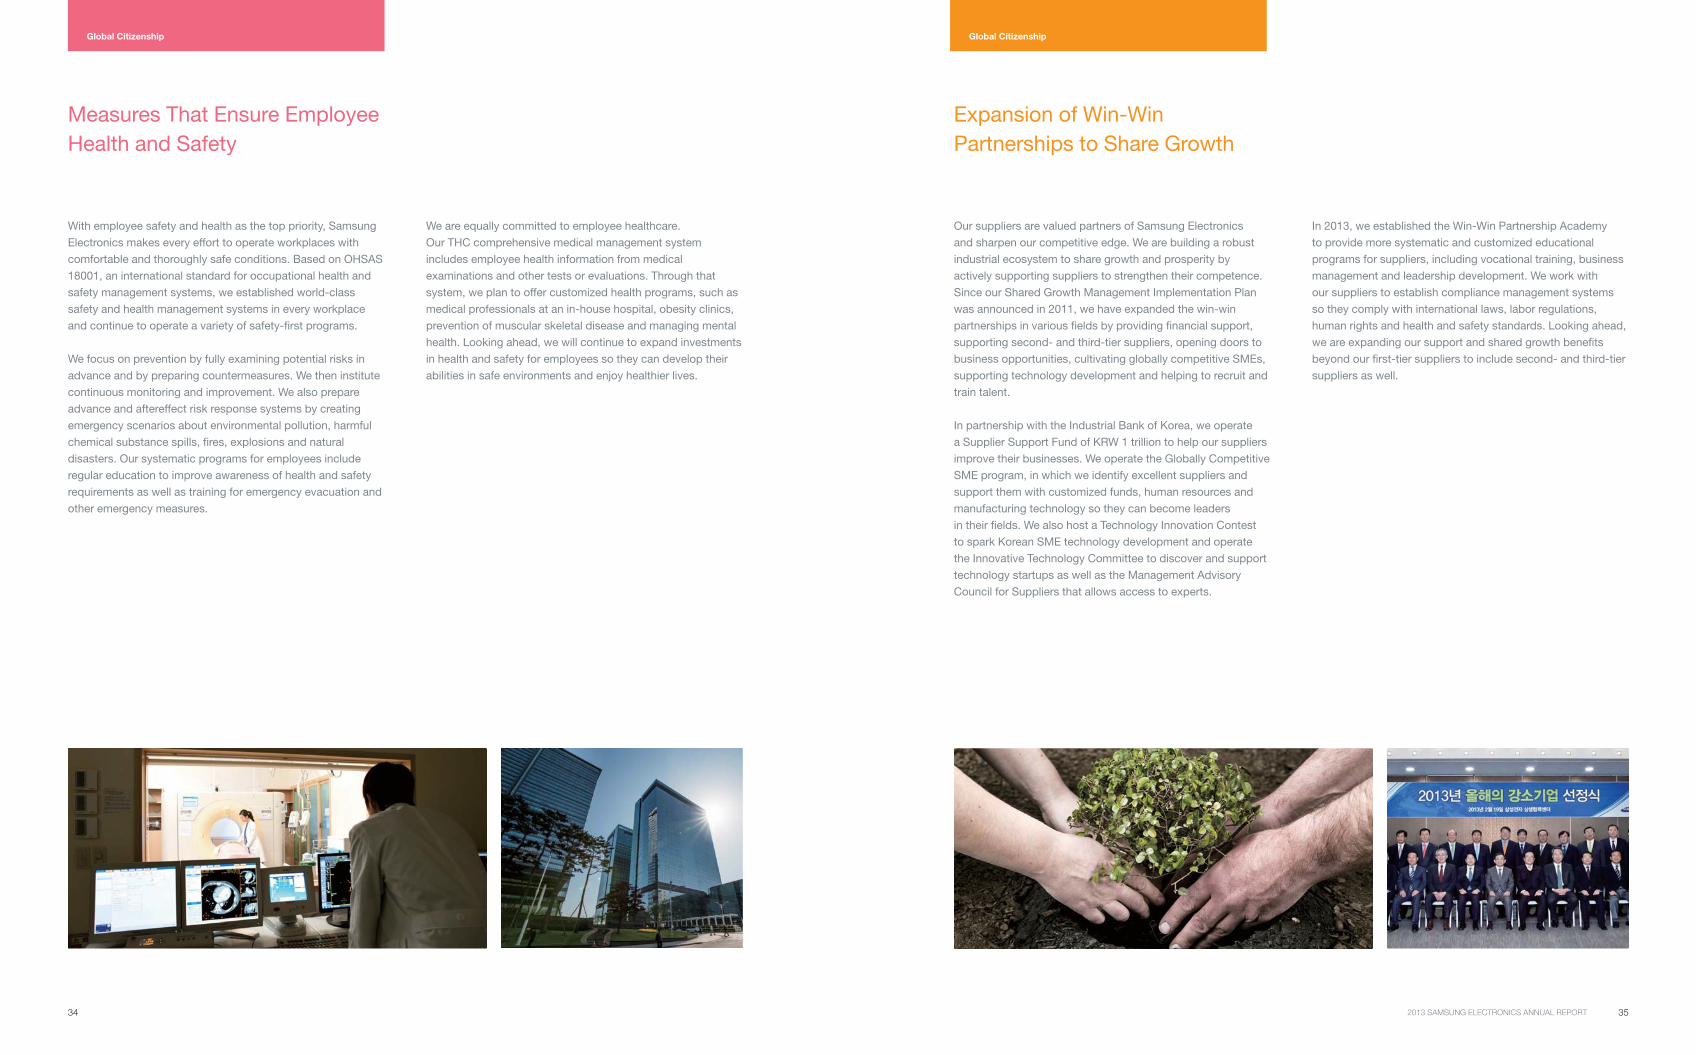
With employee safety and health as the top priority, Samsung
Electronics makes every effort to operate workplaces with
comfortable and thoroughly safe conditions. Based on OHSAS
18001, an international standard for occupational health and
safety management systems, we established world-class
safety and health management systems in every workplace
and continue to operate a variety of safety-first programs.
We focus on prevention by fully examining potential risks in
advance and by preparing countermeasures. We then institute
continuous monitoring and improvement. We also prepare
advance and aftereffect risk response systems by creating
emergency scenarios about environmental pollution, harmful
chemical substance spills, fires, explosions and natural
disasters. Our systematic programs for employees include
regular education to improve awareness of health and safety
requirements as well as training for emergency evacuation and
other emergency measures.
Our suppliers are valued partners of Samsung Electronics
and sharpen our competitive edge. We are building a robust
industrial ecosystem to share growth and prosperity by
actively supporting suppliers to strengthen their competence.
Since our Shared Growth Management Implementation Plan
was announced in 2011, we have expanded the win-win
partnerships in various fields by providing financial support,
supporting second- and third-tier suppliers, opening doors to
business opportunities, cultivating globally competitive SMEs,
supporting technology development and helping to recruit and
train talent.
In partnership with the Industrial Bank of Korea, we operate
a Supplier Support Fund of KRW 1 trillion to help our suppliers
improve their businesses. We operate the Globally Competitive
SME program, in which we identify excellent suppliers and
support them with customized funds, human resources and
manufacturing technology so they can become leaders
in their fields. We also host a Technology Innovation Contest
to spark Korean SME technology development and operate
the Innovative Technology Committee to discover and support
technology startups as well as the Management Advisory
Council for Suppliers that allows access to experts.
Measures That Ensure Employee
Health and Safety
Expansion of Win-Win
Partnerships to Share Growth
We are equally committed to employee healthcare.
Our THC comprehensive medical management system
includes employee health information from medical
examinations and other tests or evaluations. Through that
system, we plan to offer customized health programs, such as
medical professionals at an in-house hospital, obesity clinics,
prevention of muscular skeletal disease and managing mental
health. Looking ahead, we will continue to expand investments
in health and safety for employees so they can develop their
abilities in safe environments and enjoy healthier lives.
In 2013, we established the Win-Win Partnership Academy
to provide more systematic and customized educational
programs for suppliers, including vocational training, business
management and leadership development. We work with
our suppliers to establish compliance management systems
so they comply with international laws, labor regulations,
human rights and health and safety standards. Looking ahead,
we are expanding our support and shared growth benefits
beyond our first-tier suppliers to include second- and third-tier
suppliers as well.
36
Financial Statements
Report of Independent Auditors
Consolidated Financial Statements
Consolidated Statements of Financial Position
Consolidated Statements of Income
Consolidated Statements of Comprehensive Income
Consolidated Statements of Changes in Equity
Consolidated Statements of Cash Flows
Notes to the Consolidated Financial Statements
38
40
42
43
45
46
We all dream about making the world better
today and brighter tomorrow. Reaching for
that dream, Samsung Electronics is committed
to corporate citizenship around the globe.
We lend a hand to children who want to
learn and to young adults who want to work,
instilling them with optimistic energy.
We also help neighborhoods and communities
to embrace hope and health.
At the same time, with heartfelt appreciation,
we ensure the vital safety of our employees,
the continued growth of our business partners
and the essential preservation of the planet.
By believing, sharing and engaging,
we all will flourish and realize our dreams.
38 392013 SAMSUNG ELECTRONICS ANNUAL REPORT
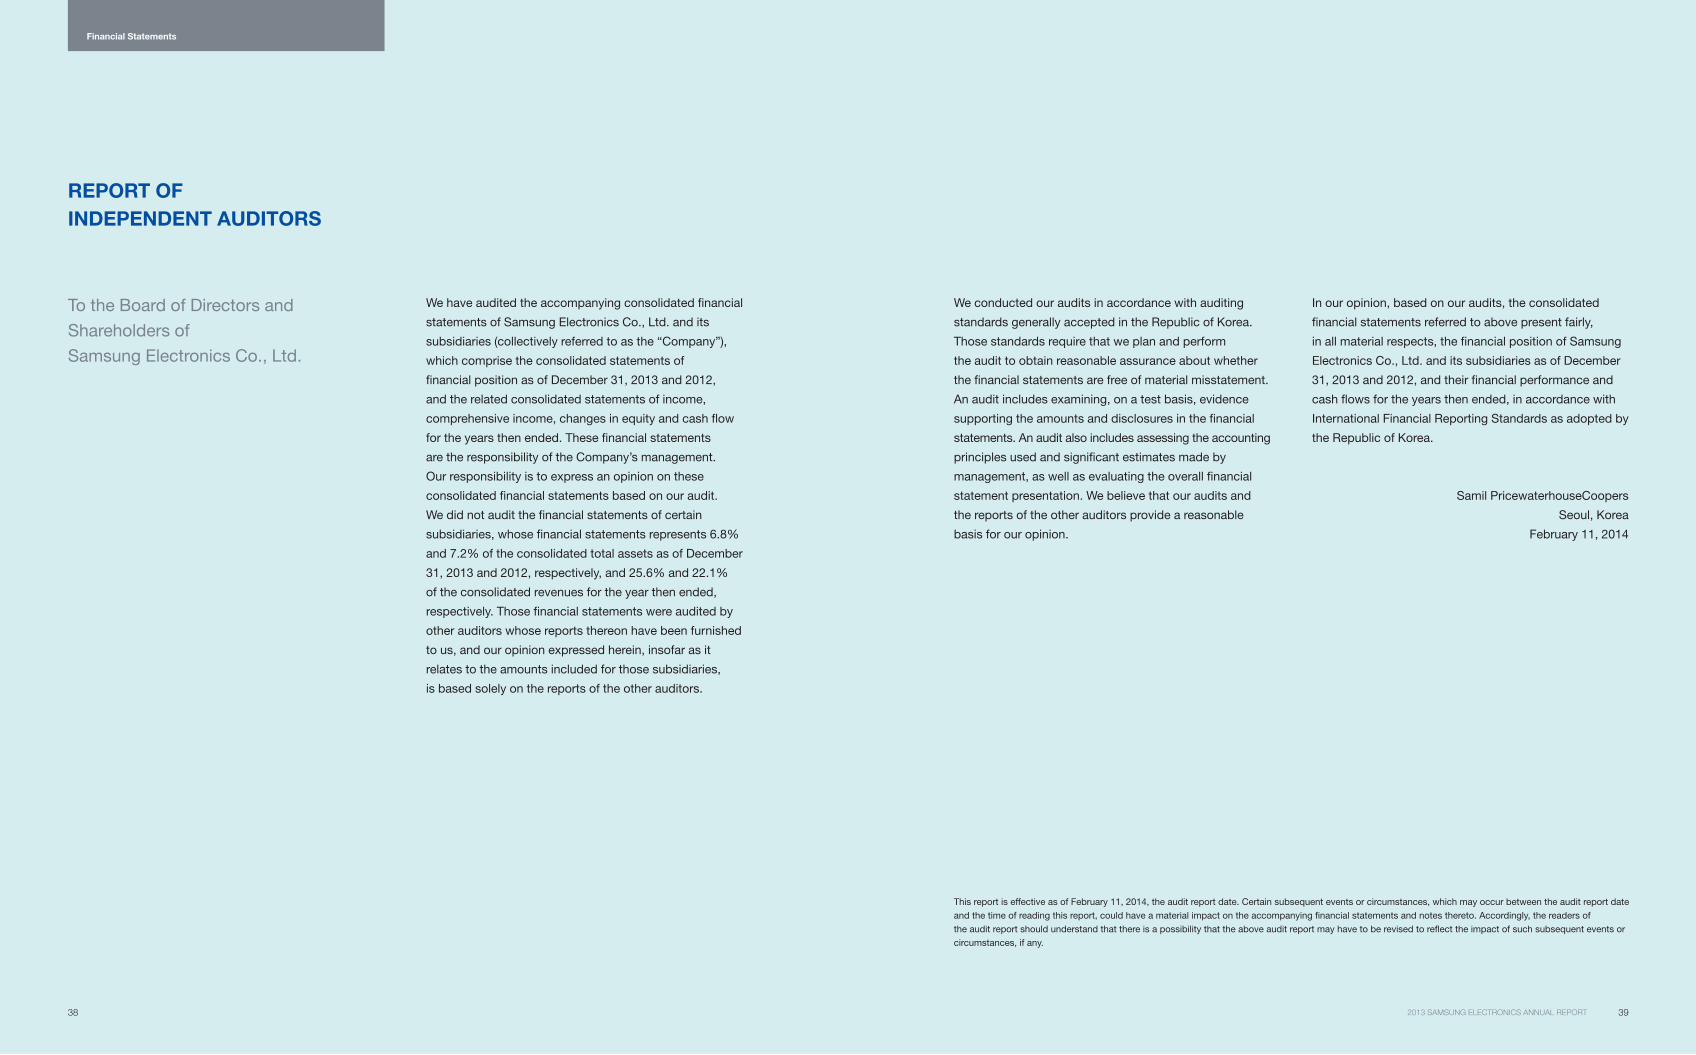
REPORT OF
INDEPENDENT AUDITORS
We have audited the accompanying consolidated financial
statements of Samsung Electronics Co., Ltd. and its
subsidiaries (collectively referred to as the “Company”),
which comprise the consolidated statements of
financial position as of December 31, 2013 and 2012,
and the related consolidated statements of income,
comprehensive income, changes in equity and cash flow
for the years then ended. These financial statements
are the responsibility of the Company’s management.
Our responsibility is to express an opinion on these
consolidated financial statements based on our audit.
We did not audit the financial statements of certain
subsidiaries, whose financial statements represents 6.8%
and 7.2% of the consolidated total assets as of December
31, 2013 and 2012, respectively, and 25.6% and 22.1%
of the consolidated revenues for the year then ended,
respectively. Those financial statements were audited by
other auditors whose reports thereon have been furnished
to us, and our opinion expressed herein, insofar as it
relates to the amounts included for those subsidiaries,
is based solely on the reports of the other auditors.
To the Board of Directors and
Shareholders of
Samsung Electronics Co., Ltd.
This report is effective as of February 11, 2014, the audit report date. Certain subsequent events or circumstances, which may occur between the audit report date
and the time of reading this report, could have a material impact on the accompanying financial statements and notes thereto. Accordingly, the readers of
the audit report should understand that there is a possibility that the above audit report may have to be revised to reflect the impact of such subsequent events or
circumstances, if any.
We conducted our audits in accordance with auditing
standards generally accepted in the Republic of Korea.
Those standards require that we plan and perform
the audit to obtain reasonable assurance about whether
the financial statements are free of material misstatement.
An audit includes examining, on a test basis, evidence
supporting the amounts and disclosures in the financial
statements. An audit also includes assessing the accounting
principles used and significant estimates made by
management, as well as evaluating the overall financial
statement presentation. We believe that our audits and
the reports of the other auditors provide a reasonable
basis for our opinion.
In our opinion, based on our audits, the consolidated
financial statements referred to above present fairly,
in all material respects, the financial position of Samsung
Electronics Co., Ltd. and its subsidiaries as of December
31, 2013 and 2012, and their financial performance and
cash flows for the years then ended, in accordance with
International Financial Reporting Standards as adopted by
the Republic of Korea.
Samil PricewaterhouseCoopers
Seoul, Korea
February 11, 2014
Financial Statements
40 412013 SAMSUNG ELECTRONICS ANNUAL REPORT
(In millions of Korean won, in thousands of US dollars (Note 2.28))
Notes December 31, 2013 December 31, 2012 December 31, 2013 December 31, 2012
KRW KRW USD USD
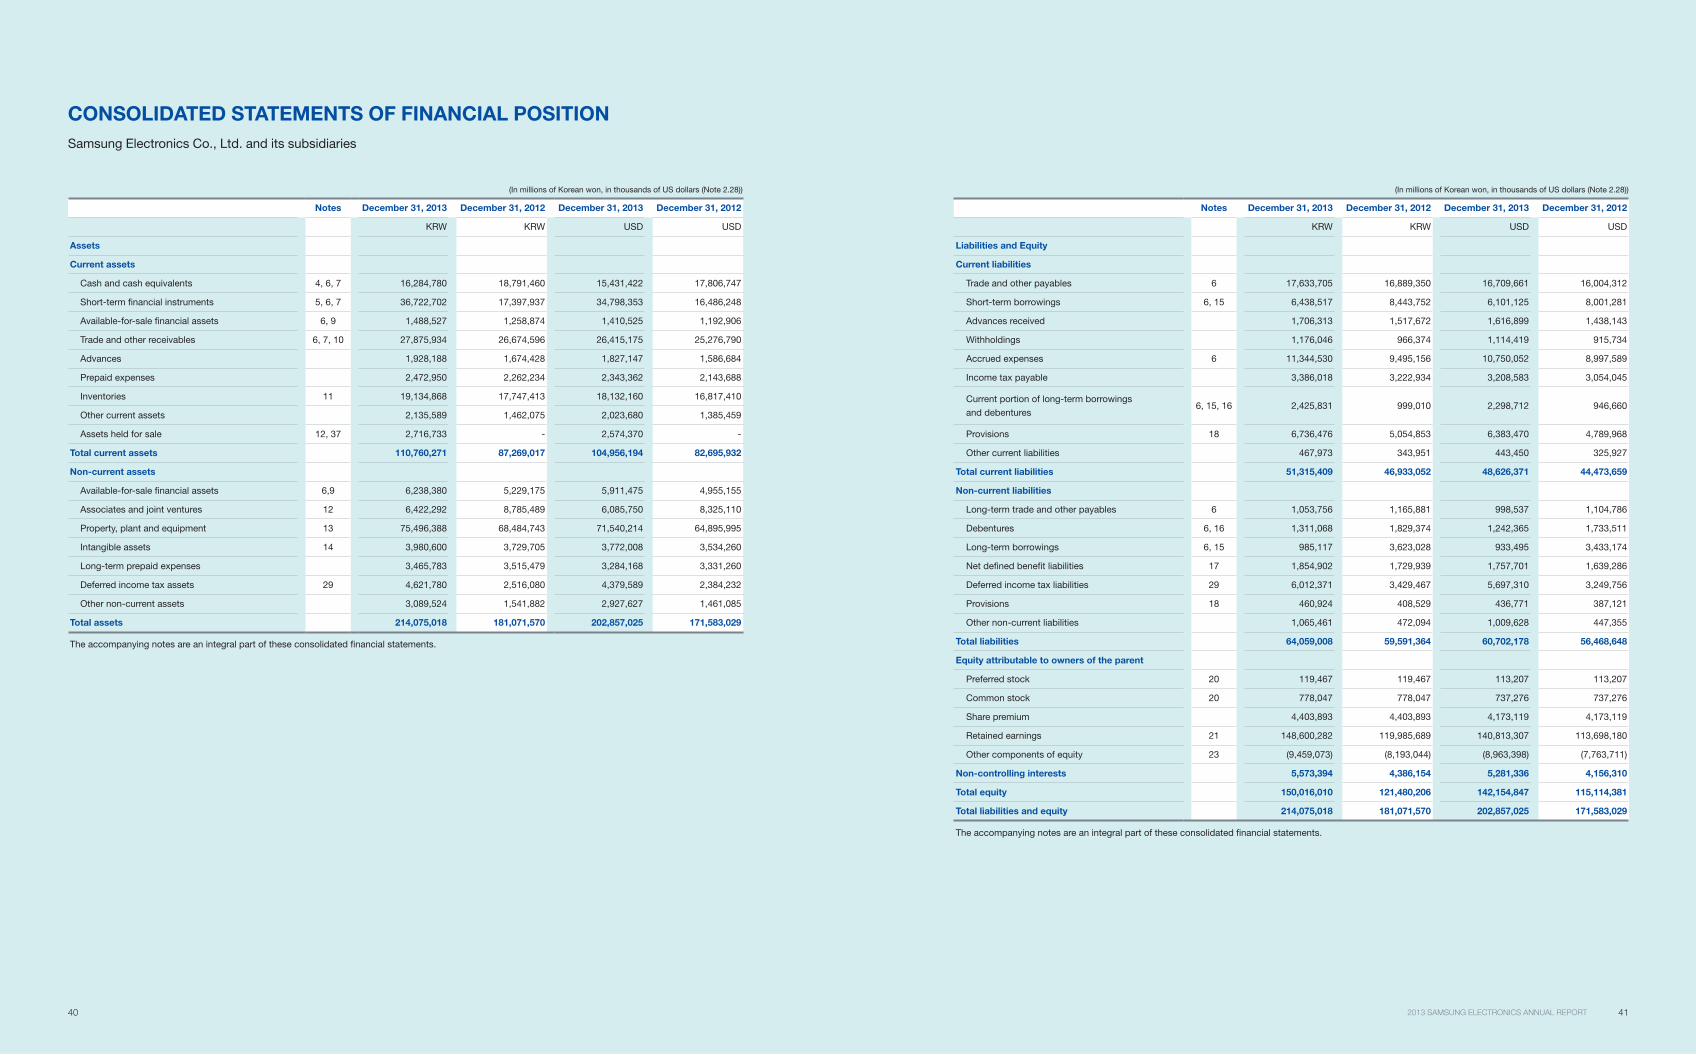
Liabilities and Equity
Current liabilities
Trade and other payables 6 17,633,705 16,889,350 16,709,661 16,004,312
Short-term borrowings 6, 15 6,438,517 8,443,752 6,101,125 8,001,281
Advances received 1,706,313 1,517,672 1,616,899 1,438,143
Withholdings 1,176,046 966,374 1,114,419 915,734
Accrued expenses 6 11,344,530 9,495,156 10,750,052 8,997,589
Income tax payable 3,386,018 3,222,934 3,208,583 3,054,045
Current portion of long-term borrowings
and debentures6, 15, 16 2,425,831 999,010 2,298,712 946,660
Provisions 18 6,736,476 5,054,853 6,383,470 4,789,968
Other current liabilities 467,973 343,951 443,450 325,927
Total current liabilities 51,315,409 46,933,052 48,626,371 44,473,659
Non-current liabilities
Long-term trade and other payables 6 1,053,756 1,165,881 998,537 1,104,786
Debentures 6, 16 1,311,068 1,829,374 1,242,365 1,733,511
Long-term borrowings 6, 15 985,117 3,623,028 933,495 3,433,174
Net defined benefit liabilities 17 1,854,902 1,729,939 1,757,701 1,639,286
Deferred income tax liabilities 29 6,012,371 3,429,467 5,697,310 3,249,756
Provisions 18 460,924 408,529 436,771 387,121
Other non-current liabilities 1,065,461 472,094 1,009,628 447,355
Total liabilities 64,059,008 59,591,364 60,702,178 56,468,648
Equity attributable to owners of the parent
Preferred stock 20 119,467 119,467 113,207 113,207
Common stock 20 778,047 778,047 737,276 737,276
Share premium 4,403,893 4,403,893 4,173,119 4,173,119
Retained earnings 21 148,600,282 119,985,689 140,813,307 113,698,180
Other components of equity 23 (9,459,073) (8,193,044) (8,963,398) (7,763,711)
Non-controlling interests 5,573,394 4,386,154 5,281,336 4,156,310
Total equity 150,016,010 121,480,206 142,154,847 115,114,381
Total liabilities and equity 214,075,018 181,071,570 202,857,025 171,583,029
The accompanying notes are an integral part of these consolidated financial statements.
CONSOLIDATED STATEMENTS OF FINANCIAL POSITION
Samsung Electronics Co., Ltd. and its subsidiaries
(In millions of Korean won, in thousands of US dollars (Note 2.28))
Notes December 31, 2013 December 31, 2012 December 31, 2013 December 31, 2012
KRW KRW USD USD
Assets
Current assets
Cash and cash equivalents 4, 6, 7 16,284,780 18,791,460 15,431,422 17,806,747
Short-term financial instruments 5, 6, 7 36,722,702 17,397,937 34,798,353 16,486,248
Available-for-sale financial assets 6, 9 1,488,527 1,258,874 1,410,525 1,192,906
Trade and other receivables 6, 7, 10 27,875,934 26,674,596 26,415,175 25,276,790
Advances 1,928,188 1,674,428 1,827,147 1,586,684
Prepaid expenses 2,472,950 2,262,234 2,343,362 2,143,688
Inventories 11 19,134,868 17,747,413 18,132,160 16,817,410
Other current assets 2,135,589 1,462,075 2,023,680 1,385,459
Assets held for sale 12, 37 2,716,733 - 2,574,370 -
Total current assets 110,760,271 87,269,017 104,956,194 82,695,932
Non-current assets
Available-for-sale financial assets 6,9 6,238,380 5,229,175 5,911,475 4,955,155
Associates and joint ventures 12 6,422,292 8,785,489 6,085,750 8,325,110
Property, plant and equipment 13 75,496,388 68,484,743 71,540,214 64,895,995
Intangible assets 14 3,980,600 3,729,705 3,772,008 3,534,260
Long-term prepaid expenses 3,465,783 3,515,479 3,284,168 3,331,260
Deferred income tax assets 29 4,621,780 2,516,080 4,379,589 2,384,232
Other non-current assets 3,089,524 1,541,882 2,927,627 1,461,085
Total assets 214,075,018 181,071,570 202,857,025 171,583,029
The accompanying notes are an integral part of these consolidated financial statements.
42 432013 SAMSUNG ELECTRONICS ANNUAL REPORT
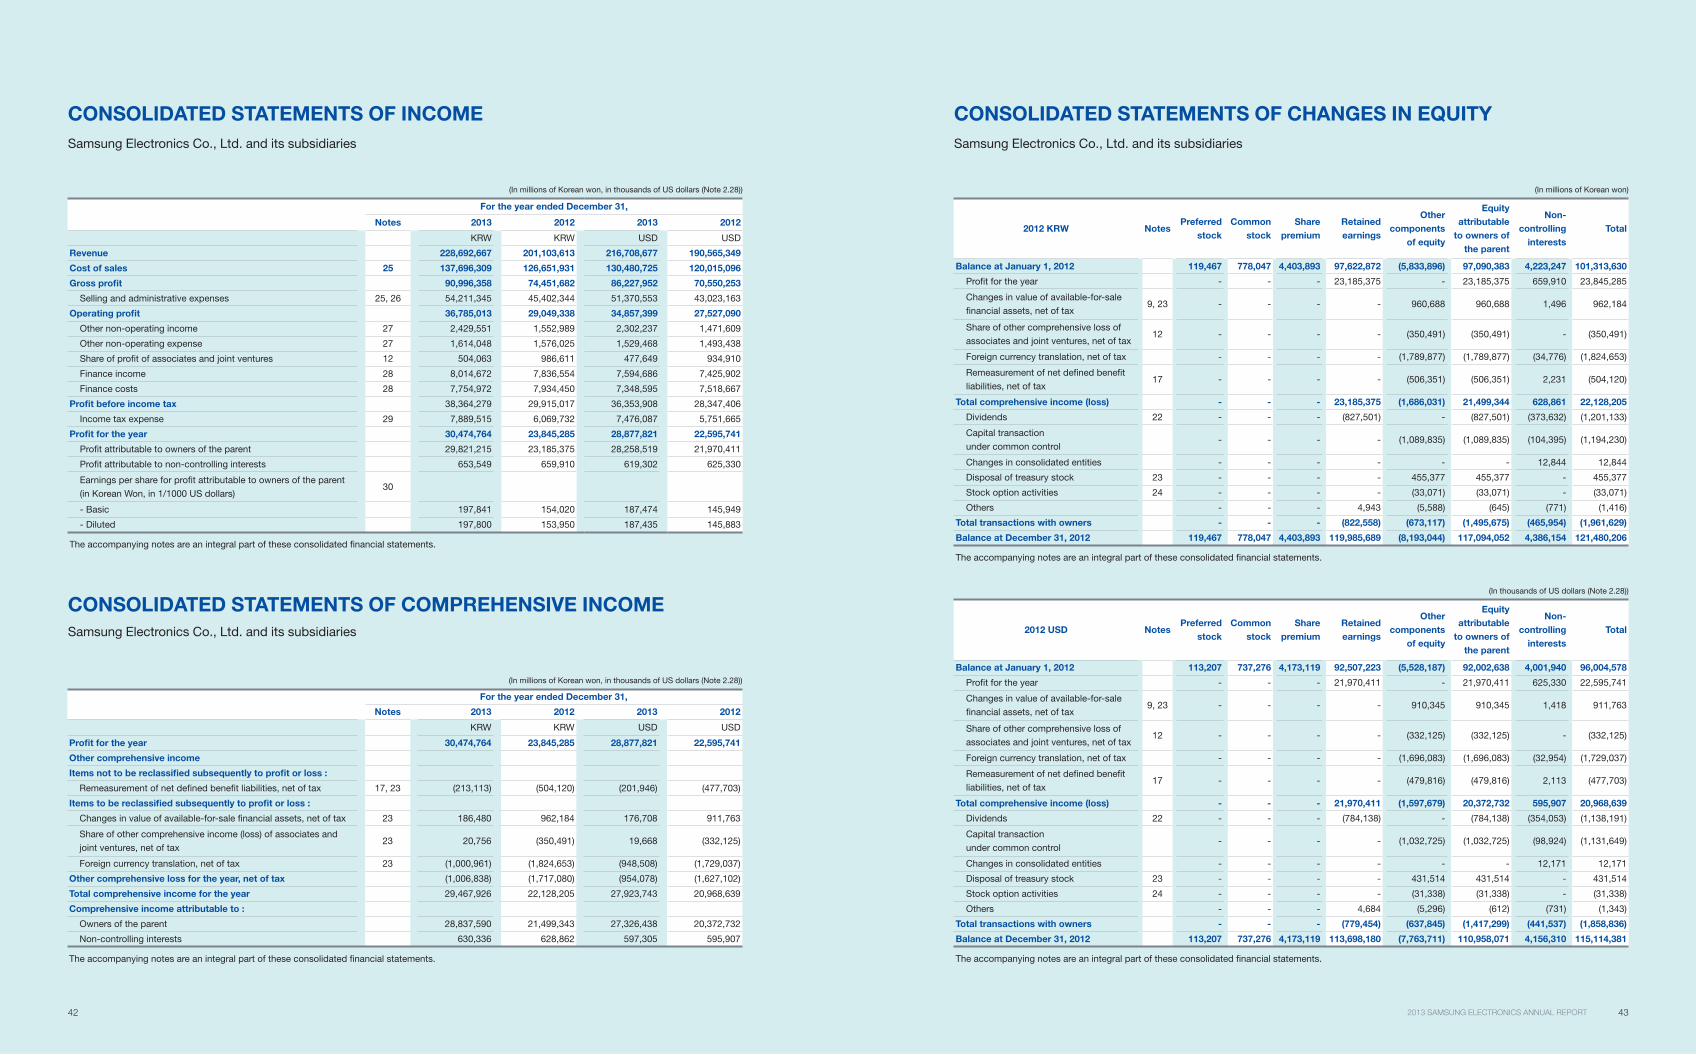
CONSOLIDATED STATEMENTS OF INCOME
Samsung Electronics Co., Ltd. and its subsidiaries
(In millions of Korean won, in thousands of US dollars (Note 2.28))
For the year ended December 31,
Notes 2013 2012 2013 2012
KRW KRW USD USD
Revenue 228,692,667 201,103,613 216,708,677 190,565,349
Cost of sales 25 137,696,309 126,651,931 130,480,725 120,015,096
Gross profit 90,996,358 74,451,682 86,227,952 70,550,253
Selling and administrative expenses 25, 26 54,211,345 45,402,344 51,370,553 43,023,163
Operating profit 36,785,013 29,049,338 34,857,399 27,527,090
Other non-operating income 27 2,429,551 1,552,989 2,302,237 1,471,609
Other non-operating expense 27 1,614,048 1,576,025 1,529,468 1,493,438
Share of profit of associates and joint ventures 12 504,063 986,611 477,649 934,910
Finance income 28 8,014,672 7,836,554 7,594,686 7,425,902
Finance costs 28 7,754,972 7,934,450 7,348,595 7,518,667
Profit before income tax 38,364,279 29,915,017 36,353,908 28,347,406
Income tax expense 29 7,889,515 6,069,732 7,476,087 5,751,665
Profit for the year 30,474,764 23,845,285 28,877,821 22,595,741
Profit attributable to owners of the parent 29,821,215 23,185,375 28,258,519 21,970,411
Profit attributable to non-controlling interests 653,549 659,910 619,302 625,330
Earnings per share for profit attributable to owners of the parent
(in Korean Won, in 1/1000 US dollars)30
- Basic 197,841 154,020 187,474 145,949
- Diluted 197,800 153,950 187,435 145,883
The accompanying notes are an integral part of these consolidated financial statements.
CONSOLIDATED STATEMENTS OF COMPREHENSIVE INCOME
Samsung Electronics Co., Ltd. and its subsidiaries
(In millions of Korean won, in thousands of US dollars (Note 2.28))
For the year ended December 31,
Notes 2013 2012 2013 2012
KRW KRW USD USD
Profit for the year 30,474,764 23,845,285 28,877,821 22,595,741
Other comprehensive income
Items not to be reclassified subsequently to profit or loss :
Remeasurement of net defined benefit liabilities, net of tax 17, 23 (213,113) (504,120) (201,946) (477,703)
Items to be reclassified subsequently to profit or loss :
Changes in value of available-for-sale financial assets, net of tax 23 186,480 962,184 176,708 911,763
Share of other comprehensive income (loss) of associates and
joint ventures, net of tax23 20,756 (350,491) 19,668 (332,125)
Foreign currency translation, net of tax 23 (1,000,961) (1,824,653) (948,508) (1,729,037)
Other comprehensive loss for the year, net of tax (1,006,838) (1,717,080) (954,078) (1,627,102)
Total comprehensive income for the year 29,467,926 22,128,205 27,923,743 20,968,639
Comprehensive income attributable to :
Owners of the parent 28,837,590 21,499,343 27,326,438 20,372,732
Non-controlling interests 630,336 628,862 597,305 595,907
The accompanying notes are an integral part of these consolidated financial statements.
CONSOLIDATED STATEMENTS OF CHANGES IN EQUITY
Samsung Electronics Co., Ltd. and its subsidiaries
(In millions of Korean won)
2012 KRW NotesPreferred
stock
Common
stock
Share
premium
Retained
earnings
Other
components
of equity
Equity
attributable
to owners of
the parent
Non-
controlling
interests
Total
Balance at January 1, 2012 119,467 778,047 4,403,893 97,622,872 (5,833,896) 97,090,383 4,223,247 101,313,630
Profit for the year - - - 23,185,375 - 23,185,375 659,910 23,845,285
Changes in value of available-for-sale
financial assets, net of tax9, 23 - - - - 960,688 960,688 1,496 962,184
Share of other comprehensive loss of
associates and joint ventures, net of tax12 - - - - (350,491) (350,491) - (350,491)
Foreign currency translation, net of tax - - - - (1,789,877) (1,789,877) (34,776) (1,824,653)
Remeasurement of net defined benefit
liabilities, net of tax17 - - - - (506,351) (506,351) 2,231 (504,120)
Total comprehensive income (loss) - - - 23,185,375 (1,686,031) 21,499,344 628,861 22,128,205
Dividends 22 - - - (827,501) - (827,501) (373,632) (1,201,133)
Capital transaction
under common control- - - - (1,089,835) (1,089,835) (104,395) (1,194,230)
Changes in consolidated entities - - - - - - 12,844 12,844
Disposal of treasury stock 23 - - - - 455,377 455,377 - 455,377
Stock option activities 24 - - - - (33,071) (33,071) - (33,071)
Others - - - 4,943 (5,588) (645) (771) (1,416)
Total transactions with owners - - - (822,558) (673,117) (1,495,675) (465,954) (1,961,629)
Balance at December 31, 2012 119,467 778,047 4,403,893 119,985,689 (8,193,044) 117,094,052 4,386,154 121,480,206
The accompanying notes are an integral part of these consolidated financial statements.
(In thousands of US dollars (Note 2.28))
2012 USD NotesPreferred
stock
Common
stock
Share
premium
Retained
earnings
Other
components
of equity
Equity
attributable
to owners of
the parent
Non-
controlling
interests
Total
Balance at January 1, 2012 113,207 737,276 4,173,119 92,507,223 (5,528,187) 92,002,638 4,001,940 96,004,578
Profit for the year - - - 21,970,411 - 21,970,411 625,330 22,595,741
Changes in value of available-for-sale
financial assets, net of tax9, 23 - - - - 910,345 910,345 1,418 911,763
Share of other comprehensive loss of
associates and joint ventures, net of tax12 - - - - (332,125) (332,125) - (332,125)
Foreign currency translation, net of tax - - - - (1,696,083) (1,696,083) (32,954) (1,729,037)
Remeasurement of net defined benefit
liabilities, net of tax17 - - - - (479,816) (479,816) 2,113 (477,703)
Total comprehensive income (loss) - - - 21,970,411 (1,597,679) 20,372,732 595,907 20,968,639
Dividends 22 - - - (784,138) - (784,138) (354,053) (1,138,191)
Capital transaction
under common control- - - - (1,032,725) (1,032,725) (98,924) (1,131,649)
Changes in consolidated entities - - - - - - 12,171 12,171
Disposal of treasury stock 23 - - - - 431,514 431,514 - 431,514
Stock option activities 24 - - - - (31,338) (31,338) - (31,338)
Others - - - 4,684 (5,296) (612) (731) (1,343)
Total transactions with owners - - - (779,454) (637,845) (1,417,299) (441,537) (1,858,836)
Balance at December 31, 2012 113,207 737,276 4,173,119 113,698,180 (7,763,711) 110,958,071 4,156,310 115,114,381
The accompanying notes are an integral part of these consolidated financial statements.
44 452013 SAMSUNG ELECTRONICS ANNUAL REPORT
(In millions of Korean won)
2013 KRW NotesPreferred
stock
Common
stock
Share
premium
Retained
earnings
Other
components
of equity
Equity
attributable
to owners
of the parent
Non-
controlling
interests
Total
Balance at January 1, 2013 119,467 778,047 4,403,893 119,985,689 (8,193,044) 117,094,052 4,386,154 121,480,206
Profit for the year - - - 29,821,215 - 29,821,215 653,549 30,474,764
Changes in value of available-for-sale
financial assets, net of tax9, 23 - - - - 187,477 187,477 (997) 186,480
Share of other comprehensive
income (loss) of associates and joint
ventures, net of tax
12 - - - - 20,949 20,949 (193) 20,756
Foreign currency translation, net of tax - - - - (986,691) (986,691) (14,270) (1,000,961)
Remeasurement of net defined benefit
liabilities, net of tax17 - - - - (205,360) (205,360) (7,753) (213,113)
Total comprehensive income (loss) - - - 29,821,215 (983,625) 28,837,590 630,336 29,467,926
Dividends 22 - - - (1,206,622) - (1,206,622) (42,155) (1,248,777)
Capital transaction
under common control- - - - (312,959) (312,959) 600,042 287,083
Changes in consolidated entities - - - - - - (918) (918)
Disposal of treasury stock 23 - - - - 41,817 41,817 - 41,817
Stock option activities 24 - - - - (11,999) (11,999) - (11,999)
Others - - - - 737 737 (65) 672
Total transactions with owners - - - (1,206,622) (282,404) (1,489,026) 556,904 (932,122)
Balance at December 31, 2013 119,467 778,047 4,403,893 148,600,282 (9,459,073) 144,442,616 5,573,394 150,016,010
The accompanying notes are an integral part of these consolidated financial statements.
(In thousands of US dollars (Note 2.28))
2013 USD NotesPreferred
stock
Common
stock
Share
premium
Retained
earnings
Other
components
of equity
Equity
attributable
to owners
of the parent
Non-
controlling
interests
Total
Balance at January 1, 2013 113,207 737,276 4,173,119 113,698,180 (7,763,711) 110,958,071 4,156,310 115,114,381
Profit for the year - - - 28,258,519 - 28,258,519 619,302 28,877,821
Changes in value of available-for-sale
financial assets, net of tax9, 23 - - - - 177,653 177,653 (945) 176,708
Share of other comprehensive
income (loss) of associates and joint
ventures, net of tax
12 - - - - 19,851 19,851 (183) 19,668
Foreign currency translation, net of tax - - - - (934,986) (934,986) (13,522) (948,508)
Remeasurement of net defined benefit
liabilities, net of tax17 - - - - (194,599) (194,599) (7,347) (201,946)
Total comprehensive income (loss) - - - 28,258,519 (932,081) 27,326,438 597,305 27,923,743
Dividends 22 - - - (1,143,392) - (1,143,392) (39,946) (1,183,338)
Capital transaction
under common control- - - - (296,559) (296,559) 568,599 272,040
Changes in consolidated entities - - - - - - (870) (870)
Disposal of treasury stock 23 - - - - 39,626 39,626 - 39,626
Stock option activities 24 - - - - (11,370) (11,370) - (11,370)
Others - - - - 697 697 (62) 635
Total transactions with owners - - - (1,143,392) (267,606) (1,410,998) 527,721 (883,277)
Balance at December 31, 2013 113,207 737,276 4,173,119 140,813,307 (8,963,398) 136,873,511 5,281,336 142,154,847
The accompanying notes are an integral part of these consolidated financial statements.
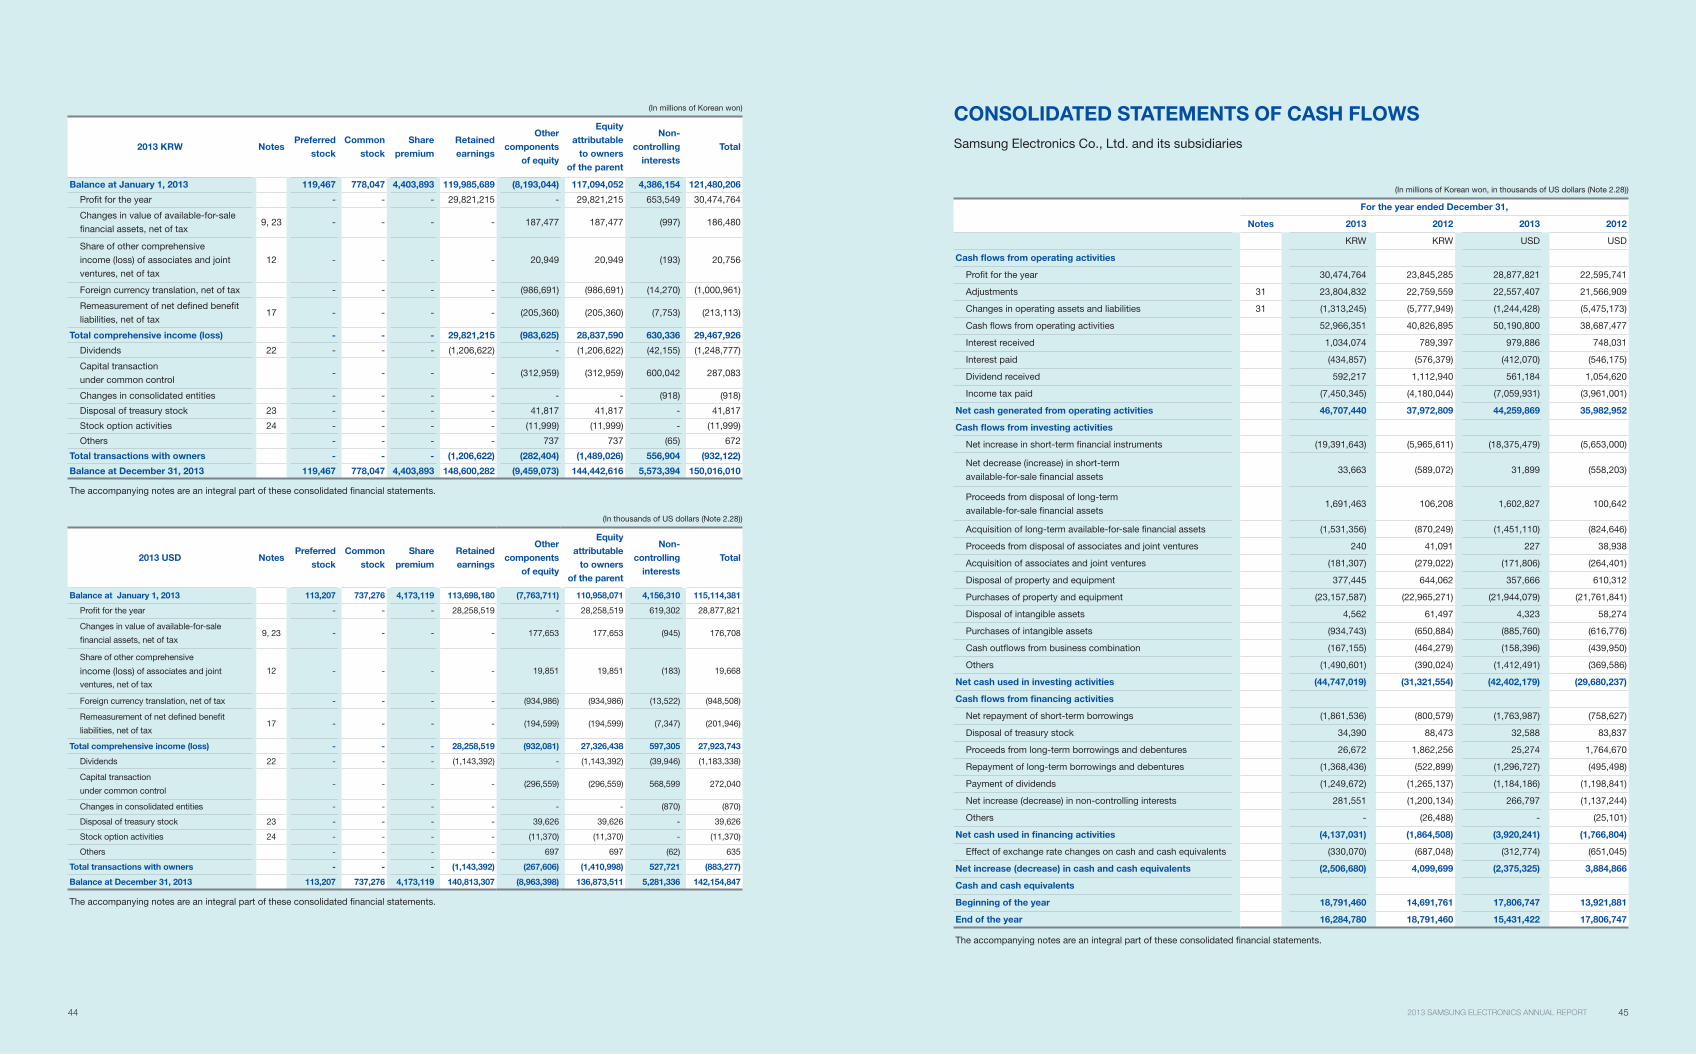
CONSOLIDATED STATEMENTS OF CASH FLOWS
Samsung Electronics Co., Ltd. and its subsidiaries
(In millions of Korean won, in thousands of US dollars (Note 2.28))
For the year ended December 31,
Notes 2013 2012 2013 2012
KRW KRW USD USD
Cash flows from operating activities
Profit for the year 30,474,764 23,845,285 28,877,821 22,595,741
Adjustments 31 23,804,832 22,759,559 22,557,407 21,566,909
Changes in operating assets and liabilities 31 (1,313,245) (5,777,949) (1,244,428) (5,475,173)
Cash flows from operating activities 52,966,351 40,826,895 50,190,800 38,687,477
Interest received 1,034,074 789,397 979,886 748,031
Interest paid (434,857) (576,379) (412,070) (546,175)
Dividend received 592,217 1,112,940 561,184 1,054,620
Income tax paid (7,450,345) (4,180,044) (7,059,931) (3,961,001)
Net cash generated from operating activities 46,707,440 37,972,809 44,259,869 35,982,952
Cash flows from investing activities
Net increase in short-term financial instruments (19,391,643) (5,965,611) (18,375,479) (5,653,000)
Net decrease (increase) in short-term
available-for-sale financial assets33,663 (589,072) 31,899 (558,203)
Proceeds from disposal of long-term
available-for-sale financial assets1,691,463 106,208 1,602,827 100,642
Acquisition of long-term available-for-sale financial assets (1,531,356) (870,249) (1,451,110) (824,646)
Proceeds from disposal of associates and joint ventures 240 41,091 227 38,938
Acquisition of associates and joint ventures (181,307) (279,022) (171,806) (264,401)
Disposal of property and equipment 377,445 644,062 357,666 610,312
Purchases of property and equipment (23,157,587) (22,965,271) (21,944,079) (21,761,841)
Disposal of intangible assets 4,562 61,497 4,323 58,274
Purchases of intangible assets (934,743) (650,884) (885,760) (616,776)
Cash outflows from business combination (167,155) (464,279) (158,396) (439,950)
Others (1,490,601) (390,024) (1,412,491) (369,586)
Net cash used in investing activities (44,747,019) (31,321,554) (42,402,179) (29,680,237)
Cash flows from financing activities
Net repayment of short-term borrowings (1,861,536) (800,579) (1,763,987) (758,627)
Disposal of treasury stock 34,390 88,473 32,588 83,837
Proceeds from long-term borrowings and debentures 26,672 1,862,256 25,274 1,764,670
Repayment of long-term borrowings and debentures (1,368,436) (522,899) (1,296,727) (495,498)
Payment of dividends (1,249,672) (1,265,137) (1,184,186) (1,198,841)
Net increase (decrease) in non-controlling interests 281,551 (1,200,134) 266,797 (1,137,244)
Others - (26,488) - (25,101)
Net cash used in financing activities (4,137,031) (1,864,508) (3,920,241) (1,766,804)
Effect of exchange rate changes on cash and cash equivalents (330,070) (687,048) (312,774) (651,045)
Net increase (decrease) in cash and cash equivalents (2,506,680) 4,099,699 (2,375,325) 3,884,866
Cash and cash equivalents
Beginning of the year 18,791,460 14,691,761 17,806,747 13,921,881
End of the year 16,284,780 18,791,460 15,431,422 17,806,747
The accompanying notes are an integral part of these consolidated financial statements.
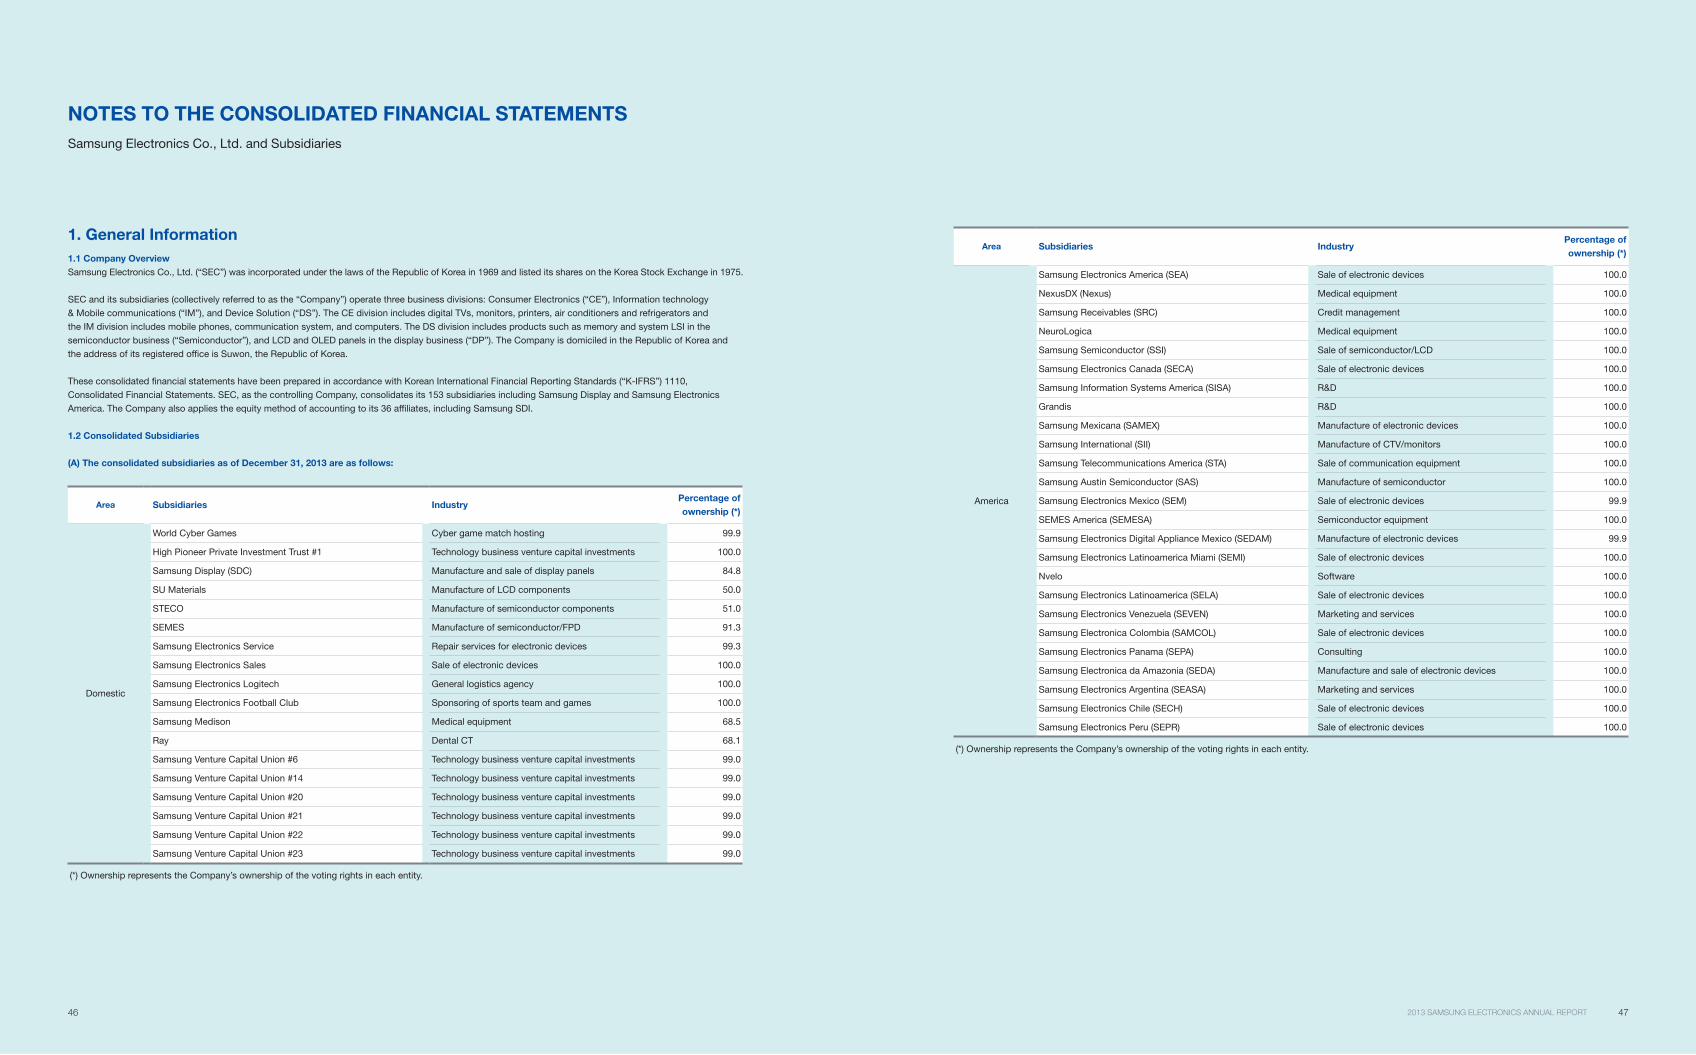
46 472013 SAMSUNG ELECTRONICS ANNUAL REPORT
Area Subsidiaries IndustryPercentage of
ownership (*)
America
Samsung Electronics America (SEA) Sale of electronic devices 100.0
NexusDX (Nexus) Medical equipment 100.0
Samsung Receivables (SRC) Credit management 100.0
NeuroLogica Medical equipment 100.0
Samsung Semiconductor (SSI) Sale of semiconductor/LCD 100.0
Samsung Electronics Canada (SECA) Sale of electronic devices 100.0
Samsung Information Systems America (SISA) R&D 100.0
Grandis R&D 100.0
Samsung Mexicana (SAMEX) Manufacture of electronic devices 100.0
Samsung International (SII) Manufacture of CTV/monitors 100.0
Samsung Telecommunications America (STA) Sale of communication equipment 100.0
Samsung Austin Semiconductor (SAS) Manufacture of semiconductor 100.0
Samsung Electronics Mexico (SEM) Sale of electronic devices 99.9
SEMES America (SEMESA) Semiconductor equipment 100.0
Samsung Electronics Digital Appliance Mexico (SEDAM) Manufacture of electronic devices 99.9
Samsung Electronics Latinoamerica Miami (SEMI) Sale of electronic devices 100.0
Nvelo Software 100.0
Samsung Electronics Latinoamerica (SELA) Sale of electronic devices 100.0
Samsung Electronics Venezuela (SEVEN) Marketing and services 100.0
Samsung Electronica Colombia (SAMCOL) Sale of electronic devices 100.0
Samsung Electronics Panama (SEPA) Consulting 100.0
Samsung Electronica da Amazonia (SEDA) Manufacture and sale of electronic devices 100.0
Samsung Electronics Argentina (SEASA) Marketing and services 100.0
Samsung Electronics Chile (SECH) Sale of electronic devices 100.0
Samsung Electronics Peru (SEPR) Sale of electronic devices 100.0
(*) Ownership represents the Company’s ownership of the voting rights in each entity.
NOTES TO THE CONSOLIDATED FINANCIAL STATEMENTS
Samsung Electronics Co., Ltd. and Subsidiaries
1. General Information
1.1 Company Overview
Samsung Electronics Co., Ltd. (“SEC”) was incorporated under the laws of the Republic of Korea in 1969 and listed its shares on the Korea Stock Exchange in 1975.
SEC and its subsidiaries (collectively referred to as the “Company”) operate three business divisions: Consumer Electronics (“CE”), Information technology
& Mobile communications (“IM”), and Device Solution (“DS”). The CE division includes digital TVs, monitors, printers, air conditioners and refrigerators and
the IM division includes mobile phones, communication system, and computers. The DS division includes products such as memory and system LSI in the
semiconductor business (“Semiconductor”), and LCD and OLED panels in the display business (“DP”). The Company is domiciled in the Republic of Korea and
the address of its registered office is Suwon, the Republic of Korea.
These consolidated financial statements have been prepared in accordance with Korean International Financial Reporting Standards (“K-IFRS”) 1110,
Consolidated Financial Statements. SEC, as the controlling Company, consolidates its 153 subsidiaries including Samsung Display and Samsung Electronics
America. The Company also applies the equity method of accounting to its 36 affiliates, including Samsung SDI.
1.2 Consolidated Subsidiaries
(A) The consolidated subsidiaries as of December 31, 2013 are as follows:
Area Subsidiaries IndustryPercentage of
ownership (*)
Domestic
World Cyber Games Cyber game match hosting 99.9
High Pioneer Private Investment Trust #1 Technology business venture capital investments 100.0
Samsung Display (SDC) Manufacture and sale of display panels 84.8
SU Materials Manufacture of LCD components 50.0
STECO Manufacture of semiconductor components 51.0
SEMES Manufacture of semiconductor/FPD 91.3
Samsung Electronics Service Repair services for electronic devices 99.3
Samsung Electronics Sales Sale of electronic devices 100.0
Samsung Electronics Logitech General logistics agency 100.0
Samsung Electronics Football Club Sponsoring of sports team and games 100.0
Samsung Medison Medical equipment 68.5
Ray Dental CT 68.1
Samsung Venture Capital Union #6 Technology business venture capital investments 99.0
Samsung Venture Capital Union #14 Technology business venture capital investments 99.0
Samsung Venture Capital Union #20 Technology business venture capital investments 99.0
Samsung Venture Capital Union #21 Technology business venture capital investments 99.0
Samsung Venture Capital Union #22 Technology business venture capital investments 99.0
Samsung Venture Capital Union #23 Technology business venture capital investments 99.0
(*) Ownership represents the Company’s ownership of the voting rights in each entity.
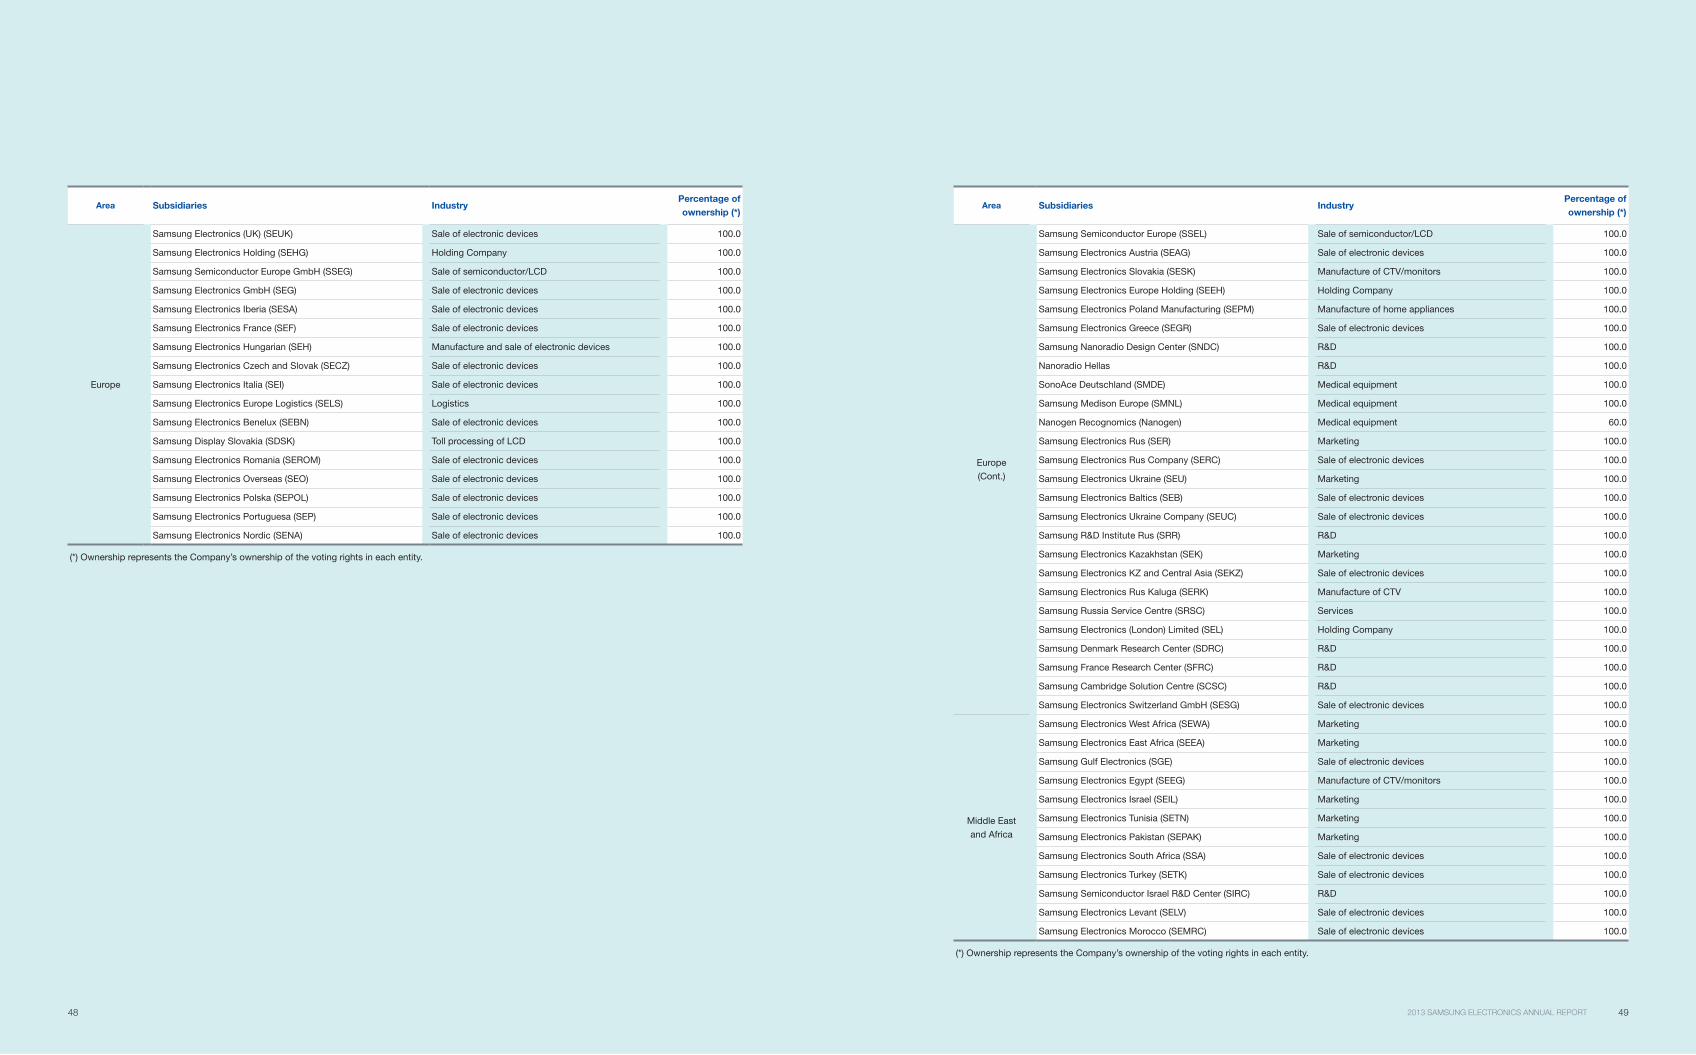
48 492013 SAMSUNG ELECTRONICS ANNUAL REPORT
Area Subsidiaries IndustryPercentage of
ownership (*)
Europe
Samsung Electronics (UK) (SEUK) Sale of electronic devices 100.0
Samsung Electronics Holding (SEHG) Holding Company 100.0
Samsung Semiconductor Europe GmbH (SSEG) Sale of semiconductor/LCD 100.0
Samsung Electronics GmbH (SEG) Sale of electronic devices 100.0
Samsung Electronics Iberia (SESA) Sale of electronic devices 100.0
Samsung Electronics France (SEF) Sale of electronic devices 100.0
Samsung Electronics Hungarian (SEH) Manufacture and sale of electronic devices 100.0
Samsung Electronics Czech and Slovak (SECZ) Sale of electronic devices 100.0
Samsung Electronics Italia (SEI) Sale of electronic devices 100.0
Samsung Electronics Europe Logistics (SELS) Logistics 100.0
Samsung Electronics Benelux (SEBN) Sale of electronic devices 100.0
Samsung Display Slovakia (SDSK) Toll processing of LCD 100.0
Samsung Electronics Romania (SEROM) Sale of electronic devices 100.0
Samsung Electronics Overseas (SEO) Sale of electronic devices 100.0
Samsung Electronics Polska (SEPOL) Sale of electronic devices 100.0
Samsung Electronics Portuguesa (SEP) Sale of electronic devices 100.0
Samsung Electronics Nordic (SENA) Sale of electronic devices 100.0
(*) Ownership represents the Company’s ownership of the voting rights in each entity.
Area Subsidiaries IndustryPercentage of
ownership (*)
Europe
(Cont.)
Samsung Semiconductor Europe (SSEL) Sale of semiconductor/LCD 100.0
Samsung Electronics Austria (SEAG) Sale of electronic devices 100.0
Samsung Electronics Slovakia (SESK) Manufacture of CTV/monitors 100.0
Samsung Electronics Europe Holding (SEEH) Holding Company 100.0
Samsung Electronics Poland Manufacturing (SEPM) Manufacture of home appliances 100.0
Samsung Electronics Greece (SEGR) Sale of electronic devices 100.0
Samsung Nanoradio Design Center (SNDC) R&D 100.0
Nanoradio Hellas R&D 100.0
SonoAce Deutschland (SMDE) Medical equipment 100.0
Samsung Medison Europe (SMNL) Medical equipment 100.0
Nanogen Recognomics (Nanogen) Medical equipment 60.0
Samsung Electronics Rus (SER) Marketing 100.0
Samsung Electronics Rus Company (SERC) Sale of electronic devices 100.0
Samsung Electronics Ukraine (SEU) Marketing 100.0
Samsung Electronics Baltics (SEB) Sale of electronic devices 100.0
Samsung Electronics Ukraine Company (SEUC) Sale of electronic devices 100.0
Samsung R&D Institute Rus (SRR) R&D 100.0
Samsung Electronics Kazakhstan (SEK) Marketing 100.0
Samsung Electronics KZ and Central Asia (SEKZ) Sale of electronic devices 100.0
Samsung Electronics Rus Kaluga (SERK) Manufacture of CTV 100.0
Samsung Russia Service Centre (SRSC) Services 100.0
Samsung Electronics (London) Limited (SEL) Holding Company 100.0
Samsung Denmark Research Center (SDRC) R&D 100.0
Samsung France Research Center (SFRC) R&D 100.0
Samsung Cambridge Solution Centre (SCSC) R&D 100.0
Samsung Electronics Switzerland GmbH (SESG) Sale of electronic devices 100.0
Middle East
and Africa
Samsung Electronics West Africa (SEWA) Marketing 100.0
Samsung Electronics East Africa (SEEA) Marketing 100.0
Samsung Gulf Electronics (SGE) Sale of electronic devices 100.0
Samsung Electronics Egypt (SEEG) Manufacture of CTV/monitors 100.0
Samsung Electronics Israel (SEIL) Marketing 100.0
Samsung Electronics Tunisia (SETN) Marketing 100.0
Samsung Electronics Pakistan (SEPAK) Marketing 100.0
Samsung Electronics South Africa (SSA) Sale of electronic devices 100.0
Samsung Electronics Turkey (SETK) Sale of electronic devices 100.0
Samsung Semiconductor Israel R&D Center (SIRC) R&D 100.0
Samsung Electronics Levant (SELV) Sale of electronic devices 100.0
Samsung Electronics Morocco (SEMRC) Sale of electronic devices 100.0
(*) Ownership represents the Company’s ownership of the voting rights in each entity.
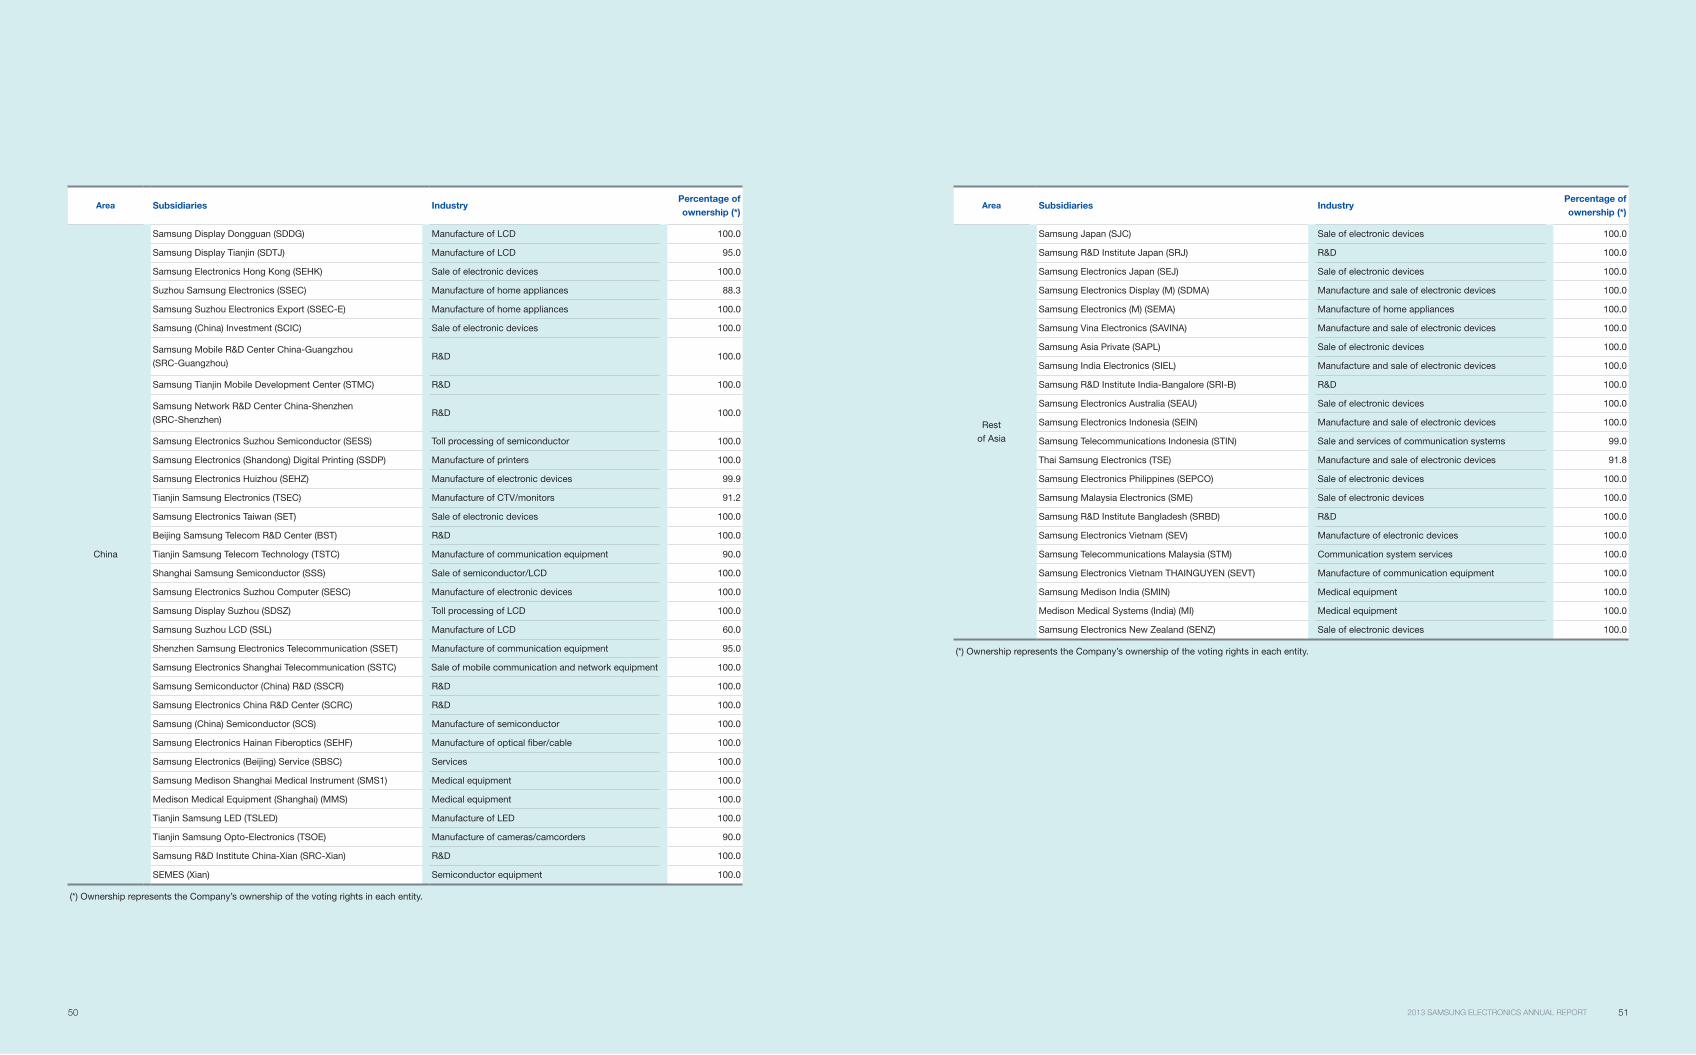
50 512013 SAMSUNG ELECTRONICS ANNUAL REPORT
Area Subsidiaries IndustryPercentage of
ownership (*)
China
Samsung Display Dongguan (SDDG) Manufacture of LCD 100.0
Samsung Display Tianjin (SDTJ) Manufacture of LCD 95.0
Samsung Electronics Hong Kong (SEHK) Sale of electronic devices 100.0
Suzhou Samsung Electronics (SSEC) Manufacture of home appliances 88.3
Samsung Suzhou Electronics Export (SSEC-E) Manufacture of home appliances 100.0
Samsung (China) Investment (SCIC) Sale of electronic devices 100.0
Samsung Mobile R&D Center China-Guangzhou
(SRC-Guangzhou)R&D 100.0
Samsung Tianjin Mobile Development Center (STMC) R&D 100.0
Samsung Network R&D Center China-Shenzhen
(SRC-Shenzhen)R&D 100.0
Samsung Electronics Suzhou Semiconductor (SESS) Toll processing of semiconductor 100.0
Samsung Electronics (Shandong) Digital Printing (SSDP) Manufacture of printers 100.0
Samsung Electronics Huizhou (SEHZ) Manufacture of electronic devices 99.9
Tianjin Samsung Electronics (TSEC) Manufacture of CTV/monitors 91.2
Samsung Electronics Taiwan (SET) Sale of electronic devices 100.0
Beijing Samsung Telecom R&D Center (BST) R&D 100.0
Tianjin Samsung Telecom Technology (TSTC) Manufacture of communication equipment 90.0
Shanghai Samsung Semiconductor (SSS) Sale of semiconductor/LCD 100.0
Samsung Electronics Suzhou Computer (SESC) Manufacture of electronic devices 100.0
Samsung Display Suzhou (SDSZ) Toll processing of LCD 100.0
Samsung Suzhou LCD (SSL) Manufacture of LCD 60.0
Shenzhen Samsung Electronics Telecommunication (SSET) Manufacture of communication equipment 95.0
Samsung Electronics Shanghai Telecommunication (SSTC) Sale of mobile communication and network equipment 100.0
Samsung Semiconductor (China) R&D (SSCR) R&D 100.0
Samsung Electronics China R&D Center (SCRC) R&D 100.0
Samsung (China) Semiconductor (SCS) Manufacture of semiconductor 100.0
Samsung Electronics Hainan Fiberoptics (SEHF) Manufacture of optical fiber/cable 100.0
Samsung Electronics (Beijing) Service (SBSC) Services 100.0
Samsung Medison Shanghai Medical Instrument (SMS1) Medical equipment 100.0
Medison Medical Equipment (Shanghai) (MMS) Medical equipment 100.0
Tianjin Samsung LED (TSLED) Manufacture of LED 100.0
Tianjin Samsung Opto-Electronics (TSOE) Manufacture of cameras/camcorders 90.0
Samsung R&D Institute China-Xian (SRC-Xian) R&D 100.0
SEMES (Xian) Semiconductor equipment 100.0
(*) Ownership represents the Company’s ownership of the voting rights in each entity.
Area Subsidiaries IndustryPercentage of
ownership (*)
Rest
of Asia
Samsung Japan (SJC) Sale of electronic devices 100.0
Samsung R&D Institute Japan (SRJ) R&D 100.0
Samsung Electronics Japan (SEJ) Sale of electronic devices 100.0
Samsung Electronics Display (M) (SDMA) Manufacture and sale of electronic devices 100.0
Samsung Electronics (M) (SEMA) Manufacture of home appliances 100.0
Samsung Vina Electronics (SAVINA) Manufacture and sale of electronic devices 100.0
Samsung Asia Private (SAPL) Sale of electronic devices 100.0
Samsung India Electronics (SIEL) Manufacture and sale of electronic devices 100.0
Samsung R&D Institute India-Bangalore (SRI-B) R&D 100.0
Samsung Electronics Australia (SEAU) Sale of electronic devices 100.0
Samsung Electronics Indonesia (SEIN) Manufacture and sale of electronic devices 100.0
Samsung Telecommunications Indonesia (STIN) Sale and services of communication systems 99.0
Thai Samsung Electronics (TSE) Manufacture and sale of electronic devices 91.8
Samsung Electronics Philippines (SEPCO) Sale of electronic devices 100.0
Samsung Malaysia Electronics (SME) Sale of electronic devices 100.0
Samsung R&D Institute Bangladesh (SRBD) R&D 100.0
Samsung Electronics Vietnam (SEV) Manufacture of electronic devices 100.0
Samsung Telecommunications Malaysia (STM) Communication system services 100.0
Samsung Electronics Vietnam THAINGUYEN (SEVT) Manufacture of communication equipment 100.0
Samsung Medison India (SMIN) Medical equipment 100.0
Medison Medical Systems (India) (MI) Medical equipment 100.0
Samsung Electronics New Zealand (SENZ) Sale of electronic devices 100.0
(*) Ownership represents the Company’s ownership of the voting rights in each entity.
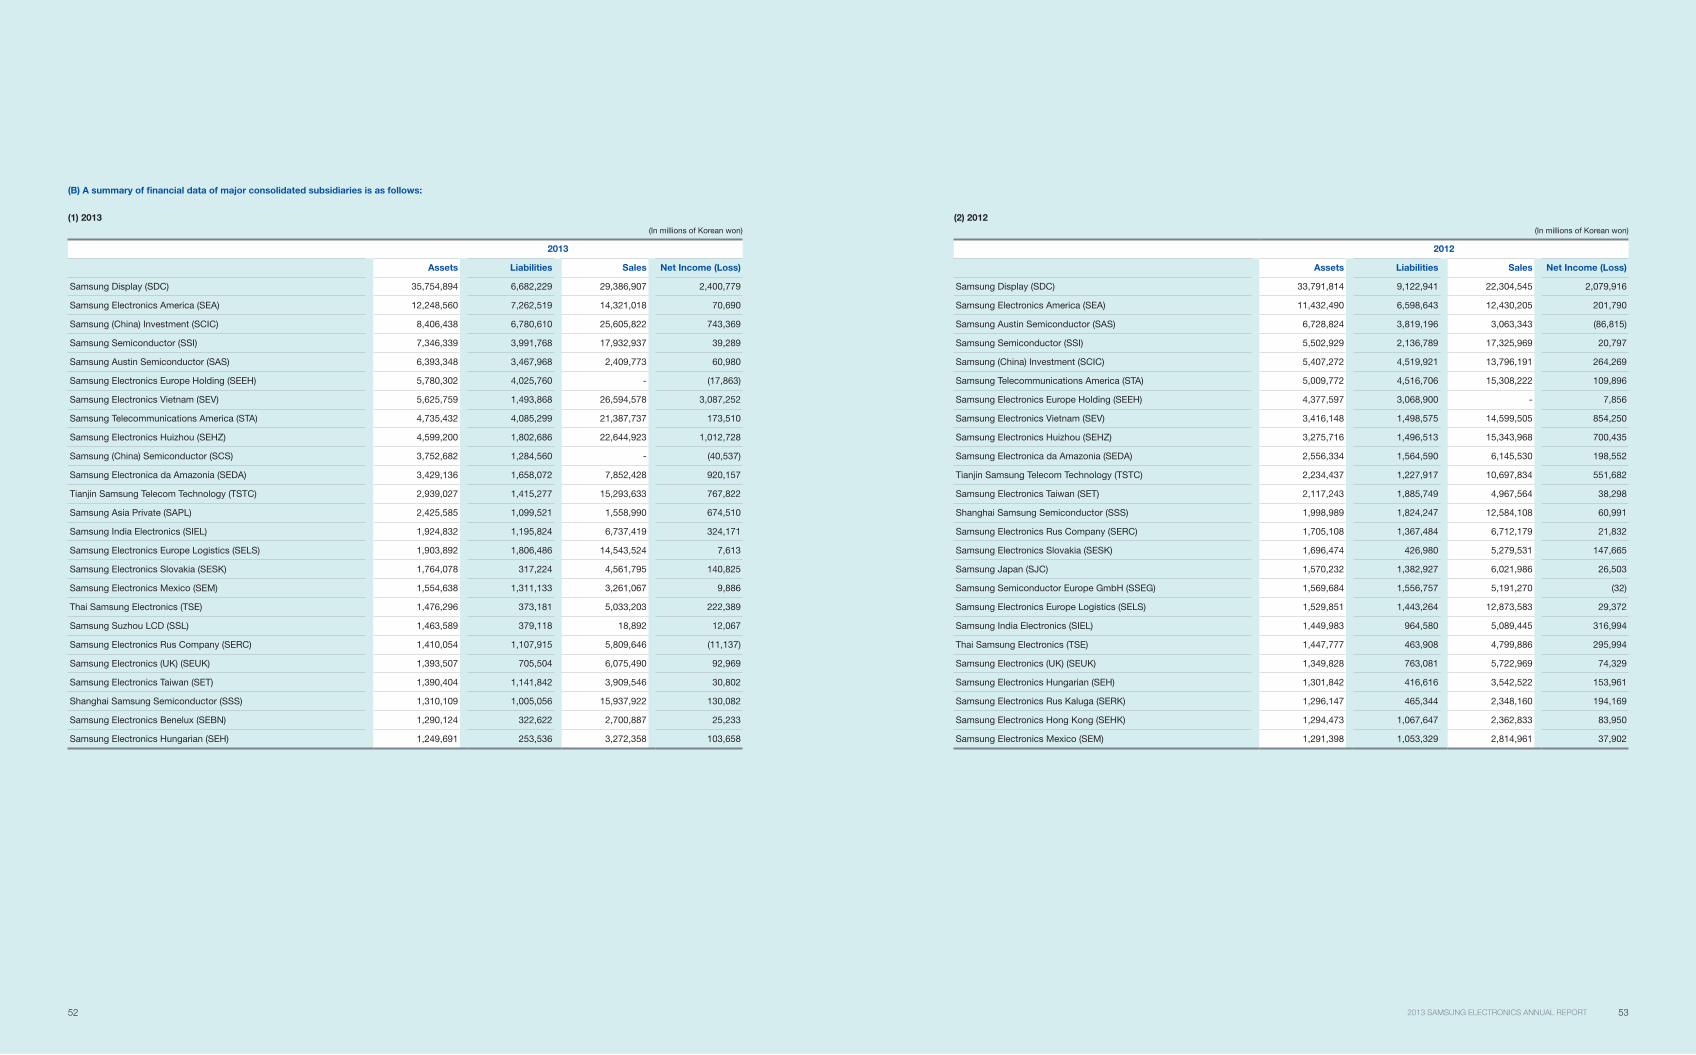
52 532013 SAMSUNG ELECTRONICS ANNUAL REPORT
(B) A summary of financial data of major consolidated subsidiaries is as follows:
(1) 2013
(In millions of Korean won)
2013
Assets Liabilities Sales Net Income (Loss)
Samsung Display (SDC) 35,754,894 6,682,229 29,386,907 2,400,779
Samsung Electronics America (SEA) 12,248,560 7,262,519 14,321,018 70,690
Samsung (China) Investment (SCIC) 8,406,438 6,780,610 25,605,822 743,369
Samsung Semiconductor (SSI) 7,346,339 3,991,768 17,932,937 39,289
Samsung Austin Semiconductor (SAS) 6,393,348 3,467,968 2,409,773 60,980
Samsung Electronics Europe Holding (SEEH) 5,780,302 4,025,760 - (17,863)
Samsung Electronics Vietnam (SEV) 5,625,759 1,493,868 26,594,578 3,087,252
Samsung Telecommunications America (STA) 4,735,432 4,085,299 21,387,737 173,510
Samsung Electronics Huizhou (SEHZ) 4,599,200 1,802,686 22,644,923 1,012,728
Samsung (China) Semiconductor (SCS) 3,752,682 1,284,560 - (40,537)
Samsung Electronica da Amazonia (SEDA) 3,429,136 1,658,072 7,852,428 920,157
Tianjin Samsung Telecom Technology (TSTC) 2,939,027 1,415,277 15,293,633 767,822
Samsung Asia Private (SAPL) 2,425,585 1,099,521 1,558,990 674,510
Samsung India Electronics (SIEL) 1,924,832 1,195,824 6,737,419 324,171
Samsung Electronics Europe Logistics (SELS) 1,903,892 1,806,486 14,543,524 7,613
Samsung Electronics Slovakia (SESK) 1,764,078 317,224 4,561,795 140,825
Samsung Electronics Mexico (SEM) 1,554,638 1,311,133 3,261,067 9,886
Thai Samsung Electronics (TSE) 1,476,296 373,181 5,033,203 222,389
Samsung Suzhou LCD (SSL) 1,463,589 379,118 18,892 12,067
Samsung Electronics Rus Company (SERC) 1,410,054 1,107,915 5,809,646 (11,137)
Samsung Electronics (UK) (SEUK) 1,393,507 705,504 6,075,490 92,969
Samsung Electronics Taiwan (SET) 1,390,404 1,141,842 3,909,546 30,802
Shanghai Samsung Semiconductor (SSS) 1,310,109 1,005,056 15,937,922 130,082
Samsung Electronics Benelux (SEBN) 1,290,124 322,622 2,700,887 25,233
Samsung Electronics Hungarian (SEH) 1,249,691 253,536 3,272,358 103,658
(2) 2012
(In millions of Korean won)
2012
Assets Liabilities Sales Net Income (Loss)
Samsung Display (SDC) 33,791,814 9,122,941 22,304,545 2,079,916
Samsung Electronics America (SEA) 11,432,490 6,598,643 12,430,205 201,790
Samsung Austin Semiconductor (SAS) 6,728,824 3,819,196 3,063,343 (86,815)
Samsung Semiconductor (SSI) 5,502,929 2,136,789 17,325,969 20,797
Samsung (China) Investment (SCIC) 5,407,272 4,519,921 13,796,191 264,269
Samsung Telecommunications America (STA) 5,009,772 4,516,706 15,308,222 109,896
Samsung Electronics Europe Holding (SEEH) 4,377,597 3,068,900 - 7,856
Samsung Electronics Vietnam (SEV) 3,416,148 1,498,575 14,599,505 854,250
Samsung Electronics Huizhou (SEHZ) 3,275,716 1,496,513 15,343,968 700,435
Samsung Electronica da Amazonia (SEDA) 2,556,334 1,564,590 6,145,530 198,552
Tianjin Samsung Telecom Technology (TSTC) 2,234,437 1,227,917 10,697,834 551,682
Samsung Electronics Taiwan (SET) 2,117,243 1,885,749 4,967,564 38,298
Shanghai Samsung Semiconductor (SSS) 1,998,989 1,824,247 12,584,108 60,991
Samsung Electronics Rus Company (SERC) 1,705,108 1,367,484 6,712,179 21,832
Samsung Electronics Slovakia (SESK) 1,696,474 426,980 5,279,531 147,665
Samsung Japan (SJC) 1,570,232 1,382,927 6,021,986 26,503
Samsung Semiconductor Europe GmbH (SSEG) 1,569,684 1,556,757 5,191,270 (32)
Samsung Electronics Europe Logistics (SELS) 1,529,851 1,443,264 12,873,583 29,372
Samsung India Electronics (SIEL) 1,449,983 964,580 5,089,445 316,994
Thai Samsung Electronics (TSE) 1,447,777 463,908 4,799,886 295,994
Samsung Electronics (UK) (SEUK) 1,349,828 763,081 5,722,969 74,329
Samsung Electronics Hungarian (SEH) 1,301,842 416,616 3,542,522 153,961
Samsung Electronics Rus Kaluga (SERK) 1,296,147 465,344 2,348,160 194,169
Samsung Electronics Hong Kong (SEHK) 1,294,473 1,067,647 2,362,833 83,950
Samsung Electronics Mexico (SEM) 1,291,398 1,053,329 2,814,961 37,902

54 552013 SAMSUNG ELECTRONICS ANNUAL REPORT
(C) Changes in scope for consolidation
(1) Subsidiaries newly included in the consolidation for the year ended December 31, 2013:
Area Subsidiaries Description
AmericaNeuroLogica Acquisition of shares
Intellectual Keystone Technology (IKT) Incorporation
Europe Samsung Electronics Switzerland GmbH (SESG) Incorporation
AsiaSamsung Electronics Vietnam THAINGUYEN (SEVT) Incorporation
Samsung Electronics New Zealand (SENZ) Incorporation
China
Samsung Network R&D Center China-Shenzhen (SRC-Shenzhen) Incorporation
Samsung R&D Institute China-Xian (SRC-Xian) Incorporation
SEMES (Xian) Incorporation
(2) Subsidiaries excluded from the consolidation for the year ended December 31, 2013:
Area Subsidiaries Description
DomesticSECRON Merger
GES Merger
America
Newton Sub Merger
Samsung Medison America (SMUS) Liquidation
Deltapoint Cardiac Diagnostics (Deltapoint) Liquidation
Intellectual Keystone Technology (IKT) Disposal of shares
mSpot Merger
Samsung Electronics Corporativo (SEC) Merger
Samsung Medison Brasil (SMBR) Merger
Europe
Samsung Telecoms (UK) (STUK) Liquidation
Samsung LCD Netherlands R&D Center (SNRC) Disposal
Samsung LCD Netherlands R&D Center UK (SNRC (UK)) Disposal
General RF Modules Liquidation
Samsung Medison France (SMFR) Liquidation
Samsung Opto-Electronics GmbH (SOG) Liquidation
Samsung Medison Italia (SMIT) Liquidation
Asia
Samsung Electronics Philippines Manufacturing (SEPHIL) Disposal
Batino Realty Corporation (BRC) Disposal
TNP Small/Medium Size & Venture Enterprise Growth Promotion Investment
Limited Partnership (TSUNAMI)Reclassified into an associate from a subsidiary
ChinaSamsung LCD Netherlands R&D Center HK (SNRC (HK)) Disposal
Medison (Shanghai) (SMS2) Liquidation
The principal accounting policies applied in the preparation of these
consolidated financial statements are set out below. These policies have
been consistently applied to all the years presented, unless otherwise
stated.
2.1 Basis of Presentation
The Company has prepared the consolidated financial statements in
accordance with Korean International Financial Reporting Standards
(“K-IFRS”). International Financial Reporting Standards (IFRS) have been
adopted by the Korean Accounting Standards Board as K-IFRS based on
standards and interpretations published by the International Accounting
Standards Board.
K-IFRS permits the use of critical accounting estimates in the preparation
of the financial statements and requires management judgments in applying
accounting policies. Footnote 3 explains where more complex and higher
standards of judgment or critical assumptions and estimates are required.
2.2 Changes in Accounting Policy and Disclosures
(A) New and amended standards adopted by the Company
The Company applied the following amended and enacted standards for
the annual period beginning on January 1, 2013:
K-IFRS 1110, ‘Consolidated Financial Statements’
The standard introduces a single control concept and provides a specific
guidance for the control. The adoption of this standard does not have an
impact on consolidation scope in the consolidated financial statements.
K-IFRS 1111, ‘Joint Arrangements’
The standard reflects the substance of joint arrangements and focuses on
the rights and obligations of the parties to the joint arrangements rather than
on the legal forms of the arrangements. Joint arrangements are classified
into joint operations or joint ventures. The adoption of this standard does
not have a material impact on the consolidated financial statements.
K-IFRS 1112, ‘Disclosure of Interests in Other Entities’
The standard provides disclosure requirements for all types of equity
investments in other entities including subsidiaries, joint arrangements,
associates and unconsolidated structured entities.
K-IFRS 1113, ‘Fair Value Measurement’
The standard provides a precise definition of fair value, and a single source
of fair value measurement and disclosure requirements for use across
K-IFRS. The adoption of this standard does not have a material impact on
the consolidated financial statements.
K-IFRS 1027, ‘Separate Financial Statements’
The standard contains accounting treatments and requirements for
investments in subsidiaries, associates, and joint ventures relating only to
separate financial statements of the Company.
(B) New and amended standards early adopted by the Company
Amendment to K-IFRS 1036, ‘Impairment of Assets’
The amendment reflects the change in disclosure requirement of
the recoverable amount for each cash-generating unit including goodwill
or intangible assets with indefinite useful lives. The amendment requires
disclosure of the recoverable amount only if the entity has recognized
impairment losses or reversals of impairment losses. For consistency,
the amendment also requires additional disclosures when the recoverable
amount of impaired assets is based on fair value less costs of disposal.
The amendment to this standard does not have a material impact on
the consolidated financial statements.
Amendments to K-IFRS 1110, ‘Consolidated Financial Statements’, K-IFRS
1112, ‘Disclosure of Interests in Other Entities’, and K-IFRS 1027, ‘Separate
Financial Statements’
The amendments define an investment entity and require a parent that is
an investment entity to measure its investments in particular subsidiaries at
fair value through profit or loss instead of presenting consolidated financial
statements. These amendments do not apply to a parent of an investment
entity if the parent itself is not an investment entity. The amendments to
K-IFRS 1110 and K-IFRS 1027 do not have a material impact on
the consolidated financial statements.
(C) New and amended standards not adopted by the Company
New standards, amendments and interpretations issued but not effective for
the financial year beginning January 1, 2013 and not early adopted are as
follows:
Amendment to K-IFRS 1032, ‘Financial Instruments: Presentation’
The standard provides that the right to offset must not be contingent on
a future event and must be legally enforceable in all of circumstances;
and if an entity can settle amounts in a manner such that outcome is,
in effect, equivalent to net settlement, the entity will meet the net settlement
criterion. This amendment is effective for annual periods beginning on
or after January 1, 2014, and the Company is assessing the impact of
application of this amendment on its consolidated financial statements.
Enactment of K-IFRIC Interpretations 2121, ‘Levies’
The interpretation requires that the liability to pay a levy is recognized when
the activity that triggers the payment of the levy occurs, as identified by
the legislation (the obligating event). This interpretation is effective for
annual periods beginning on or after January 1, 2014, with early adoption
permitted. The Company is assessing the impact of application of
this interpretation on its consolidated financial statements.
2.3 Consolidation
The Company prepares annual consolidated financial statements in
accordance with K-IFRS 1110, ‘Consolidated Financial Statements’
(A) Subsidiaries
Subsidiaries are all entities (including special purpose entities) over which
the Company has control. The Company controls the corresponding
investee when it is exposed, or has rights, to variable returns from its
involvement with the investee and has the ability to affect those returns
through its power over the investee. Consolidation of a subsidiary begins
from the date the Company obtains control of a subsidiary and ceases
when the Company loses control of the subsidiary.
2. Summary of Significant
Accounting Policies
56 572013 SAMSUNG ELECTRONICS ANNUAL REPORT
The Company applies the acquisition method to account for business
combinations. The consideration transferred is measured at the fair values
of the assets transferred, and identifiable assets acquired and liabilities
and contingent liabilities assumed in a business combination are initially
measured at their fair values at the acquisition date. The Company
recognizes any non-controlling interest in the acquiree on an acquisition-by-
acquisition basis in the event of liquidation at the non-controlling interest’s
proportionate share of the recognized amounts of acquiree’s identifiable net
assets. Acquisition-related costs are expensed as incurred.
Goodwill is recognized as the excess of (1) the aggregate of i) the
consideration transferred, ii) the amount of any non-controlling interest in
the acquiree and iii) the acquisition-date fair value of the Company’s
previously held equity interest in the acquiree over (2) the net identifiable
assets acquired. If the aggregate amount in (1) is less than the fair value of
the acquiree’s net assets in (2), the difference is recognized in profit or loss.
Balances of receivables and payables, income and expenses and unrealized
gains on transactions between the Company subsidiaries are eliminated.
Accounting policies of subsidiaries are changed where necessary to ensure
consistency with the policies adopted by the Company.
(B) Changes in ownership interests in subsidiaries without
change of control
Transactions with non-controlling interests that do not result in loss of
control are accounted for as equity transactions – that is, as transactions
with the owners in their capacity as owners. The difference between fair
value of any consideration paid and the relevant share acquired of the
carrying value of net assets of the subsidiary is recorded in equity. Gains or
losses on disposals to non-controlling interests are also recorded in equity.
(C) Disposal of subsidiaries
If the Company loses control of a subsidiary, any investment continuously
retained in the subsidiary is re-measured at its fair value at the date when
control is lost and any resulting differences are recognized in profit or loss.
Such fair value becomes the initial carrying amount for the subsequent
measurement of the retained interest accounted for as an associate, joint
venture, or financial asset. In addition, any amounts previously recognized
in other comprehensive income in respect of such entity are accounted for
as if the Company had directly disposed of the related assets or liabilities.
(D) Non-controlling interests
Each component of profit or loss and other comprehensive income is
attributed to owners of the parent and to non-controlling interests. Total
comprehensive income is attributed to owners of the parent and to non-
controlling interests even if this results in a negative balance of non-
controlling interests.
(E) Associates
Associates are all entities over which the Company has significant influence,
generally investees of which from 20% to 50% of voting stock is owned
by the Company. Investments in associates are initially recognized at
acquisition cost using the equity method. Unrealized gains on transactions
between the Company and its associates are eliminated to the extent of
the Company’s interest in the associates. If there is any objective evidence
that the investment in the associate is impaired, the Company recognizes
the difference between the recoverable amount of the associate and
its book value as impairment loss.
(F) Joint arrangements
A joint arrangement of which two or more parties have joint control is
classified as either a joint operation or a joint venture. A joint operator has
rights to the assets, and obligations for the liabilities, relating to the joint
operation and recognizes the assets, liabilities, revenues and expenses
relating to its interest in a joint operation. A joint venturer has rights to
the net assets relating to the joint venture and accounts for that investment
using the equity method.
2.4 Foreign Currency Translation
(A) Functional and presentation currency
Items included in the financial statements of each of the Company’s entities
are measured using the currency of the primary economic environment in
which each entity operates (the “functional currency”). The consolidated
financial statements are presented in Korean won, which is the Company’s
functional and presentation currency.
(B) Transactions and balances
Foreign currency transactions are translated into the functional currency
using the exchange rates prevailing at the dates of the transactions or
valuation where items are re-measured. Foreign exchange gains and losses
resulting from the settlement of such transactions and from the translation
at year-end exchange rates of monetary assets and liabilities denominated
in foreign currencies are recognized in profit or loss.
Exchange differences arising on non-monetary financial assets and liabilities
such as equity instruments at fair value through profit or loss and available-
for-sale equity instruments are recognized in profit or loss and included in
other comprehensive income, respectively, as part of the fair value gain or
loss.
(C) Translation into the presentation currency
The results and financial position of all the foreign entities that have a functional
currency different from the presentation currency of the Company are
translated into the presentation currency as follows:
Assets and liabilities for each statement of financial position presented are
translated at the closing rate at the end of the reporting date.
Income and expenses for each statement of income are translated at average
exchange rates, unless this average is not a reasonable approximation of
the cumulative effect of the rates prevailing on the transaction dates,
in which case income and expenses are translated at the rate on the dates of
the transactions.
All resulting exchange differences are recognized in other comprehensive
income.
On consolidation, exchange differences arising from the translation of
the net investment in foreign operations are recognized in other comprehensive
income. When a foreign operation is partially disposed of or sold, the exchange
differences that were recorded in equity are reclassified as part of gains
and losses on disposition in the statement of income. When the Company
loses control over foreign subsidiaries, the exchange differences that were
recorded in equity are reclassified into profit or loss when such gain or loss on
disposition is recognized.
Any goodwill arising on the acquisition of a foreign operation and any fair value
adjustments are treated as the foreign operation’s assets and liabilities.
Such goodwill is expressed in the foreign operation’s functional currency and
is translated at the closing rate. Exchange differences are recognized in other
comprehensive income.
2.5 Cash and Cash Equivalents
Cash and cash equivalents include cash on hand, deposits held at call
with banks, and other short-term highly liquid investments that are readily
convertible to a known amount of cash and are subject to an insignificant
risk of change in value.
2.6 Financial Assets
(A) Classification
The Company classifies its financial assets in the following categories:
financial assets at fair value through profit or loss, loans and receivables,
available-for-sale financial assets, and held-to-maturity financial assets.
The classification depends on the terms of the instruments and purpose for
which the financial assets were acquired. Management determines
the classification of its financial assets at initial recognition.
(1) Financial assets at fair value through profit or loss
Financial assets at fair value through profit or loss are financial assets
held for trading. A financial asset is classified in this category if acquired
principally for the purpose of selling in the short-term. Derivatives not
subject to hedge accounting and derivatives separated from financial
instruments such as embedded derivatives are also categorized as held
for trading. Assets in this category are classified as current assets.
(2) Loans and receivables
Loans and receivables are non-derivative financial assets with fixed or
determinable payments that are not quoted in an active market. They are
included in current assets, except for those with maturities greater than
12 months after the end of the reporting period which are classified as
non-current assets.
(3) Available-for-sale financial assets
Available-for-sale financial assets are non-derivatives that are either
designated in this category or not classified in any of the other categories.
They are included in non-current assets unless an investment matures
or management intends to dispose of it within 12 months of the end of
the reporting period.
(B) Recognition and measurement
Regular purchases and sales of financial assets are recognized on the trade
date. At initial recognition, financial assets are measured at fair value plus,
in the case of financial assets not carried at fair value through profit or loss,
transaction costs. Transaction costs of financial assets carried at fair value
through profit or loss are expensed in the statement of income.
After the initial recognition, available-for-sale financial assets and financial
assets at fair value through profit or loss are subsequently carried at
fair value. Loans and receivables and held-to-maturity investments are
subsequently carried at amortized cost using the effective interest method.
Changes in fair value of financial assets at fair value through profit or loss
are recognized in profit or loss and changes in fair value of available-for-sale
financial assets are recognized in other comprehensive income.
When the available-for-sale financial assets are sold or impaired, the fair
value adjustments recorded in equity are reclassified into profit or loss.
Interest on available-for-sale financial assets and held-to-maturity financial
assets calculated using the effective interest method is recognized in
the statement of income as part of finance income. Dividends on available-
for-sale financial assets are recognized in the statement of income as part of
other non-operating income when the Company’s right to receive payments
is established.
(C) Offsetting financial instruments
Financial assets and liabilities are offset and the net amount reported in
the statement of financial position when there is a legally enforceable right
to offset the recognized amounts and there is an intention to settle on a net
basis, or realize the asset and settle the liability simultaneously.
(D) Derecognition of financial assets
If the Company transfers a financial asset and the transfer does not result in
derecognition because the Company has retained substantially of all
the risks and rewards of ownership of the transferred asset due to
a recourse in the event the debtor defaults, the Company continues to
recognize the transferred asset in its entirety and recognizes a financial
liability for the consideration received. The related financial liability is
classified as ‘borrowings’ in the statement of financial position.
2.7 Impairment of Financial Assets
The Company assesses at the end of each reporting period whether there
is objective evidence that a financial asset or group of financial assets is
impaired. A financial asset or a group of financial assets is impaired and
impairment loss is recognized only if there is objective evidence and that
loss event (or events) has an impact on the estimated future cash flows of
the financial asset or group of financial assets that can be reliably estimated.
Impairment of loans and receivables is presented as a deduction in an
allowance account. Impairment of other financial assets is directly deducted
from their carrying amount. The Company writes off financial assets when
the assets are determined to be no longer recoverable.
The objective evidence that a financial asset is impaired includes significant
financial difficulty of the issuer or obligor; a delinquency in interest or principal
payments; or the disappearance of an active market for that financial asset
because of financial difficulties. A decline in the fair value of an available-for-sale
equity instrument by more than 20% from its cost or a prolonged decline below
its cost for more than six months is also objective evidence of impairment.
2.8 Trade Receivables
Trade receivables are amounts due from customers for merchandise sold
or services performed in the ordinary course of business. If collection is
expected in one year or less (or in the normal operating cycle of
the Company if longer), they are classified as current assets.
If not, they are presented as non-current assets. Trade receivables are
recognized initially at fair value and subsequently measured at amortized
cost using the effective interest method, less provision for impairment.
2.9 Inventories
Inventories are stated at the lower of cost and net realizable value.
Cost is determined using the average cost method, except for materials in
transit. The cost of finished goods and work in progress comprises design
costs, raw materials, direct labor, other direct costs and related production
overheads (based on normal operating capacity). It excludes costs of idle
plant and abnormal waste. Net realizable value is the estimated selling price
in the ordinary course of business, less applicable variable selling expenses.
Inventories are reduced for the estimated losses arising from excess,
obsolescence, and decline in value. This reduction is determined by
estimating market value based on future customer demand. The losses on
inventory obsolescence are recorded as a part of cost of sales.
58 592013 SAMSUNG ELECTRONICS ANNUAL REPORT
2.10 Disposal Group Held-for-Sale
Non-current assets (or disposal group) are classified as assets held-for-
sale when their carrying amount is to be recovered principally through a
sale transaction and a sale is considered highly probable. The assets are
measured at the lower amount between their carrying amount and the fair
value less costs to sell.
2.11 Property, Plant and Equipment
Property, plant and equipment are stated at cost less accumulated
depreciation and accumulated impairment losses.
Historical cost includes expenditures that are directly attributable to
the acquisition of the items. Subsequent costs are included in the asset’s
carrying amount or recognized as a separate asset, as appropriate,
only when it is probable that future economic benefits associated with
the item will flow to the Company and the cost of the item can be
measured reliably. The carrying amount of those parts that are replaced
is derecognized and repairs and maintenance expenses are recognized in
profit or loss in the period they are incurred.
Depreciation on tangible assets is calculated using the straight-line method
to allocate the difference between their cost and their residual values over
their estimated useful lives. Land is not depreciated. Costs that are directly
attributable to the acquisition, construction or production of a qualifying
asset, including capitalized interest costs, form part of the cost of that asset
and are amortized over the estimated useful lives.
The Company’s policy is that property, plant and equipment should be
depreciated over the following estimated useful lives:
Estimated useful lives
Buildings and structures 15, 30 years
Machinery and equipment 5 years
Others 5 years
The depreciation method, residual values and useful lives of property,
plant and equipment are reviewed, and adjusted if appropriate,
at the end of each reporting period. An asset’s carrying amount is written
down immediately to its recoverable amount if the asset’s carrying amount
is greater than its estimated recoverable amount. Gains and losses on
disposals are determined by comparing the proceeds with the carrying
amount and are recognized within the statement of income as part of other
non-operating income and expenses.
2.12 Intangible Assets
Goodwill represents the excess of the cost of an acquisition over the fair
value of the group’s share of the net identifiable assets of the acquired
subsidiary, associates, joint ventures and businesses at the date of
acquisition.
Goodwill on acquisitions of subsidiaries and businesses is included in
intangible assets and goodwill on acquisition of associates and joint
ventures are included in the investments in associates and joint ventures.
Intangible assets, except for goodwill, are initially recognized at their
historical cost and carried at cost less accumulated amortization and
accumulated impairment losses.
Internally generated development costs are the aggregate costs recognized
after meeting the asset recognition criteria, including technical feasibility,
and determined to have future economic benefits. Membership rights are
regarded as intangible assets with indefinite useful life and not amortized
because there is no foreseeable limit to the period over which the assets
are expected to be utilized. Intangible assets with definite useful life such as
trademarks and licenses are amortized using the straight-line method over
their estimated useful lives.
The Company’s policy is that intangible assets should be amortized over
the following estimated useful lives:
Estimated useful lives
Development costs 2 years
Trademarks, licenses and other intangible assets 5-10 years
2.13 Impairment of Non-Financial Assets
Goodwill or intangible assets with indefinite useful life are not subject to
amortization and are tested annually for impairment. Assets that are subject
to amortization are reviewed for impairment whenever events or changes
in circumstances indicate that the carrying amount may not be recoverable.
An impairment loss is recognized for the amount by which the asset’s
carrying amount exceeds its recoverable amount. The recoverable amount
is the higher of an asset’s fair value less costs to sell and value in use.
For the purposes of assessing impairment, assets are grouped at the lowest
levels for which there are separately identifiable cash flows (cash-generating
units). Non-financial assets other than goodwill that suffered impairment are
reviewed for possible reversal of the impairment at each reporting date.
2.14 Financial Liabilities
(A) Classification and measurement
Financial liabilities at fair value through profit or loss are financial
instruments held for trading. Financial liabilities are classified in this
category if incurred principally for the purpose of repurchasing them in the
near term. Derivatives that are not designated as hedges or bifurcated from
financial instruments containing embedded derivatives are also categorized
as held-for-trading.
The Company classifies non-derivative financial liabilities, except for
financial liabilities at fair value through profit or loss, financial guarantee
contracts and financial liabilities that arise when a transfer of financial
assets does not qualify for derecognition, as financial liabilities carried at
amortized cost and presented as ‘trade payables’, ‘borrowings’, and ‘other
financial liabilities’ in the statement of financial position.
(B) Derecognition
Financial liabilities are removed from the statement of financial position
when it is extinguished, for example, when the obligation specified in
the contract is discharged, cancelled or expired or when the terms of
an existing financial liability are substantially modified.
2.15 Trade Payables
Trade payables are amounts due to suppliers for merchandise purchased or
services received in the ordinary course of business. If payment is expected
in one year or less (or in the normal operating cycle of the Company if
longer), they are classified as current liabilities. If not, they are presented as
non-current liabilities. Non-current trade payables are recognized initially at
fair value and subsequently measured at amortized cost using the effective
interest method.
2.16 Borrowings
Borrowings are recognized initially at fair value, net of transaction costs
and are subsequently measured at amortized cost. Any difference between
cost and the redemption value is recognized in the statement of income
over the period of the borrowings using the effective interest method. If the
Company has an indefinite right to defer payment for a period longer than
12 months after the end of the reporting date, such liabilities are recorded
as non-current liabilities, otherwise, they are recorded as current liabilities.
2.17 Provisions
A provision is recognized when the Company has a present legal or
constructive obligation as a result of a past event, it is probable that
an outflow of resources embodying economic benefits will be required to
settle the obligation, and a reliable estimate can be made of the amount of
the obligation. Provisions are not recognized for future operating losses.
Provisions are measured at the present value of the expenditures expected
to be required to settle the obligation using a pre-tax rate that reflects
current market assessments of the time value of money and the risks
specific to the obligation. The increase in the provision due to passage of
time is recognized as interest expense.
When it is probable that an outflow of economic benefits will occur due to
a present obligation resulting from a past event, and the amount is
reasonably estimable, a corresponding provision is recognized in
the financial statements. However, when such outflow is dependent upon
a future event, that is not certain to occur, or cannot be reliably estimated,
a disclosure regarding the contingent liability is made in the notes to
the financial statements.
2.18 Net Defined Benefit Liabilities
The Company has a variety of retirement pension plans including defined
benefit or defined contribution plans. A defined contribution plan is
a pension plan under which the Company pays fixed contributions into
a separate entity. The Company has no legal or constructive obligations to
pay further contributions if the fund does not hold sufficient assets to pay all
employees the benefits relating to employee service in the current and prior
periods. For defined contribution plans, the Company pays contributions to
annuity plans that are managed either publicly or privately on a mandatory,
contractual or voluntary basis. The Company has no further future payment
obligations once the contributions have been paid. The contributions are
recognized as employee benefit expense when they are due.
Prepaid contributions are recognized as an asset to the extent that a cash
refund or a reduction in the future payments is available.
A defined benefit plan is a pension plan that is not a defined contribution
plan. Typically defined benefit plans define an amount of pension benefit
that an employee will receive on retirement, usually dependent on one or
more factors such as age, years of service and compensation. The liability
recognized in the statement of financial position in respect to defined
benefit pension plans is the present value of the defined benefit obligation at
the end of the reporting period less the fair value of plan assets. The defined
benefit obligation is calculated annually by independent actuaries using
the projected unit credit method. The present value of the defined benefit
obligation is determined by discounting the estimated future cash outflows
using interest rates of high-quality corporate bonds that are denominated
in the currency in which the benefits will be paid and that have terms to
maturity approximating to the terms of the related pension obligation.
Actuarial gains and losses resulting from the changes in actuarial
assumptions, and the differences between the previous actuarial
assumptions and what has actually occurred, are recognized in other
comprehensive income in the period in which they were incurred.
Past service costs are immediately recognized in profit or loss.
2.19 Financial Guarantee Contract
Financial guarantee contracts are contracts that require the issuer to make
specified payments to reimburse the holder for a loss it incurs because
a specified debtor fails to make payments when due. Financial guarantees
are initially recognized in the financial statements at fair value on the date
the guarantee was given. If the amount measured in subsequent periods
exceeds the unamortized balance of the amount initially recognized,
the excess is classified as other financial liability.
2.20 Current and Deferred Tax
The tax expense for the period comprises current and deferred tax.
Tax is recognized on the profit for the period in the statement of income,
except to the extent that it relates to items recognized in other
comprehensive income or directly in equity, in which case the tax is also
recognized in other comprehensive income or directly in equity, respectively.
The tax expense is calculated on the basis of the tax laws enacted or
substantively enacted at the end of the reporting period.
Deferred tax is recognized for temporary differences arising between
the tax bases of assets and liabilities and their carrying amounts as
expected tax consequences at the recovery or settlement of the carrying
amounts of the assets and liabilities. However, deferred tax assets and
liabilities are not recognized if they arise from initial recognition of an asset
or liability in a transaction other than a business combination that
at the time of the transaction affects neither accounting nor taxable profit or
loss. Deferred tax assets are recognized only to the extent that it is probable
that future taxable profit will be available against which the temporary
differences can be utilized.
A deferred tax liability is recognized for taxable temporary differences
associated with investments in subsidiaries, associates, and interests in
joint ventures, except to the extent that the Company is able to control
the timing of the reversal of the temporary differences and it is probable
that the temporary difference will not reverse in the foreseeable future.
In addition, a deferred tax asset is recognized for deductible temporary
differences arising from such investments to the extent that it is probable
the temporary difference will reverse in the foreseeable future and taxable
profit will be available against which the temporary difference can be utilized.
60 612013 SAMSUNG ELECTRONICS ANNUAL REPORT
(D) Net defined benefit liabilities
The net defined benefit liability depends on a number of factors that are
determined on an actuarial basis using a number of assumptions.
Any changes in these assumptions will impact the carrying amount of
the net defined benefit liability. The Company, in consideration of
the interest rates of high-quality corporate bonds, determines
the appropriate discount rate at the end of each year. This is the interest
rate that is used to determine the present value of estimated future cash
outflows expected to be required to settle the net defined benefit liability.
The principal actuarial assumptions associated with the net defined benefit
liability are based on the current market expectations.
(E) Estimated impairment of goodwill
The Company tests at the end of each reporting period whether goodwill
has suffered any impairment in accordance with the accounting policy
described in Note 2.12. The recoverable amounts of cash-generating
units have been determined based on value-in-use calculations.
These calculations are based on estimates.
(F) Income taxes
Income taxes on the Company’s taxable income from operating activities
are subject to various tax laws and determinations of each tax authority
across various countries in the world. There is uncertainty in determining
the eventual tax effects on the taxable income from operating activities.
The Company has recognized current tax and deferred tax at the end of
the fiscal year based on the best estimation of future taxes payable as
a result of operating activities. However, the resulting deferred income tax
assets and liabilities may not equal the actual future taxes payable and such
difference may impact the current tax and deferred income tax assets and
liabilities upon the determination of eventual tax effects.
4. Cash and Cash Equivalents
Cash and cash equivalents include cash on hand, deposits held at call
with banks, and other short-term highly liquid investments that are readily
convertible to a known amount of cash and are subject to an insignificant
risk of change in value.
Cash and cash equivalents as of December 31, 2013 and 2012, consist of
the following:
(In millions of Korean won)
2013 2012
Cash on hand 14,454 12,900
Bank deposits, etc. 16,270,326 18,778,560
Total 16,284,780 18,791,460
Financial instruments subject to withdrawal restrictions as of December 31,
2013 and 2012, consist of the following:
(In millions of Korean won)
2013 2012
Short-term financial instruments 23,850 46,489
Long-term financial instruments 15 29
Deferred tax assets and liabilities are offset when there is a legally
enforceable right to offset current tax assets against current tax liabilities
and when the deferred income taxes assets and liabilities relate to income
taxes levied by the same taxation authority on either the same taxable entity
or different taxable entities where there is an intention to settle the balances
on a net basis.
2.21 Derivative Instruments
All derivative instruments are accounted for at fair value with the resulting
valuation gain or loss recorded as an asset or liability. If the derivative
instrument is not designated as a hedging instrument, the gain or loss is
recognized in the statement of income in the period of change.
Fair value hedge accounting is applied to a derivative instrument with
the purpose of hedging the exposure to changes in the fair value of an asset
or a liability or a firm commitment (hedged item) that is attributable to
a particular risk. Hedge accounting is applied when the derivative instrument
is designated as a hedging instrument and the hedge accounting criteria
have been met.
2.22 Dividend Distribution
Dividend distribution to the Company’s shareholders is recognized when
the dividends are approved.
2.23 Share Capital
Common shares and preferred shares with no repayment obligations are
classified as equity. When the Company purchases its common shares,
the acquisition costs including direct transaction costs are deducted from
equity until the redemption or reissuance of treasury shares. Consideration
received on the subsequent sale or issue of treasury shares is credited to
equity.
2.24 Revenue Recognition
Revenue mainly comprises the fair value of the consideration received or
receivable for the sale of goods in the ordinary course of the Company’s
activities. Revenue is shown net of value-added tax, returns, sales
incentives and discounts and after eliminating intercompany transactions.
The Company recognizes revenue when specific recognition criteria have
been met for each of the Company’s activities as described below.
The Company bases its estimates on historical results, taking into
consideration the type of customer, the type of transaction and the specifics
of each arrangement.
Where multiple-element arrangements exist, the fair values of each
element are determined based on the current market price of each of the
elements when sold separately. When the fair values of each element are
indeterminable, the fair values of deliverables which have already been
provided are calculated in such way that the fair values of elements,
which are yet to be provided, are subtracted from total contract value of
the arrangement.
(A) Sales of goods
Sales of products and merchandise are recognized upon delivery when
the significant risks and rewards of ownership of goods have transferred
to the buyer, continuing managerial involvement usually associated with
ownership and effective control have ceased, the amount of revenue can be
measured reliably, it is probable that the economic benefits associated with
the transaction will flow to the Company and the costs incurred or
to be incurred in respect of the transaction can be measured reliably.
The Company records reductions to revenue for special pricing
arrangements, price protection and other volume based discounts.
If product sales are subject to customer acceptance, revenue is not
recognized until customer acceptance occurs.
(B) Sales of services
Revenues from rendering services are generally recognized using the
percentage-of-completion method, based on the percentage of costs to
date compared to the total estimated costs, contractual milestones or
performance.
(C) Other sources of revenue
Interest income is recognized using the effective interest method.
When a loan and receivable is impaired, the Company reduces the carrying
amount to its recoverable amount, being the estimated future cash flow
discounted at the original effective interest rate of the instrument, and
continues unwinding the discount as interest income. Royalty income is
recognized on an accruals basis in accordance with the substance of
the relevant agreements. Dividend income is recognized when the right to
receive payment is established.
2.25 Government Grants
Government grants are recognized at their fair values when there is
reasonable assurance that the grant will be received and the Group will
comply with the conditions attaching to it. Government grants related to
assets are presented by deducting the grants in arriving at the carrying
amount of the assets, and grants related to income are deferred and
presented by deducting the related expenses for the purpose of
the government grants.
2.26 Earnings per Share
Basic earnings per share is calculated by dividing net profit for the period
available to common shareholders by the weighted-average number of
common shares outstanding during the year. Diluted earnings per share
is calculated using the weighted-average number of common shares
outstanding adjusted to include the potentially dilutive effect of common
equivalent shares outstanding.
2.27 Operating Segments
Operating segments are disclosed in the manner reported to the chief
operating decision-maker (please see footnote 33). The chief operating
decision-maker is responsible for making strategic decisions on resource
allocation and performance assessment of the operating segments.
The management committee which makes strategic decisions is regarded
as the chief operating decision-maker.
2.28 Convenience Translation into United States
Dollar Amounts
The Company operates primarily in Korean won and its official accounting
records are maintained in Korean won. The US dollar amounts provided in
the financial statements represent supplementary information solely for
the convenience of the reader. All Korean won amounts are expressed
in U.S. dollars at the rate of 1,055.30 to US $1, the exchange rate in
effect on December 31, 2013. Such presentation is not in accordance with
generally accepted accounting principles, and should not be construed
as a representation that the Korean won amounts shown could be readily
converted, realized or settled in US dollars at this or at any other rate.
2.29 Approval of the Consolidated Financial
Statements
These consolidated financial statements were approved by the Board of
Directors on January 24, 2014.
The Company makes estimates and assumptions concerning the future.
The estimates and assumptions are continuously assessed, considering
historical experience and other factors, including expectations of future
events that are believed to be reasonable under the circumstances.
The resulting accounting estimates will, by definition, seldom equal
the related actual results. The estimates and assumptions that have
a significant risk of causing a material adjustment to the carrying amounts
of assets and liabilities within the next financial year are addressed below.
(A) Revenue recognition
The Company uses the percentage-of-completion method in accounting
for its fixed-price contracts to deliver installation services. Use of the
percentage-of-completion method requires the Company to estimate
the services performed to date as a proportion of the total services to
be performed. Revenues and earnings are subject to significant change,
effected by early steps in a long-term projects, change in scope of a project,
cost, period, and plans of the customers.
(B) Provision for warranty
The Company recognizes provision for warranty on products sold.
The Company accrues provision for warranty based on the best estimate
of amounts necessary to settle future and existing claims. The amounts are
estimated based on historical data.
(C) Fair value of derivatives and other financial instruments
The fair value of financial instruments that are not traded in an active market
is determined by using a variety of methods and assumptions that are
mainly based on market conditions existing at the end of each reporting
period.
5. Financial Assets Subject to
Withdrawal Restrictions
3. Critical Accounting Estimates and
Assumptions
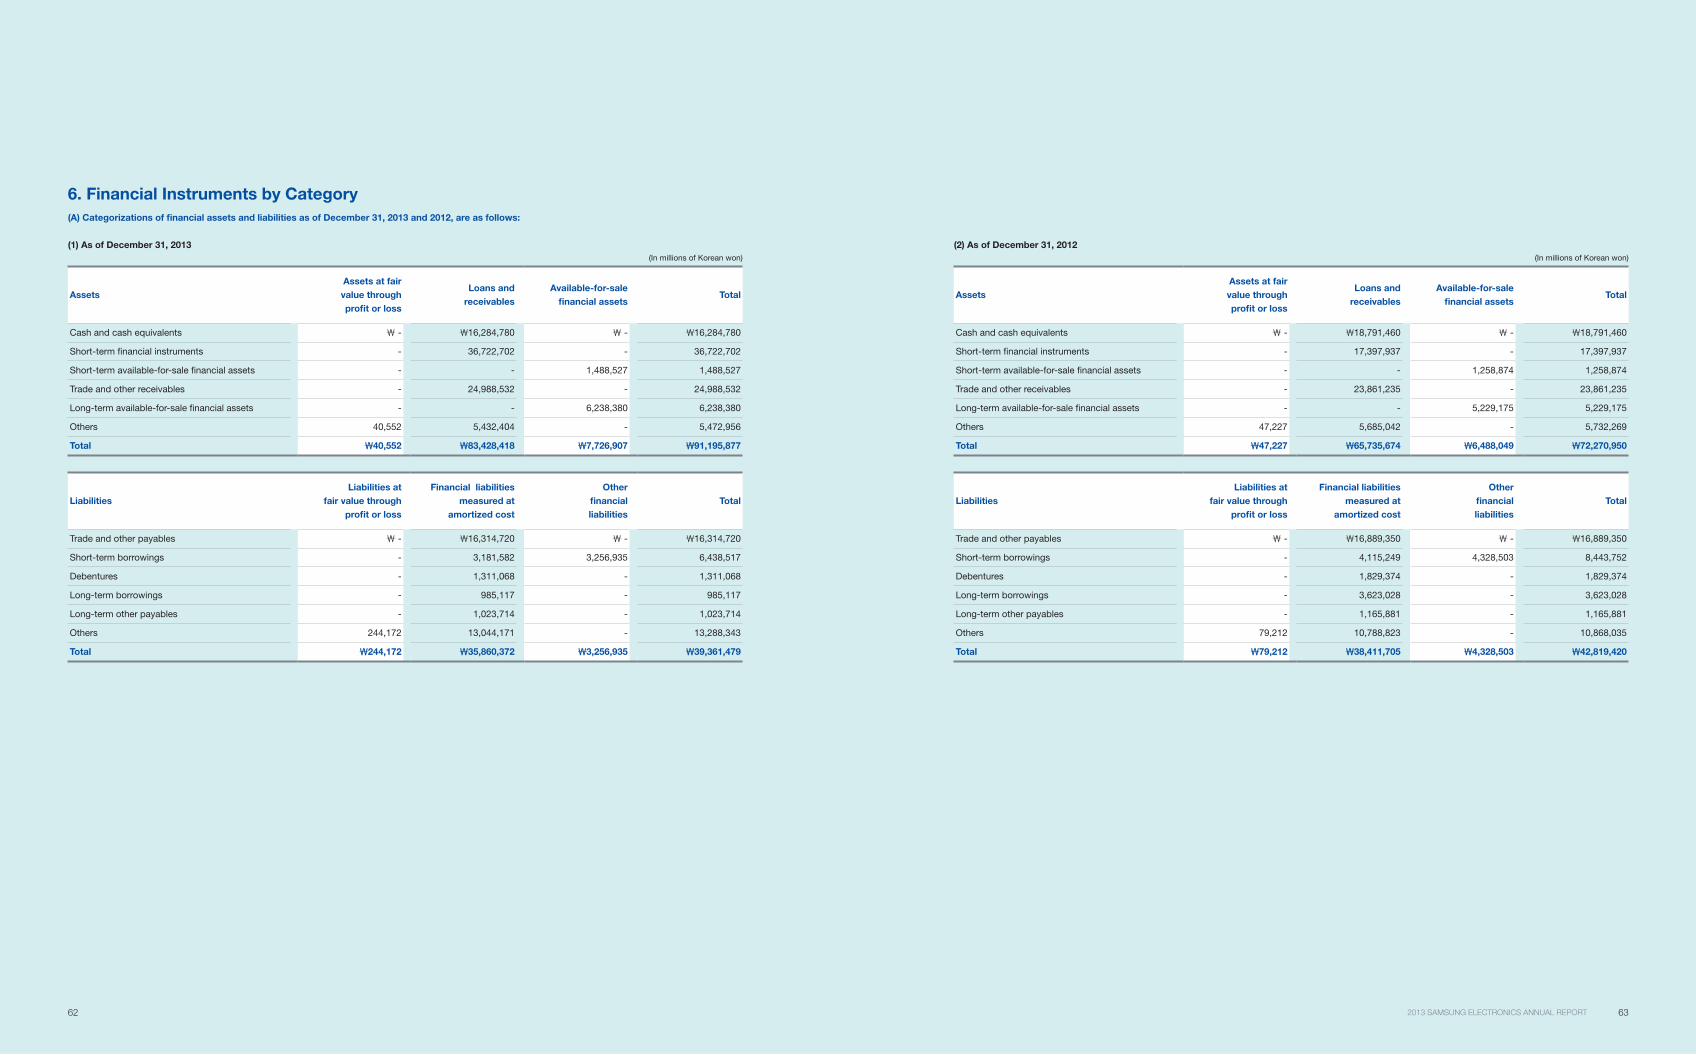
62 632013 SAMSUNG ELECTRONICS ANNUAL REPORT
6. Financial Instruments by Category
(A) Categorizations of financial assets and liabilities as of December 31, 2013 and 2012, are as follows:
(1) As of December 31, 2013
(In millions of Korean won)
Assets
Assets at fair
value through
profit or loss
Loans and
receivables
Available-for-sale
financial assetsTotal
Cash and cash equivalents - 16,284,780 - 16,284,780
Short-term financial instruments - 36,722,702 - 36,722,702
Short-term available-for-sale financial assets - - 1,488,527 1,488,527
Trade and other receivables - 24,988,532 - 24,988,532
Long-term available-for-sale financial assets - - 6,238,380 6,238,380
Others 40,552 5,432,404 - 5,472,956
Total 40,552 83,428,418 7,726,907 91,195,877
Liabilities
Liabilities at
fair value through
profit or loss
Financial liabilities
measured at
amortized cost
Other
financial
liabilities
Total
Trade and other payables - 16,314,720 - 16,314,720
Short-term borrowings - 3,181,582 3,256,935 6,438,517
Debentures - 1,311,068 - 1,311,068
Long-term borrowings - 985,117 - 985,117
Long-term other payables - 1,023,714 - 1,023,714
Others 244,172 13,044,171 - 13,288,343
Total 244,172 35,860,372 3,256,935 39,361,479
(2) As of December 31, 2012
(In millions of Korean won)
Assets
Assets at fair
value through
profit or loss
Loans and
receivables
Available-for-sale
financial assetsTotal
Cash and cash equivalents - 18,791,460 - 18,791,460
Short-term financial instruments - 17,397,937 - 17,397,937
Short-term available-for-sale financial assets - - 1,258,874 1,258,874
Trade and other receivables - 23,861,235 - 23,861,235
Long-term available-for-sale financial assets - - 5,229,175 5,229,175
Others 47,227 5,685,042 - 5,732,269
Total 47,227 65,735,674 6,488,049 72,270,950
Liabilities
Liabilities at
fair value through
profit or loss
Financial liabilities
measured at
amortized cost
Other
financial
liabilities
Total
Trade and other payables - 16,889,350 - 16,889,350
Short-term borrowings - 4,115,249 4,328,503 8,443,752
Debentures - 1,829,374 - 1,829,374
Long-term borrowings - 3,623,028 - 3,623,028
Long-term other payables - 1,165,881 - 1,165,881
Others 79,212 10,788,823 - 10,868,035
Total 79,212 38,411,705 4,328,503 42,819,420
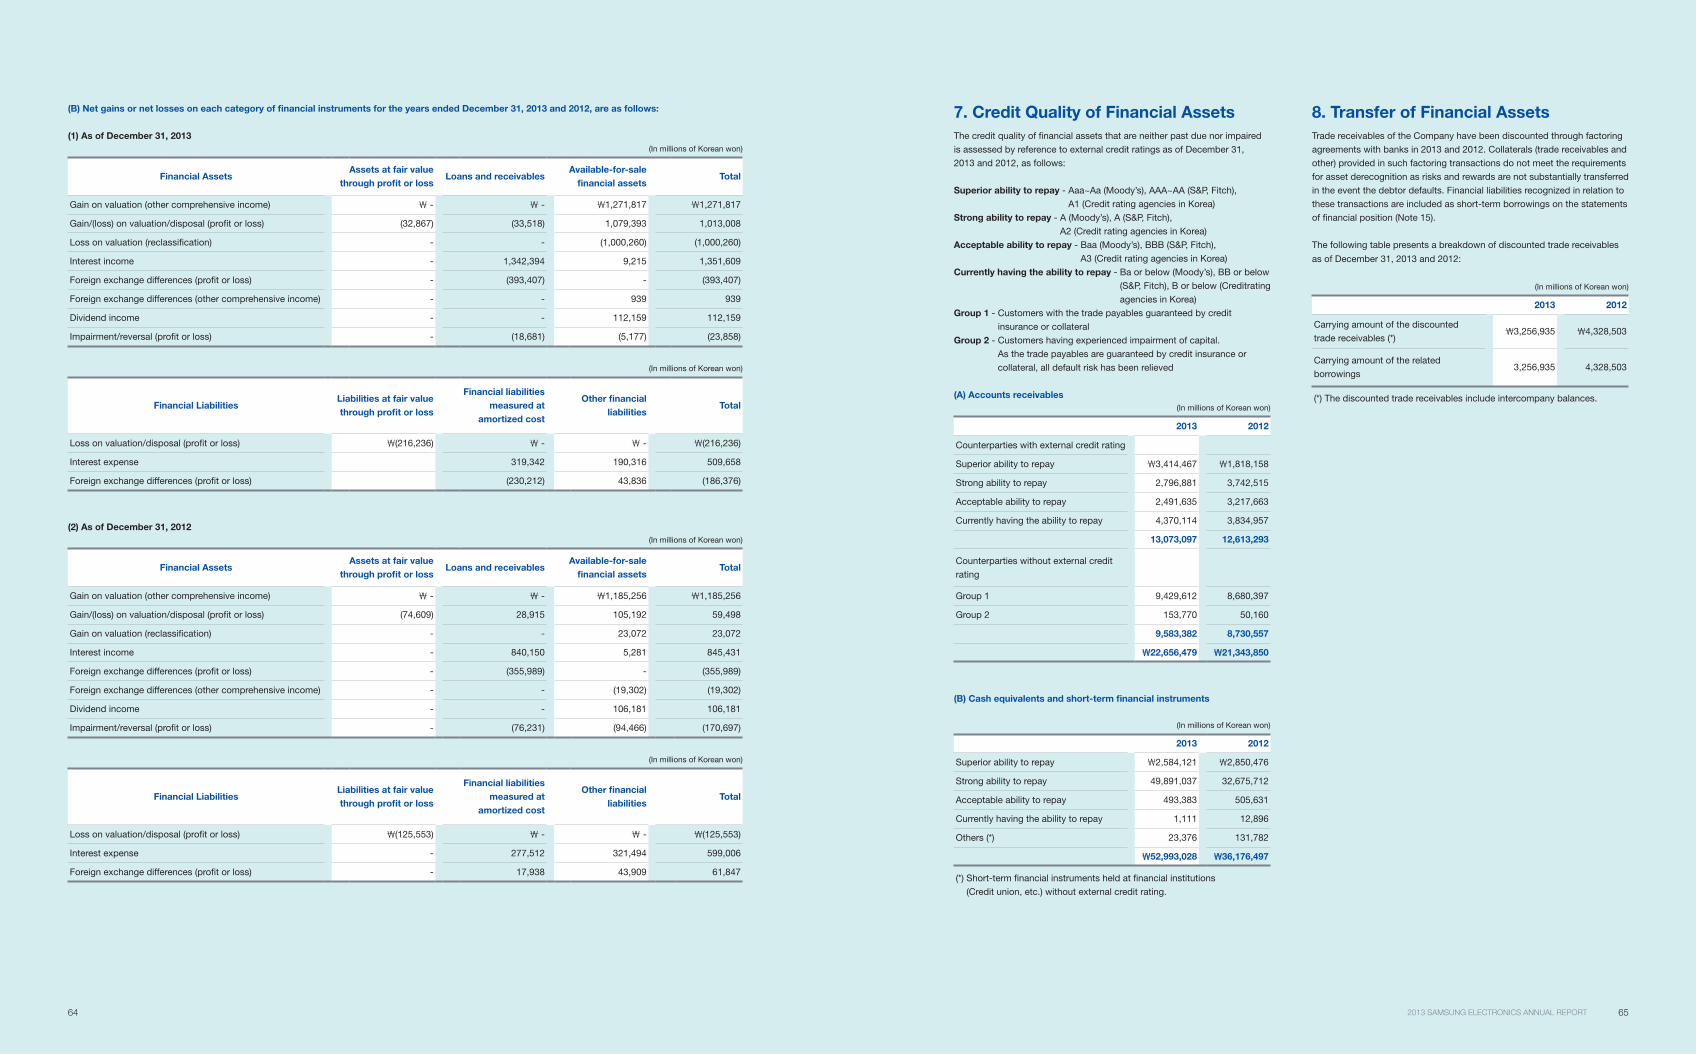
64 652013 SAMSUNG ELECTRONICS ANNUAL REPORT
7. Credit Quality of Financial Assets
The credit quality of financial assets that are neither past due nor impaired
is assessed by reference to external credit ratings as of December 31,
2013 and 2012, as follows:
Superior ability to repay - Aaa~Aa (Moody’s), AAA~AA (S&P, Fitch),
A1 (Credit rating agencies in Korea)
Strong ability to repay - A (Moody’s), A (S&P, Fitch),
A2 (Credit rating agencies in Korea)
Acceptable ability to repay - Baa (Moody’s), BBB (S&P, Fitch),
A3 (Credit rating agencies in Korea)
Currently having the ability to repay - Ba or below (Moody’s), BB or below
(S&P, Fitch), B or below (Creditrating
agencies in Korea)
Group 1 - Customers with the trade payables guaranteed by credit
insurance or collateral
Group 2 - Customers having experienced impairment of capital.
As the trade payables are guaranteed by credit insurance or
collateral, all default risk has been relieved
(A) Accounts receivables
(In millions of Korean won)
2013 2012
Counterparties with external credit rating
Superior ability to repay 3,414,467 1,818,158
Strong ability to repay 2,796,881 3,742,515
Acceptable ability to repay 2,491,635 3,217,663
Currently having the ability to repay 4,370,114 3,834,957
13,073,097 12,613,293
Counterparties without external credit
rating
Group 1 9,429,612 8,680,397
Group 2 153,770 50,160
9,583,382 8,730,557
22,656,479 21,343,850
(B) Cash equivalents and short-term financial instruments
(In millions of Korean won)
2013 2012
Superior ability to repay 2,584,121 2,850,476
Strong ability to repay 49,891,037 32,675,712
Acceptable ability to repay 493,383 505,631
Currently having the ability to repay 1,111 12,896
Others (*) 23,376 131,782
52,993,028 36,176,497
(*) Short-term financial instruments held at financial institutions
(Credit union, etc.) without external credit rating.
8. Transfer of Financial Assets
Trade receivables of the Company have been discounted through factoring
agreements with banks in 2013 and 2012. Collaterals (trade receivables and
other) provided in such factoring transactions do not meet the requirements
for asset derecognition as risks and rewards are not substantially transferred
in the event the debtor defaults. Financial liabilities recognized in relation to
these transactions are included as short-term borrowings on the statements
of financial position (Note 15).
The following table presents a breakdown of discounted trade receivables
as of December 31, 2013 and 2012:
(In millions of Korean won)
2013 2012
Carrying amount of the discounted
trade receivables (*)3,256,935 4,328,503
Carrying amount of the related
borrowings3,256,935 4,328,503
(*) The discounted trade receivables include intercompany balances.
(B) Net gains or net losses on each category of financial instruments for the years ended December 31, 2013 and 2012, are as follows:
(1) As of December 31, 2013
(In millions of Korean won)
Financial AssetsAssets at fair value
through profit or lossLoans and receivables
Available-for-sale
financial assetsTotal
Gain on valuation (other comprehensive income) - - 1,271,817 1,271,817
Gain/(loss) on valuation/disposal (profit or loss) (32,867) (33,518) 1,079,393 1,013,008
Loss on valuation (reclassification) - - (1,000,260) (1,000,260)
Interest income - 1,342,394 9,215 1,351,609
Foreign exchange differences (profit or loss) - (393,407) - (393,407)
Foreign exchange differences (other comprehensive income) - - 939 939
Dividend income - - 112,159 112,159
Impairment/reversal (profit or loss) - (18,681) (5,177) (23,858)
(In millions of Korean won)
Financial LiabilitiesLiabilities at fair value
through profit or loss
Financial liabilities
measured at
amortized cost
Other financial
liabilitiesTotal
Loss on valuation/disposal (profit or loss) (216,236) - - (216,236)
Interest expense 319,342 190,316 509,658
Foreign exchange differences (profit or loss) (230,212) 43,836 (186,376)
(2) As of December 31, 2012
(In millions of Korean won)
Financial AssetsAssets at fair value
through profit or lossLoans and receivables
Available-for-sale
financial assetsTotal
Gain on valuation (other comprehensive income) - - 1,185,256 1,185,256
Gain/(loss) on valuation/disposal (profit or loss) (74,609) 28,915 105,192 59,498
Gain on valuation (reclassification) - - 23,072 23,072
Interest income - 840,150 5,281 845,431
Foreign exchange differences (profit or loss) - (355,989) - (355,989)
Foreign exchange differences (other comprehensive income) - - (19,302) (19,302)
Dividend income - - 106,181 106,181
Impairment/reversal (profit or loss) - (76,231) (94,466) (170,697)
(In millions of Korean won)
Financial LiabilitiesLiabilities at fair value
through profit or loss
Financial liabilities
measured at
amortized cost
Other financial
liabilitiesTotal
Loss on valuation/disposal (profit or loss) (125,553) - - (125,553)
Interest expense - 277,512 321,494 599,006
Foreign exchange differences (profit or loss) - 17,938 43,909 61,847
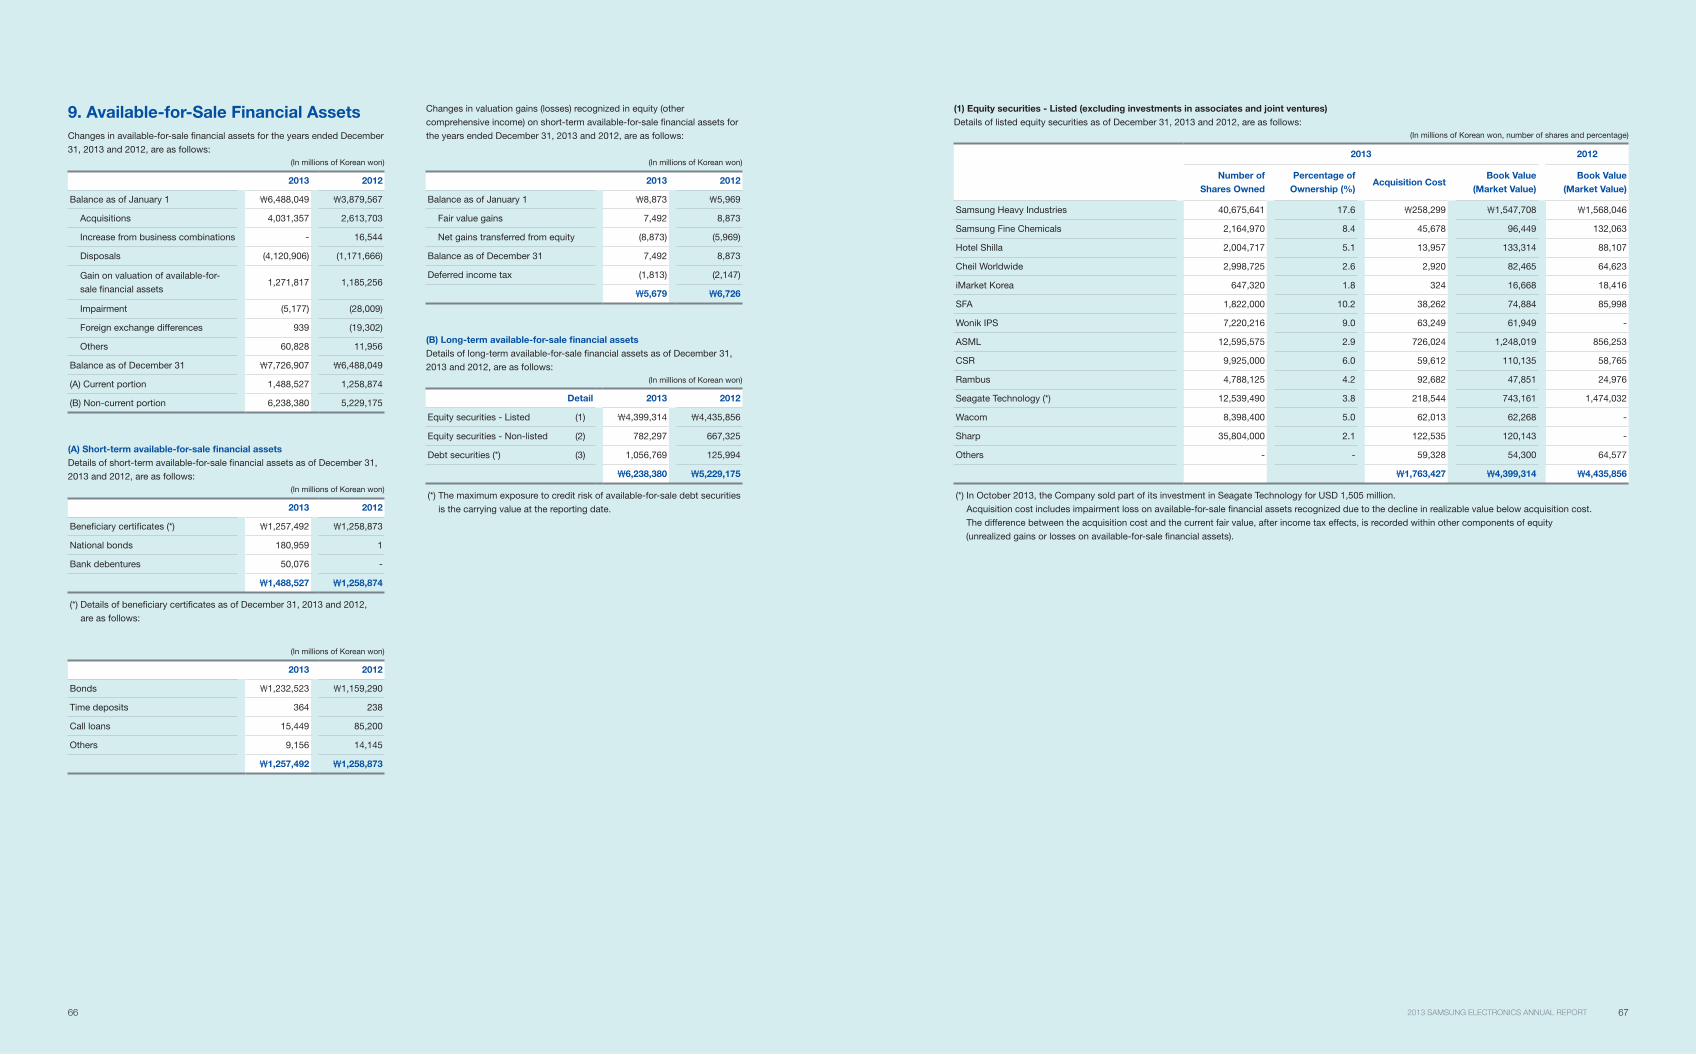
66 672013 SAMSUNG ELECTRONICS ANNUAL REPORT
Changes in valuation gains (losses) recognized in equity (other
comprehensive income) on short-term available-for-sale financial assets for
the years ended December 31, 2013 and 2012, are as follows:
(In millions of Korean won)
2013 2012
Balance as of January 1 8,873 5,969
Fair value gains 7,492 8,873
Net gains transferred from equity (8,873) (5,969)
Balance as of December 31 7,492 8,873
Deferred income tax (1,813) (2,147)
5,679 6,726
(B) Long-term available-for-sale financial assets
Details of long-term available-for-sale financial assets as of December 31,
2013 and 2012, are as follows:
(In millions of Korean won)
Detail 2013 2012
Equity securities - Listed (1) 4,399,314 4,435,856
Equity securities - Non-listed (2) 782,297 667,325
Debt securities (*) (3) 1,056,769 125,994
6,238,380 5,229,175
(*) The maximum exposure to credit risk of available-for-sale debt securities
is the carrying value at the reporting date.
9. Available-for-Sale Financial Assets
Changes in available-for-sale financial assets for the years ended December
31, 2013 and 2012, are as follows:
(In millions of Korean won)
2013 2012
Balance as of January 1 6,488,049 3,879,567
Acquisitions 4,031,357 2,613,703
Increase from business combinations - 16,544
Disposals (4,120,906) (1,171,666)
Gain on valuation of available-for-
sale financial assets1,271,817 1,185,256
Impairment (5,177) (28,009)
Foreign exchange differences 939 (19,302)
Others 60,828 11,956
Balance as of December 31 7,726,907 6,488,049
(A) Current portion 1,488,527 1,258,874
(B) Non-current portion 6,238,380 5,229,175
(A) Short-term available-for-sale financial assets
Details of short-term available-for-sale financial assets as of December 31,
2013 and 2012, are as follows:
(In millions of Korean won)
2013 2012
Beneficiary certificates (*) 1,257,492 1,258,873
National bonds 180,959 1
Bank debentures 50,076 -
1,488,527 1,258,874
(*) Details of beneficiary certificates as of December 31, 2013 and 2012,
are as follows:
(In millions of Korean won)
2013 2012
Bonds 1,232,523 1,159,290
Time deposits 364 238
Call loans 15,449 85,200
Others 9,156 14,145
1,257,492 1,258,873
(1) Equity securities - Listed (excluding investments in associates and joint ventures)
Details of listed equity securities as of December 31, 2013 and 2012, are as follows:
(In millions of Korean won, number of shares and percentage)
2013 2012
Number of
Shares Owned
Percentage of
Ownership (%)Acquisition Cost
Book Value
(Market Value)
Book Value
(Market Value)
Samsung Heavy Industries 40,675,641 17.6 258,299 1,547,708 1,568,046
Samsung Fine Chemicals 2,164,970 8.4 45,678 96,449 132,063
Hotel Shilla 2,004,717 5.1 13,957 133,314 88,107
Cheil Worldwide 2,998,725 2.6 2,920 82,465 64,623
iMarket Korea 647,320 1.8 324 16,668 18,416
SFA 1,822,000 10.2 38,262 74,884 85,998
Wonik IPS 7,220,216 9.0 63,249 61,949 -
ASML 12,595,575 2.9 726,024 1,248,019 856,253
CSR 9,925,000 6.0 59,612 110,135 58,765
Rambus 4,788,125 4.2 92,682 47,851 24,976
Seagate Technology (*) 12,539,490 3.8 218,544 743,161 1,474,032
Wacom 8,398,400 5.0 62,013 62,268 -
Sharp 35,804,000 2.1 122,535 120,143 -
Others - - 59,328 54,300 64,577
1,763,427 4,399,314 4,435,856
(*) In October 2013, the Company sold part of its investment in Seagate Technology for USD 1,505 million.
Acquisition cost includes impairment loss on available-for-sale financial assets recognized due to the decline in realizable value below acquisition cost.
The difference between the acquisition cost and the current fair value, after income tax effects, is recorded within other components of equity
(unrealized gains or losses on available-for-sale financial assets).
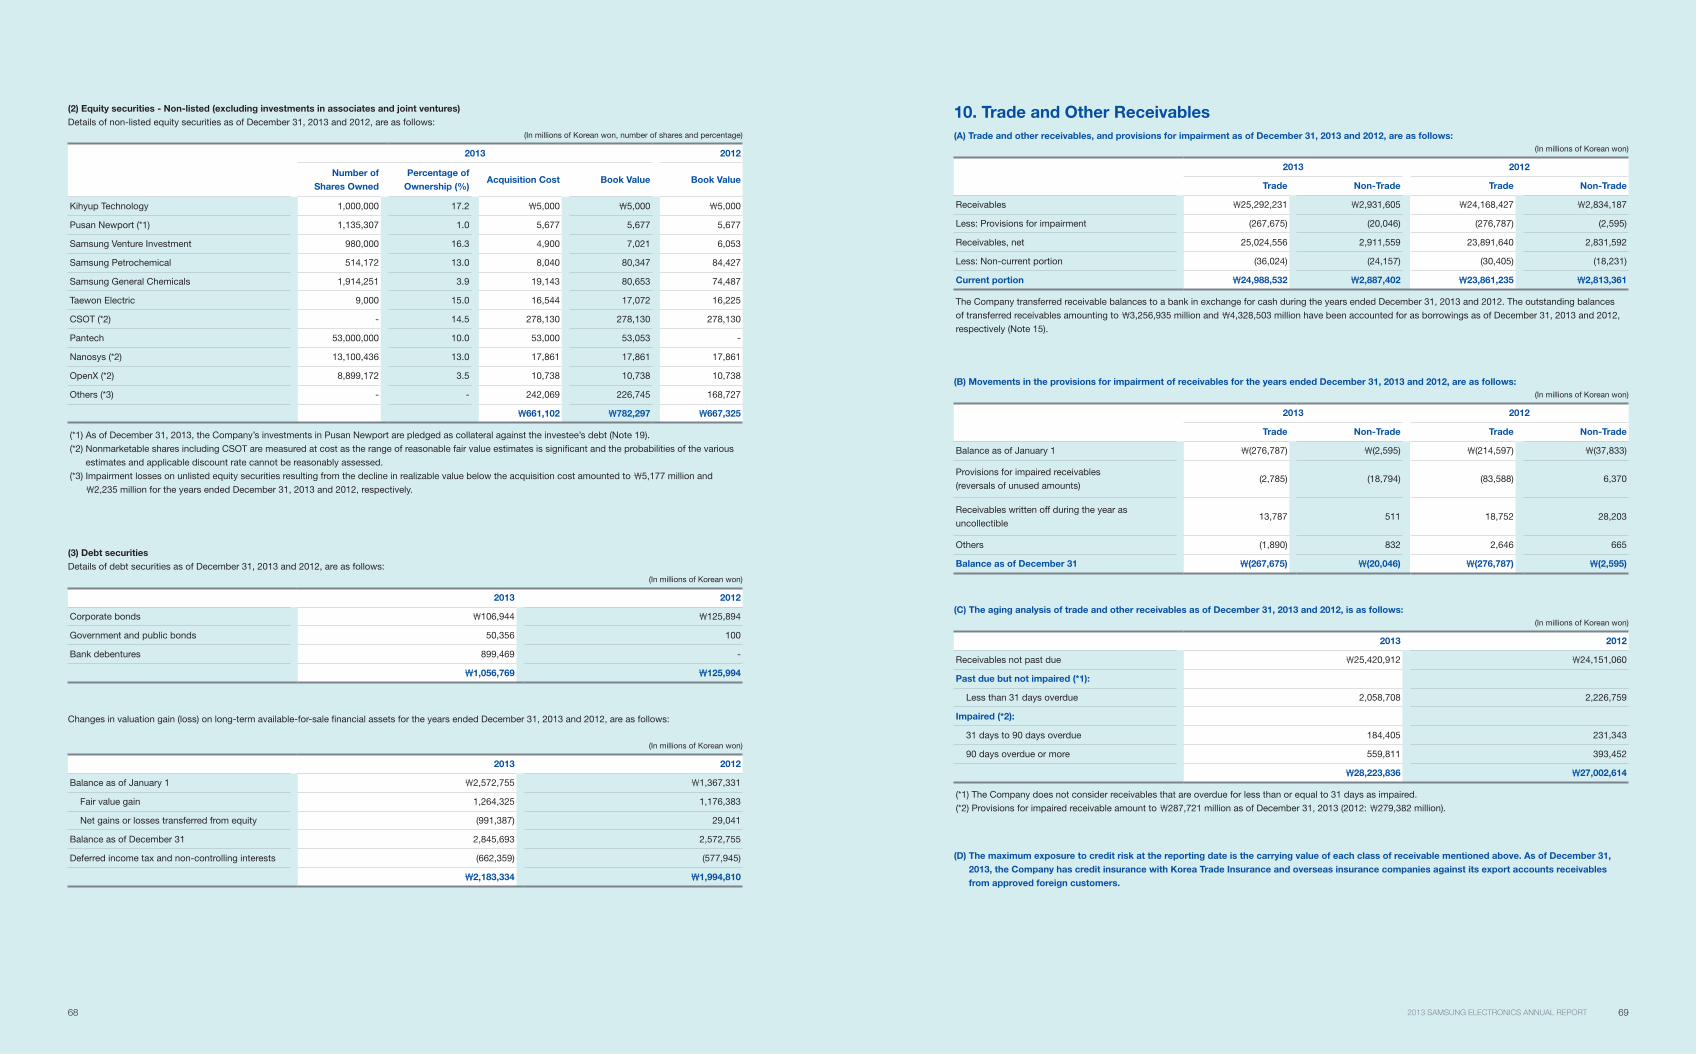
68 692013 SAMSUNG ELECTRONICS ANNUAL REPORT
(2) Equity securities - Non-listed (excluding investments in associates and joint ventures)
Details of non-listed equity securities as of December 31, 2013 and 2012, are as follows:
(In millions of Korean won, number of shares and percentage)
2013 2012
Number of
Shares Owned
Percentage of
Ownership (%)Acquisition Cost Book Value Book Value
Kihyup Technology 1,000,000 17.2 5,000 5,000 5,000
Pusan Newport (*1) 1,135,307 1.0 5,677 5,677 5,677
Samsung Venture Investment 980,000 16.3 4,900 7,021 6,053
Samsung Petrochemical 514,172 13.0 8,040 80,347 84,427
Samsung General Chemicals 1,914,251 3.9 19,143 80,653 74,487
Taewon Electric 9,000 15.0 16,544 17,072 16,225
CSOT (*2) - 14.5 278,130 278,130 278,130
Pantech 53,000,000 10.0 53,000 53,053 -
Nanosys (*2) 13,100,436 13.0 17,861 17,861 17,861
OpenX (*2) 8,899,172 3.5 10,738 10,738 10,738
Others (*3) - - 242,069 226,745 168,727
661,102 782,297 667,325
(*1) As of December 31, 2013, the Company’s investments in Pusan Newport are pledged as collateral against the investee’s debt (Note 19).
(*2) Nonmarketable shares including CSOT are measured at cost as the range of reasonable fair value estimates is significant and the probabilities of the various
estimates and applicable discount rate cannot be reasonably assessed.
(*3) Impairment losses on unlisted equity securities resulting from the decline in realizable value below the acquisition cost amounted to 5,177 million and
2,235 million for the years ended December 31, 2013 and 2012, respectively.
(3) Debt securities
Details of debt securities as of December 31, 2013 and 2012, are as follows:
(In millions of Korean won)
2013 2012
Corporate bonds 106,944 125,894
Government and public bonds 50,356 100
Bank debentures 899,469 -
1,056,769 125,994
Changes in valuation gain (loss) on long-term available-for-sale financial assets for the years ended December 31, 2013 and 2012, are as follows:
(In millions of Korean won)
2013 2012
Balance as of January 1 2,572,755 1,367,331
Fair value gain 1,264,325 1,176,383
Net gains or losses transferred from equity (991,387) 29,041
Balance as of December 31 2,845,693 2,572,755
Deferred income tax and non-controlling interests (662,359) (577,945)
2,183,334 1,994,810
10. Trade and Other Receivables
(A) Trade and other receivables, and provisions for impairment as of December 31, 2013 and 2012, are as follows:
(In millions of Korean won)
2013 2012
Trade Non-Trade Trade Non-Trade
Receivables 25,292,231 2,931,605 24,168,427 2,834,187
Less: Provisions for impairment (267,675) (20,046) (276,787) (2,595)
Receivables, net 25,024,556 2,911,559 23,891,640 2,831,592
Less: Non-current portion (36,024) (24,157) (30,405) (18,231)
Current portion 24,988,532 2,887,402 23,861,235 2,813,361
The Company transferred receivable balances to a bank in exchange for cash during the years ended December 31, 2013 and 2012. The outstanding balances
of transferred receivables amounting to 3,256,935 million and 4,328,503 million have been accounted for as borrowings as of December 31, 2013 and 2012,
respectively (Note 15).
(B) Movements in the provisions for impairment of receivables for the years ended December 31, 2013 and 2012, are as follows:
(In millions of Korean won)
2013 2012
Trade Non-Trade Trade Non-Trade
Balance as of January 1 (276,787) (2,595) (214,597) (37,833)
Provisions for impaired receivables
(reversals of unused amounts)(2,785) (18,794) (83,588) 6,370
Receivables written off during the year as
uncollectible13,787 511 18,752 28,203
Others (1,890) 832 2,646 665
Balance as of December 31 (267,675) (20,046) (276,787) (2,595)
(C) The aging analysis of trade and other receivables as of December 31, 2013 and 2012, is as follows:
(In millions of Korean won)
2013 2012
Receivables not past due 25,420,912 24,151,060
Past due but not impaired (*1):
Less than 31 days overdue 2,058,708 2,226,759
Impaired (*2):
31 days to 90 days overdue 184,405 231,343
90 days overdue or more 559,811 393,452
28,223,836 27,002,614
(*1) The Company does not consider receivables that are overdue for less than or equal to 31 days as impaired.
(*2) Provisions for impaired receivable amount to 287,721 million as of December 31, 2013 (2012: 279,382 million).
(D) The maximum exposure to credit risk at the reporting date is the carrying value of each class of receivable mentioned above. As of December 31,
2013, the Company has credit insurance with Korea Trade Insurance and overseas insurance companies against its export accounts receivables
from approved foreign customers.
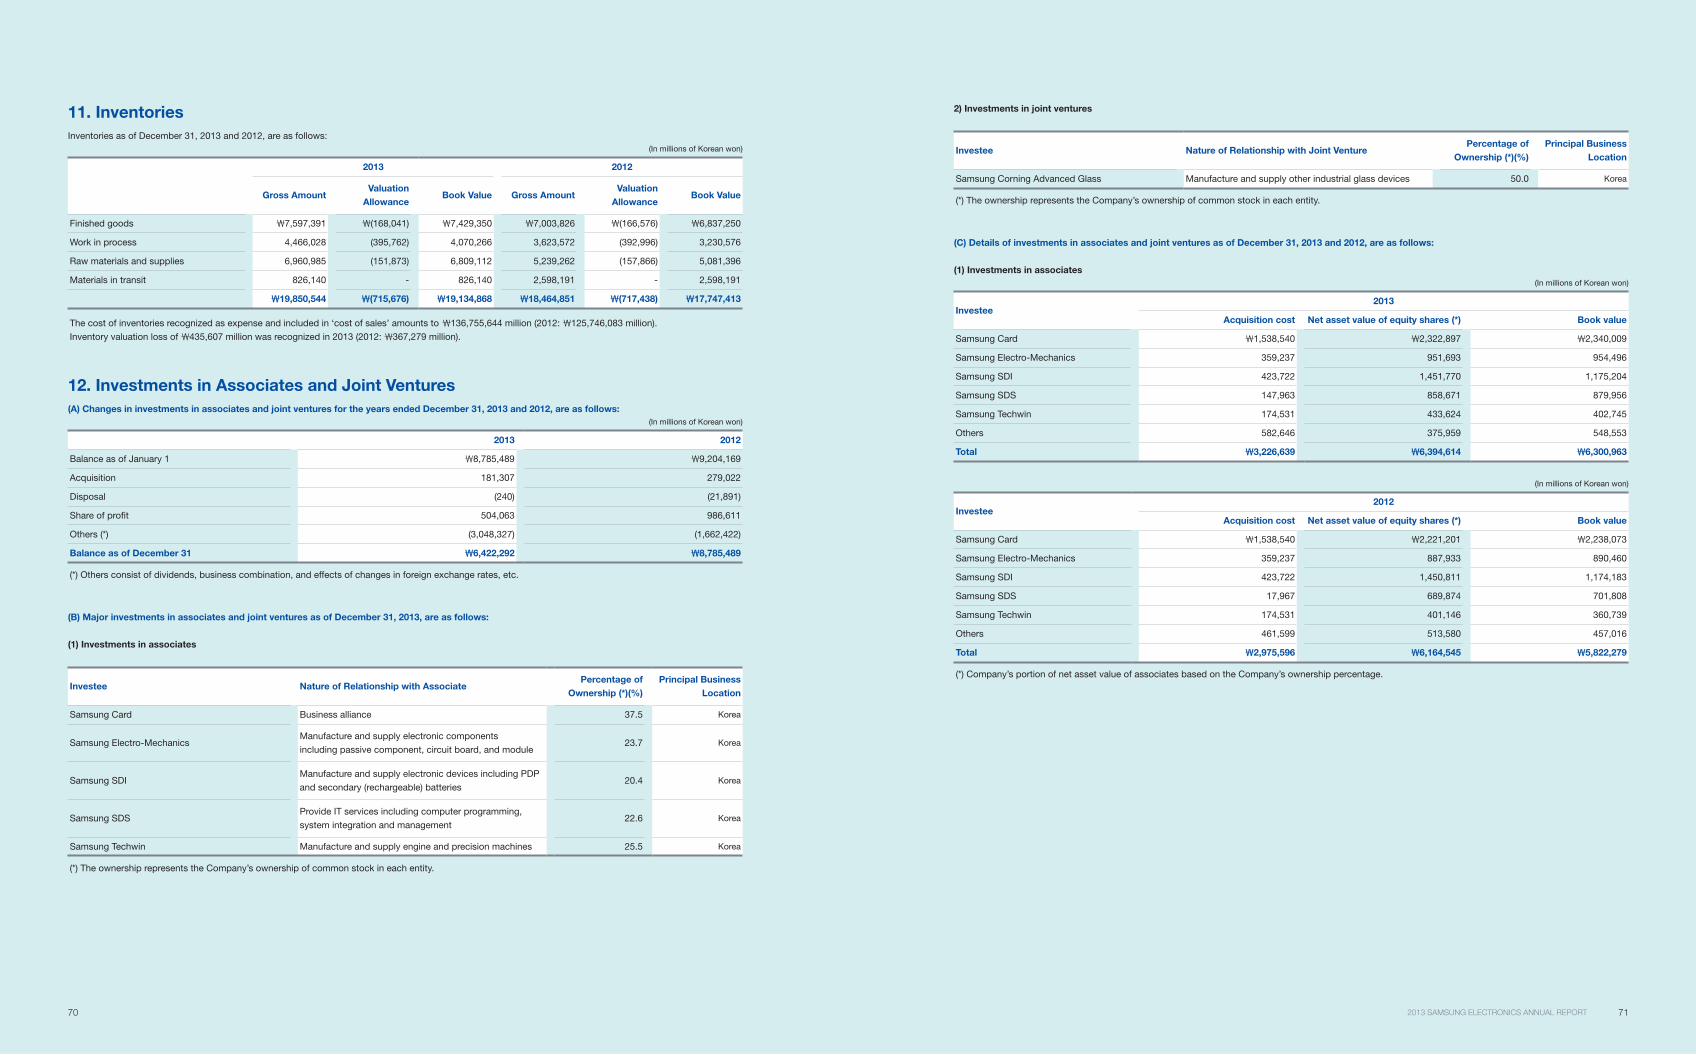
70 712013 SAMSUNG ELECTRONICS ANNUAL REPORT
11. Inventories
Inventories as of December 31, 2013 and 2012, are as follows:
(In millions of Korean won)
2013 2012
Gross AmountValuation
AllowanceBook Value Gross Amount
Valuation
AllowanceBook Value
Finished goods 7,597,391 (168,041) 7,429,350 7,003,826 (166,576) 6,837,250
Work in process 4,466,028 (395,762) 4,070,266 3,623,572 (392,996) 3,230,576
Raw materials and supplies 6,960,985 (151,873) 6,809,112 5,239,262 (157,866) 5,081,396
Materials in transit 826,140 - 826,140 2,598,191 - 2,598,191
19,850,544 (715,676) 19,134,868 18,464,851 (717,438) 17,747,413
The cost of inventories recognized as expense and included in ‘cost of sales’ amounts to 136,755,644 million (2012: 125,746,083 million).
Inventory valuation loss of 435,607 million was recognized in 2013 (2012: 367,279 million).
12. Investments in Associates and Joint Ventures
(A) Changes in investments in associates and joint ventures for the years ended December 31, 2013 and 2012, are as follows:
(In millions of Korean won)
2013 2012
Balance as of January 1 8,785,489 9,204,169
Acquisition 181,307 279,022
Disposal (240) (21,891)
Share of profit 504,063 986,611
Others (*) (3,048,327) (1,662,422)
Balance as of December 31 6,422,292 8,785,489
(*) Others consist of dividends, business combination, and effects of changes in foreign exchange rates, etc.
(B) Major investments in associates and joint ventures as of December 31, 2013, are as follows:
(1) Investments in associates
Investee Nature of Relationship with AssociatePercentage of
Ownership (*)(%)
Principal Business
Location
Samsung Card Business alliance 37.5 Korea
Samsung Electro-MechanicsManufacture and supply electronic components
including passive component, circuit board, and module23.7 Korea
Samsung SDIManufacture and supply electronic devices including PDP
and secondary (rechargeable) batteries20.4 Korea
Samsung SDSProvide IT services including computer programming,
system integration and management22.6 Korea
Samsung Techwin Manufacture and supply engine and precision machines 25.5 Korea
(*) The ownership represents the Company’s ownership of common stock in each entity.
2) Investments in joint ventures
Investee Nature of Relationship with Joint VenturePercentage of
Ownership (*)(%)
Principal Business
Location
Samsung Corning Advanced Glass Manufacture and supply other industrial glass devices 50.0 Korea
(*) The ownership represents the Company’s ownership of common stock in each entity.
(C) Details of investments in associates and joint ventures as of December 31, 2013 and 2012, are as follows:
(1) Investments in associates
(In millions of Korean won)
Investee2013
Acquisition cost Net asset value of equity shares (*) Book value
Samsung Card 1,538,540 2,322,897 2,340,009
Samsung Electro-Mechanics 359,237 951,693 954,496
Samsung SDI 423,722 1,451,770 1,175,204
Samsung SDS 147,963 858,671 879,956
Samsung Techwin 174,531 433,624 402,745
Others 582,646 375,959 548,553
Total 3,226,639 6,394,614 6,300,963
(In millions of Korean won)
Investee2012
Acquisition cost Net asset value of equity shares (*) Book value
Samsung Card 1,538,540 2,221,201 2,238,073
Samsung Electro-Mechanics 359,237 887,933 890,460
Samsung SDI 423,722 1,450,811 1,174,183
Samsung SDS 17,967 689,874 701,808
Samsung Techwin 174,531 401,146 360,739
Others 461,599 513,580 457,016
Total 2,975,596 6,164,545 5,822,279
(*) Company’s portion of net asset value of associates based on the Company’s ownership percentage.
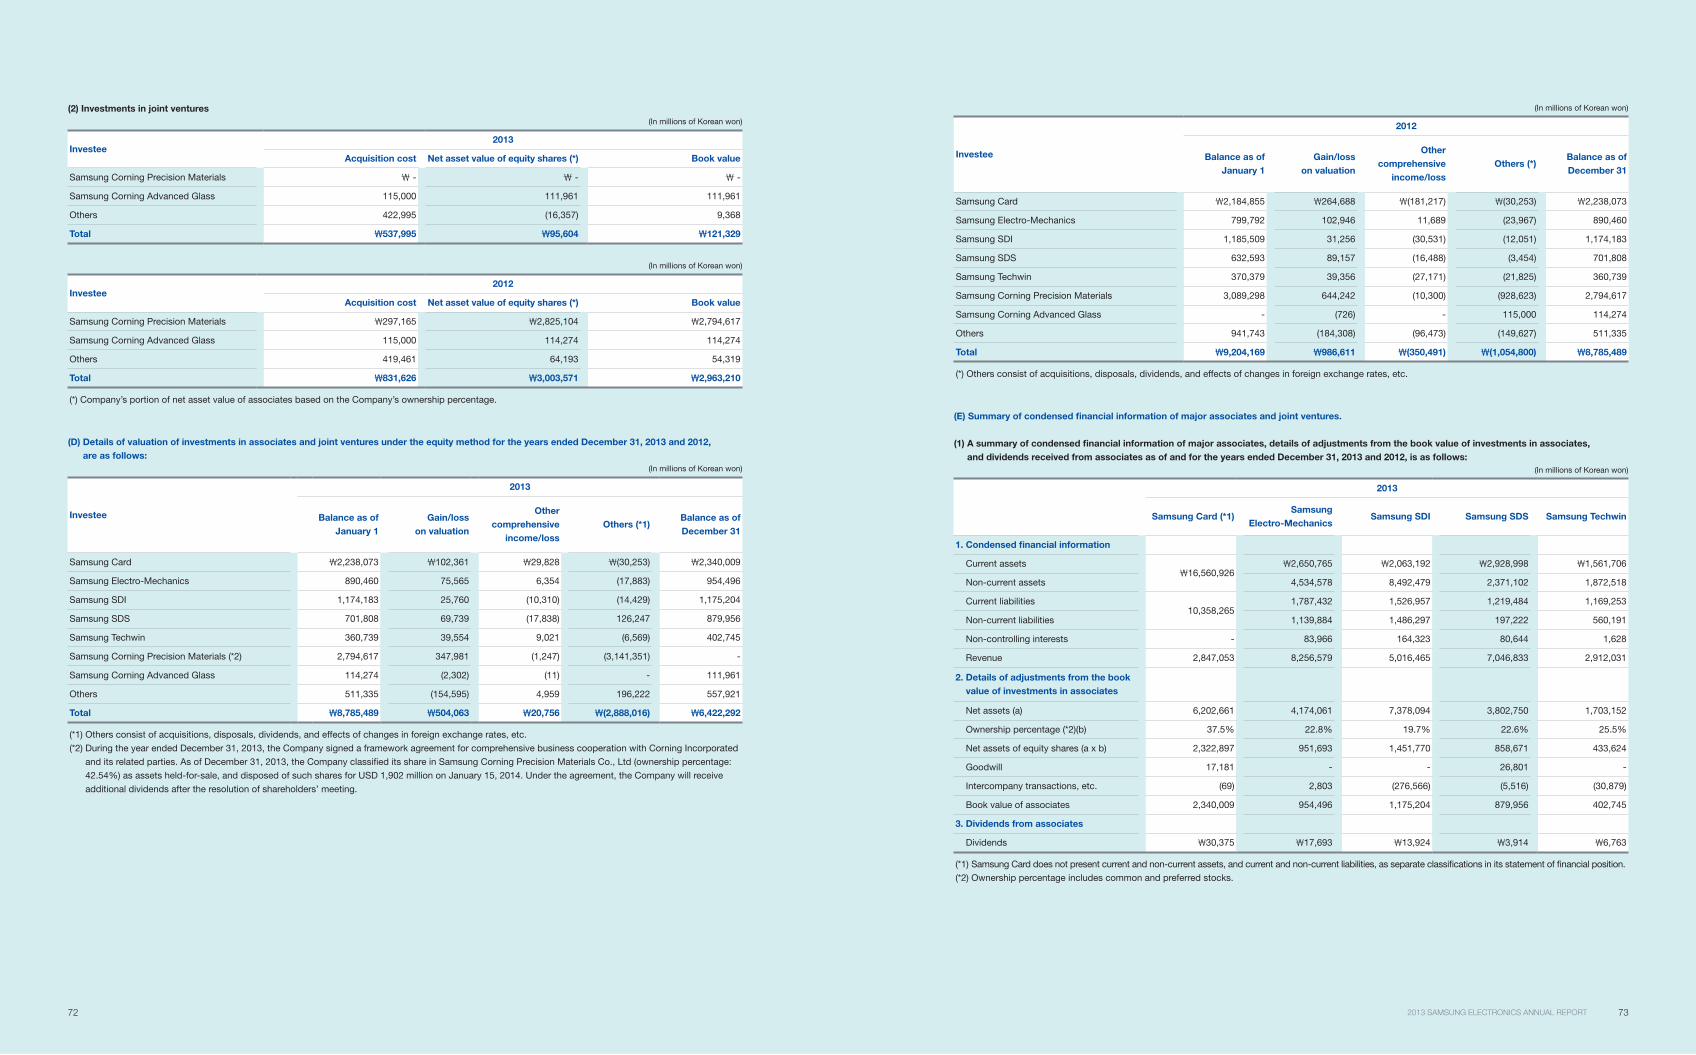
72 732013 SAMSUNG ELECTRONICS ANNUAL REPORT
(2) Investments in joint ventures
(In millions of Korean won)
Investee2013
Acquisition cost Net asset value of equity shares (*) Book value
Samsung Corning Precision Materials - - -
Samsung Corning Advanced Glass 115,000 111,961 111,961
Others 422,995 (16,357) 9,368
Total 537,995 95,604 121,329
(In millions of Korean won)
Investee2012
Acquisition cost Net asset value of equity shares (*) Book value
Samsung Corning Precision Materials 297,165 2,825,104 2,794,617
Samsung Corning Advanced Glass 115,000 114,274 114,274
Others 419,461 64,193 54,319
Total 831,626 3,003,571 2,963,210
(*) Company’s portion of net asset value of associates based on the Company’s ownership percentage.
(D) Details of valuation of investments in associates and joint ventures under the equity method for the years ended December 31, 2013 and 2012,
are as follows:
(In millions of Korean won)
Investee
2013
Balance as of
January 1
Gain/loss
on valuation
Other
comprehensive
income/loss
Others (*1)Balance as of
December 31
Samsung Card 2,238,073 102,361 29,828 (30,253) 2,340,009
Samsung Electro-Mechanics 890,460 75,565 6,354 (17,883) 954,496
Samsung SDI 1,174,183 25,760 (10,310) (14,429) 1,175,204
Samsung SDS 701,808 69,739 (17,838) 126,247 879,956
Samsung Techwin 360,739 39,554 9,021 (6,569) 402,745
Samsung Corning Precision Materials (*2) 2,794,617 347,981 (1,247) (3,141,351) -
Samsung Corning Advanced Glass 114,274 (2,302) (11) - 111,961
Others 511,335 (154,595) 4,959 196,222 557,921
Total 8,785,489 504,063 20,756 (2,888,016) 6,422,292
(*1) Others consist of acquisitions, disposals, dividends, and effects of changes in foreign exchange rates, etc.
(*2) During the year ended December 31, 2013, the Company signed a framework agreement for comprehensive business cooperation with Corning Incorporated
and its related parties. As of December 31, 2013, the Company classified its share in Samsung Corning Precision Materials Co., Ltd (ownership percentage:
42.54%) as assets held-for-sale, and disposed of such shares for USD 1,902 million on January 15, 2014. Under the agreement, the Company will receive
additional dividends after the resolution of shareholders’ meeting.
(In millions of Korean won)
Investee
2012
Balance as of
January 1
Gain/loss
on valuation
Other
comprehensive
income/loss
Others (*)Balance as of
December 31
Samsung Card 2,184,855 264,688 (181,217) (30,253) 2,238,073
Samsung Electro-Mechanics 799,792 102,946 11,689 (23,967) 890,460
Samsung SDI 1,185,509 31,256 (30,531) (12,051) 1,174,183
Samsung SDS 632,593 89,157 (16,488) (3,454) 701,808
Samsung Techwin 370,379 39,356 (27,171) (21,825) 360,739
Samsung Corning Precision Materials 3,089,298 644,242 (10,300) (928,623) 2,794,617
Samsung Corning Advanced Glass - (726) - 115,000 114,274
Others 941,743 (184,308) (96,473) (149,627) 511,335
Total 9,204,169 986,611 (350,491) (1,054,800) 8,785,489
(*) Others consist of acquisitions, disposals, dividends, and effects of changes in foreign exchange rates, etc.
(E) Summary of condensed financial information of major associates and joint ventures.
(1) A summary of condensed financial information of major associates, details of adjustments from the book value of investments in associates,
and dividends received from associates as of and for the years ended December 31, 2013 and 2012, is as follows:
(In millions of Korean won)
2013
Samsung Card (*1)Samsung
Electro-MechanicsSamsung SDI Samsung SDS Samsung Techwin
1. Condensed financial information
Current assets16,560,926
2,650,765 2,063,192 2,928,998 1,561,706
Non-current assets 4,534,578 8,492,479 2,371,102 1,872,518
Current liabilities10,358,265
1,787,432 1,526,957 1,219,484 1,169,253
Non-current liabilities 1,139,884 1,486,297 197,222 560,191
Non-controlling interests - 83,966 164,323 80,644 1,628
Revenue 2,847,053 8,256,579 5,016,465 7,046,833 2,912,031
2. Details of adjustments from the book
value of investments in associates
Net assets (a) 6,202,661 4,174,061 7,378,094 3,802,750 1,703,152
Ownership percentage (*2)(b) 37.5% 22.8% 19.7% 22.6% 25.5%
Net assets of equity shares (a x b) 2,322,897 951,693 1,451,770 858,671 433,624
Goodwill 17,181 - - 26,801 -
Intercompany transactions, etc. (69) 2,803 (276,566) (5,516) (30,879)
Book value of associates 2,340,009 954,496 1,175,204 879,956 402,745
3. Dividends from associates
Dividends 30,375 17,693 13,924 3,914 6,763
(*1) Samsung Card does not present current and non-current assets, and current and non-current liabilities, as separate classifications in its statement of financial position.
(*2) Ownership percentage includes common and preferred stocks.
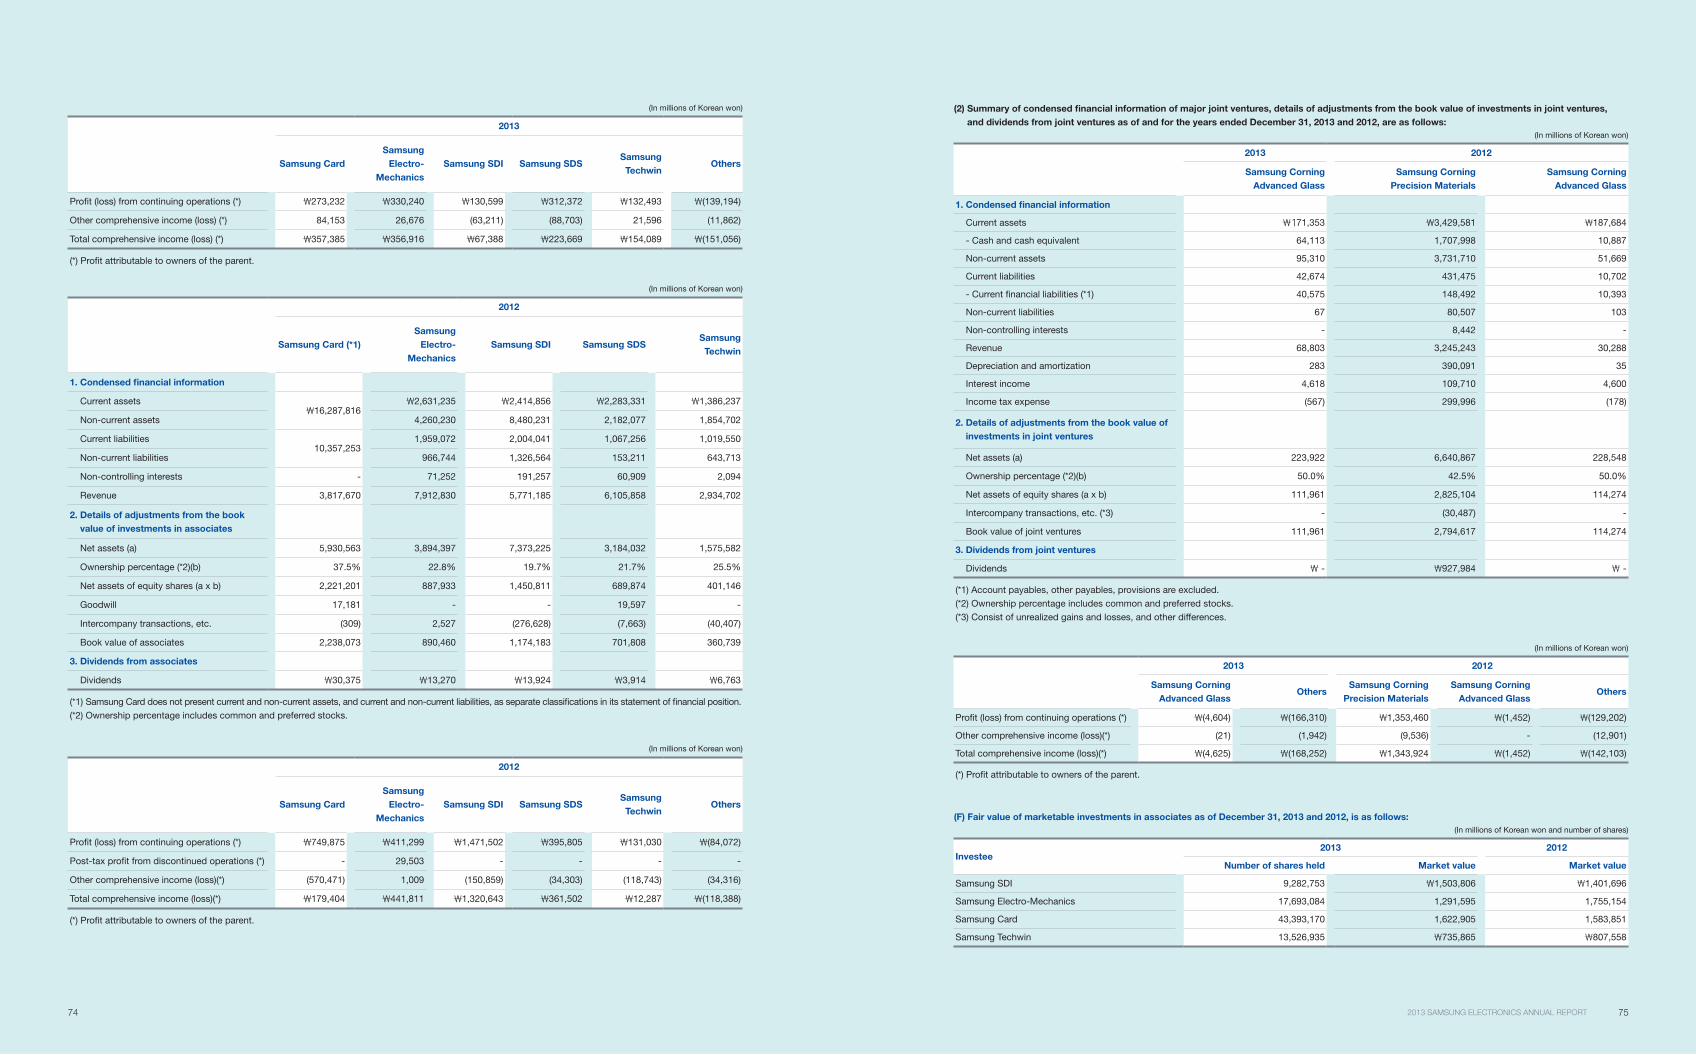
74 752013 SAMSUNG ELECTRONICS ANNUAL REPORT
(2) Summary of condensed financial information of major joint ventures, details of adjustments from the book value of investments in joint ventures,
and dividends from joint ventures as of and for the years ended December 31, 2013 and 2012, are as follows:
(In millions of Korean won)
2013 2012
Samsung Corning
Advanced Glass
Samsung Corning
Precision Materials
Samsung Corning
Advanced Glass
1. Condensed financial information
Current assets 71,353 3,429,581 187,684
- Cash and cash equivalent 64,113 1,707,998 10,887
Non-current assets 95,310 3,731,710 51,669
Current liabilities 42,674 431,475 10,702
- Current financial liabilities (*1) 40,575 148,492 10,393
Non-current liabilities 67 80,507 103
Non-controlling interests - 8,442 -
Revenue 68,803 3,245,243 30,288
Depreciation and amortization 283 390,091 35
Interest income 4,618 109,710 4,600
Income tax expense (567) 299,996 (178)
2. Details of adjustments from the book value of
investments in joint ventures
Net assets (a) 223,922 6,640,867 228,548
Ownership percentage (*2)(b) 50.0% 42.5% 50.0%
Net assets of equity shares (a x b) 111,961 2,825,104 114,274
Intercompany transactions, etc. (*3) - (30,487) -
Book value of joint ventures 111,961 2,794,617 114,274
3. Dividends from joint ventures
Dividends - 927,984 -
(*1) Account payables, other payables, provisions are excluded.
(*2) Ownership percentage includes common and preferred stocks.
(*3) Consist of unrealized gains and losses, and other differences.
(In millions of Korean won)
2013 2012
Samsung Corning
Advanced GlassOthers
Samsung Corning
Precision Materials
Samsung Corning
Advanced GlassOthers
Profit (loss) from continuing operations (*) (4,604) (166,310) 1,353,460 (1,452) (129,202)
Other comprehensive income (loss)(*) (21) (1,942) (9,536) - (12,901)
Total comprehensive income (loss)(*) (4,625) (168,252) 1,343,924 (1,452) (142,103)
(*) Profit attributable to owners of the parent.
(F) Fair value of marketable investments in associates as of December 31, 2013 and 2012, is as follows:
(In millions of Korean won and number of shares)
Investee2013 2012
Number of shares held Market value Market value
Samsung SDI 9,282,753 1,503,806 1,401,696
Samsung Electro-Mechanics 17,693,084 1,291,595 1,755,154
Samsung Card 43,393,170 1,622,905 1,583,851
Samsung Techwin 13,526,935 735,865 807,558
(In millions of Korean won)
2013
Samsung Card
Samsung
Electro-
Mechanics
Samsung SDI Samsung SDSSamsung
TechwinOthers
Profit (loss) from continuing operations (*) 273,232 330,240 130,599 312,372 132,493 (139,194)
Other comprehensive income (loss) (*) 84,153 26,676 (63,211) (88,703) 21,596 (11,862)
Total comprehensive income (loss) (*) 357,385 356,916 67,388 223,669 154,089 (151,056)
(*) Profit attributable to owners of the parent.
(In millions of Korean won)
2012
Samsung Card (*1)
Samsung
Electro-
Mechanics
Samsung SDI Samsung SDSSamsung
Techwin
1. Condensed financial information
Current assets16,287,816
2,631,235 2,414,856 2,283,331 1,386,237
Non-current assets 4,260,230 8,480,231 2,182,077 1,854,702
Current liabilities10,357,253
1,959,072 2,004,041 1,067,256 1,019,550
Non-current liabilities 966,744 1,326,564 153,211 643,713
Non-controlling interests - 71,252 191,257 60,909 2,094
Revenue 3,817,670 7,912,830 5,771,185 6,105,858 2,934,702
2. Details of adjustments from the book
value of investments in associates
Net assets (a) 5,930,563 3,894,397 7,373,225 3,184,032 1,575,582
Ownership percentage (*2)(b) 37.5% 22.8% 19.7% 21.7% 25.5%
Net assets of equity shares (a x b) 2,221,201 887,933 1,450,811 689,874 401,146
Goodwill 17,181 - - 19,597 -
Intercompany transactions, etc. (309) 2,527 (276,628) (7,663) (40,407)
Book value of associates 2,238,073 890,460 1,174,183 701,808 360,739
3. Dividends from associates
Dividends 30,375 13,270 13,924 3,914 6,763
(*1) Samsung Card does not present current and non-current assets, and current and non-current liabilities, as separate classifications in its statement of financial position.
(*2) Ownership percentage includes common and preferred stocks.
(In millions of Korean won)
2012
Samsung Card
Samsung
Electro-
Mechanics
Samsung SDI Samsung SDSSamsung
TechwinOthers
Profit (loss) from continuing operations (*) 749,875 411,299 1,471,502 395,805 131,030 (84,072)
Post-tax profit from discontinued operations (*) - 29,503 - - - -
Other comprehensive income (loss)(*) (570,471) 1,009 (150,859) (34,303) (118,743) (34,316)
Total comprehensive income (loss)(*) 179,404 441,811 1,320,643 361,502 12,287 (118,388)
(*) Profit attributable to owners of the parent.

76 772013 SAMSUNG ELECTRONICS ANNUAL REPORT
13. Property, Plant and Equipment
(A) Changes in property, plant and equipment for the years ended December 31, 2013 and 2012, are as follows:
(In millions of Korean won)
2013
LandBuildings and
Structures
Machinery and
Equipment
Construction
In ProgressOthers Total
Balance as of January 1 7,152,141 13,008,839 38,046,176 8,492,885 1,784,702 68,484,743
Acquisition cost 7,152,141 19,624,030 110,034,355 8,492,885 5,011,914 150,315,325
Accumulated depreciation and impairment - (6,615,191) (71,988,179) - (3,227,212) (81,830,582)
Acquisitions and capital expenditures (*1) 322,433 4,209,093 12,627,962 5,362,760 1,237,317 23,759,565
Business combinations - 31 877 - 144 1,052
Depreciation - (1,146,000) (13,473,515) - (850,497) (15,470,012)
Sales/disposals (29,572) (30,850) (320,296) (50,930) (60,143) (491,791)
Impairment - (78) (145,263) - (175) (145,516)
Others (*2) (15,715) (325,971) (237,463) 35,457 (97,961) (641,653)
Balance as of December 31 7,429,287 36,498,478 13,840,172 2,013,387 75,496,388
Acquisition cost 7,429,287 23,375,035 118,621,699 13,840,172 5,518,351 168,784,544
Accumulated depreciation and impairment - (7,659,971) (82,123,221) - (3,504,964) (93,288,156)
(*1) The capitalized borrowing costs are 52,039 million and the interest rate used to calculate the borrowing costs eligible for capitalization is 1.73%.
(*2) Others include effects of changes in foreign currency exchange rates.
(In millions of Korean won)
2012
LandBuildings and
Structures
Machinery and
Equipment
Construction
In ProgressOthers Total
Balance as of January 1 7,214,734 12,778,760 33,453,220 6,982,473 1,614,764 62,043,951
Acquisition cost 7,214,734 18,472,852 96,618,176 6,982,473 4,683,845 133,972,080
Accumulated depreciation and impairment - (5,694,092) (63,164,956) - (3,069,081) (71,928,129)
Acquisitions and capital expenditures (*1) 54,960 1,681,106 18,302,895 1,854,111 956,723 22,849,795
Business combinations - - 654,490 21,612 29,007 705,109
Depreciation - (1,121,614) (12,895,133) - (818,299) (14,835,046)
Sales/disposals (76,724) (100,854) (604,989) (22,213) (114,292) (919,072)
Impairment - (3,992) (211,299) - (34) (215,325)
Others (*2) (40,829) (224,567) (653,008) (343,098) 116,833 (1,144,669)
Balance as of December 31 7,152,141 13,008,839 38,046,176 8,492,885 1,784,702 68,484,743
Acquisition cost 7,152,141 19,624,030 110,034,355 8,492,885 5,011,914 150,315,325
Accumulated depreciation and impairment - (6,615,191) (71,988,179) - (3,227,212) (81,830,582)
(*1) The capitalized borrowing costs are 36,129 million and the interest rate used to calculate the borrowing costs eligible for capitalization is 2.50%.
(*2) Others include effects of changes in foreign currency exchange rates.
(B) Details of depreciation of property, plant and equipment by line item for the years ended December 31, 2013 and 2012, are as follows:
(In millions of Korean won)
2013 2012
Cost of sales 14,053,512 13,666,700
Selling and administrative expenses, etc. 1,416,500 1,168,346
15,470,012 14,835,046
14. Intangible Assets
(A) Changes in intangible assets for the years ended December 31, 2013 and 2012, are as follows:
(In millions of Korean won)
2013
Intellectual
property rights
Capitalized
costMembership Goodwill Others Total
Balance as of January 1 1,186,033 602,274 170,843 573,845 1,196,710 3,729,705
Internally generated (development costs) - 461,030 - - - 461,030
External acquisitions 284,392 - 7,203 - 182,118 473,713
Business combinations 49,046 - - 115,331 2,176 166,553
Amortization (200,452) (310,635) - - (464,314) (975,401)
Sales/disposals (44,633) - (572) (24,651) (4,125) (73,981)
Impairment (1,753) - - (99,643) (7,024) (108,420)
Others (*) (40,960) - 58 (4,348) 352,651 307,401
Balance as of December 31 1,231,673 752,669 177,532 560,534 1,258,192 3,980,600
(*) Others include effects of changes in foreign currency exchange rates.
(In millions of Korean won)
2012
Intellectual
property rights
Capitalized
costMembership Goodwill Others Total
Balance as of January 1 983,802 473,024 197,957 523,409 1,177,044 3,355,236
Internally generated (development costs) - 359,639 - - - 359,639
External acquisitions 227,538 - 9,520 - 64,832 301,890
Business combinations 163,164 - 3,670 259,961 71,917 498,712
Amortization (169,668) (229,186) - - (388,116) (786,970)
Sales/disposals (13,123) - (39,095) - (980) (53,198)
Impairment (124) (1,203) - (204,746) (10,717) (216,790)
Others (*) (5,556) - (1,209) (4,779) 282,730 271,186
Balance as of December 31 1,186,033 602,274 170,843 573,845 1,196,710 3,729,705
(*) Others include effects of changes in foreign currency exchange rates.
(B) Goodwill
Goodwill is allocated to cash-generating units at the end of the reporting period, and consists of the following:
(In millions of Korean won)
2013 2012
S. LSI business 109,120 112,723
Memory business 74,418 74,995
Health Care Equipment business 199,758 89,258
Digital Imaging business - 82,599
LCD business 80,299 80,299
LED business 79,277 79,277
Others 17,662 54,694
Total 560,534 573,845
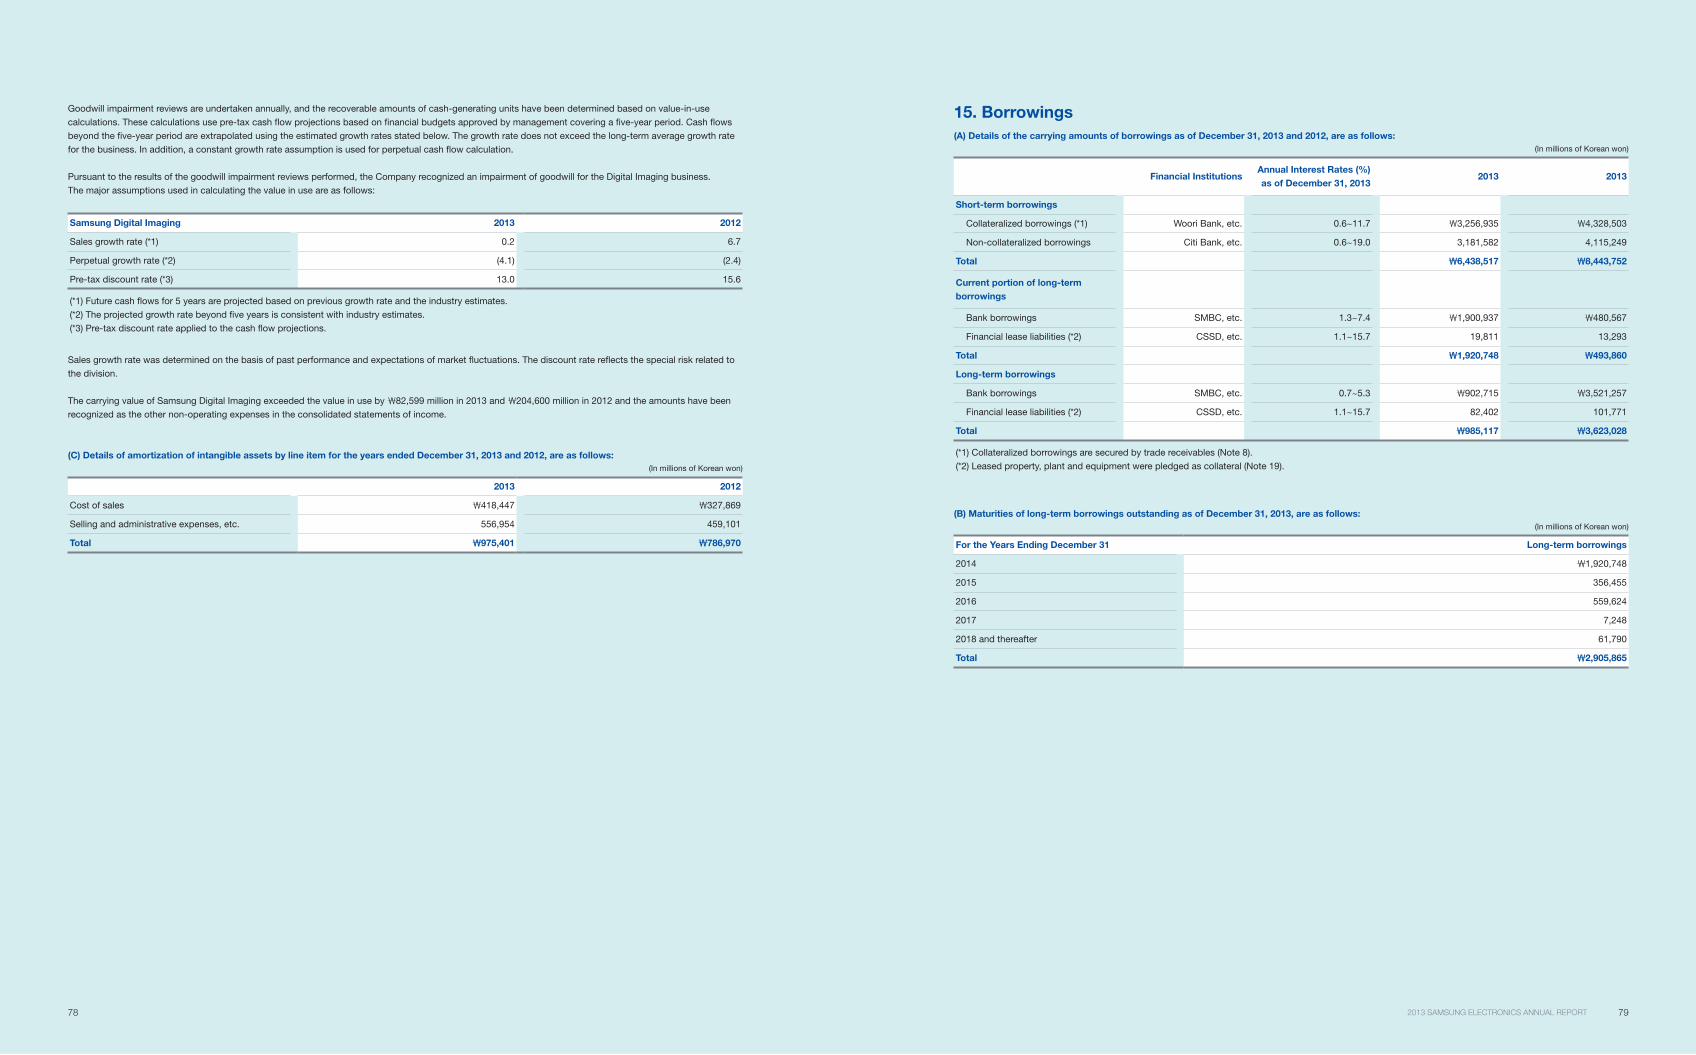
78 792013 SAMSUNG ELECTRONICS ANNUAL REPORT
15. Borrowings
(A) Details of the carrying amounts of borrowings as of December 31, 2013 and 2012, are as follows:
(In millions of Korean won)
Financial InstitutionsAnnual Interest Rates (%)
as of December 31, 20132013 2013
Short-term borrowings
Collateralized borrowings (*1) Woori Bank, etc. 0.6~11.7 3,256,935 4,328,503
Non-collateralized borrowings Citi Bank, etc. 0.6~19.0 3,181,582 4,115,249
Total 6,438,517 8,443,752
Current portion of long-term
borrowings
Bank borrowings SMBC, etc. 1.3~7.4 1,900,937 480,567
Financial lease liabilities (*2) CSSD, etc. 1.1~15.7 19,811 13,293
Total 1,920,748 493,860
Long-term borrowings
Bank borrowings SMBC, etc. 0.7~5.3 902,715 3,521,257
Financial lease liabilities (*2) CSSD, etc. 1.1~15.7 82,402 101,771
Total 985,117 3,623,028
(*1) Collateralized borrowings are secured by trade receivables (Note 8).
(*2) Leased property, plant and equipment were pledged as collateral (Note 19).
(B) Maturities of long-term borrowings outstanding as of December 31, 2013, are as follows:
(In millions of Korean won)
For the Years Ending December 31 Long-term borrowings
2014 1,920,748
2015 356,455
2016 559,624
2017 7,248
2018 and thereafter 61,790
Total 2,905,865
Goodwill impairment reviews are undertaken annually, and the recoverable amounts of cash-generating units have been determined based on value-in-use
calculations. These calculations use pre-tax cash flow projections based on financial budgets approved by management covering a five-year period. Cash flows
beyond the five-year period are extrapolated using the estimated growth rates stated below. The growth rate does not exceed the long-term average growth rate
for the business. In addition, a constant growth rate assumption is used for perpetual cash flow calculation.
Pursuant to the results of the goodwill impairment reviews performed, the Company recognized an impairment of goodwill for the Digital Imaging business.
The major assumptions used in calculating the value in use are as follows:
Samsung Digital Imaging 2013 2012
Sales growth rate (*1) 0.2 6.7
Perpetual growth rate (*2) (4.1) (2.4)
Pre-tax discount rate (*3) 13.0 15.6
(*1) Future cash flows for 5 years are projected based on previous growth rate and the industry estimates.
(*2) The projected growth rate beyond five years is consistent with industry estimates.
(*3) Pre-tax discount rate applied to the cash flow projections.
Sales growth rate was determined on the basis of past performance and expectations of market fluctuations. The discount rate reflects the special risk related to
the division.
The carrying value of Samsung Digital Imaging exceeded the value in use by 82,599 million in 2013 and 204,600 million in 2012 and the amounts have been
recognized as the other non-operating expenses in the consolidated statements of income.
(C) Details of amortization of intangible assets by line item for the years ended December 31, 2013 and 2012, are as follows:
(In millions of Korean won)
2013 2012
Cost of sales 418,447 327,869
Selling and administrative expenses, etc. 556,954 459,101
Total 975,401 786,970

80 812013 SAMSUNG ELECTRONICS ANNUAL REPORT
16. Debentures
Details of carrying amount of debentures as of December 31, 2013 and 2012, are as follows:
(In millions of Korean won)
2013 2012
Korean won denominated debentures (A) 198,566 697,822
Foreign currency denominated debentures (B) 1,112,502 1,131,552
Total 1,311,068 1,829,374
(A) Details of Korean won denominated debentures as of December 31, 2013 and 2012, are as follows:
(In millions of Korean won)
Issue Date Due Date
Annual Interest
Rates (%) as of
December 31,
2013
2013 2012
Unsecured debentures 2010.6.17 2013.6.17 - - 500,000
Unsecured debentures 2011.11.17 2014.11.17 4.1 500,000 500,000
Unsecured debentures 2011.11.17 2016.11.17 4.2 200,000 200,000
Less: Current portion (500,000) (500,000)
Less: Discounts (1,434) (2,178)
Total 198,566 697,822
All the above debentures have been issued by Samsung Display and will be repaid upon maturity.
(B) Details of foreign currency denominated debentures as of December 31, 2013 and 2012, are as follows:
(In millions of Korean won)
Issue Date Due Date
Annual Interest
Rates (%) as of
December 31,
2013
2013 2012
US dollar denominated straight bonds (*1) 1997.10.2 2027.10.1 7.773,871
(US$70 million)
80,333
(US$75 million)
US dollar denominated unsecured bonds (*2) 2012.4.10 2017.4.10 1.81,055,300
(US$1,000 million)
1,071,100
(US$1,000 million)
Less: Current portion (5,277) (5,356)
Less: Discounts (11,392) (14,525)
Total 1,112,502 1,131,552
(*1) US dollar straight bonds are repaid annually for twenty years after a ten-year grace period from the date of issuance. Interest is paid semi-annually.
(*2) Samsung Electronics America issued dollar denominated unsecured bonds. Repayment of these debentures is due on the date of maturity and interest is
paid semi-annually.
(C) Maturities of debentures outstanding as of December 31, 2013 are as follows:
(In millions of Korean won)
For the Years Ending December 31 Debentures
2014 505,277
2015 5,277
2016 205,277
2017 1,060,577
2018 and thereafter 52,763
Total 1,829,171
17. Net Defined Benefit Liabilities
(A) Details of net defined benefit liabilities recognized on the
statements of financial position as of December 31, 2013 and 2012,
are as follows:
(In millions of Korean won)
2013 2012
Present value of funded defined benefit
obligations5,672,147 4,593,284
Present value of unfunded defined
benefit obligations55,931 76,183
Subtotal 5,728,078 4,669,467
Fair value of plan assets (3,873,176) (2,939,528)
Total 1,854,902 1,729,939
(B) The amounts recognized in the statements of income for the years
ended December 31, 2013 and 2012, are as follows:
(In millions of Korean won)
2013 2012
Current service cost 836,916 670,123
Interest cost 82,487 58,591
Others 8,164 8,033
927,567 736,747
(C) The amounts recognized as cost of defined contribution plan for the
years ended December 31, 2013 and 2012, are 44,430 million and
31,676 million, respectively.
(D) The pension expenses related to defined benefit plans by line
item recognized on the statements of income for the years ended
December 31, 2013 and 2012, are as follows:
(In millions of Korean won)
2013 2012
Cost of sales 376,588 291,355
Selling and administrative expenses, etc. 550,979 445,392
927,567 736,747
(E) Changes in the defined benefit obligations for the years ended
December 31, 2013 and 2012, are as follows:
(In millions of Korean won)
2013 2012
Balance as of January 1 4,669,467 3,542,340
Current service cost 836,916 670,123
Interest cost 226,271 194,625
Remeasurement:
Actuarial gains or losses arising from
changes in demographic assumptions(38) 81,587
Actuarial gains or losses arising from
changes in financial assumptions(22,870) 473,488
Others 257,724 55,396
Benefits paid (244,186) (301,444)
Foreign exchange differences (18,128) (22,028)
Others 22,922 (24,620)
Balance as of December 31 5,728,078 4,669,467
(F) Changes in the fair value of plan assets for the years ended
December 31, 2013 and 2012, are as follows:
(In millions of Korean won)
2013 2012
Balance as of January 1 2,939,528 2,423,152
Expected return on plan assets 143,784 136,034
Remeasurement factor of plan assets (37,343) (47,333)
Contributions by the employer 978,313 595,420
Benefits paid (141,017) (155,000)
Foreign exchange differences (3,035) (8,812)
Others (7,054) (3,933)
Balance as of December 31 3,873,176 2,939,528
Expected contributions to post-employment benefit plans for the year
ending December 31, 2014, are 1,176,458 million.
(G) Plan assets as of December 31, 2013 and 2012, consist of as
follows:
(In millions of Korean won)
2013 2012
Equity instruments - 59,988
Debt instruments 3,851,102 2,859,415
Others 22,074 20,125
3,873,176 2,939,528
(*) Plan assets are mostly invested in instruments which have a quoted
price in active market.
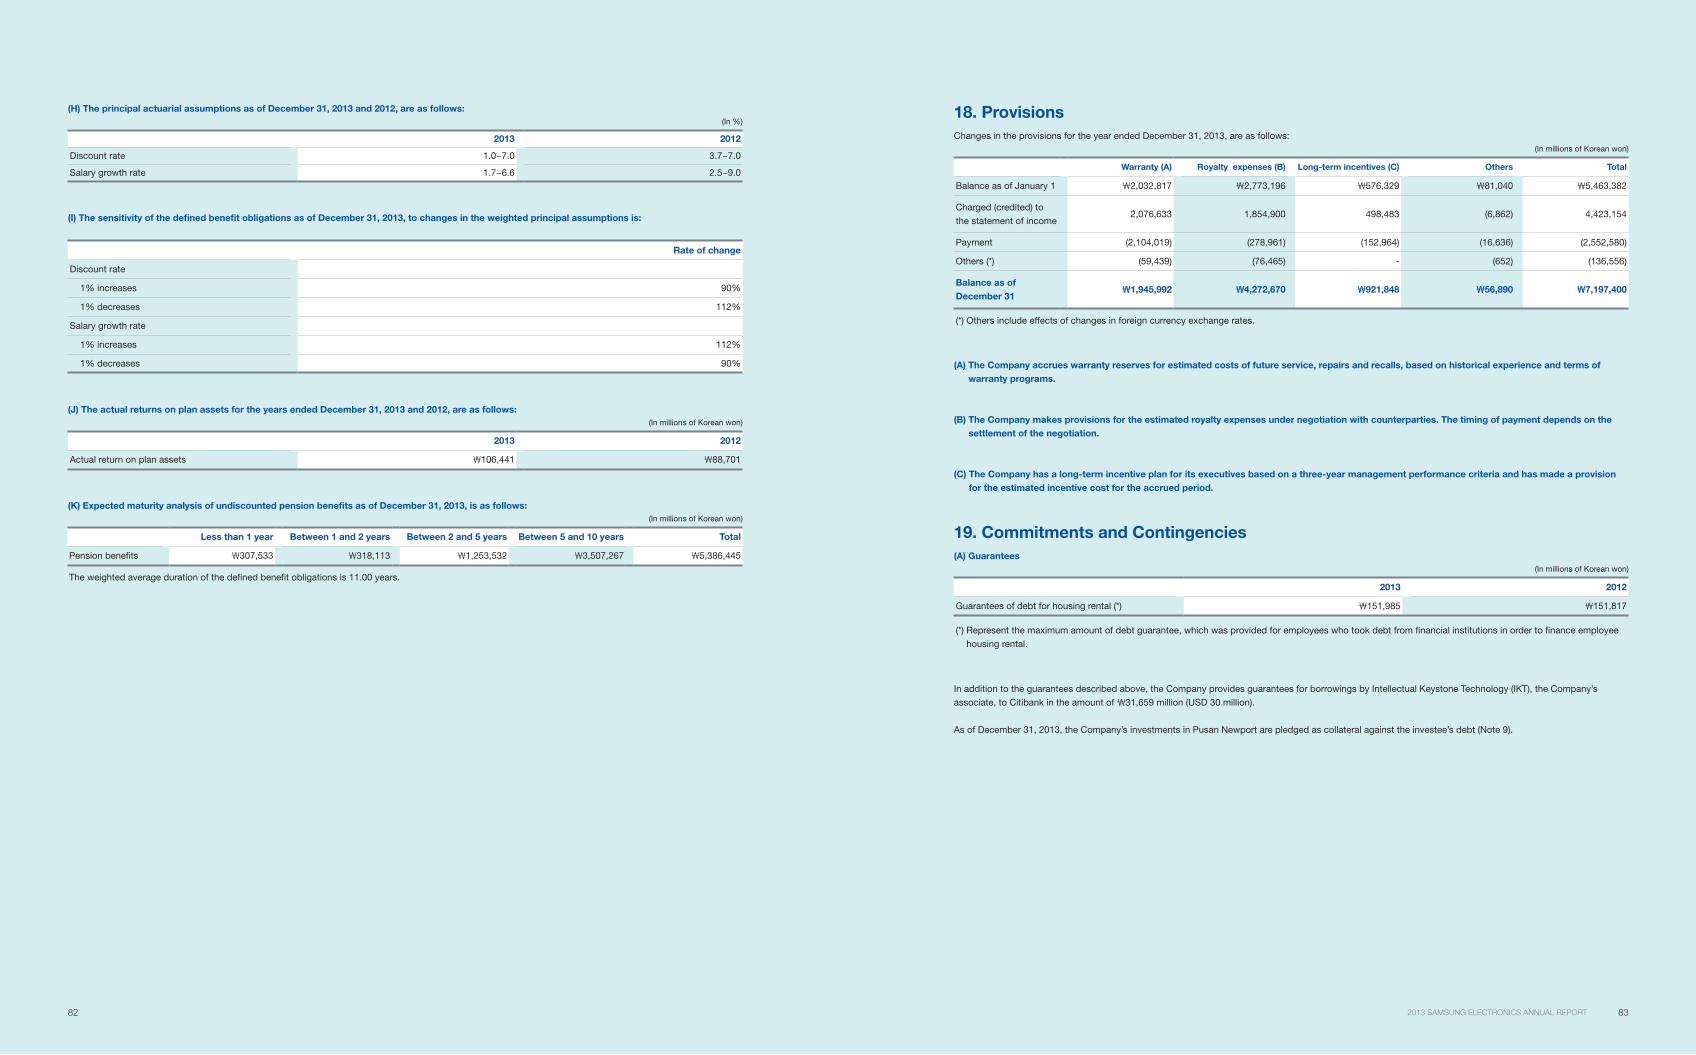
82 832013 SAMSUNG ELECTRONICS ANNUAL REPORT
(H) The principal actuarial assumptions as of December 31, 2013 and 2012, are as follows:
(In %)
2013 2012
Discount rate 1.0~7.0 3.7~7.0
Salary growth rate 1.7~6.6 2.5~9.0
(I) The sensitivity of the defined benefit obligations as of December 31, 2013, to changes in the weighted principal assumptions is:
Rate of change
Discount rate
1% increases 90%
1% decreases 112%
Salary growth rate
1% increases 112%
1% decreases 90%
(J) The actual returns on plan assets for the years ended December 31, 2013 and 2012, are as follows:
(In millions of Korean won)
2013 2012
Actual return on plan assets 106,441 88,701
(K) Expected maturity analysis of undiscounted pension benefits as of December 31, 2013, is as follows:
(In millions of Korean won)
Less than 1 year Between 1 and 2 years Between 2 and 5 years Between 5 and 10 years Total
Pension benefits 307,533 318,113 1,253,532 3,507,267 5,386,445
The weighted average duration of the defined benefit obligations is 11.00 years.
18. Provisions
Changes in the provisions for the year ended December 31, 2013, are as follows:
(In millions of Korean won)
Warranty (A) Royalty expenses (B) Long-term incentives (C) Others Total
Balance as of January 1 2,032,817 2,773,196 576,329 81,040 5,463,382
Charged (credited) to
the statement of income2,076,633 1,854,900 498,483 (6,862) 4,423,154
Payment (2,104,019) (278,961) (152,964) (16,636) (2,552,580)
Others (*) (59,439) (76,465) - (652) (136,556)
Balance as of
December 311,945,992 4,272,670 921,848 56,890 7,197,400
(*) Others include effects of changes in foreign currency exchange rates.
(A) The Company accrues warranty reserves for estimated costs of future service, repairs and recalls, based on historical experience and terms of
warranty programs.
(B) The Company makes provisions for the estimated royalty expenses under negotiation with counterparties. The timing of payment depends on the
settlement of the negotiation.
(C) The Company has a long-term incentive plan for its executives based on a three-year management performance criteria and has made a provision
for the estimated incentive cost for the accrued period.
19. Commitments and Contingencies
(A) Guarantees
(In millions of Korean won)
2013 2012
Guarantees of debt for housing rental (*) 151,985 151,817
(*) Represent the maximum amount of debt guarantee, which was provided for employees who took debt from financial institutions in order to finance employee
housing rental.
In addition to the guarantees described above, the Company provides guarantees for borrowings by Intellectual Keystone Technology (IKT), the Company’s
associate, to Citibank in the amount of 31,659 million (USD 30 million).
As of December 31, 2013, the Company’s investments in Pusan Newport are pledged as collateral against the investee’s debt (Note 9).
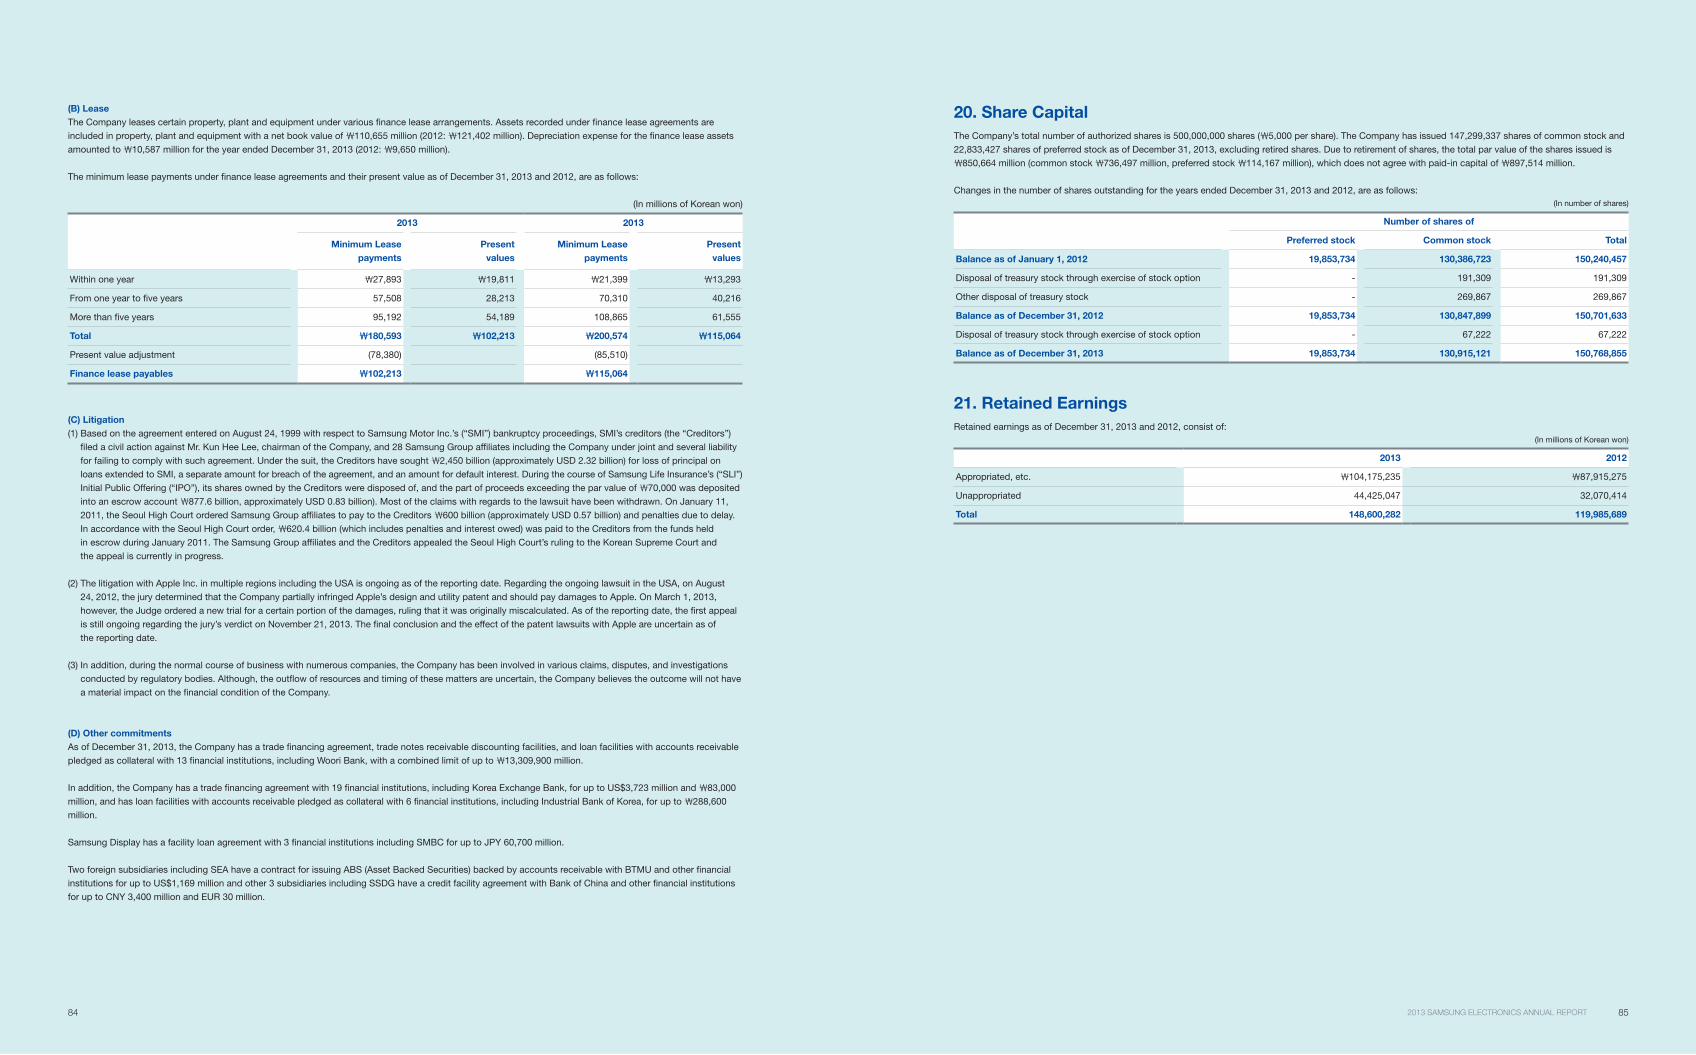
84 852013 SAMSUNG ELECTRONICS ANNUAL REPORT
20. Share Capital
The Company’s total number of authorized shares is 500,000,000 shares ( 5,000 per share). The Company has issued 147,299,337 shares of common stock and
22,833,427 shares of preferred stock as of December 31, 2013, excluding retired shares. Due to retirement of shares, the total par value of the shares issued is
850,664 million (common stock 736,497 million, preferred stock 114,167 million), which does not agree with paid-in capital of 897,514 million.
Changes in the number of shares outstanding for the years ended December 31, 2013 and 2012, are as follows:
(In number of shares)
Number of shares of
Preferred stock Common stock Total
Balance as of January 1, 2012 19,853,734 130,386,723 150,240,457
Disposal of treasury stock through exercise of stock option - 191,309 191,309
Other disposal of treasury stock - 269,867 269,867
Balance as of December 31, 2012 19,853,734 130,847,899 150,701,633
Disposal of treasury stock through exercise of stock option - 67,222 67,222
Balance as of December 31, 2013 19,853,734 130,915,121 150,768,855
21. Retained Earnings
Retained earnings as of December 31, 2013 and 2012, consist of:
(In millions of Korean won)
2013 2012
Appropriated, etc. 104,175,235 87,915,275
Unappropriated 44,425,047 32,070,414
Total 148,600,282 119,985,689
(B) Lease
The Company leases certain property, plant and equipment under various finance lease arrangements. Assets recorded under finance lease agreements are
included in property, plant and equipment with a net book value of 110,655 million (2012: 121,402 million). Depreciation expense for the finance lease assets
amounted to 10,587 million for the year ended December 31, 2013 (2012: 9,650 million).
The minimum lease payments under finance lease agreements and their present value as of December 31, 2013 and 2012, are as follows:
(In millions of Korean won)
2013 2013
Minimum Lease
payments
Present
values
Minimum Lease
payments
Present
values
Within one year 27,893 19,811 21,399 13,293
From one year to five years 57,508 28,213 70,310 40,216
More than five years 95,192 54,189 108,865 61,555
Total 180,593 102,213 200,574 115,064
Present value adjustment (78,380) (85,510)
Finance lease payables 102,213 115,064
(C) Litigation
(1) Based on the agreement entered on August 24, 1999 with respect to Samsung Motor Inc.’s (“SMI”) bankruptcy proceedings, SMI’s creditors (the “Creditors”)
filed a civil action against Mr. Kun Hee Lee, chairman of the Company, and 28 Samsung Group affiliates including the Company under joint and several liability
for failing to comply with such agreement. Under the suit, the Creditors have sought 2,450 billion (approximately USD 2.32 billion) for loss of principal on
loans extended to SMI, a separate amount for breach of the agreement, and an amount for default interest. During the course of Samsung Life Insurance’s (“SLI”)
Initial Public Offering (“IPO”), its shares owned by the Creditors were disposed of, and the part of proceeds exceeding the par value of 70,000 was deposited
into an escrow account 877.6 billion, approximately USD 0.83 billion). Most of the claims with regards to the lawsuit have been withdrawn. On January 11,
2011, the Seoul High Court ordered Samsung Group affiliates to pay to the Creditors 600 billion (approximately USD 0.57 billion) and penalties due to delay.
In accordance with the Seoul High Court order, 620.4 billion (which includes penalties and interest owed) was paid to the Creditors from the funds held
in escrow during January 2011. The Samsung Group affiliates and the Creditors appealed the Seoul High Court’s ruling to the Korean Supreme Court and
the appeal is currently in progress.
(2) The litigation with Apple Inc. in multiple regions including the USA is ongoing as of the reporting date. Regarding the ongoing lawsuit in the USA, on August
24, 2012, the jury determined that the Company partially infringed Apple’s design and utility patent and should pay damages to Apple. On March 1, 2013,
however, the Judge ordered a new trial for a certain portion of the damages, ruling that it was originally miscalculated. As of the reporting date, the first appeal
is still ongoing regarding the jury’s verdict on November 21, 2013. The final conclusion and the effect of the patent lawsuits with Apple are uncertain as of
the reporting date.
(3) In addition, during the normal course of business with numerous companies, the Company has been involved in various claims, disputes, and investigations
conducted by regulatory bodies. Although, the outflow of resources and timing of these matters are uncertain, the Company believes the outcome will not have
a material impact on the financial condition of the Company.
(D) Other commitments
As of December 31, 2013, the Company has a trade financing agreement, trade notes receivable discounting facilities, and loan facilities with accounts receivable
pledged as collateral with 13 financial institutions, including Woori Bank, with a combined limit of up to 13,309,900 million.
In addition, the Company has a trade financing agreement with 19 financial institutions, including Korea Exchange Bank, for up to US$3,723 million and 83,000
million, and has loan facilities with accounts receivable pledged as collateral with 6 financial institutions, including Industrial Bank of Korea, for up to 288,600
million.
Samsung Display has a facility loan agreement with 3 financial institutions including SMBC for up to JPY 60,700 million.
Two foreign subsidiaries including SEA have a contract for issuing ABS (Asset Backed Securities) backed by accounts receivable with BTMU and other financial
institutions for up to US$1,169 million and other 3 subsidiaries including SSDG have a credit facility agreement with Bank of China and other financial institutions
for up to CNY 3,400 million and EUR 30 million.
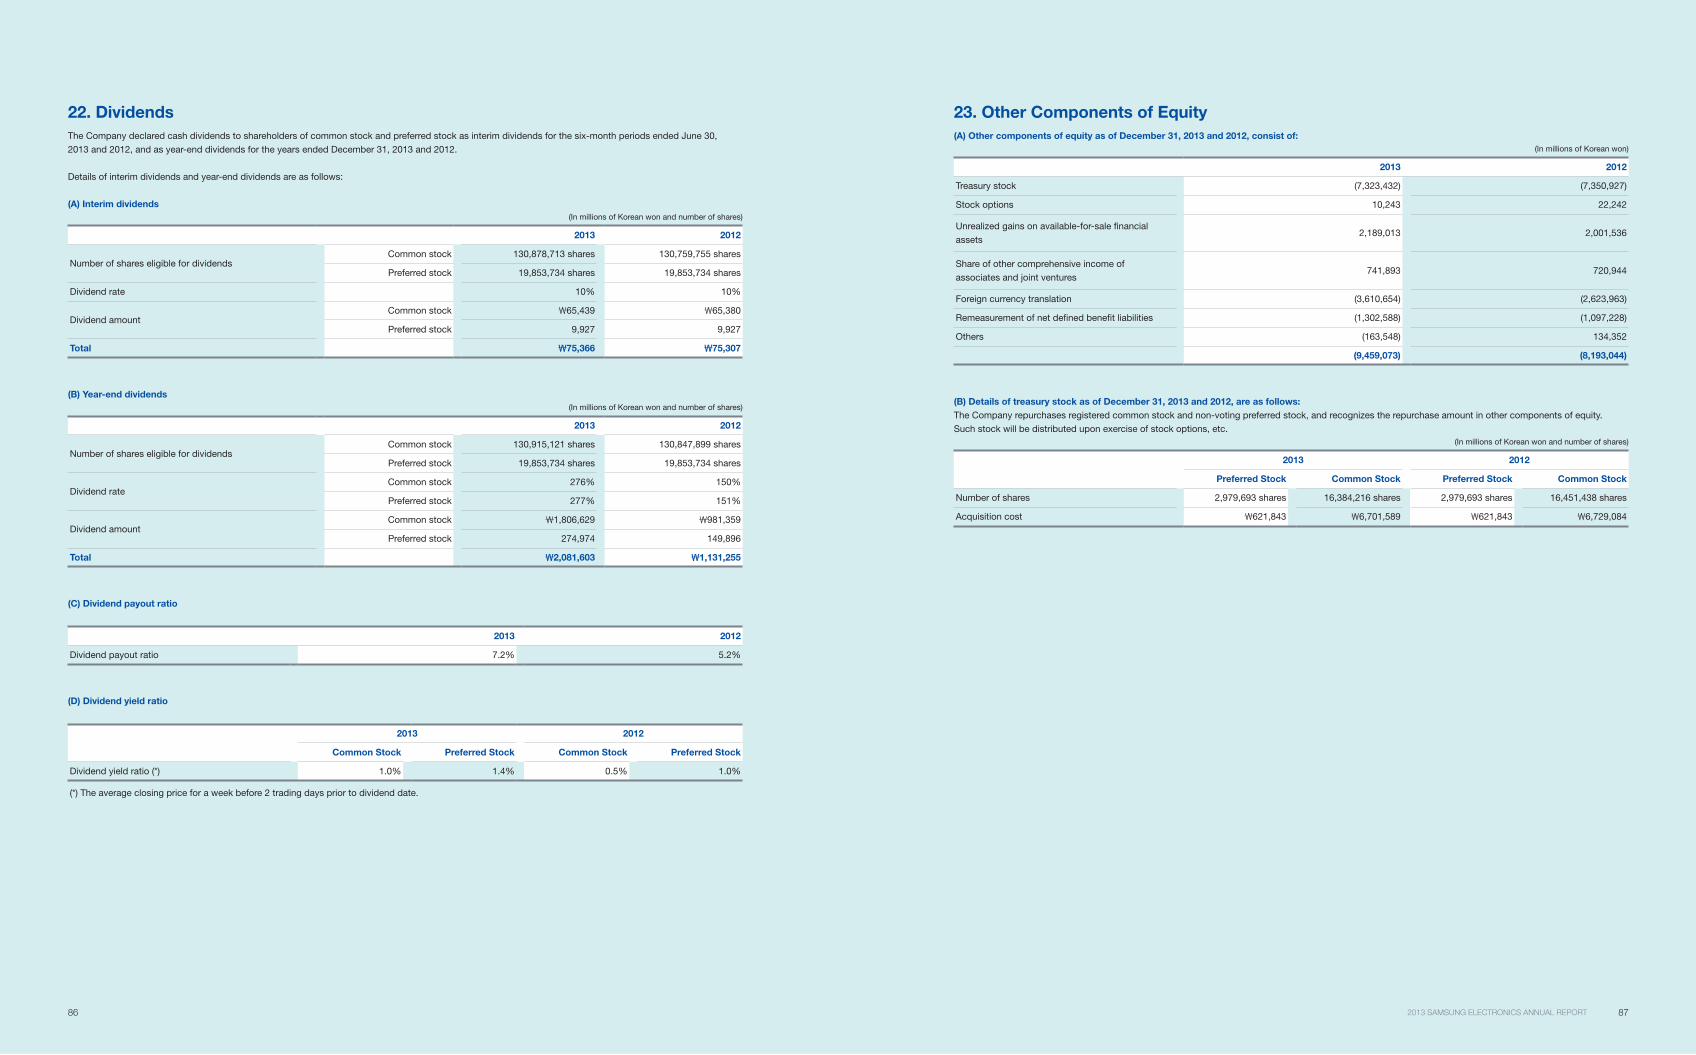
86 872013 SAMSUNG ELECTRONICS ANNUAL REPORT
22. Dividends
The Company declared cash dividends to shareholders of common stock and preferred stock as interim dividends for the six-month periods ended June 30,
2013 and 2012, and as year-end dividends for the years ended December 31, 2013 and 2012.
Details of interim dividends and year-end dividends are as follows:
(A) Interim dividends
(In millions of Korean won and number of shares)
2013 2012
Number of shares eligible for dividendsCommon stock 130,878,713 shares 130,759,755 shares
Preferred stock 19,853,734 shares 19,853,734 shares
Dividend rate 10% 10%
Dividend amountCommon stock 65,439 65,380
Preferred stock 9,927 9,927
Total 75,366 75,307
(B) Year-end dividends
(In millions of Korean won and number of shares)
2013 2012
Number of shares eligible for dividendsCommon stock 130,915,121 shares 130,847,899 shares
Preferred stock 19,853,734 shares 19,853,734 shares
Dividend rateCommon stock 276% 150%
Preferred stock 277% 151%
Dividend amountCommon stock 1,806,629 981,359
Preferred stock 274,974 149,896
Total 2,081,603 1,131,255
(C) Dividend payout ratio
2013 2012
Dividend payout ratio 7.2% 5.2%
(D) Dividend yield ratio
2013 2012
Common Stock Preferred Stock Common Stock Preferred Stock
Dividend yield ratio (*) 1.0% 1.4% 0.5% 1.0%
(*) The average closing price for a week before 2 trading days prior to dividend date.
23. Other Components of Equity
(A) Other components of equity as of December 31, 2013 and 2012, consist of:
(In millions of Korean won)
2013 2012
Treasury stock (7,323,432) (7,350,927)
Stock options 10,243 22,242
Unrealized gains on available-for-sale financial
assets2,189,013 2,001,536
Share of other comprehensive income of
associates and joint ventures741,893 720,944
Foreign currency translation (3,610,654) (2,623,963)
Remeasurement of net defined benefit liabilities (1,302,588) (1,097,228)
Others (163,548) 134,352
(9,459,073) (8,193,044)
(B) Details of treasury stock as of December 31, 2013 and 2012, are as follows:
The Company repurchases registered common stock and non-voting preferred stock, and recognizes the repurchase amount in other components of equity.
Such stock will be distributed upon exercise of stock options, etc.
(In millions of Korean won and number of shares)
2013 2012
Preferred Stock Common Stock Preferred Stock Common Stock
Number of shares 2,979,693 shares 16,384,216 shares 2,979,693 shares 16,451,438 shares
Acquisition cost 621,843 6,701,589 621,843 6,729,084
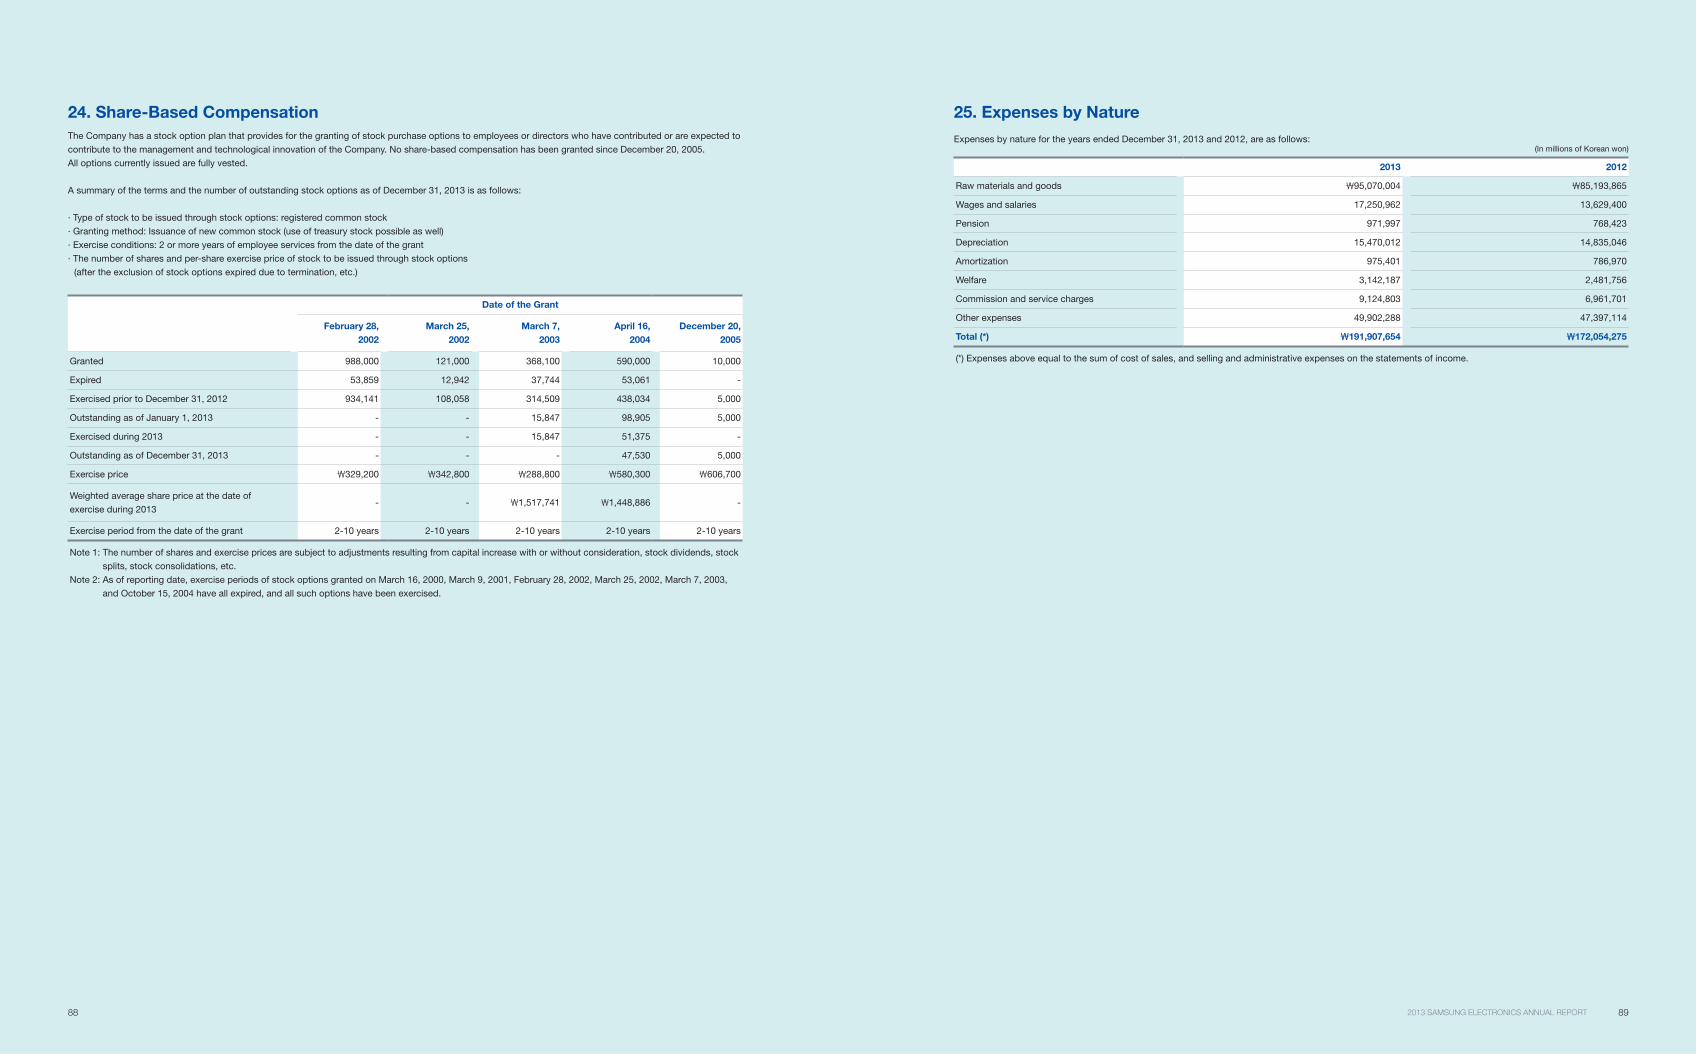
88 892013 SAMSUNG ELECTRONICS ANNUAL REPORT
24. Share-Based Compensation
The Company has a stock option plan that provides for the granting of stock purchase options to employees or directors who have contributed or are expected to
contribute to the management and technological innovation of the Company. No share-based compensation has been granted since December 20, 2005.
All options currently issued are fully vested.
A summary of the terms and the number of outstanding stock options as of December 31, 2013 is as follows:
· Type of stock to be issued through stock options: registered common stock
· Granting method: Issuance of new common stock (use of treasury stock possible as well)
· Exercise conditions: 2 or more years of employee services from the date of the grant
· The number of shares and per-share exercise price of stock to be issued through stock options
(after the exclusion of stock options expired due to termination, etc.)
Date of the Grant
February 28,
2002
March 25,
2002
March 7,
2003
April 16,
2004
December 20,
2005
Granted 988,000 121,000 368,100 590,000 10,000
Expired 53,859 12,942 37,744 53,061 -
Exercised prior to December 31, 2012 934,141 108,058 314,509 438,034 5,000
Outstanding as of January 1, 2013 - - 15,847 98,905 5,000
Exercised during 2013 - - 15,847 51,375 -
Outstanding as of December 31, 2013 - - - 47,530 5,000
Exercise price 329,200 342,800 288,800 580,300 606,700
Weighted average share price at the date of
exercise during 2013- - 1,517,741 1,448,886 -
Exercise period from the date of the grant 2-10 years 2-10 years 2-10 years 2-10 years 2-10 years
Note 1: The number of shares and exercise prices are subject to adjustments resulting from capital increase with or without consideration, stock dividends, stock
splits, stock consolidations, etc.
Note 2: As of reporting date, exercise periods of stock options granted on March 16, 2000, March 9, 2001, February 28, 2002, March 25, 2002, March 7, 2003,
and October 15, 2004 have all expired, and all such options have been exercised.
25. Expenses by Nature
Expenses by nature for the years ended December 31, 2013 and 2012, are as follows: (In millions of Korean won)
2013 2012
Raw materials and goods 95,070,004 85,193,865
Wages and salaries 17,250,962 13,629,400
Pension 971,997 768,423
Depreciation 15,470,012 14,835,046
Amortization 975,401 786,970
Welfare 3,142,187 2,481,756
Commission and service charges 9,124,803 6,961,701
Other expenses 49,902,288 47,397,114
Total (*) 191,907,654 172,054,275
(*) Expenses above equal to the sum of cost of sales, and selling and administrative expenses on the statements of income.
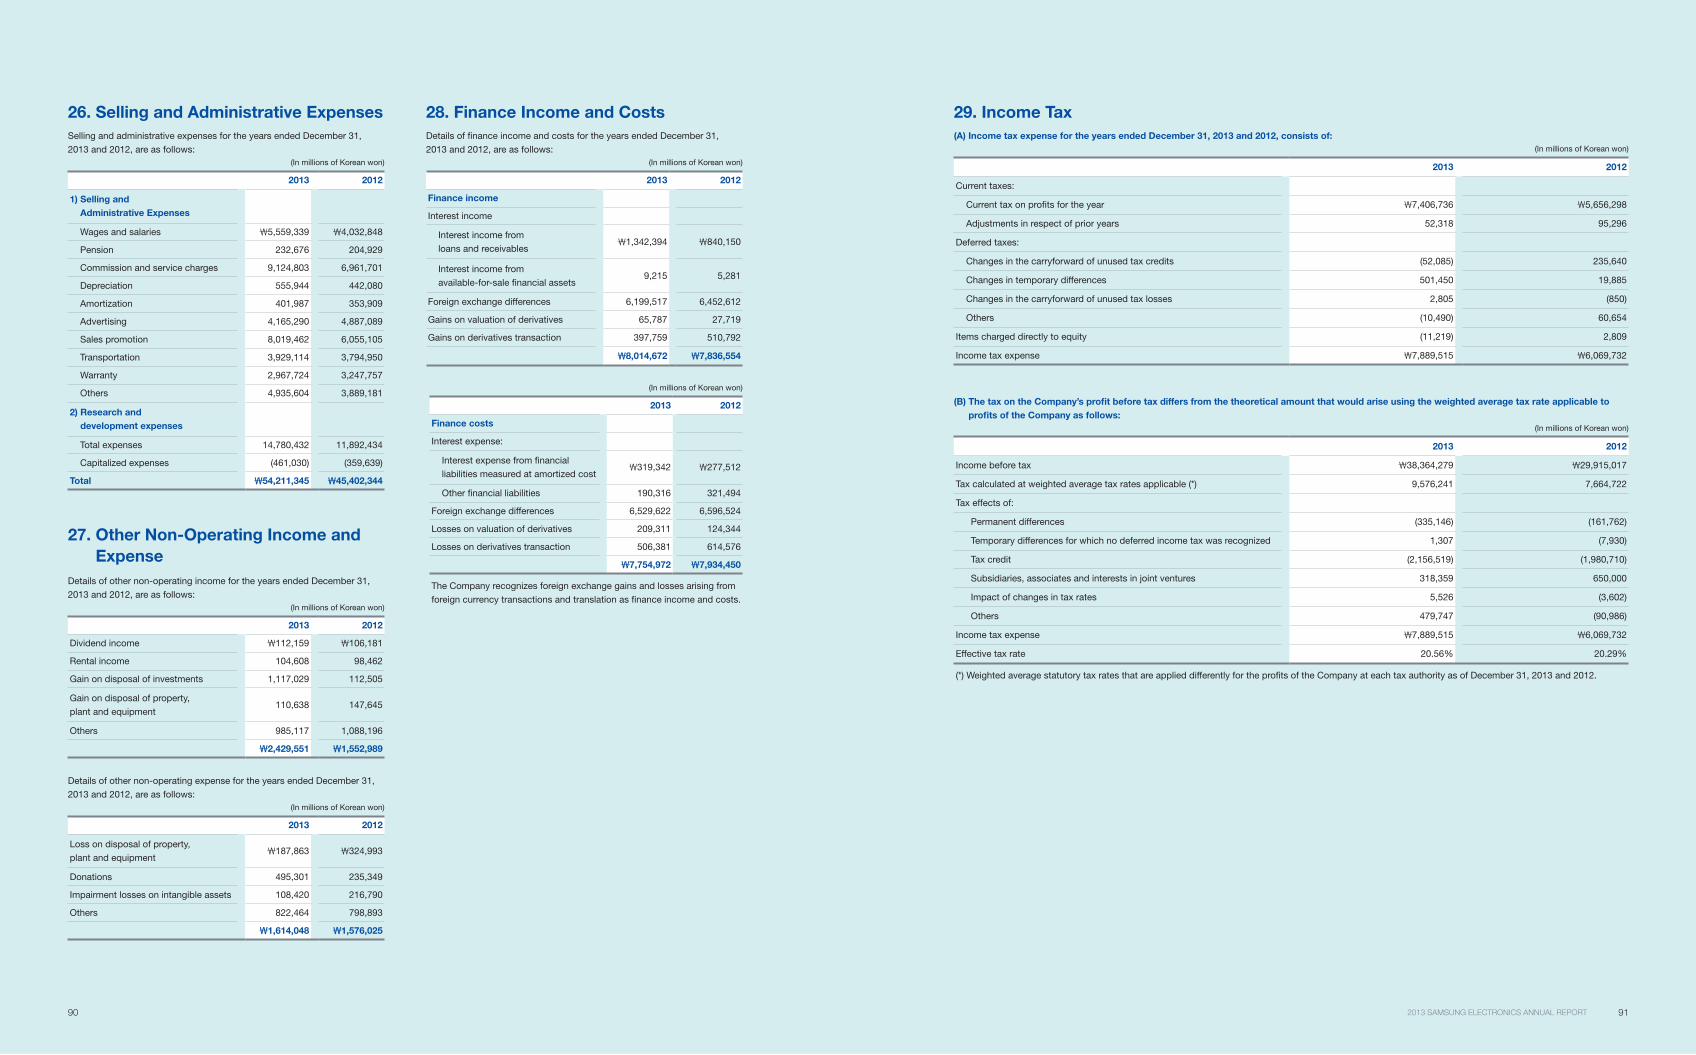
90 912013 SAMSUNG ELECTRONICS ANNUAL REPORT
29. Income Tax
(A) Income tax expense for the years ended December 31, 2013 and 2012, consists of:
(In millions of Korean won)
2013 2012
Current taxes:
Current tax on profits for the year 7,406,736 5,656,298
Adjustments in respect of prior years 52,318 95,296
Deferred taxes:
Changes in the carryforward of unused tax credits (52,085) 235,640
Changes in temporary differences 501,450 19,885
Changes in the carryforward of unused tax losses 2,805 (850)
Others (10,490) 60,654
Items charged directly to equity (11,219) 2,809
Income tax expense 7,889,515 6,069,732
(B) The tax on the Company’s profit before tax differs from the theoretical amount that would arise using the weighted average tax rate applicable to
profits of the Company as follows:
(In millions of Korean won)
2013 2012
Income before tax 38,364,279 29,915,017
Tax calculated at weighted average tax rates applicable (*) 9,576,241 7,664,722
Tax effects of:
Permanent differences (335,146) (161,762)
Temporary differences for which no deferred income tax was recognized 1,307 (7,930)
Tax credit (2,156,519) (1,980,710)
Subsidiaries, associates and interests in joint ventures 318,359 650,000
Impact of changes in tax rates 5,526 (3,602)
Others 479,747 (90,986)
Income tax expense 7,889,515 6,069,732
Effective tax rate 20.56% 20.29%
(*) Weighted average statutory tax rates that are applied differently for the profits of the Company at each tax authority as of December 31, 2013 and 2012.
26. Selling and Administrative Expenses
Selling and administrative expenses for the years ended December 31,
2013 and 2012, are as follows:
(In millions of Korean won)
2013 2012
1) Selling and
Administrative Expenses
Wages and salaries 5,559,339 4,032,848
Pension 232,676 204,929
Commission and service charges 9,124,803 6,961,701
Depreciation 555,944 442,080
Amortization 401,987 353,909
Advertising 4,165,290 4,887,089
Sales promotion 8,019,462 6,055,105
Transportation 3,929,114 3,794,950
Warranty 2,967,724 3,247,757
Others 4,935,604 3,889,181
2) Research and
development expenses
Total expenses 14,780,432 11,892,434
Capitalized expenses (461,030) (359,639)
Total 54,211,345 45,402,344
Details of other non-operating income for the years ended December 31,
2013 and 2012, are as follows:
(In millions of Korean won)
2013 2012
Dividend income 112,159 106,181
Rental income 104,608 98,462
Gain on disposal of investments 1,117,029 112,505
Gain on disposal of property,
plant and equipment110,638 147,645
Others 985,117 1,088,196
2,429,551 1,552,989
Details of other non-operating expense for the years ended December 31,
2013 and 2012, are as follows:
(In millions of Korean won)
2013 2012
Loss on disposal of property,
plant and equipment187,863 324,993
Donations 495,301 235,349
Impairment losses on intangible assets 108,420 216,790
Others 822,464 798,893
1,614,048 1,576,025
28. Finance Income and Costs
Details of finance income and costs for the years ended December 31,
2013 and 2012, are as follows:
(In millions of Korean won)
2013 2012
Finance income
Interest income
Interest income from
loans and receivables1,342,394 840,150
Interest income from
available-for-sale financial assets9,215 5,281
Foreign exchange differences 6,199,517 6,452,612
Gains on valuation of derivatives 65,787 27,719
Gains on derivatives transaction 397,759 510,792
8,014,672 7,836,554
(In millions of Korean won)
2013 2012
Finance costs
Interest expense:
Interest expense from financial
liabilities measured at amortized cost319,342 277,512
Other financial liabilities 190,316 321,494
Foreign exchange differences 6,529,622 6,596,524
Losses on valuation of derivatives 209,311 124,344
Losses on derivatives transaction 506,381 614,576
7,754,972 7,934,450
The Company recognizes foreign exchange gains and losses arising from
foreign currency transactions and translation as finance income and costs.
27. Other Non-Operating Income and
Expense

92 932013 SAMSUNG ELECTRONICS ANNUAL REPORT
(2) As of December 31, 2012
(In millions of Korean won)
Temporary Differences Deferred Income Tax Assets (Liabilities)
Balance as of
January 1
Increase
(Decrease)
Balance as of
December 31
Balance as of
January 1
Increase
(Decrease)
Balance as of
December 31
Deferred tax arising from temporary
differences
Special reserves appropriated for tax purposes (18,146) (14,951) (33,097) (4,391) (3,619) (8,010)
Revaluation of land (4,017,316) 539,625 (3,477,691) (972,191) 130,590 (841,601)
Investments in subsidiaries, associates and
joint ventures (*)(13,450,537) (11,813,329) (25,263,866) (3,032,268) (650,000) (3,682,268)
Depreciation (13,547) 1,250,940 1,237,393 (62,124) 255,468 193,344
Accrued income (92,953) (31,224) (124,177) (21,337) (6,826) (28,163)
Provisions, accrued expenses and others 7,144,431 3,217,777 10,362,208 1,806,514 750,331 2,556,845
Foreign currency translation 150,908 (164,168) (13,260) 35,482 (41,449) (5,967)
Asset impairment losses 52,901 37,755 90,656 10,937 5,587 16,524
Others 779,626 (1,673,860) (894,234) 288,217 (459,967) (171,750)
Subtotal (9,464,633) (8,651,435) (18,116,068) (1,951,161) (19,885) (1,971,046)
Deferred tax arising from carryforwards
Undisposed accumulated deficit 100,401 30,591 130,992 26,961 850 27,811
Tax credit carryforwards 1,512,052 (195,543) 1,316,509 1,495,747 (235,640) 1,260,107
Deferred tax recognized in other
comprehensive income
Valuation of available-for-sale financial
instruments(1,316,863) (1,264,765) (2,581,628) (318,052) (262,040) (580,092)
Actuarial valuation 813,514 657,804 1,471,318 196,149 153,684 349,833
Subtotal (503,349) (606,961) (1,110,310) (121,903) (108,356) (230,259)
Deferred tax assets 2,516,080
Deferred tax liabilities (3,429,467)
Total (913,387)
(*) Deferred tax assets were not recognized if it is probable that the temporary differences will not reverse in the foreseeable future for investments in subsidiaries,
associates and joint ventures.
The Company periodically assesses its ability to recover deferred income tax assets. In the event of a significant uncertainty regarding the Company’s ultimate
ability to recover such assets, deferred income tax assets are recognized only to the extent that it is probable that future taxable profit will be available against
which the temporary differences can be utilized.
Temporary differences whose deferred tax effects were not recognized due to the uncertainty regarding ultimate realizability of such assets as of December 31,
2013 and 2012 are as follows:
(In millions of Korean won)
2013 2012
Unused tax losses 12,196 -
Unused tax credits 30,098 48,262
Expiry dates of unused tax losses and unused tax credits for which no deferred tax asset is recognized in the balance sheet are as follows:
(In millions of Korean won)
2014 2015 2016 2017 and after
Undisposed accumulated deficit - - - 12,196
Tax credit carryforwards 4,170 3,437 18,525 3,966
(C) Deferred income tax assets and liabilities resulting from the tax effect of temporary differences as of December 31, 2013 and 2012, are as follows:
(1) As of December 31, 2013
(In millions of Korean won)
Temporary Differences Deferred Income Tax Assets (Liabilities)
Balance as of
January 1
Increase
(Decrease)
Balance as of
December 31
Balance as of
January 1
Increase
(Decrease)
Balance as of
December 31
Deferred tax arising from temporary
differences
Special reserves appropriated for tax purposes (33,097) 5,312 (27,785) (8,010) 1,286 (6,724)
Revaluation of land (3,477,691) 1,587 (3,476,104) (841,601) 384 (841,217)
Investments in subsidiaries, associates and
joint ventures (*)(25,263,866) (2,555,796) (27,819,662) (3,682,268) (318,359) (4,000,627)
Depreciation 1,237,393 (402,647) 834,746 193,344 (57,968) 135,376
Accrued income (124,177) (179,613) (303,790) (28,163) (44,682) (72,845)
Provisions, accrued expenses and others 10,362,208 1,983,485 12,345,693 2,556,845 596,301 3,153,146
Foreign currency translation (13,260) (168,042) (181,302) (5,967) (38,058) (44,025)
Asset impairment losses 90,656 251,433 342,089 16,524 65,375 81,899
Assets held for sale - 7,527,869 7,527,869 - 1,821,744 1,821,744
Others (894,234) (10,818,680) (11,712,914) (171,750) (2,527,473) (2,699,223)
Subtotal (18,116,068) (4,355,092) (22,471,160) (1,971,046) (501,450) (2,472,496)
Deferred tax arising from carryforwards
Unused tax losses 130,992 (23,764) 107,228 27,811 (2,805) 25,006
Unused tax credits 1,316,509 25,141 1,341,650 1,260,107 52,085 1,312,192
Deferred tax recognized in other
comprehensive income
Valuation of available-for-sale financial
instruments(2,581,628) (306,252) (2,887,880) (580,092) (84,080) (664,172)
Actuarial valuation 1,471,318 247,136 1,718,454 349,833 59,046 408,879
Subtotal (1,110,310) (59,116) (1,169,426) (230,259) (25,034) (255,293)
Deferred tax assets 4,621,780
Deferred tax liabilities (6,012,371)
Total (1,390,591)
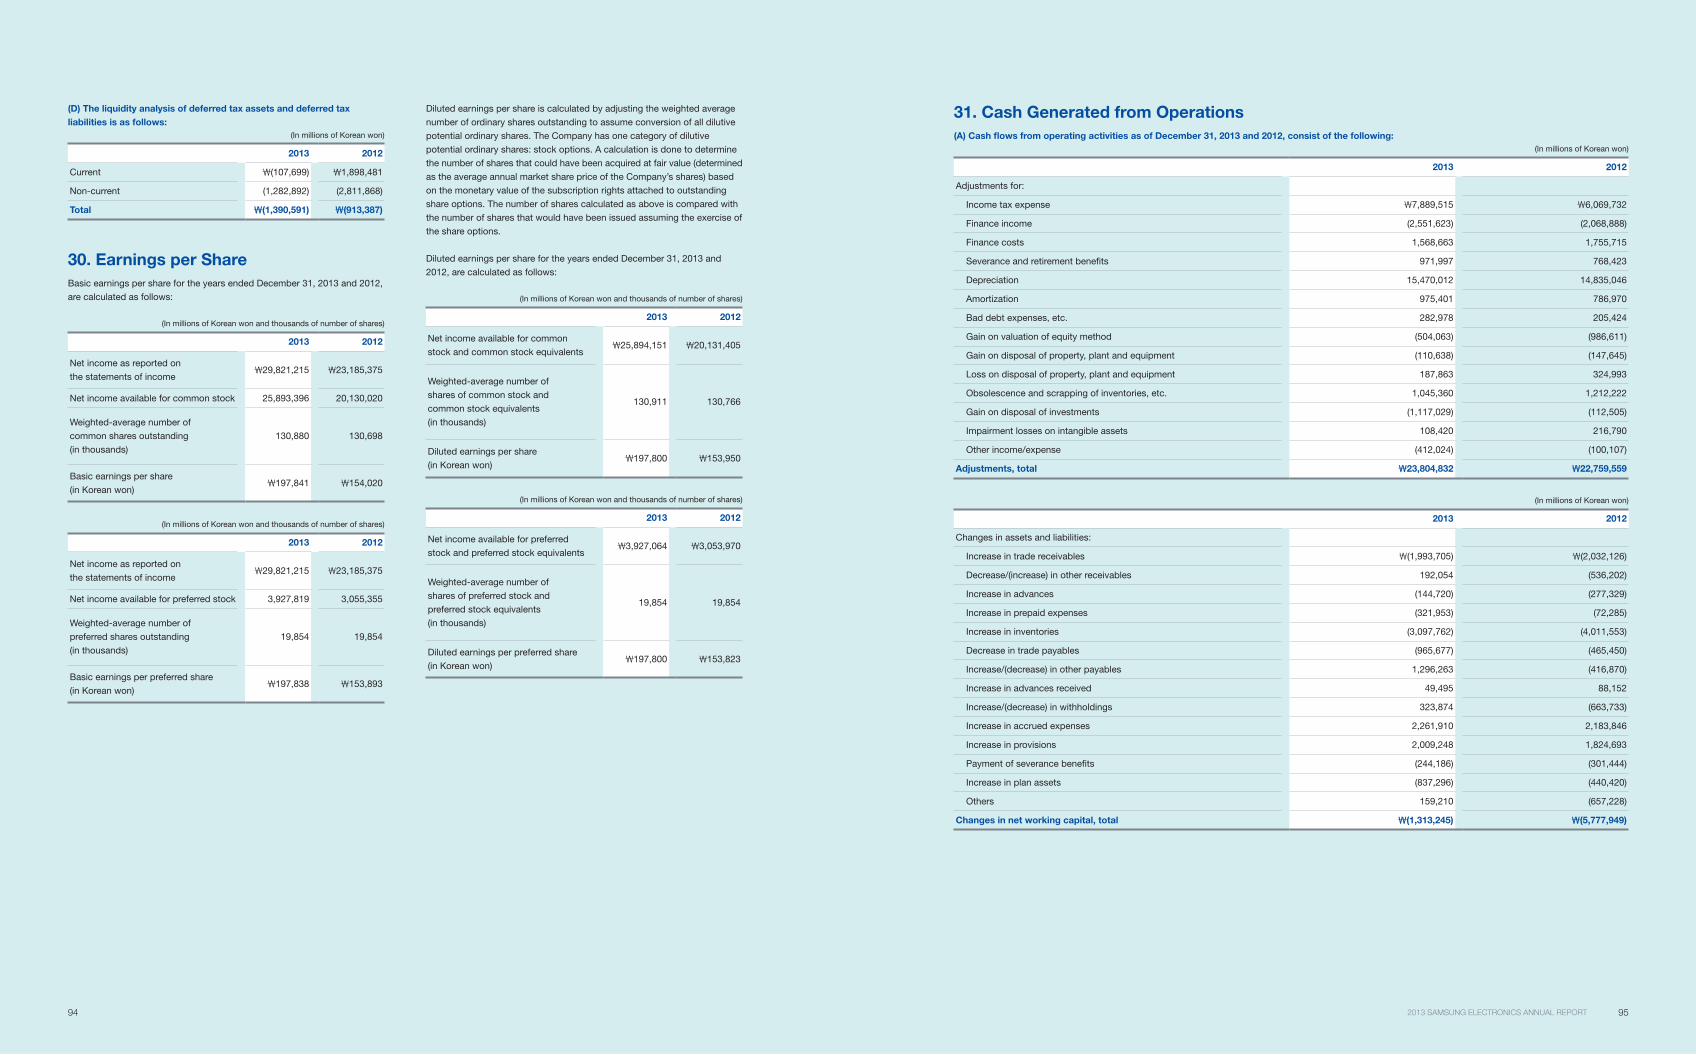
94 952013 SAMSUNG ELECTRONICS ANNUAL REPORT
31. Cash Generated from Operations
(A) Cash flows from operating activities as of December 31, 2013 and 2012, consist of the following:
(In millions of Korean won)
2013 2012
Adjustments for:
Income tax expense 7,889,515 6,069,732
Finance income (2,551,623) (2,068,888)
Finance costs 1,568,663 1,755,715
Severance and retirement benefits 971,997 768,423
Depreciation 15,470,012 14,835,046
Amortization 975,401 786,970
Bad debt expenses, etc. 282,978 205,424
Gain on valuation of equity method (504,063) (986,611)
Gain on disposal of property, plant and equipment (110,638) (147,645)
Loss on disposal of property, plant and equipment 187,863 324,993
Obsolescence and scrapping of inventories, etc. 1,045,360 1,212,222
Gain on disposal of investments (1,117,029) (112,505)
Impairment losses on intangible assets 108,420 216,790
Other income/expense (412,024) (100,107)
Adjustments, total 23,804,832 22,759,559
(In millions of Korean won)
2013 2012
Changes in assets and liabilities:
Increase in trade receivables (1,993,705) (2,032,126)
Decrease/(increase) in other receivables 192,054 (536,202)
Increase in advances (144,720) (277,329)
Increase in prepaid expenses (321,953) (72,285)
Increase in inventories (3,097,762) (4,011,553)
Decrease in trade payables (965,677) (465,450)
Increase/(decrease) in other payables 1,296,263 (416,870)
Increase in advances received 49,495 88,152
Increase/(decrease) in withholdings 323,874 (663,733)
Increase in accrued expenses 2,261,910 2,183,846
Increase in provisions 2,009,248 1,824,693
Payment of severance benefits (244,186) (301,444)
Increase in plan assets (837,296) (440,420)
Others 159,210 (657,228)
Changes in net working capital, total (1,313,245) (5,777,949)
(D) The liquidity analysis of deferred tax assets and deferred tax
liabilities is as follows:
(In millions of Korean won)
2013 2012
Current (107,699) 1,898,481
Non-current (1,282,892) (2,811,868)
Total (1,390,591) (913,387)
30. Earnings per Share
Basic earnings per share for the years ended December 31, 2013 and 2012,
are calculated as follows:
(In millions of Korean won and thousands of number of shares)
2013 2012
Net income as reported on
the statements of income29,821,215 23,185,375
Net income available for common stock 25,893,396 20,130,020
Weighted-average number of
common shares outstanding
(in thousands)
130,880 130,698
Basic earnings per share
(in Korean won)197,841 154,020
(In millions of Korean won and thousands of number of shares)
2013 2012
Net income as reported on
the statements of income29,821,215 23,185,375
Net income available for preferred stock 3,927,819 3,055,355
Weighted-average number of
preferred shares outstanding
(in thousands)
19,854 19,854
Basic earnings per preferred share
(in Korean won)197,838 153,893
Diluted earnings per share is calculated by adjusting the weighted average
number of ordinary shares outstanding to assume conversion of all dilutive
potential ordinary shares. The Company has one category of dilutive
potential ordinary shares: stock options. A calculation is done to determine
the number of shares that could have been acquired at fair value (determined
as the average annual market share price of the Company’s shares) based
on the monetary value of the subscription rights attached to outstanding
share options. The number of shares calculated as above is compared with
the number of shares that would have been issued assuming the exercise of
the share options.
Diluted earnings per share for the years ended December 31, 2013 and
2012, are calculated as follows:
(In millions of Korean won and thousands of number of shares)
2013 2012
Net income available for common
stock and common stock equivalents25,894,151 20,131,405
Weighted-average number of
shares of common stock and
common stock equivalents
(in thousands)
130,911 130,766
Diluted earnings per share
(in Korean won)197,800 153,950
(In millions of Korean won and thousands of number of shares)
2013 2012
Net income available for preferred
stock and preferred stock equivalents3,927,064 3,053,970
Weighted-average number of
shares of preferred stock and
preferred stock equivalents
(in thousands)
19,854 19,854
Diluted earnings per preferred share
(in Korean won)197,800 153,823
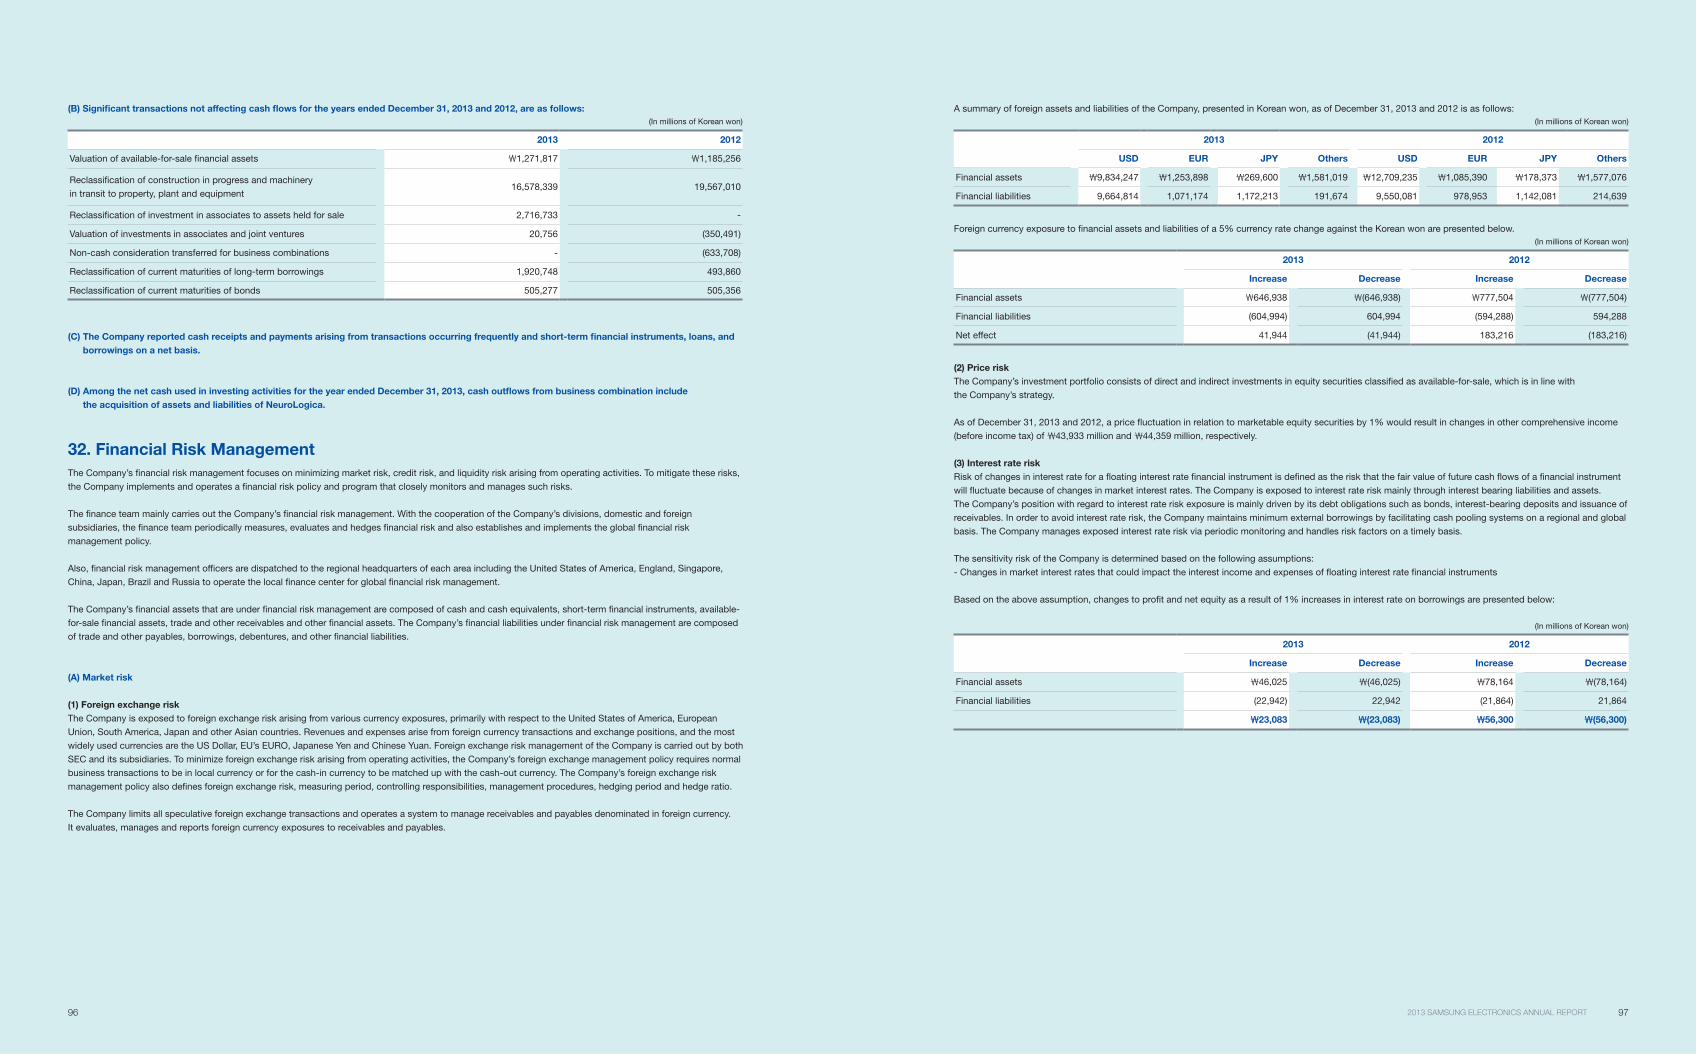
96 972013 SAMSUNG ELECTRONICS ANNUAL REPORT
A summary of foreign assets and liabilities of the Company, presented in Korean won, as of December 31, 2013 and 2012 is as follows:
(In millions of Korean won)
2013 2012
USD EUR JPY Others USD EUR JPY Others
Financial assets 9,834,247 1,253,898 269,600 1,581,019 12,709,235 1,085,390 178,373 1,577,076
Financial liabilities 9,664,814 1,071,174 1,172,213 191,674 9,550,081 978,953 1,142,081 214,639
Foreign currency exposure to financial assets and liabilities of a 5% currency rate change against the Korean won are presented below.
(In millions of Korean won)
2013 2012
Increase Decrease Increase Decrease
Financial assets 646,938 (646,938) 777,504 (777,504)
Financial liabilities (604,994) 604,994 (594,288) 594,288
Net effect 41,944 (41,944) 183,216 (183,216)
(2) Price risk
The Company’s investment portfolio consists of direct and indirect investments in equity securities classified as available-for-sale, which is in line with
the Company’s strategy.
As of December 31, 2013 and 2012, a price fluctuation in relation to marketable equity securities by 1% would result in changes in other comprehensive income
(before income tax) of 43,933 million and 44,359 million, respectively.
(3) Interest rate risk
Risk of changes in interest rate for a floating interest rate financial instrument is defined as the risk that the fair value of future cash flows of a financial instrument
will fluctuate because of changes in market interest rates. The Company is exposed to interest rate risk mainly through interest bearing liabilities and assets.
The Company’s position with regard to interest rate risk exposure is mainly driven by its debt obligations such as bonds, interest-bearing deposits and issuance of
receivables. In order to avoid interest rate risk, the Company maintains minimum external borrowings by facilitating cash pooling systems on a regional and global
basis. The Company manages exposed interest rate risk via periodic monitoring and handles risk factors on a timely basis.
The sensitivity risk of the Company is determined based on the following assumptions:
- Changes in market interest rates that could impact the interest income and expenses of floating interest rate financial instruments
Based on the above assumption, changes to profit and net equity as a result of 1% increases in interest rate on borrowings are presented below:
(In millions of Korean won)
2013 2012
Increase Decrease Increase Decrease
Financial assets 46,025 (46,025) 78,164 (78,164)
Financial liabilities (22,942) 22,942 (21,864) 21,864
23,083 (23,083) 56,300 (56,300)
(B) Significant transactions not affecting cash flows for the years ended December 31, 2013 and 2012, are as follows:
(In millions of Korean won)
2013 2012
Valuation of available-for-sale financial assets 1,271,817 1,185,256
Reclassification of construction in progress and machinery
in transit to property, plant and equipment16,578,339 19,567,010
Reclassification of investment in associates to assets held for sale 2,716,733 -
Valuation of investments in associates and joint ventures 20,756 (350,491)
Non-cash consideration transferred for business combinations - (633,708)
Reclassification of current maturities of long-term borrowings 1,920,748 493,860
Reclassification of current maturities of bonds 505,277 505,356
(C) The Company reported cash receipts and payments arising from transactions occurring frequently and short-term financial instruments, loans, and
borrowings on a net basis.
(D) Among the net cash used in investing activities for the year ended December 31, 2013, cash outflows from business combination include
the acquisition of assets and liabilities of NeuroLogica.
32. Financial Risk Management
The Company’s financial risk management focuses on minimizing market risk, credit risk, and liquidity risk arising from operating activities. To mitigate these risks,
the Company implements and operates a financial risk policy and program that closely monitors and manages such risks.
The finance team mainly carries out the Company’s financial risk management. With the cooperation of the Company’s divisions, domestic and foreign
subsidiaries, the finance team periodically measures, evaluates and hedges financial risk and also establishes and implements the global financial risk
management policy.
Also, financial risk management officers are dispatched to the regional headquarters of each area including the United States of America, England, Singapore,
China, Japan, Brazil and Russia to operate the local finance center for global financial risk management.
The Company’s financial assets that are under financial risk management are composed of cash and cash equivalents, short-term financial instruments, available-
for-sale financial assets, trade and other receivables and other financial assets. The Company’s financial liabilities under financial risk management are composed
of trade and other payables, borrowings, debentures, and other financial liabilities.
(A) Market risk
(1) Foreign exchange risk
The Company is exposed to foreign exchange risk arising from various currency exposures, primarily with respect to the United States of America, European
Union, South America, Japan and other Asian countries. Revenues and expenses arise from foreign currency transactions and exchange positions, and the most
widely used currencies are the US Dollar, EU’s EURO, Japanese Yen and Chinese Yuan. Foreign exchange risk management of the Company is carried out by both
SEC and its subsidiaries. To minimize foreign exchange risk arising from operating activities, the Company’s foreign exchange management policy requires normal
business transactions to be in local currency or for the cash-in currency to be matched up with the cash-out currency. The Company’s foreign exchange risk
management policy also defines foreign exchange risk, measuring period, controlling responsibilities, management procedures, hedging period and hedge ratio.
The Company limits all speculative foreign exchange transactions and operates a system to manage receivables and payables denominated in foreign currency.
It evaluates, manages and reports foreign currency exposures to receivables and payables.

98 992013 SAMSUNG ELECTRONICS ANNUAL REPORT
(B) Credit risk
Credit risk arises during the normal course of transactions and investing activities where clients or other parties fail to discharge an obligation. The Company
monitors and sets the client’s and counterparty’s credit limit on a periodic basis based on the client’s and counterparty’s financial conditions, default history and
other important factors.
Credit risk can arise from transactions with financial institutions which include financial instrument transactions such as cash and cash equivalents, savings,
and derivative instruments. To minimize such risk, the Company transacts only with banks which have strong international credit rating (S&P A and above),
and all new transactions with financial institutions with no prior transaction history are approved, managed and monitored by the Company’s finance team and
the local finance center. The Company requires separate approval for contracts with restrictions.
Most of the Company’s accounts receivable is adequately insured to manage any risk, therefore, the Company estimates its credit risk exposure to be limited.
The Company estimates that its maximum exposure to credit risk is the carrying value of its financial assets, net of impairment losses.
(C) Liquidity risk
Due to large investments made by the Company, maintaining adequate levels of liquidity risk is critical. The Company strives to achieve this goal by periodically
forecasting its capital balance, estimating required cash levels, and managing income and expenses.
The Company manages its liquidity risk by periodically forecasting projected cash flows. If abnormal signs are identified, the Company works with the local finance
center and provides liquidity support by utilizing a globally integrated finance structure, such as Cash Pooling. In addition, the Company maintains
a liquidity management process which provides additional financial support by the local finance center and the Company. The Cash Pooling program allows
sharing of surplus funds among entities and contributes to minimizing liquidity risk and strengthening the Company’s competitive position by reducing capital
operation expenses and finance expenses.
In addition, the Company mitigates liquidity risk by contracting with financial institutions with respect to bank overdrafts and foreign trade finance and by providing
payment guarantees to subsidiaries. For large scale facility investments, liquidity risk is minimized by utilizing internal reserves and long term borrowings according
to the capital injection schedule.
The following table is an undiscounted cash flow analysis for financial liabilities that are presented on the statements of financial position according to their
remaining contractual maturity.
(In millions of Korean won)
2013 Less than 3 months 4-6 months 7-12 months 1-5 years More than 5 years
Financial liabilities 33,862,896 1,095,285 4,806,477 2,564,769 65,772
(In millions of Korean won)
2012 Less than 3 months 4-6 months 7-12 months 1-5 years More than 5 years
Financial liabilities 32,257,940 1,690,825 2,371,879 7,006,975 76,236
The Company’s trading portfolio of derivative instruments have been included at their fair value of 244,172 million (2012: 79,212 million) within the less than
three month time bucket because the contractual maturities are not essential for an understanding of the timing of the cash flows. These contracts are managed
on a net-fair value basis rather than by maturity date. Net settled derivatives consist of forward exchange contracts used by the Company to manage
the exchange rate profile.
The maximum liquidity risk exposure from those other than the above financial liabilities (e.g. payment guarantees for affiliated companies and performance bonds)
as of December 31, 2013 is 183,644 million (December 31, 2012: 151,817 million).
(D) Capital risk management
The purpose of capital management is to maintain a sound capital structure. The Company monitors capital on the basis of the ratio of total liabilities to total
equity. This ratio is calculated by dividing total liabilities by total equity in the consolidated financial statements.
The Company’s capital risk management policy has not changed since the fiscal year ended December 31, 2012. The Company has maintained an A+ and A1
credit ratings from S&P and Moody’s, respectively, on its long term debt.
The total liabilities to equity ratios as of December 31, 2013 and 2012, are as follows:
(In millions of Korean won)
2013 2012
Total liabilities 64,059,008 59,591,364
Total equity 150,016,010 121,480,206
Total liabilities to equity ratio 42.7% 49.1%
(E) Fair value measurement
(1) The following table presents the assets and liabilities, by level, that are measured at fair value:
(In millions of Korean won)
2013 Level 1 Level 2 Level 3 Total balance
Derivatives - 40,552 - 40,552
Available-for-sale financial assets (*) 5,656,806 1,188,498 493,378 7,338,682
Total assets 5,656,806 1,229,050 493,378 7,379,234
Derivatives - 244,172 - 244,172
Total liabilities - 244,172 - 244,172
(In millions of Korean won)
2012 Level 1 Level 2 Level 3 Total balance
Derivatives - 47,227 - 47,227
Available-for-sale financial assets (*) 5,694,730 125,994 389,195 6,209,919
Total assets 5,694,730 173,221 389,195 6,257,146
Derivatives - 79,212 - 79,212
Total liabilities - 79,212 - 79,212
(*) Amount measured at cost (2013: 388,225 million, 2012: 278,130 million) is excluded as the range of reasonable fair value estimates is significant and
the probabilities of the various estimates cannot be reasonably assessed.
The levels of the fair value hierarchy and its application to financial assets and liabilities are described below.
· Level 1: Quoted prices (unadjusted) in active markets for identical assets or liabilities
· Level 2: Inputs other than quoted prices included within Level 1 that are observable for the asset or liability, either directly or indirectly
· Level 3: Inputs for the asset or liability that are not based on observable market data (that is, unobservable inputs)
The fair value of financial instruments traded in active markets is based on quoted market prices at the statement of financial position date. A market is regarded
as active if quoted prices are readily and regularly available from an exchange, dealer, broker, industry group, pricing service, or regulatory agency, and those
prices represent actual and regularly occurring market transactions on an arm’s length basis. The quoted market price used for financial assets held by
the Company is the current bid price. These instruments are included in Level 1. Instruments included in Level 1 are listed equity investments classified as trading
securities or available-for-sale financial assets.
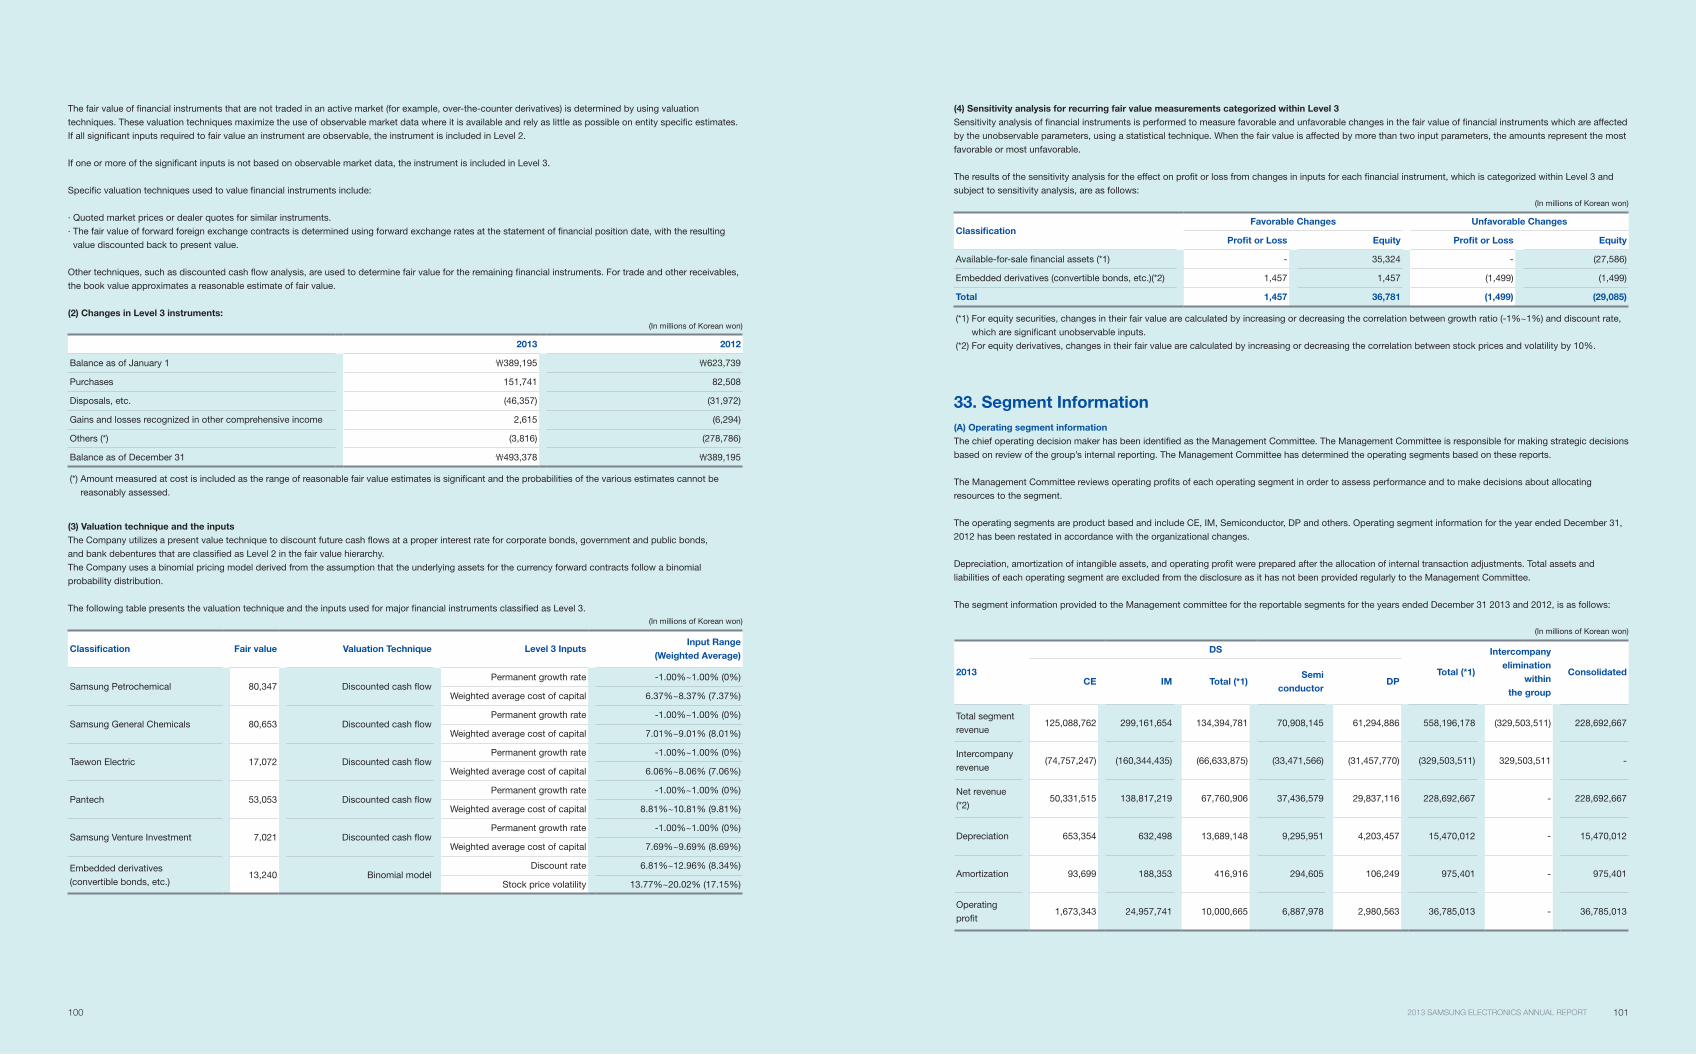
100 1012013 SAMSUNG ELECTRONICS ANNUAL REPORT
The fair value of financial instruments that are not traded in an active market (for example, over-the-counter derivatives) is determined by using valuation
techniques. These valuation techniques maximize the use of observable market data where it is available and rely as little as possible on entity specific estimates.
If all significant inputs required to fair value an instrument are observable, the instrument is included in Level 2.
If one or more of the significant inputs is not based on observable market data, the instrument is included in Level 3.
Specific valuation techniques used to value financial instruments include:
· Quoted market prices or dealer quotes for similar instruments.
· The fair value of forward foreign exchange contracts is determined using forward exchange rates at the statement of financial position date, with the resulting
value discounted back to present value.
Other techniques, such as discounted cash flow analysis, are used to determine fair value for the remaining financial instruments. For trade and other receivables,
the book value approximates a reasonable estimate of fair value.
(2) Changes in Level 3 instruments:
(In millions of Korean won)
2013 2012
Balance as of January 1 389,195 623,739
Purchases 151,741 82,508
Disposals, etc. (46,357) (31,972)
Gains and losses recognized in other comprehensive income 2,615 (6,294)
Others (*) (3,816) (278,786)
Balance as of December 31 493,378 389,195
(*) Amount measured at cost is included as the range of reasonable fair value estimates is significant and the probabilities of the various estimates cannot be
reasonably assessed.
(3) Valuation technique and the inputs
The Company utilizes a present value technique to discount future cash flows at a proper interest rate for corporate bonds, government and public bonds,
and bank debentures that are classified as Level 2 in the fair value hierarchy.
The Company uses a binomial pricing model derived from the assumption that the underlying assets for the currency forward contracts follow a binomial
probability distribution.
The following table presents the valuation technique and the inputs used for major financial instruments classified as Level 3.
(In millions of Korean won)
Classification Fair value Valuation Technique Level 3 InputsInput Range
(Weighted Average)
Samsung Petrochemical 80,347 Discounted cash flowPermanent growth rate -1.00%~1.00% (0%)
Weighted average cost of capital 6.37%~8.37% (7.37%)
Samsung General Chemicals 80,653 Discounted cash flowPermanent growth rate -1.00%~1.00% (0%)
Weighted average cost of capital 7.01%~9.01% (8.01%)
Taewon Electric 17,072 Discounted cash flowPermanent growth rate -1.00%~1.00% (0%)
Weighted average cost of capital 6.06%~8.06% (7.06%)
Pantech 53,053 Discounted cash flowPermanent growth rate -1.00%~1.00% (0%)
Weighted average cost of capital 8.81%~10.81% (9.81%)
Samsung Venture Investment 7,021 Discounted cash flowPermanent growth rate -1.00%~1.00% (0%)
Weighted average cost of capital 7.69%~9.69% (8.69%)
Embedded derivatives
(convertible bonds, etc.)13,240 Binomial model
Discount rate 6.81%~12.96% (8.34%)
Stock price volatility 13.77%~20.02% (17.15%)
(4) Sensitivity analysis for recurring fair value measurements categorized within Level 3
Sensitivity analysis of financial instruments is performed to measure favorable and unfavorable changes in the fair value of financial instruments which are affected
by the unobservable parameters, using a statistical technique. When the fair value is affected by more than two input parameters, the amounts represent the most
favorable or most unfavorable.
The results of the sensitivity analysis for the effect on profit or loss from changes in inputs for each financial instrument, which is categorized within Level 3 and
subject to sensitivity analysis, are as follows:
(In millions of Korean won)
ClassificationFavorable Changes Unfavorable Changes
Profit or Loss Equity Profit or Loss Equity
Available-for-sale financial assets (*1) - 35,324 - (27,586)
Embedded derivatives (convertible bonds, etc.)(*2) 1,457 1,457 (1,499) (1,499)
Total 1,457 36,781 (1,499) (29,085)
(*1) For equity securities, changes in their fair value are calculated by increasing or decreasing the correlation between growth ratio (-1%~1%) and discount rate,
which are significant unobservable inputs.
(*2) For equity derivatives, changes in their fair value are calculated by increasing or decreasing the correlation between stock prices and volatility by 10%.
33. Segment Information
(A) Operating segment information
The chief operating decision maker has been identified as the Management Committee. The Management Committee is responsible for making strategic decisions
based on review of the group’s internal reporting. The Management Committee has determined the operating segments based on these reports.
The Management Committee reviews operating profits of each operating segment in order to assess performance and to make decisions about allocating
resources to the segment.
The operating segments are product based and include CE, IM, Semiconductor, DP and others. Operating segment information for the year ended December 31,
2012 has been restated in accordance with the organizational changes.
Depreciation, amortization of intangible assets, and operating profit were prepared after the allocation of internal transaction adjustments. Total assets and
liabilities of each operating segment are excluded from the disclosure as it has not been provided regularly to the Management Committee.
The segment information provided to the Management committee for the reportable segments for the years ended December 31 2013 and 2012, is as follows:
(In millions of Korean won)
2013
DS
Total (*1)
Intercompany
elimination
within
the group
ConsolidatedCE IM Total (*1)
Semi
conductorDP
Total segment
revenue125,088,762 299,161,654 134,394,781 70,908,145 61,294,886 558,196,178 (329,503,511) 228,692,667
Intercompany
revenue(74,757,247) (160,344,435) (66,633,875) (33,471,566) (31,457,770) (329,503,511) 329,503,511 -
Net revenue
(*2)50,331,515 138,817,219 67,760,906 37,436,579 29,837,116 228,692,667 - 228,692,667
Depreciation 653,354 632,498 13,689,148 9,295,951 4,203,457 15,470,012 - 15,470,012
Amortization 93,699 188,353 416,916 294,605 106,249 975,401 - 975,401
Operating
profit1,673,343 24,957,741 10,000,665 6,887,978 2,980,563 36,785,013 - 36,785,013
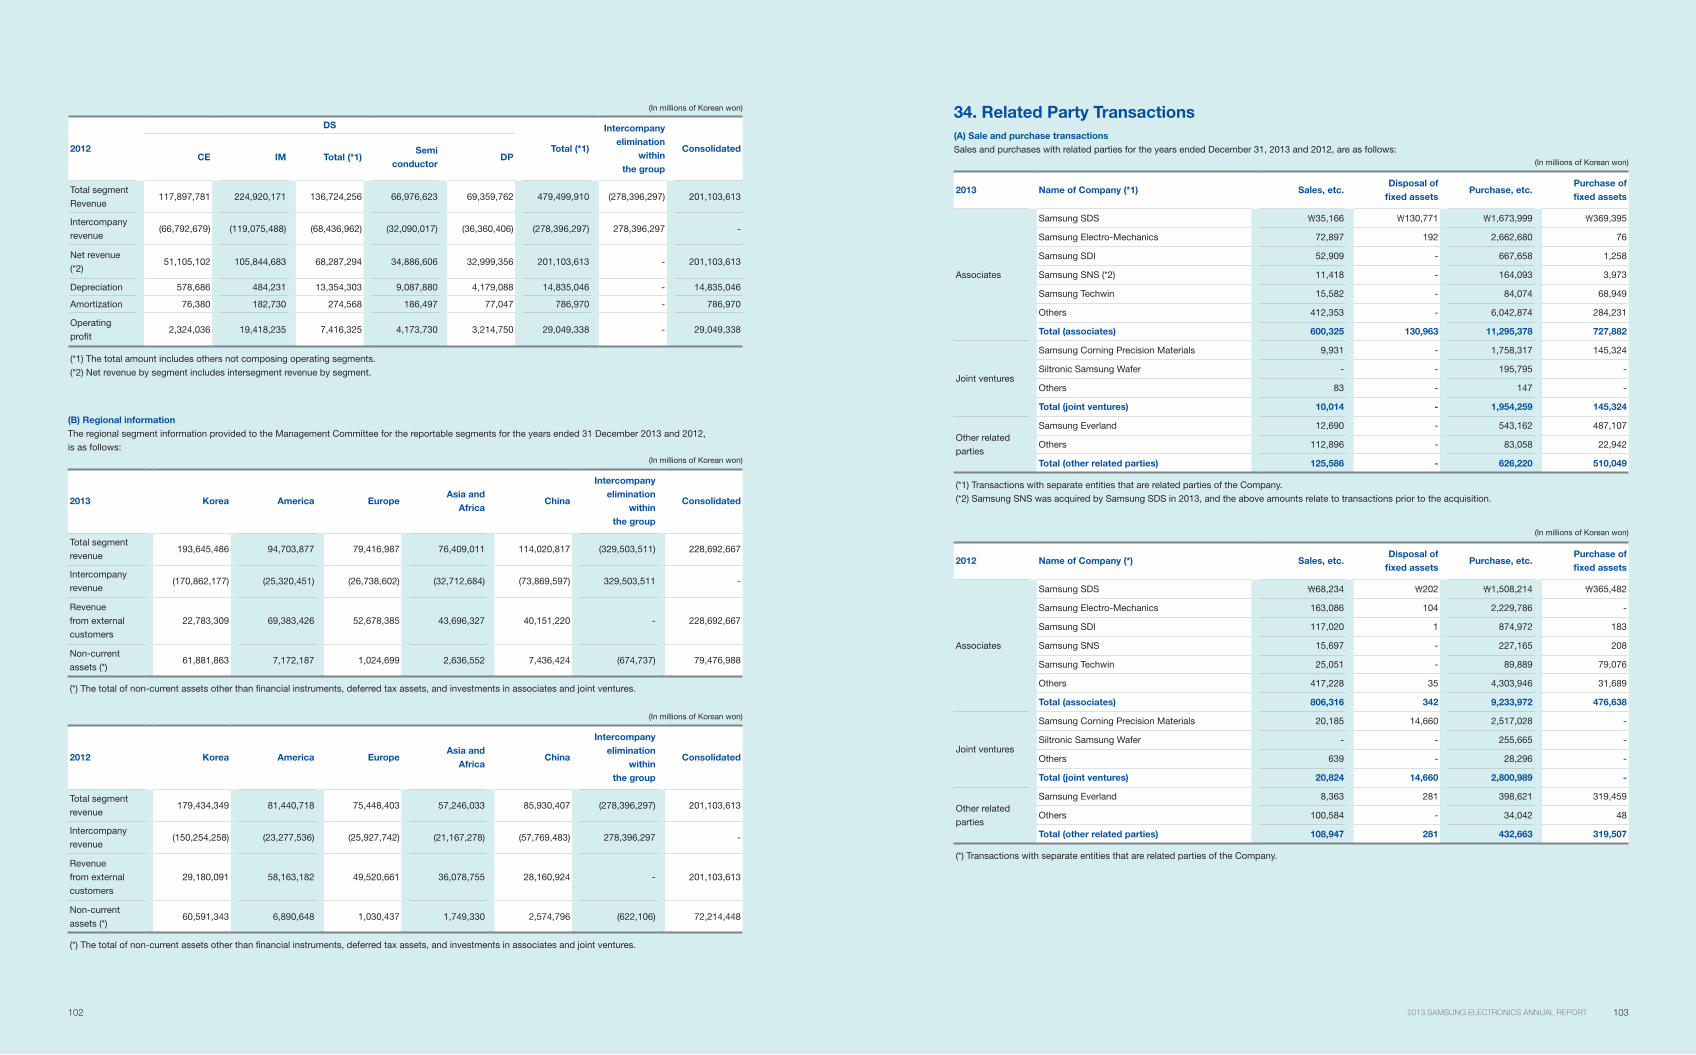
102 1032013 SAMSUNG ELECTRONICS ANNUAL REPORT
(In millions of Korean won)
2012
DS
Total (*1)
Intercompany
elimination
within
the group
ConsolidatedCE IM Total (*1)
Semi
conductorDP
Total segment
Revenue117,897,781 224,920,171 136,724,256 66,976,623 69,359,762 479,499,910 (278,396,297) 201,103,613
Intercompany
revenue(66,792,679) (119,075,488) (68,436,962) (32,090,017) (36,360,406) (278,396,297) 278,396,297 -
Net revenue
(*2)51,105,102 105,844,683 68,287,294 34,886,606 32,999,356 201,103,613 - 201,103,613
Depreciation 578,686 484,231 13,354,303 9,087,880 4,179,088 14,835,046 - 14,835,046
Amortization 76,380 182,730 274,568 186,497 77,047 786,970 - 786,970
Operating
profit2,324,036 19,418,235 7,416,325 4,173,730 3,214,750 29,049,338 - 29,049,338
(*1) The total amount includes others not composing operating segments.
(*2) Net revenue by segment includes intersegment revenue by segment.
(B) Regional information
The regional segment information provided to the Management Committee for the reportable segments for the years ended 31 December 2013 and 2012,
is as follows:
(In millions of Korean won)
2013 Korea America EuropeAsia and
AfricaChina
Intercompany
elimination
within
the group
Consolidated
Total segment
revenue193,645,486 94,703,877 79,416,987 76,409,011 114,020,817 (329,503,511) 228,692,667
Intercompany
revenue(170,862,177) (25,320,451) (26,738,602) (32,712,684) (73,869,597) 329,503,511 -
Revenue
from external
customers
22,783,309 69,383,426 52,678,385 43,696,327 40,151,220 - 228,692,667
Non-current
assets (*)61,881,863 7,172,187 1,024,699 2,636,552 7,436,424 (674,737) 79,476,988
(*) The total of non-current assets other than financial instruments, deferred tax assets, and investments in associates and joint ventures.
(In millions of Korean won)
2012 Korea America EuropeAsia and
AfricaChina
Intercompany
elimination
within
the group
Consolidated
Total segment
revenue179,434,349 81,440,718 75,448,403 57,246,033 85,930,407 (278,396,297) 201,103,613
Intercompany
revenue(150,254,258) (23,277,536) (25,927,742) (21,167,278) (57,769,483) 278,396,297 -
Revenue
from external
customers
29,180,091 58,163,182 49,520,661 36,078,755 28,160,924 - 201,103,613
Non-current
assets (*)60,591,343 6,890,648 1,030,437 1,749,330 2,574,796 (622,106) 72,214,448
(*) The total of non-current assets other than financial instruments, deferred tax assets, and investments in associates and joint ventures.
34. Related Party Transactions
(A) Sale and purchase transactions
Sales and purchases with related parties for the years ended December 31, 2013 and 2012, are as follows:
(In millions of Korean won)
2013 Name of Company (*1) Sales, etc.Disposal of
fixed assetsPurchase, etc.
Purchase of
fixed assets
Associates
Samsung SDS 35,166 130,771 1,673,999 369,395
Samsung Electro-Mechanics 72,897 192 2,662,680 76
Samsung SDI 52,909 - 667,658 1,258
Samsung SNS (*2) 11,418 - 164,093 3,973
Samsung Techwin 15,582 - 84,074 68,949
Others 412,353 - 6,042,874 284,231
Total (associates) 600,325 130,963 11,295,378 727,882
Joint ventures
Samsung Corning Precision Materials 9,931 - 1,758,317 145,324
Siltronic Samsung Wafer - - 195,795 -
Others 83 - 147 -
Total (joint ventures) 10,014 - 1,954,259 145,324
Other related
parties
Samsung Everland 12,690 - 543,162 487,107
Others 112,896 - 83,058 22,942
Total (other related parties) 125,586 - 626,220 510,049
(*1) Transactions with separate entities that are related parties of the Company.
(*2) Samsung SNS was acquired by Samsung SDS in 2013, and the above amounts relate to transactions prior to the acquisition.
(In millions of Korean won)
2012 Name of Company (*) Sales, etc.Disposal of
fixed assetsPurchase, etc.
Purchase of
fixed assets
Associates
Samsung SDS 68,234 202 1,508,214 365,482
Samsung Electro-Mechanics 163,086 104 2,229,786 -
Samsung SDI 117,020 1 874,972 183
Samsung SNS 15,697 - 227,165 208
Samsung Techwin 25,051 - 89,889 79,076
Others 417,228 35 4,303,946 31,689
Total (associates) 806,316 342 9,233,972 476,638
Joint ventures
Samsung Corning Precision Materials 20,185 14,660 2,517,028 -
Siltronic Samsung Wafer - - 255,665 -
Others 639 - 28,296 -
Total (joint ventures) 20,824 14,660 2,800,989 -
Other related
parties
Samsung Everland 8,363 281 398,621 319,459
Others 100,584 - 34,042 48
Total (other related parties) 108,947 281 432,663 319,507
(*) Transactions with separate entities that are related parties of the Company.
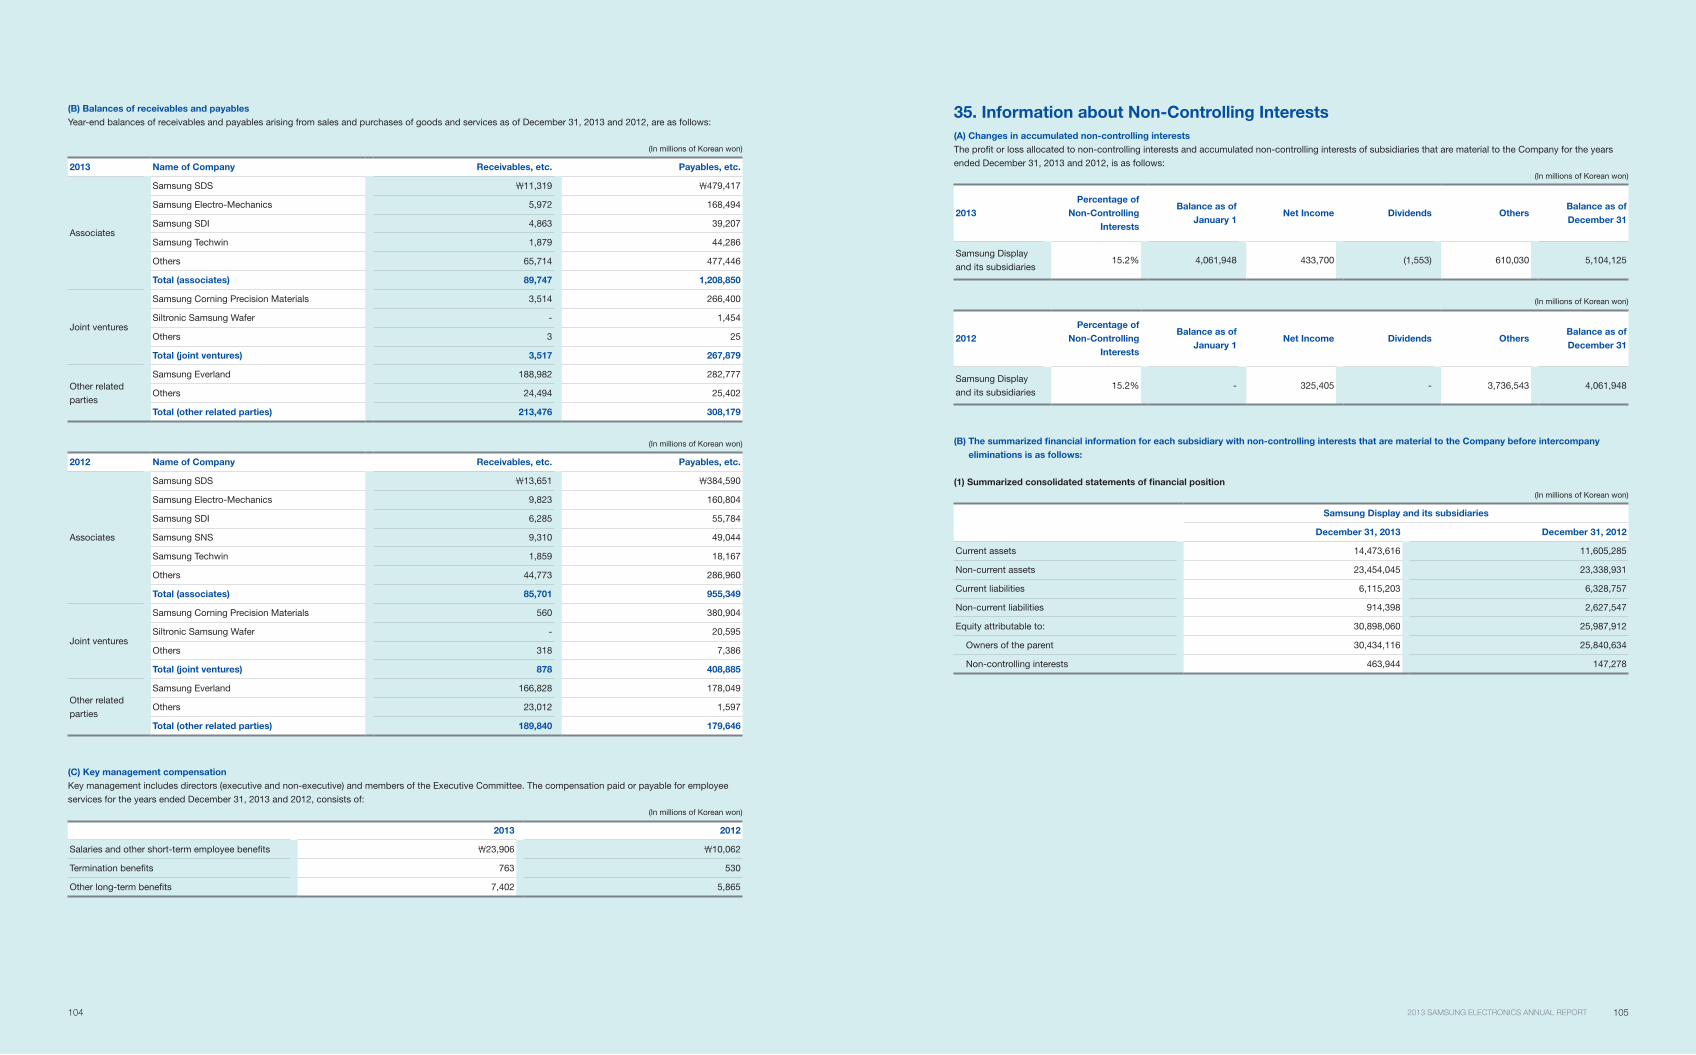
104 1052013 SAMSUNG ELECTRONICS ANNUAL REPORT
(B) Balances of receivables and payables
Year-end balances of receivables and payables arising from sales and purchases of goods and services as of December 31, 2013 and 2012, are as follows:
(In millions of Korean won)
2013 Name of Company Receivables, etc. Payables, etc.
Associates
Samsung SDS 11,319 479,417
Samsung Electro-Mechanics 5,972 168,494
Samsung SDI 4,863 39,207
Samsung Techwin 1,879 44,286
Others 65,714 477,446
Total (associates) 89,747 1,208,850
Joint ventures
Samsung Corning Precision Materials 3,514 266,400
Siltronic Samsung Wafer - 1,454
Others 3 25
Total (joint ventures) 3,517 267,879
Other related
parties
Samsung Everland 188,982 282,777
Others 24,494 25,402
Total (other related parties) 213,476 308,179
(In millions of Korean won)
2012 Name of Company Receivables, etc. Payables, etc.
Associates
Samsung SDS 13,651 384,590
Samsung Electro-Mechanics 9,823 160,804
Samsung SDI 6,285 55,784
Samsung SNS 9,310 49,044
Samsung Techwin 1,859 18,167
Others 44,773 286,960
Total (associates) 85,701 955,349
Joint ventures
Samsung Corning Precision Materials 560 380,904
Siltronic Samsung Wafer - 20,595
Others 318 7,386
Total (joint ventures) 878 408,885
Other related
parties
Samsung Everland 166,828 178,049
Others 23,012 1,597
Total (other related parties) 189,840 179,646
(C) Key management compensation
Key management includes directors (executive and non-executive) and members of the Executive Committee. The compensation paid or payable for employee
services for the years ended December 31, 2013 and 2012, consists of:
(In millions of Korean won)
2013 2012
Salaries and other short-term employee benefits 23,906 10,062
Termination benefits 763 530
Other long-term benefits 7,402 5,865
35. Information about Non-Controlling Interests
(A) Changes in accumulated non-controlling interests
The profit or loss allocated to non-controlling interests and accumulated non-controlling interests of subsidiaries that are material to the Company for the years
ended December 31, 2013 and 2012, is as follows:
(In millions of Korean won)
2013
Percentage of
Non-Controlling
Interests
Balance as of
January 1Net Income Dividends Others
Balance as of
December 31
Samsung Display
and its subsidiaries15.2% 4,061,948 433,700 (1,553) 610,030 5,104,125
(In millions of Korean won)
2012
Percentage of
Non-Controlling
Interests
Balance as of
January 1Net Income Dividends Others
Balance as of
December 31
Samsung Display
and its subsidiaries15.2% - 325,405 - 3,736,543 4,061,948
(B) The summarized financial information for each subsidiary with non-controlling interests that are material to the Company before intercompany
eliminations is as follows:
(1) Summarized consolidated statements of financial position
(In millions of Korean won)
Samsung Display and its subsidiaries
December 31, 2013 December 31, 2012
Current assets 14,473,616 11,605,285
Non-current assets 23,454,045 23,338,931
Current liabilities 6,115,203 6,328,757
Non-current liabilities 914,398 2,627,547
Equity attributable to: 30,898,060 25,987,912
Owners of the parent 30,434,116 25,840,634
Non-controlling interests 463,944 147,278
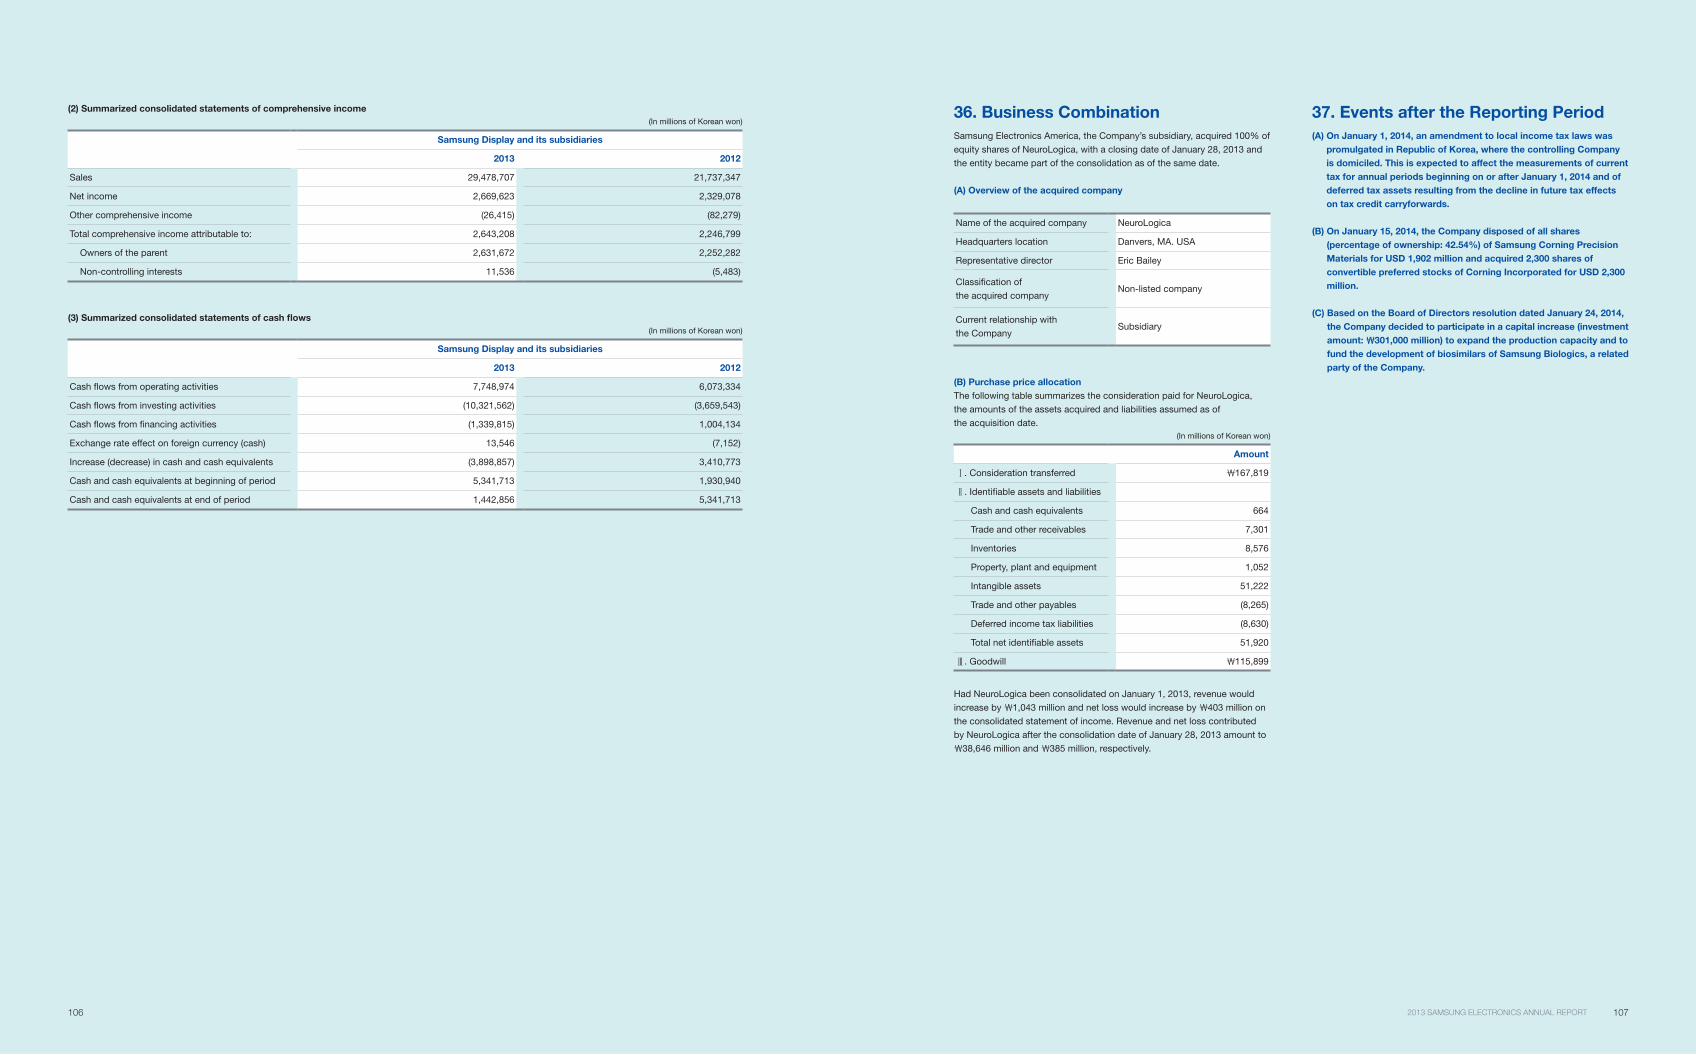
106 1072013 SAMSUNG ELECTRONICS ANNUAL REPORT
(2) Summarized consolidated statements of comprehensive income
(In millions of Korean won)
Samsung Display and its subsidiaries
2013 2012
Sales 29,478,707 21,737,347
Net income 2,669,623 2,329,078
Other comprehensive income (26,415) (82,279)
Total comprehensive income attributable to: 2,643,208 2,246,799
Owners of the parent 2,631,672 2,252,282
Non-controlling interests 11,536 (5,483)
(3) Summarized consolidated statements of cash flows
(In millions of Korean won)
Samsung Display and its subsidiaries
2013 2012
Cash flows from operating activities 7,748,974 6,073,334
Cash flows from investing activities (10,321,562) (3,659,543)
Cash flows from financing activities (1,339,815) 1,004,134
Exchange rate effect on foreign currency (cash) 13,546 (7,152)
Increase (decrease) in cash and cash equivalents (3,898,857) 3,410,773
Cash and cash equivalents at beginning of period 5,341,713 1,930,940
Cash and cash equivalents at end of period 1,442,856 5,341,713
36. Business Combination
Samsung Electronics America, the Company’s subsidiary, acquired 100% of
equity shares of NeuroLogica, with a closing date of January 28, 2013 and
the entity became part of the consolidation as of the same date.
(A) Overview of the acquired company
Name of the acquired company NeuroLogica
Headquarters location Danvers, MA. USA
Representative director Eric Bailey
Classification of
the acquired companyNon-listed company
Current relationship with
the CompanySubsidiary
(B) Purchase price allocation
The following table summarizes the consideration paid for NeuroLogica,
the amounts of the assets acquired and liabilities assumed as of
the acquisition date.
(In millions of Korean won)
Amount
. Consideration transferred 167,819
. Identifiable assets and liabilities
Cash and cash equivalents 664
Trade and other receivables 7,301
Inventories 8,576
Property, plant and equipment 1,052
Intangible assets 51,222
Trade and other payables (8,265)
Deferred income tax liabilities (8,630)
Total net identifiable assets 51,920
. Goodwill 115,899
Had NeuroLogica been consolidated on January 1, 2013, revenue would
increase by 1,043 million and net loss would increase by 403 million on
the consolidated statement of income. Revenue and net loss contributed
by NeuroLogica after the consolidation date of January 28, 2013 amount to
38,646 million and 385 million, respectively.
37. Events after the Reporting Period
(A) On January 1, 2014, an amendment to local income tax laws was
promulgated in Republic of Korea, where the controlling Company
is domiciled. This is expected to affect the measurements of current
tax for annual periods beginning on or after January 1, 2014 and of
deferred tax assets resulting from the decline in future tax effects
on tax credit carryforwards.
(B) On January 15, 2014, the Company disposed of all shares
(percentage of ownership: 42.54%) of Samsung Corning Precision
Materials for USD 1,902 million and acquired 2,300 shares of
convertible preferred stocks of Corning Incorporated for USD 2,300
million.
(C) Based on the Board of Directors resolution dated January 24, 2014,
the Company decided to participate in a capital increase (investment
amount: 301,000 million) to expand the production capacity and to
fund the development of biosimilars of Samsung Biologics, a related
party of the Company.
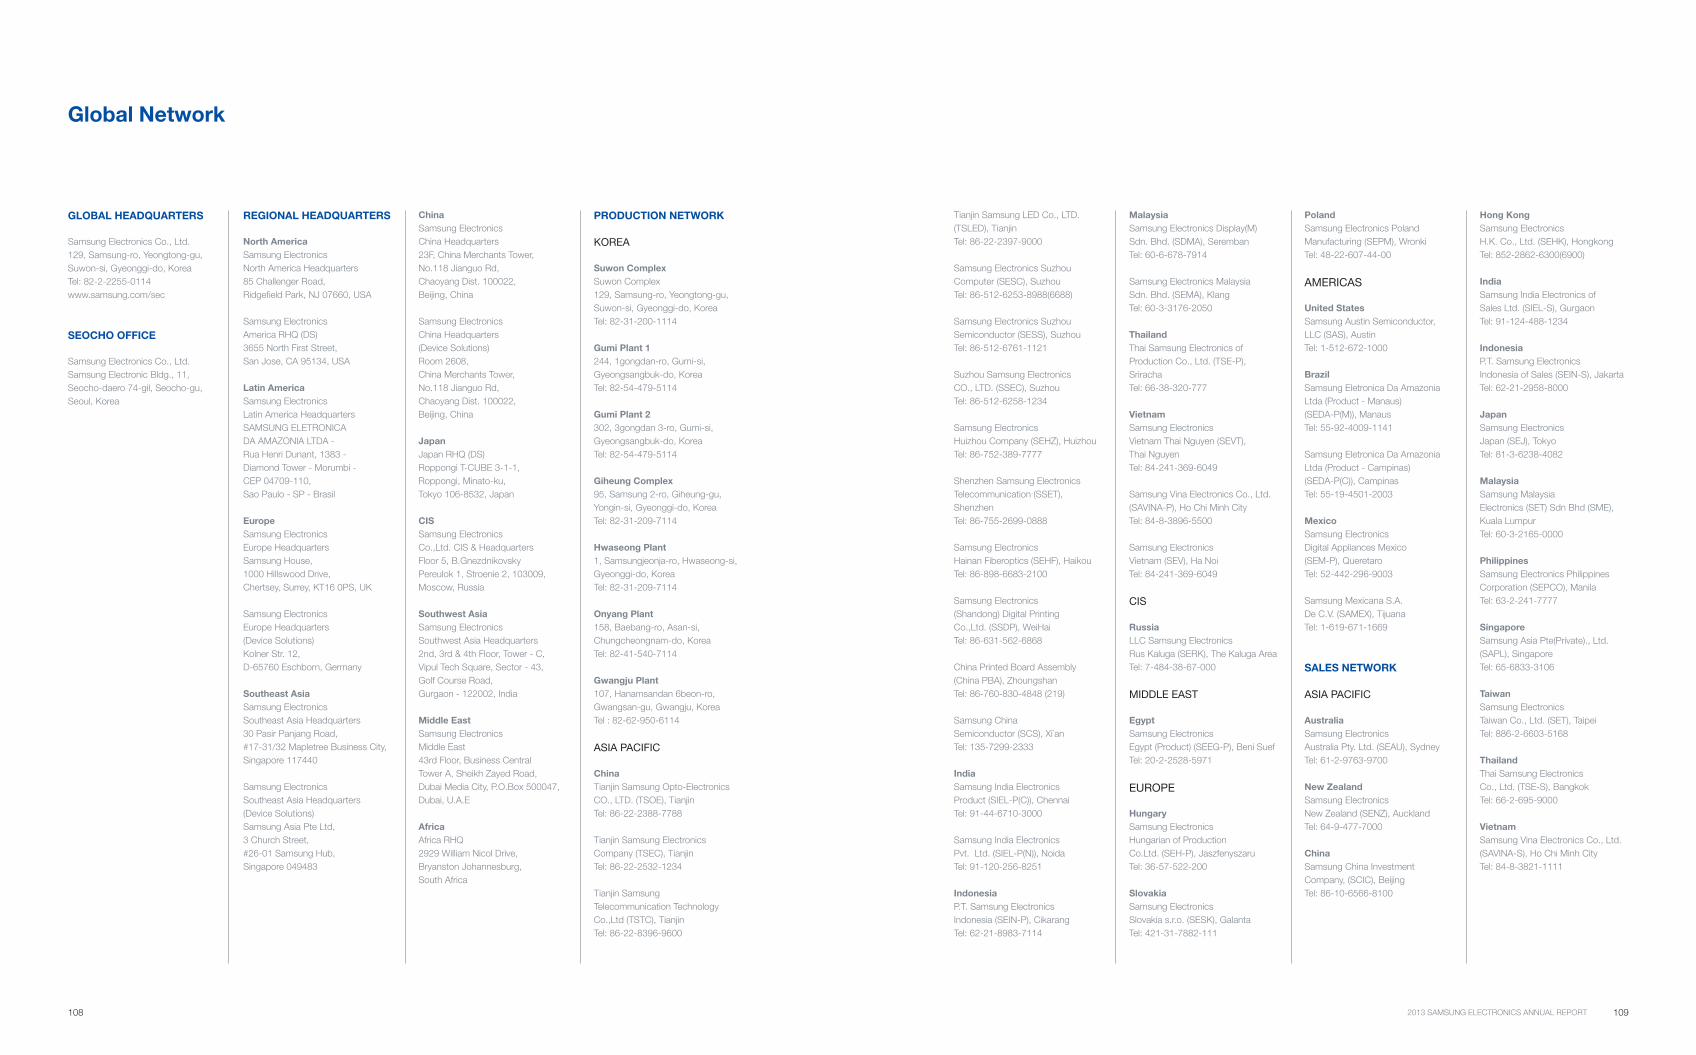
108 1092013 SAMSUNG ELECTRONICS ANNUAL REPORT
Global Network
REGIONAL HEADQUARTERS
North America
Samsung Electronics
North America Headquarters
85 Challenger Road,
Ridgefield Park, NJ 07660, USA
Samsung Electronics
America RHQ (DS)
3655 North First Street,
San Jose, CA 95134, USA
Latin America
Samsung Electronics
Latin America Headquarters
SAMSUNG ELETRONICA
DA AMAZONIA LTDA -
Rua Henri Dunant, 1383 -
Diamond Tower - Morumbi -
CEP 04709-110,
Sao Paulo - SP - Brasil
Europe
Samsung Electronics
Europe Headquarters
Samsung House,
1000 Hillswood Drive,
Chertsey, Surrey, KT16 0PS, UK
Samsung Electronics
Europe Headquarters
(Device Solutions)
Kolner Str. 12,
D-65760 Eschborn, Germany
Southeast Asia
Samsung Electronics
Southeast Asia Headquarters
30 Pasir Panjang Road,
#17-31/32 Mapletree Business City,
Singapore 117440
Samsung Electronics
Southeast Asia Headquarters
(Device Solutions)
Samsung Asia Pte Ltd,
3 Church Street,
#26-01 Samsung Hub,
Singapore 049483
China
Samsung Electronics
China Headquarters
23F, China Merchants Tower,
No.118 Jianguo Rd,
Chaoyang Dist. 100022,
Beijing, China
Samsung Electronics
China Headquarters
(Device Solutions)
Room 2608,
China Merchants Tower,
No.118 Jianguo Rd,
Chaoyang Dist. 100022,
Beijing, China
Japan
Japan RHQ (DS)
Roppongi T-CUBE 3-1-1,
Roppongi, Minato-ku,
Tokyo 106-8532, Japan
CIS
Samsung Electronics
Co.,Ltd. CIS & Headquarters
Floor 5, B.Gnezdnikovsky
Pereulok 1, Stroenie 2, 103009,
Moscow, Russia
Southwest Asia
Samsung Electronics
Southwest Asia Headquarters
2nd, 3rd & 4th Floor, Tower - C,
Vipul Tech Square, Sector - 43,
Golf Course Road,
Gurgaon - 122002, India
Middle East
Samsung Electronics
Middle East
43rd Floor, Business Central
Tower A, Sheikh Zayed Road,
Dubai Media City, P.O.Box 500047,
Dubai, U.A.E
Africa
Africa RHQ
2929 William Nicol Drive,
Bryanston Johannesburg,
South Africa
PRODUCTION NETWORK
KOREA
Suwon Complex
Suwon Complex
129, Samsung-ro, Yeongtong-gu,
Suwon-si, Gyeonggi-do, Korea
Tel: 82-31-200-1114
Gumi Plant 1
244, 1gongdan-ro, Gumi-si,
Gyeongsangbuk-do, Korea
Tel: 82-54-479-5114
Gumi Plant 2
302, 3gongdan 3-ro, Gumi-si,
Gyeongsangbuk-do, Korea
Tel: 82-54-479-5114
Giheung Complex
95, Samsung 2-ro, Giheung-gu,
Yongin-si, Gyeonggi-do, Korea
Tel: 82-31-209-7114
Hwaseong Plant
1, Samsungjeonja-ro, Hwaseong-si,
Gyeonggi-do, Korea
Tel: 82-31-209-7114
Onyang Plant
158, Baebang-ro, Asan-si,
Chungcheongnam-do, Korea
Tel: 82-41-540-7114
Gwangju Plant
107, Hanamsandan 6beon-ro,
Gwangsan-gu, Gwangju, Korea
Tel : 82-62-950-6114
ASIA PACIFIC
China
Tianjin Samsung Opto-Electronics
CO., LTD. (TSOE), Tianjin
Tel: 86-22-2388-7788
Tianjin Samsung Electronics
Company (TSEC), Tianjin
Tel: 86-22-2532-1234
Tianjin Samsung
Telecommunication Technology
Co.,Ltd (TSTC), Tianjin
Tel: 86-22-8396-9600
Tianjin Samsung LED Co., LTD.
(TSLED), Tianjin
Tel: 86-22-2397-9000
Samsung Electronics Suzhou
Computer (SESC), Suzhou
Tel: 86-512-6253-8988(6688)
Samsung Electronics Suzhou
Semiconductor (SESS), Suzhou
Tel: 86-512-6761-1121
Suzhou Samsung Electronics
CO., LTD. (SSEC), Suzhou
Tel: 86-512-6258-1234
Samsung Electronics
Huizhou Company (SEHZ), Huizhou
Tel: 86-752-389-7777
Shenzhen Samsung Electronics
Telecommunication (SSET),
Shenzhen
Tel: 86-755-2699-0888
Samsung Electronics
Hainan Fiberoptics (SEHF), Haikou
Tel: 86-898-6683-2100
Samsung Electronics
(Shandong) Digital Printing
Co.,Ltd. (SSDP), WeiHai
Tel: 86-631-562-6868
China Printed Board Assembly
(China PBA), Zhoungshan
Tel: 86-760-830-4848 (219)
Samsung China
Semiconductor (SCS), Xi`an
Tel: 135-7299-2333
India
Samsung India Electronics
Product (SIEL-P(C)), Chennai
Tel: 91-44-6710-3000
Samsung India Electronics
Pvt. Ltd. (SIEL-P(N)), Noida
Tel: 91-120-256-8251
Indonesia
P.T. Samsung Electronics
Indonesia (SEIN-P), Cikarang
Tel: 62-21-8983-7114
Malaysia
Samsung Electronics Display(M)
Sdn. Bhd. (SDMA), Seremban
Tel: 60-6-678-7914
Samsung Electronics Malaysia
Sdn. Bhd. (SEMA), Klang
Tel: 60-3-3176-2050
Thailand
Thai Samsung Electronics of
Production Co., Ltd. (TSE-P),
Sriracha
Tel: 66-38-320-777
Vietnam
Samsung Electronics
Vietnam Thai Nguyen (SEVT),
Thai Nguyen
Tel: 84-241-369-6049
Samsung Vina Electronics Co., Ltd.
(SAVINA-P), Ho Chi Minh City
Tel: 84-8-3896-5500
Samsung Electronics
Vietnam (SEV), Ha Noi
Tel: 84-241-369-6049
CIS
Russia
LLC Samsung Electronics
Rus Kaluga (SERK), The Kaluga Area
Tel: 7-484-38-67-000
MIDDLE EAST
Egypt
Samsung Electronics
Egypt (Product) (SEEG-P), Beni Suef
Tel: 20-2-2528-5971
EUROPE
Hungary
Samsung Electronics
Hungarian of Production
Co.Ltd. (SEH-P), Jaszfenyszaru
Tel: 36-57-522-200
Slovakia
Samsung Electronics
Slovakia s.r.o. (SESK), Galanta
Tel: 421-31-7882-111
Poland
Samsung Electronics Poland
Manufacturing (SEPM), Wronki
Tel: 48-22-607-44-00
AMERICAS
United States
Samsung Austin Semiconductor,
LLC (SAS), Austin
Tel: 1-512-672-1000
Brazil
Samsung Eletronica Da Amazonia
Ltda (Product - Manaus)
(SEDA-P(M)), Manaus
Tel: 55-92-4009-1141
Samsung Eletronica Da Amazonia
Ltda (Product - Campinas)
(SEDA-P(C)), Campinas
Tel: 55-19-4501-2003
Mexico
Samsung Electronics
Digital Appliances Mexico
(SEM-P), Queretaro
Tel: 52-442-296-9003
Samsung Mexicana S.A.
De C.V. (SAMEX), Tijuana
Tel: 1-619-671-1669
SALES NETWORK
ASIA PACIFIC
Australia
Samsung Electronics
Australia Pty. Ltd. (SEAU), Sydney
Tel: 61-2-9763-9700
New Zealand
Samsung Electronics
New Zealand (SENZ), Auckland
Tel: 64-9-477-7000
China
Samsung China Investment
Company, (SCIC), Beijing
Tel: 86-10-6566-8100
Hong Kong
Samsung Electronics
H.K. Co., Ltd. (SEHK), Hongkong
Tel: 852-2862-6300(6900)
India
Samsung India Electronics of
Sales Ltd. (SIEL-S), Gurgaon
Tel: 91-124-488-1234
Indonesia
P.T. Samsung Electronics
Indonesia of Sales (SEIN-S), Jakarta
Tel: 62-21-2958-8000
Japan
Samsung Electronics
Japan (SEJ), Tokyo
Tel: 81-3-6238-4082
Malaysia
Samsung Malaysia
Electronics (SET) Sdn Bhd (SME),
Kuala Lumpur
Tel: 60-3-2165-0000
Philippines
Samsung Electronics Philippines
Corporation (SEPCO), Manila
Tel: 63-2-241-7777
Singapore
Samsung Asia Pte(Private)., Ltd.
(SAPL), Singapore
Tel: 65-6833-3106
Taiwan
Samsung Electronics
Taiwan Co., Ltd. (SET), Taipei
Tel: 886-2-6603-5168
Thailand
Thai Samsung Electronics
Co., Ltd. (TSE-S), Bangkok
Tel: 66-2-695-9000
Vietnam
Samsung Vina Electronics Co., Ltd.
(SAVINA-S), Ho Chi Minh City
Tel: 84-8-3821-1111
GLOBAL HEADQUARTERS
Samsung Electronics Co., Ltd.
129, Samsung-ro, Yeongtong-gu,
Suwon-si, Gyeonggi-do, Korea
Tel: 82-2-2255-0114
www.samsung.com/sec
SEOCHO OFFICE
Samsung Electronics Co., Ltd.
Samsung Electronic Bldg., 11,
Seocho-daero 74-gil, Seocho-gu,
Seoul, Korea
110
CIS
Russia
Samsung Electronics
Russia Ltd (SERC), Moscow
Tel: 7-095-797-2344
Ukraine
Samsung Electronics
Ukraine Company (SEUC), Kiev
Tel: 380-44-390-5333
Kazakhstan
Samsung Electronics
KZ and Central Asia LLP, Almaty
Tel: 7-727-332-1212
EUROPE
Austria
Samsung Electronics
Austria Gmbh (SEKZ), Vienna
Tel: 43-1-516-15
Serbia
Samsung Electronics
Adriatic (SEAD), Beograd
Tel: 381-11-4141-301
France
Samsung Electronics
France (SEF), Paris
Tel: 33-1-4404-7000
Germany
Samsung Electronics
Germany (SEG), Schwalbach
Tel: 49-6196-6660
Greece
Samsung Electronics
Greece (SEGR), Athens
Tel: 30-213-016-3800
Hungary
Samsung Electronics Hungarian
Private Co., Ltd (SEH-S), Budapest
Tel: 36-1-453-1180
Rumania
SEROM, (SEROM), Bucuresti
Tel: 40-31-620-2333
Italy
Samsung Electronics
Italia Spa (SEI), Milano
Tel: 39-02-921-891
Netherlands
Samsung Electronics
Benelux B.V. (SEBN), Hague
Tel: 31-15-219-6100
Poland
Samsung Electronics
Polska (SEPOL), Warszawa
Tel: 48-22-607-44-00
Portugal
Samsung Electronics
Portuguesa S. A., (SEP), Lisbon
Tel: 351-21-425-1000
Spain
Samsung Electronics
Iberia S.A.U. (SESA), Madrid
Tel: 34-91-714-3700
Sweden
Samsung Electronics
Nordic AB (SENA), Stockholm
Tel: 46-8-5550-5700
Switzerland
Samsung Electronics
Switzerland Gmbh (SESG), Zurich
Tel: 41-(0)44-455-6710
United Kingdom
Samsung Electronics
United Kingdom (SEUK), London
Tel: 44-1932-455-000
Czech
Samsung Electronics
Czech (SECZ), Praha
Tel: 420-225-020-777
Latvia
Samsung Electronics
Baltics (SEB), Riga
Tel: 371-6750-8500
MIDDLE EAST & AFRICA
Egypt
Samsung Electronics
Egypt(Sales) (SEEG-S), Cairo
Tel: 20-2-2614-9200
United Arab Emirates
Samsung Gulf Electronics
Co., Ltd (SGE), Dubai
Tel: 971-4-440-6000
Turkey
Samsung Electronics
Turkey Ltd. (SETK), Istanbul
Tel: 90-212-467-0600
Jordan
Samsung Electronics
Levant Ltd. (SELV), Amman
Tel: 962-6-580-7102
Israel
Samsung Electronics
Israel (SEIL), Tel Aviv-Jaffa
Tel: 972-77-902-6276/16
Morocco
Samsung Electronics
Moroco Ltd. (SEMRC), Casablanca
Tel: 212-22-33 53 83
Tunisia
Samsung Electronics
Tunisia (SETN), Tunis
Tel: 216-71-161-212(200)
Pakistan
Samsung Electronics
Pakistan (SEPAK), Lahore
Tel: 92-42-3594-1283
Republic of South Africa
Samsung Electronics
South Africa(Pty) Ltd (SSA),
Johannesburg
Tel: 27-11-549-1500
Nigeria
Samsung Electronics
West Africa Limited (SEWA), Lagos
Tel: 234-1-8990095
Kenya
Samsung Electronics
East Africa (SEEA), Nairobi
Tel: 254-20-429-4000
NORTH AMERICA
Canada
Samsung Electronics
Canada Inc. (SECA), Toronto
Tel: 905-542-3535
United States
Samsung Electronics
America, Inc. (SEA), Ridgefield Park
Tel: 1-201-229-4000
Samsung Telecommunications
America LLP (STA), Dallas
Tel: 1-972-761-7000
LATIN AMERICA
Mexico
Samsung Electronics
Mexico (Sales)(SEM-S), Mexico city
Tel: 52-55-5747-5100
Argentina
Samsung Electronics
Argentina S.A. (SEASA), Buenosaires
Tel: 54-11-4109-4000
Brazil
Samsung Eletronica Da Amazonia
Ltda (SEDA-S), Sao Paulo
Tel: 55-11-5644-6400
Chile
Samsung Electronics Co.. Ltd.
Santiago Office (SECH), Santiago
Tel: 56-2-485-8500
Colombia
Samsung Electronics
Colombia S.A. (SAMCOL), Bogota
Tel: 57-1-487-0707
Panama
Samsung Electronics Latino America
S.A. (SELA), Panama City
Tel: 507-306-2800
Peru
Samsung Electronics
PERU S.A.C. (SEPR), Lima
Tel: 51-1-711-4801
www.samsung.com/sec