2013 technology map - jrc publications repository:...
TRANSCRIPT

J R C S C I E N C E A N D P O L I C Y R E P O R T S
JointResearchCentre
Report EUR 26345 EN
Technology Descriptions
2013 Technology Mapof the European Strategic Energy Technology Plan
JRC13_TMAP_08AP14_P5-NS-Print.indd 1 09/04/2014 16:20:55

LEGAL NOTICE
Neither the European Commission nor any person acting on behalf of the Commissionis responsible for the use which might be made of this publication.
Europe Direct is a service to help you find answers to your questions about the European UnionFreephone number (*): 00 800 6 7 8 9 10 11(*) Certain mobile telephone operators do not allow access to 00 800 numbers or these calls may be billed.
A great deal of additional information on the European Union is available on the Internet.It can be accessed through the Europa server http://europa.eu/
JRC86357
EUR 26345 EN
ISBN 978-92-79-34721-4 (print)ISBN 978-92-79-34720-7 (pdf) ISSN 1018-5593 (print)ISSN 1831-9424 (online)
doi: 10.2790/9986 (print)doi: 10.2790/99812 (online)
Luxembourg: Publications Office of the European Union, 2014
© European Union, 2014
Reproduction is authorised provided the source is acknowledged.
Printed in Luxembourg
EUROPEAN COMMISSION
Joint Research CentreInstitute for Energy and Transport
Contact: Johan Carlsson
Address:Joint Research Centre,3 Westerduinweg1755 LE Pettenthe Netherlands
E-mail: [email protected].: +31 224565341Fax: +31 224565616http://iet.jrc.ec.europa.eu/http://www.jrc.ec.europa.eu/
This publication is a Scientific and Policy Report by the Joint Research Centre of the European Commission.
JRC13_TMAP_08AP14_P5-NS-Print.indd 2 09/04/2014 16:20:55

Technology Descriptions
2013 Technology Mapof the European Strategic Energy Technology Plan
(SET-Plan)
JRC13_TMAP_08AP14_P5-NS-Print.indd 1 09/04/2014 16:20:55

JRC13_TMAP_08AP14_P5-NS-Print.indd 2 09/04/2014 16:20:56
TABLE OF CONTENTS
1. Wind Power Generation 07
2. Solar Photovoltaic Electricity Generation 16
3. Concentrated Solar Power Generation 22
4. Hydropower 27
5. Geothermal Energy 33
6. Marine Energy 41
7. Carbon Capture And Storage In Power Generation 46
8. Advanced Fossil Fuel Power Generation 54
9. Nuclear Fission Power Generation 62
10. Nuclear Fusion Power Generation 69
11. Bioenergy — Power And Heat Generation 75
12. Biofuels For The Transport Sector 83
13. Hydrogen And Fuel Cells 91
14. Electricity Storage In The Power Sector 99
15. Smart Grids 107
16. Cogeneration Or Combined Heat And Power 114
17. Energy Performance Of Buildings 119
18. Heating And Cooling Technologies 126
19. Heat Pumps 132
20. Energy Efficiency And Co2 Emissions Reduction In Industry 137
20.1 The cement industry 137 20.2 The iron and steel industry 142 20.3 The pulp and paper industry 148
JRC13_TMAP_08AP14_P5-NS-Print.indd 3 09/04/2014 16:20:56

4
Reviewers from other services of the European Commission:
Maria Getsiou [Solar PV], Jean-Marie Bemtgen and Philipp Troppmann [Iron and steel], Roger Garbil, Marc Deffrennes, Rosa Ciotola [Nuclear Fission], Rosa Ciotola, Tomasz Sliwinski, Simon Webster [Nuclear Fusion], Jeroen Schuppers [Carbon Capture and Storage, and Advanced Fossil Fuels], Patrick Van Hove [Smart Grids] Agustin Escardino Malva]
The following external contributors are also gratefully acknowledged:
Bertrand de Lamberterie [Iron and steel], Claude Loréa [Cement], Marco Mensink and Jernej Vernik [Pulp and paper], Jean-Luc Delplancke, Nikolaos Lymperopoulos, Mirela Atanasiu, Enrique Giron, Guillaume Leduc and Carlos Navas [Hydrogen and fuel cells]
The Technology Map Editorial Team:
Johan Carlsson / Marika Vellei
ACKNOWLEDGEMENTS
We would like to gratefully acknowledge the following lists of authors, reviewers and con-tributors to the 2013 Technology Map.
Chapter Authors
Wind Roberto Lacal-AranteguiPhotovoltaic Arnulf Jäger-WaldauConcentrated solar power Arnulf Jäger-WaldauHydropower Roberto Lacal-AranteguiGeothermal Andrei Bocin-Dumitriu, Bergur SigfussonMarine Ghassan Zubi, Davide MagagnaCHP Johan CarlssonCCS Maria del Mar Perez FortesAdvanced fossil fuel Maria del Mar Perez FortesNuclear fission Johan CarlssonNuclear fusion Ray MossSmart grids Stavros Lazarou
Bioenergy – power and heat David Baxter, Nicolae Scarlat, Jacopo Giuntoli, Alberto Moro
Biofuels for the transport sector Monica Padella, Marina Kousoulidou, Veljko Vorkapic, Luisa Marelli
Hydrogen and fuel cells Marc SteenElectricity storage Andreas Zucker, Roberto Lacal-AranteguiEfficiency in industry José Moya- Cement- Iron and steel- Pulp and paperEnergy performance of buildings Hans BloemHeating and cooling technologies Carmen MolesHeat pumps Carmen Moles
JRC13_TMAP_08AP14_P5-NS-Print.indd 4 09/04/2014 16:20:56

5
PREAMBLE
Background
The European Union (EU) is tackling climate change, energy supply security and economic competitiveness through the transformation of the energy system, with far-reaching implica-tions on how we source and produce our ener-gy, how we transport and trade it, and how we use it. The aim is to reduce carbon dioxide (CO2) emissions by at least 85 % by 2050 compared to the 1990 levels.
There is no single energy technology that alone can sustain this transformation. Either the energy sources are not sufficiently abun-dant or they have drawbacks in terms of sus-tainability or security of supply. In other cases the technologies proposed are not yet compet-itive as compared to technologies using fossil fuels. Therefore, a broad portfolio of low-car-bon technologies is required for coping with future uncertainty.
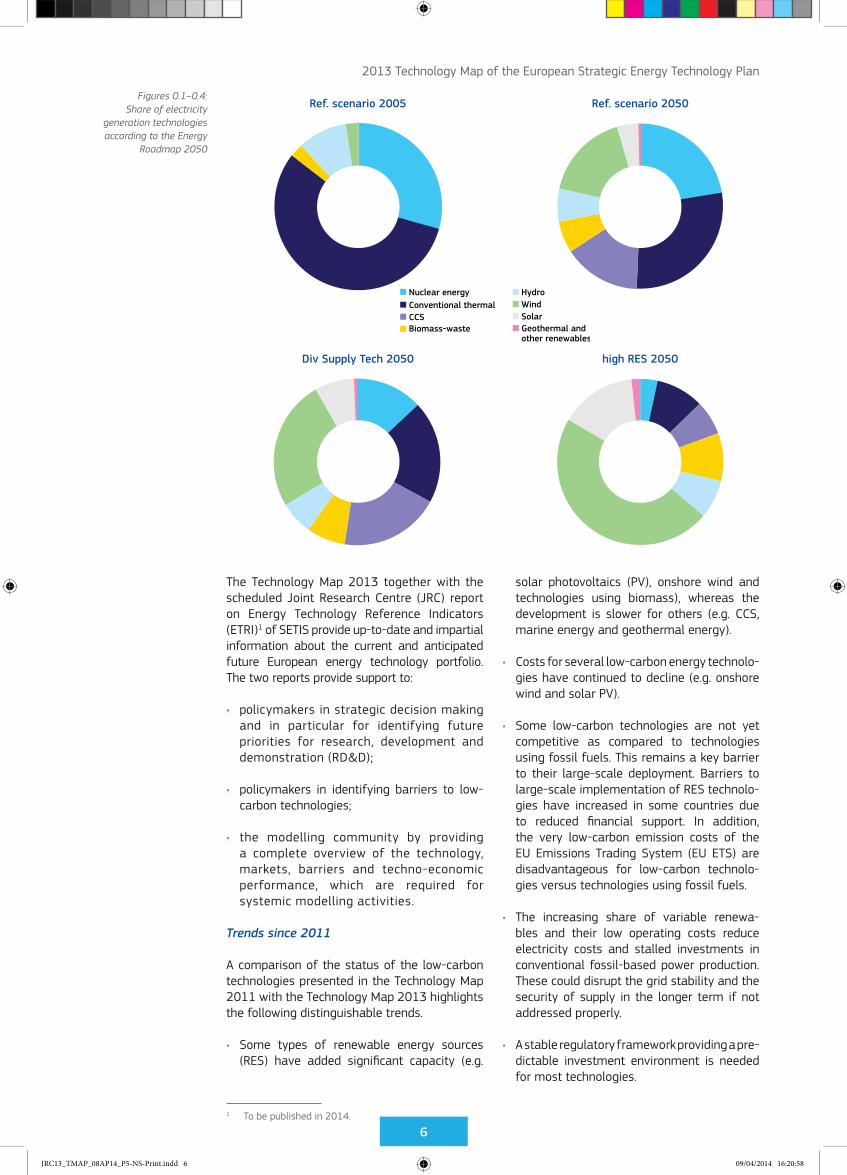
According to the Energy Roadmap 2050 (COM(2011)885/2), under the current poli-cies, the market trends show that only half of the targeted greenhouse gas (GHG) emis-sion reductions would be achieved by 2050. The respective shares of electricity generation technologies in such reference scenarios in 2005 and 2050 are shown in Figures 0.1 and 0.2. With more support for research and deve-lopment (R&D) on new technologies and a sup-portive regulatory framework for low-carbon technologies compared to the current policies, the decarbonisation of the energy system can be significantly accelerated.
The Energy Roadmap 2050 examined four decarbonisation pathways. These included different combinations of energy efficiency, renewables, nuclear, and carbon capture and storage (CCS) that would allow achieving the goal of 85 % CO2 emission reduction in 2050. The shares of electricity generation technolo-gies for two of these decarbonisation pathways are presented in Figures 0.3 and 0.4.
The Strategic Energy Technology Plan (SET-Plan) is the technology pillar of the EU’s energy and climate policy. It responds to the challenge of accelerating the development of low-carbon technologies, leading to their widespread mar-ket take-up. SETIS, the SET-Plan Information System, supports the SET-Plan. One of SETIS’s regular outputs is the Technology Map, which presents the state of knowledge for low-carbon technologies in the following domains:
• assessment of the state of the art of a wide portfolio of low-carbon energy technologies,
• market and industry potential,
• barriers to their large-scale deployment,
• ongoing and planned R&D and demonstration efforts to overcome technological barriers.
JRC13_TMAP_08AP14_P5-NS-Print.indd 5 09/04/2014 16:20:57
6
2013 Technology Map of the European Strategic Energy Technology Plan
The Technology Map 2013 together with the scheduled Joint Research Centre (JRC) report on Energy Technology Reference Indicators (ETRI)1 of SETIS provide up-to-date and impartial information about the current and anticipated future European energy technology portfolio. The two reports provide support to:
• policymakers in strategic decision making and in particular for identifying future priorities for research, development and demonstration (RD&D);
• policymakers in identifying barriers to low-carbon technologies;
• the modelling community by providing a complete overview of the technology, markets, barriers and techno-economic performance, which are required for systemic modelling activities.
Trends since 2011
A comparison of the status of the low-carbon technologies presented in the Technology Map 2011 with the Technology Map 2013 highlights the following distinguishable trends.
• Some types of renewable energy sources (RES) have added significant capacity (e.g.
1 To be published in 2014.
Figures 0.1–0.4: Share of electricity
generation technologies according to the Energy
Roadmap 2050
solar photovoltaics (PV), onshore wind and technologies using biomass), whereas the development is slower for others (e.g. CCS, marine energy and geothermal energy).
• Costs for several low-carbon energy technolo- gies have continued to decline (e.g. onshore wind and solar PV).
• Some low-carbon technologies are not yet competitive as compared to technologies using fossil fuels. This remains a key barrier to their large-scale deployment. Barriers to large-scale implementation of RES technolo-gies have increased in some countries due to reduced financial support. In addition, the very low-carbon emission costs of the EU Emissions Trading System (EU ETS) are disadvantageous for low-carbon technolo-gies versus technologies using fossil fuels.
• The increasing share of variable renewa-bles and their low operating costs reduce electricity costs and stalled investments in conventional fossil-based power production. These could disrupt the grid stability and the security of supply in the longer term if not addressed properly.
• A stable regulatory framework providing a pre-dictable investment environment is needed for most technologies.
Ref. scenario 2005
Div Supply Tech 2050
Ref. scenario 2050
high RES 2050
Nuclear energyConventional thermalCCSBiomass-waste
Hydro WindSolar Geothermal and other renewables
JRC13_TMAP_08AP14_P5-NS-Print.indd 6 09/04/2014 16:20:58

7
1. Wind power generation
1.1 Introduction
Wind power is the renewable energy that has seen the widest and most successful deploy-ment over the last two decades, from 3 giga-watts (GW) to 285 GW of global cumulative capacity by the end of 2012. In the EU, wind energy contributed 7 % to the final electricity consumption of 2012, with 4 countries sourcing more than 10 % of their electricity from wind and 7 others more than 5 %. Wind energy will provide at least 12 % of European electricity by 2020, therefore significantly contributing to the 20/20/20 goals of the European energy and cli-mate policy.
1.2 Technological state of the art and anticipated developments
At the end of the last century, a wind turbine design (the three-bladed, horizontal-axis rotor) arose as the most cost effective and efficient. The main technological characteristics of this design are:
• an upwind rotor with high blade and rotor efficiency;
• low acoustic noise;
• optimum tip speed;
• active wind speed pitch regulation;
• variable rotor speed with either a gearbox connected to a medium- or high-speed gen-erator or direct rotor connection to a low-speed generator;
• a concrete, steel or hybrid concrete–steel tower.
The main driver for developing wind technology is to minimise the cost of energy (CoE) production, for which efforts focus on minimising capital and operating costs and maximising reliability and energy production. These drivers translate into:
• design adapted to the wind characteristics (i.e. speed and turbulence);
• grid compatibility;
• aerodynamic performance;
• redundancy of key electrical systems;
• adaptation for offshore conditions.
Technical considerations that cover several of these goals include:
• top-head weight reduction;
• larger but lighter rotors and advanced com-posite engineering leading to higher yields;
• design for facilitating offshore installation, operation and maintenance (O&M).
The current and planned offshore wind instal-lations are a good example of this technologi-cal evolution. Figure 1.1 shows how the size of wind turbines installed offshore has increased with time and it is expected that they will continue to evolve. The graph permits to dis-tinguish between the 2, 2.3, 3, 3.6, 5 and 6 megawatt (MW) turbines. The size of the bubble corresponds to the number of turbines installed or expected per year.
2013 Technology Map of the European Strategic Energy Technology Plan
JRC13_TMAP_08AP14_P5-NS-Print.indd 7 09/04/2014 16:20:58

8
2013 Technology Map of the European Strategic Energy Technology Plan
The production of the magnetic field in wind turbine electricity generators is the objective of another key technological evolution, from electromagnets (EMGs) to permanent magnets (PMGs). The former include:
• squirrel cage induction generator (SCIG);
• wound-rotor induction generator (WRIG);
• compact doubly-fed induction generator (DFIG);
• large, low-speed electromagnet generator (LS-EMG) in a turbine without a gearbox.
There is a tendency to substitute EMGs with PMGs because of their higher reliability and partial-load efficiency as well as higher flexibility of integration with compact gearboxes or power electronics. However, this change is not without problems due to supply/demand imbalances of the basic raw materials needed for PMGs (rare earth elements), which in the last three years were subject to high price variability, and because the main world supplier, China, set up tight export quotas. Last but not least, ores of rare earths are often found mixed with radioactive materials and their mining and the disposal of their waste present additional environmental challenges. Key technological issues for offshore wind include:
• safe access for staff when the sea is rough (the technological evolution of the access vessels determines how rough a sea they can withstand and thus the number of days that access to turbines can be guaranteed);
• improving the design of the coupling between foundation/installation vessels to reduce installation time and to increase the number of working days;
• cost-effective foundations/installation for deeper waters and farther away sites.
Interwoven with those issues is the reliability of offshore wind turbines: the more reliable they are, the less need for access for corrective maintenance. In addition, the development of floating foundations is accelerating with two full-size prototypes already on the sea, and the first deep-water wind farm could be envisaged for 2020.
The trend towards ever-larger wind turbines, which slowed in recent years, has resumed. The largest wind turbine now in commercial operation has a capacity of 7.58 MW, and most manufacturers have introduced designs of tur-bines in the 5–8 MW range, mostly for offshore use. Table 1.1 includes a sample of current or recently presented large wind turbines.
The interest in 10 MW designs seems to have weakened after one of the three most advanced designs (Clipper’s) was cancelled. Sway (Norway), AMSC Windtec (US-AT) and several Chinese manufacturers claim to still follow this avenue. In any case, this vision is supported by industry elsewhere and academia that see even larger turbines (10–20 MW) as the future of offshore machines (TPWind, 2010).
Figure 1.1: Evolution of the size of offshore wind turbines
based on their power rating
Source: JRC, based on own data.
Number of offshore turbines installed per year according to their power rating
The red bubble corresponds to 218 turbines each rated 3 MW and
commissioned in 2010
0
1990 20051995 20102000 2015 2020
4
1
5
2
6
3
7
8
MW
JRC13_TMAP_08AP14_P5-NS-Print.indd 8 09/04/2014 16:21:01

9
2013 Technology Map of the European Strategic Energy Technology Plan
Rotor diameters have reached new records with 154 m Siemens and Haizhuang machines already operating, the 167 m SeaAngel expected at the end of the year, and the 171 m Samsung following in 2014. Generator capacities are growing as well, although to a lesser extent.
Most manufacturers now have a commercial or prototype machine on the 5 MW range but only one surpasses the 7 MW mark (Enercon) with Vestas’ V164 prototype expected to join in 2014.
Tip speed is limited by acoustic noise, and turbines might be requested to operate at reduced speed in noise-sensitive areas. However, offshore, the tip speed can increase
to over 80 m/s thus yielding more electricity production. Nacelles tend to reduce their rel-ative weight and offshore turbines tend to stabilise hub heights at 80–100 m. This is because offshore wind shear is weaker and there is a trade-off between taller towers yielding slightly higher production but needing heavier foundations, which involve higher tower and foundation costs (EWEA, 2009). Most foundations installed are monopiles, but beyond a certain depth and turbine mass multi-member foundations (jackets, tripods) are cheaper; technology improvements are increasing the range at which monopiles can be used economically. Innovative designs include tribucket, twisted jacket, suction
Table 1.1: A sample of large wind turbines in the market or being introduced
Notes: PMG = permanent magnets; EMG = electromagnets and LS/MS/HS = low/medium/high speed; LS is necessarily a direct-drive machine, HS involves a 3-stage, conventional gearbox and MS is a hybrid. Size included rated capacity in MW and rotor diameter in metres.
Manufacturer Model Size: MW/m Technology Status
Alstom Wind Haliade 150 6.0/150 LS-PMGPrototype installed in 2012
(Le Canet, FR)
Areva M50005.0/1165.0/135
MS-PMG
(116 m rotor) Commercially available(135 m rotor) Prototype
installed in 2013(Bremerhaven, DE)
BARD BARD 6.5 6.5/122 2 MS-PMGPrototype installed in 2011
(Rysumer Nacken, DE)
Enercon E126-7.5 7.58/127 LS-EMG Commercially available
Gamesa G128/5.0 5.0/128 MS-PMGPrototype installed in 2013
(Arinaga, ES)
Goldwind GW6000 6.0/ LS-PMG Prototype expected in late 2013
Guodian United Power
UP6000 6.0/136 HS-DFIGPrototype installed in 2012
(Shandong, CN)
Haizhuang CSIC HZ-5MW 5.0/154 HS-PMGPrototype installed in 2012
(Jiangsu, CN)
Ming Yang 6.5MW SCD 6.5/140 MS-PMG Prototype expected in late 2013
Mitsubishi SeaAngel 7.0/167Hydraulic
transmissionPrototype expected in late 2013
REpower 6M 6.15/128 HS-DFIG Commercially available
Samsung S7.0 7.0/171 PMG Prototype expected in 2014
Siemens SWT-6.0-154 6.0/154 LS-PMGPrototype installed in 2012
(Østerild, DK)
Sinovel SL60006.0/1286.0/155
HS-SCIG
(128 m rotor) Prototype installed in 2011 (Jiangsu, CN)
(155 m rotor) Prototype announced
Vestas V164-8.0 8.0/164 MS-PMGPrototype expected for Q2
2014
XEMC-Darwind XD115 5.0/115 LS-PMGPrototype installed in 2011
(Wieringerwerf, NL)
JRC13_TMAP_08AP14_P5-NS-Print.indd 9 09/04/2014 16:21:01

10
2013 Technology Map of the European Strategic Energy Technology Plan
790
860
950 960
880
1000 1030
1020
1110 1100
1210 1200
1060
1020 980
940 940 940 910
880
1010 1060
1210 1170
1150
1110
1030 1020
950 930 920
890 890 850
700
800
900
1000
1100
1200
1300
2004 2005 2006 2007 2008 2009 2010 2011 2012 2013
bucket monopile and even concrete-based gravity foundations such as Strabag’s, sup-ported by the European Economic Programme for Recovery (EEPR, 2013).
Wind energy investment costs (capital expendi-ture (CapEx)) vary widely because projects have a high site-related influence. This is the result of the turbine transport distance and condi-tions, soil characteristics and distance to the grid connection point, among others. Turbine prices declined until 2004, then supply/demand imbalances and the increase of raw mate-rial and component prices pushed up global
Figure 1.2: Share of foundations
in offshore wind farms commissioned during
2011/2012
Source: JRC, based on own data.
Figure 1.3: The lag between turbine
prices contracted and commissioning dates
shows how delivery times have evolved
Source: JRC, based on BNEF, 2013a.
Monopile76% of MW installed
Tripile5%
Jacket18%
High-RisePile Cap
1%
Floating0%
Share of foundations in offshore wind farms commissioned during 2011/12
Evolution of average turbine prices in €/kW (BNEF)
H1 H2 H1 H2 H1 H2 H1 H2 H1 H2 H2 H2 H1 H1 H2 H1 H2 H1 H2 H1
onshore turbine prices to around EUR 1 200 per kilowatt (kW) (except Asian) in late 2007 for delivery in 2009, when the reduction in raw materials costs caused by the financial crisis, manufacturing overcapacity and increasing competition pushed prices down to around EUR 850/kW by mid-2013 (BNEF, 2013a). The United States (US) estimated turbine price the previous year was EUR 924/kW (at EUR 1 = USD 1.392) (NREL, 2013) and China bid-ding turbine prices averaged EUR 600/kW (at EUR 1 = CNY 8.22) (BNEF, 2013b)2. Offshore turbine prices are in the range of EUR 1 500/kW (MML, 2011).
2 Chinese prices are made up from bids submitted
at the wind farm turbine auctions, but not the final
winning price, and include VAT, transportation to site,
installation and estimated 2-year warranties, but not
the towers (and possibly not the transformer either).
They correspond to the 2.5-MW–level turbines; 1.5 MW
machines average 78 % of that price.
Per delivery date
Per contract signature date
JRC13_TMAP_08AP14_P5-NS-Print.indd 10 09/04/2014 16:21:03

11
2013 Technology Map of the European Strategic Energy Technology Plan
Similarly, European capital investment (CapEx) for onshore projects showed a reduction to EUR 1 000/kW in 2003/2004 and then climbed to reach its peak in 2008, then down to around EUR 1 250/kW in 2010 (EU, 2013) with mini-mum reported CapEx of EUR 1 150/kW in 2012 (Ecotricity, 2012). The U.S. Department of Energy (U.S. DOE, 2013) suggests for the US a 2012 CapEx level around EUR 1 390/kW. Estimates of global CapEx averages (except China) show a maximum of EUR 1 515/kW in 2009 then gradually dropping to EUR 1 377/ kW for projects implemented in late 2013 (JRC analysis based on BNEF (2013a) and other data). Offshore CapEx have been even more affected by supply chain limitations and the difficulties of work-ing offshore, and showed strong price increases from EUR 2 200/kW in 2007 to EUR 3 000–4 200/kW in 2011 with the upper end covered by farther offshore, deep-water wind farms (JRC). MML (2011) suggested that raw material costs are not that significant but instead prices of off-shore wind included a market premium in the order of 20 %. This is notably higher than for onshore wind due to significant risks related to both construction and operation.
Average onshore operational costs (OpEx) are estimated at EUR 18 per megawatt-hour (MWh) (or EUR 40/kW/year at a 25 % capacity fac-tor (CF)) and, over a 20-year operation period, constitute 30–40 % of total costs. The pure maintenance component of this cost (O&M), as reflected in all-in maintenance contracts with original equipment manufacturers (OEMs) or third-party suppliers, is tending towards EUR 10/MWh. Those contracts increasingly include a clause on time or energy availabil-ity (e.g. 97 %) and the sharing of income from generation above that figure between both sup-plier and developer. Offshore OpEx costs are in the EUR 25–40/MWh (or EUR 106/kW/year at a 40 % CF) range with a European average of EUR 30/MWh (EU, 2013) and towards the upper range for farther offshore installations. However, a very interesting change is occurring regarding offshore O&M costs as industry play-ers now expect significantly lower O&M costs ahead than they did two years ago: EUR 23/MWh vs. EUR 36/MWh3.
The expected capital investment trend is for onshore capital costs to drop further and then to stabilise. Without doubt, technology will continue to progress but, as wind turbines are viewed as some kind of commodity, it is like-ly that non-technological factors will have a stronger influence on the onshore turbine price. Offshore wind is expected to maintain high
3 JRC calculations based on ARUP (2011) and GL-GH
(2013), and on assumptions from EU (2013).
costs until 2015, but it has more room for fac-tors including technology improvements (e.g. to reduce foundation and installation costs), learn-ing-by-doing, improved supply chain and more competition, which should lead to a reduction of CapEx by 18 % by 2020, 26 % by 2030, 32 % by 2040 and 35 % by 2050 (EC, 2013).
Curtailment is a problem of increasing impact. Curtailment is the forced stopping of wind elec-tricity generation following instructions from grid operators. This happens mostly in two cases: either there is excess (overall) electricity production compared to the existing demand (e.g. on a windy Saturday night), or the local wind generation is larger than what can be absorbed by the transmission lines to the cen-tres of demand. Curtailment is not regularly quantified in Europe and it is expected to remain limited, but elsewhere curtailment is having a strong impact: 20 terawatt-hours (TWh) were lost in China in 2012 for a value of around CNY 10 billion (China Daily, 2013).
The system availability of European onshore wind turbines is above 97 %, among the best of the electricity generation technologies (EWEA, 2009) although, because malfunctions occur most when the wind is blowing strong, the 3 % unavailability translates into a higher lost production of maybe 5 %. The typical CFs onshore are 1 800–2 200 full-load hours equivalent (in which a wind turbine produces at full capacity) and 3 000–3 800 offshore, for a European global average of 1 920 hours in the 2002–2011 period4 (see Figure 1.4). Technology progress tends to increase these figures, but best sites onshore have already been taken and new wind farms are built at lower wind speed sites.
4 Author’s calculations based on the historical wind
energy CF from Eurostat data on generation and
installed capacity (21.9 %), and assuming that end-
of-2012 installed wind capacity (from GWEA, 2013),
averaged over the year, generated at 21.9 % CF.
JRC13_TMAP_08AP14_P5-NS-Print.indd 11 09/04/2014 16:21:03

12
2013 Technology Map of the European Strategic Energy Technology Plan
1.3 Market and industry status and potential
There are two main market sectors: onshore and offshore wind. The differences include complexity of installation, working environ-ment (saline and tougher at sea), and facility of access for installation and maintenance. In addition, as the wind is stronger and more sta-ble at sea, wind turbine electricity production is higher offshore. Current onshore wind ener-gy technology certainly has room for further improvement (e.g. locating in forests and facing extreme weather conditions), yet it is a mature technology. Offshore wind, however, still faces many challenges. There is a third sector, small turbines (up to 10 kW) for niche applications such as isolated dwellings, but this sector is unlikely to provide a significant share of the European electricity supply and it is therefore not analysed here.
The global installed wind capacity grew at a 24.5 % annual average between 2003 and 2012, and added 44.8 GW in 2012 to total 284 GW (+ 18 %) (Navigant, 2013; GWEC, 2013). The offshore sector grew by 67 % in 2012 to 5 500 MW (JRC), including shoreline and intertid-al installations, although it still contributes less than 2 % of global installed capacity. In the EU, wind installations increased 11.9 GW to reach 106 GW (+ 12.7 %) (GWEC, 2013), and offshore made up 11 % of these new installations (1 259 MW) (JRC). With 13 GW of new installations and a market share of 28 % each, China and the US led the wind market in 2012, for a cumulative
Figure 1.4: The evolution of annual
capacity factor compared to installed capacity,
2002–2011
Source: JRC, based on Eurostat and own data.
installed capacity of 75.3 and 60 GW, respec-tively (GWEC, 2013; CWEA, 2013). The status of the EU as the major world market is a part of history since 2004, when 70 % of newly installed capacity took place in the EU; this figure was reduced to 24 % by 2010 although it then increased to 28 % in 2012. During 2012, wind installations accounted for 26.5 % of new electricity plants in the EU (EWEA, 2013) and 43 % in the US (U.S. DOE, 2013).
As a consequence of this trend, top European turbine manufacturers suffered a reduction of their global market share from 67 % in 2007 (EWEA, 2009) to 37 % in 2011, before a slight recovery to 43 % in 2012 (Navigant-JRC, 2013). The top 10 manufacturers in 2012 included GE Wind (US), Vestas and Siemens Wind Systems (DK), Enercon (DE), Gamesa (ES), Suzlon/REpower (IN/DE) and four Chinese (Goldwind, United Power, Sinovel and Ming Yang). With the replacement of Ming Yang by Dongfang, these are the same top 10 manu-facturers as in 2010 and 2011. European tur-bine manufacturers suffered negative 2012 earnings before interest and taxes (EBIT), in some cases very significant due to high restructuring costs. Outside Europe, Chinese manufacturers are similarly affected by the highly competitive market and — particular to China — a significant reduction of their home market. Still, they performed slightly better. The first half of 2013 suggested a change of tendency though, with Nordex and Gamesa posting operational profits.
18%2002 2003 2004 2005 2006 2007 2008 2009 2010 2011
19%
20%
21%
22%
23%
24%
0
20
40
60
80
100
120
140
160
180Lo
ad f
acto
r (%
)
GW (c
apac
ity) o
r TW
h (e
nerg
y)
Installed capacity (GW) Electricity generation (TWh) Load factor (LF, %) LF - weighted average
Wind energy genaration, installed capacity and load factor EU-27
JRC13_TMAP_08AP14_P5-NS-Print.indd 12 09/04/2014 16:21:04

13
2013 Technology Map of the European Strategic Energy Technology Plan
The wind energy generation by the installed capacity at the end of 2012, estimated at the European average of a 21.9 % load factor (LF), would be 203 TWh or 7.3 % of final electricity consumption. Worldwide wind would supply 550 TWh under the same assumptions. The countries with the highest wind share in the electricity mix in 2012 included Denmark (30 %), Portugal (20.4 %), Spain (18 %), Ireland (16 %) and Germany (8.8 %).
Achieving the 2020 EU industry target of 230 GW, of which 40 GW is offshore, remains a realistic scenario onshore but perhaps not so much so offshore. Electricity production would be 520 TWh, between 13 and 15 % of EU electricity demand (EWEA, 2013). The 2030 potential is 350 GW, of which 150 GW offshore, and would produce 880 TWh, between 21 and 24 % of EU demand. The economically competitive potential of 12 200 TWh by 2020 and 30 400 TWh by 2030 (EEA, 2009) is beyond reach. The 2050 EU projections suggest 382 GW of installed capacity (EC, 2011c), which is the result of the slowing down of installations after 2030. This would result in some 1 000 TWh of annual production.
The International Energy Agency (IEA) has reduced its estimate for global onshore cumu-lative capacity by 2020 from 670 GW 2 years ago to 586 GW in its latest publications (IEA, 2012a, 2012b). Of these, 40 GW would be off-shore, 200 GW in China and 93 GW in the US. For this source, by 2035 global installed capac-ity could reach 1 098 GW, of which 175 GW offshore, 326 GW in China and 161 GW in the US, and generate 7.3 % of the then estimated world consumption.
Wind is already competitive with fossil fuel generation in high-wind sites such as Scotland. The expected rise in fossil fuel prices, along with wind technology improvements — fuelled by initiatives such as the SET-Plan (EC, 2007) — will make that at more and more sites, wind generates electricity cheaper than fossil fuels. Wind power is thus an insurance against fluc-tuating (and rising) energy prices in addition to creating security of supply and protection against unstable sources of fossil fuels.
1.4 Barriers to large-scale deployment
The main barrier preventing further wind ener-gy development presented in the 2011 version of this report is still present: a lack of a vision by certain governments on the extent of wind (and renewables) deployment that they want to achieve. This has caused problems such as lack of a stable legislative framework and of invest-ment security in countries like the Czech Republic
and Spain, among others. Support policies have failed to take into account how fast equipment costs were falling. As a result, some govern-ments have been left with the feeling that sup-port schemes have provided inadequately high income levels to some wind projects, and have reacted against the whole wind sector. Also, as a result of the economic crisis governments have re-examined their support for renewable ener-gies under the assumption that the costs exceed the benefits. This is despite the fact that a com-prehensive social cost/benefit analysis for wind energy was never carried out. As a consequence of these new policies, some countries are likely to fail their 2020 targets.
A formerly low barrier is worsening as a conse-quence of the increased deployment of varia-ble renewables: their integration in the overall electricity system. Whereas electricity systems (including markets) could easily integrate low levels of variable renewables without major changes, the high levels achieved in some Member States is causing new problems to sur-face. For example, variable renewables reduce wholesale market price — which is a positive consequence bringing about reduced electricity costs — but conventional generators then find problems to justify new investment. In another example, this time pertaining to a technical issue, variable renewable generators cannot provide the very necessary system inertia that conventional generation provides.Other barri-ers reported in the 2011 version of this report are still present, although their impact on wind deployment may have varied in intensity. These include:
• the lack of a competitive and European-wide internal electricity market;
• a high — although diminishing — levelised cost of electricity (LCOE) from wind, espe-cially offshore;
• administrative barriers (permit process, etc.), social acceptance (often after individual vis-ual perceptions mixed up with the ‘not in my back yard’ (NIMBY) syndrome) or the lack of trained, experienced staff, in particular for the expected offshore development in the 2014–2020 period.
The problem of high raw material costs has been alleviated recently although it still per-sists, for example, for rare earths. Competition is higher among a group of first-tier manu-facturers, which brings about lower costs. The entry of manufacturers on the O&M market is reducing O&M costs. Balancing and other grid integration costs are quite contained.
JRC13_TMAP_08AP14_P5-NS-Print.indd 13 09/04/2014 16:21:04

14
2013 Technology Map of the European Strategic Energy Technology Plan
Entry barriers still remain for high-voltage cabling manufacture (high-voltage alternat-ing current/high-voltage direct current (HVAC/HVDC) sub-sea cables), with few players able to manufacture cable connections to the onshore grid, and — to a lesser extent — for cable lay-ing and foundation–installation vessels.
1.5 R&D priorities and current initiatives
The focus of European RD&D is changing to more clearly identify the reduction of the CoE expected from RD&D projects. The European Wind Industrial Initiative (EWI) of the SET-Plan propos-es the thematic areas of new turbines and com-ponents for on- and offshore deployment; large turbines, testing facilities; development and testing of new offshore foundations and their mass-manufacturing; grid integration including long-distance HVDCs; and an increased focus on resource assessment and social acceptance. The new EU research and innovation financing tool, Horizon 2020, will apply these priorities as well as, increasingly, Member States do.
Specific research projects already focus on reducing the CoE. These include, for example, improving serviceability of turbines, using stand-ard components more often and simplifying the designs by, for instance, reducing the use of materials. Turbine manufacturers reduced the R&D cost of launching new models, and claim to focus on: advanced blade development to improve wind capture, new controls and software to enhance power reliability, and sophisticated simulation and modelling techniques to opti-mise the placement of turbines on a wind farm site (GE Global Research); quality and reliability improvement, improved carbon fibre technology and new aerofoil and structural blade design to reduce blade weight (Vestas); and blade design and manufacture (Siemens), etc. From these communications it is clear that blades are one of the centre points of industry RD&D nowadays, whereas another focus point is the reduction of cost from multiple small initiatives such as a lower number of bolts, lighter nacelles, etc.
RD&D in advanced materials offers synergies with a number of low-carbon industries (non-exhaustive): fibre-reinforced composites with the nuclear and solar energy industries; coatings with the solar power, biomass and electricity storage industries; special types of concrete with building and nuclear industries; and high-temperature superconductors with the electricity transmission and storage sectors, etc. (EC, 2011b).
1.6 References
ARUP, Review of the generation costs and deploy-ment potential of renewable electricity technolo-gies in the UK, report for UK DECC, 2011.
Bloomberg New Energy Finance (BNEF), Wind turbine price index, issue VIII, 2013a.
Bloomberg New Energy Finance (BNEF), China wind market outlook - Q2 2013, 2013b.
Bloomberg New Energy Finance (BNEF), Wind market outlook - Q2 2013, 2013c.
China Daily, China’s wind sector lost $1.6 billion in 2012, 6 February 2013 (http://bbs.chinadaily.com.cn/thread-825132-1-1.html) accessed 10 July 2013.
Chinese Wind Energy Association (CWEA), 年中国风电装机容量统计 (2012 Statistics), 2013 (http://cwea.org.cn/ in Chinese) accessed 7 January 2014.
U.S. Department of Energy (DOE), 2012 Wind Technologies Market Report, Lawrence Berkeley National Laboratory, 2013.
Ea Energy Analyses, 50% Wind Power in Denmark in 2025 - English Summary, 2007.
Ecotricity, Memorandum submitted to the UK Parliament’s Committee of Climate Change inquiry (WIND 80), 2012.
European Commission (EC), Commission Staff Working Document SWD (2013) 158 final: Technology Assessment, 2013.
European Commission (EC), Communication from the Commission to the Council, the European Parliament, the European Economic and Social Committee and the Committee of the Regions - A European strategic energy technology plan (SET-plan) - ‘Towards a low carbon future’, COM/2007/723, 2007 (http://ec.europa.eu/energy/technology/set_plan/set_plan_en.htm) accessed 7 January 2014.
European Commission (EC), SEC (2011) 130 final - Recent progress in developing renew-able energy sources and technical evaluation of the use of biofuels and other renewable fuels in transport in accordance with Article 3 of Directive 2001/77/EC and Article 4(2) of Directive 2003/30/EC, and accompanying staff working documents, Brussels, 2011a.
European Commission (EC), On-going work of the groups of experts on the SET Plan Materials Initiative, unpublished, 2011b.
JRC13_TMAP_08AP14_P5-NS-Print.indd 14 09/04/2014 16:21:04

15
2013 Technology Map of the European Strategic Energy Technology Plan
European Commission (EC), SEC (2011) 1565 final – Energy Roadmap 2050. Commission Staff Working Paper, Brussels, 2011c.
European Energy Programme for Recovery (EEPR) (http://ec.europa.eu/energy/eepr/pro-jects/) accessed 10 July 2013.
European Environmental Agency (EEA), Europe’s onshore and offshore wind energy potential, 2009.
European Union (EU), On-going work of the Team of the European Wind Industrial Initiative, made up by representatives of the Member States and the European Commission, 2013.
European Wind Energy Association (EWEA), Wind Energy - the Facts. Part I - technology; Part III - economics; Part IV industry and markets; Part V - environmental impact; Part VI scenarios and targets, 2009.
European Wind Energy Association (EWEA), Wind in power: 2012 European statistics, 2013. (Also similar reports from previous years.)
European Wind Technology Platform (TPWind), Wind European Industrial Initiative Team - 2010-2012 Implementation Plan, 2010.
Garrad Hassan (GH) for British Wind Energy Association (BWEA) UK Offshore Wind, Charting the Right Course - Scenarios for offshore capital costs for the next five years, 2009.
GL – Garrad Hassan (GL-GH), Offshore wind operation and maintenance opportunities in Scotland, 2013.
Global Wind Energy Council (GWEC), Global wind report – Annual market update 2012, 2013 (http://www.gwec.net) accessed 7 January 2014.
International Energy Agency (IEA), Energy Technology Perspectives 2012, 2012a.
International Energy Agency (IEA), World Energy Outlook 2012, 2012b.
JRC databases of wind turbines characteristics and wind installations.
Mott MacDonald (MML), Costs of low-carbon generation technologies, Report for the UK’s Committee on Climate Change, 2011.
Navigant Research, World Market Update 2012, 2013.
Navigant-JRC, basic data from (Navigant, 2013) and similar reports of previous years have been updated by the author e.g. to disaggregate figures for REpower turbines from its mother company (Suzlon), and to include smaller European manufacturers, 2011.
Tegen, S., Lantz, E., Hand, M., Maples, B., Smith, A., Schwabe, P., 2011 Cost of Wind Energy Review, National Renewable Energy Laboratory (NREL), Report No. TP-5000-56266, 2013.
JRC13_TMAP_08AP14_P5-NS-Print.indd 15 09/04/2014 16:21:04

16
2.1 Introduction
Amongst all energy resources, solar energy is the most abundant one and compared to the rate at which all energy is used on this planet, the rate at which solar energy is intercepted by the Earth is about 10 000 times higher. There is a whole family of solar technologies that can deliver heat, cooling, electricity, lighting and fuels for a host of applications. The importance of renewable energy, including solar PV electricity, for mitigating climate change was highlighted by a special report of the Intergovernmental Panel for Climate Change (IPCC, 2011).
2.2 Technological state of the art and anticipated developments
PV solar electricity generation technologies exploit the PV effect, where electron–hole pairs generated in semiconductors (e.g. Si, GaAs, CuInSe2, CdTe, etc.) are spatially sepa-rated by an internal electric field. This leads to a separated negative charge on one side of the cell and a positive charge on the oth-er side, and the resulting charge separation creates a voltage (see Figure 2.1). When the cell is illuminated and the two sides are con-nected to a load, a current flows from one side of the device via the load to the other side of the cell. The conversion efficiency of a solar cell is defined as the ratio of output power from the solar cell per unit area (W/cm2) to the incident solar radiation.
Various materials can be used to form a PV cell and a first distinction is whether the material is based on being inorganic or organic. A second distinction in the inorganic cells is silicon (Si) or non-Si material, and the last distinction is wafer-based cells or thin-film cells. Wafer-based Si is divided into two different types: monocrystalline and multicrystalline (some-times called polycrystalline).
In 2012, more than 85 % of new PV systems were based on crystalline Si technology that is highly matured for a wide range of applications. In June 2013, the worldwide average price of a residential system without tax was EUR 1.54 per watt-peak (Wp) (USD 1.97/Wp) (PVinsight, 2013). Taking this price and adding a surcharge of EUR 0.16/Wp for fees, permits, insurance etc., an installed PV system costs EUR 1 700/kWp with-out financing and VAT. Engineering, procure-ment and construction (EPC) quotes for large systems are already much lower and turnkey system prices as low as EUR 1/Wp (USD 1.3/Wp) have been reported for projects to be finished in 2013 (BNEF, 2012). It has to be stressed that the current market prices are strongly influenced by the different national support schemes and only partially reflect the true costs of the systems.
Efficiency of typical commercial flat-plate modules and of typical commercial concentra-tor modules is up to 15 % and 25 %, respec-tively. The typical system energy payback time depends on the location of the installa-tion. In southern Europe, this is approximately 1 to 2 years and increases at higher latitudes (Fthenakis et al., 2008). The performance of PV modules is already guaranteed by the manu-facturers for up to 25 years, but the actual lifetime of the modules is well over 30 years (Osterwald & McMahon, 2009). Finally, the LCOE for crystalline Si PV systems based on the
Figure 2.1: Generic schematic cross-
section of the operation of an illuminated solar cell
Source: IPCC, 2011, Chap. 3, Fig. 3.5.
2013 Technology Map of the European Strategic Energy Technology Plan
2. Solar photovoltaic electricity generation
JRC13_TMAP_08AP14_P5-NS-Print.indd 16 09/04/2014 16:21:05

17
2013 Technology Map of the European Strategic Energy Technology Plan
actual investment costs in the second quarter (Q2) of 2013 is about EUR 0.137 per kilowatt-hour (kWh), ranging between EUR 0.079 and 0.439/kWh depending on the location of the system (BNEF, 2013).
Crystalline Si-based systems are expected to remain the dominant PV technology in the short-to-medium term. In the medium term, PV systems will become integral parts of new and retrofitted buildings. In the long term, a diversification of PV technologies according to market needs is anticipated. The cost of a typical turn-key system is expected to converge from the EUR 2.0–5.0/Wp range in 2012 to less than EUR 1.5/Wp in 2015, and reach EUR 1/Wp in 2030 and EUR 0.5/Wp in the longer term. Simultaneously, module efficiencies will also increase. Flat-panel module efficiencies will reach 20 % in 2015 and up to 40 % in the long term, while concentrator module efficiencies will reach 30 % and 60 % in 2015 and in the long term, respectively. It is expected that if these technology developments are realised, the cost of electricity (COE) from PV systems will be comparable to the retail price of electricity in 2015 and of the wholesale price of electricity in 2030.
Both crystalline-Si solar cells and the ‘tradi-tional’ thin-film technologies (a-Si:H and its variations based on protocrystalline or micro-crystalline Si, as well as polycrystalline com-pound semiconductors) have developed their roadmaps aiming at further cost reductions. These roadmaps are based on growing industri-al experience within these domains, providing a solid database for the quantification of potential cost reductions. The Strategic Research Agenda (SRA) of the European Photovoltaic Platform is one example that describes the research need-ed for these set of PV technologies in detail, but that also points out the opportunities related to beyond-evolutionary technology developments (European Photovoltaic Platform, 2007). These technologies can either be based on low-cost approaches related to extremely low (expen-sive) material consumption or approaches that allow solar cell devices to exhibit efficiencies above their traditional limits. In fact, the goal to develop crystalline Si and thin-film solar cell technologies with a cost < EUR 0.5/Wp relies heavily on disruptive breakthroughs in the field of novel technologies. PV research should therefore be sufficiently open to developments presently taking place in materials and device science (nanomaterials, self-assembly, nano-technology, plastic electronics) to detect these opportunities at an early stage.
The 2007 SRA had deliberately chosen the terms ‘emerging technologies’ and ‘novel technologies’ to discriminate between the relative maturity of
different approaches. The category ‘Emerging’ was used for those technologies that have passed the ‘proof-of-concept’ phase or can be considered as longer term options for the two established solar cell technologies (i.e. crystalline Si and thin-film solar cells). The term ‘novel’ was used for developments and ideas that can lead to potentially disruptive technologies, but where there is not yet clarity on practically achievable conversion efficiencies or cost structure.
Within the emerging PV technologies, a distinc-tion was made between three sub-categories:
• advanced inorganic thin-film technologies,
• organic solar cells,
• thermo-photovoltaic (TPV) cells and systems.
Most of the ‘novel’ approaches can be cat-egorised as high-efficiency approaches. One can make an essential distinction between approaches that are modifying and tailoring the properties of the active layer to match it better to the solar spectrum and approaches that modify the incoming solar spectrum and are applied at the periphery of the active device (without fundamentally modifying the active layer properties).
In both cases, nanotechnology and nano-materials are expected to provide the necessary toolbox to bring about these effects. Nanotechnology allows introducing features with reduced dimensionality (quantum wells – quantum wires – quantum dots) in the active layer. One can distinguish three basic ideas behind the use of structures with reduced dimensionality within the active layer of a PV device. The first approach aims at decoupling the basic relation between output current and output voltage of the device. By introducing quantum wells or quantum dots consisting of a low-bandgap semiconductor within a host semiconductor with wider bandgap, the cur-rent will be increased in principal while retain-ing (part of) the higher output voltage of the host semiconductor. A second approach aims at using the quantum confinement effect to obtain a material with a higher bandgap. The third approach aims at the collection of excited carriers before they thermalise to the bottom of the concerned energy band. The reduced dimensionality of the quantum dot material tends to reduce the allowable phonon modes by which this thermalisation process takes place and increases the probability of harvest-ing the full energy of the excited carrier. Several groups in Europe have built up a strong position in the growth, characterisation and application of these nanostructures in various structures (III-V, Si, Ge) and also, on the conceptual level,
JRC13_TMAP_08AP14_P5-NS-Print.indd 17 09/04/2014 16:21:05

18
2013 Technology Map of the European Strategic Energy Technology Plan
ground-breaking R&D is being performed (e.g. the metallic, intermediate-band solar cell).
Tailoring the incoming solar spectrum to the active semiconductor layer relies on up- and down-conversion layers and plasmonic effects. Again, nanotechnology might play an important role in the achievement of the required spectral modification. Surface plasmons have been pro-posed as a means to increase the photoconver-sion efficiency in solar cells by shifting energy in the incoming spectrum towards the wave-length region where the collection efficiency is maximum or by increasing the absorbance by enhancing the local field intensity. This applica-tion of such effects in PVs is definitely still at a very early stage, but the fact that these effects can be tailored to shift the limits of existing solar cell technologies by merely introducing modifi-cations outside the active layer represents an appreciable asset of these approaches, which would reduce their time-to-market considerably.
It is evident that both modifications to the active layer and application of the peripheral structures could be combined eventually to obtain the highest beneficial effects.
Research in PV devices over the last few years has seen major advances in efficiency, reliabili-ty and reproducibility, but it is clear that there is the potential for further progress, both in terms of existing device structures and in relation to new device topologies. Key to those advances is an understanding of material properties and fabrication processes. Research is required for specific aspects of device design and fabrica-tion, together with consideration of the new production equipment necessary to transfer these results into the fabrication processes. In parallel, advances in the system architecture and operation will allow the increases in cell efficiency to be reflected in the energy output of the system. Details of the needed research actions are described in the Implementation Plan for the SRA of the European Photovoltaic Technology Platform (European PV Technology Platform, 2009).
2.3 Market and industry status and potential
Since 1990, annual global cell production has increased by three orders of magnitude from 46 MW to about 38 GW in 2012 (Jäger-Waldau, 2012a, 2012b). This corresponds to a compound annual growth rate (CAGR) of about 36 % over the last 23 years. Statistically docu-mented cumulative installations worldwide accounted for 100 GW in 2012. The interest-ing fact is, however, that cumulative produc-tion amounts to 125 GW over the same time period. Even if we do not account for the roughly
8–10 GW difference between the reported pro-duction and installations in 2012, there is a con-siderable 15 GW capacity of solar modules that are statistically not accounted for. Parts of it might be in consumer applications, which do not contribute significantly to power generation, but the overwhelming part is probably used in stand-alone applications for communication purposes, cathodic protection, water pumping, and street, traffic and garden lights, among others.
The total installed capacity of PV systems in the EU in 2012 was 68.8 GWp, representing approxi-mately 8.5 % of the total EU electrical genera-tion capacity (Jäger-Waldau, 2012a; Systèmes Solaires, 2012). The electricity generated by PV systems that year was approximately 65 TWh. The highest shares were reported for Italy with 18.2 TWh and Germany 28.5 TWh, which cor-respond to 5.6 and 5.7 % of final electricity consumption, respectively (TERNA, 2013; Arbeitsgemeinschaft Energiebilanzen, 2012). The annual installation of PV systems in 2012 in the EU was about 17.6 GWp and will like-ly remain in the first place of the ranking of newly built electricity generation capacity after it moved to this position in 2011. Europe is cur-rently the largest market for PV systems with about 58 % of the annual worldwide installa-tions in 2012. In terms of solar cell production, Europe has slipped behind China and Taiwan to third place, capturing about 6.5 % of the world market; but it is still a world leader in PV tech-nology development.
Based on information provided by the industry, the Energy (R)evolution study has estimated that, on average, 18 full-time equivalent (FTE) jobs are created for each MW of solar power modules produced and installed (Greenpeace/EREC, 2012). This is a significant reduction from the figures (about 45 FTE) a few years ago, which reflects the increased industrialisation of the PV industry. Based on this data as well as Bloomberg New Energy Finance (BNEF) info, employment figures in the PV sector for 2011 are estimated at around 750 000 worldwide and about 275 000 in the EU (BNEF, 2012).
The PV sector has expanded annually in Europe with high growth rates, of the order of more than 40 % on average since 2000. In 2009, the European Photovoltaic Industry Association (EPIA) published its Vision for 2020 to reach up to 12 % of all European electricity (EPIA, 2009). However, to realise this vision and reach an installed PV system capacity of up to 390 GWp, the industry not only has to continue to grow at the same pace for another 10 years but a para-digm shift and major regulatory changes and upgrades of the existing electricity grid infra-structure are necessary.
JRC13_TMAP_08AP14_P5-NS-Print.indd 18 09/04/2014 16:21:06

19
2013 Technology Map of the European Strategic Energy Technology Plan
In some countries, like Germany or Italy, the installed PV capacity already exceeds 30 and 20 % of the installed thermal power plant capacities, respectively. Together with the respective wind capacities, wind and solar together will exceed 60 and 30 %, respective-ly. To effectively handle these high shares of renewable electricity, new technical and regu-latory solutions have to be implemented in order not to run into the problem of curtailing large parts of this electricity. Besides conven-tional pumped storage options, electrical bat-teries are becoming increasingly interesting, especially for small-scale storage solutions in the low-voltage distribution grid. As indicated in a business analysis for electric vehicles by McKinsey (2012), the current price of lithium-ion (Li-ion) batteries in the range of EUR 385–460/kWh (USD 500–600/kWh) storage capacity could fall to EUR 155/kWh (USD 200/kWh) sto-rage capacity in 2020. Li-ion batteries have an average of 5 000 cycles, which corre-sponds to a net kWh price for electrical stor-age systems of EUR 0.115–0.138/kWh (USD 0.15–0.18/kWh now, and should fall to EUR 0.046/kWh (USD 0.06/kWh) in 2020. With LCOE from PV systems reaching EUR 0.11–0.13/kWh
(USD 0.14–0.17/kWh) in Q4 2012, the additional storage cost already makes sense in markets with high peak costs in the evening, where only a shift of a few hours is required.
Scenarios for the worldwide deployment of PV technology vary significantly between the 2010 IEA PV Technology Roadmap scenario and the Greenpeace/European Renewable Energy Council (EREC) scenarios (IEA, 2010; Greenpeace/EREC, 2012). The IEA scenarios range between 210 GW (298 TWh) by 2020 and 870 GW (1 247 TWh) by 2030, and the Greenpeace scenarios vary between 124 GW (158 TWh) by 2020 and 234 GW (341 TWh) by 2030 for the reference scenario, and 674 GW (878 TWh) by 2020 and 1 764 GW (2 674 TWh) by 2030 for the advanced scenario.
2.4 Barriers to large-scale deployment
The main barriers to large-scale deployment of PV systems are on the one hand of adminis-trative and regulatory nature and are mainly connected to the access to the grid, and on the other the access to project financing. The way in which LCOE is calculated places a disadvantage
Figure 2.2: Increase of photovoltaic electricity generation capacity in the European Union and 2020 NREAP target
Source: JRC data.
Cum
ulat
ive
Phot
ovol
taic
Inst
alla
tion
s [M
Wp] Rest of EU
GreeceUnited KingdomCzech RepublicBelgiumFranceSpain Italy Germany
90 000
80 000
70 000
60 000
50 000
40 000
30 000
20 000
10 000
2005 2006 2007 2008 2009 2010 2011 2012 NREAP0
The market conditions for PV differ substan-tially from country to country. This is due to different energy policies and public support programmes for renewable energies and espe-cially PV, as well as the varying grades of libe-ralisation of domestic electricity markets. The legal framework for the overall increase of RES was set with the Directive 2009/28/EC and, in their National Renewable Energy Action Plans (NREAPs), 26 Member States have set specific PV solar energy targets, adding up to 84.5 GW in 2020 (Szabo et al., 2011) (see Figure 2.2).
At the end of 2012, the cumulative installed PV capacity in the EU has exceeded 68 GWp, or 80 % of the capacity pledged in the NREAPs for 2020 (see Figure 2.2). The rapid cost reduction of PV systems has accelerated the installation of PV systems in new markets and conse-quently 14 out of the EU-27 Member States have already exceeded their 2020 targets. This development shows that the targets set in the NREAPs should be seen as the guaranteed mini-mum and not the overall goal.
JRC13_TMAP_08AP14_P5-NS-Print.indd 19 09/04/2014 16:21:06

20
2013 Technology Map of the European Strategic Energy Technology Plan
on technologies, which have higher upfront investment costs and no fuel costs, as the fuel cost is discounted over time and no price risk is included. This leads to a still higher COE from PV systems compared to other electricity gen-eration sources, even though the difference has dramatically decreased over the last decade. As no uncertain and volatile fuel cost prices with the corresponding price risks are associated with electricity generation from PV systems and the investment costs are continuously decreas-ing, PV technology becomes cost competitive in more and more markets. Techno-economic bar-riers to the expansion of the sector include the development of advanced manufacturing sys-tems, further optimisation along the different production value chains and building integra-tion of solar modules. Other barriers include the lack of skilled professionals, the usage of pre-cious raw materials (e.g. silver), the introduction of new materials, regulatory and administrative barriers such as access to grid and long waiting times for connection, and finally, lack of public awareness including construction experts.
It is noted that the issue of Si availability has been resolved. The shortage of Si in the past has been a consequence of the lack of develop-ment of new Si purification facilities, as well as of high rates of market growth.
The maintenance of feed-in tariffs (FITs) with built-in reduction mechanisms reflecting the technology progress and market growth is cru-cial for the sector for the next decade. Only a reliable framework providing a stable invest-ment environment will allow the industry to grow and unlock the potential of this technol-ogy. Furthermore, a framework that will allow the European PV industry to compete with the rapidly increasing manufacturing capacity in Asia will help the expansion of the sector, which will further benefit the deployment of PV sys-tems in Europe.
In some countries, like Germany or Italy, the installed PV capacity already exceeds 30 and 20 % of the installed thermal power plant capacities, respectively. Together with the respective wind capacities, wind and solar together will exceed 60 and 30 %, respective-ly. To effectively handle these high shares of renewable electricity, new technical and regula-tory solutions have to be implemented in order not to run into the problem of curtailing large parts of this electricity.
2.5 RD&D priorities and current initiatives
Research is vital for increasing the perfor-mance of PV systems and accelerating the development of the technology. The research priorities are documented very well in the
2nd edition of the SRA of the European PV Technology Platform (European PV Technology Platform, 2011). Furthermore, the develop-ment of a healthy and growing market is essential for the development of PV technolo-gies as this will stimulate competition within the industry, which in turn will trigger further innovation. Research push tools need, however, to be combined with market pull mechanisms for the expansion of production capacity and the consequent development of economies of scale will lead to cost reductions.
The Solar Europe Industry Initiative (SEII) describes the strategic RD&D components of ‘SET for 2020’, which are essential to enable rapid, large-scale deployment of PV at mini-mum cost and maximum benefit for society (EPIA, 2009). Besides the efforts of the PV sector, the success of other industry initiatives under the SET-Plan as well as the development of other technologies (electricity storage, elec-trical vehicles, demand side management, etc.) are essential for the success of SEII.
SEII will achieve three strategic objectives:
• bring PV to cost competitiveness in all mar-ket segments (residential, commercial and industrial) by 2020 (cost reduction);
• establish the conditions allowing high pen-etration of distributed PV electricity within the European electricity system (integration);
• facilitate the implementation of large-scale demonstration and deployment projects with a high added value for the European PV sec-tor and society as a whole.
In addition to this, SEII creates the necessary basis for development beyond 2020 and the 2020 targets, supporting the European industry to also play a leading role in the longer term.
The PV industry is not in competition with other RES-based electricity generation industries. The ultimate goal of the community that supports PV systems is to make the technology com-petitive with all sources of electricity in the short term and then allow all technologies to compete for their fair share in electricity gene-ration. Moreover, the PV sector has the same concerns regarding electricity generation and transmission as the other electricity generation from RES (RES-E) technologies, such as access to grid, financial support and approval proce-dures. Further synergies should be pursued with the building and construction sector for raising awareness and facilitating the integra-tion of PV systems in new and retrofitted build-ings. Shared technology developments could be envisaged with the solar heating and cooling as
JRC13_TMAP_08AP14_P5-NS-Print.indd 20 09/04/2014 16:21:06

21
2013 Technology Map of the European Strategic Energy Technology Plan
well as concentrated solar power (CSP) sectors with regard to materials and energy storage devices. Last but not least, it should be men-tioned that materials science, nanotechnol-ogy and organic/inorganic chemistry research efforts are needed to prepare for future con-cepts and system solutions in order to avoid roadblocks in the future.
2.6 References
Arbeitsgemeinschaft Energiebilanzen e.V., Energieverbrauch in Deutschland Daten für das 1. bis 4. Quartal 2012, 19 Dezember 2012.
Bloomberg New Energy Finance (BNEF), PV Market Outlook - Q3 2012, 2012.
Bloomberg New Energy Finance (BNEF), Energy Research Note. Levelised cost of electricity update - Q2 2013, 2013.
European Photovoltaic Industry Association (EPIA), SET for 2020. Solar Photovoltaic Electricity: A Mainstream power source in Europe by 2020, 2009.
European Photovoltaic Technology Platform, A Strategic Research Agenda for Photovoltaic Solar Energy Technology, 2007. ISBN 978-92-79-05523-2
European Photovoltaic Technology Platform, Today’s actions for tomorrow’s PV technology, 2009. ISBN 978-92-79-12391-7
European Photovoltaic Technology Platform, A Strategic Research Agenda for Photovoltaic Solar Energy Technology, 2nd Edition, 2011. ISBN 978-92-79-20172-1
Fthenakis, V. M., Kim, H. C., Alsema, E., ‘Emissions from Photovoltaic Life Cycles’, Environmental Science & Technology, Vol. 42, No 6, 2008, pp. 2168 2174.
Greenpeace International and European Renewable Energy Council (EREC), Energy (R)evolution, 2012. ISBN 978-90-73361-90-4
Intergovernmental Panel for Climate Change (IPCC), Special Report on Renewable Energy Sources and Climate Change Mitigation (O. Edenhofer, R. Pichs-Madruga, Y. Sokona, K. Seyboth, P. Matschoss, S. Kadner, T. Zwickel, P. Eickemeier, G. Hansen, S. Schlömer, C. V. Stechow (eds)), Cambridge University Press, 2011 (http://srren.ipcc-wg3.de/report/srren-figures-chapter-03) accessed 7 January 2014.
Intergovernmental Panel for Climate Change (IPCC), Special Report on Renewable Energy Sources and Climate Change Mitigation, 2011.
International Energy Agency (IEA), PV Technology Roadmap, 2010.
Jäger-Waldau, A., ‘The future of PV’, International Sustainable Energy Review, Vol. 6, Issue 4, 2012a, pp. 10–13.
Jäger-Waldau, A., PV Status Report 2012, Office for Official Publications of the European Union, 2012b. EUR 25749 EN, ISBN 978-92-79-26073-5
McKinsey Quarterly, Battery technology charges ahead, 2012.
Osterwald, C. R., McMahon, T. J., ‘History of Accelerated and Qualification Testing of Terrestrial Photovoltaic Modules: A Literature Review’, Prog. Photovolt: Res. Appl. 2009, Vol. 17, pp. 11-33.
PVinsight, 21 June 2013 (http://pvinsights.com/) accessed 7 January 2014.
Systèmes Solaires, le journal du photovoltaique no 9 – 2013, Photovoltaic Energy Barometer, 2013. ISSN 0295-5873
Szabo, M., Jäger-Waldau, A., Monforti-Ferrario, F., Scarlat, N., Bloem, H., Quicheron, M., Huld, T., Ossenbrink, H., Technical Assessment of the Renewable Energy Action Plans, JRC Reference Report, Publications Office of the European Union, 2011. ISBN 978-92-21049-5 (online)
TERNA Press Release, 9 January 2013.
JRC13_TMAP_08AP14_P5-NS-Print.indd 21 09/04/2014 16:21:06

22
3. Concentrated solar power generation
3.1 Introduction
Solar energy is the most abundant energy resource and compared to the rate at which all energy is used on this planet, the rate at which solar energy is intercepted by the Earth is about 10 000 times higher. There is a whole family of solar technologies that can deliver heat, cooling, electricity, lighting and fuels for a host of applications. The importance of renewable energy, including solar, for mitigating climate change was highlighted by a special report of the Intergovernmental Panel for Climate Change (IPCC, 2011).
3.2 Technological state of the art and anticipated developmentws
Concentrated solar thermal power technology (CSP) produces electricity by concentrating the sun-light to heat a liquid, solid or gas that is then used in a downstream process for electricity generation. A CSP plant consists, schematically, of a solar con-centrator system comprising a receiver and col-lector to produce heat and a power block (in most cases a Rankine cycle). The majority of the world’s electricity today — whether generated by coal, gas, nuclear, oil or biomass — comes from the creation of a hot fluid. CSP simply provides an alternative heat source. One of the appealing elements of this technology is that it builds on much of the current know-how on power generation in the world today. In addition, there is further potential to improve as improvements are made in solar concentrator technology, but also as advances continue to be made in steam and gas turbine cycles.
Between 1985 and 1991, 354 MW of solar trough technology was deployed in southern California. These plants are still in commercial operation today and have demonstrated the potential for long-term viability of CSP.
For large-scale CSP plants, the most common form of concentration is by reflection, in contrast to refraction with lenses. Concentration is either to a line (linear focus), as in trough or linear Fresnel systems, or to a point (point focus), as in central receiver or dish systems. The major features of each type of CSP system are described below.
Trough concentrators
Long rows of parabolic reflectors concentrate the sunlight 70 to 100 times onto a heat-collection element (HCE) placed along the reflector’s focal line. The Sun is tracked around one axis, typically oriented north–south. The HCE consists of an inner steel pipe, coated with a solar-selective surface and an outer glass tube, with a vacuum in between. A heat-transfer fluid — in general oil — is circulated through the steel pipe and heated to around 390 °C. The hot fluid from numerous rows of troughs is passed through a heat exchanger to generate steam for a conventional steam tur-bine generator. Land requirements are of the order of 5 acres/MW electricity.
Alternative heat-transfer fluids such as steam and molten salt are being studied to enable higher temperatures and overall efficiencies. The use of molten salt in both the solar field and thermal energy storage (TES) system eliminates the need for the expensive heat exchangers. It also allows the solar field to be operated at higher temperatures than current heat-transfer fluids allow. This combination can lead to a substantial reduction in the cost of the TES system. However, molten salts freeze at relatively high temperatures, in the range of 120–220 °C, and this means that special care must be taken to ensure that the salt does not freeze in the solar field piping during the night.
Figure 3.1: Trough concentrators
Source: IEA/Technology Roadmap: Concentrating Solar Power, 2010; p. 11.
2013 Technology Map of the European Strategic Energy Technology Plan
JRC13_TMAP_08AP14_P5-NS-Print.indd 22 09/04/2014 16:21:08

23
2013 Technology Map of the European Strategic Energy Technology Plan
Linear Fresnel reflectors
The attraction of linear Fresnel is that installed costs on a m2 basis can be lower than troughs, and the receiver is fixed. However, the annual optical performance is lower than a trough reflector.
Central receivers (Solar towers)
The thermodynamic cycles used for electricity generation are more efficient at higher tem-peratures. Point-focus collectors such as cen-tral receivers are able to generate much higher temperatures than troughs and linear Fresnel reflectors. This technology uses an array of mir-rors (heliostats), with each mirror tracking the Sun and reflecting its light onto a fixed receiver on top of a tower, where temperatures of more than 1 000 °C can be reached. Central receivers can generate temperatures similar to those of advanced steam turbines and can be used to power gas turbine (Brayton) cycles. Trough con-centrators and solar towers also require rela-tively flat land (i.e. less than a 1 % slope for one solar field is desirable).
Dish systems
The dish is an ideal optical reflector and there-fore suitable for applications requiring high temperatures. Dish reflectors are paraboloid-shaped and concentrate the sunlight onto a receiver mounted at the focal point, with the receiver moving with the dish. Dishes have been used to power Stirling engines at 900 °C, as well as to generate steam. Operational experience with dish/Stirling engine systems exist and commercial rollout is planned. Up to now, the capacity of each Stirling engine is of the order of 10 to 15 kilowatt electric (kWe). The largest solar dishes have a 400 m2 aper-ture and are used in research facilities. The Australian National University is presently building a solar dish with a 485 m2 aperture.
Thermal storage
An important attribute of CSP is the ability to integrate thermal storage. To date, this has been primarily for operational purposes, provi-ding 30 minutes to 1 hour of full-load storage. This eases the impact of thermal transients such as clouds on the plant, and of electrical transients to the grid. Plants are now being designed for 6 to 7.5 hours of full-load storage, which is enough to allow operation well into the evening when peak demand can occur and tar-iffs are high.
In thermal storage, the heat from the solar field is stored prior to reaching the turbine. Storage media include molten salt (presently
Figure 3.2: Linear Fresnel reflectors
Source: IEA/Technology Roadmap: Concentrating Solar Power, 2010; p. 12.
Figure 3.3: Central receivers (solar towers)
Source: IEA/Technology Roadmap: Concentrating Solar Power, 2010; p. 12.
Figure 3.4:CDish systems
Source: IEA/Technology Roadmap: Concentrating Solar Power, 2010; p. 12.
comprising separate hot and cold tanks), steam accumulators (for short-term storage only), solid ceramic particles and high-temperature concrete. The heat can then be drawn from the storage to generate steam for a turbine as and when needed.
JRC13_TMAP_08AP14_P5-NS-Print.indd 23 09/04/2014 16:21:09

24
2013 Technology Map of the European Strategic Energy Technology Plan
Availability of water is an issue that has to be addressed for CSP development as the parabolic trough systems and central tower systems require cooling water. Wet cooling requires about 2.8 m3 /MWh, which is comparable to other thermal power stations (Stoddard et al., 2006). Air cooling and wet/dry hybrid cool-ing systems offer highly viable alternatives to wet cooling and can eliminate up to 90 % of the water usage (U.S. DOE, 2009). The penalty in electricity costs for steam-generating CSP plants range between 2 and 10 % depending on the actual geographical plant location, electricity pricing and effective water costs. The loss of a steam plant with state-of-the-art dry-cooled condenser can be as high as 25 % on very hot summer days in the US south-west. The penalty for linear Fresnel designs has not yet been ana-lysed, but it is expected to be somewhat higher than for troughs because of the lower operating temperature. On the other hand, power towers should have a lower cost penalty because of their higher operating temperature.
In Q2 2013, CapEx for tower and heliostat sys-tems with storage varied between EUR 4 600 and 7 000/kWe, resulting in an LCOE for the central scenario of EUR 0.15/kWh (BNEF, 2013). During the same period, CapEx for parabolic trough systems without storage had a range of EUR 2 150–5 900/kWe, resulting in a cen-tral scenario LCOE of EUR 0.22/kWh. Worldwide LCOE range from as low as EUR 0.085/kWh to as high as EUR 0.41/kWh.
3.3 Market and industry status and potential
Between 1985 and 1991, the Solar Energy Generating Systems (SEGS) I through IX (para-bolic trough), with a total capacity of 354 MW5, were built in the US Mohave Desert. After more than 15 years, the first new major capacities of concentrated solar thermal electricity plants came online with Nevada One (64 MW, US) and the PS 10 plant (11 MW, Spain) in the first half of 2007.
The most mature, large-scale technology is the parabolic trough/heat-transfer medium system. Central receiving systems (solar tower) are the second main family of CSP technology. Parabolic dish engines or turbines (e.g. using a Stirling or a small gas turbine) are modular systems of relatively small size and are primarily designed for decentralised power supply. The lifetime of CSP technologies is about 20 to 30 years (Stoddard et al., 2006). The solar-only CF without thermal storage of a CSP
5 The capacity figures given are MWe (electric) not
MWth (thermal).
plant is about 1 800 to 3 000 hours per year. The level of dispatching from CSP technologies can be augmented with thermal storage or with hybridised or combined-cycle schemes with natural gas. With storage, yearly operation could theoretically be increased to 8 760 hours, but this is not economically sensible. Systems with thermal storage generally achieve CFs between 4 000 and 5 200 hours (Stoddard et al., 2006). An experimental facility with 17 MW capacity and molten salt storage that should allow almost 6 500 operation hours per year is currently being built in Spain (Torre Solar). Several integrated solar combined cycle projects using solar and natural gas were completed in 2010 and 2011 (Jäger-Waldau et al., 2013).
At the end of beginning of May 2013, CSP plants with a cumulative capacity of about 2.05 GW were in commercial operation in Spain, repre-senting about 69 % of the worldwide capacity of 2.95 GW. Together with those plants under construction and those already registered for the FIT, this should bring Spain’s CSP capacity to about 2.3 GW by the end of 2013. Projects that have applied for interconnection have, all together, a combined total capacity of 15 GW. This is in line with the SEII, which aims at a cumulative installed CSP capacity of 30 GW in Europe, out of which 19 GW would be in Spain (ESTELA, 2009). In the US, about 1.2 GW of CSP are currently under construction and another 4.2 GW in the development stage (SEIA, 2013). More than 100 projects are currently in the planning phase, mainly in India, North Africa, Spain and the US.
The economic potential of CSP electricity in Europe (EU-27) is estimated to be around 1 500 TWh/year, mainly in Mediterranean countries (direct normal irradiance (DNI) > 2 000 kWh/m2/year) (DLR, 2005). Based on today’s tech-nology, the installed capacities forecasted in the EU-27 under the SEII are 830 MW by 2010, 30 GW by 2020 and 60 GW by 2030 (ESTELA, 2009). This represents respectively, up to 2030, 0.08 %, 2.4 % and 4.3 % of projected EU gross electricity consumption. These penetration tar-gets do not account for imports of CSP electricity. According to the DESERTEC scenario, which assumes that a grid infrastructure will be built to connect Europe with North African Countries, CSP electricity imports of 60 TWh in 2020 and 230 TWh in 2030 could be realised (DESERTEC, 2009). The penetration of CSP electricity for 2030 under these scenarios would be 10 % of the EU gross electricity consumption.
JRC13_TMAP_08AP14_P5-NS-Print.indd 24 09/04/2014 16:21:09

25
2013 Technology Map of the European Strategic Energy Technology Plan
In December 2009, the World Bank’s (WB) Clean Technology Fund (CTF) Trust Fund Committee endorsed a critical technology development (CTD) resource envelope for projects and pro-grammes in five countries in the Middle East and North Africa (MENA) to implement CSP (The World Bank, 2009). The budget envelope proposes CTF co-financing of EUR 577 million (USD 750 million), which should mobilise an additional EUR 3.73 billion (USD 4.85 billion) from other sources and help to install more than 1.1 GW of CSP by 2020.
As a follow up to this initiative, the WB commis-sioned and published a report in early 2011 on the Local Manufacturing Potential in the MENA region (The World Bank, 2011). The report con-cludes: ‘MENA could become home to a new industry with great potential in a region with considerable solar energy resources. If the CSP market increases rapidly in the next few years, the region could benefit from significant job and wealth creation, as well as from enough power supply to satisfy the growing demand, while the world’s renewable energy sector would benefit from increased competition and lower costs in CSP equipment manufacturing.’
Scenarios for the worldwide deployment of CSP technology vary significantly between the 2010 IEA CSP Roadmap and the Greenpeace/EREC Scenarios (IEA, 2010; Greenpeace, EREC and GWEC, 2012). The IEA scenarios range between 148 GW installed capacity or 340 TWh in 2020, 337 GW and 970 TWh in 2030, and 1 089 GW and 4 050 TWh in 2050. The European share in 2050 would be about 2.5 %. On the other hand, the Greenpeace scenarios vary between 11 GW (35 TWh) by 2020, 24 GW (81 TWh) by 2030 and 62 GW (222 TWh) by 2050 for the reference scenario, and 166 GW (466 TWh) by 2020, 714 GW (2 672 TWh) by 2030 and 2 054 GW (9 348 TWh) by 2050 for the advanced scenario.
Within just a few years, the CSP industry has grown from negligible activity to over 4 GWe, either commissioned or under construction. More than 10 different companies are now active in building or preparing for commercial-scale plants, compared to perhaps only 2 or 3 that were in a position to develop and build a commercial-scale plant a few years ago. These companies range from large organisations with international construction and project man-agement expertise that have acquired rights to specific technologies, to start-ups based on their own technology developed in-house. In addition, major renewable energy independent power producers such as Acciona and utilities such as Iberdrola and Florida Power & Light (FPL) are making plays through various mecha-nisms for a role in the market.
The supply chain is not limited by raw materials because the majority of required materials are glass, steel/aluminium and concrete. At pres-ent, evacuated tubes for trough plants can be produced at a sufficient rate to service several hundred MW/year. However, expanded capacity can be introduced fairly readily through new factories with an 18-month lead time.
3.4 Barriers to large-scale deployment
The cost competitiveness of CSP plants is a key barrier. There is a strong need for developing long-term policy frameworks to foster and secure CSP technology developments and investments worldwide. On the technology front, component improvements and scaling-up of first-generation technologies are necessary for cost reduction. The demonstration of new technologies at system level and relevant scale is also crucial for CSP cost competitiveness in the long term. However, these R&D and innovation activities are not covered by industrial and private funds. As a result, there is a current shortage of equity capacity. This situation is also relevant for today’s technology. The neces-sary work on critical elements for first-generation technologies, such as adjustment of steam tur-bine to CSP specification, is not being performed today. Reaching a critical mass among players is an essential ingredient. Yet, a structuring of the CSP industry as well as an expertise broadening is ongoing, but it is still in its infancy. Finally, the development of specific enabling technologies (e.g. grid infrastructure for importing CSP energy from neighbouring countries) is an important focus for sector developments.
3.5 RD&D priorities and current initiatives
The implementation of long-term frameworks with support schemes is critical to accelerate the deployment of CSP technologies. Fostering CSP promotion worldwide is important to build a global market. Joint developments with North Africa would allow the EU to benefit from higher solar resource levels. It is important to open up the European market for the import of solar electricity from North Africa. A critical element of this action is the establishment of a pan-Mediterranean grid infrastructure. On the technology front, increased R&D efforts and strategic alignment of national and EU programmes are necessary to realise all the potential embedded in technology innovation. Demonstrating next-generation CSP technologies is critical to address medium- to long-term com-petitiveness, but also to attract investors. Due to the private financing dilemma, innovative funding schemes will have to be developed.
JRC13_TMAP_08AP14_P5-NS-Print.indd 25 09/04/2014 16:21:10

26
2013 Technology Map of the European Strategic Energy Technology Plan
The SEII Implementation Plan describes the stra-tegic RD&D components to boost innovation and reach competitive levels in the energy market (ESTELA, 2010). As a first step, during the first phase of the Implementing Plan, 2010–2012, the European industry considers that top priority should be given to innovation objectives:
• reduction of generation, O&M costs,
• improvement of operational flexibility and energy dispatchability.
Synergies with other sectors
Hydrogen (H2) production is a potential indus-trial field for synergies with CSP technologies. Although these concepts are at an R&D phase, current developments on the heliostat or other heat-transfer components will certainly benefit this field. In the short term, shared develop-ments can be envisaged with concentrated PVs as their concentrators respond to the same kind of usage. Other areas of developments besides electricity production are district cooling and water desalinisation.
3.6 References
Bloomberg New Energy Finance (BNEF), Energy Research Note. Levelised cost of electricity update - Q2 2013, 2013.
DESERTEC Foundation, Clean Power from Deserts, DESERTEC White Book, 4th edition, 2009 (http://www.desertec.org/fileadmin/down-loads/DESERTEC-WhiteBook_en_small.pdf) accessed 7 January 2014.
European Solar Thermal Electricity Association (ESTELA), SOLAR POWER FROM EUROPE’S SUN BELT, A European Solar Industry Initiative Contributing to the European Commission ‘Strategic Energy Technology Plan’, 2009 (http://www.estelasolar.eu/) accessed 7 January 2014.
European Solar Thermal Electricity Association (ESTELA), SOLAR THERMAL ELECTRICITY EUROPEAN INDUSTRIAL INITIATIVE (STE-EII), IMPLEMENTING PLAN 2010-2012, 2010.
German Aerospace Center (Deutschen Zen-trums für Luft- und Raumfahrt - DLR), Con-centrating Solar Power for the Mediterranean Region, 2005 (http://www.dlr.de/tt/desktop-default.aspx/tabid-2885/4422_read-6575) accessed 7 January 2014.
Greenpeace International, European Renewable Energy Council (EREC) and Global Wind Energy Council (GWEC), Energy (r)evolution, 4th edition 2012 world energy scenario, July 2012. ISBN 978-90-73361-92-8
Intergovernmental Panel for Climate Change (IPCC), Special Report on Renewable Ener-gy Sources and Climate Change Mitigation, 2011 (http://srren.ipcc-wg3.de/report) accessed 7 January 2014.
International Energy Agency (IEA), Technology Roadmap: Concentrating Solar Power, 2010.
Jäger-Waldau, A., Monforti-Ferrario, F., Banja, M., Bloem, H., Lacal, R., Szabo, M., Renewable Energy Snapshots 2012, JRC Reference Report, Publications Office of the European Union, 2013. ISBN 978-92-79-28218-8 (online)
Solar Energy Industry Association (SEIA), Utility-Scale Solar Projects in the United States, status of 9 May 2013.
Stoddard, L., Abiecunas, J., O’Connell, R., Black & Veatch Overland Park, ‘Economic, Energy, and Environmental Benefits of Concentrating Solar Power in California’, Kansas, 2006. NREL/SR-550-39291
The World Bank (WB), Climate Investment Fund, Clean Technology Investment Plan for Concentrated Solar Power in the Middle East and North Africa Region, Inter-sessional Meeting of the CTF Trust Fund Committee, 2009 (http://www.climateinvestmentfunds.org/cif/sites/climatein-vestmentfunds.org/files/mna_csp_ctf_invest-ment_plan_kd_120809.pdf) accessed 7 January 2014 (http://www.climateinvestmentfunds.org/cif/sites/climateinvestmentfunds.org/files/CTF_MENA2-25-10.pdf) accessed 7 January 2014.
The World Bank (WB), Middle East and North Africa Region – Assessment of the Local Manufacturing Potential for Concentrated Solar Power (CSP) Projects, 2011.
Torre Solar (http://www.torresolenergy.com/TORRESOL/gemasolar-plant /en) accessed 7 January 2014.
U.S. Department of Energy (DOE), Concentrating Solar Power Commercial Application Study: Reducing Water Consumption of Concentrating Solar Power Electricity Generation, Report to Congress, 2009 (http://www1.eere.energy.gov/solar/pdfs/csp_water_study.pdf) accessed 7 January 2014.
JRC13_TMAP_08AP14_P5-NS-Print.indd 26 09/04/2014 16:21:10

27
4. Hydropower
4.1 Introduction
Hydropower is the most widely used form of renewable electricity with 3 700 TWh generated worldwide in 2012, from an installed capacity of 990 GW, an estimated 16.5 % of the global elec-tricity generation (REN21, 2013) and 79 % of all electricity from renewable resources (IEA, 2013).
In at least 36 countries hydropower covered more than 50 % of the electricity supply in 2010, and in 8 of them hydropower produced more than 20 TWh (IEA, 2013). In the EU-27, hydropower accounted for 10 % of gross elec-tricity generation in 2012, and for 44 % of all renewable electricity generation (BP, 2013). The top 5 EU countries in terms of hydropower share in the total electricity mix in 2011 are: Austria 52 %, Latvia 47 %, Sweden 44 %, Croatia 41 % and Romania 24 % (Eurostat, 2013). In neigh-bouring Norway, hydropower covers roughly 95 % of electricity supply and there remains significant unexploited potential. Elsewhere, the European hydropower potential is well exploited and expected future growth is rather limited (EC, 2009). A global potential has been estimated at 9 770 TWh (IPCC, 2011), although the growth expected is more modest but still doubling current generation to 7 000 TWh by 2050, including a three- to five-fold of pumped hydropower storage (PHS) capacity (IEA, 2012).
The advantages of hydropower can be sum-marised as: renewable, flexible, mature and relatively cheap. Disadvantages include limited unexploited potential, a potentially high envi-ronmental impact and, in some cases, the pos-sible risk of dam failure.
4.2 Technological state of the art and anticipated developments
Hydropower electricity is the result of the poten-tial energy stored in water in an elevated reser-voir being transformed into the kinetic energy of the running water, then mechanical energy in a rotating turbine, and finally electrical energy in an alternator or generator. This common hydro-power plant configuration has two main varia-tions: run-of-the-river (RoR) and PHS schemes. The former does not require a reservoir or only a very small one; the latter can pump water back-wards from a lower reservoir or river to an upper reservoir for temporary storage.
Hydropower is a mature renewable power gen-eration technology that offers two very desira-ble characteristics in today’s electricity systems: built-in storage that increases the system’s flexibility, and fast response time to meet rapid or unexpected fluctuations in supply or demand.
Figure 4.1:A hydropower plant based on a dam
Source: Wikipedia Commons.
2013 Technology Map of the European Strategic Energy Technology Plan
Hydroelectric Dam
JRC13_TMAP_08AP14_P5-NS-Print.indd 27 09/04/2014 16:21:12

28
2013 Technology Map of the European Strategic Energy Technology Plan
Figure 4.1 shows a schema of a reservoir-based hydropower plant. Small reservoirs serve for short-term storage, while large ones can provide seasonal storage. The power generated depends on its water storage capacity, discharge volume and head, and it is a design option that, for example, affects whether the plant is to be used for seasonal or daily storage. A large pipe, the penstock, delivers water to the turbine.
Figure 4.2 illustrates the application range of the different types of hydropower turbines according to their height and discharge for a range from 50 kW to 30 MW. Small discharge, high-head installations are typically mountain-based dams and are equipped with Pelton turbines. Large discharge, low-head installations are typically large RoR plants equipped with Kaplan turbines. Intermediate flow rates and head heights are usu-ally equipped with Francis turbines. Kaplan and Francis turbines are reaction turbines, meaning that the water pressure drops as it moves through the turbine. On the other hand, the Pelton turbine is an impulse turbine. Prior to hitting the turbine blades, the water goes through a nozzle, genera-ting thereby a water jet, which moves the turbine through its impulse. The largest turbines were commissioned in 2013 in China: Alstom’s 812 MW Francis at the Xiangjiaba hydropower plant (Alstom, 2013), and Voith’s 784 MW generator turbines at the Xiluodu plant (Voith, 2013).
Technological drivers include increasing the efficiency of generation equipment above the current 85–95 %, and enhancing the control capacity of pumps for PHS through variable speed. Three main drivers are pushing devel-opments in this field: erection of new large hydropower plants abroad; rehabilitation and refurbishment of existing hydropower facilities in Europe; and the need for the storage capa-bility that would allow the electricity system to accommodate additional renewable power from wind and other variable sources. Average efficiency improvements that can be expected from refurbishment are of the order of 5 %.
Hydropower technical and economic perfor-mance is very dependent on the site specifica-tions and utility operating strategies. Average LFs of large-scale hydropower plants (LHPs) range from 2 200 to 6 200 full-load hours per year in Europe (23 to 70 %), with an average of 3 000 h (35 %) in Europe, with big variations per country (see Figure 4.3). The small hydropower (SHP) sector is differentiated between reservoir-based and RoR schemes. Whereas the former have a similar dam-based structure to large plants and therefore similar ways of opera-tion and LFs, the latter operate on a continuous mode and contribute to base-load electricity.
Figure 4.2:Types of small hydropower
turbines by head height, discharge and capacity
Source: Voith Hydro, 2009. 100
5 MW
2 MW
1 MW
500 MW
300 MW
100 MW
50 MW
10 MW 15 MW
10
1
0.1
100 1 000
Dis
char
ge (
m3 /
s)
Head (m)
KaplanFrancisPeltonEcoflow
101
30 MW
JRC13_TMAP_08AP14_P5-NS-Print.indd 28 09/04/2014 16:21:13
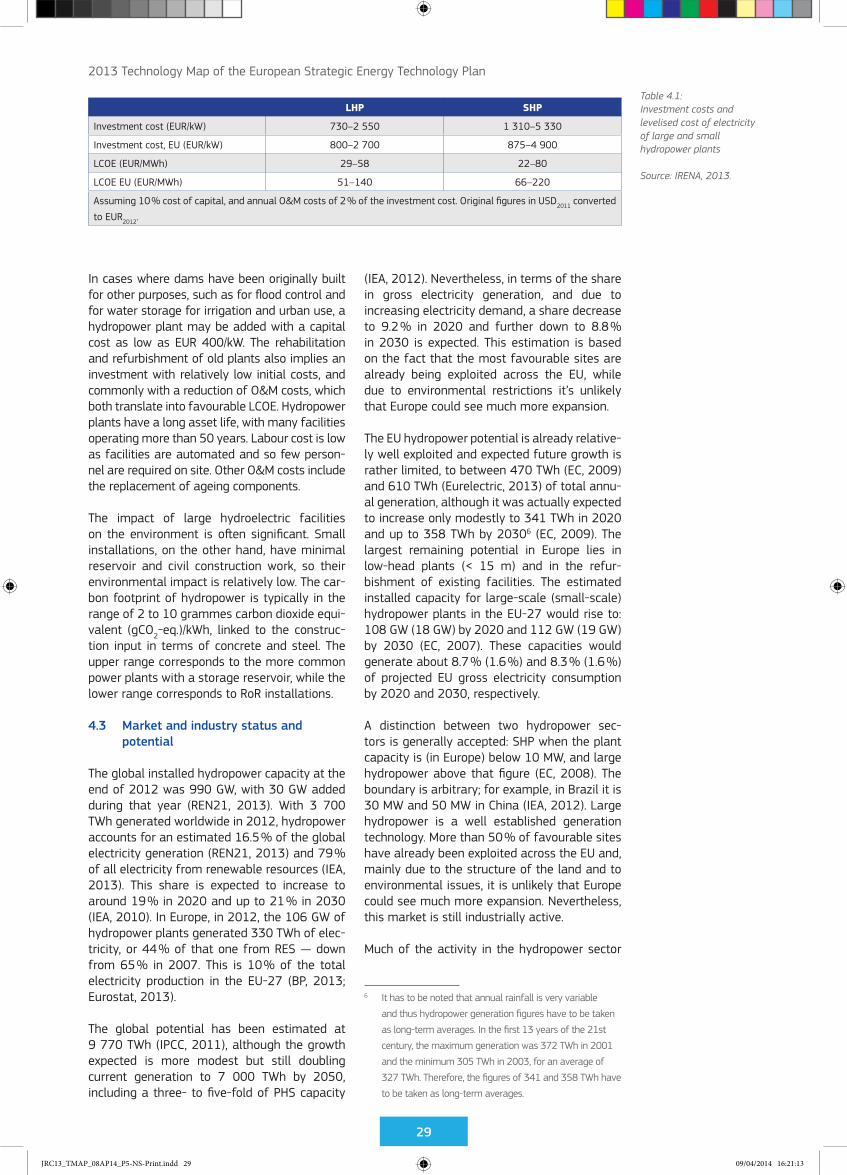
29
2013 Technology Map of the European Strategic Energy Technology Plan
Table 4.1:Investment costs and levelised cost of electricity of large and small hydropower plants
Source: IRENA, 2013.
In cases where dams have been originally built for other purposes, such as for flood control and for water storage for irrigation and urban use, a hydropower plant may be added with a capital cost as low as EUR 400/kW. The rehabilitation and refurbishment of old plants also implies an investment with relatively low initial costs, and commonly with a reduction of O&M costs, which both translate into favourable LCOE. Hydropower plants have a long asset life, with many facilities operating more than 50 years. Labour cost is low as facilities are automated and so few person-nel are required on site. Other O&M costs include the replacement of ageing components.
The impact of large hydroelectric facilities on the environment is often significant. Small installations, on the other hand, have minimal reservoir and civil construction work, so their environmental impact is relatively low. The car-bon footprint of hydropower is typically in the range of 2 to 10 grammes carbon dioxide equi-valent (gCO2-eq.)/kWh, linked to the construc-tion input in terms of concrete and steel. The upper range corresponds to the more common power plants with a storage reservoir, while the lower range corresponds to RoR installations.
4.3 Market and industry status and potential
The global installed hydropower capacity at the end of 2012 was 990 GW, with 30 GW added during that year (REN21, 2013). With 3 700 TWh generated worldwide in 2012, hydropower accounts for an estimated 16.5 % of the global electricity generation (REN21, 2013) and 79 % of all electricity from renewable resources (IEA, 2013). This share is expected to increase to around 19 % in 2020 and up to 21 % in 2030 (IEA, 2010). In Europe, in 2012, the 106 GW of hydropower plants generated 330 TWh of elec-tricity, or 44 % of that one from RES — down from 65 % in 2007. This is 10 % of the total electricity production in the EU-27 (BP, 2013; Eurostat, 2013).
The global potential has been estimated at 9 770 TWh (IPCC, 2011), although the growth expected is more modest but still doubling current generation to 7 000 TWh by 2050, including a three- to five-fold of PHS capacity
(IEA, 2012). Nevertheless, in terms of the share in gross electricity generation, and due to increasing electricity demand, a share decrease to 9.2 % in 2020 and further down to 8.8 % in 2030 is expected. This estimation is based on the fact that the most favourable sites are already being exploited across the EU, while due to environmental restrictions it’s unlikely that Europe could see much more expansion.
The EU hydropower potential is already relative-ly well exploited and expected future growth is rather limited, to between 470 TWh (EC, 2009) and 610 TWh (Eurelectric, 2013) of total annu-al generation, although it was actually expected to increase only modestly to 341 TWh in 2020 and up to 358 TWh by 20306 (EC, 2009). The largest remaining potential in Europe lies in low-head plants (< 15 m) and in the refur-bishment of existing facilities. The estimated installed capacity for large-scale (small-scale) hydropower plants in the EU-27 would rise to: 108 GW (18 GW) by 2020 and 112 GW (19 GW) by 2030 (EC, 2007). These capacities would generate about 8.7 % (1.6 %) and 8.3 % (1.6 %) of projected EU gross electricity consumption by 2020 and 2030, respectively.
A distinction between two hydropower sec-tors is generally accepted: SHP when the plant capacity is (in Europe) below 10 MW, and large hydropower above that figure (EC, 2008). The boundary is arbitrary; for example, in Brazil it is 30 MW and 50 MW in China (IEA, 2012). Large hydropower is a well established generation technology. More than 50 % of favourable sites have already been exploited across the EU and, mainly due to the structure of the land and to environmental issues, it is unlikely that Europe could see much more expansion. Nevertheless, this market is still industrially active.
Much of the activity in the hydropower sector
6 It has to be noted that annual rainfall is very variable
and thus hydropower generation figures have to be taken
as long-term averages. In the first 13 years of the 21st
century, the maximum generation was 372 TWh in 2001
and the minimum 305 TWh in 2003, for an average of
327 TWh. Therefore, the figures of 341 and 358 TWh have
to be taken as long-term averages.
LHP SHP
Investment cost (EUR/kW) 730–2 550 1 310–5 330
Investment cost, EU (EUR/kW) 800–2 700 875–4 900
LCOE (EUR/MWh) 29–58 22–80
LCOE EU (EUR/MWh) 51–140 66–220
Assuming 10 % cost of capital, and annual O&M costs of 2 % of the investment cost. Original figures in USD2011 converted
to EUR2012.
JRC13_TMAP_08AP14_P5-NS-Print.indd 29 09/04/2014 16:21:13

30
2013 Technology Map of the European Strategic Energy Technology Plan
in Europe focuses on the refurbishment of an overall ageing hydropower park, some new green-field hydropower projects and still more PHS projects that could be the transformation of conventional hydropower systems. Figure 4.3 gives the current (2011) values of hydropower generation per Member State along with their share in the gross electricity generation and their respective LFs. For a detailed projection of expected hydropower generation by 2020 and 2030, per Member State, see JRC (2011).
PHS is currently the only commercially proven, large-scale energy storage technology with over 300 plants installed worldwide with a total installed capacity of over 138 GW, of which about 3 GW was added in 2012 (REN21, 2013). The EU has an installed PHS capacity of around 43 GW, of which 675 MW was added in 2012. Interest in PHS is again high in the EU, and at least 6 GW of new capacity is expected to be added before 2020, although a significant part of this will correspond to repowering or enhan-cing existing facilities or to building pump-back plants. While PHS was previously used to enable an electricity mix with a high base-load share, there is now renewed interest driven by an increasing wind and solar energy share.
At the end of 2011, hydropower-installed capa-city in the EU-27 reached 106 GW, plus 43 GW of pumped storage. Of the former, 90 % is made up of large hydropower plants and the rest are some 21 000 SHP plants. Figure 4.3 shows the different levels of generation from both PHS and hydropower, and the corresponding CFs. The figure shows clearly that hydropower is a
bulk-production technology whereas PHS is a peak-production one, and hence the significant differences in LFs.
Three large European companies are leading the large- to medium-scale hydropower mar-ket worldwide — Alstom, Voith and Andritz Hydro — along with IMPSA from Argentina, and Harbin and Dongfang from China. The market for SHP is more accessible to small companies, with several European manufactures among the 60+ existing ones that hold a recognised industrial position worldwide, leading to signifi-cant exports (SHERPA, 2008).
4.4 Barriers to large-scale deployment
The main barrier preventing further hydropower development in Europe is the lack of appropri-ate sites as most of them are already under exploitation. Potential remains in four areas:
• adding a power plant to existing reservoirs not currently used for hydropower;
• greenfield SHP plant, especially RoR;
• transformation of reservoir hydropower to PHS;
• new low-head reservoirs.
The four present different barriers that need to be tackled by different stakeholders.
Figure 4.3:Electricity generation
and load factor (LF) from hydropower and PHS in the EU and Associated/
Candidate Countries, and share of hydropower in
gross electricity generation
Source: Eurostat, own elaboration.
European hydropower and PHS generation parameters, 2011
TWh
120
100
80
60
40
20
0
LF (%)
0%
10%
20%
30%
40%
50%
60%
70%
80%
NO SE TR IT FR AT CH ES DE RO IS FI PT UK HR EL SK SI BG LV PL CZ MK IE LT HU BE LU
JRC13_TMAP_08AP14_P5-NS-Print.indd 30 09/04/2014 16:21:15

31
2013 Technology Map of the European Strategic Energy Technology Plan
Member States could set up an inventory of all existing non-hydro reservoirs that could be used for hydropower, as well as a working group, at the adequate administrative level, to explore and combat the specific barriers and to promote the uptake of hydropower. Sometimes, historical concessions have not been built but the grantee — often an incumbent utility — does not release the concession to another developer.
New SHP plants sometimes face the lack of a developer interested in their exploitation, and other times administrative or environmen-tal constraints such as those imposed by the Water Framework Directive (WFD). Whereas the environmental health of rivers is an important objective of European environmental policy, it is claimed that the WFD has not been applied consistently and coherently at times.
PHS helps the integration of variable renewable energy (e.g. wind and solar) in the electricity system even more than a conventional hydro-power plant, and transforming the latter to the former is quite straightforward and cost effective. Until recently, not even the European potential was known, but this is now partly solved (JRC, 2013). A key barrier is the unclear economics making difficult to set up a profi-table business case, as explained in the elec-tricity storage chapter.
The increasing uptake of low-head plants is very dependent on the development of low-head technology, and thus R&D resources would be needed.
Generally, institutional barriers include long lead times to obtain or renew concession rights, grid connections, etc. Administrative procedures take from 12 months to 12 years, clearly some-times too much (EC, 2007).
The ratio of the pumped hydropower to total hydropower plants varies among Member States from 0 to 92 %, which suggests that barriers to pumped hydropower exist in certain Member States, but these have not been inves-tigated enough.
Hydropower in the EU is not seen as a political priority while, on the other hand, environmental issues related to water bodies have become a significant concern (EC, 2011). The construction of a hydroelectric plant requires a long lead time for site and resource studies, as well as environmental impact and risk assessments.
4.5 RD&D priorities and current initiatives
R&D efforts address: load and fatigue analy-sis of turbine and generator components, in particular in a context of variable-speed and frequent stop–start operations; the integra-tion of LHP with other renewable energies, for example through speed-adjustable generators; the development of hybrid systems, for exam-ple with wind, and minimising environmental impacts, for example turbine design with fewer blades and less clearance between the runner and housing to reduce injuries to and stress factors for fish, or oil-free Kaplan turbines to eliminate leak-related risks (Andritz, 2013).
Research in materials is focusing on cheaper alternatives to steel in some components and applications, such as fibreglass and special plastics. Developing more resistant materials to extend the lifetime of some components is also essential, for example steel alloys that are more resistant to turbine cavitation or high-voltage insulation systems able to sustain short-period operations to 180 ºC. Improvements in power electronics would also help the sector: for example increase voltage range of converters from 6.6 kilovolts (kV) today to 20 kV, reduce size from 2–3 m3 per megavolt-amperes (MVA) to 1.5 m3 /MVA, and increase efficiency by 1 % from 98 to 99 % — all at affordable costs by 2020 (HEA, 2013).
The European Hydro Equipment Association suggests that R&D to deliver flexibility should have the highest priority. This includes plant design for more often and faster ramp-up and ramp-down, and higher efficiency at part load (HEA, 2013). This source describes more detailed R&D priorities than is possible in the limited space of this text.
In the field of PHS, site development with the aim to increase resource is an important research field. For instance, Okinawa’s Japan 30 MW seawater PHS plant with a head of 136 m is in operation since 1999 and is still the only one of its kind worldwide. This suggests that very focused R&D is needed, for example on corrosion issues, if seawater PHS is to reach its great potential.
The eStorage project, supported by the Seventh Framework Programme (FP7) of the EU, started in 2012 with the objective to develop variable-speed pumping technology as cost-effective power regulation, for example during low-demand periods.
JRC13_TMAP_08AP14_P5-NS-Print.indd 31 09/04/2014 16:21:15

32
2013 Technology Map of the European Strategic Energy Technology Plan
4.6 References
Alstom, Alstom commissions world’s most powerful hydroelectric units at Xiangjiaba hydro power plant, in China, press release dated 21 July 2013 (http://www.alstom.com/press-centre/2013/7/alstom-commissions-worlds-most-powerful-hydroelectric-units-at-xiangjiaba-hydro-power-plant-in-china/) accessed 7 January 2014.
Andritz Hydro, 2012 annual report, 2013.
British Petroleum (BP), BP Statistical Review of World Energy, 2013.
Energy Technology Systems Analysis Pro-gramme of the IEA (ETSAP), Technology Brief E12, Hydropower, 2010 (http://www.iea-etsap.org) accessed 7 January 2014.
Eurelectric, Hydropower for a sustainable Europe, EURELECTRIC fact sheets, 2013.
European Commission (EC), Accompanying document to the Communication from the Commission to the Council, the European Par-liament, the European Economic and Social Committee and the Committee of the Regions - A European Strategic Energy Technology Plan (SET-Plan) – Technology Map, SEC(2007) 1510, Brussels, 2007.
European Commission (EC), Second Strategic Energy Review AN EU ENERGY SECURITY AND SOLIDARITY ACTION PLAN Energy Sources, Production Costs and Performance of Technologies for Power Generation, Heating and Transport, SEC (2008) 2872, Brussels, 2008.
European Union (EU), EU Water Framework Directive (WFD), 2011.
Eurostat database, For energy production the origin is monthly data for net electricity genera-tion from hydro plants versus from all power plants. Annual generation data from pumped hydro was deduced from the gross generation figures, 2013.
Hydro Equipment Association (HEA), Hydro equipment technology roadmap, 2013.
Intergovernmental Panel for Climate Change (IPCC), Special Report on Renewable Energy Sources and Climate Change Mitigation pre-pared by Working Group III of IPCC, Cambridge University Press, Cambridge, United Kingdom and New York, NY, USA, 2011.
International Energy Agency (IEA), Energy Technology Systems Analysis Program. Technology Brief Hydropower, 2010 (http://www.etsap.org/E-techDS/) accessed 7 January 2014.
International Energy Agency (IEA), Technology Roadmap – Hydropower, 2012.
International Energy Agency (IEA), Renewables Information 2013, 2013. ISBN 978-92-64-20302-0
International Renewable Energy Agency (IRENA), Renewable Power Generation Costs in 2012: An Overview, Abu Dhabi, United Arab Emirates, 2013.
Joint Research Centre (JRC), 2011 Technology Map of the European Strategic Energy Technology Plan (SET-Plan) - Technology Descriptions, European Commission, 2011. ISBN 978-92-79-21630-5
Joint Research Centre (JRC), Assessment of the European potential for pumped hydropower energy storage, European Commission, 2013. ISBN 978-92-79-29512-6
Renewable Energy Policy Network for the 21st Century (REN21), Renewables 2013 global sta-tus report, 2013.
Small Hydro Energy Efficient Promotion Campaign Action (SHERPA) is a project funded by the EU’s Intelligent Energy for Europe pro-gramme, Strategic study for development of small hydropower in the European Union, 2008.
Voith, Hydropower Heading for New Dimensions: Most powerful generator-turbine unit in the history of Voith enters service in China, press release dated 15 August 2013 (http://www.voith.com/en/press/press-releases-99_48747.html) accessed 7 January 2014.
Voith Hydro, Small hydro, p. 5, 2009.
JRC13_TMAP_08AP14_P5-NS-Print.indd 32 09/04/2014 16:21:15

33
5. Geothermal energy
5.1 Introduction
Geothermal energy is derived from the thermal energy generated and stored in the Earth’s inte-rior that originates from the incipient forma-tion of the planet (20 %) and from radioactive decay of minerals (80 %). Geothermal energy is a commercially proven renewable form of energy that can provide power and heat from high-temperature hydrothermal resources, deep aquifer systems with low and medium temperatures, and hot rock resources. It is a low-GHG–emitting renewable resource because there is a constant heat flow to the surface and atmosphere from the immense heat stored within the Earth while the water is replenished by rainfall and circulation within the crust. Geothermal energy provides an ideal oppor-tunity to be exploited by cascade utilisation and therefore increase the total efficiency and result in economic benefits. The most important cascade applications present in today’s market are (EGEC/TP-Geoelec, 2012):
• power generation (provided the temperature of fluids is high enough);
• district heating and cooling (DHC);
• industrial processing;
• greenhouses/fisheries;
• de-icing, spa baths.
Of these applications, only power generation is within the scope of this section.
The IEA’s Geothermal Heat and Power Roadmap (IEA, 2011) envisaged that geothermal energy can provide continuous (versus variable power for other renewables) base-load power genera-tion, immune to weather effects and season-al variation, with high CFs for the new power plants (e.g. 95 %).
Environmental and social impacts from geothermal use are site- and technology-specific and largely manageable. Overall, geothermal technologies are environmentally
advantageous because there is no combus-tion process emitting CO2, with the only direct emissions coming from the underground fluids in the reservoir. Direct CO2 emissions for direct use applications are negligible and enhanced geothermal system (EGS) power plants are likely to be designed with zero direct emissions. The main environmental concern associated with hydrothermal utilisation is the release of two substances: hydrogen sulphide (H2S) and mercury, sometimes found in geothermal fluids. Another significant benefit in terms of geother-mal technology development is local job crea-tion, for the whole lifespan of a project.
5.2 Technological state of the art and anticipated developments
Geothermal energy is defined as heat from the Earth. From a practical point of view, geo-thermal resources may be defined as ther-mal energy reservoirs that can be reasonably extracted at costs competitive with other forms of energy within some specified period of time. Geothermal resources have been classified according to their reservoir fluid temperatures into low-, medium- and high-enthalpy fields. Additionally, the temperatures found at very shallow depths may be used to extract and store heat for heating and cooling by means of ground-source heat pumps. Conventionally, geothermal resources are hydrothermal resources that include reservoirs of hot water and/or steam, and are categorised as vapour-dominated or liquid-dominated reservoirs. The temperature for low-enthalpy resources is below 100 °C, while medium- and high-enthal-py resources imply the temperature range of 100–180 °C and above 180 °C, respectively. Low-enthalpy, low-temperature hydrothermal resources are mainly used for direct heat use, whereas medium- and high-enthalpy resources are used to generate power and in some cases also heat in cogeneration plants. Hydrothermal resources exist at shallow to moderate depths and are the least abundant source of geo-thermal resource. Other geothermal resources include geo-pressured, magma and the more widespread hot, dry rock (HDR). Supercritical unconventional resources (390–600 °C) are limited to volcanic areas and involve superheat-ed steam at subcritical pressures (< 220 bar) with power per unit volume of fluid up to one
2013 Technology Map of the European Strategic Energy Technology Plan
JRC13_TMAP_08AP14_P5-NS-Print.indd 33 09/04/2014 16:21:15

34
2013 Technology Map of the European Strategic Energy Technology Plan
order of magnitude larger than unconventional resources (Fridleifsson et al., 2013).
Geothermal power plants use steam produced from reservoirs of hot water found close to the Earth’s surface or deeply buried into the crust to produce electricity. Generally, below-ground fluid production systems are derived from the oil and gas industry, and above-ground conver-sion systems are based on traditional steam–electric power generation.
A geothermal power plant’s annual CF is gener-ally above 90 %, reaching even higher values up to 97–98 %, but with increased maintenance costs; the higher-priced electricity can compen-sate for the higher maintenance costs.
In general, environmental impact of geother-mal facilities will fall into the following main categories:
• surface disturbances due to infrastructure;
• physical effects (particularly induced seismicity);
• noise;
• thermal and chemical pollution;
• protection (ecological protection).
The nitrogen oxides (NOx) emissions from geo-thermal sources are extremely minute but may be produced in gas treatment facilities. Another important environmental aspect is the water
Table 5.1:Gases emissions for
different types of geothermal power plants during power production
References: (1) Kagel et al., 2007, (2) Gunnlaugsson,
2012a and (3) Gunnlaugsson, 2012b.
consumption. Geothermal power plants con-sume, in general, less water per MWh of life-time energy output compared to fossil fuel and nuclear technologies since the geo-fluid is used for cooling.
Geothermal plants’ classification and technology principles
There are two main categories of geothermal resources presently providing geothermal power: conventional and advanced geother-mal systems. The conventional geothermal power plants that are commercially available use hydrothermal resources that exist natu-rally in a particular location as their main supply of energy. There are three types of conventional geothermal power plants: dry steam, flash steam, and binary cycle and var-iations of them (e.g. combined-cycle or hybrid plants, combined heat and power). A typical geothermal dry steam/flash plant’s capacity is 50–60 MWe (EGEC, 2009) but up to 300 MWe plants (Hellisheidi, Iceland, 7 power units) have been commissioned and are cur-rently in operation.
Within each geothermal power plant category, the efficiency is mainly dependent upon the tempera-ture (80–300 °C) of the geothermal working fluid.
EGS development is seen as an alternative for energy production with high production poten-tial compared to the conventional geothermal power plants that presently rely on scarce nat-ural hydrothermal reservoirs. EGS can provide energy supply almost everywhere, since almost any site at a specific depth can be considered a reservoir. In order to use this high potential, the EGS technology still needs to experience an intensified R&D phase in order to reach the stage of successful demonstration and com-mercially viable power plant by 2030.
Conventional — Direct dry steam
Dry steam is the oldest type of geothermal power plant, first being used in 1904. Dry steam plants amount to almost a quarter of geothermal capacity today. Dry steam technology collects hydrothermal fluids in the form of pure steam from a geothermal reservoir and pipes them to a turbine/generator unit. The condensate is usually re-injected into the reservoir or used for cooling. Control of steam flow to meet electricity demand fluctuations is easier than in flash steam plants.
Plant type CO2
kg/MWh
H2S kg/MWh
NOz
kg/MWh
Particulates
kg/MWh
Ref.
Flash-steam, liquid dominated-USA 27.2 0.08 0 0 (1)
Sonoma County at the Geysers dry steam field-USA
40.3 0.00005 0.000458 negligible (1)
Closed-loop binary/EGS 0 0 0 negligible (1)
Flash steam – Nesjavellir-Iceland 14.6 9.3 (2)
Flash steam – Hellisheidi-Iceland 24.1 9.8 0 0 (3)
JRC13_TMAP_08AP14_P5-NS-Print.indd 34 09/04/2014 16:21:16

35
2013 Technology Map of the European Strategic Energy Technology Plan
The dry steam power plants have the highest efficiency among all geothermal power plants, reaching values of 50–70 % (DiPippo, 1999). They are commercially proven, simple to operate and require relatively low capital costs. However, they are only suitable for dry steam resources, of which there is little known untapped potential.
Conventional — Flash cycle: Single- and double-flash systems
Flash steam power plants (see Figure 5.1) are the most common type, making up about two thirds of geothermal installed capacity today. The flash steam technology makes use of liquid-dominated hydrothermal resources with a temperature above 180 °C. In the high-temperature reservoirs, the liquid water component boils, or ‘flashes’ as pressure drops. The pressurised fluid is either partially vaporised at the wellheads or inside one or more flash tanks (double- or triple-flash plant). Combined-cycle flash steam plants use the heat from the separated geothermal brine in binary plants to produce additional power before re-injection. The thermal energy of the brine may also be extracted via heat exchangers prior to re-injection. The single-flash and dual-flash power plants reach efficiencies between 30–35 % and 35–45 %, respectively. They have a simple con-figuration and are already proven technologically; several commercially available system suppliers are present in the market already. The single-flash power plants require low capital costs but are typi-cally economically competitive only when the har-vested geothermal resources are at 200–240 ºC. The double-flash power plants have an increased power output (by 5–10 %) in comparison with single-flash ones but require higher capital costs and higher resources temperature (> 240 ºC) in
order to be competitive. In both technologies, the O&M costs increase significantly when dealing with high brine resources.
Conventional — Binary cycle: Organic Rankine and Kalina systems
Electrical power generation units using binary cycles constitute the fastest-growing group of geothermal plants as they are able to use low- to medium-temperature resources, which are more prevalent. Today, binary plants have an 11 % share of the installed global generat-ing capacity and a 44 % share in terms of the number of plants. Binary cycle power plants, employing organic Rankine cycle (ORC) or a Kalina cycle, operate lower water temperatures of about 74–180 °C using the heat from the hot water to boil a working fluid, usually an organic compound with a low boiling point. The working fluid is vaporised in a heat exchanger and used to rotate a turbine. The lower-temperature geo-thermal brine leaving the heat exchanger is re-injected back into the reservoir in a closed loop, thus promoting sustainable resource exploita-tion. The water and the working fluid are kept separated during the whole process, so there are little or no air emissions. The binary units can be produced in very small sizes (0.1–5 MW), even as container module units (modular design).
The ORC can reach efficiencies between 25 and 45 % (Emerging Energy Research, 2009). High O&M costs are present when the resource has a high brine composition, which comes in direct contact with the plant. The technology suppliers are scarce, with only a few being commercially available.
Figure 5.1:Top image displays the Nesjavellir flash cycle cogeneration 120 MWe, 300 MWth geothermal power plant in Iceland (photo by Gretar Ívarsson).
Bottom images show (from left to right) the conventional geothermal systems and advanced geothermal system: Dry steam power plant; flash steam power plant; binary cycle power plant; and enhanced geothermal system (EGS).
Sources: U.S. Department of Energy (DOE) Geothermal Technologies Office (GTO), 2013 and EPRI, 2010.
JRC13_TMAP_08AP14_P5-NS-Print.indd 35 09/04/2014 16:21:17

36
2013 Technology Map of the European Strategic Energy Technology Plan
The Kalina cycle can, under certain design conditions, operate at higher cycle efficiency of between 30 and 65 % (Emerging Energy Research, 2009). It has an abundant, more environmentally friendly heat-transfer fluid (ammonia/water). The RD&D should focus on reducing the costs to make technology competitive with current ORC alternatives. Presently, the Kalina cycle plants are associated with high capital costs and technological complexity. The technology is not yet bankable and few plants are currently operating.
Advanced — Enhanced geothermal systems
EGS or HDR provide geothermal power by tap-ping into the Earth’s deep geothermal resources that are otherwise not economical due to lack of water and fractures, location or rock type. EGS technologies have the potential to cost effectively produce large amounts of electricity (see Figure 5.2) almost anywhere in the world. The potential of EGS is especially high in regions outside known geothermal resource areas as hot rock geothermal can be developed almost anywhere that deep wells can provide sufficient temperatures. Several pilot projects are at the moment being conducted in Australia, Europe, Japan and the US. The basic concept is to drill two wells into the HDR with limited permeabili-ty and fluid content at a depth of 5–10 km. High temperature reservoirs (200 °C) have though been found as shallow as 3 km, where the tem-perature gradient is high (70–90 °C/km).
The EGS technology creates permeability in the rock by hydro fracturing the reservoir with cold water pumped into the first well (the injec-tion well) at a high pressure. The second well (the production well) intersects the stimulated fracture system and returns the hot water to the surface where electricity can be generated. Additional production wells may be drilled in order to meet power generation requirements.
Adoption of flash or binary technologies may be used with EGSs depending on the temperature of geothermal fluid extracted from the artificial reservoir created by hydraulic stimulation.
Current practice for geothermal conversion systems shows that utilisation efficiencies typi-cally range from 25–50 %. Future engineering practice would like to increase these to 60 % or more, which requires further investments in RD&D to improve heat transfer, and improving mechanical efficiencies of converters such as turbines, turbo-expanders and pumps.
There is a strong need for EGS demonstrations to be scaled up. With wells extending up to 5 000 m in many cases, drilling poses a signifi-cant challenge for EGS developers. The injection
and production wells are the next big techno-logical issue facing the commercialisation of EGS technology. A significant technological hur-dle is to control these deep-rooted fractures (exceeding 5 000 m) in order to create a large area for heat transfer. Before reaching large-scale commercialisation, it still requires signifi-cant improvements to lower the costs.
5.3 Market and industry status and potential
Geothermal is a proven, bankable and cost-com-petitive renewable power generation techno-logy for commercial-scale applications. The total world energy demand amounts to approximately 5.0x10¹⁴ megajoules (MJ)/year. The total heat content in the crust of the Earth is 5.4x10²¹ MJ. The heat stored inside the first 3 km of the Earth’s crust is huge considering a geothermal gradient of 25 °C/km under normal geological conditions. It can meet the present global heat consumption for about 100 000 years. Annually added worldwide capacity of geothermal power plants is closely related to fossil fuel prices and economic crisis (Emerging Energy Research, 2009). In spite of their much higher cost of pro-duction, medium-temperature and enhanced geothermal technology may unlock the huge geothermal potential as fuel prices rise and carbon and renewable policies continue to evolve. It is expected that these technologies will become increasingly competitive as a low-carbon base-load solution beyond 2015.
As of May 2012, the global total installed capacity is about 11.7 GWe with a global capacity in oper-ation of approximately 9.6 GWe (REN21, 2013). Global geothermal electric generating capacity grew by an estimated 300 MWe during 2012. Geothermal power plants generated worldwide approximately 75 TWh, which is about 0.33 % of the global electricity generation. At European level, the state of play in 2012 (EGEC, 2012) was a total installed capacity of 1.7 GWe (0.935 GWe for EU-27) roughly producing 11.38 TWh of electric power. The predicted growth of geother-mal installed capacity in Europe (EGEC, 2012) is up 3 GWe (1.15 GWe for EU-27) for 2016 and 3.87 GWe (1.42 GWe for EU-27) for 2019. There are currently 62 geothermal power plants (and more than 100 project ideas) in Europe, of which 48 are from EU Member States.
The LCOE may vary widely, largely depending on the main cost components such as drilling, which can be 30 % for high-temperature plants, 50 % for low-temperature and 70 % for EGS. The investment costs vary significantly depen-ding on a number of factors such as resource conditions and depth, location and number of wells. O&M costs represent a small percentage (1–3.5 %) of the total costs because geothermal
JRC13_TMAP_08AP14_P5-NS-Print.indd 36 09/04/2014 16:21:17

37
2013 Technology Map of the European Strategic Energy Technology Plan
electricity generation does not require fuel. In 2012, the LCOE for geothermal electricity was ranging between EUR 50 and 90/MWh (average 70) for conventional power plants with high temperature, between EUR 10 and 20/MWh (average 15) for power plants with low tempera-ture or small plants with high temperature, and between EUR 20 and 30/MWh (average 25) for EGS power plants (EGEC, 2013). More details about the technological and development costs of geothermal electricity are found in the ETRI database (ETRI, in development).
The Geothermal Market Report (EGEC, 2011, 2012) periodically updates the geothermal energy market, and makes a summary of the existing financial support schemes for geother-mal electricity in Europe (see Figure 5.2).
The European geothermal industry stakehold-ers include a number of direct and indirect geo-thermal players as well as an increased number of expected new players to join the geothermal market. In the category of direct players enter: municipalities, major or regional utilities com-panies (e.g. ENEL, EnBW, RWE, ES, Pfalswerke) and private developers (e.g. GeoEnergie Bayern, Exorka, EGS Energy, Petratherm, Geothermal Engineering Ltd., Mannvit, Martifer), sub-sur-face suppliers (consultants, drillers, services companies, suppliers, etc.), surface suppliers (consultants, engineers, electricity suppliers, etc.), public institutes (geological surveys, research institutes, policymakers, regulators, etc.), financial services, lawyers and insurance companies. Indirect geothermal stakeholders are cited as the cascade users of heat and civil works and electro-mechanical contractors for whom smaller plants (compared with fossil fuel or nuclear) may mean easier access to the mar-ket. The European stakeholders’ compendium is
completed with the players that are expected to join: oil and gas companies (e.g. Total, Shell, BP, Wintershall, Statoil), other power utilities (e.g. EDF, GDF Suez, Dalkia) and large engineering firms (e.g. Technip, Dornier).
5.4 Barriers to large-scale deployment
The upfront risk of developing a geothermal power plant project is due to relatively long devel-opment times and uncertainty about the size of the resource. The resource is confirmed only after the exploration and drilling is finished; these two processes often represent most of the costs associated with the development of a geothermal project. The average period for developing geo-thermal power projects to commercial deploy-ment is 5–7 years. However, once the feasibility of a resource has been established, the probabil-ity of project success is better than 80 %.
Geothermal developers struggle to find insu-rance (public or private) schemes with afford-able terms and conditions for the resource risk. This is due to a relatively limited number of geothermal electricity operations in the EU and the difficulties met while assessing the prob-ability of success. The European Geothermal Energy Council (EGEC) has proposed a European Geothermal Risk Insurance Fund (EGRIF) that aims at alleviating the shortage of insurance policies for the resource risk and easing invest-ments in geothermal electricity projects.
Figure 5.2:Geothermal power plants’ evolution and future trends in Europe by 2050 depending on the type of technology used for geothermal electricity production. Number of power plants and their estimated distribution for short and long prediction (upper left), and estimated growth of installed capacity (central figure).
Source: EGEC, 2012.
2010 2015 2020 2025 2030 2035 2040 2045 2050
250
200
150
100
50
0
Existing Geothermal Power Plants in Europe
Ideas for Geothermal Power Plants in Europe
Geothermal Power Plants Projects in Europe
Long term
Conventinal (21%)
Binary (36%)
EGS (43%)
PresentConventinal (85%)
Binary (12%)
EGS (3%)
Short term
Conventinal (57%)
Binary (28%)
EGS (15%)
GW
EGS
Low temperature(hydrothermal)
binary plants
High temperature(hydrothermal)
flash plants
JRC13_TMAP_08AP14_P5-NS-Print.indd 37 09/04/2014 16:21:18

38
2013 Technology Map of the European Strategic Energy Technology Plan
The main financial factors that can prevent geothermal from developing further are sum-marised as:
• limited access to private funds for financing (EGEC proposed EGRIF);
• poor knowledge of the deep surface over a large part of Europe, leading to an increased exposure to risk of investment;
• significant initial investment for a capital-intensive technology that could take years to develop;
• strong homogeneity of products derived from geothermal energy (e.g. power, heat, trad-able emission reduction certificates) do not command a premium that can be levied nor enable the development of niche products.
Geothermal electricity could play a key role in providing a renewable base-load power pro-duction by stabilising the grid while moving towards a low-carbon economy. One impor-tant barrier that geothermal electricity is fac-ing and which deters it from playing this role is the difficulty to access power lines through interconnection as hydrothermal resources are often far from existing power grids; however, no technical barrier is present for the integra-tion of geothermal power to the EU electricity grid. This barrier should not persist for EGS as their potential locations are more flexible. Other non-economic barriers include: long, complex permitting procedures, such as licences, and environmental appraisals; complications in negotiating a long-term power purchase agree-ment in a non-liberalised energy market; and unclear governmental responsibilities for geo-thermal resources. Another major hurdle to overcome and also seen as an important public acceptance issue is represented by the induced micro-seismicity while (re)injecting (cold) water into the reservoir (hydro-fracturing techniques) in order to release the geothermal energy.
A considerable cost can be associated with additional chemical plants to treat stream from hydrothermal (not EGS) plants to prevent the emissions of H2S and mercury into the atmos-phere. These costs need to decrease in order to enable a lower levelised cost of production and hence make hydrothermal a more appeal-ing investment opportunity.
EGEC (TP-Geoelec, 2013) recently released a report on the topic of public acceptance for geothermal electricity production. The analysis focused on four main sources of social resist-ances, namely environmental issues, ‘miss-ing involvement’ issues, financial issues and the NIMBY syndrome. Geothermal electricity production as renewable energy is viewed as extremely favourable by a broad social consen-sus in Europe.
5.5 RD&D priorities and current initiatives
Geothermal power is a promising RES capa-ble of providing naturally a continuous base-load power. Currently, the exploitation of this technology remains limited to locations where geothermal heat is easily accessible, such as naturally occurring hot springs, steam vents or hot fluids at shallow depths.
The RD&D efforts proposed in the SET-Plan materials roadmap on enabling low-carbon energy technologies follow the different phases in the exploitation of a geothermal system. Focus is on innovative developments in accessing geo-thermal reservoirs (including spallation drilling), which should work towards an increase of eco-nomic depth (EC/JRC, 2011). An important con-tribution would come by researching lightweight materials for drill bits to extend their lifetime in highly abrasive and corrosive environments at high temperatures, and developing site-specific materials for proppants in conjunction with stimulation techniques. Improved monitoring of the downhole requires materials developments to make fibre optic cables and power electronics withstand the hostile environment they operate in. When assessing the heat reservoir and the subsequent production phase, the accumulated deposition of material inside the pipes (scal-ing) and the extreme corrosion and temperature problems need to be tackled from a materi-als’ perspective. This involves the development of corrosion-resistant materials for the pipes, equipped with protective outer coatings and insulation, and inner liners. Novel polymeric, ceramic or metallic membranes to separate and re-inject gases would make the operation of a zero-emission plant possible. During the opera-tion, continuous monitoring of the system should allow for early intervention, thus reducing the risk of a fatal breakdown of a well too early in its exploitation life. Also, the downtime due to replacement or maintenance of instrumentation such as downhole pumps could be reduced by constructing pumps with specific metal alloys.
JRC13_TMAP_08AP14_P5-NS-Print.indd 38 09/04/2014 16:21:18
39
2013 Technology Map of the European Strategic Energy Technology Plan
Although RD&D is being developed at the labo-ratory scale, field tests on the materials and components listed above need to be conducted under long-term operating conditions. The estab-lishment of research wells, one at supercritical conditions, one in overpressured reservoirs and one to improve EGS technology and stimulation materials, are proposed as technology pilots. The Technology Map furthermore contains several proposals for research infrastructures in realistic laboratory or even in situ conditions. Materials standardisation would be the topic of one facil-ity. In a large-scale autoclave, heat exchangers and working fluids can be tested, while research wells are needed to test structural materials for the drilling tools and well components.
The RD&D for ORC should focus on the new heat-transfer fluids to improve efficiency, and improve the manufacturing capabilities to develop modularity benefits; the balance of the plant can be determined before construction. One advantage of the modular design is that the maintenance of individual units can be per-formed without taking the entire plant offline.
EU RD&D funding allocated to geother-mal energy during the Sixth and Seventh Framework Programmes for Research (FP6 and FP7, respectively) until March 2012 sums up to EUR 29.4 million. Moreover, to date, the geo-thermal sector is the only one (with biomass) to have experienced a proportional reduction in FP7 funding (from EUR 17.3 million in FP6 to EUR 12.1 million).
The New Entrance Reserve 300 (NER300) pro-gramme is another financing instrument at EU level used to subsidise installations of innova-tive renewable energy technology and CCS. In December 2012, the European Commission awarded NER300 funds to the Geothermal South Hungarian EGS Demonstration Project. The Hungarian project is one of the 23 inno-vative renewable energy technology projects funded according to the outcome of the first call for proposals under the NER300 programme. A second call has been launched in 2013.
One of the main future challenges for the geo-thermal sector is the expansion of the EGS con-cept across the different regions and geological conditions of Europe. The construction of these types of novel power plants together with the development of more efficient binary cycle sys-tems for low-temperature resources will pre-serve EU leadership in this area of geothermal technology and electricity production.
The EGEC’s position paper on the European Com-mission’s communication on ‘Energy Technologies and Innovation’ complements it with a number of key messages on the role that geothermal ought to play in an updated long-term technology pillar for the EU’s energy policy (EGEC, 2013b). Respec-tively, EGEC suggests the need for concrete pro-posals to develop the SET-Plan for boosting emergent geothermal renewable energy technol-ogies, and the industrial partnership in the SET-Plan through a dedicated European Geothermal Industrial Initiative (EGII).
The EGEC’s Technology Platform on Geothermal Electricity (TP-Geoelec) recently released a document on the vision of the European geo-thermal electricity industry where a roadmap for short-, medium- and long-term geother-mal research (2020, 2030 and beyond) is pre-sented; for more detailed information, please consult EGEC’s TP-Geoelec’s publication titled Strategic Research Priorities for Geothermal Electricity (2012).
5.6 References
DiPippo, R., Small Geothermal Power Plants: Design, Performance and Economics, GHC Bulletin, 1999, pp. 1-8 (http://geoheat.oit.edu/bul-letin/bull20-2/art1.pdf) accessed 7 January 2014.
European Commission/Joint Research Centre (EC/JRC), Materials Roadmap Enabling Low Carbon Energy Technologies, SEC(2011) 1609 final, Brussels, 2011 (http://setis.ec.europa.eu/system/files/Materials_Roadmap_EN.pdf) accessed 7 January 2014.
European Geothermal Energy Council/Technology Platform on Geothermal Electricity (EGEC/TP-Geoelec), Strategic Research Priorities for Geothermal Electricity, EGEC Publications, 2012 (http://egec.info/wp-content/uploads/2012/06/SRA-Geothermal-Electricity.pdf) accessed 7 January 2014.
European Geothermal Energy Council/Technology Platform on Geothermal Electricity (EGEC/TP-Geoelec), Public acceptance of geo-thermal electricity production, Deliverable no. 4.4, Report on public acceptance, EGEC Publications, 2013 (http://www.geoelec.eu/wp-content/uploads/2013/07/Deliverable_4-4_final-public-acceptance-mmi1.pdf) accessed 7 January 2014.
Emerging Energy Research, Global Geothermal Markets & Strategies, 2009-2020, published by IHS Emerging Energy Research, 2009.
JRC13_TMAP_08AP14_P5-NS-Print.indd 39 09/04/2014 16:21:18

40
2013 Technology Map of the European Strategic Energy Technology Plan
Energy Technology Reference Indicators (ETRI) database, 2014.
Electric Power Research Institute (EPRI), Geo-thermal Power: Issues, Technologies, and Opportunities for Research, Development, Dem-onstration, and Deployment, EPRI Publications, 2010 (http://www.gtherm.net/downloads/EPRI_Geothermal_WhitePaper.pdf) accessed 7 Janu-ary 2014.
European Geothermal Energy Council (EGEC), Geothermal Electricity and Combined Heat & Power, EGEC Publications, 2009.
European Geothermal Energy Council (EGEC), Deep Geothermal Market Report 2011, EGEC Publications, 2011 (http://egec.info/publica-tions/) accessed 7 January 2014.
European Geothermal Energy Council (EGEC), Geothermal Market Report 2012, EGEC Publications, 2012 (http://egec.info/publica-tions/) accessed 7 January 2014.
European Geothermal Energy Council (EGEC), Financing Geothermal Energy, EGEC Publications, 2013a (http://egec.info/wp-content/uploads/2013/07/EGEC-policy-paper-on-financing-geothermal_.pdf) accessed 7 January 2014.
European Geothermal Energy Council (EGEC), Position Paper on Commission’s “Communication on Energy Technology and Innovation”, EGEC Publications, 2013b (http://egec.info/wp-content/uploads/2011/03/EGEC-POSITION-PAPER-ON-COMMISSION%E2%80%99S-COMMUNICATION-ON-ENERGY-TECHNOLOGY-AND-INNOVATION.pdf) accessed 7 January 2014.
Fridleifsson, G.Ó., Elders, W.A., Albertsson, A., The Concept of the Iceland deep drilling project, Geothermics (in press), 2013.
Gunnlaugsson, E., Nesjavellir-Vinnsluskýrsla 2011, Reykjavik Energy report 2012-11, 2012a.
Gunnlaugsson, E., Hellisheidi-Vinnsluskýrsla 2011, Reykjavik Energy report 2012-12, 2012b.
International Energy Agency (IEA), Technology Roadmap: Geothermal Heat and Power, IEA Publications, 9, rue de la Fédération, 75739 PARIS CEDEX 15, 2011.
Kagel, A., Bates, D., Gawell, K., A Guide to Geothermal Energy and the Environment. Geothermal Energy Association, 2007 (http://geo-energy.org/reports/environmental%20guide.pdf) accessed 7 January 2014.
Renewable Energy Policy Network for the 21st Century (REN21), Renewables 2013: Global Status report, REN21 Publications, 2013 (http://www.ren21.net/gsr) accessed 7 January 2014.
U.S. Department of Energy (DOE) Geothermal Technologies Office (GTO), 2013 (https://www1.eere.energy.gov/geothermal/powerplants.html) accessed 7 January 2014.
JRC13_TMAP_08AP14_P5-NS-Print.indd 40 09/04/2014 16:21:18
41
6. Marine energy
6.1 Introduction
The ocean contains vast amounts of energy available as kinetic and thermal energy, which can be exploited to produce electricity. Also salinity differences can be used for power generation. Ocean energy has the potential of providing a substantial amount of renewable energy in Europe and around the world.
Europe has abundant marine energy resourc-es in the Atlantic Arc region. Exploiting these resources could be part of an intensifying off-shore power generation in the future, in which marine energy could cover a considerable share of Europe’s low-carbon energy mix. The add-ed value of wave and tidal (W&T) energy for Europe would be its contribution to the decar-bonisation of power generation, the depend-ence on own sustainable resources as well as a business opportunity, including technology export. Furthermore, the deployment of marine energy would contribute significantly to the economic growth of coastal regions.
Although there are many convincing arguments in favour of the development and deployment of marine energy in Europe, there is still wide uncertainty on how this sector will evolve in the long term and how much it will eventually contribute to the European decarbonisation tar-gets. Current installed capacity and short-term projections are very modest. For instance, W&T energy is expected to achieve in 2020 a cumu-lative global capacity of between 140 MW (RenewableUK, 2013) and 240 MW (165 MW tidal and 75 MW wave) (BNEF, 2013). The cur-rent very early stage of marine energy implies that many challenges are ahead, and substan-tial budgets have to be allocated for RD&D, market pull schemes and infrastructure needs.
6.2 Technological state of the art and anticipated developments
Marine energy technologies include W&T ener-gy, ocean thermal energy conversion (OTEC) and osmotic power generation. The last two will be briefly mentioned here, but the focus is ulti-mately on W&T energy. Other forms of marine
energy such as oceanogenic power are being explored, but perspectives for exploitation are not clear yet.
OTEC implies vast resources. The oceans cover around 70 % of the Earth’s surface, absorbing a huge amount of solar insolation in the sur-face layer. Tropical areas are the most favour-able application sites as water temperatures up to 30 °C are achieved. On the other hand, the water temperature at 1 000 m depth is around 5 °C. As the warmer water is at the surface, there are no thermal convection currents, while heat transfer by conduction is low due to the small temperature gradient. OTEC plants use the temperature difference between surface and deep water in a heat cycle to produce elec-tricity. Due to the low temperature difference of 20–25 °C the theoretical efficiency limit is a modest 7–8 %, while in practical terms an efficiency of 2–3 % would be realistic for a mature technology. Parasitic losses due to rela-tively intensive water pumping are relatively high. Also, a long energy payback time could be expected from such an installation. Although research and demonstration efforts are ongo-ing, the author evaluates the perspectives of this technology as slim.
Osmotic power generation is the energy availa-ble from the difference in the salt concentration. In this system, a semipermeable membrane separates the fresh water from the salty water. Due to the difference in osmotic pressure, the fresh water moves through the semipermeable membrane, generating a water flow under pres-sure, which can be converted into kinetic energy in a turbine. This power generation technology can be used in countries with abundant fresh water resources flowing into the sea, such as the Netherlands and Norway. Resources are hence very limited. The world’s first osmotic power plant with a capacity of 4 kW was inau-gurated in 2009 in Tofte, Norway.
A tidal barrage is a barrier similar to a dam, which is built to create a tidal basin in a bay or estuary. The tidal barrage allows water to flow into the basin during high tide and to release it back during low tide. Turbines capture the energy
2013 Technology Map of the European Strategic Energy Technology Plan
JRC13_TMAP_08AP14_P5-NS-Print.indd 41 09/04/2014 16:21:18

42
2013 Technology Map of the European Strategic Energy Technology Plan
as water flows in and out of the basin. Tidal bar-rages have been used for decades now and imply a mature technology. Nevertheless, their potential is limited to few geographically favourable sites. Such power plants have a considerable impact on the ecosystem of the site as they modify the hydrology. They also require intensive civil work. Compared with other renewables, they imply sig-nificant carbon emissions based on a life cycle analysis (LCA). Currently, there is only one com-mercial tidal barrage power plant in Europe. The Rance Tidal Power Station is located in Brittany, France and has a capacity of 240 MW, generating around 500 GWh annually. The barrage was built in 1966 and is 750 m long. This technology is not within the scope of this document. Further on, tidal energy refers to novel technologies installed in favourable tidal stream areas.
The tide generates water flow that can be exploited by hydraulic turbines to generate pow-er. Favourable application sites are those with high flow velocities. Global resources are esti-mated at roughly 1 200 TWh/year (OES, 2012). Nevertheless, resources will increase with the improvements in system design and turbine technology. Wave energy converters capture the energy of surface waves. The potential of wave energy is estimated at 29 500 TWh/year (OES, 2012). Figure 6.1 provides an illustration of W&T energy installations. Further information is avail-able in the SI Ocean report Ocean Energy State of the Art (SI Ocean, 2013). Non-technical issues of W&T energy (environment, policy, public involve-ment, etc.) are tackled within the SOWFIA Project (SOWFIA, 2013).
Table 6.1 gives the author’s assumptions for the W&T energy scenario for the 2020–2050 period. It is assumed that the global cumulative installed capacity would increase from 0.14 GW in 2020 up to 162 GW in 2050. The cumulative capacity would double more than 10 times in this period. Assuming a learning rate of 9 %, the capital costs would decrease from EUR 5 000 to 2 020/kW in the indicated period. It has to be pointed out that
there is a high degree of uncertainty regarding the learning rate of W&T energy systems due to the relatively very low installed cumulative capacity and the lack of historic values. The LCOE of W&T energy systems will be relatively high in the short term (up to 2020). In the medium term (2020–2030), energy costs comparable to offshore wind could be achieved. In the long term (post 2030), W&T energy would achieve energy costs roughly below EUR 0.10/kWh and become commercially competitive with conventional power generation technologies. Exact figures on the life cycle CO2 emissions of W&T energy are not available at this stage, but values roughly below 50 g/kWh can be expected.
Figure 6.1:Tidal and wave energy
concepts: HS1000 tidal turbine installed at EMEC
source: ANDRITZ HYDRO Hammerfest, and winter
testing of two Pelamis machines
Pelamis Wave Power
Table 6.1: Assumptions for the wave
and tidal energy 2020–2050 scenario
2020 2030 2040 2050
EU Installed Capacity (GW) 0.14 15 35 71
Capacity factor (h/y) 2 800 3 200 3 500 3 500
Generated power (TWh/y) 0.34 48 123 249
Share in the EU power mix (%) 0.01 1.1 2.6 5.0
Global installed capacity (GW) 0.12 20 56 142
Global cumulative capacity (GW) 0.12 20 58 162
Capital costs (EUR/kW) 5 000 2 490 2 220 2 020
Levelised cost of electricity (EUR/kWh) 0.18 0.13 0.09 0.07
JRC13_TMAP_08AP14_P5-NS-Print.indd 42 09/04/2014 16:21:22

43
2013 Technology Map of the European Strategic Energy Technology Plan
6.3 Market and industry status and potential
Currently there are few MW of installed W&T energy systems on the global level. These instal-lations are demonstration projects. Table 6.2 gives an example of W&T energy technologies that have been installed in European waters.
Installed W&T capacity is likely to remain mod-est in the short term (RenewableUK, 2013; BNEF, 2013). For 2014–2015, only 61 MW of new capacity is expected on the global level, with 42 MW of this in the United Kingdom (UK). The cumulative capacity expected in 2020 is 140 MW, implying a total sector revenue of around EUR 500 million. This is a setback compared to the estimations of a few years ago predicting 1.3 GW cumulative capacity in 2020. An installed capacity of 15 GW in 2030 as assumed in Table 6.1 can be considered as realistic to optimistic. For the long term, an esti-mate that W&T energy would cover roughly 5 % of the EU power generation in 2050 is realistic. This implies 250 TWh of W&T power. Assuming 3 500 annual full operation hours, the required W&T installed capacity in the EU would be 71 GW in 2050. In this sense, in the short term, activities in the W&T energy sector would basi-cally be on the RD&D level. In the medium term, a relatively small market maintained through market pull schemes will evolve. With deploy-ment bringing cost reductions, emancipation from financial support would materialise. In the long term, a multi-GW annual market would evolve. Initially, the market share of tidal ener-gy can be expected to be larger, but due to the more abundant resources, wave energy could
achieve a higher market share in the longer run. European W&T energy stakeholders include: Marine Current Turbines (Siemens), Andritz Hydro Hammerfest, Tidal Generation Limited (Alstom), Pelamis, Aquamarine Power, Fred Olsen, Scot Renewables, Vattenfall, Openhydro (EDF), Abengoa Seapower, Atlantis Resource Corporation, Voith Hydro, DEME Bluepower, IT Power, Tocardo, Ocean Energy Limited and Minesto, among others. Intensive W&T energy activities are ongoing in the UK, but there is also much activity taking place in the other Atlantic Arc countries. On the global level, interest in W&T energy is high in Australia, Japan, South Korea and the US. Europe is the current market leader both in terms of technology develop-ment and industrial know-how, and in terms of early operation test facilities for the optimisa-tion of performance of different prototypes.
6.4 Barriers to large-scale deployment
In terms of installed capacity, very little is going on in W&T energy. A modest 140 MW cumula-tive capacity is expected for 2020. The lack of installation tools, among other factors, limits further growth. As such, this is a low revenue sector, which makes it difficult to attract stake-holders. This is aggravated through a techno-logical fragmentation with lack of standards for the sector, which limits the potential of econo-mies of scale (RenewableUK, 2013).
Table 6.2:Examples of wave and tidal energy technologies that have been installed in European waters
Developer Projects to date
Pelamis Wave Power, UK 2 Units of 750 kW at EMEC, UK
Ocean Power Technologies, USA 2 Units of 40 kW in the USA and a 150 kW unit in Scotland
Seabased, Sweden Multiple 30 kW devices in Sweden
Aquamarine Power Oyster, UK 1 Unit of 315 kW and another of 800 kW at EMEC, UK
AW Energy WaveRoller, Finland 1 Unit of 300 kW in Portugal
Voith Hydro Wavegen, UK and Germany 1 Plant of 300 kW in Spain and another 500 kW plant in the UK
WavEC, Portugal Onshore OWC Plant of 400 kW in Pico, Azores
Wave Dragon, Denmark 1 Unit of 20 kW in Denmark
Wello Oy, Finland 1 Penguin WEC unit of 500 kW at EMEC, UK
Marine Current Turbines, UK 1 Power plant of 1.2 MW in the UK
Scot Renewables 1 Unit of 250 kW in the UK
Andritz Hydro Hammerfest 1 Unit of 1 MW at EMEC, UK
Tidal Generation Limited 1 Unit of 1 MW at EMEC, UK
JRC13_TMAP_08AP14_P5-NS-Print.indd 43 09/04/2014 16:21:22

44
2013 Technology Map of the European Strategic Energy Technology Plan
Cooperation within the W&T energy sector is underexploited. Currently, many W&T energy stakeholders are excessively focusing on in-house development of components, devices and services, instead of concentrating on their core activities, while seeking the needed part-nerships. Also, cooperation on the European level is relatively underexploited. European pro-jects like SI Ocean may provide a basis for more intensive cooperation in the future. This project targets the elaboration of a strategic technology agenda and a market deployment strategy, among other goals, and will be finalised in July 2014. An effective agenda would require con-sensus and commitment of the stakeholders.
Paving the way for large-scale deployment of W&T energy in Europe implies high infra-structural requirements. These include the upgrade and extension of the grid and the building of ports and maintenance vessels. Thereby, coexistence with other marine activ-ities like marine transport and fishing should be harmonised. Rules and regulations have still to be established.
Bankability under all the above-mentioned bar-riers remains an issue. Gaining the engagement and commitment of financing identities requires device and system developers to provide product and performance warranty. Furthermore, mar-ket pull schemes should be in place. Such risk-sharing conditions would encourage financing identities to engage in the sector.
Overcoming the mentioned barriers requires following short-, medium- and long-term meas-ures. In the short term, budgets for RD&D are required. Thereby, such budgets should encour-age cooperation within the sector. Standards should be established as soon as possible, and research, technology and market deployment agendas should be elaborated under consen-sus and acceptance of the stakeholders. In the medium term, market pull strategies, such as FITs, are required. These should initially be gen-erous to accelerate deployment, but eventu-ally undergo an annual reduction in line with the learning rate and kWh cost evolution of the technology. Thereby, grid and feed-in regula-tions should be established assuring feed-in priority and therefore best resource exploita-tion. Also, budgets should be allocated to build the infrastructure required for the growth of the sector. In the long term, market pull strategies should phase out and the technology should be freed from financial support. Exploitation of resources in deeper waters and farther away from the shore would require extending the infrastructure and related services to such locations. By then, the European power mix will
have a high share of wind energy and PV, so that adding more resources that do not pro-vide electricity on demand under reasonable integration costs will be challenging. This could impose limitations on the long-term growth of W&T energy.
6.5 RD&D priorities and current initiatives
Europe maintains global leadership in W&T ener-gy technologies. This includes the development of W&T energy conversion concepts, system design and engineering, and single and multi-ple device testing. The European wave energy test centres, for example the European Marine Energy Centre (EMEC), the Wave Hub, the Biscay Marine Energy Platform (BiMEP) and the Danish Wave Energy Centre (DanWEC), are state-of-the-art facilities. The latest industry vision paper for Europe is available from the European Ocean Energy Association (EUOEA, 2013).
R&D have already brought a wide variety of W&T energy-conversion technologies. This is an ongoing effort and new concepts can be expect-ed in the future. Many proposed systems have not been tested yet under real operation condi-tions. The evolution from the computer to the lab and from the lab to the water will eventual-ly bring to the market a variety of technologies. Demonstration should include testing of single units under real operation conditions as well as up-scaling to the array level. Accumulation of short- and long-term operation data, such as performance, component and system reliability, and O&M needs, is a required input for design optimisation and cost savings.
Cost and reliability are the main issues in the W&T energy sector today. A realistic target for W&T energy would be to achieve elec-tricity costs comparable to offshore wind in the medium term, while the long-term target should be competitiveness with convention-al power generation technologies. Reducing the LCOE requires reducing the capital costs, improving the CF and reducing the O&M costs. This requires significant technological devel-opments and large-scale deployment of W&T energy to make use of economies of scale. Standardisation is required already at an early stage to achieve a high learning rate as it would allow the supply chain to provide components and services for the W&T energy sector as part of a wider offshore activity (offshore wind power, and offshore oil and gas platforms). In this sense, synergies with these sectors can be exploited as soon as possible.
JRC13_TMAP_08AP14_P5-NS-Print.indd 44 09/04/2014 16:21:22

45
2013 Technology Map of the European Strategic Energy Technology Plan
As an offshore installation, be it floating or submerged, O&M costs for W&T energy sys-tems are high. There is also a limited working window due to strong tides or waves on the installation site, as well as limited availabil-ity of specialised vessels and tools. Therefore, high system reliability is required to achieve competitive electricity costs from W&T power plants. Achieving this in an aggressive saline environment is a challenge and one of the research priorities of the sector.
Accurate resource assessment is a must for favourable implementation of W&T energy in Europe. There is a need for a high-resolution, accurate European W&T energy atlas. This would allow for an accurate quantification of the European W&T energy resources and identifica-tion of the most favourable application sites. The evolution of the technology implies that this process is dynamic, requiring an update of the resource tool in line with technological evo-lution. An up-to-date resource assessment is within the agenda of the SI Ocean project.
6.6 References
Bloomberg New Energy Finance (BNEF), Marine - Research Note. A drop in the ocean – wave and tidal deployment to 2020, 2013.
European Ocean Energy Association (EUOEA), Industry Vision Paper 2013, 2013 (http://www.oceanenergy-europe.eu) accessed 7 January 2014.
Ocean Energy Systems (OES), An International Vision for Ocean Energy, 2012.
RenewableUK, Si-Ocean Wave and Tidal Energy Workshop, Aberdeen, 21 May 2013.
Strategic Initiative of Ocean Energy (SI Ocean), 2013 (http://www.si-ocean.eu/en/) accessed 7 January 2014.
Streamlining Ocean Wave Farm Impact Assessment (SOWFIA), 2013 (http://sowfia.hidro-mod.com/PivotMapViewer/) accessed 7 January 2014.
JRC13_TMAP_08AP14_P5-NS-Print.indd 45 09/04/2014 16:21:22

46
7. Carbon capture and storage in power generation
7.1 Introduction
Fossil fuels, mainly coal and natural gas for power generation, will maintain a crucial role on the short- and medium-term horizons due to the already existing installations, costs and the developed know-how. CCS must be considered a promising technological option to reduce CO2 emissions to the atmosphere from the power generation sector, as well as from heavy indus-tries like cement, iron and steel, paper and pulp, and refineries. The role of CCS in cost-efficient climate mitigation is crucial in all the scenarios, as highlighted in the Energy Roadmap 2050 (EC, 2011b).
CCS is a process consisting of the separation of CO2 from industrial and energy-related gases, from flue gases or as part of the production process, and transport to a storage location, such as a depleted hydrocarbon field or a saline aquifer, for a long-term isolation from the atmosphere (IPCC, 2005). The concept also includes the utilisation of the captured CO2 as a feedstock for industrial applications, the so-called carbon capture and utilisation (CCU). CCS and CCU (CCUS) will play a sig-nificant role in the future use of fossil fuels, together with enhanced or more efficient plants to control climate change. Moreover, CCUS may allow for negative emissions of CO2 if adequately combined with biomass sources (bio-CCS) (ZEP, 2012). To broaden the use of such a technology, there is a need for demonstration projects, innovation and coop-eration among public and private sectors, and public opinion support (EC, 2011b).
7.2 Technological state of the art and anticipated developments
Current CCS technologies could be applied in stationary sources of CO2 emissions. CCS is generally understood as consisting of three major steps: CO2 capture from the energy-conversion process, CO2 transport and CO2 stor-age. For each step there are currently several technology options, with different levels of per-formance and maturity, so numerous constel-lations for a CCS value chain can be envisaged.
Instead of storing it, CO2 has the potential to be used as a technical fluid: as a source of carbon or as a carbonate producer. CCU allows the pro-duction of chemicals with a relatively short life-time, if compared to the scale of CO2 storage: it means that the main advantage of CCU will come from a reduction and delay of CO2 emis-sions as well as from carbonaceous feedstock savings, rather than a ‘complete’ avoidance of CO2 emissions (IPCC, 2005). CCUS projects will have to be analysed from an LCA approach, to guarantee their emissions reduction potential.
The pilot sectors in Europe will be natural gas processing and the power sector, mainly coal power plants, since they allow for demonstra-tion at a lower cost (EC, 2011b; IEA, 2012a). Around 30 projects need to be implemented by 2020 to accomplish the environmental objec-tives and to be cost competitive after 2020 (ZEP, 2011b; IEA, 2013c). The major compo-nents of CCUS technology are presented in the following sub-sections.
Capture
Currently there are four main categories for the capture of CO2 in power plants. Due to high costs and efficiency penalties, retrofitting has to be taken into account when the lifespan of the plant is still long enough and the upgrades are substantial (EC, 2013a). The common chal-lenges are how to deal with impurities (NOx, sulphur dioxide (SO2), particulates), regarding the different requirements of the CO2 capture approach selected, and how to scale up current CO2 capture techniques, developed and proven to work at smaller capacities than what is emit-ted from an average fossil fuel power plant (up to 500 MW) (Yang et al., 2008; Spigarelli and Kawatra, 2013).
• Post-combustion capture involves remov-ing the CO2 from flue gases after fuel com-bustion with air. Flue gases are at low pres-sure, high temperature (around 120–180 °C) and CO2 composition is between 3 and 20 % in volume. Post-combustion techniques are appropriate for CO2 capture from indus-trial operations. It is considered that this
2013 Technology Map of the European Strategic Energy Technology Plan
JRC13_TMAP_08AP14_P5-NS-Print.indd 46 09/04/2014 16:21:22

47
technique will have the highest development since it can be used as a retrofit solution for fossil fuel combustion plants with little plant modification. Current post-combustion meth-ods comprise chemical absorption, physical adsorption, gas separation membranes and cryogenic distillation. Chemical absorption with amines is the most mature technique. Concerning the adsorption processes, the utilised adsorbents are zeolites, activated carbon, amine functionalised adsorbents and metal organic frameworks. Membranes can be of organic or inorganic origin, a mixture of them, or use a combination of a membrane with an absorption liquid, like an amine. And finally, cryogenic distillation, analogously to air cryogenic separation into its components, separates CO2 physically based on dew and sublimation points.
• Pre-combustion capture involves the cap-ture of CO2 from a synthesis gas stream, called syngas, produced through gasification of solid fuels or through steam reforming of natural gas. The most common application is at an integrated gasification combined-cycle (IGCC) plant. The syngas, mainly a mixture of CO and H2, is treated to produce a stream of CO2 and H2 in a water–gas–shift (WGS) reac-tor. Then, the CO2 is usually separated using physical absorption, due to the high partial pressure of the CO2. This has been proved at industrial scale. Other possibilities for CO2 separation include: adsorption on solid mate-rials, such as zeolites or activated carbon, and membranes. The resultant H2 stream can be further purified or used to produce electricity in a gas turbine. A pre-combustion technique to separate CO2 can be used to remove acid compounds, resulting in process intensifica-tion. However, the retrofit of pre-combustion techniques to existing plants may result in further changes, with consequent implica-tions for costs.
Table 7.1: Illustrative cost parameters for CCS projects (in EUR2012)
Source: EIA, 2013.
• Oxy-fuel combustion is a newer approach. The technology aims to produce a purer CO2 stream after combustion using an O2/CO2 stream instead of air. As a result, the flue gas contains CO2 at higher proportions (75–80 %), water vapour and only traces of impurities; therefore, relatively simple purification of CO2 is needed before storage. The process com-prises air separation, combustion of the fuel and CO2 recycling to dilute the pure oxygen. This process suggests high efficiency lev-els and offers major business opportunities, including the possibility of retrofitting exist-ing plants, even if the higher temperatures obtained with the oxygen combustion can be an issue. The main disadvantage is the large quantity of oxygen required, which is expen-sive both in terms of capital costs and energy consumption. There are three main oxy-fuel combustion pilot demonstration plants in the EU: Schwarze Pumpe in Germany, CIUDEN in Spain and Lacq in France.
• In chemical looping combustion the need-ed oxygen for the combustion is transferred by an oxygen carrier, generally an oxidised metal. As air is not used, the CO2 produced contains water vapour and the reduced met-al oxide. Therefore, purification only implies condensation of water. Some common met-als used are iron, nickel, cobalt, copper, man-ganese and cadmium, driving to different working conditions of pressure and tempera-ture. This technology is still in the R&D phase.
Table 7.1 shows representative cost values for CCS demonstration projects in large pow-er plants, including investment and operating costs. According to the report from ZEP (2011b), regarding the allocation of investment costs (CapEx) among echelons for coal and natural gas plants, the main contribution comes from the capture step (75–78 % contribution to the total CapEx), followed by transport (5–10 %) and storage (15–18 %).
2013 Technology Map of the European Strategic Energy Technology Plan
Nominal capacity
(MW)
Overnight capital cost (EUR2012/kW)
Fixed operating and maintenance
costs (EUR2012/kW-year)
Variable operating and maintenance
costs (EUR2012/MWh)
Pulverised coal (PC)-CCS (advanced, single unit) 650 4 051 62.4 7.4
IGCC-CCS (single unit) 520 5 114 56.44 6.5
Natural gas combined cycle (NGCC)-CCS (advanced CC)
340 1 624 24.64 5.3
JRC13_TMAP_08AP14_P5-NS-Print.indd 47 09/04/2014 16:21:22

48
2013 Technology Map of the European Strategic Energy Technology Plan
Transport
CO2 is already transported for commercial purposes by road tanker, ship and pipeline. Among them, pipeline is the most important means of transport for development of an integrated infrastructure (EC, 2011a). Since potential CO2 storage sites are not evenly distributed across Europe and the most important CO2 producers do not necessarily belong to the countries with higher storage potential, the construction of a European CO2 transport infrastruc-ture spanning state borders and in the maritime environment would be necessary for large-scale CCS deployment (EC, 2010).
Even though hydrocarbons pipelines have been extensively used to transport CO2, for instance for enhanced oil recovery (EOR) in the US, in the North Sea or in the Netherlands, it is necessary to re-qualify and inspect them for integrity assess-ment and materials evaluations. The CO2 stream has impurities that need to be limited regarding its final use/storage. In addition, existing CO2 pipelines work at 85–150 bar, while natural gas pipelines work at 85 bar or less. An accurate systematic estimation of the costs for CO2 pipelines deploy-ment at large scale is still lacking. Extrapolating natural gas data, a CO2 pipeline investment can be between EUR 0.59 and 2.98 million/km, depending on the pipe diameter and the characteristics of the field (EC, 2011a). Assuming a transportation distance of 180 km onshore, and a small volume of CO2 (2.5 million tonnes (Mt)/year), the cost can be over EUR 5/t of CO2. Offshore pipelines can be of EUR 9.5/t of CO2. For ships, the transportation cost is less dependent on distance (ZEP, 2011b).
Storage
Geological CO2 storage projects have already been initiated in Europe and worldwide. Different types of geological formations are being used and investigated, especially oil and gas reservoirs, deep saline aquifer for-mations and un-mineable coal beds. There is an estimated global storage potential of 10 000 gigatonnes (Gt) CO2, with 117 Gt in Europe (Vangkilde-Pedersen et al., 2009), nearly all of which is in depleted oil and gas reservoirs and saline aquifers. For the 2030 horizon, CCS will have to be routinely imple-mented; the estimated emissions stored will be in the amount of 2 000 Mt CO2/year. For the 2050 horizon, CCS will have to be further used, reaching 7 000 Mt CO2/year stored (IEA, 2013c). Compressed CO2 is already injected into porous rock formations by the oil and gas industry, for EOR, and has been proven at commercial scale. Typical storage costs per tonne of CO2 range from EUR 1.0–7.0 for onshore storage in depleted oil and gas reservoirs with legacy wells, rising up to EUR 6.0–20.0 for offshore storage in saline aquifers (ZEP, 2011a).
CO2 infrastructure implementation involves transmission capability and location of stor-age sites and should consider the trade-off between source of CO2 (old power plants suitable for retrofitting or new installations), place of storage, safety and public accept-ance. It is crucial to provide a secure envi-ronment for long-term CCUS projects, and this implies having a consolidated network — that is, transport network and storage sites (ZEP, 2013b). Current initiatives aim at creating a carbon atlas, to overlook sources, pipelines and storage sites’ locations (EC, 2013c).
Figure 7.1: CO2 avoidance costs for
three types of plants, built in the middle 2020s
Source: JRC, based on ZEP, 2011b.
Figure 7.1 characterises the CO2 avoidance cost, which is the break-even price at which CO2 emis-sions have to be traded to justify the investment in power plants with CCS. Note that plants with coal are closer to being commercially viable. The values represented in Figure 7.1 are mainly influ-enced by technology and feedstock prices.
JRC13_TMAP_08AP14_P5-NS-Print.indd 48 09/04/2014 16:21:23
49
2013 Technology Map of the European Strategic Energy Technology Plan
Utilisation
CO2 can be employed as source of carbon in the synthesis of chemicals and fuels, as a basis in biological processes and in inorganic processes like mineralisation. The formation of carboxylates, lactones, carbonates or urea is exothermic, while the formation of methanol, CO, methane (CH4) or other hydrocarbons requires extra energy. Current CO2 utilisation research relies on the use of excess electric energy or electricity from renewable sources to integrate CO2 reduction and water splitting, to use CO2 as an H2 carrier. In the longer term, the alternatives to develop will be a synthetic photosynthesis, comprising the use of natural photosynthetic microorganisms for CO2 fixation (like microalgae), the use of hybrid systems (enzymes and synthetic systems for a faster process), and the use of complete syn-thetic systems that mimic nature (for instance, photochemical and photoelectrochemical sys-tems) (Aresta et al., 2013). Mineral carbonation or chemical weathering of rocks is a natural process that converts, for instance, magnesium silicates or calcium silicates into a solid carbonate (lime-stone) using CO2. It takes place over years, but it is able to be accelerated by using the appropri-ate catalysers and reaction conditions (Yang et al., 2008). Graphene is a single atomic plane of graphite, a versatile state-of-the-art nanomate-rial with good electrical, optical and mechanical properties (Geim, 2009). As it is based on carbon, graphene production implies a potential use of CO2 as raw material. CCU techniques have to make sure that the integration of carbon capture with utilisation processes:
• does not add more emissions to the atmosphere than the global balance of the original process;
• results in a long-term storage option for the CO2 (CSLF, 2011).
7.3 Market and industry status and potential
In the EU, 87.4 % of CO2-eq. emissions corre-spond to fossil fuel combustion. Energy industries generate 34.5 %, followed by transport (22.7 %), and manufacturing and construction industries (22.7 %). The remaining 12.6 % mainly comes from other industrial processes and solvent use (5.3 %) and from international maritime transport (3.9 %) (EC, 2012).
Due to their importance and comparatively higher emissions, the first CCS plants will be installed in coal power plants. Coal power plants are respon-sible for around one quarter of the worldwide anthropogenic CO2 emissions — that is, more than 8.5 Gt annually (IEA, 2012c). In addition to that, coal demand is predicted to increase up to 180 exajoules (EJ) in 2017 (being of 150 EJ in
2010) (IEA, 2012b). Coal technologies will con-tinue to dominate the growth in power genera-tion. Nevertheless, the course followed by new coal plants’ implementation is contradictory to the transition towards a low-carbon economy; half of the coal plants built in 2011 worldwide use inefficient technologies. Natural gas, due to the ‘shale gas boom’ is displacing coal in some regions (IEA, 2013b). Anthropogenic CO2 used for industrial purposes (mainly for the synthesis of salicylic acid, in the Solvay process to pro-duce sodium carbonate (Na2CO3) and for urea production) represents 0.625 % of the total CO2 production worldwide (which is around 200 Mt/year). It is expected to increase up to 0.94 % (300 Mt/year) in the short term and in the best scenario (Aresta et al., 2013).
From an emissions mitigation point of view, it is important to consider the geographical profile of fossil fuel reserves and, hence, the most significant locations for fossil fuel use and deployment of CCS. Since a number of emerging economies and developing countries have significant fossil fuel reserves, the larg-est deployment of CCS will need to happen in non-Organisation for Economic Co-operation and Development (OECD) countries, with China as the main contributor (IEA, 2012a, 2013c).
According to the Carbon Sequestration Leadership Forum (CSLF) as of July 2013, there are 38 active and completed recognised pilot-scale projects, large-scale projects, and partnerships or col-laborations worldwide that look into different echelons of the CCS value chain. See Table 7.2 for further details about the ongoing large-scale projects in Europe. According to the European Commission (EC, 2013b), by January 2013, 59 projects were under identification, evaluation or definition around the world, of which 17 are in Europe. Globally, all the projects have to date stored up 50 Mt CO2. From more than 20 oper-ating small-scale demonstration CCS projects, only 2 are in Europe and none in EU territory (EC, 2013a).
According to the EU Energy Roadmap 2050, CCS from the power sector will contribute with 19–32 % of the GHG emissions reduction by 2050. The installed capacity will have to grow from 3 GW in 2020 to 3–8 GW in 2030, 22–129 GW in 2040 and 50–250 GW in 2050, depending on the energy system scenario (EC, 2013b). This would require about 20 000 km of pipeline infrastructure (ZEP, 2013b). The IEA CCS Technology Roadmap (IEA, 2013c) points out that the capture of CO2 has to be successfully demonstrated in at least 30 projects from power and industry sectors by 2020.
JRC13_TMAP_08AP14_P5-NS-Print.indd 49 09/04/2014 16:21:24

50
2013 Technology Map of the European Strategic Energy Technology Plan
The ZEP (2013b) states that in order to achieve the goal of a commercial CCS technology by 2020, action must be taken now, with active short-term policies and RD&D strategies to start with implementation of the adequate infrastructure. For the upcoming years, it will be important to:
• demonstrate integrated projects (regard-ing the complete value chain) to overcome unclear operational patterns;
• support the deployment of CO2 infrastructure;
• define a specific business case for CCS deployment;
• take advantage of knowledge sharing and of private–public partnerships;
• maximise the benefits (and the development) of local communities, going for a societal point of view;
• perform a clear (stable) legal framework;
• gain public implication and acceptance (IEA, 2012a; ZEP, 2013a; EC, 2013a, 2013b; IEA, 2013a).
Power plants equipped with CCS will compete with conventional power plants for a share in power generation capacity if they become com-mercially viable within a carbon pricing frame-work such as the EU Emissions Trading Scheme (EU ETS). The emission price should be as high as needed to motivate the implementation of CCS technology (i.e. to equate the technology cost). The current situation is not favourable with a price of less than EUR 5/t of CO2-eq., due to the economic crisis. The price has decreased from around EUR 30/t in 2008. It suggests that initial publicly funded incentives are needed to make the investment commercially attractive and to reach the needed technological maturity (ZEP, 2013a).
7.4 Barriers to large-scale deployment
Financial, regulatory, infrastructure, environ-mental and social issues are challenges for CCS demonstration and deployment. The identified barriers can be classified as follows (CSLF, 2011; EC, 2011b, 2013a; IEA, 2013a).
• Inadequate legal/regulatory frameworks and financing tools to bridge the gap towards com-mercialisation. The lack of political commit-ment to CCS by some Member States, prob-lems in permitting procedures, no financial
Table 7.2: Example of large-scale
CCUS projects in Europe recognised by the CSLF as
of July 2013. Their main purpose is to serve as
demonstration plants to help in the development
of guidelines and protocols, and to perform
risk analyses, for one source–one sink and large
integrated projects.
Source: CSLF, 2013.
Location Supporters Name of the project Characteristics CO2 captured
Rotterdam (Netherlands)
Netherlands (lead), Germany
CCS Rotterdam Project
Implementation of a large-scale ‘CO2 Hub’ for capture, transport, utilisation and storage of CO2,
with different point sources connected to multiple storage
sites.
Reduce Rotterdam emissions
by 50 % (the amount of 1990)
by 2025
North Sea (Norway)
Norway (lead), European
CommissionCO2 STORE
It follows the Sleipner project. It aims at gaining knowledge on geochemistry and dissolution processes by monitoring CO2
migration onshore and offshore. The result is the development of methodologies for assessment,
planning and monitoring.
1 Mt/year
Potential sites in UK,
Germany and Norway
European Commission
(lead), NorwayDynamis
This is the first phase of the program Hypogen, which aims
to construct and operate a commercial-scale power plant
with H2 production and CO2 management.
3 Mt/year (producing 400 MW of
electricity and 50 MW of H2-
HHV)
Rotterdam (Netherlands)
Netherlands (lead), European
Commission
Rotterdam Opslag en Afvang
Demonstratieproject (ROAD)
The project includes capture of CO2 from a coal power plant, pipeline transportation and
offshore storage in a depleted natural gas reservoir.
1.1 Mt/year
North-eastern Italy
Italy (lead), European
Commission
Zero Emission Porto Tolle Project (ZEPT)
It exemplifies a retrofitting example of a power plant of
660 MW with post-combustion techniques in 40 % of the flue gas. The storage place is a deep saline
aquifer.
1 Mt/year
JRC13_TMAP_08AP14_P5-NS-Print.indd 50 09/04/2014 16:21:24

51
2013 Technology Map of the European Strategic Energy Technology Plan
compensations for the additional capital and operational costs associated with CCS, and ETS quotas too far from motivating carbon abatement are the main drawbacks.
• High investment and operational costs. As CCS technologies have not yet been demonstrated on a commercial scale, all reported cost fig-ures are estimates. They are based on the scaling-up of smaller similar components and facilities used in other sectors or on experts’ judgment. The first CCS coal plant genera-tion is expected to be between 60 and 100 % more expensive than analogous conventional plants, while a natural gas plant with post-combustion is expected to be twice its analo-gous conventional plant. By 2050, the capital costs of pre- and post-combustion coal plants with CCS could be reduced by almost 20 % from those of the first market entrants. The corresponding reduction for gas plants could be around 10 %.
• High energy penalty. The addition of capture, transport and storage of CO2 to the power plant implies extra energy consumption; an LCA should evaluate the balance of emissions.
• Need for human and institutional capacity. The development of expertise through international collaborations and public-private partnerships are crucial to move forward.
• Lack of public awareness, understanding and support. Securing public confidence in many Member States is another key social and political challenge, as confirmed by a Eurobarometer survey on CCS (TNS, 2011). While nearly half of the respondents agree that CCS could help to combat climate change, the survey observes that 61 % of people would be worried if an underground storage site for CO2 were to be located within 5 km of their home. As a result of public opposi-tion, a number of projects that envisaged CO2 storage have been cancelled. This barrier was overcome in some cases when extensive information campaigns took place, or when CO2 will be stored offshore. Education on cli-mate change and communication are needed.
• Lack of CO2 transport infrastructure, limited geologic storage experience and limited work on CCU. The CO2 infrastructure still needs to be developed to assure storage and risk manage-ment for possible CCS investors. Estimation of storage capacity and demonstration of storage integrity are needed. At its turn, the work on CCUS is just starting.
7.5 RD&D priorities and current initiatives
More efficient and cost-competitive CCS tech-nologies have to be developed through ongo-ing RD&D to reach and maintain the desired level of competitiveness required by the Energy Roadmap 2050. As general remarks, there is a need for cost-effective capture processes, decrease of efficiency penalty, innovative uti-lisation technologies and safety assessment of CO2 storage. Specifically (EC, 2013b):
• Demonstration priorities in capture technolo-gies. These should include the development of efficient solvent systems and processes for post- and pre-combustion capture. Large-scale demonstration of oxy-fuel boilers for power plants and industry sectors and chemical loop-ing are needed.
• Development of pilot projects for second- and third-generation technologies for carbon cap-ture, to decrease costs and increase efficiency. These involve the testing of new/optimised solvents, sorbents and membranes, and new process designs and integrated power plants.
• Feasibility demonstration for power plants combined with CCS using biomass as feed-stock. This will allow defining the tools and characteristics to conceive neutral and even carbon-negative plants, using 100 % biomass streams at small scales or co-combustion of biomass with coal.
• CO2 transport. More experience here will enhance safety and, as a consequence, pub-lic acceptance. Research includes design of materials suitable to handle CO2 with different levels of impurities, to avoid pipe rupture and longitudinal cracking.
• CO2 storage. The assessments of the poten-tial and site characterisation (atlas of CO2 storage) are basic steps. Pilots, large-scale demonstrations, effective monitoring tech-niques and models that describe the behav-iour on injected CO2 at different scales are needed. Especially important are pressure management, co-optimisation of EOR and CO2 storage, CO2 migration, diffusion, flu-id–rock interactions, cap rock integrity and prediction of leakage mechanisms.
• Development of economically viable technolo-gies for CCUS. The development at larger scale of the relatively new methods will pass through a step forward in catalysts research. Particularly important is carbonation of magnesium silicates and calcium silicates, as a large-scale solution with no need for monitoring.
JRC13_TMAP_08AP14_P5-NS-Print.indd 51 09/04/2014 16:21:24

52
2013 Technology Map of the European Strategic Energy Technology Plan
The European Industrial Initiative on CCS (CCS EII), which was launched on 3 June 2010, has two strategic objectives:
• to enable the cost-competitive deployment of CCS after 2020,
• to further develop the technologies to allow appli-cation in all carbon-intensive industrial sectors.
Specific tasks of the EII include:
• identification of priority actions;
• synchronisation of agendas through coordina-tion of timeline and actions;
• identification and management of synergies between ongoing activities and possible inter-dependencies on risks between activities;
• monitoring and reporting of progress to stake-holders in reaching EII objectives.
The role of industry and several other stake-holders in the deployment of CCS in Europe is consolidated through the European Technology Platform for Zero Emission Fossil Fuel Power Plants (ZEP ETP). On the global level, the EU has a strong presence at the CSLF, which is comprised of 25 members, including 24 coun-tries and the European Commission. The Global CCS Institute aims to connect parties around the world to address issues and learn from each other to accelerate the deployment of CCS projects.
7.6 References
Aresta, M., Dibenedetto, A., Angelini, A., The changing paradigm in CO2 utilization. Journal of CO2 Utilization (in press), 2013 (http://dx.doi.org/10.1016/j.jcou.2013.08.001) accessed 7 January 2014.
Carbon Sequestration Leadership Forum (CSLF), Strategic Plan Second Update 2011-2016, 2011 (http://www.cslforum.org/publications/) accessed 7 January 2014.
Carbon Sequestration Leadership Forum (CSLF), Active and Completed CSLF Recognized Projects (as of July 2013), 2013 (last updated version avail-able at: http://www.cslforum.org/publications/doc-uments/CSLFRecognizedProjectsDecember2013.pdf) accessed 7 January 2014.
European Commission (EC), Energy infrastructure priorities for 2020 and beyond – A Blueprint for an integrated European energy network, accom-panying the document ‘Communication from the Commission to the European Parliament, the Council, the European Economic and Social Committee and the Committee of the Regions’, COM(2010) 677 final, Brussels, 2010.
European Commission (EC), Technical and Economic Characteristics of a CO2 Transmission Pipeline Infrastructure, JRC Scientific and Technical Reports, Luxembourg: Publications Office, 2011a.
European Commission (EC), Energy Roadmap 2050. Impact assessment and scenario analysis, accompanying the document ‘Communication from the Commission to the Council, the European Parliament, the European Economic and Social Committee and the Committee of the Regions’, Brussels, SEC(2011) 1565 final, 2011b.
European Commission (EC), EU energy in fig-ures. Statistical pocketbook 2012, 2012a (http://ec.europa.eu/energy/publications/doc/2012_energy_figures.pdf) accessed 7 January 2014.
European Commission (EC), Consultative Communication on the future of Carbon Capture and Storage in Europe, MEMO/13/276, Brussels, 2013a (http://europa.eu/rapid/search.htm) accessed 7 January 2014.
European Commission (EC), Energy technology developments beyond 2020 for the transition to a decarbonised European energy system by 2050, Technology Assessment, 2013b (http://ec.europa.eu/energy/technology/strategy/doc/swf_2013_0158_en.pdf) accessed 7 January 2014.
European Commission (EC), Strategic Energy Technologies Information System; European Industrial Initiative on carbon capture and stor-age, last update 23 September 2013, 2013c (http://setis.ec.europa.eu/implementation/tech-nology-roadmap/european-industrial-initiative-on-carbon-capture-and-storage) accessed 25 September 2013.
Geim, A.K., ‘Graphene: Status and Prospects’, Science, Vol. 324, No 5934, 2009, pp. 1530-1534.
International Energy Agency (IEA), A policy strat-egy for carbon capture and storage. Information paper, Paris: Organisation for Economic Co-operation and Development / International Energy Agency, 2012a (http://www.iea.org/pub-lications/freepublications/) accessed 7 January 2014.
JRC13_TMAP_08AP14_P5-NS-Print.indd 52 09/04/2014 16:21:24

53
2013 Technology Map of the European Strategic Energy Technology Plan
International Energy Agency (IEA), Carbon cap-ture and storage. Legal and Regulatory Review (Edition 3), Paris: Organisation for Economic Co-operation and Development / International Energy Agency, 2012b (http://www.iea.org/pub-lications/freepublications/) accessed 7 January 2014.
International Energy Agency (IEA), CCS Retrofit. Analysis of the Globally Installed Coal-Fired Power Plant Fleet, Paris: Organisation for Economic Co-operation and Development / International Energy Agency, 2012c (http://www.iea.org/pub-lications/freepublications/) accessed 7 January 2014.
International Energy Agency (IEA), Redrawing the energy-climate map. World Energy Outlook Special Report, Paris: Organisation for Economic Co-operation and Development / International Energy Agency, 2013a (http://www.worldener-gyoutlook.org/energyclimatemap/) accessed 7 January 2014.
International Energy Agency (IEA), Tracking Clean Energy Progress 2013. IEA Input to the Clean Energy Ministerial, Paris: Organisation for Economic Co-operation and Development / International Energy Agency, 2013b (http://www.iea.org/etp/tracking/) accessed 7 January 2014.
International Energy Agency (IEA), Technology Roadmap. Carbon capture and storage. 2013 edition, Paris: Organisation for Economic Co-operation and Development / International Energy Agency, 2013c (http://www.iea.org/road-maps/) accessed 7 January 2014.
Intergovernmental Panel For Climate Change (IPCC), Special Report on Carbon Dioxide Capture and Storage, prepared by Working Group III of the Intergovernmental Panel on Climate Change (Metz, B., O. Davidson, H.C. de Coninck, M. Loos, and L.A. Meyer (eds)), Cambridge University Press, Cambridge, United Kingdom and New York, NY, USA, 2005.
Spigarelli, B. P., Kawatra, S. K., ‘Opportunities and challenges in carbon dioxide capture’, Journal of CO2 Utilization 1, 2013, pp. 69-87.
TNS, Special Eurobarometer 364 / Wave 75.1, Public Awareness and Acceptance of CO2 capture and storage, Brussels: TNS Opinion & Social, 2011 (http://ec.europa.eu/public_opinion/archives/ebs/ebs_364_en.pdf) accessed 7 January 2014.
U.S. Energy Information Administration (EIA), Updated Capital Cost Estimates for Utility Scale Electricity Generating Plants, US Department of Energy, Washington, DC, 2013.
Vangkilde-Pedersen, T., Kirk, K., Smith, N., Maurand, N., Wojcicki, A., Neele, F., Hendriks, C., LeNindre, Y.-M., Antonsen, K.L., EU GeoCapacity project – Assessing European Capacity for Geological Storage of Carbon Dioxide, D42 GeoCapacity Final Report, 2009 (http://www.geology.cz/geocapacity) accessed 7 January 2014.
Yang, H., Xu, Z., Fan, M., Gupta, R., Slimane, R.B., Bland, A.E., Wright, I., ‘Progress in carbon dioxide separation and capture: A review’, Journal of Environmental Sciences, Vol. 20, 2008, pp. 14-27.
Zero Emissions Platform (ZEP), The Costs of CO2 Storage, Joint study between IEAGHG and ZEP, Brussels: European Technology Platform for Zero Emission Fossil Fuel Power Plants, 2011a.
Zero Emissions Platform (ZEP), The Costs of CO2 Capture, Transport and Storage, Joint study between IEAGHG and ZEP, Brussels: European Technology Platform for Zero Emission Fossil Fuel Power Plants, 2011b.
Zero Emissions Platform (ZEP), Biomass with CO2 Capture and Storage (Bio-CCS). The way for-ward for Europe, Brussels: European Technology Platform for Zero Emission Fossil Fuel Power Plants, 2012.
Zero Emissions Platform (ZEP), Accelerating the demonstration of CO2 geological storage in Europe. The case for up to six new storage pilots, Brussels: European Technology Platform for Zero Emission Fossil Fuel Power Plants, 2013a.
Zero Emissions Platform (ZEP), Building a CO2 transport infrastructure for Europe, Brussels: European Technology Platform for Zero Emission Fossil Fuel Power Plants, 2013b.
JRC13_TMAP_08AP14_P5-NS-Print.indd 53 09/04/2014 16:21:24
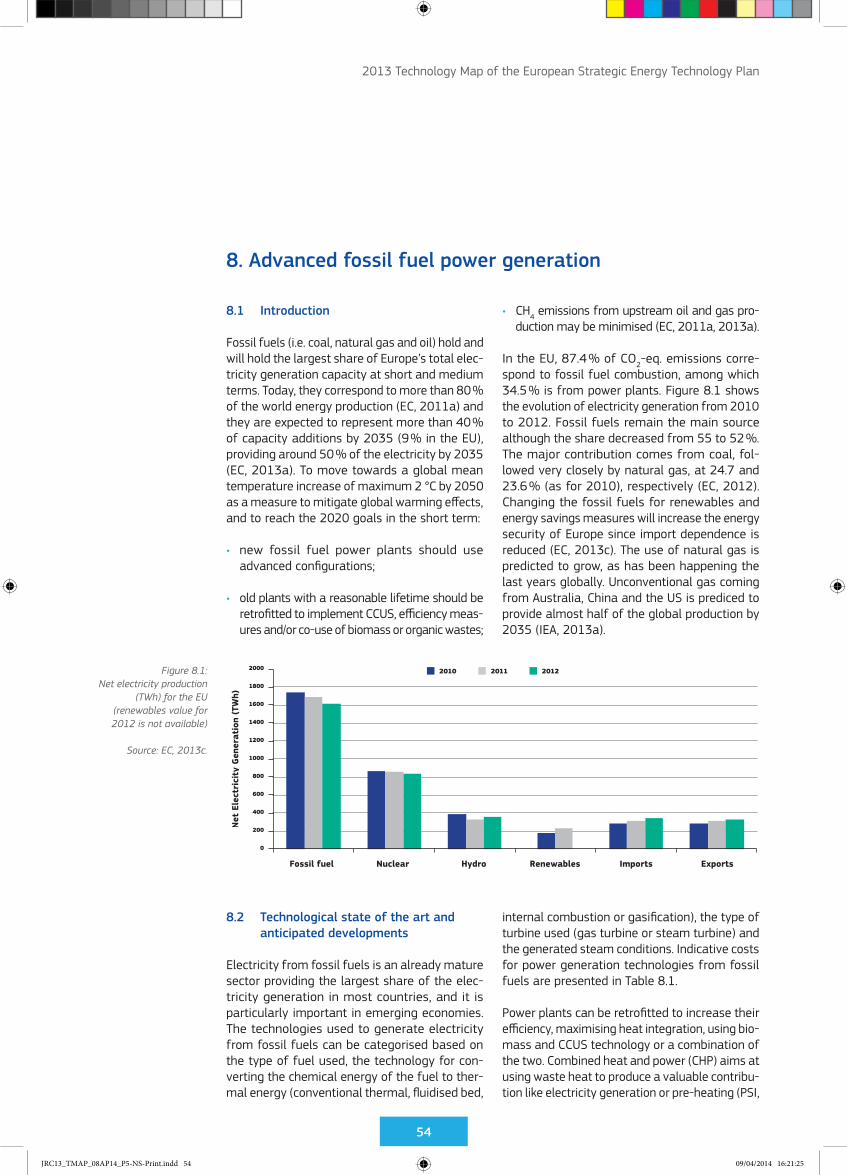
54
8.1 Introduction
Fossil fuels (i.e. coal, natural gas and oil) hold and will hold the largest share of Europe’s total elec-tricity generation capacity at short and medium terms. Today, they correspond to more than 80 % of the world energy production (EC, 2011a) and they are expected to represent more than 40 % of capacity additions by 2035 (9 % in the EU), providing around 50 % of the electricity by 2035 (EC, 2013a). To move towards a global mean temperature increase of maximum 2 °C by 2050 as a measure to mitigate global warming effects, and to reach the 2020 goals in the short term:
• new fossil fuel power plants should use advanced configurations;
• old plants with a reasonable lifetime should be retrofitted to implement CCUS, efficiency meas-ures and/or co-use of biomass or organic wastes;
8. Advanced fossil fuel power generation
• CH4 emissions from upstream oil and gas pro-duction may be minimised (EC, 2011a, 2013a).
In the EU, 87.4 % of CO2-eq. emissions corre-spond to fossil fuel combustion, among which 34.5 % is from power plants. Figure 8.1 shows the evolution of electricity generation from 2010 to 2012. Fossil fuels remain the main source although the share decreased from 55 to 52 %. The major contribution comes from coal, fol-lowed very closely by natural gas, at 24.7 and 23.6 % (as for 2010), respectively (EC, 2012). Changing the fossil fuels for renewables and energy savings measures will increase the energy security of Europe since import dependence is reduced (EC, 2013c). The use of natural gas is predicted to grow, as has been happening the last years globally. Unconventional gas coming from Australia, China and the US is prediced to provide almost half of the global production by 2035 (IEA, 2013a).
8.2 Technological state of the art and anticipated developments
Electricity from fossil fuels is an already mature sector providing the largest share of the elec-tricity generation in most countries, and it is particularly important in emerging economies. The technologies used to generate electricity from fossil fuels can be categorised based on the type of fuel used, the technology for con-verting the chemical energy of the fuel to ther-mal energy (conventional thermal, fluidised bed,
internal combustion or gasification), the type of turbine used (gas turbine or steam turbine) and the generated steam conditions. Indicative costs for power generation technologies from fossil fuels are presented in Table 8.1.
Power plants can be retrofitted to increase their efficiency, maximising heat integration, using bio-mass and CCUS technology or a combination of the two. Combined heat and power (CHP) aims at using waste heat to produce a valuable contribu-tion like electricity generation or pre-heating (PSI,
2013 Technology Map of the European Strategic Energy Technology Plan
Figure 8.1: Net electricity production
(TWh) for the EU (renewables value for 2012 is not available)
Source: EC, 2013c.
Fossil fuel Nuclear Hydro Renewables Imports Exports
Net
Ele
ctri
city
Gen
erat
ion
(TW
h)
JRC13_TMAP_08AP14_P5-NS-Print.indd 54 09/04/2014 16:21:25

55
2013 Technology Map of the European Strategic Energy Technology Plan
2008) (see Chapter 14 for more information). Feedstock supply chains must also be consid-ered for costs and GHG emissions control. New (and better) extraction methods are important to predict the impact as a whole of a power plant. Table 8.2 sums up a representative range of sources and their estimated extraction cost. The most expensive are undiscovered resources of natural gas and oil, followed by shale gas and oil. The cheapest options remain coal, oil and traditional methods of extraction.
Coal
Traditional power plants operate at sub-criti-cal pressure, using different reactor designs: pulverised coal (PC), fluidised bed boilers and
grate-fired boilers. PC plants are the main fossil fuel plants used in the world and in the EU, where water circulating through the boiler is heated to produce steam below its critical pressure, 22.1 megapascal (MPa). The thermal efficiency is around 38 % in terms of net lower heating value (LHV). PC plants still represent the largest market share of new plants. Fluidised bed combustion (FBC) plants are intrinsically working at lower tem-peratures than PC plants (800–900 ºC). This lower combustion temperature reduces the production of NOx compared to PC plants, but increases the amount of nitrous oxide (N2O). There is less production of sodium oxides (SOx) if limestone or dolomite is added to the feedstock.
Table 8.1: Indicative capital and operational costs for fossil fuel power generation technologies
Sources: Parsons Brinckerhoff, 2011, World Energy Council, 2013 and EIA, 2013b.
Table 8.2: Estimation of extraction costs
Source: Gracceva, 2013.
Nominal capacity
(MW)
Overnight capital cost (EUR2012/kW)
Fixed operating and maintenance
costs(EUR2012/kW-year)
Variable operating and maintenance
costs (EUR2012/MWh)
Advanced PC (single unit) 650 2 516 29.3 3.5
Advanced PC (dual unit) 1 300 2 274 24.2 3.5
IGCC (single unit) 600 3 100 48.2 5.6
IGCC (dual unit) 1 200 2 933 39.8 5.6
NGCC (conventional) 620 711 10.2 2.8
NGCC (advanced gas turbine) 400 793 11.9 2.5
Conventional combustion turbine 85 754 5.7 12.0
Source Extraction method Cost (€2012/GJ)
Hard coalReserves 0.7–3.1
Resources 0.9–3.3
Natural gas
Reserves 1.0–3.6
ER/reserves growth 3.9–7.0
Undiscovered resources/new discovery 1.2–5.8
Coal-bed methane 2.3–6.2
Tight gas 2.3–6.2
Shale gas 3.5–19.4
Oil
Reserves 0.7–6.7
ER/reserves growth 3.4–10.9
Undiscovered resources/new discovery 1.4–10.5
Oil sands 3.3–3.7
Extra-heavy oil 1.9–5.8
Oil shale 8.7–12.9
JRC13_TMAP_08AP14_P5-NS-Print.indd 55 09/04/2014 16:21:25

56
2013 Technology Map of the European Strategic Energy Technology Plan
Supercritical (SC) circulating FBC plants are being constructed and are in operation in China, Poland and Russia (PSI, 2008; IEA, 2012a). CCUS tech-nology will have to be retrofitted into the new-est PC and FBC plants to achieve medium- and long-term carbon emissions reduction targets. SC plants are high-efficiency plants, where the generated steam is above the critical point of water; typical conditions are 540 ºC and 25 MPa and they can reach efficiencies up to 43 %. No water/steam separation is required during the cycle, and higher costs are expected due to the use of alloys and weldings to support high pres-sure and temperature. Overnight cost can be 10–20 % higher than the cost for a sub-critical plant (IEA, 2012a).
The next step for the utilisation of coal is ultra-supercritical (USC) power plants. Steam condi-tions of 600 ºC and 25–29 MPa can be reached, resulting in efficiencies up to 47 % for bituminous coal-fired power plants, as in Nordjyllandsvæket in Denmark (Bugge et al., 2006; Beer, 2007; IEA, 2012a). A high electrical generation effi-ciency of 43 % has also been achieved with the more difficult-to-handle lignite (brown coal) at Niederaussem K plant in Germany (RWE, 2004). The cost of this type of plants can be 10 % higher than that of SC units, since pressure and tem-perature conditions are higher.
Advanced ultra-supercritical (A-USC) power plants use steam conditions of up to 700–760 ºC and 30–35 MPa to achieve efficiencies higher than 50 %. Reaching these steam conditions demands successive reheating cycles and non-ferrous alloys based on nickel, called super-alloys, which are the subject of current research. Several pilot projects to test components under real conditions have been initiated within projects funded by the EU and Member States, such as the COORETEC programme. The full commercialisation is not expected before the decade 2020–2030 (EC, 2013a). Higher steam pressures beyond A-USC conditions, at a given temperature in a reduced volume, cannot be reached due to possible leak-age problems as the steam passes through the turbine (IEA, 2012a).
IGCC plants have higher efficiencies and produce lower emissions. The product gas, called syngas, is very versatile since it can be converted into a wide range of products (i.e. electricity, heat, and liquid and gas chemicals). The technology, originally conceived to treat petcoke, uses coal to produce electricity in 6 power plants, while petcoke is used in 131 plants all over the world. Coal is gasified with oxygen and steam usually in an entrained bed gasifier. It has been successfully demonstrated at two large-scale power plant demonstration facilities in Europe (Buggenum, NL and Puertollano, ES), being practically ready for commercial deployment, but it is still suffering
from high costs. The syngas, mainly CO, H2 and CH4, is used in a combined cycle to produce elec-tricity. Instead of being combusted, the syngas can be used to produce H2, chemical products like ammonia or small organic compounds. IGCC with CCS has been proven in different plants; the last one was commissioned in China, the 250 MW IGCC unit in Tianjin, and will be used as a reference for future projects (IEA, 2013b). Most state-of-the-art approaches aim at incorporat-ing gas turbines able to tolerate 1 500 ºC as inlet temperature to combust a H2-rich syngas. A project is being developed by the European Turbine Network within the FP7 project H2-IGCC with the aim of integrating most recent (H-class) gas turbines into an IGCC allowing efficiencies up to 50 %. IGCC with hybrid fuel cells, gas turbines and steam turbines could conceptually reach 60 % efficiency with zero emissions (IEA, 2012a; EC, 2013a).
Biomass combustion and gasification with coal are called co-combustion and co-gasification. A frac-tion of coal in conventional and advanced power plants is replaced by biomass, involving solution immediacy and direct reduction of CO2 emissions. Moreover, biomass usually contains less sulphur than coal (ZEP, 2012). Biomass can be seasonal and from different origins, has LHV and low bulk density. In order to improve and homogenise the biomass source, to be closer to coal characteristics, pre-treatments like drying, chipping, pelletisation or torrefaction are needed. There exist different alternatives for biomass usage: co-combustion or co-gasification with coal and biomass mixed before going into the reactor (see Figure 8.2 as an example of pre-treated biomass), or separate gasification for joint co-combustion. Biomass share in co-use is limited by technical constraints to 10–15 % of coal inlet thermal power. This option is very attractive for the disposal of organic wastes.
Figure 8.2: Example of pre-treated
biomass, chipped
Source: JRC.
JRC13_TMAP_08AP14_P5-NS-Print.indd 56 09/04/2014 16:21:27

57
2013 Technology Map of the European Strategic Energy Technology Plan
Natural gas
Natural gas to produce electricity derives into higher efficiencies (mainly by using a combined cycle) and relatively lower capital costs than coal power plants. It has been used increasingly over the last 20 years, initially to address concerns over emissions (SOx and NOx). Open-cycle gas turbine (OCGT) plants only use the gas cycle. Natural gas combined-cycle (NGCC) plants employ Brayton and Rankine cycles; the last uses exhaust gases to heat up water to produce steam. Typical efficien-cies of gas turbines are around 35–46 %, while combined cycles can reach efficiencies of 55–60 %. Advanced air-cooled gas turbines can achieve com-bined-cycle thermal efficiencies of over 60 %, with more than 40 % efficiency in single-cycle operation (Siemens, 2010). The state-of-the-art tendencies in these plants are mainly focused on enhance-ments of the gas turbine. The goal for an NGCC is to attain a combined thermal efficiency of 63 % by 2020. In an analogous way as in co-firing options with coal, syngas can be obtained from biomass gasification, or biogas from biomass digestion, and be combined with natural gas or reformed natural gas (PSI, 2008; EC, 2013a).
Shale gas is considered an unconventional source of natural gas. Before, most shales were not con-sidered potential sources of natural gas because of their low natural permeability, which does not allow gas to flow to the well bore. Technological advances, in particular the combination of horizontal drill-ing with hydraulic fracturing have made shale gas extraction technically possible. In the United States, the combination of government policies, private initiatives, land ownership, natural gas price, water availability and pipeline infrastructure, have lead to a surge in shale gas exploitation. However, shale gas is still an uncertain source in terms of costs and availability, and the exploitation technology has to be carefully assessed in terms of environmental impact (World Energy Council, 2010; Wang, 2013).
Oil
Oil-fired power plants only represent 8 % of European electricity production; electricity pro-ducers no longer invest in oil-fired capacity. The available oil reserves are mainly used for trans-portation and in the petrochemical industry. Peak units running on jet fuel are being progressively replaced by more efficient and environmentally friendly gas turbines. The main reason why oil should be used for electricity generation is to secure electricity supply, since oil is more easily storable than gas.
8.3 Market and industry status and potentials
The fossil fuels sector must use more efficient and sustainable options. Climate impacts will affect the performance of power plants, for instance, changing levels of water stress. Therefore, the early investment in advanced power plants will give a competitive advantage to the sector, miti-gating climate change effects and assuring a well known and proper operation (IEA, 2013a). Market evolution for advanced fossil fuels will depend on legislation for emissions, climate regulations and availability of reserves. As a long-trajectory market, key equipment producers can be cited, for example, Alstom and Babcock for boilers, Shell and Texaco for gasifiers, or Siemens and Hitachi for turbines.
Coal has larger reserves than natural gas and oil in terms of energy content. More than 75 countries have recoverable reserves of coal, at a relatively cheap price. These are especially impor-tant in emerging and developing countries. More than 50 % of all operating coal power plants are more than 25 years old, produce less than 300 MWe power and almost 75 % of them use sub-critical technology. Mature advanced coal power plants, SC and USC are increasingly visible, but their share is still low: the global fleet average efficiency is only 33 %. Only a combination of advanced technologies allows achieving stipu-lated climate goals (IEA, 2012a); according to IEA (2013b), the global coal demand is expected to grow to 180 EJ in 2017, which is 17 % above the trajectory to limit temperature increase to 2 ºC by 2050. Coal-fired electricity generation increased 45 % between 2000 and 2010, of which 7 % was from 2009 to 2010, reaching 8 660 TWh. China’s coal consumption represented 46.2 % of the total coal demand of 2011, followed by India with 10.8 %. OECD Europe also experienced an increase in coal demand. EU consumption of hard coal reached its lowest level in 2009 (42 % lower than in 1990). As for 2012, hard coal consumption increased about 6 % compared with 2009. Lignite followed the same decreasing trend (40 % less consumption in 2010 than in 1990). In 2012, its consumption also grew by 1 % compared with 2011. Lignite is locally pro-duced, and little matter is imported or exported. Hard coal imports increase periodically in the EU: Colombia and Russia are the main sources (EC, 2013e). The shale gas boom in the US increased the amount of coal in the market, which led to a price decrease from EUR 95/t (USD 130/t) in March 2011 to EUR 66/t (USD 85/t) in May 2012. As a consequence, the number of power plants using coal increased, as observed in the figures cited previously (IEA, 2012a).
JRC13_TMAP_08AP14_P5-NS-Print.indd 57 09/04/2014 16:21:27

58
2013 Technology Map of the European Strategic Energy Technology Plan
The use of natural gas, with a calorific value larger than coal and higher plant efficiencies, could potentially contribute to reduced emissions if it has a competitive price. The switch towards natural gas use is happening in the US due to their shale gas extraction. It has represented a ‘gas revolution’ in the US; shale gas accounted for 1.6 % of total US natural gas production in 2000, jumping to 23.1 % in 2010, displacing coal (Wang, 2013). In the EU, the trend is the opposite, as observed in 2012. Regional market conditions drive the potential change: while shale gas is cheaper than coal in the US, cheaper coal is imported to Europe from the US. Natural gas penetration in the EU was also influenced by a renewable energy increase in 2012. According to the European Commission (EC, 2013f), gross EU inland consumption decreased by 3.6 % in 2012 in comparison with 2011. This trend can be changed if unconventional gas resources are to be exploited.
According to the EIA (2013a), there are 137 shale formations in 41 countries outside the US. Between 2009 and 2012, the output of natural gas power plants increased 4 768 TWh (9 %) worldwide. This is 170 % higher than 1990 lev-els. Natural gas power production is expected to increase globally 3 % per year up to 2017 (IEA, 2013b). Current efforts aim to develop spe-cific shale gas resource assessment by country, distinguishing between technically recoverable sources and economically viable projects. To date, the greater part of available informa-tion about the European potential for shale gas is mainly focused on UK potential (Gracceva, 2013). However, the Poyry (2011) report makes it clear that there is a real potential in Europe for unconventional gas exploitation, but environ-mental constraints would possibly act to limit it. The highest potential corresponds to Poland. The recent European public consultation about unconventional fossil fuels in Europe (EC, 2013d) reflects a varied range of opinions (around one third for each option):
• respondents for the development of uncon-ventional fossil fuels,
• respondents against its development,
• respondents that advocate for strict environ-mental and health safeguards.
The overview of scenarios of the Energy Roadmap 2050 (EC, 2011b, 2011c) covers cur-rent policy trends and decarbonisation scenarios regarding energy efficiency and diversification of technologies under renewable and GHG targets in EU. The simulation of the current policy initia-tives scenario, which is a projection of develop-ments with policies up to March 2010, predicts a decrease of CO2 emissions from power generation
by two thirds between 2010 and 2050, while electricity demand increases. The advanced fos-sil fuel electricity generation contributes with an increasing share of natural gas and an important penetration of CCS after 2030. In 2050, 18 % of electricity will be generated by power plants with CCS. The fossil fuel share is predicted to change from 55.2 % in 2005 to 30.6 % in 2050, widen-ing to 35.7 % in 2030 and 41.6 % in 2020. The simulation of the decarbonisation scenarios of the Energy Roadmap 2050 aims at reaching at least an 80 % decrease of emissions below 1990 levels by 2050 through the combination of energy efficiency, renewables, nuclear and CCS, resulting in 5 different scenarios. The high energy efficiency and the diversified supply technology scenarios provide 60–65 % of electricity by renewables, with CCS contributing with shares between 19 and 24 %, up to 32 % in the nuclear-constrained scenario. The simulation of the diversified supply technology scenario also advocates an increase in gas power generation
8.4 Barriers to large-scale deployment
The fossil fuels power generation sector is a mature sector. Privatisation in many EU countries over the last 10–15 years resulted in reduced investment in new plants, although the work on improving the SC steam technology, as well as on improving turbines efficiency, has progressed without signifi-cant interruption. The industry also saw the need for and acted accordingly to ensure development of technology to support USC steam conditions and associated higher generation efficiency. Full introduction of USC plants seems to be a matter of cost associated with the expected high risk of using a new technology. The main driving forces for technology development have been, and are, to reduce emissions and costs: more implementa-tion of advanced fossil fuel options will decrease GHG emissions and will result in further experi-ence, and therefore costs will be decreased. As the Energy Roadmap 2050 scenarios point out, CCS and CCU are key partners for fossil fuels increase; this means that larger shares of fossil fuels will have to be accompanied by CCUS technology deploy-ment. Fossil fuel-fired power not only competes within its own boundaries, but higher renewables and nuclear use will constrain the share of fossil fuels. While some renewable technologies, such as solar and wind, are growing fast and will have an increasing impact on the electricity market, the competition with nuclear power will largely depend on licensing and regulatory aspects, environmental issues, social acceptance and long-term CO2 policies (EC, 2011b, 2011c).
Coal has experienced a halt in investment, not only in high-efficiency plants, but also in its whole supply chain. The absence of a stable economic climate is the main reason for this. Beyond the technology challenges, the lack of a consistent
JRC13_TMAP_08AP14_P5-NS-Print.indd 58 09/04/2014 16:21:27

59
2013 Technology Map of the European Strategic Energy Technology Plan
policy signal creates uncertainty about the future, as well as the security about raw material, future revenues from electricity and the need for base-load plants. A barrier for coal is the high investment cost (compared to gas-fired power), which is counter-balanced by a lower fuel cost (however, sources prices will vary according to sources availability). NGCC plants, while offering shorter construction time, higher service flexibility and lower emissions per kWh, are potentially increasing their role due to the unconventional gas sources. Nevertheless, environmental regulations would have to control their exploitation, potentially motivating or limiting the extraction (EC, 2013d). Water consumption in shale gas extraction is a key issue to be addressed (IEA, 2013a).
There is a need for greater stability of investment cost and for a stable CO2 price when the ETS is in full operation. A regulatory market framework and appropriate policies promoting financial stability of the energy market are needed. The financing and regulation of the infrastructure for CO2 trans-port and storage will need to be addressed. Public acceptance is of paramount importance for the deployment of advanced large fossil fuel power generation projects and to reduce energy consump-tion (IEA, 2013a). The price of CO2 may also be a barrier or a motivator for advanced fossil fuel plants. Therefore, long-term emissions reduction policies and high CO2 prices are needed for CCUS to become commercially available. The cost of CO2 emissions within the ETS is likely to have a substantial impact on the COE production. The current price, less than EUR 5/t CO2-eq. (ZEP, 2013), is not high enough to discourage the construction of inefficient power plants. In the near future, the plants that have to comply with emissions trading systems may consider implementing CCUS. This would lead to a significant increase of the investment cost and an efficiency reduction.
The barriers to direct biomass co-firing are very low as only fuel feed systems need to be changed. Markets for trade in biomass for co-firing are not yet mature and as a consequence feedstock costs can vary widely in a relatively short space of time. The impact of biomass co-firing on power genera-tion efficiency is very small within the low range of inputs of biomass currently used. Co-firing of waste, of which there are potentially millions of tonnes available, pose both a legal barrier and a technical challenge. Under the European Waste Framework Directive (EC, 2008), waste combustion may only take place in a plant that conforms to the European Waste Incineration Directive (WID) (EC, 2000). While a number of fossil fuel power plants have experimented with waste as a fuel, most of them had to abandon the work at the end of 2005 as the WID came into full force. Fuel flexibility is becoming increasingly important as fuel resources are depleted and costs can fluctuate significantly over the lifetime of a power plant (EC, 2013b).
8.5 RD&D priorities and current initiatives
The energy scenario of the future needs fos-sil fuels, mainly coal and natural gas, deployed with high-efficiency plants, combined with CCUS, using biomass and organic waste and playing a crucial role in an interoperable electricity grid. Appropriate policies and directives must be put in place to reach technological maturity.
Regarding (I) coal power plants, it is crucial to develop super-alloys and reduce their cost in order to deploy A-USC plants (IEA, 2012a). The installation of new power plants should secure an efficiency equal or above 45 % in LHV net terms. Moreover, large-scale integrated projects with CCUS need to be demonstrated for further confidence. It will also be crucial to improve the performance of existing plants, as well as man-age an intermittent operation according to the new requirements of an energy system with high shares of intermittent renewables (IEA, 2012a). For the retrofitting of both existing PC plants and new PC combustion plants, oxy-fuel combustion is a promising option that will minimise the cost of the CO2 capture step since the flue gas contains around 90 % CO2. There are many non-quantified operational effects associated with oxy-fuel com-bustion that will need to be addressed before it could be used commercially. A 30 MW pilot-scale project was started in 2008 in Germany7 and a 30 MW pilot plant designed by Foster Wheeler for CIUDEN8 commenced operation in north-west Spain in the second half of 2011.
For (II) natural gas power plants, OCGT and NGCC are advanced technologies, so moderate effi-ciency improvements are expected before 2020, apart from retrofitting for efficiency increase (integration of processes), performance of flexible work adapted to interoperable grids and CCUS. Unconventional sources of natural gas, such as shale gas, look very attractive after evaluating the big numbers of these in the US. Nevertheless, all the pros and cons have to be analysed, especially regarding the extraction method.
The implementation of the SET-Plan, adopted by the EU in 2008, includes the CCS EII that was launched in 2010. The objective is to demonstrate the commercial viability of CCS technologies. In 1998, a group of major suppliers to the power industry and some of the major utilities in Europe started a 17-year demonstration project, finan-cially supported by the European Commission’s THERMIE programme, called the ‘Advanced (700 ºC) PF Power Plant’. The main aim of the THERMIE 700 ºC steam coal power plant project is to make the jump from using steels to nickel-based
7 See http://www.vattenfall.com/en/ccs/index.htm online.8 See http://www.ciuden.es/index.php/en/tecnologias online.
JRC13_TMAP_08AP14_P5-NS-Print.indd 59 09/04/2014 16:21:28

60
2013 Technology Map of the European Strategic Energy Technology Plan
super-alloys for the highest temperatures in the steam cycle, which should enable efficien-cies in the range of 50–55 %. When a 700 ºC steam coal power plant will become a reality is not known. Beyond fuel flexibility, there is increasing interest in poly-generation, so that not only are electricity and heat the products, but chemical feedstock and alternative fuels for transport will also be important. In this issue, IGCC plants are to be used.
8.6 References
Beer, J.M., ‘High efficiency electric power gen-eration: the environmental role’, Progress in Energy and Combustion Science, Vol. 33, 2007, pp. 107-134.
Bugge, J., Kjær, S., Blum, R., ‘High-efficiency coal-fired power plants development and perspectives’, Energy, Vol. 31, 2006, pp. 1437-1445.
European Commission (EC), The European Waste Incineration Directive, 2000/76/EC, 2000.
European Commission (EC), The European Waste Framework Directive, 2008/98/EC, 2008.
European Commission (EC), Future Fossil Fuel Electricity Generation in Europe: Options and Consequences, JRC Reference Report, 2009.
European Commission (EC), SETIS Industrial Initiative on CCS, 2010 (http://setis. ec. europ a. eu/ about-setis/technology-road-map/european-industrial-initiative-on-carbon-capture-and-storage) accessed 7 January 2014.
European Commission (EC), Market Observatory for Energy. Key Figures, 2011a (http://ec.europa.eu/energy/observatory/index_en.htm) accessed 7 January 2014.
European Commission (EC), Energy Roadmap 2050, accompanying the document ‘Communication from the Commission to the European Parliament, the Council, the European Economic and Social Committee and the Committee of the Regions’, COM(2011) 885/2, 2011b.
European Commission (EC), Energy Roadmap 2050. Impact assessment and scenario analysis, accompanying the document ‘Communication from the Commission to the Council, the European Parliament, the European Economic and Social Committee and the Committee of the Regions’, Brussels, SEC(2011) 1565 final, 2011c.
European Commission (EC), EU energy in fig-ures. Statistical pocketbook 2012, 2012 (http://ec.europa.eu/energy/publications/doc/2012_energy_figures.pdf) accessed 7 January 2014.
European Commission (EC), Energy technology developments beyond 2020 for the transition to a decarbonised European energy system by 2050. Technology Assessment, 2013a (http://ec.europa.eu/energy/technology/strategy/doc/swf_2013_0158_en.pdf) accessed 7 January 2014.
European Commission (EC), SETIS Advanced Fossil Fuel Generation, 2013b (http://setis.ec.europa.eu/technologies/Advanced-fossil-fuel-production/info) accessed 7 January 2014.
European Commission (EC), Electricity production and supply statistics, Eurostat, 2013c (http://epp.eurostat.ec.europa.eu/statistics_explained/index.php/Electricity_production_and_supply_statis-tics) accessed 7 January 2014.
European Commission (EC), Analysis and pres-entation of the results of the public consul-tation ‘Unconventional fossil fuels (e.g. shale gas) in Europe’, DG Environment, 2013d (http://ec.europa.eu/environment/integration/energy/pdf/Shale%20gas%20consultation_report.pdf) accessed 7 January 2014.
European Commission (EC), Coal consumption statistics, Eurostat, 2013e (http://epp.eurostat.ec.europa.eu/statistics_explained/index.php/Coal_consumption_statistics) accessed 7 January 2014.
European Commission (EC), Natural gas con-sumption statistics, Eurostat, 2013f (http://epp.eurostat.ec.europa.eu/statistics_explained/index.php/Natural_gas_consumption_statistics) accessed 7 January 2014.
Gracceva, F., Zeniewski, P., ‘Exploring the uncer-tainty around potential shale gas development – A global energy system analysis based on TIAM (TIMES Integrated Assessment Model)’, Energy, 2013 (http://dx.doi.org/10.1016/j.ener-gy.2013.06.006) accessed 7 January 2014.
International Energy Agency (IEA), Technology Roadmap: High-Efficiency, Low-Emissions Coal-Fired Power Generation, Paris: Organisation for Economic Co-operation and Development / International Energy Agency, 2012a.
International Energy Agency (IEA), Energy Technology Perspectives 2012. Pathways to a Clean Energy System. Executive Summary, 2012b (http://www.iea.org/Textbase/npsum/ETP2012SUM.pdf) accessed 7 January 2014.
International Energy Agency (IEA), Redrawing the energy-climate map. World Energy Outlook Special Report, Paris: Organisation for Economic Co-operation and Development / International Energy Agency, 2013a (http://www.worldener-gyoutlook.org/energyclimatemap/) accessed 7 January 2014.
JRC13_TMAP_08AP14_P5-NS-Print.indd 60 09/04/2014 16:21:28

61
2013 Technology Map of the European Strategic Energy Technology Plan
International Energy Agency (IEA), Tracking Clean Energy Progress 2013. IEA Input to the Clean Energy Ministerial, Paris: Organisation for Economic Co-operation and Development / International Energy Agency, 2013b (http://www.iea.org/etp/tracking/) accessed 7 January 2014.
Markusson, N., Haszeldine, S. ‘”Capture ready” regulation of fossil fuel power plants – Betting the UK’s carbon emissions on promises of future technology’, Energy Policy, Vol. 38, 2010, pp. 6695-67002.
Parsons Brinckerhoff, Electricity Generation Cost Model – 2011 Update, Revision 1, 2011.
Paul Scherrer Institute (PSI) and Inst. für Energiewirtschaft & Rationelle Energieanwendung, Univ. Stuttgart (IER), NEEDS, a 6th Framework Programme. Deliverable number 7.2 – RS 1a, Final report on technical data, costs and life cycle inventories of advanced fossil power generation systems, 2008.
Poyry, The impact of unconventional gas on Europe, a report to Ofgem, 2011.
RWE publication, Niederaussem: A Plant Full of Energy, 2004.
SIEMENS, The SGT5-8000H – tried, tested and trusted, Siemens brochure, 2010.
U.S. Energy Information Administration (EIA), Technically Recoverable Shale Oil and Shale Gas Resources: An Assessment of 137 Shale Formations in 41 Countries Outside the United States, US Department of Energy, Washington, DC, 2013a.
U.S. Energy Information Administration (EIA), Updated Capital Cost Estimates for Utility Scale Electricity Generating Plants, US Department of Energy, Washington, DC, 2013b.
Wang, Z., Krupnick, A., A Retrospective Review of Shale Gas Development in United States. What Led to the Boom? Resources for the Future dis-cussion paper, Washington DC, 2013.
World Energy Council, 2010 Survey of Energy Resources, UK, 2010.
World Energy Council, World Energy Perspective. Cost of Energy Technologies, UK, 2013.
Zero Emissions Platform (ZEP), Biomass with CO2 Capture and Storage (Bio-CCS). The way for-ward for Europe, Brussels: European Technology Platform for Zero Emission Fossil Fuel Power Plants, 2012.
Zero Emissions Platform (ZEP), Accelerating the demonstration of CO2 geological storage in Europe. The case for up to six new storage pilots, Brussels: European Technology Platform for Zero Emission Fossil Fuel Power Plants, 2013.
JRC13_TMAP_08AP14_P5-NS-Print.indd 61 09/04/2014 16:21:28

62
9. Nuclear fission power generation
9.1 Introduction
Nuclear energy is a reliable and cost-competitive base-load solution for providing low-carbon electric-ity and small amounts of district heating and pro-cess heat in the EU. Globally, there are 437 nuclear reactors in operation generating in total 372 GWe and representing about 13.5 % of the world’s electricity production (IAEA, 2013). In the EU, 132 nuclear reactors with a total capacity of 122 GWe are in operation in 14 out of the 28 Member States. These generate 30 % of the electricity in Europe, and about two thirds of the low-carbon electricity.
Nuclear power is likely to continue contributing a significant share of the base-load low-carbon electricity in the longer term also. Nevertheless, the future holds both opportunities and chal-lenges for nuclear energy. The opportunities arise from an expected increasing electricity demand combined with a shift towards low-carbon elec-tricity in the energy mix. In addition, new roles of nuclear power can be envisaged (e.g. to facilitate the integration of variable renewable energy by providing load balancing capacity to the electricity grid), and it can be used for replacing carbon-based technologies in various heat applications (e.g. seawater desalination, district heating/cooling or industrial applications). Challenges
for nuclear energy include public concerns about the safety of nuclear power plants and that a solution for the final waste disposal still remains to be implemented in most countries operating (or having operated) nuclear power plants. Also, a challenge for nuclear power is that a larger share of variable renewable electricity production needs to be carefully managed as compared to today’s traditional base-load power production regime.
9.2 Technological state of the art and anticipated developments
Commercial nuclear plants operating in most coun-tries today are light water reactors (LWRs), with the exception of the UK, which operates mainly gas-cooled reactors (AGRs), and Romania heavy water reactors (CANDUs). Controlled nuclear fission chain reactions heat the working fluid. In a pressurised water reactor the heated working fluid flows to a steam generator where the heat is transferred to a secondary circuit where the steam that is generated then passes through a turbine to generate electric-ity. A reactor pressure vessel encloses the neutron moderator, the coolant and the reactor fuel where the nuclear reactions take place (see Figure 9.1). Another version of the LWR is the boiling water reactor (BWR), in which the steam is produced in the reactor core and passes directly to the turbine.
Figure 9.1: Schematic view of the
primary circuit of a pressurised water reactor
Source: Cameco, 2013.
2013 Technology Map of the European Strategic Energy Technology Plan
JRC13_TMAP_08AP14_P5-NS-Print.indd 62 09/04/2014 16:21:28

63
2013 Technology Map of the European Strategic Energy Technology Plan
Most of the current nuclear power plants in opera-tion worldwide are second generation (Gen II) reactors, which typically use low-enriched urani-um fuel (3–5 % of U-235) and are mostly cooled and moderated with water. The bulk of the Gen II LWRs operating in Europe today was commis-sioned during the 1980s with original design life-times of up to 40 years. The majority of them are expected to be granted long-term operation of 50–60 years. In the US, many nuclear plants are even now planning for lifetimes of up to 80 years. One of the criteria for granting extended opera-tion is a positive outcome from safety reviews, in which a complete safety assessment of the plant is performed. For utilities, the cost to extend the lifetime of a nuclear power plant is relatively low compared to a new build and in the range of EUR 400–850/kWe (IEA, 2012), which is cost effective even compared to alternative replace-ment sources. Public acceptance, national energy policies, security of energy supply and high safety standards could influence the national decisions for lifetime extensions too.
The current state of the art of commercial nuclear power plants is the Gen III reactor, which is an evolution of the Gen II reactors with enhanced safety features and reliability. Examples are Areva’s European pressurised reactors (EPRs), Westinghouse’s AP1000, Canada Energy Inc.’s CANDU6 and OKB Gidopress’ VVER1000 reac-tor designs. Two Gen III reactors are under con-struction in Finland and France (both are EPR). They were originally planned to be connected to the grid in 2009 (Parliament, 2006) and 2012, respectively, but their dates of completion are delayed until 2016. The construction delays of these first-of-a-kind plants have resulted in cost escalations of about EUR 5–8 billion for the vendor. In the UK, there are plans to build 2 new EPRs at Hinkley Point C of 3.2 GWe in
total. The estimated total installation cost of the two reactors is EUR 16.5 billion (GBP 14 billion). There are also two EPRs under construction in Taishan, China since 2009 and 2010. Those are on budget and are expected to start operation in the second half of 2015. With the additional experience gained from building the Chinese reactors, it is expected that future new builds of EPRs in Europe will experience less delays and cost escalations. In Europe, the capital costs for EPRs are about EUR 5 000/kWe for the reactors in France, Finland and the UK. With increased learning, the cost are expected to be reduced to about EUR 3 500–4 000/kWe. The econom-ics of these very large plants (~ 1 600 MWe) is principally a function of the capital costs, which make up 60–70 % of the total electricity costs.
A new generation of nuclear reactors is being developed to achieve greater sustainable and environmental responsibility. New fast neutron breeder reactors are expected to produce up to 50 times more energy from the same quantity of natural uranium than current designs. This is because the neutron spectrum of fast reactors allows having conversion ratios equal to or higher than one. Fast reactors can also be used to trans-mute high-level nuclear waste. The radiotoxic inventory can be reduced by more than a factor 100 and its heat load by a factor of 10, which would allow reducing the size of the final geo-logical repositories substantially (SNETP, 2013; NEA, 2009; GIF, 2002). These reactors operate at higher temperatures and have higher efficiencies than current reactors. Fast reactor concepts have been demonstrated in research programmes and national prototypes have been operated in the past, but further R&D is nevertheless needed to make them commercially viable while meeting the Gen IV goals for safety, reliability and pro-liferation resistance. The capital cost for fast
Figure 9.2: Flamanville 3 — dome being lifted into place on reactor building
Source: EDF MEDIATHEQUE, 2013.
JRC13_TMAP_08AP14_P5-NS-Print.indd 63 09/04/2014 16:21:30
64
2013 Technology Map of the European Strategic Energy Technology Plan
reactors is expected to be 10–30 % greater than for Gen III reactors (Shropshire et al., 2009); but with the benefits of enhanced independence from uranium imports and reduced nuclear waste vol-umes, fast reactors are expected to be ready for commercial deployment from 2040 onwards.
The small- and medium-sized reactors (SMRs) are now receiving more attention, especially in the US. Some advantages are:
• lower total capital costs but higher EUR/kWe, which could make nuclear power reactors affordable to smaller utilities;
• smaller sizes can accommodate countries with less developed electrical grids or be dedicated to specific applications.
Several new concepts with different characteris-tics and priorities are being developed. The add-ed benefits can include, for example, enhanced safety, portability for construction and operation at remote locations, and ability for more flex-ible operation (World Nuclear, 2013). The reactor types range from conventional light water, to liquid metals (sodium, lead and lead bismuth), to molten salt cooled designs. To date, nuclear power is primarily used for electricity production, but in the future nuclear energy could potentially be employed more for various heat applications — for example, district heating, desalination and process heat industries. The size of SMRs would in most cases be a better fit to such new applications.
More information about costs and technical per-formance of nuclear power can be found in the future JRC report on ETRI, which is to be pub-lished in 2014.
9.3 Market and industry status and potential
Nuclear fission energy is a competitive and mature low-carbon technology. The installed nuclear capacity in the EU is 122 GWe (January 2013), which provides one third of the EU’s gen-erated electricity. Although the total number of reactors in the EU has decreased during the last two decades, this has been largely compensated for by power up-rates and increased availability factors of remaining reactors. Most EU Member States are expected to extend their lifetime of existing nuclear reactors.
In the Energy Roadmap 2050 of the European Commission, seven policy scenarios were stud-ied (EC, 2011a). In the current policy scenario, the share of nuclear power in gross electricity production is projected to decrease from 30.5 to 20.7 % in 2030 and to 20.6 % in 2050. For the five decarbonisation scenarios, the share
of nuclear in gross electricity generation var-ies from 13.4 to 21.2 % in 2030 and 2.5 to 19.2 % in 2050. In other recent scenario stud-ies (Eurelectric, 2009; ECF, 2011), the share of nuclear in Europe is forecasted to be either stable or reduced by 2050 as compared to today. It should be kept in mind that even when tak-ing into account successful life extension pro-grammes of existing reactors, maintaining the share of nuclear energy in 2050 would require the construction of up to 120 new reactors.
In Europe, the share of variable RES like wind and solar are expected to further significantly increase. This will require more flexible operation of nuclear power plants, but the real impact also depends on several external factors. A large expansion of transmission and smart grids as well as of stor-age capacities would reduce the need for flexible operation of nuclear reactors.
Construction of new nuclear plants falls under the responsibility of individual Member States and investors. Presently, there are six reactors under construction in the EU: the two EPRs in France and Finland mentioned earlier, two small reactors of Gen II type (VVER 440) in Slovakia and two CANDUs in Romania. The UK intends to build two new reactors at Hinkley Point and Hungary has decided to build two VVER-1200 units at Paks. Several other European countries are considering building new reactors, such as Bulgaria, the Czech Republic, France, Lithuania, Poland and Finland. On the other hand, Belgium and Germany have decided to phase out nuclear power. Worldwide, there are 73 reactors under construction in 15 countries (IAEA, 2013).
Europe plays a leading role in the development of nuclear energy, with Areva as the vendor of the EPR and many smaller companies provid-ing materials, parts, components and systems for the construction of other reactor types like AP1000 and VVER. European companies cover the complete nuclear fuel chain. Areva is competing with major vendors globally, for example, Westinghouse and GE Energy (US), Atomstroyexport (Russia), Mitsubishi Heavy Industries (Japan), AECL (Canada) and KHNP (South Korea), and and CGNPC and CNNC (China)., However, partnerships are also taking place.
Gen IV fast reactor programmes are being pursued in China, India, Japan and Russia, and within Europe France has extensive experience with sodium-cooled fast reactors (SFRs). A con-certed effort is made by promoting an European Sustainable Nuclear Industrial Initiative (ESNII) to demonstrate a Gen IV SFR sustainable nuclear fission by 2025 as part of the SET-Plan and an alternative design based on lead-cooled fast reactor (LFR) technology, having a technology pilot plant as an accelerator driven sub-critical
JRC13_TMAP_08AP14_P5-NS-Print.indd 64 09/04/2014 16:21:30

65
2013 Technology Map of the European Strategic Energy Technology Plan
systems dedicated to transmutation of nuclear waste, feasibility assessment and performance. A commercial deployment of SFR in the EU is to be ready after 2040 and an alternative design, either lead-cooled or gas-cooled, a decade later.
High-temperature reactors dedicated to cogen-eration of process heat for the production of synthetic fuels or industrial energy products could be available to meet market needs earlier than fast reactors. A key aspect is to demonstrate the coupling of a high-temperature reactor with a conventional industrial plant. An assessment of supercritical water and molten salt reactors in terms of feasibility and performance should be pursued.
9.4 Barriers to large-scale deployment
The high capital cost of nuclear energy in com-bination with uncertain long-term conditions for nuclear power due to the potential change in national energy policy or impact from an increased share of variable renewables consti-tutes a financial risk for utilities and investors. The extensive delays in constructing the EPRs at Olkiluoto, Finland and Flamanville, France prob-ably add to the uncertainty but, on the other hand, the construction of the EPR in China is progress-ing well giving reasons for increased confidence.
Public acceptance differs significantly between countries and could remain a barrier for new builds in several Member States. The public is mainly concerned about the safety of nuclear reactors, and a final solution for nuclear waste disposal still remains to be found in many coun-tries. After Fukushima, stress tests of all European nuclear power plants have been concluded. They revealed that there are no main safety short-comings necessitating an immediate shutdown, but also that not all best practice international standards were followed everywhere so cor-rective measures were proposed and are being implemented. As a long-term result, a safer fleet of nuclear power plants and a better understand-ing of the risks of nuclear energy will emerge. In June 2013, the European Commission proposed a revision to the 2009 nuclear safety directive (EC, 2013) aimed at strengthening its provisions, sharing safety objectives at EU level, enhancing role and independence of national regulatory authorities and establishing a system of peer reviews of nuclear installations. In 2011, the Radioactive waste and spent fuel management Directive was adopted that asks Member States to present national programmes presenting the construction and management of final reposi-tories (EC, 2011).
Harmonised regulations, codes and standards at the EU level would strengthen the competitive-ness of Europe’s nuclear sector and facilitate long-term operation of Gen II existing plants, the deployment of Gen III technology in the near to medium term and, later, Gen IV technology. Difficulty in raising financing for R&D (due to market uncertainty, public confidence, etc.) may undermine the strength of the European nuclear industry with regard to the development of new Gen IV technologies. There is significant com-petition from Asia and Russia where there is strong national and corporate support for R&D. Presently, the biggest challenge for innovative fast reactor designs in Europe is the need for successful demonstration prior to commerciali-sation, which would typically require a budget of the order of EUR 5 billion.
A shortage of qualified engineers and scientists as a result of the lack of interest in nuclear careers and the reduced availability of spe-cialist courses at universities is also another potential barrier for nuclear fission deployment. Preservation of nuclear knowledge and expe-rience remains an issue, as demonstrated by some of the difficulties of building new EPRs in Europe following the stagnation in the con-struction of NPPs in the last decades, and espe-cially since many of the current generation of nuclear experts are nearing retirement. The most efficient way to reduce this risk is by creating attractive R&D programmes of pan-European interest in this field.
9.5 RD&D priorities and current initiatives
Ethics opinion and Symposium on the ‘Benefits and Limitations of Nuclear Fission for a Low-Carbon Economy’
The European Group on Ethics of science and new technologies (EGE) adopted an Opinion on ‘An eth-ical framework for assessing research, production and use of energy’ (EGE, 2013). EGE proposed an integrated ethics approach for the research, production and use of energy in the EU seeking for equilibrium between four criteria covering access rights, security of supply, safety and sustainability taking into account social, environmental and economic concerns. The European Commission Symposium on the ‘Benefits and Limitations of Nuclear Fission for a Low-Carbon Economy’ held on 26–27 February 2013 in Brussels also con-firmed the need to pursue nuclear fission safety research (Symposium, 2013).
JRC13_TMAP_08AP14_P5-NS-Print.indd 65 09/04/2014 16:21:30

66
2013 Technology Map of the European Strategic Energy Technology Plan
Sustainable Nuclear Energy Technology Platform
The Sustainable Nuclear Energy Technology Platform (SNETP) has more than 120 members from industry, research organisations and univer-sities. It has defined a common vision regarding the role of nuclear energy and R&D needs. It is structured along three main pillars:
• NUclear GENeration II & III Association (NUGENIA), which develops R&D supporting safe, reliable and competitive Gen II and III nuclear systems;
• ESNII, which promotes advanced fast reac-tors and supporting infrastructures with the objective of resource preservation and the minimisation of nuclear waste;
• Nuclear Cogeneration Industrial Initiative (NC2I), which aims at demonstrating a solu-tion for low-carbon cogeneration of process heat and electricity (SNETP, 2013a).
R&D priorities are presented in the respective strategic research and innovation agendas (SRIA) according to the generations of nuclear power.
General needs
Following the Fukushima accident, immediate actions have been undertaken on the need to study the combination of extreme and rare exter-nal safety hazards and the interaction between units on one site in such events (SNETP, 2011). Areas of priority are an update of plant design, identification of external hazards, further analysis and management of severe accidents, emergency management and radiological environmental impact assessments (SNETP, 2013a).
Generation II & III
NUGENIA, under the referred SNETP, have identi-fied priority R&D areas for Gen II and III reactors. These include, for example, improved safety and risk assessments with the development of better numerical simulation of relevant phenomena. After Fukushima, more focus is given to potential impacts of severe accidents on the environ-ment, emergency preparedness and response. With long-term operation a better understand-ing of ageing mechanisms and the monitoring of ageing materials are needed. Research on innovative LWR designs is pursued with the objective to achieve long-term operation by design and higher safety by design, innova-tive components for reduced maintenance and enhanced economics.
Generation IV
The multilateral inter-governmental agreement Generation IV International Forum (GIF) was initiated in 2000. It is presently composed of 13 members of which three are European, i.e. France, United Kingdom and Euratom. Six con-cepts were selected for further development at the international level. These new concepts should be safe, clean, cost-effective and pro-liferation resistant. Three concepts are fast reactor systems using sodium, lead or helium coolants. These would allow an efficient use of fuel resources and significant reduction of the volume of nuclear wastes and toxicity. Other concepts are the very-high–temperature, the supercritical water and the molten salt reactors.
The ESNII under the Community’s SET-Plan was formally initiated in 2010 (SNETP, 2013b). ESNII addresses the need for demonstration of Gen IV fast reactor technologies, and for the sup-porting research infrastructures, fuel facilities and R&D work. Sodium coolant is considered as the reference technology with the French Advanced Sodium Technological Reactor for Industrial Demonstration (ASTRID) project, and lead coolant is the main alternative technology with the Multi-purpose hybrid research reactor for high-tech applications (MYRRHA) Accelerator Driven System as a technology pilot plant for lead-cooled developments. Gas fast reactor technology is a longer term option. Examples of technology need to achieve commercial avail-ability of fast reactors by the middle of the century are identified as (SNETP, 2013a):
• improved safety and robustness against severe damage (e.g. core designs with moder-ate void effect and other favourable reactivity feedback effects);
• structural materials and innovative fuels that can support high fast-neutron fluxes and high temperatures, and that can guarantee a plant lifetime of 60 years;
• development of European codes and stand-ards to be used for future construction of Gen IV reactors;
• more advanced physical models and compu-tational approaches to achieve more accurate and detailed modelling benefiting from the increase of computational power.
But beyond these specific domains of research, the most important step at EU-level is to build demonstrators in the coming decade. This is nec-essary to show the technical, industrial, safety and economic feasibility of Gen IV technologies. It is also necessary to keep knowledge and com-petence in the EU.
JRC13_TMAP_08AP14_P5-NS-Print.indd 66 09/04/2014 16:21:30

67
2013 Technology Map of the European Strategic Energy Technology Plan
Nuclear cogeneration
Preparations for an industrial initiative proposal on nuclear cogeneration are taking place with the aim of demonstrating the cogeneration of process heat and its coupling with indus-trial processes. This would be built and funded through a European or international consor-tium, which should also include the process heat end-user industries.
European Energy Research Alliance — Joint Programme Nuclear Materials
The European Energy Research Alliance (EERA) provides opportunities for synergies and collabo-rative work in the area of nuclear materials. The objective of this EERA Joint Programme (JP) on Nuclear Materials is to identify key priority topics and funding opportunities with the purpose of supporting in an efficient way the development and optimisation of a sustainable nuclear energy.
Framework Programmes of Euratom
The Framework Programmes (FPs) of Euratom have pursued integrated collaborative research efforts at EU level across a broad range of nuclear science and technologies and associated educa-tion and training activities. These research efforts are needed to retain and improve competences and know-how, and to improve the efficiency and effectiveness of the European Research Area (ERA), thereby contributing to maintaining high levels of nuclear knowledge and industry com-petiveness in the nuclear field.
ENEF
The European Nuclear Energy Forum (ENEF) is a pan-European forum on transparencies issues, opportunities and risks of nuclear energy gath-ering all relevant stakeholders in the nuclear field such as representatives from EU Member States, EU institutions, nuclear industry, elec-tricity consumers, research organisations, non-governmental organisations and civil society.
ENSREG
The European Nuclear Safety Regulators (ENSREG) forum gathers independent and authoritative experts on nuclear safety, radioactive waste safe-ty and radiation protection regulatory authorities from EU Member States and representatives from the European Commission. ENSREG fosters a continuous improvement and understanding of nuclear safety in Europe. They supported the coordination of peer reviews during the latest stress tests exercise undertaken following the 2011 Fukushima accident.
Civil society participation
Examples of initiatives aimed at fostering a dialogue between civil society and the nuclear industry are:
• regular meetings from 2007 of the ENEF and its specific working group on transpar-ency issues;
• roundtable discussions organised from 2009 onwards by the European Commission and the French National Association of Local Information Commissions and Committees (ANCCLI) on the practical implementation of the United Nations’ Aarhus Convention in the nuclear field supporting the rights of the public with regard to the environment;
• the supporting role of the European Economic and Social Committee (EESC) in helping EU insti-tutions to involve civil society and its decision making inclusion on research and energy policy.
9.6 References
Cameco, Types of Reactors – Pressurized Water Reactor, 2013 (http://www.cameco.com/urani-um_101/electricity-generation/types-of-reac-tors/) accessed 7 January 2014.
EDF MEDIATHEQUE, Flamanville 3 – dome being lifted into place on reactor building, 2013 (http://newsroom.edfenergy.com/Media-Library/Flamanville-3-dome-being-lifted-into-place-on-reactor-building-EDF-MEDIATHEQUE-2013-a8.aspx) accessed 7 January 2014.
Eurelectric, Power Choices - Pathways to carbon-neutral electricity in Europe by 2050, 2009.
European Climate Foundation, Roadmap 2050 - A practical guide to a prosperous, low-carbon Europe. Technical analysis, 2010.
European Commission (EC), Energy Roadmap 2050, SEC(2011) 1565 final, 2011a (http://ec.europa.eu/energy/energy2020/roadmap/index_en.htm) accessed 7 January 2014.
European Commission (EC), Council Directive 2011/70/EURATOM – establishing a Community framework for the responsible and safe man-agement of spent fuel and radioactive waste, COM(2011) 70, 2011b (http://eur-lex.europa.eu/LexUriServ/LexUriServ.do?uri=OJ:L:2011:199:0048:0056:EN:PDF) accessed 7 January 2014.
European Commission (EC), New safety proposal, 2013 (http://ec.europa.eu/energy/nuclear/safety/safety_en.htm) accessed 7 January 2014.
JRC13_TMAP_08AP14_P5-NS-Print.indd 67 09/04/2014 16:21:30

68
2013 Technology Map of the European Strategic Energy Technology Plan
EGE, Opinion 27, An ethical framework for assess-ing research, production and use of energy, 2013 (http://ec.europa.eu/bepa/european-group-ethics/docs/publications/opinion_no_27.pdf) accessed 7 January 2014.
Generation IV International Forum (GIF), A Technology Roadmap for Generation IV Nuclear Energy Systems, GIF-002 -00, Issued by the U.S. DOE and the Generation IV International Forum, 2002 (http://www.gen-4.org/PDFs/GenIVRoadmap.pdf) accessed 18 July 2011.
International Atomic Energy Agency (IAEA), Power Reactor Information System, 2013 (http://www.iaea.org/pris/) accessed 7 January 2014.
International Energy Agency (IEA), The Economics of Long-Term Operation of Nuclear Power Plants, 2012. ISBN 978-92-64-99205-4
Nuclear Energy Agency (NEA), Strategic and Policy Issues Raised by the Transition from Thermal to Fast Nuclear Systems, OECD/NEA Report No. 6352, 2009.
Shropshire, D.E., Williams, K.A., Hoffman, E.A, Smith, J.D., Hebditch, D.J., Jacobson, J.J., Morton, J.D., Phillips, A.M., Taylor, J.P., Advanced Fuel Cycle Economic Analysis of Symbiotic Light-Water Reactor and Fast Burner Reactor Systems, 2009. INL/EXT-09-15254
Sustainable Nuclear Energy Technology Platform (SNETP), Implications of the Fukushima accident for SNETP, 2011 (http://www.snetp.eu/www/snetp/images/stories/Docs-Newsflash/Implication_of_Fukushima_SNETP.pdf) accessed 7 January 2014.
Sustainable Nuclear Energy Technology Platform (SNETP), Strategic Research and Innovation Agenda, 2013a (http://www.SNETP.eu) accessed 13 September 2013.
Sustainable Nuclear Energy Technology Platform (SNETP), European Sustainable Nuclear Industrial Initiative, 2013b (http://www.snetp.eu/www/snetp/index.php?option=com_content&view=article&id=22&Itemid=12) accessed 7 January 2014.
Symposium, Benefits and Limitations of Nuclear Fission Research for a Low Carbon Economy, 2013 (http://www.eesc.europa.eu/?i=portal.en.events-and-activities-symposium-on-nuclear-fission) accessed 7 January 2014.
UK Parliament, Electricity Generation, No. 268, 2006 (http://www.parliament.uk/documents/ post/postpn268.pdf) accessed 18 July 2011.
World Nuclear Association (WNA), 2013 (http://www.world-nuclear.org/) accessed 6 October 2013.
JRC13_TMAP_08AP14_P5-NS-Print.indd 68 09/04/2014 16:21:31

69
10. Nuclear fusion power generation
10.1 Introduction
Nuclear fusion is the process that powers the Sun and the stars, wherein light atomic (H2) nuclei fuse together to form heavier ones, resulting in large amounts of released energy. The fusion process was first conceived in the first half of the 20th century and was proposed soon after as a potential source of virtually limitless energy. Nuclear fusion research today aims at developing nuclear fusion reactors run-ning on essentially an unlimited supply of cheap fuel, with passive intrinsic safety and producing no CO2 or atmospheric pollutants. Furthermore, compared to nuclear fission will produce rela-tively short-lived radioactive waste through neutron activation of structural materials, with the half-lives of most radioisotopes contained in the waste being less than 10 years, which means that within 100 years the radioactivity of the materials will have diminished to insig-nificant levels. If R&D in fusion energy continues to deliver the advances already achieved, then fusion energy should become a reality within the next two to three decades.
Within the EU, a detailed roadmap to fusion electricity was agreed by the national research laboratories of all Member States towards the end of 2012, and if R&D in fusion energy con-tinues to deliver the advances already achieved, then fusion electricity production should become a reality by the middle of the century.
The central thrust of nuclear fusion research is dominated by the International Thermonuclear Experimental Reactor (ITER)9 project, which is under construction at Cadarache, France (see Figure 10.1). Europe is financing about 45 % of the total construction cost, with one fifth of this from France as the host state and four fifths from the EU. The remaining part is split between the other six participating members (China, India, Japan, Russia, South Korea and the US)10.
9 See http://www.iter.org online.10 See http://fusionforenergy.europa.eu/
understandingfusion/ourcontribution.aspx online.
ITER aims to carry out its first experiments within the next decade and within the following years it should demonstrate the scientific and technical feasibility of fusion energy. The successful opera-tion of ITER is expected to lead to the go-ahead for the following step, a Demonstration Power Plant (DEMO), which would aim to demonstrate the commercial viability of fusion by delivering fusion power to the grid around 2050.
Most recently, the first shipment of components from China to Cadarache left the Institute of Plasma Physics in Hefei on 5 April 2013 and arrived on the ITER site on 3 June 2013. The shipment, weighing 15 tonnes, consists of nearly 1 km of dummy conductor that will serve to qualify the tooling and manufacturing processes of ITER’s large and powerful poloidal field mag-nets. During the last 3 years, the roads, bridges and roundabouts of the 104 km journey from the receiving harbour (Fos-sur-Mer, near Marseilles) to Cadarache were adapted and completed to allow the transport of components weighing more than 600 tonnes.
10.2 Technological state of the art and anticipated developments
The most efficient fusion reaction to use on Earth is that between the hydrogen isotopes, deute-rium (D) and tritium (T), which produces the high-est energy output at the ‘lowest’ (although still extremely high) temperature of the reacting fuels. For fusion to occur, the nuclei need to be brought very close together and to overcome the repul-sive force between them in order to fuse. This is achieved by increasing the temperature of the gas to such high temperatures. In this process, the motion of the electrons and nuclei increase until the (negatively charged) electrons separate from the (positively charged) nuclei. This state, where nuclei and electrons are no longer bound together, is called plasma. Heating the plasma further to temperatures in the range of 100–200 million °C results in sufficiently strong collisions between the nuclei for fusion to take place.
2013 Technology Map of the European Strategic Energy Technology Plan
JRC13_TMAP_08AP14_P5-NS-Print.indd 69 09/04/2014 16:21:31

70
2013 Technology Map of the European Strategic Energy Technology Plan
The so-called tokamak configuration, proposed by the Russian scientists Andrei Sakharov and Igor Tamm in the 1950s, is used in most devices today to study magnetic confinement fusion (see Figure 10.2). Today, large tokamaks such as JET (Euratom), JT-60 (Japan), DIII-D (US) and T-15 (Soviet Union) have been built to study plasmas in conditions close to those of a fusion power reactor. In particular, JET is the only machine presently able to operate D-T experiments. One or more other features such as superconducting coils, deuterium–tritium operation and remote handling were all introduced during the 1990s and 2000s in several machines, i.e. Tore Supra (France), KSTAR (South Korea) and EAST (China).
This accumulated experience contributed to the design of ITER, which will use the ‘magnetic con-finement’ approach. The aim of ITER is to maintain the high temperature in the plasma over long periods of time using the power of the energetic ‘α-particles’ (helium-4 nuclei) generated by the fusion reactions. ITER will be the first fusion reactor to produce a net power gain, aiming for 10 times more fusion power than input power into the plas-ma. Although the fusion power in ITER should reach some 500 MW for hundreds of seconds at a time, it will not generate electricity. The scientific and technical knowledge acquired in ITER will provide the basis on which the following step, the DEMO, will be built. DEMO should operate at high-fusion
power for long periods so that it will be possible to demonstrate reliable and commercially viable electricity generation from fusion.
Whilst ITER is being constructed and DEMO is in its conceptual phase, a number of fusion instal-lations, with different characteristics and objec-tives, will continue to operate around the world, conducting complementary R&D in support of ITER. These include, in particular:
• the Joint European Torus (JET), which will oper-ate until at least 2017-18 and will include another major experimental phase using deu-terium–tritium (D-T) as fuel, which follows the first D-T operation in the 1990s;
• the Experimental Advanced Superconducting Tokamak (EAST) at the Institute of Physical Science in Hefei, China
• the Korea Superconducting Tokamak Advanced Research (KSTAR), in operation since 2008 at the National Fusion Research Institute in Daejon, South Korea; and
• the JT-60SA device in Naka, Japan, which is currently under construction with significant European ‘in-kind’ contributions under the Euratom-Japan Broader Approach agreement. JT-60SA operation is scheduled to start in 2019.
Figure 10.1: The ITER site in Cadarache
(June 2013), indicating, amongst others, the
completed administrative building (bottom right) and the central (dark)
area, where the Tokamak Complex will be located
Source: Credit © ITER (http://www.iter.org).
Figure 10.2: Principle of a tokamak
Source: EFDA.
JRC13_TMAP_08AP14_P5-NS-Print.indd 70 09/04/2014 16:21:34

71
2013 Technology Map of the European Strategic Energy Technology Plan
Alternative magnetic configurations to the toka-mak are also being explored. The stellarator, for instance, is inherently more complex than a tokam-ak but has advantages in terms of reliability of steady-state operation. The W7-X Stellarator, pres-ently under construction in Greifswald, Germany will allow good benchmarking against the perfor-mance of comparable tokamaks11.
As an alternative to magnetic confinement fusion, inertial confinement is also being investigated, in which extremely high-power, short-pulse lasers are used to compress a small pellet of fuel to reach fusion conditions of density and tempera-ture12. Major facilities have been constructed in France and the US, these are closely linked to military programmes since the micro-explosions of inertial fusion allow for modelling the pro-cesses in nuclear weapons.
10.3 Market and industry status and potential
The obvious difference with all other low-carbon energy technologies is that fusion energy will not make any significant and commercial contribution to the electricity grid until around 2050. Current planning foresees fusion starting to be rolled out on a large scale sometime after the middle of the century following successful DEMO operation. There do not appear to be any resource issues that would prevent fusion being deployed at least as rapidly as fission power was deployed after the mid-20th century. Nevertheless, there will likely be a need for industry to progressively shift its role from that of provider of high-tech compo-nents to that of driver of fusion development. This must already start with the design and con-struction of DEMO, with industry becoming fully responsible for a commercial fusion power plant.
Electricity costs
The direct costs of fusion electricity have been estimated in a number of studies. A recent one by the Dutch Research Platform on Sustainable Energy13, using a standard cost method similar to ones used in OECD and International Atomic Energy Agency (IAEA) studies, estimated electric-ity production at between EUR 0.05 and 0.10/kWh, with a probable figure of EUR 0.07/kWh. This is around 50 % more expensive than coal or nuclear fission, but is comparable to clean fossil fuel and sustainable sources, if the costs for energy storage are not included for the latter.
11 See http://www.ipp.mpg.de/ippcms/eng/for/projekte/
w7x/index.html online.12 See http://www.fusion-eur.org/fusion_cd/inertial.htm
online.13 See http://www.energyresearch.nl/energieopties/
kernfusie/achtergrond/economie/ online.
These figures are in line with the European Power Plant Conceptual Study (PPCS, 2005), which showed that the internal COE from a fusion power plant is in the range USD 0.06–0.10/kWh, depend-ing on the extent to which the plasma physics and materials technology of fusion are optimised as a result of further R&D. With mature fusion technology, these costs are expected to be in the range of EUR 0.03–0.06/kWh.
Financing of ITER
ITER is a first-of-a-kind global collaboration involving seven members: China, the EU, India, Japan, the Russian Federation, South Korea and the US. During the construction phase, Europe will bear approximately 45.5 % of the construction costs, with the remaining six partners contribut-ing approximately 9.1 % each. Almost 90 % of each member’s share is in the form of in-kind contributions, meaning that, instead of cash, the members will deliver components and buildings directly to the ITER organisation. For the operation phase, costs are to be shared as follows: Europe 34 %, Japan and the US 13 % each, and China, India, Korea and Russia 10 % each. At the end of the ITER experimental phase, France will bear responsibility for the dismantling and decommis-sioning of the site.
EU financing
Under FP7 (2007-2011) and FP7+2 (2012-2013), the overall Euratom budget for the whole period 2007–2013 is EUR 5.31 billion, of which EUR 4.15 billion is devoted to fusion energy research. The principal activities are the realisation of ITER (as an international research infrastructure), R&D of the ITER operation (including JET operation), the technology activities in preparation of DEMO and preparation of an International Fusion Materials Irradiation Facility (IFMIF), as well as human resources, education and training.
To address the challenges of fusion energy, the European Fusion Development Agreement (EFDA) was created in 1999 to provide a framework for European fusion research institutions and the European Commission in order to strengthen their coordination and collaboration and support their participation in collective activities (Fusion news, 2009). The EFDA is responsible for the exploitation of JET, the coordination and sup-port of fusion-related R&D activities carried out by relevant associations and European industry, and the coordination of the European contribu-tion to large-scale international collaborations (i.e. ITER). In 2006, a significant change to the structure of the European Fusion Programme was introduced. The ITER parties agreed to pro-vide contributions to ITER through legal entities referred to as Domestic Agencies. Europe fulfilled its obligation by launching the European Domestic
JRC13_TMAP_08AP14_P5-NS-Print.indd 71 09/04/2014 16:21:34

72
2013 Technology Map of the European Strategic Energy Technology Plan
Agency called Fusion for Energy (F4E) in 2007 (F4E, 2007). In 2008, the IAEA and ITER signed a Fusion Cooperation Agreement to cooperate on training, publications, organisation of scien-tific conferences, plasma physics and model-ling, and fusion safety and security (IAEA-ITER, 2008). Another important step, was the Broader Approach agreement signed in 2007 between the Euratom and Japan (EU, 2007), which includes final design work and prototyping for IFMIF.
The Broader Approach agreement aims to accel-erate the realisation of fusion energy and repre-sents some EUR 340 million of EU investment. There are three projects in the Broader Approach: the Engineering Validation and Engineering Design Activities for the above-mentioned IFMIF (IFMIF-EVEDA); a satellite tokamak programme to develop operating scenarios and address key physics issues for an efficient start-up of ITER experimentation and for research towards DEMO; explore similar conditions to ITER and DEMO for steady-state operation at high pressures with heating of 400 MW for 100 seconds; and the International Fusion Energy Research Centre (IFERC) for the coordination of DEMO design and related R&D.
Financing beyond 2013
The inter-institutional agreement between the European Council and the European Parliament that is presently in force defines the Multiannual Financial Framework (MFF) and caps the amounts devoted to major categories of spending until 2013. This agreement on ITER financing was based on the initial estimates of EUR 2.7 billion for the EU contribution during the construction period, and therefore did not include funding for the additional ITER needs identified during 2010. This multiannual agreement had to be modified by the European Council and the European Parliament in 2011. The EU budget for 2011 was subsequently adopted by the European budgetary authority and, in December 2011, the EU agreed to allocate to ITER an additional funding of EUR 1.3 billion required for the period 2012–2013.
For the long-term financing beyond 2013, the European Council has so far acknowledged the overall cost of the EU contribution to ITER con-struction and has capped the European contribu-tion at EUR 6.6 billion for the period 2007–2020, including F4E (running costs and other activi-ties) and the contribution of the host state. In December 2011, the European Commission pro-posed to fund the EU contribution to ITER after 2013 outside of the MFF. However, on 8 February 2013 the European Council reached an agree-ment to reintegrate ITER into the MFF and set up the maximum level of the Euratom commit-ments for ITER at EUR 2.707 million (the 2011 value) for the period 2014–2020. Following this,
the European Commission adopted a proposal to amend the European Council’s Decision esta-blishing the European Joint Undertaking for ITER and the Development of Fusion Energy, which is the undertaking in charge of delivering the European contribution to ITER. This European Council Decision was adopted by the Council of the EU on 13 December 2013 ensuring the fun-ding of ITER for the next seven years.
Licensing of ITER
Nuclear facilities built in France require a licence under French law, that is, to become an Installation Nucléaire de Base. The ITER organisation submit-ted the Preliminary Safety Report to the French Nuclear Safety Authority (ASN) in March 2010. The French Environmental Authority, whose opi-nion on ITER’s nuclear licensing files is required in accordance with the EEC Directive 97/11/EC of 3 March 1997 on Environmental Assessments, delivered a favourable opinion in March 2011. The ITER organisation was informed by the French safety authorities (ASN) in June 2012 that the ITER safety files fulfilled expected safety require-ments. Following this, the draft decree was com-municated by the ASN to the French government for signature. On 10 November 2012, the French Prime Minister Jean-Marc Ayrault signed the offi-cial decree that authorises the ITER organisation as an Installation Nucléaire de Base.
ITER is the first nuclear installation in France to observe the stringent requirements of the 2006 French law on Nuclear Transparency and Security. It is also the first time worldwide that the safety characteristics of a fusion device have undergone the rigorous scrutiny of a nuclear regulator to obtain nuclear licensing, thereby achieving an important landmark in fusion history.
10.4 Barriers to large-scale deployment
There are currently no political barriers to nuclear fusion development. Public perception, in particular concerning safety and waste, will be important once a commercial plant is planned for construction. The difficulties may well depend on the reputation of conventional nuclear (fission) energy production.
Scientific and technical barriers include plasma physics and materials engineering, as well as the lack of appropriate harmonised European codes and standards, which may also delay the necessary developments. The availability of suit-ably trained scientists and engineers may pose problems over the long term. Excellent initiatives such as the European Fusion Training Scheme need to be made sustainable. Furthermore, as fusion is now moving from R to the R&D phase, intellectual property rights (IPR) is also an issue that will need addressing properly.
JRC13_TMAP_08AP14_P5-NS-Print.indd 72 09/04/2014 16:21:34

73
2013 Technology Map of the European Strategic Energy Technology Plan
As with other first-of-a-kind installations delays are not uncommon. For example, for ITER, a criti-cal phase of the reactor will be the injection of plasma into the reactor’s vacuum chamber. The original date for ‘first plasma’ was November 2020 but delays in construction and commis-sioning phases have already pushed this back to October 2022.
Indeed, even the events in Japan in March 2011 (Fukushima, 2011) — i.e. the earthquake and tsunami — affected some of the installations producing components for ITER. In particular, the buildings for superconducting magnet test equipment and neutral beam test equipment were seriously damaged. In its initial assess-ment, the Japanese government estimated a one-year delay in its contribution of key compo-nents. Likewise, the earthquake caused damage to the experimental lithium test loop, causing a 16-month delay to the overall IFMIF planning.
Due to the damage at the Fukushima-Daiichi reactors, the EU declared ‘that the safety of all 143 nuclear power plants [in Europe] should be reviewed on the basis of a comprehensive and transparent risk assessment.’ These assess-ments are known as the stress test14. The French safety authorities requested that ITER must also pass this complementary safety assessment. Subsequently, the ITER Safety, Quality & Security Department carried out the stress test evaluation and provided a nuclear safety stress report to the French safety authorities in September 2012.
The phenomena of plasma disruptions are a concern as they can occur due to instabilities in the plasma, leading to the degradation or loss of the magnetic confinement of the plasma, which can cause a significant thermal loading of in-vessel components together with high mechanical strains on the in-vessel components, the vacuum vessel and the coils in the tokamak (Boozer, 2012).
With respect to waste, especially nuclear waste, nuclear fusion reactors produce no high-activity/long-life radioactive waste. The ‘burnt’ fuel is helium, a non-radioactive gas. Radioactive sub-stances in the system are the fuel (tritium) and materials activated while the machine is running. During the operational lifetime of ITER, remote handling will be used to refurbish parts of the vacuum vessel. All waste materials from ITER will be treated, packaged and stored on site. ITER, as operator, will bear the financial responsibility for the temporary and final storage of opera-tional radioactive waste. The host state France will be in charge of the dismantling phase and the management of waste resulting from this
14 See http://www.ensreg.eu/eu-stress-tests online.
dismantling; the cost for these activities will be provisioned by ITER during the operation phase. France will also be responsible for providing tem-porary storage for part of the operational waste, pending its final disposal; this will be financed through ITER operation costs.
Regarding the fuels needed in a fusion plant — i.e. deuterium and lithium — the raw material for tritium fuel is widely distributed on Earth:
• deuterium is a naturally occurring isotope of hydrogen, available in water and easily extracted from it,
• lithium is easily extractable from proven resources that would provide a stock suffi-cient to operate fusion power plants for more than 1 000 years, with worldwide resources of lithium presently estimated at 25 Mt.
10.5 RD&D priorities and current initiatives
Although the concept of fusion has been demon-strated, there are still a number of fundamental issues relating to the physics where understand-ing needs to be improved, including: plasma containment and operating modes, magneto-hydrodynamics and plasma stability, particle and power exhaust, and alpha particle physics.
One of the most important technology areas is the development of materials that can operate for long periods and extended lifetimes in the extreme conditions of thermal load and neutron irradiation in close proximity to plasma, the so-called plasma-facing materials. A number of materials have been identified as candidates for future fusion power plants, but detailed experimental data is limited since there is presently no neutron source com-parable to a fusion power plant.
Nevertheless, fusion research employs a num-ber of facilities to study materials technology. In Japan, the design and qualification of the IFMIF has begun with the planned installation of the Linear IFMIF Prototype Accelerator (LIPAc). This prototype accelerator aims to demonstrate the technical feasibility of the IFMIF accelera-tor, which is designed to operate two beams of deuterons to obtain a source of fusion-relevant neutrons equivalent in energy and flux to those of a fusion power plant.
Another technology area that is key to minimising the downtime of a fusion reactor is remote han-dling. This is the machinery required to access and maintain those parts of a fusion reactor located where it would not be possible for humans to enter due to the extreme conditions — heat and radiation, in particular. Remote interven-tions are periodically required to replace and service components.
JRC13_TMAP_08AP14_P5-NS-Print.indd 73 09/04/2014 16:21:34

74
2013 Technology Map of the European Strategic Energy Technology Plan
The deployment of fusion power is a long-term route with a range of large S&T challenges to be tackled. In view of the global nature of these chal-lenges, also reflected in the ‘global’ ITER project, intensified international cooperation among ITER parties is needed. Indeed, in order to decrease risks and to develop knowledge and technologies required to advance towards that deployment, pooling resources worldwide is mandatory, since Europe or other individual partner cannot tackle these challenges alone.
Beyond ITER
ITER is the bridge towards DEMO, a device that will demonstrate the large-scale production of electrical power and tritium fuel self-sufficiency. This first demonstration of electricity production is expected in the next 30 years, with fusion then becoming available for deployment on a large scale. The first commercial plants will fol-low DEMO.
R&D on DEMO is carried out in several coun-tries and is the object of international collabora-tions, namely the Broader Approach agreement between Euratom and Japan, the main partner. DEMO will be larger than ITER, produce signifi-cantly larger fusion power over long periods, and generate electrical power. Tritium self-sufficiency will be mandatory for DEMO, requiring efficient breeding and extraction systems to minimise tritium inventory. DEMO will also need a more efficient technical solution for remote mainte-nance as well as very reliable components.
Finally, fusion will have to demonstrate the poten-tial for competitive COE in order to have a rapid market penetration.
10.6 References
Boozer, A.H., ‘Theory of tokamak disruptions’, Phys. Plasmas 19, 058101, 2012.
Ehrlich, K., Möslang, A., ‘IFMIF - an international fusion materials irradiation facility’, Nucl. Instrum. Methods Phys. Res. B, Vol. 139, 1998, pp. 72-81.
European Power Plant Conceptual Study (PPCS), 2005 (http://www.efda.org/wpcms/wp-content/uploads/2012/01/PPCS_overall_report_final-with_annexes.pdf) accessed 7 January 2014.
European Union (EU), Joint Implementation of the Broader Approach Activities in the Field of Fusion Energy Research, Official Journal of the European Union, L-246/34, 2007.
Fukushima - Association for the Study of Failure, Technical Report: Fukushima Accident Summary (AUG. 19, 2011), 2011 (http://www.shippai.org/images/html/news559/FukuAccSummary110819Final.pdf) accessed 7 January 2014.
Fusion for Energy (F4E), European Joint Undertaking for ITER and the Development of Fusion Energy, 2007.
Fusion news, Newsletter, Vol. 3, May 2009 (http://www.efda.org) accessed 7 January 2014.
International Atomic Energy Agency / International Thermonuclear Experimental Reactor (IAEA-ITER), Fusion Cooperative Agreement, 2008.
JRC13_TMAP_08AP14_P5-NS-Print.indd 74 09/04/2014 16:21:34

75
11. Bioenergy — power and heat generation
11.1 Introduction
Bioenergy is expected to have an important role within the long-term goal to become a com-petitive low-carbon economy according to the Energy Roadmap 2050. The role of biomass in the future economy was emphasised in the Strategy and Action Plan for Innovating for Sustainable Growth: a Bioeconomy for Europe (COM(2012) 60 final). The goal is to achieve a more innova-tive and low-emissions bioeconomy, based on a coherent, cross-sectoral and interdisciplinary approach towards the sustainable use of bio-logical resources from land, sea and waste for producing food, feed, materials and energy.
According to the forecast of the NREAPs, prepared by the Member States under the requirements of the RES Directive 2009/28/EC, biomass is expected to maintain a major role in renewable energy consumption (57 %) at the European level in 2020. According to the NREAPs’ aggregated data, up to 2.1 pentawatt-hours (PWh) of bio-mass should be used in the EU-27 to reach the proposed targets for bioenergy in 2020, includ-ing biofuels (Scarlat et al., 2013). The total use of biomass is expected to increase significantly until 2050 in the various scenarios of the Energy Roadmap 2050. Biomass use in the reference scenario should reach about 2.2 PWh in 2050, whereas it reaches between 3.0 and 3.7 PWh in the decarbonisation scenarios.
One of the key issues for bioenergy development is the availability of biomass. About 2.7 PWh of sustainable biomass could be available in the EU in 2020 and 3.4 PWh by 2030, accord-ing to the European Environment Agency (EEA, 2006). AEBIOM predicts similar contributions of 2 600 TWh in 2020 and 3 500 TWh in 2030 (AEBIOM, 2010). The Biomass Futures project estimated the sustainable biomass potential at 4.4 PWh in 2020 and 4.1 PWh in 2030 (Elbersen et al., 2012). The new EEA report (EEA, 2013) shows a lower bioenergy potential in three sce-narios (market first, climate focus and resource efficiency) due to the tighter environmental con-straints (such as GHG emissions from indirect land-use changes (ILUCs)) and integration of economic considerations.
11.2 Technological state of the art and anticipated developments
Different bioenergy pathways are at various stages of maturity, from RD&D to commercial stage and new technologies are expected to enter the mar-ket soon. There are several conversion technolo-gies at different stages of development based on thermo-chemical (combustion, pyrolysis and gasification) and biochemical/biological (diges-tion and fermentation) processes. A wide variety of products are also possible, including energy as well as biofuels, biochemicals and bio-based materials. Biorefineries are a rapidly emerging concept and a promising integrated approach for the co-production of both value-added products (chemicals, materials, food and feed) and bio-energy (biofuels, biogas, heat and/or electricity).
Biomass combustion
The technologies in use are largely based on mature direct combustion boiler and steam turbine systems for heat, electricity or CHP at small- and large-scale for residential and indus-trial applications. Technology development has led to efficient, industrial-scale heat production and district heating (DH) systems. Although a proven technology, the economics for biomass DH depend on a number of complex techno-eco-nomic parameters, not least the existence of a DH infrastructure and a reliable source of biomass. Traditional heating systems using wood logs have low efficiency (10–30 %) and emit high levels of particulate matter. Modern wood chips and pellet boilers have efficiencies as high as 90 %. The capital costs of biomass heat plants range from EUR 300–700/kWth. For power plants (fixed or travelling grate), the electric efficiency varies between 20 and 35 % for sizes of 1–30 MWe. CHP plants have typical capacities of 1–50 MWe with overall efficiencies of 80–90 % and invest-ment costs of EUR 2 000–3 000/kWe. FBC per-mits higher electrical efficiencies of 30–40 % at investment cost in the range EUR 2 500–3 500/kWe (Bauen et al., 2004; Siemons, 2004; IPCC, 2011; Van Tilburg, 2008; Mott MacDonald, 2011; Irena, 2012). The Stirling engine (10–100 kWe) and the ORC (50–1 500 kWe) are promising tech-nologies for small-scale and micro-scale CHP
2013 Technology Map of the European Strategic Energy Technology Plan
JRC13_TMAP_08AP14_P5-NS-Print.indd 75 09/04/2014 16:21:34

76
2013 Technology Map of the European Strategic Energy Technology Plan
(m-CHP), with electric efficiency of 16–20 %. Stirling engine technology is currently at the pilot-to-demonstration stage and the biomass ORC process has been demonstrated and is now commercially available (Liu et al., 2009; Wood and Rowley, 2011; Koop et al., 2010).
Waste
Several technologies are available for organic waste conversion, including thermal (combustion, gasification and pyrolysis) or biological treat-ment (fermentation and anaerobic digestion (AD)). Major challenges for waste combustion relate to the heterogeneous nature of waste, LHV and high corrosion risk in boilers. Municipal solid waste (MSW) has high moisture content, making AD a good option for energy recovery. Waste gasification is a promising option for electricity and heat production, as well as advanced fuels (e.g. through syngas upgrade, Fischer-Tropsch synthesis, methanol synthesis, H2 extraction). Waste-to-energy plants provided a significant contribution to the energy supply (95 TWh) in 2010 in 452 plants in Europe. Typical energy conversion efficiencies in incineration plants range between 20 and 25 % for electricity and 10–15 % electrical efficiency for CHP systems. New CHP plants using MSW are expected to reach 25–30 % electrical efficiency and 85–90 % overall efficiency in CHP (IEA, 2007; Koop et al., 2010).
Biomass co-firing
Biomass co-firing with coal in existing boilers is the most cost-effective and efficient option of heat and electricity production from biomass with small changes in the fuel feed systems. This is an attractive option for GHG emissions mitigation by substituting coal with biomass. Direct co-firing in pulverised coal-fired boilers with up to about 15 % biomass has been successfully achieved, while fluidised bed boilers can substitute higher levels of biomass. Fouling and corrosion pose
technical challenges, reducing the reliability and lifetime of coal plants. Higher percentages of biomass (50–80 %) may be used in co-firing with extensive pre-treatment (e.g. torrefaction), with minor changes in the handling system. Biomass co-firing with coal in large-scale coal plants has significantly higher electrical conversion efficiency (35–45 %) than dedicated biomass plants (typi-cally 25–35 %) (Bauen et al., 2004; IPCC, 2011; Hansson et al., 2009; Mott MacDonald, 2011; Irena, 2012).
Anaerobic digestion
AD is the conversion of organic material to biogas by bacteria, in the absence of air. The biogas is a mixture of methane (50–70 %) and CO2 with small quantities of other gases, such as H2S. This process is particularly suitable for wet feedstocks such as agricultural, municipal and industrial organic residues and wastes, sewage sludge, animal fats and slaughtering residues. Waste pre-treatment enables higher gas yields and the use of new feedstocks (such as straw and other agricultural residues). AD is a commercial technology. However, the economic viability often relies on the availability of cheap feedstock or waste. Biogas can also be upgraded to natural gas quality for injection into the natu-ral gas network or for use in gas engine-powered vehicles. Several biogas upgrading technolo-gies operate commercially, for example, water/chemical absorption and pressure swing adsorp-tion (PSA); new systems using membranes and cryogenics are at the demonstration stage. The capital cost of a biogas plant with a gas engine or turbine is estimated to be in the range of EUR 2 500–5 000/kWe (Van Tilburg, 2008). AD and gas upgrading can be integrated into new biorefinery concepts. The capacity of biogas plants with CHP ranges from typically < 250 kWe to > 2.5 MWe, with electricity conversion efficien-cies between 32 and 45 %. (Van Tilburg, 2008).
Figure 11.1: Overview of bioenergy
conversion technologies and development status
Source: IEA/Technology Roadmaps, Bioenergy for
Heat and Power, 2010; p. 14.
Basic and applied R&D Demonstration Early commercial Commercial
Biomass pretreatment
Biomass for heating
Biomass for power generation
Microbial fuel cells
Hydrothermaltreatment
Anaerobicdi gestion
2-stagedigestion
Small scalegasification
Combustion in boilers and stoves
Biogasupgrading
Landfill gas
Sewage gas
1-stagedigestion
Torrefaction
Stirling engine
Indirect co-firingCo-firing
Gasification Gasification with FCBICGTBIGCC
Parallel co-firing Direct co-firing
CombustionCombustion
with ORC
Gasification with engine
Gasification with steam cycle
Combustion and steam cycle
Pyrolysis Pelletisation/ briquetting
JRC13_TMAP_08AP14_P5-NS-Print.indd 76 09/04/2014 16:21:35

77
2013 Technology Map of the European Strategic Energy Technology Plan
Landfill gas utilisation
Landfill sites are a specific source of methane-rich gas. CH4 emissions from MSW in landfills would be between 50 and 100 kg/t (IEA, 2007). Landfill sites can produce gas over a 20–25 year lifetime. Collecting this gas can contribute signifi-cantly to the reduction of CH4 emissions (Eriksson and Olsson, 2007) and, after cleaning, provides a fuel for heat and/or electricity production. Landfill gas accounted for a significant share of biogas produced in the EU: about 37 TWh of 117 TWh in 2011. Due to the requirements to minimise land-filling of organic waste and to increase the levels of re-use, recycling and energy recovery (Landfill Directive 1999/31/EC), landfill gas is expected to decrease over time in the EU. The individual gas collection capacities of landfills vary from a few tens of kW to 4–6 MW, depending on the landfill site and conversion efficiency to electricity of 25–35 %. The capital cost of a plant coupled with a gas engine or turbine is estimated to be between EUR 1 200 and 2 000/kWe (Van Tilburg, 2008; O’Connor, 2011; Irena, 2012).
Biomass gasification
Gasification is the thermo-chemical conversion of biomass into a combustible gas (syngas) by partial oxidation at high temperatures. Biomass gasification is still in the demonstration phase and faces technical and economic challenges. Fuel gas can be used for heat and/or electricity production, or for synthesis of transport biofuels (e.g. H2, biodiesel, synthetic natural gas (SNG) and chemicals in biorefineries. Syngas can be used in internal combustion gas engines operating at elec-trical efficiencies between 22 and 35 %, in gas and steam turbine combined cycles (up to 42 %), or in fuel cells (50–55 %). Fuel gas contains a range of contaminants, depending on the feedstock and the gasification process, requiring a complex gas puri-fication system to reduce levels of contaminants. Typical gasification plant capacities range from a few hundred kWe for heat production, 100 kWe to 1 MWe for CHP with a gas engine, to 30–100 MWe for biomass integrated gasification combined cycle (BIGCC), or biomass integrated gas turbine (BIG-GT) technology. BIGCC ensures high electrical conver-sion efficiency of 40–50 % for 30–100 MW plant capacity (Faaij, 2006; Bridgwater, 2012; Fagernas et al., 2006). Small gasifier and gas engine units of 100–500 kWe are available on the market. The BIGCC concept is a promising, high-efficiency technology, although more complex and costly, for generating a high-quality gas in a pressurised gasi-fier and conversion to energy in a combined gas/steam turbine cycle. The biomass-H2 route could be a promising technology for fuel cells (McKendry, 2002). Biomass gasification and solid oxide fuel cell (SOFC) or integrated gasification fuel cell (IGFC) systems could offer high-efficiency electricity pro-duction (50–55 %) (Egsgaard et al., 2009).
Pyrolysis
Pyrolysis is the conversion of biomass to a liquid bio-oil, solid and gaseous components in the absence of air at temperatures around 450–600 °C. Fast pyrolysis (at 450–500 °C) and short residence times (< 5 s), for bio-oil production is of particular interest. The conversion efficiency of biomass to bio-oil is up to 80 %. More effort is needed to improve the quality of the pyrolysis oil, which includes hundreds of compounds. Bio-oils can be used as a feedstock for advanced biofuels and for future refineries. Whilst pyrolysis and bio-oil upgrading technology is not com-mercially available, considerable experience has been gained and several pilot plants and dem-onstration projects are on the way (BTG Empyro in the Netherlands, Fortum in Finland, Pyrogrot in Sweden, etc.) (Meier et al., 2013). The main challenges concern the development of new techniques and catalysts for bio-oil upgrading. Pyrolysis can also be used as a pre-treatment step for gasification and biofuels production.
Torrefaction
Torrefaction is a thermo-chemical upgrading process consisting of biomass heating in the absence of oxygen at temperatures typically ranging between 240 and 320 °C, releasing water and volatile compounds. Torrefaction produces a higher quality solid feedstock (bio-char) with high energy density and homogeneous composition. This decreases the costs for handling, storage and transport. Torrefied biomass can be used in small- and large-scale applications as well as in higher shares of co-firing with coal. Biomass torrefaction can create new markets and trade flows as commodity fuel and increases the feed-stock basis. The drawback is that the torrefaction and pelletisation processes result in feedstock losses and increased cost. Further development of torrefaction technology is needed to overcome certain technical and commercial challenges. No commercial torrefaction plant exists today, but the first demonstration projects are in opera-tion (e.g. Andritz-ECN at Stenderup (Denmark), Andritz ACB in Frohnleiten (Austria), Stramproy at Steenwijk (the Netherlands), Topell at Duiven (the Netherlands), etc.).
Biorefineries
A key factor in the transition to a bio-based economy will be the development of biorefiner-ies, allowing highly efficient and cost-effective processing of biomass to a range of bio-based products (chemicals, materials, food and feed) and bioenergy (biofuels, biogas, heat and/or electricity). This allows a more sustainable and efficient use of biomass resources. The stage of development of biorefineries ranges from con-ceptual to large-scale demonstration, with the
JRC13_TMAP_08AP14_P5-NS-Print.indd 77 09/04/2014 16:21:35

78
2013 Technology Map of the European Strategic Energy Technology Plan
focus either on chemicals/materials or biofuels as the main products. A variety of biorefinery configurations are currently being developed with new products and routes still being iden-tified. Biorefineries often rely on the concept of cascading use, where the highest value products are extracted first and biofuels and bioenergy are final products. The deployment of the new biorefinery concepts will depend on the technical maturity of a range of processes to produce bio-based materials, biochemicals and energy (Van Ree and Annevelink, 2007; Cherubini et al., 2009; Rødsrud et al., 2012). The cost-effective production of advanced lig-nocellulosic biofuels (lignocellulosic ethanol, Fischer-Tropsch diesel, etc.) is a major driver for the development of biorefineries.
Hydrogen from biomass
H2 can be used to power vehicles or to produce heat and power via fuel cells, engines or tur-bines. A variety of routes exist for H2 production, including thermo-chemical, electrolytic, photolytic and biological processes, all at different levels of development and not yet economically viable (IEA, 2006; Claassen and de Vrije, 2009; Foglia et al., 2011). Biological pathways are based on microorganisms, such as unicellular green algae, cyanobacteria and dark fermentative bacteria. Photo-biological processes are at a very early stage of development. Research is needed to identify more oxygen-tolerant enzymes and new strains that can convert organic material into H2. There is a need for significant improvement of conversion efficiency, reliability and reduc-ing capital costs. A key challenge is H2 separa-tion and purification. H2 storage options include compressed gas, liquid (cryogenic, borohydrides, organic liquids) and solid storage (nanotubes, nanofibres, zeolytes, hydrides). Gaseous and liq-uid storage is commercially available, but cost efficiency is an issue. Solid storage is at a very early development stage.
11.3 Market and industry status and potential
Economically, most biomass technologies have difficulties competing with fossil fuels for a number of reasons, mainly related to the maturity of the technology and the cost of feedstocks. Substantial operational experi-ence is being gained and production costs are being reduced. Some bioenergy options, such as large-scale combustion of residues, are already providing energy at a competitive price, as well as small-scale pellet boilers in residential and commercial applications.
Biomass plays an important role in energy gen-eration in the EU, with 8.2 % of gross final con-sumption and more than two thirds (66 %) of renewable energy in 2010. In 2020, this is expect-ed to remain above 57 % in 2020, although with a larger total production (Szabo et al., 2011; Banja et al., 2013). About 2 090 TWh of biomass will be used to provide about 1 630 TWh as bioenergy in 2020, including biofuels (Scarlat et al., 2013). The installed bioenergy power capacity reached 29 GWe in 2010 and it is expected to reach 43 GWe in 2020, according to the NREAPs. In the refer-ence scenario of the Energy Roadmap 2050, the installed biomass capacity is expected to further rise to 52 GWe by 2030 and even 87 GWe in 2050. The growth in biomass capacity is much higher in different decarbonisation scenarios, which should reach between 106 and 163 GW in 2050.
Biomass electricity generation in the EU increased from 69 TWh in 2005 to 123 TWh in 2010 and 133 TWh in 2011 (Eurostat, 2012). The contribution of biomass should be 232 TWh in 2020 in the reference scenario of the Energy Roadmap, representing 19 % of RES-E. The biomass electricity should significantly grow to 360 TWh in 2050 in the reference scenario and to 460–494 TWh in 2050 in decarbonisation scenarios. Biomass electricity contribution could rise from a 2.6 % share in power generation in 2005 and 3.7 % in 2010 to 7.3 % in 2050 in the reference scenario and 9.3–10.9 % in decarbonisation scenarios.
Biomass use for heating rose from 470 TWh in 1997 to 860 TWh in 2010 and it is projected to have a contribution of 1 040 TWh (81 % of renewables) to heating in 2020. Currently, bioheat is the main bioenergy market accounting for 92 % of renewable heating and 13.1 % of total heat use in the EU in 2010. Direct use of biomass for heating is expected to rise from 13.5 % in 2010 to 33 % in 2050 in the high RES scenario. In the EU, DH with biomass covers around 1.7 % of the heat demand and 20 % of DH in 2010 (Eurostat, 2012). The share of DH heating is significantly higher in some Member States (e.g. more than 60 % in Sweden, 37 % in Denmark) (Scarlat et al., 2011).
Biofuel consumption in transport rise from 36 TWh in 2005, 150 TWh in 2010, 210 TWh in 2030 and it should reach 430–450 TWh in 2050 under current policy scenarios of the Energy Roadmap 2050. The high RES and diversified sup-ply technology scenarios foresee biofuels increas-ing to 290–420 TWh in 2030 and 790–840 TWh in 2050. Future developments will depend on the adoption of the European Commission’s proposal (COM(2012) 595 final) aiming to address the ILUC effects of EU biofuel consumption, to limit the use of food-based biofuels to 5 % of energy use in transport and to encourage the development of advanced biofuels (EC, 2012).
JRC13_TMAP_08AP14_P5-NS-Print.indd 78 09/04/2014 16:21:35

79
2013 Technology Map of the European Strategic Energy Technology Plan
11.4 Barriers to large-scale deployment
The main barriers to widespread use of biomass for bioenergy are cost competitiveness with fossil fuels, low conversion efficiency for some technolo-gies and limited feedstock availability at low cost. Deployment of bioenergy requires demonstration projects at a relevant scale, which will be costly but crucial for improving and verifying technical performance and to achieve cost reduction. This is one of the key aims of the European Industrial Bioenergy Initiative (EIBI, 2010). Biomass plants, using complex treatment, handling and feeding systems for difficult feedstocks require higher capital and operating costs. Such plants are cost effective only when biomass is available at low costs, and/or when a higher carbon tax or incen-tives are in place. Additionally, the economics of bioenergy depend on many factors, such as the type of technology, (local) supply chain, resource availability and competitive uses (e.g. pulp and paper, biochemicals).
The availability of sustainable biomass feedstocks is a critical factor for large-scale deployment of bioenergy technologies. Water availability is also an important issue to consider and might have a large impact on future biomass availability. Competition between alternative use of biomass for food, feed, fibre and fuel is a major issue for bioenergy deployment. New technologies for biofuel production from lignocellulosic feedstock could also lead to competition between transport fuel and heat and power applications. Biomass feedstock costs can be zero for some by-products (e.g. black liquor, bagasse) or wastes that would otherwise have disposal costs (e.g. MSW). On the other hand, drivers to use certain types of waste and residues for energy production might raise their prices and provide incentives to pro-duce more waste. Another cost issue for biomass feedstocks refers to biomass pre-treatment. The capital costs for biomass preparation and han-dling can represent between 6 and 20 % of total investment costs of a power plant (Irena, 2012).
A main issue regarding the viability of bioenergy plants lies in the development of a reliable feed-stock supply chain. Secure, long-term supplies of low-cost, sustainable feedstock is essential to the economics of bioenergy plants. The low energy density of biomass limits the economic transport distance to a biomass plant. Feedstock costs may be low when biomass can be collected and trans-ported over short distances, but costs increase significantly over long transport distances.
Various concerns have been expressed about several aspects of sustainability of biomass. Biomass certification is expected to provide more transparency and thereby play a positive role in addressing these issues (Scarlat and Dallemand, 2011). Sustainability requirements for the use of
solid and gaseous biomass in electricity, heating and cooling were addressed by the European Commission, which provided recommendations for developing national schemes, with the same requirements as those for biofuels and bioliquids (COM(2010)11). Various initiatives have been launched to develop sustainability criteria for solid and gaseous biomass (Fritsche et al., 2012). A proposal for sustainability criteria for solid and gaseous biomass is expected to be released soon by the European Commission. Indirect effects and GHG emissions from bioenergy (such as biofuels from food crops and bioenergy from stemwood) could be important and need further analysis (Agostini et al., 2013).
Since bioenergy technologies require significant investments, the lack of long-term policies has so far been a factor discouraging investments in bioenergy and has prevented deployment at large-scale. There is nevertheless the challenge of balancing biomass use and avoiding market distortion between bioenergy and other markets for wood processing, pulp and paper, and bio-based materials.
11.5 RD&D priorities and current initiatives
RD&D priorities
There are significant uncertainties and a wide range of results with regard to biomass energy potentials due to differences in approaches, assumptions and aggregation levels that need to be addressed. More research effort should be devoted to feedstock production and development of new feedstock (higher yield, increased oil or sugar content, drought resistant, etc.) to increase productivity as well as mobilisation. Improved forest management and agricultural practices would contribute to increased biomass supply. Better use of all waste and residue streams could contribute to improved use of bioenergy potential. Additional measures are needed to extend the feedstock base, such as micro- and macroalgae (freshwater and marine), to develop new strains and enzymes and new substrates, and to encour-age the use of all residues and waste streams. Given the limited amount of biomass, the most efficient use of resources should be pursued. RD&D efforts should target the integrated bio-mass chains including cultivation, harvesting, logistics, conversion and by-product use. The development of pre-treatment methods can improve biomass characteristics, increase energy density, reduce logistics costs and increase the conversion efficiency.
Technological development is expected to improve the performances and reliability of some processes thereby permitting the introduction of high efficiency options such as ORCs, fuel cells, advanced steam cycles and biomass gasification
JRC13_TMAP_08AP14_P5-NS-Print.indd 79 09/04/2014 16:21:36

80
2013 Technology Map of the European Strategic Energy Technology Plan
combined-cycle systems. RD&D priorities include the development of new thermo-chemical and biochemical conversion processes with feedstock flexibility for lignocellulosic biomass. Key techni-cal challenges include gas upgrading, improving biodegradability, optimising conversion, engi-neering design and process integration. R&D is needed for H2 production, catalysts, separation processes and materials, and for developing H2 infrastructure. The development of biorefinery concepts should make full use of feedstocks to obtain diverse higher added-value end-products. There is a need to demonstrate and scale-up bioenergy technologies to relevant industrial scales, including innovative biofuels value chains. The research should also include small/medium-scale combustion, further development towards low emission and improved systems, as well as m-CHP installations.
Strict sustainability requirements could limit bio-mass availability for bioenergy; nevertheless, adequate sustainability requirements are critical to ensure the long-term availability of biomass and to increase customer/public acceptance of biofuels/bioenergy production. Practical imple-mentation of sustainability requirements must be based on relevant, transparent and science-based data and tools. It is essential to develop science-based and transparent criteria, indicators and worldwide accepted methodologies (e.g. LCA) to be applied to the full biomass value chain (from feedstock production and conversion pro-cesses all the way through to end uses) and to properly evaluate indirect effects of biomass use for bioenergy.
Current initiatives
The Bioenergy Technology Roadmap of the SET-Plan (EC, 2009) was set up to address techno-eco-nomic barriers to the development and commercial deployment of advanced bioenergy technologies. It aimed at bringing the most promising technolo-gies and value chains for sustainable production of advanced biofuels, heat and power to commercial maturity. The estimated budget for implementa-tion is EUR 9 billion over 10 years (EC, 2009). The EIBI (EIBI, 2010) was launched in 2010 with the objectives to achieve bioenergy production costs that compete with fossil energy and to strengthen EU technology leadership for renewable transport fuels. EIBI focuses on innovative bioenergy value chains that could be deployed commercially, in partnership with industry.
The EIBI Implementation Plan for 2013–2017 describes the core activities aimed at building and operating demonstration and/or flagship projects for innovative value chains with large market potential (EIBI, 2013). The implemen-tation approach is to support coordination of funding provided by EU and Members States (e.g.
via BESTF (2013)) using agreed project selec-tion procedures for demonstration and flagship plants starting before 2015. Substantial funding of more than EUR 600 million was agreed in 2012 from the new entrants reserve of NER300 for 8 bioenergy/biofuels demonstration projects (NER300, 2012), although it should be noted that 3 bioenergy NER300 projects have cancelled their investment decision. In 2013, a new public-private partnership initiative was announced that would aim to invest EUR 3.8 billion up to 2020 (EC, 2013). The draft 2013–2017 EIBI Implementation Plan will be approved by SET-Plan EIBI, which includes representatives of industry, the European Commission and Member States. The new Bio-based Industries Joint Technology Initiative (JTI) (COM(2013) 494) is designed to promote a wide range of topics concerning a bioeconomy with biorefineries at its heart in the period 2014–2020 (Bio-based Industries Consortium, 2013).
11.6 References
European Biomass Association (AEBIOM), Bioenergy 2030 European energy issues and the development of bioenergy towards 2030, 2010.
Agostini, A., Boulamanti, AK., Giuntoli, J., Carbon accounting of forest bioenergy, JRC Technical Report, EUR 25354, 2013.
Banja, M., Monforti-Ferrario, F., Scarlat, N., Review of Technical Assessment of National Renewable Energy Action Plans, EUR 25757, 2013.
Bauen, A., Woods, J., Hailes, R., Bioelectricity Vision: Achieving 15 % Electricity from Biomass in OECD Countries by 2020, Imperial College Centre for Energy Policy and Technology and E4Tech, 2004.
Bio-based Industries Consortium, 2013 (http://biconsortium.eu/) accessed 7 January 2014.
Bioenergy Sustaining the Future (BESTF), ERANET Plus activity, 2013 (http://www.eranetbestf.net/) accessed 7 January 2014.
Bridgwater, A.V., ‘Review of fast pyrolysis of biomass and product up-grading’, Biomass and Bioenergy, Vol. 38, 2012, pp. 68-94.
Brown, G., Hawkes, A.D., Bauen, A., Leach, M A., Biomass Applications, Imperial College Centre for Energy Policy and Technology, London, UK, 2006 (http://www.eusustel.be/index.php) accessed 7 January 2014.
Cherubini, F., Jungmeier, G., Mandl, M., Wellisch, M., Philips, C., Joergensen, H., Biorefineries, Adding Value to the Sustainable Utilisation of Biomass, IEA Bioenergy Publication T42:2009:01, IEA Bioenergy Task 42 on Biorefineries, 2009.
JRC13_TMAP_08AP14_P5-NS-Print.indd 80 09/04/2014 16:21:36

81
2013 Technology Map of the European Strategic Energy Technology Plan
Claassen, P.A.M., de Vrije, T., ‘Non-thermal produc-tion of pure hydrogen from biomass: Hyvolution’, Chem. Eng. Trans., Vol. 18, 2009, pp. 333-338.
Egsgaard, H.U., Hansen, P., Arendt, J., Glarborg, P., Nielsen, C., ‘Combustion and gasification tech-nologies’, Riso Energy Report 2, Riso, Roskilde, Denmark, 2009, pp. 35-39.
Elbersen, B., Startisky I., Hengeveld G., Schelhaas M.J., Naeff H, BottcherH., Atlas of EU biomass potentials. Spatially detailed and quantified over-view of EU biomass potential taking into account main criteria determining biomass availability from different sources, 2012.
Eriksson, P., Olsson, M., The Potential of Biogas as Vehicle Fuel in Europe – A Technological Innovation Systems Analysis of the Emerging Bio-Methane Technology, Chalmers University of Technology, Report No. 2007:6, 2007. ISSN 1404-8167
European Biofuels Technology Platform (EBTP), Boosting the contribution of bioenergy to the European Union Climate & Energy ambitions: a proposal for a European Industrial Bioenergy Initiative, 2009.
European Commission (EC), A European strategic energy technology plan (SET-plan) – ‘Towards a low carbon future’ Communication from the Commission to the Council, the European Parliament, the European Economic and Social Committee and the Committee of the Regions (COM/2007/723 final), 2007.
European Commission (EC), HYWAYS the European Hydrogen Roadmap, EUR 23123, 2008.
European Commission (EC), Investing in the Development of Low Carbon Technologies (SET-Plan), a technology Roadmap Commission Staff Working Document accompanying document to the Communication from the Commission to the European Parliament, the Council, the European Economic and Social Committee and the Committee of the Regions (SEC (2009)1295), 2009.
European Commission (EC), Proposal for a Directive of the European Parliament and of the Council amending Directive 98/70/EC relating to the quality of petrol and diesel fuels and Directive 2009/28/EC on the promotion of the use of energy from renewable sources, COM(2012) 595, 2012.
European Commission (EC), Proposal from the Commission to the European Parliament, the Council. the European Economic and Social Committee and the Committee of the Regions, Public-private partnerships in Horizon 2020: a powerful tool to deliver on innovation and growth in Europe, COM(2013) 494, 2013.
European Environment Agency (EEA), EU bio-energy potential from a resource efficiency perspective, Report No 6/2013, 2013. ISBN 978-92-9213-397-9.
European Environment Agency (EEA), How much bioenergy can Europe produce without harming the environment?, Report No 7/2006, 2006. ISBN 92–9167–849-X2006
European Industrial Bioenergy Initiative (EIBI), Boosting the contribution of Bioenergy to the EU climate and energy ambitions. Implementation Plan 2010–2012, 2010 (http://setis.ec.europa.eu/set-plan-implementation/european-industrial-ini-tiatives-eiis/eii-implementation-plans) accessed 7 January 2014.
European Industrial Bioenergy Initiative (EIBI), Draft Implementation Plan for the period 2013-2017, 2013.
Fagernas, L., Johansson, A., Wilen, C., Sipila, K., Bioenergy in Europe Opportunities and Barriers, VTT Research Notes, 2352, 2006.
Foglia, D., Wukovits, W., Friedl, A., Ljunggren, M., Zacchi, G., ‘Effects of feedstocks on the process integration of biohydrogen production’, Clean Techn Environ Policy, Vol. 13, 2011, pp. 547-558.
Hansson, J., Berndes, G., Johnsson, F., Kjarstad, J., ‘Co-firing biomass with coal for electricity genera-tion - An assessment of the potential in EU27’, Energy Policy, Vol. 37, 2009, pp. 1444-1455.
Intergovernmental Panel on Climate Change (IPCC), Special Report on Renewable Energy Sources and Climate Change Mitigation, 2011 (http://srren.ipcc-wg3.de/report) accessed 7 January 2014.
International Energy Agency (IEA), Hydrogen pro-duction and storage. R&D Priorities and Gaps, 2006.
International Energy Agency (IEA), Global Wood Pellets Markets and Industry: Policy Drivers, Market Status and Raw Material Potential, Bioenergy Task 40, 2007.
International Energy Agency (IEA), Technology Roadmaps: Bioenergy for Heat and Power, 2010.
IRENA, Renewable energy technologies: cost anal-ysis series. Biomass for Power Generation, 2012.
Koop, K., Koper, M., Bijsma, R., Wonink, S., Ouwens, J.D., Evaluation of improvements in end-conversion efficiency for bioenergy pro-duction, 2010.
JRC13_TMAP_08AP14_P5-NS-Print.indd 81 09/04/2014 16:21:36

82
2013 Technology Map of the European Strategic Energy Technology Plan
Laird, D.A., Brown, R.C., Amonette, J.E., Lehmann, J., ‘Review of the pyrolysis platform for coproduc-ing bio-oil and biochar’, Biofuels, Bioproducts and Biorefining, Vol. 3, 2009, pp. 547-562.
Liu, H., Dong, L., Riff at, S., ‘Development of Small-Scale and Micro-Scale Biomass-Fuelled CHP Systems – A literature review’, Applied Thermal Engineering, Vol. 29, 2009.
Lukehurst, C.T., Frost, P., Al Seadi, T., Utilisation of digestate from biogas plants as biofertiliser, IEA Bioenergy Task 37, 2010 (http://www.iea-biogas.net/technical-brochures.html or http://www.iea-biogas.net/files/daten-redaktion/download/publi-task37/Digestate_Brochure_Revised_12-2010.pdf) accessed 7 January 2014.
McKendry, P., ‘Energy production from biomass (part 3): gasification technologies’, Bioresource Technology, Vol. 83, 2002, pp. 55-63.
Meier, D., van de Beld, B., Bridgwater, A., Elliott, D.C., Oasmaa, A., Preto, F., ‘State-of-the-art of fast pyrolysis in IEA Bioenergy member countries’, Renewable and Sustainable Energy Reviews, Vol. 20, 2013, pp. 619-641.
New Entrants Reserve 300 (NER300), Moving towards a low carbon economy and boosting innovation, growth and employment across the EU, Commission Staff Working Document SWD(2012) 224 and Award decision under the first call for proposals of the NER300 funding programme, Commission Implementing Decision, C(2012) 9432, 2012.
Rodrigues, M., Faaij, A.P.C., Walter, A., ‘Techno-economic analysis of co-fired biomass integrated gasification/combined cycle systems with inclu-sion of economies of scale’, Energy, Vol. 28, 2003, pp. 1229-1258.
Rødsrud, G., Lersch, M., Sjöde, S., ‘History and future of world’s most advanced biorefinery in operation’, Biomass and Bioenergy, Vol. 46, 2012, pp. 46-59.
Scarlat, N., Dallemand, J.F., ‘Recent develop-ments of biofuels/bioenergy certification: a global overview’, Energy Policy, Vol. 39, 2011, pp. 1630-1646.
Scarlat, N., Dallemand, J.F., Banja, M., ‘Possible impact of 2020 bioenergy targets on European Union land use. A scenario-based assessment from national renewable energy action plans proposals’, Renewable and Sustainable Energy Reviews, Vol. 18, 2013, pp. 595-606.
Scarlat, N., Dallemand, J.F., Skjelhaugen, O.J., Asplund, D., Nesheim, L., ‘Biomass resources and bioenergy developments in Norway: present sta-tus and perspectives compared to other Nordic countries’, Renewable and Sustainable Energy Reviews, Vol. 15, 2011, pp. 3388-3398.
Siemons, R., Bio-energy’s role in the EU energy market. A view of developments until 2020, BTG Report to the European Commission, 2004.
Szabo, M., Jaeger-Waldau, A., Monforti-Ferrario, F., Scarlat, N., Bloem, H., Quicheron, M, Huld., T, Ossenbrink, H., Technical assessment of the renewable energy action plans, EUR 24926, 2011.
Thornley, P., Upham, P., Huang, Y., Rezvani, S., Brammer, J. & Rogers, J., ‘Integrated assessment of bioenergy technology options’, Energy Policy, Vol. 37, 2009, pp. 890-903.
Van Ree, R., Annevelink, E., Status Report Biorefinery, 2007.
Van Tilburg, X., Technisch-economische param-eters van duurzame energieopties in 2009-2010, 2008. ECN-E-08 - 090
Wood, S.R., Rowley, P.N., ‘A techno-economic analysis of small-scale, biomass-fuelled com-bined heat and power for community housing’, Biomass and Bioenergy, 2011.
JRC13_TMAP_08AP14_P5-NS-Print.indd 82 09/04/2014 16:21:37

83
12. Biofuels for the transport sector
12.1 Introduction
The use of biofuels in transport is promoted as a means to tackle climate change, diversify energy sources and secure energy supply. In addition, biofuels are considered as an option to contribute to the reduction of oil imports and oil dependence, rural development and GHG emissions reduction. In 2009, Directive 2009/28/EC of the EU called for at least 10 % of the final energy consumption in transport to originate from renewable sources by 2020. Biofuels will be a crucial component towards this target, the other one being electricity from renewable sources.
Although biofuels production provides new options for using agricultural crops, there are environmental, social and economic con-cerns associated with biofuels production. The diversity of feedstock, large number of biofuel pathways and their complexity lead to a high uncertainty over the GHG performances of biofuels, in terms of GHG emission reductions compared to the fossil fuels, especially if land-use change is involved. Additional uncertainties occur if indirect effects are considered, such as ILUCs or the impact on food and feed, local energy supply, bio-materials, among others. The future of biofuels development depends to a large extent on the policy support and
technology improvement of new promising options using, for example, lignocellulosic bio-mass or aquatic biomass.
12.2 Technological state of the art and anticipated developments
Bioethanol and biodiesel are the most common biofuels used in transport worldwide. Other biofuels are also in use, such as pure vegetable oil and biogas, although with a more limited scope. The production of first-generation bio-fuels from plants containing starch, sugar-based and oil-seed crops is characterised by commercial markets and mature technologies. First-generation bioethanol production is a well established and mature technology based on a fermentation process of starch and sugar-based food crops, followed by distillation. Bioethanol is produced from a wide variety of feedstocks, but is mainly produced from sugar cane (Brazil), wheat and sugar beet (EU), and maize (US). The ethanol productivity per land area in the EU is in the order of 42–84 GJ (1–2 tonnes of oil equivalent (toe)) ethanol/ha for cereals as feedstock, and 84–126 GJ (2–3 toe) ethanol/ha for sugar beet. However, one major problem with bioethanol produc-tion is the availability of raw materials for the production. The availability of feedstocks for
Figure 12.1: Bioenergy conversion routes
Source: JRC, based on Bauen et al., 2009.
2013 Technology Map of the European Strategic Energy Technology Plan
Feedstock Conversion routes Liquid fuels
Gaseous fuels
Oil crops
Sugar and startch crops
Transesterification or hydrogenation
Biodiesel
Bioethanol
Syndiesel/Renewable diesel
Methanol, DME
Biomethane
Hydrogen
Other fuels and fuel additives
(Hydrolysis) + Fermentation
Anaerobic digestion + biogas upgrading
Other biological/chemical routes
Bio-photochemical routes
Gasification
Pyrolysis
Wet biomass(organic waste, manure etc.)
Lignocellulosic biomass
Photosynthetic micro-organisms(e.g. microalgae and bacteria)
JRC13_TMAP_08AP14_P5-NS-Print.indd 83 09/04/2014 16:21:37

84
2013 Technology Map of the European Strategic Energy Technology Plan
bioethanol can vary considerably from season to season and depends on geographic locations. Therefore, the choice of crop used to produce bioethanol depends on the prevailing soil and climatic conditions.
Biodiesel production from vegetable oil and fats is based on a relatively simple and established technology, and it is characterised by mature commercial markets and well understood tech-nologies. Biodiesel is produced via transesteri-fication. The feedstock can be vegetable oil, such as that derived from oil-seed crops (e.g. rapeseed, sunflower, soya bean, oil palm), used oil (e.g. frying oil) or animal fat. Rapeseed is the main raw material for biodiesel production in the EU, soya bean in the US and Brazil, and palm oil in Malaysia and Indonesia. The bio-diesel productivity per land area from different oil-seed crops in the EU amounts to 33–50 GJ (0.8–1.2 toe) biodiesel/ha, while palm oil yields about 160–170 GJ (3.8–4 toe) of biodiesel/ha.
Biofuel blending limits in the EU are set accord-ing to conventional fuel standards, designed to ensure compatibility with conventional power trains and refuelling infrastructure.
Upgraded biogas to natural gas quality (biom-ethane or SNG) produced through AD can also be used as gaseous biofuel in modified gas engines. However, additional cleaning and upgrading of biogas is needed. A number of up-grading technologies operate commercially (e.g. absorption and PSA) and new systems using membranes and cryogenics are at the demonstration stage. Biogas is at present used mainly for heat and electricity production, with only a small share being used as fuel gas for transportation. The future use of biogas in transport will depend on the policy support.
The main cost factor for conventional biofuels is feedstock, which accounts for 45–70 % of total production costs, whereas the main factor for advanced biofuels is capital costs (35–50 %) fol-lowed by feedstock (IEA, 2011). In the longer term, the volatility of feedstock prices will be more of a disadvantage to conventional biofuels than advanced biofuels. Although production costs of biofuels can fall as scale and efficiency increase, oil prices can have an impact on feedstock and production costs. To be competitive with fossil fuels, biofuel production costs have to be below the price of the oil equivalent. Another key factor that can affect profitability is the alternative uses of the feedstock (food, feed, etc.). The production costs of ethanol and biodiesel currently remain higher than that of petrol and diesel, with the exception of sugarcane bioethanol in Brazil where the cost is lower. However, the low-cost production of sugar cane ethanol seen in Brazil is unlikely to be replicated in other countries due to lower yields,
higher costs and demand exceeding low-cost sup-ply. The EU producer prices in 2012 for ethanol and biodiesel were EUR 109/MWh and EUR 95/MWh, respectively (OECD, 2013). These prices are forecast to increase in 2015 to EUR 115/MWh for ethanol and EUR 96/MWh for biodiesel (OECD-FAO, 2013). Investment costs for a bioethanol plant in the EU are about EUR 640–2 200 per kW of transport fuel (kWtrans)
15 (Ecofys, 2011). Investment costs for a biodiesel plant are about EUR 210–860/kWtrans.
Second-generation, lignocellulosic biofuels are expected to deliver more environmental ben-efits and higher feedstock flexibility than first-generation biofuels, since many of the problems associated with first-generation biofuels can be addressed by the production of biofuels manu-factured from agricultural and forest residues and from non-food crop feedstocks. Where the lignocellulosic feedstock is to be produced from specialist energy crops grown on arable land, several concerns remain over competing land use, although energy yields (in terms of GJ/ha) are likely to be higher than if crops grown for first-generation biofuels are produced on the same land. In addition, poorer quality land could be used (IEA, 2008).
However, the future costs associated with the production of second-generation biofuels are still uncertain. Lignocellulosic biofuels can be produced from agricultural and forest residues, wood wastes, the organic part of MSW and energy crops such as energy grasses and short rotation forestry (SRF). This has low or no additional land requirements or impacts on food and fibre production. Relatively high-energy yields (GJ/ha) can be obtained from energy crops compared to the traditional food crops used for first-generation biofuels. Second-generation biofuel productivity is in the order of 2–4 toe biofuels/ha. New varieties of energy crops might have increased yields, lower water demand and lower agrochemical requirements.
The processing of cellulosic feedstocks is more complex than processing sugar- and starch-based feedstocks. Options available for lignocellulosic biofuels include biochemical enzymatic hydrolysis and thermo-chemical biomass-to-liquid (BTL) processes. In the biochemical process, enzymes and other microorganisms are used to convert cellulose and hemicellulose components of the feedstocks to sugars prior to their fermentation to produce ethanol. Thermo-chemical processes are based on a high-temperature thermal treatment (e.g. pyrolysis in an inert atmosphere or gasifica-tion under the presence of below stoichiometric amounts of an oxidising agent) to maximise the
15 Investment costs are expressed in EUR/kW of transport
fuel.
JRC13_TMAP_08AP14_P5-NS-Print.indd 84 09/04/2014 16:21:37

85
2013 Technology Map of the European Strategic Energy Technology Plan
production of a liquid product (tar) and synthesis gas, which can also be converted into liquid or gaseous synthetic fuels such as Fischer-Tropsch diesel, biomethane (SNG) or biomethanol.
According to the Renewable Energy and Fuel Quality Directive, the use of different types of second-generation biofuels (i.e. farmed wood Fischer-Tropsch, farmed wood dimethyl ether (DME), waste wood ethanol, etc.), can lead to GHG emissions savings in the order of 70–95 %, compared to the corresponding use of fossil fuels (EC, 2009a, 2009b).
Algae are likely to play an important role in third-generation biofuel production. Algae can be cul-tivated on non-productive land (i.e. degraded, non-arable) that is unsuitable for agriculture or in brackish, saline and wastewater from waste-water treatment plants. Algae can be produced in open ponds, raceway ponds, closed photobioreac-tors, closed fermenter systems and macroalgae marine systems. The potential oil yields (l/ha) for algae are significantly higher than yields of oil-seed crops. Theoretically, algae could produce up to 50 000 l of biodiesel/ha/year. High productivity in open ponds is reported in the range of 15–30 g/day/m2 of pond area (IEA/IEA-AMF, 2011; Darzins et al., 2010). Algae biorefinery could produce biodiesel, bioethanol and biomethane, as well as valuable co-products including oils, proteins and carbohydrates.
Biofuel production from algae is presently at the R&D stage and pilot plants are up and running worldwide. There are technical chal-lenges and a need for innovation and technical improvement in all steps of algal biofuels pro-duction. Further efforts are needed to develop the optimum strains of algae, with fast growth rates and/or high oil yields, in cultivation, algae harvesting and oil extraction.
H2 production plays a very important role in the development of the hydrogen economy. One of the promising H2 production approaches is conversion from biomass, which is abundant, clean and renewable. Over the life cycle, net CO2 emission is nearly zero due to the photo-synthesis of green plants. H2 produced from biomass, or third-generation biofuel, can be used to power vehicles, via fuel cells or internal combustion engines (ICEs) for heat and power production. H2 is expected to play an important role in building a low-carbon economy in the long term (2030). Several different routes are in the R&D stage and can play a role in the long term (Hamelinck, 2002; Claassen and de Vrije, 2009; Foglia et al., 2011). Many investi-gations on various H2 production methods have been conducted over the past several decades and include:
• fermentation of biomass to H2 (dark fermenta-tion) or AD followed by CH4 reforming;
• gasification followed by upgrading and reform-ing of syngas;
• pyrolysis and reforming of bio-oil;
• direct H2 production in a phototrophic environ-ment (photo fermentation) through organisms.
Production costs of second-generation bio-fuels are uncertain as little data is available. Cost estimates for second-generation biofuels show significant differences depending on plant complexity and biomass conversion efficiency. Second-generation biofuels need significant improvement in the technology to enter the market. According to IEA projections, production costs for BTL-diesel and lignocellulosic ethanol are currently not competitive with fossil fuels and most first-generation biofuels (IEA, 2010). In the long term, however, with increasing plant capacities and improved conversion efficiencies, both BTL-diesel and lignocellulosic ethanol could be produced at significantly reduced costs.
Investment costs for advanced bioethanol plants are in the range of EUR 1 130–1 150/kWtrans. Investment costs for BTL from energy crops (i.e. short rotation coppice (SRC), miscanthus, red canary grass, switchgrass) and selected waste streams (e.g. straw) are estimated at between EUR 750 and 5 600/kWtrans (Ecofys, 2011).
12.3 Market and industry status and potential
Biofuels production has increased continuously worldwide over the last years. At the moment, they represent the so-called biofuels of the first generation, while large research efforts are being undertaken to bring onto the market second-generation lignocellulosic biofuels.
In 2011, global ethanol production reached 81.6 billion litres, in more than 50 countries. At the moment, the US is the world’s leading pro-ducer of bioethanol, with Brazil following. Global bioethanol production is projected to increase to above 3 800 petajoules (PJ) in 2021. The three major producers are expected to remain Brazil, the EU and the US, followed by China and India. It is expected that Brazil will remain the major bioethanol exporter, while global trade will increase from about 4 % to about 7 % of global production by 2021 (OECD/FAO, 2012).
JRC13_TMAP_08AP14_P5-NS-Print.indd 85 09/04/2014 16:21:37

86
2013 Technology Map of the European Strategic Energy Technology Plan
Global biodiesel production totalled 24 billion litres worldwide in 2011, 57 % of biodiesel being produced in the EU. In the US, biodiesel produc-tion reached 3.4 billion litres in 2011 (EIA, 2013). The land used for biofuels is at around 30 mil-lion ha worldwide, or around 1.9 % of the global agricultural land, of which about 9.6 million ha is used for sugarcane plantation in Brazil (EC, 2012). According to the OECD-FAO Agricultural Outlook 2012–2021, global biodiesel produc-tion is expected to increase to almost 1 400 PJ by 2021. The EU is expected to be the largest producer and user of biodiesel. Other significant players are projected to be Argentina, Brazil, Indonesia, Thailand and the US. Biodiesel trade is projected to increase only slightly, with Argentina remaining the major exporter (OECD/FAO, 2012).
New biofuel mandates, such as the Renewable Fuels Standard (RFS) in the US, or the Renewable Energy Directive (RED) 2009/28/EC in the EU, and others in Asia and Latin America, provide perspectives for an increased production for biofuels across the world. Mandates for blend-ing biofuels into vehicle fuels have been set in at least 46 countries at the national level and in 26 states and provinces by early 2012. Most mandates require blending 10–15 % ethanol with gasoline or blending 2–5 % biodiesel with diesel fuel (REN21, 2010). In the EU, RED set manda-tory targets of 10 % share of renewable energy in transport for 2020 in each EU Member State, and 6 % reduction in GHG emissions from road transport fuels (EC, 2009). In the US, the Energy Independence and Security Act (EISA) of 2007 set overall renewable fuels targets of 36 billion gallons by 2022, with 15 billion gallons of ethanol and 21 billion gallons of advanced biofuels by 2022 (Environmental Protection Agency, 2010a). In addition to the bioethanol programme, the Brazil biodiesel national programme was estab-lished and the biodiesel use mandate has been set at 5 % since 2010 (USDA, 2012a). The targets of China proposed for 2020 are to produce 12 Mt of biofuels, to replace 15 % of transportation energy needs. Currently, nine provinces have 10 % ethanol mandate for transport (IEA, 2011). India’s National Biofuel Policy, approved in 2009, encour-ages the use of renewable energy resources as alternate fuels to supplement fossil motor fuels and had proposed a target of replacing 20 % of fossil motor fuel consumption with biofuels (bioethanol and biodiesel) by the end of 2017 (USDA, 2012b; IEA, 2011).
The European Commission proposed a Road Map (EC, 2006) that includes a binding overall EU 20 % RES target by 2020 and a 10 % minimum binding target for biofuels for each EU Member State. The Directive 2009/28/EC (EC, 2006), on the promotion of the use of energy from renew-able sources, set a mandatory target of 10 % share of energy from renewable sources in the
final consumption of energy in transport in each Member State by 2020. According to the Biofuels Research Advisory Council (BIOFRAC), up to one quarter of the EU’s transport fuel needs could be met by biofuels in 2030 (BIOFRAC, 2006).
The share of biofuel in the final consumption of energy in transport in the EU accounted for only 0.25 % in 2000, but increased to 138 TWh (11.9 Mtoe; 3.9 %) in 2009, 155 TWh (13.3 Mtoe; 4.3 %) in 2010 and 163 TWhe (14.0 Mtoe; 4.6 %) in 2011 (Eurostat, 2013). The NREAPs estimate that biofuel use in transport in the EU-27 is likely to reach about 349 TWh (30 Mtoe) in 2020. The greatest contribution in 2020 is expected to come from biodiesel with 251 TWh (21.6 Mtoe), followed by bioethanol/bio-ethyl tertiary butyl ether (ETBE) with 85 TWh (7.3 Mtoe) and other biofuels (such as biogas and vegetable oils) with 8.1 TWh (0.7 Mtoe). According to the NREAPs’ forecasts, the contribution made by biofuels produced from wastes, residues, non-food cel-lulosic material and lignocellulosic material is expected to reach 31.4 TWh (2.7 Mtoe), repre-senting about 9 % of the estimated biofuel con-sumption in the EU-27 in 2020. The NREAPs data show that in 2020 about 128 TWh (11 Mtoe) of biofuels could be imported by all the Member States in order to reach the 10 % binding target. This should represent about 37 % of the biofuel use in the EU in 2020.
These projections will dramatically change if the new Proposal for a Directive of the European Parliament and of the Council amending Directive 98/70/EC relating to the quality of petrol and diesel fuels and amending the Directive 2009/28/EC on the promotion of the use of energy from renewable sources gets accepted. The proposal aims to increase the minimum GHG savings threshold for new installations to 60 % and to limit the amount of food crop-based biofuels to the current consumption level of 5 % up to 2020 (European Parliament and Council, 2012).
The share of biodiesel produced from vegetable oil is expected to decrease by 10 % down to 70 % in 2021. Second-generation biodiesel production is projected to increase slightly, mainly coming from the EU. It is expected that coarse grain will remain the dominating ethanol feedstock (44 %), followed by sugarcane (34 %). Cellulosic ethanol is projected to reach a global share of almost 9.5 % and will be produced predominately in the US (OECD/FAO, 2012).
It is forecast that the ethanol and biodiesel pro-ducer prices in European countries in 2020 will be EUR 140/MWh and EUR 98/MWh, respectively (OECD/FAO, 2013).
JRC13_TMAP_08AP14_P5-NS-Print.indd 86 09/04/2014 16:21:37

87
2013 Technology Map of the European Strategic Energy Technology Plan
12.4 Barriers to large-scale development
The main barriers to widespread use of biofuels in transport are cost competitiveness with fossil fuels, low conversion efficiency, feedstock avail-ability and sustainability issues. Biofuels produc-tion depends on policy support and further cost reduction of first-generation biofuels in order to compete with fossil fuels. The development of second-generation biofuels depends on the improvement of their technological and economic performances.
There are technology challenges for the biochemi-cal and thermo-chemical routes for lignocellulosic biofuels. Technology improvements are needed for the thermo-chemical route, as well as pro-cess improvement (pyrolysis and gasification), efficiency improvement, process integration and cost reduction. For the biochemical pathway, there is a need to improve the pre-treatment stage, improve the efficiency of enzymes and reduce their cost, and improve overall process integration and reduce cost.
Although biofuel production provides new oppor-tunities for agriculture, there are environmental, social and economic concerns associated with first-generation biofuels. These are particular concerns mainly related to biofuel impact on the environ-ment, biodiversity and water resources, land-use changes, real GHG emission reductions and cost of CO2-avoided emissions. There are concerns about the additional negative effects of intensified agricultural practices aiming at increasing yields or the extension of agricultural land, leading to significant land-use change and one-time release of high emissions of CO2. This could offset climate change benefits or other benefits from the use of biofuels due to a huge carbon debt and very long payback time.
The competition between alternative use of bio-mass resources for food, feed, fibre and fuel is a critical issue. There are concerns that biofuels produced from food crops affect food security and availability, and contribute to food shortages and increased food and feed prices by displacing land that would otherwise be used for food production. The production of biofuels from lignocellulosic feedstock could reduce their impact on the agri-cultural markets and land use, but this could also lead to competition for biomass resources between transport fuel and heat and power applications.
Where lignocellulosic feedstock comes from energy crops grown on arable land, several con-cerns still remain about the competition for land, although energy yields (GJ/ha) are likely to be higher. The indirect impacts of diverting waste/resi-due feedstock into biofuels production, when these materials have other uses (i.e. tallow), must be also considered. This diversion might offer limited
GHG savings or even an increase in GHG emissions because the demand for the displaced feedstock still needs to be met from other sources that are often more GHG-intensive (RFA, 2008).
The diversity of feedstock, large number of bio-fuel pathways and their complexity leads to a high uncertainty over the GHG performances of biofuels, especially if land-use change is involved (Dallemand, 2008). The various assumptions and methodologies used for determining GHG emis-sions through LCA yield very different results, even for the same crop from the same country, leading to concerns about the validity of GHG calculations. Indirect effects are difficult to moni-tor, measure and control, but several assessment methodologies have been undertaken to estimate the GHG emissions from ILUC (Laborde, 2011; Al Riffai et al., 2010; JRC, 2010a, 2010b). Although there are still uncertainties in the definition of exact GHG emissions from ILUC, it is now recog-nised by most of the scientific community that the effect is significant, and needs therefore to be properly addressed.
In October 2012, the European Commission pub-lished a policy proposal (COM(2012) 595 EN) on how to minimise ILUC risks through legislation. The proposed amendments aim at incentivising the transition to biofuels that deliver substantial GHG savings by limiting the contribution of con-ventional biofuels towards meeting RED targets while protecting existing investments and fostering market penetration of advanced biofuels. ILUC factors per crop group (cereals and other starch-rich crops, sugars, oil crops) have been introduced based on the results of International Food Policy Research Institute (IFPRI) modelling of 2011 in RED as only a reporting requirement.
Sustainability aspects are critical for the future development of biofuels production. Biofuel certification is expected to reduce the concerns related to the sustainability of biofuels. However, biofuel certification faces large difficulties due to the large verities of feedstock, high number of conversion pathways and various aspects to be covered (Scarlat, 2011).
12.5 RD&D priorities and current initiatives
RD&D priorities
Effort is needed to advance new technologies to develop high-efficiency, cost-effective thermo-chemical and biochemical conversion routes to biofuels production. Further research is needed to improve conversion processes, system integra-tion, cost effectiveness and flexibility to use dif-ferent feedstocks. The development of biorefinery concepts, producing a variety of high-value end products, can significantly improve the competi-tiveness of bioenergy and biofuels production.
JRC13_TMAP_08AP14_P5-NS-Print.indd 87 09/04/2014 16:21:37

88
2013 Technology Map of the European Strategic Energy Technology Plan
There is a crucial need to demonstrate reliabil-ity and performance and scale-up bioenergy technologies to relevant industrial scales. The development of several demonstration or flagship plants for second-generation biofuels is crucial for process development, scale-up of the technol-ogy, and validation of the technical and economi-cal performances. A number of the technologies are included in the value chains of the EIBI, which aims to bring to commercial maturity the most promising large-scale bioenergy technologies.
There is a need, among others, to enlarge the feedstock base, to develop new feedstocks (SRF/SRC, energy grasses, aquatic biomass, etc.), with high-yield, increased oil or sugar content, fast growing and low-input biomass feedstock, and to improve biomass availability, reduce costs, and reduce competition with food, feed or fibber mar-kets. More efforts are needed to develop reliable supply chains and improved biomass logistics, at different scales. RD&D efforts should target the whole integrated biomass chains, including efficient and sustainable cultivation, harvest-ing, pre-treatment, logistics, conversion and by-product use.
Meeting sustainability requirements is a key issue for the large-scale deployment of biofuel production. Practical implementation of sustain-ability requirements must be based on relevant, transparent and science-based data and tools. It is essential to develop science-based and trans-parent criteria, indicators and worldwide accepted methodologies (e.g. LCA) to be applied to the full biomass value chain (from feedstock production and conversion processes to end uses). Improved methods must be developed to evaluate direct and indirect land-use changes due to biofuel pro-duction. The impact of ILUCs on GHG emissions must be assessed on the basis of verified and accepted methodologies. The impact of biofuel production on the availability of food products and changes in commodity prices and land use associated with the use of biomass for energy must also be evaluated.
Current initiatives
The SRA of the European Biofuels Technology Platform (EBTP) aims to provide the main direc-tion and RD&D efforts required to achieve the BIOFRAC goal of 25 % share of biofuels in road transport energy consumption in 2030 (BIOFRAC, 2006). The Bioenergy Technology Roadmap of the SET-Plan (EC, 2009b; SEC, (2009)1295) was set to address the techno-economic barriers to the commercial deployment of advanced bioenergy technologies. The first pillar of the Bioenergy Technology Roadmap is to bring to commer-cial maturity the most promising technologies and value chains for sustainable production of advanced biofuels and highly efficient heat and power from biomass at large-scale. This includes optimisation of the value chains, scale-up and process integration optimisation, feedstock flex-ibility improvement, energy and carbon efficiency, as well as ensuring CapEx efficiency and reli-ability. The second pillar is to ensure sustainable biomass feedstock availability, involving realistic potential assessment, development of advanced feedstock production, management and harvest-ing, and the scaling-up of promising feedstock options. The third pillar is to develop a longer-term R&D programme to support the bioenergy industry development beyond 2020. The total estimated budget for the implementation of the Roadmap was estimated at EUR 9 billion over the next 10 years (SEC, (2009)1295).
Based on the SET-Plan proposal (COM/2007/723 final), the EIBI (EIBI, 2010) was established with the aim to accelerate the commercial deployment of advanced technologies to boost the contribu-tion of sustainable bioenergy to EU 2020 climate and energy targets (EBTP, 2009). The EIBI was launched in 2010 and the two specific objectives are to achieve bioenergy production costs that compete with fossil energy and with advanced biofuels covering up to 4 % of EU transportation energy needs by 2020, and to strengthen EU technology leadership for renewable transport fuels serving the fastest growing area of trans-port fuels in the world.
The EIBI Implementation Plan for 2010–2012 described the core activities aimed at building and operating demonstration and/or flagship projects for innovative value chains with large market potential (EIBI, 2010). The implementa-tion approach was to organise selection pro-cedures for demonstration and flagship plants that started in 2011/2012. As a future step, the ERA-NET+ BESTF call was launched in 2013 to support bioenergy demonstration projects that fit into one or more of seven EIBI value chains. This activity is expected to provide funding and support to collaborative bioenergy projects that demonstrate one or more innovative steps result-ing in demonstration at a pre-commercial stage.
JRC13_TMAP_08AP14_P5-NS-Print.indd 88 09/04/2014 16:21:37

89
2013 Technology Map of the European Strategic Energy Technology Plan
The European Advanced Biofuels Flight Path Initiative was set up in 2011 to speed up the commercialisation of aviation biofuels in Europe. This initiative was launched by the European Commission, Airbus, and high-level representatives of the aviation and biofuel producers industries. This action aims to achieve 2 Mt of sustainable biofuels to be used in the EU civil aviation sector by the year 2020. The actions foreseen in the Flight Path include the following goals:
• on short term (0–3 years): make available more than 1 000 tonnes of Fisher-Tropsch biofuel; production of aviation-class biofuels in the hydro-treated vegetable oil (HVO); start con-struction of the first series of second-generation plants to become operational by 2015–2016;
• on mid term (4–7 years): make available more than 2 000 tonnes of algal oils; supply of 1.0 Mt of hydro-treated oils and 0.2 tonnes of syn-thetic aviation biofuels; start construction of the second series of second-generation plants including algal biofuels and pyrolytic oils from residues to become operational by 2020;
• on long term (up to 2020): supply of an addi-tional 0.8 Mt of aviation biofuels based on syn-thetic biofuels, pyrolytic oils and algal biofuels; further supply of biofuels for aviation, biofuels to be used in most EU airports; 2.0 Mt of biofuels are to be blended with kerosene.
12.6 References
Al-Riffai et al., Global Trade and Environmental Impact Study of the EU Biofuels Mandate, 2010 (http://trade.ec.europa.eu/doclib/docs/2010/march/tradoc_145954.pdf) accessed 7 January 2014.
Bauen, A., Berndes, G., Junginger, M., Londo, M., Vuille, F., Ball, R., Bole, T., Chudziak, C., Faaij, A., Mozaffarian, H., Bioenergy - A Sustainable and Reliable Energy Source: A Review of Status and Prospects, IEA Bioenergy, 2009.
Biofuels Research Advisory Council (BIOFRAC), Biofuels in the European Union. A vision for 2030 and beyond, 2006.
Cherubini, F., Jungmeier, G., Mandl, M., Wellisch, M., Philips, C., Joergensen, H., Biorefineries: Adding Value to the Sustainable Utilisation of Biomass, IEA Bioenergy Publication T42:2009:01, IEA Bioenergy Task 42 on Biorefineries, 2009.
Darzins, A., Pienkos, P., Edye, L., Current Status and Potential for Algal Biofuels Production, A report to IEA Bioenergy Task 39, 2010.
Ecofys, Financing renewable energy in the European energy market, Final report by Ecofys, Fraunhofer ISI, TU Vienna EEG, Ernst &Young, 2011.
Emerging Markets, Biodiesel 2020: Global Market Survey, Feedstock Trends and Market Forecasts, 2008 (http://www.emerging-markets.com/PDF/Biodiesel2020Study.pdf) accessed 7 January 2014.
EurObserv’ER (http://www.observ-er.org/) accessed 7 January 2014.
European Commission (EC), Communication from the Commission to the Council and the European Parliament. Renewable Energy Road Map. Renewable energies in the 21st century: building a more sustainable future, COM(2006) 848 final, 2006.
European Commission (EC), Directive 2009/28/EC of the European Parliament and of the Council of 23 April 2009 on the promotion of the use of energy from renewable sources and amending and subsequently repealing Directives 2001/77/EC and 2003/ 30/EC, 2009a.
European Commission (EC), Directive 2009/30/EC of the European Parliament and of the Council of 23 April 2009, amending Directive 98/70/EC as regards the specification of petrol, diesel and gas oil and introducing a mechanism to monitor and reduce GHG emissions and amending Council Directive 1999/32/EC as regards the specification of fuel used by inland water way vessels and repealing Directive 93/12/EEC, 2009b.
European Commission (EC), European Advanced Biofuels Flight path Initiative, 2011 (http://ec.europa.eu/energy/renewables/biofuels/flight_path_en.htm) accessed 7 January 2014.
European Commission (EC), Impact Assessment - Accompanying the document Proposal for a Directive of the European Parliament and of the Council amending Directive 98/70/EC relat-ing to the quality of petrol and diesel fuels and amending Directive 2009/28/EC on the promotion of the use of energy from renewable sources, 2012 (http://ec.europa.eu/energy/renewables/bio-fuels/doc/biofuels/swd_2012_0343_ia_en.pdf) accessed 7 January 2014.
European Industrial Bioenergy Initiative (EIBI), Boosting the contribution of Bioenergy to the EU climate and energy ambitions. Implementation Plan 2010–2012, 2010 (http://setis.ec.europa.eu/set-plan-implementation/european-industrial-ini-tiatives-eiis/eii-implementation-plans) accessed 7 January 2014.
JRC13_TMAP_08AP14_P5-NS-Print.indd 89 09/04/2014 16:21:37

90
2013 Technology Map of the European Strategic Energy Technology Plan
European Parliament and Council, Proposal for a Directive of the European Parliament and of the Council Amending Directive 98/70/EC relating to the quality of petrol and diesel fuels and amend-ing Directive 2009/28/EC on the promotion of the use of energy from renewable sources, 2012.
Eurostat, 2013 (http://epp.eurostat.ec.europa.eu/portal/page/portal/energy/introduction) accessed 7 January 2014.
Gallagher, E., The Gallagher Review of the Indirect Effects of Biofuels Production, Renewable Fuels Agency, London, United Kingdom, 2008 (http://webarchive.nationalarchives.gov.uk/20110407094507/renewablefuelsagency.gov.uk/reportsandpublications/reviewoftheindi-recteffectsofbiofuels) accessed 8 January 2014.
International Energy Agency (IEA) Bioenergy, From 1st to 2nd generation biofuel technologies. An over-view of current industry and RD&D activities, 2008.
International Energy Agency (IEA), Sustainable Production of Second-Generation Biofuels. Potential and perspectives in major economies and developing countries, OECD/IEA, Paris, 2010 (http://www.iea.org/papers/2010/second_genera-tion_biofuels.pdf) accessed 7 January 2014.
International Energy Agency (IEA), Technology Roadmap: Biofuels for Transport, OECD/IEA, Paris, 2011.
International Energy Agency/International Energy Agency-Advanced Motor Fuels (IEA/IEA-AMF), Algae as a Feedstock for Biofuels. An Assessment of the Current Status and Potential for Algal Biofuels Production, 2011 (http://www.ieabio-energy.com/publications/algae-as-a-feedstock-for-biofuels/) accessed 7 January 2014.
Joint Research Centre (JRC) (Blanco Fonseca, M., Burrell, A., Gay, H., Henseler, M., Kavallari, A., M’Barek, R., Pérez Domínguez, I. and Tonini, A.), Impacts of the EU biofuel target on agri-cultural markets and land use: a comparative modelling assessment, JRC‐IPTS Technical report, EUR24449 EN, 2010a (http://ftp.jrc.es/EURdoc/JRC58484.pdf) accessed 7 January 2014.
Joint Research Centre (JRC) (Hiederer, R., Ramos, F., Capitani, C., Koeble, R., Blujdea,V., Gomez, O., Mulligan, D. and Marelli, L.), Biofuels: a new method-ology to estimate GHG emissions from global land use change, Luxembourg: Joint Research Centre, European Commission, (doi:10.2788/48910), EUR 24483, 2010b (http://eusoils.jrc.ec.europa.eu/esdb_archive/eusoils_docs/other/EUR24483.pdf) accessed 7 January 2014.
Laborde, D., Assessing the Land Use Change Consequences of European Biofuel Policies, final report, IFPRI, 2011.
Ni, M., Leung, D.Y.C., Leung, M.K.H., Sumathy, K., ‘An overview of hydrogen production from biomass’, Fuel Processing Technology, Vol. 87, 2006, pp. 461-472.
Organization for Economic Co-operation and Development-Food and Agriculture Organization dataset (OECD-FAO dataset), Agricultural Outlook 2013-2022, data extracted on 25 June 2013 07:43 UTC (GMT) from OECD.Stat., 2013.
Pousa, P.A.G., Santos, A.L.F., Suarez, P.A.Z, ‘History and policy of biodiesel in Brazil’, Energy Policy, Vol. 35, 2007, pp. 5393-5398.
Renewable Energy Policy Network for the 21st Century (REN21), Renewables 2010 Global Status Report, 2010.
Renewable Fuel Agency (RFA), Renewable Transport Fuel Obligation, 2010 (https://www.gov.uk/renewable-transport-fuels-obligation) accessed 7 January 2014.
Scarlat, N., Dallemand, J.F., ‘Recent develop-ments of biofuels/bioenergy certification: a global overview’, Energy Policy, Vol. 39, 2011, pp. 1630-1646.
Searchinger, T., Heimlich, R., Houghton, R.A., Dong, F., Elobeid, A., Fabiosa, J., Tokgoz, S., Hayes, D., Yu, T., ‘Use of U.S. croplands for biofuels increases greenhouse gases through emissions from land-use change’, Science, Vol. 319, No 5867, 2008, pp. 1238-1240.
U.S. Energy Information Administration (EIA), 2013 (http://www.eia.gov/) accessed 7 January 2014.
U.S. Department of Agriculture (USDA), Brazil – Biofuels Annual, Annual Report 2012, 2012a.
U.S. Department of Agriculture (USDA), India – Biofuels Annual, Annual Report 2012, 2012b.
Van Ree, R., Annevelink, E., Status Report Biorefinery, 2007.
JRC13_TMAP_08AP14_P5-NS-Print.indd 90 09/04/2014 16:21:38

91
13. Hydrogen and fuel cells
13.1 Introduction
Fuel cells and hydrogen (FCH) are enabling tech-nologies that offer a wide range of benefits for the environment, energy security and competi-tiveness, including:
• reduced GHG emissions and fossil fuel consumption;
• expanded use of renewable power;
• highly efficient energy conversion;
• fuel flexibility;
• reduced air pollution;
• highly reliable grid support.
Fuel cells have numerous advantages that make them appealing for end users, including quiet and highly efficient operation, low maintenance needs and high reliability. They feature reliable start-up and can be scaled into small and large power packages. In addition to using H2, fuel cells can provide power from a variety of other fuels, including natural gas and renewable fuels such as biogas.
FCH can provide these benefits in all energy sectors — power, transport, heat and industry — through their use in a variety of applications, including:
• distributed energy and CHP systems;
• backup power;
• systems for storing and transmitting renew-able energy;
• portable power;
• auxiliary power for trucks, aircraft, rail and ships, as well as specialty vehicles such as forklifts, and passenger and freight vehicles, including cars, vans and buses.
The by-product heat from fuel cells offers addi-tional benefits for space-, water-, or process-heating needs. Fuel cells are manufactured with repetitive processes for which automation has a large potential for cost reduction.
FCH are expected to play an important role in achieving the EU vision of reducing GHG emis-sions by 80–95 % compared to 1990 levels by 2050 (EC, 2011).
Whereas previous editions of the Technology Map have described the technologies in general, this 2013 edition focuses on new developments, particularly on the role that H2 is expected to play in increasing the share of renewables in the overall energy system and in linking the differ-ent energy sectors, thus contributing to reduced GHG emissions and enhancing security of supply.
13.2 Technological state of the art and anticipated developments
A recent JRC scientific and technical report (JRC, 2012) provides an excellent overview of the state of the art and challenges for FCH technologies. The report includes targets on materials per-formance for medium-term (2020–2030) and long-term (2050) timescales.
Fuel cells
Cost and durability are the major challenges to commercialisation of fuel cells. Understanding of the effects of air, fuel, and system-derived impu-rities (including from the fuel storage system) needs to be improved, and mitigation strate-gies demonstrated. Accelerated testing protocols need to be developed to enable projection of durability and to allow for technology improve-ments. Durability, efficiency, packaging and cost of balance-of-plant components are also barriers to commercialisation.
In stationary power applications, raising the oper-ating temperature to increase performance will improve heat and power cogeneration and system efficiency. Progress in low-cost fuel processing and gas cleanup is required to enable fuel flex-ibility and use of renewable fuels such as biogas.
2013 Technology Map of the European Strategic Energy Technology Plan
JRC13_TMAP_08AP14_P5-NS-Print.indd 91 09/04/2014 16:21:38

92
2013 Technology Map of the European Strategic Energy Technology Plan
Improving the durability at lower cost of high-temperature fuel cell systems is also required. For transportation applications, fuel cell technologies face more stringent performance, durability and cost requirements. Fuel cell systems for portable power applications must have increased durabil-ity and reduced costs to compete with batteries. Likewise, fuel cells for auxiliary power must have longer durability and reduced costs to penetrate the market. To reach competitive pricing in the marketplace, improvements in efficient manu-facturing and high-volume production capaci-ties, as well as larger, more efficient supply and distribution networks are required.
Current and targeted performance charac-teristics of fuel cells are summarised in the Multi-Annual Implementation Plan (MAIP) of the European Fuel Cell and Hydrogen Joint Undertaking (FCH-JU) and in the data records website of the U.S. DOE (2013a).
According to the U.S. DOE (2013a), the projected costs for proton exchange membrane fuel cell (PEMFC) systems for light-duty vehicles have dropped considerably in the last 5 years, reaching EUR 36/kW (USD 47/kW) for production volumes of half a million. In another recent analysis (Carbon Trust, 2012), current state-of-the-art systems are predicted to cost EUR 38/kW (USD 49/kW) when manufactured at similar volume. To be competitive with internal combustion engine vehicles on a total cost of ownership basis, present-day costs for automotive fuel cell systems should reach EUR 28/kW (USD 36/kW). The MAIP targets a system cost of EUR 50/kW by 2020, and the U.S. DOE EUR 23/kW (USD 30/kW) in 2015.
Projected cost evolution of stationary fuel cell systems is provided in a European Commission working document (EC, 2013a). European cost targets for fuel cells in a number of applica-tions for 2016 and 2020 are listed in a European Commission scientific and technical background document (EC, 2013d).
Hydrogen production
H2 can be produced from a range of resources (nuclear, natural gas, coal, biomass and other renewables, including solar, wind, hydroelectric or geothermal energy) via various technologies (reforming, renewable liquid and bio-oil pro-cessing, biomass and coal gasification, electro-lytic (water splitting using a variety of energy resources) and photolytic (splitting water using sunlight biologically, electrochemically or thermo-chemically)). It can be produced in large, central facilities at some distance from the point of use, or distributed (near or at its point of use).
High-temperature fuel cells offer a very attrac-tive avenue for producing renewable H2 through a combined production of H2, heat and power that exploits the internal reforming capability of high-temperature fuel cells fed by biogas. The H2, heat and power combined production approach is promising for establishing an initial infrastructure for fuelling vehicles with minimal investment risk in areas where biogas from landfills and from wastewater treatment plants is available.
The cost of H2 to the customer is determined by the feedstock cost and conversion technol-ogy, the plant size, the required purity level, and the method and distance for H2 delivery. Capital investment cost status and targets for the EU are listed by the European Commission (EC, 2013d). Figure 13.1 shows 2030 projected cost ranges as a function of feedstock cost from a recent study (McKinsey, 2012a). Production methods based on
Figure 13.1:Projected 2030 cost
ranges for a number of hydrogen production
technologies as a function of feedstock costs
Notes: SMR = steam methane reforming;
WE = water electrolysis; IGCC = integrated
gasification combined cycle.
Source: McKinsey, 2012a.
1
1
2
3
4
5
6
72
4
7 5
3
2
20015050 10000
4
2
6
9
1
5
8
3
7
10
Costs of hydrogen production1
EUR/kg H2
BG: EUR 6.6/kg H2
Biomass: EUR 27/MWh
DWE: EUR 9.1/kg H2
Electricity: EUR 162/MWh
CWE: EUR 8.6/kg H2
Electricity: EUR 162/MWh
DSMR: EUR 3.6/kg H2
Gas: EUR 41/MWh
CSMR: EUR 2.1/kg H2
Gas: EUR 41/MWh
CG: EUR 2.5/kg H2
Coal: EUR 16/MWh
IGCC: EUR 2.1/kg H2
Coal: EUR 16/MWh
Costs of feedstockEUR/MWh
Biomassgasification (BG)
Coalgasification (CG)
Distributed SMR (DSMR)
Distributed WE (DWE)
Central WE (CWE)
Central SMR (CSMR)
IGCC
JRC13_TMAP_08AP14_P5-NS-Print.indd 92 09/04/2014 16:21:39

93
2013 Technology Map of the European Strategic Energy Technology Plan
biomass and coal gasification are most sensitive to the feedstock costs. The U.S. DOE targets a high-volume production cost of EUR 0.8–1.5/kg (USD 1–2/kg) in 2020, both for distributed and central pathways, and independent of the feedstock cost (U.S. DOE, 2013b).
Hydrogen delivery
Transmission and distribution costs are affected by volume and distance. For refuelling stations supplied with H2 from a central production source, different delivery options (trucking compressed gas, trucking liquid hydrogen and pipelines) require different equipments at the station.
The MAIP targets an overall refuelling cost of H2 (production, delivery, compression, storage and dispensing (CSD), but exclusive of taxes) of EUR 5/kg in 2020 from a current status of more than EUR 10/kg. The U.S. DOE has set its cost tar-get at EUR 1.5–3 per gallon gasoline equivalent (gge)16 (USD 2–4/gge) to become competitive with gasoline in hybrid electric vehicles in 2020 (untaxed) (U.S. DOE, 2011b). Cost targets in the EU are less stringent than in the US because of the lower US petrol tax, which imposes lower cost targets for new technologies to become competitive. Present-day US cost projections (U.S. DOE, 2013a) for forecourt H2 production and CSD using natural gas amount to EUR 3.5/kg (USD 4.5/kg) (untaxed), out of which EUR 1.6/kg (USD 2.0/kg) is for production. With the advent of cheap shale gas, the projected costs for 2020 decrease to EUR 2.9/kg (USD 3.7/kg) and EUR 0.9/kg (USD 1.2/kg), respectively.
Transport of H2 by pipeline exploits the high ener-gy transmission capacity of H2 (4 to 5 times that of electricity using HVDC (respectively 27 and 6 GWh/h) and of the same order of natural gas (38 GWh/h)). This high transmission capacity is of particular advantage for H2 production from RES considering that many of these sources are far from the major load centres. Moreover, H2 pipe-lines involve less expense and fewer siting issues than electricity transmission lines. Instead of using dedicated pipelines, H2 can also be injected in the natural gas grid. In this way the large stor-age capacity of the natural gas grid can also be used (see below sub-section on power-to-gas).
Hydrogen storage
For on-board storage, the present storage tech-nologies (liquid, high-pressure gas, solid-state) do not allow reaching the system targets in terms of performance that have been set by the U.S. DOE. The majority of the fuel cells electric vehicles
16 The energy contained in 1 gallon gasoline equivalent
is practically the same as in 1 kg of hydrogen.
(FCEVs) today use high-pressure gas tanks for on-board storage. Pre-cooling H2 to limit the maxi-mum temperature during type IV tank17 filling may be required to obtain acceptable fill times. Storage of supercritical cryo-compressed H2 is currently under investigation, with a potential of achieving a 30 % density increase above pure liquid and more than 2.5 times that of com-pressed H2.
Learned out H2 storage cost (500 000 units/year) for 70 MPa Type IV storage tank systems is esti-mated at EUR 11/kWh (USD 15/kWh), approaching the U.S. DOE 2017 target of EUR 9/kWh (USD 12/kWh) (EUR 300/kg), but still quite above the ulti-mate target of EUR 6/kWh (USD 8/kWh). The cost of the carbon fibre amounts to about 75 % of the tank cost. The ultimate system cost for a cryo-compressed tank is estimated at EUR 9/kWh (USD 12/kWh) (U.S. DOE, 2011a).
For off-board storage, mature gaseous or liquid storage systems have been developed in the chemical and refining industries. The MAIP capital cost targets for 2020 for distributed above-ground storage of gaseous hydrogen are EUR 400/kg and for storage in solid-state materials EUR 850/kg, down from the 2010 status of EUR 500/kg and EUR 5 000/kg, respectively. For liquid storage, cur-rent efforts aim at building liquefaction plants of 30–50 t/day (20 times larger than existing ones), achieving an energy consumption of 6 kWh/kg compared to today’s 12 kWh/kg.
Power-to-gas
Maintaining grid stability with increasing amounts of intermittent RES in the generation mix requires capabilities for energy storage throughout the power chain, next to dispatchable power and demand-side management. Because of its high energy content, H2 is one of the few options for high-capacity, longer-term energy storage, usu-ally in suitable underground caverns. Capital costs for large-scale compressed storage (> 8 MPa) are targeted at EUR 6 000/t (MAIP).
Producing H2 by electrolysis and injecting it in the natural gas grid allows exploiting the high transmission efficiency of the natural gas net-work. Subsequent use of the H2 for power, as a fuel or feedstock, or for heat is known as ‘power-to-gas’. This concept is not limited to renewable electricity and can be extended to include grid electrolysis. H2 can either be injected directly up to certain amounts or after transformation into SNG. In the latter case, no modifications to exist-ing natural gas transmission and distribution grids or to appliances are needed.
17 Type IV tanks are fibre-reinforced vessels with an
internal polymer liner acting as a permeation barrier.
JRC13_TMAP_08AP14_P5-NS-Print.indd 93 09/04/2014 16:21:39

94
2013 Technology Map of the European Strategic Energy Technology Plan
The combination of electrolysis and H2 storage in and transport through the natural gas grid effectively decouples energy supply from demand and hence contributes to enhancing electric grid stability. It also allows increasing the share of RES in the natural gas grid, and from there in the end-use applications of transport, heat and industry, where achieving higher RES shares is technologically more difficult and more expensive than for power generation. The power-to-gas con-cept offers a possibility for integrating electricity, heating, transportation and industrial processes, thus adding flexibility in the energy system as a whole, reducing vulnerability and increasing overall efficiency.
13.3 Market and industry status and potential
FCH technologies have a very high development potential because of the substantial contribution they can deliver towards EU energy and climate change policy goals and for enabling the transi-tion towards low-carbon energy and transport systems across a wide power range.
Hydrogen
Over the last years, hydrogen’s capacity to enhance fuel security in transport, to balance the electricity grid and to enable enhanced pen-etration of RES in transport and heat applications has resulted in a positive market outlook for FCH technologies. Additionally, demand in the refin-ing and chemical industries will likely increase because of lower crude oil quality, the need for cleaner petroleum-based fuels and the increasing demand for fertilisers.
A recent projection of the future hydrogen market in Europe is shown in Figure 13.2 (Shell, 2011).
Market revenues from H2 for European mobility could amount to several billions of euros by 2030. Next to its use in FCEV, H2 has been earmarked as a suitable alternative propulsion fuel for other trans-port modes, with the exception of long-distance heavy-duty road, aviation and sea shipping (EC, 2013b). The global demand for hydrogen fuel (FCEVs, buses, forklifts, uninterrupted power supply, scooters) is expected to reach over 0.4 Mt/year by 2020, reflecting a 2010–2020 growth rate of 88 % (Pike Research, 2011).
The second major growth area is in industrial combustion where H2 (potentially blended with natural gas) reduces emissions at a similar cost and with less complication than post-combustion retrofit CCS. Longer term, there are H2 opportuni-ties in distributed CHP.
By 2050, H2 should be produced through carbon-free or carbon-lean processes. H2 production by electrolysis is expected to considerably grow because of its ability to contribute to grid stabil-ity through both supply management (by providing dispatchable power when coupled with large-scale fuel cells or H2 turbines) and demand management (through fast response time and good partial load performance). The latter is particularly attractive for small-scale electrolysers sited at refuelling stations and has the added advantage of not requiring a distribution infrastructure.
Figure 13.2: Projection of the future hydrogen
market in Europe
Note: kboepd = kilo barrels of oil equivalent per day.
Source: Shell, 2011.
H2 consumptionton/day4, Europe
50 000
40 000
30 000
20 000
10 000
0
2011 2020 2030 2040 2050
Residential3
25% FCEVin LDVsegment
Industry
Mobility
Europe
300kboepd
200kboepd
100kboepd
JRC13_TMAP_08AP14_P5-NS-Print.indd 94 09/04/2014 16:21:39

95
2013 Technology Map of the European Strategic Energy Technology Plan
Fuel cells
At present, FCEVs have demonstrated the per-formance needed for commercial sales. Several OEMs have announced commercial introduction of FCEVs as of 2015, mainly in Europe, Japan, Korea and the US (California, Hawaii), where gov-ernments are coordinating efforts for building up H2 infrastructures. At the global level, a demand-driven market is expected as of 2025 (Pike Research, 2012). In 2013, the Global Technical Regulation on Hydrogen and Fuel Cell Vehicles has been published (UNECE, 2013) listing require-ments for attaining or exceeding equivalent levels of safety of those for conventional gasoline-fuelled vehicles. The European Commission also published Regulation (EU) No. 630/2012, which includes emission requirements for vehicles using pure H2 or a mixture of H2 and natural gas as well as a H2 reference fuel specification for FCEVs.
In the EU, anticipating an estimated 10–15 % of all cars manufactured in the EU to be fuel cell-based by 2040–2050 (EC, 2013e), the European Commission has put forward a legislative propos-al for alternative fuel infrastructures, including H2, setting targets for H2 infrastructure build-up by end-2020 and for common EU-wide technical specifications by end-2015 (EC, 2013c). In the US, the public-private partnership H2USA was launched in 2013 to enable the roll-out of the H2 infrastructure for widespread adoption of FCEVs.
Next to light-duty vehicle applications, PEMFC can be used in medium- and heavy-duty vehicles such as buses, vans and light-rail trains that operate primarily in increasingly congested urban areas where zero tailpipe emissions and low noise are most important. These applications represent a promising early-to-mid-term market because the central fuelling of fleets facilitates introduction of H2, and less stringent requirements on cost, weight and volume make implementation of fuel cell propulsion systems less challenging than for FCEVs. The MAIP aims at the deployment of 1 000 buses by 2020. Another application gaining interest, particularly in the developing world, is fuel cell scooters. Because their H2 consumption is very low, scooters can use hydrogen canisters rather than fuelling dispensers.
Because emissions from idling and auxiliary power are the subject of increasing regulations worldwide, fuel cells are expected to play an increasing role as auxiliary power units. The MAIP targets some hundreds of aircraft auxiliary power units by 2020 and a similar number in maritime applications. The use of H2 in these applications offers a large synergy potential with H2-fuelled logistical and public transportation applications in ports and airports, where local air pollution is of major concern.
Fuel cells have already become a cost-competi-tive option for the specialty vehicle market, which includes lift trucks and airport tugs, among others. These vehicles often operate in indoor facilities where ICEs cannot be used and where fuel cells offer advantages over batteries in terms of refu-elling time, constant power over time, and not requiring space for charging and storing batteries. In the US, more than 4 200 fuel cell forklifts are in use since 2009, out of which over 3 500 on a pure commercial basis (U.S. DOE, 2013a).
For industrial-scale base-power generation, the high efficiency under base-load operation and the fact that generation of power does not require any water — and even produces it — are becoming more and more important. The MAIP targets 100 MW installed capacity using natural gas and 50 MW H2-based in 2020. Additionally, with increasing needs for energy storage to balance the intermittency of RES, a substantial growth in PEMFC-based peak power generation is expected because of the superior performance of fuel cells in terms of response time and partial load efficiency.
At present, thousands of small low- and high-temperature fuel cell systems, fuelled by H2 or natural gas, are being demonstrated in private homes in Denmark, Germany, Japan and South Korea. In Japan, 50 000 units are now in operation. Following the ending of incentives, autonomous market uptake is planned as of 2015, with 5 mil-lion units expected as of 2020.
A 2012 survey among EU stakeholders (McKinsey, 2012b) indicates expectations that FCH technol-ogy will play an important role in the future EU low-carbon energy and transport sectors, for EU energy security and for EU industrial competitive-ness. There is a particularly strong support for H2 as a storage medium for renewable energy. The survey indicates that between 2007 and 2012, annual turnover has on average increased by 10 % (on a 2012 total of EUR 0.5 billion), R&D expendi-tures by 8 % (on a 2012 total of EUR 1.8 billion) and market deployment expenditures by 6 % (on a 2012 total of EUR 0.6 billion). The number of jobs is estimated to have increased by about 6 % since 2007, to around 4 000 FTE today.
Both turnover and RD&D expenditures over the 2013–2020 period are expected to continue to grow, by a factor of 8.2 and 2.2, respectively, with strongest growth in the area of H2 produc-tion and storage. The fact that turnover has and continues to outpace R&D expenditures is a posi-tive indication of impending commercialisation. For the European fuel cell market only, a recent report expects growth from an estimated EUR 116 million (USD 150.4 million) in 2013 to EUR 448 million (USD 613.7 million) by 2018, represent-ing a growth rate of 32.5 % from 2013 to 2018 (MarketsandMarkets, 2013).
JRC13_TMAP_08AP14_P5-NS-Print.indd 95 09/04/2014 16:21:40

96
2013 Technology Map of the European Strategic Energy Technology Plan
In 2012, the global turnover for FCH has reached more than EUR 0.78 billion (USD 1 billion) (Pike Research, 2013), up from EUR 232 mil-lion (USD 300 million) in 2005 (EC, 2007), with the highest growth in the stationary sector. The market is expected to be worth EUR 12.1 bil-lion (USD 15.7 billion) in 2017 (Pike Research, 2012b). A recent US study estimates that the global market could be between EUR 33 and 107 billion annually over the next 10–20 years (EUR 11–24 billion/year for stationary power, EUR 8.5 billion/year for portable power, and EUR 14–74 billion/year for transportation) (U.S. DOE, 2011c). In the market segment with the highest visibility, namely passenger vehicles, a recent study (Carbon Trust, 2012) shows the figures presented in Table 13.1.
13.4 Barriers to large-scale deployment
Apart from cost and reliability/durability, barriers and/or challenges faced by FCH industries lie at a number of levels.
• The potentially huge environmental and energy security benefits of FCH applications accrue to society at large and are difficult to be monetised by individual technology providers and consum-ers. FCH technologies have to face the estab-lished market position and public acceptance of competing incumbent technologies and systems for which external costs are not included in their overall costing.
• FCH technologies must compete with well established incumbent technologies and relat-ed infrastructures. Consequently, the financial risk for early movers is high and lack of cash flow during the first phase of deployment is to be expected.
• The FCH sector is dispersed across different activity areas (energy, transport, industry, resi-dential), actors and countries, which hampers the build-up of critical mass needed for self-sustained commercial activity.
• FCH technologies are insufficiently covered in education curricula, which may also result in incorrect safety perception and low awareness of societal benefits.
• Current regulations, codes and standards do not adequately reflect real-world use of FCH technologies and are not harmonised between countries.
In view of the long-term horizon and the very high pay-off in terms of contribution to EU policy goals, public support is and will remain necessary to help in reducing industry development times and offsetting first-mover disadvantages. Hence, a purpose-oriented coherent framework consisting of tailored and time-phased actions, policies and incentives that target public and private market actors is needed. The following components of such a framework can be identified as:
• globally harmonised standards and regulations to ensure safe, compatible and interchange-able technologies and systems — this will also contribute to cost reduction;
• increased awareness among private and pub-lic actors in the energy, transport, industrial and residential sectors, policymakers at local, regional, national and EU levels, and the public of the performance potential and societal ben-efits that H2 as a flexible energy carrier and fuel cells as modular and highly efficient energy converters offer over incumbent technologies;
• policy measures that value the societal bene-fits and ensure a level playing field enabling the uptake of FCH technologies, including public financial support, in particular for infrastruc-ture development in the energy and transport sectors;
• improved alignment of views and coordination of activities of private FCH stakeholders and public institutions, aiming at equitable risk sharing, particularly in the stages of initial commercial roll-out;
• new business models that allow the deploy-ment of large-scale H2 storage in future smart grid-based energy systems.
Table 13.1: Numbers in brackets show
shares of total light-duty vehicle fleet
Note: Average exchange rate of USD/EUR=1.3 was
used for conversion of projected cost data.
Source: Carbon Trust, 2012.
2020 2030 2050
Number FCEV EU (million) 0.44–0.9 (0.1–0.3 %)
9.0–16.0 (3.4–6.0 %)
66.1–92.4 (24.7–34.5 %)
Number FCEV global (million) 1.9–3.8 (0.1–0.3 %)
43–77 (3.3–6.0 %)
491–691 (24.4–34.4 %)
PEMFC market value EU (billion EUR) 0.88–1.16 11–15.1 23.7–26.7
PEMFC market value global(billion EUR) 3.2–4.7 53–73 180–202
JRC13_TMAP_08AP14_P5-NS-Print.indd 96 09/04/2014 16:21:40

97
2013 Technology Map of the European Strategic Energy Technology Plan
13.5 RD&D priorities and current initiatives
Successful mass volume deployment of FCH technologies critically depends on their appropri-ate, timely and successful integration in energy, transport, heat and industrial chains, and on their contribution to facilitating the intercon-nection of these chains (e.g. power-to-gas). For that purpose, sustained R&D, private and public, is still needed for effectively addressing remaining high-risk technological barriers in a pre-competitive environment.
The European Commission has therefore pro-posed to continue the FCH JTI for the period 2014–2020 (EC, 2013e). Two innovation pil-lars, energy and transport, and a number of cross-cutting activities have been identified and operational objectives associated with them. Cross-cutting activities cover pre-normative research for fit-for-purpose regulations, codes and standards to ensure safety, compatibility and interchangeability of technologies and sys-tems and fair competition in a global market, as well as socioeconomic modelling to optimise the entry of FCH technologies in the energy system at the right place and time and, hence, to guide infrastructure transition planning. For the latter, there is a need to develop methodologies and tools for quantifying the benefits that H2 as a commodity, in isolation or combined with natural gas, can offer in terms of delayed power grid reinforcement or extension, of increased grid stability, and of enabling increasing amounts of RES in power, transport, heat and industry.
Synergies will be sought with actions included in the SET-Plan European Industrial Initiatives (EIIs), in other relevant partnerships with (partial) EU fund-ing18 and with relevant programmes in EU Member States and regions. Long-term and breakthrough-oriented research will be streamlined with activities performed under the EERA of the SET-Plan.
18 For example, projects under the Energy and Transport
Challenges of H2020, the European Green Vehicle
Initiative.
13.6 References
Carbon Trust, Polymer Fuel Cells – cost reduc-tion and market potential, 2012 (http://www.carbontrust.com/media/195742/pfcc-cost-reduction-and-market-potential.pdf) accessed 7 January 2014.
European Commission (EC), 2007 FCH JTI Impact Assessment, 2007.
European Commission (EC), A roadmap for mov-ing to a competitive low carbon economy in 2050, Communication COM(2011)112, 2011.
European Commission (EC), Staff Working Document SWD(2013)158 accompanying the Communication on Energy Technologies and Innovation COM(2013)253, 2013a.
European Commission (EC), An European Alternative Fuels Strategy, Communication COM(2013)17, 2013b.
European Commission (EC), Proposal for a Directive on Alternative Fuels Infrastructure, COM(2013)18, 2013c.
European Commission (EC), Scientific and techni-cal background document for the Fuel Cells and Hydrogen Joint Undertaking under Article 187 in Horizon 2020 (in preparation), 2013d.
European Commission (EC), Impact assess-ment accompanying the Proposal for a Council Regulation on the Fuel Cells and Hydrogen 2 Joint Undertaking, SWD(2013)260, 2013e.
Joint Research Centre (JRC), Scientific Assessment in support of the Materials Roadmap enabling Low Carbon Energy Technologies - Hydrogen and Fuel Cells, EUR 25293 EN – 2012, 2012.
MarketsandMarkets, Fuel Cell Technology Market: By Applications (Portable, Stationary, Transport), Types (PEMFC, DMFC, PAFC, SOFC, MCFC), Fuel (Hydrogen, Natural Gas, Methanol, Anaerobic Digester Gas) & Geography- Global Trends and Forecast to 2018, 2013.
McKinsey, A portfolio of power-trains for Europe: a fact-based analysis, 2010 (http://www.fch-ju.eu) accessed 7 January 2014.
McKinsey, Urban buses: alternative powertrains for Europe, 2012a (http://www.fch-ju.eu) accessed 7 January 2014.
McKinsey, Survey results on the trends in terms of investments, jobs and turnover in the Fuel Cells and Hydrogen sector, 2012b (http://www.fch-ju.eu) accessed 7 January 2014.
JRC13_TMAP_08AP14_P5-NS-Print.indd 97 09/04/2014 16:21:40

98
2013 Technology Map of the European Strategic Energy Technology Plan
Multi-Annual Implementation Plan of the FCH-JU, 2011 (http://www.fch-ju.eu) accessed 7 January 2014.
Pike Research, Ten trends to watch in 2011 and beyond, 2011.
Pike Research, Fuel Cells Annual Report 2012, 2012.
Pike Research, Ten trends to watch in 2013 and beyond, 2013.
Shell, McKinsey study commissioned by Shell, 2011.
U.S. Department of Energy (DOE), Annual Merit Review 2011, 2011a.
U.S. Department of Energy (DOE), 2010 Fuel Cell Technologies Market Report, 2011b.
U.S. Department of Energy (DOE), US DoE Hydrogen and Fuel Cells Program Plan, 2011c.
U.S. Department of Energy (DOE), data records website, 2013a.
U.S. Department of Energy (DOE), Hydrogen and Fuel Cell Technologies FY 2014 Budget Request Rollout, 2013b.
United Nations Economic Commission for Europe (UNECE), 2013 (http://www.unece.org/fileadmin/DAM/trans/main/wp29/wp29wgs/wp29gen/wp29registry/ECE-TRANS-180a13e.pdf) accessed 7 January 2014.
JRC13_TMAP_08AP14_P5-NS-Print.indd 98 09/04/2014 16:21:40

99
14. Electricity storage in the power sector
14.1 Introduction
Electricity storage has gained renewed interest due to two major trends: breakthroughs in stor-age technology and the need for the integration of a growing share of intermittent RES-E. The technology can provide services along the entire power system value chain (EPRI, 2010; SANDIA, 2010), that is, to power generation, transmission, distribution, retail and end use. Depending on the part of the value chain to which services are delivered, storage technologies can be divided into two segments: centralised (generation and transmission) and decentralised storage (distri-bution, retail and end use).
Currently, the market is comprised mainly of the first segment, which is dominated by the mature PHSs, which were originally deployed in the course of the 20th century to meet peak demand with base-load generation. Decentralised technologies, in particular batteries, are gaining more attention with the growing share of PV installations, which are overwhelmingly located on the consumer side and in low-voltage distribu-tion systems. Storage technologies can be further differentiated by the time that energy is stored.
• Short-term storage (< 1 hour) mainly serves to stabilise the operation of power grids by provid-ing, for example, reserve capacity or voltage control. This typically requires the rapid injection or withdrawal of a significant amount of power during time intervals ranging from seconds to minutes. Batteries and flywheels are suited and have occasionally been used for this purpose.
• Daily storage allows the optimisation of the power generation portfolio by matching supply and demand at different times. Energy is stored for several hours before being discharged. This is the main mode of operation of existing PHS and compressed air energy storage (CAES).
• Seasonal storage of energy is already practiced in hydropower stations with natural inflows. While technically possible, PHSs are usually not designed for this purpose. In the longer term, H2 could be a candidate technology for seasonal energy storage.
Electricity storage has been identified as a key technology priority in the development of the European power system, in line with the 2020 and 2050 EU energy targets (EC, 2007, 2010, 2013).
14.2 Technological state of the art and anticipated developments
Storage of electrical energy is a three-step pro-cess consisting of:
• a transformation of electrical energy into some other energy form;
• the storage of energy itself over a period of time;
• the reconversion of the energy stored back into electrical energy.
A storage system thus roughly consists of a power conversion system (PCS) and a storage subsystem. As the costs for the PCS scale with the installed capacity, figures are usually given in EUR/kW, while costs for the storage subsystem are stated in EUR/kWh. The different technolo-gies used to convert and store electricity can be grouped according to the energy form that serves as the storage. The following options are possible.
• Mechanical energy storages convert electrical into gravitational, rotational or some other form of mechanical energy. PHS, CAES and flywheels fall into this category.
• Chemical energy storage: electrical energy enables a chemical reaction with the resulting compound storing the energy (e.g. the elec-trolysis of H2).
• Electrochemical energy storage makes use of reversible electrochemical reactions. Examples are batteries and super capacitors.
• Electrical storage differs from the other catego-ries as no transformation of electrical energy to another form is required. Capacitors and super-conducting magnetic storage are examples for this category. These technologies currently do not contribute to the grid-scale storage of electricity.
2013 Technology Map of the European Strategic Energy Technology Plan
JRC13_TMAP_08AP14_P5-NS-Print.indd 99 09/04/2014 16:21:40

100
2013 Technology Map of the European Strategic Energy Technology Plan
• Thermal energy storage, mainly electrical heating systems with attached thermal stor-age, usually lacks the capability to reconvert the energy into power but offers some of the functionality provided by other storage sys-tems technologies.
A very large number of technologies have been proposed in each of these categories, ranging from conceptual ideas to lab-scale pilots to early demo projects (Chen et al., 2009). This report focuses on the technologies most widely found in the first three categories of storage technologies.
Mechanical storage technologies
Pumped hydro storage
PHS is a mature technology, the oldest and the largest of all available energy storage technolo-gies. The basic principle of a PHS system is to store energy by means of two reservoirs located at different elevations. In times of low demand, electricity from the grid is used to pump water to the higher reservoir, while in times of peak demand the water is released to generate elec-tricity, hence operating a reversible cycle of grid electricity. Costs for pumped hydro stations are in the range of EUR 500–3 600/kW for the power production equipment and EUR 60–150/kWh for the reservoir.
In Europe, the installed capacity of pure hydro-pumped storage amounts to approximately 43 GW with an additional capacity of 5.5 GW under construction. The high storage capacity and long technical lifetime allowing a high number of cycles make the technology ideally suited for daily storage and reserve power.
Compressed air energy storage
CAES is a mechanical storage technology made of mature building blocks. The concept consists in compressing air by means of electric energy, stor-ing the compressed air in an underground cavern and expanding the air in a combustion chamber to drive a gas turbine. The technology is suited for time shifting but can also deliver reserve power to the grid19. The costs of this technology are given by the compressor and turbine and the excavation of the storage cavern. Estimates range between EUR 400 and 1 150/kW for the power conversion unit and EUR 10 and 120/kWh for the storage unit.
Currently, only two CAES plants operate world-wide. The first CAES is located in Huntorf, Germany and was commissioned in 1978 (Crotogino et al., 2001). The turbine has a capacity of 320 MWe and an efficiency of 42 %. The second CAES is
19 The Huntorf CAES is able to provide tertiary reserve.
located in McIntosh, Alabama, USA (Pollak, 1994) and started operation in 1991. By adding a recu-perator, an efficiency of 52 % could be achieved. The turbine capacity of the McIntosh CAES is 110 MWe. Plans for several new CAES projects currently exist in Europe and the US, but no con-struction activities have been initiated yet and some projects had to be abandoned following significant planning activities (SANDIA, 2012).
One option for improving the technology is the adiabatic CAES, where the expanding air recovers the heat generated during compression from a thermal storage so no natural gas is needed in the process. Demonstrating the adiabatic CAES on large-scale is the main goal of ongoing RD&D. For example, the Germany-based ADELE project aims at developing a 360 MWe generation plant with 3 h of storage (Freund et al., 2013). Based on the results of the ongoing engineering phase, an investment decision could be made in 2016.
Isothermal CAES, of which a 1.5 MW prototype has recently been deployed in the US (SUSTAINX, 2013), is a further technological option.
Flywheels
Flywheel systems store kinetic energy of a rotat-ing mass. Charging is reached by accelerating the flywheel, and it is discharged when it is slowed. The main elements of a flywheel are the rotat-ing mass, which is connected to a main shaft (rotor) powered by an external source of energy. Flywheels are designed to charge or discharge at their rated power level within seconds but usually not for more than 15 minutes. The technology is thus best suited for grid application, in particular frequency control. Flywheels are expensive in terms of energy costs of EUR 3 500–4 000/kW. Power-related costs of flywheels are between EUR 600 and 700/kW.
The use of flywheels as an energy storage device was first proposed for electric vehicles and sta-tionary power backup in the 1970s. The largest facility in operation with a capacity of 23 MWe was deployed in 1996 on the island of Okinawa, Japan. Another large-scale installation located in New York State, USA providing 20 MWe of fre-quency control to the grid went online in 2011 (Beacon Power, 2013). A second facility located in Pennsylvania, USA is currently in the commis-sioning phase. In the US, the technology currently benefits from a storage-favourable ruling that was passed by the US regulator (US FEDERAL ENERGY REGULATORY COMMISSION, 2011). A number of slightly smaller flywheel facilities are installed on non-interconnected island systems such as the Endesa-initiated construction of a flywheel in the Canary Islands with a maximum power of 0.5 MWe storing 18 MW of energy (Fastelli, 2012).
JRC13_TMAP_08AP14_P5-NS-Print.indd 100 09/04/2014 16:21:40

101
2013 Technology Map of the European Strategic Energy Technology Plan
Chemical storage technologies
Hydrogen storage and power-to-gas
H2 can be produced using electricity via reversible water electrolysis. It can be stored and trans-formed back into electricity by means of a fuel cell or a combustion engine/turbine. Even though H2 does not play a significant role in the current electricity system, it offers the broadest spectrum of potential applications of all storage technolo-gies: from stand-alone systems comprised of electrolysers and fuel cells to integrated power-to-gas concepts providing new degrees of flexibil-ity by connecting the electricity and gas sectors.
The high energy density and the possibility to store large quantities of H2 in underground caverns make the technology ideally suited for seasonal storage. Projects demonstrating electrolysers with several hundred kW of power combined with RES-E have been carried out, for example, in Norway (Ulleberg et al., 2011). An alternative approach is to store and transport H2 in natural gas grids either by blending or by creating synthetic CH4. The injection of H2 from electrolysis into the gas grid is currently test-ed to the scale of several MW in, for example, Falkenhagen, Germany (Folke, 2013).
Electrochemical storage technologies
Electrochemical batteries store electricity through a reversible chemical reaction. The essential com-ponents are the container, the electrodes (cath-ode and anode), and the electrolyte. By charging the battery, the electricity is transformed into chemical energy, while during discharging it is restored into electricity. Established battery tech-nologies have high round trip efficiencies ranging from ~ 75 % (sodium-sulphur (NaS)) to ~ 90 % (Li-ion). The extremely rapid response times make batteries ideally suited for applications in power grids such as frequency reserve, voltage control and in some case also the deferral of line exten-sions (ERPI, 2010; SANDIA, 2010).
Lead-acid batteries
Being in use for more than 100 years, lead-acid (Pb-acid) batteries provide a mature and scalable technology base for providing short-term storage, in particular frequency control. Grid-scale Pb-acid batteries have power costs of around EUR 400/kW and energy costs of less than EUR 300/kWh20. The largest Pb-acid bat-teries installed so far have been in the range
20 Energy costs for batteries are usually defined for the
used depth of discharge that is smaller than the total
capacity of the battery.
of 10–20 MWe 21. Current Japanese and US pro-
jects reach up to several 10 MWs of installed capacity for purposes of wind energy integration involving both short-term and daily storage (U.S. DOE, 2013).
Li-ion
Li-ion batteries represent the state of the art in small rechargeable batteries. They are widely used in consumer electronic devices and more recently in electric vehicles, but they are equally well suited to provide scalable and fast short-term storage. Power costs of Li-ion batteries are comparable with Pb-acid technology, but energy costs range between about two and four times those of Pb-acid systems. The total global installed stationary capacity is estimated at 100 MWe (EASE/EERA, 2013). Li-ion systems in the range of up to several 10 MWe have recently been installed in Japan (METI, 2013) and the US (U.S. DOE, 2013). Stationary Li-ion batteries are currently being installed by several European distribution system operators to provide frequen-cy control in regions with a high penetration of renewable energy. Several battery projects are currently installed in Europe, mainly to provide frequency control in power grids with a high pen-etration of renewable energy22.
NaS
NaS batteries are a commercial storage technol-ogy originally designed in Japan for providing grid-scale power storage. The sole manufacturer currently offers modules with a storage capacity of approximately 7 hours. The technology has relatively high power costs of above EUR 2 000/kW but more attractive energy costs of around EUR 300/kWh. Self-discharge can be significant during longer periods of no utilisation, due to the required operating temperature of ~ 300 °C. This makes this technology particularly well suited for daily storage. In Japan, the technology has been promoted as a means to stabilise output from RES-E23. The global installed capacity exceeds 300 MWe (SANDIA, 2013). In Europe, the Italian transmission system operator (TSO) TERNA has signed an agreement with NGK, the provider of the NaS storage technology, for up to 70 MW of capacity (NGK, 2013).
21 For example, the island power system of West Berlin
deployed a Pb-acid battery system in 1988 that
could provide up to 17 MW of reserve power (SANDIA,
2013).22 For example, a 1 MW, 3 h unit has been installed on
Canaria Island (Spain) (ENDESA, 2012).23 For example, the 34 MW Rokkasho-Futamata Wind
farm in Japan is equipped with 17 sets of 2 MW NaS
batteries with a total storage capacity of 238 MWh
(U.S. DOE, 2013).
JRC13_TMAP_08AP14_P5-NS-Print.indd 101 09/04/2014 16:21:40

102
2013 Technology Map of the European Strategic Energy Technology Plan
Other battery technologies
Further promising technologies are currently in the R&D or early demo stage, with their potential applications being similar to established technol-ogies. Redox-flow batteries separate the electro-lyte, which is stored in a tank, from the electrodes and thus could be scaled up to very large energy capacities. A large-scale demonstration project of 40 MWe is planned in Japan (METI, 2013). Further possible battery systems currently being investigated are based on Na-nickel-chloride, zinc bromide and iron-chromium (SANDIA, 2013).
14.3 Market and industry status and potential
Given the different possible applications rang-ing between power quality and seasonal energy storage and possibly transport, there is not just one market for storage. Also, storage competes with other technologies for each of these seg-ments. As long-term energy projections often do not model the power system in sufficient detail, it is not possible to determine the exact need for flexibility products that storage could meet (JRC, 2013a).
Furthermore, the way to future electricity stor-age is not clear-cut as many questions arise concerning markets and regulations. There is no universal answer to whether storage is a profitable investment or adds value to a system (JRC, 2013a). Two possible perspectives exist: the investor seeking to maximise profit, and the total costs of the energy system. From an investor’s point of view, the main income streams result from power market arbitrage or the provision of reserve power. Existing studies give a mixed picture and it does not seem clear that storage can generate sufficient revenues from these in order to justify investment (JRC, 2013a).
A large number of additional possible value pools have been identified (SANDIA, 2010; EPRI, 2010), such as the temporary deployment of storage next to congested grid infrastructure allowing a deferral of investments in transmission and distribution grids. Whether income from grid services and power generation could be simul-taneously captured in the unbundled European power system is not fully clear (STORE, 2013). Studies also reveal that storage can add value to a power system, regardless of the investor’s point of view, but a negative impact is also pos-sible if, for example, the deployment of storage requires additional investment in grid or genera-tion infrastructure (JRC, 2013a).
Mechanical storage technologies
Pumped hydro storage
Although the technology is developed since the 1920s, significant potential for additional instal-lations exists in Europe. According to the JRC (2013b), a theoretical potential of 123 TWh, and a realisable potential of around 80 TWh, exists in Europe, considering only topologies based on one already existing reservoir. Further potential exists in newly to be developed green fields, out-of-use mines and quarries, or sea-based pumped hydro.
Market needs, however, are likely to be smaller if competing sources of flexibility are taken into account: studies see an additional 50–100 % of installed capacity by 2050, that is, 20–40 GW of additional PHS or CAES for Europe (Bertsch et al., 2012).
Compressed air energy storage
The European industry still has a strong position with respect to the CAES technology and its building blocks, a result of the ongoing experience gained during construction and operation of one of the two only operating plants and from the presence of several leading manufacturers of large-scale turbo machinery (EASE/EERA, 2013). Also, there are strong competences in solution mining, which is used to create caverns for gas storages. European firms are, however, less active in the area of smaller-scale innovative processes such as isothermal storage, which is currently only marketed in the US.
Flywheels
The market for flywheels is defined by the need for frequency reserve24, which is about at 3 000 MW in the European power system (ENTSOE, 2012). How much of this market might be avail-able to flywheels or other fast-reacting storage technologies is unclear as frequency reserve is currently provided by power plants. A larger market share seems available in the US due to favourable regulation or in non-deregulated island systems as well as in the transport sec-tor and in industry. Despite US leadership in the market deployment of this technology, there are some important manufacturers in Europe (EASE/EERA, 2013).
24 ENTSOE uses the term ‘Frequency Containment
Reserve’, also called ‘Primary Reserve’ in continental
European power systems.
JRC13_TMAP_08AP14_P5-NS-Print.indd 102 09/04/2014 16:21:41

103
2013 Technology Map of the European Strategic Energy Technology Plan
Chemical storage technologies
Hydrogen and power-to-gas
The potential future market share for H2 and power-to-gas technologies will depend on the need for seasonal storage and heating demand as well as H2 demand from the industry and transport. The potential can thus be very large but might materialise only in the longer term as far as power storage is concerned. European companies are leading in electrolysers, compressors and also for chemical processes (EASE/EERA, 2013). Germany is currently bundling demo projects in a power 2 gas initiative (dena, 2013). For FCH technologies, the establishment of a joint under-taking in 2008 is contributing to the development and strengthening of the European industry.
Electrochemical storage technologies
Battery storage technologies
The market size for stationary battery storage strongly depends on regulation and the relative attractiveness of competing storage technolo-gies. The Japanese Ministry of Economy, Trade and Industry forecasts a global USD 200 billion market by 2020 (METI, 2013), which would cor-respond to 500–1 000 MW of annually installed capacity depending on the technology. Also, Japan aims at capturing 50 % of this market. Today, Japan-based company NGK Insulators is the sole manufacturer of the NaS technology. Europe’s own automotive and battery industry is expected to capture part of this market, given the environ-mentally friendly manufacturing base for mature battery technologies (EASE/EERA, 2012).
14.4 Barriers to large-scale deployment
Storage is but one of several instruments able to provide flexibility to a system with a high share of RES-E. It competes with flexible fossil generation, demand-side response technologies, grid exten-sions allowing power flows over larger regions, or a more flexible utilisation of some of the excess RES-E. Also, the profitability of the arbitrage busi-ness case is strongly dependent on the installed storage capacity as each arbitrage trade reduces the spreads between high and low power prices, thus making subsequent storage less profita-ble. Furthermore, the capacity of storage that would be economically viable in a system with high RES-E may strongly depend on the market mechanism of RES-E subsidies (Nicolosi, 2011). Finally, RES-E could also provide some of the ancillary services, an important revenue stream for storage (REserviceS, 2013a, 2013b).
The deregulation of the power industry that began in the 1990s (European Parliament and Council, 1996, 2003, 2009b) has reshaped the environment in which storage operates. After the ‘unbundling’ of the power sector, only the transmission and distribution segments remain regulated monopolies while generation, trade and retail are open to competition. Storage can generate revenues on markets, but boundaries now exist between regulated and deregulated activities making it more difficult to generate revenue streams from different segments.
Environmental concerns and public acceptability form barriers to the deployment of large-scale technologies such as CAES or PHS. Case studies (STORE, 2012) show the relevance of the WFD (European Parliament and Council, 2000), the Biodiversity and Natura 2000 legislation (European Council, 1999; European Parliament and Council, 2009a), and the requirement for environmental impact assessments (European Parliament and Council, 2001, 2011). Very little experience exists with environmental licensing of PHS according to EU law as the majority of plants have been constructed before entry into force of this legislation. New large-scale (PHS or CAES) plants may require large electricity transmission infrastructures, which might also face political and environmental resistance.
14.5 RD&D priorities and current initiatives
Almost EUR 1 billion of both European and Member States’ funds have been invested in storage RD&D during the past 5 years in the 14 Member States most active in this area (Geth et al., 2013). Most of these projects are in the research stage, and very few are demo or pre-commercial projects. Electrochemical storage receives the largest share of funds (~ 30 %), followed by chemical storage (~ 10 %). Across Europe, there is specialisation of R&D: batteries dominate the expenditures in Italy while Germany devotes significant resources to chemical stor-age. Also, the size of projects varies strongly: the UK spends more than EUR 300 million on 12 projects, of which 2 large-scale pilots make up two thirds of the budget. Significant investments are also taking place in the US where in 2009 its DOE launched an electricity storage funding programme with a total value of USD 772 mil-lion aiming at more than 500 MW of installed capacity (EPRI, 2013).
JRC13_TMAP_08AP14_P5-NS-Print.indd 103 09/04/2014 16:21:41

104
2013 Technology Map of the European Strategic Energy Technology Plan
Mechanical storage technologies
Pumped hydro storage
The goal of R&D is to overcome limitations given by very high or very low head and to extend the range of services that PHS can deliver to the power system. The recently developed double-stage regulated pump turbine gives the possibility to utilise a very high head for pumped storage. Another innovation, variable speed turbines, offers the possibility to provide reserve power in pumping mode (ESTORAGE, 2013). Further devel-opments concern challenges to the technology of using seawater with only one scheme built, in Okinawa, Japan, that uses the sea as a lower res-ervoir (Peters and O’Malley, 2008). Alternatives to conventional geological formations are PHS plants using underground reservoirs (Ekman and Jensen, 2010) or former opencast mines, for example, from granite mining in Estonia (Kruus, 2010) and from coal mining in Germany (Schulz and Jordan, 2010).
Compressed air energy storage
The main technological goal of developing adi-abatic CAES, as pursued, for example, in the ADELE project (Freund et al., 2013), is to raise thermal efficiency from the current 55 % to 70–80 %. This requires the development and demonstration to scale of thermal storage as well as high-temperature compressors able to operate under conditions of 600 °C at 100 bar. Alternative approaches such as isothermal CAES still need to be scaled up from currently modest sizes of maximum 1 MW.
Flywheels
Increasing the energy density of the flywheel is key for reducing the currently high invest-ment costs. This could be achieved by raising the rotational speed of the flywheels and further increasing the reliability of these by improving disc materials, bearings and power electronics. The energy cost of flywheels is expected to stay higher than for other technologies. Power costs are expected to decrease to below EUR 650/kW by 2020 (EASE/EERA, 2013).
Chemical storage technologies
Hydrogen and power-to-gas
Improving the challenging economics and dem-onstrating the technology to scale are the main goals to be addressed by RD&D. The levers to improve the economics are the currently high investment costs of the overall system, and the relatively low round trip efficiency of below 50 %. Electrolysers still need to be demonstrated on the MW scale. Furthermore, the storage of H2 (possibly in caverns) and the injection of H2 into gas grids need to be validated at these scales. Further information on the electrolyser technol-ogy is provided in Chapter 13 on hydrogen and fuel cells.
Electrochemical storage technologies
Pb-acid batteries
Although a mature technology, improvement is necessary regarding cycle life, depth of dis-charge and, as a result, costs. The goal for 2020–2030 is to increase the battery lifetime to 10 000 cycles at 80 % depth of discharge and to decrease the energy costs to EUR 100–150/kWh (EASE/EERA, 2013). Technological approaches consist of materials innovations for the elec-trodes and electrolyte reducing the detrimental effects of deep discharging (EPRI, 2013).
Li-ion batteries
As Li-ion technology was only commercialised in the 1990s and for consumer electronics, there is limited experience with long-term operation. The main goal for this technology is to reduce the costs. Targets for 2020–2030 include reducing energy costs from the current EUR 500–1 000/kWh to EUR 200/kWh (EASE/EERA, 2013).
Figure 14.1:Two Saft Intensium Max
20E containerised energy storage units are part of a renewable energy storage
system on the Big Island of Hawaii in the US designed
to increase the Hawaiian grid’s ability to integrate more renewable energy
Source: Saft.
JRC13_TMAP_08AP14_P5-NS-Print.indd 104 09/04/2014 16:21:41

105
2013 Technology Map of the European Strategic Energy Technology Plan
NaS batteries
Costs reduction and enhanced cyclability are also the main goals for this technology. The industry targets are to halve total system costs from the current EUR 3 000/kW25 to EUR 1 500/kW in the decade 2020–2030 and to achieve a lifetime in excess of 10 000 cycles (EASE/EERA, 2013).
Other battery technologies
Costs and lifetime are also the main R&D objec-tives for all less mature technologies such as redox-flow and nickel-based batteries.
14.6 References
Beacon Power, Proven clean technology solu-tion for frequency regulation, grid stability & renewable energy integration, 2013 (http://www.beaconpower.com/files/bp_intro.pdf) accessed 7 January 2014.
Bertsch, et al., Flexibility options in European electricity markets in high RES-E scenarios, study on behalf of the International Energy Agency (IEA), 2012.
Crotogino, F., Mohmeyer, K.-U., Scharf, R., Huntorf CAES: More than 20 Years of Successful Operation, Solution Mining Research Institute Meeting, Orlando, FL, 23–25 April 2001.
Deutsche Energie-Agentur (dena) (http://www.powertogas.info/) accessed 3 October 2013.
Ekman, C.K., Jensen, S.H., ‘Prospects for large scale electricity storage in Denmark’, Energy Conversion and Management, Vol. 51, Issue 6, 2010, pp. 1140-1147.
Electric Power Research Institute (EPRI), Electricity Energy Storage Technology Options - A White Paper Primer on Applications, Costs and Benefits, Palo Alto, California, 2010.
ENDESA, Endesa installs Spain’s first energy stor-age plant in Canary Islands, press release dated 22 August 2012 (http://www.endesa.com/en/saladeprensa/noticias/energy-storage) accessed 3 October 2013.
ESTORAGE (http://estorage-project.eu/) accessed 1 November 2013.
EURELECTRIC, EU Islands: Towards a Sustainable Energy Future, Brussels, 2012.
25 As NaS batteries come with a fixed storage capacity of
7 hours, this figure includes both the power conversion
system as well as a storage capacity of ~ 7.2 kWh.
European Association for Storage of Energy (EASE)/European Energy Research Alliance (EERA), European Energy Storage Technology Development Roadmap towards 2030, Brussels, 2013.
European Commission (EC), A European Strategy Energy Technology Plan (SET-Plan) - Towards a low carbon future, COM (2007) 723 final, 2007.
European Commission (EC), Energy infrastructure priorities for 2020 and beyond - A Blueprint for an integrated European energy network, COM(2010) 677 final, 2010.
European Commission (EC), Energy Technologies and Innovation, COM(2013) 2532013, 2013.
European Council, Directive 1992/43/EEC - Conservation of natural habitats and of wild fauna and flora, 1999.
European Network of Transmission System Operators for Electricity (ENTSOE), Ad hoc team operational reserves, final report, 2012.
European Parliament and Council, Directive 1996/92/EC Common rules for the internal mar-ket in electricity, 1996.
European Parliament and Council, Directive 2000/60/EC - Establishing a framework for Community action in the field of water policy, 2000.
European Parliament and Council, Directive 2001/42/EC – on the assessment of the effects of certain plans and programmes on the envi-ronment, 2001.
European Parliament and Council, Directive 2003/54/EC Common rules for the internal market in electricity and repealing Directive 96/92/EC, 2003.
European Parliament and Council, Directive 2009/147/EC - On the conservation of wild birds, 2009a.
European Parliament and Council, Directive 2009/72/EC Common rules for the internal mar-ket in electricity and repealing Directive 2003/54/EC, 2009b.
European Parliament and Council, Directive 2011/92/EU - On the assessment of the effects of certain public and private projects on the environment, 2011.
European Parliament and Council, Regulation (EU) No. 347/2013 of 17 April 2013.
Fastelli, Energy Storage On Islands: A sustain-able energy future for islands, Enel Ingegneria & Ricerca, EURELECTRIC Brussels, 2012.
JRC13_TMAP_08AP14_P5-NS-Print.indd 105 09/04/2014 16:21:41

106
2013 Technology Map of the European Strategic Energy Technology Plan
Folke, Experience on ‘Power to gas’ in Germany and the future steps, Presentation at the European Sustainable Energy Week, 2013.
Freund, S., Marquardt, R., Moser, P., ADELE adi-abatic compressed air energy storage, status and perspectives, VGB PowerTech, 2013.
Geth, et al., Energy Storage Innovation in Europe, a Mapping Exercise, Report to the GRID+ project, 2013.
Joint Research Centre (JRC), Assessing Storage Value in Electricity Markets – a Literature Review, EUR - Scientific and Technical Research Reports, EUR 26056, 2013.
Joint Research Centre (JRC), Assessment of the European potential for pumped hydropower energy storage, EUR 25940, 2013.
Kruus, M., Hydro pump storage plant in Estonia, in Proc. of Energy Storage Forum Europe 2010, Barcelona, 2010.
Ministry of Economy, Trade and Industry (METI) Japan, Information on Storage Technology and Markets Prospects in Japan (Presentation), IEA Energy Storage Technology Roadmap Workshop, Paris, 23–24 September 2013.
NGK, NGK and Italian TSO (Terna) came to an agreement for supply of NAS battery system, press release May 2013 (http://www.ngk.co.jp/english/news) accessed 3 October 2013.
Nicolosi, M., The Economics of Renewable Electricity Market Integration, Cologne, EWI, 2011.
Peters, R., O’Malley, L., Storing renewable pow-er, The Pembina Institute, 2008 (http://www.ontario-sea.org/Storage/28/2012_Pembina-StoringRenewablePower.pdf) accessed 7 January 2014.
Pollak, R., History of First US Compressed-Air Energy Storage (CAES) Plant (110MW, 26h), Vol. 2: Construction, Electric Power Research Institute, 1994.
REserviceS Project, Ancillary Services by Solar PV - Capabilities and Costs, Deliverable D 4.1, 2013a.
REserviceS Project, Capabilities and costs for ancillary services provision by wind power plants, Deliverable D 4.1, 2013b.
SANDIA, Energy Storage for the Electricity Grid: Benefits and Market Potential Assessment Guide, Sandia National Laboratories, Albuquerque, New Mexico, 2010.
SANDIA, Lessons from Iowa: Development of a 270 Megawatt Compressed Air Energy Storage Project in Midwest Independent System Operator, SANDIA Report SAND2012-0388, 2012.
SANDIA, DOE/EPRI Electricity Storage Handbook in Collaboration with NRCA, SANDIA Report SAND2013-5131, 2013.
Schulz, D., Jordan, M., Concepts for pumped hydro storage facilities in former opencast mining facili-ties, in proceedings of the 5th IRES Conference, Berlin, 2010.
stoRE, Facilitating energy storage to allow high penetration of intermitent renewable energy, stoRE project, 2012.
stoRE, European Regulatory and Market Framework for Electricity Storage Infrastructure, stoRE Project, 2013.
SUSTAINX, SustainX Begins Startup of World’s First Grid-Scale Isothermal Compressed Air Energy Storage System, press release 2013 (http://www.sustainx.com) accessed 2 October 2013.
Ulleberg, Ø., Nakken, T., Eté, A., ‘The wind/hydro-gen demonstration system at Utsira in Norway: Evaluation of system performance using opera-tional data and updated hydrogen energy system modeling tools’, International Journal of Hydrogen Economy, Vol. 35, Issue 5, 2010, pp. 1841-1852.
US FEDERAL ENERGY REGULATORY COMMISSION, Order No. 755 - Frequency Regulation Compensation in the Organized Wholesale Power Markets, Washington DC, 2011.
U.S. DOE, International Energy storage database, 2013 (http://www.energystorageexchange.org) accessed 3 October 2013.
JRC13_TMAP_08AP14_P5-NS-Print.indd 106 09/04/2014 16:21:41
107
15. Smart grids
15.1 Introduction
Modern societies face the complicated challenge of reducing their impact on the environment and the climate while improving citizens’ quality of life. The smart electricity systems (SES) concept refers to changes in the operational model for the genera-tion, transmission, distribution and consumption of electricity characterised by the massive integration of renewable sources, integration of sensing moni-toring, control, automation and other ICT applica-tions, communications amongst all stakeholders, and improved metering, and protection capabilities. This evolution has technical, societal and economic consequences. The transformation of the electrici-ty sector aims for the optimal exploitation of the energy provided by renewable sources mainly available at the distribution level, improvement of service quality, the mitigation of grid losses, and moderation and efficiency of the consumption. RES can be available in remote areas or can be optimally deployed locally and near the consumption points. The electricity grid has to be adequately expanded at distribution level in order to accommodate renewable sources in rural areas or at transmis-sion level to accommodate remote sources (e.g. offshore wind). The distributed generation from RES may reduce the transmission and distribution losses when it is close to the consumption points and its timing correlated to load (e.g. solar PV).
The traditional operating principles of the distri-bution grids were based on the passive transfer of electricity from the large installation plants through the transmission level to the consump-tion points. Today, due to the increasing distribut-ed generation of RES, the flow of energy becomes bi-directional, thereby changing the traditional principles by which the grids are planned and controlled. The industry accepts this fact as a rule changer procedure. Moderation of the consump-tion is being achieved through the implementa-tion of energy efficiency actions, for example, the construction of energy-efficient houses and buildings. These objectives are synergetic with the transition towards a low-carbon economy.
The EU supports the development of SES through several legislative acts (EC, 2008, 2009, 2011a, 2011b; EU, 2013).
15.2 Technological state of the art and anticipated developments
A smart electricity grid is an upgraded electric-ity network that can intelligently integrate the actions of all users connected to it (producers, consumers and the so-called prosumers (produc-ers–consumers)), in order to ensure economically efficient, sustainable power systems with low losses, high levels of quality, and security of sup-ply and safety (SmartGrids ETP, 2010a). A smart grid will employ advanced metering and commu-nication technologies in order to accommodate the dynamic behaviour of end users (EC, 2011a). The smart grids allow features such as demand-side management, smart active protection of the network, energy savings and cost reduction.
Most of the projects on advanced smart grids developed in Europe are at the R&D and dem-onstration stage. These efforts have different aspects concerning the generation, transmission, distribution and consumption sectors and many recent projects cut across several of these, for example demonstrating the integration of local generation; consumption and distribution. Most of these efforts rely on an upgrade of their ICT instruction; standardisation is important to allow interoperability of individual solutions.
Generation
Regarding generation, R&D spans from the improvement of the efficiency and the environ-mental footprint of the existing installations to the development of new, more efficient technolo-gies and a better integration in the power system. However, this is not discussed further here since these technologies are treated in other chapters of this report.
2013 Technology Map of the European Strategic Energy Technology Plan
JRC13_TMAP_08AP14_P5-NS-Print.indd 107 09/04/2014 16:21:41

108
2013 Technology Map of the European Strategic Energy Technology Plan
Transmission networks and power electronics
EU regulation (EU, 2013) defines the priority elec-tricity corridors for transmission. The Northern Seas Offshore Grid (NSOG) was established with the intent to support the transmission of elec-tric energy produced from RES in the Northern Seas and to increase the cross-border elec-tricity exchange. The North-South Electricity Interconnections in Western Europe (NSI West Electricity) define a corridor connecting conti-nental Europe with Scandinavia and the UK. The target includes the integration of RES and to integrate the markets in Europe. The third and fourth corridors are the North-South Electricity Interconnections in Central Eastern and South Eastern Europe (NSI East Electricity) and the Baltic Energy Market Interconnection Plan in Electricity (BEMIP Electricity), respectively.
From a technology perspective, HVDC multi-terminal grids technology has the potential of transmitting electricity over long distances is more efficiently than by using alternating current lines or cables. This is particularly the case for offshore grids. To deliver offshore wind power from a multiplicity of sites to several landing points, a multi-terminal approach appears as an optimal long-term solution. HVDC lines could also prove more efficient in transmitting large amounts of power over long land distances, the so-called “electricity highways”. These have also been identified as a priority in the EU infrastruc-ture regulation. Today, almost all HVDC systems have two terminal connections that exchange electric power (e.g. connecting an offshore wind farm with the onshore grid). In order to reduce the installation costs, sharing of transmission cables could be applied. This technology is named multi-terminal HVDC connection due to the use of more than two terminal connections. It is seen as an emerging market for the industry but the multi-terminal technique has not yet been adequately proven in the field.
The high penetration of RES, especially wind, in the European electricity grid could potentially create undamped oscillations that deteriorate the quality of the power supply and could affect the working life of the rotating equipment. Previous experience showed oscillations on grids during peak wind electricity production hours. In order to monitor the phenomenon, the installation of phase measurement systems is proposed. The data extracted from the phase measurement systems can facilitate the immediate reaction of the system operators following predefined procedures. Expanding the use of phase meas-urement units will facilitate the monitoring and control of the expanded European grid.
Distributed energy storage systems
The manufacturing industry offers a variety of concentrated and distributed energy storage products, which are increasingly being tested in different configurations; combined with gen-eration, connected to the grid or combined with loads. The electric energy storage modules may relieve potential congestions of the grid and thus delay the need for network upgrade, and increase the ability of the grid to absorb the energy pro-duced from intermittent renewables. Also, they may improve the efficiency and reliability of the system, but today high installation costs do not justify the business case in most configurations. In addition, regulation may not allow network operators to own and operate storage as this would interfere with the market. More informa-tion about energy storage technologies can be found in Chapter 14.
Consumption
As part of state-of-the-art smart grid technology, a distributed control approach focuses on the imple-mentation of platforms that harmonise the load and the intermittent production of electricity from RES as well as optimise the internal consumption. The main effort focuses on the development of smart devices being able to adjust their behaviour following the external signals that are regulated according to the needs of the system. An impor-tant hurdle to its implementation is the need for interoperability among different equipment in and on the grid. The manufacturers tend to use their in-house protocols and physical connections for the communication of the equipment, while independ-ent entities offer complete solutions to interface the apparatus and visualise its operation. In order for the technology to be more successful, further participation on the part of citizens is needed. It is expected in the future that the proposed solutions will be harmonised under further implementation of the appropriate technical standardisation.
The transition of the traditional metering to smart metering equipment is an important element in the implementation of smart grids. Smart meters are the measuring devices that can record real-time detailed electric energy consumption data, and communicate these measurements to the energy providers for billing. According to a recent JRC report (Giordano et al., 2012), the installa-tion of smart meters in the EU is increasing. Italy has installed around 36 million smart meters, and Sweden has completed a full roll-out of 5.2 million smart meters. Malta and Finland will com-plete their smart metering roll-out by 2013. Spain will install 28 million meters by 2018, France will install 35 million by 2017 and the UK will install 56 million by 2019. It is estimated that at least 170 million smart meters will be installed in the EU-27 by 2020 at a cost of EUR 30 billion.
JRC13_TMAP_08AP14_P5-NS-Print.indd 108 09/04/2014 16:21:42

109
2013 Technology Map of the European Strategic Energy Technology Plan
15.3 Market and industry status and potential
The European electricity grid is the largest syn-chronous operating system with more than 660 GVA of installed capacity, according to ENTSOE (European Network of Transmission System Operators for Electricity) (see Figure 15.1).
To upgrade and modernise the European network, conservative estimates forecast an investment need of EUR 56 billion by 2020–2025, EUR 390 billion by 2030 and EUR 480 billion by 2035 (EURELECTRIC, 2011; IEA, 2010).
The Directive 2009/72/EC, which repeals the Directive 2003/54/EC, defines the operational prin-ciples of the energy system market participants. As interpreted in this directive.
• Transmission and distribution system operator is the entity that develops, maintains and operates the electricity network avoiding unnecessary duplication of infrastructure. The equal access to all players is guaranteed by the legislation. The European-wide synchronously interconnected area covers the transmission electricity networks of continental Europe, including S-W European countries. Together with the Nordic countries, Baltic countries, UK, Ireland, Iceland and Cyprus in the European
system, it includes 41 TSOs in 34 countries. The TSOs are natural monopolies. According to the Third Electricity Package, the Member States can follow different options in organis-ing their energy transmission operators; these are the ownership unbundling, the Independent System Operator scheme and the Independent Transmission Operator scheme. The ownership unbundling scheme aims at eliminating vertical monopolies by separating electricity genera-tion from transmission and distribution. The Independent System Operator scheme permits Member States to allow energy groups to own the system but its operation and control goes to a self-governing operator. The Independent Transmission Operator scheme follows the principle of legal unbundling where the owner-ship remains with the energy groups, while the daily operation is independent. The investment decisions are taken in collaboration with the owner and the regulator. Less stringent unbun-dling principles apply to distribution operators and member states may decide not to unbun-dle small distribution systems.
• Producer is the individual or company gener-ating electricity. Traditionally, the energy pro-vided to the electricity system comes from large installations. The smart grids technology and market regulation included in the “3rd energy legislative package” facilitates the
Figure 15.1:The density of the current transmission grid (2010)
Note: It includes the high voltage lines over 220 kV and the Member States’ interconnectors.
Source: Platts, 2013.
JRC13_TMAP_08AP14_P5-NS-Print.indd 109 09/04/2014 16:21:43

110
2013 Technology Map of the European Strategic Energy Technology Plan
integration of electricity from distributed gen-eration. The distributed generation plants have small capacity but they can be located near the consumption; in that case, local consumption may be encouraged and network costs may be reduced. When the distributed generation is a co-producer of heat and electricity (CHP), due to its proximity with the residential load the transfer of the heat is facilitated, improving the business cases of CHP plants.
• Regulator is the independent entity that ensures fair allocation of the benefits along the electricity system chain.
• Consumer is the individual consuming elec-tricity. The EU serves the consumers’ interests, imposing high standards for consumer protec-tion and public service obligations to the utilities.
Focus on the customer
The smart grid will enable the further participa-tion of consumers in the market. In addition their ability to choose their energy provider, optimise their consumption based on the pricing and by producing electricity. The production of electric-ity at the consumer level can be implemented through the installation of distributed genera-tion (e.g. small PV plants, small wind turbines, m-CHP). The roll-out of smart metering devices combined with the online acquisition of electricity prices could incentivise consumers to optimise their consumption.
Grid investment costs
The Energy Roadmap 2050 estimates the infra-structure requirements with different energy technology scenarios. Decarbonisation scenarios require more sophisticated infrastructures than the reference scenario (policies of 2010) (see Table 15.1). For example, the scenario with high share of renewables would require extra HVDC lines to transport electricity from the North Sea to the centre of Europe and also more storage (EC, 2011c).
15.4 Barriers to further deployment
According to the European Electricity Grid Initiative (EEGI), which is one of the EIIs of the SET-Plan, particular challenges are identified, coming from:
• the change from “supply follows load” to “load follows supply”;
• increased challenges in real-time balancing;
• introduction of aggregators;
• a multi-layer control structure.
Different types of barriers are acknowledged (EEGI, 2010; EEGI 2013).
• Technological challenges: The main techno-logical challenge identified by the EEGI is in the integration of the many different technological elements, stakeholders and business models of the new panorama offered by smart electricity grids. System integration challenges include the validation of technologies for real-time operations, for market architectures and for long-term planning. Transmission operators need increasingly close coordination among themselves to realise a truly pan-European grid. Moreover, as an increasing amount of generation and active loads is connected to the distribution grid, distribution operators increas-ingly need to manage their grids as systems and tightly coordinate their operations with those of the transmission operator.
• Flexibility: The increasing amount of variable renewable energy on the networks requires the development of all possible sources of flex-ibility on the electricity networks, and appropri-ate market and control structures to organise their coordination. Flexibility may be provided by generation, large and small, by demand response and/or by storage resources.
• HVDC Technology: In terms of specific technologies, progress in HVDC technology in particular for multi-terminal applications will enable extended transmission corridors over water areas and wheeling of bulk power over long distances as already mentioned. The development of new equipment has to be supported by the respective standardisa-tion and interoperability efforts. Offshore wind
Table 15.1: The investments in transmission grids,
interconnectors, distribution grid and smart
components according to the Energy Roadmap 2050
Source: EC, 2011c.
Billion EUR '05 2011–2020 2021–2030 2031–2040 2041–2050
Reference 292 316 662 1 269
Diversified supply technologies 337 416 959 1 712
High RES 336 536 1 323 2 195
JRC13_TMAP_08AP14_P5-NS-Print.indd 110 09/04/2014 16:21:43

111
2013 Technology Map of the European Strategic Energy Technology Plan
installations, amongst others, due to the inter-mittency of the primary power supply and their increased installed capacity, usually face the cost of the connection to the electricity grid. In order to accommodate the intermittency of the renewables, the use of spinning reserves has been proposed. Network reinforcements are proposed in order to tackle the potential energy transmission bottlenecks.
• Information and privacy: the smart grid technology requires a variety of stakehold-ers to share personal information of the consumers. Therefore, the implementation of effective data privacy policies and cyber security patterns are of paramount importance. Additionally, the industry currently provides a variety of smart solutions that, however, have limitations restricting their effective commu-nication between the products of the market due to lack of standardisation.
• Standardisation efforts: the potential new investments, the goals for the decarbonisation of society and the security of energy supply will not be able to be adequately materialised if the standardisation organisations do not support the evolving sector. The International Electrotechnical Committee (IEC) at interna-tional-level and national standardisation enti-ties, such as CENELEC, CEN and ETSI, elaborate on an increase in the allocation of resources to the standardisation activities (ESO, 2011). A positive example of standardisation prac-tice is the development and implementation of a standard that defines, amongst others, the communication protocols between the major equipment used on the transmission grid. In 2011, CEN, CENELEC and ETSI formed a joint Activity on Standards for Smart Grids, which in the subsequent two years produced four reports: ‘Sustainable Processes’ (CEN-CENELEC-ETSI, 2012a), ‘First Set of Consistent Standards’ (CEN-CENELEC-ETSI, 2012b), ‘Reference Architecture’ (CEN-CENELEC-ETSI, 2012c), and ‘Investigate standards for information security and data privacy’ (CEN-CENELEC-ETSI, 2012d).
• RD&D optimisation: R&D activities span around Europe and abroad. The cooperation between the researchers can be limited, which leads to the duplication and fragmentation of their contributions. Activities to promote scaling-up of validated solutions and their rep-lication in other environments, as started in the context of the EEGI, need to be expanded.
• Market distortions: smart grids technology is evolving, creating added value. The stakeholders that mostly have to invest in this effort (system operators) support the opinion that partners that invest less (e.g. society, customers and
generators) may actually benefit most. Therefore, a changed regulatory framework is required in order to accommodate the needs of the evolving sector to provide appropriate incentives to deploy smart grids solutions after their validation in large-scale technology demonstration projects.
• Public opinion: the public usually opposes the construction of new transmission grids, distribution lines and generation fossil fuels power plants, and/or RES installations. It has to be mentioned that the different types of technologies face different public resistances. As an example, the public tends to accept more easily the installation of underground trans-mission lines compared with overhead ones and PV power plants compared to fossil fuel ones. Public opinion also needs to be managed carefully concerning privacy aspects raised by smart meters. This tendency affects the smart grids developments as well.
The author of this chapter supports the opinion that the barriers mentioned will be efficiently tackled in the future. The stakeholders involved are dealing effectively with the respective issues. The European Commission harmonises the RD&D efforts and supports the market improvement. The author supports the opinion that the public understands the target of the decarbonisation of society, the security of energy supply and the benefits of smart grids. Consequently, it is more committed to participation in the smart grids effort.
15.5 RD&D priorities and current initiatives
Research, development and demonstration priorities
The RD&D priorities of the electricity grids stakeholders are described in the SRA of the European Technology Platform SmartGrids (SmartGrids, 2007; SmartGrids, 2012).
Emphasis in terms of R&D is placed on, among others, further developing the thematic topics of:
• integration of truly sustainable, secure and economic electricity systems;
• smart electricity distribution systems;
• smart electricity transmission systems;
• smart combined electricity transmission and distribution systems;
• smart retail and consumer technologies;
• socio-economical and ecosystem smart grids barriers and opportunities.
JRC13_TMAP_08AP14_P5-NS-Print.indd 111 09/04/2014 16:21:43

112
2013 Technology Map of the European Strategic Energy Technology Plan
Programmes implementing the priorities
At the level of the EU, RD&D is based on the responsibilities allocated to different entities or programmes. The EERA operates a joint pro-gramme on smart grids giving emphasis to the disciplines of network operation, energy man-agement, control system interoperability and electrical storage technologies. Up to September 2013, 329 FP7-supported energy projects on different sub-disciplines were funded to sup-port the integration of smart grid technologies. The Competitiveness and Innovation Framework Programme launched the Intelligent Energy Europe (IEE) programme, which supports those organisa-tions willing to improve their environmental foot-print. KIC InnoEnergy targets the exploitation of knowledge that has been already created from the research of academic structures and the industry catalysing their cooperation. SmartGrids ERA-Net funds specialised proposals on smart grids and develops an articulation between national pro-grammes. The European Research Council (ERC) supports high-profile individuals in their research. The European Industrial Electricity Grid Initiative brings together representatives principally from industry and member states to plan and develop the research and innovation activities to develop and deploy smart grids in Europe.
Mapping of the current RD&D initiatives
The JRC’s Institute for Energy and Transport (JRC-IET) has been mapping the European Smart Grid projects and a respective report has been released for projects collected up to 2012 (JRC, 2013). The current initiatives, based on the infor-mation provided, include large publicly funded projects, in particular the first group of projects funded by the Low Carbon Network Fund (LCNF) (total investment of around EUR 120 million) from the UK, and a significant number of large-scale demonstrators financed under FP7 (e.g. Grid4EU, Linear, Green eMotion) (CORDIS, 2013) or with European regional funding (particularly a large-scale grid automation project for RES integration in the south of Italy). Figure 15.2 represents the current situation of the Smart Grid projects across Europe.
Figure 15.2: Smart Grid projects
across Europe per capita (blue) and by electricity
consumption (red)
Source: JRC, 2013.
JRC13_TMAP_08AP14_P5-NS-Print.indd 112 09/04/2014 16:21:45

113
2013 Technology Map of the European Strategic Energy Technology Plan
15.6 References
CEN-CENELEC-ETSI Smart Grid Coordination Group, CEN-CENELEC-ETSI Smart Grid Coordination Group – Sustainable Processes, 2012a.
CEN-CENELEC-ETSI Smart Grid Coordination Group, First Set of Standards, 2012b.
CEN-CENELEC-ETSI Smart Grid Coordination Group, Smart Grid Reference Architecture, 2012c.
CEN-CENELEC-ETSI Smart Grid Coordination Group, Smart Grid Information Security, 2012d.
Dong Energy, 2013 (http://www.dongenergy.com) accessed 7 January 2014.
Enercon, 2013 (http://www.enercon.de) accessed 7 January 2014.
EURELECTRIC, Regulation for Smart Grids, 2011 (http://www.eurelectric.org/media/25920/eure-lectric_report__on_reg_for_sg_final-2011-030-0131-01-e.pdf) accessed 7 January 2014.
European Commission (EC), Council Directive 2008/114/EC on the identification and desig-nation of European critical infrastructures and the assessment of the need to improve their protection, 2008.
European Commission (EC), Directive 2009/72/EC concerning common rules for the internal market in electricity and repealing Directive 2003/54/EC (Part of the Third Electricity Package), 2009a.
European Commission (EC), Directive 2009/73/EC concerning common rules for the internal market in natural gas and repealing Directive 2003/55/EC (Part of the Third Electricity Package), 2009b.
European Commission (EC), Smart Grids: from inno-vation to deployment, COM/2011/0202, 2011a.
European Commission (EC), The EU Energy Policy: Engaging with Partners beyond Our Borders, COM/2011/0539, 2011b.
European Commission (EC), Energy Roadmap 2050 – Impact Assessment, COM/2011/885, 2011c.
European Commission (EC), A view on Smart Grids projects in Europe: lessons learned and current developments, 2011d (http://ses.jrc.ec.europa.eu/index.php? option=com_content&view=article&id=93&Itemid=137) accessed 7 January 2014.
European Commission (EC), Making the internal energy market work, COM 2012/663, 2012.
European Commission (CORDIS), FP7 Energy Work Programme, 2013 (http://cordis.europa.eu/fp7/energy/) accessed 8 September 2013.
European Electricity Grid Initiative (EEGI), Roadmap 2010-18 and Detailed Implementation Plan 2010-12, 2010.
European Electricity Grids Initiative (EEGI) Research and Innovation Roadmap 2013-2022, 2013
European Standards Organisation (ESO), Recommendations for smart grid standardiza-tion in Europe - Standards for Smart Grids, 2011.
European Technology Platform SmartGrids (SmartGrids), SmartGrids SRA 2035 Strategic Research Agenda Update of the SmartGrids SRA2007 for the needs by the year 2035, 2012.
European Technology Platform SmartGrids (SmartGrids), Strategic Research Agenda for Europe’s electricity Networks of the Future, EUR 22580, 2007.
European Union (EU), Regulation No 714/2009 on conditions for access to the network for cross-border exchanges in electricity and repealing Regulation (EC) No 1228/2003 (Part of the Third Electricity Package), 2009a.
European Union (EU), Regulation No 715/2009 on conditions for access to the natural gas transmis-sion networks and repealing Regulation 1775/2005 (Part of the Third Electricity Package), 2009b.
European Union (EU), Regulation No 713/2009 of the European Parliament and of the Council of 13 July 2009 establishing an Agency for the Cooperation of Energy Regulators (Part of the Third Electricity Package), 2009c.
European Union (EU), Regulation (EU) 347/2013, 2013.
Giordano, V., Meletiou, A., Covrig, C.F., Mengolini, A., Ardelean, M., Fulli, G., Sánchez Jiménez, M., Filiou, C, Smart Grid projects in Europe: Lessons learned and current developments – 2012 update, ISBN 978-92-79-28603-2, doi: 10.2790/82707, 2013.
International Energy Agency (IEA), World Energy Outlook, 2010.
Platts, World Electric Power Plants Database, McGraw Hill financial, 2013.
Smart Grids European Technology Platform (SmartGrids ETP), Strategic deployment docu-ment – final version, 2010.
Vestas, 2013 (http://www.vestas.com) accessed 7 January 2014.
JRC13_TMAP_08AP14_P5-NS-Print.indd 113 09/04/2014 16:21:45

114
16. Cogeneration or combined heat and power
16.1 Introduction
Cogeneration or CHP is the simultaneous genera-tion of electric power and useful thermal heat from a single fuel source. It can be used either to replace or complement conventional heat and power production. Due to the fact that CHP recovers waste heat, more efficient use of the primary fuel is achieved. For example, the thermal efficiency of a conventional coal power plant can increase from 35 to 75 % when converted to CHP. A limitation of CHP is that there needs to be a match between heat demand and supply.
The EU has several policy objectives in the energy field, for example, to reduce GHG emissions and to employ a resource efficient approach. The Energy Efficiency Directive (2012/27/EU) (EC, 2012a) brings forward legally binding requirements on Member States to use energy more efficiently at all stages of the energy chain. This includes the requirement that new electricity genera-tion installations and existing installations that are substantially refurbished or whose permit or license is updated should be considered for high-efficiency cogeneration.
Cogeneration can accelerate the integration of renewable energy technologies. Renewables like biomass, geothermal and concentrating solar power can be used as the heat source, allow-ing both the electricity and heat supply to be decarbonised. Nuclear cogeneration could also contribute in this respect. Cogeneration can also assist in balancing renewable energy (IEA, 2011).
16.2 Technological state of the art and anticipated developments
In power plants, mechanical energy is produced by a heat source that transforms thermal energy using a turbine. The working fluid can be, for example, steam, air or an organic compound vapour. Large-scale power plants, depending on type and fuel source, transform between 35 and 60 % of the energy of the primary fuel into electricity and the rest is lost as heat to the environment. By contrast, the rejected heat from a CHP plant satisfies a heat demand, such as sup-plying heat for an industrial process or buildings,
where this would otherwise require, for example, a heat-only boiler. The total efficiency of a CHP plant can reach about 70 to 90 %, depending on the fuel and plant type as well as on the charac-teristics of the heat demand. The higher efficiency of a CHP plant compared to an electricity-only plant allows significant fuel savings and emission reductions, for example, typically in the order of 30 % for fossil-fuelled plants. In principle, a CHP design is independent of the type of heat source, hence making fossil fuels, waste, renewable fuels and nuclear energy technically viable options. In the case of low-carbon CHP plants, these heat sources often replace natural gas-fuelled indi-vidual boilers of households, thereby allowing even greater reductions.
A CHP plant is designed according to one of two cycles:
• The topping cycle: electricity is generated in a steam turbine. Energy is recovered from the exhaust or cooling system and used, for example, for DH.
• The bottoming cycle: fuel is combusted to pro-vide heat for a furnace or other industrial pro-cess. Some heat is then used for power produc-tion. Such CHP systems are typically designed to meet the base-load thermal demand of an industrial facility. The bottoming cycle is used for very-high–temperature applications and it is less common than the topping cycle (U.S. DOE and EPA, 2012).
The steam cycle plant in Figure 16.1 uses the topping cycle. It can be operated as if it were a normal electricity-only power station, in which case all the steam from the turbine is cooled in a condenser and turned from steam to water, giving up its latent heat at around 30 ºC tem-perature. This is referred to as a fully condensing mode maximising the power from the steam. When using it as CHP, steam is extracted and fed into, for instance, a DH condenser contain-ing city heating water. As a consequence, the electrical output of the power station drops, but the fuel consumption remains constant. Typically, a loss of 1 unit of electricity output will result in between 5 and 10 units (depending on the
2013 Technology Map of the European Strategic Energy Technology Plan
JRC13_TMAP_08AP14_P5-NS-Print.indd 114 09/04/2014 16:21:45

115
2013 Technology Map of the European Strategic Energy Technology Plan
power plant) of heat becoming available at a useable temperature. This ratio is often referred to as the Z factor. The higher the temperature at which the heat is required, generally the lower the Z factor will be.
Cogeneration technology covers a very broad range of technologies and sizes, from 1 kWe unit up to 400 MW. For smaller-scale heat demand, the generator selection will depend on the over-all cost savings that can be achieved. However, the CHP plant with the greatest efficiency does not always have the greatest financial benefits. Instead, the choice of generator is often decided by two factors:
• the site heat demand that can be met with CHP,
• the base-load electricity demand (DECC, 2013a).
Currently, the main types of systems used for CHP are the following (Garcia et al., 2012):
• Reciprocating engines in the form of spark or compression-ignited ICEs. The technology is mature and available in a wide range of sizes, with electrical efficiencies of 25–48 % (typically rising according to size) and total efficiencies of 75–85 %. Electrical output is 1–3 000 kWe. The investment cost for small-scale reciprocat-ing engines is up to EUR 10 000/kWe, and for large-scale engines it is from EUR 1 000/kWe.
• Gas turbines use high-temperature, high-pressure hot gasses to produce electricity and heat. They can produce heat and/or steam as well as electricity. Typical electrical effi-ciency is 20–45 %, while overall efficiencies are 75–85 %. The capacity is in the MW range and therefore generally not used for normal building heating applications, but for hospi-tals, leisure centres, hotels and other such establishments, which are characterised by a steady, year-round demand for domestic hot water supply. Investment cost for large-scale gas turbines is EUR 800–1 500/kWe.
• Combined-cycle gas turbines (CCGTs) with heat recovery can be used at large industrial cen-tres for chemical works, and at oil refineries, industrial drying facilities and food processing plants. Such industrial centres often have a common energy centre where large amounts of both heat and electricity are generated. The heat demand follows the industrial processes and tends to be fairly predictable and continu-ous on a year-round basis. Total efficiencies can be above 90 % and the electrical efficiency can remain at high levels regardless of the heat production level.
• Micro turbines are smaller versions of gas tur-bines, typically 1–250 kW and therefore more suited for different types of buildings like a house or a small commercial building. Such engine-based units currently have relatively low electrical efficiency (from around 10 % for Stirling engines up to 25 % for ICEs). There are several m-CHP units commercially avail-able, for example, Honda make a modified gas engine unit and several European manufactur-ers are making or are about to make a unit based on a Stirling engine. Investment costs are in the range of EUR 1 500–2 100/kWe.
• Fuel cells use an electrochemical process that releases the energy stored in natural gas or H2 fuel to create electricity and heat. Heat is a by-product. Fuel cells that include a fuel reformer can utilise the H2 from any hydrocarbon fuel. Fuel cells offer the advantage of nearly 1-to-1 electricity-to-heat ratios, making them well suited for modern low-energy buildings. More information about fuel cells can be found in Chapter 13.
It is possible to convert electricity-only power stations to CHP. A precondition is that they are located next to suitable heat demand. The actual conversion costs will depend mainly on the type of plant and its age. Most plants are likely to be converted for around 20 % of the equivalent cost of a new plant. In addition, investments in heat infrastructures are needed for the transport of
Figure 16.1: Large steam cycle-based CHP power station feeding district heating (CHPDH)
Note: In the condensing or electricity-only mode, all steam goes to the condenser (11) and the plant has maximum electricity production and the lowest temperature of heat output. In CHP mode, steam is extracted from the turbine via heat exchangers (10) at high temperature and the electricity generation falls slightly.
Source: DONG Energy, 2008.
JRC13_TMAP_08AP14_P5-NS-Print.indd 115 09/04/2014 16:21:46

116
2013 Technology Map of the European Strategic Energy Technology Plan
heat to the demand. Power plants were converted in, for example, Flensburg, Denmark (Prinz, 1994) and Prague, the Czech Republic (Pražská teplá-renská a.s., 2009).
Trigeneration is a variation of cogeneration. The trigeneration plant operates much like a cogen-eration plant, but it makes use of the waste heat for both heating and cooling purposes. Trigeneration plants have the greatest benefit when heat and cooling are continuously need-ed, for example, at data centres and hospitals. In certain cities, such as Paris, Barcelona and Helsinki that have a dense office accommoda-tion with very high year-round cooling loads, conventional electricity-based cooling systems were replaced with centralised cooling systems. Absorption chillers are used to transform the heat to chilled water that is distributed from a central point to multiple buildings. Typically, several large gas engines are used to provide the heat since they are able to deliver heat at high temperatures suitable for efficient absorp-tion chiller operation. Several advantages from trigeneration can be identified:
• it reduces the demand for electricity,
• it extends the options for heat use,
• it evens out the demand for heat over the seasons (DECC, 2013c).
16.3 Market and industry status and potential
The final heat/steam consumption according to the Energy Roadmap 2050 can be found in Table 16.1 (EC, 2011). Industrial heat demand is expected to increase substantially for all sce-narios, whereas households and tertiary sectors are expected to need less heat in the future.
The decarbonisation scenarios of the Energy Roadmap 2050 project that the share of elec-tricity production from CHP will increase from 473 TWh in 2005 to around 1 050 TWh in 2030 and then decline to about 700 TWh in 2050. The growth until 2030 is driven by support poli-cies based on the CHP Directive (now the Energy Efficiency Directive) and the EU ETS. The support from the latter is partially due to the fact that high-efficiency CHP plants are allocated some
emission rights for free. This free allocation of emission rights is reduced with time. DH is expect-ed to decline from its 2000 levels of 190 TWh to 109 TWh in the reference scenario and to 29–52 TWh in the decarbonisation scenarios in 2050. It is also stated that DH systems reduce emissions in the short and medium term when using fossil fuels, but in the longer term the heat source has to be biomass or another suitable low-carbon source in order to reduce GHG emissions sufficiently. This is valid for the CHP plants too.
It should be noted that other scenario studies claim that the Energy Roadmap 2050 signifi-cantly underestimates the potential of CHP and DH. It is claimed that more detailed mapping between heat sources and demands are needed for modelling a more accurate prediction of heat demand (E&P, 2013).
Cogeneration can be used to balance the elec-tricity production from variable renewables. Fluctuations in heat supply can be smoothed out by the use of heat storage technologies. It is relatively easy to store low-temperature heat for up to 48 hours. Low temperature heat is use-ful for many applications, for example, DH and about 30 % of the industrial applications. Storing higher-temperature heat is technically possible but more complex (IEA, 2011).
The Cogeneration Directive (EC, 2004) has been in place since 2004, and has now been replaced by the Energy Efficiency Directive (EC, 2012a). The progress reports on the implementation of cogeneration (JRC, 2012) revealed that the growth of electricity production from CHP has been slower than anticipated in most Member States. Some of the explanations for the slow progress are presented in the following section where barriers are discussed.
Key European players in supplying installations include Siemens and Alstom, which manufac-ture across the range except for the very small sizes. There are several industrial gas engine manufacturers such as Jenbacher, MTU, MAN and Wartsila. Outside Europe, there are several large manufacturers, for example, Caterpillar from the US for engines and smaller turbines, Mitsubishi from Japan and General Electric from the US offer large power stations.
Table 16.1:Current and projected
heat/steam consumption of the reference and the decarbonisation
scenarios of the Energy Roadmap 2050
Source: EC, 2011.
2005 2050
Reference scenario Decarbonisation scenarios
Industry 161 TWh 31 % 880 TWh 76 % 503–733 TWh 81–80 %
Households 240 TWh 46 % 186 TWh 16 % 69–126 TWh 11–13 %
Tertiary 116 TWh 22 % 92 TWh 8 % 52–64 TWh 8–7 %
Total 517 TWh 100 % 1 159 TWh 100 % 627–923 TWh 100 %
JRC13_TMAP_08AP14_P5-NS-Print.indd 116 09/04/2014 16:21:46
117
2013 Technology Map of the European Strategic Energy Technology Plan
16.4 Barriers to large-scale deployment
One fundamental barrier to CHP is that utilities perceive a risk in switching from a business model based on power generation only to one including CHP since it will increase complexity and require higher investments. The simplest model for profit-driven utilities is to focus on a small number of very large and efficient, in electrical terms, power stations. Developing a portfolio of smaller, local plants is more cumbersome to administer and maintain for utilities. Nevertheless, large indus-trial CHP units do not tend to suffer from these kinds of problems, being of sufficient size and sophistication to interact profitably and on equal terms with the large utilities. Another barrier for utilities is that heat supply (e.g. DH) from CHP might reduce sales of gas to customers, and thereby reduce their overall profits.
CHP DH is problematic in a liberalised market environment where, whilst the primary energy and CO2 savings may be significant, there is a risk in constructing a heat grid and then not managing to convince a sufficient share of customers using individual gas or electric heating to switch to DH. Incentives or legislation are needed to ensure that a sufficient amount of current customers make the switch.
Established utility players are more capable of controlling the risks they are exposed to, for example, the price at which they can purchase fuel and sell power due to their large portfolio of end users and their ability to manage sophisticat-ed trading positions. This tends to leave smaller independent generators, often CHP operators, at a disadvantage. This ability to control risks means that the incumbents can obtain long-term funding at better rates than newcomers.
Some other barriers are:
• uncertainty about future heat demand due to industrial restructuring and energy effi-ciency measures in, for example, the resi-dential sector;
• policy uncertainty, in particular as regards the future of support schemes and the functioning of the EU ETS. The low costs of EU ETS emission right allowances make CHP less attractive in relation to power production only.
16.5 RD&D priorities and current initiatives
Cogeneration is a mature technology and the RD&D priorities of large-scale CHP are in general identical to those of advanced fossil fuel power generation technologies, addressed in Chapter 8. In general, if the regulatory and economic envi-ronment is such that CHP of whatever size can succeed, then the existing manufacturers are well
able to technically develop their products. This is essential for the development of better techniques and materials to enable power plants overall to become more efficient, and to be produced and operated at lower cost.
Several European initiatives concern the integra-tion of CHP in the future energy system. The EII on Smart Cities supports cities and regions that take pioneering measures to reduce GHG emissions by 40 % by 2020. To reach this goal, measures to improve energy efficiency, low-carbon technologies, and smart management of supply and demand will be needed. This also includes high efficiency co- or trigeneration and DH and cooling systems (SETIS, 2013). Also, the Smart Cities and Communities Innovation Partnership (EC, 2012b) includes cogen-eration and DH as a means to improve the energy efficiency of cities and communities.
Several projects in FP7 were studying cogeneration and/or its integration in the future energy system. For example, FC-DISTRICT (FC-DISTRICT, 2013) is about optimising and implementing an innova-tive energy production and distribution concept for new ‘energy autonomous’ districts, exploiting decentralised cogeneration coupled with optimised building and district heat storage and distribution network; E-HUB (E-HUB, 2013) concerns an Energy Hub, which is similar to an energy station where energy and information streams are coordinated, and where different forms of energy (heat, electric-ity, chemical, biological) are converted between each other or stored for later use; DIGESPO (DIGESPO, 2013) aims to research and build a modular 1–3 kWe, 3–9 kWth m-CHP system based on innovative CSP and Stirling engine technology; and ARCHER (ARCHER, 2013), which studies the system integration of nuclear cogeneration units coupled to an industrial process.
16.6 References
ARCHER, Archer project, 2013 (http://www.archer-project.eu/) accessed 7 January 2014.
Department of Energy & Climate Change (DECC), Plant selection, 2013a (http://chp.decc.gov.uk/cms/plant-selection-4/) accessed 7 January 2014.
Department of Energy & Climate Change (DECC), Gas engines, 2013b (http://chp.decc.gov.uk/cms/gas-engines-3/) accessed 7 January 2014.
Department of Energy & Climate Change (DECC), Absorption cooling, 2013c (http://chp.decc.gov.uk/cms/absorption-cooling-6/) accessed 7 January 2014.
DIstributed CHP GEneration from small size concentrated Solar Power (DIGESPO), 2013 (http://www.digespo.eu/default.aspx) accessed 7 January 2014.
JRC13_TMAP_08AP14_P5-NS-Print.indd 117 09/04/2014 16:21:46

118
2013 Technology Map of the European Strategic Energy Technology Plan
Dong Energy, The Esbjergvaerket CHP plant, 2008 (http://www.dongenergy.com/SiteCollectionDocuments/business_activities/generation/Esbjergv%C3%A6rket_UK%5B1%5D.pdf) accessed 7 January 2014.
Euroheat & Power (E&P), Heat roadmap Europe 2050 – Second pre-study for the EU27, 2013. ISBN 978-87-91404-48-1
European Commission (EC), Directive 2004/8/EC of the European Parliament and of the Council of 11 February 2004 on the promotion of cogen-eration based on a useful heat demand in the internal energy market and amending Directive 92/42/EEC, 2004.
European Commission (EC), Energy Roadmap 2050 – Impact assessment and scenario analysis, 2011.
European Commission (EC), Directive 2012/27/EU of the European Parliament and of the Council of 25 October 2012 on energy efficiency, amending Directives 2009/125/EC and 2010/30/EU and repealing Directives 2004/8/EC and 2006/32/EC, 2012a.
European Commission (EC), Smart Cities and Communities – European Innovation Partnership, COM(2012) 4701, 2012b.
Energy Hub (E-HUB), 2013 (http://www.e-hub.org) accessed 7 January 2014.
FC-DISTRICT, Project – Summary and Objectives, 2013 (http://fc-district.eu/project.html) accessed 7 January 2014.
International Energy Agency (IEA), Cogeneration and renewables – Solutions for a low-carbon energy future, 2011 (http://www.iea.org/publica-tions/freepublications/publication/name,3980,en.html) accessed 7 January 2014.
Joint Research Centre (JRC), Background Report on Implementing the Cogeneration Directive, EUR 25365 EN, 2012. ISBN 978-92-79-25143-6
Garcia, N.P., Vatopolous, K., Krook Riekkola, A., Perez Lopez, A., Olsen, L., Best available technologies for the heat and cooling market in the European Union, JRC Scientific and Policy Reports, 2012b. doi:10.2790/5813, ISBN 978-92-79-25970-8
Pražská teplárenská a.s., Prague District Heating System. Application for 1st Global District Energy Climate Awards, 2009.
Prinz, H.-J., Geschichte der Stadtwerke Flensburg GmBH. Teil 1 Eleckrizitats-und Fernwarmeversorgung, 1994.
SETIS, European Initiative on Smart Cities, 2013 (http://setis.ec.europa.eu/implementation/tech-nology-roadmap/european-initiative-on-smart-cities) accessed 7 January 2014.
U.S. DOE and EPA, Combined Heat and Power - A Clean Energy Solution, DOE/EE-0779, 2012 (http://www1.eere.energy.gov/manufacturing/dis-tributedenergy/pdfs/chp_clean_energy_solution.pdf) accessed 7 January 2014.
JRC13_TMAP_08AP14_P5-NS-Print.indd 118 09/04/2014 16:21:46

119
17. Energy performance of buildings
17.1 Introduction
Around 38 % of the final energy consumption in Europe is associated with the building sector (see Figure 17.1). Several studies (IPCC, 2007; Fraunhofer-ISI, 2009; WBCSD, 2009; Urge-Vorsatz et al., 2012) have shown that the energy saving potential of this sector is substantial and can bring significant benefits at individual, sectored, national and international levels. For individuals, energy-efficient homes mean improved thermal comfort and indoor air quality, fuel poverty alleviation and more disposable income. For economic sectors, energy efficiency improvements are linked to industrial competitiveness, infrastructure benefits for energy providers, and increased asset values through rental and sales premiums. National gov-ernments can benefit from reduced energy-related public expenditures, more jobs and reduced energy dependency, while at the international level energy efficiency improvements equate to reduced GHG emissions, lower energy prices, improved natural resource management and other socioeconomic benefits (Ryan and Campbell, 2012).
The final energy consumption in the building sector depends significantly on annual weather conditions and should not be compared in a proportional manner with the other energy-consuming sec-tors, whereas the industry and transport sectors depend largely on economic activities.
In line with the European Commission’s objec-tive to move towards a low-carbon economy, an array of European directives (Directives 2002/91/EC, 2006/32/EC, 2009/28/EC, 2010/31/EU and 2012/27/EU) are in place in order to exploit this potential. The Energy Performance of Buildings Directive (EPBD) (Directive 2002/91/EC and recast 2010/31/EU) — concerning both the residen-tial and services sectors — requires Member States to apply minimum energy performance requirements for new and existing buildings and to establish an energy performance certifica-tion scheme, which discloses information about the energy performance of a building when it is constructed, sold or rented. The recast of the Directive 2010/31/EU requires Member States to set cost optimal levels of the energy performance requirements and sets a target of nearly-zero–energy buildings for new constructions, which can be achieved through a combination of energy efficient and renewable energy measures. The Energy Efficiency Directive requires Member States to renovate annually at least 3 % of the total floor area of the building stock owned by their public bodies to meet at least the minimum energy performance requirements (Directive 2010/31/EU), as well as to establish roadmaps for mobilising investment in the refurbishment of their national building stock.
Figure 17.1: Final energy consumption 2011
Source: Eurostat, data extracted on 31 May 2013.
Final Energy Consumption 2011
Residential and Services
Industry and Agriculture
Transport
Not Specified
2013 Technology Map of the European Strategic Energy Technology Plan
33 % 37.5 %
28.2 %
JRC13_TMAP_08AP14_P5-NS-Print.indd 119 09/04/2014 16:21:47

120
2013 Technology Map of the European Strategic Energy Technology Plan
Among all definitions that emerge for buildings in relation to reducing the energy consumption, one may recognise three fundamental approaches:
• One approach is more related to the building in its immediate environment and climate. The importance of the building interface, the envelope, between the in- and outdoor climate is recognised.
• A second approach may be distinguished in buildings that fulfil certain conditions of nearly-zero energy or, specifically, the intension to compensate at annual level the energy con-sumption by producing it preferably by RES.
• A final approach can be seen for smart build-ings where ICT plays an important role. An integrated approach might lead to optimised building design.
A high-energy –performance building will play an important role in the future energy system in balancing the demand and supply of energy at the level of the building, but also at the level of a much wider and more dynamic area both in physical and infrastructure dimensions.
Integration of more variable energy resources and energy consuming technologies in the built environment that request more energy in short periods may require approaches that traditionally are not coped with. Peak demand from heat pumps is considered by electricity producers as a specific problem for grid stability and security of supply.
It has to be stated that a building traditionally does not produce energy and only recently have prod-ucts entered the market that would eventually be considered as energy-producing building construc-tion products. However, one may state that the building sector will play a cornerstone role in the future energy system. All considered approaches have in common that an energy balance is aimed at, at varying timescales, for different technologies and resources. In addition, the dimension of the energy infrastructure plays a role and requests clear definitions of the boundaries for a proper energy performance assessment.
The above framework offers great opportunities for various energy saving measures, and energy efficient and renewable energy technologies to enter the market and be deployed at a large scale in the building sector. These are discussed in more detail in the next section.
17.2 Technological state of the art and anticipated developments
There is a wide range of technologies that can be used to reduce the energy consumption of buildings. The energy consumption of buildings is influenced by several factors, such as geom-etry and orientation of the building, performance of building envelope and efficiency of building installations, as well as usage patterns, manage-ment of the building and occupancy behaviour. The philosophy that supports the reduction of energy consumption in buildings can be followed in three priority steps:
• apply energy saving measures (e.g. improve insulation),
• increase the energy efficiency of building installations,
• use renewable energy resources (solar energy, etc.) to cover remaining energy needs.
There are many technologies that can be used in each of these steps, which in conjunction with optimum design techniques26 means that buildings of high energy performance can become reality.
Building energy performance assessment
In order to qualify an improvement in building energy consumption (e.g. a reduction of the ener-gy consumption for heating, cooling, ventilation, domestic hot water and lighting), a European-wide harmonised methodology for the performance assessment has to be put in place. The present EPBD (Directive 2010/31/EU) gives a frame-work for such an assessment; however, it leaves too many uncertainties in freedom for Member States to implement. A proper energy performance assessment is required for several reasons: firstly, to qualify construction in practice by means of measurement and to compare it to design figures; secondly, to control the improvement of building technologies and building energy performance by comparing it after renovation to previous energy consumption figures; and finally, to offer variable design figures for building design tools in order to support newly designed and renovated buildings.
Energy performance assessment by calculation or measurement should be based on a concise methodology, especially when it concerns prod-ucts such as renewable energy technologies but also energy (on site or nearby) produced, like solar thermal and electrical energy.
26 These may include compact structure, optimum
orientation to minimise summer heat gain and winter
heat loss, usage of passive heating and cooling
techniques, and use of daylight to reduce lighting needs.
JRC13_TMAP_08AP14_P5-NS-Print.indd 120 09/04/2014 16:21:47

121
2013 Technology Map of the European Strategic Energy Technology Plan
Technologies supporting the Energy Performance of Buildings Directive
The building envelope has the greatest impact on the energy consumption of a building. The separation between in- and outdoor climate defines importantly the final energy consump-tion of the building. Therefore, the focus is mainly on the insulation level of the building envelope and secondly on the energy resources that are required to fulfil the needs for space condition-ing, for example, heating, ventilation and cooling.
Consequently, a proper approach is required in the design of new buildings and renovation of exist-ing buildings is of highest importance. Following the philosophy of the Trias Energetica, one may arrive at the accepted approach that gives the highest priority to the building envelope as the most passive part of the energy requirements of the building. Although the building energy sys-tems are second priority, they require the highest operational efficiency to fulfil the requirements of the building’s energy needs.
In order to justify the energy requirements of a building, an appropriate assessment is needed taking into account the different parts of the energy consumption and in some cases the energy production that is contributing to the overall performance assessment. Performance assessment requires measurements and regular monitoring as control instruments.
Building envelope
The building envelope (i.e. building shell) plays a key role in reducing the energy demand of a building. It acts a barrier to the outdoor cli-mate (temperature, solar radiation and wind) conditions during summer/winter months and greatly affects the indoor climate (comfort level, air quality and light) (i.e. the living conditions inside a building). Innovative building materials and components are developed by the construc-tion industry offering challenges for building designers to reduce energy needs as a result of building structure.
• The heat transfer through the building envelope can be reduced by filling cavity walls and apply-ing adequate insulation on solid walls (either internally or externally) as well as roof, floor and facade. Low U-values (high thermal resist-ance) of 0.1–0.15 watts per metres squared kelvin (W/m2K) can be reached using various materials, including fibreglass, polyurethane foam, polystyrene foam, cellulose insulation and rock wool. Thermal bridges — junction points where insulation is discontinuous — are linked with the risk of excess heat loss or condensation and therefore should be avoided as much as possible.
• Double or triple glazing windows with low emissivity means that reduction levels of more than 40 % of energy consumption per m2 of glazed surface can be achieved. Double air-filled glazed windows can reduce thermal transmittance to 2.7 W/m2K, and argon-filled double glazing to 1.1 W/m2K. Argon-filled triple glazing can reach values of 0.7 W/m2K. Films and coatings can also be used on existing glaz-ing that can help minimise solar gains to a lesser extent.
• Shading devices (e.g. movable devices, inter-nal/external blinds, overhangs) can be used to reduce sun penetration in windows and other glass areas, and thereby reduce cooling loads.
• In addition to reducing heat losses through the roof by applying insulation within the roof cavity (attics) or above the structure, cool roofs can also help minimise solar absorption and maximise thermal emission. This can therefore reduce the heat flow into a building and the energy used for cooling it.
• Improved building envelope air tightness, in order to minimise unwanted air leakage, is also important. Air tightness of the building, in combination with heat recovery ventilation sys-tems can obtain levels of 0.4–0.6 air changes per hour (ACH) with an energy efficiency of the installation over 80 %.
Building installations
A variety of different new technologies for heat-ing, cooling, ventilation and other systems can be used in new constructions or in existing buildings upon renovation opportunities, some of which are discussed below. It should be noted that build-ing installations should include a highly efficient generation system, an effective and efficient distribution system, and effective controls on both generation and distribution systems. For example, correctly sized distribution systems, optimised position of generation system and length of pipe-work are all important factors in minimising heat losses.
• Condensing boilers — most commonly gas-fired, although oil-fired condensing boilers also exist — are an efficient heat-generation sys-tem that use an additional heat exchanger to extract extra heat by condensing water vapour from the combustion products. More informa-tion can be found in Chapter 18 on heating and cooling technologies.
• Heat pumps, whose main operating principle is to absorb heat from a cold place and release it to a warmer one, can also be used for space heating and hot water purposes. They transfer heat from the outside (air, water, earth) to
JRC13_TMAP_08AP14_P5-NS-Print.indd 121 09/04/2014 16:21:47

122
2013 Technology Map of the European Strategic Energy Technology Plan
the interior of a building through a system of low-temperature emission. More information can be found in Chapter 19 on heat pumps.
• Solar thermal collectors absorb the incoming solar radiation, converting it into heat. The heat is then carried from the circulating fluid either to the space heating or hot water equipment or to a TES tank for later use.
• HVAC systems provide an air flow at a suf-ficiently warm or cold temperature in order to maintain the desired thermal conditions. Measures such as heat recovery systems can reduce the energy consumption of HVAC sys-tems as they use heat exchangers to recover heat or cold air from the ventilation exhaust and supply it to the incoming fresh air.
• Chillers are larger cooling devices than air conditioners and produce chilled water rather than cooled air for use in large residential and commercial buildings. Compared to typical air conditioners, chillers’ performance can be better by a factor of 3. A chiller can use a liquid via a vapour-compression or absorption refrigeration cycle.
Renewable energy technologies
As mentioned previously, nearly-zero–ener-gy buildings — which according to Directive 2010/31/EU will be obligatory for new construc-tions from 2020 — take into account the impact of renewable energy technologies. The renewable energy technologies can be divided into the fol-lowing categories:
• solar energy (solar electrical, solar thermal, passive solar);
• biomass;
• geothermal and aero-thermal energy.
Sources of renewable energy can also be dis-tinguished as passive (e.g. passive solar heating strategies aiming to reduce the heating load) and active (e.g. solar thermal, solar electrical). As mentioned previously, solar collectors are used to produce hot water for domestic use, biomass products (e.g. wood logs, pellets) are dominant in heating systems, and heat pumps (geo- and aero-thermal energy) are often used in buildings for ground-coupled and air-to-air heat exchange. Roof-top PV installations (solar electrical) can produce electricity to cover the remaining energy needs in a building.
Energy management
Smart technologies entering the built environment range from control automation to smart metering devices for interaction with utilities. Numerous applications for innovation and requested technologies for the built environment offer opportunities to reduce energy consumption and to control the energy demand/supply balance through intelligent management (ICT). The building will be considered as a cornerstone of the future energy system in our society. Proper integration of renewable energy technologies and electrical vehicles in this built environment will lead to a more efficient use of available energy resources.
17.3 Market and industry status and potential
More stringent energy codes, as a result of the EPBD (2002/91/EC, 2010/31/EU), mean that the market can shift its focus to more sustainable construction techniques and materials, building components and designs. As energy codes have adopted a performance-based perspective (as opposed to a prescriptive one, based on indi-vidual measures), integrated solutions and pack-ages can be better promoted in buildings. The building performance can therefore be optimised by taking into consideration the interaction of all building components and systems through a holistic approach. This process would mean that more collaboration between different com-panies and industry actors should be established in order to join forces and offer combined or holis-tic renovation packages. Innovative integrated technologies (ventilated facades and windows, solar chimney and new insulation materials) can also contribute to a further decrease in overall energy consumption.
Figure 17.2: Passive house technologies
Source: Passive House Institute.
JRC13_TMAP_08AP14_P5-NS-Print.indd 122 09/04/2014 16:21:48

123
2013 Technology Map of the European Strategic Energy Technology Plan
In addition to mandatory standards, there are vari-ous voluntary exemplary standards that act as lead-ing market concepts. The Passive House concept, developed in the 1980s, is based on the concept of harnessing solar and internal heat gains in order to reduce heating needs, leading to an annual demand for space heating to 15 kWh/(m²a)27. At present, the building stock consumes annually in the residential sector about 185 kWh/(m²a). A very well insulated, air-tight building envelope along with mechanical ventilation with highly efficient heat recovery are necessary to achieve the designated energy effi-ciency and comfort levels, as shown in Figure 17.2. A similar standard is used in Switzerland (MINERGIE). The BBC-Effinergie standard in France sets a maxi-mum limit of 50 kWhep/(m²a)28 for new buildings and 80 kWhep/(m²a) for existing buildings for the uses of heating, hot water, auxiliary appliances for ventilation and heating, lighting (via natural light) and air conditioning.
Evidence exists that these standards in the mar-ket push the legislative requirements to become more ambitious. For example, the Brussels region of Belgium has mandated that all new buildings will meet the Passivhaus standards from 2015 onwards. The MINERGIE standard has led to rapid spread and a 50 % reduction of energy use for new constructions in the legislative requirements, within a period of a few years29. Similar trends are also observed in France with the low-energy standard of BBC-Effinergie, first introduced in 2007, being mandatory standard for all new buildings constructed from 2012 onwards.
27 Kilowatt-hours per square metre per annum.28 Primary energy per square metre and year.29 Build Up Report Market Trends towards Nearly Zero-
Energy Buildings.
17.4 Barriers to large-scale deployment
New buildings are constructed at a very low rate, which means that the potential linked with the exist-ing building stock needs to be realised through extensive renovation activities. Operational energy in residential or commercial buildings to be reno-vated should be the first aspect to be taken into account when considering the improvement of the energy performance of building stocks. To ensure the efficient life cycle performance of a building, life cycle responsibility and effective commissioning processes are required.
The high investment costs involved, long payback, lack of independent information on energy efficient solutions at all levels and scarce availability of solutions to specific conditions are considered the major barriers to implementation of energy efficiency measures in buildings, as identified by a cost optimal methodology. The split incentive is probably one of the most long-lasting barriers, particularly in countries where there is a high share of rental accommodation in the residential sector.
The development in the construction market, depicted in Figure 17.3, reflects the impact of the economic and financial crisis, the oversupply of construction and reduced confidence. The build-ing energy-related industry is directly affected by this development; however, it will challenge the development and marketing of innovative building products supported by the EPBD.
Figure 17.3: Development of the production index in the construction sector
Source: Eurostat, 2013.
12-2
003
03-2
004
06-2
004
09-2
004
12-2
004
03-2
004
06-2
005
09-2
005
12-2
005
03-2
006
06-2
006
09-2
006
12-2
006
03-2
007
06-2
007
09-2
007
12-2
007
03-2
008
06-2
008
09-2
008
12-2
008
03-2
009
06-2
009
09-2
009
12-2
010
03-2
010
06-2
010
09-2
010
12-2
010
03-2
011
06-2
011
09-2
011
12-2
011
03-2
012
06-2
012
09-2
012
12-2
012
115
110
105
100
95
90
85
80
75
2005 = 100
Production index in the construction sector
Euro 27, seasonally adjusted series
Euro area, seasonally adjusted series
JRC13_TMAP_08AP14_P5-NS-Print.indd 123 09/04/2014 16:21:48

124
2013 Technology Map of the European Strategic Energy Technology Plan
Two important energy directives, the recast of the EPBD and the new Energy, end-use Efficiency and Energy Services Directive (EESD), should give a new impetus for increasing energy savings and energy efficiency in order to reach the targets set by the EU for 2020. At present, a 9 % sav-ing is expected, well below the target of 20 %. Problems with the implementation of the direc-tives in national regulations (and in relation to European standards) are seen as an additional barrier. Clear definitions of boundaries for energy performance assessment are required in relation to an energy infrastructure, an economic evalu-ation for private assessment or market develop-ment. First of all, the expectations of the EPBD on single building, as has been presented in the recast-EPBD, might need to be adapted for a cluster of buildings or whole urban areas.
Methodologies for building design and simula-tion purposes will have to be adapted towards the requirements as defined in the directives and, consequently, as being implemented by national regulations. In particular, addressing the lack of sufficient knowledge on occupancy behaviour will be crucial in a future low-energy system. Energy consumption and optimising the use of it will be more linked to people’s locations: at home (residential), moving (transport) or at work (non-residential, office, school, etc.), their subsequent activities at that location and their related behaviours.
Hesitant investment in the implementation of energy efficient measures is also considered as a barrier. Confidence has to return in the financial and economic markets to stimulate the construc-tion industry and, therewith, the investment in energy-related markets.
17.5 RD&D priorities and current initiatives
A number of roadmaps are developed by gov-ernmental organisations, including the European Commission, industry associations and organi-sations such as the IEA, giving insight into their specific strategies on technologies and targets. The ‘EC - Energy Roadmap 2050’, the Eurima’s ‘Renovation Tracks for Europe up to 2050’ and the IEA ‘Technology Roadmap – Energy-efficient Buildings’ are just a few examples of the many Roadmap 2050 reports that are available.
Major renovation is seen as an important option to reduce energy consumption. The integration of renewable energy technologies in the built environment is a valuable option to support the reduction of energy consumption and in particular the reduction of GHG emissions.
The requirement of nearly-zero–energy build-ings from 2018 to 2020, as mentioned in the EPBD, will need the development of a new design approach, based more on energy flows in buildings. The trend for energy consumption in buildings is a decrease of thermal energy for space conditioning and an increase of electricity for installations and appliances. A much more design-based dynamic methodology (calculation tools) and test installations for innovative and energy-complex building elements are required to support building designers.
Storage is considered as an important technologi-cal option to reduce overall energy consumption in buildings. Major renovation of buildings and new building design have to take into account the impact of thermal mass. Dynamic evaluation and simulation models are required to carefully study the impact on the overall energy balance of a building within the energy system, ranging from an hourly/daily up to a seasonal/annual time base. Opportunities for distributed elec-tricity storage are innovative technologies, such as batteries, compressed air storage, TES and vehicle-to-grid, and will compete in this mar-ket. Benefits of electric storage installations are improved reliability and power quality, meeting peak demand, reduced need for added generation capacity and reduction of CO2 emissions. Storage is particularly applicable to variable solar and wind power installations.
Designers and architects should become acquainted with these new technologies in order to find new and low-energy buildings in our future society. Development programmes based on awareness, as well as technological knowledge, should be integrated in academic programmes.
The JRC-IET is supporting the European legisla-tion (CEN) by assessing technical requirements for standardisation in relation to the energy perfor-mance of buildings. Under review at present are the energy standards relevant for the EPBD (2010/31/EU). A holistic calculation method for final and pri-mary energy consumption is under development at CEN. This process includes harmonisation of climate data and overall energy calculation methodology.
Among other topics for harmonisation are the following:
• assessment of solar yield for solar instal-lations, energy produced by PV and solar thermal collectors;
• calculation and simulation methods for low-energy buildings, considering also passive and solar gain and the application of dynamic calculation methods.
JRC13_TMAP_08AP14_P5-NS-Print.indd 124 09/04/2014 16:21:48

125
2013 Technology Map of the European Strategic Energy Technology Plan
17.6 References
Energy Performance of Buildings Directive-Concerted Action (EPBD-CA), Implementing the EPBD – Featuring Country Reports 2012, European Commission, 2013. ISBN 978-972-8646-27-1
European Commission (EC), Energy Roadmap 2050, Publications Office of the European Union, 2012. ISBN 978-92-79-21798-2
European Insulation Manufacturers Association (Eurima), Renovation Tracks for Europe up to 2050, European Insulation Manufacturers Association, 2012.
European Union (EU), Directive 2002/91/EC of the European Parliament and of the Council of 16 December 2002 on the energy performance of buildings.
European Union (EU), Directive 2006/32/EC of the European Parliament and of the Council of 5 April 2006 on energy end-use efficiency and energy services and repealing Council Directive 93/76/EEC.
European Union (EU), Directive 2009/28/EC of the European Parliament and of the Council of 23 April 2009 on the promotion of the use of energy from renewable sources and amending and subsequently repealing Directives 2001/77/EC and 2003/30/EC.
European Union (EU), Directive 2010/31/EU of the European Parliament and of the Council of 19 May 2010 on the energy performance of buildings.
European Union (EU), Directive 2012/27/EU of the European Parliament and of the Council of 25 October 2012 on energy efficiency, amending Directives 2009/125/EC and 2010/30/EU and repealing Directives 2004/8/EC and 2006/32/EC.
EUROSTAT, An analysis of building construc-tion based on building permits statistics, 4-19022013-AP-EN, 2013.
Fraunhofer-ISI, Study on the Energy Savings Potentials in EU Member States, Candidate Countries and EEA Countries - Final Report, European Commission, 2009.
International Energy Agency (IEA), Technology Roadmap – Energy-efficient Buildings: Heating and Cooling Equipment, 2011.
Ryan, L. & Campbell, N., Spreading the net: The multiple benefits of energy efficiency improve-ments, International Energy Agency, Paris, 2012.
Urge-Vorsatz, D., et al., Best Practice Policies for Low Energy and Carbon Buildings. A Scenario Analysis, Central European University (CEU) and Global Buildings Performance Network (GBPN), 2012.
World Business Council for Sustainable Development (WBCSD), Energy Efficiency in Buildings - Transforming the Market, 2009.
JRC13_TMAP_08AP14_P5-NS-Print.indd 125 09/04/2014 16:21:48

126
18. Heating and cooling technologies
18.1 Introduction
Almost 50 % of total final energy consumption in Europe is used in heating and cooling applications. In 2007, heat accounted for 86 % of the final ener-gy consumption in households, 76 % in commerce, services and agriculture, and 55 % in industry30 (Eurostat). Although energy demand for space heating is expected to decline, energy demand for space cooling has continued to increase steadily in both the residential and services sub-sectors over the last decade. Furthermore, the use of DHC is also expected to grow and could play an important role in reaching the EU’s 2020 goals. Current heating demands are mainly covered by fossil fuels making use of conventional technology and cooling demands by individual electric chillers.
There still remains a large potential to increase the use of renewable sources for heating and cooling, in particular biomass, solar and geother-mal energy, which can be used as direct sources of heat. The EREC has estimated that renewable heating and cooling will almost reach a 30 % share of total heat consumption by 2020 and more than 50 % of the EU heat demand by 2030. The need to further increase the use of renew-able energy for heating and cooling is clearly stated in the SET-Plan as part of the European Commission’s measures to accelerate the deploy-ment of low-carbon energy technologies, that is, the RED 2009/28/EC and the European EPBD.
In addition to the use of renewable sources, overall heat demand could also be considerably reduced if energy efficiency measures are increasingly applied in the insulation of the building envelope, the dis-tribution of energy, heating and cooling equipment, and the conversion ratio of different technologies. In the building sector, reductions in the space heating demand could account for 25 % of potential energy savings in 2050 and improvements in water heating and space cooling systems could together account for an additional 24 % in savings (IEA, 2013).
30 Although district heating and cooling will be mentioned,
technology and heat demands in the industrial sector
will not be specifically covered in this chapter.
18.2 Technological state of the art and anticipated developments
The main factors that influence the selection and uptake of heating and cooling technologies include regional climate conditions, availabil-ity and cost of fossil fuel and local renewable resources, proximity to sources of waste heat, installation and maintenance costs. In 2009, almost 70 % of the heat consumed by the residential and services sectors was used for space heating and about 14 % for water heat-ing (Pardo et al., 2012). Further, nearly 72 % of energy consumed for space heating in Europe in 2010 came from fossil fuels used in traditional heating technologies.
Conventional fossil fuel-based furnaces and boilers with associated high CO, NOx and CH4 emissions still dominate the European heating market. While the efficiency of a typical non-condensing boiler or furnace ranges from 70 to 84 %31, condensing boilers32 and furnaces, which use the latent heat of water to increase the system efficiency, typically have efficiencies above 90 %. A decline in the use of oil boilers is expected, which most likely will be replaced by alternative heating technologies and a strong presence of gas boilers33.
On the other hand, RES are able to supply heat under different conditions. Shallow geothermal is best suited for temperatures up to 50 °C, and solar thermal up to about 100 °C (with the excep-tion of concentrating solar, which can reach very high temperatures). Deep geothermal heat can supply temperatures in the range of 50–150 °C depending on local conditions, and biomass can supply heat at any temperature below the com-bustion temperature of the feedstock.
31 Old boilers and furnaces can have efficiencies as low
as 60 %.32 Natural gas is the most common fuel used with
condensing boilers, but they can also operate using
fuel oil or liquefied petroleum gas.33 In 2004, the European central heating sector using
gas-fired systems represented a market share of
79 %; less than 10 % were condensing boilers, which
are considered to be the best available technology.
2013 Technology Map of the European Strategic Energy Technology Plan
JRC13_TMAP_08AP14_P5-NS-Print.indd 126 09/04/2014 16:21:49

127
2013 Technology Map of the European Strategic Energy Technology Plan
Biomass34 currently covers more than 50 % of total renewable energy contribution to the heat-ing demand in Europe. It is extensively used in northern and Nordic climates, where it is often used as a primary or secondary way of heating homes. In 2008, 40 % of total heat demand in Sweden was supplied by biomass (IEA, 2013). The use of biomass for heat in the EU35 is expected to increase to 4 600 PJ in 2020, 6 280 PJ in 2030 and 7 327 PJ in 2050 (estimations based on RHC, 2010) It should be mentioned that the use of biomass to produce heat instead of fossil fuels could reduce GHG emissions by 370 Mt GHG in 2020, that is, 7 % of the 2005 emissions (RHC, 2010). Biomass conversion technologies include small-scale stoves for room heating with low operating costs and medium-large–scale boilers to be used in residences and DHC36 installations.
Solar heating and cooling comprises a wide range of technologies, from mature domestic hot water heaters to new technologies, such as solar ther-mally driven cooling. Nowadays, the majority of applications for solar thermal systems use roof-top glazed and unglazed collectors. The choice of solar thermal collector generally depends on the application and the required temperature. In the building sector, non-concentrating flat-plate and evacuated-tube collectors are most commonly used for space and water heating. The use of solar energy for heat supply is mostly limited to low temperatures, such as hot water for sanitar-ian use. It should be noted that solar thermal combination systems, in which solar technology is combined with an auxiliary heating or cooling
34 Biomass includes a wide variety of sources such as
wood chips, residues from forests, agricultural crops,
municipal solid waste and organic waste generated in
industrial processes.35 In 2007, the European total use of biomass for heat
was 2 244 PJ.36 Large-scale units can be combined with power
cycles for combined production of heat and power.
Novel technologies like organic Rankine cycle and
gasification also offer the possibility for efficient
cogeneration.
source37, can be used to increase heating and cooling efficiency in buildings and to supply the demand that is not achieved by the solar ther-mal system.
In addition to the production of electricity, groundwater and ground temperatures38 found at depths up to 400 m39 can also be used for heating and cooling applications. Geothermal resources are classified based on enthalpy val-ues. Low-enthalpy fields (temperature < 100 °C) are directly exploited for heat applications such as space and water heating. A further distinc-tion is made for the heat sector according to whether the geothermal energy is used directly (i.e. low- and medium-temperature applications) or indirectly (very-low–temperature applications or heat pumps40). The economic feasibility of direct geothermal heat exploitation is genuinely limited by the distance to the end consumer and the configuration and type of drilling required41. Various levels of technological maturity exist, depending on the conversion process.
Conventional cooling technologies include electri-cal air conditioners and chillers based on a vapour compression refrigeration cycle. There exist dif-ferent configurations that include ducted/ductless units and packaged/split units42. Further, chillers can be water-cooled units in which water is cooled by using a secondary refrigerant such as a brine or glycol, or air-cooled units, in which ambient air and fans are used to cool refrigerant coils. Units are frequently oversized and significant energy efficiency gain is still possible through system
37 Including high-efficiency biomass, condensing gas
boiler or heat pump.38 Temperature values are usually up to 25 °C.39 Heat extracted at higher depths with temperatures
between 25 and 150 °C is usually used for district
heating, industry and agriculture.40 Heat pump technology is described in detail in
Chapter 19.41 Deep (up to 250 m) vertical drillings are more
expensive than horizontal configurations.42 Single-space packaged unit conditioners are the most
common form of air conditioning in Europe, especially
in the residential sub-sector.
Figure 18.1: European heating potential by renewable resources
Source: RHC, 2011.
27 000
PJ
22 000
17 000
12 000
7 000
2 000
2006/2007 2020 2030 2050
solar thermal
aero/hydro HP
geothermal HP
geothermal deep
biomass heat
JRC13_TMAP_08AP14_P5-NS-Print.indd 127 09/04/2014 16:21:49

128
2013 Technology Map of the European Strategic Energy Technology Plan
improvements and optimal design. It should be noted that in large facilities, chillers can account for as much as 35 % of a building’s electric energy use, particularly if primarily operated at partial load (JRC, 2012b; IRENA, 2013).
Advances in cooling technologies include improvements in centrifugal chillers, which in hot regions where year-round cooling is required can achieve an annual coefficient of perfor-mance above 1043 (JRC, 2012b; IRENA, 2013). On the other hand, high-efficiency absorp-tion chillers, which use mixtures of water and ammonia (or lithium bromide) with natural gas or cogeneration heat sources, could also replace traditional electric chillers in buildings with a high demand for cooling and/or heating and air conditioning. In buildings with high thermal or electric demand loads, absorption chillers can shift cooling from an electric load to a thermal load, and vice-versa, thereby increasing efficien-cies based on available energy.
Solar cooling is an emerging and attractive tech-nology with zero or very low GHG emissions. Apart from ordinary air conditioning systems driven by solar electricity from PV units, solar thermal cool-ing can provide cooling needs through a thermally driven heat pump cycle. Since cooling demand usually increases with solar thermal radiation intensity, thermally driven solar-cooling systems could contribute to prevent peak power demands associated with cooling. Other potential energy sources for cooling applications include waste heat from industrial processes and power generation.
DHC enables the use of surplus heat from elec-tricity production, industry, waste incineration and renewable sources to provide heat to pro-cesses and comfort to buildings. Moreover, district cooling networks allow using lakes, sea, river water, ice or snow directly for cooling. The cool-ing potential of these sources can be boosted with heat pumps. An alternative way to provide cooling is by combining DH networks and sorp-tion chilling. DHC technology is extensively used in some European countries, including Denmark, the Netherlands, Norway, Sweden and the UK. More than 50 % of heat demand in Denmark44 is supplied by DH. On average, 86 % of heat for DH in Europe is derived from a combination of recycled and renewable heat and it is respon-sible for avoiding at least 113 Mt of CO2 emis-sions per year. This corresponds to 2.6 % of total European CO2 emissions. It is estimated that due to its highly energy-efficient performance, district
43 Best available technology.44 Almost 50 % of the production of DH comes from
centralised CHP. In Copenhagen alone, the annual
geothermal district heating production was about
380 TJ in 2010.
cooling could reduce CO2 emissions by as much as 75 % as compared to conventional electrical chillers (Ecoheatcool).
DHC technology based on industrial boilers and electrical heaters usually involves the use of fossil fuels. Heat pump technology, which is considered a low-carbon technology especially if the electricity input is provided from a renew-able source, can also be used in DHC systems. Although electrical heaters present a high elec-tricity/heat conversion rate, it should be taken into account that most electricity is still produced from fossil fuels and characterised by low con-version rates (about 35 %). Biomass DH is of growing importance in Austria, Scandinavia and other countries with a large heat demand in the residential and services sectors. Large-scale bio-mass combustion plants are a mature technology; in many cases, the heat generated is competitive with that produced from fossil fuels. Bioenergy heat can also be produced in cogeneration power plants, achieving overall efficiencies of around 70 to 90 % (IEA, 2012b; DHC+TP, 2009). Moreover, solar-assisted DH systems are used to provide low-temperature heat (below 100 ℃) on a diur-nal or seasonal basis. Such technologies include large-module collectors mounted on roofs or on the ground with different sources of heat stor-age, including water-filled steel tanks used for diurnal storage. Seasonal storage is also possible using large pits in the ground, boreholes or aqui-fers. Several technologies are already applied in central and northern Europe, including Denmark, Germany, Austria and Sweden. In Europe, there are approximately 175 large-scale solar ther-mal plants above 350 kWth, with a total installed capacity of nearly 320 MWth in operation (JRC, 2012a; RHC, 2012).
18.3 Market and industry status and potential
The European heating and cooling market is mainly dominated by conventional technology and it comprises international large corpora-tions45, which dominate the energy and heating equipment supply, and small and medium-size companies that sell biomass and/or operate DHC systems. Although overall sales of gas and oil boilers have been decreasing in recent years, gas-fired systems still account for nearly 50 % of the total energy used in heating. Nonetheless, the renewable heating and cooling market is forecasted to grow rapidly, reaching 21 % and 45 % share of total final energy consumption in 2030 and 2050, respectively. The economic
45 Major equipment suppliers in the European market are
Baxi, BBT Thermotechnik, Daikin Europe N.V., Danfoss,
CIAT, Mitsubishi Electric, MTS, Nibe Energy Systems,
Siemens, Systemair AB and Vaillant.
JRC13_TMAP_08AP14_P5-NS-Print.indd 128 09/04/2014 16:21:49

129
2013 Technology Map of the European Strategic Energy Technology Plan
feasibility of systems using renewable energy strongly relies on resource availability, location and stage of development of the technology. There exist mature renewable heating and cool-ing technologies based on solar, biomass and geothermal resources. Other technologies are close to mass-market deployment (small-scale geothermal heat pumps46) or under development (solar-cooling technologies).
By the end of 2010, the European solar ther-mal collector capacity in operation was 36 GWth, prevailing the installation of evacuated collec-tors and glazed flat panels. In 2007, the average cost of a solar thermal system was EUR 1 100/kWth for pumped systems installed in central and northern Europe, and EUR 600/kWth for thermo-siphon systems in southern Europe (EC, 2007). Should the solar thermal capacity in Europe con-tinue expanding, costs for installed small-scale forced circulation units are expected to decrease to EUR 400/kWth
47 by 2030 in central Europe (EC, 2007).
The potential of bioenergy technologies to fur-ther penetrate the heating and cooling market mainly depends on the feedstock sustainability, rate of progress of biomass-related technology and the competitiveness of different commodi-ties produced from biomass. The EU consumes 4 100 PJ of biomass48. Between 2008 and 2010, the production of wood pellets in Europe increased by 20.5 %49 and the consumption increased by 43.5 %. Heat from bioenergy could provide 6 110 TWh of final industrial energy and 6 667 TWh in buildings in 2050 (IEA, 2013).
DHC systems are capital-intense, long-term investments and represented a 10 % market share in 2012 (EU, 2012). Further improvements in DHC systems will allow reaching an average share of at least 25 % of renewable energies in DH with an associated decrease of 2.14 EJ per year in primary energy consumption and the reduc-tion of 400 Mt of CO2 emissions (EHPA, 2012). Nevertheless, the market penetration of cooling machines for district cooling is still low, result-ing in a small return on experience. Investment costs for direct-heat DH systems range from EUR 300–1 000/kW. Geothermal heat pumps cost approximately EUR 2 000/kW of capacity, with
46 Due to their current high costs, strong supporting
policies will be needed to achieve a high market
uptake, which also depends on the prices for fossil
fuels.47 Current cost is EUR 400/kWth (2007 data).48 About one third is used to produce electricity,
cogeneration and district heating plants, while the rest
is consumed in the private, commercial and industrial
sectors for heating purposes.49 9.2 Mt in 2010.
average capacities of 5–20 kWth. Average system availability for geothermal energy applications is around 95 %. Considerable effort is directed at the identification of new markets in eastern Europe.
DH systems in Europe currently supply more than 9 % of total European heat demands with an annual turnover of EUR 19.5 billion and 2 EJ (556 TWh) heat sales. Market penetration of DH is unevenly distributed; the northern, central and eastern European countries have high penetra-tion of DH (as high as 70 %), while Germany and Poland have the largest total amount of DH delivery. In cities like Copenhagen, Helsinki, Riga, Vilnius and Warsaw, as much as 90 % of residential heat demands are satisfied by DH.
District cooling in Europe has a market share of about 2 % of the total cooling market, cor-responding to approximately 3 TWh cooling. Although this market has emerged quite recently, it is growing fast; for instance, Sweden is expected to reach a 25 % district cooling market share for commercial and institutional buildings in 2–3 years. Cities that have reached or are on the way to reaching 50 % district cooling shares include Amsterdam, Barcelona, Copenhagen, Helsinki, Paris, Stockholm and Vienna (DHC+TP, 2009). Further improvements and deployment of DHC systems would allow reaching an average share of at least 25 % of renewable energies in DH (i.e. decreasing primary energy consumption by 2 140 PJ per year50 and avoiding an additional 400 Mt of CO2
51 (DHC+TP, 2009).
Finally, EU-27 geothermal DH installed capacity is slightly over 1 500 MWth
52. Main geothermal DH markets are in France, Germany, Hungary, Iceland and Turkey. Future markets comprise large systems in Germany, France and the UK, and small and large systems for heating and cooling in the Mediterranean (EGEC).
18.4 Barriers to large-scale deployment
In order to increase the share of renewable sources in the heating and cooling sector and to implement energy efficiency initiatives, measures such as financial incentives, stronger regulations support-ing the use of renewable sources and an increase in consumer awareness have been identified as current barriers to large-scale deployment.
50 2.6 % of entire European annual primary energy
demand.51 9.3 % of all European CO2 emissions.52 In 2007, the installed heating and cooling capacity,
including geothermal heat pumps, was about
10 000 MWth in the EU-27.
JRC13_TMAP_08AP14_P5-NS-Print.indd 129 09/04/2014 16:21:49

130
2013 Technology Map of the European Strategic Energy Technology Plan
Solar thermal heat production already has a strong global capacity and could be significantly further expanded given the right policy discus-sions and incentives. Major barriers to a greater uptake of solar heating and cooling technology, in particular in the building sector, are high capital costs and long payback time. Furthermore, the cost-competitive deployment of solar heating and cooling is hindered by technical bottlenecks. Heat storage is considered the most important techni-cal bottleneck for the further expansion of the solar thermal market. Other major bottlenecks include the unavailability of commercialised cool-ing machines for solar-cooling applications.
Large-scale deployment of geothermal heating and cooling technologies could be prevented by lack of acceptance and negative impacts of geothermal exploitation. This technology is still subjected to high installation and, in some cases, maintenance costs. In order to achieve a large deployment, geothermal systems have to be able to compete with other clean-energy technologies. There still remains a lack of specific machinery and equipment as well as insufficient skilled personnel to develop and install geothermal technologies.
Should DHC have a contribution to the decar-bonisation of the European energy system, a more favourable financial environment with fast returns on investments will be needed (EC, 2011b; DHC+TP, 2009). It should also be pointed out that a common barrier to large-scale deployment of non-conventional heating and cooling technolo-gies is the higher capital costs usually associated with renewable energy technologies compared to conventional energy technologies.
18.5 RD&D priorities and current initiatives
In order to play a significant role in the achieve-ment of European energy and emissions targets, further investment in R&D of advanced heating and cooling technologies is needed. Additionally, improved statistics and more detailed disaggre-gated data are also required to have a better understanding of the European heating and, in particular, cooling sectors. Considerable efficiency improvements are still needed and can be achieved through the further optimisation and integration of already market-viable, high-efficiency convention-al technologies such as condensing boilers, electric resistance systems, advanced heat pumps and solar thermal technologies. Further development efforts should also be focused on the replacement of traditional biomass units with high-efficiency fireplaces and stoves.
In the next decade, research and demonstration efforts are needed in order to guarantee that geo-thermal systems are commercially available by 2030. Priorities are the development of techniques for resource assessment and development of more
competitive drilling technology. There is a need for the development of technology able to minimise the overall environmental impacts of geothermal exploitation and for characterisation of hot rocks resources and potentials. Finally, novel ground-coupling technologies are needed for geothermal heating and cooling in the residential sector.
Regarding solar thermal technology, R&D is needed to enable the commercialisation of market-viable products in colder regions requiring freeze protec-tion systems. Furthermore, advanced materials also need to be developed, including new poly-meric materials and glasses with improved optical properties, as well as novel materials with bet-ter insulation properties and better heat-transfer capabilities at high temperature (up to 250 °C). Regarding the storage of heat, additional research is needed on high-density storage media, such as thermo-chemical and phase-change materials able to meet the requirements and to store heat for long periods of time.
Technology to provide cooling services from renew-able resources and the integration with heating systems is still largely in the research and demon-stration stage. The efficiency and flexibility of cool-ing generation technologies have to be increased (i.e. improved chillers, heat pumps and low-cost concentrating collectors for solar cooling). Further effort is also needed to develop free-cooling and hybrid cooling demonstration projects. In addition, technical improvements in existing cooling tech-nologies should include variable-speed fans that lower electrical draw, high-efficiency motors that operate the fan using less electricity, improved heat exchangers and more efficient compressors (JRC, 2012b; EC, 2012; IEA, 2007, 2012).
DHC networks must evolve to provide more flex-ible solutions. Crucial to this are the development of low-temperature networks, the integration of innovative thermal storage, and interaction with other energy networks (electricity and gas). Cost effectiveness must be enhanced and cooling gen-eration technologies must be improved. Finally, transfer of know-how and optimisation of policies are essential to facilitate market penetration.
18.6 References
DHC+Technology Platform (TP), District heating and cooling. A vision towards 2020-2030-2050, 2009.
Ecoheatcool Project Results (http://www.euroheat.org/ecoheatcool) accessed 7 January 2014.
European Commission (EC), A European Strategic Energy Technology Plan (SET-Plan), Communication COM(2007) 723, 2007.
JRC13_TMAP_08AP14_P5-NS-Print.indd 130 09/04/2014 16:21:50

131
2013 Technology Map of the European Strategic Energy Technology Plan
European Commission (EC), Investing in the Development of Low Carbon Technologies (SET-Plan), Communication COM(2009)519, 2009.
European Commission (EC), A Roadmap for mov-ing to a competitive low carbon economy in 2050, Communication COM(2011)112, 2011a.
European Commission (EC), Energy Roadmap 2050, Communication COM(2011) 885, 2011b.
European Commission (EC), Research Priorities for Renewable Energy Technology by 2020 and Beyond, 2012.
European Commission (EC), Energy Technologies and Innovation, Communication COM(2013)253, 2013a.
European Commission (EC), Renewable Energy Progress Report, Communication COM(2013)175, 2013b.
European Environmental Agency (EEA) (http://www.eea.europa.eu/) accessed 7 January 2014.
European Geothermal Energy Council (EGEC) (http://egec.info) accessed 7 January 2014.
European Heat Pump Association (EHPA), Outlook 2012 - European Heat Pumps Statistics, 2012.
European Renewable Energy Council (EREC) (http://www.erec.org/) accessed 7 January 2014.
European Technology Platform on Renewable Heating and Cooling (RHC), Biomass for heating and cooling-vision document, 2010.
European Technology Platform on Renewable Heating and Cooling (RHC), 2020-2030-2050 Common vision for the Renewable Heating and Cooling Sector in Europe, 2011.
European Technology Platform on Renewable Heating and Cooling (RHC), Strategic Research and Innovation Agenda for Renewable Heating and Cooling, 2013.
European Union (EU) Handbook, District heating markets, Prepared by the cross-border bioenergy Working group on DH technologies, Intelligent Energy Europe, 2012.
European Union (EU), Directive 2002/91/EC of the European Parliament and of the Council of 16 December 2002 on the energy performance of buildings.
European Union (EU), Directive 2004/8/EC of the European Parliament and of the Council of 11 February 2004 on the promotion of cogeneration based on a useful heat demand in the internal energy market.
European Union (EU), Directive 2009/28/EC of the European Parliament and of the Council of 23 April 2009 on the promotion of the use of energy from renewable sources.
European Union (EU), Directive 2010/31/EU of the European Parliament and of the Council of 19 May 2010 on the energy performance of buildings.
Eurostat (http://epp.eurostat.ec.europa.eu/portal/page/portal/eurostat/home/) accessed 7 January 2014.
Intergovernmental Panel on Climate Change (IPCC), Renewable Energy Sources and Climate Change Mitigation, Special report, 2012.
International Energy Agency (IEA), Renewables for Heating and Cooling (Untapped potential), 2007.
International Energy Agency (IEA), Technology Roadmap. Solar Heating and Cooling, 2012a.
International Energy Agency (IEA), Technology Roadmap. Bioenergy for Heat and Power, 2012b.
International Energy Agency (IEA), Transition to Sustainable Buildings, Strategies and Opportunities to 2050, 2013.
Joint Research Centre (JRC), Best Available technologies for the Heat and Cooling Market in the European Union, Scientific and Policy Reports, 2012a.
Joint Research Centre (JRC), Heat and cooling Demand and Market Perspective, Scientific and Policy Reports, 2012b
Pardo, N., Vatopoulos, K., Krook Riekkola, A., Perez, A., ‘Methodology to Estimate the Energy Flows of the European Union Heating and Cooling Market’, Energy, Vol. 52, No 1, 2012, pp. 339-352.
JRC13_TMAP_08AP14_P5-NS-Print.indd 131 09/04/2014 16:21:50

132
19. Heat pumps
19.1 Introduction
Total heating and cooling energy used by the industrial, commercial and domestic sectors con-stitutes close to 50 % of the total final energy demand in Europe. Yet, heating demand is mainly met by fossil fuels and cooling demand by indi-vidual electric chillers. Space and water heating constitutes the major share of energy consump-tion in the residential area53. There clearly exists a major potential to increase the use of renewable sources for heating and cooling.
Aero-thermal, geothermal, hydrothermal and solar energy can be primary sources of heat energy, which can also be produced by nuclear processes and combustion of fossil fuels, bio-mass and waste. In addition, electric energy can also be converted into heat by using electric heat-ers and heat pumps.
Heat pumps are a versatile and mature tech-nology that has been identified as one of the technologies that could contribute to meeting the European Commission’s energy targets regarding final demand of energy, increased use of renewable energy and reduction of GHG emissions. They can be used to provide space cooling, space heating and hot water, with the possibility of providing all three services from one integrated unit.
Besides their use in hybrid systems (i.e. in con-junction with alternative renewable and/or con-ventional heating and cooling systems), heat pumps can also contribute to storing surplus elec-tricity in the form of thermal energy, to integrate and optimise the performance of different energy resources in the electric grid. It should be noted that synergies between heat pump technology on the demand side and the decarbonisation on the supply side could make a significant contribution to the reduction of CO2 emissions.
53 Heat demand for space heating is expected to
decrease by 9 % in the EU in 2050 (EEA).
19.2 Technological state of the art and anticipated developments
Heat pumps are based on a mature technology that transfers thermal energy from a heat source to a heat sink using a compression cycle that takes advantage of temperature gradients. They can be driven by electricity or by thermal energy. The main difference between conventional heat pump technology and thermally activated heat pumps is their approach towards compression: compression heat pumps employ a mechani-cal compressor (driven by an electric motor or combustion engine), while thermally activated heat pumps achieve compression by thermal means. Thermally driven heat pumps can further be differentiated into absorption, which use high-temperature heat for the process, and adsorption heat pumps, which incorporate low-temperature energy and convert it to a higher temperature. One of the advantages of using thermally acti-vated heat pumps in the service and residential sectors is their high output temperature and sim-ple integration with existing heating systems and infrastructure (i.e. solar energy systems, condensing boilers, electrical heat pumps and conventional radiators).
It should also be mentioned that electrically driv-en heat pumps have higher efficiencies compared to absorption heat pumps and that typically the investment costs per produced heat output are lower for absorption heat pumps than for the mechanically driven heat pumps. Moreover, and in the case of optimally controlled, electric heat pumps could operate on the grid in response to electricity prices and contribute to work at optimum load.
Different working fluids are available, all having advantages and disadvantages. Choosing the correct working fluid will depend on the specific application and no single fluid is preferred in all applications. Fluorinated gases (F-gases), which have a high global warming potential (GWP), are still widely used in air conditioning and heat pump equipment. Furthermore, CO2 and ammonia are currently the two main refrigerants used for high-capacity heat pumps. Heat pumps using CO2 can be used for applications with temperatures
2013 Technology Map of the European Strategic Energy Technology Plan
JRC13_TMAP_08AP14_P5-NS-Print.indd 132 09/04/2014 16:21:50

133
2013 Technology Map of the European Strategic Energy Technology Plan
up to 90 °C whereas new ammonia systems are capable of reaching temperatures up to 100 °C. In absorption systems, which use liquids or salt to absorb vapour, the most common combinations of working fluid and absorbent are water/lithium bromide and ammonia/water. Even in winter, heat can be extracted from outside air, water and ground as long as the working refrigerant in the heat pump is correctly selected.
There exists a direct relation between the tem-perature of the energy source and the capacity provided by the heat pump (i.e. the lower the source temperature, the lower the capacity54). Capacity-modulating units overcome this limita-tion as they can change the compressor speed and thus the capacity provided. While this leads to a lower efficiency at full-load operation, it results in superior performance under part-load conditions. They constitute an attractive technol-ogy in countries with mild climate conditions as well as in the integration of different heat sources into hybrid systems.
The efficiency of heat pumps depends on their technical specifications, mode of operation (increase/decrease temperature), selection of (partial/full) load mode, and differences between indoor and outdoor temperatures (IEA, 2007; JRC, 2012b). Heat pump performances and efficiencies have increased considerably over the past 30 years. Improvements in per-formance have been achieved by implementing new technologies and components (compres-sors, pumps, fans, heat exchangers, expansion valves and with the use of inverters) as well as by a better system integration.
Heat pump efficiency is characterised by the coef-ficient of performance (COP), which is defined as the ratio between energy delivered and energy consumed, and depends strongly on the water temperature adjacent to the condenser, humidity
54 A heat pump designed for (average) temperatures
of – 16 °C will be over-dimensioned at warmer
temperatures.
Figure 19.1:Typical compression/expansion cycle
Source: IEA/Heat Pump Centre.
and ambient air temperature, set point tempera-ture, hot water draw profile, auxiliary energy con-sumption55 and operating mode. All these factors can cause efficiency to vary widely, particularly if the unit is in an unconditioned space where the ambient air temperature can vary significantly over the course of a year.
Table 19.1 shows average COP values for dif-ferent types of heat pumps and typical costs).
The most common heat pumps used in the resi-dential sector are air/air units and split-air condi-tioners for air conditioning. Air-source heat pumps (ASHPs) provide sanitary hot water and space heating, while avoiding the need for expensive ground or water loops.5657
Although water/water and water/air heat pumps have higher efficiencies than air/air units, they require a water source situated close to the end user. It should be noted that ground-source heat pumps, which use underground heat exchang-ers, have higher efficiencies in cold weather than ASHPs58.
Heat pump units that operate at a high level of effi-ciency can have low CO2 emissions. Furthermore, electricity used by the system will also have to be mainly produced by renewable sources in the case of electrically driven heat pumps and by low-emission CO2 sources in the case of absorption units. In particular, ground-source heat pumps can reduce energy consumption and correspond-ing emissions by 63 to 72 % when compared to electric resistance heating with standard air conditioning equipment. Payback periods are in the range of 2 to 8 years (EPA).
55 Energy consumed by pumps, fans, supplementary heat
for bivalent system, etc.56 The table shows indicative average values.57 An electric heater has a COP = 1.58 About 30 % of houses in Sweden have geothermal
heat pumps (IEA, 2013).
Table 19.1: Average performance and cost of different types of heat pumps
Sources: JRC, 2012a, EHPA, IFE and Ross.
Type of Heat Pump56 COP57 Cost (EUR)
air/air 2.4–3 2 000–8 000
air/water 2.5–3 7 000–10 000
water/air 3.5–4 8 000–18 000
water/water 3–4 12 000–22 000
JRC13_TMAP_08AP14_P5-NS-Print.indd 133 09/04/2014 16:21:50

134
2013 Technology Map of the European Strategic Energy Technology Plan
19.3 Market and industry status and potential
The main factors that have been identified as having a significant influence in the European heat pump market are the price of primary energy sources59, the building and construction market, and the implementation of policies.
The EU market60 is dominated by air/air and air/water units, followed by geothermal units mainly used for heating (see Figure 19.2). The choice of energy source largely depends on national and regional factors. While in countries with warm climates there is a higher use of reversible air/air units, colder climates demand a more stable source temperature, which implies a larger share of ground-coupled units. Overall, the air-source segment, including reversible heat pumps and exhaust air heat pumps, remains the largest. In recent years, the share of sanitary hot water (SHW) has greatly increased and it currently rep-resents 9 % of the total market (EPHA, 2013). This technology is particularly associated with the building renovation sector and the use of hot water heat pumps with fossil fuel boilers and in combination with PV systems.
The total value of the heat pump market volume in 2011 exceeded EUR 6 174 million. France, Italy and Sweden are the three countries with the highest volume of sales (EHPA, 2012). It is foreseen that in the future there will be a sig-nificant contribution in overall market volumes and relative growth of Belgium, the Netherlands, Poland and the UK.
59 Recent factors such as the decrease of gas price, the
ratio of electricity/oil and the pellet price have resulted
in higher operating cost for heat pumps.60 Based on EU-21 values (IEA, 2013).
However, the market evolution of some European countries such as Austria, Sweden and Switzerland, in which heat pump technologies have been deployed for a longer time, is indicat-ing the reach of maturity.
Heat pump sales in households in the period from 2005 to 2010 showed a considerable market pen-etration in the Scandinavian countries, followed by Austria, Estonia, Italy and Switzerland. The market for multi-family residences and services is currently under development with a lower market penetration (around 10 %). The rest of the European countries have lower market penetration values, which indi-cates potential for further exploitation.
In particular, new growth opportunities for heat pumps exist in the renovation sector, and their potential remains stable in both the commer-cial and industrial sectors. The SHW segment in both residential and commercial applications is the one showing the highest growth over the last years. In terms of energy source, the trend towards aero-thermal energy is pronounced in most markets and accounts for most of the market growth. These solutions are proving to be ideal in combination with small gas boilers61 in hybrid applications.
61 The reduction in gas prices has thus brought the
operating costs of gas boilers closer to those of heat
pumps.
Figure 19.2: EU-21 sales by product
category in 2012
Source: EHPA, 2013. 10 %
49 % 2 %
Heating air/water
Heating ground/water
Exhaust air
Reversible air/air
Reversible other
Sanitary hot water14 %
16 %9 %
JRC13_TMAP_08AP14_P5-NS-Print.indd 134 09/04/2014 16:21:51

135
2013 Technology Map of the European Strategic Energy Technology Plan
vIn recent years, the European heat pump mar-ket has undergone major changes with a clear trend towards the creation of medium- and large-sized enterprises62 capable of offering global solutions for the heating and cooling sector. It should also be noted that tradition-al air conditioning manufacturers, including Japanese and Korean suppliers, have expanded into the combined heat and cooling sector.
19.4 Barriers to large-scale deployment
Apart from the price ratio of electricity to con-ventional fossil fuels, major barriers prevent-ing a widespread deployment of heat pumps include insufficient recognition of benefits and high investment costs, especially for ground-source installations. Stakeholders and consum-ers need to have a better understanding of the technology involved and how it could effectively contribute to achieving GHG emission reductions in the heating and cooling sector.
In addition to international standards for heat pump efficiency and labelling, the sector has also identified the following key factors to achieve large-scale deployment: government support and specific regulations in which the use of heat pumps is encouraged. The implementation of financial incentives and subsidies would contribute to the promotion of heat pumps as a feasible technol-ogy to achieve the EU’s 2020 and 2050 targets.
It should also be pointed out that a large-scale deployment is also affected by common factors to other emerging technologies, such as uncer-tainties in the markets and the long-term nature of investments in the energy sector.
62 The main corporations delivering heat pump solutions
are BDR Thermia, Bosch Thermotechnik, CIAT, Clivet,
Daikin Europe, Danfoss, Glen Dimplex, Mitsubishi
Electric, Nibe Industrie, Stiebel Eltron, Vaillant Group
and Viessmann.
On the whole, and in order to achieve the full potential of heat pump technology, investments in infrastructure, supportive business initiatives and the furthering of societal environment awareness are still needed.
19.5 RD&D priorities and current initiatives
Despite the fact that heat pump technology is mature and well established, challenges still remain in order to enhance overall performance and operation. The use of alternative materials will help to reduce the cost of equipment and components (JRC, 2012a; IEA, 2007).
The main areas in which further R&D effort is needed include the optimisation of operational plans, control systems, and the design of load management strategies and installing protocols. Optimal integration of heat pumps with alterna-tive heat and cooling technologies (in particu-lar, conventional boilers and solar technology) constitutes one of the main challenges in order to achieve large-scale deployment in the near future. Integrated solutions will have a relevant role in increasing the use of renewable and low-carbon technology in building renovation applica-tions. Small heat pumps with low investment and installation costs could either supply most of the annual heating demand being supported only by existing boilers at low ambient temperatures or cover peaks in demand.
Another area in which further R&D is needed involves the performance of heat pumps in cold and/or warm climates. The efficiency and heating capacity of ASHP units decrease considerable in cold climates. In warm environments, the use of geothermal energy could be promoted by the use of reversible heat pumps capable of supplying both heat and cool. In general, reversible systems need to increase the efficiency and flexibility of the cooling generation.
Figure 19.3:Units of heat pump sold in 2011 and 2012
Source: EHPA, 2012, 2013.
EU-21UKSKSEPTPLNONLLTITIE
HUFRFI
ESEEDKDECZCHBEAT
0 100 000 200 000 300 000 400 000 500 000 600 000 700 000 800 000
JRC13_TMAP_08AP14_P5-NS-Print.indd 135 09/04/2014 16:21:51

136
2013 Technology Map of the European Strategic Energy Technology Plan
Additionally, the selection of refrigerants capa-ble of maximising performance while minimis-ing GWP also constitutes a challenging area that will benefit from additional R&D activities. It should be noted that no single refrigerant exists that can be used with the same economic and environmental efficiency across all application requirements. There is considerable effort put into the analysis and efficient use of natural refriger-ants (CO2, ammonia and hydrocarbons) and into the development of new synthetic refrigerants. Both development pathways have their disad-vantages: the use of natural refrigerants comes at the cost of reduced efficiency, flammability or toxicity, while new synthetic refrigerants are not yet completely understood with regard to safety and their impact on the environment.
Heat pump technology will also benefit from improvements and research in cross-cutting technology, including cost reduction in drilling processes for geothermal units and reduction of energy loss in pipe technology.
19.6 References
European Environmental Agency (EEA) (http://www.eea.europa.eu/) accessed 7 January 2014.
European Heat Pump Association (EHPA), Outlook 2012 - European Heat Pumps Statistics, 2012.
European Heat Pump Association (EHPA), Personal communication, 2013.
European Technology Platform on Renewable Heating and Cooling (RHC), 2020-2030-2050 Common vision for the Renewable Heating and Cooling Sector in Europe, 2011.
European Technology Platform on Renewable Heating and Cooling (RHC), Strategic research and innovation agenda for renewable heating and cooling, 2013.
European Union (EU), Energy Markets in the European Union in 2011, 2012.
International Energy Agency (IEA), Renewables for Heating and Cooling (Untapped potential), 2007.
International Energy Agency (IEA), Transition to Sustainable buildings. Strategies and Opportunities to 2050, 2013.
IEA HPP Annex 32, -Economical Heating and Cooling Systems for Low Energy Houses, State-of-the-Art Report, SINTEF, 2007.
Institutt for Energiteknikk (IFE), Norsk deltagelse i IEA Heat Pump Programme Annex 34 – slut-trapport, 2013.
Intergovernmental Panel on Climate Change (IPCC), Renewable Energy Sources and Climate Change Mitigation, Special report, 2012.
International Renewable Energy Agency (IRENA), Heat pumps.Technology (brief), 2013.
Joint Research Centre (JRC), Best available technologies for the heat and cooling market in the European Union, JRC Scientific and Policy Reports, 2012a.
Joint Research Centre (JRC), Heat and Cooling Demand and Market Perspective, JRC Scientific and Policy Reports, 2012b.
National Renewable Energy Laboratory (NREL) (http://www.nrel.gov/) accessed 7 January 2014.
Pardo, N., Vatopoulos, K., Krook Riekkola, A., Perez, A., ‘Methodology to Estimate the Energy Flows of the European Union Heating and Cooling Market’, Energy, Vol. 52, No 1, 2012, pp. 339-352.
Ross, C., Air Source Heat Pump Installation. Performance Review, University of Strathclyde, 2008.
U.S. Environmental Protection Agency (EPA) (http://www.epa.gov) accessed 7 January 2014.
JRC13_TMAP_08AP14_P5-NS-Print.indd 136 09/04/2014 16:21:52

137
20. Energy efficiency and CO2 emissions reduction in industry
20.1 The cement industry
20.1.1 Introduction
Cement is a binder, a substance that sets and hardens independently, and can bind other mate-rials together; its most important use is in the production of concrete. Concrete is the most used man-made material in the world; almost 3 tonnes of concrete are produced in the world per person — twice as much as all the other materials together, including wood, steel, plastics and aluminium.
Energy needs accounts for an important share of the variable cost of cement production (around 40 %). This energy requirement is split between process heat and electrical energy, the latter accounting for around 20 % of cement energy needs (Capros et al., 2008).
Most of the CO2 emissions and energy use of the cement industry are related to the production of the clinker. The main component of cement, clinker is obtained throughout the calcination of limestone. Of the CO2 emissions emitted dur-ing the fabrication of cement, 62 % come from the calcination process, while the rest (38 %) is produced during the combustion of fossil fuels to feed the calcination process (EIPPCB, 2013). The CO2 emissions from the cement industry in Europe peaked in 2007 at 173.6 Mt CO2 (Ecofys, 2009), whereas in 2008, CO2 emissions came back to 2005 values (157.4 Mt CO2 in 2005 and 157.8 Mt CO2 in 2008 (Ecofys, 2008). The European CO2 emissions in 2011 (around 124.7 Mt CO2) (WBCSD/CSI, 2013) are a direct consequence of the sharp decrease in cement production.
20.1.2 Technological state of the art and anticipated developments
Four processes are currently available to produce the clinker: wet, semi-wet, semi-dry and dry. The main steps in the production of cement are:
• preparing/grinding the raw materials;
• producing an intermediary clinker;
• grinding and blending clinker with other prod-ucts to make cement.
The heat consumption of a typical dry pro-cess is currently 3.38 GJ/t clinker (WBCSD/CSI, 2009). Where 1.76 GJ/t clinker is the minimum energy consumption for the thermo dynamical process, about 0.2–1.0 GJ/t clinker is required for raw material drying (based on a moisture content of 3–15 %), and the rest are thermal losses (WBCSD/CSI – ECRA, 2009). This amount (3.38 GJ/t clinker) is a little more than half of the energy consumption of the wet process (6.34 GJ/t clinker (WBCSD/CSI, 2009). According to the BREF63 (EIPPCB, 2013), the best available value (best available techniques (BAT)) for the production of clinker ranges between 2.9 and 3.3 GJ/t (under optimal conditions). It is noted that these values have been revised recently as in the first version of the BREF document a consumption of 3.0 GJ/t clinker was proposed (based on a dry process kiln with multi-stage pre-heating and pre-calcination). This broaden-ing of the energy consumption range for clinker production is due to the recognition that there is a realistic difference between short-term and annual average values of 160 to 320 MJ/t clinker, depending on kiln operation and reliability (e.g. number of kiln stops) (Bauer and Hoenig, 2009). The average heat consumption of the EU indus-try was 3.74 GJ/t clinker in 2010 (WBCSD/CSI, 2013). The average thermal energy value in 2030 can be expected to decrease to a level of 3.3 to 3.4 GJ/t of clinker; this value can be higher if other measures to improve overall energy efficiency are pursued (cogeneration of electric power may need additional waste heat) (WBCSD/CSI, 2013). The percentage of the dry process use in the EU cement industry production has risen from 78 % in 1997 to 90 % in 2007 (EIPPCB, 2013; CEMBUREAU, 1999); in the rest of the world this
63 BREFs are the main reference documents on best
available techniques. They are prepared by the
European Integrated Pollution Prevention and
Control Bureau (EIPPCB) and are used by competent
authorities in Member States when issuing operating
permits for the installations that represent a
significant pollution potential in Europe.
2013 Technology Map of the European Strategic Energy Technology Plan
JRC13_TMAP_08AP14_P5-NS-Print.indd 137 09/04/2014 16:21:52

138
2013 Technology Map of the European Strategic Energy Technology Plan
process is gaining progressively ground but not at the same pace. The general trend is towards a progressive phasing out of wet process facili-ties; nevertheless, individual cases will provide remarkable exceptions to this trend (Grydgaard, 1998; Kapphahn and Burkhard, 2009).
The current European average of electrical con-sumption is 117 kWh/t cement (WBCSD/CSI, 2013), most of it (around 80 %) consumed for grinding processes. The main users of electricity are the mills (grinding of raw materials, solid fuels and final grinding of the cement) that account for more than 60 % of the electrical consumption (WBCSD/CSI – ECRA, 2009) and the exhaust fans (kiln/raw mills and cement mills), which together with the mills account for more than 80 % of electrical energy usage (CEMBUREAU, 2006). However, the energy efficiency of grinding is typi-cally only 5 to 10 % (Taylor et al., 2006). From 1990 to 2010, the global weighted average of electrical consumption of the participants in the project ‘Getting the numbers right’ (GNR) (WBCSD/CSI, 2013) has increased from 114 kWh/t cement to 117 kWh/t cement; without the adoption of CCS technologies, the electrical consumption in 2030 can decrease to a level of about 105 kWh/t cement in 2030. The uptake of CCS technology
by the cement industry would mean a significant increase of power consumption (WBCSD/CSI – ECRA, 2009).
As a mature industry, no breakthrough technolo-gies in cement manufacture are foreseen that can significantly reduce thermal energy consump-tion. Alternative technologies are currently being researched, such as the fluidised bed technology; however, although improvements can be expect-ed, it is not foreseen that such technologies will cover the segment of big kiln capacities (WBCSD/CSI – ECRA, 2009). On the other hand, CCS has been identified as a prominent option to reduce CO2 emissions from cement production in the medium term. Currently, the main evolution of the sector to improve its energy and environ-mental performance is towards higher uses of clinker substitutes in the cement, higher use of alternative fuels such as waste and biomass, and the deployment of more energy efficiency meas-ures. A significant number of energy efficiency measures are currently being proposed; however, their deployment is quite site-specific, rendering it difficult to assess the gains that can be expected. It is noted that many thermal energy reducing measures can increase the power consumption (WBCSD/CSI – ECRA, 2009).
Figure 20.1: Typical mass balance for the manufacture
of 1 kg of cement with a clinker to cement
ratio of 0.75 (source: EIPPCB, 2013), and main processes involved in the
manufacturing
Mass balance for 1kg cement
JRC13_TMAP_08AP14_P5-NS-Print.indd 138 09/04/2014 16:22:14

139
2013 Technology Map of the European Strategic Energy Technology Plan
20.1.3 Market and industry status and potential
The EU-27 cement industry production in 2006 (267.5 Mt) represented 10.5 % of the total world production; the weight of the European cement industry in 2011 decreased to a 5.6 % of world production (195.5 Mt) (EIPPCB, 2013; CEMBUREAU, 2013). The overall EU consumption per capita in the future can be expected to remain around 450 kg (Gielen, 2008) in spite of the fact that there will be differences among countries. Assuming such average would lead to cement production in Europe of around 234 Mt by 2030.
The EU-27 thermal energy consumption for cement production in 2007 was 0.76 EJ (18.1 Mtoe). The alternative fuels consumption increased from 3 % of the heat consumption in 1990 to almost 18 % in 2006 (CEMBUREAU, 2009); if the current trends remain similar, the substitution rate could reach 49 % in 2030 with a saving of 0.30 EJ (7.3 Mtoe) in 2030.
The main focus of CO2 emissions reduction as currently pursued is a decrease in the proportion of clinker in the cement (clinker to cement ratio) as the process emissions in the manufacture of the clinker — coming from the calcination of the raw material are governed by chemistry — 526 gCO2/kg of clinker (EIPPCB, 2013). From 1990 to 2011, this ratio has decreased from 0.81 to 0.74 (WBCSD/CSI, 2013); if this trend is sustained, this ratio would reach around 0.70 in 2030.
The use of alternative fuels avoids the emis-sion in the disposal of the waste treated by the cement industry as fuels, and at the same time saves fossil fuels. The amount of CO2 emissions savings from the use of alternative fuels would be 23.5 Mt CO2 in 2030 if current trends in fuels substitution were held. This is an indirect saving of CO2; if the cement industry had not
used some wastes as alternative fuels then they would have produced that amount of CO2
in their disposal elsewhere.
Taking into account all these trends, Pardo (2011) estimates that between 2006 and 2030 the cost-effective implementation of remaining techno-logical innovation can reduce the thermal energy consumption by 10 % (see Figure 20.2) and CO2 emissions by 4 %. The value for the specific thermal energy consumption in 2030 (around 3 350 MJ/t clinker) is in line with the expected value in 2030 (3 400 MJ/t clinker) used in the IEA cement technology roadmap (Tam and van der Meer, 2009).
It is noted that the deployment of CCS could sig-nificantly reduce the CO2 emissions of the sector; however, a wide deployment of this technology in the cement industry is not foreseen before 2020.
Assuming no CCS deployment, the specific elec-tricity demand of cement production can decrease from 110 kWh/t cement in 2006 to 105 kWh/t cement in 2030 (WBCSD/CSI – ECRA, 2009).
The number of people employed in the sector in the EU-27 was about 54 000 in 2005 (EIPPCB, 2013). The average price of cement in Europe varies broadly between countries. Despite a his-torical tendency to produce and consume cement locally, this is a product with a relatively low price, around EUR 70/t on average in the EU, compared to its transport prices (transport costs are around EUR 10/t of cement per 100 km by road and around EUR 15/t of cement per 100 km to cross the Mediterranean Sea) (Hourcade et al., 2007).
Three out of the world’s five largest cement pro-ducers are sited in the EU-27: HeidelbergCement (Germany), Lafarge (France) and Italcementi (Italy), and the other two big ones are Cemex (Mexico) and Holcim (Switzerland) (EIPPCB, 2013).
Figure 20.2:Evolution of the total thermal energy consumption modelled, precluding the retrofitting of existing facilities (upper area), and allowing cost-effective retrofits(lower area)
Source: Pardo, 2011.
0.66
0.64
0.62
0.6
0.58
0.56
0.54
0.52
0.5
2003
Ther
mal
Ene
rgy
Cons
umpt
ion,
(EJ
)
2006 2009 2012 2015
Year
2018 2021 2024 2027 2030
JRC13_TMAP_08AP14_P5-NS-Print.indd 139 09/04/2014 16:22:15

140
2013 Technology Map of the European Strategic Energy Technology Plan
This means that the European cement indus-try has a truly global presence enjoying a mar-ket share of 95 % in Europe and 70 % in North America (IEA, 2008). In addition to the production of cement, these companies have also diversified in other sectors of building materials.
20.1.4 Barriers to large-scale deployment
The industry has pointed out the risks of carbon leakage under the terms of the former EU ETS (Directive 2003/87/EC). The revised Directive (Directive 2009/29/EC) provides for 100 % of allowances allocated free of charge, at the level of the benchmark to the sectors exposed. The sectors exposed were determined by the European Commission in December 2009 (EC, 2009); the cement industry is among them. The benchmarking values, proposed by the European Commission, were adopted in April 2011 (EC, 2011a). The European Commission has launched the Sustainable Industry Low Carbon (SILC) initia-tive (SILC, 2011) to help the industry to achieve specific GHG emission intensity reductions in order to maintain its competitiveness. On a larger scale, the Sustainable Process Industry through Resource and Energy Efficiency (SPIRE) partner-ship (SPIRE, 2013) is a major cross-sectoral part-nership planning to channel EUR 1.4 billion in private sector research spending to resource and energy efficiency in Europe’s process industries.
One of the main barriers to the deployment of energy efficiency measures and CO2 mitigation technologies in the cement industry in Europe is related to energy prices. High energy price favours investment in energy efficiency and CO2
emissions abatement; however, at the same time, higher energy prices may lead towards more and more imports from non-EU countries to the detri-ment of European production. There are energy efficiency improvements that the EU industry is currently not following, due to, among other fac-tors, low energy prices. For example, concerning heat waste recovery, by 2009 there were 120 cement plants equipped with cogeneration sys-tems with a total capacity of 730 MW (Rainer, 2009), whereas nowadays the number of EU-27 plants recovering waste heat is very limited.
The market penetration of cements with a decreasing clinker to cement ratio will depend on six factors:
• availability of raw materials,
• properties of those cements,
• price of clinker substitutes,
• intended application,
• national standards,
• market acceptance (WBCSD/CSI – ECRA, 2009).
It is noted that cement that can be fit for purpose in one country can often not be placed in some other countries due to differences in national application documents of the European concrete standard (Damtoft and Herfort, 2009). Therefore, a way to encourage the use of these cements would be the promotion of standard harmonisa-tion at the EU level.
20.1.5 RD&D priorities and current initiatives
The main needs of the cement industry can be summarised as follows:
• promotion of current state-of-the-art technologies;
• encourage and facilitate an increased use of alternative fuels;
• facilitate and encourage clinker substitution;
• facilitate the development of CCS;
• ensure predictable, objective and stable CO2 constraints and an energy framework on an international level;
• enhance R&D of capabilities, skills, expertise and innovation;
• encourage international collaboration and public-private partnerships (Tam and van der Meer, 2009).
Among the conclusions of the cement roadmap of the IEA (Tam and van der Meer, 2009) is that the options available today (BAT, alternative fuels and clinker substitutes) are not sufficient to achieve a meaningful reduction of CO2 emissions; hence, there is a need for new technologies, CCS and new types of cements. To achieve this goal a step increase in RDD&D is required.
The cement industry shows great potential for the use of CCS as CO2 emissions are concen-trated in few locations and at the same time the concentration of CO2 in their flue gas is twice the concentration found in coal-fired plants (about 14–33 % compared to 12–14 %) (IPCC, 2005). The relevance of the application of CCS to indus-trial processes is also underlined in the Low-Carbon Economy Roadmap 2050 (EC, 2011b) as well as in the Energy Roadmap 2050 (EC, 2011c). Nonetheless, the deployment of CCS technologies currently being considered (oxy-combustion and post-combustion) can double
JRC13_TMAP_08AP14_P5-NS-Print.indd 140 09/04/2014 16:22:15

141
2013 Technology Map of the European Strategic Energy Technology Plan
the price of the cement; therefore, along with significant research and demonstration efforts, the application of CCS technologies will demand the development of a stable economic frame-work able to compensate for the increased costs (WBCSD/CSI – ECRA, 2009).
20.1.6 References
Bauer, K., Hoenig, V., Energy efficiency of cement plants, Proceedings of the 6th International VDZ Congress 2009, Process Technology of Cement Manufacturing, Düsseldorf, 30 September to 2 October 2009.
Capros, P., et al., European Energy and Transport Trends to 2030 – Update 2007, European Commission, Directorate-General for Energy and Transport, 2008.
CEMBUREAU, Best available techniques for the cement industry, A contribution from the cement industry to the exchange of information and prep-aration of the IPPC BAT Reference Document for the cement Industry, 1999.
CEMBUREAU, Specific energy consumption, Contribution to the cement & Lime BREF revi-sion, 2006.
CEMBUREAU, Co-Processing of alternative fuels and raw materials in the European cement Industry, 2009.
CEMBUREAU, Activity report 2012, 2013.
Damtoft, J.S., Herfort, D., Fit for Purpose Market-oriented cements, Proceedings of the 6th International VDZ Congress 2009, Process Technology of Cement Manufacturing, Düsseldorf, 30 September to 2 October 2009.
Directive 2003/87/EC of the European Parliament and of the Council of 13 October 2003 estab-lishing a scheme for greenhouse gas emission allowance trading within the Community and amending Council Directive 96/61/EC
Directive 2009/29/EC of the European Parliament and of the Council of 23 April 2009 amending Directive 2003/87/EC so as to improve and extend the greenhouse gas emission allowance trading scheme of the Community.
Ecofys, Fraunhofer ISI and Öko-Institut, Methodology for the free allocation of emission allowances in the EU ETS post 2012, Sector report for the lime industry by order of the European Commission, 2009.
European Commission (EC), Commission Decision of 24 December 2009 determining, pursuant Directive 2003/87/EC of the European
Parliament and of the council, a list of sectors and subsectors which are deemed to be exposed to a significant risk of carbon leakage, 2009.
European Commission (EC), Commission Decision of 27 April 2011 determining transitional Union-wide rules for harmonised free allocation of emission allowances pursuant to Article 10a of Directive 2003/87/EC, 2011a.
European Commission (EC), Communication from the Commission to the European Parliament, the Council and the European Economic and Social committee and the committee of the regions; A roadmap for moving to a competitive low carbon economy in 2050, COM(2011)112 final, 2011b.
European Commission (EC), Communication from the Commission to the European Parliament, the Council and the European Economic and Social committee and the committee of the regions; Energy Roadmap 2050, COM(2011)885 final, 2011c.
European Integrated Pollution Prevention and Control Bureau (EIPPCB), Best Available Techniques (BAT) Reference Document for the Production of Cement, Lime and Magnesium Oxide, JRC-IPTS, 2013.
Gielen, D., IEA G8 Activities and the cement Industry, CSI, Beijing, 2008.
Grydgaard, P., Get out of the wet, International Cement Review, No 4, 1998, pp. 77-84.
Hourcade, et al., Differentiation and Dynamics of EU ETS Industrial competitiveness Impacts, Climate Strategies Report, 2007.
Intergovernmental Panel on Climate Change (IPCC), Special report on Carbon dioxide Capture and Storage, Cambridge University Press, 2005.
International Energy Agency (IEA), Greenhouse Gas R&D programme, CO2 Capture in the cement Industry, Technical Study, Report Number: 2008/3, 2008.
Kapphahn, M., Burkhard W., Modern Raw Material Preparation of Chalk – Get out of the wet?, Proceedings of the 6th International VDZ Congress 2009, Process Technology of Cement Manufacturing, Düsseldorf, 30 September to 2 October 2009.
Pardo, N., Moya, J.A., Mercier, A., ‘Prospective on the energy efficiency and CO2 emissions in the EU cement industry’, Energy, Vol. 36, Issue 5, 2011, pp. 3244-3254.
Rainer, N., Burning Technology, Proceedings of the 6th International VDZ Congress 2009, Process
JRC13_TMAP_08AP14_P5-NS-Print.indd 141 09/04/2014 16:22:15

142
2013 Technology Map of the European Strategic Energy Technology Plan
Technology of Cement Manufacturing, Düsseldorf, 30 September to 2 October 2009.
SPIRE Roadmap, 2013.
Sustainable Industry Low Carbon scheme (SILC), I - Short-term innovation measures, Action ENT/CIP/11/D/N02S00, 2011.
Tam, C., van der Meer, R., IEA/CSI technology road-map for the cement industry, Proceedings of the 6th International VDZ Congress 2009, Process Technology of Cement Manufacturing. Düsseldorf, 30 September to 2 October 2009.
Taylor, M., Tam, C., Gielen, D., Energy Efficiency and CO2 Emissions from the Global Cement Industry, Paper prepared for the IEA-WBCSD workshop: Energy Efficiency and CO2 Emission Reduction Potentials and Policies in the Cement Industry, IEA, Paris, 4–5 September 2006.
World Business Council for Sustainable Development/Cement Sustainability Initiative - European Cement Research Academy (WBCSD/CSI – ECRA), Development of state of the Art-Techniques in Cement Manufacturing: Trying to look ahead, Düsseldorf, Geneva, 2009.
World Business Council for Sustainable Development/Cement Sustainability Initiative (WBCSD/CSI), Cement Industry Energy and CO2 Performance – ‘Getting the Numbers Right’, 2009.
World Business Council for Sustainable Development/Cement Sustainability Initiative (WBCSD/CSI), Global Cement Database on CO2 and Energy Information – ‘Getting the Numbers Right’, 2013.
20.2 The iron and steel industry
20.2.1 Introduction
The GHG emissions from the iron and steel industry during the period 2005–2008 on aver-age amounted to 252.5 Mt CO2-eq. (Ecofys, 2009), while the value estimated (250.6 Mt CO2-eq.) for 2010 using EEA (2012) hardly changed. In Europe, about 80 % of CO2 emis-sions related to the integrated route originates from waste gases. These waste gases are used substantially within the same industry to produce about 80 % of its electricity needs (EUROFER, 2009).
Part of the steep decrease in energy consump-tion in the European industry in the last 40 years (by about 50 %) has been due to the increase of the recycling route at the expense of the integrated route (the share has increased from 20 % in the 1970s to around 40 % today). However, a prospective shift to recycling is con-fined by scrap availability and its quality.
In Europe, the number of people directly employed in the sector was about 360 000 people in 2013 (EUROFER, 2013a). Steel is a direct supplier for and part of a value chain representing the best of European industry, and contributing annually revenues in excess of EUR 3 000 billion and employing 23 million people (ESTEP, 2009).
20.2.2 Technological state of the art and anticipated developments
There are two main routes to produce steel. The first route is called the integrated route, which is based on the production of iron from iron ore. The second route, called recycling route, uses scrap iron as the main iron-bearing raw material in electric arc furnaces. In both cases, the energy consumption is related to fuel (mainly coal and coke) and electricity. The recycling route has much lower energy con-sumption (by about 80 %).
The integrated route relies on the use of coke ovens, sinter plants, blast furnaces (BFs) and basic oxygen furnace (BOF) converters. Current energy consumption for the integrated route is estimated to lie between 17 and 23 GJ/t of hot-rolled product (SET-Plan Workshop, 2010). The lower value is considered by the European sector as a good reference value for an inte-grated plant. A value of 21 GJ/t is considered as an average value throughout the EU-27 (SET-Plan Workshop, 2010). It is noted that a fraction of this energy consumption may be committed to downstream processes. The fuels applied are fully exploited, first for their chemical reaction potential (during which they
JRC13_TMAP_08AP14_P5-NS-Print.indd 142 09/04/2014 16:22:15

143
are converted into process gases) and then for their energy potentials by capturing, cleaning and combusting these process gases within production processes and for the generation of heat and electricity. It is an important charac-teristic of this ‘cascadic fuel use’ that increased energy efficiencies in the use of the process gases do not reduce the overall energy con-sumption, related to the use of primary fuels for the chemical reactions.
The recycling route converts scrap iron in electri-cal arc furnaces. Current energy consumption for this route is estimated to lie between 3.5 and 4.5 GJ/t of hot-rolled product (SET-Plan Workshop, 2010). The lower value corresponds to a ‘good reference’ plant. The higher value corresponds to today’s average value within the EU-27. In Figure 20.3, the integrated route and the recycling route are at the left hand side and right hand side of the continuous casting, respectively.
Alternative product routes to the two main routes are provided by direct-reduced iron technology (which produces substitutes for scrap) or smelting reduction (which, like the BF, produces hot metal). The advantage of these technologies compared to the integrated route is that they do not need raw material beneficia-tion, such as coke making and sintering, and that they can better adjust to low-grade raw materials. On the other hand, more primary fuels are needed, especially natural gas for direct-reduced iron technology and coal for smelting reduction. In the latter, 20–25 % sav-ings in CO2 emissions (De Beer, 1998) can be achieved if the additional coal is transformed into process gases that are captured and used to produce heat and electricity for exports to the respective markets for heat and electricity. So far, and for this reason, the expansion of these technologies occurs in developing coun-tries with weak energy supply infrastructures or countries with low fuel resources. In 2006, this represented about 6.8 % of worldwide pro-duction (EIPPCB, 2013). The European produc-tion of direct-reduced iron technology is limited to one facility in Germany, and none of the eight facilities of smelting reduction operating in the world are sited in the EU-27. The pos-sible gap for direct-reduced iron technology could come in the EU-27 if increased capacity of hot metal is required (EIPPCB, 2013) and if the necessary, additional primary fuel demands could be satisfied at low cost. The opportunity for smelting reduction is harder to assess due to the lack of detailed information available today, but it should be governed by the same boundary conditions.
20.2.3 Market and industry status and potential
The production of crude steel in the EU in 2011 was 177.2 Mt, representing 11.7 % of the total world production (1 514.1 Mt of crude steel) (Worldsteel Association, 2012). Ten years earlier, with a slightly higher pro-duction (187.2 Mt of crude steel), the share of the same European countries was 22.0 %. The main difference is that the Chinese pro-duction has grown more than four-fold over this period (from 151.5 Mt to 684.6 Mt of crude steel) (Worldsteel Association, 2012). In these 10 years, the European consumption of finished-steel products fell from 159 Mt to 152 Mt (Worldsteel Association, 2012). In 2009, with the financial crisis, the production level in Europe dropped by 30 % compared to the previous 3 years. Partial recovery of production has been achieved in the first half of 2010, but subsequent falls makes pre-crises output levels hardly achievable before 2020.
The growth of the EU-27 iron and steel pro-duction can be estimated to be 0.7 % per year up to 2050 (BCG, 2013). This would imply a production of around 206 Mt and 236 Mt of crude steel in 2030 and 2050, respectively. The increase in the production is estimated to be covered mainly by an increase in the recycling route. The production from the integrated route will stay around current values.
Today, around 30 % of steel is traded interna-tionally and over 50 % is produced in develop-ing countries (Worldsteel Association, 2012). The world steel industry has an overcapacity of 542 Mt (out of a global expected capacity by 2014 of 2 172 Mt) (EC, 2013). Chinese over-capacity (200 Mt) is similar to total EU pro-duction capacity of 217 Mt, and the European overcapacity amounts to around 40 Mt (EC, 2013). The world’s largest producer in 2011 was a European company (ArcelorMittal). The production of the 12th world producer (Tata Steel) includes the production of for-mer Corus, the 3rd largest European producer (ThyssenKrupp) was ranked 16th in the 2011 world production, and the 4th and 5th largest producer (Riva and Techint) were ranked 21st and 36th, respectively.
To achieve the potential identified in the 2011 Technology Map for wind power generation (SETIS, 2011), the annual consumption of steel in the wind industry by 2020, 2030 and 2050 could amount to 3.2, 4.5 and 4.2 Mt, respectively. These annual amounts of steel would be needed to achieve 220 GW of wind energy in 2020 (185 GW onshore and 35 GW offshore), 350 GW in 2030 (230 GW onshore and 120 GW offshore), and 500 GW by 2050
2013 Technology Map of the European Strategic Energy Technology Plan
JRC13_TMAP_08AP14_P5-NS-Print.indd 143 09/04/2014 16:22:15

144
2013 Technology Map of the European Strategic Energy Technology Plan
(275 GW onshore and 225 GW offshore)64. These figures include the additional installa-tions from repowering old wind farms, which may start to pick up from 2020 onshore and from 2030 offshore.
In thermal power plants, the development of new steel grades will increase temperature and pressure and will contribute to the improvement of energy efficiency (a realistic medium-term target is the development of types of steels able to operate at pressures and temperatures up to 325 bar and 650 °C, respectively). In advanced supercritical plants with steam conditions up to 600 °C and 300 bar it should be possible to reach net efficiencies between 46 and 49 %, whereas plants with steam conditions of 600 °C and 250 bar have efficiencies in the range 40–45 % (SETIS, 2011). Older PC plants, with sub-critical steam parameters, operate with efficiencies
64 The turbine data used to obtain these estimates is
based on an analysis of the mass of existing and
projected offshore and onshore wind turbines, and
on expected technology evolution. Iron and steel use
considered include unalloyed and highly alloyed steel,
cast iron and others, used in the steel tower (93 % iron
and steel), top-head (67 % iron and steel), and onshore
and gravity foundations (5 % steel). Account has been
taken of market share of the different tower types
(85 % steel, 15 % concrete) and offshore foundations
(70 % monopile and 10 % each jacket, tripod/tripile
and concrete). Assumptions had been made on the
possible evolution of the weight versus capacity
relationship according to technological evolution,
to 2015/2020/2030/2050, in turbines, towers and
foundations. The turbine sizes assumed are of 3 MW for
onshore and 6 MW for offshore by 2020, 4 MW/8 MW
by 2030 and 5 MW/12 MW by 2050.
between 32 and 40 %. Each percentage point efficiency increase is equivalent to about 2.5 % reduction in tonnes of CO2 emitted (SETIS, 2011). Therefore, major retrofitting of old sub-critical power plants with supercritical steam cycles or retiring old plants and their replacement with new plants is essential to minimise CO2 emis-sions in the power sector. Further developments of nickel-based alloys may allow steam with temperatures up to 700 °C (ESTEP-SRA, 2005).
In gas transportation, the development of very-high–strength steels will contribute to safe and efficient transportation of natural gas, H2 and CO2 (CCS technologies). Historically, since 1996, a fundamental effort of the EU focused on smoothing out the workings of the internal ener-gy market was the Trans-European Networks for Energy (EC, 2010a). In recent years, the EEPR has allocated almost EUR 4 billion to leverage private funding in gas and electricity structure. A good example of the active role of the European Commission in support of this kind of project is the Baltic Energy Market Interconnection Plan (BEMIP) (EC, 2010b) or the Southern Corridor (including Nabucco (EC, 2008)).
The development of new grades (lightweight alloys) for the automotive industry can decrease steel consumption (energy consumption) and at the same time improve the efficiency of the final products; lighter cars will be more efficient. If the body structures of all cars produced world-wide were made of advanced high-strength steel instead of conventional steel, 156 Mt CO2-eq. would be avoided (Worldsteel Association, 2011a). The savings that are typically achieved today correspond to a total vehicle weight reduc-tion of 9 %. For every 10 % reduction in vehicle weight fuel, its economy is improved between
Figure 20.3: Overview of the steel-
making process and variety of products
manufactured
Source: Worldsteel Association, 2011b.
JRC13_TMAP_08AP14_P5-NS-Print.indd 144 09/04/2014 16:22:23

145
1.9 and 8.2 % (Worldsteel Association, 2011a). When applied to a typical 5-seated passenger family car, the overall weight of the vehicle is reduced by 117 kg and the savings produced dur-ing the whole lifetime of the vehicle is 2.2 tCO2-eq. (Geyer, 2006).
20.2.4 Barriers to large-scale deployment
Increases in the recycling rate beyond 60 % will be stifled by the availability of scrap. Such high recycling values could increase the impurities and reduce the overall steel quality. Recycling has high emissions of heavy metals and organic pollutants due to the impurities of scrap (ETC/RWM, 2005). These issues will become a more pressing issue to be solved urgently.
According to the industry (EUROFER, 2013b), for the reduction of CO2 emissions with the conven-tional integrated route (BF and BOF), the thermo-chemical efficiency of current BFs is very close to the optimum. CO2 emissions are linked to the chemical reaction for the reduction of iron ore. No significant advance to decrease CO2 emis-sions is possible without the development of breakthrough technologies, as proposed by the Ultra-Low CO2 Steelmaking (ULCOS) project.
The main lever of energy savings for steel produc-tion is led by further increases in the recycling rate. For the integrated route, the BFs and BOFs of existing good reference plants are very close to the optimum, so there are very few possi-bilities of additional energy savings in this area. The best performers are at 17 GJ/t of hot-rolled product when the average is at around 21 GJ/t of hot-rolled product. Not all the European opera-tors are best-in-class and thus more potential to save energy is available by bringing them up to the level of the best performers: dissemina-tion of best practices and BATs identified in the BREF documents for the iron and steel industries (EIPPCB, 2013). In addition, there is some room for improvement for the best performers and others, especially for the downstream processes, with a better energetic valourisation of process gases in excess, wastes and by-products. Thus, recovery of waste heat (including mean and low levels of temperatures), improving the valourisa-tion of process gases, use of renewable energies, ICT integrated approach for plants’ energy man-agement, and recovery of wastes and residues are some of the topics where the industry needs support for research, pilots and demonstrators.
The industry has pointed out the risks of carbon leakage under the terms of the former EU ETS (Directive 2003/87/EC). According to Worldsteel’s figures (Worldsteel Association, 2012), trade within the EU-27 in 2011 amounted to 108 Mt of crude steel, with 35.9 Mt imported from outside the EU-27 and 38 Mt exported to other non-EU-27
countries. Excluding the intra-EU-27 trade, the EU is ranked first as world importer and third as world exporter. The revised Directive (Directive 2009/29/EC) provides for 100 % of allowances allocated free of charge, at the level of the bench-mark to the sectors exposed. The sectors exposed were determined by the European Commission in December 2009 (EC, 2009); the iron and steel industry is among them. The benchmarking val-ues, proposed by the European Commission, were adopted in April 2011 (Decision, 2011).
Other social challenges to the industry come from the increasing average age structure of its workforce: more than 20 % will retire from 2005 to 2015 and close to 30 % during the following 10 years. Therefore, the industry has the chal-lenge of attracting, educating and securing more qualified people (ESTEP/SRA, 2005).
20.2.5 RD&D priorities and current initiatives
During the period 2005–2008, direct emissions from the integrated route were on average 2.3 tCO2/t of rolled products and 0.21 tCO2/t of rolled products for the recycling route (Ecofys, 2009). Taking into account the indirect emis-sions from electricity production in the case of the recycling route, around 452 kgCO2/t of rolled products65 should be added to the 210 kgCO2/t of rolled products reported. The resulting amount remains well below the reference values emitted for the integrated route (on average 2 300 kgCO2/t of rolled products). Exploiting the advantages of the recycling route (an order of magnitude lower of direct CO2 emissions than the integrate route) will demand an outstanding end-of-life management to make sure that all steel contained in scrap can be recycled in an effective way.
The data collected for the purposes of the imple-mentation of the revised Emissions Trading Directive indicate a potential for reductions of direct CO2 by applying best practice to the extent of 10 % of the current absolute and direct emis-sion of the parts of the sector covered by the revised Emissions Trading Directive (roughly equivalent to 27 Mt of CO2 per year). However, this potential relies strongly on a substitution of local raw materials with increased imports of best performance raw materials from out-side the EU (especially ores and coal). In order to maintain the competitiveness of the energy-intensive industries, the European Commission has launched the SILC initiative (SILC, 2013) to
65 This value has been obtained using an average emission
factor for electricity of 0.465 tCO2/MWh (Capros, 2008)
for the overall EU electrical production and the 3.5 GJ/t
needed as a good reference value for the production of
the recycling route (SET-Plan Workshop, 2010).
2013 Technology Map of the European Strategic Energy Technology Plan
JRC13_TMAP_08AP14_P5-NS-Print.indd 145 09/04/2014 16:22:23

146
2013 Technology Map of the European Strategic Energy Technology Plan
help the industry achieve specific GHG emission intensity reductions.
An early market roll-out after 2020 of the first technology considered in the ULCOS project (sup-ported by the EU) could further reduce the CO2 emissions. The ULCOS project is the flagship pro-ject of the industry to obtain a decrease of over 50 % of CO2 emissions in the long term. The first phase of ULCOS had a budget of EUR 75 million. As a result of this first phase, four main processes have been earmarked for further development.
• Top gas recycling BF is based on the sep-aration of the off-gases so that the useful components can be recycled back into the furnace and used as a reducing agent and in the injection of oxygen instead of pre-heated air to ease the CCS. The implementation of the top-gas recycling BF with CCS could cost about EUR 590 million for an industrial demonstrator producing 1.2 Mt hot metal per year (SET-Plan Workshop, 2010).
• The HIsarna technology combines pre-heating of coal and partial pyrolysis in a reactor, a melting cyclone for ore melting, and a smelter vessel for final ore reduction and iron produc-tion. The market roll-out is foreseen for 2030. Combined with CCS, the potential reduction of CO2 emissions of this process is 70–80 % (SET-Plan Workshop, 2010). A pilot plant (8 t/h, with-out CCS) was commissioned during 2011 in Ijmuiden, the Netherlands (EECRsteel, 2011a).
• The ULCORED (advanced direct reduction with CCS) direct-reduced iron is produced from the direct reduction of iron ore by a reducing gas produced from natural gas. The reduced iron is in solid state and will need an electric arc furnace for melting the iron. An experimental pilot plant is being planned in Sweden, with market roll-out foreseen for 2030. The poten-tial reduction of CO2 emissions of this process is 70–80 %.
• ULCOWIN and ULCOSYS are electrolysis pro-cesses to be tested on a laboratory scale. There is a clear need to support this research effort with a high share of public funds, and to lead the global framework market towards condi-tions that ease the prospective deployment of these breakthrough technologies.
It is important to note that, compared to the conventional BF, the first two breakthroughs ULCOS-BF and HIsarna would result in a reduc-tion of CO2 emissions of 50–80 % and at the same time a reduction of energy consumption by 10–15 %. One important synergy in the quest to curb prospective CO2 emissions through the ULCOS project is the share of innovation initia-tives within the power sector or with any other
(energy-intensive) manufacturing industries that could launch initiatives in the field of CCS (e.g. cement industry) (ZEP, 2010; ESTEP, 2009).
Under the assumptions of a recent study by JRC (2012), it would only be after 2030, when new technologies may become available, that there could be a reduction of around 10 % in energy consumption and of 20 % in total direct CO2 emis-sions. A follow-up study (Moya, 2013) indicates that by varying the investment decision criterion, and also considering an advanced market roll-out of new technologies, the reduction in energy consumption and CO2 emissions reachable would amount to 18 % and 65 %, respectively. A critical area is therefore a successful demonstration of breakthrough technologies for CO2 emission abatement, including industrial CCS.
One of the instruments that will support the implementation of the SET-Plan is the NER300 established in Article 10(a)8 of the revised Directive. This instrument will provide the mon-etary value of 300 million emission allowances to co-finance CCS and innovative renewable dem-onstration projects. No CCS project was awarded under the first call for proposals of the NER300 funding programme (EC, 2012a). The EUR 275 million envisaged for CCS projects in the first call remains available to fund projects under the second phase of the programme. Also, the EU has maintained its research activities in the iron and steel industry through the FP7 and the Research Fund for coal and steel (EC, 2012b), and, on a smaller scale, the SILC scheme of the European Commission aims to help sectors to achieve spe-cific reductions in GHG emission intensity in order to maintain their competitiveness. Moreover, the steel industry together with other process indus-tries submitted, under Horizon 2020, a proposal for a new public-private partnership called SPIRE with an annual budget of about EUR 20–25 mil-lion for the steel part.
In order to design a long-term policy strategy, the European Commission has recently published an Action Plan for the steel sector (EC, 2013) whose aim is to identify ways to preserve and enhance the competitiveness of the steel sector.
20.2.6 References
Capros, P., Mantzos, L., Papandreu, Tasios, N., Model-based Analysis of the 2008 EU Policy Package on Climate Change and Renewables, 2008 (http://ec.europa.eu/environment/climat/pdf/climat_action/analysis.pdf) accessed 7 January 2014.
Commission Decision of 27 April 2011 determin-ing transitional Union-wide rules for harmonised free allocation of emission allowances pursuant to Article 10a of Directive 2003/87/EC.
JRC13_TMAP_08AP14_P5-NS-Print.indd 146 09/04/2014 16:22:24

147
2013 Technology Map of the European Strategic Energy Technology Plan
de Beer, J., Worrel, E., Block., K., ‘Future Technologies for Energy Efficient Iron and Steel making’, Annual Review of Energy and the Environment, Vol. 23, 1998, pp. 123-205.
Directive 2003/87/EC of the European Parliament and of the Council of 13 October 2003 estab-lishing a scheme for greenhouse gas emission allowance trading within the Community and amending Council Directive 96/61/EC.
Directive 2009/29EC of the European Parliament and of the Council of 23 April 2009 amending Directive 2003/87/EC so as to improve and extend the greenhouse gas emission allowance trading scheme of the Community.
Ecofys, Fraunhofer ISI and Öko-Institut, Methodology for the free allocation of emission allowances in the EU ETS post 2012, Sector report for the iron and steel industry by order of the European Commission, 2009.
EECRsteel, Proceedings of the first International Conference on Energy efficiency and CO2 Reduction in the Steel Industry, HIsarna Pilot Plant Project, Meijer, K., Guenther, C., Dry, R.J., 27 June to 1 July 2011, Dusseldorf, 2011a.
EUROFER, Climate Change: EUROFER statement on waste Gases, 4 November 2009.
EUROFER, 2013a (http://www.eurofer.org/) accessed 24 April 2013.
EUROFER, A steel roadmap for a low carbon Europe 2050, 2013b.
European Commission (EC), Second Strategic Energy Review. An EU Energy security and solidar-ity action plan, Communication COM(2008)781 final, 2008.
European Commission (EC), Commission Decision of 24 December 2009 determining, pursuant Directive 2003/87/EC of the European Parliament and of the council, a list of sectors and subsectors which are deemed to be exposed to a significant risk of carbon leakage, 2009.
European Commission (EC), Implementation of the Trans-European Energy networks in the Period 2007-2009, Communication COM(2010)2003 final, 2010a.
European Commission (EC), European Commission 2010. Baltic Energy Market Interconnection Plan (BEMIP), 2010b (http://ec.europa.eu/energy/infrastructure/bemip_en.htm) accessed 7 January 2014.
European Commission (EC), Commission implementing decision of 18.12.2012. Award
Decision under the first call for proposals of the NER 300 funding programme, Communication COM(2012)9432 final, 2012a (http://ec.europa.eu/clima/news/docs/c_2012_9432_en.pdf) accessed 7 January 2014.
European Commission (EC), Research Fund for Coal & Steel, 2012b (http://cordis.europa.eu/home_en.html) accessed 7 January 2014.
European Commission (EC), Communication from the Commission to the Parliament the Council, The European Economic and Social Committee and the Committee of Regions. Action Plan for a competitive and sustainable steel industry in Europe, Communication COM(2013) 407, 2013.
European Environment Agency (EEA), Annual European Union greenhouse gas inventory 1990–2010 and inventory report 2012, Technical report No 3/2012, 2012.
European Integrated Pollution Prevention and Control Bureau (EIPPCB), Best Available Techniques (BAT) Reference Document for Iron and Steel Production, JRC-IPTS, 2013.
European Steel Technology Platform (ESTEP), A bridge to the future. STEEL a key partner in the European low-carbon economy of tomorrow, 2009.
European Steel Technology Platform (ESTEP)/Strategic Research Agenda (SRA), Executive Summary. A vision for the future of the steel sector, endorsed by the steering committee on 15th December 2004, 2005.
European Topic Centre on Resource and Waste Management (ETC/RWM) working paper 2005/3, Moll, S., Acosta, J., Schütz, H., Iron and steel – a materials system analysis, Pilot study examining the material flows related to the production and consumption of steel in the European Union, 2005.
Geyer, R., Bren, D., An LCA-GHG Parametric Model, School of Environmental Science and Management, University of California Santa Barbara, 2006.
Joint Research Centre (JRC), Prospective Scenarios on Energy Efficiency and CO2 Emissions in the EU Iron & Steel Industry, EUR25543, 2012 (http://publications.jrc.ec.europa.eu/repository/bitstream/111111111/26669/1/ldna25543enn.pdf) accessed 7 January 2014.
JRC-SETIS Work Group, Technology Map of the European Strategic Energy Technology Plan (SET-Plan), European Commission, 2011. Euro-Report EUR 24979 EN
Moya, J.A., Pardo, N., ‘Potential for improvements in energy efficiency and CO2 emissions in the
JRC13_TMAP_08AP14_P5-NS-Print.indd 147 09/04/2014 16:22:24

148
2013 Technology Map of the European Strategic Energy Technology Plan
EU27 iron and steel industry under different pay-back periods’, Journal of Cleaner Production, Vol. 52, 2013, pp. 71-83 (http://dx.doi.org/10.1016/j.jclepro.2013.02.028) accessed 7 January 2014.
SET-Plan workshop on Technology Innovations for Energy Efficiency and Greenhouse Gas (GHG) emissions reduction in the Iron and Steel Industries in the EU27 up to 2030, Brussels, 2010.
Sustainable Industry Low Carbon scheme (SILC), I - short-term innovation measures, 2013. 67-G-ENT-CIP-13-D-N03S02
The Boston Consulting Group (BCG), Steel Roadmap for a Low Carbon Europe 2050. Approach and methodology, Brussels, 2013.
Worldsteel Association, Environmental case study. Automotive, 2011a.
Worldsteel Association, 2011b (http://www.worldsteel.org/?action=publicationdetail&id=8) accessed 7 January 2014.
Worldsteel Association, World steel in figures 2012, 2012.
Zero Emissions Platform (ZEP), EU Demonstration Programme for CO2 capture and Storage (CCS). Maximising the benefits of knowledge sharing, 2010.
20.3 The pulp and paper industry
20.3.1 Introduction
Pulp and paper is an energy-intensive indus-try. On average, energy costs are 16 % of their production costs (EIPPCB, 2013) and in some cases they reach up to 30 %. This industry is the largest user and producer of renewable energy (around 50 % of its primary energy consumption comes from biomass) (EIPPCB, 2013). At the same time, in 2008, the bioenergy consumption in the European pulp and paper industry represented more than 16 % of the bioenergy consumed in Europe (AEBIOM, 2010; Alankas, 2010). In the quest for energy efficiency measures, the industry has invested heavily in CHP. In 2010, its electric-ity production from CHP was 50 % (CEPI, 2012) of their electrical consumption. Also, half of the paper produced comes from recycled fibre. This evolution has led to direct absolute CO2 emissions decreasing by 6.9 %, from 1990 to 2010, whereas the pulp and paper production has increased by 30 % and 46 %, respectively (CEPI, 2012). The CO2 emissions from the sector in 2010, around 37 Mt, represented around 2 % of the emissions under the EU ETS.
In 2010, in Europe, the sector had a total turnover of EUR 76.4 billion, employing some 225 000 people directly (CEPI, 2012). Many mills operate in rural areas, making them particularly relevant to regional employment — 60 % of employment in the European pulp and paper industry is located in rural areas.
20.3.2 Technological state of the art and anticipated developments
There are two main routes to produce different types of pulp: from virgin wood or from recy-cled material. The pulp produced in either way is subsequently processed into a variety of paper products. For virgin pulp making, two main kinds of processes are used: chemical and mechanical pulp making. Virgin pulp can be produced along-side paper, on the same site. In Europe, about 18 % of all mills are integrated mills producing both virgin pulp and paper (Ecofys, 2009).
Recycled fibres are the starting point for the recycling route. Europe has one of the highest recovery and utilisation rates of fibres in the world (68.7 % in 200866) (CEPI, 2012). Except for a small number of deinked market pulp mills, pulp production from recycled fibres is always integrated alongside paper production.
66 Recycling rate: ‘Utilization of paper for recycling + net
trade of paper for recycling’, compared to paper and
board consumption (CEPI, 2012).
JRC13_TMAP_08AP14_P5-NS-Print.indd 148 09/04/2014 16:22:25

149
The pulp and paper industry is one of the most energy-intensive sectors of the EU. Pulp and paper production requires the use of power and steam/heat. There are large variations in the energy profiles of different technologies. Raw wood use differs by almost four times between the different paper grades, and energy use dif-fers by a factor of two (EC, 2006). However, in general terms, it can be said that mechanical pulp making is more electricity intensive and less heat intensive than chemical pulping. The electricity/steam consumption ratio at paper mills enables an efficient use of CHP. On the overall European balance, the industry in 2010 bought 67.7 TWh of electricity, sold 10.9 TWh of electricity, and pro-duced 56.6 TWh of electricity (CEPI, 2012); that is, its electricity production amounts to almost 50 % of its electrical consumption.
Specific primary energy consumption in 2010 was 13.9 GJ/t, based on the overall totals of energy and production data (CEPI, 2012); this specific consumption includes 1.90 GJ/t of specific net bought electricity. Half of the energy used by the industry (53 % in 2010) comes from biomass and approximately 38 % from natural gas (CEPI, 2012). Therefore, although the industry is energy intensive, its carbon intensity is not comparable with other sectors.
From 1990 to 2010, the improvement in spe-cific primary energy and electricity consumption has been 13.7 % and 15.3 %, respectively (CEPI, 2012). In a business-as-usual scenario, there is still some room for improvement because the average values of the 10 % of best perform-ers (benchmark levels) have 50 % and 30 % lower specific CO2 emissions than the highest values and the average, respectively (SET-Plan Workshop, 2010). However, tapping this potential improvement requires the replacement of today’s machines with new ones. However, due to the high cost of new machines, this will take time and is dependent on machine age, investment cycles, sector developments and availability of capital. The prime candidates for improvements are the boilers followed by the most energy-intensive part of the paper production and the drying of the paper. There exist several potential breakthrough technologies (see Section 20.3.5) that have not managed to demonstrate market viability yet.
Figure 20.4: Main processes involved in the production of pulp and paper in integrated and non-integrated mills. These are the processes covered in the BREF 2013.
Source: EIPPCB, 2013.
Related activities:• Power and steam generation• Raw water treatment• Waste water treatment• Waste handling and on-site treatment• Storage and handling of chemicals
Mechanical and chemi-mechanical
pulping
Repulping ofImported pulp
Mechanicalcleaning
of recoveredpaper
De-inking(optional)
Stockpreparation
Papermachine
Finishingoperations
Paperproduct
Papermachine
Exportof pulp
Bleaching(optional)
Pulpdrying
Stringently linkedprocess unit
OU
TPU
TS
INPU
TS
De-inking(optional)
Logs
Logs,chips,
saw mill dust
Producedpulp
Recoveredpaper
2013 Technology Map of the European Strategic Energy Technology Plan
JRC13_TMAP_08AP14_P5-NS-Print.indd 149 09/04/2014 16:22:25

150
2013 Technology Map of the European Strategic Energy Technology Plan
20.3.3 Market and industry status and potential
In 2010, the EU paper and board production (reported by the 19 CEPI-associated countries67) was 24.5 % (96.6 Mt) of world production (Asia 42.4 % and North America 22.5 %). Europe also represents about 20.9 % (38.8 Mt) of the world’s total pulp production (CEPI, 2012).
From 1991 to 2010, the EU pulp and paper pro-duction (in CEPI countries) had an average annual growth of 0.6 % and 1.8 % for pulp and paper, respectively, whereas the number of pulp and paper mills has decreased around 40 % (CEPI, 2012). This process of consolidation of the sec-tor has led to fewer and larger companies with a large number of relatively small plants specialis-ing in niche markets. The current total number of pulp and paper mills (all grades) in Europe is 203 and 944, respectively (EIPPCB, 2013).
Finland and Sweden are the countries with the highest number of pulp mills (around 35 each), followed by Germany (19) (EIPPCB, 2013). Their production share in 2011 was 26.7 %, 30.6 % and 7.0 %, respectively (EIPPCB, 2013). The two countries with the highest number of paper mills are Germany and Italy with around 170 mills each, followed by France, with around 95 paper mills (EIPPCB, 2013), with a production share in 2008 of 23.9 %, 9.6 % and 9.0 %, respectively (CEPI, 2012). Other countries (like Finland and Sweden) with a lower number of paper mills (around 40 each) have a higher share of the production, 11.9 % and 11.9 %, respectively (CEPI, 2012). This is because a small amount of new mills are able to account for most of the produc-tion (i.e. for wood-free machines, the 10 % most efficient paper machines produce roughly 40 % of the total production (CEPI, 2012; EC, 2006)).
In 2010, the amount of pulp exported and import-ed to third countries (outside the EU) were 2.3 and 8.0 Mt, respectively, whereas for paper, the figures of the exported and imported paper amounted to 16.9 and 4.5 Mt, respectively (CEPI, 2012).
Since the middle of the 1990s, the sector has invested annually 6–8 % (around EUR 5 billion)
67 CEPI is the Confederation of European Paper Industries
(CEPI), and its mission is to promote its members’
business sectors by taking specific actions, notably, by
monitoring and analysing activities and initiatives in
the areas of industry, environment, energy, forestry,
recycling, fiscal policies and competitiveness in general
(CEPI, 2011a). Its associated countries are: Austria,
Belgium, the Czech Republic, Finland, France, Germany,
Hungary, Italy, the Netherlands, Norway, Poland,
Portugal, Romania, Slovak Republic, Slovenia, Spain,
Sweden, Switzerland and the United Kingdom.
of its annual revenue to improve its capacity. The turnover estimated by CEPI in 2010 was EUR 76.4 billion, and between 2007 and 2010, due to the financial crisis, the production decreased by 7 % and the turnover by 3 %. The European pulp and paper industry has partially recovered; however, it has not reached the pre-crisis levels yet. For certain grades (e.g. newsprint), production is not expected to come back to pre-crisis levels (SET-Plan Workshop, 2010). Overall, the sector keeps growing at a steady pace with a changing product mix and new grades developing as a consequence of long-term societal changes (tissue, because of the ageing population and hygiene needs, packag-ing, etc.). The situation of the sector in the future will also depend largely on the extent to which export markets advance (e.g. the competitiveness of the sector in a global perspective).
20.3.4 Barriers to large-scale deployment
In the short- and long-term perspectives, the avail-ability of raw materials (wood and recycled fibre) will be crucial for the pulp and paper industry. Currently, there is an increasing pressure on bio-mass availability. For their main virgin feedstock, wood, the pulp and paper industry is competing with other bioenergy producers; almost 5 % of the EU gross energy demand is covered by biomass resources. In fact, the biomass was almost two thirds (67.6 %) of all renewable primary energy consumption in 2010 (Eurostat, 2013). At the same time, waste paper is exported at large-scale mainly to China, where new large paper mills use this resource. This leads to shortages in recycled fibres for some European paper producers.
Current research and demonstration in many innovative technologies is nearly stalled. This is related to the fact that many of the already available innovative technologies have not been able to demonstrate market viability yet. Most of the potential emerging technologies are cur-rently in a ‘valley of death’, unable to achieve market deployment. Large-scale demonstration plants could help the breakthrough technolo-gies to cross or leave this valley of death and demonstrate market viability. If the emerging technologies are not deployed, the expected improvement of the sector in energy consump-tion and emissions is roughly estimated at about 25 % by 2050, achievable through the deploy-ment of BATs in two investment cycles from now to 2050 (CEPI, 2011b).
Despite the high penetration of cogeneration in the European pulp and paper industry, it is esti-mated that only 40 % of CHP potential capacity has been installed in this industry (ASPAPEL, 2011). The barriers that the sector faces to fur-ther expansion of CHP are similar to the ones that the rest of the industry sector encounters (ASPAPEL, 2011). One of the main barriers is the
JRC13_TMAP_08AP14_P5-NS-Print.indd 150 09/04/2014 16:22:25

151
2013 Technology Map of the European Strategic Energy Technology Plan
‘spread price’ (Moya, 2013; SET-Plan Workshop, 2010), the difference between the price of the fuel used by the CHP and the price of the electric-ity generated. Priority grid access and dispatch for CHP electricity sold back to the national grid might enhance faster and wider implementa-tion. Also, the trend by many municipalities to decrease the availability of waste to be recycled by the energy-intensive industries may further hamper reaching higher levels of efficiency.
The industry has pointed out the risks of carbon leakage under the terms of the former EU ETS (Directive 2003/87/EC). Sensitive to these con-cerns, the revised Directive (Directive 2009/29/EC) stipulates that industrial sectors exposed to carbon leakage receive free emissions allow-ances equivalent to 100 % of benchmark values. The sectors exposed were determined by the European Commission in December 2009 (EC, 2009); the pulp and paper industry is among them. The benchmarking values proposed by the European Commission, were adopted in April 2011 (EC, 2011). The European Commission has launched the SILC initiative (SILC, 2013) to help the industry achieve specific GHG emis-sion intensity reductions in order to maintain its competitiveness. Also, the lack of detailed and consolidated information about consumptions and emissions of most of the pulp and paper technologies is a barrier in itself. Potential policy measures need to be justified and prioritised on sound data and robust impact calculations. The SILC initiative could also contribute to alleviate this issue. On a larger scale, the sector will be able to take advantage of the SPIRE partner-ship programme (SPIRE, 2013). This is a major cross-sectoral partnership planning to channel EUR 1.4 billion in private sector research spend-ing to resource and energy efficiency in Europe’s process industries.
20.3.5 RD&D priorities and current initiatives
In general terms, and similar to other energy-intensive industries, the pulp and paper indus-try devotes around 1 to 2 % of its turnover to R&D. However, many companies focus their R&D investments mainly on new products, leaving most of the investment in R&D regarding tech-nology and processes to a small number of specialised machine and equipment suppliers (SET-Plan Workshop, 2010). Although Europe is the global technology leader, the technology sup-pliers mainly develop modular-based solutions for the EU pulp and paper industry that operates in a stable market, whereas the suppliers focus on Asia and South America for the development of new mill concepts.
There are potential emerging and break-through technologies, although most are
currently at a standstill. These can be grouped in the following families.
• The bio-route is the route towards integrated biorefinery complexes producing bio-pulp, bio-paper, biochemicals, biofuels, bioenergy and possibly bio-CCS. Some of the bio-route concepts are in the EIBI. In fact, as part of this Initiative, there is a first large-scale dem-onstrator, a bio-DME plant in connection to a pulp mill, under construction in Sweden (Bio-DME, 2011) (see Figure 20.5). Also, one of the flagships planned for this Initiative is led by a Finnish pulp and paper company (EIBI, 2013; UPM, 2011). Part of this route is also the further development of gasification of black liquor, which aims at producing a combustible mixture of raw gases on the one hand and separating out the inorganic pulping chemicals on the other for their subsequent use in the pulping processes. Lignoboost, another bio-route concept, is a complete sys-tem that extracts lignin, a component of wood, from kraft black liquor. This lignin can be used as a biofuel with a relatively high heating value and could also be used as feedstock to produce innovative chemicals.
• Innovative drying technologies. Some dry-ing technologies, such as ‘impulse drying’, the ‘Condebelt’ process, or the ‘steam impinge-ment drying, have only had a first-of-a-kind implementation, and have not been replicated. The first European commercial facility with a condebelt® process entered into operation in 1996 at the Pankaboard mill in Pankakoski, Finland. There is a second case of implemen-tation of this technology in 1999 in South Korea (Åsblad, 2001). Research and demon-stration regarding innovative drying technolo-gies seems to be at a standstill.
• Mechanical pulping. There is ongoing work, at laboratory studies-level, to optimise the production of mechanical pulp focusing mainly on the wood yield preparation and more effi-cient refiner plates (less energy consumption at the same productivity levels).
The aggregated nature of the information avail-able at EU sector-level makes it difficult to assess the impact that individual technologies for the pulp and paper industry could have at the energy system level. Nevertheless, the roadmap of the sector (CEPI, 2011b) provides first estimates of savings potentials that could be achieved through a larger-scale deployment of the above-listed breakthrough technologies and BATs.
The EU is contributing to the four projects funded under the European Commission’s Sustainable Biorefineries Call (Star-COLIBRI, SUPRABIO, EuroBioRef and BIOCORE (Star-COLIBRI,
JRC13_TMAP_08AP14_P5-NS-Print.indd 151 09/04/2014 16:22:25

152
2013 Technology Map of the European Strategic Energy Technology Plan
2011)) with EUR 51.6 million of a total budget of EUR 79.1 million. Also, part of the support needed to develop the bio-route can be chan-nelled through the EIBI (EIBI, 2013) with projects like Bio-DME (Bio-DME, 2011) and UPN (UPN, 2011). However, the large investments needed to jump from pilot plant to full-scale applica-tion may require an additional push to allow the industry to leave the apparent ‘valley of death’ in which much of the research is. A number of these investments bring financial risks that mills cannot take in the current economic conditions and for which assistance is needed. Furthermore, several large-scale technologies are compet-ing in the same field, where it is not clear yet which one will be the winning technology. For those commercially available drying technolo-gies, the market seems to doubt their potential so far since very few new machines have been deployed. Next to the investment cost factor, trust or reliability of new technologies seems to be an issue.
Although the 2050 roadmap of the sector (CEPI, 2011b) does not include the CCS option, one important synergy in the quest to curb CO2 emis-sions could be exploited through sharing innova-tion initiatives with the power sector or with any other (energy-intensive) manufacturing industries that could launch initiatives in the field of CCS (e.g. iron and steel industry and cement industry) (EBTP – ZEP, 2012; ZEP, 2010; ESTEP, 2009).
20.3.6 References
Alankas, E., Forest industry and bioenergy – Overview of EUBIONET III results, 2010.
Åsblad, A., Franck, P., Berntsson, T., Learning from experiences with Energy conservation in the pulp and Paper Industry, Centre for the analysis and
dissemination of demonstrated energy technolo-gies (CADDET), 2001.
Bio-DME, Domsjö research and development (R&D) project, 2011 (http://www.chemrec.se/Domsjoe_Fabriker_producing_green_fuels_with_Chemrec.aspx) accessed 7 January 2014.
Confederation of European Paper Industries (CEPI), Key Statistics 2011. European Pulp and Paper Industry, 2012.
Confederation of European Paper Industries (CEPI), Who is CEPI?, 2011a (http://www.cepi.org/) accessed 7 January 2014.
Confederation of European Paper Industries (CEPI), Unfolding the future. The forest Fibre Industry. 2050 Roadmap to a low-carbon bio-economy, 2011b (http://www.unfoldthefuture.eu/uploads/CEPI-2050-Roadmap-to-a-low-carbon-bio-economy.pdf) accessed 7 January 2014.
Directive 2003/87/EC of the European Parliament and of the Council of 13 October 2003 estab-lishing a scheme for greenhouse gas emission allowance trading within the Community and amending Council Directive 96/61/EC.
Directive 2009/29/EC of the European Parliament and of the Council of 23 April 2009 amending Directive 2003/87/EC so as to improve and extend the greenhouse gas emission allowance trading scheme of the Community.
Ecofys, Fraunhofer ISI and Öko-Institut, Methodology for the free allocation of emission allowances in the EU ETS post 2012, Sector report for the pulp and paper industry by order of the European Commission, 2009.
Figure 20.5: Photomontage of gasification plant
producing green fuels dimethyl ether, ether and
methanol at Domsjoe Fabriker. The plant is
expected to be ready in 2013.
Source: CHEMREC (http://www.chemrec.se/Page228.
aspx).
JRC13_TMAP_08AP14_P5-NS-Print.indd 152 09/04/2014 16:22:28

153
2013 Technology Map of the European Strategic Energy Technology Plan
European Biofuels Technology Platform/Zero Emissions Platform (EBTP/ZEP), Biomass with CO2 Capture and Storage (Bio-CCS); The way forward for Europe, 2012.
European Biomass Association (AEBIOM), AEBIOM Position. BIOENERGY 2030 - European Energy issues and the development of bio-energy towards 2030, 2010.
European Commission (EC), Development of a Model of the Worlds Pulp and Paper Industry. EUR 22544, JRC- IPTS, 2006.
European Commission (EC), European Energy and Transport Trends to 2030 – Update 2007, Directorate-General for Energy and Transport, 2007.
European Commission (EC), Commission Decision of 24 December 2009 determining, pursuant Directive 2003/87/EC of the European Parliament and of the council, a list of sectors and subsectors which are deemed to be exposed to a significant risk of carbon leakage, 2009.
European Commission (EC), Commission Decision of 27 April 2011 determining transitional Union-wide rules for harmonised free allocation of emission allowances pursuant to Article 10a of Directive 2003/87/EC, 2011.
European Industrial Bioenergy Initiative (EIBI), 2013 (http://www.biofuelstp.eu/eibi.html) accessed 7 January 2014.
European Integrated Pollution Prevention and Control Bureau (EIPPCB), Reference Document on Best Available Techniques for the Production of Pulp and Paper, JRC-IPTS IPPC, 2001.
European Integrated Pollution Prevention and Control Bureau (EIPPCB), Draft Reference Document on Best Available Techniques for the Production of Pulp and Paper, JRC-IPTS IPPC, 2013.
European Steel Technology Platform (ESTEP), A bridge to the future. STEEL a key partner in the European low-carbon economy of tomorrow, 2009.
Eurostat, 2013 (http://epp.eurostat.ec.europa.eu/statistics_explained/index.php?title=File:Primary_production_of_renewable_energy,_2000_and_2010.png&filetimestamp=20121214154330) accessed 7 January 2014.
Javier Rodríguez Morales (ASPAPEL – Spanish Association of Pulp and Paper manufactures), The use of cogeneration in European key industry sectors, presentation in the 2011 EU Sustainable Energy Week, Brussels, 2011.
JRC-SETIS Work Group, European Commission, Technology Map of the European Strategic Energy Technology Plan (SET-Plan), Euro-Report EUR 24117 EN, 2009. ISBN 978-92-79-14587-2
Moya, J.A., ‘Impact of support schemes and bar-riers in Europe on the evolution of cogenera-tion’, Energy Policy, Vol. 60, September 2013, pp. 345-355.
SET-Plan Workshop on Technology Innovations for Energy Efficiency and Greenhouse Gas (GHG) emis-sions reduction in the Pulp and Paper Industries in the EU27 up to 2030, Brussels, 2010.
SPIRE Roadmap, 2013 (http://www.spire2030.eu/library) accessed 7 January 2014.
Star-COLIBRI project: biorefinery clustering, 2011 (http://www.star-colibri.eu/about-star-colibri/sis-ter-projects/) accessed 7 January 2014.
Sustainable Industry Low Carbon scheme (SILC), I - short-term innovation measures - 67-G-ENT-CIP-13-D-N03S02, 2013 (http://ec.europa.eu/research/participants/portal/page/call_CIP?callIdentifier=67-G-ENT-CIP-13-D-N03S02&specificProgram=EIP) accessed 7 January 2014.
UPM, 2011 (http://www.upm.com/EN/MEDIA/All-news/Pages/UPM-selects-Rauma-or-Strasbourg-as-the-possible-location-for-a-biorefinery-002-Thu-31-Mar-2011-15-44.aspx) accessed 7 January 2014.
Zero Emissions Platform (ZEP), Maximising the benefits of knowledge sharing, EU Demonstration Programme for CO2 capture and Storage (CCS), 2010.
JRC13_TMAP_08AP14_P5-NS-Print.indd 153 09/04/2014 16:22:28

154
Abbreviations and Acronyms
ACH Air Changes per HourAD Anaerobic Digestion
AEBIOM European Biomass AssociationAGR Advanced Gas Cooled ReactorsAMF Advanced Motor Fuels
ANCCLI National Association of Local Information Commissions and Committees
ASHP Air-Source Heat PumpASN French Safety Authorities
ASPAPEL Spanish Association of Pulp and Paper Manufactures
A-USC Advanced Ultra-SupercriticalBAT Best Available Techniques BCG The Boston Consulting Group
BEMIP Baltic Energy Market Interconnection PlanBESTF Bioenergy Sustaining the Future
BF Blast FurnaceBIGCC Biomass Integrated Gasification Combined
CycleBIG-GT Biomass Integrated Gas TurbineBiMEP Biscay Marine Energy Platform
bio-CCS bio-Carbon Capture and StorageBIOFRAC Biofuels Research Advisory Council
BNEF Bloomberg New Energy FinanceBOF Basic Oxygen Furnace
BP British PetroleumBREF Best Available Techniques Reference Document
BTL Biomass-to-LiquidBWEA British Wind Energy AssociationCAES Compressed Air Energy StorageCAGR Compound Annual Growth Rate
CANDU Heavy Water ReactorsCapEx Capital Expenditures
CCS Carbon Capture and StorageCCU Carbon Capture and Utilisation
CCUS Carbon Capture Utilisation and StorageCEN Comité Européen de Normalisation (European
Committee for Standardization)CENELEC European Committee for Electrotechnical
StandardizationCEPI Confederation of European Paper Industries
CF Capacity FactorCHHP Combined Hydrogen Production, Heat and
PowerCHP Combined Heat and PowerCNY Chinese YuanCOE Cost of ElectricityCoE Cost of EnergyCOP Coefficient of PerformanceCSD Compression, Storage and Dispensing
CSI Cement Sustainability InitiativeCSLF Carbon Sequestration Leadership ForumCSP Concentrated Solar PowerCTD Critical Technology DevelopmentCTF Clean Technology Fund
CWEA Chinese Wind Energy AssociationDanWEC Danish Wave Energy Centre
DECC Department of Energy & Climate ChangeDEMO Demonstration Power PlantDFIG Doubly-Fed Induction Generator
DG Directorate GeneralDH District Heating
DHC District Heating and CoolingDIGESPO DIstributed CHP GEneration from small size
concentrated Solar PowerDLR Deutschen Zentrums für Luft- und Raumfahrt
(German Aerospace Center)DME Dimethyl EtherDNI Direct Normal IrradianceDOE U.S. Department of Energy E&P Euroheat & Power
EASE European Association for Storage of EnergyEBIT Earnings Before Interest and Taxes EBTP European Biofuels Technology Platform
EC European CommissionECRA European Cement Research Academy
EEA European Environmental AgencyEECRsteel First International Conference on Energy
efficiency and CO2 Reduction in the Steel Industry
EED Energy Efficiency DirectiveEEGI European Electricity Grid InitiativeEEPR European Energy Program for RecoveryEERA European Energy Research AllianceEESC European Economic and Social CommitteeEESD Energy, end-use Efficiency and Energy Services
DirectiveEFDA European Fusion Development Agreement
EGE European Group on Ethics of science and new technologies
EGEC European Geothermal Energy CouncilEGII European Geothermal Industrial Initiative
EGRIF European Geothermal Risk Insurance FundEGS Enhanced Geothermal System
EHPA European Heat Pump AssociationEIA U.S. Energy Information Administration
EIBI European Industrial Bioenergy InitiativeEII European Industrial Initiative
EIPPCB European Integrated Pollution Prevention and Control Bureau
JRC13_TMAP_08AP14_P5-NS-Print.indd 154 09/04/2014 16:22:29

155
EISA Energy Independence and Security ActEMEC European Marine Energy CentreEMG Electromagnets
ENEF European Nuclear Energy ForumENSREG European Nuclear Safety Regulators forumENTSOE European Network of Transmission System
Operators for ElectricityEOR Enhanced Oil RecoveryEPA U.S. Environmental Protection Agency
EPBD Energy Performance of Buildings DirectiveEPC Engineering, Procurement and Construction
EPIA European Photovoltaic Industry AssociationEPR European Pressurised Reactors
EPRI Electric Power Research InstituteERA European Research AreaERC European Research Council
EREC European Renewable Energy CouncilESNII European Sustainable Nuclear Industrial
InitiativeESO European Standards Organisation
ESTELA European Solar Thermal Electricity AssociationESTEP European Steel Technology PlatformETBE Ethyl Tertiary Butyl Ether
ETC/RWM European Topic Centre on Resource and Waste Management
ETRI Energy Technology Reference IndicatorsETS Emission Trading System
ETSAP Energy Technology Systems Analysis ProgramETSI European Telecommunications Standards
InstituteEU European Union
EUOEA European Ocean Energy Association Eurima European Insulation Manufacturers AssociationEVEDA Engineering Validation and Engineering Design
Activities EWEA European Wind Energy Association
EWI European Wind InitiativeF4E Fusion for EnergyFAO Food and Agriculture OrganizationFBC Fluidised Bed Combustion
FC Fuel CellFCEV Fuel Cells Electric Vehicle FCH Fuel cells and Hydrogen
FCH-JU Fuel Cell and Hydrogen Joint UndertakingFIT Feed-in TariffFPL Florida Power & LightFPs Framework Programmes ()FTE Full-Time Equivalent
Gen II Second GenerationGen III Third GenerationGen IV Fourth Generation
GH Garrad HassanGHG Greenhouse GasesGIF Generation IV International Forum
GNR Getting the Numbers RightGWEC Global Wind Energy CouncilGWP Global Warming PotentialHCE Heat Collection ElementHDR Hot Dry RockHEA Hydro Equipment Association
HP Heat PumpHVAC High-Voltage Alternating CurrentHVDC High-Voltage Direct Current
HVO Hydro-treated Vegetable OilIAEA International Atomic Energy Agency
ICE Internal Combustion EngineICT Information and Communication TechnologyIEA International Energy Agency
IEA HPP International Energy Agency Heat Pump Program
IEC International Electrotechnical CommitteeIEE Intelligent Energy EuropeIFE Institutt for Energiteknikk (Institute for Energy
Technology)IFERC International Fusion Energy Research CentreIFMIF International Fusion Materials Irradiation
FacilityIFPRI International Food Policy Research InstituteIGCC Integrated Gasification Combined CycleIGFC Integrated Gasification Fuel CellILUC Indirect Land-Use ChangesIPCC Intergovernmental Panel for Climate ChangeIPPC Integrated Pollution Prevention and ControlIPR Intellectual Property Rights
IPTS Institute for Prospective Technological StudiesIRENA International Renewable Energy Agency
ITER International Thermonuclear Experimental Reactor
JET Joint European TorusJRC Joint Research Centre
KSTAR Korea Superconducting Tokamak Advanced Research
LCA Life Cycle AnalysisLCNF Low Carbon Network FundLCOE Levelised Cost of ElectricityLDV Light Duty Vehicle
LF Load Factors LFR Lead-cooled Fast ReactorLHP Large Hydropower PlantLHV Lower Heating Value
LIPAc Linear IFMIF Prototype AcceleratorLS-EMG Low-Speed Electromagnet Generator
LWR Light Water ReactorMAIP Multi-Annual Implementation Plan
m-CHP micro-Combined Heat and PowerMENA Middle East and North AfricaMETI Ministry of Economy, Trade and IndustryMFF Multiannual Financial FrameworkMML Mott MacDonald
MS Member StatesMSW Municipal Solid WasteNC2I Nuclear Cogeneration Industrial InitiativeNEA Nuclear Energy Agency
NER300 New Entrants Reserve 300NGCC Natural Gas Combined Cycle
NIMBY Not In My Back YardNREAP National Renewable Energy Action Plan
NREL National Renewable Energy Laboratory NSI North-South Interconnections
NSOG Northern Seas Offshore GridO&M Operation & MaintenanceOCGT Open-Cycle Gas TurbineOECD Organisation for Economic Co-operation and
Development OEM Original Equipment ManufacturerOES Ocean Energy Systems
JRC13_TMAP_08AP14_P5-NS-Print.indd 155 09/04/2014 16:22:29

156
OpEx Operational ExpendituresORC Organic Rankine Cycle
OTEC Ocean Thermal Energy ConversionOWC Oscillating Water Columns
PC Pulverised CoalPCS Power Conversion System
PEMFC Proton Exchange Membrane Fuel CellPHS Pumped Hydropower StoragePMG Permanent Magnet Generator
PPCS Power Plant Conceptual StudyPSA Pressure Swing AdsorptionPV Photovoltaic
PWR Pressurized Water ReactorR&D Research & Development
RD&D Research, Development & DemonstrationRDD&D Research, Development, Demonstration &
DeploymentRED Renewable Energy Directive
REN21 Renewable Energy Policy Network for the 21st Century
RES Renewable Energy SourcesRFA Renewable Fuel AgencyRFS Renewable Fuels StandardRHC European Technology Platform on Renewable
Heating and CoolingROAD Rotterdam Opslag en Afvang
DemonstratieprojectRoR Run-of-the-RiverSC Supercritical
SCIG Squirrel Cage Induction Generator SEGS Solar Energy Generating SystemsSEIA Solar Energy Industry AssociationSEII Solar Europe Industry InitiativeSES Smart Electricity Systems
SETIS Strategic Energy Technology Information System
SET-Plan Strategic Energy Technology PlanSFR Sodium-cooled Fast Reactors
SHERPA Small Hydro Energy Efficient Promotion Campaign Action
SHP Small HydropowerSHW Sanitary Hot Water
SI Ocean Strategic Initiative of Ocean EnergySILC Sustainable Industry Low Carbon scheme
SPIRE Sustainable Process Industry through Resource and Energy Efficiency
SMR Small- and Medium-sized ReactorsSNETP Sustainable Nuclear Energy Technology
PlatformSNG Synthetic Natural Gas
SOFC Solid Oxide Fuel CellSOWFIA Streamlining Ocean Wave Farm Impact
Assessment SRA Strategic Research AgendaSRC Short Rotation CoppiceSRF Short Rotation ForestryTES Thermal Energy StorageTP Technology Platform
TP-Geoelec Technology Platform on Geothermal ElectricityTPV Thermo-Photovoltaic
TPWind European Wind Technology PlatformTSO Transmission System Operator
ULCOS Ultra-Low CO2 Steelmaking
UNECE United Nations Economic Commission for Europe
USC Ultra-SupercriticalUSD US Dollars
USDA U.S. Department of AgricultureVAT Value Added Tax
W&T Wave & TidalWB The World Bank
WBCSD World Business Council for Sustainable Development
WFD Water Framework DirectiveWGS Water-Gas-Shift ReactorWID Waste Incineration Directive
WNA World Nuclear AssociationWRIG Wound-Rotor Induction Generator
ZEP Zero Emissions PlatformZEP ETP European Technology Platform for Zero
Emission Fossil Fuel Power PlantsZEPT Zero Emission Porto Tolle Project
JRC13_TMAP_08AP14_P5-NS-Print.indd 156 09/04/2014 16:22:29

European Commission
EUR 26345 – Joint Research Centre – Institute for Energy and TransportTitle: : 2013 Technology Map of the European Strategic Energy Technology Plan (SET-Plan)
Luxembourg: Publications Office of the European Union
2014 — 156 pp. — 21.0 x 29.7 cm
EUR – Scientific and Technical Research series – ISSN 1018-5593 (print) - ISSN 1831-9424 (online)
ISBN 978-92-79-34721-4 (print)
ISBN 978-92-79-34720-7 (pdf)
doi: 10.2790/9986 (print)
doi: 10.2790/99812 (online)
Abstract
The Technology Map is one of the principal regular deliverables of SETIS. It is prepared by JRC scientists in collaboration with colleagues from other services of the European Commission and with experts from industry, national authorities and academia to provide:
• a concise and authoritative assessment of the state of the art of a wide portfolio of low-carbon energy technologies;
• their current and estimated future market penetration and the barriers to their large-scale deployment;
• the ongoing and planned R&D and demonstration efforts to overcome technological barriers;
• reference values for their operational and economic performance, which can be used for the modelling and analytical work performed in support of implementation of the SET-Plan.
This fourth edition of the Technology Map, i.e. the 2013 update, addresses 22 different technologies, covering the whole spectrum of the energy system, including both supply and demand technologies, namely: Wind Power Generation, Solar Photovoltaic Electricity Generation, Concentrated Solar Power Generation, Hydropower, Geothermal Energy, Marine Energy, Cogeneration or Combined Heat and Power, Carbon Capture and Storage in Power Generation, Advanced Fossil Fuel Power Generation, Nuclear Fission Power Generation, Nuclear Fusion Power Generation, Smart Grids, Bioenergy - Power and Heat Generation, Biofuels for the Transport Sector, Fuel Cells and Hydrogen, Electricity Storage in the Power Sector, Energy Efficiency and CO2 Emission Reduction in Industry (The Cement Industry, The Iron and Steel Industry, The Pulp and Paper Industry), Heating and Cooling, Heat Pumps and Energy Performance of Buildings.
Comparing the status of the low carbon technologies in the Technology Map 2011 and the Technology Map 2013 highlights the following distinguishable trends:
• some types of renewable energy sources have added significant capacity (e.g. solar PV, onshore wind and biomass), whereas the development is slower for others (e.g. carbon capture and storage, marine energy and geothermal energy);
• the lack of cost competitiveness compared to fossil fuels remains a key barrier for most low carbon technologies;
• barriers to large-scale implementation of renewables have increased in some countries due to reduced financial support. In addition, the very low-carbon emission costs of the EU ETS are disadvantageous for low-carbon technologies versus fossil fuels;
• the increasing share of variable renewables and their low operating costs reduce electricity costs, but discourage investments in conventional power production. This could disrupt the security of supply in the longer perspective if not addressed properly;
• a stable regulatory framework providing a predictable investment environment is needed for most technologies.
How to obtain EU publicationsFree publications:• one copy:
via EU Bookshop (http://bookshop.europa.eu);• more than one copy or posters/maps:
from the European Union’s representations (http://ec.europa.eu/represent_en.htm); from the delegations in non-EU countries (http://eeas.europa.eu/delegations/index_en.htm); by contacting the Europe Direct service (http://europa.eu/europedirect/index_en.htm) or calling 00 800 6 7 8 9 10 11 (freephone number from anywhere in the EU) (*). (*) The information given is free, as are most calls (though some operators, phone boxes or hotels may charge you).
Priced publications:• via EU Bookshop (http://bookshop.europa.eu);
Priced subscriptions:• via one of the sales agents of the Publications Office of the European Union
(http://publications.europa.eu/others/agents/index_en.htm).
JRC13_TMAP_08AP14_P5-NS-Print.indd 3 09/04/2014 16:22:29

LD-N
A-26345-EN
-C
JRC Mission
As the Commission’sin-house science service, the Joint Research Centre’s mission is to provide EU policies with independent, evidence-based scien-tific and technical support throughout the wholepolicy cycle.
Working in close coop-eration with policy Direc-torates-General, the JRC addresses key societal chal-lenges while stimulating innovation through develop-ing new methods, tools and standards, and sharing its know-how with the Member States, the scientific com-munity and international partners.
Serving societyStimulating innovationSupporting legislation
LD-NA-26345-EN-
C
doi: 10.2790/9986
JRC13_TMAP_08AP14_P5-NS-Print.indd 4 09/04/2014 16:22:30