2013–2014 - ocpe.nt.gov.au · dcm department of the chief minister ... concluding with a case...
TRANSCRIPT

OFFICE OF THE COMMISSIONER FOR PUBLIC EMPLOYMENT
State of the Service Report2013–2014

OFFICE OF THE COMMISSIONER FOR PUBLIC EMPLOYMENT
STATE OF THE SERVICE REPORT 2013-14
Purpose of the Report
The Commissioner for Public Employment is responsible for giving an account of the performance of the Northern Territory Public Sector and this is done through the State of the Service Report (with statistical supplement) which is a separate report to the Office of the Commissioner for Public Employment Annual Report 2013-14.
Published by the Office of the Commissioner for Public Employment.
© Northern Territory Government of Australia 2014
Apart from any use permitted under the Australian Copyright Act, no part of this document may be reproduced without prior written permission from the Northern Territory Government through the Office of the Commissioner for Public Employment.
ISSN 1835-3037
Enquiries should be made to:
The Office of the Commissioner for Public Employment
GPO Box 4371 Darwin NT 0801
Telephone: 08 8999 4282 Facsimile: 08 8999 4186 Email: [email protected] Web: www.nt.gov.au/ocpe

01
STATE OF TH
E SERVICE REPORT 2013–
14
Letter to the Minister
The Honourable John Elferink MLA Minister for Public Employment GPO Box 3146 DARWIN NT 0801
Dear Minister Elferink
RE: STATE OF THE SERVICE REPORT 2013-14
In accordance with the Public Sector Employment and Management Act (PSEMA), I present to you the State of the Service Report 2013-14 for the Northern Territory Public Sector.
The report is divided into eight sections, meeting the requirements of section 18 of PSEMA and providing a statistical analysis of state of the service indicators. Together, these eight sections help to assess human resource management practices, including the extent to which agencies comply with the principles of human resource management, administration management, and performance and conduct as prescribed by PSEMA.
The report draws on a range of information sources, primarily an Agency Reporting Survey in which Chief Executive Officers are required to critically analyse and report on the application of human resource management processes within their agencies.
I can report that all agencies have established processes that ensure the observance of the human resource management principle and the performance and conduct principle, and no significant breaches or evasions of the principles have been detected or brought to my attention.
It is a requirement of section 18(4) of PSEMA that you lay a copy of this report before the Legislative Assembly within six sitting days of its receipt.
Yours sincerely
Craig Allen Commissioner for Public Employment
30 September 2014

STAT
E O
F TH
E SE
RVIC
E RE
PORT
201
3–14
02
TABLE OF CONTENTS
01
02
03
05
06
07
08
14
21
29
37
42
50
58
88
89
91
92
Letter to the Minister
Contents
List of Figures
Acronyms and Abbreviations
Commissioner’s Foreword
Report Overview
The NTPS at a Glance
Attracting Talent
Recruiting People in the NTPS
Working in the NTPS
Managing Our People
Developing Our People
Planning Our Future Workforce
Staffing Profile of the NTPS
Public Sector Principles
Employment Instructions
Feedback Form
How to Contact Us
Introduction
Appendices
03
STATE OF TH
E SERVICE REPORT 2013–
14
List of Figures
Figure 1: The Employment Cycle 6
Figure 2: Growth in the NTPS, Labour Force and Population June 1983-2014 9
Figure 3: Movements in NT Population and NTPS Staff 1983-2014 10
Figure 4: Age of NTPS Employees 1994 and 2014 12
Figure 5: Age distribution employed NTPS vs NT total 12
Figure 6: Flexible Workplace Practices that agencies have adopted 15
Figure 7: Representation of Equal Opportunity Groups in the NTPS 16
Figure 8: Job Evaluation in the NTPS 24
Figure 9: Merit Based Employment 26
Figure 10: Number and Percentage of NTPS Promotions Appealed 27
Figure 11: Outcome of NTPS Promotion Appeals 27
Figure 12: Agencies that provide Employee Access to Information 32
Figure 13: Grievance Reviews Commonly Raised Issues 33
Figure 14: NTPS Values 34
Figure 15: NTPS Values Framework 36
Figure 16: Summary of Discipline 2011-14 40
Figure 17: Inability or Unsatisfactory Performance Cases 2011-14 40
Figure 18: Number of Agencies with a Workforce Plan 51
Figure 19: Agency Approaches to Succession Planning 51
Figure 20: Representation of Equal Opportunity Groups in the NTPS 60
Figure 21: Growth in the NTPS, Labour Force and Population June 1983-2014 61
Figure 22: Movements in NT Population and NTPS Staff 1983-2014 63
Figure 23: Changes to Average Public Sector Staff Employed by Agency: June Quarter 2011 to June Quarter 2014 64
Figure 24: Employment Status of NTPS Staff 2004-2014 65
Figure 25: Part-time in the NTPS 2003-2014 66

STAT
E O
F TH
E SE
RVIC
E RE
PORT
201
3–14
04
Figure 26: Proportion of Women in the NTPS 1993-2014 67
Figure 27: Part-time Employees by Age and Gender: June 2014 68
Figure 28: Proportion of Part-time Employees in Age Groups by Gender: June 2014 68
Figure 29: Proportions of Women and Men by Agency (All Employees) 2014 69
Figure 30: Percentage of Women by Employment Stream June 1994 to June 2014 with Overall Percentage Change Since 1994 70
Figure 31: Proportion of Ongoing Staff by Gender NTPS 1994-2014 71
Figure 32: Distribution of Men and Women in the NTPS by Age Group (All Employees) 2014 72
Figure 33 Distribution of Women in the NTPS by Age Group June 1994 and June 2014 73
Figure 34: Distribution of Men in the NTPS by Age Group June 1994 and June 2014 73
Figure 35: Average Age by Gender NTPS Staff 1994-2014 74
Figure 36: Length of Service by Gender NTPS Staff – 2014 – Ongoing Employees 75
Figure 37: Distribution of Men and Women in the NTPS by Employment Category June 2014 (Change in Total Stream Proportion Since 1994) 76
Figure 38: Distribution of Men and Women in the NTPS by Salary Level - June 2014 77
Figure 39: Distribution of Men and Women in the NTPS by Salary Level -June 1995 78
Figure 40: Average Age by Classification Stream June 2014 All Employees with Change in Median Age Since 1994 79
Figure 41: Change in Executive Contract Numbers by Classification and Gender 2013-2014 80
Figure 42: NTPS Separation and Recruitment Rates by Employment Category: 2008-09 to 2013-14 Ongoing Staff* 81
Figure 43: NTPS Separation and Recruitment Rates by Employment Category: 2008-09 to 2013-14 (Ongoing and Fixed period) 82
Figure 44: Separation Statistics for 2013-14 (Ongoing and Fixed period Staff) 83
Figure 45: Days Personal Leave Taken by Individuals in the NTPS in 2013-14 (All Employees) 85
Figure 46: NTPS Median Personal Leave Days Taken per Employee 1995 2014 (data not reliable pre 1995) 86
Figure 47: NTPS Average (Mean) Sick Days Taken per Employee by Stream by Gender 2013-14 86

05
STATE OF TH
E SERVICE REPORT 2013–
14
Acronyms and Abbreviations
AAPA Aboriginal Areas Protection Authority
ANZSOG Australia and New Zealand School of Government
BPI Budget Profiling Interface
CCAT Cross Cultural Awareness Training
CEO Chief Executive Officer
CLF NTPS Capability and Leadership Framework
CPE Commissioner for Public Employment
DCF Department of Children and Families
DCIS Department of Corporate and Information Services
DCM Department of the Chief Minister
DCS Department of Correctional Services
DEP Disability Employment Program
DLPE Department of Lands, Planning and Environment
DLRM Department of Land Resource Management
DME Department of Mines and Energy
DoE Department of Education
DoI Department of Infrastructure
DoH Department of Health
DoT Department of Transport
DPC Darwin Port Corporation
DTF Department of Treasury and Finance
ECP Early Careers Program
EEO Equal Employment Opportunity
EI Employment Instruction
FOILs Fares Out of Isolated Locality
FTE Full Time Equivalent
HR Human Resources
IECDS Indigenous Employment and Career Development Strategy
JES Mercer Job Evaluation System
LPS Learning Pathways Strategy
NT Northern Territory
NTEC Northern Territory Electoral Commission
NTG Northern Territory Government
NTPS Northern Territory Public Sector
OCPE Office of the Commissioner for Public Employment
PFES Police, Fire and Emergency Services
PIPS Personnel Integrated Payroll System
PSA&GR OCPE Public Sector Appeals & Grievance Reviews Division
PSEMA Public Sector Employment and Management Act
PWC Power and Water Corporation
PWCNT Parks and Wildlife Commission of the Northern Territory
TRS Teacher Recruitment System

STAT
E O
F TH
E SE
RVIC
E RE
PORT
201
3–14
06
Welcome to the annual NTG State of the Service Report. This report is the result of a substantial reporting process by NTPS agencies against indicators to help assess the ‘people’ health of the sector.
As we move into an increasingly challenging environment a greater emphasis is placed on the sector’s most valuable resource, its people. The State of the Service Report 2013-14 is framed around the employment cycle (Figure 1) and outlines what we, as a sector, are doing to ensure we have capable people to support the continuing challenges of providing first class services to Territorians.
Figure 1: The Employment Cycle
The 2013-14 report is presented in eight sections:
• The NTPS at a Glance
• Attracting Talent
• Recruiting People in the NTPS
• Working in the NTPS
• Managing our People
• Developing our People
• Planning our Future Workforce and
• Staffing Profile of the NTPS
Agencies’ responses to the State of the Service Survey have informed the statistics/data and commentary of the first seven sections of this
report, with data extracted from PIPS informing the statistics/data and commentary in the Staffing Profile of the NTPS section:
Each section outlines the performance and current initiatives that agencies reported concluding with a case study that provide real examples of what has worked in the agenices.
For the first time, the collection of data for this report was moved to an online format. The change was intended to streamline the reporting process for agencies, maximising efficiencies. The layout of the report has also been altered, while continuing to meet all legislative requirements. I trust the changes made to the format provide relevance to the broader sector and allow for a greater audience to benefit from the publication. The value of this report is increased by the significant continuity of data, as this report has been published for the last eight years. Lessons learned from this year’s process will allow for ongoing refinement of the process for 2014-15.
An identified need for more accurate and relevant HR reporting was identified in the last reporting period. In response, a significant project was completed to develop a suite of Sector Wide Workforce Metrics. The suite features 31 metrics including age, EEO distribution, and leave liability. OCPE produced a whole of sector comparative set of metrics for each quarter in 2013. These metrics have been disseminated to agencies and are being used to provide the factual basis for a number of strategies. The metrics will also be used to inform the NTPS Strategic Workforce Plan, due for release in 2015.
Work will continue into the next reporting period on refining and maximising the benefits of the metrics, including introducing bench marks, in an effort to improve evidence based HR decision making across the sector.
One of my major priorities for the 2014-15 period is working to maximise current efforts in the EEO space. The last 10 years has seen
Commissioner’s Foreword

some significant improvements in regards to women in senior management roles1, increasing 17% to 44%. However, there is still work to be done in the Indigenous and disability employment arenas. Disability employment has dropped 0.6% to 1.1%. OCPE are currently leading a range of initiatives to increase the number of people employed with disability and have been working with DoH to investigate possible initiatives to increase both attraction and retention of people with disability in the NTPS.
Indigenous employment across the sector currently sits at 8.7%. This figure needs to increase substantially to ensure a true representation in our workforce of the community we serve. In 2013 a consultant was engaged to assist with the research and development of the next iteration of the Indigenous Employment and Career Development Strategy. The consultant has been liaising with a number of senior Indigenous NTPS employees as well as heads of agencies and a key advisory group.
We will continue to refine our strategies and work with agencies to ensure the people that make up the NTPS are given all the necessary tools to rise to the challenges of tomorrow. Reporting against HR performance indicators will continue to be an important way of measuring the health and effectiveness of the sector, allowing us to refine and review our methods to ensure continuing relevance and quality of service delivery to Territorians.
Craig Allen Commissioner for Public Employment30 September 2014
Under section 18(1) of PSEMA the CPE is required to report annually to the Minister on human resource management in the NTPS. Section 18(2) of PSEMA provides that the report shall refer to:
(a) the extent to which the human resource management principle and performance and conduct principle have been upheld in the Public Sector during the financial year, including:
(i) measures taken to ensure they are upheld; and
(ii) any significant failures to uphold them of which the Commissioner is aware;
(b) measures, if any, taken to improve human resource management in the various Agencies;
(c) the extent to which disciplinary, redeployment and inability procedures were invoked in the Public Sector;
(d) those matters specified in section 28(2) in so far as they relate to the Commissioner’s Office; and
(e) any other matters as prescribed by regulation.
The relevant matters specified under section 28(2) of PSEMA are:
• management training and staff development programs in the Agency; and
• occupational health and safety programs in the Agency.
Both of these matters are dealt with in the 2012–13 OCPE Annual Report rather than in this report.
There are no prescribed matters under section 18(2)(e) of PSEMA.
Report Overview
1 Senior Management Roles are defined as being between SAO2 – ECO6
07
STATE OF TH
E SERVICE REPORT 2013–
14

STAT
E O
F TH
E SE
RVIC
E RE
PORT
201
3–14 NTPS at a Glance
08
The NTPS at a Glance
The NTPS is responsible for providing services to the NT community including hospital care, education, public transport, electricity, water provision, and public libraries to name a few.
Currently, the NTPS consists of 32 agencies, including the following four “central” agencies:
• DCM
• DTF
• OCPE
• DCIS
It should be noted that the data for this report is based on survey responses from 31 agencies. However, the NTPS at a glance infographic and the statistical information provided in the Staffing Statistics section identifies 32 agencies. The reason for this is that the Land Development Corporation is incorporated as part of DLPE survey responses, but identified as a separate agency when represented statistically.
The Workforce
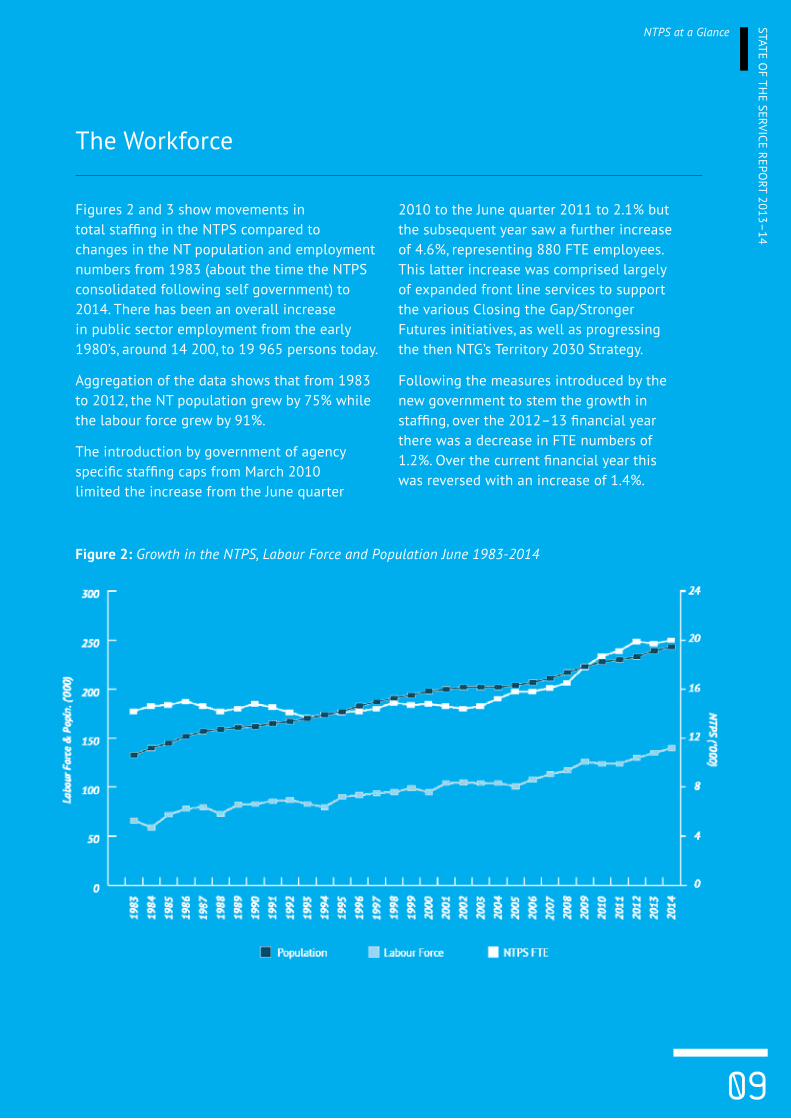
Figures 2 and 3 show movements in total staffing in the NTPS compared to changes in the NT population and employment numbers from 1983 (about the time the NTPS consolidated following self government) to 2014. There has been an overall increase in public sector employment from the early 1980’s, around 14 200, to 19 965 persons today.
Aggregation of the data shows that from 1983 to 2012, the NT population grew by 75% while the labour force grew by 91%.
The introduction by government of agency specific staffing caps from March 2010 limited the increase from the June quarter
2010 to the June quarter 2011 to 2.1% but the subsequent year saw a further increase of 4.6%, representing 880 FTE employees. This latter increase was comprised largely of expanded front line services to support the various Closing the Gap/Stronger Futures initiatives, as well as progressing the then NTG’s Territory 2030 Strategy.
Following the measures introduced by the new government to stem the growth in staffing, over the 2012–13 financial year there was a decrease in FTE numbers of 1.2%. Over the current financial year this was reversed with an increase of 1.4%.
Figure 2: Growth in the NTPS, Labour Force and Population June 1983-2014
09
STATE OF TH
E SERVICE REPORT 2013–
14NTPS at a Glance

STAT
E O
F TH
E SE
RVIC
E RE
PORT
201
3–14
10
NTPS at a Glance
Figure 3: Movements in NT Population and NTPS Staff 1983-2014

11
STATE OF TH
E SERVICE REPORT 2013–
14NTPS at a Glance
Percentage of employees earning < $70, 625
Percentage of employees working full-time
Percentage of employees earning > $70, 625
Gender Balance
Percentage of employees working in the NT Public Sector

STAT
E O
F TH
E SE
RVIC
E RE
PORT
201
3–14
12
NTPS at a Glance
Age Groups
Figure 4: Age of NTPS Employees 1994 and 2014
Figure 5: Age distribution employed NTPS vs NT total
Females 1994
Males 1994 Total 1994
Females 2014
Males 2014 Total 2014
15-19 1.8% 1.0% 1.5% 0.8% 0.6% 0.8%
20-24 9.3% 5.0% 7.4% 5.9% 3.7% 5.0%
25-29 13.7% 10.5% 12.3% 12.1% 9.1% 11.0%
30-34 15.6% 14.1% 14.9% 13.4% 12.2% 12.9%
35-39 16.6% 15.6% 16.2% 12.1% 12.2% 12.1%
40-44 16.9% 17.8% 17.3% 12.7% 14.2% 13.3%
45-49 13.4% 16.5% 14.8% 12.3% 12.6% 12.4%
50-54 8.2% 11.3% 9.6% 12.3% 12.5% 12.4%
55-59 3.5% 5.2% 4.2% 10.2% 11.8% 10.8%
60-64 1.1% 2.7% 1.8% 6.0% 7.4% 6.5%
65+ 0.0% 0.2% 0.1% 2.2% 3.7% 2.8%
Total 100.0% 100.0% 100.0% 100.0% 100.0% 100.0%
Age group 15-24 25-34 35-44 45-54 55-64 65+ Total
NT public sector 5.8% 24.0% 25.4% 24.8% 17.3% 2.8% 100.0%
NT total employed persons 15.1% 23.8% 22.9% 21.4% 14.0% 2.8% 100.0%
In comparison to the NT workforce as a whole, the NTPS has a lower amount of the youngest contingent of the working age population but manages to attract more 25–34 year olds as a percentage than the general NT workforce.

Where We Are Located
Darwin is the largest hub of NTPS staff with 65% of the workforce working in the Darwin and Palmerston region. The Alice Springs region has the largest proportion of staff outside of Darwin with 20%. While 65% of NTPS employees work in the greater Darwin area, this is not a much greater proportion than the 57% of the Territory population which resides in this region.
Statistical Regions of the NT
13
STATE OF TH
E SERVICE REPORT 2013–
14NTPS at a Glance

Career opportunities within the NTPS cover a varied range of fields, disciplines and industries, providing a stimulating work environment along with a range of benefits that make the NTPS an attractive employer for its almost 20,000 strong workforce.
The Territory provides unique opportunities to work in the most remote parts of Australia, such as Yuendumu and Ntaria, or urban centres such as Darwin, Alice Springs and Katherine,
and to enjoy the NTPS’ multicultural working environment.
NTPS employees are leading and instigating significant and real change for Territorians, with opportunities to work on some of the NT’s biggest and most exciting projects. Additionally, the NT is a unique jurisdiction with unmatched access to Members of Parliament and agency executives, making the experience of working in the NTPS a much sought after one.
Flexible Workplace Practices
Flexible workplace practices are an essential attraction and retention strategy in the competitive labour market. NTPS employees fulfil a number of important roles in their lives such as:
• employee
• parent
• carer
• volunteer and
• community leader.
The NTPS recognises the demands imposed by these roles and in recognition of this, supports flexible work practices, where appropriate. More information about flexible working arrangements can be found within the relevant enterprise agreement.
There are a range of formalised flexible work practices adopted across the NTPS. In most agencies, applications for flexible workplace practices are assessed by managers within the work unit on a case by case basis to ensure a balance is maintained between business needs and the specific circumstances of the individual.
Attracting Talent
STAT
E O
F TH
E SE
RVIC
E RE
PORT
201
3–14
14
Attracting Talent

Figure 6: Flexible Workplace Practices that agencies have adopted
15
STATE OF TH
E SERVICE REPORT 2013–
14Attracting Talent
STAT
E O
F TH
E SE
RVIC
E RE
PORT
201
3–14 Attracting Talent
16
Equity and Diversity Strategies
Equity and Diversity Strategies have been implemented by the following agencies:
• DLRM
• DoT
• PWCNT
• DTF
• DoI
• OCPE
• DCS
• PFES
• Tourism NT
• DPC and
• AAPA.
Agencies are, in large, using their staff only intranet pages to promote these and other strategies. Other marketing methods include promoting Equity and Diversity strategies during the induction process, staff meetings and during the performance management process.
It is encouraging that from the sector wide EmployAbility strategy 22% of agencies have developed agency specific EmployAbility strategies, demonstrating their ongoing commitment to employ people with disability.
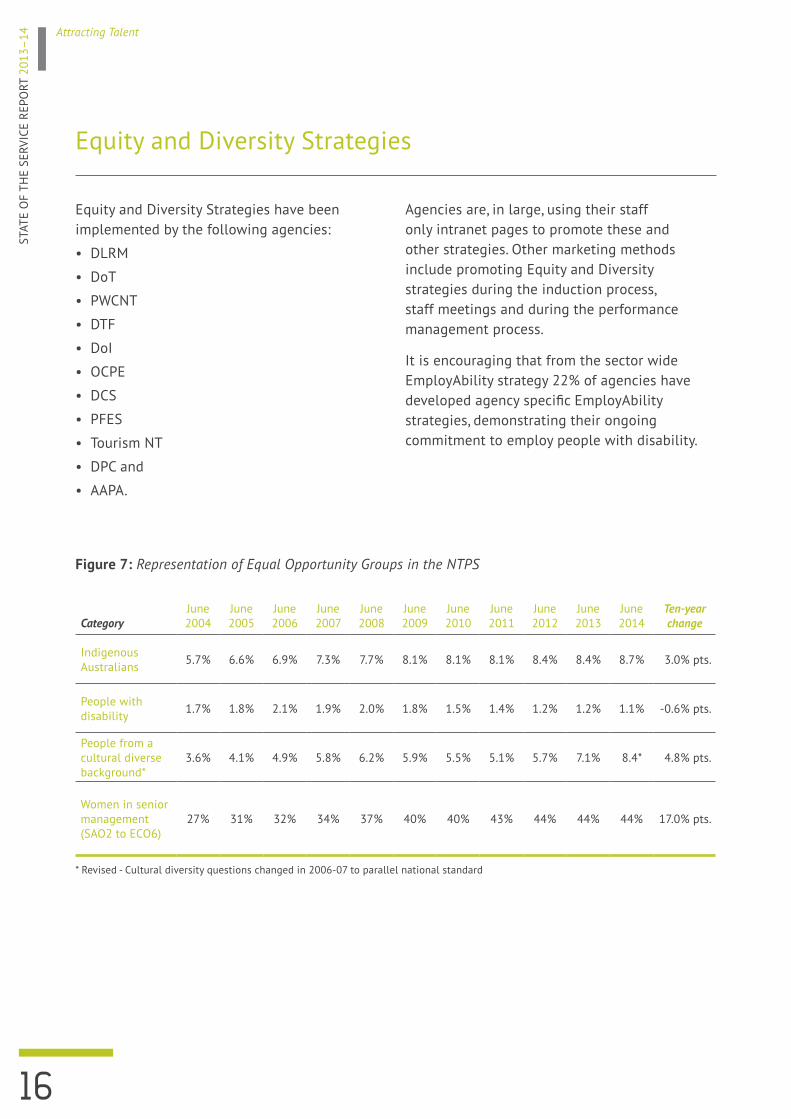
Figure 7: Representation of Equal Opportunity Groups in the NTPS
CategoryJune 2004
June 2005
June 2006
June 2007
June 2008
June 2009
June 2010
June 2011
June 2012
June 2013
June 2014
Ten-year change
Indigenous Australians 5.7% 6.6% 6.9% 7.3% 7.7% 8.1% 8.1% 8.1% 8.4% 8.4% 8.7% 3.0% pts.
People with disability 1.7% 1.8% 2.1% 1.9% 2.0% 1.8% 1.5% 1.4% 1.2% 1.2% 1.1% -0.6% pts.
People from a cultural diverse background*
3.6% 4.1% 4.9% 5.8% 6.2% 5.9% 5.5% 5.1% 5.7% 7.1% 8.4* 4.8% pts.
Women in senior management (SAO2 to ECO6)
27% 31% 32% 34% 37% 40% 40% 43% 44% 44% 44% 17.0% pts.
* Revised - Cultural diversity questions changed in 2006-07 to parallel national standard

17
STATE OF TH
E SERVICE REPORT 2013–
14Attracting Talent
Disability Employment in the NTPS
The NTPS is committed to increasing the employment opportunities for people with disability (Figure 7 - Representation of EEO Groups in the NTPS, on page 18). EmployAbility a Strategy for People with Disability 2013-2017 was approved by Cabinet in May 2013. The NTPS offers employment to people with disability as a pathway to ongoing employment under DEP. DEP is an initiative under the EmployAbility strategy and aims to provide job opportunities in the NTPS including wage assistance to agencies to employ people with disability who face severe workplace restrictions and are unable to compete for jobs on merit. DEP provides participants with the opportunity to gain skills and experience, together with building their self confidence, to widen their future employment opportunities. At the conclusion of the training and development period, host agencies are encouraged to consider ongoing employment for participants who have demonstrated the ability to undertake the required duties.
During the 2013-14 round of funding 13 people gained employment under DEP. Of the 13, four will have their funding carried over to 2014-15.
Agencies are currently assessing the suitability of the remaining participants for ongoing employment.
The following agencies took part in DEP in 2013-14:
• DoE
• DoH
• PWCNT
• DTF
• AAPA
• NTEC
Those agencies that did not access the program (74%) in the last financial year cited the absence of entry level work as their reason for not accessing the funding, with 14% of these agencies identifying that they will not access the 2014-15 round of funding for the same reason. Less than 4% of agencies cited reservations about the capability of an employee under DEP. Approximately half (54% of agencies) indicated they would consider accessing funding through the program in 2014-15 pending appropriate placements and managers with requisite knowledge and skills being available to supervise employees.
OCPE is currently developing a marketing campaign, internal to the NTPS, to encourage maximum placements through DEP. The marketing will also place emphasis on self identification of employees with disability and the value of accurate workforce data relating to disability.
Indigenous Employment and Career Development Strategy
A consultant was engaged in May 2014 to develop the fourth IECDS, following the expiration of the previous strategy in December 2012. The new strategy will include ambitious
targets to improve Indigenous employment outcomes in the NTPS and is anticipated to be released late 2014.

STAT
E O
F TH
E SE
RVIC
E RE
PORT
201
3–14 Attracting Talent
18
CCAT improves the capability of the NTPS workforce to effectively deliver services to its clients. The multi cultural dimension of the NTPS workforce, coupled with the culturally diverse population of the NT, highlights the importance of having a culturally competent workforce. This is underpinned by section three of EI 10 – Equality of Employment Opportunity Programs, requiring agencies to provide opportunities for all employees to undertake CCAT.
Historically, agencies have offered tailored cross cultural training to address specific workforce and clientele needs. To consolidate agency approaches and maintain a common approach to learning outcomes across the sector, a Cross Cultural Training Framework with a suite of CCAT across five key areas was developed and released in August 2013.
Over 80% of agencies offer CCAT to employees, demonstrating the NTPS’ understanding of the importance of developing a capable workforce which values appropriate service delivery and an inclusive working environment for all NTPS staff.
Cross Cultural Awareness Training
Agencies offering CCAT to employees
Levels of CCAT available in agencies

19
STATE OF TH
E SERVICE REPORT 2013–
14Attracting Talent
Attraction and Retention
Employee attraction and retention is critical to the long term health and success of any organisation. The ability to retain and attract the best employees ensures a dynamic public sector into the future.
The employment conditions of the NTPS are among the best in the country, and the NTPS has embedded a number of incentives designed to attract and retain the highest calibre employees to the workforce in relevant enterprise agreements applying to particular groups of employees. An example of one of the incentives designed to attract and retain employees is the Remote Locality Provisions. These provisions apply to an employee who is employed in an area declared a “remote locality” by the CPE. Remote Locality entitlements are in addition to other conditions of service.
Employees who reside in a locality declared as ‘remote’ may be entitled to receive:
• assistance with airfares on a regular basis, for themselves and their recognised dependents, to Darwin or Alice Springs - FOILs and
• an allowance to assist with the cost of freight for foodstuffs they purchase outside the remote locality
Additionally, they may also be eligible for:
• rental concessions
• special study leave provisions
• an accommodation allowance in conjunction with FOILs
• family travel assistance in conjunction with professional development and
• partial reimbursement of household contents insurance premiums if higher costs are incurred.
To ensure the NTPS is an attractive employer for people new to the NT or a particular region a Relocation Allowance may be available. When a person gains permanent appointment, is promoted, or is transferred and it is necessary to move from one location to another to commence duty the CEO may approve the payment of relocation expenses or a relocation allowance.

STAT
E O
F TH
E SE
RVIC
E RE
PORT
201
3–14 Attracting Talent
20
Attraction and Retention of Indigenous Employees – Department of Children and Families - Learning Pathways Strategy
LPS is a significant investment towards growing and retaining a local, confident and competent workforce with a particular focus on:
(a) career opportunities and progression for the regional and remote administrative stream Indigenous workforce and
(b) providing professional and administrative stream employees with opportunities to develop and strengthen their practice.
The Vocational Graduate Certificate in Community Services Practice is a cornerstone qualification of the LPS that supports the transition of the administrative Indigenous workforce into the professional stream in an effort to offer culturally informed child protection services. Currently, 12 employees from Nguiu, Tennant Creek, Alice Springs, Katherine and Darwin are undertaking this postgraduate qualification and are expected to complete in November 2014.
2014 NT Training Awards
Aboriginal and Torres Strait Islander Student of the Year Award
Ms Dawn Ivinson, a current DCF employee, is a great example of how the Learning Pathways Strategy provides education and career opportunities to DCF employees. She completed the Diploma of Child Youth and Family Intervention and is commencing the Vocational Graduate Certificates in Community Services to gain eligibility to transition into a professional child protection role. She has been shortlisted for the NTG sponsored 2014 Aboriginal and Torres Strait Islander Student of the Year Award (NT Training Awards) which recognises the achievement of an Aboriginal or Torres Strait Islander student who displays a strong understanding and knowledge of the vocational education training system and is able to demonstrate the relevance of lifelong learning for themselves and their community.
Vocational Student of the Year Award
Another success story of the Learning Pathways Strategy is Patrick Rivers, a Case Support Worker with the Safety Assessment and Mobile Child Protection Teams in Alice Springs. Patrick recently completed a Certificate IV in Community Services from Charles Darwin University. Due to his outstanding commitment, dedication, and enthusiasm towards this qualification, Patrick was nominated by his lecturer Susan Burns in recognition of his outstanding achievement in a course of study leading to a nationally recognised qualification.
What Worked?

Recruiting People in the NTPS
Growth in the NT labour force, NT Population and NTPS ( ‘000) 1983 v 2014
2014
1983
There are varied careers in the NTPS in a range of designations within sector specific employment streams including, to name a few:
• Aboriginal Health Workers
• Administrative Officers
• PWC Employees
• Assistant Teachers
• Dentists
• Enrolled Nurses
• Senior Teachers
• Firefighters
• Medical Officers
• Nurses
• Physical Grade Employees
• Prison Educators
• Prison Officers
• Professional Officers
• Senior Prison Officers
• Teachers and
• Technical employees
21
STATE OF TH
E SERVICE REPORT 2013–
14Recruiting People in the NTPS

Employment can be offered on an ongoing, fixed period and casual basis. To be eligible for appointment as an ongoing employee a person must be either an Australian citizen or have permanent resident status, have been granted a Regional Sponsored Migration Scheme (RSMS) visa, or a New Zealand citizen with a Special Category visa that allows them to remain and work in Australia indefinitely. Fixed period and casual employment can be offered to a person who has an appropriate visa to enable employment in Australia, subject to the requirements of the Commonwealth Department of Immigration and Citizenship.
Ongoing and long term temporary vacancies are advertised on the NTG Employment Opportunities website and applicants can apply online. Some jobs are also advertised in vocation specific journals and websites and in regional/ interstate media. Some agencies offer employment opportunities through:
• Graduate Development Programs
• Cadetships for Aboriginal and Torres Strait Islander People
• Apprenticeships for Aboriginal and Torres Strait Islander People
• Apprenticeships
• Vacation Employment and
• Project Employment Scheme
Intakes for these programs are usually advertised in October each year.
2013 NTPS Employment Status
2014 NTPS Employment Status
STAT
E O
F TH
E SE
RVIC
E RE
PORT
201
3–14
22
Recruiting People in the NTPS
23
STATE OF TH
E SERVICE REPORT 2013–
14Recruiting People in the NTPS
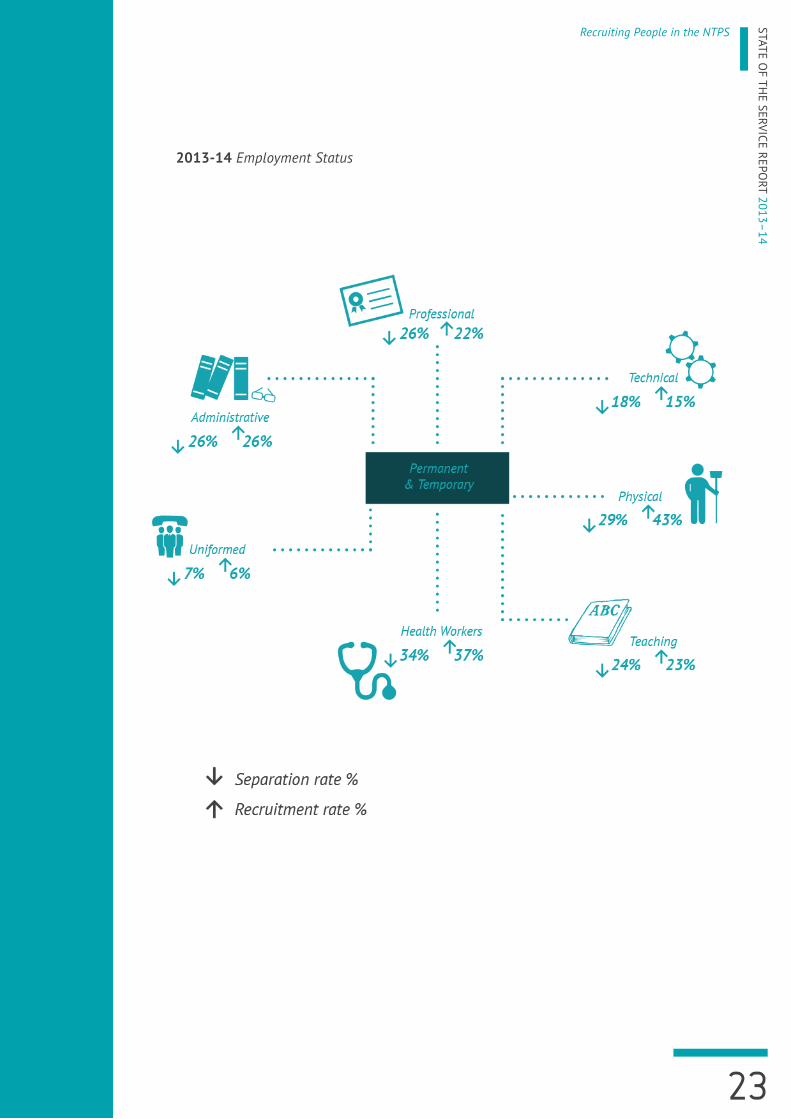
2013-14 Employment Status

STAT
E O
F TH
E SE
RVIC
E RE
PORT
201
3–14
24
Recruiting People in the NTPS
Job Evaluation System
To ensure remuneration is commensurate with responsibilities throughout the NTPS, jobs are evaluated using JES, or where applicable, work level standards contained in the relevant enterprise agreements, such as ‘physical’ stream jobs. The resultant job evaluation determines the classification of the job within its designated stream. It is important to clarify that job evaluation does not determine remuneration, but measures the work value of the job relative to other jobs. Once evaluated, jobs are paid at the salary level relevant to the determined classification.
Most agencies (87%) provide employees with information about JES, or other relevant work value system applicable to determining job classification. The four agencies that indicated they do not provide information do provide advice and assistance on job evaluation on an as required basis through their HR sections. This is a significant improvement on last year’s data whereby only 53% of agencies provided this information.
Agencies advised that information is provided to employees via agency intranet sites, through recruitment policy guidelines and procedures available through HR sections, agency inductions/orientations and via training such as Merit Selection and JES Evaluator training. Employees are also provided information through agency change management processes, as part of recruitment actions, and via staff meetings (including performance management meetings).
Most agencies (93%) include in their agency procedures a requirement to review the job descriptions/Job Analysis Questionnaire prior to advertising. This step assists the agency to determine if there has been any change to the duties or responsibilities and if the job needs to be re-evaluated prior to filling. Whilst this
represents a small decrease against last year’s data of 97%, two agencies advised that they are updating their current procedures and this step will be included in the revised process.
The majority of agencies (90%) indicated that there are appropriate steps for job design and job evaluation built into their agency’s procedures for change management and the establishment of new functions. This is a slight improvement on last year’s data of 87% of agencies. The three agencies that indicated they do not, advised that where work units are affected by substantial change their HR sections ensure consultation with employees and their representatives occurs, and work closely with the work unit to ensure job design and evaluation are undertaken as a matter of priority.
Figure 8: Job Evaluation in the NTPS

25
STATE OF TH
E SERVICE REPORT 2013–
14Recruiting People in the NTPS
Merit Selection
The selection process for employment with, and transfer and promotion in, the NTPS is based on the merit principle and applicants are required to demonstrate that they are the most suitable person for the job.
In accordance with PSEMA, all NTPS selections are to be undertaken on the basis of merit. The merit principle requires all employment, promotion and transfer decisions to be made on the basis of the person’s:
• suitability to perform the relevant duties and
• suitability for employment in the relevant workplace and for employment in the public sector.
A person’s suitability is determined having regard to the person’s knowledge, skills, qualifications and experience, and potential for future development.
Under PSEMA and Regulation 8, promotions can be appealed, but only by existing employees, in situations where the selection is a promotion for both the appellant and the provisional promotee. The test applied by the Public Sector Appeals Board is whether the selection decision was consistent with the merit principle, as defined in PSEMA.
In the case of selections which are not appealable, existing employees can lodge a grievance pursuant to PSEMA section 59 requesting the CPE to review a selection decision if they believe that the merit principle has not been applied.
PSA&GR provides Merit Selection Training to agency employees. Further information about this training is provided in the Merit Selection Training case study on page 28.
Employment Based on Merit
EI 1 – Filling Vacancies, requires agencies to develop procedures for the employment, promotion and transfer of employees; and to ensure selection is made in accordance with the merit and equality of employment opportunity principles.
The majority of agencies (90%) have developed procedures for filling vacancies (Recruitment Procedures). Agencies ensure that employees are aware of these procedures via the agency’s intranet, through staff induction/orientation programs, other training such as Merit Selection, and reminders via staff broadcasts, newsletters/bulletins and staff meetings. The procedures and related information are available to employees through agency policies and procedures,
handbook, forms and reference guides. HR sections also provide information as and when required.
Nearly all agencies (97%) make the Merit Selection Guide (and its related Guides, eg. Good Practice Guides) readily available to employees in the same manner as agency procedures above. The one agency that doesn’t is currently finalising its agency policy which will include this information.

STAT
E O
F TH
E SE
RVIC
E RE
PORT
201
3–14
26
Recruiting People in the NTPS
In accordance with the human resource management principles including the merit principle under PSEMA, NTPS agencies have in place a variety of protocols to ensure agency recruitment and selection activities occur in accordance with best practice.
Employees have ready access to information relating to how classification levels are determined, how selection processes occur, and importantly reassurance that selection processes occur in accordance with the merit principle. Employees also have the ability to seek a review of selection outcomes through the promotion appeals and grievances processes. Relevant training is readily available to employees who are required to undertake recruitment and selection actions to ensure the merit principle is properly applied and the most suitable person selected for jobs in the NTPS. This appears to be supported by the decreased number of promotion appeals heard by PSA&GR.
The majority of agencies (90%) require selection panel members to attend Merit Selection Training. Some agencies, however, only require chairpersons of panels to undertake the training, while it remains optional for other panel members. The agencies that do not require staff to attend the training do ensure the Merit Selection guidelines are adhered to. This is a positive improvement on last year’s data, whereby, only 66% of agencies required selection panel members to attend training.
All agencies have employees who have been trained in merit based selection processes.
Percentage of agencies and employees in those agencies trained in merit-based selection processes
Figure 9: Merit Based Employment

27
STATE OF TH
E SERVICE REPORT 2013–
14Recruiting People in the NTPS
Promotion Appeals
There has been a reduction in the number of promotions appealed during the reporting period when compared with last year’s data, which may be attributed to the significant
number of employees who are participating in the Merit Selection training provided by PSA&GR.
Figure 10: Number and Percentage of NTPS Promotions Appealed
Year Promotions Promotion Appeals %
2013-14 1147 53 4.6%
2012-13 961 65 6.8%
2011-12 1835 145* 7.9%*
* The larger than usual number of appeals in the 2011 12 financial year stems from several ‘bulk’ recruitment processes.
Figure 11: Outcome of NTPS Promotion Appeals
Year 2011-12 2012-13 2013-14
Varied by appointing Appellant (Allowed) 3 1 3
Decision Affirmed (Disallowed) 38 27 6
Set aside and returned to be redone advertised/set aside 58 14 5
Withdrawn 54 16 21
Vacated (cancelled) 2 5 6
On hand at end of period 0 2 12

STAT
E O
F TH
E SE
RVIC
E RE
PORT
201
3–14
28
Recruiting People in the NTPS
What Worked?
Merit Selection Training
In response to poor ratings on the application of the merit principle obtained through surveying employees, commencing in January 2013 PSA&GR has conducted extensive merit selection training aimed at selection panel members at all levels. All of the training is offered free of charge to participants.
The Merit Selection Training courses include an intensive full day course, a condensed half-day course which covers the same material but with less opportunity for interactive exercises, and short courses for senior executives and delegates. An e learning merit selection course is currently under development and will also include a short refresher course for employees who have already done a longer course. The Merit Selection training programs focus on:
• understanding the merit principle
• addressing recruitment facts and myths
• merit assessment methods
• understanding the importance of demonstrated work performance and past work experience to assess suitability and
• selection report writing.
One aspect of the training, that has made a significant difference to the way in which merit selection processes are now undertaken, is the emphasis placed on assessing a person’s suitability for a job based on their relevant proven, day to day work performance as verified through improved referee checks as opposed to the person’s interview performance. This change in process also removes the previous automatic assumption and/or requirement to always conduct interviews of all applicants, and the myth that every interview must be conducted in exactly the same manner.
Since its inception, approximately 1500 employees have received the training and the reception has been overwhelmingly positive, with long waiting list for attendance and approval ratings for the course standing at well over 90%.
The CPE has signalled an intention to issue a uniform merit selection policy and procedures which will align with the Merit Selection Training courses and contribute to consistency in practice across the NTPS. The vision is to ensure that all selections in the NTPS will be conducted in a consistent manner, in accordance with best practice, and the merit principle.

The NTPS recognises the skills, energy and cooperation of its employees is important in ensuring productivity and efficiency across the NTPS and integral to client service delivery and career satisfaction. It is therefore imperative that employees are kept informed of:
• government priorities relevant to their agencies
• substantial changes affecting them in the workplace and
• decisions affecting their employment.
Consistent with informing employees, it is imperative that employees are appropriately consulted and have the ability to provide feedback about changes and decisions affecting them, and that this occurs in a constructive and meaningful way and in a safe workplace environment.
All NTPS enterprise agreements also contain ‘Management of Change’ clauses setting out the principles to be followed where substantial change, which may affect employees, is proposed.
Working in the NTPS
Methods of communication used by agencies for ensuring employees know Government Priorities
29
STATE OF TH
E SERVICE REPORT 2013–
14Working in the NTPS

Change Management and Consultation
All agencies ensure that employees are provided with information about government priorities relevant to their workplaces using a number of methods. The most popular method that is used by all agencies is via managers/supervisors and in team meetings. Other customary methods are:
• through the corporate and business/budget planning processes (90%)
• through internal newsletters and e-bulletins (87%)
• as part of the performance management process (77%) and
• promoted via the intranet (84%).
Other methods used by agencies to disseminate information and obtain feedback include various forums such as CEO briefings, executive/senior leadership forums, ministerial forums and whole of agency briefings; emails, annual reports, governance committees, and through change management meetings.
Similarly employees are informed about workplace changes that affect them through team and informal meetings, communications from CEOs and senior management at branch
meetings via emails, newsletters and on agency intranet sites as well as communication plans and change management strategies. Agencies also identified focus groups, performance planning workshops and consultative committees as other methods of communication of workplace changes to employees.
Agencies encourage staff input and commitment on workplace changes affecting them through staff meetings and business planning meetings, via feedback through the agency intranet, and through performance management meetings. Other methods used by agencies are through consultation and change management committees, focus groups, inductions/orientations, exit interviews, professional supervision programs, and agency satisfaction surveys. For smaller agencies, the CEO meets with employees individually to obtain feedback.
There are a number of relevant EIs under the Public Sector Employment and Management legislation that require agencies to ensure employee rights and obligations are addressed regarding the above. These are:
Natural Justice
EI 3 – Natural Justice which sets out the principles of natural justice that must be observed in all dealings with employees under PSEMA where an employee may be adversely affected by an impending decision, other than those taken under section 50 of PSEMA, which deals with summary dismissal.
The majority of agencies (94%) provide employees with information on the principles of natural justice and the same number have agency policies and procedures for selection, discipline and performance management that specifically require adherence to the natural
justice principles. Information on the principles is provided through agency inductions/orientations, performance management processes, training, and availability on agency intranet sites.
Two agencies are currently updating their policies and procedures to include specific references to the natural justice principles, and two agencies deal with providing the information on an as required basis and through training sessions such as ‘Code of Conduct’ and ‘Appropriate Workplace Behaviours’.
STAT
E O
F TH
E SE
RVIC
E RE
PORT
201
3–14
30
Working in the NTPS

31
STATE OF TH
E SERVICE REPORT 2013–
14Working in the NTPS
Reasonable Access to Redress
EI 8 – Internal Agency Complaints and Section 59 Grievance Reviews requires agencies to develop an internal agency employee grievance handling policy and procedure.
The majority of agencies (94%) provide their employees with information on their rights to seek a review of decisions affecting them. Employees are made aware of their rights to seek a review of decisions affecting them through agency induction/orientation programs, via staff meetings, through the policy and procedures available on staff intranets, and as required through HR sections or in Gazettes. The one agency that does not only has a small number of staff and deals with matters arising as and when required. This is consistent with last year’s data.
The majority of agencies (94%) have an internal employee complaint handling policy and procedure as required by EI 8 – Internal Agency Complaints and Section 59 Grievance Reviews. Employees are made aware of the policy and procedures through agency induction/orientation programs, via staff meetings, incorporated into complaints policy and procedures available on staff intranets, and as required through HR sections or in Gazettes. The two agencies that have not developed an agency specific policy and procedure apply EI 8 – Internal Agency Complaints and Section 59 Grievance Reviews, and provide relevant information through their HR sections and through training such as ‘Appropriate Workplace Behaviour’ sessions.
Performance and Conduct Principle
Employees in the NTPS are expected to perform their duties in a professional manner consistent with the NTPS Code of Conduct and, where applicable, agency specific code of conduct, and in accordance with NTPS and agency values.
EI 12 – Code of Conduct applies to all public sector officers (defined in PSEMA as employees, CEOs and the CPE). The EI also enables CEOs to issue agency specific codes of conduct.
The majority of agencies (90%) provide all employees with information on the Performance and Conduct Principle and the Code of Conduct. Three agencies advise that employees are only provided information if they attend the agency training session.
Agencies that provide employees with information on the Performance and Conduct Principle and the Code of conduct

STAT
E O
F TH
E SE
RVIC
E RE
PORT
201
3–14 Working in the NTPS
32
Employees are made aware of the principles and Code of Conduct through the agency induction/orientation programs, training such as ‘Appropriate Workplace Behaviour’ workshops, through performance reviews, information sessions and staff meetings, emails, e-bulletins and newsletters. The principles and Code of Conduct are also available on agency intranet sites.
Nearly a third of agencies (30%) have developed their own specific Code of Conduct or guidelines. Noticeably, all of these agencies have regulatory functions.
Conflicts of Interest
All agencies advised that they have appropriate policies in place to safe guard against employees incurring potential conflicts of interest. Employees are provided with this information through agency induction/orientation programs, training programs such as ‘Appropriate Workplace Behaviour’ and ‘Code of Conduct’, and through policies and procedures available on their agency intranet sites. Relevant information is promoted through Executive and leadership teams and at staff meetings, and employees are reminded annually by email broadcasts and newsletters to update disclosure statements as appropriate, including through performance management processes.
Figure 12: Agencies that provide Employee Access to Information

33
STATE OF TH
E SERVICE REPORT 2013–
14Working in the NTPS
Effective, Efficient and Appropriate Use of Public Resources
Consistent with ensuring employees are aware of their responsibilities under the Principles and Code of Conduct, 90% of agencies reported they have client service principles/policies and standards (eg service excellence, confidentiality, respect, etc) in place. These figures are identical to those reported last year. Service performance and standards are monitored by agencies and actively seek feedback from clients through:
• divisional business plans and planning sessions
• performance management
• external client and stakeholder feedback systems such as surveys, web feedback, TRIP advisor, meetings
• internal reviews
• staff meetings
• audits
• data and exception reporting
• committees
• key performance indicators on service delivery
• statistical monitoring and
• community engagement.
Grievance Reviews
A total of 121 grievance reviews were handled in 2013-14 compared with 115 in the previous reporting period. The most common issues raised in grievances in 2013-14 were, in order of prevalence:
• selection decision
• management action or decision
• agency handling of bullying and harassment
• termination on probation section 59(1)
• review of a disciplinary decision
• unfair treatment
• application of conditions of service
• application of procedures and policies and
• bullying and harassment.
PSA&GR utilises a flexible, outcome focused approach to handling grievances, concentrating, when possible, on achieving resolution through discussion, negotiation and mediation. As a result, many grievances are resolved at early stages, without the CPE having to make a specific direction. Only two grievances in 2013-14 led to the CPE directing an agency to change the agency decision or take another action. However, in a number of other grievances, although the CPE did confirm the agency action, he also included comments or advice for improvement in the agency’s handling of the matter.
Figure 13: Grievance Reviews Commonly Raised Issues
Order of Prevalence Grievance Issues
1 Selection decision
2 Management action or decision
3 Agency handling of bullying and harassment
4 Termination on probation s.59(1)
5 Review of a disciplinary decision
6 Unfair treatment

STAT
E O
F TH
E SE
RVIC
E RE
PORT
201
3–14 Working in the NTPS
34
What Worked?
Occupational Health and Safety
EI 11 – Occupational Health and Safety Standards Programs sets out the rules for NTPS agencies to develop occupational health and safety standards and programs in the NTPS.
The majority of agencies (90%) have fully implemented the requirements of EI11 – Occupational Health and Safety Standards Programs within their agencies.
Agencies have made their frameworks available on their intranet sites, and promote Occupational Health and Safety through their induction/orientation programs, training, and using work health and safety committees. Some elements of the framework are currently being reviewed or finalised within the three agencies that have not yet fully implemented the EI requirements.
Figure 14: NTPS Values

35
STATE OF TH
E SERVICE REPORT 2013–
14Working in the NTPS
NTPS Values
Following extensive consultation including with NTPS employees, Cabinet endorsed the implementation of six public sector values within the NTPS in April 2013. The six values are:
• Commitment to Service: The NTPS is professional, hardworking, effective, innovative and efficient, working collaboratively to achieve the best results for the NT.
• Ethical Practice: The NTPS upholds the highest standards of practice and acts with integrity in all that it does.
• Respect: The NTPS respects all people, and in particular their rights as individuals.
• Accountability: The NTPS is transparent and accountable in all its actions.
• Impartiality: The NTPS is apolitical and provides the government with advice that is objective, timely and based on the best available evidence.
• Diversity: The NTPS values the diversity of its workforce as well as the NT population it serves.
The NTPS Values were developed as a result of reviewing contemporary research and the work of other Australian jurisdictions as well as the significant input of NTPS employees through sector wide consultation. NTPS employees continue to play an important part in developing the expected behaviours associated with demonstrating these values, including how values can look and feel in everyday workplaces, how they can be used to aid employees in making everyday decisions and how the NTPS can build a values based culture.
NTPS Values apply to all public sector employees regardless of:• agency• nature and level of employment• employment status (permanent, temporary, casual, traineeship, apprenticeship) and• nature of organisation (administrative, public corporation, statutory authority, public
school or hospital etc)
Some public sector employees (e.g. health professionals, teachers, police and lawyers) are also bound by codes of conduct relevant to their profession. The NTPS Values, PSEMA, and Code of Conduct do not take precedence nor replace professional standards, but rather employees must have regard to their professional codes alongside the NTPS Values, Code of Conduct and ethics.
In developing the NTPS Values, employees’ guidance on how the NTPS Values can be applied in the context of individual agency values was invaluable. The following framework assists with the application of the NTPS Values alongside agency specific and our values as individuals within the context of relationships at three levels: within our workplace, with other agencies and the public we serve.
The application of the NTPS Values was not intended to replace agency specific values, but inform and support them by reminding employees of the expectations of their peers, Government and the NT public. The NTPS Values support OCPE’s vision of creating a public sector that provides the highest quality service to all Territorians.

Working in the NTPS
36
Values identify what is important in terms of appropriate behaviours in the workplace and how we should interact with others in our everyday work. The NTPS Values ensure a shared understanding of the values that underpin how NTPS employees work in delivering services to Territorians, promote collaboration and professionalism, guide employees in achieving best performance and set common expectations across the sector for all public sector employees.
To assist in embedding the NTPS Values, a range of strategies and activities have been undertaken by agencies, including:
• incorporating the NTPS Values into email signature blocks (this has been the most common method)
• installing the NTPS Values as a screensaver on employee computers and laptops
• promoting the NTPS Values through agency induction/orientation programs
• including the NTPS Values on promotion materials such as posters, key tags, and business and identification cards
• incorporating them into agency newsletters and strategic documents such as business plans
• incorporating the values into performance management criteria
• incorporating the values into training and leadership programs and
• incorporating the values into agency awards as part of the criteria.
A range of materials and tools to assist agencies in embedding the NTPS Values are also available on the NTG intranet site.
Figure 15: NTPS Values Framework
STAT
E O
F TH
E SE
RVIC
E RE
PORT
201
3–14

Performance Management
All agencies reported that they met the requirements of PSEMA and EI 4 – Employee Performance Management and Development Systems for implementing performance management and development systems in their agencies. This should, therefore, provide the means for employees to know clearly what their performance expectations are and for supervisors to provide feedback to help improve productivity. A large number of agencies (71%) reported having reliable monitoring systems in place to verify that all supervisors/managers were providing formal feedback to staff at least annually. This figure is a slight decrease on last year’s figures, noting that some agencies indicated issues with their current systems or that they did not want to invest in a system if an all of government system was released.
Managing Our People
The NTPS understands that to improve its productivity our people management practices must improve. OCPE is part of a current initiative looking at all of government policies and procedures including performance management. The People Matter Employee Survey will be administered by OCPE in late 2014 and will provide further information on the effectiveness of NTPS current performance management systems from the employee’s perspective. Information from both the State of the Service Report and the People Matter Employee Survey results will influence the work currently being undertaken to create a all of government approach to performance management.
Agencies that ensure first time supervisors/managers undertake training in managing workplace behaviour
2 out of 3 people in the NTPS have undertaken performance management conversations in 2013-14
37
STATE OF TH
E SERVICE REPORT 2013–
14Managing Our People

Whilst the number of agencies requiring all staff appointed to a supervisory/management role for the first time to attend formal training on performance feedback within six months of their appointment remains unchanged, some agencies do offer training but it is not mandatory, or is provided as part of the manager’s general induction package.
Almost all agencies (97%) have implemented a performance management system in all areas of the agency. The one agency that does not have a system across all areas does gather performance feedback, however, there is no consistent framework between all related sites. This agency is developing a contemporary and consistent approach that can be used in all roles, including those where supervisors regularly change due to rosters.
Agencies ensured that employees were aware of performance management policies and systems through a range of different methods including:
• documentation on the intranet
• system training courses offered to employees upon rollout and ongoing training as part of corporate induction
• six monthly review period email broadcasts to all staff providing information and valuable tips on how to get the most out of the process
• CEO newsletters
• team meetings and
• HR Consultancy.
Agencies conveyed that communication regarding status of performance management agreements is provided to agency executive groups on a quarterly basis in many agencies, which is an important step with regard to getting “buy in” on the performance management process. Methods for measuring
the effectiveness of agencies’ performance management system varies but common approaches include staff surveys, monitoring participation rates, and as a reflection of overall agency performance.
Interestingly, when asked how they would describe performance management in their agency:
• 10% indicated there is ‘increasing recognition by managers of the importance of performance management to business outcomes’.
• 23% indicated ‘agency set performance management objectives, relevant documentation and guidelines available, and formal performance agreements have been developed with staff’.
• 55% indicated ‘as with above, but the performance management system aligns individual and agency goals and priorities. Training and support provided to managers to ensure they have the skills to provide high-quality feedback. Performance assessment aligned with agency goals and based on multiple sources of feedback.
• 10% indicated ‘as with above, but with employee performance managed transparently and consistently – rewarding good performance and tackling poor performance. Extensive training and mentoring provided, focusing on personal development and performance improvement.’
• Only one agency indicated ‘as with above, but with high levels of confidence among staff that the performance management system is improving their performance. Employee performance management informs the organisation’s workforce and strategic planning through a continual cycle of review and evaluation.
STAT
E O
F TH
E SE
RVIC
E RE
PORT
201
3–14
38
Managing Our People

39
STATE OF TH
E SERVICE REPORT 2013–
14Managing Our People
Appropriate Workplace Behaviour
EI 13 – Appropriate Workplace Behaviour, states that CEOs must develop and implement a policy and procedure to foster appropriate workplace behaviour and a culture of respect, and to deal effectively with inappropriate workplace behaviour and bullying as defined by this EI.
All agencies reported they have a policy and procedure for dealing with inappropriate workplace behaviour (including bullying). Across all agencies there were 101 complaints of workplace inappropriate behaviour and/or
bullying received (down from 130 in the last reporting period). The largest number of complaints within one of the larger agencies was 58, however, across the remaining agencies the number of complaints received was relatively small, generally, less than 5 complaints.
The majority of agencies (93%) have proactive policy and procedures for fostering appropriate workplace behaviours.
Discipline and Inability
Section 18 of PSEMA requires the CPE to report on the extent to which discipline and inability procedures have been invoked in the NTPS. There was a significant decrease in the number of formal discipline processes during the reporting year, with breaches occurring across 16 agencies. No specific trends or causes were identified by agencies for the decrease in discipline and inability cases during the reporting period. Discipline actions were undertaken for breaches including: breach of procedure, breach of the code of conduct, inappropriate use of alcohol, inappropriate use of information technology, absences without leave and nondisclosure of offences, criminal charges including assault and possession of prohibited substances, and disregarding or disobeying a lawful order or direction.
Not all agencies keep data on the number of discipline or inability actions applied to casual and fixed period employees (as they are not subject to the discipline and inability provisions of PSEMA). However, one agency reported three
formal discipline actions pertaining to casual and fixed term employees for:
• negligent or careless performance of the employee’s duties
• disregarding or disobeying a lawful order or direction and
• failing to uphold the performance and conduct principle.
A second agency reported three employees were terminated due to abandonment of employment, a further two employees were terminated under formal disciplinary processes, and a cadetship was terminated for the cadet’s failure to meet the required academic standards.
A third agency reported one discipline matter involving a fixed period employee and related to failing to uphold the performance and conduct principle and conducting themselves in an improper manner.
A fourth agency reported one breach for inappropriate workplace conduct during 2013-14.

STAT
E O
F TH
E SE
RVIC
E RE
PORT
201
3–14 Managing Our People
40
The Organisational & Workforce Development team, Department of Transport and Department of Lands, Planning and the Environment Promote a Performance Culture
The agencies recognised that in order to create high performing teams they need to promote a performance culture and that performance management commences from when an employee starts in the NTPS. Previously, training and development around performance management had been delivered through monthly group sessions with poor attendance rates. The Organisational and Workforce Development team
changed its approach to the delivery of training from group sessions to more targeted and individual training in performance management.
A number of strategies were developed to support this culture, including:
• All new employees attend a one on one Induction session with their HR Consultant within their first week of joining the agency.
Figure 16: Summary of Discipline 2011-14
Year Type Number of New Cases Percentage of NTPS
2013-14 Dismissal 1 0.01%
Discipline 85 0.43%
2012-13
Dismissal 1 0.01%
Discipline 105 0.53%
2011-12
Dismissal 2 0.01%
Discipline 62 0.25%
Figure 17: Inability or Unsatisfactory Performance Cases 2011-14
Year Type Number of New Cases Percentage of NTPS
2013-14 Inability 30 0.15%
2012-13 Inability 46 0.23%
2011-12 Inability 51 0.20%
What Worked?

41
STATE OF TH
E SERVICE REPORT 2013–
14Managing Our People
• All new managers receive a one on one Management Induction session with their HR Consultant within their first week of joining the agency.
• Plan Do Review (the employee performance management system) training sessions are scheduled at times aligning with the arrival of new team members. Plan Do Review training is also delivered to work units. This has proven to be a valuable method of getting all team members onto the same page regarding performance management.
• A training session has been developed which focuses on the Capability Leadership Framework and its various uses.
• Development of a Performance Management for Managers training program. The program was developed to ensure that managers understand that performance management is not just about the performance appraisal but starts with induction and can
range from a quick informal word about something done well or in need of attention, to a formal counselling session on an aspect of performance which requires improvement. The agencies believe that if a manager treats performance management as part of their day to day operations, it will be recognised by staff as an integral part of their employment. It also builds a good working relationships between managers and staff, where feedback is expected and accepted and is regularly sought and given.
HR Services regularly seeks feedback from participants on the above training initiatives to ensure the program continues to meet employees’ needs and to measure the effectiveness of the sessions. All feedback received has been positive, with employees preferring the direct engagement with HR Consultants and in depth training received.
The Organisational & Workforce Development team at DoT and DLPE promote a performance culture through training in their online performance management system.

Developing Our People
The NTPS needs to be agile and adaptable in order to meet the challenges of providing services to Territorians achieved through developing employees. All agencies reported building training and development needs into their performance management agreements, demonstrating a strong commitment to capacity development across the NTPS.
OCPE is responsible for developing sector wide capability building initiatives and offers a suite of eight Leadership Development Programs, delivered by external providers. Each program has been developed to align with the Capability and Leadership Framework.
Smaller agencies are able to access OCPE programs to eliminate the need for duplication, while larger agencies complement OCPE’s work with programs targeted at specific needs and identified gaps.
84% of agencies conducted internal training and development activities including:
• persuasion and effective communication tactics to diffuse situations
• contract management
• building employees’ capacity
• development in corporate policy, processes and legislation
• preparing Ministerial and executive documents and
• Emerging Leaders Programs.
Largely, agency facilitated programs covered specific soft skills or industry specific training and development programs, for example, ‘Mobile Polling’ for Electoral Officers and information technology specific training.
Following is a brief description of each Leadership Development Program offered by OCPE.
Percentage of agencies that used OCPE Leadership Programs
STAT
E O
F TH
E SE
RVIC
E RE
PORT
201
3–14
42
Developing Our People
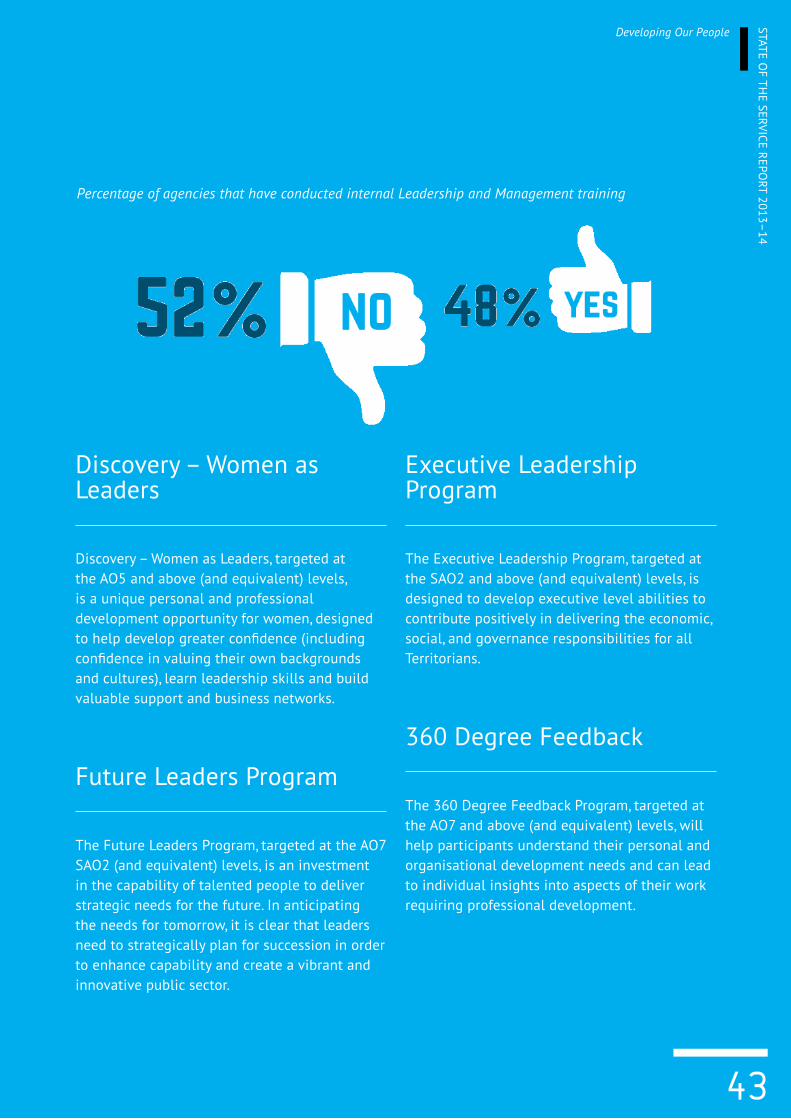
Percentage of agencies that have conducted internal Leadership and Management training
Discovery – Women as Leaders
Discovery – Women as Leaders, targeted at the AO5 and above (and equivalent) levels, is a unique personal and professional development opportunity for women, designed to help develop greater confidence (including confidence in valuing their own backgrounds and cultures), learn leadership skills and build valuable support and business networks.
Future Leaders Program
The Future Leaders Program, targeted at the AO7 SAO2 (and equivalent) levels, is an investment in the capability of talented people to deliver strategic needs for the future. In anticipating the needs for tomorrow, it is clear that leaders need to strategically plan for succession in order to enhance capability and create a vibrant and innovative public sector.
Executive Leadership Program
The Executive Leadership Program, targeted at the SAO2 and above (and equivalent) levels, is designed to develop executive level abilities to contribute positively in delivering the economic, social, and governance responsibilities for all Territorians.
360 Degree Feedback
The 360 Degree Feedback Program, targeted at the AO7 and above (and equivalent) levels, will help participants understand their personal and organisational development needs and can lead to individual insights into aspects of their work requiring professional development.
43
STATE OF TH
E SERVICE REPORT 2013–
14Developing Our People

Lookrukin & Kigaruk – Indigenous Leadership Programs
The Lookrukin & Kigaruk programs, targeted at the AO4/AO7 (and equivalent) levels, are unique personal and professional development programs for Indigenous men and women employed in the NTPS. It is specifically designed to provide an opportunity for participants to gain the knowledge and skills necessary to increase their effectiveness in their current position and to improve their career progression.
Public Sector Management Program
The Public Sector Management Program, targeted at the AO6/SAO2 (and equivalent) levels, is designed to enhance the existing knowledge, skills, attitudes and behaviours of middle and senior managers in order to improve public sector outcomes. The program is the management development program of choice for public sector managers. From 2015 the program will be facilitated and accredited by Queensland University of Technology.
ANZSOG – Executive Masters of Public Administration
The Executive Masters of Public Administration, targeted at the SAO2 and above (and equivalent) levels, is a two year postgraduate qualification designed to give high potential, experienced mid-level managers and aspiring leaders a thorough grounding in the theory and practice of public administration. ANZSOG’s only accredited program, it is delivered to highly committed public sector managers from across Australian and New Zealand governments.
ANZSOG – Executive Fellows Program
The Executive Fellows Program, targeted at the SAO2 and above (and equivalent) levels, is a high-level residential executive program for senior public sector leaders, tailored to build on the core relationship, leadership, and management skills needed in the public sector of the 21st century.
STAT
E O
F TH
E SE
RVIC
E RE
PORT
201
3–14
44
Developing Our People

ECPs aim to attract people to the NTPS workforce through structured development programs. These programs include:
• work experience
• school-based apprenticeships
• Indigenous employment programs
• adult apprenticeships
• graduate traineeships
• Indigenous cadetships and
• vacation employment (for undergraduates on holidays).
The below infographic shows agency participation in ECPs, with 48% of participating agencies employing staff under the NTPS Apprenticeship Program. The Apprenticeship program offers employees hands on learning in their chosen field and affords agencies the opportunity to ‘grow their own’ leaders from entry level positions.
Other ECPs used by agencies include work experience opportunities and industry specific training paths eg Finance Officer in Training in DTF and Prison Officer in Training in DCS.
Early Careers Programs
Apprenticeship Participants by Discipline Apprenticeship Participants by Gender
45
STATE OF TH
E SERVICE REPORT 2013–
14Developing Our People

Graduate Trainee Participants by Discipline Indigenous Employment Program Participants by Gender
Indigenous Employment Program Participants
by Discipline
Indigenous Cadetship Support Participants by Discipline
STAT
E O
F TH
E SE
RVIC
E RE
PORT
201
3–14
46
Developing Our People

47
STATE OF TH
E SERVICE REPORT 2013–
14Developing Our People
NTPS Capability and Leadership Framework
The NTPS CLF provides a common language to support consistent sector wide capability development and is designed to ensure that leadership capabilities and behaviours exist to meet future challenges.
The framework can be used as a centrepiece for discussion around strengthening the work performance of individuals and teams, and to inform decisions around determining and prioritising appropriate professional development and learning. The CLF also assists employees to identify key capabilities required of them at their current level and growth areas for future career development.
A majority of agencies (87%) reported utilizing the CLF in their agency; the use of the CLF ranges from assisting in performance management conversations to aiding in the development of job descriptions.
OCPE ran information sessions for management groups in DME and DPIF on incorporating the CLF as a tool in their newly restructured performance management process.
OCPE plays a significant role in providing relevant sector wide Leadership Development Programs. To ensure these programs are contemporary and appropriately contextualised, a review of the suite of programs offered though OCPE is currently being undertaken, including considering the programs’ alignment with the CLF and sector’s needs.
Technical streams and agency specific training and development opportunities exist within each agency as a means of developing specialised skill sets. Regardless of the classification or stream of employment, the CLF provides agencies with a benchmarking tool that identifies capabilities that are essential at each level of an employee’s career. Some agencies have begun the process of aligning their Physical and Technical classifications with the Administrative classifications used in the CLF to allow seamless comparison and use of the tool.
The following case study on DoH’s “The Capability and Leadership Framework - Health Professionals’ Training Matrix” discusses this initiative further.

STAT
E O
F TH
E SE
RVIC
E RE
PORT
201
3–14 Developing Our People
48
The Capability and Leadership Framework – Department of Health - Health Professionals’ Training Matrix
DoH’s Learning and Development unit has developed a Leadership Capability and Development Framework that incorporates a matrix of Health Professions mapped against the CLF. This matrix has also been aligned to training opportunities offered by OCPE and DoH.
CLF and Health Service Capabilities Matrix
CLF1 CLF2 CLF3 CLF4 CLF5 CLF6 CLF7 CLF8 CLF9 CLF10 CLF11 CLF12
ApprenticeTrainee
Technical Officer
Graduate Trainee
AO1 AO2 AO3 AO4 AO5 AO6 AO7 SAO1SAO2, ECO1
ECO2 ECO3 ECO4
Phy 1 - Phy 3 Phy 4 - Phy 5 Phy 6 Phy 7 Phy 8 - Phy9
T1 T2 T3 T4 T5 T6
P1 P2 P3 SP1 SP2
N1 N2 N3 N4 N5 N6 N7/8 N8
Acute MO1 MO1-MO2MO4-MO5
HMO1-HMO7
(S) REG SMO1 SMO1/2 SMO2
Remote MO1 MO2-MO3 RL1 RL2 RL3 RL4 RL5
To be Aligned - Aboriginal and Torres Islander Strait Health Practitioners 1 to 6
To be Aligned - Dentist / Senior Dentist / Dentist Manager / Remote Dentist Manager / Remote Services Manager / Senior Dentist Manager / Clinical Manager / Principal Dental Advisor
AO - Administration Officer N - Nurse MO - Medical Officer ATISHP - Aboriginal and Torres Strait D - Dentist SAO - Senior Administrative Officer HMO - Hospital Medical Officer Health Practioner SD - Senior Dentist ECO - Executive Contract Officer Phy - Physical (S) REG - Specialist Registrar DM - Dentist Manager SMO - Specialist Medical Officer RDM - Remote Dentist Manager P - Professional T - Technical RL - Remote Level SDM - Senior Dentist Manager SP - Senior Professional CM - Clinical Manager PDA - Principal Dental Advisor
War
d Cl
erk
Pers
onal
Ass
ista
nt
Enro
lled
Nur
se
Firs
t Lin
e M
anag
er
Phar
mac
ist
Inte
rn M
edic
al O
ffice
r Gr
adua
te N
urse
Qua
lity
Offi
cer
Juni
or M
edic
al O
ffice
r Ge
nera
l Nur
se
Mid
wife
Mid
dle
Man
ager
Cl
inic
al P
ract
ition
er
Med
ical
Offi
cer
Nur
se E
duca
tor
Seni
or P
ract
ition
er
Regi
stra
r in
Trai
ning
Cl
inic
al N
urse
/Mid
wife
co
nsul
tant
Dire
ctor
Sp
ecia
lists
Cl
inic
al N
urse
Man
ager
Seni
or D
irect
or
Med
ical
Co-
Dire
ctor
s N
ursi
ng D
irect
ors
Dire
ctor
of M
edic
al
Serv
ices
D
irect
or o
f Nur
sing
Exec
utiv
e D
irect
or
Chie
f Med
ical
Offi
cer
Chie
f Hea
lth O
ffice
r Ch
ief N
ursi
ng &
Mid
wife
ry
Offi
cer
What Worked?

49
STATE OF TH
E SERVICE REPORT 2013–
14Developing Our People
Health Professions and the CLF
Ms Bhavini Patel, Acting Chief Pharmacist, Clinical Engagement and Leadership Support consulted with nurses and medical officer representatives to gain agreement on the alignment of their designations to the CLF.
In conjunction with Learning and Development, Ms Patel will meet with relevant stakeholders to discuss the rationale and factors to be considered to align the Dental and Aboriginal and Torres Strait Islander Health Practitioner designations.
The benefits of aligning classifications with the CLF include:
• increased employee satisfaction – their professions recognised and included into all of government and departmental frameworks
• employees have a sense of belonging and understanding where they fit and
• employees understand the standard required for their employment level.
Health Professions, CLF and Corporate Training Opportunities
DoH values investment in professional development and encourages lifelong learning and, therefore, offers all employees a range of training opportunities from one day short courses (across a variety of topics) to 12 month leadership and management development programs.
To assist employees and managers in determining training needs, the employment levels have been mapped against OCPE Sector Wide Development programs and the agency’s short courses/leadership programs.
The alignment of what training suits which levels is dependent on a variety of considerations including: legislative and agency requirements, program learning outcomes, and the recommended target audiences for each program.
The benefits include:
• all employment levels included
• understanding the range of training available and
• determining best training to be undertaken by employees.
Work Partnership Plans
Given the alignment to Health Professions to training and development, the CLF will assist employees to complete their Work Partnership Plans as:
• employees can conduct self assessments against the CLF as a benchmark and aid their career progression and
• the CLF is a resource for all employees to complete their Work Partnership Plans.
CLF and Health Service Capabilities Matrix
CLF1 CLF2 CLF3 CLF4 CLF5 CLF6 CLF7 CLF8 CLF9 CLF10 CLF11 CLF12
ApprenticeTrainee
Technical Officer
Graduate Trainee
AO1 AO2 AO3 AO4 AO5 AO6 AO7 SAO1SAO2, ECO1
ECO2 ECO3 ECO4
Phy 1 - Phy 3 Phy 4 - Phy 5 Phy 6 Phy 7 Phy 8 - Phy9
T1 T2 T3 T4 T5 T6
P1 P2 P3 SP1 SP2
N1 N2 N3 N4 N5 N6 N7/8 N8
Acute MO1 MO1-MO2MO4-MO5
HMO1-HMO7
(S) REG SMO1 SMO1/2 SMO2
Remote MO1 MO2-MO3 RL1 RL2 RL3 RL4 RL5
To be Aligned - Aboriginal and Torres Islander Strait Health Practitioners 1 to 6
To be Aligned - Dentist / Senior Dentist / Dentist Manager / Remote Dentist Manager / Remote Services Manager / Senior Dentist Manager / Clinical Manager / Principal Dental Advisor
AO - Administration Officer N - Nurse MO - Medical Officer ATISHP - Aboriginal and Torres Strait D - Dentist SAO - Senior Administrative Officer HMO - Hospital Medical Officer Health Practioner SD - Senior Dentist ECO - Executive Contract Officer Phy - Physical (S) REG - Specialist Registrar DM - Dentist Manager SMO - Specialist Medical Officer RDM - Remote Dentist Manager P - Professional T - Technical RL - Remote Level SDM - Senior Dentist Manager SP - Senior Professional CM - Clinical Manager PDA - Principal Dental Advisor

Planning Our Future Workforce
To ensure the success of the NTPS into the future, careful consideration must be given to ensuring adequate steps have been taken to align the needs and priorities of the NTPS with the design of the workforce to ensure it can continue to meet its future objectives. Planning for tomorrow can be challenging in a public
sector that is currently facing capacity and capability gaps, which it is trying to address. Nonetheless, it is essential. The NTPS is meeting these challenges through proactive workforce planning, succession planning and staff retention strategies.
Workforce Planning
Greatest workforce risks as identified by agencies
OCPE has begun work and consultation with agencies to create a sector wide Strategic Workforce Plan. However, there is an expectation that all agencies have an agency specific workforce plan that encompasses their unique sectors and workforce requirements. Currently, 39% of agencies responded that they had a workforce plan, with an additional five agencies
having one under development. A recent client satisfaction survey of OCPE’s services produced feedback that agencies wanted more support with workforce planning, indicating that some agencies may not have workforce plans due to a lack of in house skills or knowledge in the area. To help remedy this, OCPE has published on its website a suite of up to date resources
STAT
E O
F TH
E SE
RVIC
E RE
PORT
201
3–14
50
Planning Our Future Workforce

51
STATE OF TH
E SERVICE REPORT 2013–
14Planning Our Future Workforce
aimed at assisting agencies in their workforce planning efforts and has, in the last 12 months, provided agencies training in workforce planning, delivered by Government Skills Australia.
For large agencies, such as DoE, workforce plans exist for some but not all divisions of the agency (for example many schools have their own workforce plans).
In 2013-14 five agencies’ workforce plans included a workforce demand analysis, ie the required capacity (the number of people needed to be employed directly by an agency to achieve agency outcomes).
In 2013-14, only six agencies’ workforce plans included a workforce supply analysis, ie the avenues for recruitment, including universities, interstate and international migration, and education institutions.
Succession Planning
Succession planning strategies ensure that there are qualified people capable of filling critical positions within agencies. The approach to succession planning across the agencies varied. All bar two agencies undertake a combination of the following approaches to succession planning:
• mentoring/coaching
• job sharing
• acting opportunities/backfilling
• job shadowing
• graduate program
• talent management
• career pathways and
• analysis of age demographics to identify areas of high risk.
Figure 19: Agency Approaches to Succession Planning
Figure 18: Number of Agencies with a Workforce Plan

STAT
E O
F TH
E SE
RVIC
E RE
PORT
201
3–14 Planning Our Future Workforce
52
Identified Capacity (Headcount) and Capability (Skills) Gaps
More than half of the agencies (68%) identified critical capacity gaps, a significant increase from 23% of agencies in last year’s report. As can be seen in Top four capacity gaps infographic, the range of gaps identified was broad.
61% of agencies identified key capability skill gaps in their workforce, which is also an increase from 23% of agencies last year. “Leadership and management” skills gaps were the most prevalent. People and performance management was also highlighted by many agencies as an area requiring attention which indicates that current performance management offerings may not be effective. Investment in professional development (both accredited and non-accredited) is the most common method being used by agencies to address these capability gaps.
Top four capacity gaps
Top four capability gaps

53
STATE OF TH
E SERVICE REPORT 2013–
14Planning Our Future Workforce
Staff Retention
Strategies to improve staff retention were undertaken by 61% of agencies, with internal agency recognition programs being the most common.
As an alternative means of retaining staff, DTF has developed systems to support and encourage further professional development and continuing education, in addition to allowing staff to balance their professional and personal priorities by offering a range of flexible work arrangements. These flexible work arrangements included:
• In 2013-14 DTF provided study assistance for university course fees and Certified Practicing Accountant courses to 18 employees.
• DTF approved flexible work arrangements and leave without pay for career breaks, travel, or family purposes for a number of staff.
• DTF continued to be supportive of mobility/secondment arrangements, and rotational arrangements for staff participating in employment programs such as apprenticeships, vacation employment, scholarship programs, and DTF’s graduate program.
DTF also encourages placements of administrative officers as well as executive level staff in other DTF business units or in other agencies for professional and personal development.
Many agencies use exit interviews as a key information source for informing their retention strategies. PFES proactively conduct pre exit interviews to discuss alternatives with the employee who has resigned before they leave, in an attempt to retain them.
Productivity
Agencies were asked if they have strategies and programs in place to improve productivity. The examples provided by agencies were encouraging, with most agencies having a range of measures in place to assess or encourage productivity within their agency.
• DoH has introduced the “New Services Framework for Health” aimed at increasing the productivity of the NTPS’s largest agency.
• DoT has looked at how to increase the effectiveness of their services to the public and introduced an MVR smart phone app as well as changes to streamline registration and licensing.
• PFES has restructured their agency in line with some necessary budget savings that focus on productivity.
• DCIS commenced a functional alignment process in 2013. This involved examining its services and business areas to ensure functions were aligned to maximise productivity. In 2014 the agency implemented a new organisational structure based on the alignment of functions. The functional alignment project is ongoing, with the current focus now on business and process engineering to support the agency’s new structure.
Percentage of agencies that offer exit interviews or surveys for departing staff

STAT
E O
F TH
E SE
RVIC
E RE
PORT
201
3–14 Planning Our Future Workforce
54
Identified Workforce Challenges and Risks
Redeployment
Where a CEO is of the opinion that an ongoing employee is potentially surplus to the requirements of his or her agency, and the agency has made all reasonable attempts to find a suitable placement for the employee, the person may be referred to the CPE as a redeployee, in accordance with section 41 of PSEMA.
Potentially surplus means that the employee is in a class comprising a greater number of employees than is necessary for the efficient and economical working of the agency; the employee’s services cannot be effectively used because of technological or other changes in the work methods of the agency; or changes in the nature, extent, or organisation of the functions of the agency.
There was a significant increase in redeployee numbers in the reporting period, influenced by the outsourcing of the Government Printing Office and certain functions of the Department of Infrastructure, continuing restructures across government, and agencies actively managing the number of staff unattached to positions. In particular, a number of employees who had been subject to the informal redeployment process following its inception in December 2012 were formally declared under PSEMA.
A total of 88 employees accepted an offer of voluntary retrenchment in the reporting period and there were no involuntary redundancies.
Workforce Data
To make evidence based decisions on the future needs of the NTPS workforce it is imperative that the current workforce is accurately reported on and analysed. To ensure the reporting that is
produced is correct agencies were asked if PIPS accurately reflects the structures existing in agencies. Of the agencies surveyed, 65% responded that PIPS accurately reflected the staffing arrangements in their agencies. All agencies currently have unattached/supernumerary employees for a range of reasons, including the use of supernumeraries for early career programs, as a result of structural change, as well as to fill positions that were not yet established.
Workforce Metrics
During the 2012–13 reporting period OCPE released a Workforce Metrics Dictionary and Guidelines to support efforts to strengthen workforce planning across the NTPS. In 2012–13 OCPE commenced developing a “bird’s eye view” of workforce data across the NTPS. The first report was released to agency CEOs for the 2013 January to March quarter and allows agencies to compare their own agency statistics with other agencies and the sector as a whole, with a view to establishing good practice and ultimately benchmarks. Twelve months on, 17 agencies reported that they are finding this report useful, with a further seven agencies reporting that it’s too early to tell if this project will be of real value to their agency. Three agencies believe that their internal reporting mechanisms provide them with sufficient information.
The majority of agencies use the workforce metrics to inform strategic decisions and as a reporting tool for their executive or management groups, which are both intended outcomes of the project.

55
STATE OF TH
E SERVICE REPORT 2013–
14Planning Our Future Workforce
Innovation within Agencies
Innovation is essential in an ever changing environment that requires government to accomplish more with less, and develop new solutions to increasingly complex challenges. Increasing, our capacity to embrace innovation in our daily business will result in better policy, better services, and better value for the community, while making the NTPS a leading edge and rewarding place to work.
It is acknowledged across the NTPS that innovative ideas can be in the form of small ideas that have a real impact in an agency or work area, and that ideas do not need to be ground breaking.
During the reporting period, some agency innovations included:
• In August 2013 DTF held a strategic engagement day. Prior to the event, a staff survey was run to gather views and ideas from all DTF staff as input for the day. The survey sought responses from staff in areas including pride in the work/workplace, challenges presented by the work, sense of engagement in the workplace, support provided by managers/level of resourcing to do work, and assessment of climate/quality of culture.
• At the strategic engagement day the agenda items included: communication within DTF (both between managers to staff and across divisions), how to maximise training options in a constrained budget environment, opportunities for rotations within the agency and external to the agency and how these can be managed, and services/functions that they currently undertake that could be done differently.
• A feedback session from the survey and the strategic engagement day was subsequently held for all staff. Among the outcomes were a series of information sessions for staff,
increased utilisation of internal rotations as professional development opportunities and to back fill short term vacancies, as well as greater synergy between output group functions.
• DLPE has developed the “Building a New DLPE initiative”. DLPE worked collaboratively with YellowEdge to coordinate facilitation of the ‘Building A New DLPE’ workshops. These workshops form part of the DLPE’s aim to enhance morale and job satisfaction within the workplace. Elements of the team building program include what makes a good team, assist staff to understand ‘thinking preferences’ and how it impacts communication, problem solving, and motivating and inspiring others. Using results from the Herrmann Brain Dominance Instrument questionnaire, YellowEdge works closely with work units on team building.
• DCF introduced regionalised bulk recruitment which attracted potential child protection professionals through targeted online advertising on professional websites and the NT News to ensure local interest continues to be sourced.
• DoE commenced a new TRS in November 2013. TRS is an online application system that provides end to end processing for the recruitment of classroom teachers and relief teachers. An enhancement has been under discussion with DCIS to provide an interface with eRecruit. All applicants apply online and TRS generates referee report requests via email. A recruitment officer makes personal contact with all applicants, within two days of applying, to discuss any issues with their application and to inform them of what to expect from the agency’s teacher recruitment process. The recruitment team screens applicants, including checks

STAT
E O
F TH
E SE
RVIC
E RE
PORT
201
3–14 Planning Our Future Workforce
56
What Worked?
for teacher registration and Working with Children Clearance. Applicants are flagged as eligible and available to form a pool of screened applicants. Principals then identify potential recruits from the pool, and assess their professional standing and suitability for their context, before recommending offers of employment to their Regional Director. On approval of the Regional Director, principals
enter the request for employment into eRecruit.
• DCS launched the “smoke free prisons” initiative from 1 July 2013. The agency went smoke free in July 2013; with activities implemented to support staff. A recent survey shows that of those respondents who declared as smokers, 27% had given up as a result of the initiative.
Org Charts: Business Critical Data at a Glance
With the onslaught of reports modern managers are exposed to, the presentation of information has gained increased importance, and this is something that DoE has certainly taken notice of. Regardless of size, communicating business critical information to managers is important for all organisations. However, with over 5,000 employees, serving over 150 schools, in a land mass larger than South Africa, engaging recipients in management reports takes on additional complexities. Through graphically combining information from PIPS and BPI, the Human Resource Metrics team have been able to deliver business critical information in a format more akin to an infographic than the data heavy spreadsheet managers are typically used to. This graphical presentation of budget and positional information has increased engagement over previous reports of similar information, as it provides positional and budgetary information at a glance for time poor managers.
With the innovative organisation charts produced through Org Plus 9, managers can not only see their establishment,
they can see the comparison between people, positional (held in PIPS), and budgetary information (held in BPI). For example, if a vacant position exists in PIPS, but this position doesn’t exist in BPI, then colour coding indicates to the manager that action is required. This may include such actions as allocating budget to the position or closing the position off in PIPS. Alternatively, a filled position which hasn’t had budget allocated to it will be highlighted within the org chart, prompting managers to ensure budget is allocated to this position.
At the organisation level, the adoption of this tool by managers within DoE acts as a constant data correction mechanism, ensuring the establishment is kept as current as possible. The outcome of this is improved reporting around such areas as vacant positions, divisional FTE allocation, and reporting line accuracy.
Not an organisation to rest on current successes, DoE is already partway through the development of future enhancements to this tool, which will deliver further value to its managers and executives.

57
STATE OF TH
E SERVICE REPORT 2013–
14Planning Our Future Workforce
Organisational Chart

Staffing Profile of the NTPS
Staffing Statistics
Multiple previous editions of the Statistical Profile of the NTPS have shown long term trends in a number of the metrics profiled in this report. Following the August 2012 election the new government set about bringing expenditure under control. One part of that strategy was to address the rise in public sector staffing numbers over preceding recent years. While some of this rise had been funded by additional special purpose grants from the Commonwealth, it was seen that in order to keep the Budget under control this rise needed to be stemmed.
As part of this strategy a policy to control fixed period employment was implemented whereby expiring fixed period employment contracts were only to be renewed following scrutiny
of the necessity of retaining the position; in other words renewal was not to be seen as a foregone conclusion. As a result the normal drop off in numbers over the Christmas break at the end of 2012 was magnified, with FTE numbers dropping by over 700 in the two months to the end of January 2013. From that low the numbers slowly rose by over 500 to the end of June 2012, and it was reported last year that this rapid change had caused a blip in some of the time series profiles described in that report. From the June quarters 2013 to 2014 FTE numbers have risen by 270 and are now back at a similar level to June 2012. The former rapidly rising trend in staffing has flattened over the two year period, and it may be helpful to bear this in mind when considering some of the following descriptors.
Overview
References to the NTPS in this report include the agencies listed in Figure 23 on page 64. The list includes a substantial number of people employed under Acts other than PSEMA, including uniformed police, employees of Tourism NT, employees of the AAPA and ministerial staff.
It should also be noted that the total public sector numbers described in this report are different to those described in the NT Treasury Budget papers, as this report includes PWC.
The analysis in the following sections is based mainly on data extracted from PIPS. Most figures, summaries and tables refer to individual employees, not to their FTE status. The basic
criterion for an individual being included in the summary is that they had a positive FTE figure as defined by PIPS (i.e. they recorded a positive pay transaction of some description) in the final pay of the reporting period.
Staffing analyses from the early 1980s until 1992-93, relied largely on data contained in a previous personnel database. The accuracy and scope of the analyses were limited, as some agencies maintained detailed personnel records in facilities other than the default database. From mid 1993 the PIPS system came into mandated use, and so most time-series comparisons described below start at that point in time.
STAT
E O
F TH
E SE
RVIC
E RE
PORT
201
3–14
58
Staffing Profile of the NTPS

Comparisons made using data after June 1994 are more accurate than those using earlier data. However, small changes in some variables may be due to changes in definitions or developments in processing protocols.
In addition, the FTE staffing calculation was fine tuned in late 1999 to decrease the variance in
the FTE figure. The revised calculation was then back cast to 1995, which was when pay data started to be back loaded into PIPS as part of pay processing. Consequently, caution should be exercised when making detailed comparisons of some current data with PIPS data extracted before 1995.
Equity and Diversity
Information on the representation of EEO groups in the NTPS is stored in PIPS. NTPS employees voluntarily identify their own EEO status, usually when they start employment. The data tends to under-represent the actual number of employees who are Indigenous, people with disability and people from culturally diverse backgrounds.
There are a number of reasons why people may choose not to disclose their EEO status, including fear of stigma or discrimination or feeling that their disability does not affect their ability to perform their job. However, the introduction of agency censuses, and improvements in data collection and processing have been responsible for at least some of the increases in the percentage values over the past nine years. Also, for the purposes of obtaining the most accurate representation practicable, the historical Indigenous data series includes all those employed in generic Indigenous classifications, such as Aboriginal Health Workers and Aboriginal Community Police.
Please note that the people from culturally diverse background figures from 2007 onward have been revised since earlier State of the Service reports, as it was discovered that the standard personnel system report had not been revised to pick up changes made to the non-English speaking background questions in 2006 to bring them into line with Australian Bureau of Statistics standards and was understating the true figures. The current figures in Figure 20 now follow a consistent definition across the years 2006 to 2007, but differ from those in previous reports in this series in which data for the years 2007 to 2010 were low.
At June 2014, NTPS the proportion of employees identified as being:
• Indigenous was 8.7%
• a person with disability was 1.1% and
• a person from culturally diverse background was 8.4%.
59
STATE OF TH
E SERVICE REPORT 2013–
14Staffing Profile of the NTPS

The following table highlights the annual changes to the percentages of employees identified as being in the four highlighted EEO groups from 2002. The year 2002 saw the introduction of the IECDS in the NTPS, and it was also the year the regular and consistent collection of Indigenous employee statistics began.
Figure 20: Representation of Equal Opportunity Groups in the NTPS
CategoryJune 2004
June 2005
June 2006
June 2007
June 2008
June 2009
June 2010
June 2011
June 2012
June 2013
June 2014
Ten-year change
Indigenous Australians 5.7% 6.6% 6.9% 7.3% 7.7% 8.1% 8.1% 8.1% 8.4% 8.4% 8.7% 3.0% pts.
People with disability 1.7% 1.8% 2.1% 1.9% 2.0% 1.8% 1.5% 1.4% 1.2% 1.2% 1.1% -0.6% pts.
People from a cultural diverse background*
3.6% 4.1% 4.9% 5.8% 6.2% 5.9% 5.5% 5.1% 5.7% 7.1% 8.4* 4.8% pts.
Women in senior management (SAO2 to ECO6)
27% 31% 32% 34% 37% 40% 40% 43% 44% 44% 44% 17.0% pts.
* Revised - Cultural diversity questions changed in 2006-07 to parallel national standards – defined as people of a non-English speaking background with neither parent’s first language being English
Of particular note in the above table is that over the last ten years Indigenous employees have increased their participation by 3.0 percentage points and women in senior management by 17 percentage points.
Staffing Levels
Figures 21 and 22 show movements in total staffing in the NTPS compared to changes in the NT population and employment numbers from 1983 (about the time the NTPS consolidated following self-government) to 2014. There has been an overall increase in public sector employment from around 14 200 to 19 965 persons over this period. While data from the 1980s and early 1990s was compiled from two different databases to PIPS, the basic definitions
and assumptions are similar enough to make valid any broad comparisons made in this report.
Since the early 1990s, an FTE figure based on payroll has been used to track numbers of employees, and this provides more robust data than was used previously. Nevertheless, the overall time series from the late 1980s to the 1990s is quite smooth, as can be seen clearly from Figure 22, which indicates that the effects of the changeover at that time were marginal.
STAT
E O
F TH
E SE
RVIC
E RE
PORT
201
3–14
60
Staffing Profile of the NTPS

Aggregation of the data shows that from 1983 to 2014, the NT population grew by 83% while the labour force grew by 111%. The NTPS is currently 41% larger than it was in 1983. Further analysis shows that, in 2002, the NTPS was 1.1% larger than in 1983, but increased by a further 14.8% from 2002 to 2008, and by an additional 12.8% in the two subsequent years to June 2010. This latter rapid growth can be attributed largely to increased NTPS staffing as a result of the Federal Government Intervention and to the Territory Government’s Closing the Gap on Indigenous Disadvantage Strategy. Following the introduction by government of an agency specific staffing caps from March 2010, the increase from the June quarter 2010 to the
June quarter 2011 was limited to 2.1%, but the subsequent year saw a further increase of 4.6%, representing 880 full time equivalent employees. This latter increase was comprised largely of expanded front line services to support the various Closing the Gap/Stronger Futures initiatives, as well as progressing the previous NT Government’s Territory 2030 Strategy.
Following the measures introduced by the new government to stem the growth in staffing, over the 2012-13 financial year there was a decrease in FTE numbers of 1.2%. Over the current financial year this was reversed with an increase of 1.4%.
Figure 21: Growth in the NTPS, Labour Force and Population June 1983-2014
61
STATE OF TH
E SERVICE REPORT 2013–
14Staffing Profile of the NTPS

The change in the size of the public sector since 1983 is compared directly to population growth in Figure 22. The graph shows that the population of the Territory has grown steadily during this period while NTPS staffing has varied substantially, first peaking in 1986 at around 15 000. The decrease that followed was precipitated by significant cuts in federal funding to the NT following a review of state and territory financing. Staffing numbers then steadily increased until the NT Government’s Estimates Review Committee decisions in 1991 began a further three-year decline of close to 1000 public servants. Then followed another period of growth that peaked in the year 2000. In 2001 02 there was a drop of nearly 290 people after significant budget cuts to agencies, the outsourcing of information technology (involving about 120 people) and a major restructuring of the sector following a change of government. This restructure reduced the number of individual agencies from 35 to 19, which created some uncertainty about staffing budgets and required staffing levels.
This process of significant change appeared to have consolidated when staff numbers increased by 235 over the 12 months to June 2003. Following a number of government commitments on increasing staff resources (mainly affecting police, education and health), the numbers increased in 2003-04 by 565 and from 2004-05 by a further 651. During this period there were also significant increases in several agencies other than those targeted.
From the time of a further minor restructuring of Administrative Arrangements from June 2005, which increased the number of agencies from 19 to 21, the subsequent overall staffing level remained relatively constant for the ensuing 18 months or so. From June 2007 to June 2008 there was an increase of 378, and from June
2008 to June 2009 a further increase of 1342. The 2009 10 increase of 830 was followed by a considerably reduced addition of 396 during 2010 11, following the introduction of the staffing cap mentioned previously. The major part of the 2007 to 2009 increases appeared to be associated with the additional Australian Government funding and resulting staffing required for the Intervention in Indigenous communities, particularly in the areas of health, education and housing. From 2009 11 the expansion was further extended to other agencies and included reforms involving infrastructure and local government. Also there was a refocusing of the health system in 2011, with the splitting of Department of Health & Families into DoH and DCF.
While the staffing cap remained in place during 2011 12, there were significant staffing increases in all the major front line agencies, particularly Health, Education & Training, Children & Families and Justice. During the March quarter the caps for a number of agencies were raised to bring them more into line with their actual staffing levels, but the June quarter then saw a further surge in numbers so that the average for the June quarter 2012 was 880 higher than for the June quarter 2011.
Following the change of government in August 2012 there was a larger than normal drop of over 700 in staffing numbers over the Christmas period, but staffing slowly built up again over the remainder of the financial year so that the net decrease over the year from June quarter 2012 to June quarter 2013 was a relatively modest 238. From June 2013 to June 2014 this decrease has been countered by an increase of 270, owed principally to further growth in the Health portfolio.
STAT
E O
F TH
E SE
RVIC
E RE
PORT
201
3–14
62
Staffing Profile of the NTPS

Figure 22: Movements in NT Population and NTPS Staff 1983-2014
The changes over the last three years are illustrated clearly in Figure 23, which shows full-time equivalent staffing numbers for each agency averaged over the June quarter for 2014 and for the previous three years. Also shown are the changes for each agency between years. This quarterly reporting protocol is in line with the tables published on the OCPE internet site. The reason for this protocol is that comparison of quarterly data 12 months apart removes seasonal effects on staffing numbers and is more sensitive than annual averages to relatively rapid changes in overall staffing levels.
63
STATE OF TH
E SERVICE REPORT 2013–
14Staffing Profile of the NTPS

Figure 23: Changes to Average Public Sector Staff Employed by Agency: June Quarter 2011 to June Quarter 2014
AGENCY*
Average June
quarter 2011
Average June
quarter 2012
Change over 12 months
Average June
quarter 2013
Change over 12 months
Average June
quarter 2014
Change over 12 months
Aboriginal Areas Protection Authority 32 31 - 1 31 .. 26 - 5
Arts & Museums new 147 147 136 - 11
Attorney- General & Justice new 430 430 451 21
Auditor General 4 4 . . 5 1 5 . .
Business new 307 307 305 - 2
Business & Employment 759 806 47 ceased - 806
Chief Minister 273 275 2 209 - 66 283 74
Children & Families 585 741 156 606 - 135 647 41
Commissioner for Public Employment 27 32 5 27 - 5 26 - 1
Community Services new 166 166
Construction & Infrastructure 432 407 - 25 ceased - 407
Corporate & Information Services new 602 602 621 19
Correctional Services new 909 909 954 45
Darwin Port Corporation 96 105 9 99 - 6 98 - 1
Education 4 383 4 584 201 4 442 - 142 4 257 - 185
Health 5 335 5 600 265 5 820 220 6 083 263
Housing new 419 419 396 - 23
Housing, Local Govt & Regional Services 619 674 55 ceased - 674
Infrastructure new 377 377 344 - 33
Justice 1 297 1 428 131 ceased -1 428
Land Development Corp new 9 9 12 3
Land Resource Management new 250 250 251 1
Lands & Planning 552 567 15 ceased - 567
Lands, Planning & Environment new 284 284 279 - 5
Legislative Assembly 102 96 - 6 94 - 2 102 8
Local Government & Regions new 45 45 44 - 1
Mines & Energy new 125 125 148 23
Natural Resources, Environment, Arts & Sport 862 791 - 71 ceased - 791
NT Electoral Commission 15 43 28 13 - 30 13 ..
Ombudsman 15 14 - 1 13 - 1 12 - 1
Parks & Wildlife Commission new 270 270 273 3
Police, Fire & Emergency Services 1 914 1 957 43 2 043 86 2 093 50
Power & Water Corporation 997 1 054 57 1 059 5 1 057 - 2
Primary Industry & Fisheries new 288 288 308 20
Regional Develpment & Indigenous Advancement new 178 178 ceased - 178
Resources 447 427 - 20 ceased - 427
Sport & Recreation new 47 47 55 8
Tourism NT 129 117 - 12 107 - 10 75 - 32
Transport new 269 269 282 13
Treasury & Finance 178 180 2 171 - 9 163 - 8
TOTAL 19 053 19 933 880 19 695 - 238 19 965 270
Note: Numbers refer to the full-time equivalent of all paid staff including those on paid leave and casual employees.* Agencies marked ‘ceased’ and ‘new’ are a result of changes in Administrative Arrangements subsequent to the change of government
in August 2012
STAT
E O
F TH
E SE
RVIC
E RE
PORT
201
3–14
64
Staffing Profile of the NTPS

65
STATE OF TH
E SERVICE REPORT 2013–
14Staffing Profile of the NTPS
Staffing by Employment Status
Data on the employment status of staff from June 2004 to June 2014 is presented in Figure 24. The table shows that the proportion of ongoing employees dropped by 5.4 percentage points over this period. There had been a slow trending down of this figure over many years up until last year, but from June 2012 to June 2013 this was reversed, with an increase of 3.5 percentage points and a corresponding drop in the number of fixed period employees of 3.4 percentage points. While the reason for this cannot be stated definitively, that there was a period of several months following the
installation of the new government when there was a policy of scrutinising the necessity of renewing expiring fixed term contracts would have had some influence on this figure. This year the downward trend has resumed with a decrease of 1.8 percentage points. Nevertheless the proportion of ongoing employees, at 71.6%, is still the highest level since June 2008.
Earlier data not included in the table shows that in 1994 the percentage of ongoing employees was 81.5%, which gives an overall drop of 9.9 percentage points since that time.
Figure 24: Employment Status of NTPS Staff 2004-2014
STATUS 2004 2005 2006 2007 2008 2009 2010 2011 2012 2013 2014Change
04 to 14
Permanent 77.0% 75.5% 75.6% 74.0% 72.3% 70.9% 70.4% 70.8% 69.9% 73.4% 71.6% -5.4% pts.
Temporary 19.6% 21.3% 21.3% 22.1% 23.7% 24.9% 25.3% 25.3% 26.1% 22.7% 24.6% 5.0% pts.
Casual 3.3% 3.2% 3.0% 3.6% 3.7% 4.0% 3.9% 3.7% 3.7% 3.6% 3.6% 0.3% pts.
Misc. 0.2% 0.1% 0.1% 0.3% 0.3% 0.3% 0.4% 0.3% 0.3% 0.3% 0.3% 0.1% pts.
100% 100% 100% 100% 100% 100% 100% 100% 100% 100% 100%
Part-time Staffing
Part-time work has, in recent years, been encouraged as an option to assist in retaining the valuable skills of employees who are striving to achieve a better work-life balance. For the purposes of this section, part-time employment includes all employees who have a part-time flag in PIPS.
At 2,217, the number of part-time NTPS employees this year is 211 (1.0%) more than it was at the same time last year. This is around three and a half times more than were working in a formal part-time capacity in 1994. It should be noted that the part-time staffing numbers cited this year differ from those in previous

STAT
E O
F TH
E SE
RVIC
E RE
PORT
201
3–14 Staffing Profile of the NTPS
66
editions of this report. This is because the definition of part-time has been revised and is now in line with the agreed definitions as outlined in the recently developed workforce metrics reports where only ongoing and fixed period employees are included. The largest employment category in permanent part-time work is nursing, which currently holds nearly one third of these positions, with the administrative stream not far behind. However, there have also been large increases in the number of part-time employees across all streams, with the administrative, professional and technical
streams all in excess of a five-fold increase since 1994.
In terms of the proportion of workers within the streams who are part-time, the highest is assistant teachers where 52% work part-time, followed by the nursing stream at 27% and medical officers at 15%. At the other end of the spectrum are fire and prison officers, of which there are none permanently working part-time.
The increase in the proportion of workers in part-time employment since 2002 is shown in Figure 25.
Figure 25: Part-time in the NTPS 2003-2014
STATUS 2004 2005 2006 2007 2008 2009 2010 2011 2012 2013 2014Change
‘04 to ‘14
Part-time staff 8.5% 8.6% 8.9% 8.8% 8.9% 9.3% 9.0% 9.2% 9.6% 9.8% 10.7% 2.2% pts.
Further discussion of the demographics of part-time staff is contained in the following section.
Staffing by Gender
The proportion of women in the public sector as at June 1994 was 55.6%. Since then the figure has risen slowly but steadily to reach 63.0% in both 2011 and 2012. Last year it dropped slightly to 62.9%, and this year decreased further to 62.7% (see Figure 26). Over this period, this equates to an average annual increase in the proportion of women of 0.40 percentage points. Why there has been an apparent counter movement in the former steady upward trend is not known.
This may be viewed in the context of Australian Bureau of Statistics national data, which indicates that the trend labour force participation rate for women (i.e. the number of women either in work or looking for work) has increased by 15.2 percentage points since the beginning of the ABS Labour Force trend series in 1978, whereas that for men has decreased by 8.4 percentage points over the same period. It should be noted that the overall downward trend for men reversed slightly from mid 2003 to the end of 2007 but again dropped off once

67
STATE OF TH
E SERVICE REPORT 2013–
14Staffing Profile of the NTPS
the Global Financial Crisis (GFC) took effect and has resumed its 30+ year downward course. Conversely, the GFC had only a marginal effect on the upward trend of the female participation rate until early 2009, but subsequently it too dropped significantly but has since flattened out, in concert with the movement in the proportion of women in the NTPS described above.
In terms of NT labour force data, the participation rate for women has increased by 20.6 percentage points since 1978, whereas that
for men has dropped by 2.6 percentage points. Last year it was commented that the then participation rate for women was almost identical to that for the previous year, whereas that for men had risen by 1.3 percentage points, “presumably largely as a result of the Inpex gas project”. This year the rate for women has risen by 0.9 percentage points and that for men by 0.8 percentage points. Whatever the reason for this, it certainly indicates a healthy labour market.
Figure 26: Proportion of Women in the NTPS 1993-2014
Following on from the previous section on part-time work, it is of interest to note the distribution of part-time staff by age and gender. Figure 27 illustrates that permanent part-time work arrangements are far more common for women than men (85% of part-timers are women) and far more prevalent in the middle years, especially for women.
Figure 27 further breaks this down by showing the proportion of total men and women in each age group who are engaged in part-time
work arrangements. Note that this graph treats each individual age group separately and, regardless of how many are in the age group, charts the proportion in that group who are part-time. This shows that such arrangements are most common among the youngest and oldest groups, with an additional upward trend during the child-rearing years. The latter is far more noticeable for women than for men. Also obvious is that men are proportionately far less likely to be engaged in part-time work for all age groups, except the young.

STAT
E O
F TH
E SE
RVIC
E RE
PORT
201
3–14 Staffing Profile of the NTPS
68
Figure 27: Part-time Employees by Age and Gender: June 2014
Figure 28: Proportion of Part-time Employees in Age Groups by Gender: June 2014
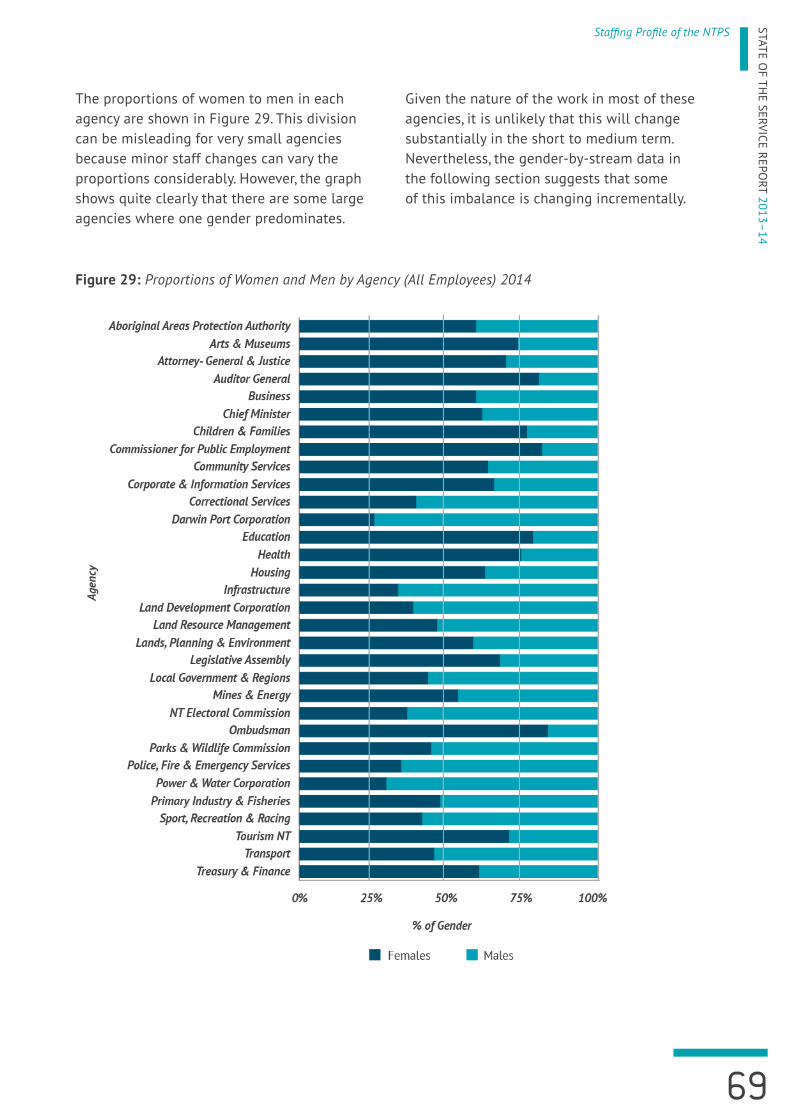
69
STATE OF TH
E SERVICE REPORT 2013–
14Staffing Profile of the NTPS
Figure 29: Proportions of Women and Men by Agency (All Employees) 2014
The proportions of women to men in each agency are shown in Figure 29. This division can be misleading for very small agencies because minor staff changes can vary the proportions considerably. However, the graph shows quite clearly that there are some large agencies where one gender predominates.
Given the nature of the work in most of these agencies, it is unlikely that this will change substantially in the short to medium term. Nevertheless, the gender-by-stream data in the following section suggests that some of this imbalance is changing incrementally.

STAT
E O
F TH
E SE
RVIC
E RE
PORT
201
3–14 Staffing Profile of the NTPS
70
Figure 30 illustrates the change in the proportion of women by vocational stream from June 1994 to June 2014. The seven major streams are derived from the historical industrial relations framework and are retained for the purpose of making consistent time series comparisons. In the NTPS these streams consist, in alphabetical order, of Administration (clerical and managerial staff), Health (doctors, nurses and Aboriginal health workers), Physical (work predominantly of a physical nature), Professional (requiring a specific professional qualification), Teaching (all educators), Technical (requiring a specific technical qualification) and Uniformed (police, prison officers and fire fighters). Since 1994 the proportion of women has gone up in every stream except health. The greatest rise has been in the professional stream (up 20.1%) followed by educators (up 10.8%) and the uniformed stream (10.7%).
Some of this change can be viewed positively from an EEO perspective. For example, the very high over-representation of women in the health professions (doctors, nurses and Aboriginal health workers) has shown some
decline (with the proportion of males increasing by 4.5 percentage points) and, conversely, the proportion of females has increased markedly in the uniformed (with the increase confined to prison officers and police, not fire officers), technical and professional streams, with women professionals rising by a remarkable 20.1 percentage points. In the education sector, the proportion of female teachers further increased by 10.8 percentage points. Three out of four educators in NT public education are women and, given the trend over the last 20 years, there appears to be little chance of this reducing in the short to medium term.
Looking closely at Figure 30 reveals a marked rise in the proportion of female physicals over the past two years. This has been due principally to the transfer of some male PWC former trade employees into new classifications with technical specialist labels, consequently moving from the physical into the technical stream. These two streams are becoming rather blurred in contemporary times because of the much higher rates of pay the labour market now awards to some trade based occupations.
Figure 30: Percentage of Women by Employment Stream June 1994 to June 2014 with Overall Percentage Change Since 1994

71
STATE OF TH
E SERVICE REPORT 2013–
14Staffing Profile of the NTPS
Figure 31: Proportion of Ongoing Staff by Gender NTPS 1994-2014
Status by Gender
Figure 31 graphs the proportion of ongoing staff by gender from 1994 to 2014. This reveals that the drop in the proportion of ongoing staff over the 10 years to 2012 was not split evenly between men and women. While the earlier initial drop was at a similar rate, the proportion for females levelled out from 1996 while that for men continued to decrease until they converged in 2001. They remained at a similar level for five years, with the overall drop in the proportion of ongoing staff from 2003 being similar for both genders. From 2006 there was a slightly greater drop for women than for men with women close to three percentage points lower than for men in 2008. For the next two years the two rates again converged, with the
difference then standing at 1.7%. The following year there was a slight increase for both women and men, but then they both further declined.
Last financial year, following the change of government, there was a sharp increase in the proportion of ongoing employees for both genders, largely as a result of the policy discouraging the renewal of fixed term contracts unless necessary and a policy of making front line employees ongoing where appropriate. This year, with the relaxation of that policy, the overall proportion of ongoing staff has again decreased, with the extent of the decrease slightly larger for women than for men.
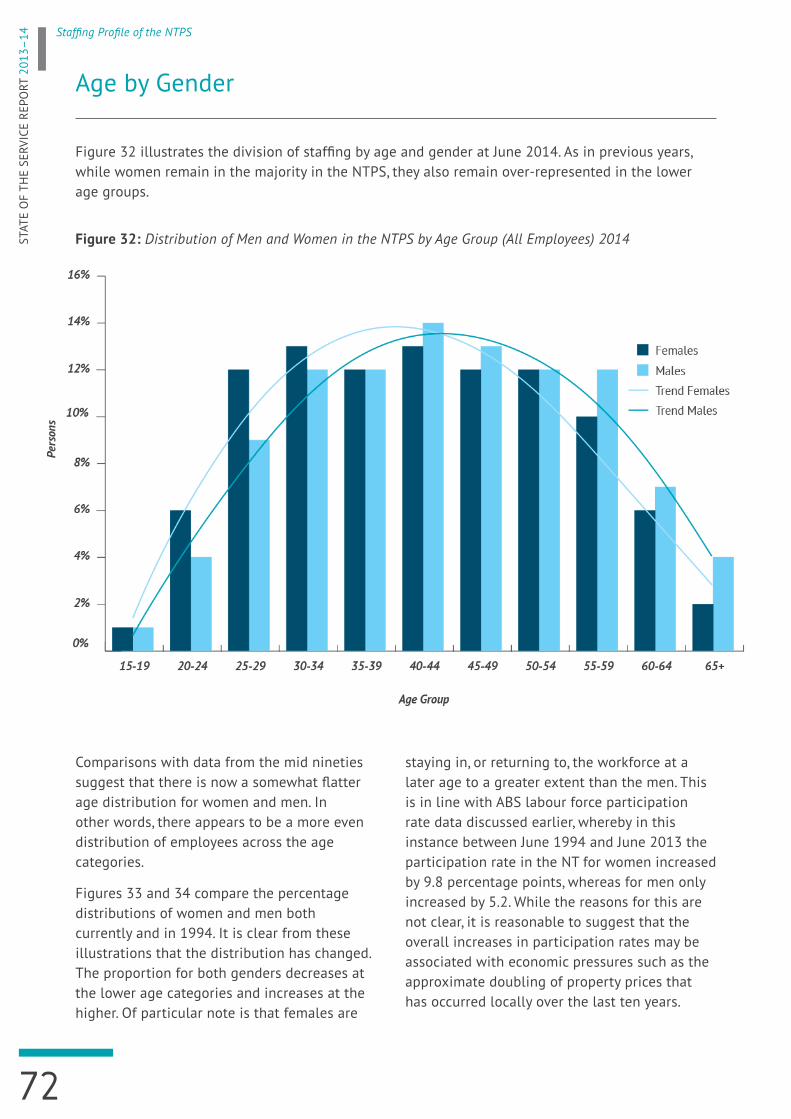
STAT
E O
F TH
E SE
RVIC
E RE
PORT
201
3–14 Staffing Profile of the NTPS
72
Age by Gender
Figure 32 illustrates the division of staffing by age and gender at June 2014. As in previous years, while women remain in the majority in the NTPS, they also remain over-represented in the lower age groups.
Figure 32: Distribution of Men and Women in the NTPS by Age Group (All Employees) 2014
Comparisons with data from the mid nineties suggest that there is now a somewhat flatter age distribution for women and men. In other words, there appears to be a more even distribution of employees across the age categories.
Figures 33 and 34 compare the percentage distributions of women and men both currently and in 1994. It is clear from these illustrations that the distribution has changed. The proportion for both genders decreases at the lower age categories and increases at the higher. Of particular note is that females are
staying in, or returning to, the workforce at a later age to a greater extent than the men. This is in line with ABS labour force participation rate data discussed earlier, whereby in this instance between June 1994 and June 2013 the participation rate in the NT for women increased by 9.8 percentage points, whereas for men only increased by 5.2. While the reasons for this are not clear, it is reasonable to suggest that the overall increases in participation rates may be associated with economic pressures such as the approximate doubling of property prices that has occurred locally over the last ten years.

73
STATE OF TH
E SERVICE REPORT 2013–
14Staffing Profile of the NTPS
Figure 33: Distribution of Women in the NTPS by Age Group June 1994 and June 2014
Figure 34: Distribution of Men in the NTPS by Age Group June 1994 and June 2014

STAT
E O
F TH
E SE
RVIC
E RE
PORT
201
3–14 Staffing Profile of the NTPS
74
The average age of NTPS personnel from June 1994 to June 2014 is shown in Figure 35. Currently at 43.1 years, the overall average has risen by 3.7 years during this time. Most of this increase occurred up to around 2003, with the level of increase subsequently being minimal despite the relaxation and then repeal of compulsory retirement during 2002-03. 2009 was the first year in which there had been an actual drop in average age since the series began, and the overall average has remained at that same level for the past three years. When the series initially dropped from 2008 to 2009 we observed that this was probably related to the rapid expansion of the sector over the year, with younger people being more likely to be transient. Nevertheless it was thought likely that this was a ‘blip’ in the series and that the long term upward movement in average age would continue. However, the overall level subsequently remained fairly static until last
year when there was again a slight rise. As there has been a further rise this year it would appear that overall long term upward trend has resumed.
The most recently released data from the Australian Bureau of Statistics indicates that in the two decades prior to 2012 the median age of the Australian population grew by 5.0 years. The median age of Northern Territorians, currently 31.6 years (June 2012), is nearly six years lower than the national average of 37.4 years. Nevertheless, the Territory figure increased by a similar amount to the Australian average over the same period (+4.7 years for the NT vs. +5.0 years for Australia). It is therefore reasonable to suggest that the cause of the slowly ageing NTPS can be at least partially attributed to the changing demographics of the broader population.
Figure 35: Average Age by Gender NTPS Staff 1994-2014

75
STATE OF TH
E SERVICE REPORT 2013–
14Staffing Profile of the NTPS
Length of Service by Gender (Ongoing Employees)
Figure 36 compares the length of service profiles of men and women for ongoing employees only. Given that women are more likely to take career breaks for child rearing, it might be expected that the length of service profile for women would be more heavily skewed towards the lower end of the chart than that for men. Somewhat surprisingly, while this effect is present, it is not particularly marked. The median length of service for women in ongoing employment is 6.9 years (up from 6.3 last year) and for men 6.8 years (up from 6.5 last year).
Figure 36: Length of Service by Gender NTPS Staff – 2014 – Ongoing Employees
The overall median length of service for all employees is currently 4.6 years, up from 4.4 last year and 3.9 years in 2012. This current overall average is comprised of 4.4 years for women and 4.9 years for men.

STAT
E O
F TH
E SE
RVIC
E RE
PORT
201
3–14 Staffing Profile of the NTPS
76
Stream by Gender
While the gender balance within streams has varied, there has been less significant change in the balance between streams over time. The largest employment category in the NTPS remains the administrative stream, which accounts for 38.0% of the sector. Women remain overwhelmingly concentrated in administration, teaching and health. Figure 37 shows that the greatest changes since 1994 have been increases in the proportions of health, administrative and uniformed staff, and a drop in the proportions of physical, teaching and technical staff. Noted in last year’s report was the drop in the proportion of the administrative stream from 39.3% of the sector in 2012 to 37.8% in 2013. This was attributed to be a reflection of the emphasis the then new government had placed on concentrating resources on front line staff. The slight increase of 0.2 percentage points to 38.0 this year indicates that the drop in the proportion of administrative staff last year has largely been maintained.
Figure 37: Distribution of Men and Women in the NTPS by Employment Category June 2014 (Change in Total Stream Proportion Since 1994)

Salary by Gender
Over the last decade and a half there has been a substantial increase in the participation rate of women in the traditionally male-dominated professional, technical and uniformed streams. There has also been a concurrent marked increase in the numbers of women in middle and senior management. In June 1994 the proportion of women in executive officer classifications was 15%, whereas the current figure is 44%. More striking is that over the same period the proportion of women in the AO6 to SAO1 (formerly AO8) middle management group has increased from 37% to 67%.
Although there remain a large number of women at the lower salary levels, there is a positive trend with an increase of women at management levels. Figure 38 illustrates the significant difference in the profiles of male and female earnings in 2014. Executive contract officers are not included in this graph, and are reported on separately in a later section (pages 79 and 80). The most notable feature of this graph is at the lower end of the spectrum where the large predominance of women in the $40 000 to $50 000 bracket consists of 45% administrative staff, with the next most common category being physicals at 27%. The similar predominance of women in the $50 000 to $60 000 bracket consists of 65% administrative staff followed by 12% level one and two nurses.
Figure 38: Distribution of Men and Women in the NTPS by Salary Level - June 2014
77
STATE OF TH
E SERVICE REPORT 2013–
14Staffing Profile of the NTPS

Figure 39 shows the distribution of salary by gender over the then current salary ranges in 1995 (the first year that salary data was back loaded into PIPS). A clear change in salary profiles can be seen when compared to the 2014 data, with the extreme female salary trend line at the lower levels in 1995 having dropped away by 2014, and the upper salary profile drawing significantly closer to that for males.
Figure 39: Distribution of Men and Women in the NTPS by Salary Level - June 1995
* Note that officers on executive contracts are not included in these graphs
STAT
E O
F TH
E SE
RVIC
E RE
PORT
201
3–14
78
Staffing Profile of the NTPS

79
STATE OF TH
E SERVICE REPORT 2013–
14Staffing Profile of the NTPS
Staffing by Stream
Age by Stream
A plot of average age against stream, together with the change in age for each stream between 1993 and 2014, is shown in Figure 40. This illustrates that the health, professional and uniformed streams are, on average, the youngest in the NTPS. Technical, physical, and teaching staff are the oldest. While the average age of the NTPS has risen by 3.7 years since 1994, the average age increases of the individual streams differ markedly. The lowest change is that of professional staff with an increase of 2.9 years. At the other end of the spectrum is the average age for the physical stream, which has risen by 6.6 years. With respect to the latter, it is noteworthy that as at June 2014, 10.9% of physicals are over 60 years of age.
Figure 40: Average Age by Classification Stream June 2014 All Employees with Change in Median Age Since 1994
Executive Contracts
Figure 41 shows the change in executive contracts numbers from June 2013 to June 2014 by classification and gender. Last year the total number on contract decreased by 68 (-9%) and in the subsequent 12 months to June 2014 there has been a further drop of 37 (-6%). The net decrease over the two years by gender is women, - 52 and men -53.
The significant decrease over the past two years is in sharp contrast to the rapid growth in executive contracts that had been evident in previous years. This is in line with earlier observations reflecting the changed government’s policy of fiscal reform and initially placing strong scrutiny on the renewal of all fixed term contracts, which, it would appear, has continued to be applied to executive contracts.

STAT
E O
F TH
E SE
RVIC
E RE
PORT
201
3–14 Staffing Profile of the NTPS
80
Women on contract continue to be unevenly distributed over the different streams. The administrative stream (38%) is in line with the average (40%) but the high proportion of women in education (60%) is in contrast to the low levels among medical specialists (14%), police (21%) and PWC managers (25%).
Figure 41: Change in Executive Contract Numbers by Classification and Gender 2013-2014
Women Men Total
2013 2014 Diffce 2013 2014 Diffce 2013 2014 Diffce
Administration
Executive Officer 1 105 97 -8 169 148 -21 274 245 -29
Executive Officer 2 56 55 -1 72 78 6 128 133 5
Executive Officer 3 12 11 -1 29 30 1 41 41 0
Executive Officer 4 9 7 -2 9 7 -2 18 14 -4
Executive Officer 5 4 6 2 9 10 1 13 16 3
Executive Officer 6 1 1 0 16 10 -6 17 11 -6
Sub-total 187 177 -10 304 283 -21 491 460 -31
Education
Executive Principal 1 2 0 -2 1 0 -1 3 0 -3
Executive Principal 2 3 0 -3 1 0 -1 4 0 -4
Executive Principal 3 0 0 0 1 0 -1 1 0 -1
Contract Principal 2 34 36 2 20 19 -1 54 55 1
Contract Principal 3 10 10 0 8 9 1 18 19 1
Contract Principal 4 2 5 3 6 6 0 8 11 3
Contract Principal 5 3 2 -1 0 1 1 3 3 0
Sub-total 54 53 -1 37 35 -2 91 88 -3
Medical Specialists
Medical Contract 1 1 0 9 6 -3 10 7 -3
Police
Commissioner 0 0 0 1 1 0 1 1 0
Police Contract Officer 3 3 0 9 10 1 12 13 1
Sub-total 3 3 0 10 11 1 13 14 1
Power & Water
Executive Manager 1 5 2 -3 15 8 -7 20 10 -10
Executive Manager 2 2 2 0 6 12 6 8 14 6
Executive Manager 3 2 3 1 4 6 2 6 9 3
Executive Manager 4 5 5 0 10 10 0 15 15 0
Sub-total 14 12 -2 35 36 1 49 48 -1
TOTAL 259 246 -13 395 371 -24 654 617 -37

81
STATE OF TH
E SERVICE REPORT 2013–
14Staffing Profile of the NTPS
Staff Separation and Recruitment
Staff separation and recruitment data since 2008-09 is set out in Figures 42 and 43. For the purpose of this section, recruitment is defined as when someone begins employment in the NTPS, and payment of salary commences. Separation is defined as when someone formally leaves the NTPS, for whatever reason, and salary payments cease.
The following background information will assist in interpreting the turnover statistics. A few years before PIPS was introduced, a decision was made to revise the reporting of turnover data by producing two sets of tables. One contained both ongoing and fixed period employees (as had been the custom) and the other included ongoing employees only.
The practice of using both sets of data has continued, as both have their uses in tracking turnover profiles. The data representing ongoing employees only is contained in Figure 42 and the data representing both ongoing and fixed period employees is in Figure 43.
Nevertheless, and as noted in previous years’ reports, there is an additional complication with the interpretation of the PIPS turnover data. While the separations count is reasonably straightforward, the commencements data is a little more complex. A count of all commencements is simple enough, but becomes confusing when we attempt to separate ongoing from fixed period appointments.
Figure 42: NTPS Separation and Recruitment Rates by Employment Category: 2008-09 to 2013-14 Ongoing Staff *
2008-2009 2009-2010 2010-2011 2011-2012 2012-2013 2013-2014
Administrative 7 4 8 3 7 4 8 4 8 3 8 3
Professional 11 8 9 7 11 7 10 7 11 6 12 7
Technical 9 7 9 8 10 5 10 6 11 7 9 6
Physical 9 9 9 5 10 7 11 7 9 9 12 7
Teaching 8 0 8 0 8 0 6 0 8 2 11 0
Health Workers 11 9 11 9 11 7 11 7 10 5 9 5
Uniformed 7 11 5 7 7 5 7 8 6 10 7 3
Total 8 5 8 5 9 4 8 5 9 5 9 4
* For clarification regarding low recruitment rates see text
sepa
ratio
n ra
te %
recr
uitm
ent r
ate
%
sepa
ratio
n ra
te %
recr
uitm
ent r
ate
%
sepa
ratio
n ra
te %
recr
uitm
ent r
ate
%
sepa
ratio
n ra
te %
recr
uitm
ent r
ate
%
sepa
ratio
n ra
te %
recr
uitm
ent r
ate
%
sepa
ratio
n ra
te %
recr
uitm
ent r
ate
%

STAT
E O
F TH
E SE
RVIC
E RE
PORT
201
3–14 Staffing Profile of the NTPS
82
Closer analysis of the data shows it is quite common for individuals to be hired as fixed period employees and then, after a varying period, to win ongoing positions. Their status is simply transferred across to ‘ongoing’ on the main database, but this is quite reasonably not reflected in the commencement report. The commencements data thus shows them as being recruited to fixed period, rather than ongoing, positions. The net result is that the figures for recruitment of ongoing staff fall far below those for separation of ongoing staff without this actually being the case.
In singling out those actually recruited as ongoing, the annual report for 2001-02 noted as significant that these had, for every stream, ‘decreased significantly over the six-year period outlined’, dropping steadily from 7% in 1996-97 to 4% in 2001-02. In 2002-03 the figure jumped back to 6%, in 2003-04 to 7%, in 2004-05 back
to 6% and, for the subsequent five years was 5%. While during 2010-11 it dropped to 4%, for the subsequent two years it went back to 5%. This year it has again dropped back to 4%.
Historically the most notable component of the overall decrease has been in the education stream where the recruitment to ongoing positions was for many years virtually non-existent. However last year the rate rose to two% (58 out of 726 recruitments), which was attributed to the government policy of discouraging the over use of fixed period contract positions. Nevertheless this year it has again dropped to 0% (2 out of 674 recruitments). Conversely, in the uniformed stream 56% of the 127 recruitments were to an ongoing position, and almost all of the fixed period recruitments were to new recruits on fixed period contracts while undertaking training.
Figure 43: NTPS Separation and Recruitment Rates by Employment Category: 2008-09 to 2013-14 (Ongoing and Fixed period)
2008-2009 2009-2010 2010-2011 2011-2012 2012-2013 2013-2014
Administrative 25 26 25 31 23 29 24 30 26 21 26 26
Professional 25 30 24 32 25 30 24 32 26 25 26 22
Technical 17 24 17 22 20 15 17 17 18 18 18 15
Physical 25 37 26 33 26 30 24 35 29 34 29 43
Teaching 24 28 25 29 24 30 21 27 24 24 24 23
Health Workers 38 48 35 45 32 37 34 43 34 39 34 37
Uniformed 8 11 6 9 7 8 8 10 7 14 7 6
Total 24 29 24 30 23 27 23 29 24 24 24 25
sepa
ratio
n ra
te %
recr
uitm
ent r
ate
%
sepa
ratio
n ra
te %
recr
uitm
ent r
ate
%
sepa
ratio
n ra
te %
recr
uitm
ent r
ate
%
sepa
ratio
n ra
te %
recr
uitm
ent r
ate
%
sepa
ratio
n ra
te %
recr
uitm
ent r
ate
%
sepa
ratio
n ra
te %
recr
uitm
ent r
ate
%

83
STATE OF TH
E SERVICE REPORT 2013–
14Staffing Profile of the NTPS
As shown in Figure 43, the separation rate is 24%, the same as last year. That figure was a percentage point higher than that for the previous two years, but the same as that for the two years prior to that. In fact the last six years are the lowest since 1994-95 when it was again 24%. The reason it has been lower for the last six years appears to be related to the high demand for staff associated with the follow up to the Australian Government Intervention starting in 2007-08. The slight rise for the last two years may be associated with a tightening of NTPS staffing protocols which have resulted in a flattening of staffing numbers which had formerly been trending steeply upward.
Three years ago it was noted that the separation rate for health workers, at 32%, was the lowest since 1994-95 when it was 42%. The following year it rose marginally to 34%, and has remained at that level subsequently. This is still quite low in historical terms. From the earlier low point in the mid-nineties it trended upward until it peaked at 59% in 2000-01, and has subsequently decreased to the current level. This variation needs to be viewed in the context of the various recruitment drives and consequent rapid expansion of numbers in the health area in recent times, particularly in response to the ‘Little Children are Sacred’ report.
Figure 44: Separation Statistics for 2013-14 (Ongoing and Fixed period Staff )*
Admin Teaching Health Profesnl. Technical Uniformed Physical Total
Cessation - Temporary 744 387 424 87 55 3 172 1872
Deceased 10 3 4 1 1 1 2 22
Dismissal 21 6 2 1 3 3 16 52
Resignation 1055 381 618 281 114 131 248 2828
Retire Invalid 7 1 2 1 0 5 2 18
Retire Min Age 1 3 0 0 2 3 2 11
Retire Other 12 8 5 3 5 11 2 46
Retrenchment 73 2 0 3 14 0 7 99
Other 32 3 1 0 1 0 1 38
Total 1955 794 1056 377 195 157 452 4986
* Does not include casual staff or those on long-term workers’ compensation

STAT
E O
F TH
E SE
RVIC
E RE
PORT
201
3–14 Staffing Profile of the NTPS
84
The breakdown of separations by type is listed by stream in Figure 44. The proportion of resignations to total separations, which was up three percentage points to 60% three years ago, dropped back to 59% the next year, to 55% last year and was back up to 57% this year. This compares favourably with the high resignation rate of 69% in 1994–95.
It might be expected that having permanency in the public sector would lead to a reasonable period of stable employment. But, of the 1,884 ongoing employees who elected to leave in 2013-14, 43% had two years or less service and 65% had five years or less service. For the three years to 2009 these percentages had been fairly steady at around 42% for the two-year cut-off and 63% for the five year cut-off. In 2009 10 the numbers were up to nearly 50% and 69% respectively, but for 2010 11 and 2011 12 moderated to 44/45 and 66. Last year the dropped to 43% but the five year jumped back up to 68% which was thought a little odd as those movements were in opposite directions. This year the two year cut-off remained at 43% and the five year dropped back to 65%.
The following paragraph discusses turnover in relation to the commonly referenced groups of baby boomers and generations X and Y. While there is no clear agreement on the precise datelines dividing these groups, for the purpose of this discussion baby boomers are defined as having been born post World War II up until 1960, Generation X born during the 1960s and 1970s, and generation Y from 1980 on. It has been hypothesised that a substantial number of those who resign early may be generations X and Y. The descendants of the baby boomers are reputed to, on average, value permanency less than those born earlier. In fact, the median age of those leaving during 2013-14 with two years’ or less service was 34 whereas the median age of those leaving during 2013-14 with greater than two years’ service was 44. While there has been some variation in these averages from year to year, they have been consistently different for at least the past 13 years, and so further support the hypothesis of a disparity between generations.
The ageing workforce and higher endemic turnover of post baby boomers will continue to apply pressure on staff retention and recruitment in the NTPS.
Personal Leave (Sick and Carer’s Leave)
Figure 45 shows the distribution of the number of days personal leave with pay taken by individual employees during 2013-14. The graph shows that employees taking just one personal leave day during the year were the most frequent occurrence. The median number of personal leave days taken this year was 6.3. This means half the sector took more days and
half took fewer days, which is the statistically appropriate average measure for a distribution of this shape.

85
STATE OF TH
E SERVICE REPORT 2013–
14Staffing Profile of the NTPS
Figure 45: Days Personal Leave Taken by Individuals in the NTPS in 2013-14 (All Employees)
The median amount of personal/sick leave taken for each employee since 1994-95 is shown in Figure 46. The data suggests that there has been some variation from year to year, but overall there has been a significant increase in the average days taken over that time. The figure for this year, at 6.3 days, is higher than the 6.0 days recorded last year and than the 5.5 days recorded for the preceding two years, which in turn was higher than the 5.0 recorded for the two years prior to that.
These changes need to be viewed in the context of the provision of carer’s leave. This was first provided for in the NT as part of the 1994 Enterprise Bargaining Agreement (EBA), which allowed up to five days to be taken when
caring for sick family members. This maximum was extended to 10 days in the 1997 EBA. While carer’s leave was, in theory, immediately available to the whole sector, there was some evidence that knowledge and use of this leave may have been slower to be adopted in some sectors than in others.
The introduction of national personal leave as part of the federal Fair Work Act 2009 may also have had an influence on the utilisation of leave for caring for household members, as the Act has put increasing focus on and public awareness of the rights of the carer in the contemporary workplace. A combination of the above could explain at least some of the increase over the past few years.

STAT
E O
F TH
E SE
RVIC
E RE
PORT
201
3–14 Staffing Profile of the NTPS
86
Figure 46: NTPS Median Personal Leave Days Taken per Employee 1995 2014 (data not reliable pre 1995)
The measure of average sick leave more commonly used in the industrial relations arena is the mean, rather than the median, number of days taken (total days taken divided by the number of FTE staff). This, at 11.1 is up on the 10.8 days last year which in turn was up substantially on the 10.0 recorded for the two preceding years, the 9.7 days the year prior, 9.5 days the year before and 9.4 the year before that. For the three years preceding this (mid 2004 to mid 2007), the mean had been steady on 9.1 days. It was suggested last year that the then higher average could have been related to uncertainty among some employees associated with the reform agenda introduced by the new government, but the continuing high rate still cannot be taken as proof of this.
There is no doubt that high levels of personal leave can impact significantly on overall workforce costs, particularly in work environments where it is imperative that absent employees must be replaced. Levels can also be monitored as an indication of workforce satisfaction. It is therefore of interest to look
at the rates of personal leave use by employment category. In line with mainstream industrial analysis, this section will use the mean as the average. Figure 47 shows the mean number of days taken by stream and by gender for 2013-14.
Figure 47: NTPS Average (Mean) Sick Days Taken per Employee by Stream by Gender 2013-14
Stream Females Males Total
Admin Staff 12.7 9.7 11.8
Health Workers 9.6 6.8 9.0
Physical Staff 10.6 10.2 10.4
Prof Staff 10.3 7.4 9.1
Teaching Staff 11.8 9.9 11.4
Technical Staff 11.6 9.8 10.2
Uniformed Staff 17.8 12.2 13.5
Total 11.8 9.9 11.1

The data shows that there is a considerable disparity between the streams. While one or two days difference may not seem significant, when considering a workforce of more than 21 000 people, single day differences in averages can translate into many millions of dollars annually. While the average (mean) number of days taken overall is 11.1, the lowest average is by workers in the health stream at 9.0 days (up slightly from 8.9 last year), and the highest by the uniformed stream at 13.5 days (up from 13.2 last year). A further breakdown of the uniformed staff figures reveals that the fire fighter sub-group is at the top of the average with a figure of 14.8 days (up from 13.1 in 2013), followed by police with 13.8 days (down from 13.7 in 2013) and prison officers with 11.0 days (down from 11.4 in 2013). Also of note is that a rise in the average compared to last year was common to all streams except technical & physical, which both experienced a decrease.
Appendices
87
STATE OF TH
E SERVICE REPORT 2013–
14Appendices

Human Resource Management Principle
The human resource management principle prescribed in section 5C of PSEMA is that human resource management in the NTPS must be directed towards promoting the following:
(1) (a) employment based on merit;
(b) equality of employment opportunity;
(c) working environments in which employees:
(i) are treated fairly, reasonably, and in a non-discriminatory way; and
(ii) are remunerated at rates appropriate to their responsibilities; and
(iii) have reasonable access to training and development; and
(iv) have reasonable access to redress when adversely affected by improper or unreasonable decisions.
(2) The human resource management principle incorporates the merit principle and the equality of employment opportunity principle.
Performance and Conduct Principle
The performance and conduct principle prescribed in section 5F of PSEMA is that a public sector officer must do the following:
(a) carry out the officer’s duties as follows:
(i) objectively, impartially, professionally and with integrity;
(ii) to the best of the officer’s ability;
(iii) in accordance with the Act and any code of conduct applicable to the officer under section 16(2)(c);
(b) treat other public sector officers, other persons in the workplace and members of the public fairly, equitably and with proper courtesy and consideration;
(c) ensure effective, efficient and appropriate use of public resources;
(d) avoid actual or apparent conflicts of interest between personal or other interests and duties as a public sector officer;
(e) ensure the officer’s personal conduct does not:
(i) adversely affect the performance of the officer’s duties as a public sector officer; or
(ii) bring the Public Sector into disrepute.
Public Sector Officer means the Commissioner, a Chief Executive Officer or an employee.
The human resource management principle and performance and conduct principle are complemented by the administration management principle. These three principles (collectively, the Public Sector Principles) underpin PSEMA as the basis for administrative action, administration of the public sector, and conduct expected of public sector employees. They are the essential components of the human relations framework that governs employment in the NTPS.
The Public Sector Principles are designed to support agencies by providing a framework within which each agency can develop the culture and values that best support its operations and achievement of service objectives.
Public Sector Principles
STAT
E O
F TH
E SE
RVIC
E RE
PORT
201
3–14
88
Appendices

Employment Instructions
Employment Instruction Summary of Employment Instruction and Associated PSEMA Requirements
1. Filling Vacancies Develop procedures for the employment, promotion and transfer of employees that are consistent with PSEMA, Regulations, By-laws, EIs, Determinations and relevant award or enterprise agreement.
Ensure selection is made in accordance with the merit and equality of employment opportunity principles.
2. Probation Develop procedures for a probationary process that are consistent with PSEMA, Regulations, By-laws, EIs, Determinations and relevant award or enterprise agreement.
Ensure probationary employees are aware of the details of that process as soon as practicable after commencing duty.
3. Natural Justice Sets out the rules of natural justice that must be observed in all dealings with employees under PSEMA where an employee may be adversely affected by an impending decision, other than those referred to in section 50 of PSEMA – Summary Dismissal.
4. Employee Performance Management and Development Systems
Develop and implement an employee performance management and development procedure consistent with PSEMA, Regulations, By-laws, EIs, Determinations and relevant award or enterprise agreement.
Ensure employees are aware of, understand the purpose and application of, and participate in the agency’s employee performance management and development system.
Ensure supervisors responsible for conducting employee performance reviews have adequate training within six months of commencing a position where they will be required to perform this function.
5. Medical Examinations Ensure the prescribed requirements regarding medical examinations of employees as set out in this EI - such as engaging a health practitioner, notifying the employee in writing of the direction to attend and purpose, and information to be provided to the health practitioner - are followed.
6. Employee Performance and Inability
Ensure the prescribed requirements for undertaking an employee performance and inability process, medical examinations, suspension and transfers are followed.
7. Discipline Ensure the prescribed requirements for undertaking a discipline process, medical examinations, suspension and transfers are followed.
8. Internal Agency Complaints and Section 59 Grievance Reviews
Develop an internal agency employee grievance-handling policy and procedure consistent with PSEMA, Regulations, By-laws, EIs, Determinations and relevant award or enterprise agreement.
89
STATE OF TH
E SERVICE REPORT 2013–
14Appendices

Employment Instruction Summary of Employment Instruction and Associated PSEMA Requirements
9. Employment Records Ensure recording of required details for every employee.
Ensure a person’s employment record contains the prescribed information.
Comply with the requirements of the Information Act (NT) regarding the correction, collection and handling of personal information contained in an employee’s employment record.
10. Equality of Employment Opportunity Programs
Develop an Equality of Employment Opportunity Program consistent with PSEMA, Regulations, By-laws, EIs, Determinations, Anti Discrimination Act and relevant award or enterprise agreement.
Ensure programs are integrated with corporate, strategic and other agency planning processes and be directed towards:
• ensuring all persons have equal opportunity to compete for employment, promotion and transfer, and to pursue careers within the public sector
• eliminating unlawful discrimination from human resource management in the public sector.
11. Occupational Health and Safety Standards Programs
Develop an occupational health and safety program which includes a management plan that encourages employees and their representatives to participate in the decision making process in relation to occupational health and safety, and other requirements as set out in the EI.
Ensure the application of appropriate occupational health and safety standards and programs in the agency.
12. Code of Conduct The Code of Conduct applies to all public sector officers (employees, CEOs and the CPE).
CEOs may issue agency-specific codes of conduct consistent with PSEMA, Regulations, By-laws and EIs.
CEOs may issue guidelines regarding acceptance of gifts and benefits by employees.
13. Appropriate Workplace Behaviour
Develop and implement a policy and procedure to foster appropriate workplace behaviour and a culture of respect, and to deal effectively with inappropriate workplace behaviour and bullying as defined by this EI.
STAT
E O
F TH
E SE
RVIC
E RE
PORT
201
3–14
90
Appendices

91
STATE OF TH
E SERVICE REPORT 2013–
14Appendices
Feedback Form
We welcome your feedback on the State of the Service Report 2013-14. Your comments and suggestions will be used in the development of future reports.
Please tick the relevant box to indicate how you rate the report.
Overall impression
Excellent Good Satisfactory Poor
Presentation and design
Excellent Good Satisfactory Poor
Easy to read and understand
Excellent Good Satisfactory Poor
Content/information
Excellent Good Satisfactory Poor
Which areas of the report were most useful?
.. . . . . . . . . . . . . . . . . . . . . . . . . . . . . . . . . . . . . . . . . . . . . . . . . . . . . . . . . . . . . . . . . . . . . . .
. . . . . . . . . . . . . . . . . . . . . . . . . . . . . . . . . . . . . . . . . . . . . . . . . . . . . . . . . . . . . . . . . . . . . . . .
. . . . . . . . . . . . . . . . . . . . . . . . . . . . . . . . . . . . . . . . . . . . . . . . . . . . . . . . . . . . . . . . . . . . . . . .
. . . . . . . . . . . . . . . . . . . . . . . . . . . . . . . . . . . . . . . . . . . . . . . . . . . . . . . . . . . . . . . . . . . . . . . .
. . . . . . . . . . . . . . . . . . . . . . . . . . . . . . . . . . . . . . . . . . . . . . . . . . . . . . . . . . . . . . . . . . . . . . . .
. . . . . . . . . . . . . . . . . . . . . . . . . . . . . . . . . . . . . . . . . . . . . . . . . . . . . . . . . . . . . . . . . . . . . . . .
How do you think the report could be improved?
.. . . . . . . . . . . . . . . . . . . . . . . . . . . . . . . . . . . . . . . . . . . . . . . . . . . . . . . . . . . . . . . . . . . . . . .
. . . . . . . . . . . . . . . . . . . . . . . . . . . . . . . . . . . . . . . . . . . . . . . . . . . . . . . . . . . . . . . . . . . . . . . .
. . . . . . . . . . . . . . . . . . . . . . . . . . . . . . . . . . . . . . . . . . . . . . . . . . . . . . . . . . . . . . . . . . . . . . . .
. . . . . . . . . . . . . . . . . . . . . . . . . . . . . . . . . . . . . . . . . . . . . . . . . . . . . . . . . . . . . . . . . . . . . . . .
Does the report contain the information you required?
Yes No
If no, please list suggested information to be included in future reports.
. . . . . . . . . . . . . . . . . . . . . . . . . . . . . . . . . . . . . . . . . . . . . . . . . . . . . . . . . . . . . . . . . . . . . . . .
. . . . . . . . . . . . . . . . . . . . . . . . . . . . . . . . . . . . . . . . . . . . . . . . . . . . . . . . . . . . . . . . . . . . . . . .
. . . . . . . . . . . . . . . . . . . . . . . . . . . . . . . . . . . . . . . . . . . . . . . . . . . . . . . . . . . . . . . . . . . . . . . .
Please indicate where you are from:
NT Government
Education or research institution
Community member or organisation
Australian Government
Industry
Other State or Territory government
Private sector
Please return your completed feedback sheet either by email, post, or fax to:
Email: [email protected]
Post: GPO Box 4371 DARWIN NT 0801
Facsimile: 08 8999 4186

Office of the Commissioner for Public Employment
Ground and 4th Floors, Harbour View Plaza 8 McMinn Street (cnr Bennett and McMinn Streets) Darwin NT 0800
GPO Box 4371 Darwin NT 0801
Telephone: 08 8999 4282
Facsimile: 08 8999 4186
Email: [email protected]
Web: www.nt.gov.au/ocpe
HOW TO CONTACT US
STAT
E O
F TH
E SE
RVIC
E RE
PORT
201
3–14
92
Appendices