2013.6 海外ir資料 2012決算 e...sep. completed a new cathode materials production facility for...
TRANSCRIPT

0
JX Holdings IR Materials
2. Financial Results for FY2012 & Forecast for FY2013
Tokyo 5020Security Code
June, 2013

1Copyright © 2013 JX Holdings, Inc.
Contents
1. Financial Results for FY2012 (Apr.1 2012~Mar. 31 2013)
2. Forecast for FY2013 (Apr.1 2013~Mar. 31 2014)
2 ~12
13 ~20
2Copyright © 2013 JX Holdings, Inc.
Financial Results for FY2012(Apr. 1, 2012~March 31, 2013)
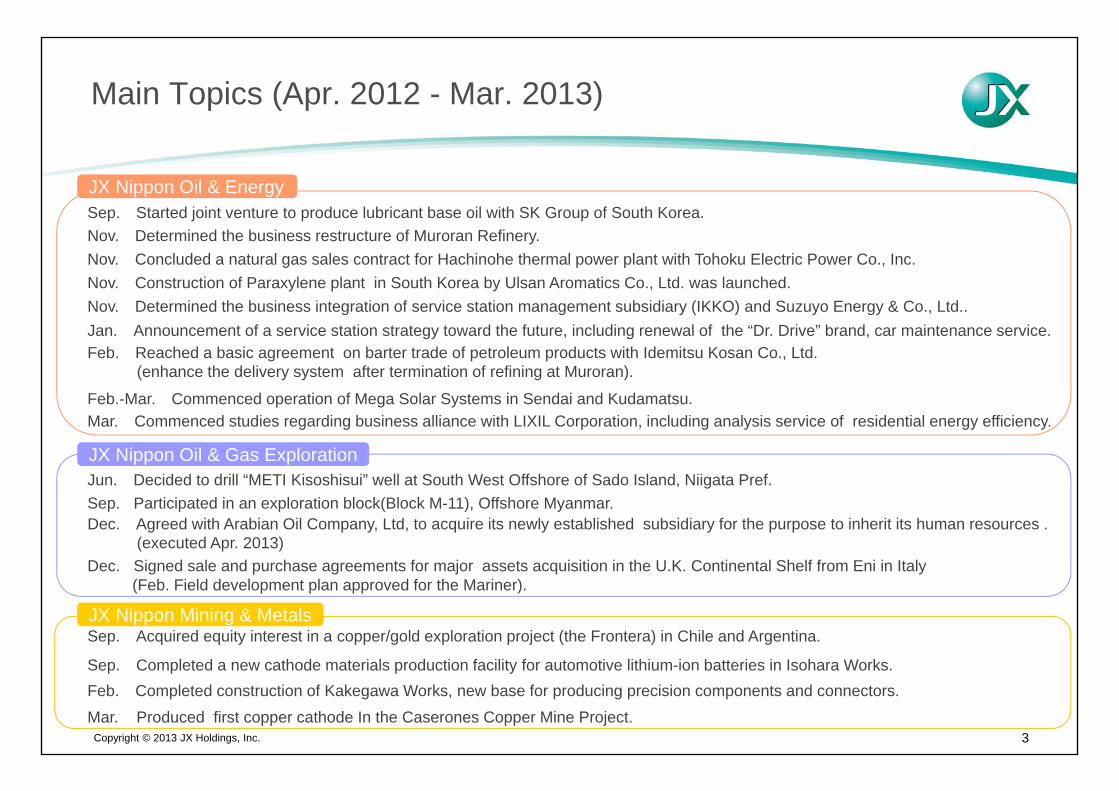
Main Topics (Apr. 2012 - Mar. 2013)
3Copyright © 2013 JX Holdings, Inc.
Nov. Determined the business restructure of Muroran Refinery.
Nov. Determined the business integration of service station management subsidiary (IKKO) and Suzuyo Energy & Co., Ltd..Nov. Construction of Paraxylene plant in South Korea by Ulsan Aromatics Co., Ltd. was launched.
Jan. Announcement of a service station strategy toward the future, including renewal of the “Dr. Drive” brand, car maintenance service.
Sep. Started joint venture to produce lubricant base oil with SK Group of South Korea.
Feb. Reached a basic agreement on barter trade of petroleum products with Idemitsu Kosan Co., Ltd.(enhance the delivery system after termination of refining at Muroran).
Mar. Commenced studies regarding business alliance with LIXIL Corporation, including analysis service of residential energy efficiency.
Dec. Agreed with Arabian Oil Company, Ltd, to acquire its newly established subsidiary for the purpose to inherit its human resources .(executed Apr. 2013)
Dec. Signed sale and purchase agreements for major assets acquisition in the U.K. Continental Shelf from Eni in Italy (Feb. Field development plan approved for the Mariner).
Sep. Participated in an exploration block(Block M-11), Offshore Myanmar.Jun. Decided to drill “METI Kisoshisui” well at South West Offshore of Sado Island, Niigata Pref.
Mar. Produced first copper cathode In the Caserones Copper Mine Project.
Sep. Acquired equity interest in a copper/gold exploration project (the Frontera) in Chile and Argentina.
Sep. Completed a new cathode materials production facility for automotive lithium-ion batteries in Isohara Works.Feb. Completed construction of Kakegawa Works, new base for producing precision components and connectors.
Nov. Concluded a natural gas sales contract for Hachinohe thermal power plant with Tohoku Electric Power Co., Inc.
Feb.-Mar. Commenced operation of Mega Solar Systems in Sendai and Kudamatsu.
JX Nippon Oil & Energy
JX Nippon Oil & Gas Exploration
JX Nippon Mining & Metals

4Copyright © 2013 JX Holdings, Inc.
Business Environment
80
90
100
110
120
130
140
April October
2011
2012
Dubai Crude Oil$/B
200
300
400
500
April October
2011
2012
Copper(LME)¢/lb
74
76
78
80
82
84
86
88
90
92
April October
2011
2012
Exchange RateYen/$

0
100
200
300
400
500
600
700
800
900
1,000
Apr. Oct.
FY2009
FY2010
FY2011
FY2012
5
Margins of Petroleum and Petrochemical Products
*Margin=Spot Price – All Japan Crude Oil CIF (including petroleum tax and interest)
Copyright © 2013 JX Holdings, Inc.
Gasoline, Kerosene, Diesel Fuel and Fuel Oil A Paraxylene
*ACP – Crude Oil Price(Dubai Spot Price)
0
3
6
9
12
15
18
Apr . Oct.
FY2009
FY2010
FY2011
FY2012
Yen/L $/ton
6Copyright © 2013 JX Holdings, Inc.
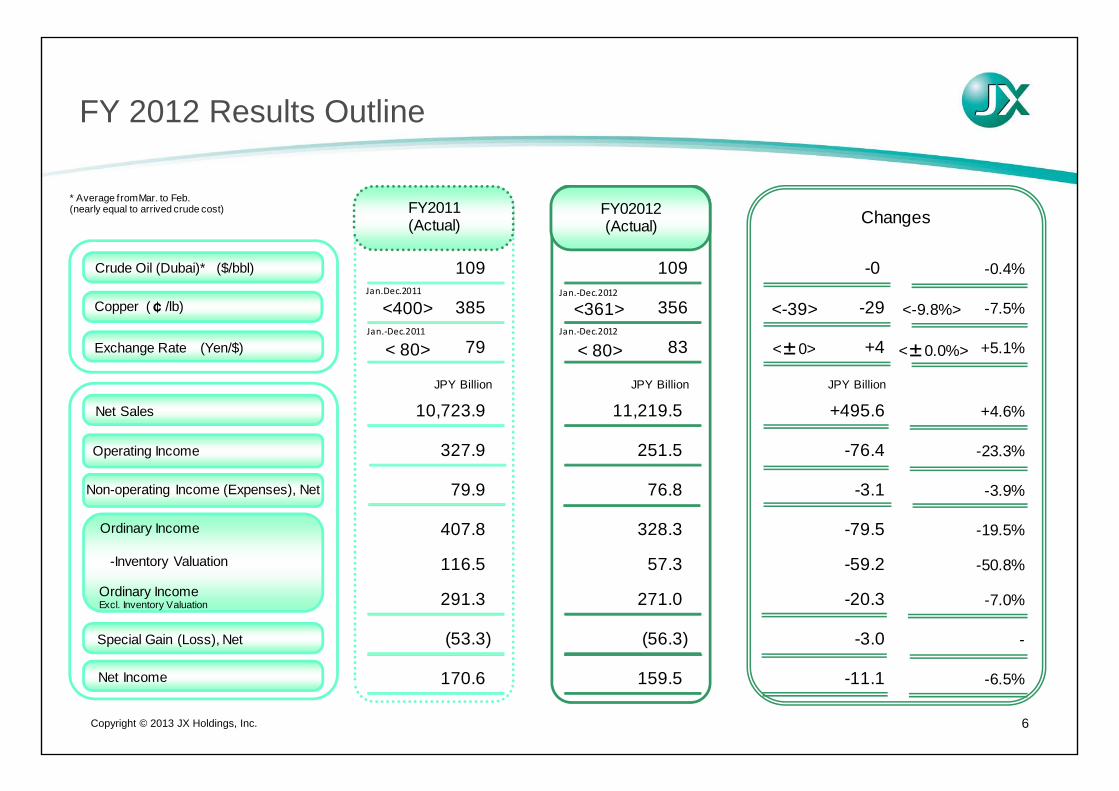
FY 2012 Results Outline
109 109 -0 -0.4%
385 356 -29 -7.5%
79 83 +4 +5.1%
JPY Billion JPY Billion JPY Billion
10,723.9 11,219.5 +495.6 +4.6%
327.9 251.5 -76.4 -23.3%
79.9 76.8 -3.1 -3.9%
407.8 328.3 -79.5 -19.5%
116.5 57.3 -59.2 -50.8%
291.3 271.0 -20.3 -7.0%
(53.3) (56.3) -3.0 -
170.6 159.5 -11.1 -6.5%
Changes
Net Sales
Operating Income
Non-operating Income (Expenses), Net
Ordinary Income
Special Gain (Loss), Net
Net Income
Crude Oil (Dubai)* ($/bbl)
Exchange Rate (Yen/$)
Ordinary IncomeExcl. Inventory Valuation
Copper (¢/lb)
* Average from Mar. to Feb. (nearly equal to arrived crude cost)
<400>Jan.Dec.2011
<361> <-39>
FY2011(Actual)
FY02012(Actual)
< 80> < 80> <±0>
-Inventory Valuation
<-9.8%>
<±0.0%>Jan.‐Dec.2011
Jan.‐Dec.2012
Jan.‐Dec.2012

7
FY2011 Actual vs. FY2012 ActualChanges in Ordinary Income (Loss) by Segment
Copyright © 2013 JX Holdings, Inc.
JPY Billion JPY Billion JPY Billion
Energy 232.5 161.6 -70.9 -30.5%
- Inventory Valuation 119.7 58.8 -60.9 -50.9%
Excl. Inventory Valuation 112.8 102.8 -10.0 -8.9%
- Petroleum Products 74.6 56.1 -18.5 -24.8%
- Petrochemicals 38.2 46.7 +8.5 +22.3%
Oil & Natural Gas E&P 97.5 93.6 -3.9 -4.0%
Metals 60.0 45.0 -15.0 -25.0%
- Inventory Valuation (3.2) (1.5) +1.7 -53.1%
Excl. Inventory Valuation 63.2 46.5 -16.7 -26.4%
Others 17.8 28.1 +10.3 +57.9%
Total 407.8 328.3 -79.5 -19.5%
Excl. Inventory Valuation 291.3 271.0 -20.3 -7.0%
ChangesFY2011(Actual)
137 FY2012(Actual)

8Copyright © 2013 JX Holdings, Inc.
FY2011 Actual vs. FY2012 ActualChanges in Ordinary Income - Energy Business -
9Copyright © 2013 JX Holdings, Inc.
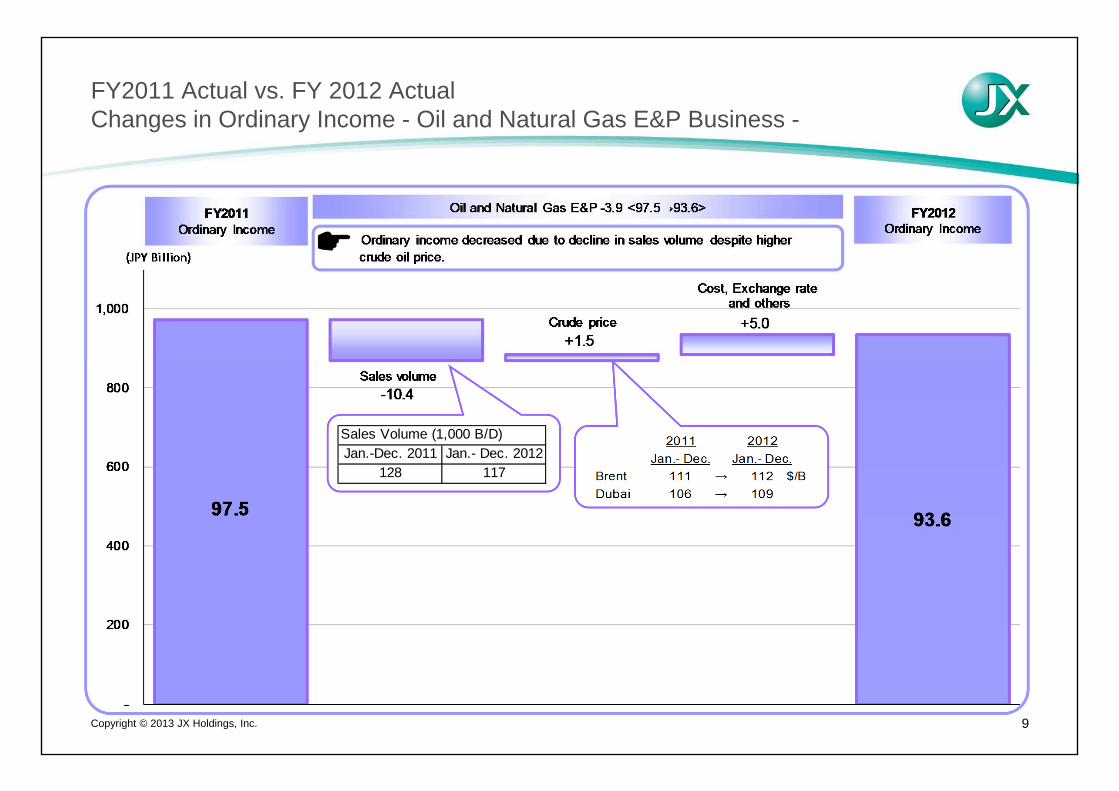
FY2011 Actual vs. FY 2012 ActualChanges in Ordinary Income - Oil and Natural Gas E&P Business -
Sales Volume (1,000 B/D)Jan.-Dec. 2011 Jan.- Dec. 2012
128 117

10Copyright © 2013 JX Holdings, Inc.
FY2011 Actual vs. FY2012 ActualChanges in Ordinary Income - Metals Business-

11Copyright © 2013 JX Holdings, Inc.
Consolidated Balance SheetsConsolidated Statement of Cash Flows
Consolidated Cash Flows
(JPY Billion)
Consolidated Balance Sheets
FY2012
Ordinary income 328.3
Depreciation and amortization 180.4
Increase in working capital (164.5)
Corporate tax and others (78.6)
Cash flows from operating activities 265.6
Cash flows from investing activities (426.1)
Free cash flows (160.5)
Dividends and others (18.0)
Net cash flows (178.5)Shareholders' equity ratio
Net D/E ratio
At the end of Mar. 2013(Actual)
26.1%
At the end of Mar. 2012(Actual)
26.7%
1.17 1.18ROE 10.1% 8.7%
Other assets6,448.4
Other assets7,024.8
242.0
250.1
12年3月末 13年3月末
Shareholders' equity
1,744.2
Shareholders' equity
1,942.7
300.5384.7
Other debt2,363.1
Other debt2,398.2
Interest bearing debt
2,282.6
Interest bearing debt
2,549.3
at the end of Mar. 2012 at the end of Mar. 2013
Total:6,690.4 Total:7,274.9JPY Billion
Minority Interests in consolidaed subsidiaries
Cash and cashequivalents
+258.6 Net Interest bearing debt, excluding cash and cash equivalentsDetails:-Negative net cash flows (178.5 billon yen) -Newly consolidated subsidiariesand others

12Copyright © 2013 JX Holdings, Inc.
FY2012 Last Forecast vs. FY2012 ActualChanges in Ordinary Income (Loss) by Segment
JPY Billion JPY Billion JPY Billion
Energy 181.0 161.6 -19.4 -10.7%
- Inventory Valuation 48.0 58.8 + 10.8 +22.5%
Excl. Inventory Valuation 133.0 102.8 -30.2 -22.7%
- Petroleum Products 88.0 56.1 -31.9 -36.3%
- Petrochemicals 45.0 46.7 + 1.7 +3.8%
Oil & Natural Gas E&P 95.0 93.6 -1.4 -1.5%
Metals 42.0 45.0 + 3.0 +7.1%
- Inventory Valuation (3.0) (1.5) + 1.5 -
Excl. Inventory Valuation 45.0 46.5 + 1.5 +3.3%
Others 27.0 28.1 + 1.1 +4.1%
Total 345.0 328.3 -16.7 -4.8%
Excl. Inventory Valuation 300.0 271.0 -29.0 -9.7%
ChangesFY 2012Actual
FY2012Last Forecast
(Announced in February)
13Copyright © 2013 JX Holdings, Inc.
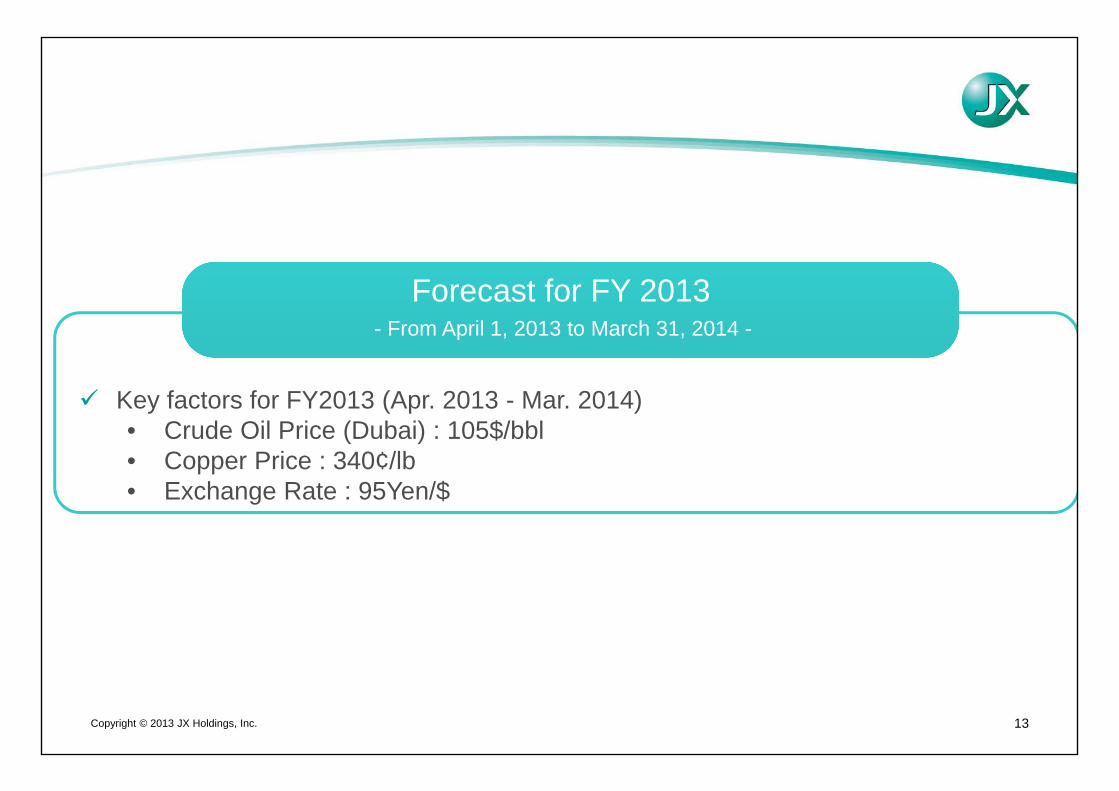
Key factors for FY2013 (Apr. 2013 - Mar. 2014)• Crude Oil Price (Dubai) : 105$/bbl• Copper Price : 340¢/lb• Exchange Rate : 95Yen/$
Forecast for FY 2013 - From April 1, 2013 to March 31, 2014 -

14Copyright © 2013 JX Holdings, Inc.
FY2013 Forecast Outline
109 105 -4 -3.2%
356 340 -16 -4.5%
83 95 +12 +14.5%
JPY Billion JPY Billion JPY Billion
11,219.5 12,250.0 +1,030.5 +9.2%
251.5 255.0 +3.5 +1.4%
76.8 80.0 +3.2 +4.2%
328.3 335.0 +6.7 +2.0%
57.3 35.0 -22.3 -38.9%
271.0 300.0 +29.0 +10.7%
(56.3) (25.0) +31.3 -
159.5 170.0 +10.5 +6.6%
Changes
Net Sales
Operating Income
Non-operating Income (Expenses), Net
Ordinary Income
Special Gain (Loss), Net
Net Income
Crude Oil (Dubai)* ($/bbl)
Exchange Rate (Yen/$)
Ordinary Income
Copper (¢/lb)
* Average from Mar. to Feb. (nearly equal to arrived crude cost)
<361>Jan.‐Dec.2012
<345> <-16>
FY2012(Actual)
FY2013(Forecast)
< 80> < 94> <+14>
-Inventory Valuation
<-4.4%>
<+17.5%>Jan.‐Dec.2012
Jan.‐Dec.2013
Jan.‐Dec.2013

15Copyright © 2013 JX Holdings, Inc.
FY2012 Actual vs. FY2013 ForecastChanges in Ordinary Income (Loss) by Segment
JPY Billion JPY Billion JPY Billion
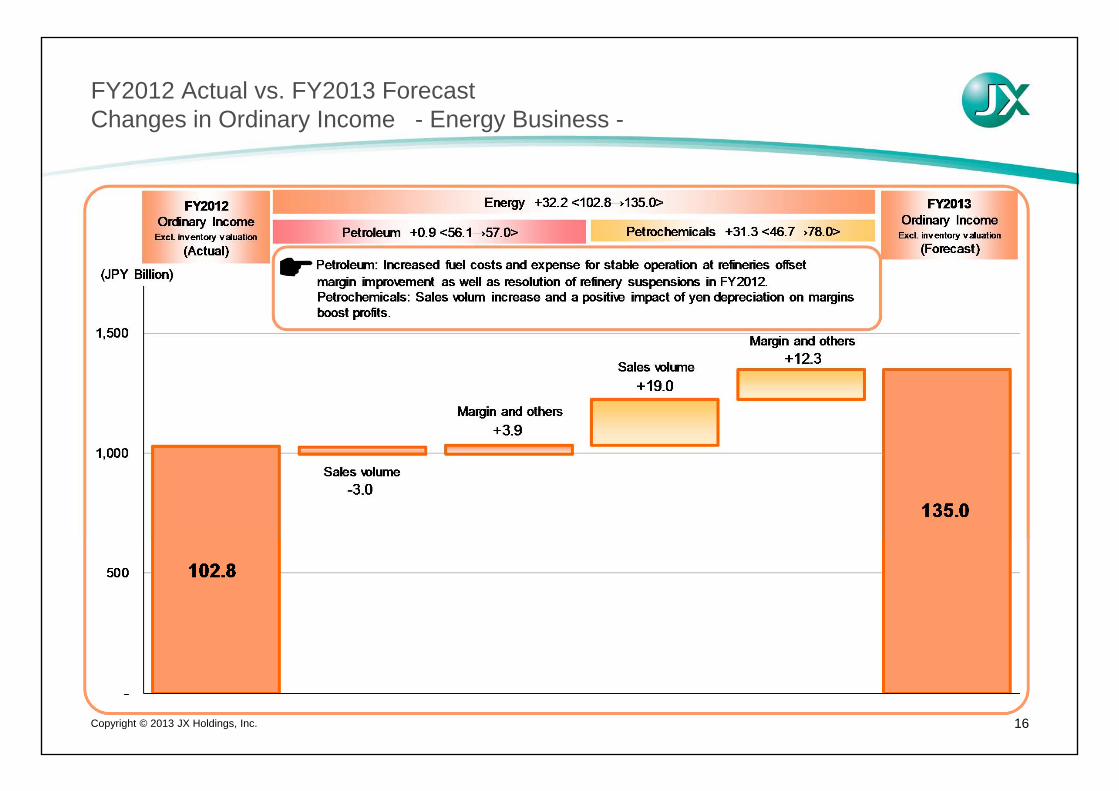
Energy 161.6 170.0 +8.4 +5.2%
- Inventory Valuation ( 58.8 ) ( 35.0 ) ( -23.8 ) -40.5%
Excl. Inventory Valuation 102.8 135.0 +32.2 +31.3%
- Petroleum Products ( 56.1 ) ( 57.0 ) ( +0.9 ) +1.6%
- Petrochemicals ( 46.7 ) ( 78.0 ) ( +31.3 ) +67.0%
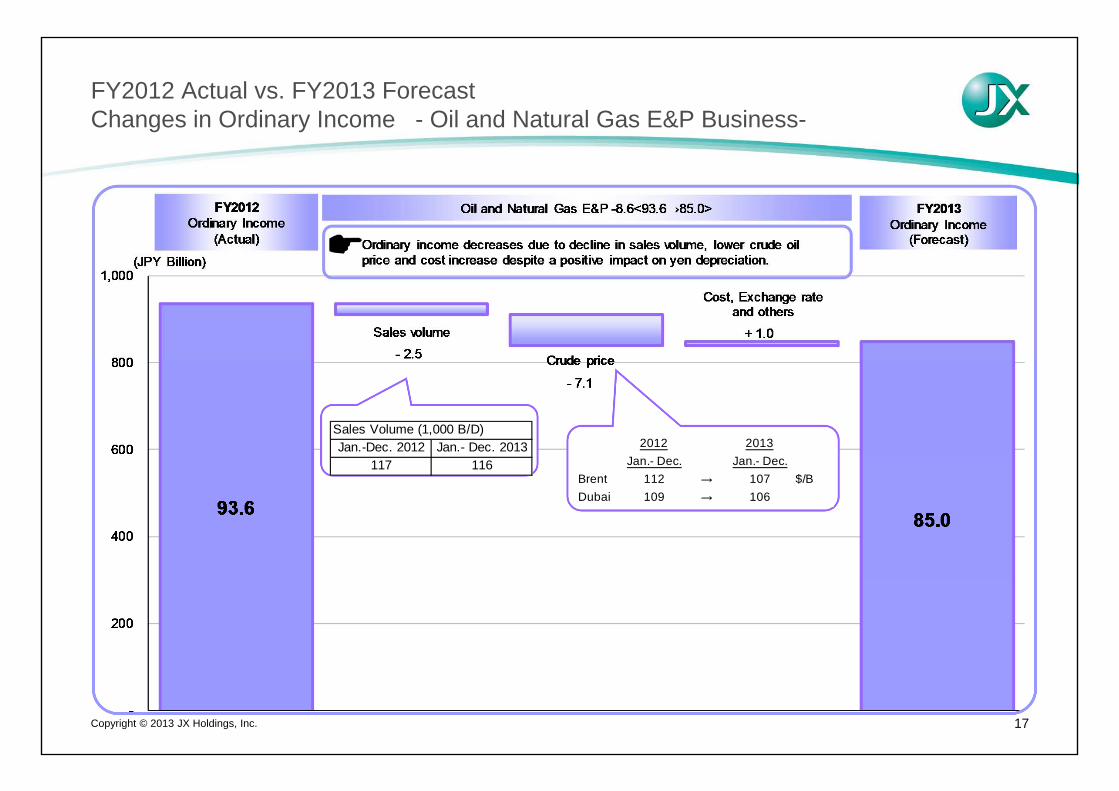
Oil & Natural Gas E&P 93.6 85.0 -8.6 -9.2%
Metals* 45.0 55.0 +10.0 +22.2%
- Inventory Valuation ( (1.5) ) ( - ) ( +1.5 ) -
Excl. Inventory Valuation 46.5 55.0 +8.5 +18.3%
Others* 28.1 25.0 -3.1 -11.0%
Total 328.3 335.0 +6.7 +2.0%
Excl. Inventory Valuation 271.0 300.0 +29.0 +10.7%
差 異
* Titanium business has been transferd to the "Metals segment " from "Others" as of FY2013.
FY2012(Actual)
FY2013(Forecast)
16Copyright © 2013 JX Holdings, Inc.
FY2012 Actual vs. FY2013 ForecastChanges in Ordinary Income - Energy Business -
17Copyright © 2013 JX Holdings, Inc.
FY2012 Actual vs. FY2013 ForecastChanges in Ordinary Income - Oil and Natural Gas E&P Business-
Sales Volume (1,000 B/D)Jan.-Dec. 2012 Jan.- Dec. 2013
117 116
2012 2013Jan.- Dec. Jan.- Dec.
Brent 112 → 107 $/BDubai 109 → 106

18Copyright © 2013 JX Holdings, Inc.
FY2012 Actual vs. FY2013 ForecastChanges in Ordinary Income - Metals Business -

19Copyright © 2013 JX Holdings, Inc.
Key Factors
*1 Crude oil arrival basis
FY2009 FY2011 FY2012 FY2013
Actual Actual Actual Actual
Exchange rate [Yen/$] 93 86 79 83 95
Crude oil price [Dubai] *1 [$/bbl] 86 82 109 109 105Paraxylene spread [ACP] (vs. Dubai crude oil price of previous month) [$/ton] 510 570 765 715 725
Sales volume <Crude oil equivalent> [1,000 BD] 143 140 128 117 116Crude oil price [Brent] [Jan.-Dec.] [$/bbl] 62 80 111 109 106
Metals Copper price [LME] [Jan.-Dec.] [¢/lb] 277 342 400 361 345
Equity entitled copper mine production [1,000 tons/year] 101 111 105 105 132
PPC refined copper sales [1,000 tons/year] 605 588 566 551 571
Treated Rolled Copper Foil sales [1,000 km/month] 2.7 3.3 2.6 2.7 3.2Precision rolled products sales [1,000 tons/month] 3.5 3.8 3.5 3.3 3.8
Gold recovery volume by Recycling & Environmental Services [tons/year] 6.3 6.5 7.0 5.8 6.1
All segments
Energy
Oil andNatural Gas
E&P
Forecast
FY2010

20
Sensitivity Analysis (FY2013 basis)
Sensitivity analysis (Only for Fiscal 2013)
Key factors (From Apr. 2013 to Mar. 2014)
Exchange Rate: 95Yen/$ Crude Oil FOB : 105$/bbl(Dubai spot)
Copper Price (LME) : 340 ¢/lb
Copyright © 2013 JX Holdings, Inc.
(JPY Billion)Key factors Appreciation
Energy (In-house fuel costs rise, margin improvement in petrochemicals) +1.0Oil and Natural Gas E&P +1.0Metals (Margin improvement, exchange gain/loss) +1.0Subtotal +3.0Inventory valuation gain/loss +8.0Total +11.0
Energy (In-house Fuel costs rise) -1.5Inventory valuation gain/loss +7.5Total +7.5
Metals +2.5Total +2.5
Copper Price(LME)
+10¢/lb
Segment Impact
Exchange Rate +1 Yen/$yen depreciation
Crude Oil FOB(Dubai spot) +1$/bbl

21Copyright © 2013 JX Holdings, Inc.
Cautionary Statement Regarding Forward-Looking Statements
This notice contains certain forward-looking statements, however, actual results may differ materially from those reflected in any forward-looking statement, due to various factors, including but not limited to, the following: (1) macroeconomic conditions and changes in the competitive environment in the energy, resources and materials industries; (2) changes in laws and regulations; and (3) risks related to litigation and other legal proceedings.