2014-2015 academic review june 22, 2015 - d41.org · 2014-2015 academic review june 22, 2015 . 1 ....
TRANSCRIPT

2014-2015 Academic Review June 22, 2015
1

Overview
● Cohort Growth and Year to Year Data for Reading and Math ○ MAP Data ○ Fountas & Pinnell Data
● Dual, FLES, ELL ● Pre-K, Special Education ● Economically Disadvantaged ● AEC ● Future Academic Updates
2

Key to Understanding MAP Growth Data Count: Number of students with valid growth test events in the beginning and ending terms. Data shown in the Actual Growth columns come from this group of students.
Mean RIT: Average RIT score of students in this group for the term indicated.
Mean Growth: Average change in RIT scores from starting term to ending term (ending RIT minus starting RIT).
Mean Projection: Average of the individual student growth projections. Each individual growth projection is from the latest NWEA norms study of students who started the year with the same RIT score as the individual student.
Percent of Projection: Total student growth divided by the total of projected RIT growth scores expressed as a percentage. This measure shows the proportion of the overall RIT growth projections achieved by the students. Performance of 100% is considered average; the student growth equaled the projections. Use in conjunction with the Percent Meeting Growth Projection value. When no growth norms exist, no value appears in this column.
Percent Meeting Projection: Percentage of students in this group that met their individual growth projections.
3

Reading
4

Overall District Growth Reading MAP 2014-15
Grade Count Fall 2014 Mean RIT
Spring 2015 Mean RIT
Actual Mean
Growth
Projected Mean
Growth
Percent of Projection
Percent Meeting
Projection
KG 343 148.5 163.6 15.1 14.5 104.1 56.0
1 336 168.2 186.2 18.1 16.9 107.1 55.4
2 366 180.5 195.8 15.3 13.1 116.8 61.5
3 370 197.4 207.8 10.4 8.6 120.9 62.4
4 340 205.3 213.5 8.3 6.5 127.7 59.4
5 394 215.1 221.8 6.7 4.8 139.6 64.0
6 395 220.6 225.0 4.3 3.8 113.2 56.7
7 353 224.0 227.9 3.9 3.0 130.0 57.5
8 386 229.8 232.9 3.2 2.6 123.1 58.3
Note: This data includes only students who took both the Fall 2014 and Spring 2015 MAP assessments. 5

Reading RIT Growth - Grade K Cohort
School Year
Count (students who
took both Spring and Fall assessments)
Fall Mean RIT
Spring Mean RIT
Actual Mean
Growth
Projected Mean
Growth
Percent of Projection
Percent Meeting
Projection
2014-15 343 148.5 163.6 15.1 14.5 104.1 56.0
6

Reading RIT Growth - Grade 1 Cohort
School Year
Count (students who
took both Spring and Fall assessments)
Fall Mean RIT
Spring Mean RIT
Actual Mean
Growth
Projected Mean
Growth
Percent of Projection
Percent Meeting
Projection
2014-15 336 168.2 186.2 18.1 16.9 107.1 55.4
7

Reading RIT Growth - Grade 2 Cohort
School Year
Count (students who
took both Spring and Fall assessments)
Fall Mean RIT
Spring Mean RIT
Actual Mean
Growth
Projected Mean
Growth
Percent of Projection
Percent Meeting
Projection
2013-14 (Grade 1)
360 163.6 182.3 18.7 16.8 111.3 58.1
2014-15 (Grade 2)
366 180.5 195.8 15.3 13.1 116.8 61.5
8

Reading RIT Growth - Grade 3 Cohort
School Year
Count (students who
took both Spring and Fall assessments)
Fall Mean RIT
Spring Mean RIT
Actual Mean
Growth
Projected Mean
Growth
Percent of Projection
Percent Meeting
Projection
2012-13 Grade 1
372 165.8 183.9 18.1 16.8 107.7 60.5
2013-14 Grade 2
369 181.1 196.7 15.6 13.0 120.0 62.6
2014-15 Grade 3
370 197.4 207.8 10.4 8.6 120.9 62.4
9

Reading RIT Growth - Grade 4 Cohort
School Year
Count (students who
took both Spring and Fall assessments)
Fall Mean RIT
Spring Mean RIT
Actual Mean
Growth
Projected Mean
Growth
Percent of Projection
Percent Meeting
Projection
2011-12 Grade 1
316 166.9 185.1 18.2 16.9 107.7 57.9
2012-13 Grade 2
334 182.4 196.8 14.3 12.8 111.7 60.5
2013-14 Grade 3
352 195.1 204.5 9.5 8.8 108.0 54.5
2014-15 Grade 4
340 205.3 213.5 8.3 6.5 127.7 59.4
10

Reading RIT Growth - Grade 5 Cohort
School Year
Count (students who
took both Spring and Fall assessments)
Fall Mean RIT
Spring Mean RIT
Actual Mean
Growth
Projected Mean
Growth
Percent of Projection
Percent Meeting
Projection
2011-12 Grade 2
372 182.9 197.7 14.8 12.7 116.5 61.0
2012-13 Grade 3
394 198.2 206.3 8.1 8.5 95.3 48.2
2013-14 Grade 4
393 206.7 214.1 7.3 6.4 114.1 60.3
2014-15 Grade 5
394 215.1 221.8 6.7 4.8 139.6 64.0
11

Reading RIT Growth - Grade 6 Cohort
School Year
Count (students who
took both Spring and Fall assessments)
Fall Mean RIT
Spring Mean RIT
Actual Mean
Growth
Projected Mean
Growth
Percent of Projection
Percent Meeting
Projection
2011-12 Grade 3
409 197.9 206.5 8.6 8.5 101.2 55.5
2012-13 Grade 4
396 207.2 214.2 6.9 6.4 107.8 57.3
2013-14 Grade 5
399 214.4 220.3 6.0 4.8 125.0 61.9
2014-15 Grade 6
395 220.6 225 4.3 3.8 113.2 56.7
12

Reading RIT Growth - Grade 7 Cohort
School Year
Count (students who
took both Spring and Fall assessments)
Fall Mean RIT
Spring Mean RIT
Actual Mean
Growth
Projected Mean
Growth
Percent of Projection
Percent Meeting
Projection
2011-12 Grade 4
349 207.0 213.4 6.4 6.4 100.0 51.3
2012-13 Grade 5
369 213.6 219.3 5.7 4.9 116.3 57.7
2013-14 Grade 6
371 217.5 222.4 4.9 3.9 125.6 62.3
2014-15 Grade 7
353 224.0 227.9 3.9 3.0 130.0 57.5
13

Reading RIT Growth - Grade 8 Cohort
School Year
Count (students who
took both Spring and Fall assessments)
Fall Mean RIT
Spring Mean RIT
Actual Mean
Growth
Projected Mean
Growth
Percent of Projection
Percent Meeting
Projection
2011-12 Grade 5
395 214.2 219.3 5.1 4.8 106.3 50.6
2012-13 Grade 6
399 219.5 222.9 3.5 3.9 89.7 50.6
2013-14 Grade 7
404 223.1 228.1 5.0 3.1 161.3 67.1
2014-15 Grade 8
386 229.8 232.9 3.2 2.6 123.1 58.3
14

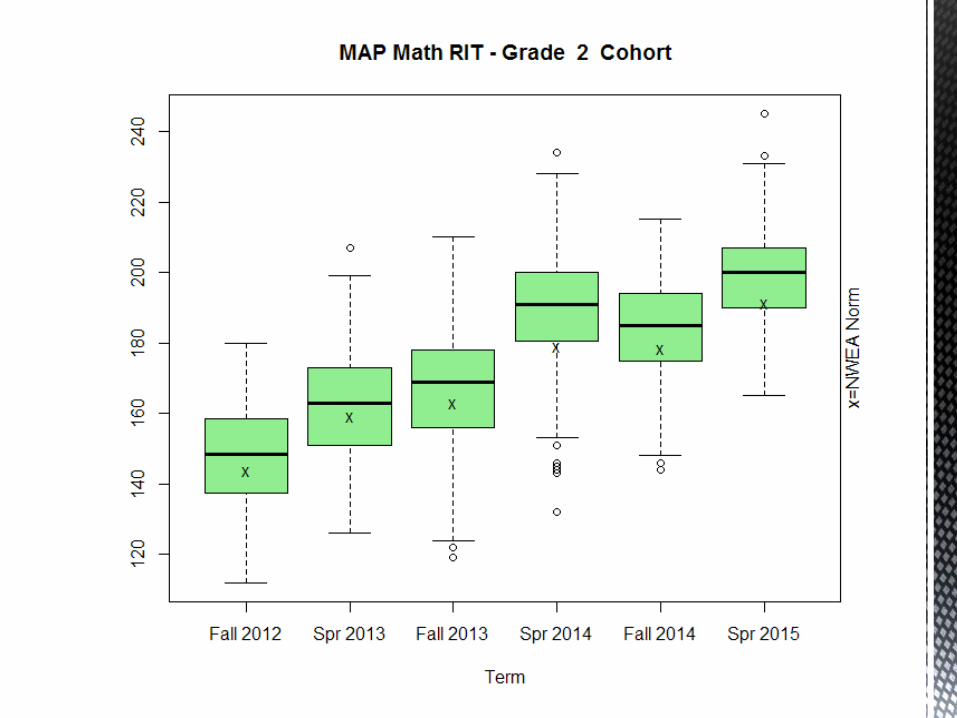
● Graphical depiction of scores, displaying range, quartiles, and outliers (Note: quartiles are locally computed, not NWEA percentiles)
● Indication of how scores are spread
● Side-by-side plots allow comparison of data sets
● Outliers represent a single student performing outside the minimum to maximum range.
Outliers (outside 1.5 times the length of the box from either end)
Maximum (or 1.5*size of box)
75th Percentile
Median
25th Percentile
Minimum (or 1.5*size of box)


Only 2 schools took Fall KG
test

Only 85 kindergarteners
took Fall 2012 test.


Year-to-Year Same Grade Level Comparisons
● Shows data of same grade level at each year (not cohort)
● Note: 2010-11 school year was first year for Common Core MAP assessments
● Grade 1-8 Norms are changing for next year--Reading going down slightly (except 1st grade), Math going up slightly.
25

Reading RIT Growth Over Time - Grade 1
School Year
Count (students who
took both Spring and Fall assessments)
Fall Mean RIT
Spring Mean RIT
Actual Mean
Growth
Projected Mean
Growth
Percent of Projection
Percent Meeting
Projection
2008-09 324 165.4 181.8 16.4 16.9 97.0 45.7
2009-10 377 162.9 182.7 19.8 16.8 117.9 66.0
2010-11 373 163.1 183.2 20.1 16.8 119.6 64.8
2011-12 316 166.9 185.1 18.2 16.9 107.7 57.9
2012-13 372 165.8 183.9 18.1 16.8 107.7 60.5
2013-14 360 163.6 182.3 18.7 16.8 111.3 58.1
2014-15 336 168.2 186.2 18.1 16.9 107.1 55.4
Pre-Common Core test
26

Reading RIT Growth Over Time - Grade 2
School Year
Count (students who
took both Spring and Fall assessments)
Fall Mean RIT
Spring Mean RIT
Actual Mean
Growth
Projected Mean
Growth
Percent of Projection
Percent Meeting
Projection
2008-09 390 182.5 195.4 13.0 12.8 101.6 50.3
2009-10 328 183.4 199.8 16.4 12.7 129.1 67.1
2010-11 403 180.9 196.6 15.7 13.0 120.8 61.3
2011-12 372 182.9 197.7 14.8 12.7 116.5 61.0
2012-13 334 182.4 196.8 14.3 12.8 111.7 60.5
2013-14 369 181.1 196.7 15.6 13.0 120.0 62.6
2014-15 366 180.5 195.8 15.3 13.1 116.8 61.5
Pre-Common Core test
27

Reading RIT Growth Over Time - Grade 3
School Year
Count (students who
took both Spring and Fall assessments)
Fall Mean RIT
Spring Mean RIT
Actual Mean
Growth
Projected Mean
Growth
Percent of Projection
Percent Meeting
Projection
2008-09 358 199.2 207.3 8.1 8.4 96.4 52.5
2009-10 393 197.5 207.1 9.6 8.6 111.6 57.3
2010-11 351 198.2 208.9 10.7 8.5 125.9 62.4
2011-12 409 197.9 206.5 8.6 8.5 101.2 55.5
2012-13 394 198.2 206.3 8.1 8.5 95.3 48.2
2013-14 352 195.1 204.5 9.5 8.8 108.0 54.5
2014-15 370 197.4 207.8 10.4 8.6 120.9 62.4
Pre-Common Core test
28

Reading RIT Growth Over Time - Grade 4
School Year
Count (students who
took both Spring and Fall assessments)
Fall Mean RIT
Spring Mean RIT
Actual Mean
Growth
Projected Mean
Growth
Percent of Projection
Percent Meeting
Projection
2008-09 394 207.5 213.9 6.4 6.4 100.0 55.6
2009-10 361 208.1 215.4 7.2 6.3 114.3 57.3
2010-11 400 207.6 216.2 8.6 6.3 136.5 61.5
2011-12 349 207.0 213.4 6.4 6.4 100.0 51.3
2012-13 396 207.2 214.2 6.9 6.4 107.8 57.3
2013-14 393 206.7 214.1 7.3 6.4 114.1 60.3
2014-15 340 205.3 213.5 8.3 6.5 127.7 59.4
Pre-Common Core test 29

Reading RIT Growth Over Time - Grade 5
School Year
Count (students who
took both Spring and Fall assessments)
Fall Mean RIT
Spring Mean RIT
Actual Mean
Growth
Projected Mean
Growth
Percent of Projection
Percent Meeting
Projection
2008-09 388 214.5 219.1 4.6 4.8 95.8 50.5
2009-10 395 214.5 221.3 6.8 4.8 141.7 62.0
2010-11 377 214.7 222.4 7.7 4.9 157.1 69.2
2011-12 395 214.2 219.3 5.1 4.8 106.3 50.6
2012-13 369 213.6 219.3 5.7 4.9 116.3 57.7
2013-14 399 214.4 220.3 6.0 4.8 125.0 61.9
2014-15 394 215.1 221.8 6.7 4.8 139.6 64.0
Pre-Common Core test 30

Reading RIT Growth Over Time - Grade 6
School Year Count Fall Mean RIT
Spring Mean RIT
Actual Mean
Growth
Projected Mean
Growth
Percent of Projection
Percent Meeting
Projection
2008-09 361 219.4 224.1 4.6 3.8 121.1 59.0
2009-10 373 217.6 223.2 5.7 3.9 146.2 60.9
2010-11 385 220.4 225.9 5.5 3.8 144.7 62.3
2011-12 365 218.8 223.6 4.8 3.8 126.3 59.5
2012-13 399 219.5 222.9 3.5 3.9 89.7 50.6
2013-14 371 217.5 222.4 4.9 3.9 125.6 62.3
2014-15 395 220.6 225.0 4.3 3.8 113.2 56.7
Pre-Common Core test
31

Reading RIT Growth Over Time - Grade 7
School Year Count Fall Mean RIT
Spring Mean RIT
Actual Mean
Growth
Projected Mean
Growth
Percent of Projection
Percent Meeting
Projection
2008-09 381 223.7 226.6 2.9 3.1 93.5 53.5
2009-10 350 223.9 227.7 3.8 3.1 122.6 57.7
2010-11 376 223.8 227.7 3.9 3.1 125.8 61.4
2011-12 390 223.9 228.3 4.4 3.1 141.9 59.2
2012-13 384 224.0 227.4 3.3 3.1 106.5 56.5
2013-14 404 223.1 228.1 5.0 3.1 161.3 67.1
2014-15 353 224.0 227.9 3.9 3.0 130.0 57.5
Pre-Common Core test
32

Reading RIT Growth Over Time - Grade 8
School Year Count Fall Mean RIT
Spring Mean RIT
Actual Mean
Growth
Projected Mean
Growth
Percent of Projection
Percent Meeting
Projection
2008-09 368 226.4 229.9 3.4 2.7 125.9 56.0
2009-10 366 227.7 230.4 2.7 2.6 103.8 53.3
2010-11 355 228.5 232.0 3.5 2.6 134.6 54.9
2011-12 372 227.5 229.9 2.4 2.7 88.9 49.2
2012-13 400 228.4 231.5 3.0 2.7 111.1 55.8
2013-14 398 227.0 230.9 3.9 2.7 144.4 61.6
2014-15 386 229.8 232.9 3.2 2.6 123.1 58.3
Pre-Common Core test
33
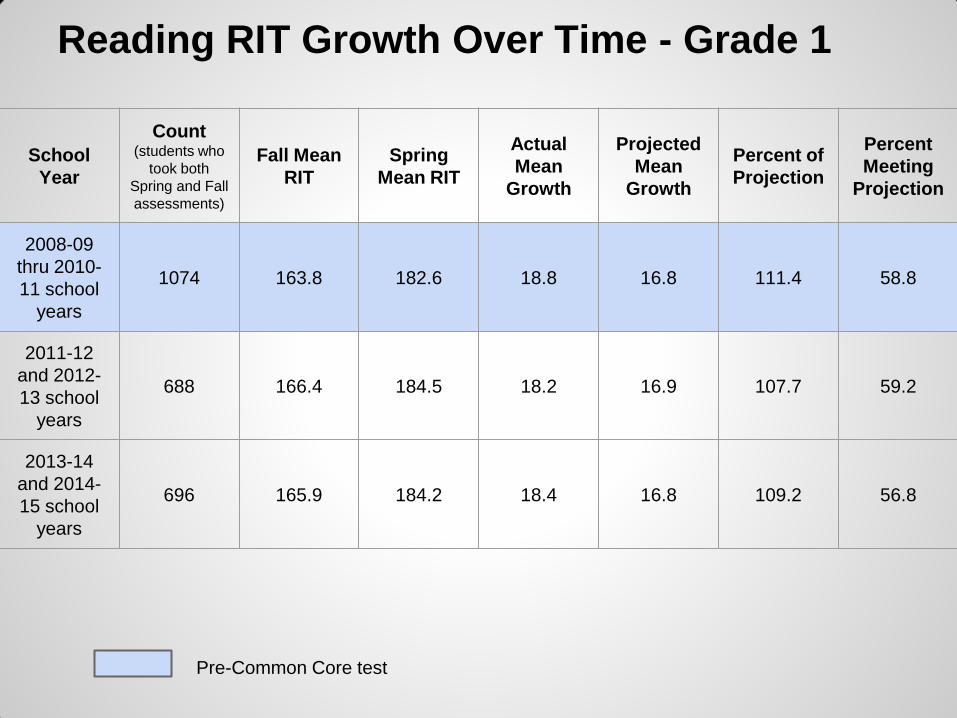
Reading RIT Growth Over Time - Grade 1
School
Year
Count (students who
took both
Spring and Fall
assessments)
Fall Mean
RIT
Spring
Mean RIT
Actual
Mean
Growth
Projected
Mean
Growth
Percent of
Projection
Percent
Meeting
Projection
2008-09
thru 2010-
11 school
years
1074 163.8 182.6 18.8 16.8 111.4 58.8
2011-12
and 2012-
13 school
years
688 166.4 184.5 18.2 16.9 107.7 59.2
2013-14
and 2014-
15 school
years
696 165.9 184.2 18.4 16.8 109.2 56.8
Pre-Common Core test

School Year
Count (students who
took both Spring and Fall assessments)
Fall Mean
RIT
Spring Mean RIT
Actual Mean
Growth
Projected Mean
Growth
Percent of Projection
Percent Meeting
Projection
2008-09 thru
2010-11 school years
1121 182.2 197.1 15.0 12.8 116.5 59.2
2011-12 and
2012-13 school years
706 182.7 197.3 14.6 12.7 114.2 60.8
2013-14 and
2014-15 school years
735 180.8 196.3 15.5 13.0 118.4 62.1
Pre-Common Core test 34

School Year
Count (students who
took both Spring and Fall assessments)
Fall Mean
RIT
Spring Mean
RIT
Actual Mean
Growth
Projected Mean
Growth
Percent of Projection
Percent Meeting
Projection
2008-09 thru
2010-11 school years
1102 198.3 207.7 9.5 8.5 111.3 57.4
2011-12 and
2012-13 school years
803 198.0 206.4 8.4 8.5 98.3 51.9
2013-14 and
2014-15 school years
722 196.3 206.2 10.0 8.7 114.5 58.5
Pre-Common Core test 35
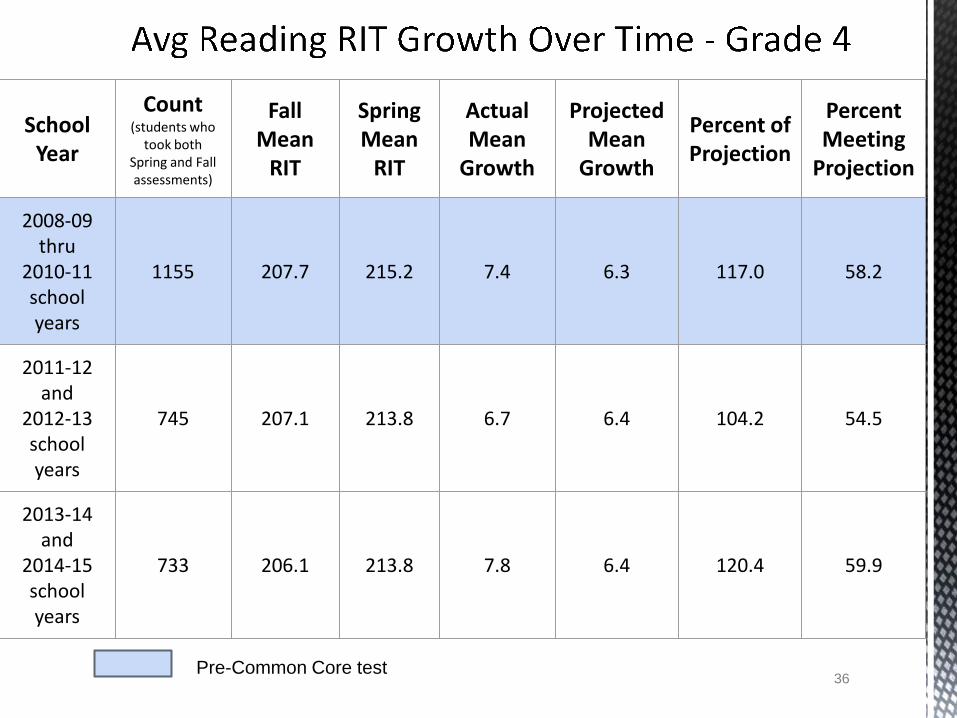
School Year
Count (students who
took both Spring and Fall assessments)
Fall Mean
RIT
Spring Mean
RIT
Actual Mean
Growth
Projected Mean
Growth
Percent of Projection
Percent Meeting
Projection
2008-09 thru
2010-11 school years
1155 207.7 215.2 7.4 6.3 117.0 58.2
2011-12 and
2012-13 school years
745 207.1 213.8 6.7 6.4 104.2 54.5
2013-14 and
2014-15 school years
733 206.1 213.8 7.8 6.4 120.4 59.9
Pre-Common Core test 36

School Year
Count (students who
took both Spring and Fall assessments)
Fall Mean
RIT
Spring Mean RIT
Actual Mean
Growth
Projected Mean
Growth
Percent of Projection
Percent Meeting
Projection
2008-09 thru
2010-11 school years
1160 214.6 220.9 6.4 4.8 131.4 60.5
2011-12 and
2012-13 school years
764 213.9 219.3 5.4 4.8 111.2 54.0
2013-14 and
2014-15 school years
793 214.7 221.0 6.3 4.8 132.2 62.9
Pre-Common Core test 37

Reading RIT Growth Over Time - Grade 6
School
Year
Count (students who
took both
Spring and Fall
assessments)
Fall Mean
RIT
Spring
Mean RIT
Actual
Mean
Growth
Projected
Mean
Growth
Percent of
Projection
Percent
Meeting
Projection
2008-09
thru 2010-
11 school
years
1119 219.1 224.4 5.3 3.8 137.4 60.7
2011-12
and 2012-
13 school
years
764 219.1 223.3 4.2 3.8 108.4 55.2
2013-14
and 2014-
15 school
years
766 219.0 223.7 4.6 3.9 119.6 59.5
Pre-Common Core test

Reading RIT Growth Over Time - Grade 7
School
Year
Count (students who
took both
Spring and Fall
assessments)
Fall Mean
RIT
Spring
Mean RIT
Actual
Mean
Growth
Projected
Mean
Growth
Percent of
Projection
Percent
Meeting
Projection
2008-09
thru 2010-
11 school
years
1107 223.8 227.3 3.5 3.1 113.8 57.5
2011-12
and 2012-
13 school
years
774 224.0 227.8 3.8 3.1 123.1 57.8
2013-14
and 2014-
15 school
years
757 223.5 228.0 4.5 3.1 147.0 62.6
Pre-Common Core test

Reading RIT Growth Over Time - Grade 8
School
Year
Count (students who
took both
Spring and Fall
assessments)
Fall Mean
RIT
Spring
Mean RIT
Actual
Mean
Growth
Projected
Mean
Growth
Percent of
Projection
Percent
Meeting
Projection
2008-09
thru 2010-
11 school
years
1089 227.5 230.8 3.2 2.6 122.1 54.8
2011-12
and 2012-
13 school
years
772 228.0 230.8 2.7 2.7 100.7 52.7
2013-14
and 2014-
15 school
years
784 228.3 231.8 3.6 2.7 134.7 60.1
Pre-Common Core test

Fountas & Pinnell Reading Level Data by Cohort
38

39

40

41

42

43

44

Math
45

Overall District Growth Math MAP 2014-15
Grade Count Fall 2014 Mean RIT
Spring 2015 Mean RIT
Actual Mean
Growth
Projected Mean
Growth
Percent of Projection
Percent Meeting
Projection
KG 342 148.9 165.7 16.8 15.1 111.3 64.9
1 335 170.7 191.4 20.7 14.6 141.8 79.1
2 364 183.7 198.6 14.9 12.5 119.2 68.7
3 371 201.0 212.3 11.3 10.8 104.6 56.3
4 341 211.6 223.1 11.5 8.9 129.2 67.4
5 392 224.9 233.7 8.8 8.0 110.0 56.8
6 396 229.1 237.4 8.2 6.0 136.7 68.4
7 357 235.1 241.1 6.0 5.0 120.0 61.3
8 383 242.5 248.2 5.7 4.0 142.5 64.0
Note: This data includes only students who took both the Fall 2014 and Spring 2015 MAP assessments. 46

Math RIT Growth - Grade K Cohort
School Year
Count (students who
took both Spring and Fall assessments)
Fall Mean RIT
Spring Mean RIT
Actual Mean
Growth
Projected Mean
Growth
Percent of Projection
Percent Meeting
Projection
2014-15 342 148.9 165.7 16.8 15.1 111.3 64.9
47

Math RIT Growth - Grade 1 Cohort
School Year
Count (students who
took both Spring and Fall assessments)
Fall Mean RIT
Spring Mean RIT
Actual Mean
Growth
Projected Mean
Growth
Percent of Projection
Percent Meeting
Projection
2014-15 335 170.7 191.4 20.7 14.6 141.8 79.1
48

Math RIT Growth - Grade 2 Cohort
School Year
Count (students who
took both Spring and Fall assessments)
Fall Mean RIT
Spring Mean RIT
Actual Mean
Growth
Projected Mean
Growth
Percent of Projection
Percent Meeting
Projection
2013-14 (Grade 1)
361 166.6 189.1 22.5 15.3 147.1 84.1
2014-15 (Grade 2)
364 183.7 198.6 14.9 12.5 119.2 68.7
49

Math RIT Growth - Grade 3 Cohort
School Year
Count (students who
took both Spring and Fall assessments)
Fall Mean RIT
Spring Mean RIT
Actual Mean
Growth
Projected Mean
Growth
Percent of Projection
Percent Meeting
Projection
2012-13 Grade 1
367 168.0 189.3 21.3 15.1 141.1 78.7
2013-14 Grade 2
369 184.0 200.6 16.6 12.4 133.9 74.8
2014-15 Grade 3
371 201.0 212.3 11.3 10.8 104.6 56.3
50

Math RIT Growth - Grade 4 Cohort
School Year
Count (students who
took both Spring and Fall assessments)
Fall Mean RIT
Spring Mean RIT
Actual Mean
Growth
Projected Mean
Growth
Percent of Projection
Percent Meeting
Projection
2011-12 Grade 1
311 170.4 189.9 19.4 14.7 132.0 77.5
2012-13 Grade 2
341 185.3 200.5 15.2 12.3 123.6 67.4
2013-14 Grade 3
352 197.4 211.1 13.6 10.9 124.8 67.3
2014-15 Grade 4
341 211.6 223.1 11.5 8.9 129.2 67.4
51

Math RIT Growth - Grade 5 Cohort
School Year
Count (students who
took both Spring and Fall
assessments)
Fall Mean RIT
Spring Mean RIT
Actual Mean
Growth
Projected Mean Growth
Percent of Projection
Percent Meeting
Projection
2011-12 Grade 2
371 186.8 203.1 16.3 12.1 134.7 73.9
2012-13 Grade 3
393 202.3 213.0 10.8 10.7 100.9 52.7
2013-14 Grade 4
395 212.8 224.8 11.9 8.9 133.7 67.1
2014-15 Grade 5
392 224.9 233.7 8.8 8.0 110.0 56.8
52

Math RIT Growth - Grade 6 Cohort
School Year
Count (students who
took both Spring and Fall assessments)
Fall Mean RIT
Spring Mean RIT
Actual Mean
Growth
Projected Mean
Growth
Percent of Projection
Percent Meeting
Projection
2011-12 Grade 3
405 200.6 212.3 11.7 10.8 108.3 59.0
2012-13 Grade 4
396 212.9 224.1 11.3 8.9 127.0 67.9
2013-14 Grade 5
402 222.7 232.7 10.0 8.0 125.0 63.4
2014-15 Grade 6
396 229.1 237.4 8.2 6.0 136.7 68.4
53

Math RIT Growth - Grade 7 Cohort
School Year
Count (students who
took both Spring and Fall assessments)
Fall Mean RIT
Spring Mean RIT
Actual Mean
Growth
Projected Mean
Growth
Percent of Projection
Percent Meeting
Projection
2011-12 Grade 4
349 212.3 223.7 11.4 8.9 128.1 66.5
2012-13 Grade 5
370 222.4 231.4 9.0 8.0 112.5 56.5
2013-14 Grade 6
368 226.8 235.8 9.1 6.0 151.7 70.7
2014-15 Grade 7
357 235.1 241.1 6.0 5.0 120.0 61.3
54

Math RIT Growth - Grade 8 Cohort
School Year
Count (students who
took both Spring and Fall assessments)
Fall Mean RIT
Spring Mean RIT
Actual Mean
Growth
Projected Mean
Growth
Percent of Projection
Percent Meeting
Projection
2011-12 Grade 5
396 222.5 232.3 9.8 8.0 122.5 65.7
2012-13 Grade 6
404 229.4 234.5 5.1 6.0 85.0 47.3
2013-14 Grade 7
406 234.5 242.0 7.5 5.0 150.0 66.4
2014-15 Grade 8
383 242.5 248.2 5.7 4.0 142.5 64.0
55


Only 2 schools took Fall KG
test


Year-to-Year Same Grade Level Comparisons
● Shows data of same grade level at each year (not cohort)
● Note: 2010-11 school year was first year for Common Core MAP assessments
● Grade 1-8 Norms are changing for next year--Reading going down slightly (except 1st grade), Math going up slightly.
65

Math RIT Growth Over Time - Grade 1
School Year Count Fall Mean RIT
Spring Mean RIT
Actual Mean
Growth
Projected Mean
Growth
Percent of Projection
Percent Meeting
Projection
2008-09 323 167.9 186.2 18.2 15.1 120.5 71.8
2009-10 376 166.5 189.0 22.5 15.3 147.1 79.7
2010-11 371 167.1 189.2 22.1 15.2 145.4 85.7
2011-12 316 170.4 189.9 19.4 14.7 132.0 77.5
2012-13 367 168.0 189.3 21.3 15.1 141.1 78.7
2013-14 361 166.6 189.1 22.5 15.3 147.1 84.1
2014-15 335 170.7 191.4 20.7 14.6 141.8 79.1
Pre-Common Core test
66

Math RIT Growth Over Time - Grade 2
School Year Count Fall Mean RIT
Spring Mean RIT
Actual Mean
Growth
Projected Mean
Growth
Percent of Projection
Percent Meeting
Projection
2008-09 389 184.1 197.1 13.0 12.4 104.8 55.0
2009-10 328 186.1 201.5 15.4 12.2 126.2 71.6
2010-11 408 184.2 199.6 15.5 12.4 125.0 68.1
2011-12 371 186.8 203.1 16.3 12.1 134.7 73.9
2012-13 341 185.3 200.5 15.2 12.3 123.6 67.4
2013-14 369 184.0 200.6 16.6 12.4 133.9 74.8
2014-15 364 183.7 198.6 14.9 12.5 119.2 68.7
Pre-Common Core test
67

Math RIT Growth Over Time - Grade 3
School Year Count Fall Mean RIT
Spring Mean RIT
Actual Mean
Growth
Projected Mean
Growth
Percent of Projection
Percent Meeting
Projection
2008-09 364 200.3 211.9 11.6 10.8 107.4 57.1
2009-10 389 199.7 212.5 12.7 10.8 117.6 64.5
2010-11 353 200.3 212.6 12.3 10.8 113.9 62.9
2011-12 405 200.6 212.3 11.7 10.8 108.3 59.0
2012-13 393 202.3 213.0 10.8 10.7 100.9 52.7
2013-14 352 197.4 211.1 13.6 10.9 124.8 67.3
2014-15 371 201.0 212.3 11.3 10.8 104.6 56.3
Pre-Common Core test
68

Math RIT Growth Over Time - Grade 4
School Year Count Fall Mean RIT
Spring Mean RIT
Actual Mean Growth
Projected Mean
Growth
Percent of Projection
Percent Meeting Projecti
on
2008-09 389 210.3 219.9 9.6 8.9 107.9 59.1
2009-10 362 212.9 223.3 10.4 8.9 116.9 58.8
2010-11 400 212.5 222.9 10.4 8.9 116.9 61.0
2011-12 349 212.3 223.7 11.4 8.9 128.1 66.5
2012-13 396 212.9 224.1 11.3 8.9 127.0 67.9
2013-14 395 212.8 224.7 11.9 8.9 133.7 67.1
2014-15 341 211.6 223.1 11.5 8.9 129.2 67.4
Pre-Common Core test
69

Math RIT Growth Over Time - Grade 5
School Year Count Fall Mean RIT
Spring Mean RIT
Actual Mean
Growth
Projected Mean
Growth
Percent of Projection
Percent Meeting
Projection
2008-09 387 218.2 228.8 10.5 8.0 131.3 66.7
2009-10 396 220.3 231.4 11.1 8.0 138.8 68.9
2010-11 374 222.4 232.3 9.9 8.0 123.8 64.7
2011-12 396 222.5 232.3 9.8 8.0 122.5 65.7
2012-13 370 222.4 231.4 9.0 8.0 112.5 56.5
2013-14 402 222.7 232.7 10.0 8.0 125.0 63.4
2014-15 392 224.9 233.7 8.8 8.0 110.0 56.8
Pre-Common Core test
70

Math RIT Growth Over Time - Grade 6
School Year Count Fall Mean RIT
Spring Mean RIT
Actual Mean
Growth
Projected Mean
Growth
Percent of Projection
Percent Meeting
Projection
2008-09 360 226.2 233.0 6.7 6.0 111.7 60.3
2009-10 383 224.5 234.2 9.7 6.0 161.7 71.0
2010-11 398 228.2 237.3 9.0 6.0 150.0 71.6
2011-12 372 228.6 236.6 7.9 6.0 131.7 63.4
2012-13 404 229.4 234.5 5.1 6.0 85.0 47.3
2013-14 368 226.8 235.8 9.1 6.0 151.7 70.7
2014-15 396 229.1 237.4 8.2 6.0 136.7 68.4
Pre-Common Core test
71

Math RIT Growth Over Time - Grade 7
School Year Count Fall Mean RIT
Spring Mean RIT
Actual Mean
Growth
Projected Mean
Growth
Percent of Projection
Percent Meeting
Projection
2008-09 382 232.5 238.6 6.1 5.0 122.0 60.7
2009-10 350 234.7 242.1 7.4 5.0 148.0 67.1
2010-11 378 234.1 240.4 6.4 5.0 128.0 60.8
2011-12 393 236.7 243.8 7.1 5.0 142.0 65.9
2012-13 385 235.5 241.1 5.6 5.0 112.0 58.2
2013-14 406 234.5 242.0 7.5 5.0 150.0 66.4
2014-15 357 235.1 241.1 6.0 5.0 120.0 61.3
Pre-Common Core test
72

Math RIT Growth Over Time - Grade 8
School Year Count Fall Mean RIT
Spring Mean RIT
Actual Mean
Growth
Projected Mean
Growth
Percent of Projection
Percent Meeting
Projection
2008-09 366 237.4 241.2 3.8 4.0 95.0 56.0
2009-10 365 239.5 245.9 6.4 4.0 160.0 66.8
2010-11 353 241.9 247.2 5.3 4.0 132.5 58.1
2011-12 376 240.2 244.4 4.2 4.0 105.0 54.3
2012-13 401 243.2 248.1 5.0 4.0 125.0 61.6
2013-14 399 240.4 247.8 7.4 4.0 185.0 74.3
2014-15 383 242.5 248.2 5.7 4.0 142.5 64.0
Pre-Common Core test
73

Math RIT Growth Over Time - Grade 1
School
Year
Count (students who
took both
Spring and Fall
assessments)
Fall Mean
RIT
Spring
Mean RIT
Actual
Mean
Growth
Projected
Mean
Growth
Percent of
Projection
Percent
Meeting
Projection
2008-09
thru 2010-
11 school
years
1070 167.1 188.2 21.0 15.2 138.0 79.0
2011-12
and 2012-
13 school
years
683 169.2 189.6 20.3 14.9 136.5 78.1
2013-14
and 2014-
15 school
years
696 168.7 190.3 21.6 14.9 144.4 81.5
Pre-Common Core test

School Year
Count (students who
took both Spring and Fall assessments)
Fall Mean
RIT
Spring Mean
RIT
Actual Mean
Growth
Projected Mean
Growth
Percent of Projection
Percent Meeting
Projection
2008-09 thru
2010-11 school years
1025 184.8 199.5 14.8 12.3 119.7 65.5
2011-12 and
2012-13 school years
712 186.1 201.9 15.8 12.2 129.3 70.8
2013-14 and
2014-15 school years
733 183.9 199.6 15.8 12.4 126.6 71.8
Pre-Common Core test 74

School Year
Count (students who
took both Spring and Fall assessments)
Fall Mean
RIT
Spring Mean
RIT
Actual Mean
Growth
Projected Mean
Growth
Percent of Projection
Percent Meeting
Projection
2008-09 thru
2010-11 school years
1106 200.1 212.3 12.2 10.8 113.1 61.6
2011-12 and
2012-13 school years
798 201.4 212.6 11.3 10.8 104.7 55.9
2013-14 and
2014-15 school years
723 199.2 211.7 12.4 10.8 114.5 61.7
Pre-Common Core test 75

School Year
Count (students who
took both Spring and Fall assessments)
Fall Mean
RIT
Spring Mean
RIT
Actual Mean
Growth
Projected Mean
Growth
Percent of Projection
Percent Meeting
Projection
2008-09 thru
2010-11 school years
1151 211.9 222.0 10.1 8.9 113.8 59.7
2011-12 and
2012-13 school years
745 212.6 223.9 11.3 8.9 127.5 67.2
2013-14 and
2014-15 school years
736 212.2 224.0 11.7 8.9 131.6 67.2
Pre-Common Core test 76

School Year
Count (students who
took both Spring and Fall
assessments)
Fall Mean RIT
Spring Mean RIT
Actual Mean
Growth
Projected Mean
Growth
Percent of
Projection
Percent Meeting Projectio
n
2008-09 thru
2010-11 school years
1157 220.3 230.8 10.5 8.0 131.4 66.8
2011-12 and 2012-13 school
years
766 222.5 231.9 9.4 8.0 117.7 61.3
2013-14 and 2014-15 school
years
794 223.8 233.2 9.4 8.0 117.6 60.1
Pre-Common Core test 77

Math RIT Growth Over Time - Grade 6
School
Year
Count (students who
took both
Spring and Fall
assessments)
Fall Mean
RIT
Spring
Mean RIT
Actual
Mean
Growth
Projected
Mean
Growth
Percent of
Projection
Percent
Meeting
Projection
2008-09
thru 2010-
11 school
years
1141 226.2 234.8 8.5 6.0 141.5 67.7
2011-12
and 2012-
13 school
years
776 229.0 235.6 6.5 6.0 108.7 55.5
2013-14
and 2014-
15 school
years
764 228.0 236.6 8.6 6.0 144.0 69.5
Pre-Common Core test

Math RIT Growth Over Time - Grade 7
School
Year
Count (students who
took both
Spring and Fall
assessments)
Fall Mean
RIT
Spring
Mean RIT
Actual
Mean
Growth
Projected
Mean
Growth
Percent of
Projection
Percent
Meeting
Projection
2008-09
thru 2010-
11 school
years
1110 233.7 240.3 6.6 5.0 131.8 62.6
2011-12
and 2012-
13 school
years
778 236.1 242.5 6.4 5.0 127.8 62.3
2013-14
and 2014-
15 school
years
763 234.8 241.6 6.8 5.0 135.1 63.9
Pre-Common Core test

Math RIT Growth Over Time - Grade 8
School
Year
Count (students who
took both
Spring and Fall
assessments)
Fall Mean
RIT
Spring
Mean RIT
Actual
Mean
Growth
Projected
Mean
Growth
Percent of
Projection
Percent
Meeting
Projection
2008-09
thru 2010-
11 school
years
1084 239.9 245.1 5.2 4.0 130.7 60.3
2011-12
and 2012-
13 school
years
777 241.6 246.2 4.6 4.0 114.6 57.8
2013-14
and 2014-
15 school
years
782 241.4 248.0 6.6 4.0 163.9 69.2
Pre-Common Core test

Dual Language
78

How much did the students grow between the Fall and Spring MAP tests?
79

How did the average RIT growth compare to the district averages and the NWEA projections?
80

Did they meet the NWEA Projected Growth?
81

Did they meet the NWEA Projected
Growth in 1st grade?
82

Foreign Language Elementary Students (FLES)
83

FLES Assessment Plan The district utilizes two end of the year assessments to determine the student's’ progress in
their second language acquisition: Student Oral Proficiency Assessment (SOPA) and a Spanish district writing assessment.
SOPA The SOPA is an innovative language proficiency assessment instrument designed in
collaboration with the Center of Applied Linguistics (CAL) that allows students to demonstrate their highest level of performance in oral fluency, grammar vocabulary, and listening comprehension. The assessment is administered at the end of each year.
District Writing Assessment The district writing assessment is used to measure the students’ growth in Spanish using
written communication. The assessment is administered at the end of each year. Student performance is rated using a rubric that analyzes the student’s abilities in producing appropriate vocabulary, language control, and mechanics based on the language proficiency expectations for the grade level.
84

FLES Assessment Plan Continued Assessment Data Analysis Assessment data is analyzed by the teachers and administrative staff to guide instruction in
the following ways: ● Determine the knowledge and skills students have obtained from the current year and
retained from previous learning ● Identify the different learning styles students have and how to address their individual
and collective needs ● Refine teaching goals and modify teaching goals to meet the district FLES objectives
Year 1 - 2013/2014 and beyond Created grade 1 SOPA assessment in collaboration with CAL and a district writing assessment. Assessments were piloted, reviewed and adjustments made for year 2. Each year administer the grade level assessments, while piloting the subsequent year.
Working with CAL to establish appropriate growth measures given our model.
85

English Language Learners (ELL)
86

District Growth Reading MAP - ELL Students 2014-15
Grade Count Fall 2014 Mean RIT
Spring 2015
Mean RIT
Actual Mean
Growth
Projected Mean
Growth
Percent of Projection
Percent Meeting
Projection
KG 78 138.9 150 11.1 15.3 72.5 42.3
1 62 154.3 169.6 15.3 16.6 92.2 45.2
2 91 167.3 182.7 15.4 14.9 103.4 52.7
3 65 182 195.4 13.4 10.1 132.7 73.8
4 40 180.1 193 12.9 8.3 155.4 62.5
5 21 191.9 196.7 4.8 6 80.0 47.6
6 14 195.1 201.7 6.6 4.6 143.5 71.4
7 20 201.4 201.7 0.4 4 10.0 30.0
8 13 204.2 210.8 6.5 4.2 154.8 76.9
Note: This data includes only students who took both the Fall 2014 and Spring 2015 MAP assessments and were identified as ELL in Spring 2015. 87

District Growth Math MAP - ELL Students 2014-15
Grade Count Fall 2014 Mean RIT
Spring 2015
Mean RIT
Actual Mean
Growth
Projected Mean
Growth
Percent of Projection
Percent Meeting
Projection
KG 78 137.4 151.6 14.2 16.9 84.0 41.0
1 62 155.8 175 19.2 17.2 111.6 56.5
2 91 172.3 188.7 16.4 13.9 118.0 68.1
3 66 188.2 199.3 11.2 11.1 100.9 59.1
4 40 191.6 202 10.4 8.3 125.3 70.0
5 21 200.3 209.2 8.9 8 111.3 57.1
6 16 197.4 205.8 8.4 6 140.0 68.8
7 20 205.9 210.4 4.6 4.8 95.8 45.0
8 13 214.3 220.2 5.9 4 147.5 76.9
Note: This data includes only students who took both the Fall 2014 and Spring 2015 MAP assessments and were identified as ELL in Spring 2015. 88

ACCESS Data for ELL Students
*2015 has not been released by the state yet. Preliminary data indicates that 21.2% of our students attained proficiency in 2015.
89
2014 District Performance State Target
ELL’s making progress
69.8% 63.5%
ELL’S Attaining proficiency
18.2% 12%

Pre Kindergarten (Pre- K)
90

Pre Kindergarten (Pre-K) The Early Childhood/Blended/Pre-K program utilizes Teaching Strategies GOLD as
the assessment tool. GOLD is based on 38 research-based objectives that include predictors of school success and are aligned with the Common Core State Standards and early learning standards. The objectives are organized into 10 areas of development and learning.
Individual student progress is shared with parents three times a year. Reports to
parents show typical progressions for each objective through color-coded age bands that are tied to their child's age. In addition, there are "in-between" steps in each progression to allow for emerging skills or to indicate if a child needs support to accomplish a skill or behavior.
91

Special Education
92

Special Education
Students receiving special education services have an Individualized Educational Program (IEP). The IEP has goals which address the unique needs of the student. Progress towards meeting the goals is monitored throughout the year and updated annually.
Important that we continue to meet all students’ academic,
emotional and behavior needs to enable them to reach their full potential. Our expectation is for all students to make progress and to lessen or close the achievement gap.
93

District Growth Reading MAP - SPED Students 2014-15
Grade Count Fall 2014 Mean RIT
Spring 2015
Mean RIT
Actual Mean
Growth
Projected Mean
Growth
Percent of Projection
Percent Meeting
Projection
KG 33 146.3 161.8 15.6 14.7 106.1 57.6
1 25 159.2 175.2 16 16.7 95.8 32.0
2 36 172.5 187.6 15.1 14.2 106.3 61.1
3 31 181 194.8 13.7 10.3 133.0 64.5
4 38 193.7 203.9 10.2 7.3 139.7 65.8
5 32 200.7 207.3 6.6 5.5 120.0 56.3
6 31 208.3 212.3 4 4.2 95.2 48.4
7 37 206.2 212 5.8 3.8 152.6 64.9
8 22 217.7 222 4.3 3.2 134.4 68.2
Note: This data includes only students who took both the Fall 2014 and Spring 2015 MAP assessments and were identified as SPED in Spring 2015. 94

District Growth Math MAP - SPED Students 2014-15
Grade Count Fall 2014 Mean RIT
Spring 2015
Mean RIT
Actual Mean
Growth
Projected Mean
Growth
Percent of Projection
Percent Meeting
Projection
KG 32 147.4 163.6 16.1 15.2 105.9 56.3
1 25 157.5 181.8 24.3 16.9 143.8 80.0
2 36 181.2 197.3 16.1 12.8 125.8 75.0
3 31 194.3 202.9 8.6 10.9 78.9 48.4
4 38 203 213.9 10.9 8.7 125.3 71.1
5 31 213.4 220.8 7.5 8 93.8 54.8
6 31 217.3 223.6 6.3 6 105.0 48.4
7 39 215 220.7 5.6 4.9 114.3 66.7
8 22 222.3 228.1 5.9 4 147.5 72.7
Note: This data includes only students who took both the Fall 2014 and Spring 2015 MAP assessments and were identified as SPED in Spring 2015. 95

Economically Disadvantage Free Reduced Lunch (FRL)
96

Grade Count Fall 2014 Mean RIT
Spring 2015 Mean RIT
Actual Mean
Growth
Projected Mean
Growth
Percent of Projection
Percent Meeting
Projection
KG 84 139.6 151.4 11.8 15.3 77.1 42.9
1 84 156.1 171.7 15.5 16.7 92.8 42.9
2 111 168.9 184.7 15.8 14.7 107.5 58.6
3 86 186.3 198.5 12.2 9.7 125.8 67.4
4 89 191.9 201.3 9.4 7.4 127.0 57.3
5 75 202.3 208.6 6.3 5.4 116.7 62.7
6 81 209.9 214.1 4.2 4.1 102.4 55.6
7 88 211.4 215.5 4.1 3.6 113.9 53.4
8 81 219.1 222.9 3.8 3.2 118.8 53.1
Note: This data includes only students who took both the Fall 2014 and Spring 2015 MAP assessments and were identified as FRL in Spring 2015. 97

Grade Count Fall 2014 Mean RIT
Spring 2015 Mean RIT
Actual Mean
Growth
Projected Mean
Growth
Percent of Projection
Percent Meeting
Projection
KG 84 138.8 153.5 14.7 16.7 88.0 44.0
1 84 157.8 175.5 17.7 16.8 105.4 53.6
2 110 173.9 190 16 13.7 116.8 66.4
3 86 191.4 201.6 10.1 11 91.8 54.7
4 89 199 209.3 10.3 8.5 121.2 68.5
5 75 210.2 218 7.7 8 96.3 53.3
6 82 215 222.8 7.8 6 130.0 64.6
7 89 219 224.7 5.8 4.9 118.4 66.3
8 82 228.3 232.9 4.6 4 115.0 58.5
Note: This data includes only students who took both the Fall 2014 and Spring 2015 MAP assessments and were identified as FRL in Spring 2015. 98

Advanced and Enriched Curriculum (AEC)
99

Grade Count Fall 2014 Mean RIT
Spring 2015 Mean RIT
Actual Mean
Growth
Projected Mean
Growth
Percent of Projection
Percent Meeting
Projection
4 26 238.5 251.2 12.8 9.6 133.3 57.7
5 54 247.9 257.4 9.5 8 118.8 60.4
Note: This data includes only students who took both the Fall 2014 and Spring 2015 MAP assessments and were identified as AEC in Spring 2015. 100

2015-2016 Presentation Updates October 26, 2015 February 8, 2016 June 27, 2016 *tentative dates subject to change
101