2014-2015 district annual report
TRANSCRIPT

1420 Lakeville Road • Oxford, MI 48367 • 248.969.1800 • Fax: 248.969.1840Emergency Phone Line: 248.969.5070 • www.oxfordschools.org/oms
2014-2015 District Annual ReportOXFORD MIDDLE SCHOOL
MissionTogether with parents and com-munity, Oxford Middle School will create a positive environment which promotes academic achievement, good citizenship, student responsibil-ity, and lifelong learning.
Student ProfileAn Oxford graduate will be:•Aknowledgeableindividual•Aninformationorganizer•Areasonerandproblemsolver•Aneffectivecommunicator•Aresponsiblecommunity member•Acontinuouslearner
AdministrationWilliamC.Skilling,Ph.D.,Superintendent
NancyLatowski,AssistantSuperintendent of Human Resoursces
PamelaAnstey,AssistantSuperintendent for Business & Finance
Ken Weaver, Assistant Superintendent for Curriculum and Instruction
DeniseSweat,AssistantSuperintendent of Student Services
Board of EducationJimReis PresidentCarolMitchell VicePresidentDanD’Alessandro TreasurerKimShumaker SecretaryJoyce Brasington TrusteeMikeSchweig TrusteeMarkStepek Trustee
Welcome from the PrincipalsWe are pleased to present you with the Annual Education Report (AER) which provides key information on the 2014-2015 education progress for Oxford Middle School.
The AER addresses the complex reporting information required by federal and state laws. The school’s report contains information about student assessment, accountability and teacher quality. If you have any questions about the AER, please contact Dacia Beazley, Principal of Oxford Middle School, for assistance.
The AER is available for you to review electronically by visiting the following web site: www.oxfordschools.org or you may review a copy in the main office at your child’s school.
In reviewing the data from the past years’ testing cycles, Oxford Middle School students exceed the state averages in all Michigan testing areas. However, we are concerned for students who continue to struggle in the areas of math and reading. At OMS, we have developed a process for identifying students for intervention in those areas.
Our 1,192 students in grades 6-8 were given many opportunities to grow academically, socially, physically and emotionally with support from staff, parents and the community. As an IB World School, teachers and staff have developed core, exploratory and an Advisory curriculum to meet the individual needs of every student. Through this framework, students are also provided with opportunities to prepare them for an ever-changing global world. Together we are best able to provide for the development of a well-rounded student.
Parental involvement is vital to the success of all students and is a key component of the culture at Oxford Middle School. Parents are involved through an active Parent-Teacher Organization, many opportunities for volunteering for grade-level activities and trips, and constant monitoring of their child’s education. Parents continue to access grades and attendance through PowerSchool. Teachers communicate daily homework assignments and upcoming classroom activities through Haiku, our online learning management system.
We invite you to visit our school where caring, committed adults are focused on the growth, needs and development of our students.
Dacia Beazley, PrincipalMaryanne Moriconi, Assistant PrincipalCarl Sproul, Assistant Principal

2014-2015 District Annual Report Oxford Middle School2
Process for Assigning Pupils to the SchoolOMS serves students living within the district boundaries, as the only middle school in the District. However, Oxford Community Schools is open for School of Choice students, based on availability year-to-year in grades 6-8.
Status of 3-5 Year School Improvement PlanThe School Improvement process at Oxford Middle School is led by school leadership teams and is accredited by AdvancED. The leadership teams have identified improvement goals and strategies to achieve the building and District goals. The 2014-15 school year is the fourth year in the AdvancED school improvement and accreditation process. During the following year, 2015-16, the district expects the accreditation external review, which will provide feedback on the progress toward the following goals:
• Students will improve their reading performance• Students will improve their writing performance• Students will improve their mathematical skills and knowledge• Students will improve their skills and knowledge within social studies• Students will improve their skills and knowledge within science• Students will enhance their preparation for success in a global environment
Strategies are implemented to reach these goals based on researched best practices. International Baccalaureate, the Middle Years Programme, continues to provide the foundation for our staff development. Teachers in all grades and subjects receive training in IB, with a focus in assessment, grading and Approaches to Learning (ATLs). Additional staff development has been provided in the areas of technology, common assessment development, special education teaching in math, Reading and Writing Connections, and the core areas of math, English/Language Arts, and science.
Specialized SchoolsOxford Middle School provides educational programs, services and support to certified special education studentsat our school. During the 2014-15 school year, we had students who required specialized services outside of Oxford Community Schools. These students attended schools in Waterford School District and Bloomfield Hills School District.
Students at Oxford Middle School have the opportunity to take online courses provided by Oxford Virtual Academy, our online distance learning school.
Academic Core CurriculumA core curriculum includes all grades, kindergarten through twelve, and describes what a student will know and be able to do for each subject area. All Oxford Schools curricula are based upon the Michigan Academic Standards. To access information on the curriculum, please visit our website: http://www.oxfordschools.org. Refer to the Departments tab, then Curriculum and Instruction.
Parental InvolvementParents are a student’s first and most important teachers.
2013-2014, 270 (23)% of parents/guardians attended spring Parent Teacher Conferences and 624 (52%) attended fall Parent Teacher Conferences.
2014-2015, 292 (27%) of parents/guardians attended spring Parent Teacher Conferences and 618 (56%) attended fall Parent Teacher Conferences.
OMS Web Leaders
OMS Students participating in robotics competition

04/01/2016
Annual Education ReportOxford Middle School
M-STEP Grades 3-8
Subject Grade TestingGroup
School Year State PercentStudentsProficient
DistrictPercentStudentsProficient
SchoolPercentStudentsProficient
PercentAdvanced
PercentProficient
PercentPartiallyProficient
Percent NotProficient
ELA (M-STEP)/Reading(MEAP)
5th GradeContent
All Students 2013-14 71.5% 81.5% 81.5% 29.3% 52.2% 12.1% 6.4%
ELA (M-STEP)/Reading(MEAP)
5th GradeContent
AmericanIndian
2013-14 64.6% <10 <10 <10 <10 <10 <10
ELA (M-STEP)/Reading(MEAP)
5th GradeContent
AfricanAmerican
2013-14 50% 42.9% 50% 8.3% 41.7% 41.7% 8.3%
ELA (M-STEP)/Reading(MEAP)
5th GradeContent
Asian 2013-14 82.4% <10 <10 <10 <10 <10 <10
ELA (M-STEP)/Reading(MEAP)
5th GradeContent
Hispanic ofAny Race
2013-14 60.1% 100% 100% 35.7% 64.3% 0% 0%
ELA (M-STEP)/Reading(MEAP)
5th GradeContent
NativeHawaiian orOther PacificIslander
2013-14 83.1% <10 <10 <10 <10 <10 <10
ELA (M-STEP)/Reading(MEAP)
5th GradeContent
Two or MoreRaces
2013-14 70.4% <10 <10 <10 <10 <10 <10
ELA (M-STEP)/Reading(MEAP)
5th GradeContent
White 2013-14 77.7% 82.3% 82.1% 29.6% 52.4% 11.7% 6.3%
ELA (M-STEP)/Reading(MEAP)
5th GradeContent
Female 2013-14 74.7% 83.1% 82.9% 29.3% 53.7% 11.2% 5.9%
Page 1 of A service of the Center for Educational Performance and Information (CEPI) 44

04/01/2016
Annual Education ReportOxford Middle School
M-STEP Grades 3-8
Subject Grade TestingGroup
School Year State PercentStudentsProficient
DistrictPercentStudentsProficient
SchoolPercentStudentsProficient
PercentAdvanced
PercentProficient
PercentPartiallyProficient
Percent NotProficient
ELA (M-STEP)/Reading(MEAP)
5th GradeContent
Male 2013-14 68.4% 79.8% 80.1% 29.4% 50.7% 12.9% 7%
ELA (M-STEP)/Reading(MEAP)
5th GradeContent
EconomicallyDisadvantaged
2013-14 59.2% 65.1% 66.3% 16.3% 50% 20% 13.8%
ELA (M-STEP)/Reading(MEAP)
5th GradeContent
EnglishLanguageLearners
2013-14 36.8% <10 <10 <10 <10 <10 <10
ELA (M-STEP)/Reading(MEAP)
5th GradeContent
Students WithDisabilities
2013-14 33.6% 46.7% 44.8% 3.4% 41.4% 24.1% 31%
ELA (M-STEP)/Reading(MEAP)
6th GradeContent
All Students 2014-15 44.7% 60.3% 61% 15.4% 45.5% 25.3% 13.8%
ELA (M-STEP)/Reading(MEAP)
6th GradeContent
All Students 2013-14 60.4% 74.5% 73.8% 25.6% 48.2% 17.9% 8.3%
ELA (M-STEP)/Reading(MEAP)
6th GradeContent
AfricanAmerican
2014-15 20% <10 <10 <10 <10 <10 <10
ELA (M-STEP)/Reading(MEAP)
6th GradeContent
AfricanAmerican
2013-14 34.6% 58.3% <10 <10 <10 <10 <10
ELA (M-STEP)/Reading(MEAP)
6th GradeContent
Asian 2014-15 70.9% <10 <10 <10 <10 <10 <10
Page 2 of A service of the Center for Educational Performance and Information (CEPI) 44

04/01/2016
Annual Education ReportOxford Middle School
M-STEP Grades 3-8
Subject Grade TestingGroup
School Year State PercentStudentsProficient
DistrictPercentStudentsProficient
SchoolPercentStudentsProficient
PercentAdvanced
PercentProficient
PercentPartiallyProficient
Percent NotProficient
ELA (M-STEP)/Reading(MEAP)
6th GradeContent
Asian 2013-14 75.2% <10 <10 <10 <10 <10 <10
ELA (M-STEP)/Reading(MEAP)
6th GradeContent
Hispanic ofAny Race
2014-15 32% 28.6% 28.6% 0% 28.6% 35.7% 35.7%
ELA (M-STEP)/Reading(MEAP)
6th GradeContent
Hispanic ofAny Race
2013-14 46.8% 80% <10 <10 <10 <10 <10
ELA (M-STEP)/Reading(MEAP)
6th GradeContent
NativeHawaiian orOther PacificIslander
2014-15 48.2% <10 <10 <10 <10 <10 <10
ELA (M-STEP)/Reading(MEAP)
6th GradeContent
Two or MoreRaces
2014-15 42.4% 50% <10 <10 <10 <10 <10
ELA (M-STEP)/Reading(MEAP)
6th GradeContent
Two or MoreRaces
2013-14 59% <10 <10 <10 <10 <10 <10
ELA (M-STEP)/Reading(MEAP)
6th GradeContent
White 2014-15 51.2% 61.5% 62.1% 16.3% 45.8% 25.4% 12.5%
ELA (M-STEP)/Reading(MEAP)
6th GradeContent
White 2013-14 67.8% 75.3% 74.8% 26.5% 48.4% 17% 8.2%
ELA (M-STEP)/Reading(MEAP)
6th GradeContent
Female 2014-15 51.1% 68.5% 69.4% 22.3% 47.2% 20.7% 9.8%
Page 3 of A service of the Center for Educational Performance and Information (CEPI) 44

04/01/2016
Annual Education ReportOxford Middle School
M-STEP Grades 3-8
Subject Grade TestingGroup
School Year State PercentStudentsProficient
DistrictPercentStudentsProficient
SchoolPercentStudentsProficient
PercentAdvanced
PercentProficient
PercentPartiallyProficient
Percent NotProficient
ELA (M-STEP)/Reading(MEAP)
6th GradeContent
Female 2013-14 62.5% 73.6% 72.8% 24.7% 48.1% 21% 6.2%
ELA (M-STEP)/Reading(MEAP)
6th GradeContent
Male 2014-15 38.6% 50.9% 50.9% 7.4% 43.6% 30.7% 18.4%
ELA (M-STEP)/Reading(MEAP)
6th GradeContent
Male 2013-14 58.4% 75.3% 74.7% 26.4% 48.3% 14.9% 10.3%
ELA (M-STEP)/Reading(MEAP)
6th GradeContent
EconomicallyDisadvantaged
2014-15 29.1% 35.6% 36.2% 5.8% 30.4% 33.3% 30.4%
ELA (M-STEP)/Reading(MEAP)
6th GradeContent
EconomicallyDisadvantaged
2013-14 45.4% 62% 61.3% 17.7% 43.5% 25.8% 12.9%
ELA (M-STEP)/Reading(MEAP)
6th GradeContent
EnglishLanguageLearners
2014-15 16.2% <10 <10 <10 <10 <10 <10
ELA (M-STEP)/Reading(MEAP)
6th GradeContent
EnglishLanguageLearners
2013-14 23% <10 <10 <10 <10 <10 <10
ELA (M-STEP)/Reading(MEAP)
6th GradeContent
Students WithDisabilities
2014-15 10.3% 15.8% 16.7% 0% 16.7% 36.1% 47.2%
ELA (M-STEP)/Reading(MEAP)
6th GradeContent
Students WithDisabilities
2013-14 22.9% 22.2% 23.5% 5.9% 17.6% 52.9% 23.5%
Page 4 of A service of the Center for Educational Performance and Information (CEPI) 44

04/01/2016
Annual Education ReportOxford Middle School
M-STEP Grades 3-8
Subject Grade TestingGroup
School Year State PercentStudentsProficient
DistrictPercentStudentsProficient
SchoolPercentStudentsProficient
PercentAdvanced
PercentProficient
PercentPartiallyProficient
Percent NotProficient
ELA (M-STEP)/Reading(MEAP)
7th GradeContent
All Students 2014-15 49.1% 59% 60.1% 17.8% 42.3% 25.4% 14.4%
ELA (M-STEP)/Reading(MEAP)
7th GradeContent
All Students 2013-14 72.7% 86.4% 85.7% 41.3% 44.4% 11% 3.4%
ELA (M-STEP)/Reading(MEAP)
7th GradeContent
AmericanIndian
2014-15 39.3% <10 <10 <10 <10 <10 <10
ELA (M-STEP)/Reading(MEAP)
7th GradeContent
AfricanAmerican
2014-15 25.2% 8.3% 10% 10% 0% 50% 40%
ELA (M-STEP)/Reading(MEAP)
7th GradeContent
AfricanAmerican
2013-14 49.7% 83.3% <10 <10 <10 <10 <10
ELA (M-STEP)/Reading(MEAP)
7th GradeContent
Asian 2014-15 73.9% <10 <10 <10 <10 <10 <10
ELA (M-STEP)/Reading(MEAP)
7th GradeContent
Asian 2013-14 84.2% <10 <10 <10 <10 <10 <10
ELA (M-STEP)/Reading(MEAP)
7th GradeContent
Hispanic ofAny Race
2014-15 35.4% 53.3% 61.5% 15.4% 46.2% 23.1% 15.4%
ELA (M-STEP)/Reading(MEAP)
7th GradeContent
Hispanic ofAny Race
2013-14 61.8% 100% 100% 30.8% 69.2% 0% 0%
Page 5 of A service of the Center for Educational Performance and Information (CEPI) 44

04/01/2016
Annual Education ReportOxford Middle School
M-STEP Grades 3-8
Subject Grade TestingGroup
School Year State PercentStudentsProficient
DistrictPercentStudentsProficient
SchoolPercentStudentsProficient
PercentAdvanced
PercentProficient
PercentPartiallyProficient
Percent NotProficient
ELA (M-STEP)/Reading(MEAP)
7th GradeContent
NativeHawaiian orOther PacificIslander
2014-15 61.2% <10 <10 <10 <10 <10 <10
ELA (M-STEP)/Reading(MEAP)
7th GradeContent
NativeHawaiian orOther PacificIslander
2013-14 72.2% <10 <10 <10 <10 <10 <10
ELA (M-STEP)/Reading(MEAP)
7th GradeContent
Two or MoreRaces
2014-15 47.9% <10 <10 <10 <10 <10 <10
ELA (M-STEP)/Reading(MEAP)
7th GradeContent
Two or MoreRaces
2013-14 72.5% <10 <10 <10 <10 <10 <10
ELA (M-STEP)/Reading(MEAP)
7th GradeContent
White 2014-15 55.4% 60.8% 61.5% 17.6% 43.9% 24.9% 13.6%
ELA (M-STEP)/Reading(MEAP)
7th GradeContent
White 2013-14 79.2% 86.7% 85.7% 42.1% 43.6% 11.2% 3.1%
ELA (M-STEP)/Reading(MEAP)
7th GradeContent
Female 2014-15 56.3% 64% 66.8% 21.5% 45.4% 25.4% 7.8%
ELA (M-STEP)/Reading(MEAP)
7th GradeContent
Female 2013-14 74.6% 88.7% 87.8% 43.1% 44.7% 9.6% 2.7%
ELA (M-STEP)/Reading(MEAP)
7th GradeContent
Male 2014-15 42.2% 53.9% 53.4% 14.2% 39.2% 25.5% 21.1%
Page 6 of A service of the Center for Educational Performance and Information (CEPI) 44

04/01/2016
Annual Education ReportOxford Middle School
M-STEP Grades 3-8
Subject Grade TestingGroup
School Year State PercentStudentsProficient
DistrictPercentStudentsProficient
SchoolPercentStudentsProficient
PercentAdvanced
PercentProficient
PercentPartiallyProficient
Percent NotProficient
ELA (M-STEP)/Reading(MEAP)
7th GradeContent
Male 2013-14 70.9% 83.8% 83.3% 39.3% 44% 12.5% 4.2%
ELA (M-STEP)/Reading(MEAP)
7th GradeContent
EconomicallyDisadvantaged
2014-15 33.2% 29.7% 31.3% 6.3% 25% 35% 33.8%
ELA (M-STEP)/Reading(MEAP)
7th GradeContent
EconomicallyDisadvantaged
2013-14 60.1% 75% 75% 31.7% 43.3% 18.3% 6.7%
ELA (M-STEP)/Reading(MEAP)
7th GradeContent
EnglishLanguageLearners
2014-15 18.9% <10 <10 <10 <10 <10 <10
ELA (M-STEP)/Reading(MEAP)
7th GradeContent
EnglishLanguageLearners
2013-14 35.5% <10 <10 <10 <10 <10 <10
ELA (M-STEP)/Reading(MEAP)
7th GradeContent
Students WithDisabilities
2014-15 10.9% 13.5% 12.1% 0% 12.1% 45.5% 42.4%
ELA (M-STEP)/Reading(MEAP)
7th GradeContent
Students WithDisabilities
2013-14 33.9% 42.1% 42.1% 0% 42.1% 36.8% 21.1%
ELA (M-STEP)/Reading(MEAP)
8th GradeContent
All Students 2014-15 47.6% 63.3% 64.5% 18.2% 46.3% 24.7% 10.8%
ELA (M-STEP)/Reading(MEAP)
8th GradeContent
AfricanAmerican
2014-15 23.7% <10 <10 <10 <10 <10 <10
Page 7 of A service of the Center for Educational Performance and Information (CEPI) 44

04/01/2016
Annual Education ReportOxford Middle School
M-STEP Grades 3-8
Subject Grade TestingGroup
School Year State PercentStudentsProficient
DistrictPercentStudentsProficient
SchoolPercentStudentsProficient
PercentAdvanced
PercentProficient
PercentPartiallyProficient
Percent NotProficient
ELA (M-STEP)/Reading(MEAP)
8th GradeContent
Asian 2014-15 71.4% <10 <10 <10 <10 <10 <10
ELA (M-STEP)/Reading(MEAP)
8th GradeContent
Hispanic ofAny Race
2014-15 36.2% 53.8% 54.5% 27.3% 27.3% 18.2% 27.3%
ELA (M-STEP)/Reading(MEAP)
8th GradeContent
Two or MoreRaces
2014-15 44.7% 33.3% 30% 0% 30% 70% 0%
ELA (M-STEP)/Reading(MEAP)
8th GradeContent
White 2014-15 53.8% 65.4% 66.6% 18.6% 47.9% 23.3% 10.1%
ELA (M-STEP)/Reading(MEAP)
8th GradeContent
Female 2014-15 54.2% 68.3% 69.9% 24.7% 45.2% 22.9% 7.2%
ELA (M-STEP)/Reading(MEAP)
8th GradeContent
Male 2014-15 41.2% 58.7% 59.7% 12.4% 47.3% 26.3% 14%
ELA (M-STEP)/Reading(MEAP)
8th GradeContent
EconomicallyDisadvantaged
2014-15 31.8% 39.2% 38.2% 11.8% 26.5% 39.7% 22.1%
ELA (M-STEP)/Reading(MEAP)
8th GradeContent
EnglishLanguageLearners
2014-15 19.3% <10 <10 <10 <10 <10 <10
ELA (M-STEP)/Reading(MEAP)
8th GradeContent
Students WithDisabilities
2014-15 9.8% 11.4% 9.4% 0% 9.4% 43.8% 46.9%
Page 8 of A service of the Center for Educational Performance and Information (CEPI) 44

04/01/2016
Annual Education ReportOxford Middle School
M-STEP Grades 3-8
Subject Grade TestingGroup
School Year State PercentStudentsProficient
DistrictPercentStudentsProficient
SchoolPercentStudentsProficient
PercentAdvanced
PercentProficient
PercentPartiallyProficient
Percent NotProficient
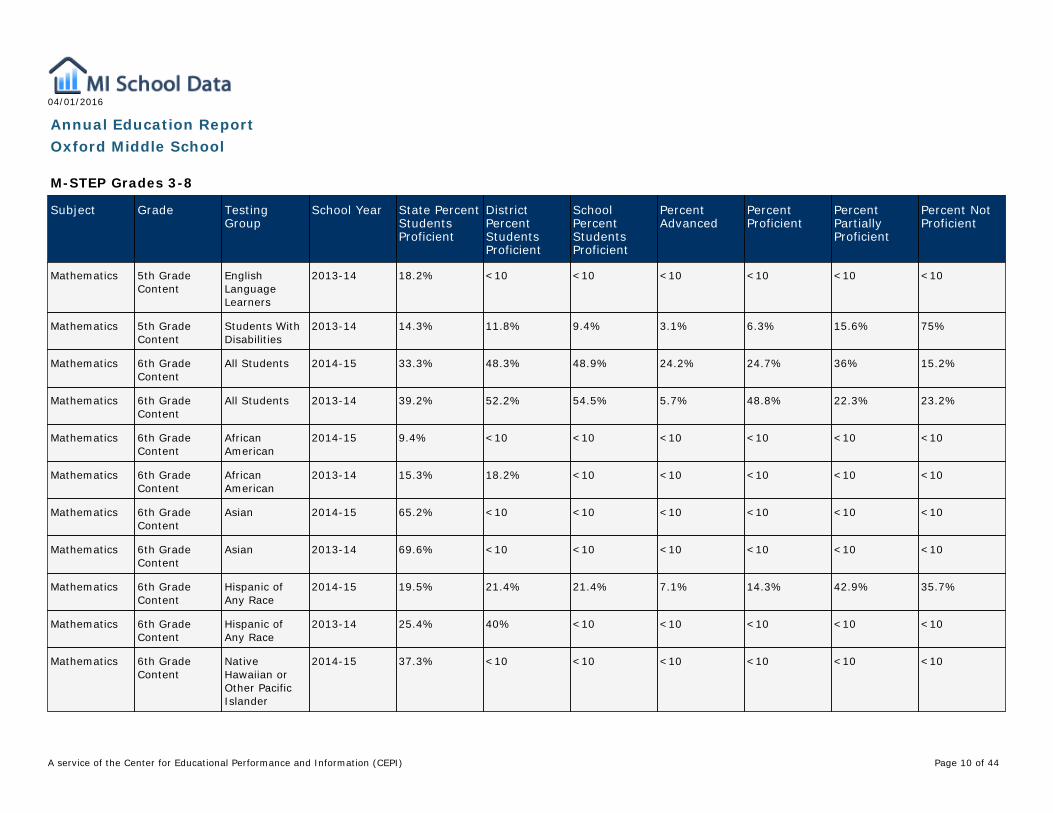
Mathematics 5th GradeContent
All Students 2013-14 41.5% 57.5% 59.1% 17.2% 41.9% 17.4% 23.5%
Mathematics 5th GradeContent
AmericanIndian
2013-14 27.7% <10 <10 <10 <10 <10 <10
Mathematics 5th GradeContent
AfricanAmerican
2013-14 17.6% 7.1% 8.3% 8.3% 0% 16.7% 75%
Mathematics 5th GradeContent
Asian 2013-14 73.2% <10 <10 <10 <10 <10 <10
Mathematics 5th GradeContent
Hispanic ofAny Race
2013-14 27.6% 60% 64.3% 7.1% 57.1% 7.1% 28.6%
Mathematics 5th GradeContent
NativeHawaiian orOther PacificIslander
2013-14 58.3% <10 <10 <10 <10 <10 <10
Mathematics 5th GradeContent
Two or MoreRaces
2013-14 39.1% <10 <10 <10 <10 <10 <10
Mathematics 5th GradeContent
White 2013-14 47.6% 59.4% 60.5% 17.6% 43% 17.8% 21.6%
Mathematics 5th GradeContent
Female 2013-14 40.9% 55.2% 57.8% 14.1% 43.7% 18.9% 23.3%
Mathematics 5th GradeContent
Male 2013-14 42% 59.8% 60.4% 20.3% 40.1% 15.8% 23.8%
Mathematics 5th GradeContent
EconomicallyDisadvantaged
2013-14 25.9% 27.3% 28% 2.4% 25.6% 19.5% 52.4%
Page 9 of A service of the Center for Educational Performance and Information (CEPI) 44
04/01/2016
Annual Education ReportOxford Middle School
M-STEP Grades 3-8
Subject Grade TestingGroup
School Year State PercentStudentsProficient
DistrictPercentStudentsProficient
SchoolPercentStudentsProficient
PercentAdvanced
PercentProficient
PercentPartiallyProficient
Percent NotProficient
Mathematics 5th GradeContent
EnglishLanguageLearners
2013-14 18.2% <10 <10 <10 <10 <10 <10
Mathematics 5th GradeContent
Students WithDisabilities
2013-14 14.3% 11.8% 9.4% 3.1% 6.3% 15.6% 75%
Mathematics 6th GradeContent
All Students 2014-15 33.3% 48.3% 48.9% 24.2% 24.7% 36% 15.2%
Mathematics 6th GradeContent
All Students 2013-14 39.2% 52.2% 54.5% 5.7% 48.8% 22.3% 23.2%
Mathematics 6th GradeContent
AfricanAmerican
2014-15 9.4% <10 <10 <10 <10 <10 <10
Mathematics 6th GradeContent
AfricanAmerican
2013-14 15.3% 18.2% <10 <10 <10 <10 <10
Mathematics 6th GradeContent
Asian 2014-15 65.2% <10 <10 <10 <10 <10 <10
Mathematics 6th GradeContent
Asian 2013-14 69.6% <10 <10 <10 <10 <10 <10
Mathematics 6th GradeContent
Hispanic ofAny Race
2014-15 19.5% 21.4% 21.4% 7.1% 14.3% 42.9% 35.7%
Mathematics 6th GradeContent
Hispanic ofAny Race
2013-14 25.4% 40% <10 <10 <10 <10 <10
Mathematics 6th GradeContent
NativeHawaiian orOther PacificIslander
2014-15 37.3% <10 <10 <10 <10 <10 <10
Page 10 of A service of the Center for Educational Performance and Information (CEPI) 44

04/01/2016
Annual Education ReportOxford Middle School
M-STEP Grades 3-8
Subject Grade TestingGroup
School Year State PercentStudentsProficient
DistrictPercentStudentsProficient
SchoolPercentStudentsProficient
PercentAdvanced
PercentProficient
PercentPartiallyProficient
Percent NotProficient
Mathematics 6th GradeContent
Two or MoreRaces
2014-15 29.3% 30% <10 <10 <10 <10 <10
Mathematics 6th GradeContent
Two or MoreRaces
2013-14 34.8% <10 <10 <10 <10 <10 <10
Mathematics 6th GradeContent
White 2014-15 39.3% 49.9% 50.2% 24.1% 26% 36.4% 13.5%
Mathematics 6th GradeContent
White 2013-14 45.4% 54% 56% 6.2% 49.8% 21.8% 22.1%
Mathematics 6th GradeContent
Female 2014-15 34.1% 51% 51.8% 28.5% 23.3% 35.8% 12.4%
Mathematics 6th GradeContent
Female 2013-14 39.9% 48.9% 51.9% 4.9% 46.9% 23.5% 24.7%
Mathematics 6th GradeContent
Male 2014-15 32.5% 45.1% 45.4% 19% 26.4% 36.2% 18.4%
Mathematics 6th GradeContent
Male 2013-14 38.5% 55.3% 56.9% 6.3% 50.6% 21.3% 21.8%
Mathematics 6th GradeContent
EconomicallyDisadvantaged
2014-15 17.6% 23.3% 24.6% 7.2% 17.4% 46.4% 29%
Mathematics 6th GradeContent
EconomicallyDisadvantaged
2013-14 23.5% 26.8% 30.6% 4.8% 25.8% 25.8% 43.5%
Mathematics 6th GradeContent
EnglishLanguageLearners
2014-15 11.5% <10 <10 <10 <10 <10 <10
Mathematics 6th GradeContent
EnglishLanguageLearners
2013-14 14.5% <10 <10 <10 <10 <10 <10
Page 11 of A service of the Center for Educational Performance and Information (CEPI) 44

04/01/2016
Annual Education ReportOxford Middle School
M-STEP Grades 3-8
Subject Grade TestingGroup
School Year State PercentStudentsProficient
DistrictPercentStudentsProficient
SchoolPercentStudentsProficient
PercentAdvanced
PercentProficient
PercentPartiallyProficient
Percent NotProficient
Mathematics 6th GradeContent
Students WithDisabilities
2014-15 7.8% 10.5% 11.1% 5.6% 5.6% 33.3% 55.6%
Mathematics 6th GradeContent
Students WithDisabilities
2013-14 10.4% 11.1% 11.8% 0% 11.8% 23.5% 64.7%
Mathematics 7th GradeContent
All Students 2014-15 33.3% 50% 51.2% 23.3% 27.9% 33.6% 15.2%
Mathematics 7th GradeContent
All Students 2013-14 34.5% 52.4% 53.5% 9.3% 44.2% 27.2% 19.3%
Mathematics 7th GradeContent
AmericanIndian
2014-15 22% <10 <10 <10 <10 <10 <10
Mathematics 7th GradeContent
AfricanAmerican
2014-15 10.6% 8.3% 10% 10% 0% 20% 70%
Mathematics 7th GradeContent
AfricanAmerican
2013-14 11.4% 9.1% <10 <10 <10 <10 <10
Mathematics 7th GradeContent
Asian 2014-15 66.4% <10 <10 <10 <10 <10 <10
Mathematics 7th GradeContent
Asian 2013-14 66.7% <10 <10 <10 <10 <10 <10
Mathematics 7th GradeContent
Hispanic ofAny Race
2014-15 19.3% 53.3% 61.5% 15.4% 46.2% 15.4% 23.1%
Mathematics 7th GradeContent
Hispanic ofAny Race
2013-14 20.4% 38.5% 38.5% 0% 38.5% 46.2% 15.4%
Mathematics 7th GradeContent
NativeHawaiian orOther PacificIslander
2014-15 41.8% <10 <10 <10 <10 <10 <10
Page 12 of A service of the Center for Educational Performance and Information (CEPI) 44

04/01/2016
Annual Education ReportOxford Middle School
M-STEP Grades 3-8
Subject Grade TestingGroup
School Year State PercentStudentsProficient
DistrictPercentStudentsProficient
SchoolPercentStudentsProficient
PercentAdvanced
PercentProficient
PercentPartiallyProficient
Percent NotProficient
Mathematics 7th GradeContent
NativeHawaiian orOther PacificIslander
2013-14 46.4% <10 <10 <10 <10 <10 <10
Mathematics 7th GradeContent
Two or MoreRaces
2014-15 29.2% <10 <10 <10 <10 <10 <10
Mathematics 7th GradeContent
Two or MoreRaces
2013-14 31.5% <10 <10 <10 <10 <10 <10
Mathematics 7th GradeContent
White 2014-15 39% 51.1% 51.7% 23.3% 28.4% 34.9% 13.4%
Mathematics 7th GradeContent
White 2013-14 40.5% 53.6% 54.5% 10% 44.5% 26.3% 19.1%
Mathematics 7th GradeContent
Female 2014-15 33% 48.4% 51.2% 22.9% 28.3% 34.6% 14.1%
Mathematics 7th GradeContent
Female 2013-14 33.8% 49.3% 50.8% 8.1% 42.7% 29.2% 20%
Mathematics 7th GradeContent
Male 2014-15 33.5% 51.6% 51.2% 23.6% 27.6% 32.5% 16.3%
Mathematics 7th GradeContent
Male 2013-14 35.3% 55.9% 56.5% 10.7% 45.8% 25% 18.5%
Mathematics 7th GradeContent
EconomicallyDisadvantaged
2014-15 17.8% 20.4% 21.3% 2.5% 18.8% 40% 38.8%
Mathematics 7th GradeContent
EconomicallyDisadvantaged
2013-14 18.7% 33.9% 34.5% 1.7% 32.8% 27.6% 37.9%
Page 13 of A service of the Center for Educational Performance and Information (CEPI) 44

04/01/2016
Annual Education ReportOxford Middle School
M-STEP Grades 3-8
Subject Grade TestingGroup
School Year State PercentStudentsProficient
DistrictPercentStudentsProficient
SchoolPercentStudentsProficient
PercentAdvanced
PercentProficient
PercentPartiallyProficient
Percent NotProficient
Mathematics 7th GradeContent
EnglishLanguageLearners
2014-15 12% <10 <10 <10 <10 <10 <10
Mathematics 7th GradeContent
EnglishLanguageLearners
2013-14 12.3% <10 <10 <10 <10 <10 <10
Mathematics 7th GradeContent
Students WithDisabilities
2014-15 6.5% 10.5% 9.1% 0% 9.1% 33.3% 57.6%
Mathematics 7th GradeContent
Students WithDisabilities
2013-14 8.2% 17.6% 17.6% 0% 17.6% 17.6% 64.7%
Mathematics 8th GradeContent
All Students 2014-15 32.2% 49.1% 52% 29.5% 22.4% 25.6% 22.4%
Mathematics 8th GradeContent
AfricanAmerican
2014-15 9.7% <10 <10 <10 <10 <10 <10
Mathematics 8th GradeContent
Asian 2014-15 65.5% <10 <10 <10 <10 <10 <10
Mathematics 8th GradeContent
Hispanic ofAny Race
2014-15 18.9% 23.1% 27.3% 18.2% 9.1% 45.5% 27.3%
Mathematics 8th GradeContent
Two or MoreRaces
2014-15 28.5% 25% 30% 10% 20% 30% 40%
Mathematics 8th GradeContent
White 2014-15 37.7% 51.3% 53.9% 30.6% 23.3% 25.2% 20.8%
Mathematics 8th GradeContent
Female 2014-15 32.6% 47.8% 51.8% 28.3% 23.5% 26.5% 21.7%
Mathematics 8th GradeContent
Male 2014-15 31.8% 50.2% 52.2% 30.6% 21.5% 24.7% 23.1%
Page 14 of A service of the Center for Educational Performance and Information (CEPI) 44

04/01/2016
Annual Education ReportOxford Middle School
M-STEP Grades 3-8
Subject Grade TestingGroup
School Year State PercentStudentsProficient
DistrictPercentStudentsProficient
SchoolPercentStudentsProficient
PercentAdvanced
PercentProficient
PercentPartiallyProficient
Percent NotProficient
Mathematics 8th GradeContent
EconomicallyDisadvantaged
2014-15 17% 31.1% 33.8% 11.8% 22.1% 16.2% 50%
Mathematics 8th GradeContent
EnglishLanguageLearners
2014-15 12.2% <10 <10 <10 <10 <10 <10
Mathematics 8th GradeContent
Students WithDisabilities
2014-15 5.1% 8.6% 9.4% 3.1% 6.3% 21.9% 68.8%
Science 7th GradeContent
All Students 2014-15 22.7% 39.5% 41.1% 13% 28.1% 28.4% 30.6%
Science 7th GradeContent
All Students 2013-14 19.8% 21.1% 21.6% 6.4% 15.2% 34.1% 44.3%
Science 7th GradeContent
AmericanIndian
2014-15 16.9% <10 <10 <10 <10 <10 <10
Science 7th GradeContent
AfricanAmerican
2014-15 5% 8.3% 10% 10% 0% 10% 80%
Science 7th GradeContent
AfricanAmerican
2013-14 3.9% 0% 0% 0% 0% 30% 70%
Science 7th GradeContent
Asian 2014-15 43.1% <10 <10 <10 <10 <10 <10
Science 7th GradeContent
Asian 2013-14 35.6% <10 <10 <10 <10 <10 <10
Science 7th GradeContent
Hispanic ofAny Race
2014-15 11.6% 28.6% 30.8% 7.7% 23.1% 23.1% 46.2%
Science 7th GradeContent
Hispanic ofAny Race
2013-14 9.7% 15.4% 15.4% 0% 15.4% 46.2% 38.5%
Page 15 of A service of the Center for Educational Performance and Information (CEPI) 44

04/01/2016
Annual Education ReportOxford Middle School
M-STEP Grades 3-8
Subject Grade TestingGroup
School Year State PercentStudentsProficient
DistrictPercentStudentsProficient
SchoolPercentStudentsProficient
PercentAdvanced
PercentProficient
PercentPartiallyProficient
Percent NotProficient
Science 7th GradeContent
NativeHawaiian orOther PacificIslander
2014-15 25.8% <10 <10 <10 <10 <10 <10
Science 7th GradeContent
NativeHawaiian orOther PacificIslander
2013-14 26.8% <10 <10 <10 <10 <10 <10
Science 7th GradeContent
Two or MoreRaces
2014-15 21.6% <10 <10 <10 <10 <10 <10
Science 7th GradeContent
Two or MoreRaces
2013-14 17.9% <10 <10 <10 <10 <10 <10
Science 7th GradeContent
White 2014-15 27.4% 40.7% 41.7% 13.1% 28.6% 29.7% 28.6%
Science 7th GradeContent
White 2013-14 24.2% 22.3% 22.8% 6.8% 16% 32.9% 44.3%
Science 7th GradeContent
Female 2014-15 20.8% 34.2% 36.1% 8.3% 27.8% 30.2% 33.7%
Science 7th GradeContent
Female 2013-14 17.5% 16.1% 16.9% 3.7% 13.2% 34.9% 48.1%
Science 7th GradeContent
Male 2014-15 24.6% 45% 46.1% 17.6% 28.4% 26.5% 27.5%
Science 7th GradeContent
Male 2013-14 22% 26.8% 26.7% 9.3% 17.4% 33.1% 40.1%
Science 7th GradeContent
EconomicallyDisadvantaged
2014-15 10.9% 10.9% 11.3% 3.8% 7.5% 26.3% 62.5%
Page 16 of A service of the Center for Educational Performance and Information (CEPI) 44

04/01/2016
Annual Education ReportOxford Middle School
M-STEP Grades 3-8
Subject Grade TestingGroup
School Year State PercentStudentsProficient
DistrictPercentStudentsProficient
SchoolPercentStudentsProficient
PercentAdvanced
PercentProficient
PercentPartiallyProficient
Percent NotProficient
Science 7th GradeContent
EconomicallyDisadvantaged
2013-14 9.4% 12.1% 12.9% 3.2% 9.7% 27.4% 59.7%
Science 7th GradeContent
EnglishLanguageLearners
2014-15 2.3% <10 <10 <10 <10 <10 <10
Science 7th GradeContent
EnglishLanguageLearners
2013-14 2.1% <10 <10 <10 <10 <10 <10
Science 7th GradeContent
Students WithDisabilities
2014-15 4.7% 7.9% 9.1% 3% 6.1% 24.2% 66.7%
Science 7th GradeContent
Students WithDisabilities
2013-14 4.5% 0% 0% 0% 0% 16% 84%
Social Studies 5th GradeContent
All Students 2013-14 26.5% 40.5% 41.5% 4.9% 36.7% 45.6% 12.9%
Social Studies 5th GradeContent
AmericanIndian
2013-14 21% <10 <10 <10 <10 <10 <10
Social Studies 5th GradeContent
AfricanAmerican
2013-14 8.1% 6.7% 7.7% 7.7% 0% 38.5% 53.8%
Social Studies 5th GradeContent
Asian 2013-14 45.7% <10 <10 <10 <10 <10 <10
Social Studies 5th GradeContent
Hispanic ofAny Race
2013-14 12.6% 26.7% 28.6% 0% 28.6% 57.1% 14.3%
Social Studies 5th GradeContent
NativeHawaiian orOther PacificIslander
2013-14 31.3% <10 <10 <10 <10 <10 <10
Page 17 of A service of the Center for Educational Performance and Information (CEPI) 44

04/01/2016
Annual Education ReportOxford Middle School
M-STEP Grades 3-8
Subject Grade TestingGroup
School Year State PercentStudentsProficient
DistrictPercentStudentsProficient
SchoolPercentStudentsProficient
PercentAdvanced
PercentProficient
PercentPartiallyProficient
Percent NotProficient
Social Studies 5th GradeContent
Two or MoreRaces
2013-14 24.2% <10 <10 <10 <10 <10 <10
Social Studies 5th GradeContent
White 2013-14 31.8% 43.1% 43.8% 4.8% 39% 45.2% 11%
Social Studies 5th GradeContent
Female 2013-14 25.2% 40.7% 42.2% 3.9% 38.3% 45.1% 12.6%
Social Studies 5th GradeContent
Male 2013-14 27.8% 40.4% 40.8% 5.8% 35% 46.1% 13.1%
Social Studies 5th GradeContent
EconomicallyDisadvantaged
2013-14 13.2% 15.4% 16.5% 3.5% 12.9% 49.4% 34.1%
Social Studies 5th GradeContent
EnglishLanguageLearners
2013-14 4.7% <10 <10 <10 <10 <10 <10
Social Studies 5th GradeContent
Students WithDisabilities
2013-14 6.8% 7.9% 5.6% 0% 5.6% 47.2% 47.2%
Social Studies 8th GradeContent
All Students 2014-15 29.7% 47.6% 49% 10.5% 38.5% 38.7% 12.3%
Social Studies 8th GradeContent
AfricanAmerican
2014-15 9.1% <10 <10 <10 <10 <10 <10
Social Studies 8th GradeContent
Asian 2014-15 50.9% <10 <10 <10 <10 <10 <10
Social Studies 8th GradeContent
Hispanic ofAny Race
2014-15 18.1% 38.5% 45.5% 18.2% 27.3% 36.4% 18.2%
Social Studies 8th GradeContent
Two or MoreRaces
2014-15 26.7% 16.7% 20% 0% 20% 60% 20%
Page 18 of A service of the Center for Educational Performance and Information (CEPI) 44

04/01/2016
Annual Education ReportOxford Middle School
M-STEP Grades 3-8
Subject Grade TestingGroup
School Year State PercentStudentsProficient
DistrictPercentStudentsProficient
SchoolPercentStudentsProficient
PercentAdvanced
PercentProficient
PercentPartiallyProficient
Percent NotProficient
Social Studies 8th GradeContent
White 2014-15 35.2% 49.4% 50.3% 10.8% 39.6% 38.6% 11.1%
Social Studies 8th GradeContent
Female 2014-15 25.2% 41.7% 43.4% 9% 34.3% 44.6% 12%
Social Studies 8th GradeContent
Male 2014-15 34% 53% 54.1% 11.9% 42.2% 33.5% 12.4%
Social Studies 8th GradeContent
EconomicallyDisadvantaged
2014-15 15.9% 33.8% 35.3% 10.3% 25% 36.8% 27.9%
Social Studies 8th GradeContent
EnglishLanguageLearners
2014-15 5.8% <10 <10 <10 <10 <10 <10
Social Studies 8th GradeContent
Students WithDisabilities
2014-15 7.3% 8.6% 9.4% 3.1% 6.3% 43.8% 46.9%
Page 19 of A service of the Center for Educational Performance and Information (CEPI) 44

04/01/2016
Annual Education ReportOxford Middle School
MME
Subject Grade TestingGroup
School Year State PercentStudentsProficient
DistrictPercentStudentsProficient
SchoolPercentStudentsProficient
PercentAdvanced
PercentProficient
PercentPartiallyProficient
Percent NotProficient
No Data to Display
Page 20 of A service of the Center for Educational Performance and Information (CEPI) 44

04/01/2016
Annual Education ReportOxford Middle School
Michigan Educational Assessment Program Access (MEAP - Access)
Subject Grade Testing Group School Year State PercentStudentsProficient
DistrictPercentStudentsProficient
School PercentStudentsProficient
PercentExceeded
Percent Met PercentProgressing
Mathematics 6th All Students 2013-14 65.3% 75% 75% 25% 50% 25%
Mathematics 6th AfricanAmerican
2013-14 54.7% <10 <10 <10 <10 <10
Mathematics 6th White 2013-14 70.4% 66.7% 66.7% 33.3% 33.3% 33.3%
Mathematics 6th Female 2013-14 66.5% <10 <10 <10 <10 <10
Mathematics 6th Male 2013-14 64.5% 66.7% 66.7% 0% 66.7% 33.3%
Mathematics 6th EconomicallyDisadvantaged
2013-14 62.8% 66.7% 66.7% 0% 66.7% 33.3%
Mathematics 7th All Students 2013-14 47.2% 53.8% 53.8% 15.4% 38.5% 46.2%
Mathematics 7th AfricanAmerican
2013-14 35.9% <10 <10 <10 <10 <10
Mathematics 7th Asian 2013-14 60% <10 <10 <10 <10 <10
Mathematics 7th Hispanic of AnyRace
2013-14 41.7% <10 <10 <10 <10 <10
Mathematics 7th Two or MoreRaces
2013-14 46% <10 <10 <10 <10 <10
Mathematics 7th White 2013-14 52.3% 50% 50% 12.5% 37.5% 50%
Mathematics 7th Female 2013-14 49% 40% 40% 20% 20% 60%
Mathematics 7th Male 2013-14 46.1% 62.5% 62.5% 12.5% 50% 37.5%
Mathematics 7th EconomicallyDisadvantaged
2013-14 44.5% 50% 50% 16.7% 33.3% 50%
Mathematics 8th All Students 2013-14 40.9% 50% 50% 0% 50% 50%
Page 21 of A service of the Center for Educational Performance and Information (CEPI) 44

04/01/2016
Annual Education ReportOxford Middle School
Michigan Educational Assessment Program Access (MEAP - Access)
Subject Grade Testing Group School Year State PercentStudentsProficient
DistrictPercentStudentsProficient
School PercentStudentsProficient
PercentExceeded
Percent Met PercentProgressing
Mathematics 8th AfricanAmerican
2013-14 29.5% <10 <10 <10 <10 <10
Mathematics 8th White 2013-14 46% 33.3% 33.3% 0% 33.3% 66.7%
Mathematics 8th Female 2013-14 38.2% 50% 50% 0% 50% 50%
Mathematics 8th Male 2013-14 42.5% 50% 50% 0% 50% 50%
Mathematics 8th EconomicallyDisadvantaged
2013-14 38.1% 25% 25% 0% 25% 75%
Reading 6th All Students 2013-14 58.1% 62.5% 57.1% 28.6% 28.6% 42.9%
Reading 6th AfricanAmerican
2013-14 48.6% <10 <10 <10 <10 <10
Reading 6th Two or MoreRaces
2013-14 56.3% <10 <10 <10 <10 <10
Reading 6th White 2013-14 62.2% 60% 60% 20% 40% 40%
Reading 6th Female 2013-14 63.1% 100% <10 <10 <10 <10
Reading 6th Male 2013-14 55.3% 40% 40% 20% 20% 60%
Reading 6th EconomicallyDisadvantaged
2013-14 55.2% 40% 40% 20% 20% 60%
Reading 7th All Students 2013-14 61.7% 38.5% 38.5% 15.4% 23.1% 61.5%
Reading 7th Asian 2013-14 73% <10 <10 <10 <10 <10
Reading 7th Hispanic of AnyRace
2013-14 58.5% <10 <10 <10 <10 <10
Reading 7th Two or MoreRaces
2013-14 65.3% <10 <10 <10 <10 <10
Page 22 of A service of the Center for Educational Performance and Information (CEPI) 44

04/01/2016
Annual Education ReportOxford Middle School
Michigan Educational Assessment Program Access (MEAP - Access)
Subject Grade Testing Group School Year State PercentStudentsProficient
DistrictPercentStudentsProficient
School PercentStudentsProficient
PercentExceeded
Percent Met PercentProgressing
Reading 7th White 2013-14 66.7% 33.3% 33.3% 22.2% 11.1% 66.7%
Reading 7th Female 2013-14 66.1% 40% 40% 20% 20% 60%
Reading 7th Male 2013-14 59.3% 37.5% 37.5% 12.5% 25% 62.5%
Reading 7th EconomicallyDisadvantaged
2013-14 59.3% 50% 50% 16.7% 33.3% 50%
Reading 8th All Students 2013-14 69% 83.3% 83.3% 33.3% 50% 16.7%
Reading 8th AfricanAmerican
2013-14 54.3% <10 <10 <10 <10 <10
Reading 8th White 2013-14 76.3% 80% 80% 40% 40% 20%
Reading 8th Female 2013-14 71.2% <10 <10 <10 <10 <10
Reading 8th Male 2013-14 67.8% 75% 75% 25% 50% 25%
Reading 8th EconomicallyDisadvantaged
2013-14 65.9% <10 <10 <10 <10 <10
Page 23 of A service of the Center for Educational Performance and Information (CEPI) 44

04/01/2016
Annual Education ReportOxford Middle School
MI-Access Functional Independence
Subject Grade Testing Group School Year State PercentStudentsProficient
DistrictPercentStudentsProficient
School PercentStudentsProficient
PercentSurpassed
PercentAttained
PercentEmerging
Mathematics 5th GradeContent
All Students 2013-14 73.8% <10 <10 <10 <10 <10
Reading 5th GradeContent
All Students 2013-14 86.8% <10 <10 <10 <10 <10
Mathematics 5th GradeContent
White 2013-14 76.9% <10 <10 <10 <10 <10
Reading 5th GradeContent
White 2013-14 86.9% <10 <10 <10 <10 <10
Mathematics 5th GradeContent
Male 2013-14 74.9% <10 <10 <10 <10 <10
Reading 5th GradeContent
Male 2013-14 86% <10 <10 <10 <10 <10
Mathematics 6th GradeContent
All Students 2014-15 67.8% <10 <10 <10 <10 <10
ELA 6th GradeContent
All Students 2014-15 68.1% <10 <10 <10 <10 <10
Mathematics 6th GradeContent
Two or MoreRaces
2014-15 58.7% <10 <10 <10 <10 <10
ELA 6th GradeContent
Two or MoreRaces
2014-15 61% <10 <10 <10 <10 <10
Mathematics 6th GradeContent
Male 2014-15 69.7% <10 <10 <10 <10 <10
ELA 6th GradeContent
Male 2014-15 66% <10 <10 <10 <10 <10
Mathematics 6th GradeContent
EconomicallyDisadvantaged
2014-15 69.9% <10 <10 <10 <10 <10
Page 24 of A service of the Center for Educational Performance and Information (CEPI) 44

04/01/2016
Annual Education ReportOxford Middle School
MI-Access Functional Independence
Subject Grade Testing Group School Year State PercentStudentsProficient
DistrictPercentStudentsProficient
School PercentStudentsProficient
PercentSurpassed
PercentAttained
PercentEmerging
ELA 6th GradeContent
EconomicallyDisadvantaged
2014-15 69.3% <10 <10 <10 <10 <10
Mathematics 7th GradeContent
All Students 2014-15 67.8% <10 <10 <10 <10 <10
ELA 7th GradeContent
All Students 2014-15 68.8% <10 <10 <10 <10 <10
Science 7th GradeContent
All Students 2014-15 51.8% <10 <10 <10 <10 <10
Mathematics 7th GradeContent
White 2014-15 72.3% <10 <10 <10 <10 <10
ELA 7th GradeContent
White 2014-15 71.8% <10 <10 <10 <10 <10
Science 7th GradeContent
White 2014-15 57.6% <10 <10 <10 <10 <10
Mathematics 7th GradeContent
Male 2014-15 70.8% <10 <10 <10 <10 <10
ELA 7th GradeContent
Male 2014-15 66.6% <10 <10 <10 <10 <10
Science 7th GradeContent
Male 2014-15 54.8% <10 <10 <10 <10 <10
Mathematics 7th GradeContent
EconomicallyDisadvantaged
2014-15 68.9% <10 <10 <10 <10 <10
ELA 7th GradeContent
EconomicallyDisadvantaged
2014-15 69.8% <10 <10 <10 <10 <10
Science 7th GradeContent
EconomicallyDisadvantaged
2014-15 52.4% <10 <10 <10 <10 <10
Page 25 of A service of the Center for Educational Performance and Information (CEPI) 44

04/01/2016
Annual Education ReportOxford Middle School
MI-Access Supported Independence
Subject Grade Testing Group School Year State PercentStudentsProficient
DistrictPercentStudentsProficient
School PercentStudentsProficient
PercentSurpassed
PercentAttained
PercentEmerging
No Data to Display
Page 26 of A service of the Center for Educational Performance and Information (CEPI) 44

04/01/2016
Annual Education ReportOxford Middle School
MI-Access Participation
Subject Grade Testing Group School Year State PercentStudentsProficient
DistrictPercentStudentsProficient
School PercentStudentsProficient
PercentSurpassed
PercentAttained
PercentEmerging
Mathematics 6th GradeContent
All Students 2014-15 63.2% <10 <10 <10 <10 <10
Mathematics 6th GradeContent
All Students 2013-14 62.3% <10 <10 <10 <10 <10
ELA 6th GradeContent
All Students 2014-15 53.3% <10 <10 <10 <10 <10
ELA 6th GradeContent
All Students 2013-14 76.8% <10 <10 <10 <10 <10
Mathematics 6th GradeContent
White 2014-15 64.3% <10 <10 <10 <10 <10
Mathematics 6th GradeContent
White 2013-14 62.1% <10 <10 <10 <10 <10
ELA 6th GradeContent
White 2014-15 54% <10 <10 <10 <10 <10
ELA 6th GradeContent
White 2013-14 80.8% <10 <10 <10 <10 <10
Mathematics 6th GradeContent
Female 2014-15 63.1% <10 <10 <10 <10 <10
Mathematics 6th GradeContent
Female 2013-14 55.2% <10 <10 <10 <10 <10
ELA 6th GradeContent
Female 2014-15 54.6% <10 <10 <10 <10 <10
ELA 6th GradeContent
Female 2013-14 77.6% <10 <10 <10 <10 <10
Mathematics 6th GradeContent
Male 2013-14 66% <10 <10 <10 <10 <10
Page 27 of A service of the Center for Educational Performance and Information (CEPI) 44

04/01/2016
Annual Education ReportOxford Middle School
MI-Access Participation
Subject Grade Testing Group School Year State PercentStudentsProficient
DistrictPercentStudentsProficient
School PercentStudentsProficient
PercentSurpassed
PercentAttained
PercentEmerging
ELA 6th GradeContent
Male 2013-14 76.4% <10 <10 <10 <10 <10
Mathematics 7th GradeContent
All Students 2013-14 58.6% <10 <10 <10 <10 <10
ELA 7th GradeContent
All Students 2013-14 70.6% <10 <10 <10 <10 <10
Science 7th GradeContent
All Students 2013-14 79.7% <10 <10 <10 <10 <10
Mathematics 7th GradeContent
White 2013-14 62.9% <10 <10 <10 <10 <10
ELA 7th GradeContent
White 2013-14 72.5% <10 <10 <10 <10 <10
Science 7th GradeContent
White 2013-14 80.5% <10 <10 <10 <10 <10
Mathematics 7th GradeContent
Male 2013-14 56.7% <10 <10 <10 <10 <10
ELA 7th GradeContent
Male 2013-14 68.1% <10 <10 <10 <10 <10
Science 7th GradeContent
Male 2013-14 77.2% <10 <10 <10 <10 <10
Mathematics 8th GradeContent
All Students 2014-15 67.7% <10 <10 <10 <10 <10
ELA 8th GradeContent
All Students 2014-15 63% <10 <10 <10 <10 <10
Mathematics 8th GradeContent
White 2014-15 71.6% <10 <10 <10 <10 <10
Page 28 of A service of the Center for Educational Performance and Information (CEPI) 44

04/01/2016
Annual Education ReportOxford Middle School
MI-Access Participation
Subject Grade Testing Group School Year State PercentStudentsProficient
DistrictPercentStudentsProficient
School PercentStudentsProficient
PercentSurpassed
PercentAttained
PercentEmerging
ELA 8th GradeContent
White 2014-15 66.7% <10 <10 <10 <10 <10
Mathematics 8th GradeContent
Female 2014-15 65.2% <10 <10 <10 <10 <10
ELA 8th GradeContent
Female 2014-15 60.2% <10 <10 <10 <10 <10
Mathematics 8th GradeContent
Male 2014-15 69.1% <10 <10 <10 <10 <10
ELA 8th GradeContent
Male 2014-15 64.6% <10 <10 <10 <10 <10
Page 29 of A service of the Center for Educational Performance and Information (CEPI) 44

04/01/2016
Annual Education ReportOxford Middle School
Accountability Details Subject Data
TestingGroup
Subject State TestedTotal
State PercentProficient
DistrictTested Total
DistrictPercentProficient*
School TestedTotal
SchoolPercentProficient**
All Students Mathematics 98.1% 36.5% 98.6% N/A 99.6% N/A
All Students ELA 98.1% 48.5% 98.6% N/A 99.7% N/A
All Students Science 97.5% 22.2% 98.8% N/A 99.5% N/A
All Students Social Studies 97.4% 31.8% 98.4% N/A 98.9% N/A
AmericanIndian
Mathematics 98.2% 27.8% <30 N/A <30 N/A
AmericanIndian
ELA 98% 41.5% <30 N/A <30 N/A
AmericanIndian
Science 97.8% 17.7% <30 N/A <30 N/A
AmericanIndian
Social Studies 97.2% 25.2% N/A N/A N/A N/A
AfricanAmerican
Mathematics 96.5% 13.5% 98.6% N/A <30 N/A
AfricanAmerican
ELA 96.5% 24.5% 98.6% N/A <30 N/A
AfricanAmerican
Science 95.4% 6.1% 97.6% N/A <30 N/A
AfricanAmerican
Social Studies 95.2% 11% 100% N/A <30 N/A
Asian Mathematics 99.1% 66.3% 97.9% N/A <30 N/A
Asian ELA 98.7% 70.2% 97.9% N/A <30 N/A
Asian Science 99% 38% <30 N/A <30 N/A
Asian Social Studies 98.8% 49.6% <30 N/A <30 N/A
Hispanic of AnyRace
Mathematics 98.3% 23.7% 98.2% N/A 100% N/A
Hispanic of AnyRace
ELA 98.3% 36.1% 98.2% N/A 100% N/A
Hispanic of AnyRace
Science 97.9% 11.7% 96.4% N/A <30 N/A
Hispanic of AnyRace
Social Studies 97.5% 20.2% 100% N/A <30 N/A
NativeHawaiian orOther PacificIslander
Mathematics 99.8% 40.8% <30 N/A <30 N/A
Page 30 of A service of the Center for Educational Performance and Information (CEPI) 44

04/01/2016
Annual Education ReportOxford Middle School
Accountability Details Subject Data
TestingGroup
Subject State TestedTotal
State PercentProficient
DistrictTested Total
DistrictPercentProficient*
School TestedTotal
SchoolPercentProficient**
NativeHawaiian orOther PacificIslander
ELA 99.3% 53.3% <30 N/A <30 N/A
NativeHawaiian orOther PacificIslander
Science 99.6% 21.9% <30 N/A <30 N/A
NativeHawaiian orOther PacificIslander
Social Studies 99.3% 33% <30 N/A N/A N/A
Two or MoreRaces
Mathematics 98.5% 33.6% 97.5% N/A <30 N/A
Two or MoreRaces
ELA 98.5% 46.9% 96.3% N/A <30 N/A
Two or MoreRaces
Science 98.5% 20.1% <30 N/A <30 N/A
Two or MoreRaces
Social Studies 98.1% 28.3% 100% N/A <30 N/A
White Mathematics 98.5% 42.5% 98.7% N/A 99.7% N/A
White ELA 98.5% 55% 98.7% N/A 99.8% N/A
White Science 98.1% 26.6% 98.9% N/A 99.7% N/A
White Social Studies 98% 37.3% 98.2% N/A 98.8% N/A
EconomicallyDisadvantaged
Mathematics 97.6% 22.5% 97% N/A 99.1% N/A
EconomicallyDisadvantaged
ELA 97.6% 33.7% 97% N/A 99.1% N/A
EconomicallyDisadvantaged
Science 96.8% 11.7% 95.7% N/A 98.8% N/A
EconomicallyDisadvantaged
Social Studies 96.5% 17.8% 97.6% N/A 100% N/A
EnglishLanguageLearners
Mathematics 98.6% 20.3% 100% N/A <30 N/A
EnglishLanguageLearners
ELA 98.2% 24% 100% N/A <30 N/A
EnglishLanguageLearners
Science 98.2% 3.9% <30 N/A <30 N/A
Page 31 of A service of the Center for Educational Performance and Information (CEPI) 44

04/01/2016
Annual Education ReportOxford Middle School
Accountability Details Subject Data
TestingGroup
Subject State TestedTotal
State PercentProficient
DistrictTested Total
DistrictPercentProficient*
School TestedTotal
SchoolPercentProficient**
EnglishLanguageLearners
Social Studies 97.9% 8.1% <30 N/A <30 N/A
Students WithDisabilities
Mathematics 97.2% 21.8% 99.3% N/A 99.1% N/A
Students WithDisabilities
ELA 96.6% 24.7% 98.6% N/A 99.1% N/A
Students WithDisabilities
Science 96.5% 15.4% 100% N/A 100% N/A
Students WithDisabilities
Social Studies 95% 13.9% 94.7% N/A 94.1% N/A
Page 32 of A service of the Center for Educational Performance and Information (CEPI) 44

04/01/2016
Annual Education ReportOxford Middle School
Accountability Details Graduation Data
Student Group Statewide District School
All Students 78.6% 93.9% N/A
American Indian 64.8% N/A N/A
African American 64.5% N/A N/A
Asian 89.1% N/A N/A
Hispanic of Any Race 68.8% N/A N/A
Native Hawaiian or Other PacificIslander
78.9% N/A N/A
Two or More Races 74.2% N/A N/A
White 82.9% 94.6% N/A
Female 82.9% N/A N/A
Male 74.4% N/A N/A
Economically Disadvantaged 65.6% 89.9% N/A
English Language Learners 68.2% N/A N/A
Students With Disabilities 55.1% N/A N/A
Bottom 30% N/A N/A N/A
* All data based on students enrolled for a full academic year.
Page 33 of A service of the Center for Educational Performance and Information (CEPI) 44

04/01/2016
Annual Education ReportOxford Middle School
Accountability Details Attendance Data
Student Group Statewide District School
All Students 94.7% 96.8% 97.2%
* All data based on students enrolled for a full academic year.
Page 34 of A service of the Center for Educational Performance and Information (CEPI) 44

04/01/2016
Annual Education ReportOxford Middle School
Accountability Status District Data
DistrictName
ReadingStatus
ReadingScore
WritingStatus
WritingScore
MathStatus
Math Score ScienceStatus
ScienceScore
SocialStudiesStatus
SocialStudiesScore
OverallStatus
OverallScore
No Data to Display
Page 35 of A service of the Center for Educational Performance and Information (CEPI) 44

04/01/2016
Annual Education ReportOxford Middle School
Accountability Status School Data
DistrictName
SchoolName
Title 1Status
ReadingStatus
ReadingScore
WritingStatus
WritingScore
MathStatus
MathScore
ScienceStatus
ScienceScore
SocialStudiesStatus
SocialStudiesScore
OverallStatus
OverallScore
No Data to Display
Page 36 of A service of the Center for Educational Performance and Information (CEPI) 44

04/01/2016
Annual Education ReportOxford Middle School
Teacher Quality - Qualification
Other B.A. M.A. P.H.D.
ProfessionalQualifications of All PublicElementary andSecondary SchoolTeachers in the School
0 18 41 1
Professional Qualifications are defined by the State and may include information such as the degrees of public school teachers (e.g.,percentage of teachers with Bachelors Degrees or Masters Degrees) or the percentage of fully certified teachers
Teacher Quality - Class
School Aggregate High-Poverty Schools Low-Poverty Schools
Percentage of Core AcademicSubject Elementary andSecondary School Classes notTaught by Highly QualifiedTeachers
0.0% 0.0% 0.0%
Teacher Quality - Provisional
Certification Percent
Percentage of Public Elementary and Secondary School Teachersin the School with Emergency Certification
0%
Page 37 of A service of the Center for Educational Performance and Information (CEPI) 44

04/01/2016
Annual Education ReportOxford Middle School
NAEP Grade 4 Math
Percent ofStudents
Percent belowBasic
Percent Basic Percent Proficient Percent Advanced
All Students 100 23 77 34 5
MaleFemale
5149
2223
7877
3632
64
National LunchProgram EligibilityEligibleNot EligibleInfo not available
4753#
3610‡
6490‡
1749‡
19‡
Race/EthnicityWhiteBlackHispanicAsianAmericanIndian/Alaska NativeNativeHawaiian/PacificIslanderTwo or More Races
7215641#3
15533811‡‡‡
85476289‡‡‡
39102158‡‡‡
5觷‡‡‡
Student classified ashaving a disabilitySDNot SD
1288
4719
5381
1437
15
Student is an EnglishLanguage LearnerELLNot ELL
595
4222
5878
1635
15
‡ Reporting Standards not met. Note: Observed differences are not necessarily statistically significant. Detail may not sum to totalbecause of rounding. SOURCE: U.S. Department of Education. Institute for Education Sciences. National Center for EducationStatistics. National Assessment of Educational Progress (NAEP) 2015 Mathematics Achievement.
Page 38 of A service of the Center for Educational Performance and Information (CEPI) 44

04/01/2016
Annual Education ReportOxford Middle School
NAEP Grade 8 Math
Percent ofStudents
Percent belowBasic
Percent Basic Percent Proficient Percent Advanced
All Students 100 32 39 22 7
MaleFemale
5149
3134
3939
2321
76
National LunchProgram EligibilityEligibleNot EligibleInfo not available
4555#
4819‡
3940‡
1230‡
211‡
Race/EthnicityWhiteBlackHispanicAsianAmericanIndian/Alaska NativeNativeHawaiian/PacificIslanderTwo or More Races
6920431#2
23663811‡‡‡
43294418‡‡‡
2651539‡‡‡
7#432‡‡‡
Student classified ashaving a disabilitySDNot SD
1189
7727
1941
324
#7
Student is an EnglishLanguage LearnerELLNot ELL
397
5432
3339
1122
27
‡ Reporting Standards not met. NOTE: Observed differences are not necessarily statistically significant. Detail may not sum to totalbecause of rounding. SOURCE: U.S. Department of Education. Institute for Education Sciences. National Center for EducationStatistics. National Assessment of Educational Progress (NAEP) 2015 Mathematics Achievement.
Page 39 of A service of the Center for Educational Performance and Information (CEPI) 44

04/01/2016
Annual Education ReportOxford Middle School
NAEP Grade 12 Math
Percent ofStudents
Percent belowBasic
Percent Basic Percent Proficient Percent Advanced
All Students 100 34 41 23 2
MaleFemale
5149
3235
4142
2622
11
National LunchProgram EligibilityEligibleNot EligibleInfo not available
35640
54220
37440
9320
020
Race/EthnicityWhiteBlackHispanicAsianAmerican IndianNativeHawaiian/PacificIslanderTwo or More Races
761453101
26685826000
42273332000
305935000
2007000
Student classified ashaving a disabilitySDNot SD
991
7830
1943
325
02
Student is an EnglishLanguage LearnerELLNot ELL
298
033
041
024
02
‡ Reporting Standards not met. NOTE: Observed differences are not necessarily statistically significant. Detail may not sum to totalbecause of rounding. SOURCE: U.S. Department of Education. Institute for Education Sciences. National Center for EducationStatistics. National Assessment of Educational Progress (NAEP) 2015 Mathematics Achievement.
Page 40 of A service of the Center for Educational Performance and Information (CEPI) 44
04/01/2016
Annual Education ReportOxford Middle School
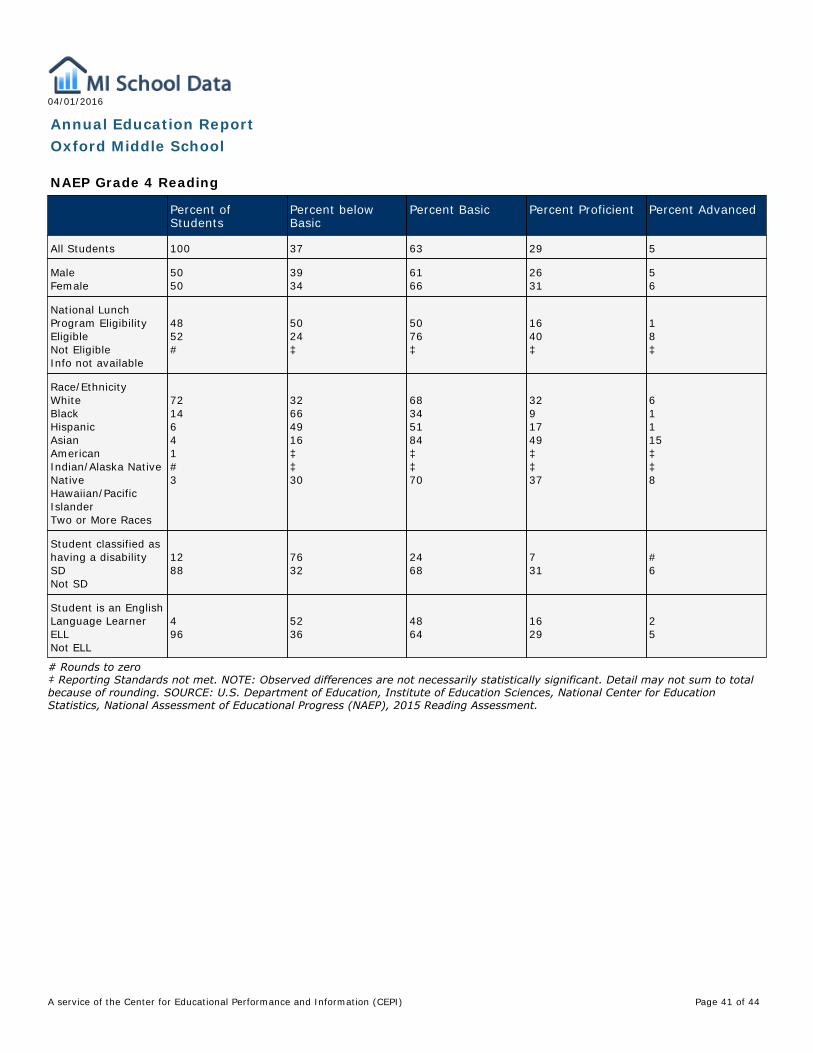
NAEP Grade 4 Reading
Percent ofStudents
Percent belowBasic
Percent Basic Percent Proficient Percent Advanced
All Students 100 37 63 29 5
MaleFemale
5050
3934
6166
2631
56
National LunchProgram EligibilityEligibleNot EligibleInfo not available
4852#
5024‡
5076‡
1640‡
18‡
Race/EthnicityWhiteBlackHispanicAsianAmericanIndian/Alaska NativeNativeHawaiian/PacificIslanderTwo or More Races
7214641#3
32664916‡‡30
68345184‡‡70
3291749‡‡37
61115‡‡8
Student classified ashaving a disabilitySDNot SD
1288
7632
2468
731
#6
Student is an EnglishLanguage LearnerELLNot ELL
496
5236
4864
1629
25
# Rounds to zero‡ Reporting Standards not met. NOTE: Observed differences are not necessarily statistically significant. Detail may not sum to totalbecause of rounding. SOURCE: U.S. Department of Education, Institute of Education Sciences, National Center for EducationStatistics, National Assessment of Educational Progress (NAEP), 2015 Reading Assessment.
Page 41 of A service of the Center for Educational Performance and Information (CEPI) 44

04/01/2016
Annual Education ReportOxford Middle School
NAEP Grade 8 Reading
Percent ofStudents
Percent belowBasic
Percent Basic Percent Proficient Percent Advanced
All Students 100 24 44 29 3
MaleFemale
5149
2920
4542
2534
24
National LunchProgram EligibilityEligibleNot EligibleInfo not available
4555#
3714‡
4543‡
1739‡
14‡
Race/EthnicityWhiteBlackHispanicAsian/Pacific IslanderAmericanIndian/Alaska NativeTwo or More Races
69204312
18472713‡‡
44444135‡‡
3492941‡‡
3觮‡‡
Student classified ashaving a disabilitySDNot SD
1090
6420
3045
532
#3
Student is an EnglishLanguage LearnerELLNot ELL
397
5723
3744
630
#3
# Rounds to zero‡ Reporting Standards not met. NOTE: Observed differences are not necessarily statistically significant. Detail may not sum to totalbecause of rounding. SOURCE: U.S. Department of Education, Institute of Education Sciences, National Center for EducationStatistics, National Assessment of Educational Progress (NAEP), 2015 Reading Assessment.
Page 42 of A service of the Center for Educational Performance and Information (CEPI) 44

04/01/2016
Annual Education ReportOxford Middle School
NAEP Grade 12 Reading
Percent ofStudents
Percent belowBasic
Percent Basic Percent Proficient Percent Advanced
All Students 100 26 5 27 5
MaleFemale
5050
3120
3737
2837
46
National LunchProgram EligibilityEligibleNot EligibleInfo not available
35641
37190
39360
22380
270
Race/EthnicityWhiteBlackHispanicAsianAmerican IndianNativeHawaiian/PacificIslanderTwo or More Races
761453100
20523421000
38364426000
36122141000
60112000
Student classified ashaving a disabilitySDNot SD
793
6623
2538
834
15
Student is an EnglishLanguage LearnerELLNot ELL
298
025
037
033
05
# Rounds to zero‡ Reporting Standards not met. NOTE: Observed differences are not necessarily statistically significant. Detail may not sum to totalbecause of rounding. SOURCE: U.S. Department of Education, Institute of Education Sciences, National Center for EducationStatistics, National Assessment of Educational Progress (NAEP), 2015 Reading Assessment.
Page 43 of A service of the Center for Educational Performance and Information (CEPI) 44
04/01/2016
Annual Education ReportOxford Middle School
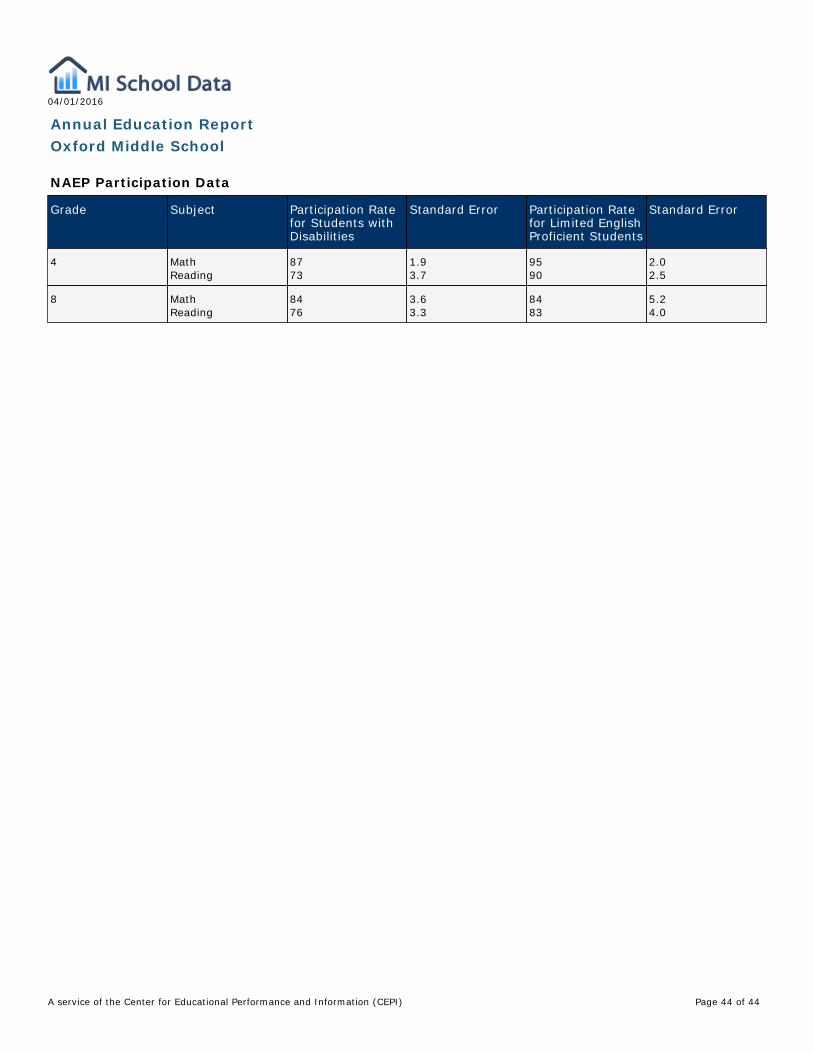
NAEP Participation Data
Grade Subject Participation Ratefor Students withDisabilities
Standard Error Participation Ratefor Limited EnglishProficient Students
Standard Error
4 MathReading
8773
1.93.7
9590
2.02.5
8 MathReading
8476
3.63.3
8483
5.24.0
Page 44 of A service of the Center for Educational Performance and Information (CEPI) 44