2014 commercial real estate outlook trimming the sails for
TRANSCRIPT

2014 Commercial Real Estate Outlook Trimming the sails for growthBusiness transformation is key
Deloitte Center for Financial Services

2

2014 commercial real estate outlook Business transformation is key 3
Contents
Foreword 1 Trimming the sails for growth 3 Competition and markets 4 Clients and products 8 Governance, risk, and compliance 12 Financial management 14 Organizational effectiveness 20 Technology dynamics 22 Business transformation is key 24 Contacts 25

4

2014 commercial real estate outlook Business transformation is key 1
Foreword
Dear colleagues“It was the best of times, it was the worst of times…..” So begins Charles Dickens’ A Tale of Two Cities. In many ways, this describes the environment that the financial services industry is facing as we head into 2014. The economy is showing some signs of life, balance sheets are stabilizing, and consumer and manufacturer confidence indices are trending toward the positive. That said, the coming year likely will be one of continued challenges for industry executives to realign business models, adjust to increasing regulation, and attempt to innovate for growth.
In many ways, the commercial real estate (CRE) sector has experienced more good times than bad in recent years. It is looking to build on this momentum by exploring new sources of revenue and identifying ways to drive increased efficiency. For example, private equity firms’ success with buying and renting foreclosed single-family (SF) homes has driven the housing rebound in the U.S. and is leading to increased interest on their part to establish these properties as a new asset class for investment. Bank lenders are easing their standards, leading to increased CRE lending volumes and a rebound in commercial mortgage-backed securities (CMBS) issuance. Transaction activity and pricing are healthy for prime properties.
But challenges remain. The impact of regulations, such as Dodd-Frank, Terrorism Risk Insurance Act (TRIA), and Foreign Account Tax Compliance Act (FATCA) is still somewhat uncertain. Capital availability for construction activity and non-prime properties remains tight. Technology is becoming a driving force in a number of ways – from its impact on retail property owners through the rise of online shopping; to increases in mobile workforces and the resultant changes in demand for office space; and its influence through social media and mobility (again) on the potential talent shortage that may be looming for the sector. Successful firms will navigate these issues in order to capitalize on these changing driversof growth.
We are pleased to share with you this outlook for 2014, the fifteenth publication in Deloitte’s series on critical issues affecting real estate, based on original research combined with the insights and first-hand experience of many of Deloitte’s leading real estate practitioners. Clearly, Deloitte is not alone in producing annual forecasts for the financial services industry. More often than not, these forecasts take the form of a list of trends, initiatives, or strategies. We were bothered by this “list-for-a-list’s-sake” approach and thought we could improve how we bring relevant, thoughtful content to our clients. Over the past year we have restructured our content into six major topical platforms, which are designed to explore both industry-wide competitive and market dynamics as well as examine tactical trends and opportunities within individual firms. Across nine segments of the financial services industry, our 2014 outlooks rely on this new structure and provide insights aligned to the following:• Competition and markets - Evaluates existing industry
structure, competitive landscape, or market composition• Clients and products - Explores emerging trends in retail
or institutional customer behaviors, attitudes, and needs amongst tenants and owners across real estate property types
• Governance, risk, and compliance - Reviews industry risk management practices and regulatory mandates and their potential financial and strategic impacts on industry participants
• Financial management - Highlights how finance leaders can better organize and deliver needed insights to their firms
• Organizational effectiveness - Analyzes how firms have responded to talent, process, and other operational challenges
• Technology dynamics - Examines the evolving role of technologies in the industry

2
We’ve included a graphic element (below), which you will see throughout the report, which provides a signpost as you navigate the outlook. If you pick up more than one of our financial services outlooks, you will be able to easily compare how the various industry sectors are addressing the six issues by visiting the corresponding section. For example, you’ll see technology trends by visiting the corresponding blue sections in all nine reports.
We hope you find this report insightful and informative as you consider your company’s strategic decisions in the upcoming year. Please share your feedback or questions with us. We would value the opportunity to discuss the report directly with you and your team.
Competitionand markets
6Focus areas
Clients
and products
Tech
nolo
gy
dyna
mics
Organizational
effectiveness
Financialmanagement
Gover
nanc
e, ris
k
and
com
plia
nce
Bob O’BrienVice Chairman and PartnerGlobal and U.S. Real Estate Services LeaderDeloitte & Touche LLP+1 312 486 [email protected]
Jim EckenrodeExecutive DirectorDeloitte Center for Financial ServicesDeloitte Services LP+1 617 585 [email protected]

2014 commercial real estate outlook Business transformation is key 3
Three-quarters into 2013, the CRE industry is marked by continued recovery in asset prices, transactions, and capital availability. Asset prices are close to 2007 peaks in the major metropolitan markets and transaction activity has improved in the secondary markets. Debt markets have improved to a point where refinancing concerns have eased and there is less worry about the maturity schedule. In addition, private equity and international investor interest have increased in U.S. CRE, with the region considered both the most stable as well as offering better overall returns relative to risk globally.
Can this recovery gain momentum as we move into 2014?
CRE fundamentals – rents and occupancy – have strengthened since the economic downturn, and are now stabilized across property types. However, as we dig deeper into these fundamentals that drive core revenue growth, we observe that, except for multifamily and hotels, rent growth and occupancy are trending below historical averages across most sub-sectors. In sectors such as multifamily,
Trimming the sails for growth
which were the first to recover from the recession, fundamentals are beginning to peak and are expected to moderate. Development activity, which provides indications about medium-to-long-term growth prospects for the CRE industry, remains muted for most property types, again other than multifamily and hotels. In addition, lending standards for construction loans remain stringent.
Institutional interest in SF homes has provided the much needed boost to the beleaguered housing market and has led to the emergence of a new asset class in the form of SF real estate investment trusts (REITs). This sector is likely to continue to grow, albeit at a slower pace, and longer-term investor appetite for this new institutional asset class is yet to be determined.
In summary, with economic growth expected to remain protracted, along with uncertainty surrounding the outcomes of impending regulations such as Dodd-Frank and TRIA, we believe that the pace of recovery of the CRE industry is likely to moderate in the near-to-medium term.

4
The global economy continues to grow at a modest pace, with Europe and many major emerging markets exhibiting slower growth. Meanwhile, global financial markets have experienced considerable volatility due to expected changes in U.S. monetary policy, a new policy in Japan, and instability in China’s banking system.1 The United States likely will experience slow-to-moderate economic growth through 2014.
A closer look at some of the key macroeconomic parameters confirms the improved, albeit slow economic growth (Figure 1), which is leading to increased competition in the CRE sector for both financing and transactions. While banks have eased lending standards, they continue to be stringent about asset location and quality. Hence, the prime market has stabilized as available capital and credit pursue that top tier; whereas bank financing for non-prime properties and new construction remains tight. This is not surprising given that, typically, CRE recovery tends to lag broader economic growth.
Macroeconomic fundamentals – Modest CRE growth drives need for operational excellence
6Focus areas
Competitionand markets
Clients
and products
Tech
nolo
gy
dyna
mics
Organizational
effectiveness
Financialmanagement
Gover
nanc
e, ris
k
and
com
plia
nce
Figure 1. GDP growth, unemployment, and consumer confidence
15
10
5
0
-5
-10
Percent Index value120
100
80
60
40
20
0
GDP Growth Unemployment rate Consumer confidence index (RHS)
1Q07
2Q07
3Q07
4Q07
1Q08
2Q08
3Q08
4Q08
1Q09
2Q09
3Q09
4Q09
1Q10
2Q10
3Q10
4Q10
1Q11
2Q11
3Q11
4Q11
1Q12
2Q12
3Q12
4Q12
1Q13
2Q13
Gross Domestic Product (GDP) growthGDP grew by 2.5 percent in 2Q13, better than the prior estimate of 1.7 percent growth, primarily due to stronger exports and improved consumption demand.2 It is unlikely that there will be sustained higher growth levels in the medium term, as the economy needs time to adjust to the tax increases that went into effect at the beginning of the year and the federal spending cuts that began in March.3
Consumer sentiment & manufacturingConsumer sentiment dropped recently amid concerns over government policies as highlighted by the Thomson Reuters/University of Michigan index, which came in at 77.5 in September compared to 78.3 during the same period last year. Further, the index of consumer expectations declined to 67.8, compared to 73.5 during the comparable period in 2012. However, manufacturing witnessed an expansion in activity, as the Purchasing Managers Index (PMI) rose to 56.2 percent in September, an uptick for the fourth consecutive month.4
Source: Bureau of Economic Analysis, Bureau of Labor Statistics, and Conference Board

2014 commercial real estate outlook Business transformation is key 5
UnemploymentThe unemployment rate continued to decline and fell to its lowest point since 2008; 7.3 percent in August.5 However, the long-term unemployed accounted for a significant 37.9 percent of the total unemployed, while labor force participation dropped to 63.2 percent, its lowest level since 1978.6,7 This reflects the high incidence of structural unemployment and is expected to continue to act as a drag on the overall economic recovery.
OutlookEven with these challenges, the outlook for the United States has improved; attention is now on the timing of the Federal Reserve’s reduction and discontinuation of asset purchases and its plan for interest rates.8 While a rate increase may indicate confidence about current and future economic growth, it is likely to impact the refinancing market in the short-to-medium term. A slow growth environment coupled with policy uncertainty such as this may deter investments and the opening up of financing for non-prime properties.
The bottom lineIt is difficult to see how the government makes the hard choices necessary to provide long-term solutions, but we do know that the longer it waits, the harder the fix will be.9 Delay may create risks to the rate of CRE industry growth, although key parameters – fundamentals, transactions, lending – continue to improve. We believe -- given the expected modest near-term economic growth, longer-term risks to the industry from government fiscal policy, and CRE’s standing in the current recovery cycle -- that astute players can potentially enhance their competitive edge by reducing costs through improved processes and leveraging technology to improve operations. Additionally, CRE companies should focus on enhancing the tenant experience to suit tenants’ changing needs, with an emphasis on service, sustainability, and increased use of technology.
6
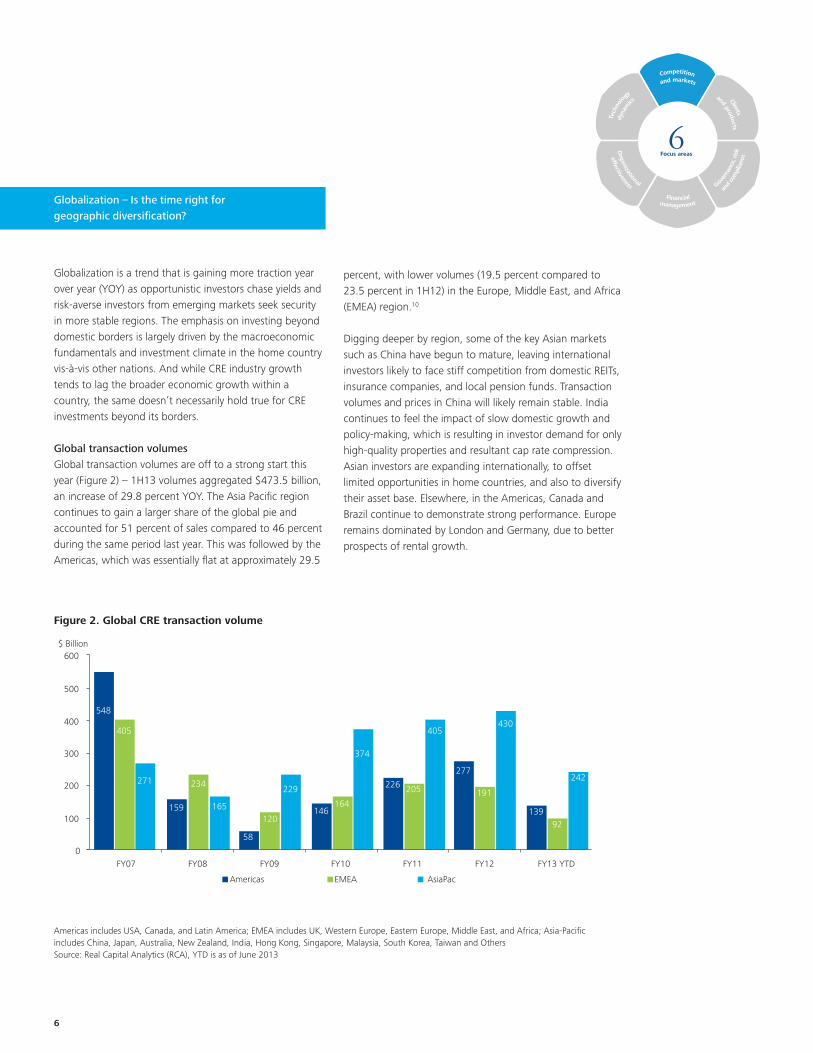
Globalization is a trend that is gaining more traction year over year (YOY) as opportunistic investors chase yields and risk-averse investors from emerging markets seek security in more stable regions. The emphasis on investing beyond domestic borders is largely driven by the macroeconomic fundamentals and investment climate in the home country vis-à-vis other nations. And while CRE industry growth tends to lag the broader economic growth within a country, the same doesn’t necessarily hold true for CRE investments beyond its borders.
Global transaction volumesGlobal transaction volumes are off to a strong start this year (Figure 2) – 1H13 volumes aggregated $473.5 billion, an increase of 29.8 percent YOY. The Asia Pacific region continues to gain a larger share of the global pie and accounted for 51 percent of sales compared to 46 percent during the same period last year. This was followed by the Americas, which was essentially flat at approximately 29.5
Figure 2. Global CRE transaction volume
$ Billion
FY07 FY08 FY09 FY10 FY11 FY12 FY13 YTD
Americas EMEA AsiaPac
600
500
400
300
200
100
0
548
405
271
159
234
165
58
120
229
146
277
405
205226
374
164191
430
13992
242
Americas includes USA, Canada, and Latin America; EMEA includes UK, Western Europe, Eastern Europe, Middle East, and Africa; Asia-Pacific includes China, Japan, Australia, New Zealand, India, Hong Kong, Singapore, Malaysia, South Korea, Taiwan and OthersSource: Real Capital Analytics (RCA), YTD is as of June 2013
percent, with lower volumes (19.5 percent compared to 23.5 percent in 1H12) in the Europe, Middle East, and Africa (EMEA) region.10
Digging deeper by region, some of the key Asian markets such as China have begun to mature, leaving international investors likely to face stiff competition from domestic REITs, insurance companies, and local pension funds. Transaction volumes and prices in China will likely remain stable. India continues to feel the impact of slow domestic growth and policy-making, which is resulting in investor demand for only high-quality properties and resultant cap rate compression. Asian investors are expanding internationally, to offset limited opportunities in home countries, and also to diversify their asset base. Elsewhere, in the Americas, Canada and Brazil continue to demonstrate strong performance. Europe remains dominated by London and Germany, due to better prospects of rental growth.
Globalization – Is the time right for geographic diversification?
6Focus areas
Competitionand markets
Clients
and products
Tech
nolo
gy
dyna
mics
Organizational
effectiveness
Financialmanagement
Gover
nanc
e, ris
k
and
com
plia
nce

2014 commercial real estate outlook Business transformation is key 7
Global investmentsThe above trends are backed by higher availability of capital for investment. Of the $320 billion capital available for investment in CRE globally (+7.4 percent YOY), a large portion is likely to be directed towards the Americas and Asia Pacific region.11 This is no surprise, given that during the three-year period ending August 30, Brazil’s FIPE ZAP and the MSCI US REIT Index have had returns of 68.7 percent and 12.8 percent, respectively, compared to the MSCI World Real Estate Index’s 11.8 percent return (Figure 3). While Brazil has demonstrated substantial returns over the last three years, the U.S. CRE market continues to be the favorite, with approximately 56 percent of new capital raised being funneled into the region.12
* China real estate returns represent the median returns based on sales price indices of newly constructed commercial residential buildings in 70 large- and medium-sized Chinese cities. Indices assume 2010 as base. Returns of indices other than China are for three years to August 2013. Source: MSCI, ZAP Brazil, National Bureau of Statistics of China, September 2013
OutlookIncreased international interest in U.S. CRE has helped revive the transaction market following the financial crisis. In 1H13, cross-border investment in the U.S. was
The bottom lineInternational diversification is a double-edged sword for U.S. CRE players. It provides an opportunity to spread risks and improve returns, yet insufficient local market knowledge, lack of transparency in many emerging real estate markets, and REIT regulations in the home country can impede expansion of a global footprint. That said, an effective international diversification strategy, including joint ventures with local partners, may help U.S. CRE players differentiate themselves. For example, while EMEA continues to trail other CRE markets, select properties appear attractively priced. CRE players also may benefit from increased international interest in U.S. secondary and tertiary markets, as this will help strengthen the transaction market, as well as cap rates and pricing.
approximately 8.8 percent of total property investment volumes, double the investment level of 2001, with three of the four largest investors being Asian nations -- Singapore, China, and South Korea.13 According to a 2013 Association of Foreign Investors in Real Estate (AFIRE) survey, 55 percent of the respondents expect the U.S. real estate market to provide the most substantive capital appreciation, and also consider it to be most stable and secure. In fact, going forward, 81 percent of respondents plan to increase their portfolio size in the United States. In contrast, the Europe, Middle East, and Africa (EMEA) region continues to see a significant decline, except for London. However, opportunistic and distress investors are increasingly interested in European opportunities. The U.S. has also gradually increased its global presence, with cross-border investments growing by 13.4 percent in 2012 over 2008 levels.14 We believe this trend will continue through 2014 as investors find value in attractively priced properties across the globe.
Composite FIPEZAPindex Brazil
MSCI U.S. REIT index
China real estate
Percent
68.7
11.8
12.8
11.6
0 10 20 30 40 50 60 70 80
MSCI World realestate index
Figure 3. Global real estate: 3-year cumulative returns (through August 2013)*

8
6Focus areas
Competitionand markets
Clients
and products
Tech
nolo
gy
dyna
mics
Organizational
effectiveness
Financialmanagement
Gover
nanc
e, ris
k
and
com
plia
nce
Stronger leasing activity has led to an improvement in CRE fundamentals. Both rent growth and occupancy levels have stabilized, although they continue to remain below historical averages across most property types. However, tenants’ technology use and a changing workforce are now influencing leasing decisions to a point that we believe requires CRE property owners to evaluate their existing space and service levels, and determine the need for redesign in the near-to-medium term.
OfficeOffice vacancy rate and rental growth was 15.2 percent and 2.1 percent in 2Q13 (compared to 15.8 percent and 3 percent, respectively, in 2Q12),15 although growth remains below historical average. And, while net absorption remains positive (10 million square feet as of 2Q13), new development activity is insignificant.16 Going forward, a focus on employee well-being (e.g., flexible work strategies) and a desire to reduce rental expenses through efficient space utilization likely will impact leasing decisions and result in lower demand for physical space. A Deloitte report on Work Environment Redesign states that many tenants are now including the physical, virtual, and management infrastructure as part of the overall work environment to enhance employee satisfaction.17 In addition, a 2012 Flexibility Drives Productivity Regus Study says that $15 billion in savings can be achieved if all U.S. firms adopt flexible work schedules.18 Demand for office space is also being influenced by improved mobile technologies, experiences gained from globalization, and the work/lifestyle expectations of younger employees among other factors. Office players can potentially up their game by anticipating tenants’ demands to optimize workforce effectiveness and appropriately redesign their existing space.
RetailIn the retail sub-sector, vacancy was down 60 basis points YOY in 2Q13 to 12.3 percent.19 Effective rents declined 0.3 percent YOY, which is marginally better than the 1.2 percent YOY decrease in 2Q12.20 Net absorption expanded to 8.1 million square feet in 2Q13 compared to 4.5 million in 2Q12, which is a positive sign.21 However, as retailers’ store sales and margins continue to be impacted by the rise in Internet sales, they remain cautious about expanding brick-and-mortar stores and are increasing
use of alternative channels such as online. Also, retail real estate development activity is at a record low, which should temper the effect of lower demand to some extent. In addition, improved consumer spending is likely to support overall retail sales, as categories like home products gain traction. Retail CRE players can potentially help tenants redirect traffic back to brick-and-mortar stores by enhancing the customer experience through technology enablement, such as integrated use of mobile apps and social media; enhancing the tenant roster to include more experiential service providers; providing personalized/customized advice for shoppers; and delivering non-traditional productsand/or services.
IndustrialRent growth for industrial space inched up to 2.6 percent in 2Q13 from 0.8 percent in 2Q12, and vacancy improved to 12 percent, compared to 13.1 percent in 2Q12.22 Net absorption was a strong 46.5 million square feet in 2Q13, compared to 24.2 million square feet in 2Q1223 attributed to e-retailers and their shippers leasing more warehouse space given the increase in online shopping. We believe this trend will continue well into 2014. Warehouse operators may be able to use their existing space more efficiently via advanced supply chain management and automated warehouse management systems.
MultifamilyThe apartment sector continues to post a strongperformance, with vacancy and rent growth near historical levels. In 2Q13, effective rent growth and vacancy was 3 percent and 4.6 percent compared with 5 percent and 4.8 percent, respectively, during 2Q12.24 In addition, the sector continues to witness a strong development pipeline supported by healthy absorption. In 2Q13, net absorption totaled 119.7 million square feet compared to 70.2 million in 2Q12.25 However, the robust development pipeline is likely to exert pressure on rent and occupancy in the medium term as concerns about oversupply build in a few cities. That said, we believe apartment owners/operators are comparatively less impacted by the onslaught of technology from a demand-supply perspective. In fact, they are benefitting from adopting technology in the leasing and tenant service processes to establish better rapport with existing and potential tenants.
CRE fundamentals – A business case for retrofits
2014 commercial real estate outlook Business transformation is key 9
LodgingThe lodging sector reported solid growth, although the pace of increase has moderated compared to the same period last year. In 2Q13, higher occupancy (+1.3 percent YOY to 65.9 percent) and average daily rate (ADR) (+3.6 percent YOY to $110.5) led to a 5 percent YOY growth in revenue per available room (RevPAR).26,27 In general, lodging operators potentially need to upgrade technology in existing space to allow tenants to offer enhanced levels of guest convenience through smart reservation systems. In particular, business hotels face competition from increased use of video and virtual meetings
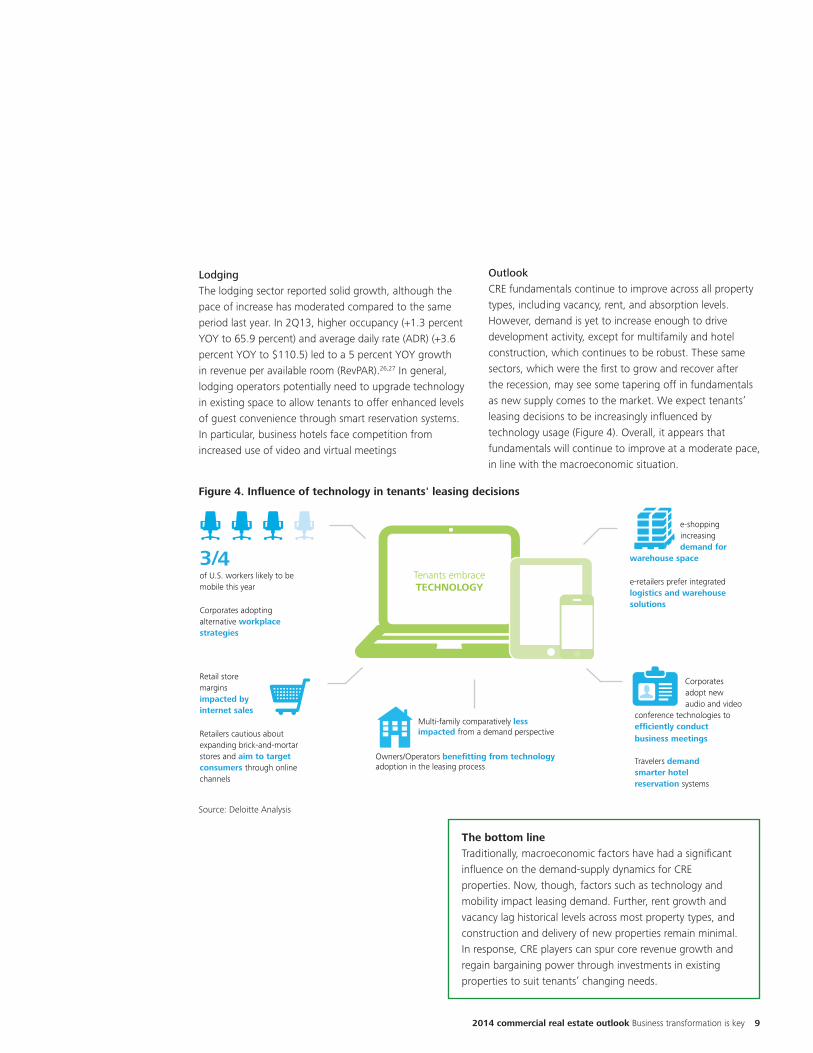
Figure 4. Influence of technology in tenants' leasing decisions
The bottom lineTraditionally, macroeconomic factors have had a significant influence on the demand-supply dynamics for CRE properties. Now, though, factors such as technology and mobility impact leasing demand. Further, rent growth and vacancy lag historical levels across most property types, and construction and delivery of new properties remain minimal. In response, CRE players can spur core revenue growth and regain bargaining power through investments in existing properties to suit tenants’ changing needs.
OutlookCRE fundamentals continue to improve across all property types, including vacancy, rent, and absorption levels. However, demand is yet to increase enough to drive development activity, except for multifamily and hotel construction, which continues to be robust. These same sectors, which were the first to grow and recover after the recession, may see some tapering off in fundamentals as new supply comes to the market. We expect tenants’ leasing decisions to be increasingly influenced by technology usage (Figure 4). Overall, it appears that fundamentals will continue to improve at a moderate pace, in line with the macroeconomic situation.
Source: Deloitte Analysis
3/of U.S. workers likely to be mobile this year
Corporates adopting alternative workplace strategies
4Tenants embrace TECHNOLOGY
Retail store margins impacted by internet sales
Retailers cautious about expanding brick-and-mortar stores and aim to target consumers through online channels
Multi-family comparatively less impacted from a demand perspective
Owners/Operators benefitting from technology adoption in the leasing process
Corporates adopt new audio and video
conference technologies to efficiently conduct business meetings
Travelers demand smarter hotel reservation systems
e-shopping increasing demand for
warehouse space
e-retailers prefer integrated logistics and warehouse solutions

10
The single-family or SF housing market is abuzz with rental activity as institutional investors continue to increase their appetite for purchasing and renting foreclosed homes. As we highlighted in our last outlook, SF homes have emerged as a separate asset class, with a few companies completing initial public offerings as REITs and several more expected to follow. The current institutional investment in SF homes stands at $17 billion.28 Consequently, a backlog of delinquent homes is now forming a part of the foreclosed pipeline, which is likely to clear the glut and is a positive sign from a long-term perspective. In fact, according to Realty Trac, foreclosure filings and starts declined 27 percent and 39 percent YOY, respectively, in September.
Housing fundamentalsThe emergence of the SF rental segment has provided much needed support to the otherwise beleaguered housing market, as most stats point to a recovery
(Figure 5). One of the most positive changes is that average home prices are back to spring 2004 levels.29 The S&P/Case-Shiller Index (national composite) rose 10.1 percent YOY in 2Q13. According to the Zillow Home Prices Expectation Survey, home prices are expected to appreciate 6.7 percent by the end of 2013, eventually slowing to 4.4 percent in 2014 and 3.4 percent in 2017.30 From a demographic perspective, first-time home buyers have also stepped up purchases, which is a positive sign. According to the 2012 National Association of Realtors Survey, entry-level buyers accounted for 39 percent of purchasers, which is close to the typical 40 percent.31
Residential mortgage marketsAnother emerging bright spot for the SF market is a modest improvement in the residential mortgage market. According to the Federal Reserve’s July Senior Loan Officer Opinion Survey on Bank Lending Practices, demand for prime residential mortgages is moderately stronger, while
Figure 5. SF homes
Source: National Association of Realtors, S&P Case-Shiller, Zillow Real Estate Research, RealtyTrac, and Deloitte Analysis
Total housing inventory increased
0.4%MOM in August. However, in light of increased sales, it reduced to
4.9-monthsupply compared to
6-monthsupply a year ago
Institutionalization of the housing sector
Foreclosure filings declined
27%YOY in September. Distressed home sales reduced to
12%of August sales, substantially lower than
23%recorded a year ago
Emergence of a robust rental market
Modest improvement in residential mortgage market
Foreclosure
New single family home
sales up 12.6% YOY
Existing home sales up
13.2% YOY
12.6% 13.2%10.1%
YOY
in 2Q13 home prices
rose 10.1% YOY
Prices expected to rise 6.7% YOY
in 2013 and 4.4% YOY in 2014
%6.7 4.4%
6Focus areas
Competitionand markets
Clients
and products
Tech
nolo
gy
dyna
mics
Organizational
effectiveness
Financialmanagement
Gover
nanc
e, ris
k
and
com
plia
nce
Single-family homes – Big investors help drive housing rebound

2014 commercial real estate outlook Business transformation is key 11
The bottom lineWhile most parameters point to a recovery, the overall housing market still lags the stable market seen during the mid-to-late 1990s. Developers should be more innovative in designing new construction, as demand increases for new formats such as NextGenii homes. Individual buyers should be careful about market timing and asset selection as the lending market remains tight compared to historical levels. Institutional investors can potentially consider engaging third-party managers with proven expertise in property management, given their relative inexperience in this area. This is critical, as SF operators with improved operations and financing are likely to benefit as the sector matures.
i The survey defines “prime” mortgage as loans to borrowers with strong credit histories, high credit scores, and low debt-to-income ratios. “Non-traditional” mortgages include loans with limited income verification, mortgages secured by non-owner-occupied properties, interest-only mortgages, and loans with multiple payment options. Sub-prime mortgages include loans made to borrowers with weakened credit histories.
ii NextGen homes encompass a ‘home’ within a ‘home’ to accommodate multiple generations of a family and are seeing an upsurge in demand given changes in economic situations (unemployment and foreclosures).
it remains consistent for non-traditional and sub-prime loans.i 32 Credit standards for all loan categories remain predominantly unchanged. However, the recent rise in mortgage rates may slow refinancing activity, which accounted for 70 percent of mortgage originations during 1H13.33 Residential mortgage backed security (RMBS) issuance totaled $1.4 trillion through September, primarily driven by agency issuances.34 Non-agency issuance continues to languish and is likely to account for only 1 percent of total RMBS issuance, although it is expected to increase to $20 billion in 2013 from $12 billion in 201235 Delinquencies (seasonally adjusted) fell to 9.4 percent in 2Q13 compared to 9.7 percent in the preceding quarter.36
OutlookWe expect institutional interest in SF homes to continue to support the ongoing recovery. In addition, home ownership is on the mend, with buyers returning to the market. This likely bodes well for the housing sector in general; however, there is some concern about rental rates sustaining the same pace of growth as home prices. As we look ahead to 2014, an uptick in development activity - increased housing starts and land purchases, appears likely. Builders are drawing up expansion plans, which include diversification and/or initial public offerings. However, stringent lending standards for construction loans and a shortage of skilled labor are likely to act as headwinds. Further, the outcome of the government-sponsored enterprise (GSE) reforms and qualified mortgages could play a pivotal role in thawing the mortgage market.

12
Policy & regulatory – Uncertainty prevails
Historically, real estate has been more directly impacted by local regulations such as entitlements and building codes than by Federal regulations, other than those related to income taxes and environmental protection. Federal regulations, which impact the capital markets, typically have an indirect, yet significant, impact on the real estate industry. The 2008 financial crisis resulted in thedevelopment of several regulations, such as the Dodd-Frank Act, which have far-reaching implications for the industry as a whole, with certain provisions impacting CRE financing. Many of these regulations are at various stages of finalization and/or implementation. In addition, there are other regulations that may potentially affect CRE financing and accounting (Figure 6).
Terrorism Risk Insurance Act (TRIA)37
The impending expiry of TRIA is likely to have an immediate impact on CRE financing. Unveiled in 2002 and extended in 2007, TRIA provides a federal backstop to insurers for terrorism coverage of CRE properties. This gives lenders confidence to provide funding for construction and ownership of real estate. TRIA’s popularity is evident in the uptick in adoption rate for all terrorism coverage – approximately 62 percent currently compared to 27 percent in 2003. More specifically, the current adoption rate for financial institutions and real estate players is close to 80 percent.38 TRIA is scheduled to expire by the end of 2014, but the impact of the pending expiration would be felt much sooner by CRE developers and owners. This means that effective January 1, 2014, the market for terrorism coverage will likely begin to dry up, if not evaporate entirely, which can impact both new and ongoing project financing. In case of TRIA’s non-renewal,
6Focus areas
Competitionand markets
Clients
and products
Tech
nolo
gy
dyna
mics
Organizational
effectiveness
Financialmanagement
Gover
nanc
e, ris
k
and
com
plia
nce
existing loans can run into a technical default, creating a double whammy for the CRE industry: not only will coverage become expensive and/or scarce, but financing will be hard to come by. Lease accounting standardsOn the accounting front, the latest exposure draft of the Financial Accounting Standards Board (FASB) and International Accounting Standards Board (IASB) proposes to require tenants to record leases as right-of-use assets and financing liabilities on their balance sheets, and report rent expense on a straight-line lease basis in their income statements. While the accounting boards aim to create greater corporate transparency and consistency in lease accounting presentation, industry stakeholders have raised concerns about the potential negative impact of the new standards on tenant behavior, existing CRE debt covenants, lending, and property valuations.39
Foreign Investment in Real Estate PropertyTax Act (FIRPTA)The FIRPTA reform bill proposes to double the maximum tax-exempt foreign stake in public REITs to 10 percent and allow additional categories of redemptions and liquidations of foreign ownership interests in domestically-controlled REITs to be treated as sales of stock, effectively exempting them from taxation.40 Further, earlier this year, the government proposed to exclude foreign pension funds from the purview of the Act, effectively putting them on even ground with their U.S. counterparts. If passed, the proposed reforms likely will encourage foreign equity investments in U.S. CRE.

2014 commercial real estate outlook Business transformation is key 13
Foreign Account Tax Compliance Act (FATCA)FATCA requires foreign financial institutions and investment funds to comply with the new reporting rules with respect to their U.S. account holders and investors, or face a new 30 percent withholding tax on the U.S. source payments made to them. U.S. based investors will also be required to furnish information regarding foreign assets and transactions involving certain foreign entities in order to avoid penalty. The new proposals, which will impact CRE funds and REITs, likely will be implemented in July 2014, resulting in additional compliance and reporting costs.
The bottom lineGiven the regulatory uncertainty, chief risk officers (CROs) and chief financial officers (CFOs) at CRE companies should effectively utilize this time to assess the potential impact to their business. However, this may not be an easy task, as stakeholders may need to make adjustments based on the assumption that the rules have changed. In addition, portfolio managers should consider regulations impacting international investments while designing their strategy, especially as global diversification gains traction.
Regulation IssueLikely impact
TRIA Risk of non-renewal
Lease accounting standards
Capitalization of operating leases
FIRPTA Higher exemption limits
FATCAWithholding tax for U.S. sourced payments for non-U.S. funds
Figure 6. Regulatory issues and likely impact
Source: Deloitte Analysis
OutlookWith most regulations at various stages of development, the associated uncertainty is likely to promote caution within the real estate industry. In the past, Congress has utilized a wait-and-see approach on TRIA and extended it at the last minute. However, the effects of a looming expiration would be felt long before TRIA’s actual demise. The proposed changes to FIRPTA and FATCA likely will impact international investments through 2014.

14
CRE lending – On more steady ground
6Focus areas
Competitionand markets
Clients
and products
Tech
nolo
gy
dyna
mics
Organizational
effectiveness
Financialmanagement
Gover
nanc
e, ris
k
and
com
plia
nce
The CRE lending landscape is more stable compared to a year ago, with lenders increasing commercial mortgage issuances due to the improving economy and rising property prices. We see a clear bifurcation in credit availability across markets. While lenders continue to compete for large CRE loans in primary markets, traditional funding sources remain scarce in secondary and tertiary markets. Concerns around loan performance and refinancing options for maturing debt ($1.6 trillion during 2014-18) have alleviated and paved the way for a healthier funding scenario.41
Lending scenario – Banks & CMBS Life insurance companies and GSEs continued to lead Commercial Mortgage Originations (CMOs) in 1H13 (Figure 7), although traditional lenders such as banks are extending more CRE loans. Banks are now willing to accept higher loan-to-value (LTV) ratios for CRE loans and have eased lending standards. According to the Federal
0
100
200
300
400
500
600
700
1Q05
2Q05
3Q05
4Q05
1Q06
2Q06
3Q06
4Q06
1Q07
2Q07
3Q07
4Q07
1Q08
2Q08
3Q08
4Q08
1Q09
2Q09
3Q09
4Q09
1Q10
2Q10
3Q10
4Q10
1Q11
2Q11
3Q11
4Q11
1Q12
2Q12
3Q12
4Q12
1Q13
2Q13
Index
CMBS Commercial Banks Life Insurance Companies Fannie Mae/Freddie Mac
Reserve’s July Senior Loan Officer Opinion Survey on Bank Lending Practices, on a net basis, nearly 21 percent of the banks eased lending standards on CRE loans in 2Q13. However, banks continue to maintain relatively stringent standards around asset location and borrower credit quality.42 In 2Q13, bank CMOs grew 14 percent YOY, with the Mortgage Bankers Association (MBA) index rising to 196, its highest 2Q level since 2008.43 In addition, banks’ CRE loan delinquencies declined 96 bps and stood at 2.2 percent in 2Q13.44 CMBS issuances have also exceeded expectations, with the $64.6 billion raised as of October being 82.6 percent higher than the same period last year.45 Regional and community banks; however, remain cautious about extending loans outside class ‘A’ markets as they are yet to recover fully from the substantial loan losses suffered during the financial crisis and some of them are still focused on restructuring troubled mortgages.
Figure 7. Commercial/multifamily mortgage originations – MBA Index
Source: MBA, 2Q13

2014 commercial real estate outlook Business transformation is key 15
OutlookOver the past year, the recovery in CRE financing has been more broad-based, and should likely continue in 2014. We expect banks to continue gradually easing lending standards, although construction loans will remain difficult to obtain. Conduits and private lenders, often referred to as “shadow lenders,” will fill the void created by the banks, especially in non-prime markets. In addition, hedge funds will continue to extend construction loan funding to mid-market companies. However, these loan options may be relatively expensive, typically in the range of 9-12 percent for a term of one to three years.46 Risks include the expected wind-down of the Fed’s bond-buying program and the uncertainty around regulations that are likely to impact CRE financing (Dodd-Frank Act and TRIA), which, in turn, likely will increase interest rates and may impede recovery in the near-to-medium term.
The bottom lineAn improved and stabilized lending environment with better lending terms bodes well for the CRE industry as it creates more opportunities for domestic investments. Given fewer concerns around deleveraging the balance sheets, CRE companies may opt for more competitive deal structures. In fact, according to a 2013 REIT executive survey, nearly one-fourth of respondents indicated their plan to increase leverage.47 The next step in the lending environment may be gradual leniency in construction loan standards, and improved borrowing for secondary and tertiary market properties. Players with healthy balance sheets may decide to use this opportunity to tap the non-prime markets and move up the risk curve.

16
U.S. REITs and private equity real estate (PERE) funds have continued to raise more capital on a YOY basis, reflecting improved investor confidence in the U.S. CRE recovery. However, unlike relative increases in the past few years, REIT stocks have underperformed other asset classes, largely due to the recent spike in interest rates.
REITsAs of September, REIT fundraising rose 11.5 percent YOY to $60.6 billion, with nearly two-thirds of the capital raised through the equity route.48 REIT IPOs have been at their highest level (in terms of number and value of transactions) since 2005 and have ranged from traditional RE asset classes to more non-traditional RE classes, including SF rentals and data centers. In contrast to the last three years, REITs underperformed traditional asset classes with returns of 4.3 percent in 2013YTD (as of October 10) compared to 20.7 percent for the S&P 500 and 27.2 percent for the Russell 2000.49 Nonetheless, we expect that this is likely
26.2 36.955.5 70 83.5 86.1 95.2 80.2 93.3 88.8 97.8
6.14.8
18.7
29.7
48.8 50.247.7
37.736.5 33
36.5
6.713.5
23.9
32.9
34.6 35.1 37.6
36.437.2
34.835.6
2 2 0.5 3 2 3
20 1612
21 2635
4635
27
18
5
10
1914
26
23
0
10
20
30
40
50
60
70
80
FY06 FY07 FY08 FY09 FY10 FY11 FY12 FY13YTD*
$ Billion REIT Fundraising
22 0
50
100
150
200
Dec
-03
Dec
-04
Dec
-05
Dec
-06
Dec
-07
Dec
-08
Dec
-09
Dec
-10
Dec
-11
Dec
-12
Sep-
13
$ Billion Global PERE Dry Powder
North America Asia and Rest of the World EuropeInitial Public Offering Secondary Equity Secondary Debt
4% 38% 56%During the six monetary tightening cycles since 1979, when U.S. treasury yields rose significantly, REITs generated cumulative returns of 56.5 percent compared to 38.3 percent returns on stocks and 4.2 percent on bonds
REITs
Stocks
Bonds
a short-term phenomenon; historically, REIT performance and CRE values have improved during periods of rising interest rates and a strengthening economy. During the six monetary tightening cycles since 1979, when U.S. treasury yields rose significantly, REITs generated cumulative returns of 56.5 percent, compared to 38.3 percent returns on stocks and 4.2 percent on bonds (Figure 8).50
PEREU.S. PERE funds raised nearly $34 billion as of September 2013 and will likely maintain a positive annual growth clip for the third straight year.51 These funds exhibited improved performance in 2012 with average internal rate of return (IRR) of 6.4 percent compared to 4.9 percent in 2011, driven by the sustained recovery in real estate prices.52 In addition, PERE dry powder available for investment in North America aggregates to $97.8 million and accounts for 57.6 percent of the global total (Figure 8).
Figure 8. Comparative returns, REIT fundraising, and PERE dry powder
* FY13YTD is as of September 2013; Note: Circles representing returns are not to scaleSource: Cohen & Steers, April 2013; NAREIT and Preqin, October 2013
CRE Investments – Continued REITs and PERE interest
6Focus areas
Competitionand markets
Clients
and products
Tech
nolo
gy
dyna
mics
Organizational
effectiveness
Financialmanagement
Gover
nanc
e, ris
k
and
com
plia
nce

2014 commercial real estate outlook Business transformation is key 17
Unlike the past, PERE funds have diversified investments into foreclosed SF homes over the past 18 months. Large players have helped create a SF rental market through bulk purchases of foreclosed homes, which has led to the emergence of SF homes as a new asset class. While some players have listed as public REITs, others are looking for opportunities to monetize their portfolios in secondary markets to benefit from the recent surge in home prices.
OutlookDespite the recent decline in REIT valuations, investors likely will continue to favor REITs to earn higher yields. In addition, REITs as an asset class now provide more diversification opportunities with the advent of non-traditional REITsiii and the recently introduced SF home REITs. For instance, Timber REITs provided the highest returns (37.1 percent) among the REIT sub-sectors in 2012, and continued to provide positive returns in FY13YTD (as of August) -- even as other sub-sectors delivered sub-zero returns.53 Moving forward, REIT returns are expected to stabilize to more sustainable levels in 2013 and 2014. Private equity will continue to focus on non-core markets, given higher return prospects. A majority of these funds are looking to invest in opportunistic and value-add real estate assets, which is becoming increasingly competitive as 458 funds are targeting total commitments of$162 billion.54
The bottom linePERE investors have shown an increased interest in CRE following the recession, given favorable pricing. However, they need to craft an effective exit strategy for legacy investments to derive maximum gains. REITs continue to raise additional capital and drive property transactions. They should also evaluate new alternatives for growth, such as substantial updating and repositioning of existing properties to meet evolving tenant needs, mergers and acquisitions, or select international expansion. That said, REITs can potentially consider increasing dividends or repurchasing preferred or common shares based on their balance sheet strength.
iii Owners of income-producing real estate such as timber, data centers, document storage facilities, cell towers, prisons, and billboards are classified as “non-traditional” as the underlying assets have different and unique characteristics compared to the owners of traditional properties. These companies have opted to convert to a REIT to capitalize on the benefits of the structure.

18
Transaction activity continues to be the sweet spot for the CRE sector, driven by easier access to low- cost capital and a strengthening economy. The consequent increase in investor interest, both domestic and global, drove the price of high-quality CRE above pre-recession highs in 2Q13.
Property transaction volumes grew 17.1 percent YOY to $162.1 billion as of July 2013, as REITs and private CRE firms have been on an acquisition spree (Figure 9).55 REITs led transaction activity with positive net investments of $14.2 billion in 1H13, up 84.5 percent YOY (Figure 10).56
0
100
200
300
400
500
600
FY01 FY02 FY03 FY04 FY05 FY06 FY07 FY08 FY09 FY10 FY11 FY12 FY13YTD*
$ Billion
Apartment Hotel Industrial Office Retail
Figure 9. U.S. CRE transaction volume by property type
Figure 10. Net CRE acquisitions by investor type
*YTD is as of July 2013Source: RCA, August 2013
Source: RCA, YTD June 2013
M&A activity continues to rise, as deal value increased 32 percent YOY in 1H13 to $22.9 billion, driven by large deals in the office and apartment sub-sectors.57 Regionally, the Westiv continued to lead transaction volume and accounted for 27 percent of total 1H13 volumes.58
(3.2)(0.2)
7.7
(1.5) (1.7) (1.1)
0.2
(19.4)
14.2
8.5
(3.2)(0.3)
(20)
(15)
(10)
(5)
0
5
10
15
20
Cross-Border Inst'l/Eq Fund Listed/REITs Private User/other Unknown
$ Billion
1H12 1H13
iv Per RCA, CRE markets in the West include East Bay, Inland Empire, Las Vegas, Los Angeles, Orange Co, Portland, Sacramento, Salt Lake City, San Diego, San Francisco, San Jose, Seattle, and Tertiary West.
CRE deal flow – Focus shifts beyond core markets
6Focus areas
Competitionand markets
Clients
and products
Tech
nolo
gy
dyna
mics
Organizational
effectiveness
Financialmanagement
Gover
nanc
e, ris
k
and
com
plia
nce

2014 commercial real estate outlook Business transformation is key 19
Increased transaction volumes continue to have a positive impact on overall property prices and cap rates. However, we can see a reduction of the prior bifurcation between core and secondary markets. Prices of Class A properties in gateway markets have hit a plateau after crossing peak-2007 levels, as Green Street Advisors’ Commercial Property Price Index (CPPI) has remained flat between May and August.59 In contrast, property values in secondary markets continue to rise, as investors increase theirrisk appetite.
The increase in property prices and lenders’ strong focus on loan workouts has produced a steady decline in distressed assets and underwater loans. Distressed CRE sales declined 15.2 percent YOY to $11.8 billion in 1H13, and comprised 7.8 percent of total CRE sales compared to 11.7 percent in 1H12. However, distressed CRE sales may still represent an important chunk of total deal activity in the next few quarters, as $97.2 billion (34.1 percent of 2012 transaction volumes aggregating $285.4 billion) of distressed assets remain outstanding.60
OutlookCRE deal flow likely will continue to increase in 2014 due to favorable fundamentals, capital availability, and positive cap rate spreads over the 10-year treasuries. Sale and leaseback transactions are likely to boost transaction activity as more companies opt for such deals to unlock value of their owned real estate and earn higher returns on their core businesses. In addition, we expect private and international investors to increasingly look for higher-yield real estate investments in secondary and tertiary markets, and help support the broader transaction market recovery.
The bottom lineReal estate investors with healthy balance sheets and liquidity may want to look at the value offered by properties in non-prime markets when designing their portfolio and acquisition plans given compressed cap rates for prime assets. Companies may consider different routes for investments – direct purchase, M&A, and/or sale and leaseback transaction. For over-leveraged companies, we expect to see increased use of joint ventures with institutional investors looking to increase their real estate allocations.

20
By 2025, Gen Y employees, now in their 20s,
will grow to represent
75%of the workforce
CRE companies need to
re-strategize and refresh their
talent brand to derive bottom
line benefits
Social Media Is challenging the status quo of
developing talent capabilities,Use of mobile has led to
higher virtual collaboration
Employees prefer to work fewer hours
and get better work-life balance
Companies need to rethink about
the entire talent chain, from skills considered at the
time of hiring to the incentive structure
and finally up-skilling the existing pool
Tenants are also focused on improving the quality of their workforce, as
sustainability has moved beyond energy efficiency and carbon footprint reduction
Average age of employee in the real estate industry is
40-50 years
Universities have launched several
real estate specific programs from undergraduate to
post-graduate level.
The talent conundrum – Does experience count?
6Focus areas
Competitionand markets
Clients
and products
Tech
nolo
gy
dyna
mics
Organizational
effectiveness
Financialmanagement
Gover
nanc
e, ris
k
and
com
plia
nce
CRE companies traditionally hired business school graduates and groomed them for promotion and future growth, given that CRE is a relationship-based business and there weren’t many specialized academic offerings. The average age of an employee in the real estate industry is 40-50 years old (Figure 11), subject to function and level. A higher proportion of older professionals has worked for the sector to date, as winning incremental business has been associated with experience.
Moving into 2014, talent is becoming a key agenda item for CRE executives and boards. In fact, experts argue that talent deserves the same priority as capital. We concur, especially in light of the following trends that are redefining the corporate ecosystem for CRE players:
Unlike the past, tenants’ leasing decisions today are being influenced by their talent demographics. To put the situation in perspective, by 2025, Gen Y employees, now in their 20s, will grow to represent 75 percent of the global workforce.61 Increased digitization – the use
of mobile technologies, among other things -- has led to higher levels of virtual collaboration. In addition, both men and women are opting to work fewer hours in the office to attain a better work-life balance; employers are allowing this flexibility.62,63 These trends are requiring that organizations think about workplace flexibility as a means to improve productivity.
Further, tenants are also focused on improving the “quality of life” of their workforce in the office, moving sustainability beyond energy efficiency and carbon footprint reduction. Real estate investors could benefit by giving their HR professionals a strategic role in real estate acquisition and development decisions.
Lastly, CRE players cannot develop and nurture their talent brand independent of their corporate brand, as the hyper-connected, social-media savvy world is blurring these lines. Gen Y employees increasingly are connecting their self image to their employer’s brand and commitment to social responsibility, even including this criteria in their job search.
Figure 11. The talent conundrum
Source: Huffington Post, Center for American Congress, and Deloitte Analysis

2014 commercial real estate outlook Business transformation is key 21
OutlookIs the older, experienced CRE talent pool equipped to drive future profitability within the context of the above trends? We believe there is an age gap, which expands moving up to the core real estate functions and executive-leadership talent pool. The high unemployment rate in the United States and abroad has not created a talent surplus; rather, there is a shortage across functions responsible for innovation and growth. The situation is exacerbated by the fact that over 65 percent of senior leaders will retire by 2020 and the next level is not prepared to fill the vacuum.64 Companies should more aggressively manage succession planning and the development of their futureleadership pipeline.
The good news is that a thoughtful and effective talent strategy need not be expensive – it’s more about innovation and a willingness to flex outmoded assumptions that hold a company’s talent hostage to pre-technology, pre-mobility thinking. The war for talent may have gone underground in the recent financial crisis, but we expect competition for top talent to re-emerge; many CRE sectors are already seeing this dynamic occurring. A comprehensive and well-designed talent strategy addresses and mitigates these organizational risks.
The bottom lineThere has been an improvement in real estate-focused university offerings, with at least 15 U.S. universities providing graduate programs in real estate.65 In addition, 30 universities offer MBA programs with a real estate concentration and there has been an increase in real estate programs at the undergraduate level, as well. With the academic world gearing up to fill the gap by preparing Gen Y for the industry, companies need to re-strategize and refresh their talent brand to attract this new generation and derive bottom-line benefits.
In parallel, CRE companies should rethink their entire talent chain approach this should be at the time of recruitment, companies should consider broader functional skills, leadership and personality attributes, along with academic qualification. In grooming existing and future top management, executives should recognize and prioritize strategic skills, along with innovative and creative thinking, a trend evident in some European nations. Talent development and assessment should have a holistic focus on strategic, creative, and leadership competencies. Further, retention should be driven by a more attractive incentive structure, workplace flexibility for better work-life integration, and efforts to provide more meaningful work experiences that leverage employees’ strengths, while also developing skills and capabilities needed to progress in the organization.

22
Finance transformation – Technology will be the key driver
6Focus areas
Competitionand markets
Clients
and products
Tech
nolo
gy
dyna
mics
Organizational
effectiveness
Financialmanagement
Gover
nanc
e, ris
k
and
com
plia
nce
The finance function at CRE companies typically spends the bulk of its time consolidating and reporting key pieces of financial information across the organization and externally. This is primarily because many real estate companies have de-centralized financial operations and systems that use multiple enterprise systems, as well as offline tools, such as MS Excel. Companies also make significant use of process and procedure manuals to perform core activities. Most of the larger real estate companies use leading ERP solutions for corporate management and point solutions for different functions, and face integration challenges.66
As the CRE sector enters a modest growth phase and many prior balance-sheet concerns have been addressed,
Current Scenario
Offline tools andpoint solutions
Business intelligence& analytics
Integrated financialsystems
FinancetransformationAccounting
Budgeting &forecasting
Strategicdecisionsupport
Enhancedorganizational
structure
Cost efficiencyReporting
Decentralized anddisparate systems
Manual processes& procedures
Automation,standardization,
and sharedservices capabilities
Post-transformation
the CFO’s role is becoming increasingly valuable and complex. CFOs are being asked to focus on improving cost efficiency and competitiveness, as well as using enhanced technology and analytics to deliver strategic insights (Figure 12). This requires automation and standardization of repetitive and transactional tasks, and increased accuracy, efficiency, and speed of core finance operations to effectively manage business information and reporting. These requirements can be achieved with more robust technologies, a redefined chart of accounts, and the introduction of shared services capabilities and enhanced organizational structures (e.g. centralization, regionalization).
Figure 12. Technology enables finance transformation
Source: Deloitte Analysis

2014 commercial real estate outlook Business transformation is key 23
The above transformation may require companies to overhaul their core finance reporting systems and processes. While this can be a lengthy and costly effort, companies can facilitate the process by answering questions such as:67 • Do the current system’s capabilities align with
leadership’s objectives to support the business for the next three or five years?
• Does current technology provide the information, tools, and services that business leaders are demanding for shorter- and longer-term planning, decision support, and strategy implementation?
• Can the technology be scaled to support business model changes, company’s growth, and expansion into new markets?
• Can the technology generate information that can help management plan for and address unexpected events or risks that may impact earnings?
• Does the technology enable the finance organization to comply readily with new regulations and report on such compliance?
OutlookFinance transformation is a hot topic for the CRE sector. We anticipate that a great number of companies may opt for piecemeal implementation rather than large upfront
The bottom lineCRE companies tend to have a multi-entity structure, with properties spread across various geographies. At the same time, each company typically has a unique finance operating model using different legacy systems. Therefore, companies should consider challenging current practices, identifying an optimal finance model, and evaluating the right mix of technology to achieve their goals. Successful companies are challenging the status quo and asking if their finance operating model reflects innovative practices that have been adopted by leading companies both within and outside their RE industry peer group. Companies also may benefit from early interaction with various business stakeholders in order to realize value at each project stage, while also adopting a disciplined approach to drive value and ensure successful execution.
investments. The choice may not be an easy one for technology leadership to make, as they balance long-term strategic imperatives against the imminent need for technology revamps across various functions and processes.

24
Business transformation is key
Domestic and global interest in U.S. CRE is expected to continue in 2014 and the financing environment is likely to further improve, including both equity and debt issuances. Together, these factors should increase deal flow in the non-prime property markets, although regulatory uncertainty and fiscal policy issues present a number of risks for CRE. Increased institutional activity is anticipated to help clear the SF foreclosure pipeline and continue to support the housing recovery, but rent growth may be slower compared to home price appreciation. The housing recovery likely will lead to a muted revival in construction activity, with increased demand for new homes, particularly in formats such as NextGen.
Driven by evolving customer and tenant needs, the CRE industry is undergoing a fundamental change in the way it does business, challenged by technology proliferation in the forms of automation and digitization, and the evolution of a new virtual world. Some elements of this transformation may include redesigning existing space to suit new demands from tenants, increasing automation, and re-tooling the existing talent pool. With most CRE fundamentals pointing to average growth through 2014, we suggest that CRE management and boards consider factoring-in the influence of these new forces to derive above-average growth, achieve operational excellence, and be better-positioned for the long term.

2014 commercial real estate outlook Business transformation is key 25
Contacts
Industry leadership Bob O’BrienVice Chairman and PartnerGlobal and U.S. Real Estate Services LeaderDeloitte & Touche LLP+1 312 486 [email protected]
Deloitte Center for Financial Services Jim EckenrodeExecutive DirectorDeloitte Center for Financial ServicesDeloitte Services LP+1 617 585 [email protected]
AuthorsLead AuthorSurabhi ShethResearch Leader, Real EstateDeloitte Center for Financial Services Deloitte SVCS India Pvt. Ltd.+1 615 718 [email protected]
Co-authorSaurabh MahajanAssistant Manager, Real EstateDeloitte Center for Financial ServicesDeloitte SVCS India Pvt Ltd.
The Center wishes to thank the following Deloitte client service professionals for their insights and contributions to this report:
Ken Meyer, Principal, Deloitte Consulting LLPMatt Kimmel, Principal, Deloitte FAS LLPDean Halfacre, Partner, Deloitte Tax LLPGuy Langford, Principal, Deloitte & Touche LLPAnton Sher, Principal, Deloitte Consulting LLPCelia Ramos, Principal, Deloitte Consulting LLPWyndham Smith, Partner, Deloitte & Touche LLPBurt Rea, Director, Deloitte Consulting LLPKeith Bown, Senior Manager, Deloitte & Touche LLP
The Center wishes to thank the following Deloitte professionals for their support and contribution to the report:
Catherine Flynn, Senior Marketing Manager, Deloitte Services LPKaren Ambari, Senior Manager, Deloitte Services LPMark Wojteczko, Senior Manager, Deloitte Services LPDerrick Nakamura, Lead Graphic Designer, Deloitte Services LPRobert Libbey, Lead Market Research Analyst, Deloitte Services LP

26
End notes:
1 Global Economic Outlook Q32013 Overview, Deloitte University Press 2 Bureau of Economic Analysis, August 29, 2013 3 Global Economic Outlook Q32013 Overview, Deloitte University Press.4 Institute of Supply Management, October 1, 20135 Bureau of Labor Statistics, September 6, 20136 Ibid7 Ibid8 Global Economic Outlook Q32013 Overview, Deloitte University Press9 Ibid10 RCA August 201311 “The Great Wall of Money”, DTZ Research, March 201312 Ibid13 “Cross-border Capital Tracker”, 2Q13, RCA14 Bureau of Economic Analysis15 CB Richard Ellis - Econometric Advisors (CBRE-EA), Overview & Outlook - Office, 2Q1316 Ibid17 John Hagel III, John Seely Brown, and Tamara Samoylova, Work Environment Redesign: Accelerating talent development and performance
improvement, Deloitte June 3, 201318 Regus, Flexibility Drives Productivity, February 201219 CB Richard Ellis - Econometric Advisors (CBRE-EA), Overview & Outlook - Retail, 2Q1320 Ibid21 Ibid22 CB Richard Ellis - Econometric Advisors (CBRE-EA), Overview & Outlook - Industrial, 2Q1323 Ibid24 CB Richard Ellis - Econometric Advisors (CBRE-EA), Overview & Outlook – Multi-Housing, 2Q1325 Ibid26 STR reports 2Q13 results, Hotelnewsnow.com27 Ibid28 Morgan Stanley: Single-family rental is here to stay, SNL Blog, August 201329 Mortgage News Daily, July 2013 30 "U.S. Home Value Appreciation Expected to Top 6 Percent in 2013 as Rising Interest Rates Fail to Derail Recovery – So Far", Zillow, August 201331 2012 National Association of Realtors® Profile of Home Buyers and Sellers, National Association of Realtors, November 201232 The Federal Reserve Board, Senior Loan Officer Opinion Survey on Bank Lending Practices, July 201333 MBA, September 201334 Securities Industry and Financial Markets Association (SIFMA), YTD 2013 data through September 201335 Despite More Favorable Conditions In The Housing Market, The U.S. RMBS Outlook Is Stable, Standard & Poor's, June 201336 Charge-Off and Delinquency Rates on Loans and Leases at Commercial Banks, Federal Reserve, August 201337 Surabhi Sheth, "Impending Expiration of TRIA – A Race to the Finish Line?", Deloitte, September 3, 201338 Erwann O. MICHEL-KERJAN TRIA at Ten Years: The Future of the Terrorism Risk Insurance Program The Wharton School, University of
Pennsylvania, September 2012. 39 Accounting Policy Update, Real Estate Roundtable, May 201340 “Senate FIRPTA Bill Re-Introduced With Strong Bipartisan Backing", Real Estate Roundtable, June 201341 Trepp LLC, 1Q1342 "RELA Chandan Survey – Lending Sentiment Report," 1Q1343 MBA, July 201344 MBA, September 201345 Commercial mortgage alert, October 11, 201346 “Lenders Target Construction As Market Heats Up”, Real Estate Finance and Investment, April 201347 Fifth annual Chatham Financial REIT Capital Survey, 201348 NAREIT, October 201349 NAREIT, October 10, 201350 Cohen & Steers, April 201351 Preqin, October 201352 Thomson Reuters53 NAREIT, August 30, 201354 Preqin, October 201355 U.S. Quarterly Outlook, PREI, July 201356 RCA, August 201357 Thomson Reuters, July 201358 RCA, September 201359 “Property Pricing Stalls’, Green Street Advisors, September 6, 201360 RCA, September 201361 Huffington Post 2010 report62 More magazine, 2011, Third annual “Women in Workplace Study”63 Center for American Progress, August 16, 201264 CEL & Associates, Inc., 201065 NAREIM/FPL Pulse Series, Second Quarter, 201366 "Can Real Estate ERP Vendors Keep Pace with Industry Demands?", Realcomm, April 201167 “How CFOs Can Unlock Value with a New Financial System”, Deloitte WSJ CFO Journal, April 17, 2013

2014 commercial real estate outlook Business transformation is key 27

This document contains general information only and is based on the experiences and research of Deloitte practitioners. Deloitte is not, by means of this document, rendering business, financial, investment, or other professional advice or services. This document is not a substitute for such professional advice or services, nor should it be used as a basis for any decision or action that may affect your business. Before making any decision or taking any action that may affect your business, you should consult a qualified professional advisor. Deloitte shall not be responsible for any loss sustained by any person who relies on this presentation.
About DeloitteDeloitte refers to one or more of Deloitte Touche Tohmatsu Limited, a UK private company limited by guarantee, and its network of member firms, each of which is a legally separate and independent entity. Please see www.deloitte.com/about for a detailed description of the legal structure of Deloitte Touche Tohmatsu Limited and its member firms. Please see www.deloitte.com/us/about for a detailed description of the legal structure of Deloitte LLP and its subsidiaries. Certain services may not be available to attest clients under the rules and regulations of public accounting.
Copyright © 2013 Deloitte Development LLC. All rights reserved.Member of Deloitte Touche Tohmatsu Limited
Deloitte Center for Financial Services