2014 en - french automotive industry - ccfa
TRANSCRIPT
The French AuTomoTive
indusTry2014 Analysis and Statistics
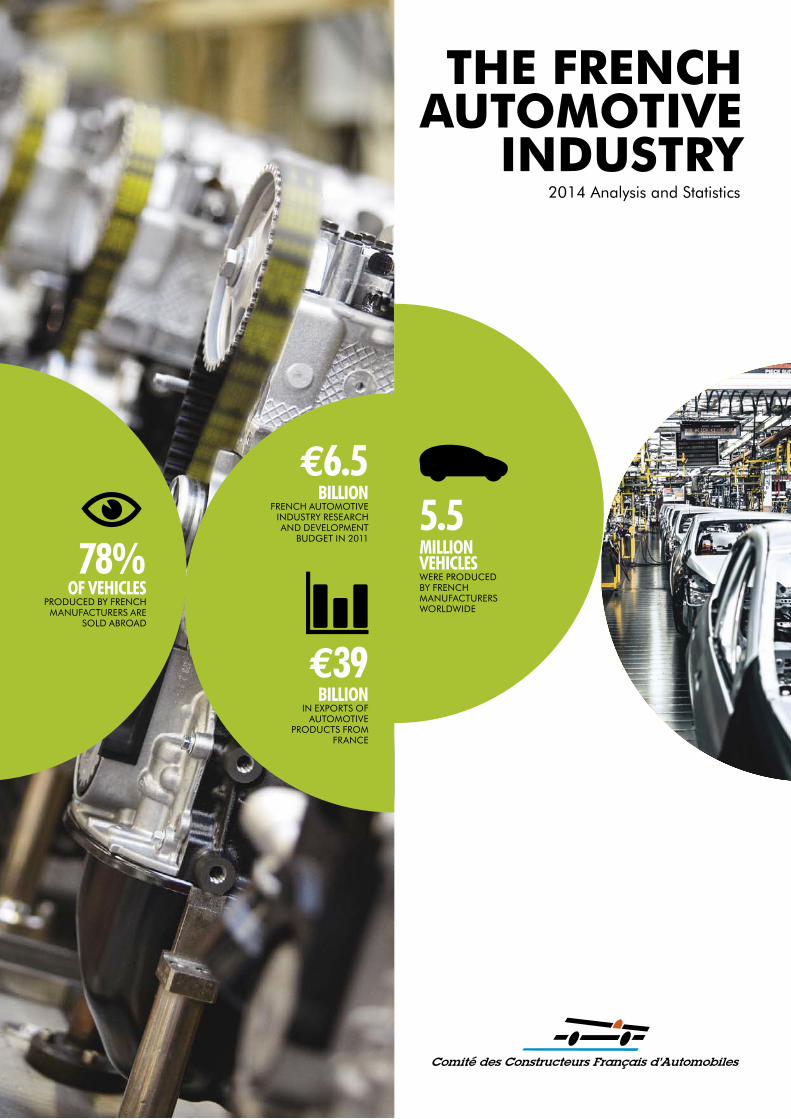
5.5 MILLION VEHICLESwere produced by French mAnuFActurerS worldwide
€39 bILLION
in exportS oF Automotive
productS From FrAnce
€6.5 bILLION
French Automotive induStry reSeArch And development
budget in 2011
78%Of VEHICLES
produced by French mAnuFActurerS Are
Sold AbroAd
Fren
ch au
tomo
tive i
ndus
try,
2014
editi
on
ediToriAl
Patrick Blain, chairman of the ccfa
01
europe
14 • marketS anD fleet
23 • Data on the aUto inDUStrY
14
FrAnce
24 • the manUfactUrerS
28 • Data on the aUtomotiVe inDUStrY (comPetitiVeneSS, the Sector, traDe, reSearch anD
DeVeloPment)
38 • marketS anD fleet
44 • roaD tranSPort (VolUmeS anD PriceS)
52 • aUtomoBile PUrchaSeS (PriceS, eXPenDitUre, financinG, DealerS)
56 • recYclinG
58 • economic imPact anD JoBS
24
sTATisTics
62 • world
65 • europe
74 • FrAnce
61
production
04 • ProDUction
10 • marketS anD fleet
12 • traDe
04
AnAlysis And FAcTs
ediToriAlconTenT
PATrick BlAin, chairman of the ccfa
this brochure was produced by ccfa, 2 rue de Presbourg, 75008 Paris – telephone: +33 (0)1 49 52 51 00 – fax: +33 (0)1 47 23 74 73 – Website: www.ccfa.fr – e-mail: [email protected]– Design and production : – Photos: (cover) Dominique Pizzalla / médiathèque PSa, Philippe Stroppa / photothèque renault, Peugeot, citroën, renault, renault trucks. this document is printed on Print Speed laser paper, certified Pefc (Program for the endorsement of forest certification), guaranteeing sustainable management of forests. it was printed by an imprim’vert printer who uses only non-toxic products and ensures the safe collection, storage and processing of dangerous products and waste.
in 2013, despite a very slow recovery in its key european market, the French automotive industry is still turned toward the future. it continues to invest, it is consolidating its national industrial base and is continuing its expansion beyond Western europe.
Dear Sir/Madam,
Growth returned to the global economy in 2009 after the sharp downturn of 2008. The world’s automotive industry attained new highs in 2013, producing more than 87 million vehicles. However, the results vary greatly by geographical region, with, on the one hand, the sluggishness in Western Europe and, on the other, the dynamism of the rest of the world. In the expanding regions, the situations are varied: new large players in the automotive industry, such as China and the ASEAN countries, are producing volumes never seen before, while some countries are slowing, such as India and Russia. Other countries, such as the United States and Japan, are making impressive recoveries from a profound crisis.
As a result of these developments, Western Europe’s share in production is diminishing: it now accounts for only 15% of global production, compared with 29% in 2000. With globalization, the automotive industry is shifting towards the East. The develop-ments in the market reflect this eastward shift. The slowdown did not tamp the strong urge for vehicle ownership in the emerging economies, and the demand among first-time car purchasers also remains robust. Conversely, since the last crisis, the markets of the countries of Southern Europe, where the problems of debts and a weak demand for replacement coincide, have fallen significantly and are not recovering: compared with 2007, sales are down 48% in Italy, 55% in Spain, 79% in Greece. Since 2007, the disappearance of four million vehicles from the Western European market, a major marketplace for French automakers, has had a terrible impact on the entire industry, both on production and sales. France had to tackle a 40% drop in industrial activity, while making every effort to improve domestic competitiveness. At least this bleak environment offers some upside: the neces-sity of French companies to look beyond the euro-zone has turned out to be particularly profitable for them. For the last two years (2012 and 2013), such sales represent more than 40% of their total sales. This well-entrenched strategy that has been in pro-cess for many years is paying off.
In 2013, French manufacturers produced 5.5 mil-lion vehicles worldwide, a creditable performance, at just 9% below the pre-crisis level of 2005. In France, automotive output contracted by 12%, to around 1.7 million vehicles. Various factors lie behind this contraction, the most prominent being
the weakness of the historical Eastern European markets and, above all, the lack of competitiveness of the French industry (well beyond the automotive sector). The report produced at the end of the Industry Summit (EGI) and, more recently, the Gallois Report clearly demonstrated the impact of heavy corporate taxation on the demise of French production. They propose measures to restore the profit margins of French industry, which have fallen compared with those of its European counterparts over several years now. The “Responsibility Pact” initiative, launched in January 2014 by the French President, is an element of this. It is essential to understand how urgent it is to take measures to return competitiveness to our domestic industry. One of the major stakes in this situation is to con-tinue the manufacture of cars in France. All aspects of the automotive industry are affected, including assembly and mechanical production, and research and development, but the impact extends to the contributing industries; the suppliers to the French automakers, on which automakers spend e 44 bil-lion per year. In this context of structural crisis, other storm clouds are gathering for the French automo-tive industry. Intellectual property protection of bodywork parts is still threatened, and its elimina-tion would seriously affect investments in techno-logical innovation.Political vagaries surrounding a rise in taxation on diesel fuel would jeopardize the future of the sig-nificant groundbreaking progress made by French automakers in modernizing diesel, quite apart from the negative social impacts and the lack of sense from an ecological point of view. A significant con-tribution to the poor air quality in urban areas is made by the large number of older, more inefficient cars on the road. Progress toward cleaner air could be made by providing cash incentives for drivers of these cars to upgrade. This is a powerful lever for reducing emissions of pollutants and CO2 by road traffic.
Despite the crisis, the automotive industry has con-tinued to invest in the future since 2007. R&D expenses stand at around e 6 billion per year. The auto industry is still the leader in terms of R&D and of patent filings in France. French auto engineers do not lag the world on innovation: they are the leading developers of electric and hybrid tech-nologies, and have made breakthroughs in the area of cars consuming two liters per 100 km.With the Automotive Industry Platform (PFA), set up
at the time of the 2009 crisis, manufacturers under-took a meaningful restructuring of the automotive industry with their equipment maker and supplier partners. Research was added to the four existing priorities of lean manufacturing, tomorrow’s skills and specialties, better information and communi-cation management and a mid- and long-term strategy in terms of products and international development. Three committees were set up in sup-port of this new initiative: the CTA (Automotive Technical Committee), the CSTA (Automotive Standardization Committee) and the CRA (Automobile Research Committee). The automotive industry is giving thought to its future in common. In this unstable and highly complex economic uni-verse, the CCFA keeps pace and consolidates its ability to produce quality work. It addresses the themes provided by its members in its efforts to analyze and better convey the automotive industry in France and in the world. Domestically, the CCFA is the active partner of the other professional asso-ciations of the industry, such as the CNPA for dis-tribution and repairs, the FIEV for equipment, and the CSIAM for the foreign makes. In the large projects affecting the automobile and its general environment, the CCFA is still deeply involved in the joint discussions. With the support of its mem-bers, it makes its voice heard in such large business organizations as MEDEF, UIMM and GFI, as well as in specialized organizations such as URF and GERPISA. Internationally, it defends French interests in OICA – of which it is currently president – and EAMA, and contributes abundantly to the analyti-cal capabilities and statistical data produced by these organizations.
You will be reassured of the success of our efforts as you read this new edition of Analysis and Statistics. We are always eager to hear from you. Please don’t hesitate to contact us or consult our website (www.ccfa.fr).
Best regards.
NP_ANAlysis ANd highlights / Comité des ConstruCteurs Français d’automobiles Comité des ConstruCteurs Français d’automobiles / ANAlysis ANd highlights_01
The French AuTomobile mAnuFAcTurers’ AssociATion
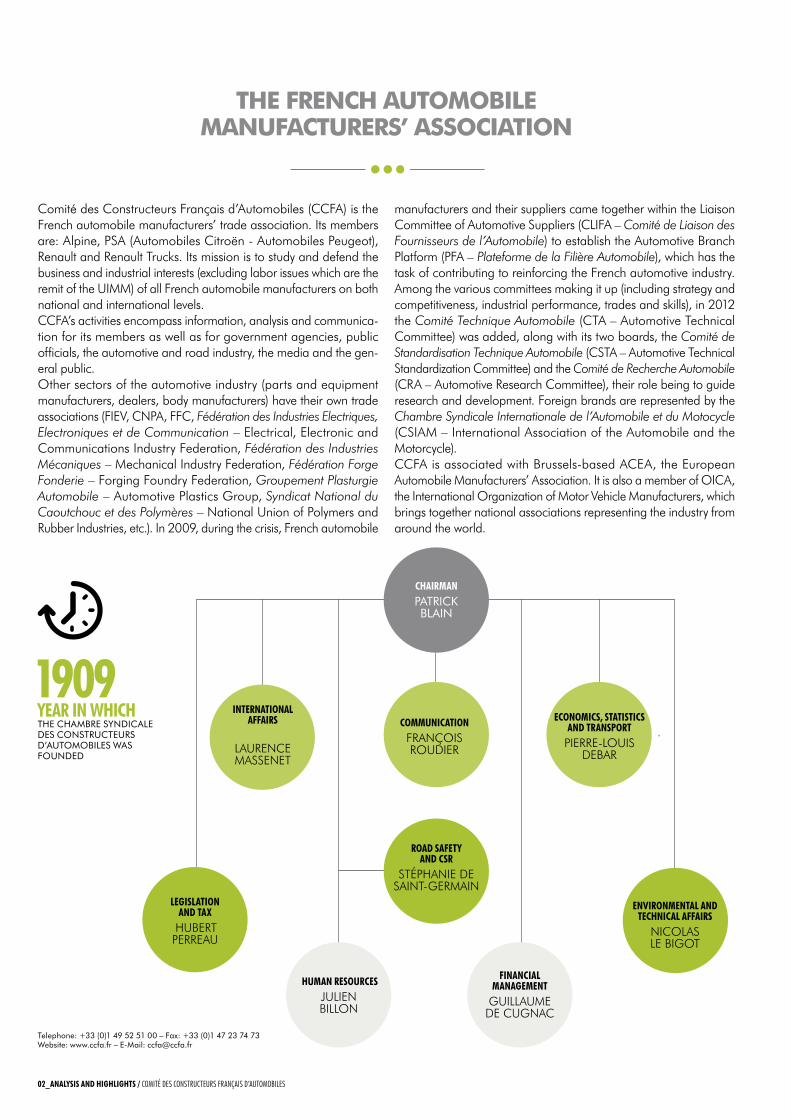
Comité des Constructeurs Français d’Automobiles (CCFA) is the French automobile manufacturers’ trade association. Its members are: Alpine, PSA (Automobiles Citroën - Automobiles Peugeot), Renault and Renault Trucks. Its mission is to study and defend the business and industrial interests (excluding labor issues which are the remit of the UIMM) of all French automobile manufacturers on both national and international levels.CCFA’s activities encompass information, analysis and communica-tion for its members as well as for government agencies, public officials, the automotive and road industry, the media and the gen-eral public.Other sectors of the automotive industry (parts and equipment manufacturers, dealers, body manufacturers) have their own trade associations (FIEV, CNPA, FFC, Fédération des Industries Electriques, Electroniques et de Communication – Electrical, Electronic and Communications Industry Federation, Fédération des Industries Mécaniques – Mechanical Industry Federation, Fédération Forge Fonderie – Forging Foundry Federation, Groupement Plasturgie Automobile – Automotive Plastics Group, Syndicat National du Caoutchouc et des Polymères – National Union of Polymers and Rubber Industries, etc.). In 2009, during the crisis, French automobile
manufacturers and their suppliers came together within the Liaison Committee of Automotive Suppliers (CLIFA – Comité de Liaison des Fournisseurs de l’Automobile) to establish the Automotive Branch Platform (PFA – Plateforme de la Filière Automobile), which has the task of contributing to reinforcing the French automotive industry. Among the various committees making it up (including strategy and competitiveness, industrial performance, trades and skills), in 2012 the Comité Technique Automobile (CTA – Automotive Technical Committee) was added, along with its two boards, the Comité de Standardisation Technique Automobile (CSTA – Automotive Technical Standardization Committee) and the Comité de Recherche Automobile (CRA – Automotive Research Committee), their role being to guide research and development. Foreign brands are represented by the Chambre Syndicale Internationale de l’Automobile et du Motocycle (CSIAM – International Association of the Automobile and the Motorcycle).CCFA is associated with Brussels-based ACEA, the European Automobile Manufacturers’ Association. It is also a member of OICA, the International Organization of Motor Vehicle Manufacturers, which brings together national associations representing the industry from around the world.
ChAiRMANPATRICK BLAIN
RoAd sAfety ANd CsR
STÉPHANIE DE SAINT-GERMAIN
eNviRoNMeNtAl ANd teChNiCAl AffAiRs
NICOLAS LE BIGOT
legislAtioN ANd tAx
HUBERT PERREAU
huMAN ResouRCesJULIEN BILLON
fiNANCiAl MANAgeMeNt
GUILLAUME DE CUGNAC
iNteRNAtioNAl AffAiRs
LAURENCE MASSENET
eCoNoMiCs, stAtistiCs ANd tRANsPoRtPIERRE-LOUIS
DEBAR
CoMMuNiCAtioNFRANÇOIS ROUDIER
Telephone: +33 (0)1 49 52 51 00 – Fax: +33 (0)1 47 23 74 73 Website: www.ccfa.fr – E-Mail: [email protected]
1909 yeAR iN whiCh ThE ChAMBRE SyNdICALE dES CoNSTRuCTEuRS d’AuToMoBILES WAS FouNdEd
02_ANAlysis ANd highlights / Comité des ConstruCteurs Français d’automobiles Comité des ConstruCteurs Français d’automobiles / ANAlysis ANd highlights_03
DISTRIBUTORS
MANUFACTURERS
LEVEL-1 EQUIPMENT MAKERS
SUBCONTRACTORS
MAINTENANCE AND SERVICES
RECYCLING
USERS
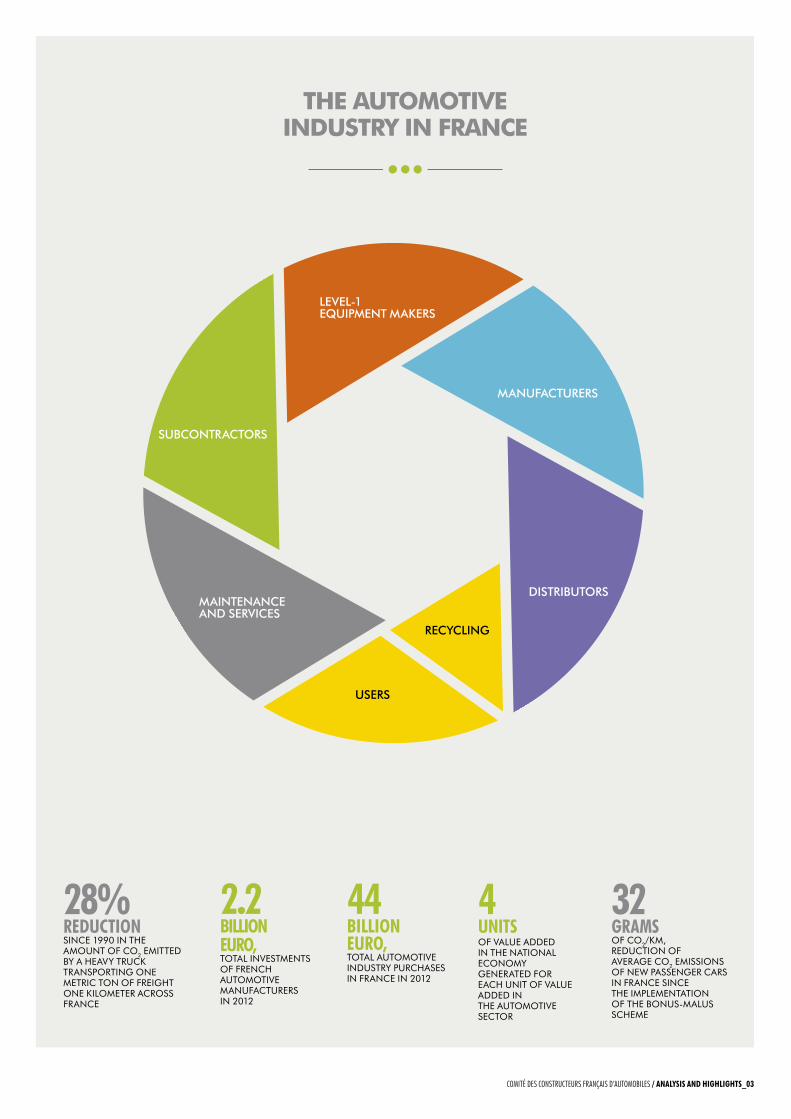
The AuTomoTive indusTry in FrAnce
4 uNitsoF vALuE AddEd IN ThE NATIoNAL ECoNoMy gENERATEd FoR EACh uNIT oF vALuE AddEd IN ThE AuToMoTIvE SECToR
32 gRAMsoF Co2/KM, REduCTIoN oF AvERAgE Co2 EMISSIoNS oF NEW PASSENgER CARS IN FRANCE SINCE ThE IMPLEMENTATIoN oF ThE BoNuS-MALuS SChEME
28%ReduCtioNSINCE 1990 IN ThE AMouNT oF Co2 EMITTEd By A hEAvy TRuCK TRANSPoRTINg oNE METRIC ToN oF FREIghT oNE KILoMETER ACRoSS FRANCE
44 billioN euRo,ToTAL AuToMoTIvE INduSTRy PuRChASES IN FRANCE IN 2012
2.2 billioN euRo,ToTAL INvESTMENTS oF FRENCh AuToMoTIvE MANuFACTuRERS IN 2012
02_ANAlysis ANd highlights / Comité des ConstruCteurs Français d’automobiles Comité des ConstruCteurs Français d’automobiles / ANAlysis ANd highlights_03
1997 2007 2012 2013 Change 2013-2012 Change 2013-2007
World production of French manufacturers 4,046 6,188 n/a n/a n/a n/a
Passenger cars 3,472 5,301 4,863 4,794 -1.4% -9.6%
Light commercial vehicles 507 830 714 745 4.4% -10.3%
All light vehicles 3,979 6,131 5,576 5,539 -0.7% -9.7%
Heavy trucks (at constant scope) 36 58 n/a n/a n/a n/a
Production of French manufacturers in France 2,525 2,573 1,647 1,445 n/a n/a
Passenger cars 2,235 2,165 1,377 1,164 -15.5% -46.3%
Light commercial vehicles 258 352 270 282 4.5% -20.0%
All light vehicles 2,493 2,518 1,647 1,445 -12.2% -42.6%
Heavy trucks 30 55 n/a n/a n/a n/a
vehicle exports outside France 2,822 4,697 4,404 4,373 -0.7% -6.9%
Passenger cars 2,526 4,110 3,898 3,842 -1.4% -6.5%
Light commercial vehicles 276 549 481 511 6.4% -6.8%
All light vehicles 2,802 4,659 4,379 4,354 -0.6% -6.6%
Heavy trucks 20 38 25 19 -25.6% -49.8%
vehicle exports outside europe (17 countries) 659 2,110 2,747 2,722 -0.9% 29.0%
Passenger cars 563 1,914 2,504 2,486 -0.7% 29.9%
Light commercial vehicles 88 178 228 225 -1.2% 26.4%
All light vehicles 651 2,092 2,731 2,711 -0.7% 29.6%
Heavy trucks 8 18 16 11 -31.8% -41.3%
vehicle registrations in France 2,068 2,629 2,332 2,207 -5.3% -16.0%
Passenger cars 1,713 2,110 1,899 1,790 -5.7% -15.1%
Light commercial vehicles 313 461 384 367 -4.4% -20.4%
All light vehicles 2,026 2,571 2,283 2,158 -5.5% -16.1%
Heavy trucks 39.3 52.5 43.4 43.3 -0.3% -17.7%
Coaches and buses 3.1 5.5 5.5 6.3 14.0% 15.1%
registrations in europe (17 countries) of vehicles from French groups 3,300 3,906 2,907 2,804 -3.6% -28.2%
Passenger cars 2,841 3,181 2,374 2,287 -3.7% -28.1%Light commercial vehicles 432 690 510 497 -2.7% -28.0%All light vehicles 3,273 3,871 2,884 2,783 -3.5% -28.1%Heavy trucks 27 35 23 21 -11.6% -40.8%
in thousandsKey dATA
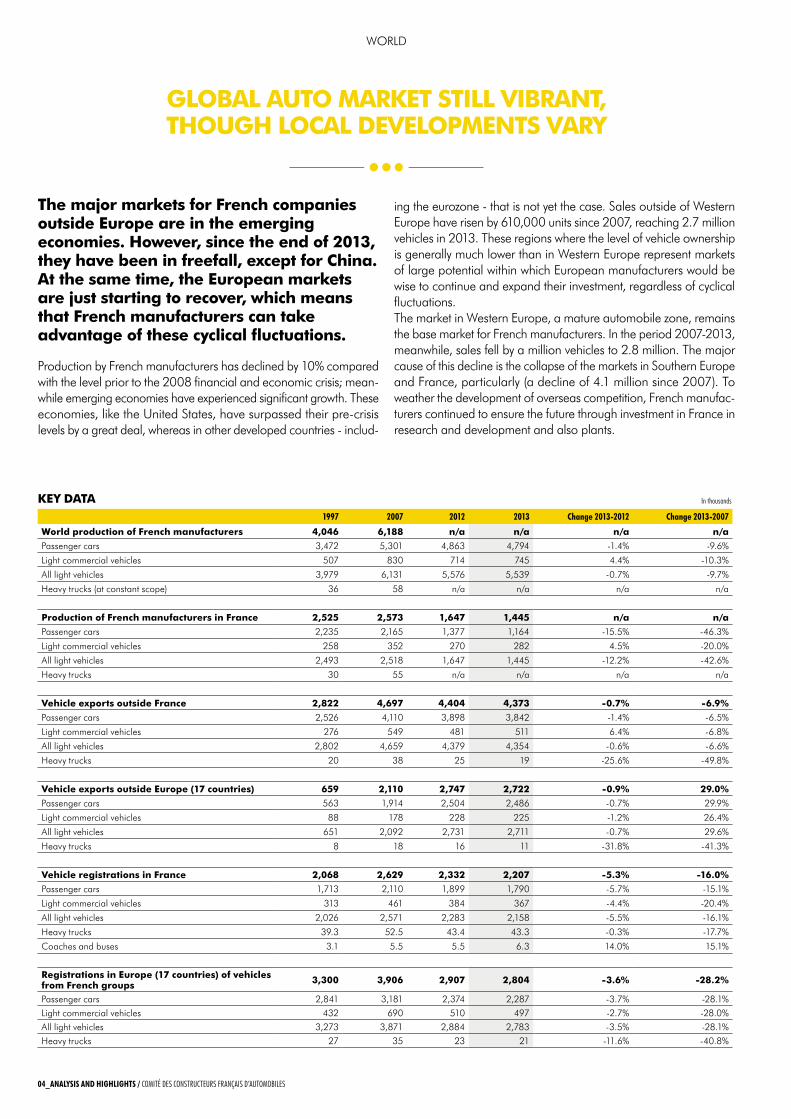
Production by French manufacturers has declined by 10% compared with the level prior to the 2008 financial and economic crisis; mean-while emerging economies have experienced significant growth. These economies, like the United States, have surpassed their pre-crisis levels by a great deal, whereas in other developed countries - includ-
ing the eurozone - that is not yet the case. Sales outside of Western Europe have risen by 610,000 units since 2007, reaching 2.7 million vehicles in 2013. These regions where the level of vehicle ownership is generally much lower than in Western Europe represent markets of large potential within which European manufacturers would be wise to continue and expand their investment, regardless of cyclical fluctuations.The market in Western Europe, a mature automobile zone, remains the base market for French manufacturers. In the period 2007-2013, meanwhile, sales fell by a million vehicles to 2.8 million. The major cause of this decline is the collapse of the markets in Southern Europe and France, particularly (a decline of 4.1 million since 2007). To weather the development of overseas competition, French manufac-turers continued to ensure the future through investment in France in research and development and also plants.
The major markets for French companies outside europe are in the emerging economies. however, since the end of 2013, they have been in freefall, except for china. At the same time, the european markets are just starting to recover, which means that French manufacturers can take advantage of these cyclical fluctuations.
GlobAl AuTo mArKeT sTill vibrAnT, ThouGh locAl develoPmenTs vAry
04_ANAlysis ANd highlights / Comité des ConstruCteurs Français d’automobiles Comité des ConstruCteurs Français d’automobiles / ANAlysis ANd highlights_05
WORLD
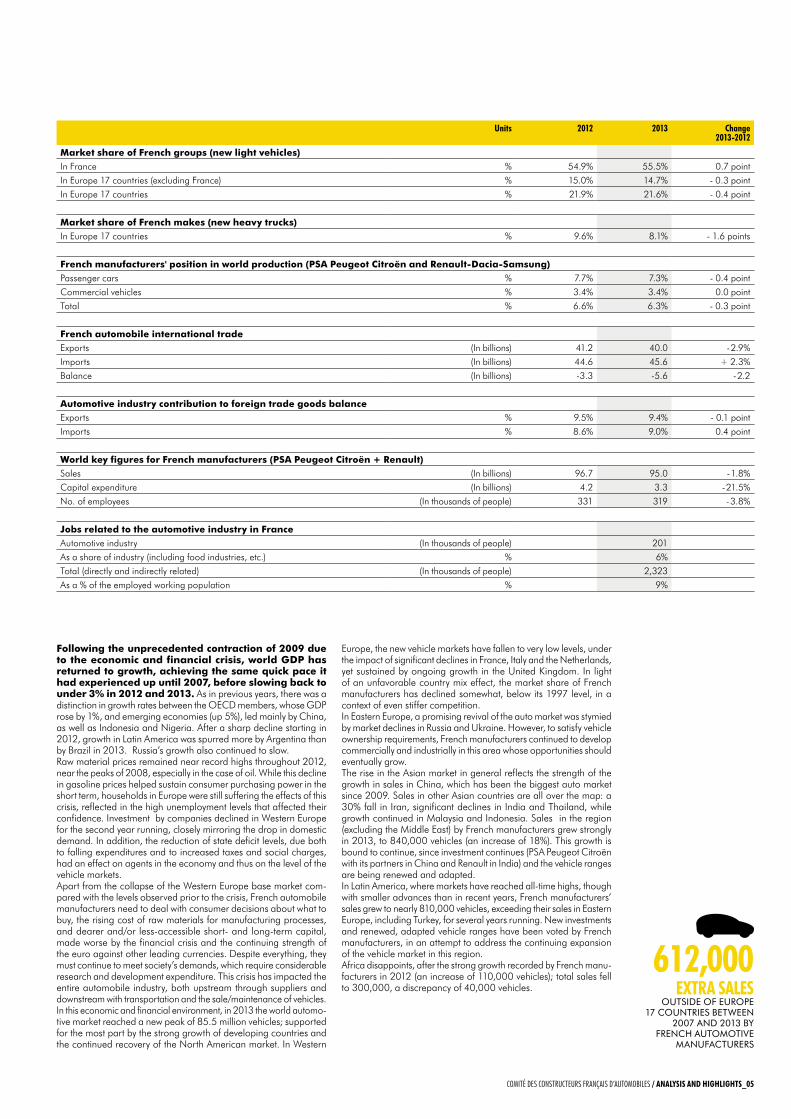
units 2012 2013 Change 2013-2012
market share of French groups (new light vehicles)In France % 54.9% 55.5% 0.7 pointIn Europe 17 countries (excluding France) % 15.0% 14.7% - 0.3 pointIn Europe 17 countries % 21.9% 21.6% - 0.4 point
market share of French makes (new heavy trucks)In Europe 17 countries % 9.6% 8.1% - 1.6 points
French manufacturers' position in world production (PsA Peugeot citroën and renault-dacia-samsung)Passenger cars % 7.7% 7.3% - 0.4 pointCommercial vehicles % 3.4% 3.4% 0.0 pointTotal % 6.6% 6.3% - 0.3 point
French automobile international tradeExports (In billions) 41.2 40.0 - 2.9%Imports (In billions) 44.6 45.6 + 2.3%Balance (In billions) -3.3 -5.6 - 2.2
Automotive industry contribution to foreign trade goods balanceExports % 9.5% 9.4% - 0.1 pointImports % 8.6% 9.0% 0.4 point
World key figures for French manufacturers (PsA Peugeot citroën + renault)Sales (In billions) 96.7 95.0 - 1.8%Capital expenditure (In billions) 4.2 3.3 - 21.5%No. of employees (In thousands of people) 331 319 - 3.8%
Jobs related to the automotive industry in FranceAutomotive industry (In thousands of people) 201As a share of industry (including food industries, etc.) % 6%Total (directly and indirectly related) (In thousands of people) 2,323As a % of the employed working population % 9%
Following the unprecedented contraction of 2009 due to the economic and financial crisis, world GdP has returned to growth, achieving the same quick pace it had experienced up until 2007, before slowing back to under 3% in 2012 and 2013. As in previous years, there was a distinction in growth rates between the OECD members, whose GDP rose by 1%, and emerging economies (up 5%), led mainly by China, as well as Indonesia and Nigeria. After a sharp decline starting in 2012, growth in Latin America was spurred more by Argentina than by Brazil in 2013. Russia’s growth also continued to slow.Raw material prices remained near record highs throughout 2012, near the peaks of 2008, especially in the case of oil. While this decline in gasoline prices helped sustain consumer purchasing power in the short term, households in Europe were still suffering the effects of this crisis, reflected in the high unemployment levels that affected their confidence. Investment by companies declined in Western Europe for the second year running, closely mirroring the drop in domestic demand. In addition, the reduction of state deficit levels, due both to falling expenditures and to increased taxes and social charges, had an effect on agents in the economy and thus on the level of the vehicle markets.Apart from the collapse of the Western Europe base market com-pared with the levels observed prior to the crisis, French automobile manufacturers need to deal with consumer decisions about what to buy, the rising cost of raw materials for manufacturing processes, and dearer and/or less-accessible short- and long-term capital, made worse by the financial crisis and the continuing strength of the euro against other leading currencies. Despite everything, they must continue to meet society’s demands, which require considerable research and development expenditure. This crisis has impacted the entire automobile industry, both upstream through suppliers and downstream with transportation and the sale/maintenance of vehicles.In this economic and financial environment, in 2013 the world automo-tive market reached a new peak of 85.5 million vehicles; supported for the most part by the strong growth of developing countries and the continued recovery of the North American market. In Western
Europe, the new vehicle markets have fallen to very low levels, under the impact of significant declines in France, Italy and the Netherlands, yet sustained by ongoing growth in the United Kingdom. In light of an unfavorable country mix effect, the market share of French manufacturers has declined somewhat, below its 1997 level, in a context of even stiffer competition.In Eastern Europe, a promising revival of the auto market was stymied by market declines in Russia and Ukraine. However, to satisfy vehicle ownership requirements, French manufacturers continued to develop commercially and industrially in this area whose opportunities should eventually grow.The rise in the Asian market in general reflects the strength of the growth in sales in China, which has been the biggest auto market since 2009. Sales in other Asian countries are all over the map: a 30% fall in Iran, significant declines in India and Thailand, while growth continued in Malaysia and Indonesia. Sales in the region (excluding the Middle East) by French manufacturers grew strongly in 2013, to 840,000 vehicles (an increase of 18%). This growth is bound to continue, since investment continues (PSA Peugeot Citroën with its partners in China and Renault in India) and the vehicle ranges are being renewed and adapted.In Latin America, where markets have reached all-time highs, though with smaller advances than in recent years, French manufacturers’ sales grew to nearly 810,000 vehicles, exceeding their sales in Eastern Europe, including Turkey, for several years running. New investments and renewed, adapted vehicle ranges have been voted by French manufacturers, in an attempt to address the continuing expansion of the vehicle market in this region.Africa disappoints, after the strong growth recorded by French manu-facturers in 2012 (an increase of 110,000 vehicles); total sales fell to 300,000, a discrepancy of 40,000 vehicles.
612,000 extRA sAles ouTSIdE oF EuRoPE
17 CouNTRIES BETWEEN 2007 ANd 2013 By
FRENCh AuToMoTIvE MANuFACTuRERS
04_ANAlysis ANd highlights / Comité des ConstruCteurs Français d’automobiles Comité des ConstruCteurs Français d’automobiles / ANAlysis ANd highlights_05
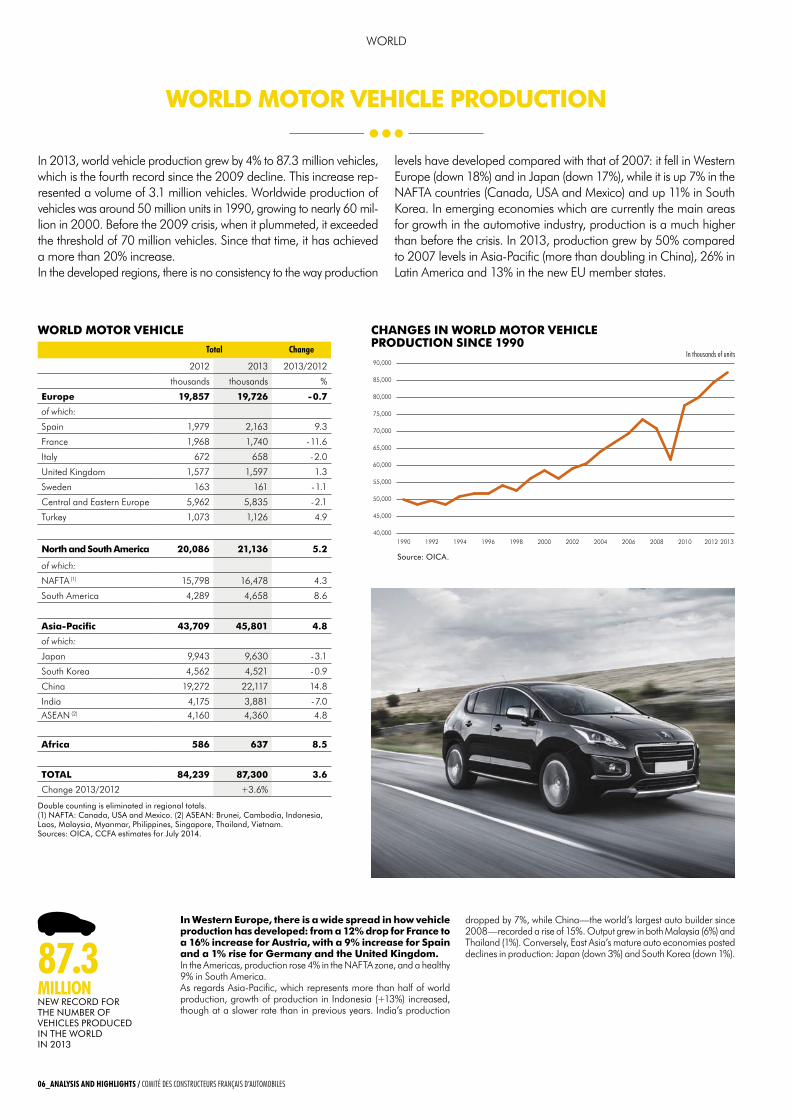
in Western europe, there is a wide spread in how vehicle production has developed: from a 12% drop for France to a 16% increase for Austria, with a 9% increase for spain and a 1% rise for Germany and the united Kingdom.In the Americas, production rose 4% in the NAFTA zone, and a healthy 9% in South America.As regards Asia-Pacific, which represents more than half of world production, growth of production in Indonesia (+13%) increased, though at a slower rate than in previous years. India’s production
dropped by 7%, while China—the world’s largest auto builder since 2008—recorded a rise of 15%. Output grew in both Malaysia (6%) and Thailand (1%). Conversely, East Asia’s mature auto economies posted declines in production: Japan (down 3%) and South Korea (down 1%).
World moTor vehicle chAnGes in World moTor vehicle ProducTion since 1990
double counting is eliminated in regional totals. (1) NAFTA: Canada, uSA and Mexico. (2) ASEAN: Brunei, Cambodia, Indonesia, Laos, Malaysia, Myanmar, Philippines, Singapore, Thailand, vietnam.Sources: oICA, CCFA estimates for July 2014.
40,000
45,000
50,000
55,000
60,000
65,000
70,000
75,000
80,000
85,000
90,000
2013201220102008200620042002200019981996199419921990
total Change
2012 2013 2013/2012
thousands thousands %
europe 19,857 19,726 - 0.7
of which:
Spain 1,979 2,163 9.3
France 1,968 1,740 - 11.6
Italy 672 658 - 2.0
United Kingdom 1,577 1,597 1.3
Sweden 163 161 - 1.1
Central and Eastern Europe 5,962 5,835 - 2.1
Turkey 1,073 1,126 4.9
north and south America 20,086 21,136 5.2
of which:
NAFTA (1) 15,798 16,478 4.3
South America 4,289 4,658 8.6
Asia-Pacific 43,709 45,801 4.8
of which:
Japan 9,943 9,630 - 3.1
South Korea 4,562 4,521 - 0.9
China 19,272 22,117 14.8
India 4,175 3,881 - 7.0ASEAN (2) 4,160 4,360 4.8
Africa 586 637 8.5
ToTAl 84,239 87,300 3.6
Change 2013/2012 +3.6%
87 .3MillioNNEW RECoRd FoR ThE NuMBER oF vEhICLES PRoduCEd IN ThE WoRLd IN 2013
in thousands of units
Source: oICA.
06_ANAlysis ANd highlights / Comité des ConstruCteurs Français d’automobiles Comité des ConstruCteurs Français d’automobiles / ANAlysis ANd highlights_07
WORLD
World moTor vehicle ProducTion
In 2013, world vehicle production grew by 4% to 87.3 million vehicles, which is the fourth record since the 2009 decline. This increase rep-resented a volume of 3.1 million vehicles. Worldwide production of vehicles was around 50 million units in 1990, growing to nearly 60 mil-lion in 2000. Before the 2009 crisis, when it plummeted, it exceeded the threshold of 70 million vehicles. Since that time, it has achieved a more than 20% increase.In the developed regions, there is no consistency to the way production
levels have developed compared with that of 2007: it fell in Western Europe (down 18%) and in Japan (down 17%), while it is up 7% in the NAFTA countries (Canada, USA and Mexico) and up 11% in South Korea. In emerging economies which are currently the main areas for growth in the automotive industry, production is a much higher than before the crisis. In 2013, production grew by 50% compared to 2007 levels in Asia-Pacific (more than doubling in China), 26% in Latin America and 13% in the new EU member states.
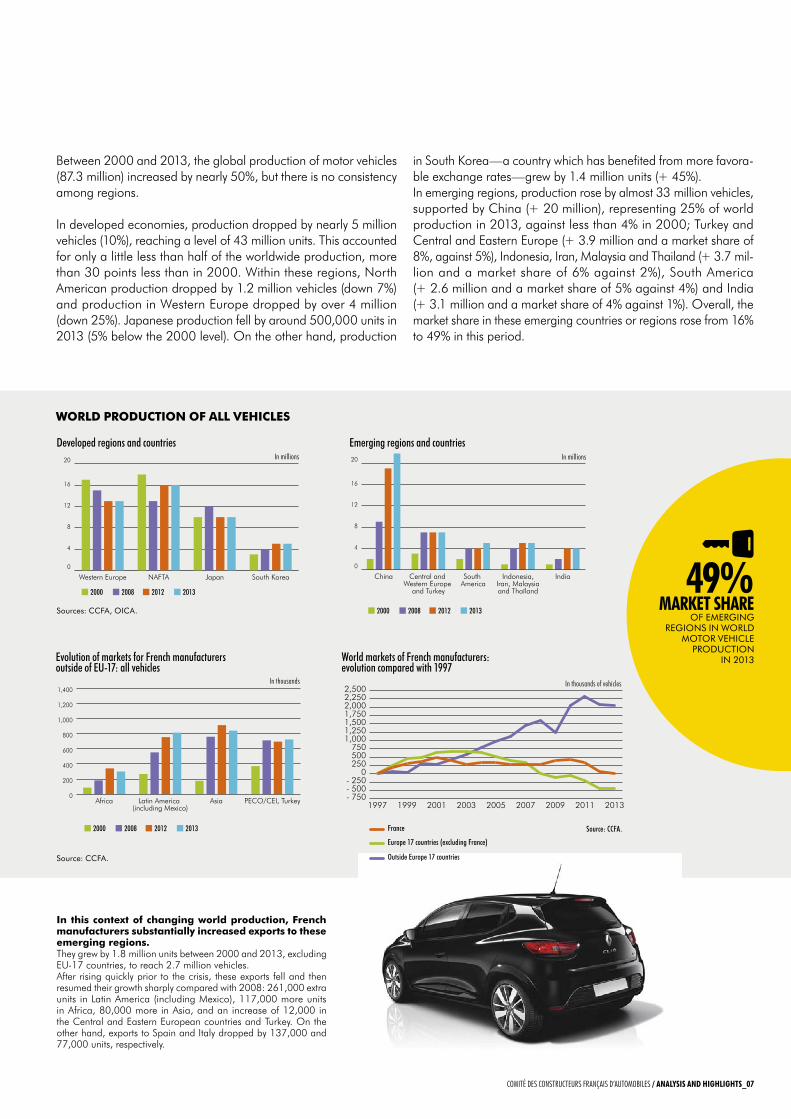
in this context of changing world production, French manufacturers substantially increased exports to these emerging regions. They grew by 1.8 million units between 2000 and 2013, excluding EU-17 countries, to reach 2.7 million vehicles.After rising quickly prior to the crisis, these exports fell and then resumed their growth sharply compared with 2008: 261,000 extra units in Latin America (including Mexico), 117,000 more units in Africa, 80,000 more in Asia, and an increase of 12,000 in the Central and Eastern European countries and Turkey. On the other hand, exports to Spain and Italy dropped by 137,000 and 77,000 units, respectively.
World ProducTion oF All vehicles
Evolution of markets for French manufacturers outside of EU-17: all vehicles
2000 2008 2012 2013
2000 2008 2012 2013
2000 2008 2012 2013
0
4
8
12
16
20
South KoreaJapanNAFTAWestern Europe
0
4
8
12
16
20
IndiaIndonesia,Iran, Malaysiaand Thaïland
South America
Central and Western Europe
and Turkey
China
0
200
400
600
800
1,000
1,200
1,400
PECO/CEI, TurkeyAsiaLatin America (including Mexico)
Africa
2000 2008 2012 2013
2000 2008 2012 2013
2000 2008 2012 2013
0
4
8
12
16
20
South KoreaJapanNAFTAWestern Europe
0
4
8
12
16
20
IndiaIndonesia,Iran, Malaysiaand Thaïland
South America
Central and Western Europe
and Turkey
China
0
200
400
600
800
1,000
1,200
1,400
PECO/CEI, TurkeyAsiaLatin America (including Mexico)
Africa
- 750- 500- 250
0250500750
1,0001,2501,5001,7502,0002,2502,500 Hors Europe 17 pays
Europe 17 pays hors FranceFrance
201320112009200720052003200119991997
France
Outside Europe 17 countries
Europe 17 countries (excluding France)
Source: CCFA.
in millions
Developed regions and countries
Sources: CCFA, oICA.
Source: CCFA.
in thousands in thousands of vehicles
in millions
Emerging regions and countries
World markets of French manufacturers: evolution compared with 1997
49%MARket shARe
oF EMERgINg REgIoNS IN WoRLd
MoToR vEhICLE PRoduCTIoN
IN 2013
06_ANAlysis ANd highlights / Comité des ConstruCteurs Français d’automobiles Comité des ConstruCteurs Français d’automobiles / ANAlysis ANd highlights_07
Between 2000 and 2013, the global production of motor vehicles (87.3 million) increased by nearly 50%, but there is no consistency among regions.
In developed economies, production dropped by nearly 5 million vehicles (10%), reaching a level of 43 million units. This accounted for only a little less than half of the worldwide production, more than 30 points less than in 2000. Within these regions, North American production dropped by 1.2 million vehicles (down 7%) and production in Western Europe dropped by over 4 million (down 25%). Japanese production fell by around 500,000 units in 2013 (5% below the 2000 level). On the other hand, production
in South Korea—a country which has benefited from more favora-ble exchange rates—grew by 1.4 million units (+ 45%).In emerging regions, production rose by almost 33 million vehicles, supported by China (+ 20 million), representing 25% of world production in 2013, against less than 4% in 2000; Turkey and Central and Eastern Europe (+ 3.9 million and a market share of 8%, against 5%), Indonesia, Iran, Malaysia and Thailand (+ 3.7 mil-lion and a market share of 6% against 2%), South America (+ 2.6 million and a market share of 5% against 4%) and India (+ 3.1 million and a market share of 4% against 1%). Overall, the market share in these emerging countries or regions rose from 16% to 49% in this period.
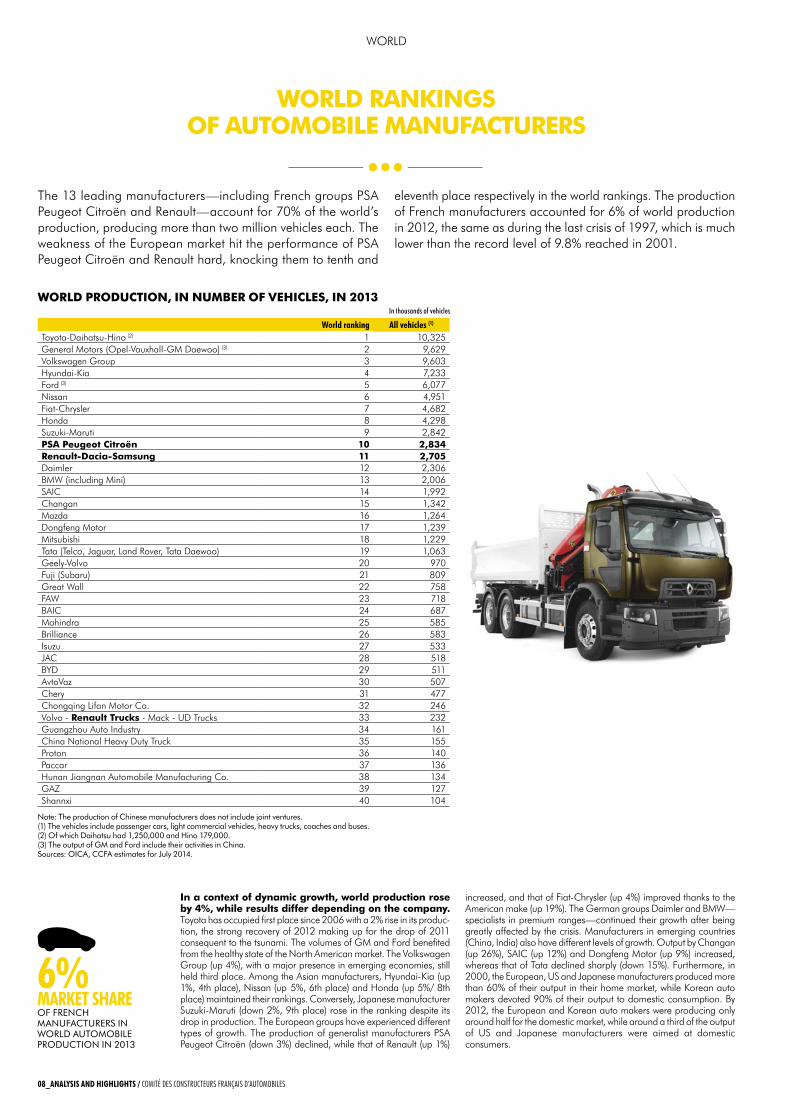
in a context of dynamic growth, world production rose by 4%, while results differ depending on the company. Toyota has occupied first place since 2006 with a 2% rise in its produc-tion, the strong recovery of 2012 making up for the drop of 2011 consequent to the tsunami. The volumes of GM and Ford benefited from the healthy state of the North American market. The Volkswagen Group (up 4%), with a major presence in emerging economies, still held third place. Among the Asian manufacturers, Hyundai-Kia (up 1%, 4th place), Nissan (up 5%, 6th place) and Honda (up 5%/ 8th place) maintained their rankings. Conversely, Japanese manufacturer Suzuki-Maruti (down 2%, 9th place) rose in the ranking despite its drop in production. The European groups have experienced different types of growth. The production of generalist manufacturers PSA Peugeot Citroën (down 3%) declined, while that of Renault (up 1%)
increased, and that of Fiat-Chrysler (up 4%) improved thanks to the American make (up 19%). The German groups Daimler and BMW—specialists in premium ranges—continued their growth after being greatly affected by the crisis. Manufacturers in emerging countries (China, India) also have different levels of growth. Output by Changan (up 26%), SAIC (up 12%) and Dongfeng Motor (up 9%) increased, whereas that of Tata declined sharply (down 15%). Furthermore, in 2000, the European, US and Japanese manufacturers produced more than 60% of their output in their home market, while Korean auto makers devoted 90% of their output to domestic consumption. By 2012, the European and Korean auto makers were producing only around half for the domestic market, while around a third of the output of US and Japanese manufacturers were aimed at domestic consumers.
World ProducTion, in number oF vehicles, in 2013
6% MARket shAReoF FRENCh MANuFACTuRERS IN WoRLd AuToMoBILE PRoduCTIoN IN 2013
The 13 leading manufacturers—including French groups PSA Peugeot Citroën and Renault—account for 70% of the world’s production, producing more than two million vehicles each. The weakness of the European market hit the performance of PSA Peugeot Citroën and Renault hard, knocking them to tenth and
eleventh place respectively in the world rankings. The production of French manufacturers accounted for 6% of world production in 2012, the same as during the last crisis of 1997, which is much lower than the record level of 9.8% reached in 2001.
In thousands of vehicles
world ranking All vehicles (1)
Toyota-Daihatsu-Hino (2) 1 10,325 General Motors (Opel-Vauxhall-GM Daewoo) (3) 2 9,629 Volkswagen Group 3 9,603 Hyundai-Kia 4 7,233 Ford (3) 5 6,077 Nissan 6 4,951 Fiat-Chrysler 7 4,682 Honda 8 4,298 Suzuki-Maruti 9 2,842 PsA Peugeot citroën 10 2,834 renault-dacia-samsung 11 2,705 Daimler 12 2,306 BMW (including Mini) 13 2,006 SAIC 14 1,992 Changan 15 1,342 Mazda 16 1,264 Dongfeng Motor 17 1,239 Mitsubishi 18 1,229 Tata (Telco, Jaguar, Land Rover, Tata Daewoo) 19 1,063 Geely-Volvo 20 970 Fuji (Subaru) 21 809 Great Wall 22 758 FAW 23 718 BAIC 24 687 Mahindra 25 585 Brilliance 26 583 Isuzu 27 533 JAC 28 518 BYD 29 511 AvtoVaz 30 507 Chery 31 477 Chongqing Lifan Motor Co. 32 246 Volvo - renault Trucks - Mack - UD Trucks 33 232 Guangzhou Auto Industry 34 161 China National Heavy Duty Truck 35 155 Proton 36 140 Paccar 37 136 Hunan Jiangnan Automobile Manufacturing Co. 38 134 GAZ 39 127 Shannxi 40 104
Note: The production of Chinese manufacturers does not include joint ventures. (1) The vehicles include passenger cars, light commercial vehicles, heavy trucks, coaches and buses. (2) of which daihatsu had 1,250,000 and hino 179,000. (3) The output of gM and Ford include their activities in China. Sources: oICA, CCFA estimates for July 2014.
08_ANAlysis ANd highlights / Comité des ConstruCteurs Français d’automobiles Comité des ConstruCteurs Français d’automobiles / ANAlysis ANd highlights_09
WORLD
World rAnKinGs oF AuTomobile mAnuFAcTurers
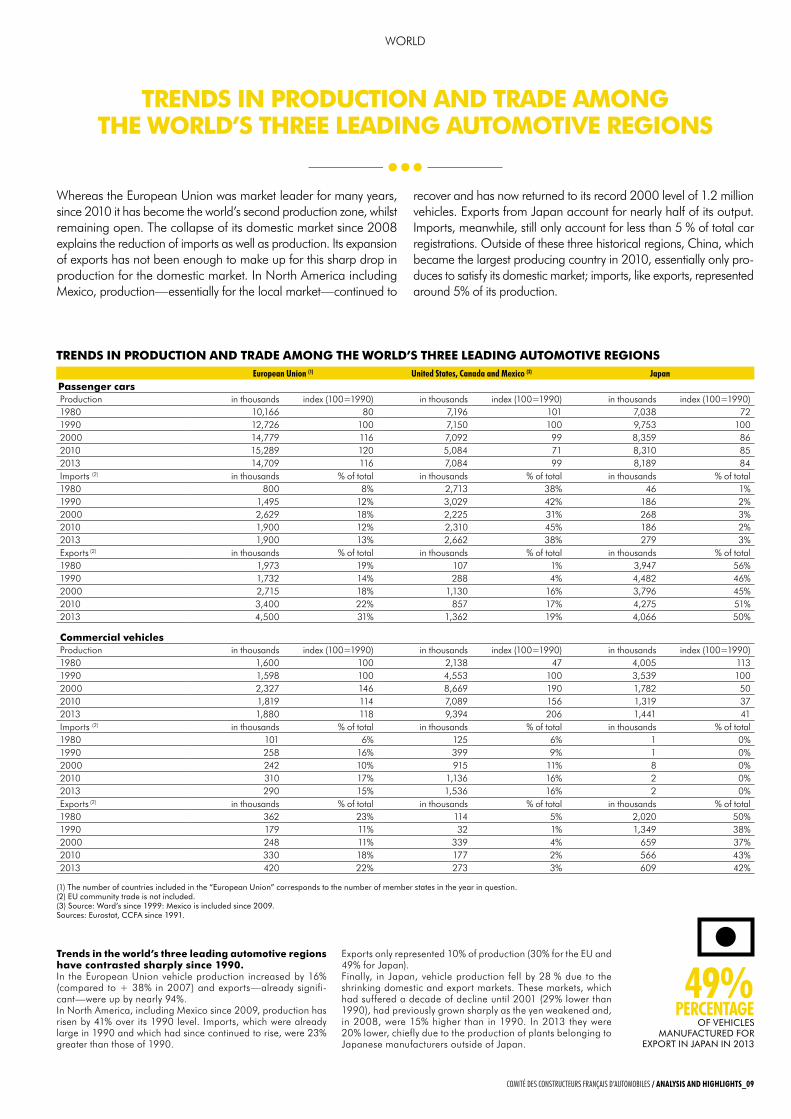
Whereas the European Union was market leader for many years, since 2010 it has become the world’s second production zone, whilst remaining open. The collapse of its domestic market since 2008 explains the reduction of imports as well as production. Its expansion of exports has not been enough to make up for this sharp drop in production for the domestic market. In North America including Mexico, production—essentially for the local market—continued to
recover and has now returned to its record 2000 level of 1.2 million vehicles. Exports from Japan account for nearly half of its output. Imports, meanwhile, still only account for less than 5 % of total car registrations. Outside of these three historical regions, China, which became the largest producing country in 2010, essentially only pro-duces to satisfy its domestic market; imports, like exports, represented around 5% of its production.
Trends in ProducTion And TrAde AmonG The World’s Three leAdinG AuTomoTive reGions
Trends in the world’s three leading automotive regions have contrasted sharply since 1990.In the European Union vehicle production increased by 16% (compared to + 38% in 2007) and exports—already signifi-cant—were up by nearly 94%.In North America, including Mexico since 2009, production has risen by 41% over its 1990 level. Imports, which were already large in 1990 and which had since continued to rise, were 23% greater than those of 1990.
Exports only represented 10% of production (30% for the EU and 49% for Japan).Finally, in Japan, vehicle production fell by 28 % due to the shrinking domestic and export markets. These markets, which had suffered a decade of decline until 2001 (29% lower than 1990), had previously grown sharply as the yen weakened and, in 2008, were 15% higher than in 1990. In 2013 they were 20% lower, chiefly due to the production of plants belonging to Japanese manufacturers outside of Japan.
49%PeRCeNtAge
oF vEhICLES MANuFACTuREd FoR
ExPoRT IN JAPAN IN 2013
Trends in ProducTion And TrAde AmonG The World’s Three leAdinG AuTomoTive reGionseuropean union (1) united states, Canada and Mexico (3) Japan
Passenger carsProduction in thousands index (100=1990) in thousands index (100=1990) in thousands index (100=1990)1980 10,166 80 7,196 101 7,038 72 1990 12,726 100 7,150 100 9,753 100 2000 14,779 116 7,092 99 8,359 86 2010 15,289 120 5,084 71 8,310 85 2013 14,709 116 7,084 99 8,189 84 Imports (2) in thousands % of total in thousands % of total in thousands % of total1980 800 8% 2,713 38% 46 1%1990 1,495 12% 3,029 42% 186 2%2000 2,629 18% 2,225 31% 268 3%2010 1,900 12% 2,310 45% 186 2%2013 1,900 13% 2,662 38% 279 3%Exports (2) in thousands % of total in thousands % of total in thousands % of total1980 1,973 19% 107 1% 3,947 56%1990 1,732 14% 288 4% 4,482 46%2000 2,715 18% 1,130 16% 3,796 45%2010 3,400 22% 857 17% 4,275 51%2013 4,500 31% 1,362 19% 4,066 50%
commercial vehiclesProduction in thousands index (100=1990) in thousands index (100=1990) in thousands index (100=1990)1980 1,600 100 2,138 47 4,005 113 1990 1,598 100 4,553 100 3,539 100 2000 2,327 146 8,669 190 1,782 50 2010 1,819 114 7,089 156 1,319 37 2013 1,880 118 9,394 206 1,441 41 Imports (2) in thousands % of total in thousands % of total in thousands % of total1980 101 6% 125 6% 1 0%1990 258 16% 399 9% 1 0%2000 242 10% 915 11% 8 0%2010 310 17% 1,136 16% 2 0%2013 290 15% 1,536 16% 2 0%Exports (2) in thousands % of total in thousands % of total in thousands % of total1980 362 23% 114 5% 2,020 50%1990 179 11% 32 1% 1,349 38%2000 248 11% 339 4% 659 37%2010 330 18% 177 2% 566 43%2013 420 22% 273 3% 609 42%
(1) The number of countries included in the “European union” corresponds to the number of member states in the year in question. (2) Eu community trade is not included. (3) Source: Ward’s since 1999: Mexico is included since 2009. Sources: Eurostat, CCFA since 1991.
08_ANAlysis ANd highlights / Comité des ConstruCteurs Français d’automobiles Comité des ConstruCteurs Français d’automobiles / ANAlysis ANd highlights_09
WORLD
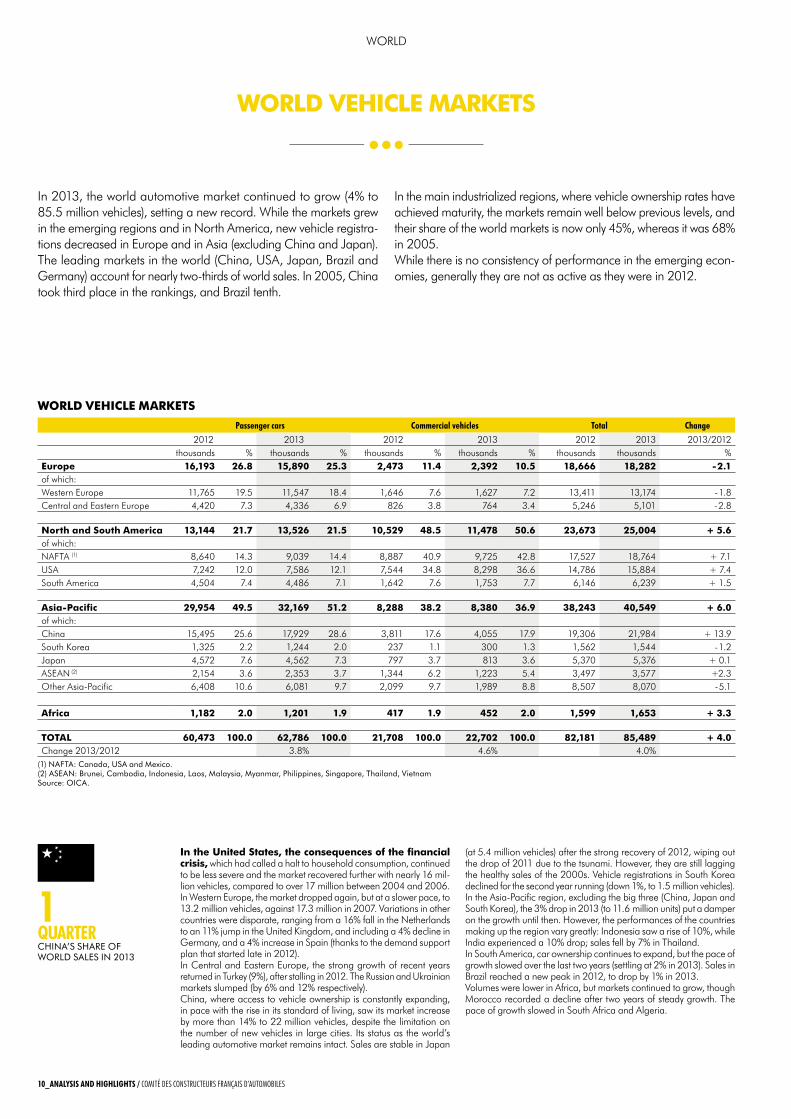
In 2013, the world automotive market continued to grow (4% to 85.5 million vehicles), setting a new record. While the markets grew in the emerging regions and in North America, new vehicle registra-tions decreased in Europe and in Asia (excluding China and Japan).The leading markets in the world (China, USA, Japan, Brazil and Germany) account for nearly two-thirds of world sales. In 2005, China took third place in the rankings, and Brazil tenth.
In the main industrialized regions, where vehicle ownership rates have achieved maturity, the markets remain well below previous levels, and their share of the world markets is now only 45%, whereas it was 68% in 2005.While there is no consistency of performance in the emerging econ-omies, generally they are not as active as they were in 2012.
World vehicle mArKeTs
in the united states, the consequences of the financial crisis, which had called a halt to household consumption, continued to be less severe and the market recovered further with nearly 16 mil-lion vehicles, compared to over 17 million between 2004 and 2006.In Western Europe, the market dropped again, but at a slower pace, to 13.2 million vehicles, against 17.3 million in 2007. Variations in other countries were disparate, ranging from a 16% fall in the Netherlands to an 11% jump in the United Kingdom, and including a 4% decline in Germany, and a 4% increase in Spain (thanks to the demand support plan that started late in 2012).In Central and Eastern Europe, the strong growth of recent years returned in Turkey (9%), after stalling in 2012. The Russian and Ukrainian markets slumped (by 6% and 12% respectively).China, where access to vehicle ownership is constantly expanding, in pace with the rise in its standard of living, saw its market increase by more than 14% to 22 million vehicles, despite the limitation on the number of new vehicles in large cities. Its status as the world’s leading automotive market remains intact. Sales are stable in Japan
(at 5.4 million vehicles) after the strong recovery of 2012, wiping out the drop of 2011 due to the tsunami. However, they are still lagging the healthy sales of the 2000s. Vehicle registrations in South Korea declined for the second year running (down 1%, to 1.5 million vehicles).In the Asia-Pacific region, excluding the big three (China, Japan and South Korea), the 3% drop in 2013 (to 11.6 million units) put a damper on the growth until then. However, the performances of the countries making up the region vary greatly: Indonesia saw a rise of 10%, while India experienced a 10% drop; sales fell by 7% in Thailand.In South America, car ownership continues to expand, but the pace of growth slowed over the last two years (settling at 2% in 2013). Sales in Brazil reached a new peak in 2012, to drop by 1% in 2013.Volumes were lower in Africa, but markets continued to grow, though Morocco recorded a decline after two years of steady growth. The pace of growth slowed in South Africa and Algeria.
Passenger cars Commercial vehicles total Change
2012 2013 2012 2013 2012 2013 2013/2012thousands % thousands % thousands % thousands % thousands thousands %
europe 16,193 26.8 15,890 25.3 2,473 11.4 2,392 10.5 18,666 18,282 - 2.1of which:Western Europe 11,765 19.5 11,547 18.4 1,646 7.6 1,627 7.2 13,411 13,174 - 1.8Central and Eastern Europe 4,420 7.3 4,336 6.9 826 3.8 764 3.4 5,246 5,101 - 2.8
north and south America 13,144 21.7 13,526 21.5 10,529 48.5 11,478 50.6 23,673 25,004 + 5.6of which:NAFTA (1) 8,640 14.3 9,039 14.4 8,887 40.9 9,725 42.8 17,527 18,764 + 7.1USA 7,242 12.0 7,586 12.1 7,544 34.8 8,298 36.6 14,786 15,884 + 7.4South America 4,504 7.4 4,486 7.1 1,642 7.6 1,753 7.7 6,146 6,239 + 1.5
Asia-Pacific 29,954 49.5 32,169 51.2 8,288 38.2 8,380 36.9 38,243 40,549 + 6.0of which:China 15,495 25.6 17,929 28.6 3,811 17.6 4,055 17.9 19,306 21,984 + 13.9South Korea 1,325 2.2 1,244 2.0 237 1.1 300 1.3 1,562 1,544 - 1.2Japan 4,572 7.6 4,562 7.3 797 3.7 813 3.6 5,370 5,376 + 0.1ASEAN (2) 2,154 3.6 2,353 3.7 1,344 6.2 1,223 5.4 3,497 3,577 +2.3Other Asia-Pacific 6,408 10.6 6,081 9.7 2,099 9.7 1,989 8.8 8,507 8,070 - 5.1
Africa 1,182 2.0 1,201 1.9 417 1.9 452 2.0 1,599 1,653 + 3.3
ToTAl 60,473 100.0 62,786 100.0 21,708 100.0 22,702 100.0 82,181 85,489 + 4.0Change 2013/2012 3.8% 4.6% 4.0%
World vehicle mArKeTs
(1) NAFTA: Canada, uSA and Mexico.(2) ASEAN: Brunei, Cambodia, Indonesia, Laos, Malaysia, Myanmar, Philippines, Singapore, Thailand, vietnamSource: oICA.
1quARteR ChINA’S ShARE oF WoRLd SALES IN 2013
10_ANAlysis ANd highlights / Comité des ConstruCteurs Français d’automobiles Comité des ConstruCteurs Français d’automobiles / ANAlysis ANd highlights_11
WORLD
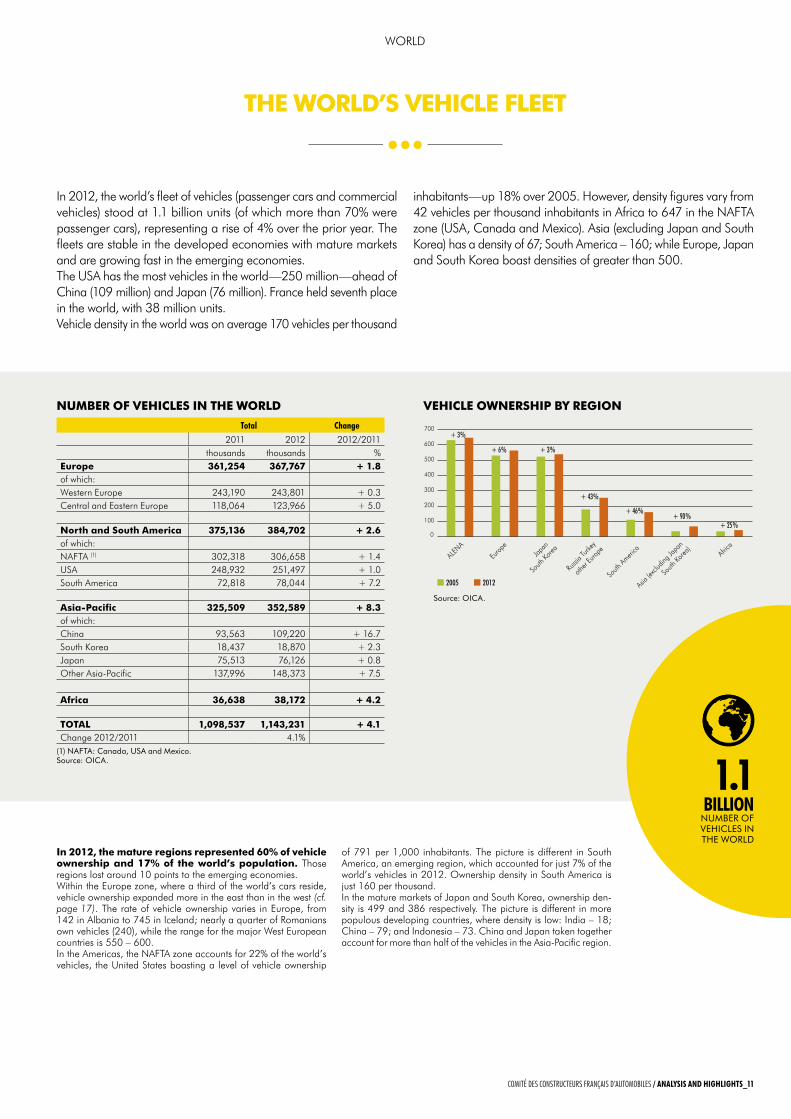
In 2012, the world’s fleet of vehicles (passenger cars and commercial vehicles) stood at 1.1 billion units (of which more than 70% were passenger cars), representing a rise of 4% over the prior year. The fleets are stable in the developed economies with mature markets and are growing fast in the emerging economies.The USA has the most vehicles in the world—250 million—ahead of China (109 million) and Japan (76 million). France held seventh place in the world, with 38 million units.Vehicle density in the world was on average 170 vehicles per thousand
inhabitants—up 18% over 2005. However, density figures vary from 42 vehicles per thousand inhabitants in Africa to 647 in the NAFTA zone (USA, Canada and Mexico). Asia (excluding Japan and South Korea) has a density of 67; South America – 160; while Europe, Japan and South Korea boast densities of greater than 500.
The World’s vehicle FleeT
in 2012, the mature regions represented 60% of vehicle ownership and 17% of the world’s population. Those regions lost around 10 points to the emerging economies.Within the Europe zone, where a third of the world’s cars reside, vehicle ownership expanded more in the east than in the west (cf. page 17). The rate of vehicle ownership varies in Europe, from 142 in Albania to 745 in Iceland; nearly a quarter of Romanians own vehicles (240), while the range for the major West European countries is 550 – 600.In the Americas, the NAFTA zone accounts for 22% of the world’s vehicles, the United States boasting a level of vehicle ownership
of 791 per 1,000 inhabitants. The picture is different in South America, an emerging region, which accounted for just 7% of the world’s vehicles in 2012. Ownership density in South America is just 160 per thousand.In the mature markets of Japan and South Korea, ownership den-sity is 499 and 386 respectively. The picture is different in more populous developing countries, where density is low: India – 18; China – 79; and Indonesia – 73. China and Japan taken together account for more than half of the vehicles in the Asia-Pacific region.
total Change
2011 2012 2012/2011thousands thousands %
europe 361,254 367,767 + 1.8of which:Western Europe 243,190 243,801 + 0.3Central and Eastern Europe 118,064 123,966 + 5.0
north and south America 375,136 384,702 + 2.6of which:NAFTA (1) 302,318 306,658 + 1.4USA 248,932 251,497 + 1.0South America 72,818 78,044 + 7.2
Asia-Pacific 325,509 352,589 + 8.3of which:China 93,563 109,220 + 16.7South Korea 18,437 18,870 + 2.3Japan 75,513 76,126 + 0.8Other Asia-Pacific 137,996 148,373 + 7.5
Africa 36,638 38,172 + 4.2
ToTAl 1,098,537 1,143,231 + 4.1Change 2012/2011 4.1%
number oF vehicles in The World
(1) NAFTA: Canada, uSA and Mexico.Source: oICA.
2005 2012
0
100
200
300
400
500
600
700+ 3%
+ 6% + 3%
+ 43%
+ 46%+ 90%
+ 25%
Africa
Asia (e
xclud
ing Ja
pan
South
Korea
)
South
America
Russi
a Turk
ey
other
Europ
e
Ja
pan
South
Korea
Europ
e
ALENA
Source: oICA.
vehicle oWnershiP by reGion
1.1 billioN
NuMBER oF vEhICLES IN ThE WoRLd
10_ANAlysis ANd highlights / Comité des ConstruCteurs Français d’automobiles Comité des ConstruCteurs Français d’automobiles / ANAlysis ANd highlights_11
WORLD
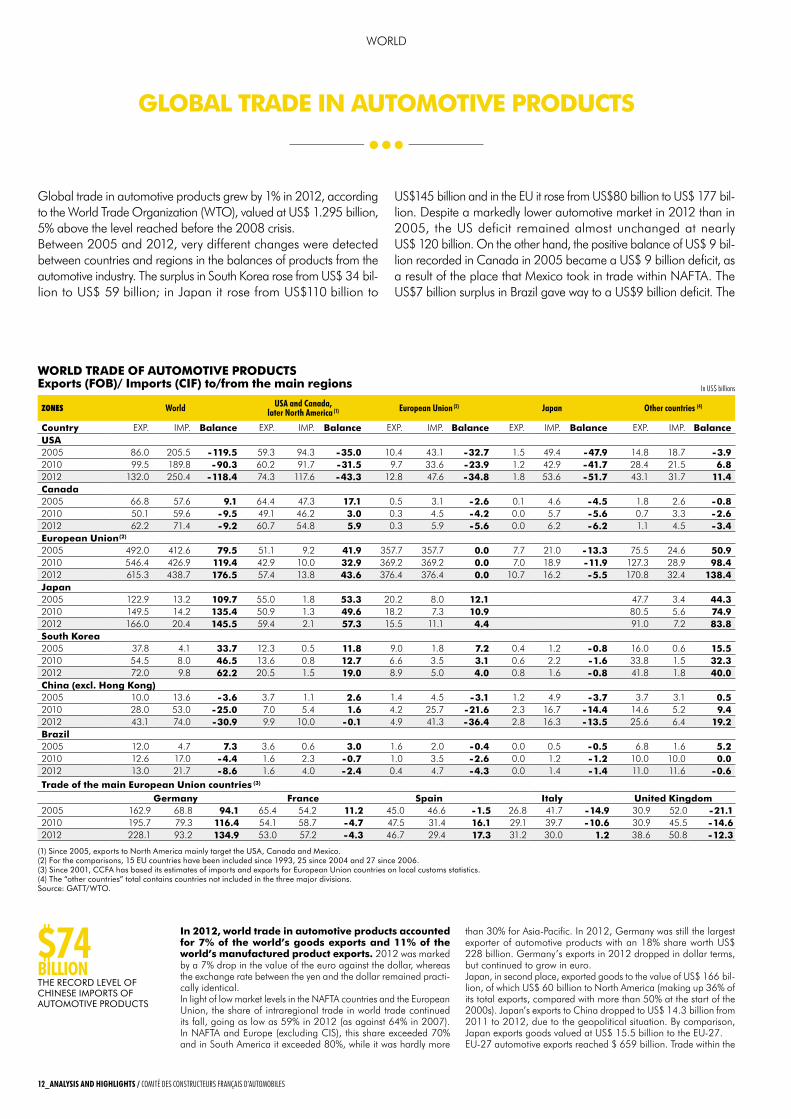
Global trade in automotive products grew by 1% in 2012, according to the World Trade Organization (WTO), valued at US$ 1.295 billion, 5% above the level reached before the 2008 crisis.Between 2005 and 2012, very different changes were detected between countries and regions in the balances of products from the automotive industry. The surplus in South Korea rose from US$ 34 bil-lion to US$ 59 billion; in Japan it rose from US$110 billion to
US$145 billion and in the EU it rose from US$80 billion to US$ 177 bil-lion. Despite a markedly lower automotive market in 2012 than in 2005, the US deficit remained almost unchanged at nearly US$ 120 billion. On the other hand, the positive balance of US$ 9 bil-lion recorded in Canada in 2005 became a US$ 9 billion deficit, as a result of the place that Mexico took in trade within NAFTA. The US$7 billion surplus in Brazil gave way to a US$9 billion deficit. The
GlobAl TrAde in AuTomoTive ProducTs
in 2012, world trade in automotive products accounted for 7% of the world’s goods exports and 11% of the world’s manufactured product exports. 2012 was marked by a 7% drop in the value of the euro against the dollar, whereas the exchange rate between the yen and the dollar remained practi-cally identical.In light of low market levels in the NAFTA countries and the European Union, the share of intraregional trade in world trade continued its fall, going as low as 59% in 2012 (as against 64% in 2007). In NAFTA and Europe (excluding CIS), this share exceeded 70% and in South America it exceeded 80%, while it was hardly more
than 30% for Asia-Pacific. In 2012, Germany was still the largest exporter of automotive products with an 18% share worth US$ 228 billion. Germany’s exports in 2012 dropped in dollar terms, but continued to grow in euro.Japan, in second place, exported goods to the value of US$ 166 bil-lion, of which US$ 60 billion to North America (making up 36% of its total exports, compared with more than 50% at the start of the 2000s). Japan’s exports to China dropped to US$ 14.3 billion from 2011 to 2012, due to the geopolitical situation. By comparison, Japan exports goods valued at US$ 15.5 billion to the EU-27.EU-27 automotive exports reached $ 659 billion. Trade within the
$74billioNThE RECoRd LEvEL oF ChINESE IMPoRTS oF AuToMoTIvE PRoduCTS
World TrAde oF AuTomoTive ProducTs exports (Fob)/ imports (ciF) to/from the main regions in us$ billions
(1) Since 2005, exports to North America mainly target the uSA, Canada and Mexico.(2) For the comparisons, 15 Eu countries have been included since 1993, 25 since 2004 and 27 since 2006.(3) Since 2001, CCFA has based its estimates of imports and exports for European union countries on local customs statistics.(4) The “other countries” total contains countries not included in the three major divisions.Source: gATT/WTo.
ZONES world usA and Canada, later North America (1) european union (2) Japan other countries (4)
country EXP. IMP. balance EXP. IMP. balance EXP. IMP. balance EXP. IMP. balance EXP. IMP. balanceusA2005 86.0 205.5 - 119.5 59.3 94.3 - 35.0 10.4 43.1 - 32.7 1.5 49.4 - 47.9 14.8 18.7 - 3.9 2010 99.5 189.8 - 90.3 60.2 91.7 - 31.5 9.7 33.6 - 23.9 1.2 42.9 - 41.7 28.4 21.5 6.8 2012 132.0 250.4 - 118.4 74.3 117.6 - 43.3 12.8 47.6 - 34.8 1.8 53.6 - 51.7 43.1 31.7 11.4 canada2005 66.8 57.6 9.1 64.4 47.3 17.1 0.5 3.1 - 2.6 0.1 4.6 - 4.5 1.8 2.6 - 0.8 2010 50.1 59.6 - 9.5 49.1 46.2 3.0 0.3 4.5 - 4.2 0.0 5.7 - 5.6 0.7 3.3 - 2.6 2012 62.2 71.4 - 9.2 60.7 54.8 5.9 0.3 5.9 - 5.6 0.0 6.2 - 6.2 1.1 4.5 - 3.4 european union (2)
2005 492.0 412.6 79.5 51.1 9.2 41.9 357.7 357.7 0.0 7.7 21.0 - 13.3 75.5 24.6 50.9 2010 546.4 426.9 119.4 42.9 10.0 32.9 369.2 369.2 0.0 7.0 18.9 - 11.9 127.3 28.9 98.4 2012 615.3 438.7 176.5 57.4 13.8 43.6 376.4 376.4 0.0 10.7 16.2 - 5.5 170.8 32.4 138.4 Japan2005 122.9 13.2 109.7 55.0 1.8 53.3 20.2 8.0 12.1 47.7 3.4 44.3 2010 149.5 14.2 135.4 50.9 1.3 49.6 18.2 7.3 10.9 80.5 5.6 74.9 2012 166.0 20.4 145.5 59.4 2.1 57.3 15.5 11.1 4.4 91.0 7.2 83.8 south Korea2005 37.8 4.1 33.7 12.3 0.5 11.8 9.0 1.8 7.2 0.4 1.2 - 0.8 16.0 0.6 15.5 2010 54.5 8.0 46.5 13.6 0.8 12.7 6.6 3.5 3.1 0.6 2.2 - 1.6 33.8 1.5 32.3 2012 72.0 9.8 62.2 20.5 1.5 19.0 8.9 5.0 4.0 0.8 1.6 - 0.8 41.8 1.8 40.0 china (excl. hong Kong)2005 10.0 13.6 - 3.6 3.7 1.1 2.6 1.4 4.5 - 3.1 1.2 4.9 - 3.7 3.7 3.1 0.5 2010 28.0 53.0 - 25.0 7.0 5.4 1.6 4.2 25.7 - 21.6 2.3 16.7 - 14.4 14.6 5.2 9.4 2012 43.1 74.0 - 30.9 9.9 10.0 - 0.1 4.9 41.3 - 36.4 2.8 16.3 - 13.5 25.6 6.4 19.2 brazil2005 12.0 4.7 7.3 3.6 0.6 3.0 1.6 2.0 - 0.4 0.0 0.5 - 0.5 6.8 1.6 5.2 2010 12.6 17.0 - 4.4 1.6 2.3 - 0.7 1.0 3.5 - 2.6 0.0 1.2 - 1.2 10.0 10.0 0.0 2012 13.0 21.7 - 8.6 1.6 4.0 - 2.4 0.4 4.7 - 4.3 0.0 1.4 - 1.4 11.0 11.6 - 0.6 Trade of the main european union countries (3)
Germany France spain italy united Kingdom 2005 162.9 68.8 94.1 65.4 54.2 11.2 45.0 46.6 - 1.5 26.8 41.7 - 14.9 30.9 52.0 - 21.12010 195.7 79.3 116.4 54.1 58.7 - 4.7 47.5 31.4 16.1 29.1 39.7 - 10.6 30.9 45.5 - 14.62012 228.1 93.2 134.9 53.0 57.2 - 4.3 46.7 29.4 17.3 31.2 30.0 1.2 38.6 50.8 - 12.3
12_ANAlysis ANd highlights / Comité des ConstruCteurs Français d’automobiles Comité des ConstruCteurs Français d’automobiles / ANAlysis ANd highlights_13
WORLD
-118.4
-8.6
-39.5
-30.9
USA
BrazilUnited Kingdom
Russia
South KoreaJapon EU (2)USAGermanySouth Korea
Germany France Italy
Japan
China
165.2
74
62.4
ALENA EU (2) China
0
20
40
60
80
100
120
140
160
180
20122011201020092008200720062005
-130
-110
-90
-70
-50
-30
-10
10
20122011201020092008200720062005
0
50
100
150
200
2012201020082006200420022000305478
102126150174198222246270
20122011201020092008200720062005
0
10
20
30
40
50
60
201320122011201020092008200720062005
62.2
145.5
176.5
166.0
132.0
72.0
228.1
11.6%
53.4%
5.2% 4.5%
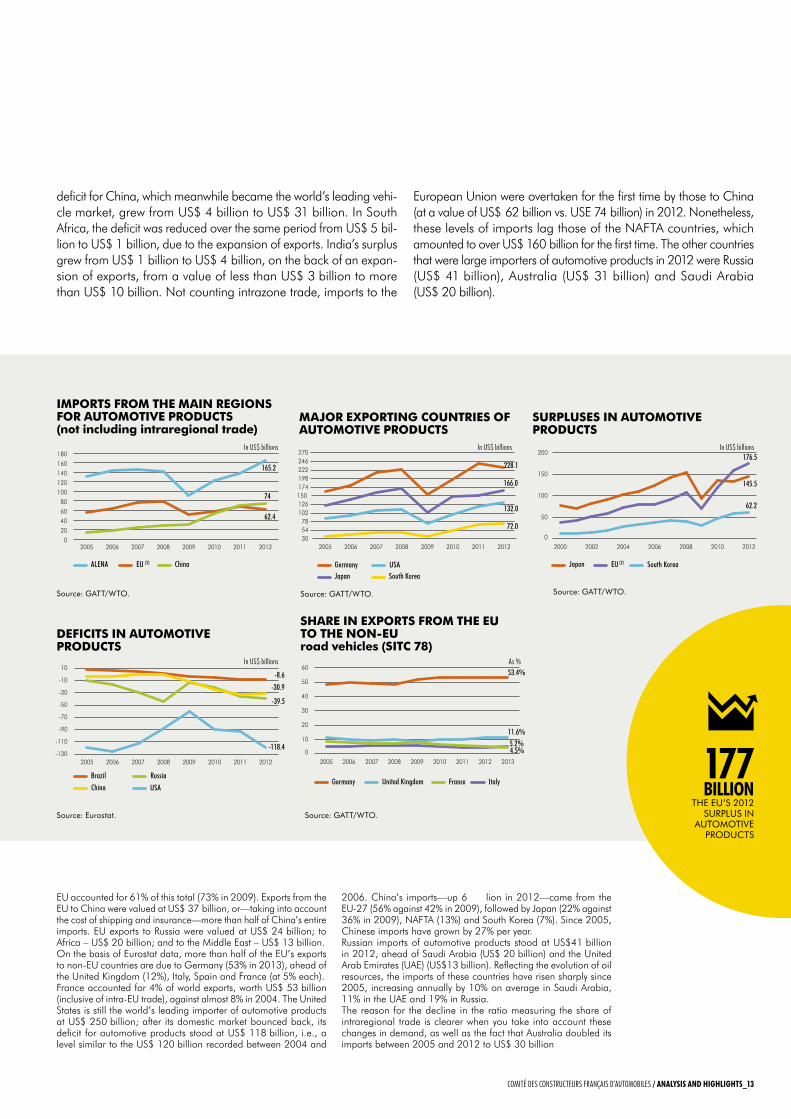
deficit for China, which meanwhile became the world’s leading vehi-cle market, grew from US$ 4 billion to US$ 31 billion. In South Africa, the deficit was reduced over the same period from US$ 5 bil-lion to US$ 1 billion, due to the expansion of exports. India’s surplus grew from US$ 1 billion to US$ 4 billion, on the back of an expan-sion of exports, from a value of less than US$ 3 billion to more than US$ 10 billion. Not counting intrazone trade, imports to the
European Union were overtaken for the first time by those to China (at a value of US$ 62 billion vs. USE 74 billion) in 2012. Nonetheless, these levels of imports lag those of the NAFTA countries, which amounted to over US$ 160 billion for the first time. The other countries that were large importers of automotive products in 2012 were Russia (US$ 41 billion), Australia (US$ 31 billion) and Saudi Arabia (US$ 20 billion).
EU accounted for 61% of this total (73% in 2009). Exports from the EU to China were valued at US$ 37 billion, or—taking into account the cost of shipping and insurance—more than half of China’s entire imports. EU exports to Russia were valued at US$ 24 billion; to Africa – US$ 20 billion; and to the Middle East – US$ 13 billion.On the basis of Eurostat data, more than half of the EU’s exports to non-EU countries are due to Germany (53% in 2013), ahead of the United Kingdom (12%), Italy, Spain and France (at 5% each).France accounted for 4% of world exports, worth US$ 53 billion (inclusive of intra-EU trade), against almost 8% in 2004. The United States is still the world’s leading importer of automotive products at US$ 250 billion; after its domestic market bounced back, its deficit for automotive products stood at US$ 118 billion, i.e., a level similar to the US$ 120 billion recorded between 2004 and
2006. China’s imports—up 6 lion in 2012—came from the EU-27 (56% against 42% in 2009), followed by Japan (22% against 36% in 2009), NAFTA (13%) and South Korea (7%). Since 2005, Chinese imports have grown by 27% per year.Russian imports of automotive products stood at US$41 billion in 2012, ahead of Saudi Arabia (US$ 20 billion) and the United Arab Emirates (UAE) (US$13 billion). Reflecting the evolution of oil resources, the imports of these countries have risen sharply since 2005, increasing annually by 10% on average in Saudi Arabia, 11% in the UAE and 19% in Russia.The reason for the decline in the ratio measuring the share of intraregional trade is clearer when you take into account these changes in demand, as well as the fact that Australia doubled its imports between 2005 and 2012 to US$ 30 billion
deFiciTs in AuTomoTive ProducTs
shAre in exPorTs From The eu To The non-euroad vehicles (siTc 78)
in us$ billions
Source: Eurostat. Source: gATT/WTo.
imPorTs From The mAin reGions For AuTomoTive ProducTs(not including intraregional trade)
mAJor exPorTinG counTries oF AuTomoTive ProducTs
surPluses in AuTomoTive ProducTs
in us$ billions in us$ billions in us$ billions
Source: gATT/WTo. Source: gATT/WTo. Source: gATT/WTo.
-118.4
-8.6
-39.5
-30.9
USA
BrazilUnited Kingdom
Russia
South KoreaJapon EU (2)USAGermanySouth Korea
Germany France Italy
Japan
China
165.2
74
62.4
ALENA EU (2) China
0
20
40
60
80
100
120
140
160
180
20122011201020092008200720062005
-130
-110
-90
-70
-50
-30
-10
10
20122011201020092008200720062005
0
50
100
150
200
2012201020082006200420022000305478
102126150174198222246270
20122011201020092008200720062005
0
10
20
30
40
50
60
201320122011201020092008200720062005
62.2
145.5
176.5
166.0
132.0
72.0
228.1
11.6%
53.4%
5.2% 4.5%
as %
177 billioN
ThE Eu’S 2012 SuRPLuS IN
AuToMoTIvE PRoduCTS
12_ANAlysis ANd highlights / Comité des ConstruCteurs Français d’automobiles Comité des ConstruCteurs Français d’automobiles / ANAlysis ANd highlights_13
3.0
0.7
2.3
1.31.8
Germany France GreeceItaly
United Kigdom
Netherlands Belgium-LuxembourgSwitzerland Austria
Sweden DenmarkNorway
Portugal Ireland
Finland
Spain
11.5
Europe
10
11
12
13
14
15
13121008060402009896949290
0
1
2
3
4
5
13121008060402009896949290
200
250
300
350
400
450
500
550
600
650
13121008060402009896949290
050
100
150
200
250
300
350
400
13121008060402009896949290
0
50
100
150
200
250
300
350
13121008060402009896949290
306319
417
533
182
103142
270
2007
0%
5%
10%
15%
20%
25%
30%
UnitedKingdom
ItalyFranceEuropeOther2
NorthernEurope1
SpainGermany
2013
106
59
74
New passeNger car registratioNs per couNtry
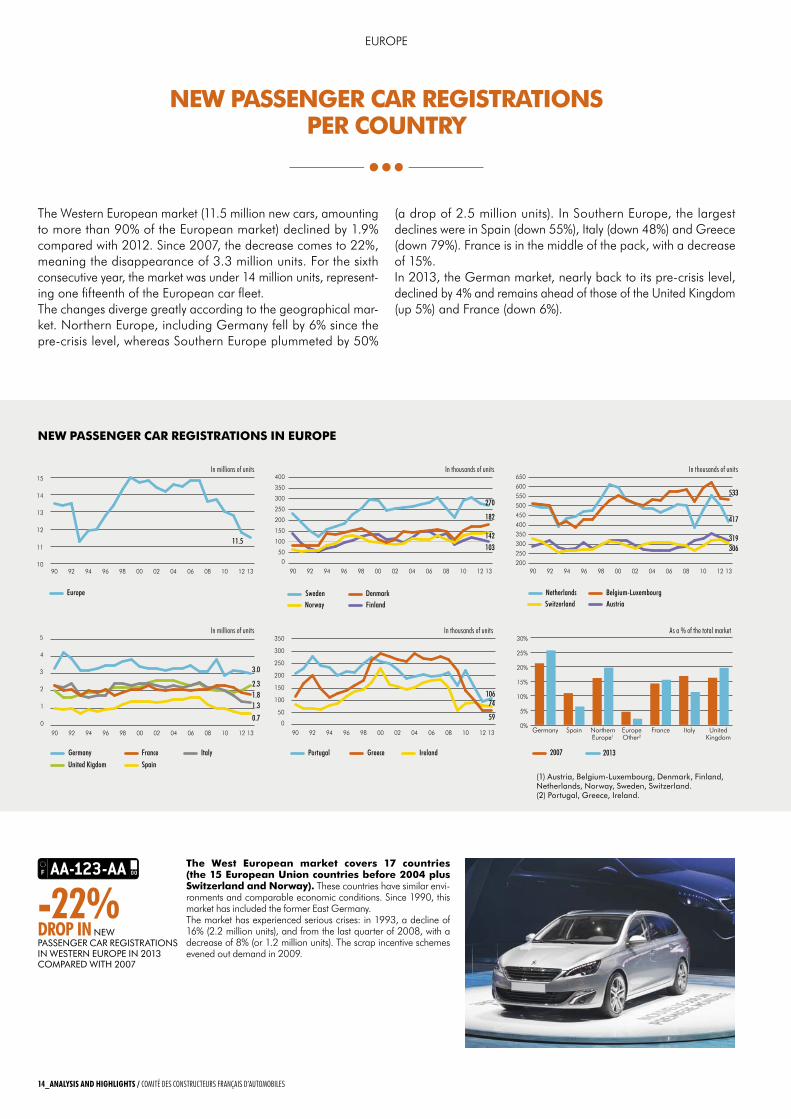
The Western European market (11.5 million new cars, amounting to more than 90% of the European market) declined by 1.9% compared with 2012. Since 2007, the decrease comes to 22%, meaning the disappearance of 3.3 million units. For the sixth consecutive year, the market was under 14 million units, represent-ing one fifteenth of the European car fleet.The changes diverge greatly according to the geographical mar-ket. Northern Europe, including Germany fell by 6% since the pre-crisis level, whereas Southern Europe plummeted by 50%
(a drop of 2.5 million units). In Southern Europe, the largest declines were in Spain (down 55%), Italy (down 48%) and Greece (down 79%). France is in the middle of the pack, with a decrease of 15%.In 2013, the German market, nearly back to its pre-crisis level, declined by 4% and remains ahead of those of the United Kingdom (up 5%) and France (down 6%).
New passeNger car registratioNs iN europe
In millions of units
In thousands of units
In thousands of units
In thousands of unitsIn millions of units
(1) Austria, Belgium-Luxembourg, Denmark, Finland, Netherlands, Norway, Sweden, Switzerland.(2) Portugal, Greece, Ireland.
As a % of the total market
the west european market covers 17 countries (the 15 european union countries before 2004 plus switzerland and Norway). These countries have similar envi-ronments and comparable economic conditions. Since 1990, this market has included the former East Germany.The market has experienced serious crises: in 1993, a decline of 16% (2.2 million units), and from the last quarter of 2008, with a decrease of 8% (or 1.2 million units). The scrap incentive schemes evened out demand in 2009.
-22%drop in New PASSeNGer cAr reGIStrAtIoNS IN weSterN euroPe IN 2013 comPAreD wIth 2007
14_AnAlysis And highlights / ComIté des ConstruCteurs FrAnçAIs d’AutomobIles ComIté des ConstruCteurs FrAnçAIs d’AutomobIles / AnAlysis And highlights_15
EUropE
VW Fiat RenaultPSA Peugeot Citroën
Ford GM Daimler
Toyota Group Nissan Hyundai-Kia
BMW Group
5%7%9%
11%13%15%17%19%21%23%25%
13121008060402009896949290
0%
3%
6%
9%
12%
15%
12121008060402009896949290
0%
1%
2%
3%
4%
5%
6%
7%
13121008060402009896949290
7.9%
7.6%6.7%
5.8%
24.8%
11.1%
6.2%
8.7%
4.3%
5.9%
3.5%
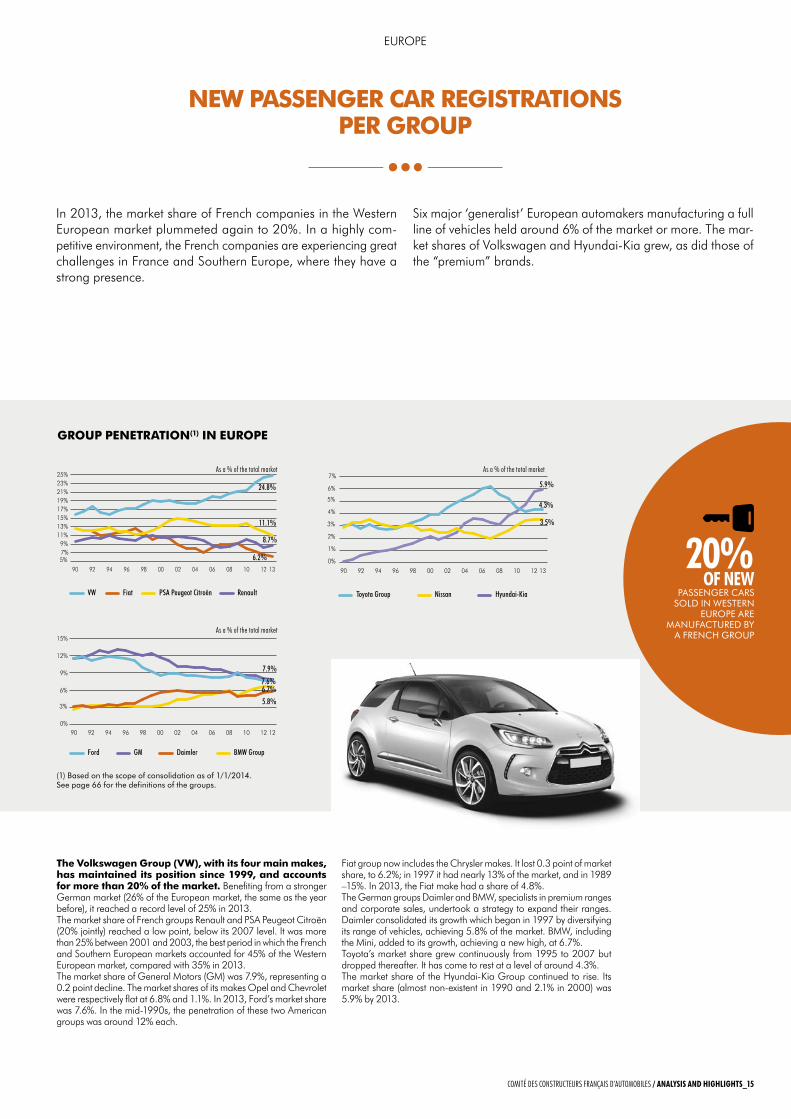
the Volkswagen group (Vw), with its four main makes, has maintained its position since 1999, and accounts for more than 20% of the market. Benefiting from a stronger German market (26% of the European market, the same as the year before), it reached a record level of 25% in 2013.The market share of French groups renault and pSA peugeot Citroën (20% jointly) reached a low point, below its 2007 level. It was more than 25% between 2001 and 2003, the best period in which the French and Southern European markets accounted for 45% of the Western European market, compared with 35% in 2013.The market share of General Motors (GM) was 7.9%, representing a 0.2 point decline. The market shares of its makes opel and Chevrolet were respectively flat at 6.8% and 1.1%. In 2013, Ford’s market share was 7.6%. In the mid-1990s, the penetration of these two American groups was around 12% each.
Fiat group now includes the Chrysler makes. It lost 0.3 point of market share, to 6.2%; in 1997 it had nearly 13% of the market, and in 1989 –15%. In 2013, the Fiat make had a share of 4.8%.The German groups Daimler and BMW, specialists in premium ranges and corporate sales, undertook a strategy to expand their ranges. Daimler consolidated its growth which began in 1997 by diversifying its range of vehicles, achieving 5.8% of the market. BMW, including the Mini, added to its growth, achieving a new high, at 6.7%.Toyota’s market share grew continuously from 1995 to 2007 but dropped thereafter. It has come to rest at a level of around 4.3%.The market share of the Hyundai-Kia Group continued to rise. Its market share (almost non-existent in 1990 and 2.1% in 2000) was 5.9% by 2013.
(1) Based on the scope of consolidation as of 1/1/2014. See page 66 for the definitions of the groups.
As a % of the total market
As a % of the total market
group peNetratioN(1) iN europe
As a % of the total market
20%of new
PASSeNGer cArS SoLD IN weSterN
euroPe Are mANuFActureD By
A FreNch GrouP
New passeNger car registratioNs per group
In 2013, the market share of French companies in the Western European market plummeted again to 20%. In a highly com-petitive environment, the French companies are experiencing great challenges in France and Southern Europe, where they have a strong presence.
Six major ‘generalist’ European automakers manufacturing a full line of vehicles held around 6% of the market or more. The mar-ket shares of Volkswagen and Hyundai-Kia grew, as did those of the “premium” brands.
14_AnAlysis And highlights / ComIté des ConstruCteurs FrAnçAIs d’AutomobIles ComIté des ConstruCteurs FrAnçAIs d’AutomobIles / AnAlysis And highlights_15
EUropE
models And body styles reSPectIveLy oFFereD By FreNch mANuFActurerS
groups makes economy and low range low-mid range high-mid range premium range
pSA pEUGEoT CITroëNCITroëN C-Zéro, C1, C3, DS3,
C4-Cactus, Nemo, BerlingoC4, DS4, C4 Air Cross,
Jumpy, Jumper C5, DS5, C8
pEUGEoT i0n, 107, 206+, 207, 208, 2008, Bipper, partner
308, rCZ, 3008, 4008, 5008, Expert, Boxer 508 807
rENAULT GroUprENAULT Twingo, Wind, Clio, Modus,
Captur, Kangoo, ZoE Mégane, Fluence, Master Laguna, Trafic, Koleos Espace, Latitude
DACIA Logan, Sandero, Duster, Dokker Lodgy
BMWBMW i3 Série 1 Série 4, X1 Séries 3, 5, 6, 7, X3, X5, X6, Z4
MINI Mini
DAIMLErMErCEDES Classes A, B, CLA, Vito Viano Classes C, E, S, CL, SL, CLS,
SLS, CLK, SLK, r, G, GL, GLK SMArT Fortwo ML
FIAT
ALFA roMEo Mito Giuletta 159 4C
CHrYSLEr-JEEp Wrangler, Compass (Grand) Cherokee
FIAT panda, 500, punto, Sedici, Fiorino, Doblo, Bravo, Scudo, Ducato Freemont
LANCIA Ypsilon, Musa Delta Thema, Voyager
ForD EUropE ForD Ka, Fiesta, B-Max, T. Connect Focus, (Grand) C-Max, Kuga, Transit, t Custom Mondeo Galaxy, S-Max
GEELY VoLVo C30 S40, V40, V50 S60, S80, V60, V70, C70, XC60, XC70, XC90
GM EUropECHEVroLET Spark, Aveo, Trax orlando, Volt Cruze, Captiva Malibu, Corvette, Camaro
opEL Agila, Corsa, Adam, Meriva, Combo, Mokka Astra, Ampera, Zafira Cascada, Insignia, Antara,
Vivaro
HoNDA HoNDA Jazz Civic, Cr-Z, Insight Accord, Cr-V
HYUNDAIHYUNDAI I10, I20, IX20 I30, Veloster, H1 Sonata, IX 35, I40, Santa
Fe, IX 55
KIA picanto, Soul, Venga rio, Cee’d, Carens optima, Sportage Sorento
MAZDA MAZDA 2 3, 5, MX5, CX-5 6
MITSUBISHI MITSUBISHI i-MiEV Spacestar, ASX outlander pajero
NISSAN NISSAN pixo, Micra, Note, Juke primastar, Leaf, NV200 Qashqai, X-Trail 370Z, Murano, pathfinder, GT-r
SUBArU SUBArU Trezia Impreza, Legacy, Forester BrZ
SUZUKI SUZUKI Alto, Splash, Swift, SX4, Jimny Grand Vitara
TATA GroUpJAGUAr XF, XJ, XK, F-TYpE
LAND roVEr Freelander, rr Evoque Discovery, range rover
ToYoTA
DAIHATSU Charade, Cuore, Sirion, Terios
LEXUS CT 200 H GS, IS, LS, rX
ToYoTA IQ, Aygo, Yaris, Verso-S, Urban Cruiser Verso, Auris Avensis, prius, rAV4 GT86, Land Cruiser
VoLKSWAGEN GroUp
AUDI A1 A3, S3 A4, A5, TT, Q3, rS4, rS5 A6, A7, A8, r8, Q5, Q7, rS6, rS7
porSCHE 911, Boxster, Cayman, Cayenne, panamera
SEAT Mii, Ibiza Leon, Altea Toledo, Exeo Alhambra
SKoDA Citigo, roomster, Yeti Fabia, rapid octavia Superb
VoLKSWAGEN Up!, polo, Caddy Golf, Jetta, New Beetle, Touran, Eos
passat, Scirocco, Tiguan, CC, Transporter Sharan, phaeton, Touareg
Source: ccFA.
raNge aNalysis iN 2013
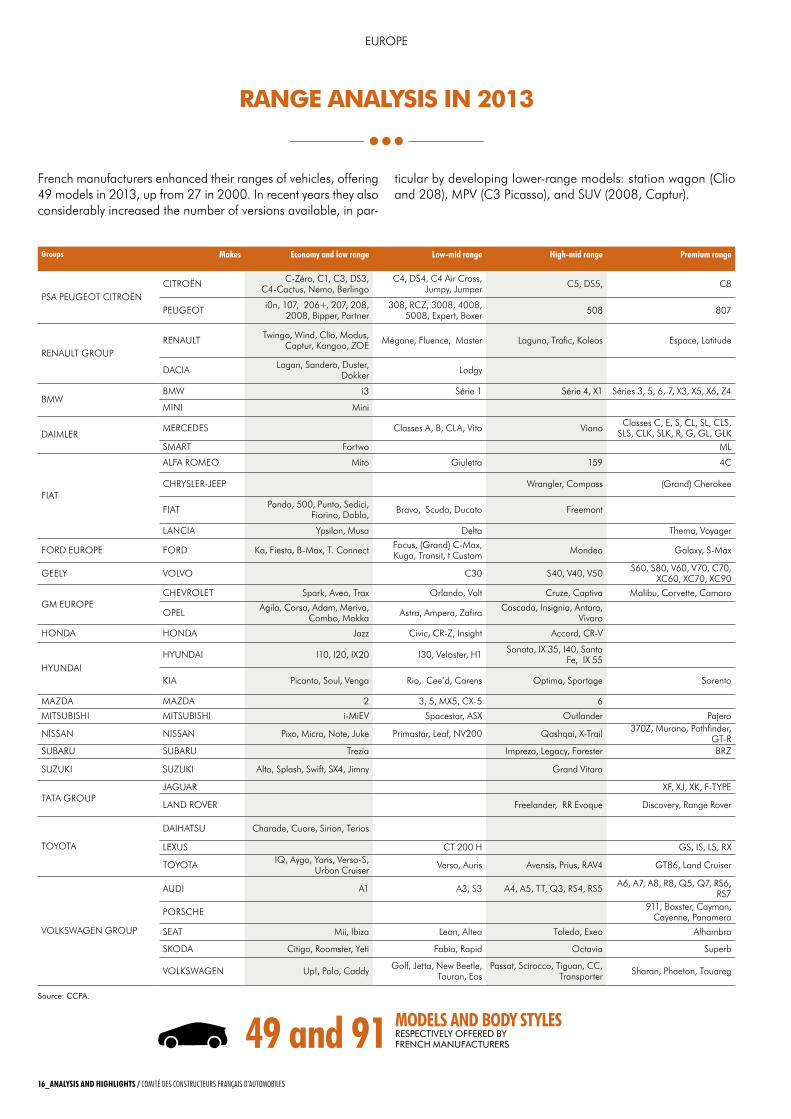
French manufacturers enhanced their ranges of vehicles, offering 49 models in 2013, up from 27 in 2000. In recent years they also considerably increased the number of versions available, in par-
ticular by developing lower-range models: station wagon (Clio and 208), MpV (C3 picasso), and SUV (2008, Captur).
49 and 9116_AnAlysis And highlights / ComIté des ConstruCteurs FrAnçAIs d’AutomobIles ComIté des ConstruCteurs FrAnçAIs d’AutomobIles / AnAlysis And highlights_17
EUropE
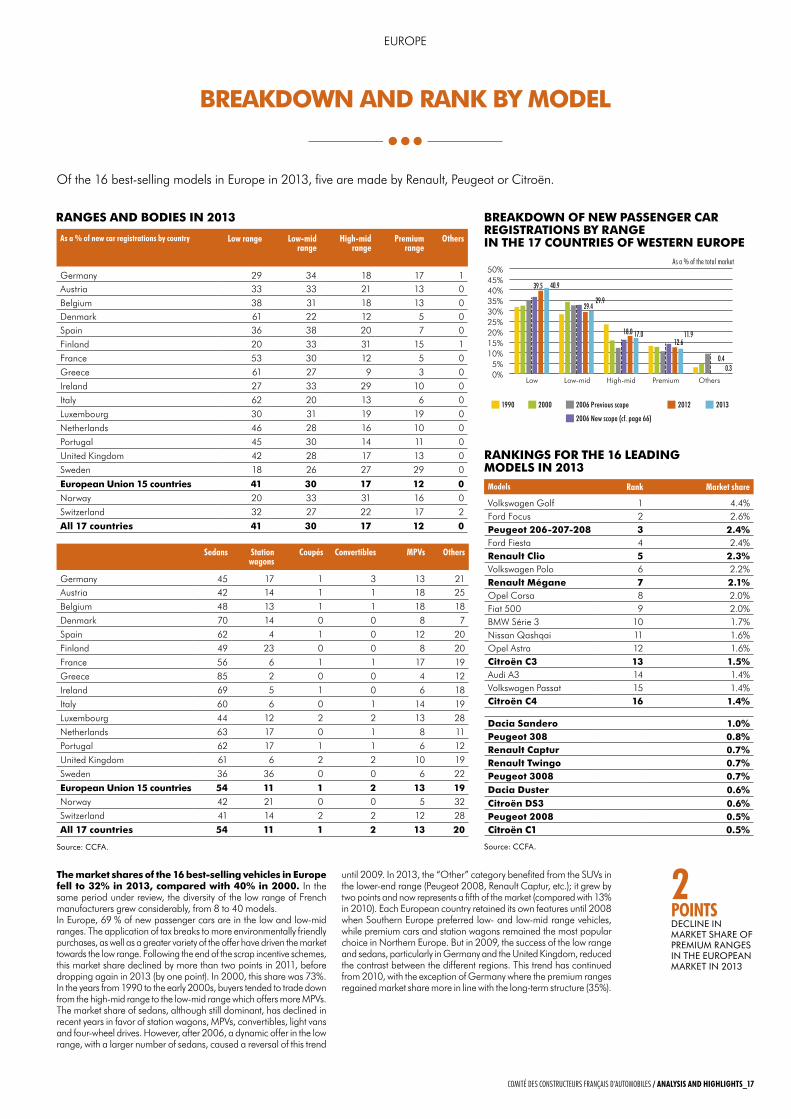
the market shares of the 16 best-selling vehicles in europe fell to 32% in 2013, compared with 40% in 2000. In the same period under review, the diversity of the low range of French manufacturers grew considerably, from 8 to 40 models.In Europe, 69 % of new passenger cars are in the low and low-mid ranges. The application of tax breaks to more environmentally friendly purchases, as well as a greater variety of the offer have driven the market towards the low range. Following the end of the scrap incentive schemes, this market share declined by more than two points in 2011, before dropping again in 2013 (by one point). In 2000, this share was 73%.In the years from 1990 to the early 2000s, buyers tended to trade down from the high-mid range to the low-mid range which offers more MpVs. The market share of sedans, although still dominant, has declined in recent years in favor of station wagons, MpVs, convertibles, light vans and four-wheel drives. However, after 2006, a dynamic offer in the low range, with a larger number of sedans, caused a reversal of this trend
until 2009. In 2013, the “other” category benefited from the SUVs in the lower-end range (peugeot 2008, renault Captur, etc.); it grew by two points and now represents a fifth of the market (compared with 13% in 2010). Each European country retained its own features until 2008 when Southern Europe preferred low- and low-mid range vehicles, while premium cars and station wagons remained the most popular choice in Northern Europe. But in 2009, the success of the low range and sedans, particularly in Germany and the United Kingdom, reduced the contrast between the different regions. This trend has continued from 2010, with the exception of Germany where the premium ranges regained market share more in line with the long-term structure (35%).
of the 16 best-selling models in Europe in 2013, five are made by renault, peugeot or Citroën.
BreakdowN aNd raNk By model
2 points DecLINe IN mArket ShAre oF PremIum rANGeS IN the euroPeAN mArket IN 2013
raNges aNd Bodies iN 2013
As a % of new car registrations by country low range low-mid range
high-mid range
premium range
others
Germany 29 34 18 17 1Austria 33 33 21 13 0Belgium 38 31 18 13 0Denmark 61 22 12 5 0Spain 36 38 20 7 0Finland 20 33 31 15 1France 53 30 12 5 0Greece 61 27 9 3 0Ireland 27 33 29 10 0Italy 62 20 13 6 0Luxembourg 30 31 19 19 0Netherlands 46 28 16 10 0portugal 45 30 14 11 0United Kingdom 42 28 17 13 0Sweden 18 26 27 29 0
european union 15 countries 41 30 17 12 0Norway 20 33 31 16 0Switzerland 32 27 22 17 2
all 17 countries 41 30 17 12 0
sedans station wagons
Coupés Convertibles mpVs others
Germany 45 17 1 3 13 21Austria 42 14 1 1 18 25Belgium 48 13 1 1 18 18Denmark 70 14 0 0 8 7Spain 62 4 1 0 12 20Finland 49 23 0 0 8 20France 56 6 1 1 17 19Greece 85 2 0 0 4 12Ireland 69 5 1 0 6 18Italy 60 6 0 1 14 19Luxembourg 44 12 2 2 13 28Netherlands 63 17 0 1 8 11portugal 62 17 1 1 6 12United Kingdom 61 6 2 2 10 19Sweden 36 36 0 0 6 22
european union 15 countries 54 11 1 2 13 19Norway 42 21 0 0 5 32Switzerland 41 14 2 2 12 28
all 17 countries 54 11 1 2 13 20
Source: ccFA.
raNkiNgs for the 16 leadiNg models iN 2013models rank market share
Volkswagen Golf 1 4.4%Ford Focus 2 2.6%peugeot 206-207-208 3 2.4%Ford Fiesta 4 2.4%renault clio 5 2.3%Volkswagen polo 6 2.2%renault mégane 7 2.1%opel Corsa 8 2.0%Fiat 500 9 2.0%BMW Série 3 10 1.7%Nissan Qashqai 11 1.6%opel Astra 12 1.6%citroën c3 13 1.5%Audi A3 14 1.4%Volkswagen passat 15 1.4%citroën c4 16 1.4%
dacia sandero 1.0%peugeot 308 0.8%renault captur 0.7%renault twingo 0.7%peugeot 3008 0.7%dacia duster 0.6%citroën ds3 0.6%peugeot 2008 0.5%citroën c1 0.5%
Source: ccFA.
BreakdowN of New passeNger car registratioNs By raNge iN the 17 couNtries of westerN europe
Low Low-mid High-mid Premium Others0%5%
10%15%20%25%30%35%40%45%50%
1990 2000 2006 Previous scope
2006 New scope (cf. page 66)
2012 2013
39.5 40.9
29.929.4
18.0 17.0 11.912.6
0.30.4
As a % of the total market
16_AnAlysis And highlights / ComIté des ConstruCteurs FrAnçAIs d’AutomobIles ComIté des ConstruCteurs FrAnçAIs d’AutomobIles / AnAlysis And highlights_17
EUropE
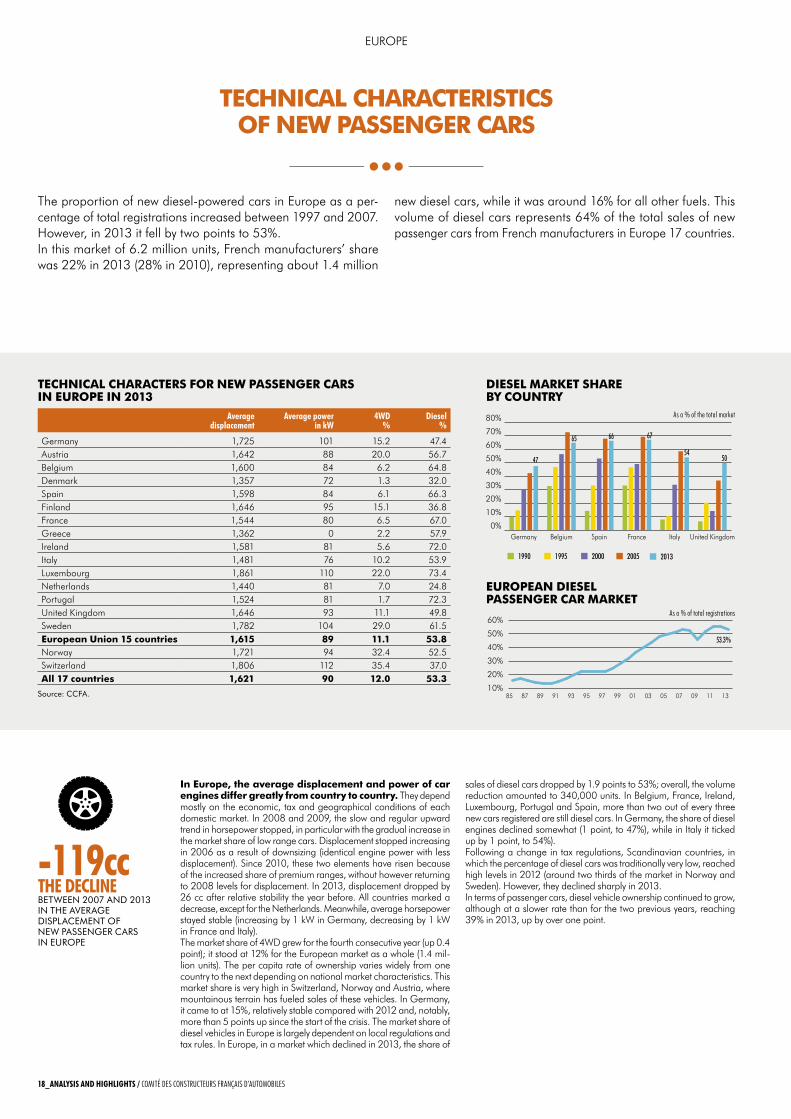
in europe, the average displacement and power of car engines differ greatly from country to country. They depend mostly on the economic, tax and geographical conditions of each domestic market. In 2008 and 2009, the slow and regular upward trend in horsepower stopped, in particular with the gradual increase in the market share of low range cars. Displacement stopped increasing in 2006 as a result of downsizing (identical engine power with less displacement). Since 2010, these two elements have risen because of the increased share of premium ranges, without however returning to 2008 levels for displacement. In 2013, displacement dropped by 26 cc after relative stability the year before. All countries marked a decrease, except for the Netherlands. Meanwhile, average horsepower stayed stable (increasing by 1 kW in Germany, decreasing by 1 kW in France and Italy).The market share of 4WD grew for the fourth consecutive year (up 0.4 point); it stood at 12% for the European market as a whole (1.4 mil-lion units). The per capita rate of ownership varies widely from one country to the next depending on national market characteristics. This market share is very high in Switzerland, Norway and Austria, where mountainous terrain has fueled sales of these vehicles. In Germany, it came to at 15%, relatively stable compared with 2012 and, notably, more than 5 points up since the start of the crisis. The market share of diesel vehicles in Europe is largely dependent on local regulations and tax rules. In Europe, in a market which declined in 2013, the share of
The proportion of new diesel-powered cars in Europe as a per-centage of total registrations increased between 1997 and 2007. However, in 2013 it fell by two points to 53%.In this market of 6.2 million units, French manufacturers’ share was 22% in 2013 (28% in 2010), representing about 1.4 million
new diesel cars, while it was around 16% for all other fuels. This volume of diesel cars represents 64% of the total sales of new passenger cars from French manufacturers in Europe 17 countries.
techNical characteristics of New passeNger cars
-119ccthe deCline BetweeN 2007 AND 2013 IN the AverAGe DISPLAcemeNt oF New PASSeNGer cArS IN euroPe
techNical characters for New passeNger cars iN europe iN 2013
diesel market share By couNtry
europeaN diesel passeNger car market
Average displacement
Average power in kw
4wd %
diesel %
Germany 1,725 101 15.2 47.4Austria 1,642 88 20.0 56.7Belgium 1,600 84 6.2 64.8Denmark 1,357 72 1.3 32.0Spain 1,598 84 6.1 66.3Finland 1,646 95 15.1 36.8France 1,544 80 6.5 67.0Greece 1,362 0 2.2 57.9Ireland 1,581 81 5.6 72.0Italy 1,481 76 10.2 53.9Luxembourg 1,861 110 22.0 73.4Netherlands 1,440 81 7.0 24.8portugal 1,524 81 1.7 72.3United Kingdom 1,646 93 11.1 49.8Sweden 1,782 104 29.0 61.5european union 15 countries 1,615 89 11.1 53.8Norway 1,721 94 32.4 52.5Switzerland 1,806 112 35.4 37.0all 17 countries 1,621 90 12.0 53.3
Source: ccFA.
1990 1995 2000 2005 2013
0%
10%
20%
30%
40%
50%
60%
70%
80%2013
2005
2000
1995
1990
United KingdomItalyFranceSpainBelgiumGermany
65
47
66 67
5450
53.3%
10%
20%
30%
40%
50%
60%
131109070503019997959391898785
As a % of total registrations
As a % of the total market
1990 1995 2000 2005 2013
0%
10%
20%
30%
40%
50%
60%
70%
80%2013
2005
2000
1995
1990
United KingdomItalyFranceSpainBelgiumGermany
65
47
66 67
5450
53.3%
10%
20%
30%
40%
50%
60%
131109070503019997959391898785
sales of diesel cars dropped by 1.9 points to 53%; overall, the volume reduction amounted to 340,000 units. In Belgium, France, Ireland, Luxembourg, portugal and Spain, more than two out of every three new cars registered are still diesel cars. In Germany, the share of diesel engines declined somewhat (1 point, to 47%), while in Italy it ticked up by 1 point, to 54%). Following a change in tax regulations, Scandinavian countries, in which the percentage of diesel cars was traditionally very low, reached high levels in 2012 (around two thirds of the market in Norway and Sweden). However, they declined sharply in 2013.In terms of passenger cars, diesel vehicle ownership continued to grow, although at a slower rate than for the two previous years, reaching 39% in 2013, up by over one point.
18_AnAlysis And highlights / ComIté des ConstruCteurs FrAnçAIs d’AutomobIles ComIté des ConstruCteurs FrAnçAIs d’AutomobIles / AnAlysis And highlights_19
EUropE
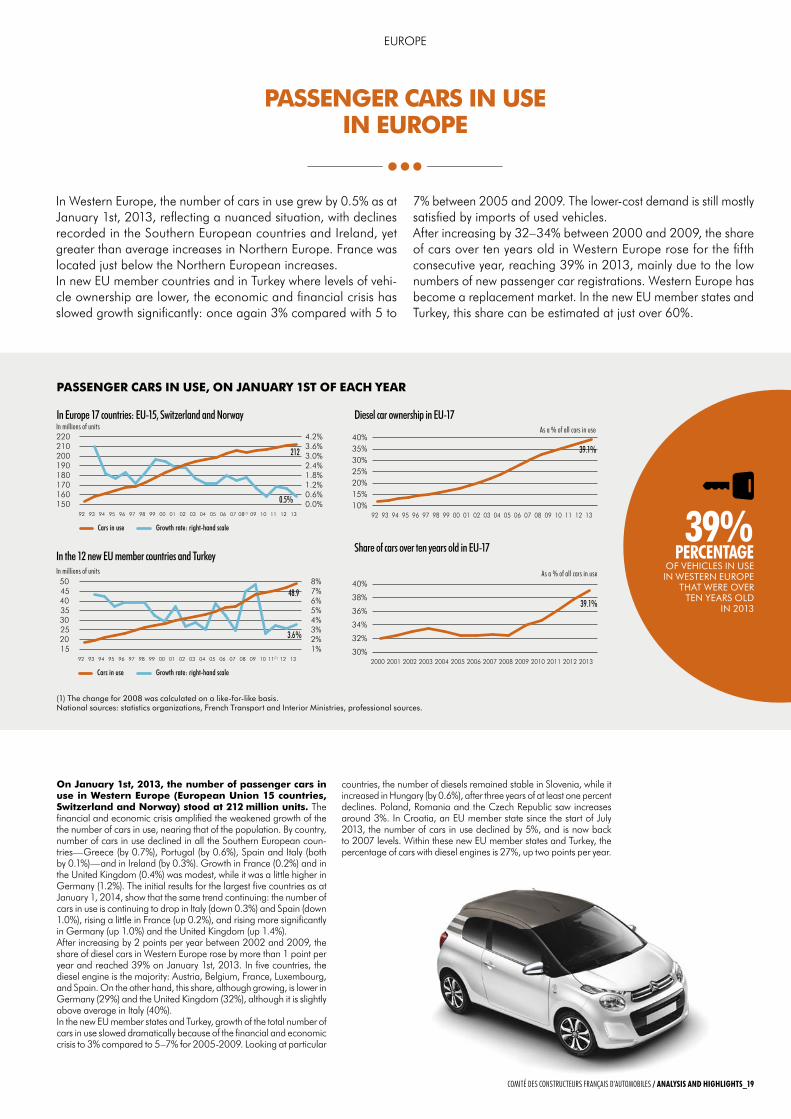
on January 1st, 2013, the number of passenger cars in use in western europe (european union 15 countries, switzerland and Norway) stood at 212 million units. The financial and economic crisis amplified the weakened growth of the the number of cars in use, nearing that of the population. By country, number of cars in use declined in all the Southern European coun-tries—Greece (by 0.7%), portugal (by 0.6%), Spain and Italy (both by 0.1%)—and in Ireland (by 0.3%). Growth in France (0.2%) and in the United Kingdom (0.4%) was modest, while it was a little higher in Germany (1.2%). The initial results for the largest five countries as at January 1, 2014, show that the same trend continuing: the number of cars in use is continuing to drop in Italy (down 0.3%) and Spain (down 1.0%), rising a little in France (up 0.2%), and rising more significantly in Germany (up 1.0%) and the United Kingdom (up 1.4%).After increasing by 2 points per year between 2002 and 2009, the share of diesel cars in Western Europe rose by more than 1 point per year and reached 39% on January 1st, 2013. In five countries, the diesel engine is the majority: Austria, Belgium, France, Luxembourg, and Spain. on the other hand, this share, although growing, is lower in Germany (29%) and the United Kingdom (32%), although it is slightly above average in Italy (40%).In the new EU member states and Turkey, growth of the total number of cars in use slowed dramatically because of the financial and economic crisis to 3% compared to 5–7% for 2005-2009. Looking at particular
countries, the number of diesels remained stable in Slovenia, while it increased in Hungary (by 0.6%), after three years of at least one percent declines. poland, romania and the Czech republic saw increases around 3%. In Croatia, an EU member state since the start of July 2013, the number of cars in use declined by 5%, and is now back to 2007 levels. Within these new EU member states and Turkey, the percentage of cars with diesel engines is 27%, up two points per year.
In Western Europe, the number of cars in use grew by 0.5% as at January 1st, 2013, reflecting a nuanced situation, with declines recorded in the Southern European countries and Ireland, yet greater than average increases in Northern Europe. France was located just below the Northern European increases.In new EU member countries and in Turkey where levels of vehi-cle ownership are lower, the economic and financial crisis has slowed growth significantly: once again 3% compared with 5 to
7% between 2005 and 2009. The lower-cost demand is still mostly satisfied by imports of used vehicles.After increasing by 32–34% between 2000 and 2009, the share of cars over ten years old in Western Europe rose for the fifth consecutive year, reaching 39% in 2013, mainly due to the low numbers of new passenger car registrations. Western Europe has become a replacement market. In the new EU member states and Turkey, this share can be estimated at just over 60%.
passeNger cars iN use iN europe
In Europe 17 countries: EU-15, Switzerland and Norway Diesel car ownership in EU-17
In the 12 new EU member countries and TurkeyShare of cars over ten years old in EU-17
In millions of units As a % of all cars in use
As a % of all cars in useIn millions of units
0.0%0.6%1.2%1.8%2.4%3.0%3.6%4.2% Taux de croissance
131211100908(1)07060504030201009998979695949392
Growth rate: right-hand scaleCars in use
0.5%150160170180190200210220 TOTAL
212
1%2%3%4%5%6%7%8% Taux de croissance
131211(1)10090807060504030201009998979695949392
Growth rate: right-hand scaleCars in use
3.6 %1520253035404550 TOTAL
48.9
10%15%20%25%30%35%40%
13121110090807060504030201009998979695949392
39.1%
30%
32%
34%
36%
38%
40%
20132012201120102009200820072006200520042003200220012000
39.1%
10%15%20%25%30%35%40%
13121110090807060504030201009998979695949392
39.1%
30%
32%
34%
36%
38%
40%
20132012201120102009200820072006200520042003200220012000
39.1%
(1) the change for 2008 was calculated on a like-for-like basis. National sources: statistics organizations, French transport and Interior ministries, professional sources.
passeNger cars iN use, oN JaNuary 1st of each year
39%perCentAge
oF vehIcLeS IN uSe IN weSterN euroPe
thAt were over teN yeArS oLD
IN 2013
18_AnAlysis And highlights / ComIté des ConstruCteurs FrAnçAIs d’AutomobIles ComIté des ConstruCteurs FrAnçAIs d’AutomobIles / AnAlysis And highlights_19
EUropE
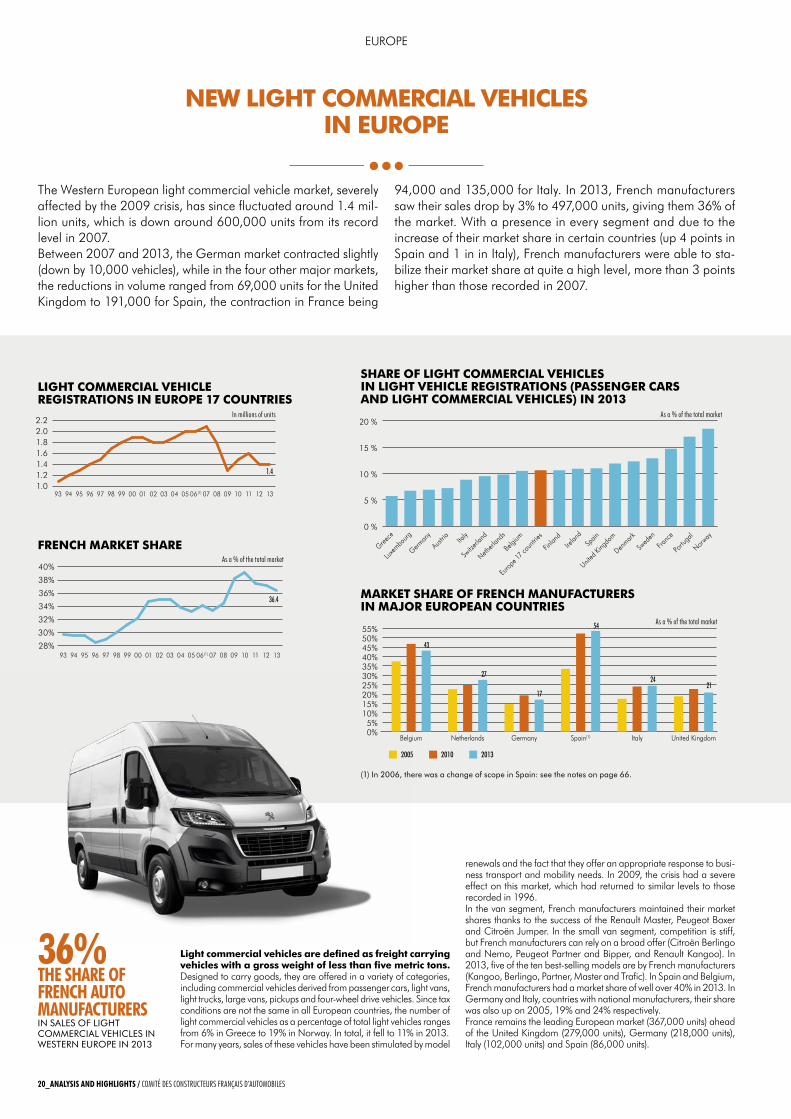
New light commercial Vehicles iN europe
light commercial vehicles are defined as freight carrying vehicles with a gross weight of less than five metric tons. Designed to carry goods, they are offered in a variety of categories, including commercial vehicles derived from passenger cars, light vans, light trucks, large vans, pickups and four-wheel drive vehicles. Since tax conditions are not the same in all European countries, the number of light commercial vehicles as a percentage of total light vehicles ranges from 6% in Greece to 19% in Norway. In total, it fell to 11% in 2013.For many years, sales of these vehicles have been stimulated by model
renewals and the fact that they offer an appropriate response to busi-ness transport and mobility needs. In 2009, the crisis had a severe effect on this market, which had returned to similar levels to those recorded in 1996.In the van segment, French manufacturers maintained their market shares thanks to the success of the renault Master, peugeot Boxer and Citroën Jumper. In the small van segment, competition is stiff, but French manufacturers can rely on a broad offer (Citroën Berlingo and Nemo, peugeot partner and Bipper, and renault Kangoo). In 2013, five of the ten best-selling models are by French manufacturers (Kangoo, Berlingo, partner, Master and Trafic). In Spain and Belgium, French manufacturers had a market share of well over 40% in 2013. In Germany and Italy, countries with national manufacturers, their share was also up on 2005, 19% and 24% respectively.France remains the leading European market (367,000 units) ahead of the United Kingdom (279,000 units), Germany (218,000 units), Italy (102,000 units) and Spain (86,000 units).
The Western European light commercial vehicle market, severely affected by the 2009 crisis, has since fluctuated around 1.4 mil-lion units, which is down around 600,000 units from its record level in 2007. Between 2007 and 2013, the German market contracted slightly (down by 10,000 vehicles), while in the four other major markets, the reductions in volume ranged from 69,000 units for the United Kingdom to 191,000 for Spain, the contraction in France being
94,000 and 135,000 for Italy. In 2013, French manufacturers saw their sales drop by 3% to 497,000 units, giving them 36% of the market. With a presence in every segment and due to the increase of their market share in certain countries (up 4 points in Spain and 1 in in Italy), French manufacturers were able to sta-bilize their market share at quite a high level, more than 3 points higher than those recorded in 2007.
light commercial Vehicle registratioNs iN europe 17 couNtries
freNch market share
(1) In 2006, there was a change of scope in Spain: see the notes on page 66.
share of light commercial Vehicles iN light Vehicle registratioNs (passeNger cars aNd light commercial Vehicles) iN 2013
market share of freNch maNufacturers iN maJor europeaN couNtries
1.01.21.41.61.82.02.2
1312111009080706(1)05040302010099989796959493
28%
30%
32%
34%
36%
38%
40%
1312111009080706(1)05040302010099989796959493
1.4
36.4
0 %
5 %
10 %
15 %
20 %
2005 2010 2013
0%5%
10%15%20%25%30%35%40%45%50%55%
United KingdomItalySpain(1)GermanyNetherlandsBelgium
Norway
Portu
gal
Franc
e
Swed
en
Denmark
United
King
dom
Spain
Irelan
d
Finlan
d
Europ
e 17 c
ountr
ies
Belgi
um
Netherl
ands
Switz
erlan
dIta
ly
Austria
German
y
Luxem
bourg
Greece
24 21
43
27
17
54
As a % of the total market
As a % of the total market
In millions of units
As a % of the total market
36% the shAre of frenCh Auto mAnufACturersIN SALeS oF LIGht commercIAL vehIcLeS IN weSterN euroPe IN 2013
20_AnAlysis And highlights / ComIté des ConstruCteurs FrAnçAIs d’AutomobIles ComIté des ConstruCteurs FrAnçAIs d’AutomobIles / AnAlysis And highlights_21
EUropE
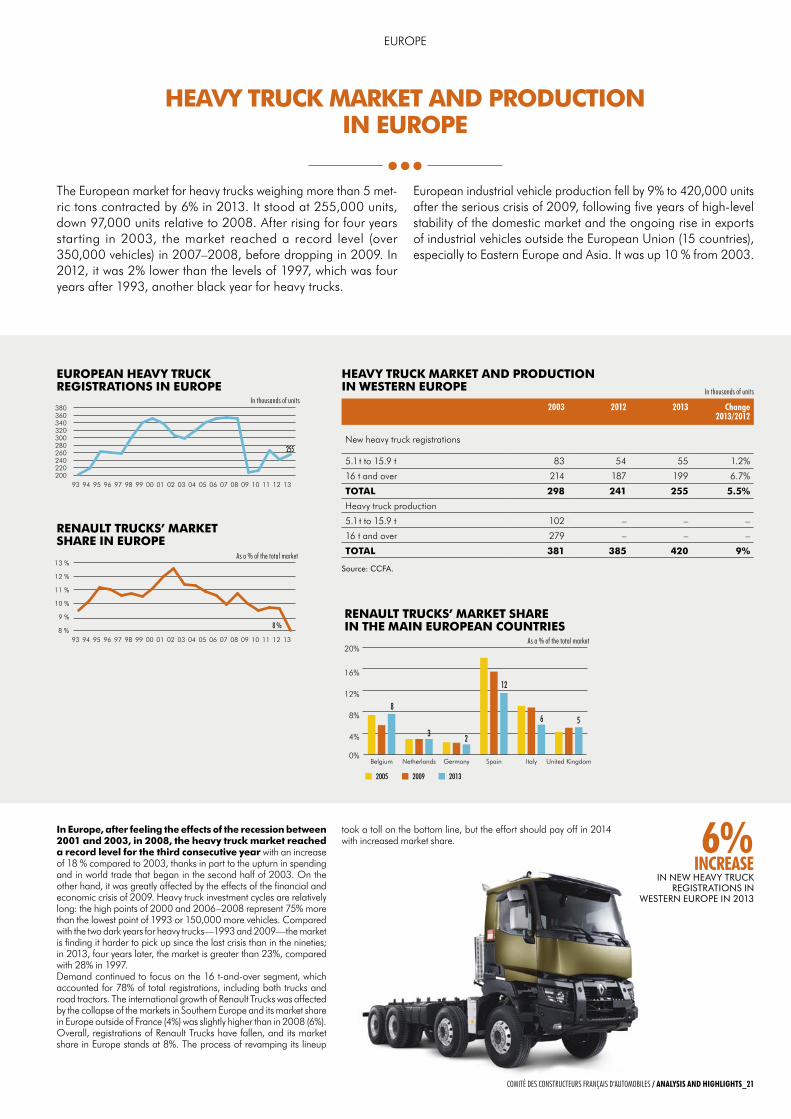
heaVy truck market aNd productioN iN europe
in europe, after feeling the effects of the recession between 2001 and 2003, in 2008, the heavy truck market reached a record level for the third consecutive year with an increase of 18 % compared to 2003, thanks in part to the upturn in spending and in world trade that began in the second half of 2003. on the other hand, it was greatly affected by the effects of the financial and economic crisis of 2009. Heavy truck investment cycles are relatively long: the high points of 2000 and 2006–2008 represent 75% more than the lowest point of 1993 or 150,000 more vehicles. Compared with the two dark years for heavy trucks—1993 and 2009—the market is finding it harder to pick up since the last crisis than in the nineties; in 2013, four years later, the market is greater than 23%, compared with 28% in 1997.Demand continued to focus on the 16 t-and-over segment, which accounted for 78% of total registrations, including both trucks and road tractors. The international growth of renault Trucks was affected by the collapse of the markets in Southern Europe and its market share in Europe outside of France (4%) was slightly higher than in 2008 (6%). overall, registrations of renault Trucks have fallen, and its market share in Europe stands at 8%. The process of revamping its lineup
took a toll on the bottom line, but the effort should pay off in 2014 with increased market share.
The European market for heavy trucks weighing more than 5 met-ric tons contracted by 6% in 2013. It stood at 255,000 units, down 97,000 units relative to 2008. After rising for four years starting in 2003, the market reached a record level (over 350,000 vehicles) in 2007–2008, before dropping in 2009. In 2012, it was 2% lower than the levels of 1997, which was four years after 1993, another black year for heavy trucks.
European industrial vehicle production fell by 9% to 420,000 units after the serious crisis of 2009, following five years of high-level stability of the domestic market and the ongoing rise in exports of industrial vehicles outside the European Union (15 countries), especially to Eastern Europe and Asia. It was up 10 % from 2003.
In thousands of units
heaVy truck market aNd productioN iN westerN europe
europeaN heaVy truck registratioNs iN europe
200220240260280300320340360380
131211100908070605040302010099989796959493
8 % 8 %
9 %
10 %
11 %
12 %
13 %
131211100908070605040302010099989796959493
255
reNault trucks’ market share iN europe
200220240260280300320340360380
131211100908070605040302010099989796959493
8 % 8 %
9 %
10 %
11 %
12 %
13 %
131211100908070605040302010099989796959493
255
As a % of the total market
reNault trucks’ market share iN the maiN europeaN couNtries
2005 2009 2013
0%
4%
8%
12%
16%
20% 2013
2009
2005
United KingdomItalySpainGermanyNetherlandsBelgium
3 2
8
12
6 5
In thousands of units2003 2012 2013 Change
2013/2012
New heavy truck registrations
5.1 t to 15.9 t 83 54 55 1.2%
16 t and over 214 187 199 6.7%
total 298 241 255 5.5%
Heavy truck production
5.1 t to 15.9 t 102 – – –
16 t and over 279 – – –
total 381 385 420 9% Source: ccFA.
As a % of the total market
6% inCreAse
IN New heAvy truck reGIStrAtIoNS IN
weSterN euroPe IN 2013
20_AnAlysis And highlights / ComIté des ConstruCteurs FrAnçAIs d’AutomobIles ComIté des ConstruCteurs FrAnçAIs d’AutomobIles / AnAlysis And highlights_21
EUropE
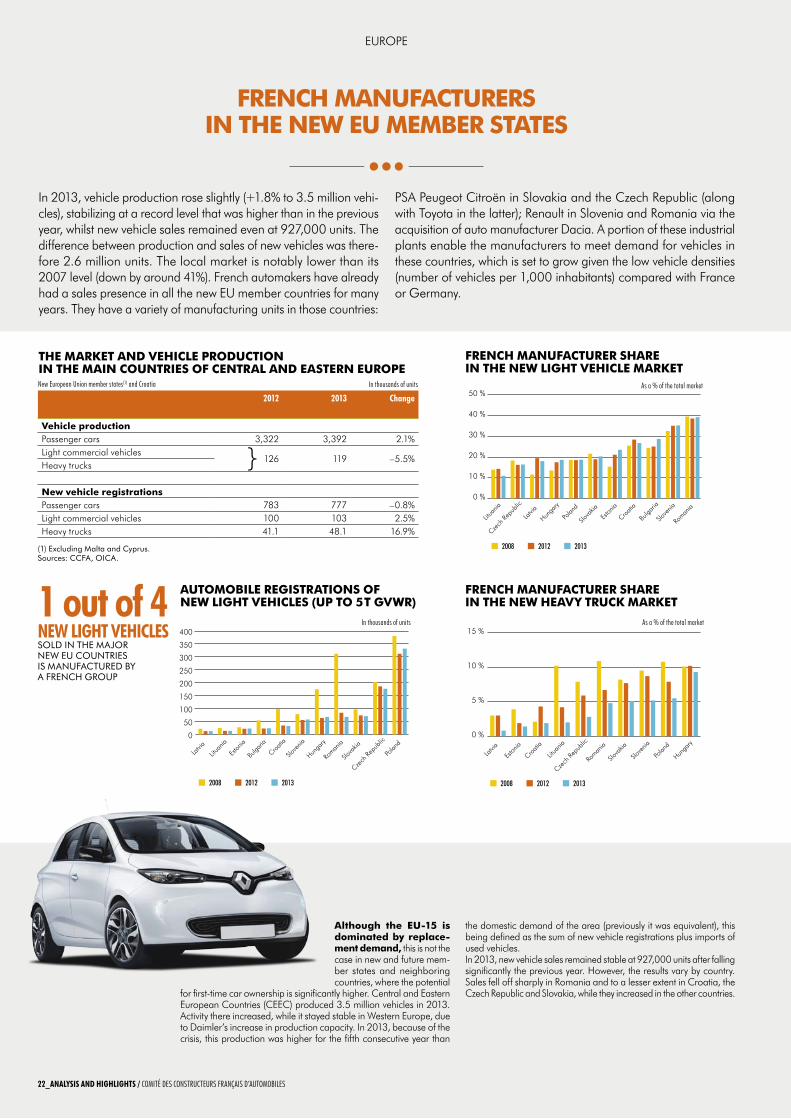
although the eu-15 is dominated by replace-ment demand, this is not the case in new and future mem-ber states and neighboring countries, where the potential
for first-time car ownership is significantly higher. Central and Eastern European Countries (CEEC) produced 3.5 million vehicles in 2013. Activity there increased, while it stayed stable in Western Europe, due to Daimler’s increase in production capacity. In 2013, because of the crisis, this production was higher for the fifth consecutive year than
the domestic demand of the area (previously it was equivalent), this being defined as the sum of new vehicle registrations plus imports of used vehicles.In 2013, new vehicle sales remained stable at 927,000 units after falling significantly the previous year. However, the results vary by country. Sales fell off sharply in romania and to a lesser extent in Croatia, the Czech republic and Slovakia, while they increased in the other countries.
1 out of 4new light VehiClesSoLD IN the mAjor New eu couNtrIeS IS mANuFActureD By A FreNch GrouP
2012 2013 Change
Vehicle productionpassenger cars 3,322 3,392 2.1%Light commercial vehicles
126 119 –5.5%Heavy trucks
New vehicle registrationspassenger cars 783 777 –0.8%Light commercial vehicles 100 103 2.5%Heavy trucks 41.1 48.1 16.9%
In thousands of units
(1) excluding malta and cyprus.Sources: ccFA, oIcA.
the market aNd Vehicle productioN iN the maiN couNtries of ceNtral aNd easterN europenew european union member states(1) and Croatia
automoBile registratioNs of New light Vehicles (up to 5 t gVwr)
freNch maNufacturer share iN the New light Vehicle market
freNch maNufacturer share iN the New heaVy truck market
Roman
ia
Slove
nia
Hunga
ry
Bulga
ria
Eston
ia
Croati
a
Slova
kia
Latvi
aPo
land
Czech
Repu
blic
Litua
nia
Czech
Repu
blic
Slova
kia
Roman
ia
Polan
d
Slove
nia
Hunga
ry
Croati
a
Bulga
ria
Eston
ia
Litua
nia
Latvi
a
2008 2012 2013
2008 2012 2013
2008 2012 2013
0
50
100
150
200
250
300
350
400
0 %
10 %
20 %
30 %
40 %
50 %
Litua
nia
Czech
Repu
blic
Roman
ia
Polan
d
Slova
kia
Slove
nia
Croati
a
Hunga
ry
Eston
iaLa
tvia
0 %
5 %
10 %
15 %
Roman
ia
Slove
nia
Hunga
ry
Bulga
ria
Eston
ia
Croati
a
Slova
kia
Latvi
aPo
land
Czech
Repu
blic
Litua
nia
Czech
Repu
blic
Slova
kia
Roman
ia
Polan
d
Slove
nia
Hunga
ry
Croati
a
Bulga
ria
Eston
ia
Litua
nia
Latvi
a
2008 2012 2013
2008 2012 2013
2008 2012 2013
0
50
100
150
200
250
300
350
400
0 %
10 %
20 %
30 %
40 %
50 %
Litua
nia
Czech
Repu
blic
Roman
ia
Polan
d
Slova
kia
Slove
nia
Croati
a
Hunga
ry
Eston
iaLa
tvia
0 %
5 %
10 %
15 %In thousands of units
As a % of the total market
As a % of the total market
In 2013, vehicle production rose slightly (+1.8% to 3.5 million vehi-cles), stabilizing at a record level that was higher than in the previous year, whilst new vehicle sales remained even at 927,000 units. The difference between production and sales of new vehicles was there-fore 2.6 million units. The local market is notably lower than its 2007 level (down by around 41%). French automakers have already had a sales presence in all the new EU member countries for many years. They have a variety of manufacturing units in those countries:
pSA peugeot Citroën in Slovakia and the Czech republic (along with Toyota in the latter); renault in Slovenia and romania via the acquisition of auto manufacturer Dacia. A portion of these industrial plants enable the manufacturers to meet demand for vehicles in these countries, which is set to grow given the low vehicle densities (number of vehicles per 1,000 inhabitants) compared with France or Germany.
freNch maNufacturers iN the New eu memBer states
}
22_AnAlysis And highlights / ComIté des ConstruCteurs FrAnçAIs d’AutomobIles ComIté des ConstruCteurs FrAnçAIs d’AutomobIles / AnAlysis And highlights_23
EUropE
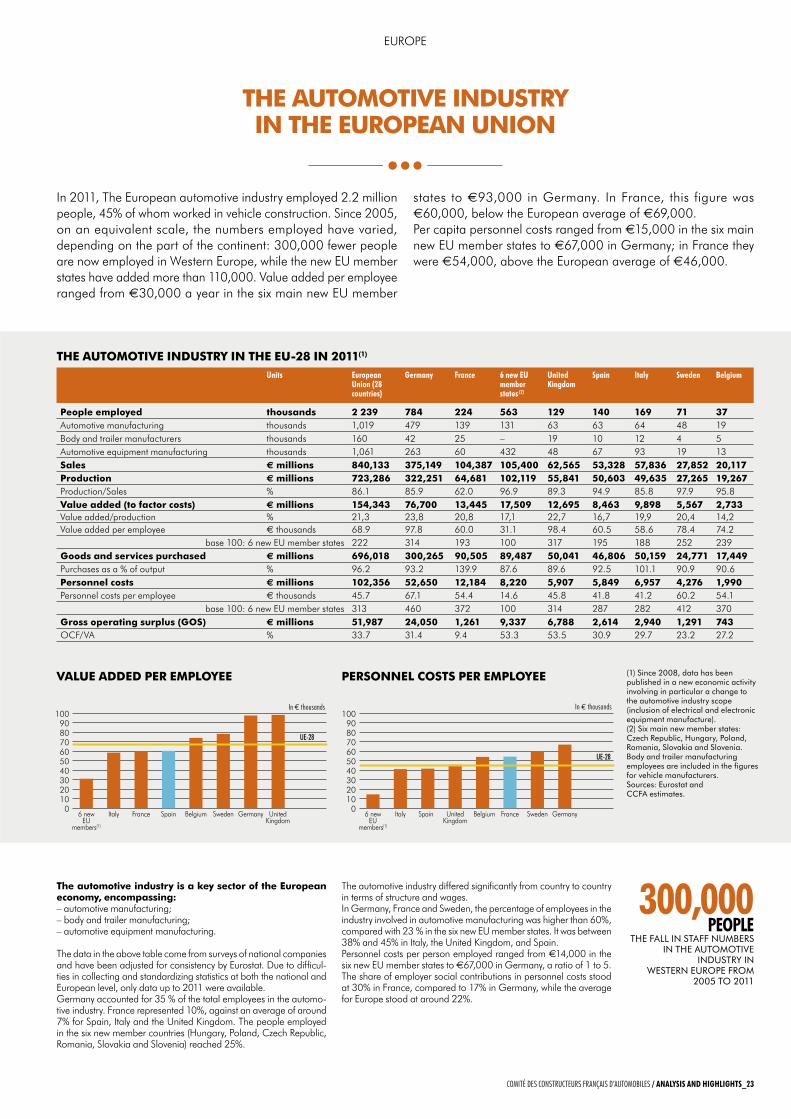
the automotive industry is a key sector of the european economy, encompassing:– automotive manufacturing;– body and trailer manufacturing;– automotive equipment manufacturing.
The data in the above table come from surveys of national companies and have been adjusted for consistency by Eurostat. Due to difficul-ties in collecting and standardizing statistics at both the national and European level, only data up to 2011 were available.Germany accounted for 35 % of the total employees in the automo-tive industry. France represented 10%, against an average of around 7% for Spain, Italy and the United Kingdom. The people employed in the six new member countries (Hungary, poland, Czech republic, romania, Slovakia and Slovenia) reached 25%.
The automotive industry differed significantly from country to country in terms of structure and wages.In Germany, France and Sweden, the percentage of employees in the industry involved in automotive manufacturing was higher than 60%, compared with 23 % in the six new EU member states. It was between 38% and 45% in Italy, the United Kingdom, and Spain.personnel costs per person employed ranged from €14,000 in the six new EU member states to €67,000 in Germany, a ratio of 1 to 5.The share of employer social contributions in personnel costs stood at 30% in France, compared to 17% in Germany, while the average for Europe stood at around 22%.
In 2011, The European automotive industry employed 2.2 million people, 45% of whom worked in vehicle construction. Since 2005, on an equivalent scale, the numbers employed have varied, depending on the part of the continent: 300,000 fewer people are now employed in Western Europe, while the new EU member states have added more than 110,000. Value added per employee ranged from €30,000 a year in the six main new EU member
states to €93,000 in Germany. In France, this figure was €60,000, below the European average of €69,000.per capita personnel costs ranged from €15,000 in the six main new EU member states to €67,000 in Germany; in France they were €54,000, above the European average of €46,000.
the automotiVe iNdustry iN the eu-28 iN 2011(1)
units european union (28 countries)
germany france 6 new eu member states (2)
united Kingdom
spain italy sweden belgium
people employed thousands 2 239 784 224 563 129 140 169 71 37Automotive manufacturing thousands 1,019 479 139 131 63 63 64 48 19Body and trailer manufacturers thousands 160 42 25 – 19 10 12 4 5Automotive equipment manufacturing thousands 1,061 263 60 432 48 67 93 19 13sales € millions 840,133 375,149 104,387 105,400 62,565 53,328 57,836 27,852 20,117production € millions 723,286 322,251 64,681 102,119 55,841 50,603 49,635 27,265 19,267production/Sales % 86.1 85.9 62.0 96.9 89.3 94.9 85.8 97.9 95.8Value added (to factor costs) € millions 154,343 76,700 13,445 17,509 12,695 8,463 9,898 5,567 2,733Value added/production % 21,3 23,8 20,8 17,1 22,7 16,7 19,9 20,4 14,2Value added per employee € thousands 68.9 97.8 60.0 31.1 98.4 60.5 58.6 78.4 74.2
base 100: 6 new EU member states 222 314 193 100 317 195 188 252 239goods and services purchased € millions 696,018 300,265 90,505 89,487 50,041 46,806 50,159 24,771 17,449purchases as a % of output % 96.2 93.2 139.9 87.6 89.6 92.5 101.1 90.9 90.6personnel costs € millions 102,356 52,650 12,184 8,220 5,907 5,849 6,957 4,276 1,990personnel costs per employee € thousands 45.7 67.1 54.4 14.6 45.8 41.8 41.2 60.2 54.1
base 100: 6 new EU member states 313 460 372 100 314 287 282 412 370gross operating surplus (gos) € millions 51,987 24,050 1,261 9,337 6,788 2,614 2,940 1,291 743oCF/VA % 33.7 31.4 9.4 53.3 53.5 30.9 29.7 23.2 27.2
Value added per employee persoNNel costs per employee
0102030405060708090
100
UnitedKingdom
GermanySwedenBelgiumSpainFranceItaly6 newEU
members(1)
0102030405060708090
100
GermanySwedenFranceBelgiumUnitedKingdom
SpainItaly6 newEU
members(1)
UE-28
UE-28
0102030405060708090
100
UnitedKingdom
GermanySwedenBelgiumSpainFranceItaly6 newEU
members(1)
0102030405060708090
100
GermanySwedenFranceBelgiumUnitedKingdom
SpainItaly6 newEU
members(1)
UE-28
UE-28
In € thousands In € thousands
(1) Since 2008, data has been published in a new economic activity involving in particular a change to the automotive industry scope (inclusion of electrical and electronic equipment manufacture). (2) Six main new member states: czech republic, hungary, Poland, romania, Slovakia and Slovenia. Body and trailer manufacturing employees are included in the figures for vehicle manufacturers. Sources: eurostat and ccFA estimates.
the automotiVe iNdustry iN the europeaN uNioN
300,000 people
the FALL IN StAFF NumBerS IN the AutomotIve
INDuStry IN weSterN euroPe From
2005 to 2011
22_AnAlysis And highlights / ComIté des ConstruCteurs FrAnçAIs d’AutomobIles ComIté des ConstruCteurs FrAnçAIs d’AutomobIles / AnAlysis And highlights_23
EUropE
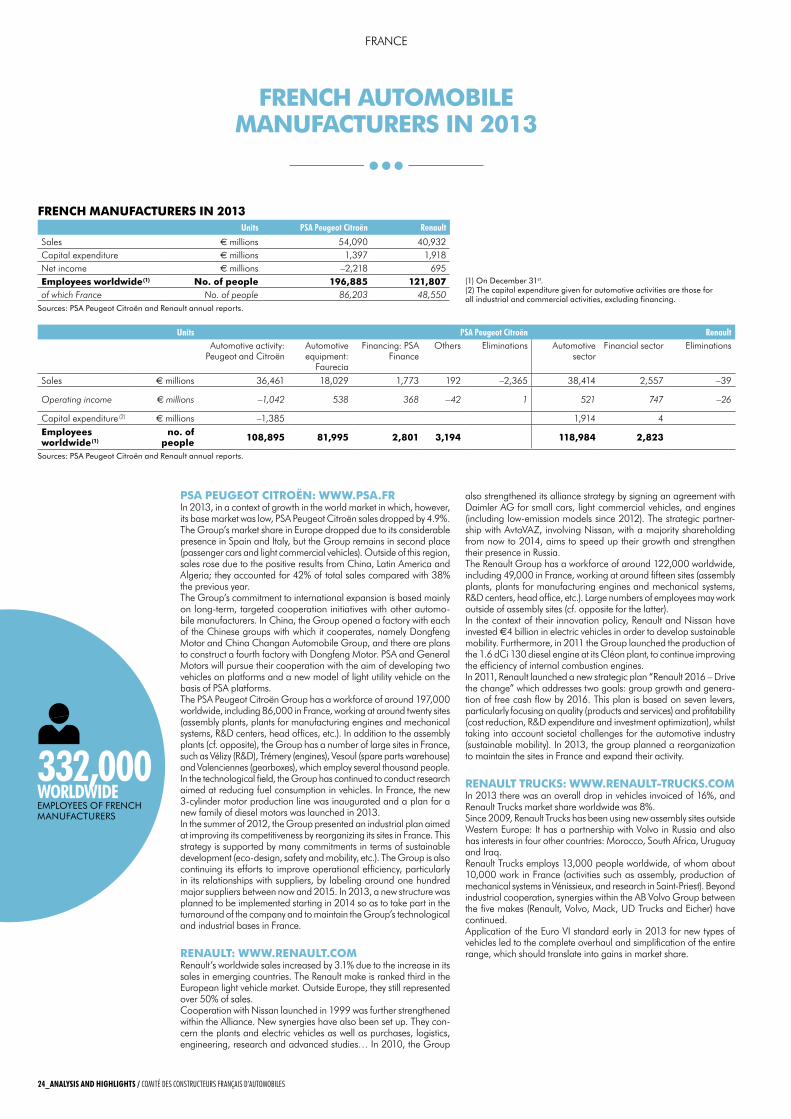
FRENCH AUTOMOBILE MANUFACTURERS IN 2013
FRENCH MANUFACTURERS IN 2013Units PSA Peugeot Citroën Renault
Sales € millions 54,090 40,932Capital expenditure € millions 1,397 1,918Net income € millions –2,218 695Employees worldwide (1) No. of people 196,885 121,807of which France No. of people 86,203 48,550
(1) On December 31st. (2) The capital expenditure given for automotive activities are those for all industrial and commercial activities, excluding financing.
Units PSA Peugeot Citroën RenaultAutomotive activity:
Peugeot and CitroënAutomotive equipment:
Faurecia
Financing: PSA Finance
Others eliminations Automotive sector
Financial sector eliminations
Sales € millions 36,461 18,029 1,773 192 –2,365 38,414 2,557 –39
Operating income € millions –1,042 538 368 –42 1 521 747 –26
Capital expenditure (2) € millions –1,385 1,914 4Employees worldwide (1)
no. of people 108,895 81,995 2,801 3,194 118,984 2,823
332,000woRldwideemplOyees Of french manufacTurers
sources: psa peugeot citroën and renault annual reports.
sources: psa peugeot citroën and renault annual reports.
FRANCe
24_AnAlySiS And highlightS / Comité des ConstruCteurs Français d’automobiles
PSA PEUgEOT CITROëN: www.PSA.FRIn 2013, in a context of growth in the world market in which, however, its base market was low, PSA Peugeot Citroën sales dropped by 4.9%. The Group’s market share in europe dropped due to its considerable presence in Spain and Italy, but the Group remains in second place (passenger cars and light commercial vehicles). Outside of this region, sales rose due to the positive results from China, Latin America and Algeria; they accounted for 42% of total sales compared with 38% the previous year.The Group’s commitment to international expansion is based mainly on long-term, targeted cooperation initiatives with other automo-bile manufacturers. In China, the Group opened a factory with each of the Chinese groups with which it cooperates, namely Dongfeng Motor and China Changan Automobile Group, and there are plans to construct a fourth factory with Dongfeng Motor. PSA and General Motors will pursue their cooperation with the aim of developing two vehicles on platforms and a new model of light utility vehicle on the basis of PSA platforms.The PSA Peugeot Citroën Group has a workforce of around 197,000 worldwide, including 86,000 in France, working at around twenty sites (assembly plants, plants for manufacturing engines and mechanical systems, R&D centers, head offices, etc.). In addition to the assembly plants (cf. opposite), the Group has a number of large sites in France, such as Vélizy (R&D), Trémery (engines), Vesoul (spare parts warehouse) and Valenciennes (gearboxes), which employ several thousand people.In the technological field, the Group has continued to conduct research aimed at reducing fuel consumption in vehicles. In France, the new 3-cylinder motor production line was inaugurated and a plan for a new family of diesel motors was launched in 2013.In the summer of 2012, the Group presented an industrial plan aimed at improving its competitiveness by reorganizing its sites in France. This strategy is supported by many commitments in terms of sustainable development (eco-design, safety and mobility, etc.). The Group is also continuing its efforts to improve operational efficiency, particularly in its relationships with suppliers, by labeling around one hundred major suppliers between now and 2015. In 2013, a new structure was planned to be implemented starting in 2014 so as to take part in the turnaround of the company and to maintain the Group’s technological and industrial bases in France.
RENAULT: www.RENAULT.COMRenault’s worldwide sales increased by 3.1% due to the increase in its sales in emerging countries. The Renault make is ranked third in the european light vehicle market. Outside europe, they still represented over 50% of sales. Cooperation with Nissan launched in 1999 was further strengthened within the Alliance. New synergies have also been set up. They con-cern the plants and electric vehicles as well as purchases, logistics, engineering, research and advanced studies… In 2010, the Group
also strengthened its alliance strategy by signing an agreement with Daimler AG for small cars, light commercial vehicles, and engines (including low-emission models since 2012). The strategic partner-ship with AvtoVAZ, involving Nissan, with a majority shareholding from now to 2014, aims to speed up their growth and strengthen their presence in Russia.The Renault Group has a workforce of around 122,000 worldwide, including 49,000 in France, working at around fifteen sites (assembly plants, plants for manufacturing engines and mechanical systems, R&D centers, head office, etc.). Large numbers of employees may work outside of assembly sites (cf. opposite for the latter).In the context of their innovation policy, Renault and Nissan have invested €4 billion in electric vehicles in order to develop sustainable mobility. Furthermore, in 2011 the Group launched the production of the 1.6 dCi 130 diesel engine at its Cléon plant, to continue improving the efficiency of internal combustion engines.In 2011, Renault launched a new strategic plan “Renault 2016 – Drive the change” which addresses two goals: group growth and genera-tion of free cash flow by 2016. This plan is based on seven levers, particularly focusing on quality (products and services) and profitability (cost reduction, R&D expenditure and investment optimization), whilst taking into account societal challenges for the automotive industry (sustainable mobility). In 2013, the group planned a reorganization to maintain the sites in France and expand their activity.
RENAULT TRUCkS: www.RENAULT-TRUCkS.COMIn 2013 there was an overall drop in vehicles invoiced of 16%, and Renault Trucks market share worldwide was 8%.Since 2009, Renault Trucks has been using new assembly sites outside Western europe: It has a partnership with Volvo in Russia and also has interests in four other countries: Morocco, South Africa, Uruguay and Iraq.Renault Trucks employs 13,000 people worldwide, of whom about 10,000 work in France (activities such as assembly, production of mechanical systems in Vénissieux, and research in Saint-Priest). Beyond industrial cooperation, synergies within the AB Volvo Group between the five makes (Renault, Volvo, Mack, UD Trucks and eicher) have continued.Application of the euro VI standard early in 2013 for new types of vehicles led to the complete overhaul and simplification of the entire range, which should translate into gains in market share.
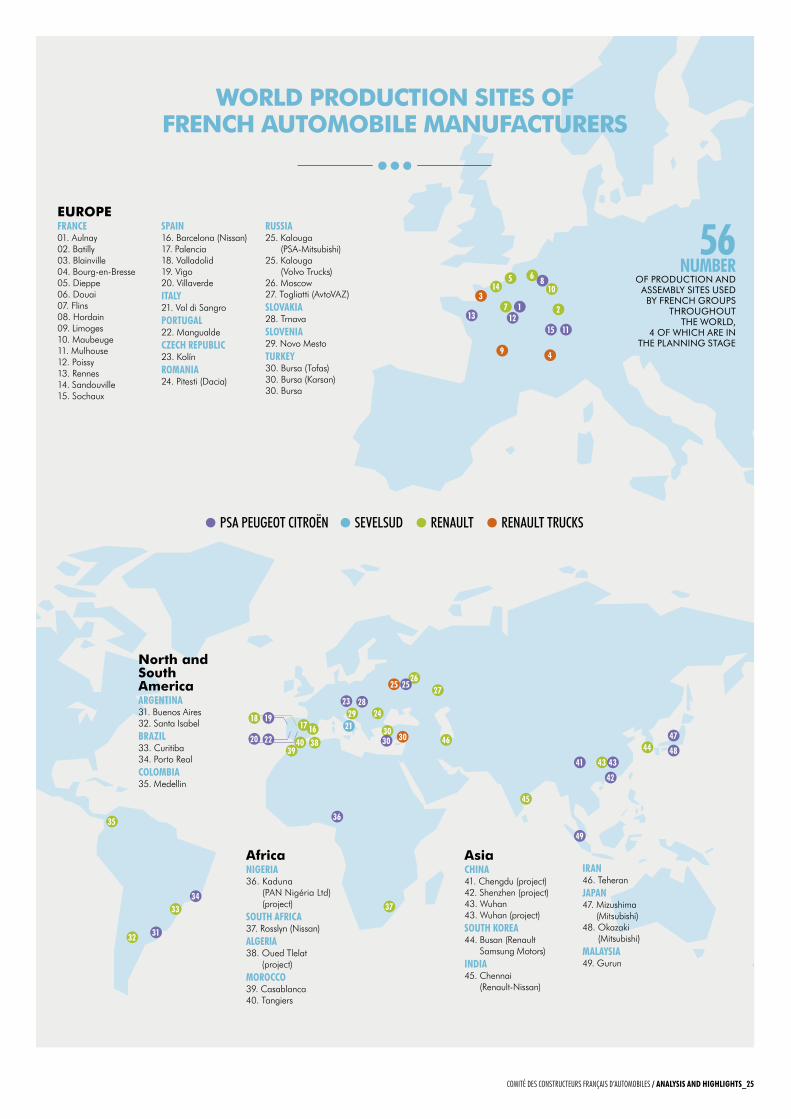
wORLd PROdUCTION SITES OF FRENCH AUTOMOBILE MANUFACTURERS
35
34
23 2824
36
3940 38
18 2921 30
2726
25
30 46
45
43
49
37
41 43
42
48
47
32
33
31
1617
PSA Peugeot Citroën SevelSud renAult renAult truCkS
EUROPEFRAnCe01. Aulnay02. Batilly03. Blainville04. Bourg-en-Bresse05. Dieppe06. Douai07. Flins08. Hordain09. Limoges10. Maubeuge11. Mulhouse12. Poissy13. Rennes14. Sandouville15. Sochaux
SPAin16. Barcelona (Nissan)17. Palencia18. Valladolid19. Vigo20. VillaverdeitAly21. Val di SangroPoRtUgAl22. MangualdeCzeCh RePUbliC23. KolínRomAniA24. Pitesti (Dacia)
RUSSiA25. Kalouga
(PSA-Mitsubishi)25. Kalouga
(Volvo Trucks)26. Moscow27. Togliatti (AvtoVAZ) SlovAkiA28. TrnavaSloveniA29. Novo MestotURkey30. Bursa (Tofas)30. Bursa (Karsan)30. Bursa
AsiaChinA41. Chengdu (project) 42. Shenzhen (project)43. Wuhan43. Wuhan (project)SoUth koReA44. Busan (Renault
Samsung Motors)indiA45. Chennai
(Renault-Nissan)
iRAn46. Teheran JAPAn47. Mizushima
(Mitsubishi)48. Okazaki
(Mitsubishi)mAlAySiA49. Gurun
North and South AmericaARgentinA31. Buenos Aires32. Santa IsabelbRAzil33. Curitiba34. Porto RealColombiA35. Medellin
AfricanigeRiA 36. Kaduna
(PAN Nigéria Ltd) (project)
SoUth AFRiCA37. Rosslyn (Nissan)AlgeRiA 38. Oued Tlelat
(project)moRoCCo39. Casablanca40. Tangiers
4430
25
13
14
712
1
15 11
5 6 810
23
9 4
19
20 22
56 nUmbeR
Of prODucTiOn anD assembly siTes useD by french grOups
ThrOughOuT The wOrlD,
4 Of which are in The planning sTage
Comité des ConstruCteurs Français d’automobiles / AnAlySiS And highlightS_25
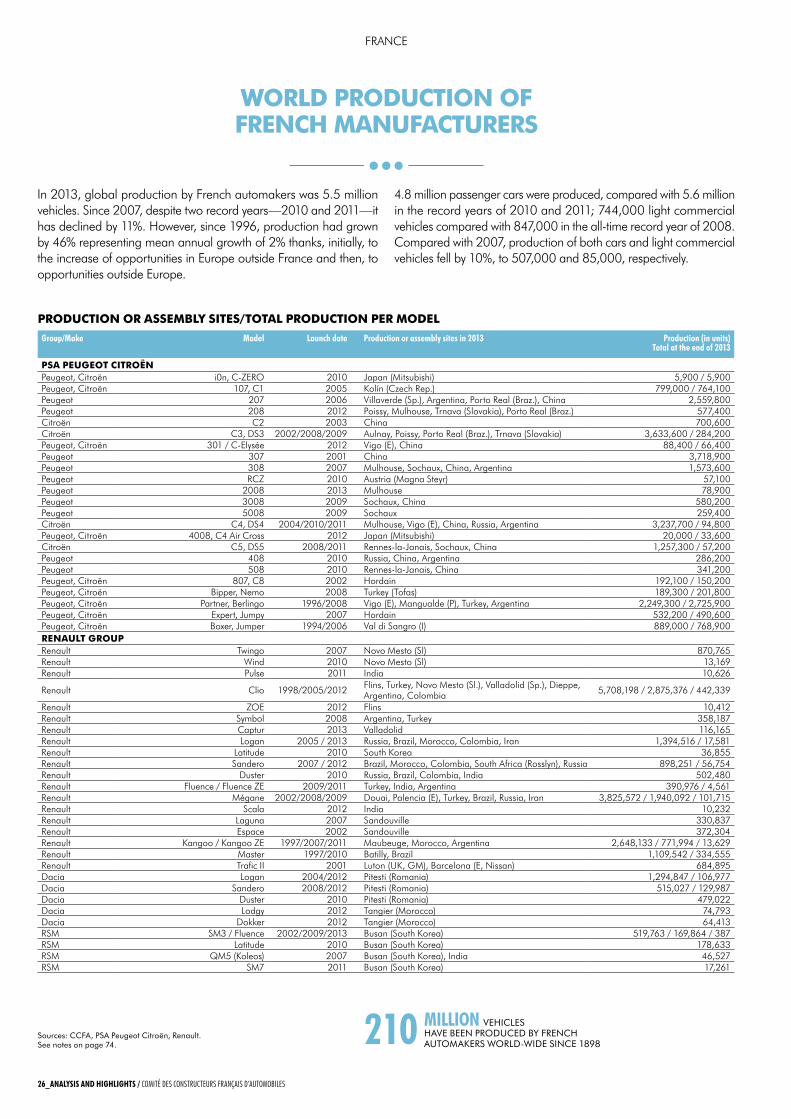
In 2013, global production by French automakers was 5.5 million vehicles. Since 2007, despite two record years—2010 and 2011—it has declined by 11%. However, since 1996, production had grown by 46% representing mean annual growth of 2% thanks, initially, to the increase of opportunities in europe outside France and then, to opportunities outside europe.
4.8 million passenger cars were produced, compared with 5.6 million in the record years of 2010 and 2011; 744,000 light commercial vehicles compared with 847,000 in the all-time record year of 2008. Compared with 2007, production of both cars and light commercial vehicles fell by 10%, to 507,000 and 85,000, respectively.
wORLd PROdUCTION OF FRENCH MANUFACTURERS
210 million vehicles have been prODuceD by french auTOmaKers wOrlD-wiDe since 1898
PROdUCTION OR ASSEMBLy SITES/TOTAL PROdUCTION PER MOdEL
group/make model launch date Production or assembly sites in 2013 Production (in units) total at the end of 2013
PSA PEUgEOT CITROëNPeugeot, Citroën i0n, C-ZeRO 2010 Japan (Mitsubishi) 5,900 / 5,900Peugeot, Citroën 107, C1 2005 Kolín (Czech Rep.) 799,000 / 764,100Peugeot 207 2006 Villaverde (Sp.), Argentina, Porto Real (Braz.), China 2,559,800 Peugeot 208 2012 Poissy, Mulhouse, Trnava (Slovakia), Porto Real (Braz.) 577,400 Citroën C2 2003 China 700,600 Citroën C3, DS3 2002/2008/2009 Aulnay, Poissy, Porto Real (Braz.), Trnava (Slovakia) 3,633,600 / 284,200Peugeot, Citroën 301 / C-elysée 2012 Vigo (e), China 88,400 / 66,400Peugeot 307 2001 China 3,718,900 Peugeot 308 2007 Mulhouse, Sochaux, China, Argentina 1,573,600 Peugeot RCZ 2010 Austria (Magna Steyr) 57,100 Peugeot 2008 2013 Mulhouse 78,900 Peugeot 3008 2009 Sochaux, China 580,200 Peugeot 5008 2009 Sochaux 259,400 Citroën C4, DS4 2004/2010/2011 Mulhouse, Vigo (e), China, Russia, Argentina 3,237,700 / 94,800Peugeot, Citroën 4008, C4 Air Cross 2012 Japan (Mitsubishi) 20,000 / 33,600Citroën C5, DS5 2008/2011 Rennes-la-Janais, Sochaux, China 1,257,300 / 57,200Peugeot 408 2010 Russia, China, Argentina 286,200 Peugeot 508 2010 Rennes-la-Janais, China 341,200 Peugeot, Citroën 807, C8 2002 Hordain 192,100 / 150,200Peugeot, Citroën Bipper, Nemo 2008 Turkey (Tofas) 189,300 / 201,800Peugeot, Citroën Partner, Berlingo 1996/2008 Vigo (e), Mangualde (P), Turkey, Argentina 2,249,300 / 2,725,900Peugeot, Citroën expert, Jumpy 2007 Hordain 532,200 / 490,600Peugeot, Citroën Boxer, Jumper 1994/2006 Val di Sangro (I) 889,000 / 768,900RENAULT gROUP Renault Twingo 2007 Novo Mesto (Sl) 870,765 Renault Wind 2010 Novo Mesto (Sl) 13,169 Renault Pulse 2011 India 10,626
Renault Clio 1998/2005/2012 Flins, Turkey, Novo Mesto (Sl.), Valladolid (Sp.), Dieppe, Argentina, Colombia 5,708,198 / 2,875,376 / 442,339
Renault ZOe 2012 Flins 10,412 Renault Symbol 2008 Argentina, Turkey 358,187 Renault Captur 2013 Valladolid 116,165 Renault Logan 2005 / 2013 Russia, Brazil, Morocco, Colombia, Iran 1,394,516 / 17,581Renault Latitude 2010 South Korea 36,855 Renault Sandero 2007 / 2012 Brazil, Morocco, Colombia, South Africa (Rosslyn), Russia 898,251 / 56,754Renault Duster 2010 Russia, Brazil, Colombia, India 502,480 Renault Fluence / Fluence Ze 2009/2011 Turkey, India, Argentina 390,976 / 4,561Renault Mégane 2002/2008/2009 Douai, Palencia (e), Turkey, Brazil, Russia, Iran 3,825,572 / 1,940,092 / 101,715Renault Scala 2012 India 10,232 Renault Laguna 2007 Sandouville 330,837 Renault espace 2002 Sandouville 372,304 Renault Kangoo / Kangoo Ze 1997/2007/2011 Maubeuge, Morocco, Argentina 2,648,133 / 771,994 / 13,629Renault Master 1997/2010 Batilly, Brazil 1,109,542 / 334,555Renault Trafic II 2001 Luton (UK, GM), Barcelona (e, Nissan) 684,895 Dacia Logan 2004/2012 Pitesti (Romania) 1,294,847 / 106,977Dacia Sandero 2008/2012 Pitesti (Romania) 515,027 / 129,987Dacia Duster 2010 Pitesti (Romania) 479,022 Dacia Lodgy 2012 Tangier (Morocco) 74,793 Dacia Dokker 2012 Tangier (Morocco) 64,413 RSM SM3 / Fluence 2002/2009/2013 Busan (South Korea) 519,763 / 169,864 / 387RSM Latitude 2010 Busan (South Korea) 178,633 RSM QM5 (Koleos) 2007 Busan (South Korea), India 46,527 RSM SM7 2011 Busan (South Korea) 17,261
sources: ccfa, psa peugeot citroën, renault.see notes on page 74.
FRANCe
26_AnAlySiS And highlightS / Comité des ConstruCteurs Français d’automobiles
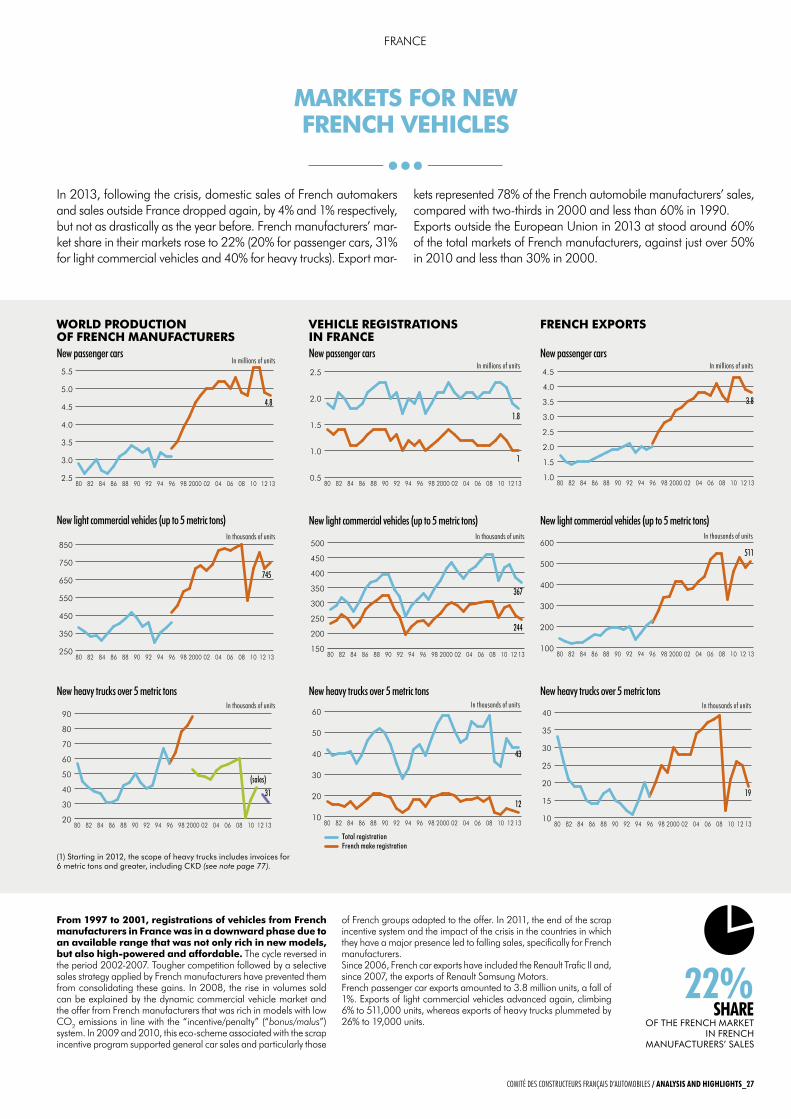
In 2013, following the crisis, domestic sales of French automakers and sales outside France dropped again, by 4% and 1% respectively, but not as drastically as the year before. French manufacturers’ mar-ket share in their markets rose to 22% (20% for passenger cars, 31% for light commercial vehicles and 40% for heavy trucks). export mar-
kets represented 78% of the French automobile manufacturers’ sales, compared with two-thirds in 2000 and less than 60% in 1990.exports outside the european Union in 2013 at stood around 60% of the total markets of French manufacturers, against just over 50% in 2010 and less than 30% in 2000.
MARkETS FOR NEw FRENCH vEHICLES
(1) starting in 2012, the scope of heavy trucks includes invoices for 6 metric tons and greater, including cKD (see note page 77).
4.8
250
350
450
550
650
750
850
13121008060402200098969492908886848280
2.5
3.0
3.5
4.0
4.5
5.0
5.5
13121008060402200098969492908886848280
20
30
40
50
60
70
80
90
13121008060402200098969492908886848280
745
31(sales)
1.8
1
12
Total registrationFrench make registration
244
367
0.5
1.0
1.5
2.0
2.5
13121008060402200098969492908886848280
150
200
250
300
350
400
450
500
13121008060402200098969492908886848280
10
20
30
40
50
60
13121008060402200098969492908886848280
43
1.8
1
12
Total registrationFrench make registration
244
367
0.5
1.0
1.5
2.0
2.5
13121008060402200098969492908886848280
150
200
250
300
350
400
450
500
13121008060402200098969492908886848280
10
20
30
40
50
60
13121008060402200098969492908886848280
43
19
511
3.8
1.0
1.5
2.0
2.5
3.0
3.5
4.0
4.5
13121008060402200098969492908886848280
100
200
300
400
500
600
13121008060402200098969492908886848280
10
15
20
25
30
35
40
13121008060402200098969492908886848280
19
511
3.8
1.0
1.5
2.0
2.5
3.0
3.5
4.0
4.5
13121008060402200098969492908886848280
100
200
300
400
500
600
13121008060402200098969492908886848280
10
15
20
25
30
35
40
13121008060402200098969492908886848280
4.8
250
350
450
550
650
750
850
13121008060402200098969492908886848280
2.5
3.0
3.5
4.0
4.5
5.0
5.5
13121008060402200098969492908886848280
20
30
40
50
60
70
80
90
13121008060402200098969492908886848280
745
31(sales)
1.8
1
12
Total registrationFrench make registration
244
367
0.5
1.0
1.5
2.0
2.5
13121008060402200098969492908886848280
150
200
250
300
350
400
450
500
13121008060402200098969492908886848280
10
20
30
40
50
60
13121008060402200098969492908886848280
43
19
511
3.8
1.0
1.5
2.0
2.5
3.0
3.5
4.0
4.5
13121008060402200098969492908886848280
100
200
300
400
500
600
13121008060402200098969492908886848280
10
15
20
25
30
35
40
13121008060402200098969492908886848280
wORLd PROdUCTION OF FRENCH MANUFACTURERS
vEHICLE REgISTRATIONS IN FRANCE
FRENCH EXPORTS
new passenger cars new passenger cars new passenger carsin millions of units
in millions of units in millions of units
new light commercial vehicles (up to 5 metric tons) new light commercial vehicles (up to 5 metric tons)
new heavy trucks over 5 metric tons new heavy trucks over 5 metric tons new heavy trucks over 5 metric tons
4.8
250
350
450
550
650
750
850
13121008060402200098969492908886848280
2.5
3.0
3.5
4.0
4.5
5.0
5.5
13121008060402200098969492908886848280
20
30
40
50
60
70
80
90
13121008060402200098969492908886848280
745
31(sales)
new light commercial vehicles (up to 5 metric tons)in thousands of units
in thousands of units
in thousands of units
in thousands of units
in thousands of units
in thousands of units
From 1997 to 2001, registrations of vehicles from French manufacturers in France was in a downward phase due to an available range that was not only rich in new models, but also high-powered and affordable. The cycle reversed in the period 2002-2007. Tougher competition followed by a selective sales strategy applied by French manufacturers have prevented them from consolidating these gains. In 2008, the rise in volumes sold can be explained by the dynamic commercial vehicle market and the offer from French manufacturers that was rich in models with low CO2 emissions in line with the “incentive/penalty” (“bonus/malus”) system. In 2009 and 2010, this eco-scheme associated with the scrap incentive program supported general car sales and particularly those
of French groups adapted to the offer. In 2011, the end of the scrap incentive system and the impact of the crisis in the countries in which they have a major presence led to falling sales, specifically for French manufacturers.Since 2006, French car exports have included the Renault Trafic II and, since 2007, the exports of Renault Samsung Motors.French passenger car exports amounted to 3.8 million units, a fall of 1%. exports of light commercial vehicles advanced again, climbing 6% to 511,000 units, whereas exports of heavy trucks plummeted by 26% to 19,000 units.
22% ShARe
Of The french marKeT in french
manufacTurers’ sales
FRANCe
Comité des ConstruCteurs Français d’automobiles / AnAlySiS And highlightS_27
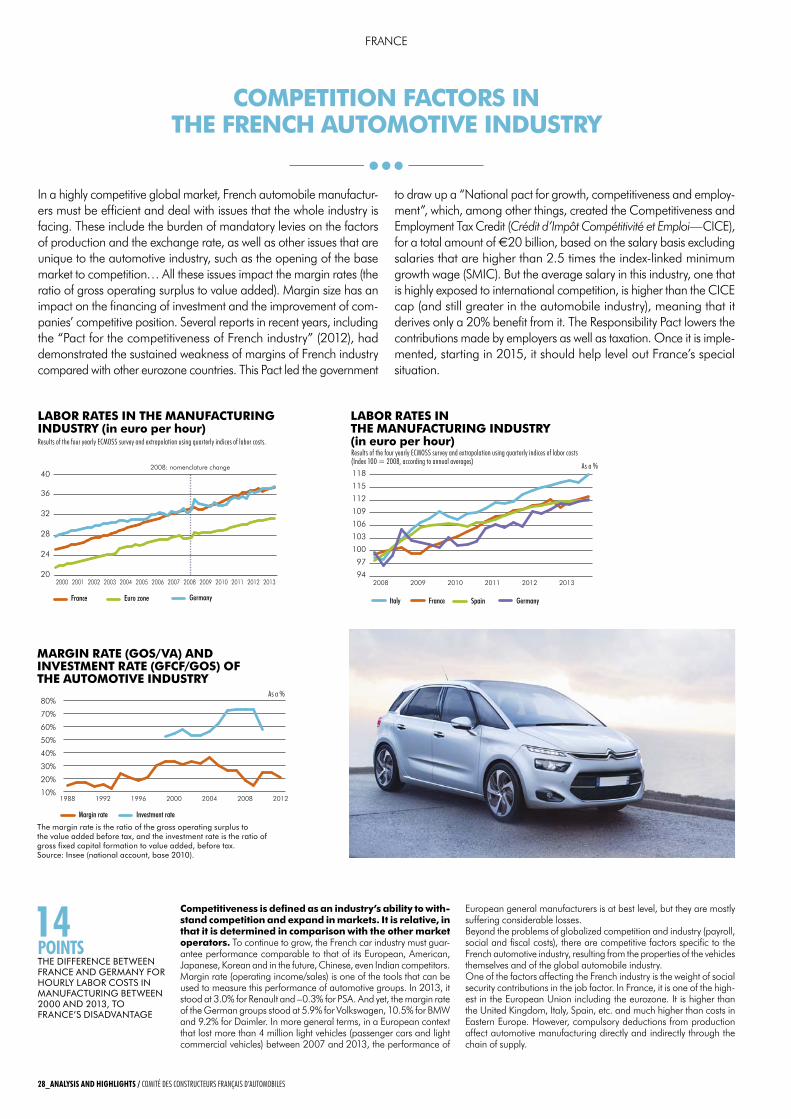
In a highly competitive global market, French automobile manufactur-ers must be efficient and deal with issues that the whole industry is facing. These include the burden of mandatory levies on the factors of production and the exchange rate, as well as other issues that are unique to the automotive industry, such as the opening of the base market to competition… All these issues impact the margin rates (the ratio of gross operating surplus to value added). Margin size has an impact on the financing of investment and the improvement of com-panies’ competitive position. Several reports in recent years, including the “Pact for the competitiveness of French industry” (2012), had demonstrated the sustained weakness of margins of French industry compared with other eurozone countries. This Pact led the government
to draw up a “National pact for growth, competitiveness and employ-ment”, which, among other things, created the Competitiveness and employment Tax Credit (Crédit d’Impôt Compétitivité et Emploi—CICe), for a total amount of €20 billion, based on the salary basis excluding salaries that are higher than 2.5 times the index-linked minimum growth wage (SMIC). But the average salary in this industry, one that is highly exposed to international competition, is higher than the CICe cap (and still greater in the automobile industry), meaning that it derives only a 20% benefit from it. The Responsibility Pact lowers the contributions made by employers as well as taxation. Once it is imple-mented, starting in 2015, it should help level out France’s special situation.
COMPETITION FACTORS IN THE FRENCH AUTOMOTIvE INdUSTRy
Competitiveness is defined as an industry’s ability to with-stand competition and expand in markets. It is relative, in that it is determined in comparison with the other market operators. To continue to grow, the French car industry must guar-antee performance comparable to that of its european, American, Japanese, Korean and in the future, Chinese, even Indian competitors. Margin rate (operating income/sales) is one of the tools that can be used to measure this performance of automotive groups. In 2013, it stood at 3.0% for Renault and –0.3% for PSA. And yet, the margin rate of the German groups stood at 5.9% for Volkswagen, 10.5% for BMW and 9.2% for Daimler. In more general terms, in a european context that lost more than 4 million light vehicles (passenger cars and light commercial vehicles) between 2007 and 2013, the performance of
european general manufacturers is at best level, but they are mostly suffering considerable losses.Beyond the problems of globalized competition and industry (payroll, social and fiscal costs), there are competitive factors specific to the French automotive industry, resulting from the properties of the vehicles themselves and of the global automobile industry.One of the factors affecting the French industry is the weight of social security contributions in the job factor. In France, it is one of the high-est in the european Union including the eurozone. It is higher than the United Kingdom, Italy, Spain, etc. and much higher than costs in eastern europe. However, compulsory deductions from production affect automotive manufacturing directly and indirectly through the chain of supply.
14 PointSThe Difference beTween france anD germany fOr hOurly labOr cOsTs in manufacTuring beTween 2000 anD 2013, TO france’s DisaDvanTage
The margin rate is the ratio of the gross operating surplus to the value added before tax, and the investment rate is the ratio of gross fixed capital formation to value added, before tax.source: insee (national account, base 2010).
10%
20%
30%
40%
50%
60%
70%
80%
2012200820042000199619921988
Margin rate Investment rate
94
97
100
103
106
109
112
115
118
Italy France Spain Germany
201320122011201020092008
France Euro zone Germany
20
24
28
32
36
40France
Allemagne
Zone euro
20132012201120102009200820072006200520042003200220012000
2008: nomenclature change
MARgIN RATE (gOS/vA) ANd INvESTMENT RATE (gFCF/gOS) OF THE AUTOMOTIvE INdUSTRy
as a %
10%
20%
30%
40%
50%
60%
70%
80%
2012200820042000199619921988
Margin rate Investment rate
94
97
100
103
106
109
112
115
118
Italy France Spain Germany
201320122011201020092008
France Euro zone Germany
20
24
28
32
36
40France
Allemagne
Zone euro
20132012201120102009200820072006200520042003200220012000
2008: nomenclature change
LABOR RATES IN THE MANUFACTURINg INdUSTRy (in euro per hour)results of the four yearly eCmoss survey and extrapolation using quarterly indices of labor costs.
10%
20%
30%
40%
50%
60%
70%
80%
2012200820042000199619921988
Margin rate Investment rate
94
97
100
103
106
109
112
115
118
Italy France Spain Germany
201320122011201020092008
France Euro zone Germany
20
24
28
32
36
40France
Allemagne
Zone euro
20132012201120102009200820072006200520042003200220012000
2008: nomenclature change
LABOR RATES IN THE MANUFACTURINg INdUSTRy (in euro per hour)
as a %
results of the four yearly eCmoss survey and extrapolation using quarterly indices of labor costs (index 100 = 2008, according to annual averages)
FRANCe
28_AnAlySiS And highlightS / Comité des ConstruCteurs Français d’automobiles
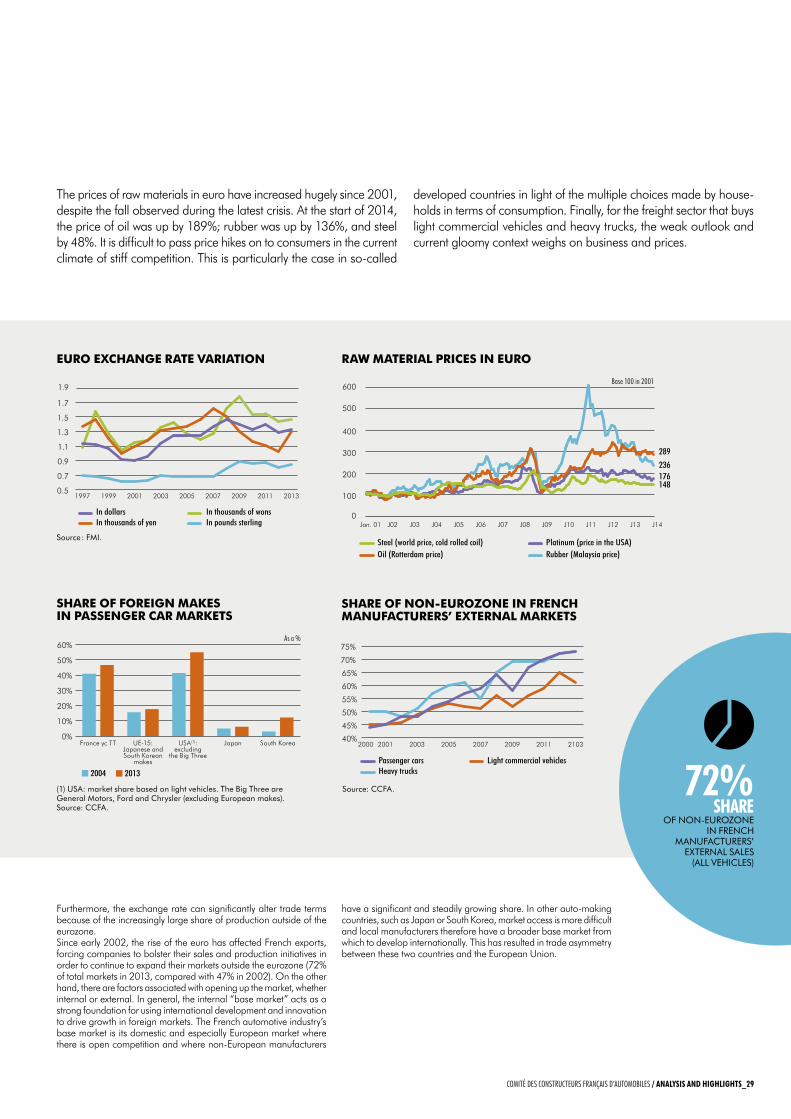
The prices of raw materials in euro have increased hugely since 2001, despite the fall observed during the latest crisis. At the start of 2014, the price of oil was up by 189%; rubber was up by 136%, and steel by 48%. It is difficult to pass price hikes on to consumers in the current climate of stiff competition. This is particularly the case in so-called
developed countries in light of the multiple choices made by house-holds in terms of consumption. Finally, for the freight sector that buys light commercial vehicles and heavy trucks, the weak outlook and current gloomy context weighs on business and prices.
Furthermore, the exchange rate can significantly alter trade terms because of the increasingly large share of production outside of the eurozone.Since early 2002, the rise of the euro has affected French exports, forcing companies to bolster their sales and production initiatives in order to continue to expand their markets outside the eurozone (72% of total markets in 2013, compared with 47% in 2002). On the other hand, there are factors associated with opening up the market, whether internal or external. In general, the internal “base market” acts as a strong foundation for using international development and innovation to drive growth in foreign markets. The French automotive industry’s base market is its domestic and especially european market where there is open competition and where non-european manufacturers
have a significant and steadily growing share. In other auto-making countries, such as Japan or South Korea, market access is more difficult and local manufacturers therefore have a broader base market from which to develop internationally. This has resulted in trade asymmetry between these two countries and the european Union.
In dollars In thousands of wonsIn thousands of yen In pounds sterling
0.5
0.7
0.9
1.1
1.3
1.5
1.7
201320112009200720052003200119991997
1.9
Steel (world price, cold rolled coil) Platinum (price in the USA)Oil (Rotterdam price) Rubber (Malaysia price)
0
100
200
300
400
500
600
J14J13J12J11J10J09J08J07J06J05J04J03J02Jan. 01
236
289
176148
2004 2013
0%
10%
20%
30%
40%
50%
60% 2013
2004
South KoreaJapanUSA(1):excluding
the Big Three
UE-15:Japanese andSouth Korean
makes
France yc TT
Passenger cars Light commercial vehiclesHeavy trucks
40%
45%
50%
55%
60%
65%
70%
75%
21032011200920072005200320012000
source : fmi.
EURO EXCHANgE RATE vARIATION
In dollars In thousands of wonsIn thousands of yen In pounds sterling
0.5
0.7
0.9
1.1
1.3
1.5
1.7
201320112009200720052003200119991997
1.9
Steel (world price, cold rolled coil) Platinum (price in the USA)Oil (Rotterdam price) Rubber (Malaysia price)
0
100
200
300
400
500
600
J14J13J12J11J10J09J08J07J06J05J04J03J02Jan. 01
236
289
176148
2004 2013
0%
10%
20%
30%
40%
50%
60% 2013
2004
South KoreaJapanUSA(1):excluding
the Big Three
UE-15:Japanese andSouth Korean
makes
France yc TT
Passenger cars Light commercial vehiclesHeavy trucks
40%
45%
50%
55%
60%
65%
70%
75%
21032011200920072005200320012000
RAw MATERIAL PRICES IN EURO
base 100 in 2001
In dollars In thousands of wonsIn thousands of yen In pounds sterling
0.5
0.7
0.9
1.1
1.3
1.5
1.7
201320112009200720052003200119991997
1.9
Steel (world price, cold rolled coil) Platinum (price in the USA)Oil (Rotterdam price) Rubber (Malaysia price)
0
100
200
300
400
500
600
J14J13J12J11J10J09J08J07J06J05J04J03J02Jan. 01
236
289
176148
2004 2013
0%
10%
20%
30%
40%
50%
60% 2013
2004
South KoreaJapanUSA(1):excluding
the Big Three
UE-15:Japanese andSouth Korean
makes
France yc TT
Passenger cars Light commercial vehiclesHeavy trucks
40%
45%
50%
55%
60%
65%
70%
75%
21032011200920072005200320012000
(1) usa: market share based on light vehicles. The big Three are general motors, ford and chrysler (excluding european makes).source: ccfa.
SHARE OF FOREIgN MAkES IN PASSENgER CAR MARkETS
as a %
In dollars In thousands of wonsIn thousands of yen In pounds sterling
0.5
0.7
0.9
1.1
1.3
1.5
1.7
201320112009200720052003200119991997
1.9
Steel (world price, cold rolled coil) Platinum (price in the USA)Oil (Rotterdam price) Rubber (Malaysia price)
0
100
200
300
400
500
600
J14J13J12J11J10J09J08J07J06J05J04J03J02Jan. 01
236
289
176148
2004 2013
0%
10%
20%
30%
40%
50%
60% 2013
2004
South KoreaJapanUSA(1):excluding
the Big Three
UE-15:Japanese andSouth Korean
makes
France yc TT
Passenger cars Light commercial vehiclesHeavy trucks
40%
45%
50%
55%
60%
65%
70%
75%
21032011200920072005200320012000
source: ccfa.
SHARE OF NON-EUROzONE IN FRENCH MANUFACTURERS’ EXTERNAL MARkETS
72% ShARe
Of nOn-eurOzOne in french
manufacTurers’ exTernal sales
(all vehicles)
Comité des ConstruCteurs Français d’automobiles / AnAlySiS And highlightS_29
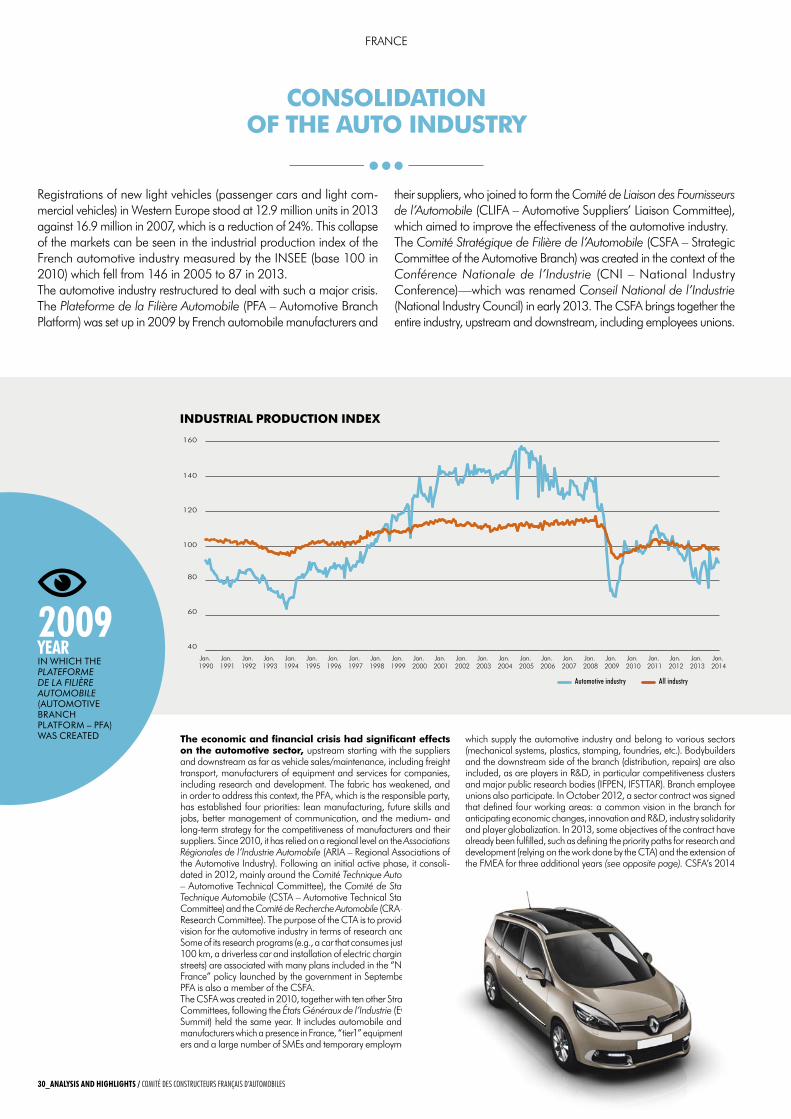
40
60
80
100
120
140
160
Jan. 2014
Jan. 2013
Jan. 2012
Jan. 2011
Jan. 2010
Jan. 2009
Jan. 2008
Jan. 2007
Jan. 2006
Jan. 2005
Jan. 2004
Jan. 2003
Jan. 2002
Jan. 2001
Jan. 2000
Jan. 1999
Jan. 1998
Jan. 1997
Jan. 1996
Jan. 1995
Jan. 1994
Jan. 1993
Jan. 1992
Jan. 1991
Jan. 1990
Automotive industry All industry
Registrations of new light vehicles (passenger cars and light com-mercial vehicles) in Western europe stood at 12.9 million units in 2013 against 16.9 million in 2007, which is a reduction of 24%. This collapse of the markets can be seen in the industrial production index of the French automotive industry measured by the INSee (base 100 in 2010) which fell from 146 in 2005 to 87 in 2013.The automotive industry restructured to deal with such a major crisis. The Plateforme de la Filière Automobile (PFA – Automotive Branch Platform) was set up in 2009 by French automobile manufacturers and
their suppliers, who joined to form the Comité de Liaison des Fournisseurs de l’Automobile (CLIFA – Automotive Suppliers’ Liaison Committee), which aimed to improve the effectiveness of the automotive industry.The Comité Stratégique de Filière de l’Automobile (CSFA – Strategic Committee of the Automotive Branch) was created in the context of the Conférence Nationale de l’Industrie (CNI – National Industry Conference)—which was renamed Conseil National de l’Industrie (National Industry Council) in early 2013. The CSFA brings together the entire industry, upstream and downstream, including employees unions.
CONSOLIdATION OF THE AUTO INdUSTRy
The economic and financial crisis had significant effects on the automotive sector, upstream starting with the suppliers and downstream as far as vehicle sales/maintenance, including freight transport, manufacturers of equipment and services for companies, including research and development. The fabric has weakened, and in order to address this context, the PFA, which is the responsible party, has established four priorities: lean manufacturing, future skills and jobs, better management of communication, and the medium- and long-term strategy for the competitiveness of manufacturers and their suppliers. Since 2010, it has relied on a regional level on the Associations Régionales de l’Industrie Automobile (ARIA – Regional Associations of the Automotive Industry). Following an initial active phase, it consoli-dated in 2012, mainly around the Comité Technique Automobile (CTA – Automotive Technical Committee), the Comité de Standardisation Technique Automobile (CSTA – Automotive Technical Standardization Committee) and the Comité de Recherche Automobile (CRA – Automotive Research Committee). The purpose of the CTA is to provide a common vision for the automotive industry in terms of research and innovation. Some of its research programs (e.g., a car that consumes just 2 liters every 100 km, a driverless car and installation of electric charging stations on streets) are associated with many plans included in the “New industrial France” policy launched by the government in September 2013. The PFA is also a member of the CSFA.The CSFA was created in 2010, together with ten other Strategic Branch Committees, following the États Généraux de l’Industrie (eGI – Industry Summit) held the same year. It includes automobile and heavy truck manufacturers which a presence in France, “tier1” equipment manufactur-ers and a large number of SMes and temporary employment agencies
which supply the automotive industry and belong to various sectors (mechanical systems, plastics, stamping, foundries, etc.). Bodybuilders and the downstream side of the branch (distribution, repairs) are also included, as are players in R&D, in particular competitiveness clusters and major public research bodies (IFPeN, IFSTTAR). Branch employee unions also participate. In October 2012, a sector contract was signed that defined four working areas: a common vision in the branch for anticipating economic changes, innovation and R&D, industry solidarity and player globalization. In 2013, some objectives of the contract have already been fulfilled, such as defining the priority paths for research and development (relying on the work done by the CTA) and the extension of the FMeA for three additional years (see opposite page). CSFA’s 2014 priorities will also concern the special features of the heavy truck and of the downstream side.
INdUSTRIAL PROdUCTION INdEX
2009yeARin which The Plateforme de la filière automobile (auTOmOTive branch plaTfOrm – pfa) was creaTeD
FRANCe
30_AnAlySiS And highlightS / Comité des ConstruCteurs Français d’automobiles
The automotive industry requires considerable infrastructure invest-ments (production sites, etc.), which are paid off over long periods. In addition, during their design and before they are sold, vehicles require work in research centers lasting several years, in a process of permanent progress, in order to be able to meet the needs of society in terms of safety as well as the environment. The automotive industry is a capital-intensive industry which, in general terms, has consider-able financing needs.
During the financial crisis, this specific feature had a serious effect on the automotive industry, and the public authorities created structural instruments to encourage long-term financing (Strategic Investment Funds in 2008 and a Fund for Modernizing Automotive equipment Manufacturers in 2009, which were both rolled up into Bpifrance in 2013) and research and development capabilities (Research Tax Credit and future investments).
INTERvENTION FUNdS, RESEARCH TAX CREdITS, FUTURE INvESTMENTS
In connection with long-term financing, since it was created the Strategic Investment Fund (FSI), now Bpifrance Participations since the public investment bank Bpifrance was created, had invested in three companies in the automotive sector. As for the Fund for the modernization of automotive equipment manufacturers tier 1 (FMeA tier 1) to which French manufacturers contributed €400 million, it has invested €328 million in 16 equipment manufacturing companies. The Fund for the Modernization of Automotive equipment Manufacturers tier 2 (FMeA tier 2) in turn has contributed €26 million to eleven companies.Future investments were launched at the end of 2009 after the Juppé-Rocard report recommended boosting innovation in France. The objec-tive of this investment program is to strengthen productivity and improve the competitive edge of French companies. It started with an initial tranche of €35 billion euro which was supplemented by a second tranche of €12 billion in 2013. The €750 million dedicated to the automotive sector concern vehicles for the future which must be more economical and more efficient in environmental terms.The automotive industry also benefits from sections which it can access among the other future investment programs, including a project relating to the creation of an internationally oriented “Institute for excellence in Carbon-Free energy” named “Véhicule Décarboné Communicant et sa Mobilité” (VeDeCoM – Communicating Carbon-Free Vehicle and its Mobility). VeDeCom is based on a single site in the Yvelines and is set to become a reference in the new eco-mobility branch. It has three areas for research: electric vehicles, driving delegation and connectivity, and shared mobility and energy. It includes over 40 members: large industrial groups including PSA and Renault, SMes, research laboratories and centers, colleges and training centers, as
well as local authorities. The planned 10-year budget is around €300 million, of which €67 million is earmarked for the period 2014–16.French automakers are also members of the Jules Verne Technological Research Institute (IRT) at Nantes. The 10-year budget is around €350 million, partially funded by “future investments.” It specializes in advanced production technologies for composite, metal and hybrid structures. It focuses on the transportation equipment, including the car, as well as energy.The public authorities also support Research and Development in companies through the Research Tax Credits (CIR), a fiscal measure created in 1983, improved in 2004 but simplified and amplified by the 2008 Finance Act. In 2011, the manufacturing industry received 61% of the total Research Tax Credits, representing €5.1 billion. The automotive industry was the third highest recipient of Research Tax Credits, representing 6.9%, or €354 million.Loans from the european Investment Bank (eIB) and the Framework Program for Research and Technological Development (PCRD) of the european Union also make it possible to guarantee effective stimula-tion of funding for R&D. Nevertheless, in the european Union as a whole, the automotive industry accounts for one quarter of all private R&D, twice as much as aeronautics, while receiving five times less assistance. Moreover, countries that have traditionally been strong in the automotive industry as well as the BRIC countries are also providing major support for the automotive branch, in particular in terms of R&D.
329million
eURo in 16 equipmenT manufacTuring
cOmpanies: magniTuDe Of
invesTmenT by fmea in The auTOmOTive inDusTry
aT The enD Of 2013
INvESTMENT FUNdS
source: bpifrance.
goals and provisions list of recipients
The Strategic Investment Fund (FSI) (created in November 2008), which became Bpifrance Participations in 2013 when Bpifrance was created.
At the outset: Sovereign wealth fund set up by the public authorities to meet the equity capital needs of companies with potential for growth and competitiveness for the economy At the end of 2013, the capital was in excess of 15 billion euro.
Gruau, Mécachrome, Valéo
Fund for the modernization of automotive equipment manufacturers (FMeA) (created in January 2009)
To take minority holdings in companies working in the automotive branch which are undertaking industrial projects that create value and competitiveness for the economy. Total investments come to between five and sixty million euro. Initial provision of €600 million equally distributed among PSA Peugeot Citroën, Renault SA and the FSI (which is now Bpifrance Participations).
Agrati, Atelier des Janves, Bourbon, Cooper Standard, Defta, Delfingen, Faurecia AC, FSD SNOP, Maike Automotive, Mecaplast, Metaltemple, SAFe, Saint-Jean Industries, Savoy International, Sofedit/Gestamp, Trèves
Fund for the modernization of automotive equipment manufacturers (FMeA) Tier 2 (created in November 2009)
Fund specifically aimed at smaller automotive suppliers (Tier 2 and higher) Total investments come to between €1 and 5 million. Initial provision of €50 million gathered by five leading automotive equipment manufacturers and the players of FMeA Tier 1.
Adduxi, Altia, Citèle, Devillé, embaltech, FMX, Maike Automotive, PJ Industry, Saint-Jean engine, SPPP, Tecma
FRANCe
Comité des ConstruCteurs Français d’automobiles / AnAlySiS And highlightS_31
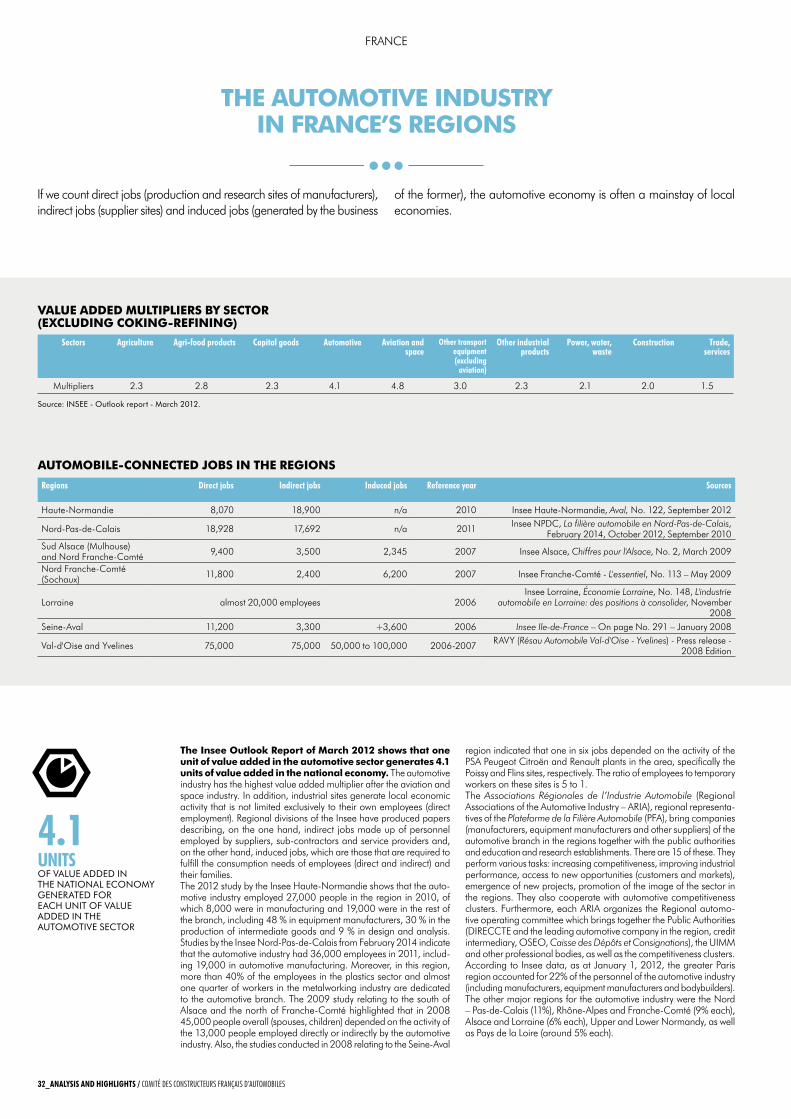
If we count direct jobs (production and research sites of manufacturers), indirect jobs (supplier sites) and induced jobs (generated by the business
of the former), the automotive economy is often a mainstay of local economies.
THE AUTOMOTIvE INdUSTRy IN FRANCE’S REgIONS
vALUE AddEd MULTIPLIERS By SECTOR (EXCLUdINg COkINg-REFININg)
AUTOMOBILE-CONNECTEd jOBS IN THE REgIONS
source: insee - Outlook report - march 2012.
Sectors Agriculture Agri-food products Capital goods Automotive Aviation and space
other transport equipment (excluding
aviation)
other industrial products
Power, water, waste
Construction trade, services
Multipliers 2.3 2.8 2.3 4.1 4.8 3.0 2.3 2.1 2.0 1.5
Regions direct jobs indirect jobs induced jobs Reference year Sources
Haute-Normandie 8,070 18,900 n/a 2010 Insee Haute-Normandie, Aval, No. 122, September 2012
Nord-Pas-de-Calais 18,928 17,692 n/a 2011 Insee NPDC, La filière automobile en Nord-Pas-de-Calais, February 2014, October 2012, September 2010
Sud Alsace (Mulhouse) and Nord Franche-Comté 9,400 3,500 2,345 2007 Insee Alsace, Chiffres pour l'Alsace, No. 2, March 2009
Nord Franche-Comté (Sochaux) 11,800 2,400 6,200 2007 Insee Franche-Comté - L'essentiel, No. 113 – May 2009
Lorraine almost 20,000 employees 2006Insee Lorraine, Économie Lorraine, No. 148, L'industrie
automobile en Lorraine: des positions à consolider, November 2008
Seine-Aval 11,200 3,300 +3,600 2006 Insee Ile-de-France – On page No. 291 – January 2008
Val-d'Oise and Yvelines 75,000 75,000 50,000 to 100,000 2006-2007 RAVY (Résau Automobile Val-d'Oise - Yvelines) - Press release - 2008 edition
The Insee Outlook Report of March 2012 shows that one unit of value added in the automotive sector generates 4.1 units of value added in the national economy. The automotive industry has the highest value added multiplier after the aviation and space industry. In addition, industrial sites generate local economic activity that is not limited exclusively to their own employees (direct employment). Regional divisions of the Insee have produced papers describing, on the one hand, indirect jobs made up of personnel employed by suppliers, sub-contractors and service providers and, on the other hand, induced jobs, which are those that are required to fulfill the consumption needs of employees (direct and indirect) and their families.The 2012 study by the Insee Haute-Normandie shows that the auto-motive industry employed 27,000 people in the region in 2010, of which 8,000 were in manufacturing and 19,000 were in the rest of the branch, including 48 % in equipment manufacturers, 30 % in the production of intermediate goods and 9 % in design and analysis. Studies by the Insee Nord-Pas-de-Calais from February 2014 indicate that the automotive industry had 36,000 employees in 2011, includ-ing 19,000 in automotive manufacturing. Moreover, in this region, more than 40% of the employees in the plastics sector and almost one quarter of workers in the metalworking industry are dedicated to the automotive branch. The 2009 study relating to the south of Alsace and the north of Franche-Comté highlighted that in 2008 45,000 people overall (spouses, children) depended on the activity of the 13,000 people employed directly or indirectly by the automotive industry. Also, the studies conducted in 2008 relating to the Seine-Aval
region indicated that one in six jobs depended on the activity of the PSA Peugeot Citroën and Renault plants in the area, specifically the Poissy and Flins sites, respectively. The ratio of employees to temporary workers on these sites is 5 to 1.The Associations Régionales de l’Industrie Automobile (Regional Associations of the Automotive Industry – ARIA), regional representa-tives of the Plateforme de la Filière Automobile (PFA), bring companies (manufacturers, equipment manufacturers and other suppliers) of the automotive branch in the regions together with the public authorities and education and research establishments. There are 15 of these. They perform various tasks: increasing competitiveness, improving industrial performance, access to new opportunities (customers and markets), emergence of new projects, promotion of the image of the sector in the regions. They also cooperate with automotive competitiveness clusters. Furthermore, each ARIA organizes the Regional automo-tive operating committee which brings together the Public Authorities (DIReCCTe and the leading automotive company in the region, credit intermediary, OSeO, Caisse des Dépôts et Consignations), the UIMM and other professional bodies, as well as the competitiveness clusters.According to Insee data, as at January 1, 2012, the greater Paris region accounted for 22% of the personnel of the automotive industry (including manufacturers, equipment manufacturers and bodybuilders). The other major regions for the automotive industry were the Nord – Pas-de-Calais (11%), Rhône-Alpes and Franche-Comté (9% each), Alsace and Lorraine (6% each), Upper and Lower Normandy, as well as Pays de la Loire (around 5% each).
4.1 UnitSOf value aDDeD in The naTiOnal ecOnOmy generaTeD fOr each uniT Of value aDDeD in The auTOmOTive secTOr
FRANCe
32_AnAlySiS And highlightS / Comité des ConstruCteurs Français d’automobiles
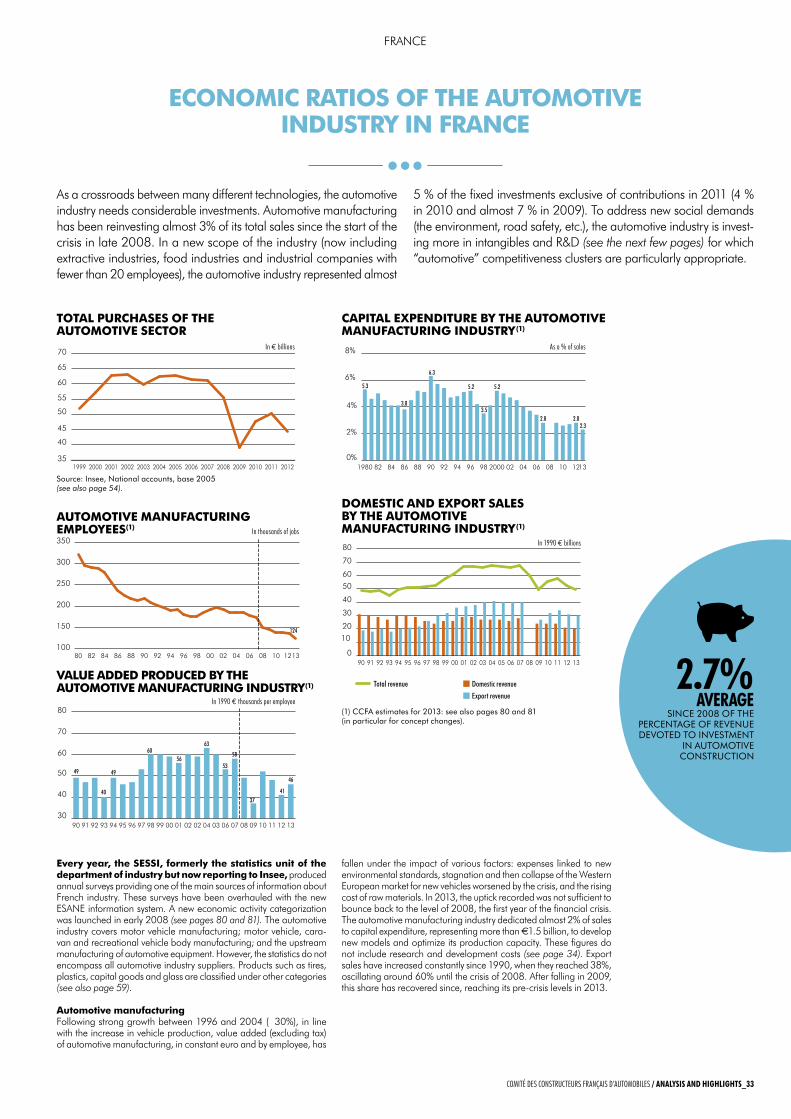
ECONOMIC RATIOS OF THE AUTOMOTIvE INdUSTRy IN FRANCE
As a crossroads between many different technologies, the automotive industry needs considerable investments. Automotive manufacturing has been reinvesting almost 3% of its total sales since the start of the crisis in late 2008. In a new scope of the industry (now including extractive industries, food industries and industrial companies with fewer than 20 employees), the automotive industry represented almost
5 % of the fixed investments exclusive of contributions in 2011 (4 % in 2010 and almost 7 % in 2009). To address new social demands (the environment, road safety, etc.), the automotive industry is invest-ing more in intangibles and R&D (see the next few pages) for which “automotive” competitiveness clusters are particularly appropriate.
Every year, the SESSI, formerly the statistics unit of the department of industry but now reporting to Insee, produced annual surveys providing one of the main sources of information about French industry. These surveys have been overhauled with the new eSANe information system. A new economic activity categorization was launched in early 2008 (see pages 80 and 81). The automotive industry covers motor vehicle manufacturing; motor vehicle, cara-van and recreational vehicle body manufacturing; and the upstream manufacturing of automotive equipment. However, the statistics do not encompass all automotive industry suppliers. Products such as tires, plastics, capital goods and glass are classified under other categories (see also page 59).
Automotive manufacturingFollowing strong growth between 1996 and 2004 ( 30%), in line with the increase in vehicle production, value added (excluding tax) of automotive manufacturing, in constant euro and by employee, has
fallen under the impact of various factors: expenses linked to new environmental standards, stagnation and then collapse of the Western european market for new vehicles worsened by the crisis, and the rising cost of raw materials. In 2013, the uptick recorded was not sufficient to bounce back to the level of 2008, the first year of the financial crisis. The automotive manufacturing industry dedicated almost 2% of sales to capital expenditure, representing more than €1.5 billion, to develop new models and optimize its production capacity. These figures do not include research and development costs (see page 34). export sales have increased constantly since 1990, when they reached 38%, oscillating around 60% until the crisis of 2008. After falling in 2009, this share has recovered since, reaching its pre-crisis levels in 2013.
35
40
45
50
55
60
65
70
20122011201020092008200720062005200420032002200120001999
100
150
200
250
300
350Effectif
131210080604020098969492908886848280
124
30
40
50
60
70
80VA
131211100908070603040202010099989796959493929190
41
4649 49
6056
63
53
58
3740
0%
2%
4%
6%
8%
Inv
1312100806040220009896949290888684821980
5.3
3.8
6.3
5.2
3.52.8 2.8
2.3
5.2
Total revenue Domestic revenue
Export revenue
0
10
20
30
40
50
60
70
80
CA Exp
CA Int
131211100908070605040302010099989796959493929190
TOTAL PURCHASES OF THE AUTOMOTIvE SECTOR
AUTOMOTIvE MANUFACTURINg EMPLOyEES(1)
35
40
45
50
55
60
65
70
20122011201020092008200720062005200420032002200120001999
100
150
200
250
300
350Effectif
131210080604020098969492908886848280
124
30
40
50
60
70
80VA
131211100908070603040202010099989796959493929190
41
4649 49
6056
63
53
58
3740
0%
2%
4%
6%
8%
Inv
1312100806040220009896949290888684821980
5.3
3.8
6.3
5.2
3.52.8 2.8
2.3
5.2
Total revenue Domestic revenue
Export revenue
0
10
20
30
40
50
60
70
80
CA Exp
CA Int
131211100908070605040302010099989796959493929190
in thousands of jobs
in 1990 € thousands per employee
35
40
45
50
55
60
65
70
20122011201020092008200720062005200420032002200120001999
100
150
200
250
300
350Effectif
131210080604020098969492908886848280
124
30
40
50
60
70
80VA
131211100908070603040202010099989796959493929190
41
4649 49
6056
63
53
58
3740
0%
2%
4%
6%
8%
Inv
1312100806040220009896949290888684821980
5.3
3.8
6.3
5.2
3.52.8 2.8
2.3
5.2
Total revenue Domestic revenue
Export revenue
0
10
20
30
40
50
60
70
80
CA Exp
CA Int
131211100908070605040302010099989796959493929190
CAPITAL EXPENdITURE By THE AUTOMOTIvE MANUFACTURINg INdUSTRy (1)
dOMESTIC ANd EXPORT SALES By THE AUTOMOTIvE MANUFACTURINg INdUSTRy (1)
as a % of sales
in 1990 € billions
(1) ccfa estimates for 2013: see also pages 80 and 81 (in particular for concept changes).
source: insee, national accounts, base 2005 (see also page 54).
in € billions
vALUE AddEd PROdUCEd By THE AUTOMOTIvE MANUFACTURINg INdUSTRy (1) 2.7%
AveRAgesince 2008 Of The
percenTage Of revenue DevOTeD TO invesTmenT
in auTOmOTive cOnsTrucTiOn
FRANCe
Comité des ConstruCteurs Français d’automobiles / AnAlySiS And highlightS_33
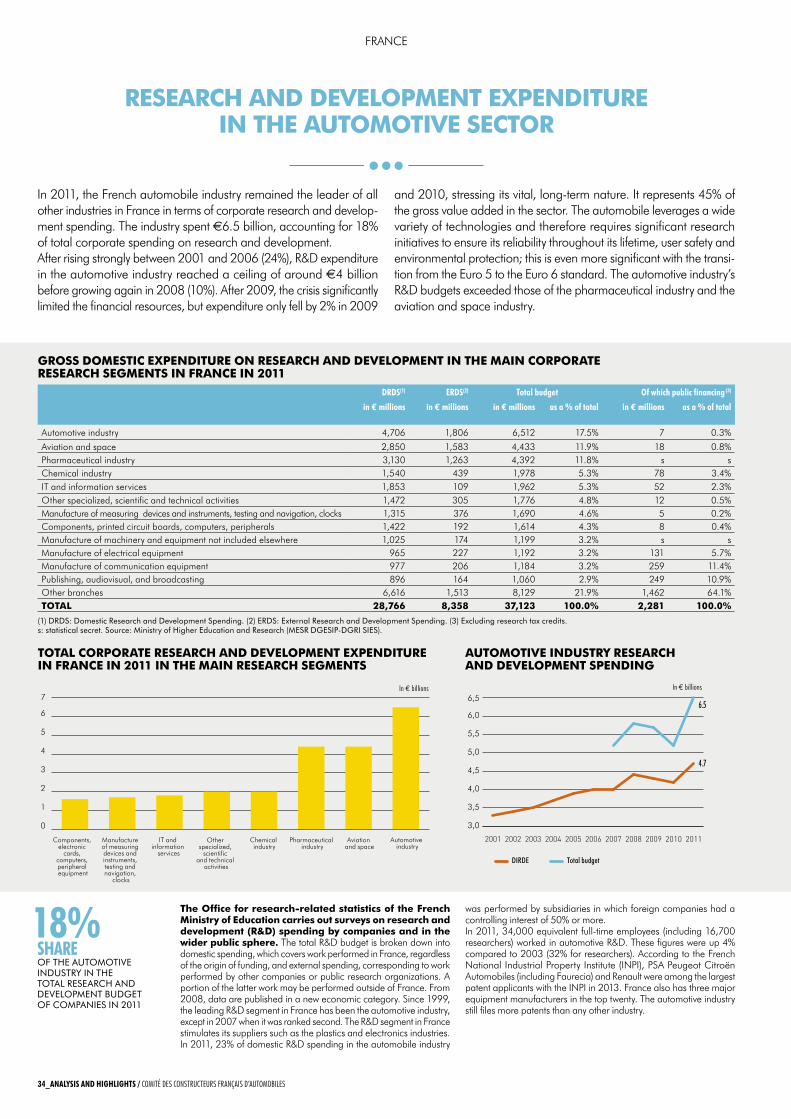
The Office for research-related statistics of the French Ministry of Education carries out surveys on research and development (R&d) spending by companies and in the wider public sphere. The total R&D budget is broken down into domestic spending, which covers work performed in France, regardless of the origin of funding, and external spending, corresponding to work performed by other companies or public research organizations. A portion of the latter work may be performed outside of France. From 2008, data are published in a new economic category. Since 1999, the leading R&D segment in France has been the automotive industry, except in 2007 when it was ranked second. The R&D segment in France stimulates its suppliers such as the plastics and electronics industries. In 2011, 23% of domestic R&D spending in the automobile industry
was performed by subsidiaries in which foreign companies had a controlling interest of 50% or more.In 2011, 34,000 equivalent full-time employees (including 16,700 researchers) worked in automotive R&D. These figures were up 4% compared to 2003 (32% for researchers). According to the French National Industrial Property Institute (INPI), PSA Peugeot Citroën Automobiles (including Faurecia) and Renault were among the largest patent applicants with the INPI in 2013. France also has three major equipment manufacturers in the top twenty. The automotive industry still files more patents than any other industry.
gROSS dOMESTIC EXPENdITURE ON RESEARCH ANd dEvELOPMENT IN THE MAIN CORPORATE RESEARCH SEgMENTS IN FRANCE IN 2011
dRdS(1) eRdS(2) total budget of which public financing (3)
in € millions in € millions in € millions as a % of total in € millions as a % of total
Automotive industry 4,706 1,806 6,512 17.5% 7 0.3%
Aviation and space 2,850 1,583 4,433 11.9% 18 0.8%Pharmaceutical industry 3,130 1,263 4,392 11.8% s sChemical industry 1,540 439 1,978 5.3% 78 3.4%IT and information services 1,853 109 1,962 5.3% 52 2.3%Other specialized, scientific and technical activities 1,472 305 1,776 4.8% 12 0.5%Manufacture of measuring devices and instruments, testing and navigation, clocks 1,315 376 1,690 4.6% 5 0.2%Components, printed circuit boards, computers, peripherals 1,422 192 1,614 4.3% 8 0.4%Manufacture of machinery and equipment not included elsewhere 1,025 174 1,199 3.2% s sManufacture of electrical equipment 965 227 1,192 3.2% 131 5.7%Manufacture of communication equipment 977 206 1,184 3.2% 259 11.4%Publishing, audiovisual, and broadcasting 896 164 1,060 2.9% 249 10.9%Other branches 6,616 1,513 8,129 21.9% 1,462 64.1%TOTAL 28,766 8,358 37,123 100.0% 2,281 100.0%
(1) DrDs: Domestic research and Development spending. (2) erDs: external research and Development spending. (3) excluding research tax credits. s: statistical secret. source: ministry of higher education and research (mesr Dgesip-Dgri sies).
AUTOMOTIvE INdUSTRy RESEARCH ANd dEvELOPMENT SPENdINg
IT and information
services
Components, electronic
cards, computers, peripheral equipment
Manufacture of measuring devices and instruments, testing and navigation,
clocks
Other specialized,
scientific and technical
activities
Chemical industry
Pharmaceutical industry
Automotive industry
Aviation and space
0
1
2
3
4
5
6
7
DIRDE Total budget
3,0
3,5
4,0
4,5
5,0
5,5
6,0
6,5Budget total
DIRDE
20112010200920082007200620052004200320022001
6.5
4.7
TOTAL CORPORATE RESEARCH ANd dEvELOPMENT EXPENdITURE IN FRANCE IN 2011 IN THE MAIN RESEARCH SEgMENTS
IT and information
services
Components, electronic
cards, computers, peripheral equipment
Manufacture of measuring devices and instruments, testing and navigation,
clocks
Other specialized,
scientific and technical
activities
Chemical industry
Pharmaceutical industry
Automotive industry
Aviation and space
0
1
2
3
4
5
6
7
DIRDE Total budget
3,0
3,5
4,0
4,5
5,0
5,5
6,0
6,5Budget total
DIRDE
20112010200920082007200620052004200320022001
6.5
4.7
RESEARCH ANd dEvELOPMENT EXPENdITURE IN THE AUTOMOTIvE SECTOR
18% ShAReOf The auTOmOTive inDusTry in The TOTal research anD DevelOpmenT buDgeT Of cOmpanies in 2011
in € billions in € billions
In 2011, the French automobile industry remained the leader of all other industries in France in terms of corporate research and develop-ment spending. The industry spent €6.5 billion, accounting for 18% of total corporate spending on research and development.After rising strongly between 2001 and 2006 (24%), R&D expenditure in the automotive industry reached a ceiling of around €4 billion before growing again in 2008 (10%). After 2009, the crisis significantly limited the financial resources, but expenditure only fell by 2% in 2009
and 2010, stressing its vital, long-term nature. It represents 45% of the gross value added in the sector. The automobile leverages a wide variety of technologies and therefore requires significant research initiatives to ensure its reliability throughout its lifetime, user safety and environmental protection; this is even more significant with the transi-tion from the euro 5 to the euro 6 standard. The automotive industry’s R&D budgets exceeded those of the pharmaceutical industry and the aviation and space industry.
FRANCe
34_AnAlySiS And highlightS / Comité des ConstruCteurs Français d’automobiles
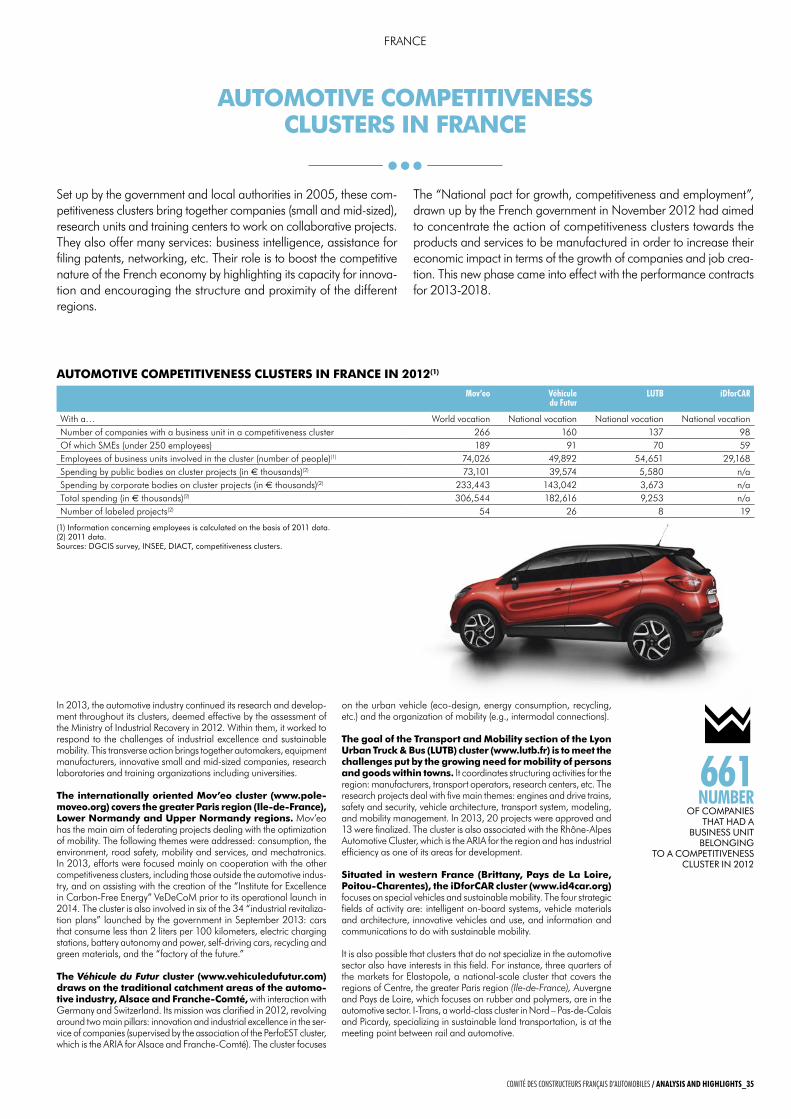
AUTOMOTIvE COMPETITIvENESS CLUSTERS IN FRANCE
In 2013, the automotive industry continued its research and develop-ment throughout its clusters, deemed effective by the assessment of the Ministry of Industrial Recovery in 2012. Within them, it worked to respond to the challenges of industrial excellence and sustainable mobility. This transverse action brings together automakers, equipment manufacturers, innovative small and mid-sized companies, research laboratories and training organizations including universities.
The internationally oriented Mov’eo cluster (www.pole-moveo.org) covers the greater Paris region (Ile-de-France), Lower Normandy and Upper Normandy regions. Mov’eo has the main aim of federating projects dealing with the optimization of mobility. The following themes were addressed: consumption, the environment, road safety, mobility and services, and mechatronics. In 2013, efforts were focused mainly on cooperation with the other competitiveness clusters, including those outside the automotive indus-try, and on assisting with the creation of the “Institute for excellence in Carbon-Free energy” VeDeCoM prior to its operational launch in 2014. The cluster is also involved in six of the 34 “industrial revitaliza-tion plans” launched by the government in September 2013: cars that consume less than 2 liters per 100 kilometers, electric charging stations, battery autonomy and power, self-driving cars, recycling and green materials, and the “factory of the future.”
The Véhicule du Futur cluster (www.vehiculedufutur.com) draws on the traditional catchment areas of the automo-tive industry, Alsace and Franche-Comté, with interaction with Germany and Switzerland. Its mission was clarified in 2012, revolving around two main pillars: innovation and industrial excellence in the ser-vice of companies (supervised by the association of the PerfoeST cluster, which is the ARIA for Alsace and Franche-Comté). The cluster focuses
on the urban vehicle (eco-design, energy consumption, recycling, etc.) and the organization of mobility (e.g., intermodal connections).
The goal of the Transport and Mobility section of the Lyon Urban Truck & Bus (LUTB) cluster (www.lutb.fr) is to meet the challenges put by the growing need for mobility of persons and goods within towns. It coordinates structuring activities for the region: manufacturers, transport operators, research centers, etc. The research projects deal with five main themes: engines and drive trains, safety and security, vehicle architecture, transport system, modeling, and mobility management. In 2013, 20 projects were approved and 13 were finalized. The cluster is also associated with the Rhône-Alpes Automotive Cluster, which is the ARIA for the region and has industrial efficiency as one of its areas for development.
Situated in western France (Brittany, Pays de La Loire, Poitou-Charentes), the idforCAR cluster (www.id4car.org) focuses on special vehicles and sustainable mobility. The four strategic fields of activity are: intelligent on-board systems, vehicle materials and architecture, innovative vehicles and use, and information and communications to do with sustainable mobility.
It is also possible that clusters that do not specialize in the automotive sector also have interests in this field. For instance, three quarters of the markets for elastopole, a national-scale cluster that covers the regions of Centre, the greater Paris region (Ile-de-France), Auvergne and Pays de Loire, which focuses on rubber and polymers, are in the automotive sector. I-Trans, a world-class cluster in Nord – Pas-de-Calais and Picardy, specializing in sustainable land transportation, is at the meeting point between rail and automotive.
Set up by the government and local authorities in 2005, these com-petitiveness clusters bring together companies (small and mid-sized), research units and training centers to work on collaborative projects. They also offer many services: business intelligence, assistance for filing patents, networking, etc. Their role is to boost the competitive nature of the French economy by highlighting its capacity for innova-tion and encouraging the structure and proximity of the different regions.
The “National pact for growth, competitiveness and employment”, drawn up by the French government in November 2012 had aimed to concentrate the action of competitiveness clusters towards the products and services to be manufactured in order to increase their economic impact in terms of the growth of companies and job crea-tion. This new phase came into effect with the performance contracts for 2013-2018.
AUTOMOTIvE COMPETITIvENESS CLUSTERS IN FRANCE IN 2012(1)
mov’eo véhicule du Futur
lUtb idforCAR
With a… World vocation National vocation National vocation National vocation Number of companies with a business unit in a competitiveness cluster 266 160 137 98 Of which SMes (under 250 employees) 189 91 70 59 employees of business units involved in the cluster (number of people)(1) 74,026 49,892 54,651 29,168 Spending by public bodies on cluster projects (in € thousands)(2) 73,101 39,574 5,580 n/a Spending by corporate bodies on cluster projects (in € thousands)(2) 233,443 143,042 3,673 n/a Total spending (in € thousands)(2) 306,544 182,616 9,253 n/a Number of labeled projects(2) 54 26 8 19
(1) information concerning employees is calculated on the basis of 2011 data.(2) 2011 data. sources: Dgcis survey, insee, DiacT, competitiveness clusters.
661 nUmbeR
Of cOmpanies ThaT haD a
business uniT belOnging
TO a cOmpeTiTiveness clusTer in 2012
FRANCe
Comité des ConstruCteurs Français d’automobiles / AnAlySiS And highlightS_35
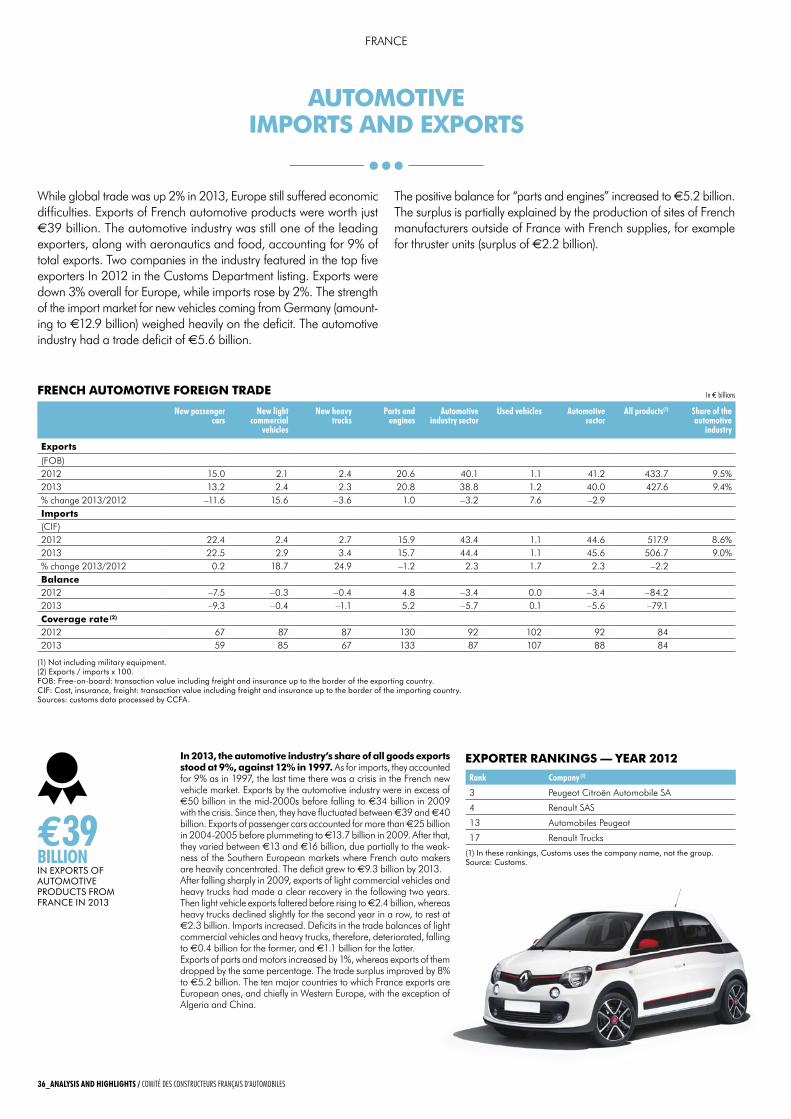
While global trade was up 2% in 2013, europe still suffered economic difficulties. exports of French automotive products were worth just €39 billion. The automotive industry was still one of the leading exporters, along with aeronautics and food, accounting for 9% of total exports. Two companies in the industry featured in the top five exporters In 2012 in the Customs Department listing. exports were down 3% overall for europe, while imports rose by 2%. The strength of the import market for new vehicles coming from Germany (amount-ing to €12.9 billion) weighed heavily on the deficit. The automotive industry had a trade deficit of €5.6 billion.
The positive balance for “parts and engines” increased to €5.2 billion. The surplus is partially explained by the production of sites of French manufacturers outside of France with French supplies, for example for thruster units (surplus of €2.2 billion).
In 2013, the automotive industry’s share of all goods exports stood at 9%, against 12% in 1997. As for imports, they accounted for 9% as in 1997, the last time there was a crisis in the French new vehicle market. exports by the automotive industry were in excess of €50 billion in the mid-2000s before falling to €34 billion in 2009 with the crisis. Since then, they have fluctuated between €39 and €40 billion. exports of passenger cars accounted for more than €25 billion in 2004-2005 before plummeting to €13.7 billion in 2009. After that, they varied between €13 and €16 billion, due partially to the weak-ness of the Southern european markets where French auto makers are heavily concentrated. The deficit grew to €9.3 billion by 2013.After falling sharply in 2009, exports of light commercial vehicles and heavy trucks had made a clear recovery in the following two years. Then light vehicle exports faltered before rising to €2.4 billion, whereas heavy trucks declined slightly for the second year in a row, to rest at €2.3 billion. Imports increased. Deficits in the trade balances of light commercial vehicles and heavy trucks, therefore, deteriorated, falling to €0.4 billion for the former, and €1.1 billion for the latter.exports of parts and motors increased by 1%, whereas exports of them dropped by the same percentage. The trade surplus improved by 8% to €5.2 billion. The ten major countries to which France exports are european ones, and chiefly in Western europe, with the exception of Algeria and China.
AUTOMOTIvE IMPORTS ANd EXPORTS
FRENCH AUTOMOTIvE FOREIgN TRAdE
new passenger cars
new light commercial
vehicles
new heavy trucks
Parts and engines
Automotive industry sector
Used vehicles Automotive sector
All products(1) Share of the automotive
industry
Exports
(FOB)2012 15.0 2.1 2.4 20.6 40.1 1.1 41.2 433.7 9.5%2013 13.2 2.4 2.3 20.8 38.8 1.2 40.0 427.6 9.4%% change 2013/2012 –11.6 15.6 –3.6 1.0 –3.2 7.6 –2.9Imports(CIF)2012 22.4 2.4 2.7 15.9 43.4 1.1 44.6 517.9 8.6%2013 22.5 2.9 3.4 15.7 44.4 1.1 45.6 506.7 9.0%% change 2013/2012 0.2 18.7 24.9 –1.2 2.3 1.7 2.3 –2.2Balance2012 –7.5 –0.3 –0.4 4.8 –3.4 0.0 –3.4 –84.22013 –9.3 –0.4 –1.1 5.2 –5.7 0.1 –5.6 –79.1Coverage rate (2)
2012 67 87 87 130 92 102 92 84 2013 59 85 67 133 87 107 88 84
(1) not including military equipment.(2) exports / imports x 100.fOb: free-on-board: transaction value including freight and insurance up to the border of the exporting country.cif: cost, insurance, freight: transaction value including freight and insurance up to the border of the importing country.sources: customs data processed by ccfa.
€39 billionin expOrTs Of auTOmOTive prODucTs frOm france in 2013
in € billions
Rank Company (1)
3 Peugeot Citroën Automobile SA
4 Renault SAS
13 Automobiles Peugeot
17 Renault Trucks
EXPORTER RANkINgS — yEAR 2012
(1) in these rankings, customs uses the company name, not the group.source: customs.
FRANCe
36_AnAlySiS And highlightS / Comité des ConstruCteurs Français d’automobiles
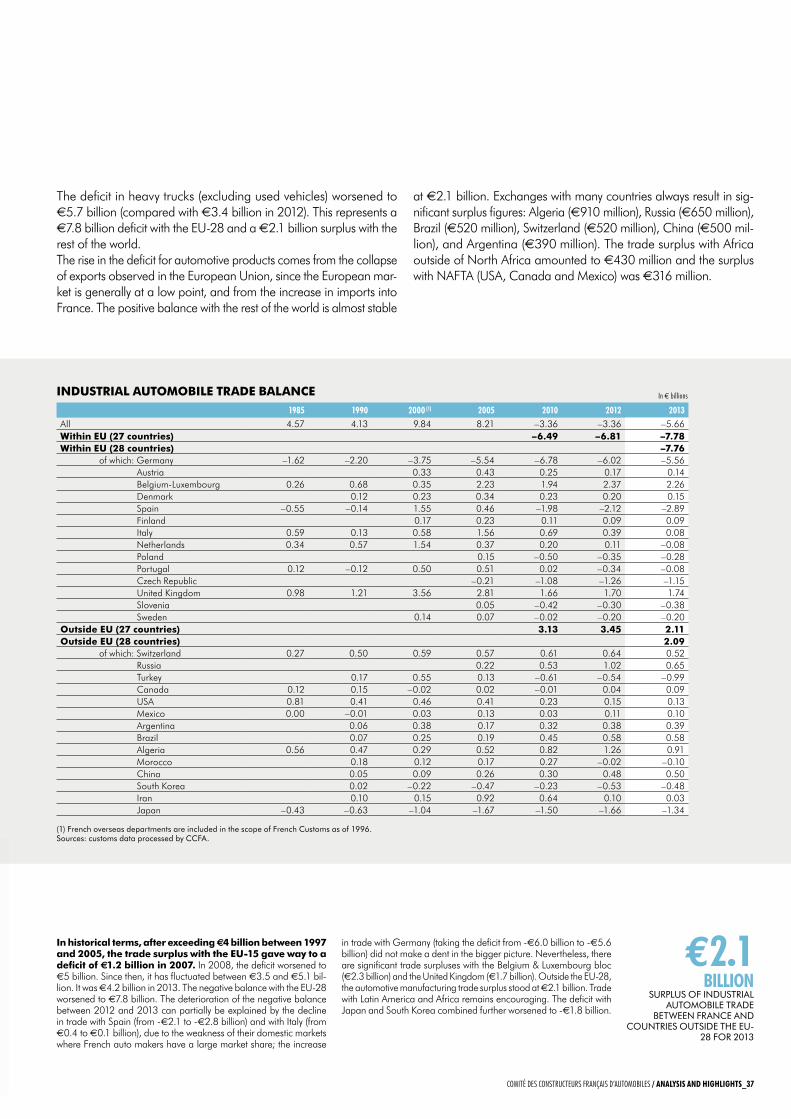
€2.1 billion
surplus Of inDusTrial auTOmObile TraDe
beTween france anD cOunTries OuTsiDe The eu-
28 fOr 2013
In historical terms, after exceeding €4 billion between 1997 and 2005, the trade surplus with the EU-15 gave way to a deficit of €1.2 billion in 2007. In 2008, the deficit worsened to €5 billion. Since then, it has fluctuated between €3.5 and €5.1 bil-lion. It was €4.2 billion in 2013. The negative balance with the eU-28 worsened to €7.8 billion. The deterioration of the negative balance between 2012 and 2013 can partially be explained by the decline in trade with Spain (from -€2.1 to -€2.8 billion) and with Italy (from €0.4 to €0.1 billion), due to the weakness of their domestic markets where French auto makers have a large market share; the increase
in trade with Germany (taking the deficit from -€6.0 billion to -€5.6 billion) did not make a dent in the bigger picture. Nevertheless, there are significant trade surpluses with the Belgium & Luxembourg bloc (€2.3 billion) and the United Kingdom (€1.7 billion). Outside the eU-28, the automotive manufacturing trade surplus stood at €2.1 billion. Trade with Latin America and Africa remains encouraging. The deficit with Japan and South Korea combined further worsened to -€1.8 billion.
The deficit in heavy trucks (excluding used vehicles) worsened to €5.7 billion (compared with €3.4 billion in 2012). This represents a €7.8 billion deficit with the eU-28 and a €2.1 billion surplus with the rest of the world.The rise in the deficit for automotive products comes from the collapse of exports observed in the european Union, since the european mar-ket is generally at a low point, and from the increase in imports into France. The positive balance with the rest of the world is almost stable
at €2.1 billion. exchanges with many countries always result in sig-nificant surplus figures: Algeria (€910 million), Russia (€650 million), Brazil (€520 million), Switzerland (€520 million), China (€500 mil-lion), and Argentina (€390 million). The trade surplus with Africa outside of North Africa amounted to €430 million and the surplus with NAFTA (USA, Canada and Mexico) was €316 million.
INdUSTRIAL AUTOMOBILE TRAdE BALANCE
1985 1990 2000 (1) 2005 2010 2012 2013 All 4.57 4.13 9.84 8.21 –3.36 –3.36 –5.66within EU (27 countries) –6.49 –6.81 –7.78within EU (28 countries) –7.76
of which: Germany –1.62 –2.20 –3.75 –5.54 –6.78 –6.02 –5.56Austria 0.33 0.43 0.25 0.17 0.14Belgium-Luxembourg 0.26 0.68 0.35 2.23 1.94 2.37 2.26Denmark 0.12 0.23 0.34 0.23 0.20 0.15Spain –0.55 –0.14 1.55 0.46 –1.98 –2.12 –2.89Finland 0.17 0.23 0.11 0.09 0.09Italy 0.59 0.13 0.58 1.56 0.69 0.39 0.08Netherlands 0.34 0.57 1.54 0.37 0.20 0.11 –0.08Poland 0.15 –0.50 –0.35 –0.28Portugal 0.12 –0.12 0.50 0.51 0.02 –0.34 –0.08Czech Republic –0.21 –1.08 –1.26 –1.15United Kingdom 0.98 1.21 3.56 2.81 1.66 1.70 1.74Slovenia 0.05 –0.42 –0.30 –0.38Sweden 0.14 0.07 –0.02 –0.20 –0.20
Outside EU (27 countries) 3.13 3.45 2.11Outside EU (28 countries) 2.09
of which: Switzerland 0.27 0.50 0.59 0.57 0.61 0.64 0.52Russia 0.22 0.53 1.02 0.65Turkey 0.17 0.55 0.13 –0.61 –0.54 –0.99Canada 0.12 0.15 –0.02 0.02 –0.01 0.04 0.09USA 0.81 0.41 0.46 0.41 0.23 0.15 0.13Mexico 0.00 –0.01 0.03 0.13 0.03 0.11 0.10Argentina 0.06 0.38 0.17 0.32 0.38 0.39Brazil 0.07 0.25 0.19 0.45 0.58 0.58Algeria 0.56 0.47 0.29 0.52 0.82 1.26 0.91Morocco 0.18 0.12 0.17 0.27 –0.02 –0.10China 0.05 0.09 0.26 0.30 0.48 0.50South Korea 0.02 –0.22 –0.47 –0.23 –0.53 –0.48Iran 0.10 0.15 0.92 0.64 0.10 0.03Japan –0.43 –0.63 –1.04 –1.67 –1.50 –1.66 –1.34
(1) french overseas departments are included in the scope of french customs as of 1996. sources: customs data processed by ccfa.
in € billions
Comité des ConstruCteurs Français d’automobiles / AnAlySiS And highlightS_37
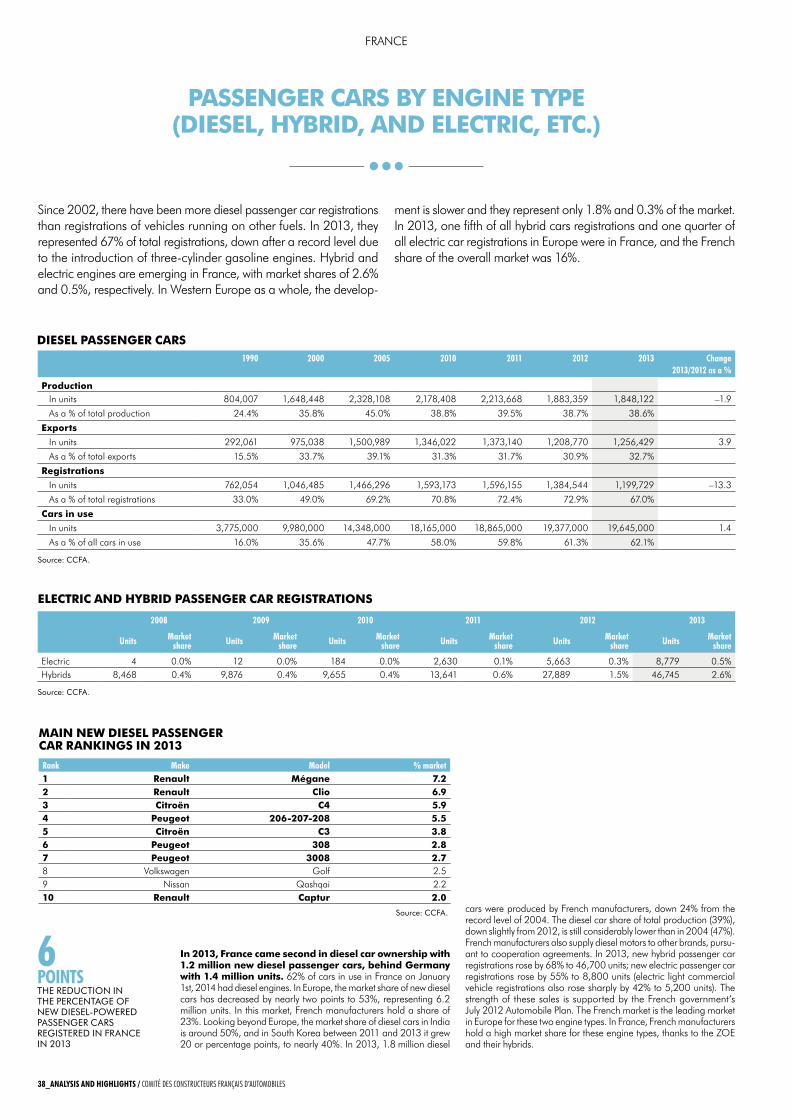
PASSENgER CARS By ENgINE TyPE (dIESEL, HyBRId, ANd ELECTRIC, ETC.)
In 2013, France came second in diesel car ownership with 1.2 million new diesel passenger cars, behind germany with 1.4 million units. 62% of cars in use in France on January 1st, 2014 had diesel engines. In europe, the market share of new diesel cars has decreased by nearly two points to 53%, representing 6.2 million units. In this market, French manufacturers hold a share of 23%. Looking beyond europe, the market share of diesel cars in India is around 50%, and in South Korea between 2011 and 2013 it grew 20 or percentage points, to nearly 40%. In 2013, 1.8 million diesel
Since 2002, there have been more diesel passenger car registrations than registrations of vehicles running on other fuels. In 2013, they represented 67% of total registrations, down after a record level due to the introduction of three-cylinder gasoline engines. Hybrid and electric engines are emerging in France, with market shares of 2.6% and 0.5%, respectively. In Western europe as a whole, the develop-
ment is slower and they represent only 1.8% and 0.3% of the market. In 2013, one fifth of all hybrid cars registrations and one quarter of all electric car registrations in europe were in France, and the French share of the overall market was 16%.
1990 2000 2005 2010 2011 2012 2013 Change2013/2012 as a %
ProductionIn units 804,007 1,648,448 2,328,108 2,178,408 2,213,668 1,883,359 1,848,122 –1.9
As a % of total production 24.4% 35.8% 45.0% 38.8% 39.5% 38.7% 38.6%
Exports
In units 292,061 975,038 1,500,989 1,346,022 1,373,140 1,208,770 1,256,429 3.9
As a % of total exports 15.5% 33.7% 39.1% 31.3% 31.7% 30.9% 32.7%
Registrations
In units 762,054 1,046,485 1,466,296 1,593,173 1,596,155 1,384,544 1,199,729 –13.3
As a % of total registrations 33.0% 49.0% 69.2% 70.8% 72.4% 72.9% 67.0%
Cars in use
In units 3,775,000 9,980,000 14,348,000 18,165,000 18,865,000 19,377,000 19,645,000 1.4
As a % of all cars in use 16.0% 35.6% 47.7% 58.0% 59.8% 61.3% 62.1%
source: ccfa.
2008 2009 2010 2011 2012 2013
Units market share Units market
share Units market share Units market
share Units market share Units market
share
electric 4 0.0% 12 0.0% 184 0.0% 2,630 0.1% 5,663 0.3% 8,779 0.5%Hybrids 8,468 0.4% 9,876 0.4% 9,655 0.4% 13,641 0.6% 27,889 1.5% 46,745 2.6%
source: ccfa.
dIESEL PASSENgER CARS
ELECTRIC ANd HyBRId PASSENgER CAR REgISTRATIONS
cars were produced by French manufacturers, down 24% from the record level of 2004. The diesel car share of total production (39%), down slightly from 2012, is still considerably lower than in 2004 (47%). French manufacturers also supply diesel motors to other brands, pursu-ant to cooperation agreements. In 2013, new hybrid passenger car registrations rose by 68% to 46,700 units; new electric passenger car registrations rose by 55% to 8,800 units (electric light commercial vehicle registrations also rose sharply by 42% to 5,200 units). The strength of these sales is supported by the French government’s July 2012 Automobile Plan. The French market is the leading market in europe for these two engine types. In France, French manufacturers hold a high market share for these engine types, thanks to the ZOe and their hybrids.
6 PointSThe reDucTiOn in The percenTage Of new Diesel-pOwereD passenger cars regisTereD in france in 2013
Rank make model % market1 Renault Mégane 7.2 2 Renault Clio 6.9 3 Citroën C4 5.9 4 Peugeot 206-207-208 5.5 5 Citroën C3 3.8 6 Peugeot 308 2.8 7 Peugeot 3008 2.7 8 Volkswagen Golf 2.5 9 Nissan Qashqai 2.2 10 Renault Captur 2.0
MAIN NEw dIESEL PASSENgER CAR RANkINgS IN 2013
source: ccfa.
FRANCe
38_AnAlySiS And highlightS / Comité des ConstruCteurs Français d’automobiles
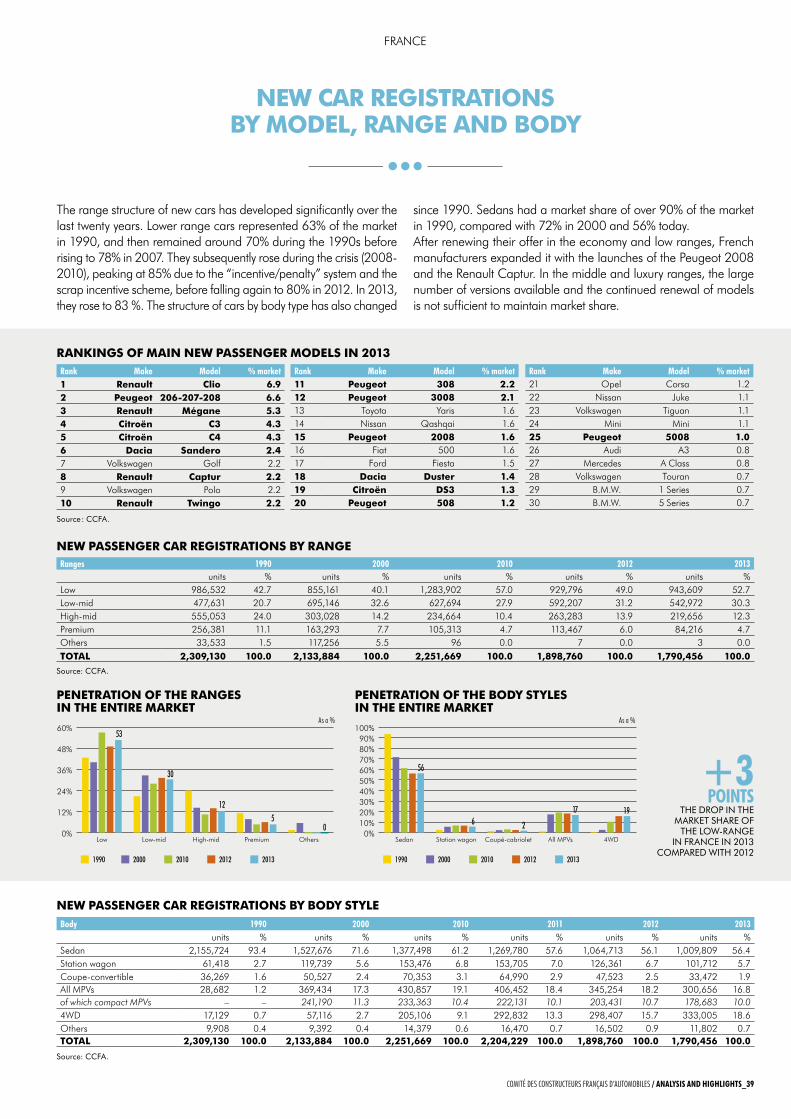
The range structure of new cars has developed significantly over the last twenty years. Lower range cars represented 63% of the market in 1990, and then remained around 70% during the 1990s before rising to 78% in 2007. They subsequently rose during the crisis (2008-2010), peaking at 85% due to the “incentive/penalty” system and the scrap incentive scheme, before falling again to 80% in 2012. In 2013, they rose to 83 %. The structure of cars by body type has also changed
since 1990. Sedans had a market share of over 90% of the market in 1990, compared with 72% in 2000 and 56% today.After renewing their offer in the economy and low ranges, French manufacturers expanded it with the launches of the Peugeot 2008 and the Renault Captur. In the middle and luxury ranges, the large number of versions available and the continued renewal of models is not sufficient to maintain market share.
NEw CAR REgISTRATIONS By MOdEL, RANgE ANd BOdy
+3 PointS
The DrOp in The marKeT share Of
The lOw-range in france in 2013
cOmpareD wiTh 2012
Rank make model % market1 Renault Clio 6.92 Peugeot 206-207-208 6.63 Renault Mégane 5.34 Citroën C3 4.35 Citroën C4 4.36 dacia Sandero 2.47 Volkswagen Golf 2.28 Renault Captur 2.29 Volkswagen Polo 2.210 Renault Twingo 2.2
RANkINgS OF MAIN NEw PASSENgER MOdELS IN 2013
NEw PASSENgER CAR REgISTRATIONS By BOdy STyLE
source : ccfa.
NEw PASSENgER CAR REgISTRATIONS By RANgERanges 1990 2000 2010 2012 2013
units % units % units % units % units %Low 986,532 42.7 855,161 40.1 1,283,902 57.0 929,796 49.0 943,609 52.7Low-mid 477,631 20.7 695,146 32.6 627,694 27.9 592,207 31.2 542,972 30.3High-mid 555,053 24.0 303,028 14.2 234,664 10.4 263,283 13.9 219,656 12.3Premium 256,381 11.1 163,293 7.7 105,313 4.7 113,467 6.0 84,216 4.7Others 33,533 1.5 117,256 5.5 96 0.0 7 0.0 3 0.0TOTAL 2,309,130 100.0 2,133,884 100.0 2,251,669 100.0 1,898,760 100.0 1,790,456 100.0
source: ccfa.
body 1990 2000 2010 2011 2012 2013units % units % units % units % units % units %
Sedan 2,155,724 93.4 1,527,676 71.6 1,377,498 61.2 1,269,780 57.6 1,064,713 56.1 1,009,809 56.4Station wagon 61,418 2.7 119,739 5.6 153,476 6.8 153,705 7.0 126,361 6.7 101,712 5.7Coupe-convertible 36,269 1.6 50,527 2.4 70,353 3.1 64,990 2.9 47,523 2.5 33,472 1.9All MPVs 28,682 1.2 369,434 17.3 430,857 19.1 406,452 18.4 345,254 18.2 300,656 16.8of which compact MPVs – – 241,190 11.3 233,363 10.4 222,131 10.1 203,431 10.7 178,683 10.04WD 17,129 0.7 57,116 2.7 205,106 9.1 292,832 13.3 298,407 15.7 333,005 18.6Others 9,908 0.4 9,392 0.4 14,379 0.6 16,470 0.7 16,502 0.9 11,802 0.7TOTAL 2,309,130 100.0 2,133,884 100.0 2,251,669 100.0 2,204,229 100.0 1,898,760 100.0 1,790,456 100.0
Rank make model % market11 Peugeot 308 2.212 Peugeot 3008 2.113 Toyota Yaris 1.614 Nissan Qashqai 1.615 Peugeot 2008 1.616 Fiat 500 1.617 Ford Fiesta 1.518 dacia duster 1.419 Citroën dS3 1.320 Peugeot 508 1.2
PENETRATION OF THE RANgES IN THE ENTIRE MARkET
PENETRATION OF THE BOdy STyLES IN THE ENTIRE MARkET
0Sedan Station wagon Coupé-cabriolet All MPVs 4WD
0%10%20%30%40%50%60%70%80%90%
100%
1990 2000 2010 2012 2013
Low Low-mid High-mid Premium Others0%
12%
24%
36%
48%
60%
1990 2000 2010 2012 2013
53
30
125
0
17 19
56
6 2
as a % as a %
Rank make model % market21 Opel Corsa 1.222 Nissan Juke 1.123 Volkswagen Tiguan 1.124 Mini Mini 1.125 Peugeot 5008 1.026 Audi A3 0.827 Mercedes A Class 0.828 Volkswagen Touran 0.729 B.M.W. 1 Series 0.730 B.M.W. 5 Series 0.7
source: ccfa.
FRANCe
Comité des ConstruCteurs Français d’automobiles / AnAlySiS And highlightS_39
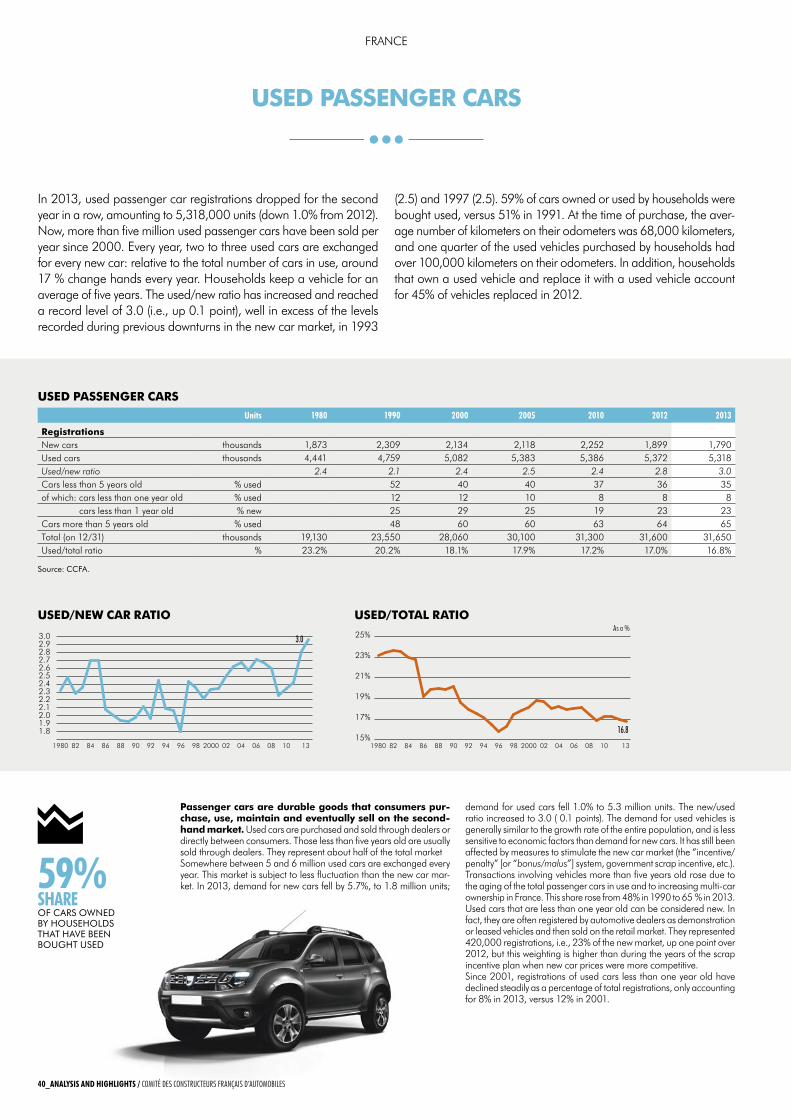
Passenger cars are durable goods that consumers pur-chase, use, maintain and eventually sell on the second-hand market. Used cars are purchased and sold through dealers or directly between consumers. Those less than five years old are usually sold through dealers. They represent about half of the total marketSomewhere between 5 and 6 million used cars are exchanged every year. This market is subject to less fluctuation than the new car mar-ket. In 2013, demand for new cars fell by 5.7%, to 1.8 million units;
demand for used cars fell 1.0% to 5.3 million units. The new/used ratio increased to 3.0 ( 0.1 points). The demand for used vehicles is generally similar to the growth rate of the entire population, and is less sensitive to economic factors than demand for new cars. It has still been affected by measures to stimulate the new car market (the “incentive/penalty” [or “bonus/malus”] system, government scrap incentive, etc.).Transactions involving vehicles more than five years old rose due to the aging of the total passenger cars in use and to increasing multi-car ownership in France. This share rose from 48% in 1990 to 65 % in 2013.Used cars that are less than one year old can be considered new. In fact, they are often registered by automotive dealers as demonstration or leased vehicles and then sold on the retail market. They represented 420,000 registrations, i.e., 23% of the new market, up one point over 2012, but this weighting is higher than during the years of the scrap incentive plan when new car prices were more competitive.Since 2001, registrations of used cars less than one year old have declined steadily as a percentage of total registrations, only accounting for 8% in 2013, versus 12% in 2001.
In 2013, used passenger car registrations dropped for the second year in a row, amounting to 5,318,000 units (down 1.0% from 2012). Now, more than five million used passenger cars have been sold per year since 2000. every year, two to three used cars are exchanged for every new car: relative to the total number of cars in use, around 17 % change hands every year. Households keep a vehicle for an average of five years. The used/new ratio has increased and reached a record level of 3.0 (i.e., up 0.1 point), well in excess of the levels recorded during previous downturns in the new car market, in 1993
(2.5) and 1997 (2.5). 59% of cars owned or used by households were bought used, versus 51% in 1991. At the time of purchase, the aver-age number of kilometers on their odometers was 68,000 kilometers, and one quarter of the used vehicles purchased by households had over 100,000 kilometers on their odometers. In addition, households that own a used vehicle and replace it with a used vehicle account for 45% of vehicles replaced in 2012.
USEd PASSENgER CARS
USEd PASSENgER CARSUnits 1980 1990 2000 2005 2010 2012 2013
RegistrationsNew cars thousands 1,873 2,309 2,134 2,118 2,252 1,899 1,790Used cars thousands 4,441 4,759 5,082 5,383 5,386 5,372 5,318Used/new ratio 2.4 2.1 2.4 2.5 2.4 2.8 3.0Cars less than 5 years old % used 52 40 40 37 36 35of which: cars less than one year old % used 12 12 10 8 8 8
cars less than 1 year old % new 25 29 25 19 23 23Cars more than 5 years old % used 48 60 60 63 64 65Total (on 12/31) thousands 19,130 23,550 28,060 30,100 31,300 31,600 31,650Used/total ratio % 23.2% 20.2% 18.1% 17.9% 17.2% 17.0% 16.8%
source: ccfa.
USEd/NEw CAR RATIO USEd/TOTAL RATIO
1.8 1.9 2.0 2.1 2.2 2.3 2.4 2.5 2.6 2.7 2.8 2.9 3.0
10 130806040220009896949290888684821980
3.0
16.815%
17%
19%
21%
23%
25%
10 130806040220009896949290888684821980
as a %
59%ShARe Of cars OwneD by hOusehOlDs ThaT have been bOughT useD
FRANCe
40_AnAlySiS And highlightS / Comité des ConstruCteurs Français d’automobiles
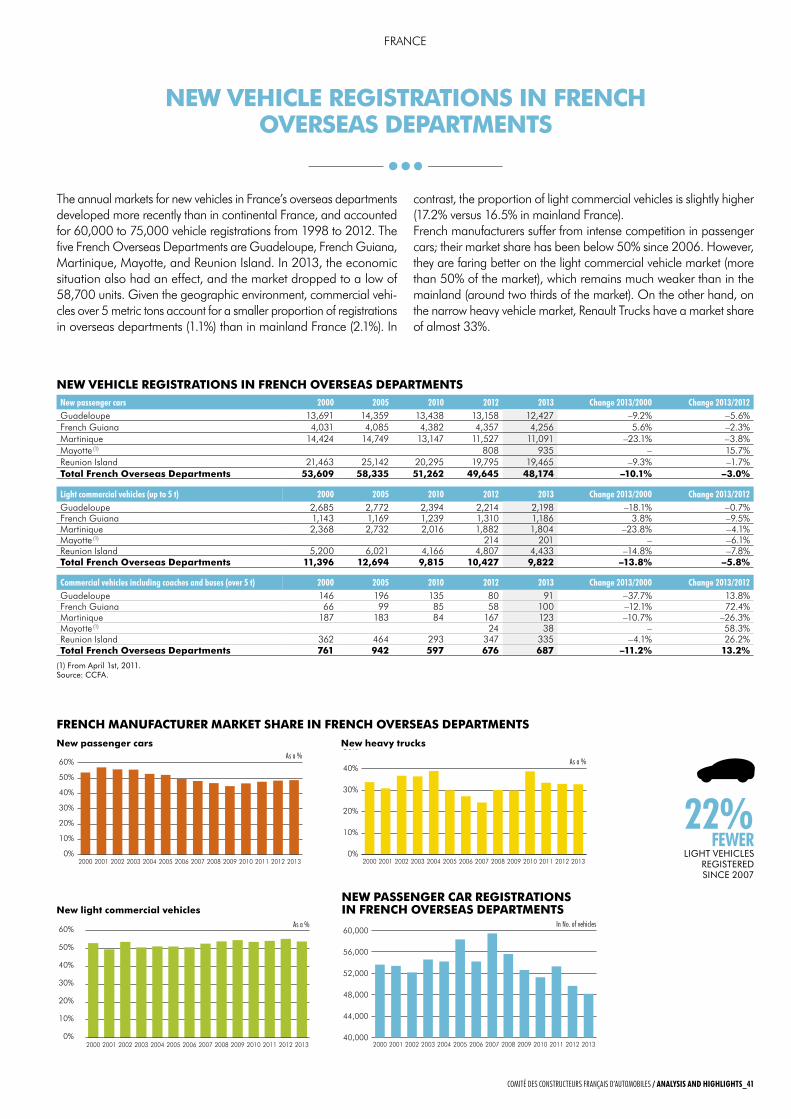
The annual markets for new vehicles in France’s overseas departments developed more recently than in continental France, and accounted for 60,000 to 75,000 vehicle registrations from 1998 to 2012. The five French Overseas Departments are Guadeloupe, French Guiana, Martinique, Mayotte, and Reunion Island. In 2013, the economic situation also had an effect, and the market dropped to a low of 58,700 units. Given the geographic environment, commercial vehi-cles over 5 metric tons account for a smaller proportion of registrations in overseas departments (1.1%) than in mainland France (2.1%). In
contrast, the proportion of light commercial vehicles is slightly higher (17.2% versus 16.5% in mainland France).French manufacturers suffer from intense competition in passenger cars; their market share has been below 50% since 2006. However, they are faring better on the light commercial vehicle market (more than 50% of the market), which remains much weaker than in the mainland (around two thirds of the market). On the other hand, on the narrow heavy vehicle market, Renault Trucks have a market share of almost 33%.
NEw vEHICLE REgISTRATIONS IN FRENCH OvERSEAS dEPARTMENTS
NEw vEHICLE REgISTRATIONS IN FRENCH OvERSEAS dEPARTMENTSnew passenger cars 2000 2005 2010 2012 2013 Change 2013/2000 Change 2013/2012Guadeloupe 13,691 14,359 13,438 13,158 12,427 –9.2% –5.6%French Guiana 4,031 4,085 4,382 4,357 4,256 5.6% –2.3%Martinique 14,424 14,749 13,147 11,527 11,091 –23.1% –3.8%Mayotte (1) 808 935 – 15.7%Reunion Island 21,463 25,142 20,295 19,795 19,465 –9.3% –1.7%Total French Overseas departments 53,609 58,335 51,262 49,645 48,174 –10.1% –3.0%
light commercial vehicles (up to 5 t) 2000 2005 2010 2012 2013 Change 2013/2000 Change 2013/2012Guadeloupe 2,685 2,772 2,394 2,214 2,198 –18.1% –0.7%French Guiana 1,143 1,169 1,239 1,310 1,186 3.8% –9.5%Martinique 2,368 2,732 2,016 1,882 1,804 –23.8% –4.1%Mayotte (1) 214 201 – –6.1%Reunion Island 5,200 6,021 4,166 4,807 4,433 –14.8% –7.8%Total French Overseas departments 11,396 12,694 9,815 10,427 9,822 –13.8% –5.8%
Commercial vehicles including coaches and buses (over 5 t) 2000 2005 2010 2012 2013 Change 2013/2000 Change 2013/2012Guadeloupe 146 196 135 80 91 –37.7% 13.8%French Guiana 66 99 85 58 100 –12.1% 72.4%Martinique 187 183 84 167 123 –10.7% –26.3%Mayotte (1) 24 38 – 58.3%Reunion Island 362 464 293 347 335 –4.1% 26.2%Total French Overseas departments 761 942 597 676 687 –11.2% 13.2%
NEw PASSENgER CAR REgISTRATIONS IN FRENCH OvERSEAS dEPARTMENTS
0%
10%
20%
30%
40%
50%
60%
70%
20132012201120102009200820072006200520042003200220012000
40,000
44,000
48,000
52,000
56,000
60,000
20132012201120102009200820072006200520042003200220012000
0%
10%
20%
30%
40%
50%
20132012201120102009200820072006200520042003200220012000
0%
10%
20%
30%
40%
50%
60%
20132012201120102009200820072006200520042003200220012000
in no. of vehicles
FRENCH MANUFACTURER MARkET SHARE IN FRENCH OvERSEAS dEPARTMENTS
0%
10%
20%
30%
40%
50%
60%
70%
20132012201120102009200820072006200520042003200220012000
40,000
44,000
48,000
52,000
56,000
60,000
20132012201120102009200820072006200520042003200220012000
0%
10%
20%
30%
40%
50%
20132012201120102009200820072006200520042003200220012000
0%
10%
20%
30%
40%
50%
60%
20132012201120102009200820072006200520042003200220012000
0%
10%
20%
30%
40%
50%
60%
70%
20132012201120102009200820072006200520042003200220012000
40,000
44,000
48,000
52,000
56,000
60,000
20132012201120102009200820072006200520042003200220012000
0%
10%
20%
30%
40%
50%
20132012201120102009200820072006200520042003200220012000
0%
10%
20%
30%
40%
50%
60%
20132012201120102009200820072006200520042003200220012000
New passenger cars
New light commercial vehicles
New heavy trucks
(1) from april 1st, 2011.source: ccfa.
as a %as a %
as a %
22% FeweR
lighT vehicles regisTereD since 2007
FRANCe
Comité des ConstruCteurs Français d’automobiles / AnAlySiS And highlightS_41
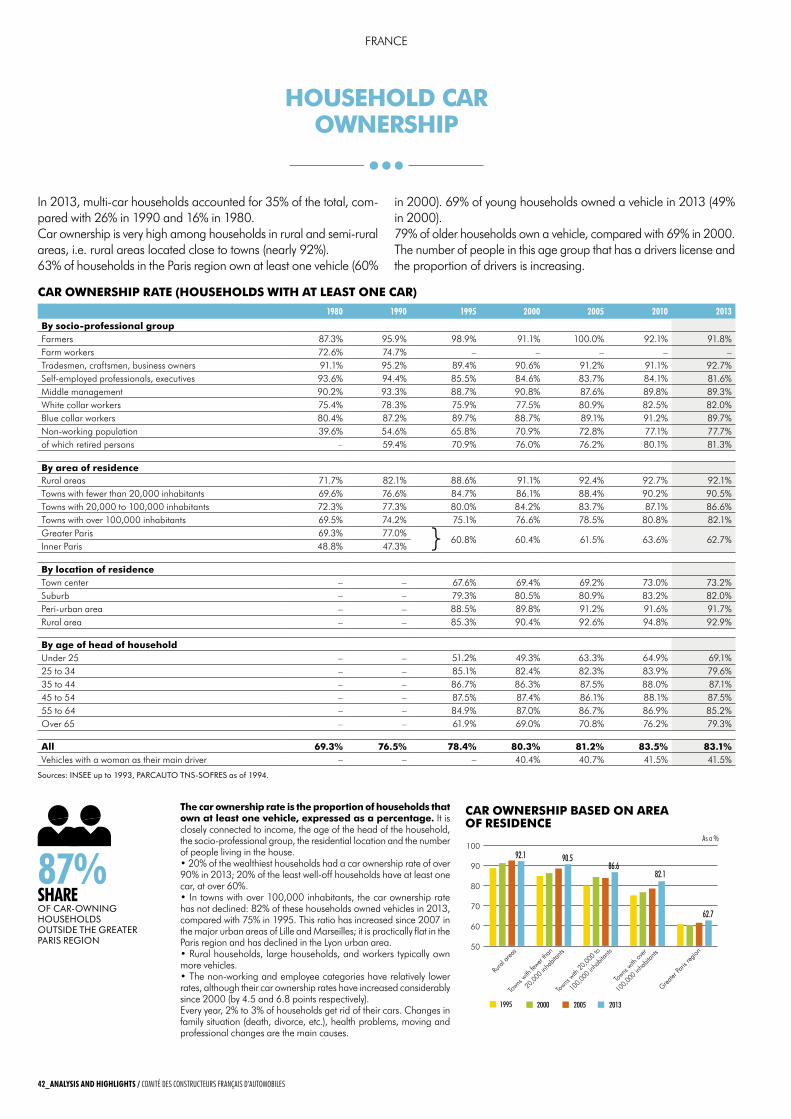
The car ownership rate is the proportion of households that own at least one vehicle, expressed as a percentage. It is closely connected to income, the age of the head of the household, the socio-professional group, the residential location and the number of people living in the house.• 20% of the wealthiest households had a car ownership rate of over 90% in 2013; 20% of the least well-off households have at least one car, at over 60%.• In towns with over 100,000 inhabitants, the car ownership rate has not declined: 82% of these households owned vehicles in 2013, compared with 75% in 1995. This ratio has increased since 2007 in the major urban areas of Lille and Marseilles; it is practically flat in the Paris region and has declined in the Lyon urban area.• Rural households, large households, and workers typically own more vehicles.• The non-working and employee categories have relatively lower rates, although their car ownership rates have increased considerably since 2000 (by 4.5 and 6.8 points respectively).every year, 2% to 3% of households get rid of their cars. Changes in family situation (death, divorce, etc.), health problems, moving and professional changes are the main causes.
In 2013, multi-car households accounted for 35% of the total, com-pared with 26% in 1990 and 16% in 1980. Car ownership is very high among households in rural and semi-rural areas, i.e. rural areas located close to towns (nearly 92%). 63% of households in the Paris region own at least one vehicle (60%
in 2000). 69% of young households owned a vehicle in 2013 (49% in 2000). 79% of older households own a vehicle, compared with 69% in 2000. The number of people in this age group that has a drivers license and the proportion of drivers is increasing.
HOUSEHOLd CAR OwNERSHIP
CAR OwNERSHIP RATE (HOUSEHOLdS wITH AT LEAST ONE CAR)
sources: insee up to 1993, parcauTO Tns-sOfres as of 1994.
1995 2000 2005 2013
Greater
Paris
regio
n
Towns
with
over
100,0
00 in
habit
ants
Towns
with
20,00
0 to
100,0
00 in
habit
ants
Towns
with
fewer
than
20,00
0 inh
abita
nts
Rural
area
s50
60
70
80
90
10092.1 90.5
86.682.1
62.7
CAR OwNERSHIP BASEd ON AREA OF RESIdENCE
as a %
87% ShARe Of car-Owning hOusehOlDs OuTsiDe The greaTer paris regiOn
1980 1990 1995 2000 2005 2010 2013
By socio-professional groupFarmers 87.3% 95.9% 98.9% 91.1% 100.0% 92.1% 91.8%Farm workers 72.6% 74.7% – – – – –Tradesmen, craftsmen, business owners 91.1% 95.2% 89.4% 90.6% 91.2% 91.1% 92.7%Self-employed professionals, executives 93.6% 94.4% 85.5% 84.6% 83.7% 84.1% 81.6%Middle management 90.2% 93.3% 88.7% 90.8% 87.6% 89.8% 89.3%White collar workers 75.4% 78.3% 75.9% 77.5% 80.9% 82.5% 82.0%Blue collar workers 80.4% 87.2% 89.7% 88.7% 89.1% 91.2% 89.7%Non-working population 39.6% 54.6% 65.8% 70.9% 72.8% 77.1% 77.7%of which retired persons – 59.4% 70.9% 76.0% 76.2% 80.1% 81.3%
By area of residenceRural areas 71.7% 82.1% 88.6% 91.1% 92.4% 92.7% 92.1%Towns with fewer than 20,000 inhabitants 69.6% 76.6% 84.7% 86.1% 88.4% 90.2% 90.5%Towns with 20,000 to 100,000 inhabitants 72.3% 77.3% 80.0% 84.2% 83.7% 87.1% 86.6%Towns with over 100,000 inhabitants 69.5% 74.2% 75.1% 76.6% 78.5% 80.8% 82.1%Greater Paris 69.3% 77.0%
60.8% 60.4% 61.5% 63.6% 62.7%Inner Paris 48.8% 47.3%
By location of residenceTown center – – 67.6% 69.4% 69.2% 73.0% 73.2%Suburb – – 79.3% 80.5% 80.9% 83.2% 82.0%Peri-urban area – – 88.5% 89.8% 91.2% 91.6% 91.7%Rural area – – 85.3% 90.4% 92.6% 94.8% 92.9%
By age of head of householdUnder 25 – – 51.2% 49.3% 63.3% 64.9% 69.1%25 to 34 – – 85.1% 82.4% 82.3% 83.9% 79.6%35 to 44 – – 86.7% 86.3% 87.5% 88.0% 87.1%45 to 54 – – 87.5% 87.4% 86.1% 88.1% 87.5%55 to 64 – – 84.9% 87.0% 86.7% 86.9% 85.2%Over 65 – – 61.9% 69.0% 70.8% 76.2% 79.3%
All 69.3% 76.5% 78.4% 80.3% 81.2% 83.5% 83.1%Vehicles with a woman as their main driver – – – 40.4% 40.7% 41.5% 41.5%
}
FRANCe
42_AnAlySiS And highlightS / Comité des ConstruCteurs Français d’automobiles
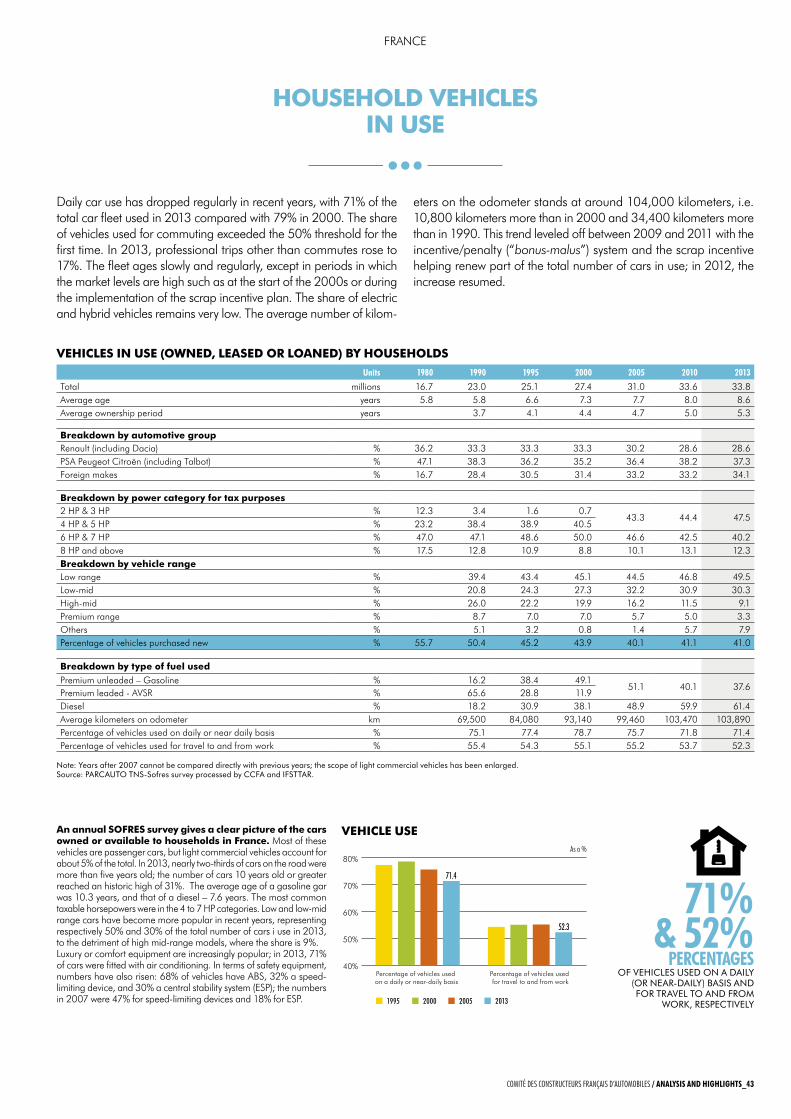
An annual SOFRES survey gives a clear picture of the cars owned or available to households in France. Most of these vehicles are passenger cars, but light commercial vehicles account for about 5% of the total. In 2013, nearly two-thirds of cars on the road were more than five years old; the number of cars 10 years old or greater reached an historic high of 31%. The average age of a gasoline gar was 10.3 years, and that of a diesel – 7.6 years. The most common taxable horsepowers were in the 4 to 7 HP categories. Low and low-mid range cars have become more popular in recent years, representing respectively 50% and 30% of the total number of cars i use in 2013, to the detriment of high mid-range models, where the share is 9%.Luxury or comfort equipment are increasingly popular; in 2013, 71% of cars were fitted with air conditioning. In terms of safety equipment, numbers have also risen: 68% of vehicles have ABS, 32% a speed-limiting device, and 30% a central stability system (eSP); the numbers in 2007 were 47% for speed-limiting devices and 18% for eSP.
Daily car use has dropped regularly in recent years, with 71% of the total car fleet used in 2013 compared with 79% in 2000. The share of vehicles used for commuting exceeded the 50% threshold for the first time. In 2013, professional trips other than commutes rose to 17%. The fleet ages slowly and regularly, except in periods in which the market levels are high such as at the start of the 2000s or during the implementation of the scrap incentive plan. The share of electric and hybrid vehicles remains very low. The average number of kilom-
eters on the odometer stands at around 104,000 kilometers, i.e. 10,800 kilometers more than in 2000 and 34,400 kilometers more than in 1990. This trend leveled off between 2009 and 2011 with the incentive/penalty (“bonus-malus”) system and the scrap incentive helping renew part of the total number of cars in use; in 2012, the increase resumed.
HOUSEHOLd vEHICLES IN USE
vEHICLES IN USE (OwNEd, LEASEd OR LOANEd) By HOUSEHOLdS
note: years after 2007 cannot be compared directly with previous years; the scope of light commercial vehicles has been enlarged. source: parcauTO Tns-sofres survey processed by ccfa and ifsTTar.
1995 2000 2005 2013
Percentage of vehicles used for travel to and from work
Percentage of vehicles used on a daily or near-daily basis
40%
50%
60%
70%
80%
71.4
52.3
vEHICLE USE
Units 1980 1990 1995 2000 2005 2010 2013
Total millions 16.7 23.0 25.1 27.4 31.0 33.6 33.8Average age years 5.8 5.8 6.6 7.3 7.7 8.0 8.6Average ownership period years 3.7 4.1 4.4 4.7 5.0 5.3
Breakdown by automotive groupRenault (including Dacia) % 36.2 33.3 33.3 33.3 30.2 28.6 28.6PSA Peugeot Citroën (including Talbot) % 47.1 38.3 36.2 35.2 36.4 38.2 37.3Foreign makes % 16.7 28.4 30.5 31.4 33.2 33.2 34.1
Breakdown by power category for tax purposes2 HP & 3 HP % 12.3 3.4 1.6 0.7
43.3 44.4 47.54 HP & 5 HP % 23.2 38.4 38.9 40.56 HP & 7 HP % 47.0 47.1 48.6 50.0 46.6 42.5 40.28 HP and above % 17.5 12.8 10.9 8.8 10.1 13.1 12.3Breakdown by vehicle rangeLow range % 39.4 43.4 45.1 44.5 46.8 49.5Low-mid % 20.8 24.3 27.3 32.2 30.9 30.3High-mid % 26.0 22.2 19.9 16.2 11.5 9.1Premium range % 8.7 7.0 7.0 5.7 5.0 3.3Others % 5.1 3.2 0.8 1.4 5.7 7.9Percentage of vehicles purchased new % 55.7 50.4 45.2 43.9 40.1 41.1 41.0
Breakdown by type of fuel usedPremium unleaded – Gasoline % 16.2 38.4 49.1
51.1 40.1 37.6Premium leaded - AVSR % 65.6 28.8 11.9Diesel % 18.2 30.9 38.1 48.9 59.9 61.4Average kilometers on odometer km 69,500 84,080 93,140 99,460 103,470 103,890Percentage of vehicles used on daily or near daily basis % 75.1 77.4 78.7 75.7 71.8 71.4Percentage of vehicles used for travel to and from work % 55.4 54.3 55.1 55.2 53.7 52.3
as a %
71% & 52%
PeRCentAgeSOf vehicles useD On a Daily
(Or near-Daily) basis anD fOr Travel TO anD frOm
wOrK, respecTively
FRANCe
Comité des ConstruCteurs Français d’automobiles / AnAlySiS And highlightS_43
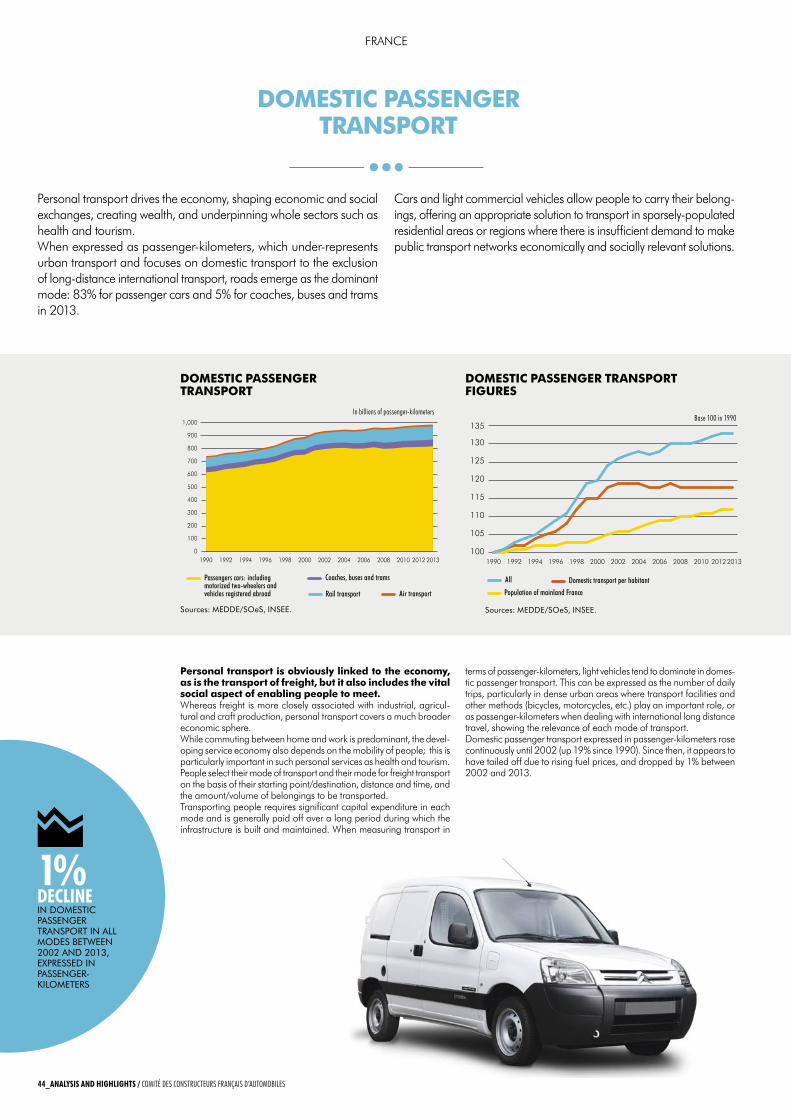
Passengers cars: including motorized two-wheelers and vehicles registered abroad
Coaches, buses and trams
Rail transport Air transport
0
100
200
300
400
500
600
700
800
900
1,000Transports aériens
Transports ferrés
Autobus, autocars et tramways
Voitures particulières : y compris deux-roues motorisées et véhicules immatriculés à l'étranger
2013201220102008200620042002200019981996199419921990100
105
110
115
120
125
130
135TIV par hab, 100 = 90
Pop Base 100 en 1990
TIV Base 100 en 90
2013201220102008200620042002200019981996199419921990
All Domestic transport per habitant
Population of mainland France
sources: meDDe/sOes, insee.
dOMESTIC PASSENgER TRANSPORT
dOMESTIC PASSENgER TRANSPORT FIgURES
in billions of passenger-kilometersbase 100 in 1990
sources: meDDe/sOes, insee.
Personal transport is obviously linked to the economy, as is the transport of freight, but it also includes the vital social aspect of enabling people to meet.Whereas freight is more closely associated with industrial, agricul-tural and craft production, personal transport covers a much broader economic sphere.While commuting between home and work is predominant, the devel-oping service economy also depends on the mobility of people; this is particularly important in such personal services as health and tourism.People select their mode of transport and their mode for freight transport on the basis of their starting point/destination, distance and time, and the amount/volume of belongings to be transported.Transporting people requires significant capital expenditure in each mode and is generally paid off over a long period during which the infrastructure is built and maintained. When measuring transport in
terms of passenger-kilometers, light vehicles tend to dominate in domes-tic passenger transport. This can be expressed as the number of daily trips, particularly in dense urban areas where transport facilities and other methods (bicycles, motorcycles, etc.) play an important role, or as passenger-kilometers when dealing with international long distance travel, showing the relevance of each mode of transport.Domestic passenger transport expressed in passenger-kilometers rose continuously until 2002 (up 19% since 1990). Since then, it appears to have tailed off due to rising fuel prices, and dropped by 1% between 2002 and 2013.
Personal transport drives the economy, shaping economic and social exchanges, creating wealth, and underpinning whole sectors such as health and tourism.When expressed as passenger-kilometers, which under-represents urban transport and focuses on domestic transport to the exclusion of long-distance international transport, roads emerge as the dominant mode: 83% for passenger cars and 5% for coaches, buses and trams in 2013.
Cars and light commercial vehicles allow people to carry their belong-ings, offering an appropriate solution to transport in sparsely-populated residential areas or regions where there is insufficient demand to make public transport networks economically and socially relevant solutions.
dOMESTIC PASSENgER TRANSPORT
FRANCe
44_AnAlySiS And highlightS / Comité des ConstruCteurs Français d’automobiles
1%deCline in DOmesTic passenger TranspOrT in all mODes beTween 2002 anD 2013, expresseD in passenger-KilOmeTers
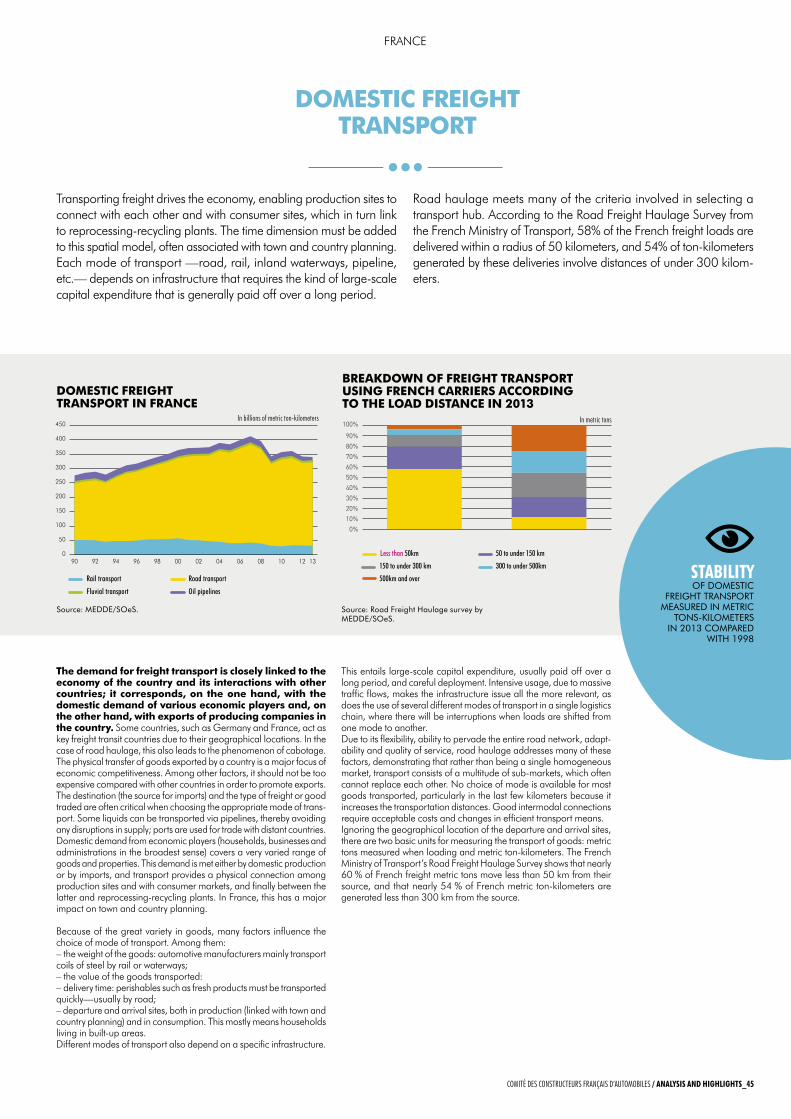
Rail transport Road transport
Fluvial transport Oil pipelines
Less than 50km 50 to under 150 km
150 to under 300 km
500km and over
300 to under 500km
0
50
100
150
200
250
300
350
400
450
Oléoducs
Transport fluvial
Transport routier
Transport ferroviaire
13121008060402009896949290
0%
10%
20%
30%
40%
50%
60%
70%
80%
90%
100%500 km et plus
300 à moins de 500 km
150 à moins de 300 km
50 à moins de 150 km
Moins de 50 km
source: meDDe/sOes.
dOMESTIC FREIgHT TRANSPORT IN FRANCE
BREAkdOwN OF FREIgHT TRANSPORT USINg FRENCH CARRIERS ACCORdINg TO THE LOAd dISTANCE IN 2013
in billions of metric ton-kilometers
source: road freight haulage survey by meDDe/sOes.
in metric tons
The demand for freight transport is closely linked to the economy of the country and its interactions with other countries; it corresponds, on the one hand, with the domestic demand of various economic players and, on the other hand, with exports of producing companies in the country. Some countries, such as Germany and France, act as key freight transit countries due to their geographical locations. In the case of road haulage, this also leads to the phenomenon of cabotage.The physical transfer of goods exported by a country is a major focus of economic competitiveness. Among other factors, it should not be too expensive compared with other countries in order to promote exports. The destination (the source for imports) and the type of freight or good traded are often critical when choosing the appropriate mode of trans-port. Some liquids can be transported via pipelines, thereby avoiding any disruptions in supply; ports are used for trade with distant countries.Domestic demand from economic players (households, businesses and administrations in the broadest sense) covers a very varied range of goods and properties. This demand is met either by domestic production or by imports, and transport provides a physical connection among production sites and with consumer markets, and finally between the latter and reprocessing-recycling plants. In France, this has a major impact on town and country planning.
Because of the great variety in goods, many factors influence the choice of mode of transport. Among them:– the weight of the goods: automotive manufacturers mainly transport coils of steel by rail or waterways;– the value of the goods transported:– delivery time: perishables such as fresh products must be transported quickly—usually by road;– departure and arrival sites, both in production (linked with town and country planning) and in consumption. This mostly means households living in built-up areas.Different modes of transport also depend on a specific infrastructure.
This entails large-scale capital expenditure, usually paid off over a long period, and careful deployment. Intensive usage, due to massive traffic flows, makes the infrastructure issue all the more relevant, as does the use of several different modes of transport in a single logistics chain, where there will be interruptions when loads are shifted from one mode to another.Due to its flexibility, ability to pervade the entire road network, adapt-ability and quality of service, road haulage addresses many of these factors, demonstrating that rather than being a single homogeneous market, transport consists of a multitude of sub-markets, which often cannot replace each other. No choice of mode is available for most goods transported, particularly in the last few kilometers because it increases the transportation distances. Good intermodal connections require acceptable costs and changes in efficient transport means.Ignoring the geographical location of the departure and arrival sites, there are two basic units for measuring the transport of goods: metric tons measured when loading and metric ton-kilometers. The French Ministry of Transport’s Road Freight Haulage Survey shows that nearly 60 % of French freight metric tons move less than 50 km from their source, and that nearly 54 % of French metric ton-kilometers are generated less than 300 km from the source.
StAbility Of DOmesTic
freighT TranspOrT measureD in meTric
TOns-KilOmeTers in 2013 cOmpareD
wiTh 1998
Transporting freight drives the economy, enabling production sites to connect with each other and with consumer sites, which in turn link to reprocessing-recycling plants. The time dimension must be added to this spatial model, often associated with town and country planning.each mode of transport —road, rail, inland waterways, pipeline, etc.— depends on infrastructure that requires the kind of large-scale capital expenditure that is generally paid off over a long period.
Road haulage meets many of the criteria involved in selecting a transport hub. According to the Road Freight Haulage Survey from the French Ministry of Transport, 58% of the French freight loads are delivered within a radius of 50 kilometers, and 54% of ton-kilometers generated by these deliveries involve distances of under 300 kilom-eters.
dOMESTIC FREIgHT TRANSPORT
FRANCe
Comité des ConstruCteurs Français d’automobiles / AnAlySiS And highlightS_45
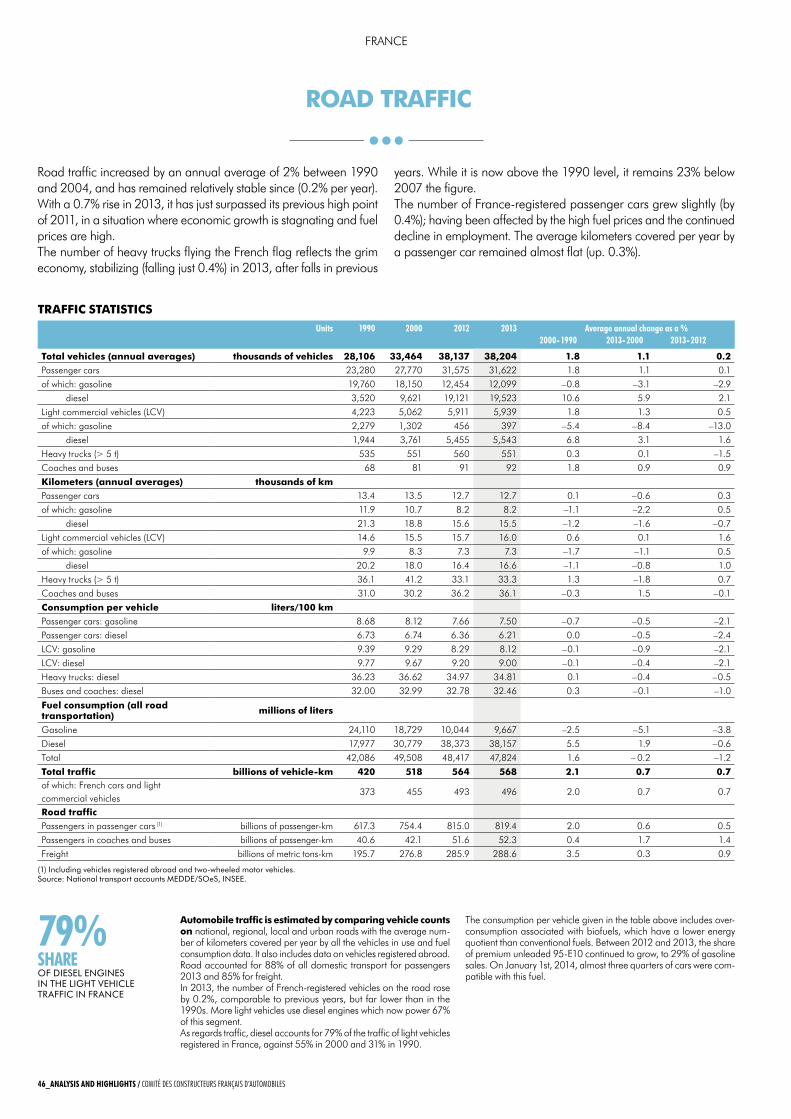
Road traffic increased by an annual average of 2% between 1990 and 2004, and has remained relatively stable since (0.2% per year).With a 0.7% rise in 2013, it has just surpassed its previous high point of 2011, in a situation where economic growth is stagnating and fuel prices are high.The number of heavy trucks flying the French flag reflects the grim economy, stabilizing (falling just 0.4%) in 2013, after falls in previous
years. While it is now above the 1990 level, it remains 23% below 2007 the figure.The number of France-registered passenger cars grew slightly (by 0.4%); having been affected by the high fuel prices and the continued decline in employment. The average kilometers covered per year by a passenger car remained almost flat (up. 0.3%).
ROAd TRAFFIC
79%ShARe Of Diesel engines in The lighT vehicle Traffic in france
Automobile traffic is estimated by comparing vehicle counts on national, regional, local and urban roads with the average num-ber of kilometers covered per year by all the vehicles in use and fuel consumption data. It also includes data on vehicles registered abroad.Road accounted for 88% of all domestic transport for passengers 2013 and 85% for freight.In 2013, the number of French-registered vehicles on the road rose by 0.2%, comparable to previous years, but far lower than in the 1990s. More light vehicles use diesel engines which now power 67% of this segment.As regards traffic, diesel accounts for 79% of the traffic of light vehicles registered in France, against 55% in 2000 and 31% in 1990.
The consumption per vehicle given in the table above includes over-consumption associated with biofuels, which have a lower energy quotient than conventional fuels. Between 2012 and 2013, the share of premium unleaded 95-e10 continued to grow, to 29% of gasoline sales. On January 1st, 2014, almost three quarters of cars were com-patible with this fuel.
Units 1990 2000 2012 2013 Average annual change as a %2000- 1990 2013- 2000 2013- 2012
Total vehicles (annual averages) thousands of vehicles 28,106 33,464 38,137 38,204 1.8 1.1 0.2Passenger cars 23,280 27,770 31,575 31,622 1.8 1.1 0.1of which: gasoline 19,760 18,150 12,454 12,099 –0.8 –3.1 –2.9
diesel 3,520 9,621 19,121 19,523 10.6 5.9 2.1Light commercial vehicles (LCV) 4,223 5,062 5,911 5,939 1.8 1.3 0.5of which: gasoline 2,279 1,302 456 397 –5.4 –8.4 –13.0
diesel 1,944 3,761 5,455 5,543 6.8 3.1 1.6Heavy trucks (> 5 t) 535 551 560 551 0.3 0.1 –1.5Coaches and buses 68 81 91 92 1.8 0.9 0.9
kilometers (annual averages) thousands of kmPassenger cars 13.4 13.5 12.7 12.7 0.1 –0.6 0.3of which: gasoline 11.9 10.7 8.2 8.2 –1.1 –2.2 0.5
diesel 21.3 18.8 15.6 15.5 –1.2 –1.6 –0.7Light commercial vehicles (LCV) 14.6 15.5 15.7 16.0 0.6 0.1 1.6of which: gasoline 9.9 8.3 7.3 7.3 –1.7 –1.1 0.5
diesel 20.2 18.0 16.4 16.6 –1.1 –0.8 1.0Heavy trucks (> 5 t) 36.1 41.2 33.1 33.3 1.3 –1.8 0.7Coaches and buses 31.0 30.2 36.2 36.1 –0.3 1.5 –0.1
Consumption per vehicle liters/100 kmPassenger cars: gasoline 8.68 8.12 7.66 7.50 –0.7 –0.5 –2.1Passenger cars: diesel 6.73 6.74 6.36 6.21 0.0 –0.5 –2.4LCV: gasoline 9.39 9.29 8.29 8.12 –0.1 –0.9 –2.1LCV: diesel 9.77 9.67 9.20 9.00 –0.1 –0.4 –2.1Heavy trucks: diesel 36.23 36.62 34.97 34.81 0.1 –0.4 –0.5Buses and coaches: diesel 32.00 32.99 32.78 32.46 0.3 –0.1 –1.0
Fuel consumption (all road transportation) millions of liters
Gasoline 24,110 18,729 10,044 9,667 –2.5 –5.1 –3.8Diesel 17,977 30,779 38,373 38,157 5.5 1.9 –0.6Total 42,086 49,508 48,417 47,824 1.6 – 0.2 –1.2
Total traffic billions of vehicle-km 420 518 564 568 2.1 0.7 0.7of which: French cars and light commercial vehicles
373 455 493 496 2.0 0.7 0.7
Road trafficPassengers in passenger cars (1) billions of passenger-km 617.3 754.4 815.0 819.4 2.0 0.6 0.5Passengers in coaches and buses billions of passenger-km 40.6 42.1 51.6 52.3 0.4 1.7 1.4Freight billions of metric tons-km 195.7 276.8 285.9 288.6 3.5 0.3 0.9
TRAFFIC STATISTICS
(1) including vehicles registered abroad and two-wheeled motor vehicles.source: national transport accounts meDDe/sOes, insee.
FRANCe
46_AnAlySiS And highlightS / Comité des ConstruCteurs Français d’automobiles
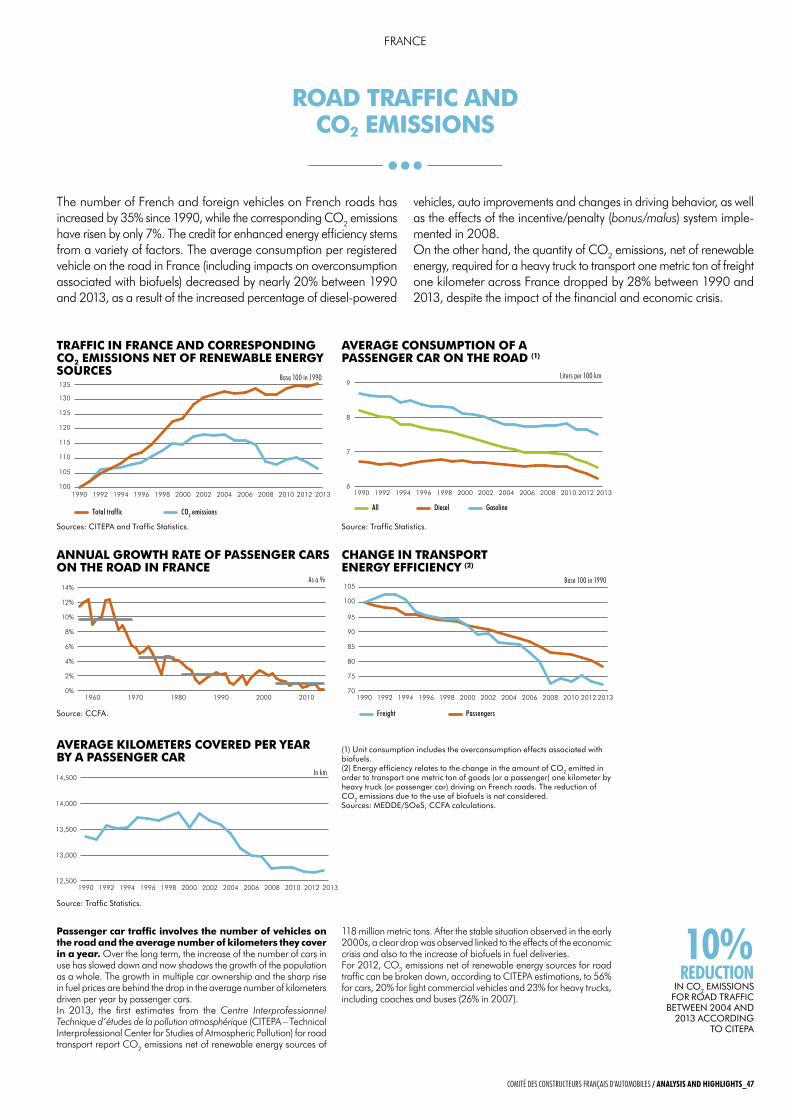
Passenger car traffic involves the number of vehicles on the road and the average number of kilometers they cover in a year. Over the long term, the increase of the number of cars in use has slowed down and now shadows the growth of the population as a whole. The growth in multiple car ownership and the sharp rise in fuel prices are behind the drop in the average number of kilometers driven per year by passenger cars.In 2013, the first estimates from the Centre Interprofessionnel Technique d’études de la pollution atmosphérique (CITePA – Technical Interprofessional Center for Studies of Atmospheric Pollution) for road transport report CO2 emissions net of renewable energy sources of
118 million metric tons. After the stable situation observed in the early 2000s, a clear drop was observed linked to the effects of the economic crisis and also to the increase of biofuels in fuel deliveries.For 2012, CO2 emissions net of renewable energy sources for road traffic can be broken down, according to CITePA estimations, to 56% for cars, 20% for light commercial vehicles and 23% for heavy trucks, including coaches and buses (26% in 2007).
The number of French and foreign vehicles on French roads has increased by 35% since 1990, while the corresponding CO2 emissions have risen by only 7%. The credit for enhanced energy efficiency stems from a variety of factors. The average consumption per registered vehicle on the road in France (including impacts on overconsumption associated with biofuels) decreased by nearly 20% between 1990 and 2013, as a result of the increased percentage of diesel-powered
vehicles, auto improvements and changes in driving behavior, as well as the effects of the incentive/penalty (bonus/malus) system imple-mented in 2008. On the other hand, the quantity of CO2 emissions, net of renewable energy, required for a heavy truck to transport one metric ton of freight one kilometer across France dropped by 28% between 1990 and 2013, despite the impact of the financial and economic crisis.
ROAd TRAFFIC ANd CO2 EMISSIONS
10% RedUCtion
in cO2 emissiOns fOr rOaD Traffic
beTween 2004 anD 2013 accOrDing
TO ciTepa
100
105
110
115
120
125
130
135Émissions CO2 en base 100 en 1990
Circu totale yc véh ét, base 100 en 1990
2013201220102008200620042002200019981996199419921990
Total traffic
All Diesel Gasoline
CO2 emissions
Freight Passengers
0%
2%
4%
6%
8%
10%
12%
14%Tx croissance Parc Vp
Tx croissance Parc Vp
201020001990198019701960
12,500
13,000
13,500
14,000
14,500KAM VP
2013201220102008200620042002200019981996199419921990
70
75
80
85
90
95
100
105voyageurs
marchandises
2013201220102008200620042002200019981996199419921990
6
7
8
9Gazole
Essence
Ensemble
2013201220102008200620042002200019981996199419921990
100
105
110
115
120
125
130
135Émissions CO2 en base 100 en 1990
Circu totale yc véh ét, base 100 en 1990
2013201220102008200620042002200019981996199419921990
Total traffic
All Diesel Gasoline
CO2 emissions
Freight Passengers
0%
2%
4%
6%
8%
10%
12%
14%Tx croissance Parc Vp
Tx croissance Parc Vp
201020001990198019701960
12,500
13,000
13,500
14,000
14,500KAM VP
2013201220102008200620042002200019981996199419921990
70
75
80
85
90
95
100
105voyageurs
marchandises
2013201220102008200620042002200019981996199419921990
6
7
8
9Gazole
Essence
Ensemble
2013201220102008200620042002200019981996199419921990
AvERAgE CONSUMPTION OF A PASSENgER CAR ON THE ROAd (1)
AvERAgE kILOMETERS COvEREd PER yEAR By A PASSENgER CAR
in km
TRAFFIC IN FRANCE ANd CORRESPONdINg CO2 EMISSIONS NET OF RENEwABLE ENERgy SOURCES
100
105
110
115
120
125
130
135Émissions CO2 en base 100 en 1990
Circu totale yc véh ét, base 100 en 1990
2013201220102008200620042002200019981996199419921990
Total traffic
All Diesel Gasoline
CO2 emissions
Freight Passengers
0%
2%
4%
6%
8%
10%
12%
14%Tx croissance Parc Vp
Tx croissance Parc Vp
201020001990198019701960
12,500
13,000
13,500
14,000
14,500KAM VP
2013201220102008200620042002200019981996199419921990
70
75
80
85
90
95
100
105voyageurs
marchandises
2013201220102008200620042002200019981996199419921990
6
7
8
9Gazole
Essence
Ensemble
2013201220102008200620042002200019981996199419921990
sources: ciTepa and Traffic statistics. source: Traffic statistics.
(1) unit consumption includes the overconsumption effects associated with biofuels.(2) energy efficiency relates to the change in the amount of cO2 emitted in order to transport one metric ton of goods (or a passenger) one kilometer by heavy truck (or passenger car) driving on french roads. The reduction of cO2 emissions due to the use of biofuels is not considered.sources: meDDe/sOes, ccfa calculations.
source: Traffic statistics.
liters per 100 kmbase 100 in 1990
100
105
110
115
120
125
130
135Émissions CO2 en base 100 en 1990
Circu totale yc véh ét, base 100 en 1990
2013201220102008200620042002200019981996199419921990
Total traffic
All Diesel Gasoline
CO2 emissions
Freight Passengers
0%
2%
4%
6%
8%
10%
12%
14%Tx croissance Parc Vp
Tx croissance Parc Vp
201020001990198019701960
12,500
13,000
13,500
14,000
14,500KAM VP
2013201220102008200620042002200019981996199419921990
70
75
80
85
90
95
100
105voyageurs
marchandises
2013201220102008200620042002200019981996199419921990
6
7
8
9Gazole
Essence
Ensemble
2013201220102008200620042002200019981996199419921990
CHANgE IN TRANSPORT ENERgy EFFICIENCy (2)
100
105
110
115
120
125
130
135Émissions CO2 en base 100 en 1990
Circu totale yc véh ét, base 100 en 1990
2013201220102008200620042002200019981996199419921990
Total traffic
All Diesel Gasoline
CO2 emissions
Freight Passengers
0%
2%
4%
6%
8%
10%
12%
14%Tx croissance Parc Vp
Tx croissance Parc Vp
201020001990198019701960
12,500
13,000
13,500
14,000
14,500KAM VP
2013201220102008200620042002200019981996199419921990
70
75
80
85
90
95
100
105voyageurs
marchandises
2013201220102008200620042002200019981996199419921990
6
7
8
9Gazole
Essence
Ensemble
2013201220102008200620042002200019981996199419921990
ANNUAL gROwTH RATE OF PASSENgER CARS ON THE ROAd IN FRANCE
source: ccfa.
base 100 in 1990as a %
FRANCe
Comité des ConstruCteurs Français d’automobiles / AnAlySiS And highlightS_47
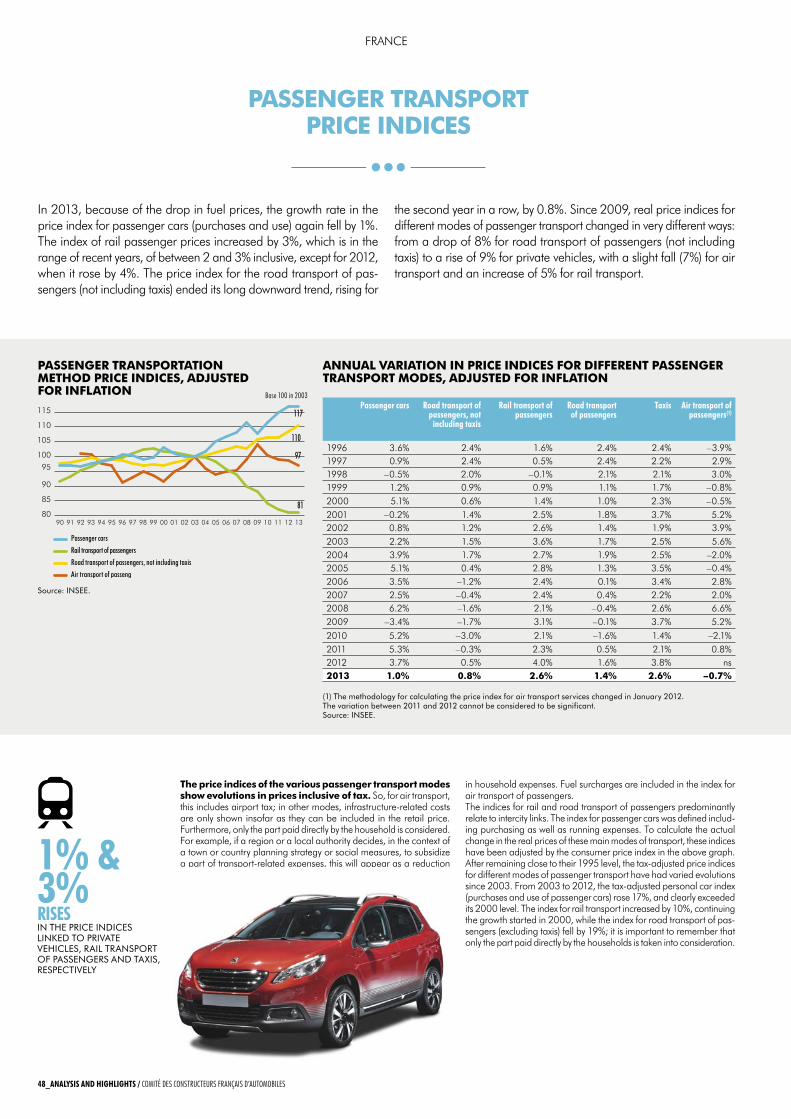
The price indices of the various passenger transport modes show evolutions in prices inclusive of tax. So, for air transport, this includes airport tax; in other modes, infrastructure-related costs are only shown insofar as they can be included in the retail price. Furthermore, only the part paid directly by the household is considered. For example, if a region or a local authority decides, in the context of a town or country planning strategy or social measures, to subsidize a part of transport-related expenses, this will appear as a reduction
in household expenses. Fuel surcharges are included in the index for air transport of passengers. The indices for rail and road transport of passengers predominantly relate to intercity links. The index for passenger cars was defined includ-ing purchasing as well as running expenses. To calculate the actual change in the real prices of these main modes of transport, these indices have been adjusted by the consumer price index in the above graph.After remaining close to their 1995 level, the tax-adjusted price indices for different modes of passenger transport have had varied evolutions since 2003. From 2003 to 2012, the tax-adjusted personal car index (purchases and use of passenger cars) rose 17%, and clearly exceeded its 2000 level. The index for rail transport increased by 10%, continuing the growth started in 2000, while the index for road transport of pas-sengers (excluding taxis) fell by 19%; it is important to remember that only the part paid directly by the households is taken into consideration.
In 2013, because of the drop in fuel prices, the growth rate in the price index for passenger cars (purchases and use) again fell by 1%. The index of rail passenger prices increased by 3%, which is in the range of recent years, of between 2 and 3% inclusive, except for 2012, when it rose by 4%. The price index for the road transport of pas-sengers (not including taxis) ended its long downward trend, rising for
the second year in a row, by 0.8%. Since 2009, real price indices for different modes of passenger transport changed in very different ways: from a drop of 8% for road transport of passengers (not including taxis) to a rise of 9% for private vehicles, with a slight fall (7%) for air transport and an increase of 5% for rail transport.
PASSENgER TRANSPORTATION METHOd PRICE INdICES, AdjUSTEd FOR INFLATION
ANNUAL vARIATION IN PRICE INdICES FOR dIFFERENT PASSENgER TRANSPORT MOdES, AdjUSTEd FOR INFLATION
80
85
90
95
100
105
110
115Transports aériens de voyageurs
Transports ferroviaires de voyageurs
Transports routiers de voyageurs, hors taxi
Véhicules personnels
131211100908070605040302010099989796959493929190
Passenger cars
Road transport of passengers, not including taxis
Rail transport of passengers
Air transport of passengers(1)
117
110
97
81
base 100 in 2003
as a %
source: insee.
Passenger cars Road transport of passengers, not including taxis
Rail transport of passengers
Road transport of passengers
taxis Air transport of passengers(1)
1996 3.6% 2.4% 1.6% 2.4% 2.4% –3.9%1997 0.9% 2.4% 0.5% 2.4% 2.2% 2.9%1998 –0.5% 2.0% –0.1% 2.1% 2.1% 3.0%1999 1.2% 0.9% 0.9% 1.1% 1.7% –0.8%2000 5.1% 0.6% 1.4% 1.0% 2.3% –0.5%2001 –0.2% 1.4% 2.5% 1.8% 3.7% 5.2%2002 0.8% 1.2% 2.6% 1.4% 1.9% 3.9%2003 2.2% 1.5% 3.6% 1.7% 2.5% 5.6%2004 3.9% 1.7% 2.7% 1.9% 2.5% –2.0%2005 5.1% 0.4% 2.8% 1.3% 3.5% –0.4%2006 3.5% –1.2% 2.4% 0.1% 3.4% 2.8%2007 2.5% –0.4% 2.4% 0.4% 2.2% 2.0%2008 6.2% –1.6% 2.1% –0.4% 2.6% 6.6%2009 –3.4% –1.7% 3.1% –0.1% 3.7% 5.2%2010 5.2% –3.0% 2.1% –1.6% 1.4% –2.1%2011 5.3% –0.3% 2.3% 0.5% 2.1% 0.8%2012 3.7% 0.5% 4.0% 1.6% 3.8% ns2013 1.0% 0.8% 2.6% 1.4% 2.6% –0.7%
(1) The methodology for calculating the price index for air transport services changed in January 2012. The variation between 2011 and 2012 cannot be considered to be significant.source: insee.
1% & 3% RiSeS in The price inDices linKeD TO privaTe vehicles, rail TranspOrT Of passengers anD Taxis, respecTively
PASSENgER TRANSPORT PRICE INdICES
FRANCe
48_AnAlySiS And highlightS / Comité des ConstruCteurs Français d’automobiles
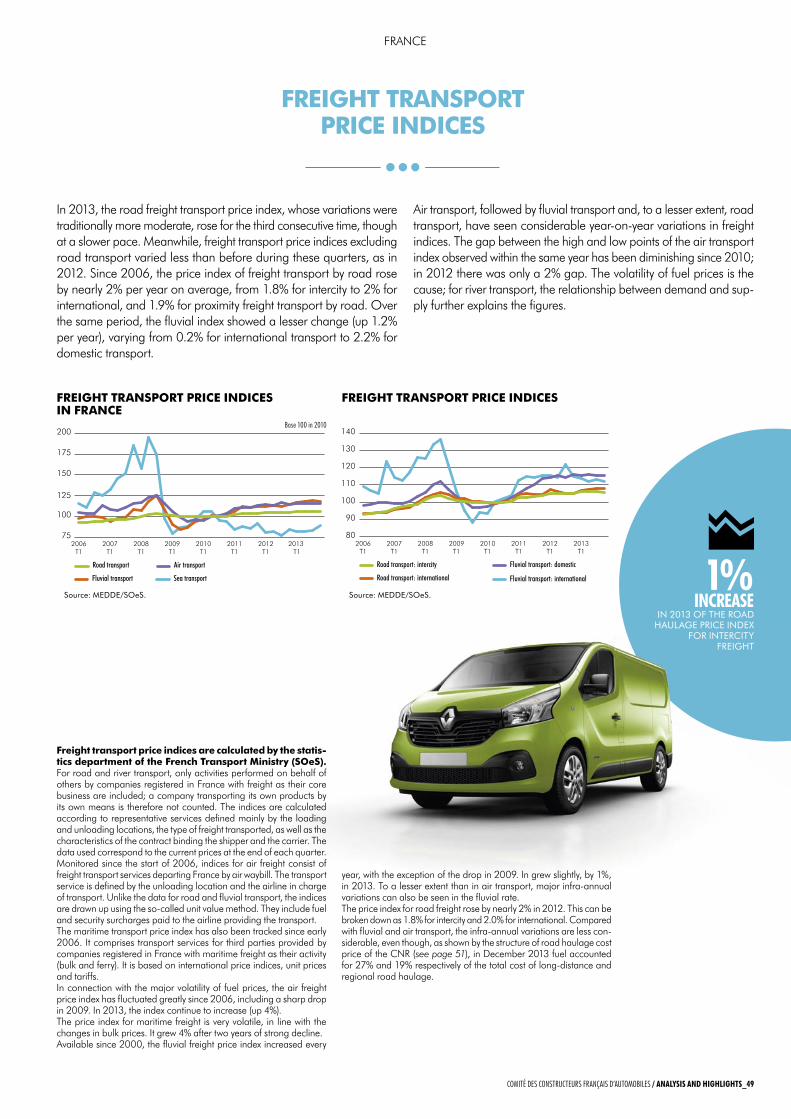
FREIgHT TRANSPORT PRICE INdICES
In 2013, the road freight transport price index, whose variations were traditionally more moderate, rose for the third consecutive time, though at a slower pace. Meanwhile, freight transport price indices excluding road transport varied less than before during these quarters, as in 2012. Since 2006, the price index of freight transport by road rose by nearly 2% per year on average, from 1.8% for intercity to 2% for international, and 1.9% for proximity freight transport by road. Over the same period, the fluvial index showed a lesser change (up 1.2% per year), varying from 0.2% for international transport to 2.2% for domestic transport.
Air transport, followed by fluvial transport and, to a lesser extent, road transport, have seen considerable year-on-year variations in freight indices. The gap between the high and low points of the air transport index observed within the same year has been diminishing since 2010; in 2012 there was only a 2% gap. The volatility of fuel prices is the cause; for river transport, the relationship between demand and sup-ply further explains the figures.
FREIgHT TRANSPORT PRICE INdICES IN FRANCE
FREIgHT TRANSPORT PRICE INdICES
75
100
125
150
175
200Maritime
Aérien
Fluvial
Routier
2013 T1
2012T1
2011T1
2010T1
2009T1
2008T1
2007T1
2006T1
80
90
100
110
120
130
140International
National
International
Interurbain
2013T1
2012T1
2011T1
2010T1
2009T1
2008T1
2007T1
2006T1
Road transport Air transport
Fluvial transport Sea transport
Road transport: intercity
Road transport: international
Fluvial transport: domestic
Fluvial transport: international
base 100 in 2010
source: meDDe/sOes. source: meDDe/sOes.1%
inCReASe in 2013 Of The rOaD
haulage price inDex fOr inTerciTy
freighT
Freight transport price indices are calculated by the statis-tics department of the French Transport Ministry (SOeS). For road and river transport, only activities performed on behalf of others by companies registered in France with freight as their core business are included; a company transporting its own products by its own means is therefore not counted. The indices are calculated according to representative services defined mainly by the loading and unloading locations, the type of freight transported, as well as the characteristics of the contract binding the shipper and the carrier. The data used correspond to the current prices at the end of each quarter.Monitored since the start of 2006, indices for air freight consist of freight transport services departing France by air waybill. The transport service is defined by the unloading location and the airline in charge of transport. Unlike the data for road and fluvial transport, the indices are drawn up using the so-called unit value method. They include fuel and security surcharges paid to the airline providing the transport.The maritime transport price index has also been tracked since early 2006. It comprises transport services for third parties provided by companies registered in France with maritime freight as their activity (bulk and ferry). It is based on international price indices, unit prices and tariffs.In connection with the major volatility of fuel prices, the air freight price index has fluctuated greatly since 2006, including a sharp drop in 2009. In 2013, the index continue to increase (up 4%).The price index for maritime freight is very volatile, in line with the changes in bulk prices. It grew 4% after two years of strong decline.Available since 2000, the fluvial freight price index increased every
year, with the exception of the drop in 2009. In grew slightly, by 1%, in 2013. To a lesser extent than in air transport, major infra-annual variations can also be seen in the fluvial rate.The price index for road freight rose by nearly 2% in 2012. This can be broken down as 1.8% for intercity and 2.0% for international. Compared with fluvial and air transport, the infra-annual variations are less con-siderable, even though, as shown by the structure of road haulage cost price of the CNR (see page 51), in December 2013 fuel accounted for 27% and 19% respectively of the total cost of long-distance and regional road haulage.
FRANCe
Comité des ConstruCteurs Français d’automobiles / AnAlySiS And highlightS_49
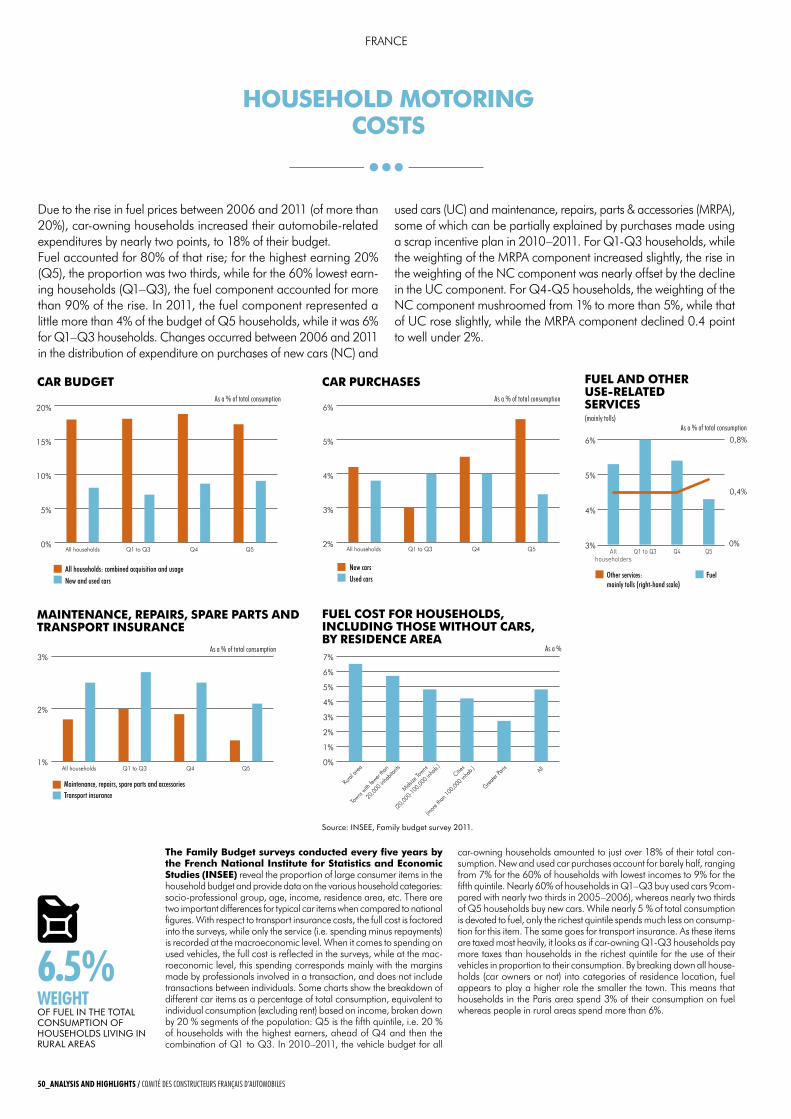
0%
5%
10%
15%
20%
New and used carsAll households: combined acquisition and usage
Q5Q4Q1 to Q3All households
1%
2%
3%
Transport insuranceMaintenance, repairs, spare parts and accessories
Q5Q4Q1 to Q3All households0%
1%
2%
3%
4%
5%
6%
7%
2%
3%
4%
5%
6%
Used carsNew cars
Q5Q4Q1 to Q3All households
3%
4%
5%
6%
Fuel
Q5Q4Q1 to Q3Allhouseholders
Other services: mainly tolls (right-hand scale)
All
Greater
Paris
Cities
(more
than
100,0
00 in
hab.)
M
idsize
Towns
(20,00
0-10
0,000
inha
b.)
Towns
with fe
wer tha
n
20,00
0 inh
abita
nts
Rural
area
0%
0,4%
0,8%
0%
5%
10%
15%
20%
New and used carsAll households: combined acquisition and usage
Q5Q4Q1 to Q3All households
1%
2%
3%
Transport insuranceMaintenance, repairs, spare parts and accessories
Q5Q4Q1 to Q3All households0%
1%
2%
3%
4%
5%
6%
7%
2%
3%
4%
5%
6%
Used carsNew cars
Q5Q4Q1 to Q3All households
3%
4%
5%
6%
Fuel
Q5Q4Q1 to Q3Allhouseholders
Other services: mainly tolls (right-hand scale)
All
Greater
Paris
Cities
(more
than
100,0
00 in
hab.)
M
idsize
Towns
(20,00
0-10
0,000
inha
b.)
Towns
with fe
wer tha
n
20,00
0 inh
abita
nts
Rural
area
0%
0,4%
0,8%
CAR BUdgET CAR PURCHASESas a % of total consumption as a % of total consumption
MAINTENANCE, REPAIRS, SPARE PARTS ANd TRANSPORT INSURANCE
FUEL ANd OTHER USE-RELATEd SERvICES(mainly tolls)
as a % of total consumption
as a % of total consumption
FUEL COST FOR HOUSEHOLdS, INCLUdINg THOSE wITHOUT CARS, By RESIdENCE AREA
source: insee, family budget survey 2011.
as a %
Due to the rise in fuel prices between 2006 and 2011 (of more than 20%), car-owning households increased their automobile-related expenditures by nearly two points, to 18% of their budget.Fuel accounted for 80% of that rise; for the highest earning 20% (Q5), the proportion was two thirds, while for the 60% lowest earn-ing households (Q1–Q3), the fuel component accounted for more than 90% of the rise. In 2011, the fuel component represented a little more than 4% of the budget of Q5 households, while it was 6% for Q1–Q3 households. Changes occurred between 2006 and 2011 in the distribution of expenditure on purchases of new cars (NC) and
used cars (UC) and maintenance, repairs, parts & accessories (MRPA), some of which can be partially explained by purchases made using a scrap incentive plan in 2010–2011. For Q1-Q3 households, while the weighting of the MRPA component increased slightly, the rise in the weighting of the NC component was nearly offset by the decline in the UC component. For Q4-Q5 households, the weighting of the NC component mushroomed from 1% to more than 5%, while that of UC rose slightly, while the MRPA component declined 0.4 point to well under 2%.
HOUSEHOLd MOTORINg COSTS
6.5%weight Of fuel in The TOTal cOnsumpTiOn Of hOusehOlDs living in rural areas
The Family Budget surveys conducted every five years by the French National Institute for Statistics and Economic Studies (INSEE) reveal the proportion of large consumer items in the household budget and provide data on the various household categories: socio-professional group, age, income, residence area, etc. There are two important differences for typical car items when compared to national figures. With respect to transport insurance costs, the full cost is factored into the surveys, while only the service (i.e. spending minus repayments) is recorded at the macroeconomic level. When it comes to spending on used vehicles, the full cost is reflected in the surveys, while at the mac-roeconomic level, this spending corresponds mainly with the margins made by professionals involved in a transaction, and does not include transactions between individuals. Some charts show the breakdown of different car items as a percentage of total consumption, equivalent to individual consumption (excluding rent) based on income, broken down by 20 % segments of the population: Q5 is the fifth quintile, i.e. 20 % of households with the highest earners, ahead of Q4 and then the combination of Q1 to Q3. In 2010–2011, the vehicle budget for all
car-owning households amounted to just over 18% of their total con-sumption. New and used car purchases account for barely half, ranging from 7% for the 60% of households with lowest incomes to 9% for the fifth quintile. Nearly 60% of households in Q1–Q3 buy used cars 9com-pared with nearly two thirds in 2005–2006), whereas nearly two thirds of Q5 households buy new cars. While nearly 5 % of total consumption is devoted to fuel, only the richest quintile spends much less on consump-tion for this item. The same goes for transport insurance. As these items are taxed most heavily, it looks as if car-owning Q1-Q3 households pay more taxes than households in the richest quintile for the use of their vehicles in proportion to their consumption. By breaking down all house-holds (car owners or not) into categories of residence location, fuel appears to play a higher role the smaller the town. This means that households in the Paris area spend 3% of their consumption on fuel whereas people in rural areas spend more than 6%.
FRANCe
50_AnAlySiS And highlightS / Comité des ConstruCteurs Français d’automobiles
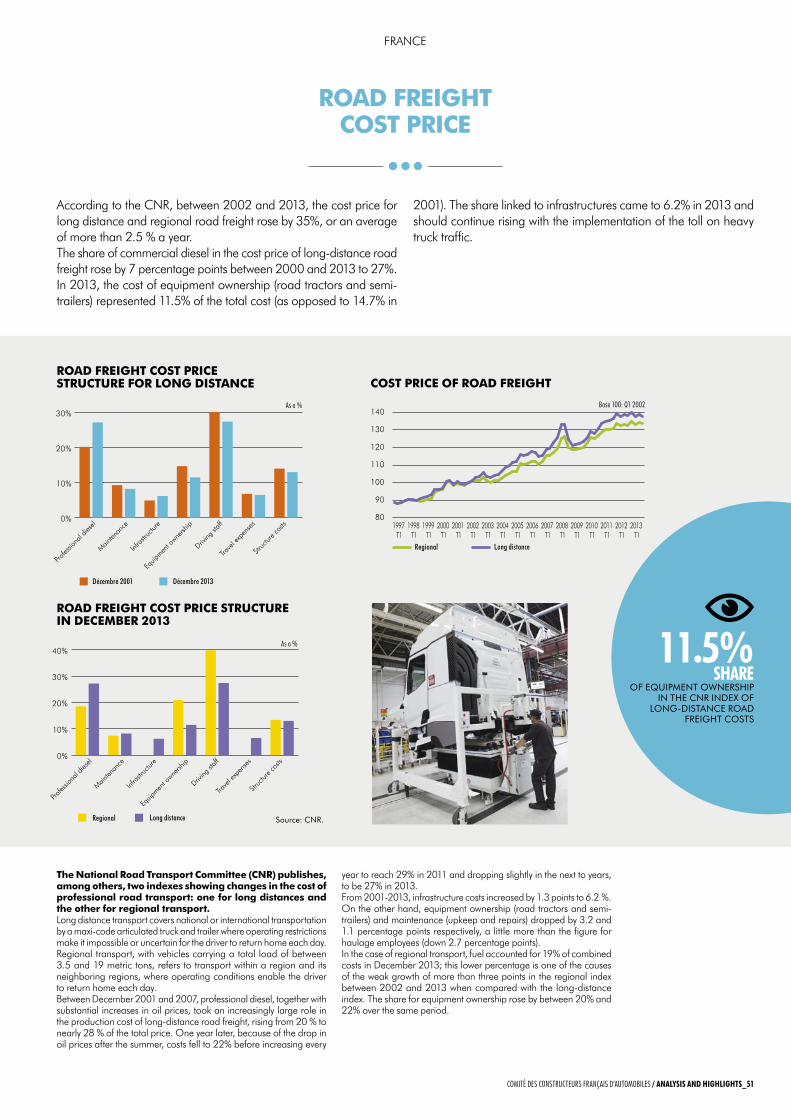
The National Road Transport Committee (CNR) publishes, among others, two indexes showing changes in the cost of professional road transport: one for long distances and the other for regional transport.Long distance transport covers national or international transportation by a maxi-code articulated truck and trailer where operating restrictions make it impossible or uncertain for the driver to return home each day.Regional transport, with vehicles carrying a total load of between 3.5 and 19 metric tons, refers to transport within a region and its neighboring regions, where operating conditions enable the driver to return home each day.Between December 2001 and 2007, professional diesel, together with substantial increases in oil prices, took an increasingly large role in the production cost of long-distance road freight, rising from 20 % to nearly 28 % of the total price. One year later, because of the drop in oil prices after the summer, costs fell to 22% before increasing every
year to reach 29% in 2011 and dropping slightly in the next to years, to be 27% in 2013.From 2001-2013, infrastructure costs increased by 1.3 points to 6.2 %.On the other hand, equipment ownership (road tractors and semi-trailers) and maintenance (upkeep and repairs) dropped by 3.2 and 1.1 percentage points respectively, a little more than the figure for haulage employees (down 2.7 percentage points).In the case of regional transport, fuel accounted for 19% of combined costs in December 2013; this lower percentage is one of the causes of the weak growth of more than three points in the regional index between 2002 and 2013 when compared with the long-distance index. The share for equipment ownership rose by between 20% and 22% over the same period.
According to the CNR, between 2002 and 2013, the cost price for long distance and regional road freight rose by 35%, or an average of more than 2.5 % a year.The share of commercial diesel in the cost price of long-distance road freight rose by 7 percentage points between 2000 and 2013 to 27%.In 2013, the cost of equipment ownership (road tractors and semi-trailers) represented 11.5% of the total cost (as opposed to 14.7% in
2001). The share linked to infrastructures came to 6.2% in 2013 and should continue rising with the implementation of the toll on heavy truck traffic.
ROAd FREIgHT COST PRICE
0%
10%
20%
30%
0%
10%
20%
30%
40%
Longue distance
Régional
80
90
100
110
120
130
140
2013 T1
2012 T1
2011 T1
2010 T1
2009 T1
2008 T1
2007 T1
2006 T1
2005 T1
2004 T1
2003 T1
2002 T1
2001 T1
2000 T1
1999 T1
1998 T1
1997 T1
Struc
ture c
osts
Trave
l exp
ense
s
Driving
staff
Equip
ment o
wnersh
ip
Infra
struc
ture
Mainten
ance
Profes
siona
l dies
el
Struc
ture c
osts
Trave
l exp
ense
s
Driving
staff
Equip
ment o
wnersh
ip
Infra
struc
ture
Mainten
ance
Profes
siona
l dies
el
Décembre 2013Décembre 2001
Long distanceRegional
Regional Long distance
0%
10%
20%
30%
0%
10%
20%
30%
40%
Longue distance
Régional
80
90
100
110
120
130
140
2013 T1
2012 T1
2011 T1
2010 T1
2009 T1
2008 T1
2007 T1
2006 T1
2005 T1
2004 T1
2003 T1
2002 T1
2001 T1
2000 T1
1999 T1
1998 T1
1997 T1
Struc
ture c
osts
Trave
l exp
ense
s
Driving
staff
Equip
ment o
wnersh
ip
Infra
struc
ture
Mainten
ance
Profes
siona
l dies
el
Struc
ture c
osts
Trave
l exp
ense
s
Driving
staff
Equip
ment o
wnersh
ip
Infra
struc
ture
Mainten
ance
Profes
siona
l dies
el
Décembre 2013Décembre 2001
Long distanceRegional
Regional Long distance
ROAd FREIgHT COST PRICE STRUCTURE FOR LONg dISTANCE
ROAd FREIgHT COST PRICE STRUCTURE IN dECEMBER 2013
source: cnr.
COST PRICE OF ROAd FREIgHT
base 100: Q1 2002as a %
as a % 11.5% ShARe
Of equipmenT Ownership in The cnr inDex Of
lOng-DisTance rOaD freighT cOsTs
FRANCe
Comité des ConstruCteurs Français d’automobiles / AnAlySiS And highlightS_51
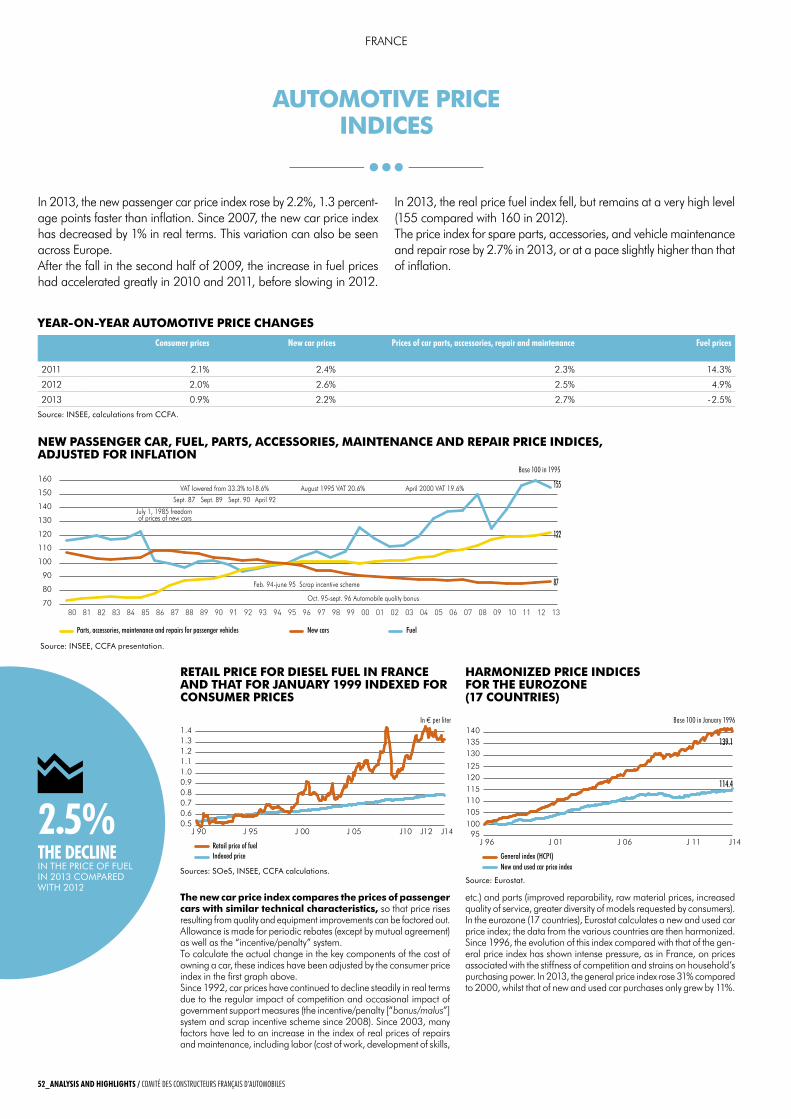
The new car price index compares the prices of passenger cars with similar technical characteristics, so that price rises resulting from quality and equipment improvements can be factored out. Allowance is made for periodic rebates (except by mutual agreement) as well as the “incentive/penalty” system.To calculate the actual change in the key components of the cost of owning a car, these indices have been adjusted by the consumer price index in the first graph above.Since 1992, car prices have continued to decline steadily in real terms due to the regular impact of competition and occasional impact of government support measures (the incentive/penalty [“bonus/malus”] system and scrap incentive scheme since 2008). Since 2003, many factors have led to an increase in the index of real prices of repairs and maintenance, including labor (cost of work, development of skills,
etc.) and parts (improved reparability, raw material prices, increased quality of service, greater diversity of models requested by consumers).In the eurozone (17 countries), eurostat calculates a new and used car price index; the data from the various countries are then harmonized. Since 1996, the evolution of this index compared with that of the gen-eral price index has shown intense pressure, as in France, on prices associated with the stiffness of competition and strains on household’s purchasing power. In 2013, the general price index rose 31% compared to 2000, whilst that of new and used car purchases only grew by 11%.
In 2013, the new passenger car price index rose by 2.2%, 1.3 percent-age points faster than inflation. Since 2007, the new car price index has decreased by 1% in real terms. This variation can also be seen across europe. After the fall in the second half of 2009, the increase in fuel prices had accelerated greatly in 2010 and 2011, before slowing in 2012.
In 2013, the real price fuel index fell, but remains at a very high level (155 compared with 160 in 2012). The price index for spare parts, accessories, and vehicle maintenance and repair rose by 2.7% in 2013, or at a pace slightly higher than that of inflation.
Consumer prices new car prices Prices of car parts, accessories, repair and maintenance Fuel prices
2011 2.1% 2.4% 2.3% 14.3%
2012 2.0% 2.6% 2.5% 4.9%
2013 0.9% 2.2% 2.7% - 2.5%
source: insee, calculations from ccfa.
NEw PASSENgER CAR, FUEL, PARTS, ACCESSORIES, MAINTENANCE ANd REPAIR PRICE INdICES, AdjUSTEd FOR INFLATION
0.50.60.70.80.91.01.11.21.31.4
J14J12J10J 05J 00J 95J 90
95100105110115120125
130135140
J14J 11J 06J 01J 96
Retail price of fuelIndexed price
114.4
General index (HCPI)New and used car price index
139.1
70
80
90
100
110
120
130
140
150
160DEPESSENCE BASE 100 = 1995
DEPUTIL RÉEL BASE 100 = 1995
AUTO RÉEL BASE 100 = 1995
13121110090807060504030201009998979695949392919089888786858483828180
July 1, 1985 freedom of prices of new cars
VAT lowered from 33.3% to18.6% August 1995 VAT 20.6%
Feb. 94-june 95 Scrap incentive scheme
April 2000 VAT 19.6%
Oct. 95-sept. 96 Automobile quality bonus
Sept. 87 Sept. 89 Sept. 90 April 92
Parts, accessories, maintenance and repairs for passenger vehicles New cars Fuel
87
122
155
source: insee, ccfa presentation.
RETAIL PRICE FOR dIESEL FUEL IN FRANCE ANd THAT FOR jANUARy 1999 INdEXEd FOR CONSUMER PRICES
0.50.60.70.80.91.01.11.21.31.4
J14J12J10J 05J 00J 95J 90
95100105110115120125
130135140
J14J 11J 06J 01J 96
Retail price of fuelIndexed price
114.4
General index (HCPI)New and used car price index
139.1
70
80
90
100
110
120
130
140
150
160DEPESSENCE BASE 100 = 1995
DEPUTIL RÉEL BASE 100 = 1995
AUTO RÉEL BASE 100 = 1995
13121110090807060504030201009998979695949392919089888786858483828180
July 1, 1985 freedom of prices of new cars
VAT lowered from 33.3% to18.6% August 1995 VAT 20.6%
Feb. 94-june 95 Scrap incentive scheme
April 2000 VAT 19.6%
Oct. 95-sept. 96 Automobile quality bonus
Sept. 87 Sept. 89 Sept. 90 April 92
Parts, accessories, maintenance and repairs for passenger vehicles New cars Fuel
87
122
155
sources: sOes, insee, ccfa calculations.
HARMONIzEd PRICE INdICES FOR THE EUROzONE (17 COUNTRIES)
0.50.60.70.80.91.01.11.21.31.4
J14J12J10J 05J 00J 95J 90
95100105110115120125
130135140
J14J 11J 06J 01J 96
Retail price of fuelIndexed price
114.4
General index (HCPI)New and used car price index
139.1
70
80
90
100
110
120
130
140
150
160DEPESSENCE BASE 100 = 1995
DEPUTIL RÉEL BASE 100 = 1995
AUTO RÉEL BASE 100 = 1995
13121110090807060504030201009998979695949392919089888786858483828180
July 1, 1985 freedom of prices of new cars
VAT lowered from 33.3% to18.6% August 1995 VAT 20.6%
Feb. 94-june 95 Scrap incentive scheme
April 2000 VAT 19.6%
Oct. 95-sept. 96 Automobile quality bonus
Sept. 87 Sept. 89 Sept. 90 April 92
Parts, accessories, maintenance and repairs for passenger vehicles New cars Fuel
87
122
155
source: eurostat.
base 100 in January 1996
base 100 in 1995
AUTOMOTIvE PRICE INdICES
2.5% the deCline in The price Of fuel in 2013 cOmpareD wiTh 2012
yEAR-ON-yEAR AUTOMOTIvE PRICE CHANgES
in € per liter
FRANCe
52_AnAlySiS And highlightS / Comité des ConstruCteurs Français d’automobiles
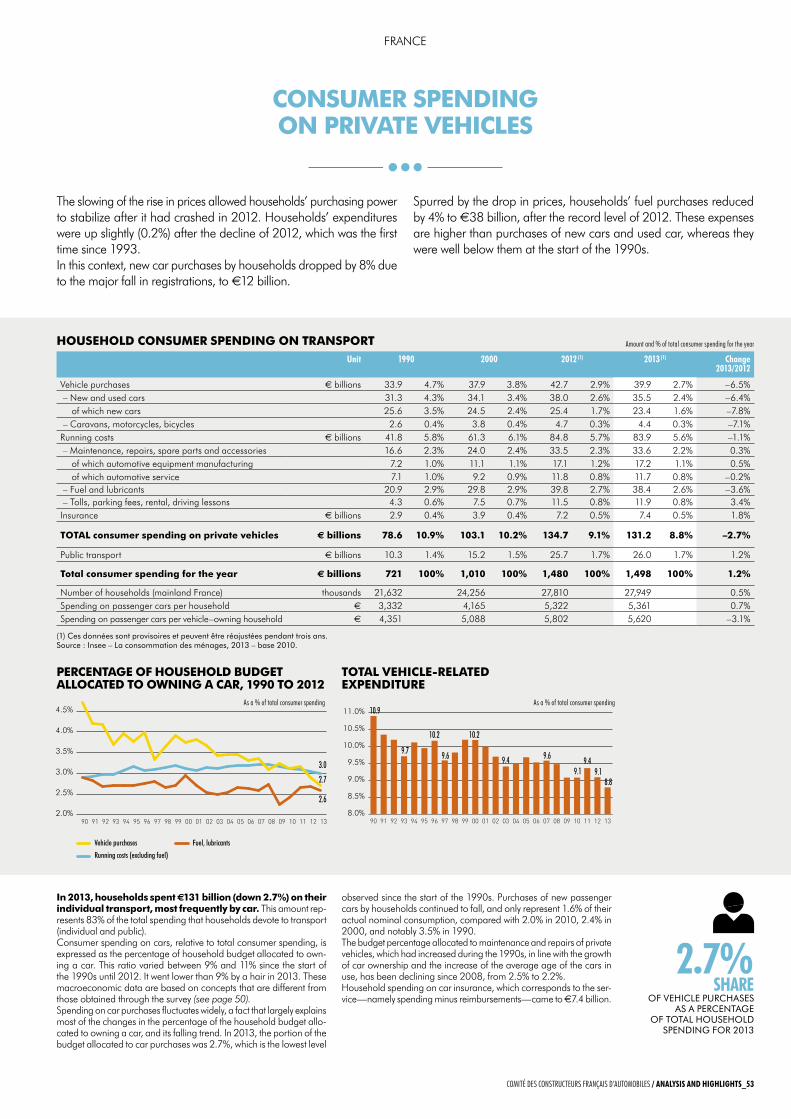
CONSUMER SPENdINg ON PRIvATE vEHICLES
In 2013, households spent €131 billion (down 2.7%) on their individual transport, most frequently by car. This amount rep-resents 83% of the total spending that households devote to transport (individual and public).Consumer spending on cars, relative to total consumer spending, is expressed as the percentage of household budget allocated to own-ing a car. This ratio varied between 9% and 11% since the start of the 1990s until 2012. It went lower than 9% by a hair in 2013. These macroeconomic data are based on concepts that are different from those obtained through the survey (see page 50).Spending on car purchases fluctuates widely, a fact that largely explains most of the changes in the percentage of the household budget allo-cated to owning a car, and its falling trend. In 2013, the portion of the budget allocated to car purchases was 2.7%, which is the lowest level
observed since the start of the 1990s. Purchases of new passenger cars by households continued to fall, and only represent 1.6% of their actual nominal consumption, compared with 2.0% in 2010, 2.4% in 2000, and notably 3.5% in 1990.The budget percentage allocated to maintenance and repairs of private vehicles, which had increased during the 1990s, in line with the growth of car ownership and the increase of the average age of the cars in use, has been declining since 2008, from 2.5% to 2.2%.Household spending on car insurance, which corresponds to the ser-vice—namely spending minus reimbursements—came to €7.4 billion.
The slowing of the rise in prices allowed households’ purchasing power to stabilize after it had crashed in 2012. Households’ expenditures were up slightly (0.2%) after the decline of 2012, which was the first time since 1993.In this context, new car purchases by households dropped by 8% due to the major fall in registrations, to €12 billion.
Spurred by the drop in prices, households’ fuel purchases reduced by 4% to €38 billion, after the record level of 2012. These expenses are higher than purchases of new cars and used car, whereas they were well below them at the start of the 1990s.
PERCENTAgE OF HOUSEHOLd BUdgET ALLOCATEd TO OwNINg A CAR, 1990 TO 2012
TOTAL vEHICLE-RELATEd EXPENdITURE
2.0%
2.5%
3.0%
3.5%
4.0%
4.5%Dépenses d’utilisation (hors carburants)
Carburants, lubrifiants
Achats de véhicules
131211100908070605040302010099989796959493929190
Vehicle purchases Fuel, lubricants
Running costs (excluding fuel)
8.0%
8.5%
9.0%
9.5%
10.0%
10.5%
11.0%Dépenses automobiles
131211100908070605040302010099989796959493929190
3.0
2.7
2.6
10.9
9.7 9.6 9.6
9.1 9.19.4
8.8
9.4
10.2 10.2
as a % of total consumer spending as a % of total consumer spending
HOUSEHOLd CONSUMER SPENdINg ON TRANSPORT
(1) ces données sont provisoires et peuvent être réajustées pendant trois ans.source : insee – la consommation des ménages, 2013 – base 2010.
Unit 1990 2000 2012 (1) 2013 (1) Change 2013/2012
Vehicle purchases € billions 33.9 4.7% 37.9 3.8% 42.7 2.9% 39.9 2.7% –6.5% – New and used cars 31.3 4.3% 34.1 3.4% 38.0 2.6% 35.5 2.4% –6.4%
of which new cars 25.6 3.5% 24.5 2.4% 25.4 1.7% 23.4 1.6% –7.8% – Caravans, motorcycles, bicycles 2.6 0.4% 3.8 0.4% 4.7 0.3% 4.4 0.3% –7.1%Running costs € billions 41.8 5.8% 61.3 6.1% 84.8 5.7% 83.9 5.6% –1.1% – Maintenance, repairs, spare parts and accessories 16.6 2.3% 24.0 2.4% 33.5 2.3% 33.6 2.2% 0.3%
of which automotive equipment manufacturing 7.2 1.0% 11.1 1.1% 17.1 1.2% 17.2 1.1% 0.5%of which automotive service 7.1 1.0% 9.2 0.9% 11.8 0.8% 11.7 0.8% –0.2%
– Fuel and lubricants 20.9 2.9% 29.8 2.9% 39.8 2.7% 38.4 2.6% –3.6% – Tolls, parking fees, rental, driving lessons 4.3 0.6% 7.5 0.7% 11.5 0.8% 11.9 0.8% 3.4%Insurance € billions 2.9 0.4% 3.9 0.4% 7.2 0.5% 7.4 0.5% 1.8%
TOTAL consumer spending on private vehicles € billions 78.6 10.9% 103.1 10.2% 134.7 9.1% 131.2 8.8% –2.7%
Public transport € billions 10.3 1.4% 15.2 1.5% 25.7 1.7% 26.0 1.7% 1.2%
Total consumer spending for the year € billions 721 100% 1,010 100% 1,480 100% 1,498 100% 1.2%
Number of households (mainland France) thousands 21,632 24,256 27,810 27,949 0.5%Spending on passenger cars per household € 3,332 4,165 5,322 5,361 0.7%Spending on passenger cars per vehicle–owning household € 4,351 5,088 5,802 5,620 –3.1%
amount and % of total consumer spending for the year
2.7% ShARe
Of vehicle purchases as a percenTage
Of TOTal hOusehOlD spenDing fOr 2013
FRANCe
Comité des ConstruCteurs Français d’automobiles / AnAlySiS And highlightS_53
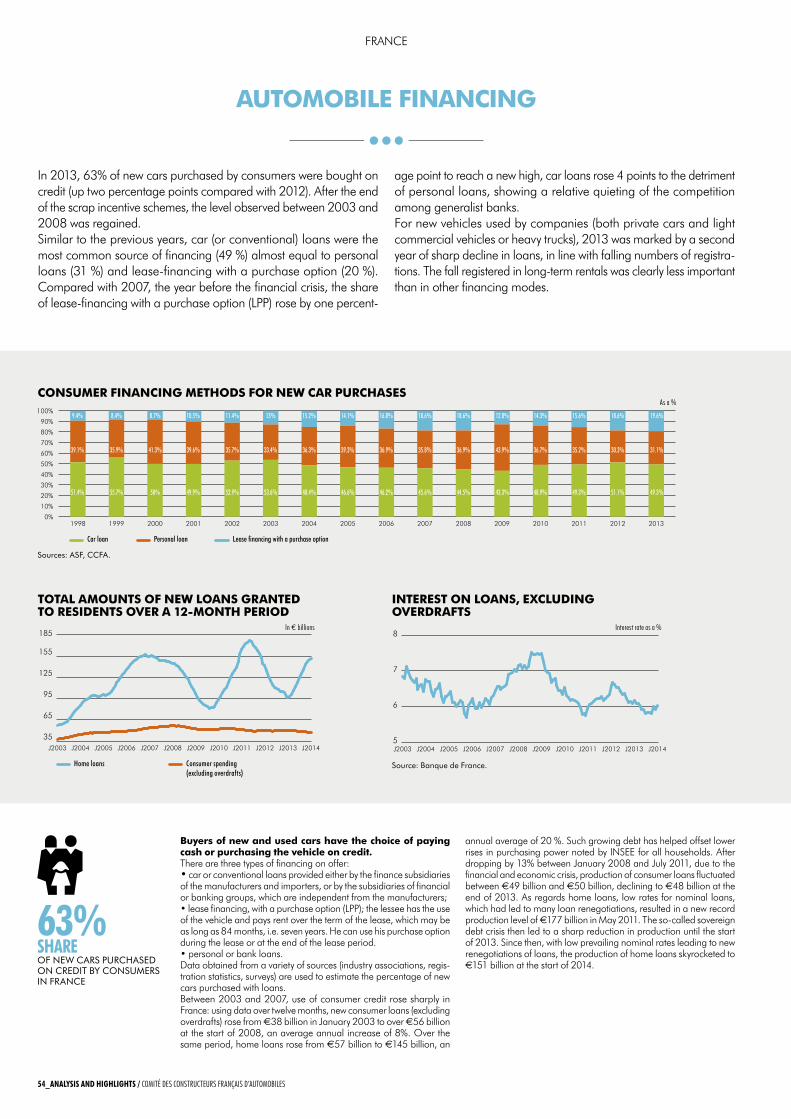
Buyers of new and used cars have the choice of paying cash or purchasing the vehicle on credit. There are three types of financing on offer:• car or conventional loans provided either by the finance subsidiaries of the manufacturers and importers, or by the subsidiaries of financial or banking groups, which are independent from the manufacturers;• lease financing, with a purchase option (LPP); the lessee has the use of the vehicle and pays rent over the term of the lease, which may be as long as 84 months, i.e. seven years. He can use his purchase option during the lease or at the end of the lease period.• personal or bank loans.Data obtained from a variety of sources (industry associations, regis-tration statistics, surveys) are used to estimate the percentage of new cars purchased with loans.Between 2003 and 2007, use of consumer credit rose sharply in France: using data over twelve months, new consumer loans (excluding overdrafts) rose from €38 billion in January 2003 to over €56 billion at the start of 2008, an average annual increase of 8%. Over the same period, home loans rose from €57 billion to €145 billion, an
annual average of 20 %. Such growing debt has helped offset lower rises in purchasing power noted by INSee for all households. After dropping by 13% between January 2008 and July 2011, due to the financial and economic crisis, production of consumer loans fluctuated between €49 billion and €50 billion, declining to €48 billion at the end of 2013. As regards home loans, low rates for nominal loans, which had led to many loan renegotiations, resulted in a new record production level of €177 billion in May 2011. The so-called sovereign debt crisis then led to a sharp reduction in production until the start of 2013. Since then, with low prevailing nominal rates leading to new renegotiations of loans, the production of home loans skyrocketed to €151 billion at the start of 2014.
In 2013, 63% of new cars purchased by consumers were bought on credit (up two percentage points compared with 2012). After the end of the scrap incentive schemes, the level observed between 2003 and 2008 was regained.Similar to the previous years, car (or conventional) loans were the most common source of financing (49 %) almost equal to personal loans (31 %) and lease-financing with a purchase option (20 %). Compared with 2007, the year before the financial crisis, the share of lease-financing with a purchase option (LPP) rose by one percent-
age point to reach a new high, car loans rose 4 points to the detriment of personal loans, showing a relative quieting of the competition among generalist banks.For new vehicles used by companies (both private cars and light commercial vehicles or heavy trucks), 2013 was marked by a second year of sharp decline in loans, in line with falling numbers of registra-tions. The fall registered in long-term rentals was clearly less important than in other financing modes.
AUTOMOBILE FINANCINg
CONSUMER FINANCINg METHOdS FOR NEw CAR PURCHASES
0%
10%
20%
30%
40%
50%
60%
70%
80%
90%
100%
2013201220112010200920082007200620052004200320022001200019991998
51.4%
39.1%
9.4%
55.7%
35.9%
8.4%
50%
41.3%
8.7%
49.9%
39.6%
10.5%
52.9 %
35.7%
11.4 %
53.6 %
33.4%
13 %
48.4 %
36.3%
15.2 %
46.6 %
39.3%
14.1%
46.2 %
36.9%
16.8 %
45.6 %
35.8%
18.6 %
44.5 %
36.9%
18.6 %
43.3 %
43.9%
12.8%
48.9 %
36.7%
14.3%
49.3 %
35.2%
15.6%
51.1 %
30.3%
18.6%
49.3 %
31.1%
19.6%
Car loan Personal loan Lease financing with a purchase option
sources: asf, ccfa.
TOTAL AMOUNTS OF NEw LOANS gRANTEd TO RESIdENTS OvER A 12-MONTH PERIOd
INTEREST ON LOANS, EXCLUdINg OvERdRAFTS
35
65
95
125
155
185Habitat des ménages
Conso des ménages hors découvert
J2014J2013J2012J2011J2010J2009J2008J2007J2006J2005J2004J2003
Home loans Consumer spending (excluding overdrafts)
5
6
7
8Taux crédit conso, hors découvert
J2014J2013J2012J2011J2010J2009J2008J2007J2006J2005J2004J2003
35
65
95
125
155
185Habitat des ménages
Conso des ménages hors découvert
J2014J2013J2012J2011J2010J2009J2008J2007J2006J2005J2004J2003
Home loans Consumer spending (excluding overdrafts)
5
6
7
8Taux crédit conso, hors découvert
J2014J2013J2012J2011J2010J2009J2008J2007J2006J2005J2004J2003
in € billions interest rate as a %
as a %
source: banque de france.
63%ShARe Of new cars purchaseD On creDiT by cOnsumers in france
FRANCe
54_AnAlySiS And highlightS / Comité des ConstruCteurs Français d’automobiles
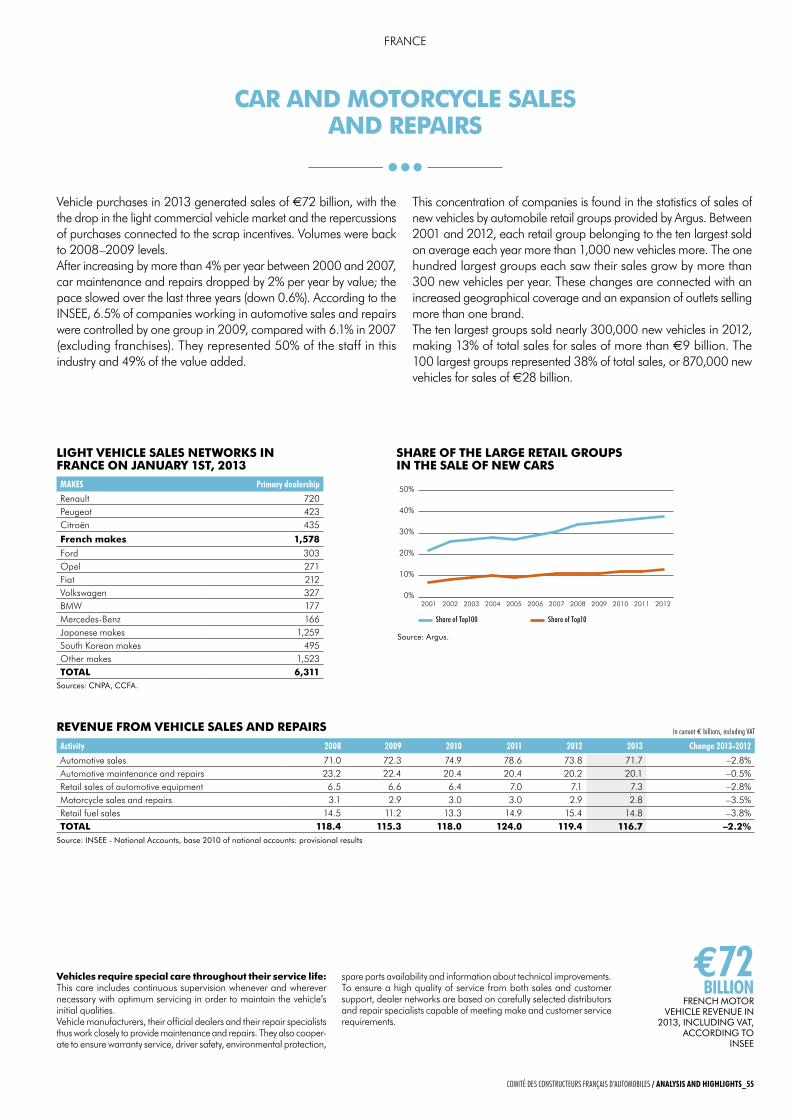
vehicles require special care throughout their service life: This care includes continuous supervision whenever and wherever necessary with optimum servicing in order to maintain the vehicle’s initial qualities.Vehicle manufacturers, their official dealers and their repair specialists thus work closely to provide maintenance and repairs. They also cooper-ate to ensure warranty service, driver safety, environmental protection,
spare parts availability and information about technical improvements.To ensure a high quality of service from both sales and customer support, dealer networks are based on carefully selected distributors and repair specialists capable of meeting make and customer service requirements.
Vehicle purchases in 2013 generated sales of €72 billion, with the the drop in the light commercial vehicle market and the repercussions of purchases connected to the scrap incentives. Volumes were back to 2008–2009 levels.After increasing by more than 4% per year between 2000 and 2007, car maintenance and repairs dropped by 2% per year by value; the pace slowed over the last three years (down 0.6%). According to the INSee, 6.5% of companies working in automotive sales and repairs were controlled by one group in 2009, compared with 6.1% in 2007 (excluding franchises). They represented 50% of the staff in this industry and 49% of the value added.
This concentration of companies is found in the statistics of sales of new vehicles by automobile retail groups provided by Argus. Between 2001 and 2012, each retail group belonging to the ten largest sold on average each year more than 1,000 new vehicles more. The one hundred largest groups each saw their sales grow by more than 300 new vehicles per year. These changes are connected with an increased geographical coverage and an expansion of outlets selling more than one brand.The ten largest groups sold nearly 300,000 new vehicles in 2012, making 13% of total sales for sales of more than €9 billion. The 100 largest groups represented 38% of total sales, or 870,000 new vehicles for sales of €28 billion.
CAR ANd MOTORCyCLE SALES ANd REPAIRS
SHARE OF THE LARgE RETAIL gROUPS IN THE SALE OF NEw CARS
0%
10%
20%
30%
40%
50%
201220112010200920082007200620052004200320022001
Share of Top100 Share of Top10
€72 billion
french mOTOr vehicle revenue in
2013, incluDing vaT, accOrDing TO
insee
in current € billions, including Vat
mAkeS Primary dealership
Renault 720Peugeot 423Citroën 435
French makes 1,578Ford 303Opel 271Fiat 212Volkswagen 327BMW 177Mercedes-Benz 166Japanese makes 1,259South Korean makes 495Other makes 1,523TOTAL 6,311
LIgHT vEHICLE SALES NETwORkS IN FRANCE ON jANUARy 1ST, 2013
REvENUE FROM vEHICLE SALES ANd REPAIRS
sources: cnpa, ccfa.
source: argus.
source: insee - national accounts, base 2010 of national accounts: provisional results
Activity 2008 2009 2010 2011 2012 2013 Change 2013-2012
Automotive sales 71.0 72.3 74.9 78.6 73.8 71.7 –2.8%Automotive maintenance and repairs 23.2 22.4 20.4 20.4 20.2 20.1 –0.5%Retail sales of automotive equipment 6.5 6.6 6.4 7.0 7.1 7.3 –2.8%Motorcycle sales and repairs 3.1 2.9 3.0 3.0 2.9 2.8 –3.5%Retail fuel sales 14.5 11.2 13.3 14.9 15.4 14.8 –3.8%TOTAL 118.4 115.3 118.0 124.0 119.4 116.7 –2.2%
FRANCe
Comité des ConstruCteurs Français d’automobiles / AnAlySiS And highlightS_55
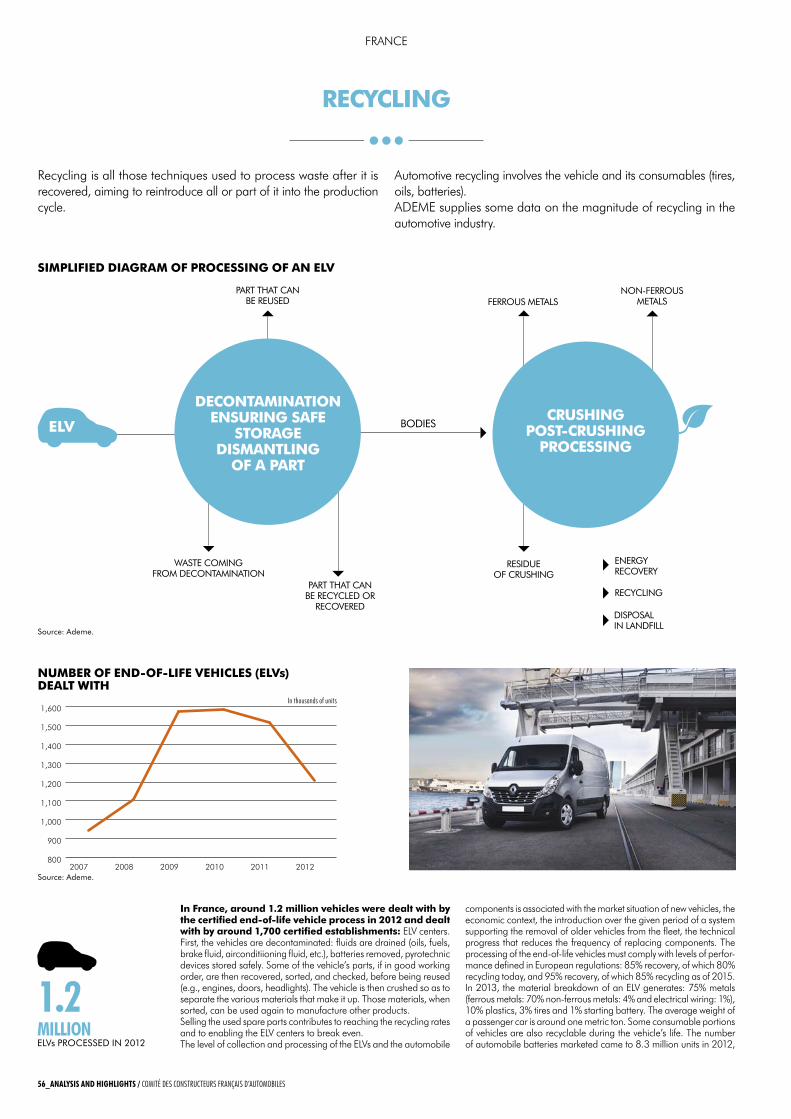
Recycling is all those techniques used to process waste after it is recovered, aiming to reintroduce all or part of it into the production cycle.
Automotive recycling involves the vehicle and its consumables (tires, oils, batteries).ADeMe supplies some data on the magnitude of recycling in the automotive industry.
RECyCLINg
In France, around 1.2 million vehicles were dealt with by the certified end-of-life vehicle process in 2012 and dealt with by around 1,700 certified establishments: eLV centers. First, the vehicles are decontaminated: fluids are drained (oils, fuels, brake fluid, airconditiioning fluid, etc.), batteries removed, pyrotechnic devices stored safely. Some of the vehicle’s parts, if in good working order, are then recovered, sorted, and checked, before being reused (e.g., engines, doors, headlights). The vehicle is then crushed so as to separate the various materials that make it up. Those materials, when sorted, can be used again to manufacture other products.Selling the used spare parts contributes to reaching the recycling rates and to enabling the eLV centers to break even.The level of collection and processing of the eLVs and the automobile
components is associated with the market situation of new vehicles, the economic context, the introduction over the given period of a system supporting the removal of older vehicles from the fleet, the technical progress that reduces the frequency of replacing components. The processing of the end-of-life vehicles must comply with levels of perfor-mance defined in european regulations: 85% recovery, of which 80% recycling today, and 95% recovery, of which 85% recycling as of 2015.In 2013, the material breakdown of an eLV generates: 75% metals (ferrous metals: 70% non-ferrous metals: 4% and electrical wiring: 1%), 10% plastics, 3% tires and 1% starting battery. The average weight of a passenger car is around one metric ton. Some consumable portions of vehicles are also recyclable during the vehicle’s life. The number of automobile batteries marketed came to 8.3 million units in 2012,
1.2 million elvs prOcesseD in 2012
dECONTAMINATIONENSURINg SAFE
STORAgEdISMANTLINg
OF A PART
parT ThaT canbe reuseD
nOn-ferrOusmeTalsferrOus meTals
bODies
parT ThaT canbe recycleD Or
recOvereD
wasTe cOmingfrOm DecOnTaminaTiOn
resiDueOf crushing
energyrecOvery
DispOsalin lanDfill
recycling
CRUSHINgPOST-CRUSHINg
PROCESSINgELv
NUMBER OF ENd-OF-LIFE vEHICLES (ELvs) dEALT wITH
800
900
1,000
1,100
1,200
1,300
1,400
1,500
1,600
201220112010200920082007
in thousands of units
source: ademe.
source: ademe.
SIMPLIFIEd dIAgRAM OF PROCESSINg OF AN ELv
FRANCe
56_AnAlySiS And highlightS / Comité des ConstruCteurs Français d’automobiles
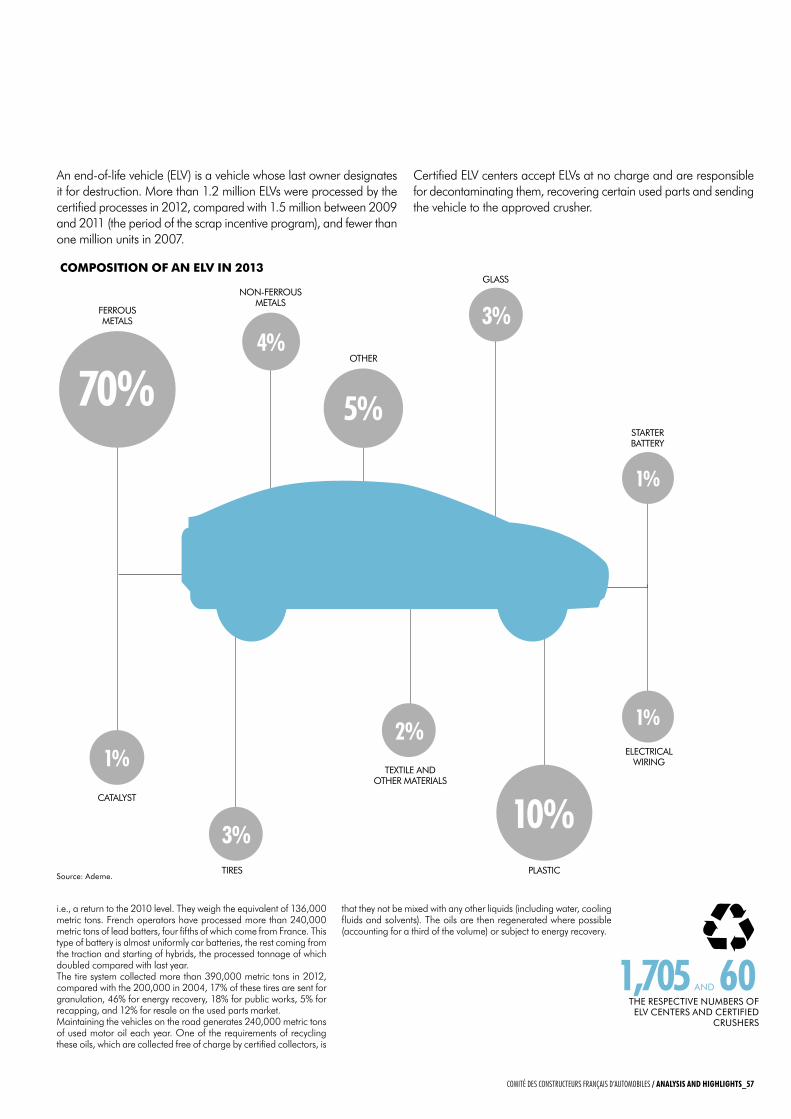
An end-of-life vehicle (eLV) is a vehicle whose last owner designates it for destruction. More than 1.2 million eLVs were processed by the certified processes in 2012, compared with 1.5 million between 2009 and 2011 (the period of the scrap incentive program), and fewer than one million units in 2007.
Certified eLV centers accept eLVs at no charge and are responsible for decontaminating them, recovering certain used parts and sending the vehicle to the approved crusher.
i.e., a return to the 2010 level. They weigh the equivalent of 136,000 metric tons. French operators have processed more than 240,000 metric tons of lead batters, four fifths of which come from France. This type of battery is almost uniformly car batteries, the rest coming from the traction and starting of hybrids, the processed tonnage of which doubled compared with last year.The tire system collected more than 390,000 metric tons in 2012, compared with the 200,000 in 2004, 17% of these tires are sent for granulation, 46% for energy recovery, 18% for public works, 5% for recapping, and 12% for resale on the used parts market.Maintaining the vehicles on the road generates 240,000 metric tons of used motor oil each year. One of the requirements of recycling these oils, which are collected free of charge by certified collectors, is
that they not be mixed with any other liquids (including water, cooling fluids and solvents). The oils are then regenerated where possible (accounting for a third of the volume) or subject to energy recovery.
70%4%
1%
1%
1%
5%
3%
3%
2%
10%TexTile anD
OTher maTerials
elecTrical wiring
ferrOusmeTals
nOn-ferrOusmeTals
sTarTerbaTTery
glass
plasTic
OTher
Tires
caTalysT
source: ademe.
1,705 anD 60The respecTive numbers Of elv cenTers anD cerTifieD
crushers
COMPOSITION OF AN ELv IN 2013
Comité des ConstruCteurs Français d’automobiles / AnAlySiS And highlightS_57
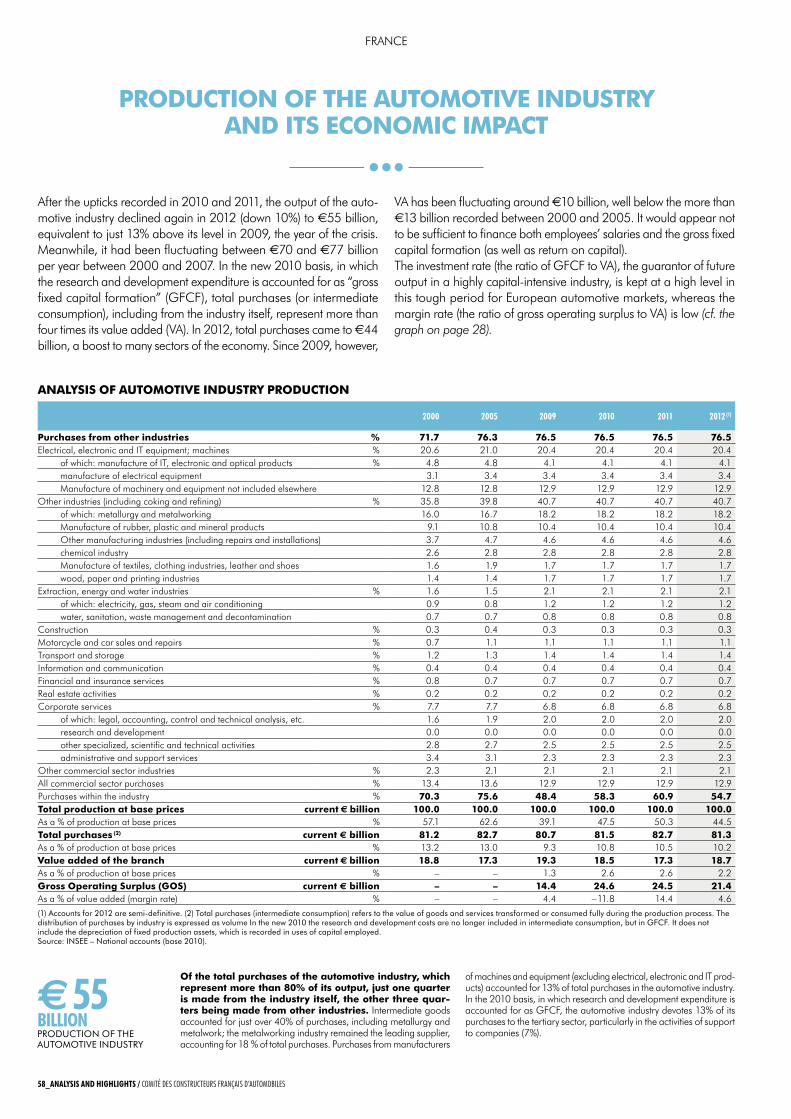
Of the total purchases of the automotive industry, which represent more than 80% of its output, just one quarter is made from the industry itself, the other three quar-ters being made from other industries. Intermediate goods accounted for just over 40% of purchases, including metallurgy and metalwork; the metalworking industry remained the leading supplier, accounting for 18 % of total purchases. Purchases from manufacturers
of machines and equipment (excluding electrical, electronic and IT prod-ucts) accounted for 13% of total purchases in the auto motive industry. In the 2010 basis, in which research and development expenditure is accounted for as GFCF, the automotive industry devotes 13% of its purchases to the tertiary sector, particularly in the activities of support to companies (7%).
After the upticks recorded in 2010 and 2011, the output of the auto-motive industry declined again in 2012 (down 10%) to €55 billion, equivalent to just 13% above its level in 2009, the year of the crisis. Meanwhile, it had been fluctuating between €70 and €77 billion per year between 2000 and 2007. In the new 2010 basis, in which the research and development expenditure is accounted for as “gross fixed capital formation” (GFCF), total purchases (or intermediate consumption), including from the industry itself, represent more than four times its value added (VA). In 2012, total purchases came to €44 billion, a boost to many sectors of the economy. Since 2009, however,
VA has been fluctuating around €10 billion, well below the more than €13 billion recorded between 2000 and 2005. It would appear not to be sufficient to finance both employees’ salaries and the gross fixed capital formation (as well as return on capital).The investment rate (the ratio of GFCF to VA), the guarantor of future output in a highly capital-intensive industry, is kept at a high level in this tough period for european automotive markets, whereas the margin rate (the ratio of gross operating surplus to VA) is low (cf. the graph on page 28).
PROdUCTION OF THE AUTOMOTIvE INdUSTRy ANd ITS ECONOMIC IMPACT
ANALySIS OF AUTOMOTIvE INdUSTRy PROdUCTION
2000 2005 2009 2010 2011 2012 (1)
Purchases from other industries % 71.7 76.3 76.5 76.5 76.5 76.5electrical, electronic and IT equipment; machines % 20.6 21.0 20.4 20.4 20.4 20.4 of which: manufacture of IT, electronic and optical products % 4.8 4.8 4.1 4.1 4.1 4.1 manufacture of electrical equipment 3.1 3.4 3.4 3.4 3.4 3.4 Manufacture of machinery and equipment not included elsewhere 12.8 12.8 12.9 12.9 12.9 12.9Other industries (including coking and refining) % 35.8 39.8 40.7 40.7 40.7 40.7 of which: metallurgy and metalworking 16.0 16.7 18.2 18.2 18.2 18.2 Manufacture of rubber, plastic and mineral products 9.1 10.8 10.4 10.4 10.4 10.4 Other manufacturing industries (including repairs and installations) 3.7 4.7 4.6 4.6 4.6 4.6 chemical industry 2.6 2.8 2.8 2.8 2.8 2.8 Manufacture of textiles, clothing industries, leather and shoes 1.6 1.9 1.7 1.7 1.7 1.7 wood, paper and printing industries 1.4 1.4 1.7 1.7 1.7 1.7extraction, energy and water industries % 1.6 1.5 2.1 2.1 2.1 2.1 of which: electricity, gas, steam and air conditioning 0.9 0.8 1.2 1.2 1.2 1.2 water, sanitation, waste management and decontamination 0.7 0.7 0.8 0.8 0.8 0.8Construction % 0.3 0.4 0.3 0.3 0.3 0.3Motorcycle and car sales and repairs % 0.7 1.1 1.1 1.1 1.1 1.1Transport and storage % 1.2 1.3 1.4 1.4 1.4 1.4Information and communication % 0.4 0.4 0.4 0.4 0.4 0.4Financial and insurance services % 0.8 0.7 0.7 0.7 0.7 0.7Real estate activities % 0.2 0.2 0.2 0.2 0.2 0.2Corporate services % 7.7 7.7 6.8 6.8 6.8 6.8 of which: legal, accounting, control and technical analysis, etc. 1.6 1.9 2.0 2.0 2.0 2.0 research and development 0.0 0.0 0.0 0.0 0.0 0.0 other specialized, scientific and technical activities 2.8 2.7 2.5 2.5 2.5 2.5 administrative and support services 3.4 3.1 2.3 2.3 2.3 2.3Other commercial sector industries % 2.3 2.1 2.1 2.1 2.1 2.1All commercial sector purchases % 13.4 13.6 12.9 12.9 12.9 12.9Purchases within the industry % 70.3 75.6 48.4 58.3 60.9 54.7Total production at base prices current € billion 100.0 100.0 100.0 100.0 100.0 100.0As a % of production at base prices % 57.1 62.6 39.1 47.5 50.3 44.5Total purchases (2) current € billion 81.2 82.7 80.7 81.5 82.7 81.3As a % of production at base prices % 13.2 13.0 9.3 10.8 10.5 10.2value added of the branch current € billion 18.8 17.3 19.3 18.5 17.3 18.7As a % of production at base prices % – – 1.3 2.6 2.6 2.2gross Operating Surplus (gOS) current € billion – – 14.4 24.6 24.5 21.4As a % of value added (margin rate) % – – 4.4 – 11.8 14.4 4.6
(1) accounts for 2012 are semi-definitive. (2) Total purchases (intermediate consumption) refers to the value of goods and services transformed or consumed fully during the production process. The distribution of purchases by industry is expressed as volume in the new 2010 the research and development costs are no longer included in intermediate consumption, but in gfcf. it does not include the depreciation of fixed production assets, which is recorded in uses of capital employed. source: insee – national accounts (base 2010).
e 55 billionprODucTiOn Of The auTOmOTive inDusTry
FRANCe
58_AnAlySiS And highlightS / Comité des ConstruCteurs Français d’automobiles
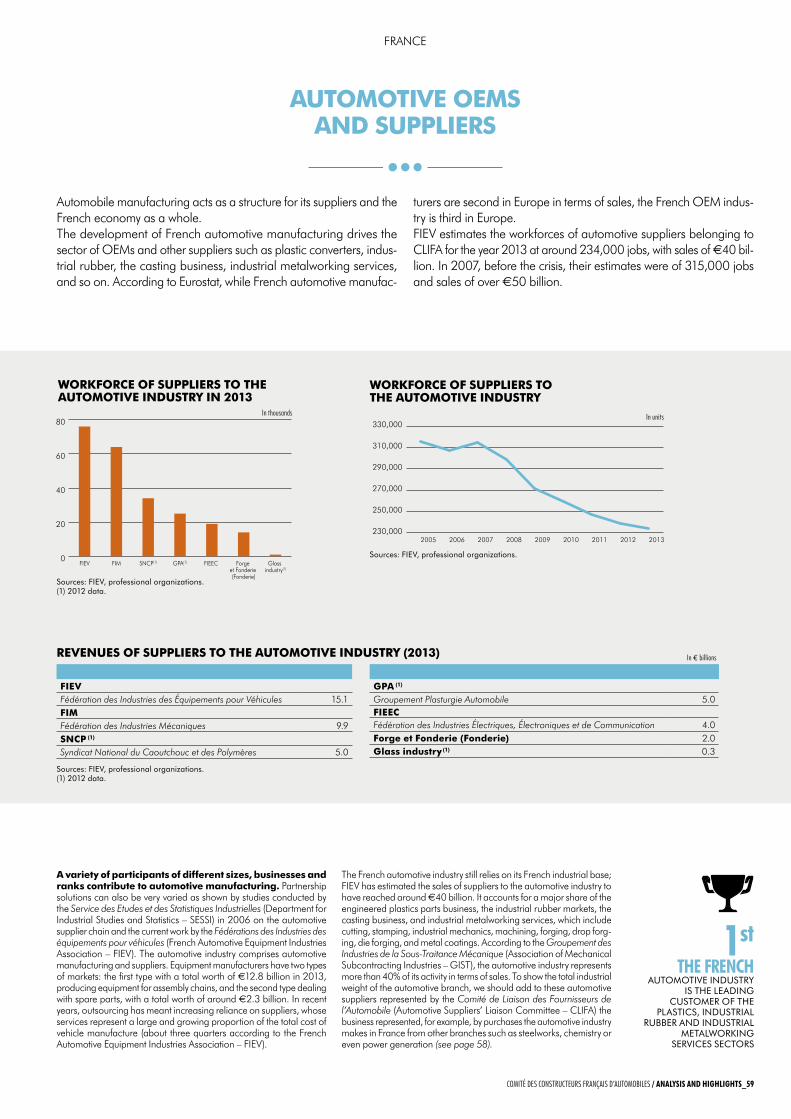
in units
A variety of participants of different sizes, businesses and ranks contribute to automotive manufacturing. Partnership solutions can also be very varied as shown by studies conducted by the Service des Etudes et des Statistiques Industrielles (Department for Industrial Studies and Statistics – SeSSI) in 2006 on the automotive supplier chain and the current work by the Fédérations des Industries des équipements pour véhicules (French Automotive equipment Industries Association – FIeV). The automotive industry comprises automotive manufacturing and suppliers. equipment manufacturers have two types of markets: the first type with a total worth of €12.8 billion in 2013, producing equipment for assembly chains, and the second type dealing with spare parts, with a total worth of around €2.3 billion. In recent years, outsourcing has meant increasing reliance on suppliers, whose services represent a large and growing proportion of the total cost of vehicle manufacture (about three quarters according to the French Automotive equipment Industries Association – FIeV).
The French automotive industry still relies on its French industrial base; FIeV has estimated the sales of suppliers to the automotive industry to have reached around €40 billion. It accounts for a major share of the engineered plastics parts business, the industrial rubber markets, the casting business, and industrial metalworking services, which include cutting, stamping, industrial mechanics, machining, forging, drop forg-ing, die forging, and metal coatings. According to the Groupement des Industries de la Sous-Traitance Mécanique (Association of Mechanical Subcontracting Industries – GIST), the automotive industry represents more than 40% of its activity in terms of sales. To show the total industrial weight of the automotive branch, we should add to these automotive suppliers represented by the Comité de Liaison des Fournisseurs de l’Automobile (Automotive Suppliers’ Liaison Committee – CLIFA) the business represented, for example, by purchases the automotive industry makes in France from other branches such as steelworks, chemistry or even power generation (see page 58).
Automobile manufacturing acts as a structure for its suppliers and the French economy as a whole.The development of French automotive manufacturing drives the sector of OeMs and other suppliers such as plastic converters, indus-trial rubber, the casting business, industrial metalworking services, and so on. According to eurostat, while French automotive manufac-
turers are second in europe in terms of sales, the French OeM indus-try is third in europe. FIeV estimates the workforces of automotive suppliers belonging to CLIFA for the year 2013 at around 234,000 jobs, with sales of €40 bil-lion. In 2007, before the crisis, their estimates were of 315,000 jobs and sales of over €50 billion.
AUTOMOTIvE OEMS ANd SUPPLIERS
1stthe FRenCh
auTOmOTive inDusTry is The leaDing
cusTOmer Of The plasTics, inDusTrial
rubber anD inDusTrial meTalwOrKing
services secTOrs
wORkFORCE OF SUPPLIERS TO THE AUTOMOTIvE INdUSTRy
230,000
250,000
270,000
290,000
310,000
330,000
201320122011201020092008200720062005
sources: fiev, professional organizations.
sources: fiev, professional organizations.(1) 2012 data.
0
20
40
60
80
Glass industry(1)
Forge et Fonderie (Fonderie)
FIEEC GPA(1)SNCP(1)FIMFIEV
wORkFORCE OF SUPPLIERS TO THE AUTOMOTIvE INdUSTRy IN 2013
in thousands
in € billionsREvENUES OF SUPPLIERS TO THE AUTOMOTIvE INdUSTRy (2013)
sources: fiev, professional organizations. (1) 2012 data.
FIEvFédération des Industries des Équipements pour Véhicules 15.1FIMFédération des Industries Mécaniques 9.9SNCP (1)
Syndicat National du Caoutchouc et des Polymères 5.0
gPA (1)
Groupement Plasturgie Automobile 5.0FIEECFédération des Industries Électriques, Électroniques et de Communication 4.0Forge et Fonderie (Fonderie) 2.0 glass industry (1) 0.3
FRANCe
Comité des ConstruCteurs Français d’automobiles / AnAlySiS And highlightS_59
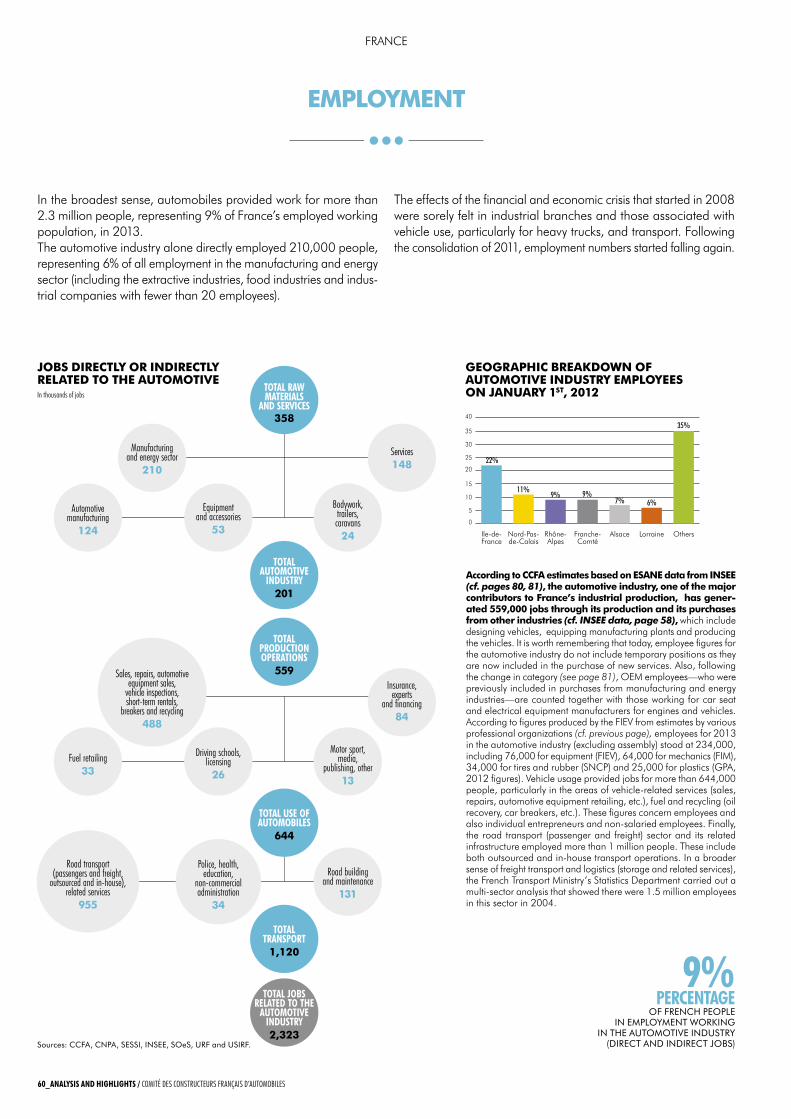
According to CCFA estimates based on ESANE data from INSEE (cf. pages 80, 81), the automotive industry, one of the major contributors to France’s industrial production, has gener-ated 559,000 jobs through its production and its purchases from other industries (cf. INSEE data, page 58), which include designing vehicles, equipping manufacturing plants and producing the vehicles. It is worth remembering that today, employee figures for the automotive industry do not include temporary positions as they are now included in the purchase of new services. Also, following the change in category (see page 81), OEM employees—who were previously included in purchases from manufacturing and energy industries—are counted together with those working for car seat and electrical equipment manufacturers for engines and vehicles.According to figures produced by the FIEV from estimates by various professional organizations (cf. previous page), employees for 2013 in the automotive industry (excluding assembly) stood at 234,000, including 76,000 for equipment (FIEV), 64,000 for mechanics (FIM), 34,000 for tires and rubber (SNCP) and 25,000 for plastics (GPA, 2012 figures). Vehicle usage provided jobs for more than 644,000 people, particularly in the areas of vehicle-related services (sales, repairs, automotive equipment retailing, etc.), fuel and recycling (oil recovery, car breakers, etc.). These figures concern employees and also individual entrepreneurs and non-salaried employees. Finally, the road transport (passenger and freight) sector and its related infrastructure employed more than 1 million people. These include both outsourced and in-house transport operations. In a broader sense of freight transport and logistics (storage and related services), the French Transport Ministry’s Statistics Department carried out a multi-sector analysis that showed there were 1.5 million employees in this sector in 2004.
JobS dIrECtly or INdIrECtly rElAtEd to thE AutomotIvEIn thousands of jobs
Sources: CCFA, CNPA, SESSI, INSEE, SOeS, URF and USIRF.
Automotive manufacturing
124
Manufacturing and energy sector
210
Fuel retailing33
Road transport (passengers and freight,
outsourced and in-house), related services
955
Sales, repairs, automotive equipment sales,
vehicle inspections, short-term rentals,
breakers and recycling488
Equipment and accessories
53
Driving schools, licensing26
Police, health, education,
non-commercial administration
34
Bodywork, trailers, caravans24
Services148
Motor sport, media,
publishing, other13
Road building and maintenance
131
Insurance, experts
and financing84
TOTAL AuTOmOTive
indusTry201
TOTAL TrAnspOrT1,120
TOTAL jObs reLATed TO The
AuTOmOTive indusTry2,323
TOTAL rAW mATeriALs
And serviCes358
TOTAL prOduCTiOn OperATiOns
559
TOTAL use Of AuTOmObiLes
644
GEoGrAphIC brEAkdowN oF AutomotIvE INduStry EmployEES oN JANuAry 1St, 2012
0
5
10
15
20
25
30
35
40
OthersLorraineAlsaceFranche-Comté
Rhône-Alpes
Nord-Pas-de-Calais
Ile-de-France
22%
11%9% 9%
7% 6%
35%
In the broadest sense, automobiles provided work for more than 2.3 million people, representing 9% of France’s employed working population, in 2013.The automotive industry alone directly employed 210,000 people, representing 6% of all employment in the manufacturing and energy sector (including the extractive industries, food industries and indus-trial companies with fewer than 20 employees).
The effects of the financial and economic crisis that started in 2008 were sorely felt in industrial branches and those associated with vehicle use, particularly for heavy trucks, and transport. Following the consolidation of 2011, employment numbers started falling again.
EmploymENt
9%perCenTAge
OF FRENCh PEOPlE IN EmPlOymENt wORkINg
IN thE AUtOmOtIvE INdUStRy (dIRECt ANd INdIRECt jObS)
60_AnALysis And highLighTs / CoMIté DES ConStRuCtEuRS FRAnçAIS D’AutoMoBIlES
FrANCE
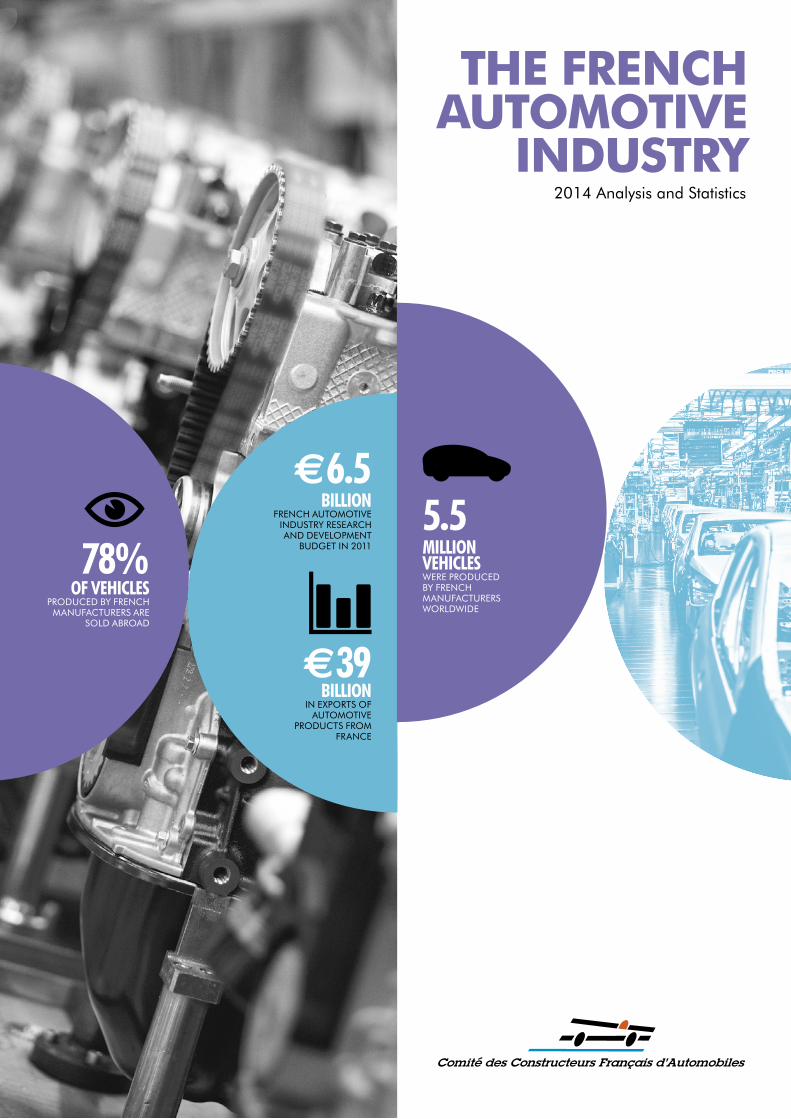
thE FrENCh AutomotIvE
INduStry2014 Analysis and Statistics
5.5 miLLiOn vehiCLeswERE PROdUCEd by FRENCh mANUFACtURERS wORldwIdE
a39biLLiOn
IN ExPORtS OF AUtOmOtIvE
PROdUCtS FROm FRANCE
a6.5 biLLiOn
FRENCh AUtOmOtIvE INdUStRy RESEARCh ANd dEvElOPmENt
bUdgEt IN 2011 78%Of vehiCLes
PROdUCEd by FRENCh mANUFACtURERS ARE
SOld AbROAd
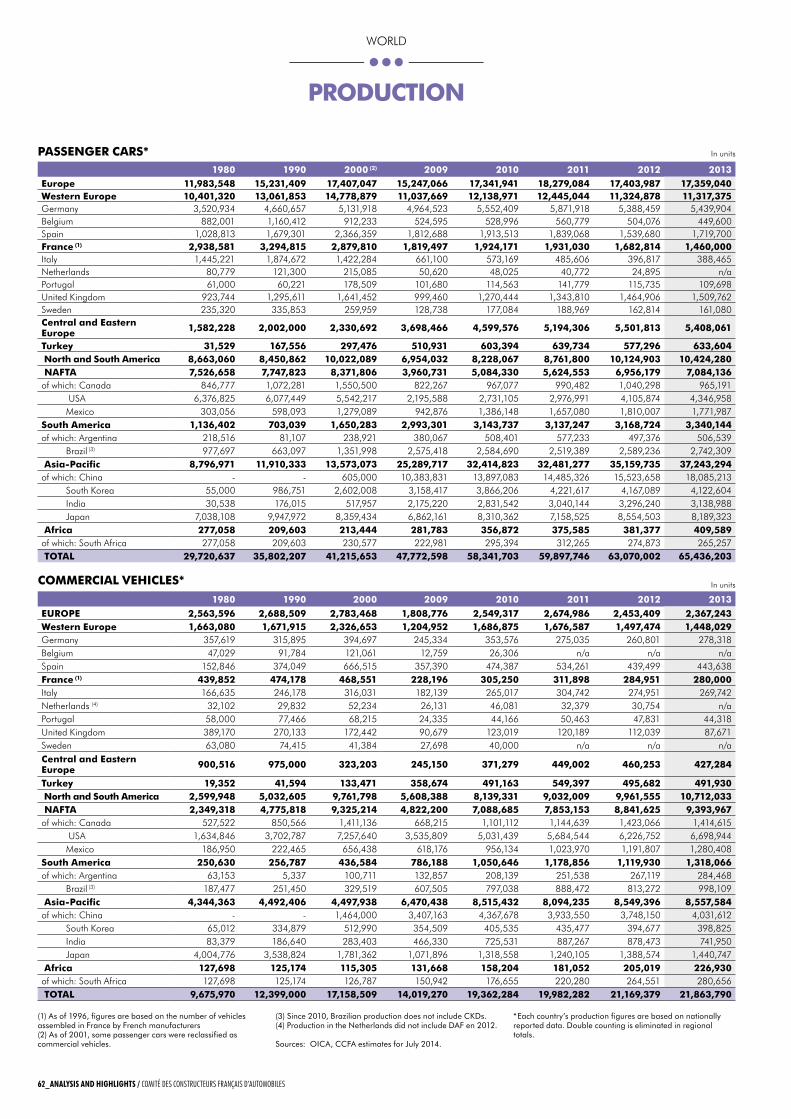
produCtIoN
pASSENGEr CArS*
CommErCIAl vEhIClES*
In units
In units
1980 1990 2000 (2) 2009 2010 2011 2012 2013 Europe 11,983,548 15,231,409 17,407,047 15,247,066 17,341,941 18,279,084 17,403,987 17,359,040western Europe 10,401,320 13,061,853 14,778,879 11,037,669 12,138,971 12,445,044 11,324,878 11,317,375Germany 3,520,934 4,660,657 5,131,918 4,964,523 5,552,409 5,871,918 5,388,459 5,439,904Belgium 882,001 1,160,412 912,233 524,595 528,996 560,779 504,076 449,600Spain 1,028,813 1,679,301 2,366,359 1,812,688 1,913,513 1,839,068 1,539,680 1,719,700France (1) 2,938,581 3,294,815 2,879,810 1,819,497 1,924,171 1,931,030 1,682,814 1,460,000Italy 1,445,221 1,874,672 1,422,284 661,100 573,169 485,606 396,817 388,465Netherlands 80,779 121,300 215,085 50,620 48,025 40,772 24,895 n/aPortugal 61,000 60,221 178,509 101,680 114,563 141,779 115,735 109,698United Kingdom 923,744 1,295,611 1,641,452 999,460 1,270,444 1,343,810 1,464,906 1,509,762Sweden 235,320 335,853 259,959 128,738 177,084 188,969 162,814 161,080Central and Eastern Europe 1,582,228 2,002,000 2,330,692 3,698,466 4,599,576 5,194,306 5,501,813 5,408,061
turkey 31,529 167,556 297,476 510,931 603,394 639,734 577,296 633,604 North and South America 8,663,060 8,450,862 10,022,089 6,954,032 8,228,067 8,761,800 10,124,903 10,424,280 NAFtA 7,526,658 7,747,823 8,371,806 3,960,731 5,084,330 5,624,553 6,956,179 7,084,136of which: Canada 846,777 1,072,281 1,550,500 822,267 967,077 990,482 1,040,298 965,191
USA 6,376,825 6,077,449 5,542,217 2,195,588 2,731,105 2,976,991 4,105,874 4,346,958Mexico 303,056 598,093 1,279,089 942,876 1,386,148 1,657,080 1,810,007 1,771,987
South America 1,136,402 703,039 1,650,283 2,993,301 3,143,737 3,137,247 3,168,724 3,340,144of which: Argentina 218,516 81,107 238,921 380,067 508,401 577,233 497,376 506,539
Brazil (3) 977,697 663,097 1,351,998 2,575,418 2,584,690 2,519,389 2,589,236 2,742,309 Asia-pacific 8,796,971 11,910,333 13,573,073 25,289,717 32,414,823 32,481,277 35,159,735 37,243,294of which: China - - 605,000 10,383,831 13,897,083 14,485,326 15,523,658 18,085,213
South Korea 55,000 986,751 2,602,008 3,158,417 3,866,206 4,221,617 4,167,089 4,122,604India 30,538 176,015 517,957 2,175,220 2,831,542 3,040,144 3,296,240 3,138,988Japan 7,038,108 9,947,972 8,359,434 6,862,161 8,310,362 7,158,525 8,554,503 8,189,323
Africa 277,058 209,603 213,444 281,783 356,872 375,585 381,377 409,589of which: South Africa 277,058 209,603 230,577 222,981 295,394 312,265 274,873 265,257 totAl 29,720,637 35,802,207 41,215,653 47,772,598 58,341,703 59,897,746 63,070,002 65,436,203
(1) As of 1996, figures are based on the number of vehicles assembled in France by French manufacturers(2) As of 2001, some passenger cars were reclassified as commercial vehicles.
(3) Since 2010, brazilian production does not include Ckds.(4) Production in the Netherlands did not include dAF en 2012.
Sources: OICA, CCFA estimates for july 2014.
* Each country’s production figures are based on nationally reported data. double counting is eliminated in regional totals.
1980 1990 2000 2009 2010 2011 2012 2013
EuropE 2,563,596 2,688,509 2,783,468 1,808,776 2,549,317 2,674,986 2,453,409 2,367,243western Europe 1,663,080 1,671,915 2,326,653 1,204,952 1,686,875 1,676,587 1,497,474 1,448,029Germany 357,619 315,895 394,697 245,334 353,576 275,035 260,801 278,318Belgium 47,029 91,784 121,061 12,759 26,306 n/a n/a n/aSpain 152,846 374,049 666,515 357,390 474,387 534,261 439,499 443,638France (1) 439,852 474,178 468,551 228,196 305,250 311,898 284,951 280,000Italy 166,635 246,178 316,031 182,139 265,017 304,742 274,951 269,742Netherlands (4) 32,102 29,832 52,234 26,131 46,081 32,379 30,754 n/aPortugal 58,000 77,466 68,215 24,335 44,166 50,463 47,831 44,318United Kingdom 389,170 270,133 172,442 90,679 123,019 120,189 112,039 87,671Sweden 63,080 74,415 41,384 27,698 40,000 n/a n/a n/aCentral and Eastern Europe 900,516 975,000 323,203 245,150 371,279 449,002 460,253 427,284
turkey 19,352 41,594 133,471 358,674 491,163 549,397 495,682 491,930 North and South America 2,599,948 5,032,605 9,761,798 5,608,388 8,139,331 9,032,009 9,961,555 10,712,033 NAFtA 2,349,318 4,775,818 9,325,214 4,822,200 7,088,685 7,853,153 8,841,625 9,393,967of which: Canada 527,522 850,566 1,411,136 668,215 1,101,112 1,144,639 1,423,066 1,414,615
USA 1,634,846 3,702,787 7,257,640 3,535,809 5,031,439 5,684,544 6,226,752 6,698,944Mexico 186,950 222,465 656,438 618,176 956,134 1,023,970 1,191,807 1,280,408
South America 250,630 256,787 436,584 786,188 1,050,646 1,178,856 1,119,930 1,318,066of which: Argentina 63,153 5,337 100,711 132,857 208,139 251,538 267,119 284,468
Brazil (3) 187,477 251,450 329,519 607,505 797,038 888,472 813,272 998,109 Asia-pacific 4,344,363 4,492,406 4,497,938 6,470,438 8,515,432 8,094,235 8,549,396 8,557,584of which: China - - 1,464,000 3,407,163 4,367,678 3,933,550 3,748,150 4,031,612
South Korea 65,012 334,879 512,990 354,509 405,535 435,477 394,677 398,825India 83,379 186,640 283,403 466,330 725,531 887,267 878,473 741,950Japan 4,004,776 3,538,824 1,781,362 1,071,896 1,318,558 1,240,105 1,388,574 1,440,747
Africa 127,698 125,174 115,305 131,668 158,204 181,052 205,019 226,930of which: South Africa 127,698 125,174 126,787 150,942 176,655 220,280 264,551 280,656 totAl 9,675,970 12,399,000 17,158,509 14,019,270 19,362,284 19,982,282 21,169,379 21,863,790
62_AnALysis And highLighTs / CoMIté DES ConStRuCtEuRS FRAnçAIS D’AutoMoBIlES CoMIté DES ConStRuCtEuRS FRAnçAIS D’AutoMoBIlES / AnALysis And highLighTs_63
wOrlD
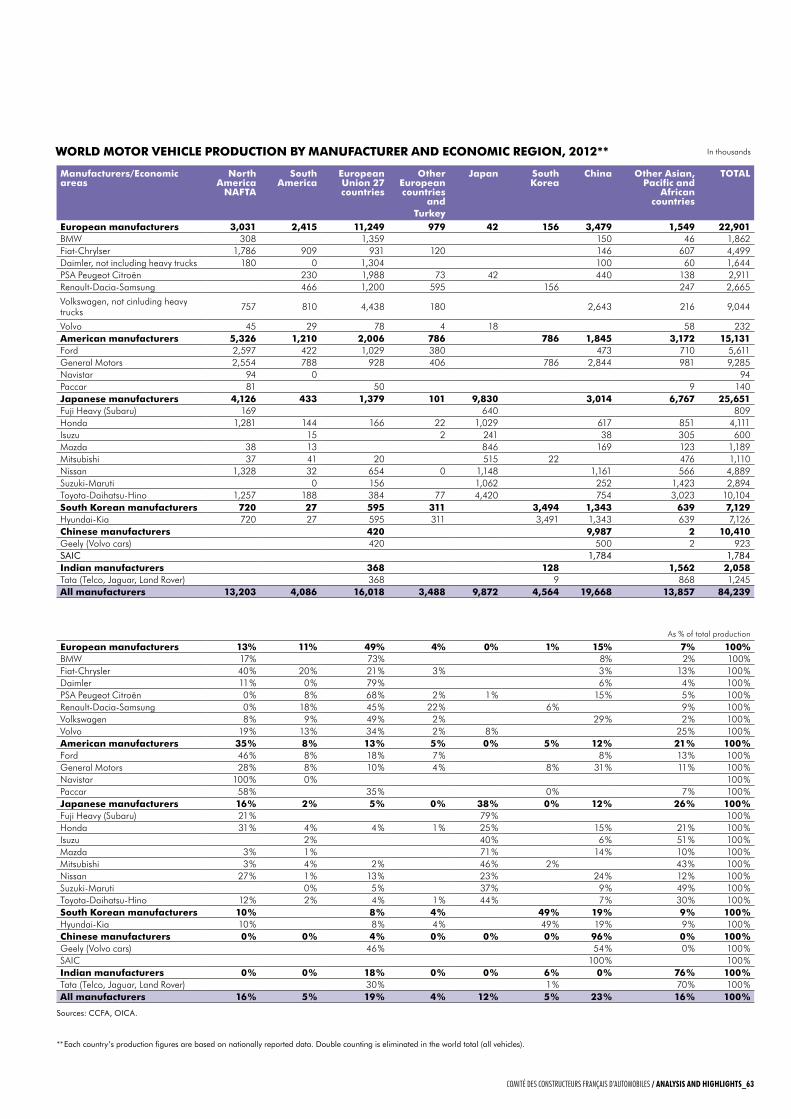
manufacturers/Economic areas
North America
NAFtA
South America
European union 27 countries
other European countries
and turkey
Japan South korea
China other Asian, pacific and
African countries
totAl
European manufacturers 3,031 2,415 11,249 979 42 156 3,479 1,549 22,901BMw 308 1,359 150 46 1,862Fiat-Chrylser 1,786 909 931 120 146 607 4,499Daimler, not including heavy trucks 180 0 1,304 100 60 1,644PSA Peugeot Citroën 230 1,988 73 42 440 138 2,911renault-Dacia-Samsung 466 1,200 595 156 247 2,665
Volkswagen, not cinluding heavy trucks 757 810 4,438 180 2,643 216 9,044
Volvo 45 29 78 4 18 58 232American manufacturers 5,326 1,210 2,006 786 786 1,845 3,172 15,131Ford 2,597 422 1,029 380 473 710 5,611General Motors 2,554 788 928 406 786 2,844 981 9,285Navistar 94 0 94Paccar 81 50 9 140Japanese manufacturers 4,126 433 1,379 101 9,830 3,014 6,767 25,651Fuji Heavy (Subaru) 169 640 809Honda 1,281 144 166 22 1,029 617 851 4,111Isuzu 15 2 241 38 305 600Mazda 38 13 846 169 123 1,189Mitsubishi 37 41 20 515 22 476 1,110Nissan 1,328 32 654 0 1,148 1,161 566 4,889Suzuki-Maruti 0 156 1,062 252 1,423 2,894Toyota-Daihatsu-Hino 1,257 188 384 77 4,420 754 3,023 10,104South korean manufacturers 720 27 595 311 3,494 1,343 639 7,129Hyundai-Kia 720 27 595 311 3,491 1,343 639 7,126Chinese manufacturers 420 9,987 2 10,410Geely (Volvo cars) 420 500 2 923SAIC 1,784 1,784Indian manufacturers 368 128 1,562 2,058Tata (Telco, Jaguar, land rover) 368 9 868 1,245All manufacturers 13,203 4,086 16,018 3,488 9,872 4,564 19,668 13,857 84,239
As % of total production
European manufacturers 13% 11% 49% 4% 0% 1% 15% 7% 100%BMw 17% 73% 8% 2% 100%Fiat-Chrysler 40 % 20 % 21 % 3 % 3 % 13 % 100 %Daimler 11 % 0 % 79 % 6 % 4 % 100 %PSA Peugeot Citroën 0 % 8 % 68 % 2 % 1 % 15 % 5 % 100 %renault-Dacia-Samsung 0 % 18 % 45 % 22 % 6 % 9 % 100 %Volkswagen 8 % 9 % 49 % 2 % 29 % 2 % 100 %Volvo 19 % 13 % 34 % 2 % 8 % 25 % 100 %American manufacturers 35 % 8 % 13 % 5 % 0 % 5 % 12 % 21 % 100 %Ford 46 % 8 % 18 % 7 % 8 % 13 % 100 %General Motors 28 % 8 % 10 % 4 % 8 % 31 % 11 % 100 %Navistar 100 % 0 % 100 %Paccar 58 % 35 % 0 % 7 % 100 %Japanese manufacturers 16 % 2 % 5 % 0 % 38 % 0 % 12 % 26 % 100 %Fuji Heavy (Subaru) 21 % 79 % 100 %Honda 31 % 4 % 4 % 1 % 25 % 15 % 21 % 100 %Isuzu 2 % 40 % 6 % 51 % 100 %Mazda 3 % 1 % 71 % 14 % 10 % 100 %Mitsubishi 3 % 4 % 2 % 46 % 2 % 43 % 100 %Nissan 27 % 1 % 13 % 23 % 24 % 12 % 100 %Suzuki-Maruti 0 % 5 % 37 % 9 % 49 % 100 %Toyota-Daihatsu-Hino 12 % 2 % 4 % 1 % 44 % 7 % 30 % 100 %South korean manufacturers 10 % 8 % 4 % 49 % 19 % 9 % 100 %Hyundai-Kia 10 % 8 % 4 % 49 % 19 % 9 % 100 %Chinese manufacturers 0 % 0 % 4 % 0 % 0 % 0 % 96 % 0 % 100 %Geely (Volvo cars) 46 % 54 % 0 % 100 %SAIC 100 % 100 %Indian manufacturers 0 % 0 % 18 % 0 % 0 % 6 % 0 % 76 % 100 %Tata (Telco, Jaguar, land rover) 30 % 1 % 70 % 100 %All manufacturers 16 % 5 % 19 % 4 % 12 % 5 % 23 % 16 % 100 %
Sources: CCFA, OICA.
** Each country’s production figures are based on nationally reported data. double counting is eliminated in the world total (all vehicles).
world motor vEhIClE produCtIoN by mANuFACturEr ANd ECoNomIC rEGIoN, 2012** In thousands
62_AnALysis And highLighTs / CoMIté DES ConStRuCtEuRS FRAnçAIS D’AutoMoBIlES CoMIté DES ConStRuCtEuRS FRAnçAIS D’AutoMoBIlES / AnALysis And highLighTs_63
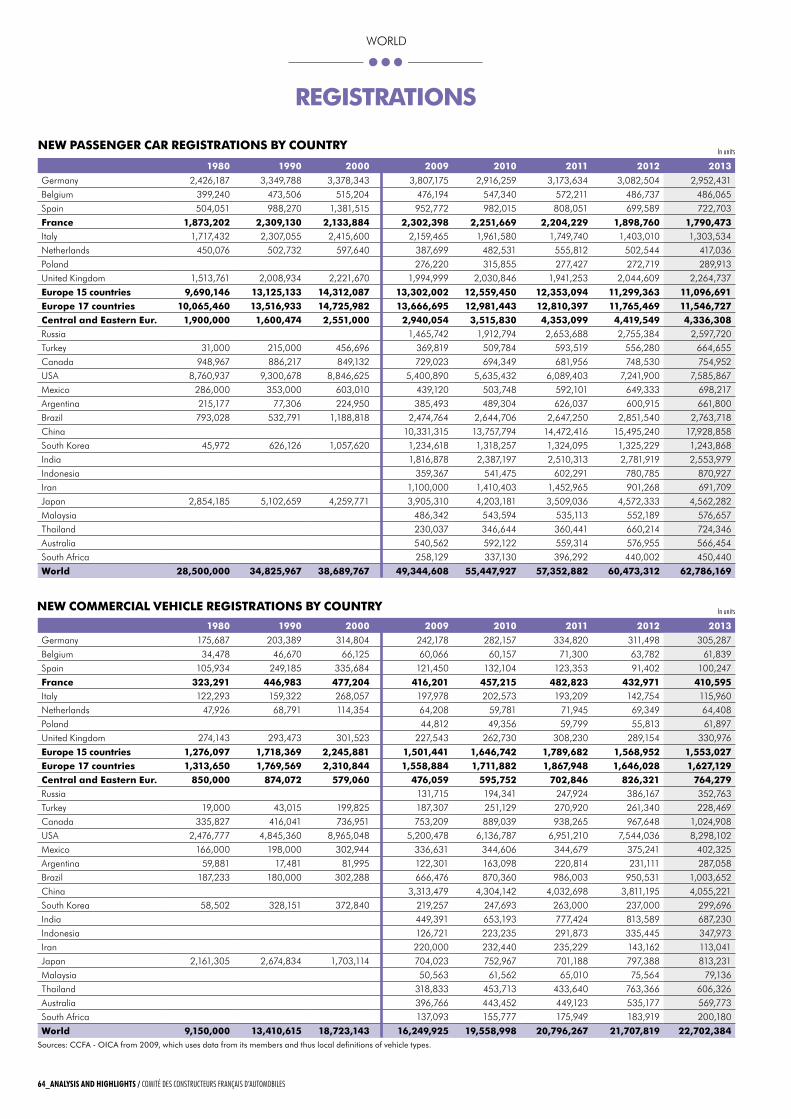
NEw pASSENGEr CAr rEGIStrAtIoNS by CouNtry
1980 1990 2000 2009 2010 2011 2012 2013
Germany 2,426,187 3,349,788 3,378,343 3,807,175 2,916,259 3,173,634 3,082,504 2,952,431
Belgium 399,240 473,506 515,204 476,194 547,340 572,211 486,737 486,065Spain 504,051 988,270 1,381,515 952,772 982,015 808,051 699,589 722,703
France 1,873,202 2,309,130 2,133,884 2,302,398 2,251,669 2,204,229 1,898,760 1,790,473Italy 1,717,432 2,307,055 2,415,600 2,159,465 1,961,580 1,749,740 1,403,010 1,303,534Netherlands 450,076 502,732 597,640 387,699 482,531 555,812 502,544 417,036Poland 276,220 315,855 277,427 272,719 289,913United Kingdom 1,513,761 2,008,934 2,221,670 1,994,999 2,030,846 1,941,253 2,044,609 2,264,737
Europe 15 countries 9,690,146 13,125,133 14,312,087 13,302,002 12,559,450 12,353,094 11,299,363 11,096,691Europe 17 countries 10,065,460 13,516,933 14,725,982 13,666,695 12,981,443 12,810,397 11,765,469 11,546,727Central and Eastern Eur. 1,900,000 1,600,474 2,551,000 2,940,054 3,515,830 4,353,099 4,419,549 4,336,308russia 1,465,742 1,912,794 2,653,688 2,755,384 2,597,720Turkey 31,000 215,000 456,696 369,819 509,784 593,519 556,280 664,655Canada 948,967 886,217 849,132 729,023 694,349 681,956 748,530 754,952USA 8,760,937 9,300,678 8,846,625 5,400,890 5,635,432 6,089,403 7,241,900 7,585,867Mexico 286,000 353,000 603,010 439,120 503,748 592,101 649,333 698,217Argentina 215,177 77,306 224,950 385,493 489,304 626,037 600,915 661,800Brazil 793,028 532,791 1,188,818 2,474,764 2,644,706 2,647,250 2,851,540 2,763,718China 10,331,315 13,757,794 14,472,416 15,495,240 17,928,858South Korea 45,972 626,126 1,057,620 1,234,618 1,318,257 1,324,095 1,325,229 1,243,868India 1,816,878 2,387,197 2,510,313 2,781,919 2,553,979Indonesia 359,367 541,475 602,291 780,785 870,927Iran 1,100,000 1,410,403 1,452,965 901,268 691,709Japan 2,854,185 5,102,659 4,259,771 3,905,310 4,203,181 3,509,036 4,572,333 4,562,282Malaysia 486,342 543,594 535,113 552,189 576,657Thailand 230,037 346,644 360,441 660,214 724,346Australia 540,562 592,122 559,314 576,955 566,454South Africa 258,129 337,130 396,292 440,002 450,440
world 28,500,000 34,825,967 38,689,767 49,344,608 55,447,927 57,352,882 60,473,312 62,786,169
In units
NEw CommErCIAl vEhIClE rEGIStrAtIoNS by CouNtry
Sources: CCFA - OICA from 2009, which uses data from its members and thus local definitions of vehicle types.
In units
1980 1990 2000 2009 2010 2011 2012 2013
Germany 175,687 203,389 314,804 242,178 282,157 334,820 311,498 305,287
Belgium 34,478 46,670 66,125 60,066 60,157 71,300 63,782 61,839Spain 105,934 249,185 335,684 121,450 132,104 123,353 91,402 100,247
France 323,291 446,983 477,204 416,201 457,215 482,823 432,971 410,595Italy 122,293 159,322 268,057 197,978 202,573 193,209 142,754 115,960Netherlands 47,926 68,791 114,354 64,208 59,781 71,945 69,349 64,408Poland 44,812 49,356 59,799 55,813 61,897United Kingdom 274,143 293,473 301,523 227,543 262,730 308,230 289,154 330,976
Europe 15 countries 1,276,097 1,718,369 2,245,881 1,501,441 1,646,742 1,789,682 1,568,952 1,553,027Europe 17 countries 1,313,650 1,769,569 2,310,844 1,558,884 1,711,882 1,867,948 1,646,028 1,627,129Central and Eastern Eur. 850,000 874,072 579,060 476,059 595,752 702,846 826,321 764,279russia 131,715 194,341 247,924 386,167 352,763Turkey 19,000 43,015 199,825 187,307 251,129 270,920 261,340 228,469Canada 335,827 416,041 736,951 753,209 889,039 938,265 967,648 1,024,908USA 2,476,777 4,845,360 8,965,048 5,200,478 6,136,787 6,951,210 7,544,036 8,298,102Mexico 166,000 198,000 302,944 336,631 344,606 344,679 375,241 402,325Argentina 59,881 17,481 81,995 122,301 163,098 220,814 231,111 287,058Brazil 187,233 180,000 302,288 666,476 870,360 986,003 950,531 1,003,652China 3,313,479 4,304,142 4,032,698 3,811,195 4,055,221South Korea 58,502 328,151 372,840 219,257 247,693 263,000 237,000 299,696India 449,391 653,193 777,424 813,589 687,230Indonesia 126,721 223,235 291,873 335,445 347,973Iran 220,000 232,440 235,229 143,162 113,041Japan 2,161,305 2,674,834 1,703,114 704,023 752,967 701,188 797,388 813,231Malaysia 50,563 61,562 65,010 75,564 79,136Thailand 318,833 453,713 433,640 763,366 606,326Australia 396,766 443,452 449,123 535,177 569,773South Africa 137,093 155,777 175,949 183,919 200,180
world 9,150,000 13,410,615 18,723,143 16,249,925 19,558,998 20,796,267 21,707,819 22,702,384
rEGIStrAtIoNS
64_AnALysis And highLighTs / CoMIté DES ConStRuCtEuRS FRAnçAIS D’AutoMoBIlES CoMIté DES ConStRuCtEuRS FRAnçAIS D’AutoMoBIlES / AnALysis And highLighTs_65
wOrlD
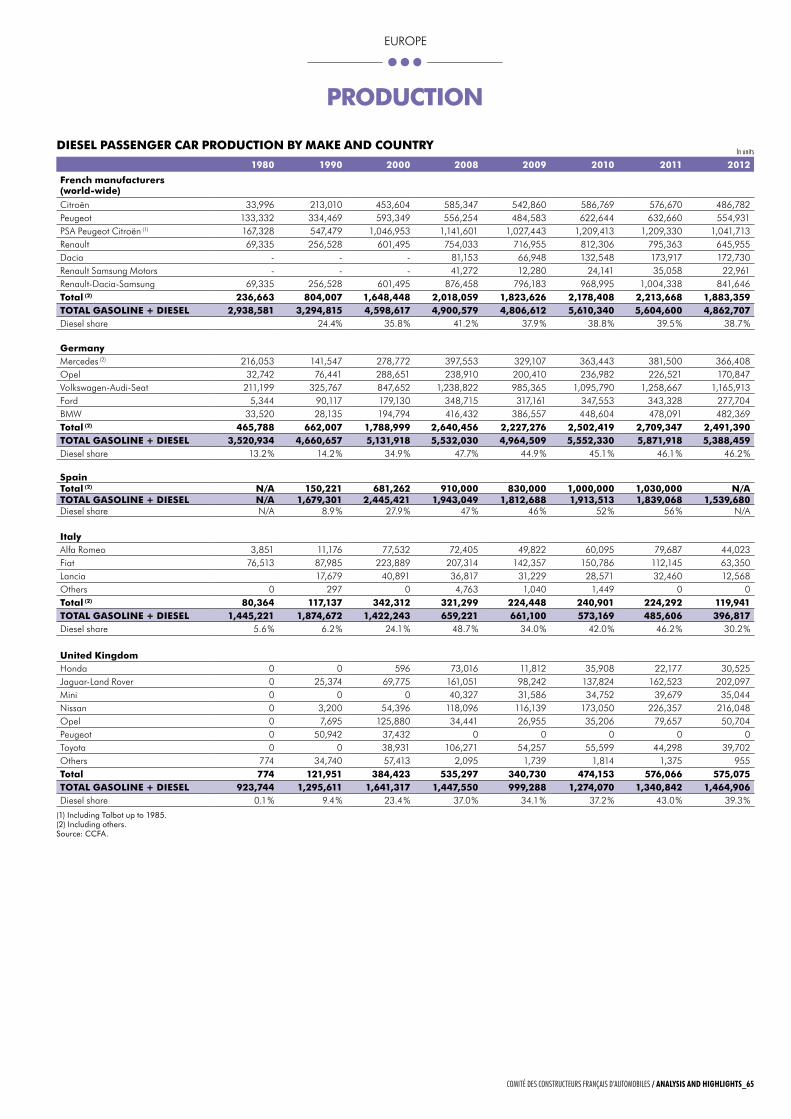
produCtIoN
dIESEl pASSENGEr CAr produCtIoN by mAkE ANd CouNtry
1980 1990 2000 2008 2009 2010 2011 2012
French manufacturers (world-wide)
Citroën 33,996 213,010 453,604 585,347 542,860 586,769 576,670 486,782Peugeot 133,332 334,469 593,349 556,254 484,583 622,644 632,660 554,931PSA Peugeot Citroën (1) 167,328 547,479 1,046,953 1,141,601 1,027,443 1,209,413 1,209,330 1,041,713renault 69,335 256,528 601,495 754,033 716,955 812,306 795,363 645,955Dacia - - - 81,153 66,948 132,548 173,917 172,730renault Samsung Motors - - - 41,272 12,280 24,141 35,058 22,961renault-Dacia-Samsung 69,335 256,528 601,495 876,458 796,183 968,995 1,004,338 841,646total (2) 236,663 804,007 1,648,448 2,018,059 1,823,626 2,178,408 2,213,668 1,883,359totAl GASolINE + dIESEl 2,938,581 3,294,815 4,598,617 4,900,579 4,806,612 5,610,340 5,604,600 4,862,707Diesel share 24.4% 35.8 % 41.2 % 37.9 % 38.8 % 39.5 % 38.7 %
GermanyMercedes (2) 216,053 141,547 278,772 397,553 329,107 363,443 381,500 366,408Opel 32,742 76,441 288,651 238,910 200,410 236,982 226,521 170,847Volkswagen-Audi-Seat 211,199 325,767 847,652 1,238,822 985,365 1,095,790 1,258,667 1,165,913Ford 5,344 90,117 179,130 348,715 317,161 347,553 343,328 277,704BMw 33,520 28,135 194,794 416,432 386,557 448,604 478,091 482,369total (2) 465,788 662,007 1,788,999 2,640,456 2,227,276 2,502,419 2,709,347 2,491,390totAl GASolINE + dIESEl 3,520,934 4,660,657 5,131,918 5,532,030 4,964,509 5,552,330 5,871,918 5,388,459Diesel share 13.2 % 14.2 % 34.9 % 47.7% 44.9 % 45.1 % 46.1 % 46.2 %
Spaintotal (2) N/A 150,221 681,262 910,000 830,000 1,000,000 1,030,000 N/AtotAl GASolINE + dIESEl N/A 1,679,301 2,445,421 1,943,049 1,812,688 1,913,513 1,839,068 1,539,680Diesel share N/A 8.9 % 27.9 % 47 % 46 % 52 % 56 % N/A
ItalyAlfa romeo 3,851 11,176 77,532 72,405 49,822 60,095 79,687 44,023Fiat 76,513 87,985 223,889 207,314 142,357 150,786 112,145 63,350lancia 17,679 40,891 36,817 31,229 28,571 32,460 12,568Others 0 297 0 4,763 1,040 1,449 0 0total (2) 80,364 117,137 342,312 321,299 224,448 240,901 224,292 119,941totAl GASolINE + dIESEl 1,445,221 1,874,672 1,422,243 659,221 661,100 573,169 485,606 396,817Diesel share 5.6 % 6.2 % 24.1 % 48.7 % 34.0 % 42.0 % 46.2 % 30.2 %
united kingdomHonda 0 0 596 73,016 11,812 35,908 22,177 30,525Jaguar-land rover 0 25,374 69,775 161,051 98,242 137,824 162,523 202,097Mini 0 0 0 40,327 31,586 34,752 39,679 35,044Nissan 0 3,200 54,396 118,096 116,139 173,050 226,357 216,048Opel 0 7,695 125,880 34,441 26,955 35,206 79,657 50,704Peugeot 0 50,942 37,432 0 0 0 0 0Toyota 0 0 38,931 106,271 54,257 55,599 44,298 39,702Others 774 34,740 57,413 2,095 1,739 1,814 1,375 955total 774 121,951 384,423 535,297 340,730 474,153 576,066 575,075totAl GASolINE + dIESEl 923,744 1,295,611 1,641,317 1,447,550 999,288 1,274,070 1,340,842 1,464,906Diesel share 0.1 % 9.4 % 23.4 % 37.0 % 34.1 % 37.2 % 43.0 % 39.3 %
In units
(1) Including talbot up to 1985.(2) Including others.Source: CCFA.
64_AnALysis And highLighTs / CoMIté DES ConStRuCtEuRS FRAnçAIS D’AutoMoBIlES CoMIté DES ConStRuCtEuRS FRAnçAIS D’AutoMoBIlES / AnALysis And highLighTs_65
EUrOPE
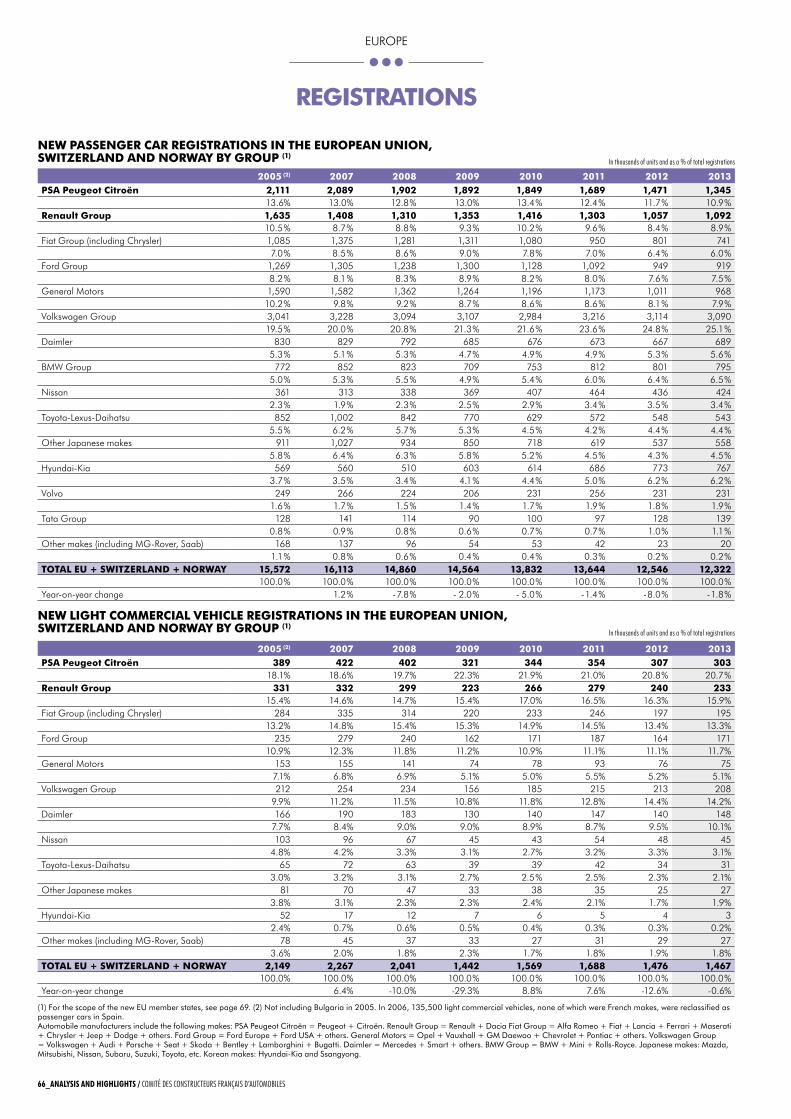
rEGIStrAtIoNS
NEw pASSENGEr CAr rEGIStrAtIoNS IN thE EuropEAN uNIoN, SwItZErlANd ANd NorwAy by Group (1)
NEw lIGht CommErCIAl vEhIClE rEGIStrAtIoNS IN thE EuropEAN uNIoN, SwItZErlANd ANd NorwAy by Group (1)
2005 (2) 2007 2008 2009 2010 2011 2012 2013pSA peugeot Citroën 2,111 2,089 1,902 1,892 1,849 1,689 1,471 1,345
13.6% 13.0% 12.8 % 13.0% 13.4 % 12.4 % 11.7 % 10.9 %renault Group 1,635 1,408 1,310 1,353 1,416 1,303 1,057 1,092
10.5 % 8.7 % 8.8 % 9.3 % 10.2 % 9.6 % 8.4 % 8.9 %Fiat Group (including Chrysler) 1,085 1,375 1,281 1,311 1,080 950 801 741
7.0 % 8.5 % 8.6 % 9.0 % 7.8 % 7.0 % 6.4 % 6.0 %Ford Group 1,269 1,305 1,238 1,300 1,128 1,092 949 919
8.2 % 8.1 % 8.3 % 8.9 % 8.2 % 8.0 % 7.6 % 7.5 %General Motors 1,590 1,582 1,362 1,264 1,196 1,173 1,011 968
10.2 % 9.8 % 9.2 % 8.7 % 8.6 % 8.6 % 8.1 % 7.9 %Volkswagen Group 3,041 3,228 3,094 3,107 2,984 3,216 3,114 3,090
19.5 % 20.0 % 20.8 % 21.3 % 21.6 % 23.6 % 24.8 % 25.1 %Daimler 830 829 792 685 676 673 667 689
5.3 % 5.1 % 5.3 % 4.7 % 4.9 % 4.9 % 5.3 % 5.6 %BMw Group 772 852 823 709 753 812 801 795
5.0 % 5.3 % 5.5 % 4.9 % 5.4 % 6.0 % 6.4 % 6.5 %Nissan 361 313 338 369 407 464 436 424
2.3 % 1.9 % 2.3 % 2.5 % 2.9 % 3.4 % 3.5 % 3.4 %Toyota-lexus-Daihatsu 852 1,002 842 770 629 572 548 543
5.5 % 6.2 % 5.7 % 5.3 % 4.5 % 4.2 % 4.4 % 4.4 %Other Japanese makes 911 1,027 934 850 718 619 537 558
5.8 % 6.4 % 6.3 % 5.8 % 5.2 % 4.5 % 4.3 % 4.5 %Hyundai-Kia 569 560 510 603 614 686 773 767
3.7 % 3.5 % 3.4 % 4.1 % 4.4 % 5.0 % 6.2 % 6.2 %Volvo 249 266 224 206 231 256 231 231
1.6 % 1.7 % 1.5 % 1.4 % 1.7 % 1.9 % 1.8 % 1.9 %Tata Group 128 141 114 90 100 97 128 139
0.8 % 0.9 % 0.8 % 0.6 % 0.7 % 0.7 % 1.0 % 1.1 %Other makes (including MG-rover, Saab) 168 137 96 54 53 42 23 20
1.1 % 0.8 % 0.6 % 0.4 % 0.4 % 0.3 % 0.2 % 0.2 %totAl Eu + SwItZErlANd + NorwAy 15,572 16,113 14,860 14,564 13,832 13,644 12,546 12,322
100.0 % 100.0 % 100.0 % 100.0 % 100.0 % 100.0 % 100.0 % 100.0 %Year-on-year change 1.2 % - 7.8 % - 2.0 % - 5.0 % - 1.4 % - 8.0 % - 1.8 %
2005 (2) 2007 2008 2009 2010 2011 2012 2013pSA peugeot Citroën 389 422 402 321 344 354 307 303
18.1% 18.6% 19.7% 22.3% 21.9% 21.0% 20.8 % 20.7 %renault Group 331 332 299 223 266 279 240 233
15.4% 14.6% 14.7% 15.4% 17.0% 16.5% 16.3% 15.9%Fiat Group (including Chrysler) 284 335 314 220 233 246 197 195
13.2% 14.8% 15.4% 15.3% 14.9% 14.5% 13.4% 13.3%Ford Group 235 279 240 162 171 187 164 171
10.9% 12.3% 11.8% 11.2% 10.9% 11.1% 11.1% 11.7%General Motors 153 155 141 74 78 93 76 75
7.1% 6.8% 6.9% 5.1% 5.0% 5.5% 5.2% 5.1%Volkswagen Group 212 254 234 156 185 215 213 208
9.9% 11.2% 11.5% 10.8% 11.8% 12.8% 14.4% 14.2%Daimler 166 190 183 130 140 147 140 148
7.7% 8.4% 9.0% 9.0% 8.9% 8.7% 9.5% 10.1%Nissan 103 96 67 45 43 54 48 45
4.8% 4.2% 3.3% 3.1% 2.7% 3.2% 3.3% 3.1%Toyota-lexus-Daihatsu 65 72 63 39 39 42 34 31
3.0% 3.2% 3.1% 2.7% 2.5 % 2.5% 2.3% 2.1%Other Japanese makes 81 70 47 33 38 35 25 27
3.8% 3.1% 2.3% 2.3% 2.4% 2.1% 1.7% 1.9%Hyundai-Kia 52 17 12 7 6 5 4 3
2.4% 0.7% 0.6% 0.5% 0.4% 0.3% 0.3% 0.2%Other makes (including MG-rover, Saab) 78 45 37 33 27 31 29 27
3.6% 2.0% 1.8% 2.3% 1.7% 1.8% 1.9% 1.8%totAl Eu + SwItZErlANd + NorwAy 2,149 2,267 2,041 1,442 1,569 1,688 1,476 1,467
100.0% 100.0% 100.0% 100.0 % 100.0 % 100.0 % 100.0 % 100.0 %Year-on-year change 6.4% -10.0% -29.3% 8.8% 7.6% -12.6% -0.6%
(1) For the scope of the new EU member states, see page 69. (2) Not including bulgaria in 2005. In 2006, 135,500 light commercial vehicles, none of which were French makes, were reclassified as passenger cars in Spain. Automobile manufacturers include the following makes: PSA Peugeot Citroën = Peugeot + Citroën. Renault group = Renault + dacia Fiat group = Alfa Romeo + Fiat + lancia + Ferrari + maserati + Chrysler + jeep + dodge + others. Ford group = Ford Europe + Ford USA + others. general motors = Opel + vauxhall + gm daewoo + Chevrolet + Pontiac + others. volkswagen group = volkswagen + Audi + Porsche + Seat + Skoda + bentley + lamborghini + bugatti. daimler = mercedes + Smart + others. bmw group = bmw + mini + Rolls-Royce. japanese makes: mazda, mitsubishi, Nissan, Subaru, Suzuki, toyota, etc. korean makes: hyundai-kia and Ssangyong.
In thousands of units and as a % of total registrations
In thousands of units and as a % of total registrations
66_AnALysis And highLighTs / CoMIté DES ConStRuCtEuRS FRAnçAIS D’AutoMoBIlES CoMIté DES ConStRuCtEuRS FRAnçAIS D’AutoMoBIlES / AnALysis And highLighTs_67
EUrOPE
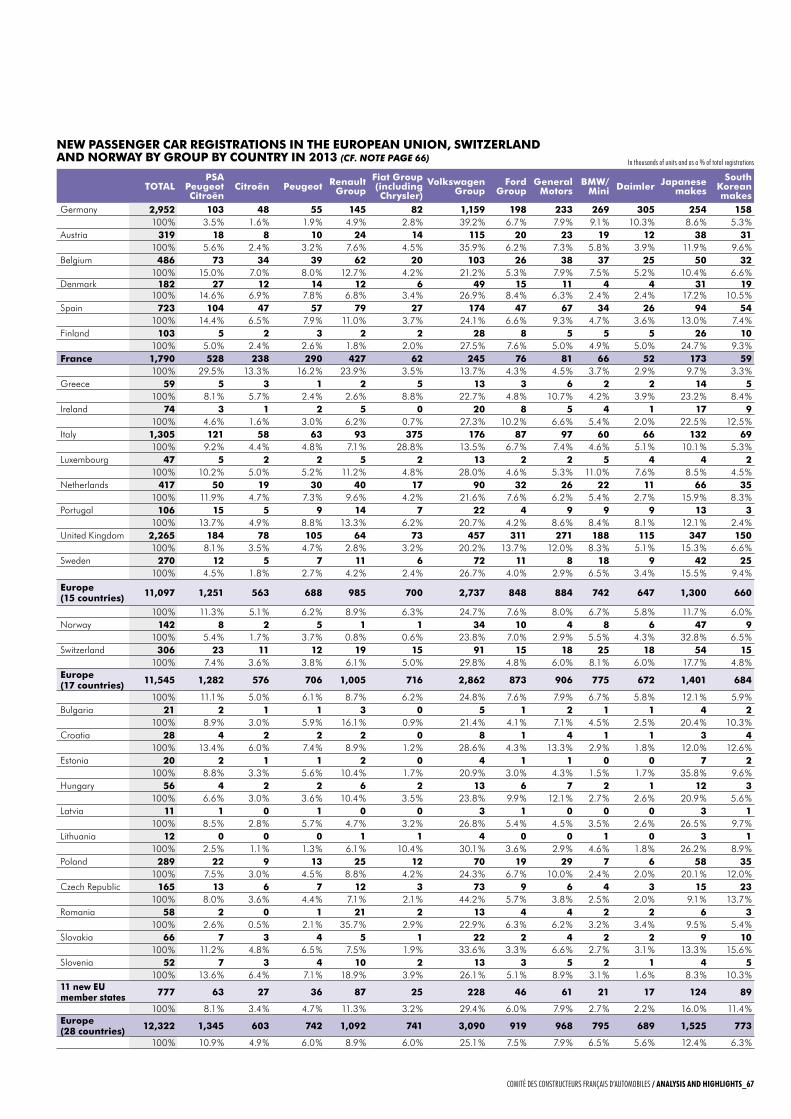
NEw pASSENGEr CAr rEGIStrAtIoNS IN thE EuropEAN uNIoN, SwItZErlANd ANd NorwAy by Group by CouNtry IN 2013 (cf. NotE pagE 66)
totAlpSA
peugeot Citroën
Citroën peugeot renault Group
Fiat Group (including Chrysler)
volkswagen Group
Ford Group
General motors
bmw/mini daimler Japanese
makesSouth
korean makes
Germany 2,952 103 48 55 145 82 1,159 198 233 269 305 254 158100 % 3.5 % 1.6 % 1.9 % 4.9 % 2.8 % 39.2 % 6.7 % 7.9 % 9.1 % 10.3 % 8.6 % 5.3 %
Austria 319 18 8 10 24 14 115 20 23 19 12 38 31100 % 5.6 % 2.4 % 3.2 % 7.6 % 4.5 % 35.9 % 6.2 % 7.3 % 5.8 % 3.9 % 11.9 % 9.6 %
Belgium 486 73 34 39 62 20 103 26 38 37 25 50 32100 % 15.0 % 7.0 % 8.0 % 12.7 % 4.2 % 21.2 % 5.3 % 7.9 % 7.5 % 5.2 % 10.4 % 6.6 %
Denmark 182 27 12 14 12 6 49 15 11 4 4 31 19100 % 14.6 % 6.9 % 7.8 % 6.8 % 3.4 % 26.9 % 8.4 % 6.3 % 2.4 % 2.4 % 17.2 % 10.5 %
Spain 723 104 47 57 79 27 174 47 67 34 26 94 54100 % 14.4 % 6.5 % 7.9 % 11.0 % 3.7 % 24.1 % 6.6 % 9.3 % 4.7 % 3.6 % 13.0 % 7.4 %
Finland 103 5 2 3 2 2 28 8 5 5 5 26 10100 % 5.0 % 2.4 % 2.6 % 1.8 % 2.0 % 27.5 % 7.6 % 5.0 % 4.9 % 5.0 % 24.7 % 9.3 %
France 1,790 528 238 290 427 62 245 76 81 66 52 173 59100 % 29.5 % 13.3 % 16.2 % 23.9 % 3.5 % 13.7 % 4.3 % 4.5 % 3.7 % 2.9 % 9.7 % 3.3 %
Greece 59 5 3 1 2 5 13 3 6 2 2 14 5100 % 8.1 % 5.7 % 2.4 % 2.6 % 8.8 % 22.7 % 4.8 % 10.7 % 4.2 % 3.9 % 23.2 % 8.4 %
Ireland 74 3 1 2 5 0 20 8 5 4 1 17 9100 % 4.6 % 1.6 % 3.0 % 6.2 % 0.7 % 27.3 % 10.2 % 6.6 % 5.4 % 2.0 % 22.5 % 12.5 %
Italy 1,305 121 58 63 93 375 176 87 97 60 66 132 69100 % 9.2 % 4.4 % 4.8 % 7.1 % 28.8 % 13.5 % 6.7 % 7.4 % 4.6 % 5.1 % 10.1 % 5.3 %
luxembourg 47 5 2 2 5 2 13 2 2 5 4 4 2100 % 10.2 % 5.0 % 5.2 % 11.2 % 4.8 % 28.0 % 4.6 % 5.3 % 11.0 % 7.6 % 8.5 % 4.5 %
Netherlands 417 50 19 30 40 17 90 32 26 22 11 66 35100 % 11.9 % 4.7 % 7.3 % 9.6 % 4.2 % 21.6 % 7.6 % 6.2 % 5.4 % 2.7 % 15.9 % 8.3 %
Portugal 106 15 5 9 14 7 22 4 9 9 9 13 3100 % 13.7 % 4.9 % 8.8 % 13.3 % 6.2 % 20.7 % 4.2 % 8.6 % 8.4 % 8.1 % 12.1 % 2.4 %
United Kingdom 2,265 184 78 105 64 73 457 311 271 188 115 347 150100 % 8.1 % 3.5 % 4.7 % 2.8 % 3.2 % 20.2 % 13.7 % 12.0 % 8.3 % 5.1 % 15.3 % 6.6 %
Sweden 270 12 5 7 11 6 72 11 8 18 9 42 25100 % 4.5 % 1.8 % 2.7 % 4.2 % 2.4 % 26.7 % 4.0 % 2.9 % 6.5 % 3.4 % 15.5 % 9.4 %
Europe (15 countries) 11,097 1,251 563 688 985 700 2,737 848 884 742 647 1,300 660
100 % 11.3 % 5.1 % 6.2 % 8.9 % 6.3 % 24.7 % 7.6 % 8.0 % 6.7 % 5.8 % 11.7 % 6.0 %Norway 142 8 2 5 1 1 34 10 4 8 6 47 9
100 % 5.4 % 1.7 % 3.7 % 0.8 % 0.6 % 23.8 % 7.0 % 2.9 % 5.5 % 4.3 % 32.8 % 6.5 %Switzerland 306 23 11 12 19 15 91 15 18 25 18 54 15
100 % 7.4 % 3.6 % 3.8 % 6.1 % 5.0 % 29.8 % 4.8 % 6.0 % 8.1 % 6.0 % 17.7 % 4.8 %Europe (17 countries) 11,545 1,282 576 706 1,005 716 2,862 873 906 775 672 1,401 684
100 % 11.1 % 5.0 % 6.1 % 8.7 % 6.2 % 24.8 % 7.6 % 7.9 % 6.7 % 5.8 % 12.1 % 5.9 %Bulgaria 21 2 1 1 3 0 5 1 2 1 1 4 2
100 % 8.9 % 3.0 % 5.9 % 16.1 % 0.9 % 21.4 % 4.1 % 7.1 % 4.5 % 2.5 % 20.4 % 10.3 %Croatia 28 4 2 2 2 0 8 1 4 1 1 3 4
100 % 13.4 % 6.0 % 7.4 % 8.9 % 1.2 % 28.6 % 4.3 % 13.3 % 2.9 % 1.8 % 12.0 % 12.6 %Estonia 20 2 1 1 2 0 4 1 1 0 0 7 2
100 % 8.8 % 3.3 % 5.6 % 10.4 % 1.7 % 20.9 % 3.0 % 4.3 % 1.5 % 1.7 % 35.8 % 9.6 %Hungary 56 4 2 2 6 2 13 6 7 2 1 12 3
100 % 6.6 % 3.0 % 3.6 % 10.4 % 3.5 % 23.8 % 9.9 % 12.1 % 2.7 % 2.6 % 20.9 % 5.6 %latvia 11 1 0 1 0 0 3 1 0 0 0 3 1
100 % 8.5 % 2.8 % 5.7 % 4.7 % 3.2 % 26.8 % 5.4 % 4.5 % 3.5 % 2.6 % 26.5 % 9.7 %lithuania 12 0 0 0 1 1 4 0 0 1 0 3 1
100 % 2.5 % 1.1 % 1.3 % 6.1 % 10.4 % 30.1 % 3.6 % 2.9 % 4.6 % 1.8 % 26.2 % 8.9 %Poland 289 22 9 13 25 12 70 19 29 7 6 58 35
100 % 7.5 % 3.0 % 4.5 % 8.8 % 4.2 % 24.3 % 6.7 % 10.0 % 2.4 % 2.0 % 20.1 % 12.0 %Czech republic 165 13 6 7 12 3 73 9 6 4 3 15 23
100 % 8.0 % 3.6 % 4.4 % 7.1 % 2.1 % 44.2 % 5.7 % 3.8 % 2.5 % 2.0 % 9.1 % 13.7 %romania 58 2 0 1 21 2 13 4 4 2 2 6 3
100 % 2.6 % 0.5 % 2.1 % 35.7 % 2.9 % 22.9 % 6.3 % 6.2 % 3.2 % 3.4 % 9.5 % 5.4 %Slovakia 66 7 3 4 5 1 22 2 4 2 2 9 10
100 % 11.2 % 4.8 % 6.5 % 7.5 % 1.9 % 33.6 % 3.3 % 6.6 % 2.7 % 3.1 % 13.3 % 15.6 %Slovenia 52 7 3 4 10 2 13 3 5 2 1 4 5
100 % 13.6 % 6.4 % 7.1 % 18.9 % 3.9 % 26.1 % 5.1 % 8.9 % 3.1 % 1.6 % 8.3 % 10.3 %11 new Eu member states 777 63 27 36 87 25 228 46 61 21 17 124 89
100 % 8.1 % 3.4 % 4.7 % 11.3 % 3.2 % 29.4 % 6.0 % 7.9 % 2.7 % 2.2 % 16.0 % 11.4 %Europe (28 countries) 12,322 1,345 603 742 1,092 741 3,090 919 968 795 689 1,525 773
100 % 10.9 % 4.9 % 6.0 % 8.9 % 6.0 % 25.1 % 7.5 % 7.9 % 6.5 % 5.6 % 12.4 % 6.3 %
In thousands of units and as a % of total registrations
66_AnALysis And highLighTs / CoMIté DES ConStRuCtEuRS FRAnçAIS D’AutoMoBIlES CoMIté DES ConStRuCtEuRS FRAnçAIS D’AutoMoBIlES / AnALysis And highLighTs_67
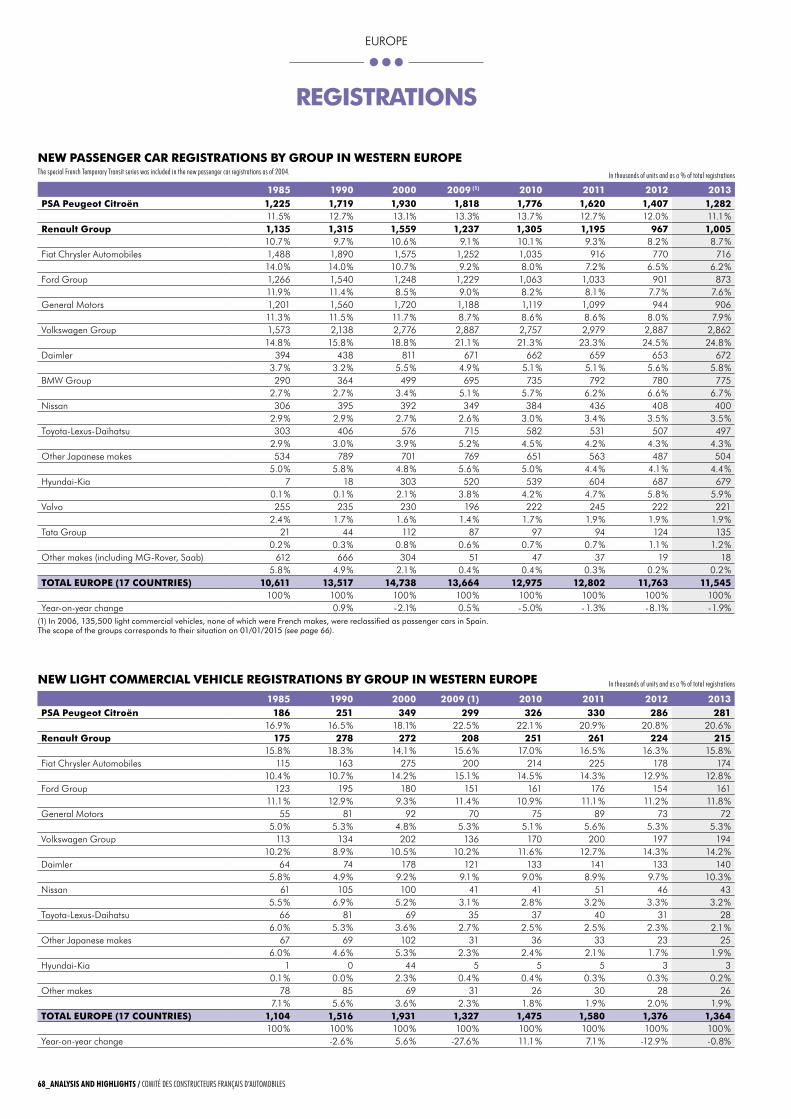
rEGIStrAtIoNS
(1) In 2006, 135,500 light commercial vehicles, none of which were French makes, were reclassified as passenger cars in Spain.the scope of the groups corresponds to their situation on 01/01/2015 (see page 66).
NEw pASSENGEr CAr rEGIStrAtIoNS by Group IN wEStErN EuropEthe special French temporary transit series was included in the new passenger car registrations as of 2004.
NEw lIGht CommErCIAl vEhIClE rEGIStrAtIoNS by Group IN wEStErN EuropE
1985 1990 2000 2009 (1) 2010 2011 2012 2013 pSA peugeot Citroën 1,225 1,719 1,930 1,818 1,776 1,620 1,407 1,282
11.5% 12.7% 13.1% 13.3% 13.7 % 12.7 % 12.0 % 11.1 %renault Group 1,135 1,315 1,559 1,237 1,305 1,195 967 1,005
10.7 % 9.7 % 10.6 % 9.1 % 10.1 % 9.3 % 8.2 % 8.7 %Fiat Chrysler Automobiles 1,488 1,890 1,575 1,252 1,035 916 770 716
14.0 % 14.0 % 10.7 % 9.2 % 8.0 % 7.2 % 6.5 % 6.2 %Ford Group 1,266 1,540 1,248 1,229 1,063 1,033 901 873
11.9 % 11.4 % 8.5 % 9.0 % 8.2 % 8.1 % 7.7 % 7.6 %General Motors 1,201 1,560 1,720 1,188 1,119 1,099 944 906
11.3 % 11.5 % 11.7 % 8.7 % 8.6 % 8.6 % 8.0 % 7.9 %Volkswagen Group 1,573 2,138 2,776 2,887 2,757 2,979 2,887 2,862
14.8 % 15.8 % 18.8 % 21.1 % 21.3 % 23.3 % 24.5 % 24.8 %Daimler 394 438 811 671 662 659 653 672
3.7 % 3.2 % 5.5 % 4.9 % 5.1 % 5.1 % 5.6 % 5.8 %BMw Group 290 364 499 695 735 792 780 775
2.7 % 2.7 % 3.4 % 5.1 % 5.7 % 6.2 % 6.6 % 6.7 %Nissan 306 395 392 349 384 436 408 400
2.9 % 2.9 % 2.7 % 2.6 % 3.0 % 3.4 % 3.5 % 3.5 %Toyota-lexus-Daihatsu 303 406 576 715 582 531 507 497
2.9 % 3.0 % 3.9 % 5.2 % 4.5 % 4.2 % 4.3 % 4.3 %Other Japanese makes 534 789 701 769 651 563 487 504
5.0 % 5.8 % 4.8 % 5.6 % 5.0 % 4.4 % 4.1 % 4.4 %Hyundai-Kia 7 18 303 520 539 604 687 679
0.1 % 0.1 % 2.1 % 3.8 % 4.2 % 4.7 % 5.8 % 5.9 %Volvo 255 235 230 196 222 245 222 221
2.4 % 1.7 % 1.6 % 1.4 % 1.7 % 1.9 % 1.9 % 1.9 %Tata Group 21 44 112 87 97 94 124 135
0.2 % 0.3 % 0.8 % 0.6 % 0.7 % 0.7 % 1.1 % 1.2 %Other makes (including MG-rover, Saab) 612 666 304 51 47 37 19 18
5.8 % 4.9 % 2.1 % 0.4 % 0.4 % 0.3 % 0.2 % 0.2 %totAl EuropE (17 CouNtrIES) 10,611 13,517 14,738 13,664 12,975 12,802 11,763 11,545
100 % 100 % 100 % 100 % 100 % 100 % 100 % 100 %Year-on-year change 0.9 % - 2.1% 0.5 % - 5.0% - 1.3% - 8.1% - 1.9%
1985 1990 2000 2009 (1) 2010 2011 2012 2013 pSA peugeot Citroën 186 251 349 299 326 330 286 281
16.9 % 16.5 % 18.1% 22.5 % 22.1 % 20.9 % 20.8 % 20.6 %renault Group 175 278 272 208 251 261 224 215
15.8 % 18.3 % 14.1 % 15.6 % 17.0 % 16.5 % 16.3 % 15.8 %Fiat Chrysler Automobiles 115 163 275 200 214 225 178 174
10.4 % 10.7 % 14.2 % 15.1 % 14.5 % 14.3 % 12.9 % 12.8 %Ford Group 123 195 180 151 161 176 154 161
11.1 % 12.9 % 9.3 % 11.4 % 10.9 % 11.1 % 11.2 % 11.8 %General Motors 55 81 92 70 75 89 73 72
5.0 % 5.3 % 4.8 % 5.3 % 5.1 % 5.6 % 5.3 % 5.3 %Volkswagen Group 113 134 202 136 170 200 197 194
10.2 % 8.9 % 10.5 % 10.2 % 11.6 % 12.7 % 14.3 % 14.2 %Daimler 64 74 178 121 133 141 133 140
5.8 % 4.9 % 9.2 % 9.1 % 9.0 % 8.9 % 9.7 % 10.3 %Nissan 61 105 100 41 41 51 46 43
5.5 % 6.9 % 5.2 % 3.1 % 2.8 % 3.2 % 3.3 % 3.2 %Toyota-lexus-Daihatsu 66 81 69 35 37 40 31 28
6.0 % 5.3 % 3.6 % 2.7 % 2.5 % 2.5 % 2.3 % 2.1 %Other Japanese makes 67 69 102 31 36 33 23 25
6.0 % 4.6 % 5.3 % 2.3 % 2.4 % 2.1 % 1.7 % 1.9 %Hyundai-Kia 1 0 44 5 5 5 3 3
0.1 % 0.0 % 2.3 % 0.4 % 0.4 % 0.3 % 0.3 % 0.2 %Other makes 78 85 69 31 26 30 28 26
7.1 % 5.6 % 3.6 % 2.3 % 1.8 % 1.9 % 2.0 % 1.9 %totAl EuropE (17 CouNtrIES) 1,104 1,516 1,931 1,327 1,475 1,580 1,376 1,364
100 % 100 % 100 % 100 % 100 % 100 % 100 % 100 %Year-on-year change -2.6 % 5.6 % -27.6 % 11.1 % 7.1 % -12.9 % -0.8%
In thousands of units and as a % of total registrations
In thousands of units and as a % of total registrations
68_AnALysis And highLighTs / CoMIté DES ConStRuCtEuRS FRAnçAIS D’AutoMoBIlES CoMIté DES ConStRuCtEuRS FRAnçAIS D’AutoMoBIlES / AnALysis And highLighTs_69
EUrOPE
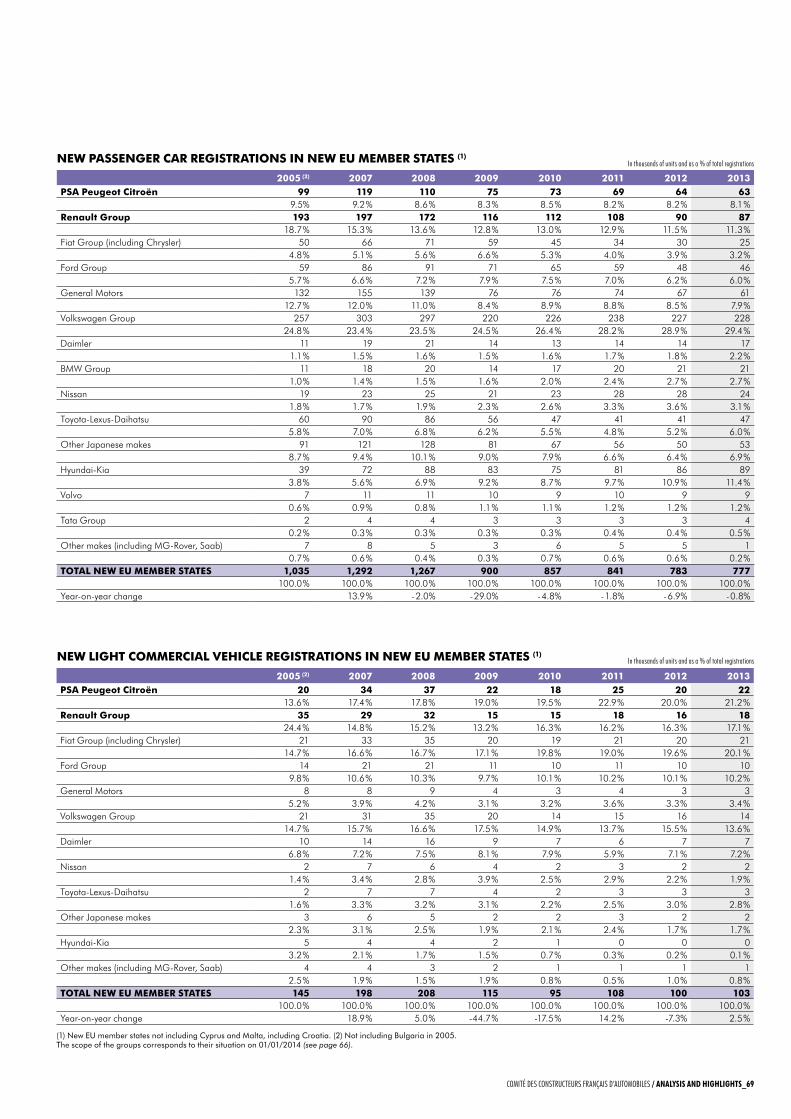
(1) New EU member states not including Cyprus and malta, including Croatia. (2) Not including bulgaria in 2005.the scope of the groups corresponds to their situation on 01/01/2014 (see page 66).
NEw pASSENGEr CAr rEGIStrAtIoNS IN NEw Eu mEmbEr StAtES (1)
NEw lIGht CommErCIAl vEhIClE rEGIStrAtIoNS IN NEw Eu mEmbEr StAtES (1)
2005 (2) 2007 2008 2009 2010 2011 2012 2013pSA peugeot Citroën 99 119 110 75 73 69 64 63
9.5% 9.2 % 8.6 % 8.3 % 8.5 % 8.2 % 8.2 % 8.1 %renault Group 193 197 172 116 112 108 90 87
18.7 % 15.3 % 13.6 % 12.8 % 13.0 % 12.9 % 11.5 % 11.3 %Fiat Group (including Chrysler) 50 66 71 59 45 34 30 25
4.8 % 5.1 % 5.6 % 6.6 % 5.3 % 4.0 % 3.9 % 3.2 %Ford Group 59 86 91 71 65 59 48 46
5.7 % 6.6 % 7.2 % 7.9 % 7.5 % 7.0 % 6.2 % 6.0 %General Motors 132 155 139 76 76 74 67 61
12.7 % 12.0 % 11.0 % 8.4 % 8.9 % 8.8 % 8.5 % 7.9 %Volkswagen Group 257 303 297 220 226 238 227 228
24.8 % 23.4 % 23.5 % 24.5 % 26.4 % 28.2 % 28.9 % 29.4 %Daimler 11 19 21 14 13 14 14 17
1.1 % 1.5 % 1.6 % 1.5 % 1.6 % 1.7 % 1.8 % 2.2 %BMw Group 11 18 20 14 17 20 21 21
1.0 % 1.4 % 1.5 % 1.6 % 2.0 % 2.4 % 2.7 % 2.7 %Nissan 19 23 25 21 23 28 28 24
1.8 % 1.7 % 1.9 % 2.3 % 2.6 % 3.3 % 3.6 % 3.1 %Toyota-lexus-Daihatsu 60 90 86 56 47 41 41 47
5.8 % 7.0 % 6.8 % 6.2 % 5.5 % 4.8 % 5.2 % 6.0 %Other Japanese makes 91 121 128 81 67 56 50 53
8.7 % 9.4 % 10.1 % 9.0 % 7.9 % 6.6 % 6.4 % 6.9 %Hyundai-Kia 39 72 88 83 75 81 86 89
3.8 % 5.6 % 6.9 % 9.2 % 8.7 % 9.7 % 10.9 % 11.4 %Volvo 7 11 11 10 9 10 9 9
0.6 % 0.9 % 0.8 % 1.1 % 1.1 % 1.2 % 1.2 % 1.2 %Tata Group 2 4 4 3 3 3 3 4
0.2 % 0.3 % 0.3 % 0.3 % 0.3 % 0.4 % 0.4 % 0.5 %Other makes (including MG-rover, Saab) 7 8 5 3 6 5 5 1
0.7 % 0.6 % 0.4 % 0.3 % 0.7 % 0.6 % 0.6 % 0.2 %totAl NEw Eu mEmbEr StAtES 1,035 1,292 1,267 900 857 841 783 777
100.0 % 100.0 % 100.0 % 100.0 % 100.0 % 100.0 % 100.0 % 100.0 %Year-on-year change 13.9 % - 2.0% - 29.0% - 4.8% - 1.8% - 6.9% - 0.8%
2005 (2) 2007 2008 2009 2010 2011 2012 2013pSA peugeot Citroën 20 34 37 22 18 25 20 22
13.6 % 17.4 % 17.8 % 19.0 % 19.5 % 22.9 % 20.0 % 21.2 %renault Group 35 29 32 15 15 18 16 18
24.4 % 14.8 % 15.2 % 13.2 % 16.3 % 16.2 % 16.3 % 17.1 %Fiat Group (including Chrysler) 21 33 35 20 19 21 20 21
14.7 % 16.6 % 16.7 % 17.1 % 19.8 % 19.0 % 19.6 % 20.1 %Ford Group 14 21 21 11 10 11 10 10
9.8 % 10.6 % 10.3 % 9.7 % 10.1 % 10.2 % 10.1 % 10.2 %General Motors 8 8 9 4 3 4 3 3
5.2 % 3.9 % 4.2 % 3.1 % 3.2 % 3.6 % 3.3 % 3.4 %Volkswagen Group 21 31 35 20 14 15 16 14
14.7 % 15.7 % 16.6 % 17.5 % 14.9 % 13.7 % 15.5 % 13.6 %Daimler 10 14 16 9 7 6 7 7
6.8 % 7.2 % 7.5 % 8.1 % 7.9 % 5.9 % 7.1 % 7.2 %Nissan 2 7 6 4 2 3 2 2
1.4 % 3.4 % 2.8 % 3.9 % 2.5 % 2.9 % 2.2 % 1.9 %Toyota-lexus-Daihatsu 2 7 7 4 2 3 3 3
1.6 % 3.3 % 3.2 % 3.1 % 2.2 % 2.5 % 3.0 % 2.8 %Other Japanese makes 3 6 5 2 2 3 2 2
2.3 % 3.1 % 2.5 % 1.9 % 2.1 % 2.4 % 1.7 % 1.7 %Hyundai-Kia 5 4 4 2 1 0 0 0
3.2 % 2.1 % 1.7 % 1.5 % 0.7 % 0.3 % 0.2 % 0.1 %Other makes (including MG-rover, Saab) 4 4 3 2 1 1 1 1
2.5 % 1.9 % 1.5 % 1.9 % 0.8 % 0.5 % 1.0 % 0.8 %totAl NEw Eu mEmbEr StAtES 145 198 208 115 95 108 100 103
100.0 % 100.0 % 100.0 % 100.0 % 100.0 % 100.0 % 100.0 % 100.0 %Year-on-year change 18.9 % 5.0 % -44.7 % -17.5 % 14.2 % -7.3% 2.5 %
In thousands of units and as a % of total registrations
In thousands of units and as a % of total registrations
68_AnALysis And highLighTs / CoMIté DES ConStRuCtEuRS FRAnçAIS D’AutoMoBIlES CoMIté DES ConStRuCtEuRS FRAnçAIS D’AutoMoBIlES / AnALysis And highLighTs_69
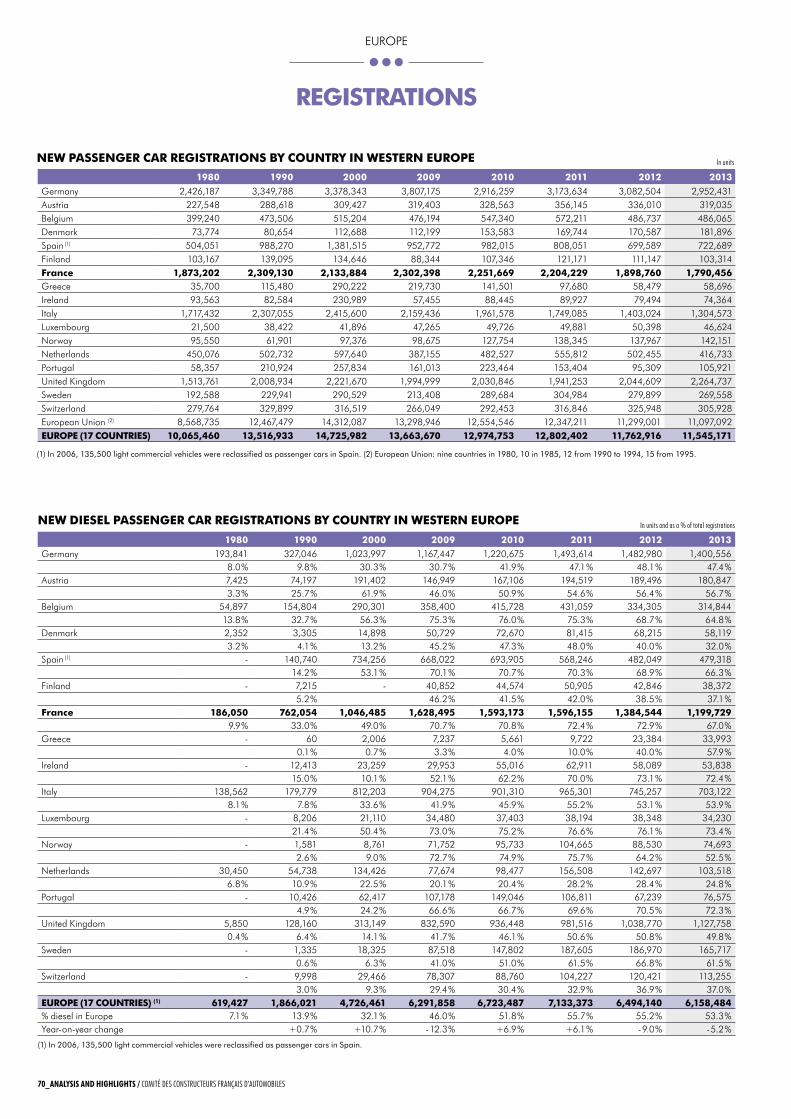
(1) In 2006, 135,500 light commercial vehicles were reclassified as passenger cars in Spain. (2) European Union: nine countries in 1980, 10 in 1985, 12 from 1990 to 1994, 15 from 1995.
NEw pASSENGEr CAr rEGIStrAtIoNS by CouNtry IN wEStErN EuropE
1980 1990 2000 2009 2010 2011 2012 2013
Germany 2,426,187 3,349,788 3,378,343 3,807,175 2,916,259 3,173,634 3,082,504 2,952,431Austria 227,548 288,618 309,427 319,403 328,563 356,145 336,010 319,035Belgium 399,240 473,506 515,204 476,194 547,340 572,211 486,737 486,065Denmark 73,774 80,654 112,688 112,199 153,583 169,744 170,587 181,896Spain (1) 504,051 988,270 1,381,515 952,772 982,015 808,051 699,589 722,689Finland 103,167 139,095 134,646 88,344 107,346 121,171 111,147 103,314France 1,873,202 2,309,130 2,133,884 2,302,398 2,251,669 2,204,229 1,898,760 1,790,456Greece 35,700 115,480 290,222 219,730 141,501 97,680 58,479 58,696Ireland 93,563 82,584 230,989 57,455 88,445 89,927 79,494 74,364Italy 1,717,432 2,307,055 2,415,600 2,159,436 1,961,578 1,749,085 1,403,024 1,304,573luxembourg 21,500 38,422 41,896 47,265 49,726 49,881 50,398 46,624Norway 95,550 61,901 97,376 98,675 127,754 138,345 137,967 142,151Netherlands 450,076 502,732 597,640 387,155 482,527 555,812 502,455 416,733Portugal 58,357 210,924 257,834 161,013 223,464 153,404 95,309 105,921United Kingdom 1,513,761 2,008,934 2,221,670 1,994,999 2,030,846 1,941,253 2,044,609 2,264,737Sweden 192,588 229,941 290,529 213,408 289,684 304,984 279,899 269,558Switzerland 279,764 329,899 316,519 266,049 292,453 316,846 325,948 305,928European Union (2) 8,568,735 12,467,479 14,312,087 13,298,946 12,554,546 12,347,211 11,299,001 11,097,092EuropE (17 CouNtrIES) 10,065,460 13,516,933 14,725,982 13,663,670 12,974,753 12,802,402 11,762,916 11,545,171
In units
NEw dIESEl pASSENGEr CAr rEGIStrAtIoNS by CouNtry IN wEStErN EuropE
1980 1990 2000 2009 2010 2011 2012 2013 Germany 193,841 327,046 1,023,997 1,167,447 1,220,675 1,493,614 1,482,980 1,400,556
8.0 % 9.8 % 30.3 % 30.7 % 41.9 % 47.1 % 48.1 % 47.4 %Austria 7,425 74,197 191,402 146,949 167,106 194,519 189,496 180,847
3.3 % 25.7 % 61.9 % 46.0 % 50.9 % 54.6 % 56.4 % 56.7 %Belgium 54,897 154,804 290,301 358,400 415,728 431,059 334,305 314,844
13.8 % 32.7 % 56.3 % 75.3 % 76.0 % 75.3 % 68.7 % 64.8 %Denmark 2,352 3,305 14,898 50,729 72,670 81,415 68,215 58,119
3.2 % 4.1 % 13.2 % 45.2 % 47.3 % 48.0 % 40.0 % 32.0 %Spain (1) - 140,740 734,256 668,022 693,905 568,246 482,049 479,318
14.2 % 53.1 % 70.1 % 70.7 % 70.3 % 68.9 % 66.3 %Finland - 7,215 - 40,852 44,574 50,905 42,846 38,372
5.2 % 46.2 % 41.5 % 42.0 % 38.5 % 37.1 %France 186,050 762,054 1,046,485 1,628,495 1,593,173 1,596,155 1,384,544 1,199,729
9.9 % 33.0 % 49.0 % 70.7 % 70.8 % 72.4 % 72.9 % 67.0 %Greece - 60 2,006 7,237 5,661 9,722 23,384 33,993
0.1 % 0.7 % 3.3 % 4.0 % 10.0 % 40.0 % 57.9 %Ireland - 12,413 23,259 29,953 55,016 62,911 58,089 53,838
15.0 % 10.1 % 52.1 % 62.2 % 70.0 % 73.1 % 72.4 %Italy 138,562 179,779 812,203 904,275 901,310 965,301 745,257 703,122
8.1 % 7.8 % 33.6 % 41.9 % 45.9 % 55.2 % 53.1 % 53.9 %luxembourg - 8,206 21,110 34,480 37,403 38,194 38,348 34,230
21.4 % 50.4 % 73.0 % 75.2 % 76.6 % 76.1 % 73.4 %Norway - 1,581 8,761 71,752 95,733 104,665 88,530 74,693
2.6 % 9.0 % 72.7 % 74.9 % 75.7 % 64.2 % 52.5 %Netherlands 30,450 54,738 134,426 77,674 98,477 156,508 142,697 103,518
6.8 % 10.9 % 22.5 % 20.1 % 20.4 % 28.2 % 28.4 % 24.8 %Portugal - 10,426 62,417 107,178 149,046 106,811 67,239 76,575
4.9 % 24.2 % 66.6 % 66.7 % 69.6 % 70.5 % 72.3 %United Kingdom 5,850 128,160 313,149 832,590 936,448 981,516 1,038,770 1,127,758
0.4 % 6.4 % 14.1 % 41.7 % 46.1 % 50.6 % 50.8 % 49.8 %Sweden - 1,335 18,325 87,518 147,802 187,605 186,970 165,717
0.6 % 6.3 % 41.0 % 51.0 % 61.5 % 66.8 % 61.5 %Switzerland - 9,998 29,466 78,307 88,760 104,227 120,421 113,255
3.0 % 9.3 % 29.4 % 30.4 % 32.9 % 36.9 % 37.0 %EuropE (17 CouNtrIES) (1) 619,427 1,866,021 4,726,461 6,291,858 6,723,487 7,133,373 6,494,140 6,158,484% diesel in Europe 7.1 % 13.9 % 32.1 % 46.0 % 51.8 % 55.7 % 55.2 % 53.3 %Year-on-year change +0.7 % +10.7 % - 12.3 % +6.9 % +6.1 % - 9.0 % - 5.2 %
In units and as a % of total registrations
(1) In 2006, 135,500 light commercial vehicles were reclassified as passenger cars in Spain.
rEGIStrAtIoNS
70_AnALysis And highLighTs / CoMIté DES ConStRuCtEuRS FRAnçAIS D’AutoMoBIlES CoMIté DES ConStRuCtEuRS FRAnçAIS D’AutoMoBIlES / AnALysis And highLighTs_71
EUrOPE
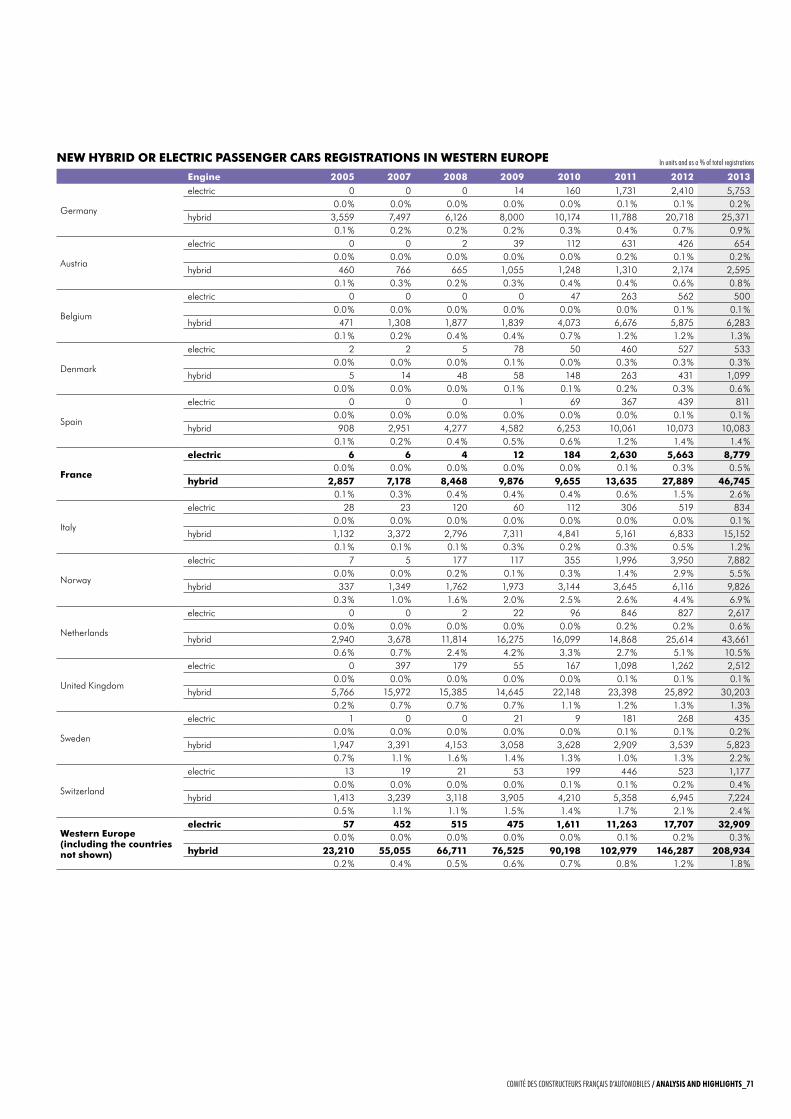
Engine 2005 2007 2008 2009 2010 2011 2012 2013
Germany
electric 0 0 0 14 160 1,731 2,410 5,7530.0 % 0.0 % 0.0 % 0.0 % 0.0 % 0.1 % 0.1 % 0.2 %
hybrid 3,559 7,497 6,126 8,000 10,174 11,788 20,718 25,3710.1 % 0.2 % 0.2 % 0.2 % 0.3 % 0.4 % 0.7 % 0.9 %
Austria
electric 0 0 2 39 112 631 426 6540.0 % 0.0 % 0.0 % 0.0 % 0.0 % 0.2 % 0.1 % 0.2 %
hybrid 460 766 665 1,055 1,248 1,310 2,174 2,5950.1 % 0.3 % 0.2 % 0.3 % 0.4 % 0.4 % 0.6 % 0.8 %
Belgium
electric 0 0 0 0 47 263 562 5000.0 % 0.0 % 0.0 % 0.0 % 0.0 % 0.0 % 0.1 % 0.1 %
hybrid 471 1,308 1,877 1,839 4,073 6,676 5,875 6,2830.1 % 0.2 % 0.4 % 0.4 % 0.7 % 1.2 % 1.2 % 1.3 %
Denmark
electric 2 2 5 78 50 460 527 5330.0 % 0.0 % 0.0 % 0.1 % 0.0 % 0.3 % 0.3 % 0.3 %
hybrid 5 14 48 58 148 263 431 1,0990.0 % 0.0 % 0.0 % 0.1 % 0.1 % 0.2 % 0.3 % 0.6 %
Spain
electric 0 0 0 1 69 367 439 8110.0 % 0.0 % 0.0 % 0.0 % 0.0 % 0.0 % 0.1 % 0.1 %
hybrid 908 2,951 4,277 4,582 6,253 10,061 10,073 10,0830.1 % 0.2 % 0.4 % 0.5 % 0.6 % 1.2 % 1.4 % 1.4 %
France
electric 6 6 4 12 184 2,630 5,663 8,7790.0 % 0.0 % 0.0 % 0.0 % 0.0 % 0.1 % 0.3 % 0.5 %
hybrid 2,857 7,178 8,468 9,876 9,655 13,635 27,889 46,7450.1 % 0.3 % 0.4 % 0.4 % 0.4 % 0.6 % 1.5 % 2.6 %
Italy
electric 28 23 120 60 112 306 519 8340.0 % 0.0 % 0.0 % 0.0 % 0.0 % 0.0 % 0.0 % 0.1 %
hybrid 1,132 3,372 2,796 7,311 4,841 5,161 6,833 15,1520.1 % 0.1 % 0.1 % 0.3 % 0.2 % 0.3 % 0.5 % 1.2 %
Norway
electric 7 5 177 117 355 1,996 3,950 7,8820.0 % 0.0 % 0.2 % 0.1 % 0.3 % 1.4 % 2.9 % 5.5 %
hybrid 337 1,349 1,762 1,973 3,144 3,645 6,116 9,8260.3 % 1.0 % 1.6 % 2.0 % 2.5 % 2.6 % 4.4 % 6.9 %
Netherlands
electric 0 0 2 22 96 846 827 2,6170.0 % 0.0 % 0.0 % 0.0 % 0.0 % 0.2 % 0.2 % 0.6 %
hybrid 2,940 3,678 11,814 16,275 16,099 14,868 25,614 43,6610.6 % 0.7 % 2.4 % 4.2 % 3.3 % 2.7 % 5.1 % 10.5 %
United Kingdom
electric 0 397 179 55 167 1,098 1,262 2,5120.0 % 0.0 % 0.0 % 0.0 % 0.0 % 0.1 % 0.1 % 0.1 %
hybrid 5,766 15,972 15,385 14,645 22,148 23,398 25,892 30,2030.2 % 0.7 % 0.7 % 0.7 % 1.1 % 1.2 % 1.3 % 1.3 %
Sweden
electric 1 0 0 21 9 181 268 4350.0 % 0.0 % 0.0 % 0.0 % 0.0 % 0.1 % 0.1 % 0.2 %
hybrid 1,947 3,391 4,153 3,058 3,628 2,909 3,539 5,8230.7 % 1.1 % 1.6 % 1.4 % 1.3 % 1.0 % 1.3 % 2.2 %
Switzerland
electric 13 19 21 53 199 446 523 1,1770.0 % 0.0 % 0.0 % 0.0 % 0.1 % 0.1 % 0.2 % 0.4 %
hybrid 1,413 3,239 3,118 3,905 4,210 5,358 6,945 7,2240.5 % 1.1 % 1.1 % 1.5 % 1.4 % 1.7 % 2.1 % 2.4 %
western Europe (including the countries not shown)
electric 57 452 515 475 1,611 11,263 17,707 32,9090.0 % 0.0 % 0.0 % 0.0 % 0.0 % 0.1 % 0.2 % 0.3 %
hybrid 23,210 55,055 66,711 76,525 90,198 102,979 146,287 208,9340.2 % 0.4 % 0.5 % 0.6 % 0.7 % 0.8 % 1.2 % 1.8 %
NEw hybrId or ElECtrIC pASSENGEr CArS rEGIStrAtIoNS IN wEStErN EuropE In units and as a % of total registrations
70_AnALysis And highLighTs / CoMIté DES ConStRuCtEuRS FRAnçAIS D’AutoMoBIlES CoMIté DES ConStRuCtEuRS FRAnçAIS D’AutoMoBIlES / AnALysis And highLighTs_71
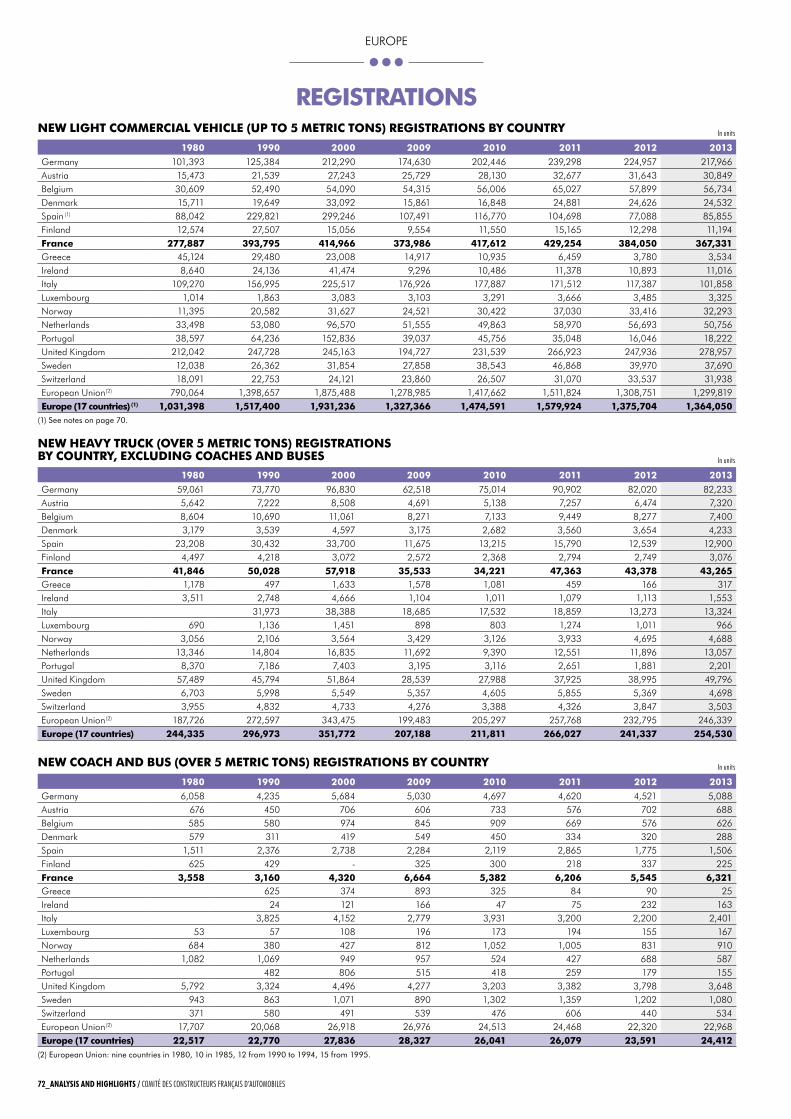
(1) See notes on page 70.
(2) European Union: nine countries in 1980, 10 in 1985, 12 from 1990 to 1994, 15 from 1995.
NEw lIGht CommErCIAl vEhIClE (up to 5 mEtrIC toNS) rEGIStrAtIoNS by CouNtry
NEw hEAvy truCk (ovEr 5 mEtrIC toNS) rEGIStrAtIoNS by CouNtry, ExCludING CoAChES ANd buSES
NEw CoACh ANd buS (ovEr 5 mEtrIC toNS) rEGIStrAtIoNS by CouNtry
1980 1990 2000 2009 2010 2011 2012 2013
Germany 101,393 125,384 212,290 174,630 202,446 239,298 224,957 217,966Austria 15,473 21,539 27,243 25,729 28,130 32,677 31,643 30,849Belgium 30,609 52,490 54,090 54,315 56,006 65,027 57,899 56,734Denmark 15,711 19,649 33,092 15,861 16,848 24,881 24,626 24,532Spain (1) 88,042 229,821 299,246 107,491 116,770 104,698 77,088 85,855Finland 12,574 27,507 15,056 9,554 11,550 15,165 12,298 11,194France 277,887 393,795 414,966 373,986 417,612 429,254 384,050 367,331Greece 45,124 29,480 23,008 14,917 10,935 6,459 3,780 3,534Ireland 8,640 24,136 41,474 9,296 10,486 11,378 10,893 11,016Italy 109,270 156,995 225,517 176,926 177,887 171,512 117,387 101,858luxembourg 1,014 1,863 3,083 3,103 3,291 3,666 3,485 3,325Norway 11,395 20,582 31,627 24,521 30,422 37,030 33,416 32,293Netherlands 33,498 53,080 96,570 51,555 49,863 58,970 56,693 50,756Portugal 38,597 64,236 152,836 39,037 45,756 35,048 16,046 18,222United Kingdom 212,042 247,728 245,163 194,727 231,539 266,923 247,936 278,957Sweden 12,038 26,362 31,854 27,858 38,543 46,868 39,970 37,690Switzerland 18,091 22,753 24,121 23,860 26,507 31,070 33,537 31,938European Union (2) 790,064 1,398,657 1,875,488 1,278,985 1,417,662 1,511,824 1,308,751 1,299,819Europe (17 countries) (1) 1,031,398 1,517,400 1,931,236 1,327,366 1,474,591 1,579,924 1,375,704 1,364,050
1980 1990 2000 2009 2010 2011 2012 2013
Germany 59,061 73,770 96,830 62,518 75,014 90,902 82,020 82,233Austria 5,642 7,222 8,508 4,691 5,138 7,257 6,474 7,320Belgium 8,604 10,690 11,061 8,271 7,133 9,449 8,277 7,400Denmark 3,179 3,539 4,597 3,175 2,682 3,560 3,654 4,233Spain 23,208 30,432 33,700 11,675 13,215 15,790 12,539 12,900Finland 4,497 4,218 3,072 2,572 2,368 2,794 2,749 3,076France 41,846 50,028 57,918 35,533 34,221 47,363 43,378 43,265Greece 1,178 497 1,633 1,578 1,081 459 166 317Ireland 3,511 2,748 4,666 1,104 1,011 1,079 1,113 1,553Italy 31,973 38,388 18,685 17,532 18,859 13,273 13,324luxembourg 690 1,136 1,451 898 803 1,274 1,011 966Norway 3,056 2,106 3,564 3,429 3,126 3,933 4,695 4,688Netherlands 13,346 14,804 16,835 11,692 9,390 12,551 11,896 13,057Portugal 8,370 7,186 7,403 3,195 3,116 2,651 1,881 2,201United Kingdom 57,489 45,794 51,864 28,539 27,988 37,925 38,995 49,796Sweden 6,703 5,998 5,549 5,357 4,605 5,855 5,369 4,698Switzerland 3,955 4,832 4,733 4,276 3,388 4,326 3,847 3,503European Union (2) 187,726 272,597 343,475 199,483 205,297 257,768 232,795 246,339Europe (17 countries) 244,335 296,973 351,772 207,188 211,811 266,027 241,337 254,530
1980 1990 2000 2009 2010 2011 2012 2013
Germany 6,058 4,235 5,684 5,030 4,697 4,620 4,521 5,088Austria 676 450 706 606 733 576 702 688Belgium 585 580 974 845 909 669 576 626Denmark 579 311 419 549 450 334 320 288Spain 1,511 2,376 2,738 2,284 2,119 2,865 1,775 1,506Finland 625 429 - 325 300 218 337 225France 3,558 3,160 4,320 6,664 5,382 6,206 5,545 6,321Greece 625 374 893 325 84 90 25Ireland 24 121 166 47 75 232 163Italy 3,825 4,152 2,779 3,931 3,200 2,200 2,401luxembourg 53 57 108 196 173 194 155 167Norway 684 380 427 812 1,052 1,005 831 910Netherlands 1,082 1,069 949 957 524 427 688 587Portugal 482 806 515 418 259 179 155United Kingdom 5,792 3,324 4,496 4,277 3,203 3,382 3,798 3,648Sweden 943 863 1,071 890 1,302 1,359 1,202 1,080Switzerland 371 580 491 539 476 606 440 534European Union (2) 17,707 20,068 26,918 26,976 24,513 24,468 22,320 22,968Europe (17 countries) 22,517 22,770 27,836 28,327 26,041 26,079 23,591 24,412
In units
In units
In units
rEGIStrAtIoNS
72_AnALysis And highLighTs / CoMIté DES ConStRuCtEuRS FRAnçAIS D’AutoMoBIlES CoMIté DES ConStRuCtEuRS FRAnçAIS D’AutoMoBIlES / AnALysis And highLighTs_73
EUrOPE
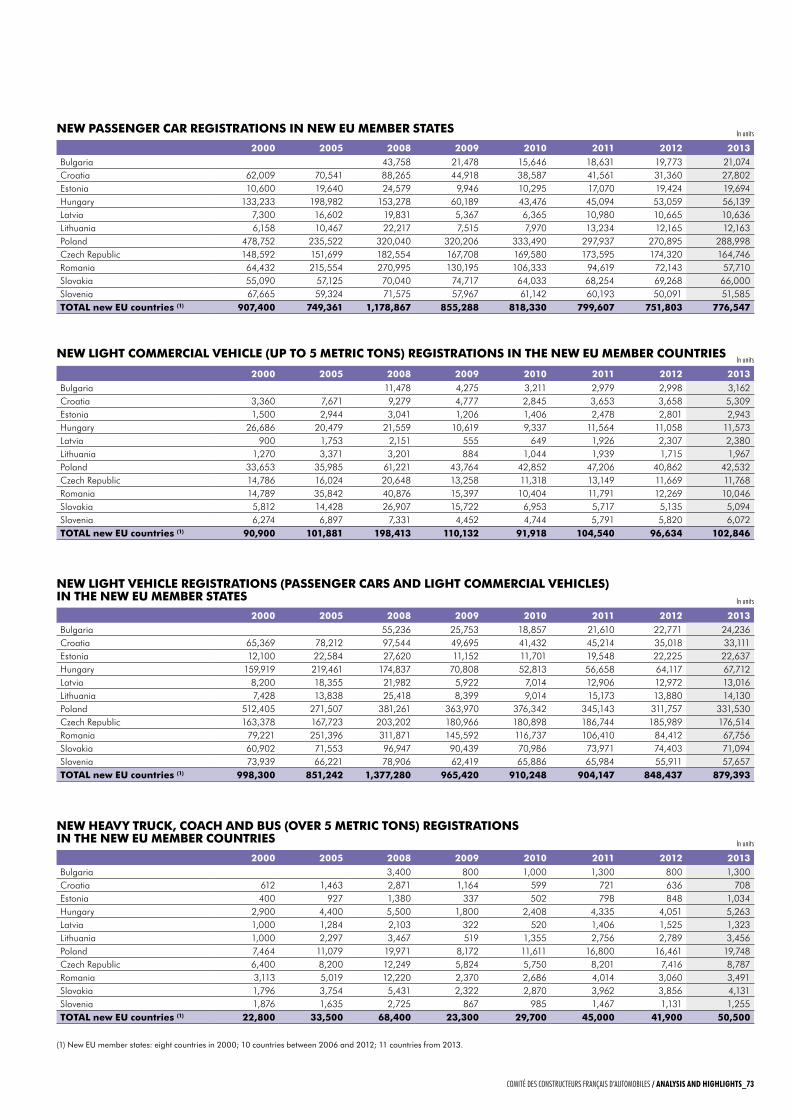
NEw pASSENGEr CAr rEGIStrAtIoNS IN NEw Eu mEmbEr StAtES
2000 2005 2008 2009 2010 2011 2012 2013Bulgaria 43,758 21,478 15,646 18,631 19,773 21,074Croatia 62,009 70,541 88,265 44,918 38,587 41,561 31,360 27,802Estonia 10,600 19,640 24,579 9,946 10,295 17,070 19,424 19,694Hungary 133,233 198,982 153,278 60,189 43,476 45,094 53,059 56,139latvia 7,300 16,602 19,831 5,367 6,365 10,980 10,665 10,636lithuania 6,158 10,467 22,217 7,515 7,970 13,234 12,165 12,163Poland 478,752 235,522 320,040 320,206 333,490 297,937 270,895 288,998Czech republic 148,592 151,699 182,554 167,708 169,580 173,595 174,320 164,746romania 64,432 215,554 270,995 130,195 106,333 94,619 72,143 57,710Slovakia 55,090 57,125 70,040 74,717 64,033 68,254 69,268 66,000Slovenia 67,665 59,324 71,575 57,967 61,142 60,193 50,091 51,585totAl new Eu countries (1) 907,400 749,361 1,178,867 855,288 818,330 799,607 751,803 776,547
In units
NEw lIGht CommErCIAl vEhIClE (up to 5 mEtrIC toNS) rEGIStrAtIoNS IN thE NEw Eu mEmbEr CouNtrIES
2000 2005 2008 2009 2010 2011 2012 2013Bulgaria 11,478 4,275 3,211 2,979 2,998 3,162Croatia 3,360 7,671 9,279 4,777 2,845 3,653 3,658 5,309Estonia 1,500 2,944 3,041 1,206 1,406 2,478 2,801 2,943Hungary 26,686 20,479 21,559 10,619 9,337 11,564 11,058 11,573latvia 900 1,753 2,151 555 649 1,926 2,307 2,380lithuania 1,270 3,371 3,201 884 1,044 1,939 1,715 1,967Poland 33,653 35,985 61,221 43,764 42,852 47,206 40,862 42,532Czech republic 14,786 16,024 20,648 13,258 11,318 13,149 11,669 11,768romania 14,789 35,842 40,876 15,397 10,404 11,791 12,269 10,046Slovakia 5,812 14,428 26,907 15,722 6,953 5,717 5,135 5,094Slovenia 6,274 6,897 7,331 4,452 4,744 5,791 5,820 6,072totAl new Eu countries (1) 90,900 101,881 198,413 110,132 91,918 104,540 96,634 102,846
In units
NEw lIGht vEhIClE rEGIStrAtIoNS (pASSENGEr CArS ANd lIGht CommErCIAl vEhIClES) IN thE NEw Eu mEmbEr StAtES
2000 2005 2008 2009 2010 2011 2012 2013Bulgaria 55,236 25,753 18,857 21,610 22,771 24,236Croatia 65,369 78,212 97,544 49,695 41,432 45,214 35,018 33,111Estonia 12,100 22,584 27,620 11,152 11,701 19,548 22,225 22,637Hungary 159,919 219,461 174,837 70,808 52,813 56,658 64,117 67,712latvia 8,200 18,355 21,982 5,922 7,014 12,906 12,972 13,016lithuania 7,428 13,838 25,418 8,399 9,014 15,173 13,880 14,130Poland 512,405 271,507 381,261 363,970 376,342 345,143 311,757 331,530Czech republic 163,378 167,723 203,202 180,966 180,898 186,744 185,989 176,514romania 79,221 251,396 311,871 145,592 116,737 106,410 84,412 67,756Slovakia 60,902 71,553 96,947 90,439 70,986 73,971 74,403 71,094Slovenia 73,939 66,221 78,906 62,419 65,886 65,984 55,911 57,657totAl new Eu countries (1) 998,300 851,242 1,377,280 965,420 910,248 904,147 848,437 879,393
In units
(1) New EU member states: eight countries in 2000; 10 countries between 2006 and 2012; 11 countries from 2013.
NEw hEAvy truCk, CoACh ANd buS (ovEr 5 mEtrIC toNS) rEGIStrAtIoNS IN thE NEw Eu mEmbEr CouNtrIES
2000 2005 2008 2009 2010 2011 2012 2013Bulgaria 3,400 800 1,000 1,300 800 1,300Croatia 612 1,463 2,871 1,164 599 721 636 708Estonia 400 927 1,380 337 502 798 848 1,034Hungary 2,900 4,400 5,500 1,800 2,408 4,335 4,051 5,263latvia 1,000 1,284 2,103 322 520 1,406 1,525 1,323lithuania 1,000 2,297 3,467 519 1,355 2,756 2,789 3,456Poland 7,464 11,079 19,971 8,172 11,611 16,800 16,461 19,748Czech republic 6,400 8,200 12,249 5,824 5,750 8,201 7,416 8,787romania 3,113 5,019 12,220 2,370 2,686 4,014 3,060 3,491Slovakia 1,796 3,754 5,431 2,322 2,870 3,962 3,856 4,131Slovenia 1,876 1,635 2,725 867 985 1,467 1,131 1,255totAl new Eu countries (1) 22,800 33,500 68,400 23,300 29,700 45,000 41,900 50,500
In units
72_AnALysis And highLighTs / CoMIté DES ConStRuCtEuRS FRAnçAIS D’AutoMoBIlES CoMIté DES ConStRuCtEuRS FRAnçAIS D’AutoMoBIlES / AnALysis And highLighTs_73
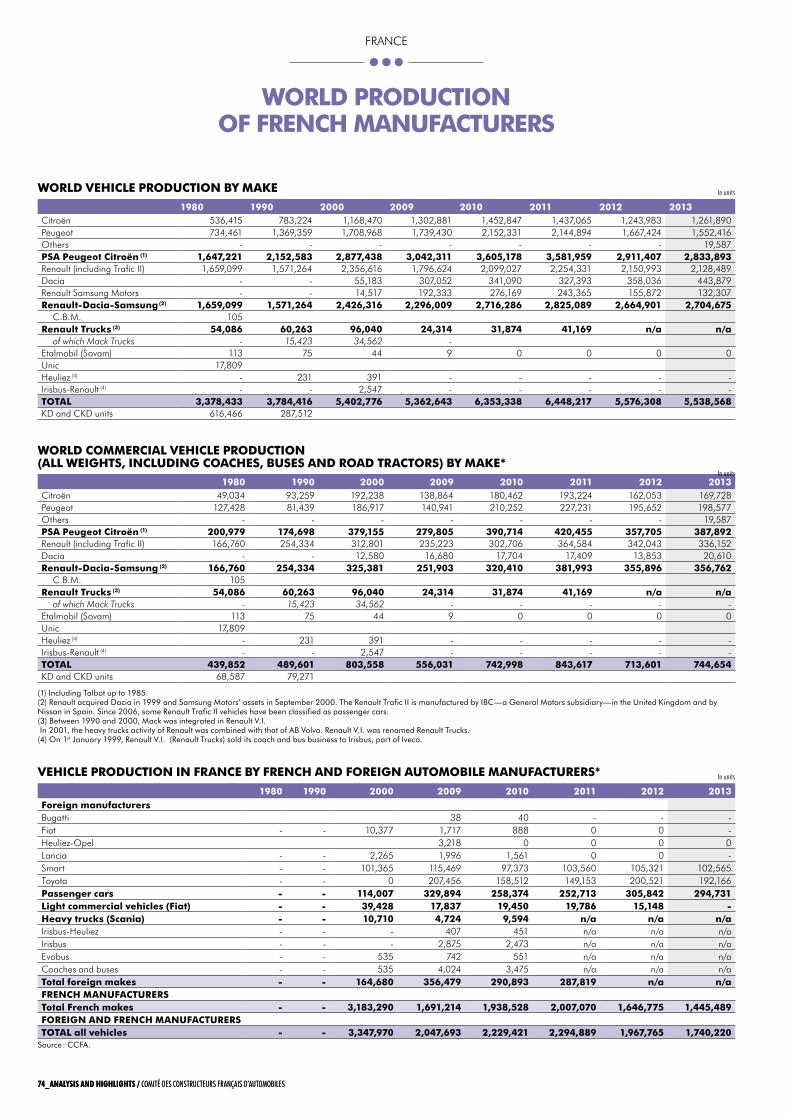
world vEhIClE produCtIoN by mAkE
1980 1990 2000 2009 2010 2011 2012 2013Citroën 536,415 783,224 1,168,470 1,302,881 1,452,847 1,437,065 1,243,983 1,261,890Peugeot 734,461 1,369,359 1,708,968 1,739,430 2,152,331 2,144,894 1,667,424 1,552,416Others - - - - - - - 19,587pSA peugeot Citroën (1) 1,647,221 2,152,583 2,877,438 3,042,311 3,605,178 3,581,959 2,911,407 2,833,893renault (including Trafic II) 1,659,099 1,571,264 2,356,616 1,796,624 2,099,027 2,254,331 2,150,993 2,128,489Dacia - - 55,183 307,052 341,090 327,393 358,036 443,879renault Samsung Motors - - 14,517 192,333 276,169 243,365 155,872 132,307renault-dacia-Samsung (2) 1,659,099 1,571,264 2,426,316 2,296,009 2,716,286 2,825,089 2,664,901 2,704,675
C.B.M. 105renault trucks (3) 54,086 60,263 96,040 24,314 31,874 41,169 n/a n/a
of which Mack Trucks - 15,423 34,562 -Etalmobil (Sovam) 113 75 44 9 0 0 0 0Unic 17,809Heuliez (4) - 231 391 - - - - -Irisbus-renault (4) - - 2,547 - - - - -totAl 3,378,433 3,784,416 5,402,776 5,362,643 6,353,338 6,448,217 5,576,308 5,538,568KD and CKD units 616,466 287,512
1980 1990 2000 2009 2010 2011 2012 2013Foreign manufacturersBugatti 38 40 - - -Fiat - - 10,377 1,717 888 0 0 -Heuliez-Opel 3,218 0 0 0 0lancia - - 2,265 1,996 1,561 0 0 -Smart - - 101,365 115,469 97,373 103,560 105,321 102,565Toyota - - 0 207,456 158,512 149,153 200,521 192,166passenger cars - - 114,007 329,894 258,374 252,713 305,842 294,731light commercial vehicles (Fiat) - - 39,428 17,837 19,450 19,786 15,148 -heavy trucks (Scania) - - 10,710 4,724 9,594 n/a n/a n/aIrisbus-Heuliez - - - 407 451 n/a n/a n/aIrisbus - - - 2,875 2,473 n/a n/a n/aEvobus - - 535 742 551 n/a n/a n/aCoaches and buses - - 535 4,024 3,475 n/a n/a n/atotal foreign makes - - 164,680 356,479 290,893 287,819 n/a n/aFrENCh mANuFACturErStotal French makes - - 3,183,290 1,691,214 1,938,528 2,007,070 1,646,775 1,445,489ForEIGN ANd FrENCh mANuFACturErStotAl all vehicles - - 3,347,970 2,047,693 2,229,421 2,294,889 1,967,765 1,740,220
In units
1980 1990 2000 2009 2010 2011 2012 2013Citroën 49,034 93,259 192,238 138,864 180,462 193,224 162,053 169,728Peugeot 127,428 81,439 186,917 140,941 210,252 227,231 195,652 198,577Others - - - - - - - 19,587pSA peugeot Citroën (1) 200,979 174,698 379,155 279,805 390,714 420,455 357,705 387,892renault (including Trafic II) 166,760 254,334 312,801 235,223 302,706 364,584 342,043 336,152Dacia - - 12,580 16,680 17,704 17,409 13,853 20,610renault-dacia-Samsung (2) 166,760 254,334 325,381 251,903 320,410 381,993 355,896 356,762
C.B.M. 105renault trucks (3) 54,086 60,263 96,040 24,314 31,874 41,169 n/a n/a
of which Mack Trucks - 15,423 34,562 - - - - -Etalmobil (Sovam) 113 75 44 9 0 0 0 0Unic 17,809Heuliez (4) - 231 391 - - - - -Irisbus-renault (4) - - 2,547 - - - - -totAl 439,852 489,601 803,558 556,031 742,998 843,617 713,601 744,654KD and CKD units 68,587 79,271
(1) Including talbot up to 1985.(2) Renault acquired dacia in 1999 and Samsung motors’ assets in September 2000. the Renault trafic II is manufactured by IbC—a general motors subsidiary—in the United kingdom and by Nissan in Spain. Since 2006, some Renault trafic II vehicles have been classified as passenger cars. (3) between 1990 and 2000, mack was integrated in Renault v.I. In 2001, the heavy trucks activity of Renault was combined with that of Ab volvo. Renault v.I. was renamed Renault trucks.(4) On 1st january 1999, Renault v.I. (Renault trucks) sold its coach and bus business to Irisbus, part of Iveco.
world CommErCIAl vEhIClE produCtIoN (All wEIGhtS, INCludING CoAChES, buSES ANd roAd trACtorS) by mAkE*
In units
vEhIClE produCtIoN IN FrANCE by FrENCh ANd ForEIGN AutomobIlE mANuFACturErS* In units
Source : CCFA.
world produCtIoN oF FrENCh mANuFACturErS
74_AnALysis And highLighTs / CoMIté DES ConStRuCtEuRS FRAnçAIS D’AutoMoBIlES CoMIté DES ConStRuCtEuRS FRAnçAIS D’AutoMoBIlES / AnALysis And highLighTs_7574_AnALysis And highLighTs / CoMIté DES ConStRuCtEuRS FRAnçAIS D’AutoMoBIlES CoMIté DES ConStRuCtEuRS FRAnçAIS D’AutoMoBIlES / AnALysis And highLighTs_75
FrANCE
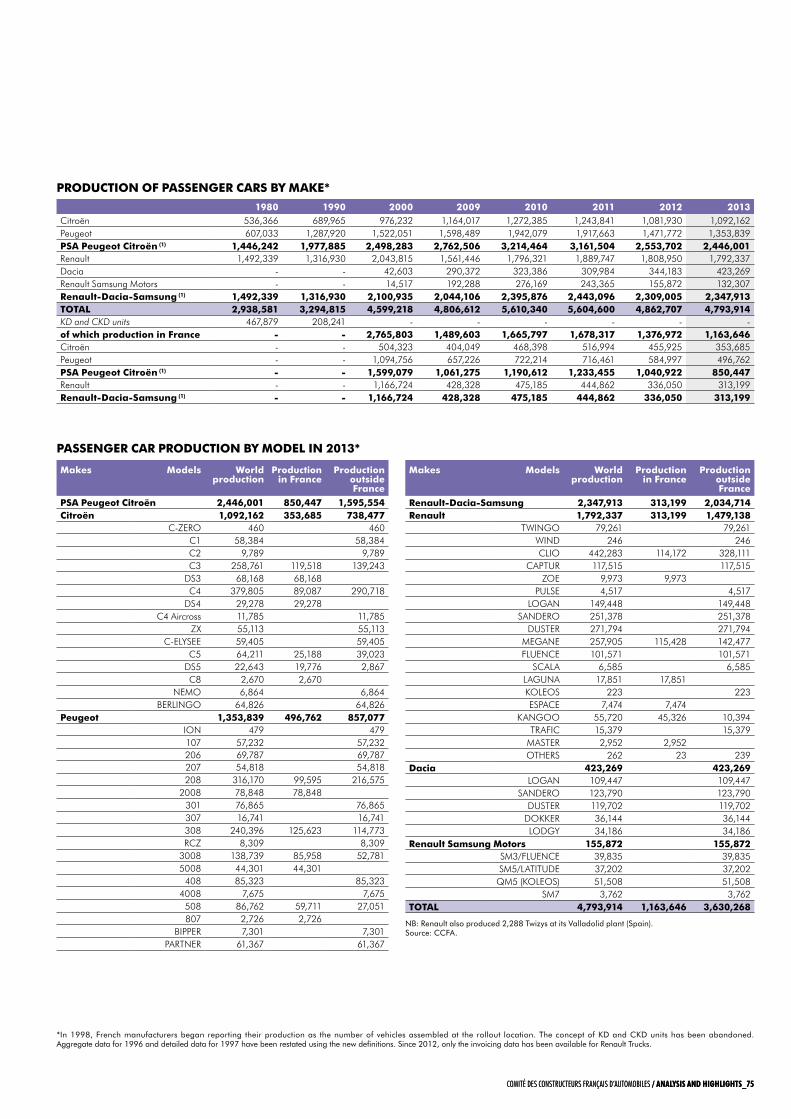
produCtIoN oF pASSENGEr CArS by mAkE*
1980 1990 2000 2009 2010 2011 2012 2013Citroën 536,366 689,965 976,232 1,164,017 1,272,385 1,243,841 1,081,930 1,092,162Peugeot 607,033 1,287,920 1,522,051 1,598,489 1,942,079 1,917,663 1,471,772 1,353,839pSA peugeot Citroën (1) 1,446,242 1,977,885 2,498,283 2,762,506 3,214,464 3,161,504 2,553,702 2,446,001renault 1,492,339 1,316,930 2,043,815 1,561,446 1,796,321 1,889,747 1,808,950 1,792,337Dacia - - 42,603 290,372 323,386 309,984 344,183 423,269renault Samsung Motors - - 14,517 192,288 276,169 243,365 155,872 132,307renault-dacia-Samsung (1) 1,492,339 1,316,930 2,100,935 2,044,106 2,395,876 2,443,096 2,309,005 2,347,913totAl 2,938,581 3,294,815 4,599,218 4,806,612 5,610,340 5,604,600 4,862,707 4,793,914KD and CKD units 467,879 208,241 - - - - - -of which production in France - - 2,765,803 1,489,603 1,665,797 1,678,317 1,376,972 1,163,646Citroën - - 504,323 404,049 468,398 516,994 455,925 353,685Peugeot - - 1,094,756 657,226 722,214 716,461 584,997 496,762pSA peugeot Citroën (1) - - 1,599,079 1,061,275 1,190,612 1,233,455 1,040,922 850,447renault - - 1,166,724 428,328 475,185 444,862 336,050 313,199renault-dacia-Samsung (1) - - 1,166,724 428,328 475,185 444,862 336,050 313,199
pASSENGEr CAr produCtIoN by modEl IN 2013*
makes models world production
production in France
production outside France
pSA peugeot Citroën 2,446,001 850,447 1,595,554Citroën 1,092,162 353,685 738,477
C-ZErO 460 460C1 58,384 58,384C2 9,789 9,789C3 258,761 119,518 139,243
DS3 68,168 68,168C4 379,805 89,087 290,718
DS4 29,278 29,278C4 Aircross 11,785 11,785
ZX 55,113 55,113C-ElYSEE 59,405 59,405
C5 64,211 25,188 39,023DS5 22,643 19,776 2,867C8 2,670 2,670
NEMO 6,864 6,864BErlINGO 64,826 64,826
peugeot 1,353,839 496,762 857,077ION 479 479107 57,232 57,232206 69,787 69,787207 54,818 54,818208 316,170 99,595 216,575
2008 78,848 78,848301 76,865 76,865307 16,741 16,741308 240,396 125,623 114,773rCZ 8,309 8,309
3008 138,739 85,958 52,7815008 44,301 44,301
408 85,323 85,3234008 7,675 7,675
508 86,762 59,711 27,051807 2,726 2,726
BIPPEr 7,301 7,301PArTNEr 61,367 61,367
makes models world production
production in France
production outside France
renault-dacia-Samsung 2,347,913 313,199 2,034,714renault 1,792,337 313,199 1,479,138
TwINGO 79,261 79,261wIND 246 246ClIO 442,283 114,172 328,111
CAPTUr 117,515 117,515ZOE 9,973 9,973
PUlSE 4,517 4,517lOGAN 149,448 149,448
SANDErO 251,378 251,378DUSTEr 271,794 271,794
MEGANE 257,905 115,428 142,477FlUENCE 101,571 101,571
SCAlA 6,585 6,585lAGUNA 17,851 17,851KOlEOS 223 223ESPACE 7,474 7,474
KANGOO 55,720 45,326 10,394TrAFIC 15,379 15,379
MASTEr 2,952 2,952OTHErS 262 23 239
dacia 423,269 423,269lOGAN 109,447 109,447
SANDErO 123,790 123,790DUSTEr 119,702 119,702
DOKKEr 36,144 36,144lODGY 34,186 34,186
renault Samsung motors 155,872 155,872SM3/FlUENCE 39,835 39,835SM5/lATITUDE 37,202 37,202
QM5 (KOlEOS) 51,508 51,508SM7 3,762 3,762
totAl 4,793,914 1,163,646 3,630,268
Nb: Renault also produced 2,288 twizys at its valladolid plant (Spain).Source: CCFA.
*In 1998, French manufacturers began reporting their production as the number of vehicles assembled at the rollout location. the concept of kd and Ckd units has been abandoned. Aggregate data for 1996 and detailed data for 1997 have been restated using the new definitions. Since 2012, only the invoicing data has been available for Renault trucks.
74_AnALysis And highLighTs / CoMIté DES ConStRuCtEuRS FRAnçAIS D’AutoMoBIlES CoMIté DES ConStRuCtEuRS FRAnçAIS D’AutoMoBIlES / AnALysis And highLighTs_7574_AnALysis And highLighTs / CoMIté DES ConStRuCtEuRS FRAnçAIS D’AutoMoBIlES CoMIté DES ConStRuCtEuRS FRAnçAIS D’AutoMoBIlES / AnALysis And highLighTs_75
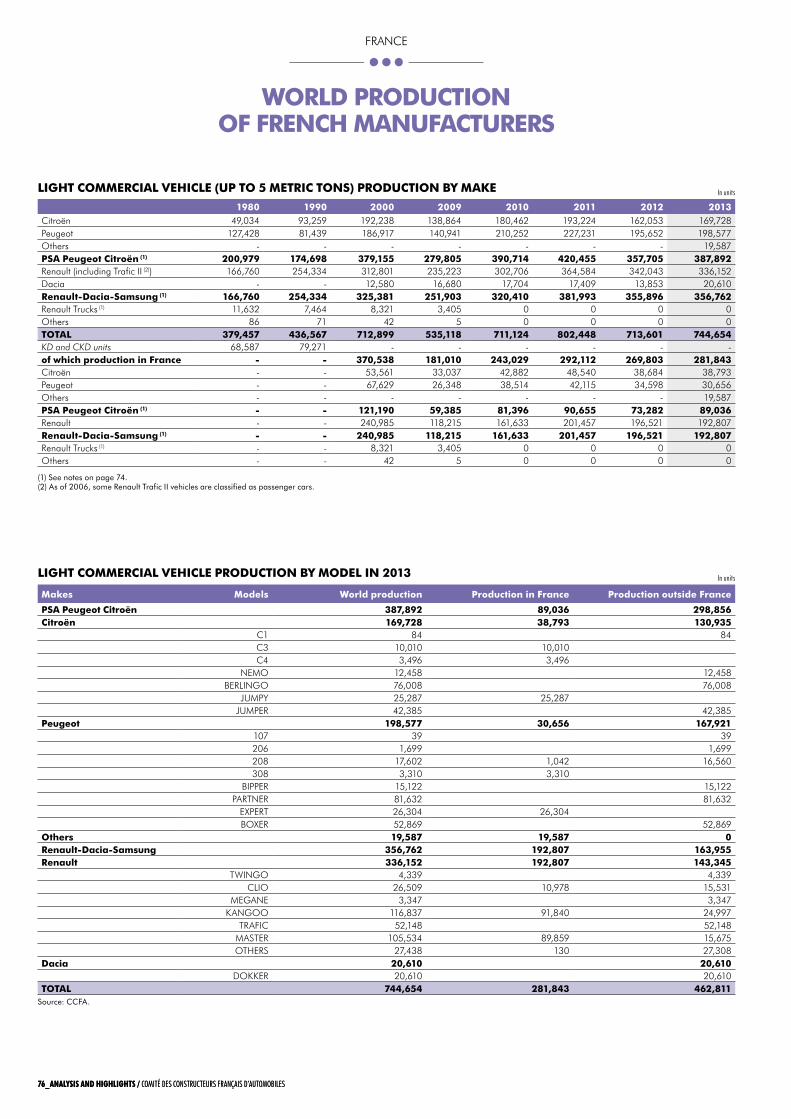
world produCtIoN oF FrENCh mANuFACturErS
lIGht CommErCIAl vEhIClE (up to 5 mEtrIC toNS) produCtIoN by mAkE
1980 1990 2000 2009 2010 2011 2012 2013Citroën 49,034 93,259 192,238 138,864 180,462 193,224 162,053 169,728Peugeot 127,428 81,439 186,917 140,941 210,252 227,231 195,652 198,577Others - - - - - - - 19,587pSA peugeot Citroën (1) 200,979 174,698 379,155 279,805 390,714 420,455 357,705 387,892renault (including Trafic II (2)) 166,760 254,334 312,801 235,223 302,706 364,584 342,043 336,152Dacia - - 12,580 16,680 17,704 17,409 13,853 20,610renault-dacia-Samsung (1) 166,760 254,334 325,381 251,903 320,410 381,993 355,896 356,762renault Trucks (1) 11,632 7,464 8,321 3,405 0 0 0 0Others 86 71 42 5 0 0 0 0totAl 379,457 436,567 712,899 535,118 711,124 802,448 713,601 744,654KD and CKD units 68,587 79,271 - - - - - -of which production in France - - 370,538 181,010 243,029 292,112 269,803 281,843Citroën - - 53,561 33,037 42,882 48,540 38,684 38,793Peugeot - - 67,629 26,348 38,514 42,115 34,598 30,656Others - - - - - - - 19,587pSA peugeot Citroën (1) - - 121,190 59,385 81,396 90,655 73,282 89,036renault - - 240,985 118,215 161,633 201,457 196,521 192,807renault-dacia-Samsung (1) - - 240,985 118,215 161,633 201,457 196,521 192,807renault Trucks (1) - - 8,321 3,405 0 0 0 0Others - - 42 5 0 0 0 0
(1) See notes on page 74.(2) As of 2006, some Renault trafic II vehicles are classified as passenger cars.
In units
In unitslIGht CommErCIAl vEhIClE produCtIoN by modEl IN 2013
makes models world production production in France production outside France
pSA peugeot Citroën 387,892 89,036 298,856Citroën 169,728 38,793 130,935
C1 84 84C3 10,010 10,010C4 3,496 3,496
NEMO 12,458 12,458BErlINGO 76,008 76,008
JUMPY 25,287 25,287JUMPEr 42,385 42,385
peugeot 198,577 30,656 167,921107 39 39206 1,699 1,699208 17,602 1,042 16,560308 3,310 3,310
BIPPEr 15,122 15,122PArTNEr 81,632 81,632
EXPErT 26,304 26,304BOXEr 52,869 52,869
others 19,587 19,587 0renault-dacia-Samsung 356,762 192,807 163,955renault 336,152 192,807 143,345
TwINGO 4,339 4,339ClIO 26,509 10,978 15,531
MEGANE 3,347 3,347KANGOO 116,837 91,840 24,997
TrAFIC 52,148 52,148MASTEr 105,534 89,859 15,675OTHErS 27,438 130 27,308
dacia 20,610 20,610DOKKEr 20,610 20,610
totAl 744,654 281,843 462,811Source: CCFA.
76_AnALysis And highLighTs / CoMIté DES ConStRuCtEuRS FRAnçAIS D’AutoMoBIlES CoMIté DES ConStRuCtEuRS FRAnçAIS D’AutoMoBIlES / AnALysis And highLighTs_7776_AnALysis And highLighTs / CoMIté DES ConStRuCtEuRS FRAnçAIS D’AutoMoBIlES CoMIté DES ConStRuCtEuRS FRAnçAIS D’AutoMoBIlES / AnALysis And highLighTs_77
FrANCE
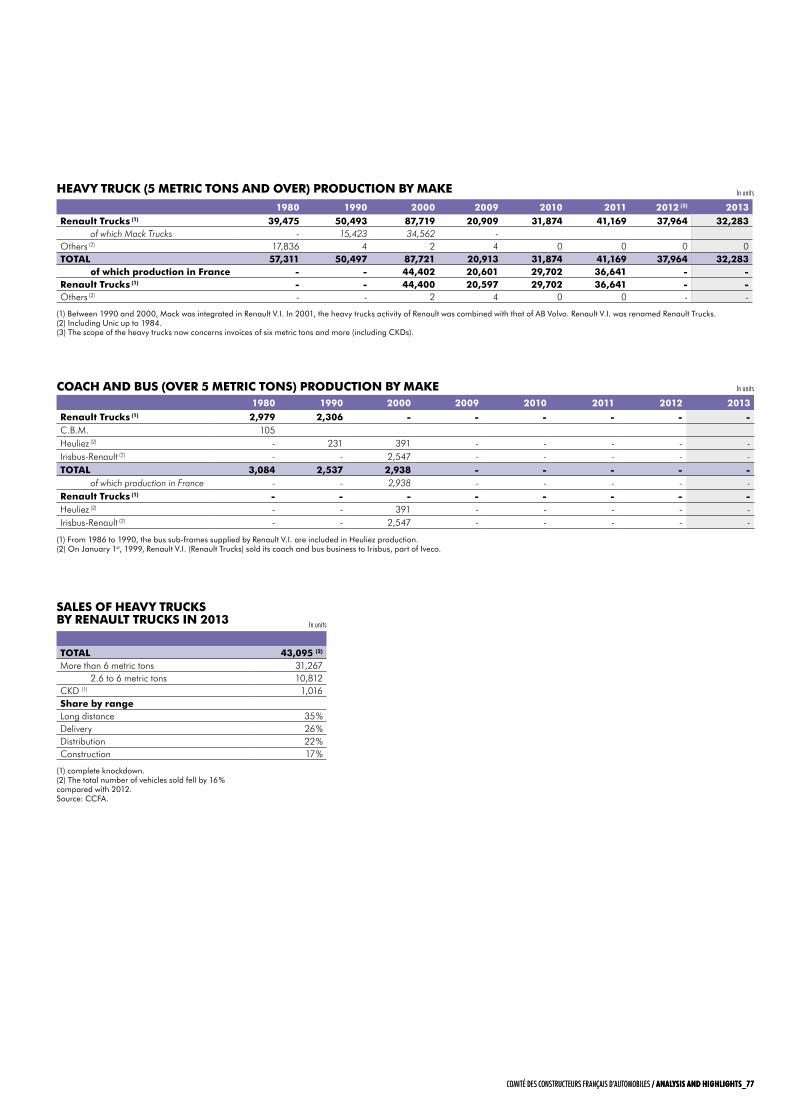
hEAvy truCk (5 mEtrIC toNS ANd ovEr) produCtIoN by mAkE1980 1990 2000 2009 2010 2011 2012 (3) 2013
renault trucks (1) 39,475 50,493 87,719 20,909 31,874 41,169 37,964 32,283of which Mack Trucks - 15,423 34,562 -
Others (2) 17,836 4 2 4 0 0 0 0 totAl 57,311 50,497 87,721 20,913 31,874 41,169 37,964 32,283
of which production in France - - 44,402 20,601 29,702 36,641 - -renault trucks (1) - - 44,400 20,597 29,702 36,641 - -Others (2) - - 2 4 0 0 - -
(1) between 1990 and 2000, mack was integrated in Renault v.I. In 2001, the heavy trucks activity of Renault was combined with that of Ab volvo. Renault v.I. was renamed Renault trucks.(2) Including Unic up to 1984.(3) the scope of the heavy trucks now concerns invoices of six metric tons and more (including Ckds).
In units
CoACh ANd buS (ovEr 5 mEtrIC toNS) produCtIoN by mAkE1980 1990 2000 2009 2010 2011 2012 2013
renault trucks (1) 2,979 2,306 - - - - - -C.B.M. 105Heuliez (2) - 231 391 - - - - -Irisbus-renault (2) - - 2,547 - - - - -totAl 3,084 2,537 2,938 - - - - -
of which production in France - - 2,938 - - - - -renault trucks (1) - - - - - - - -Heuliez (2) - - 391 - - - - -Irisbus-renault (2) - - 2,547 - - - - -
(1) From 1986 to 1990, the bus sub-frames supplied by Renault v.I. are included in heuliez production.(2) On january 1st, 1999, Renault v.I. (Renault trucks) sold its coach and bus business to Irisbus, part of Iveco.
In units
SAlES oF hEAvy truCkS by rENAult truCkS IN 2013
totAl 43,095 (2)
More than 6 metric tons 31,267 2.6 to 6 metric tons 10,812
CKD (1) 1,016 Share by rangelong distance 35 %Delivery 26 %Distribution 22 %Construction 17 %
(1) complete knockdown.(2) the total number of vehicles sold fell by 16 % compared with 2012.Source: CCFA.
In units
76_AnALysis And highLighTs / CoMIté DES ConStRuCtEuRS FRAnçAIS D’AutoMoBIlES CoMIté DES ConStRuCtEuRS FRAnçAIS D’AutoMoBIlES / AnALysis And highLighTs_7776_AnALysis And highLighTs / CoMIté DES ConStRuCtEuRS FRAnçAIS D’AutoMoBIlES CoMIté DES ConStRuCtEuRS FRAnçAIS D’AutoMoBIlES / AnALysis And highLighTs_77
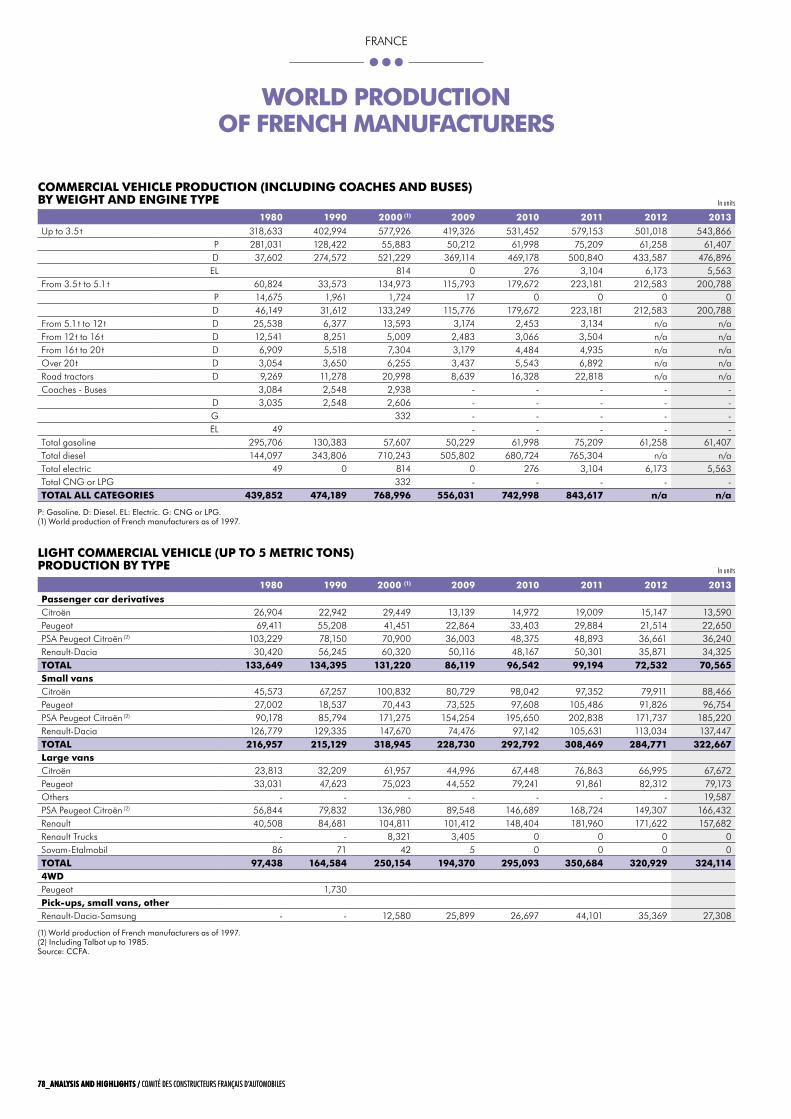
world produCtIoN oF FrENCh mANuFACturErS
CommErCIAl vEhIClE produCtIoN (INCludING CoAChES ANd buSES) by wEIGht ANd ENGINE typE
1980 1990 2000 (1) 2009 2010 2011 2012 2013Up to 3.5 t 318,633 402,994 577,926 419,326 531,452 579,153 501,018 543,866
P 281,031 128,422 55,883 50,212 61,998 75,209 61,258 61,407D 37,602 274,572 521,229 369,114 469,178 500,840 433,587 476,896El 814 0 276 3,104 6,173 5,563
From 3.5 t to 5.1 t 60,824 33,573 134,973 115,793 179,672 223,181 212,583 200,788P 14,675 1,961 1,724 17 0 0 0 0D 46,149 31,612 133,249 115,776 179,672 223,181 212,583 200,788
From 5.1 t to 12 t D 25,538 6,377 13,593 3,174 2,453 3,134 n/a n/aFrom 12 t to 16 t D 12,541 8,251 5,009 2,483 3,066 3,504 n/a n/aFrom 16 t to 20 t D 6,909 5,518 7,304 3,179 4,484 4,935 n/a n/aOver 20 t D 3,054 3,650 6,255 3,437 5,543 6,892 n/a n/aroad tractors D 9,269 11,278 20,998 8,639 16,328 22,818 n/a n/aCoaches - Buses 3,084 2,548 2,938 - - - - -
D 3,035 2,548 2,606 - - - - -G 332 - - - - -El 49 - - - - -
Total gasoline 295,706 130,383 57,607 50,229 61,998 75,209 61,258 61,407Total diesel 144,097 343,806 710,243 505,802 680,724 765,304 n/a n/aTotal electric 49 0 814 0 276 3,104 6,173 5,563Total CNG or lPG 332 - - - - -totAl All CAtEGorIES 439,852 474,189 768,996 556,031 742,998 843,617 n/a n/a
P: gasoline. d: diesel. El: Electric. g: CNg or lPg.(1) world production of French manufacturers as of 1997.
In units
lIGht CommErCIAl vEhIClE (up to 5 mEtrIC toNS) produCtIoN by typE
1980 1990 2000 (1) 2009 2010 2011 2012 2013
passenger car derivativesCitroën 26,904 22,942 29,449 13,139 14,972 19,009 15,147 13,590Peugeot 69,411 55,208 41,451 22,864 33,403 29,884 21,514 22,650PSA Peugeot Citroën (2) 103,229 78,150 70,900 36,003 48,375 48,893 36,661 36,240renault-Dacia 30,420 56,245 60,320 50,116 48,167 50,301 35,871 34,325totAl 133,649 134,395 131,220 86,119 96,542 99,194 72,532 70,565Small vansCitroën 45,573 67,257 100,832 80,729 98,042 97,352 79,911 88,466Peugeot 27,002 18,537 70,443 73,525 97,608 105,486 91,826 96,754PSA Peugeot Citroën (2) 90,178 85,794 171,275 154,254 195,650 202,838 171,737 185,220renault-Dacia 126,779 129,335 147,670 74,476 97,142 105,631 113,034 137,447totAl 216,957 215,129 318,945 228,730 292,792 308,469 284,771 322,667large vansCitroën 23,813 32,209 61,957 44,996 67,448 76,863 66,995 67,672Peugeot 33,031 47,623 75,023 44,552 79,241 91,861 82,312 79,173Others - - - - - - - 19,587PSA Peugeot Citroën (2) 56,844 79,832 136,980 89,548 146,689 168,724 149,307 166,432renault 40,508 84,681 104,811 101,412 148,404 181,960 171,622 157,682renault Trucks - - 8,321 3,405 0 0 0 0Sovam-Etalmobil 86 71 42 5 0 0 0 0totAl 97,438 164,584 250,154 194,370 295,093 350,684 320,929 324,1144wdPeugeot 1,730pick-ups, small vans, otherrenault-Dacia-Samsung - - 12,580 25,899 26,697 44,101 35,369 27,308
(1) world production of French manufacturers as of 1997.(2) Including talbot up to 1985.Source: CCFA.
In units
78_AnALysis And highLighTs / CoMIté DES ConStRuCtEuRS FRAnçAIS D’AutoMoBIlES CoMIté DES ConStRuCtEuRS FRAnçAIS D’AutoMoBIlES / AnALysis And highLighTs_7978_AnALysis And highLighTs / CoMIté DES ConStRuCtEuRS FRAnçAIS D’AutoMoBIlES CoMIté DES ConStRuCtEuRS FRAnçAIS D’AutoMoBIlES / AnALysis And highLighTs_79
FrANCE
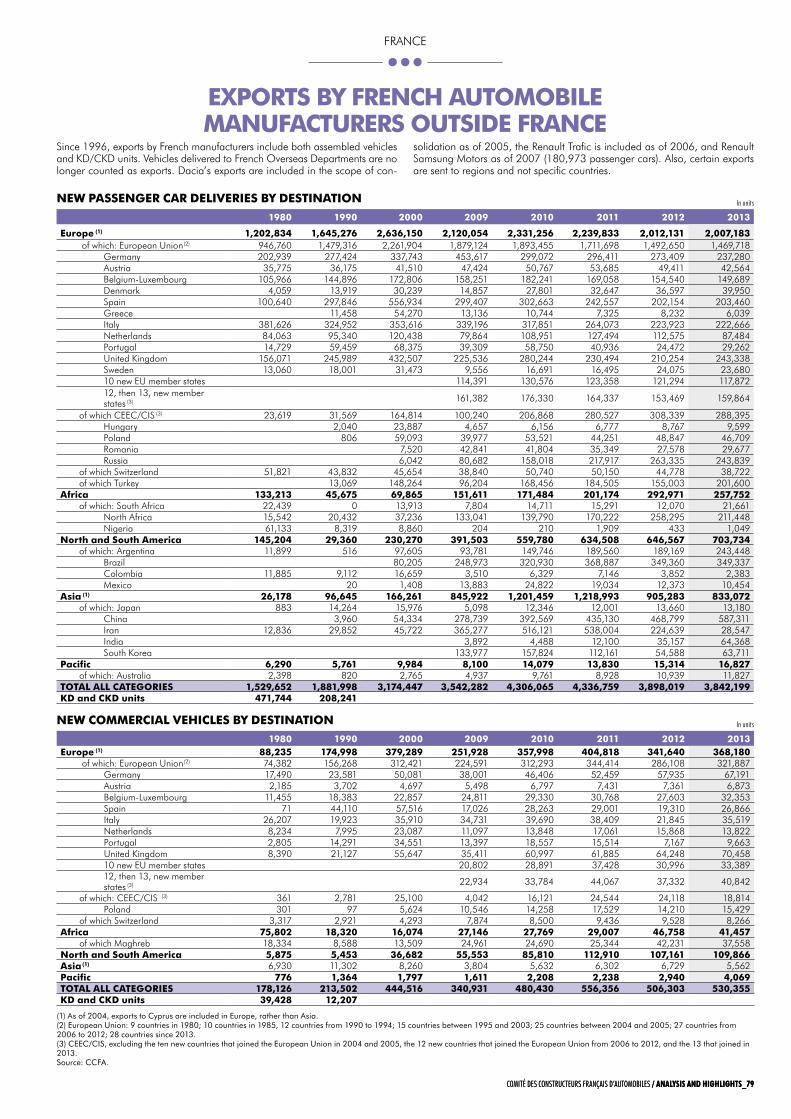
ExportS by FrENCh AutomobIlE mANuFACturErS outSIdE FrANCE
NEw pASSENGEr CAr dElIvErIES by dEStINAtIoN
NEw CommErCIAl vEhIClES by dEStINAtIoN
1980 1990 2000 2009 2010 2011 2012 2013
Europe (1) 1,202,834 1,645,276 2,636,150 2,120,054 2,331,256 2,239,833 2,012,131 2,007,183 of which: European Union (2) 946,760 1,479,316 2,261,904 1,879,124 1,893,455 1,711,698 1,492,650 1,469,718
Germany 202,939 277,424 337,743 453,617 299,072 296,411 273,409 237,280Austria 35,775 36,175 41,510 47,424 50,767 53,685 49,411 42,564Belgium-luxembourg 105,966 144,896 172,806 158,251 182,241 169,058 154,540 149,689Denmark 4,059 13,919 30,239 14,857 27,801 32,647 36,597 39,950Spain 100,640 297,846 556,934 299,407 302,663 242,557 202,154 203,460Greece 11,458 54,270 13,136 10,744 7,325 8,232 6,039Italy 381,626 324,952 353,616 339,196 317,851 264,073 223,923 222,666Netherlands 84,063 95,340 120,438 79,864 108,951 127,494 112,575 87,484Portugal 14,729 59,459 68,375 39,309 58,750 40,936 24,472 29,262United Kingdom 156,071 245,989 432,507 225,536 280,244 230,494 210,254 243,338Sweden 13,060 18,001 31,473 9,556 16,691 16,495 24,075 23,68010 new EU member states 114,391 130,576 123,358 121,294 117,87212, then 13, new member states (3) 161,382 176,330 164,337 153,469 159,864
of which CEEC/CIS (3) 23,619 31,569 164,814 100,240 206,868 280,527 308,339 288,395Hungary 2,040 23,887 4,657 6,156 6,777 8,767 9,599Poland 806 59,093 39,977 53,521 44,251 48,847 46,709romania 7,520 42,841 41,804 35,349 27,578 29,677russia 6,042 80,682 158,018 217,917 263,335 243,839
of which Switzerland 51,821 43,832 45,654 38,840 50,740 50,150 44,778 38,722of which Turkey 13,069 148,264 96,204 168,456 184,505 155,003 201,600
Africa 133,213 45,675 69,865 151,611 171,484 201,174 292,971 257,752of which: South Africa 22,439 0 13,913 7,804 14,711 15,291 12,070 21,661
North Africa 15,542 20,432 37,236 133,041 139,790 170,222 258,295 211,448Nigeria 61,133 8,319 8,860 204 210 1,909 433 1,049
North and South America 145,204 29,360 230,270 391,503 559,780 634,508 646,567 703,734of which: Argentina 11,899 516 97,605 93,781 149,746 189,560 189,169 243,448
Brazil 80,205 248,973 320,930 368,887 349,360 349,337Colombia 11,885 9,112 16,659 3,510 6,329 7,146 3,852 2,383Mexico 20 1,408 13,883 24,822 19,034 12,373 10,454
Asia (1) 26,178 96,645 166,261 845,922 1,201,459 1,218,993 905,283 833,072of which: Japan 883 14,264 15,976 5,098 12,346 12,001 13,660 13,180
China 3,960 54,334 278,739 392,569 435,130 468,799 587,311Iran 12,836 29,852 45,722 365,277 516,121 538,004 224,639 28,547India 3,892 4,488 12,100 35,157 64,368South Korea 133,977 157,824 112,161 54,588 63,711
pacific 6,290 5,761 9,984 8,100 14,079 13,830 15,314 16,827of which: Australia 2,398 820 2,765 4,937 9,761 8,928 10,939 11,827
totAl All CAtEGorIES 1,529,652 1,881,998 3,174,447 3,542,282 4,306,065 4,336,759 3,898,019 3,842,199kd and Ckd units 471,744 208,241
1980 1990 2000 2009 2010 2011 2012 2013Europe (1) 88,235 174,998 379,289 251,928 357,998 404,818 341,640 368,180
of which: European Union (2) 74,382 156,268 312,421 224,591 312,293 344,414 286,108 321,887Germany 17,490 23,581 50,081 38,001 46,406 52,459 57,935 67,191Austria 2,185 3,702 4,697 5,498 6,797 7,431 7,361 6,873Belgium-luxembourg 11,455 18,383 22,857 24,811 29,330 30,768 27,603 32,353Spain 71 44,110 57,516 17,026 28,263 29,001 19,310 26,866Italy 26,207 19,923 35,910 34,731 39,690 38,409 21,845 35,519Netherlands 8,234 7,995 23,087 11,097 13,848 17,061 15,868 13,822Portugal 2,805 14,291 34,551 13,397 18,557 15,514 7,167 9,663United Kingdom 8,390 21,127 55,647 35,411 60,997 61,885 64,248 70,45810 new EU member states 20,802 28,891 37,428 30,996 33,38912, then 13, new member states (3) 22,934 33,784 44,067 37,332 40,842
of which: CEEC/CIS (3) 361 2,781 25,100 4,042 16,121 24,544 24,118 18,814Poland 301 97 5,624 10,546 14,258 17,529 14,210 15,429
of which Switzerland 3,317 2,921 4,293 7,874 8,500 9,436 9,528 8,266Africa 75,802 18,320 16,074 27,146 27,769 29,007 46,758 41,457
of which Maghreb 18,334 8,588 13,509 24,961 24,690 25,344 42,231 37,558North and South America 5,875 5,453 36,682 55,553 85,810 112,910 107,161 109,866Asia (1) 6,930 11,302 8,260 3,804 5,632 6,302 6,729 5,562pacific 776 1,364 1,797 1,611 2,208 2,238 2,940 4,069totAl All CAtEGorIES 178,126 213,502 444,516 340,931 480,430 556,356 506,303 530,355kd and Ckd units 39,428 12,207
(1) As of 2004, exports to Cyprus are included in Europe, rather than Asia.(2) European Union: 9 countries in 1980; 10 countries in 1985, 12 countries from 1990 to 1994; 15 countries between 1995 and 2003; 25 countries between 2004 and 2005; 27 countries from 2006 to 2012; 28 countries since 2013.(3) CEEC/CIS, excluding the ten new countries that joined the European Union in 2004 and 2005, the 12 new countries that joined the European Union from 2006 to 2012, and the 13 that joined in 2013. Source: CCFA.
In units
In units
Since 1996, exports by French manufacturers include both assembled vehicles and KD/CKD units. Vehicles delivered to French Overseas Departments are no longer counted as exports. Dacia’s exports are included in the scope of con-
solidation as of 2005, the renault Trafic is included as of 2006, and renault Samsung Motors as of 2007 (180,973 passenger cars). Also, certain exports are sent to regions and not specific countries.
78_AnALysis And highLighTs / CoMIté DES ConStRuCtEuRS FRAnçAIS D’AutoMoBIlES CoMIté DES ConStRuCtEuRS FRAnçAIS D’AutoMoBIlES / AnALysis And highLighTs_7978_AnALysis And highLighTs / CoMIté DES ConStRuCtEuRS FRAnçAIS D’AutoMoBIlES CoMIté DES ConStRuCtEuRS FRAnçAIS D’AutoMoBIlES / AnALysis And highLighTs_79
FrANCE
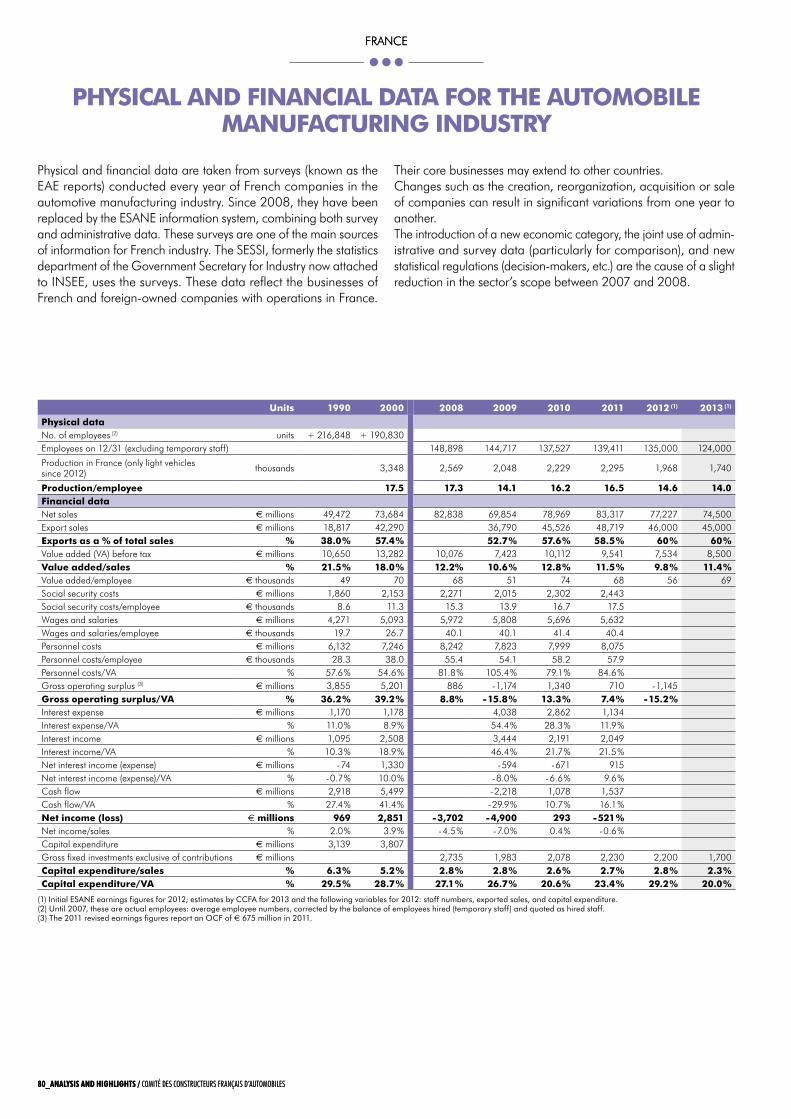
Physical and financial data are taken from surveys (known as the EAE reports) conducted every year of French companies in the automotive manufacturing industry. Since 2008, they have been replaced by the ESANE information system, combining both survey and administrative data. These surveys are one of the main sources of information for French industry. The SESSI, formerly the statistics department of the Government Secretary for Industry now attached to INSEE, uses the surveys. These data reflect the businesses of French and foreign-owned companies with operations in France.
Their core businesses may extend to other countries.Changes such as the creation, reorganization, acquisition or sale of companies can result in significant variations from one year to another.The introduction of a new economic category, the joint use of admin-istrative and survey data (particularly for comparison), and new statistical regulations (decision-makers, etc.) are the cause of a slight reduction in the sector’s scope between 2007 and 2008.
phySICAl ANd FINANCIAl dAtA For thE AutomobIlE mANuFACturING INduStry
units 1990 2000 2008 2009 2010 2011 2012 (1) 2013 (1)
physical dataNo. of employees (2) units + 216,848 + 190,830Employees on 12/31 (excluding temporary staff) 148,898 144,717 137,527 139,411 135,000 124,000
Production in France (only light vehicles since 2012) thousands 3,348 2,569 2,048 2,229 2,295 1,968 1,740
production/employee 17.5 17.3 14.1 16.2 16.5 14.6 14.0Financial dataNet sales € millions 49,472 73,684 82,838 69,854 78,969 83,317 77,227 74,500Export sales € millions 18,817 42,290 36,790 45,526 48,719 46,000 45,000Exports as a % of total sales % 38.0 % 57.4 % 52.7 % 57.6 % 58.5 % 60 % 60 %Value added (VA) before tax € millions 10,650 13,282 10,076 7,423 10,112 9,541 7,534 8,500value added/sales % 21.5 % 18.0 % 12.2% 10.6 % 12.8 % 11.5 % 9.8 % 11.4 %Value added/employee € thousands 49 70 68 51 74 68 56 69Social security costs € millions 1,860 2,153 2,271 2,015 2,302 2,443Social security costs/employee € thousands 8.6 11.3 15.3 13.9 16.7 17.5 wages and salaries € millions 4,271 5,093 5,972 5,808 5,696 5,632wages and salaries/employee € thousands 19.7 26.7 40.1 40.1 41.4 40.4 Personnel costs € millions 6,132 7,246 8,242 7,823 7,999 8,075Personnel costs/employee € thousands 28.3 38.0 55.4 54.1 58.2 57.9 Personnel costs/VA % 57.6 % 54.6 % 81.8 % 105.4 % 79.1 % 84.6 %Gross operating surplus (3) € millions 3,855 5,201 886 - 1,174 1,340 710 - 1,145 Gross operating surplus/vA % 36.2 % 39.2 % 8.8% - 15.8 % 13.3 % 7.4 % - 15.2 %Interest expense € millions 1,170 1,178 4,038 2,862 1,134Interest expense/VA % 11.0 % 8.9 % 54.4 % 28.3 % 11.9 %Interest income € millions 1,095 2,508 3,444 2,191 2,049Interest income/VA % 10.3 % 18.9 % 46.4 % 21.7 % 21.5 %Net interest income (expense) € millions - 74 1,330 - 594 - 671 915Net interest income (expense)/VA % - 0.7 % 10.0 % - 8.0 % - 6.6 % 9.6 %Cash flow € millions 2,918 5,499 - 2,218 1,078 1,537Cash flow/VA % 27.4 % 41.4 % - 29.9 % 10.7 % 16.1 %Net income (loss) € millions 969 2,851 - 3,702 - 4,900 293 - 521 %Net income/sales % 2.0 % 3.9 % - 4.5 % - 7.0 % 0.4 % - 0.6 %Capital expenditure € millions 3,139 3,807Gross fixed investments exclusive of contributions € millions 2,735 1,983 2,078 2,230 2,200 1,700Capital expenditure/sales % 6.3 % 5.2 % 2.8 % 2.8 % 2.6 % 2.7 % 2.8 % 2.3 %Capital expenditure/vA % 29.5 % 28.7 % 27.1 % 26.7 % 20.6 % 23.4 % 29.2 % 20.0 %
(1) Initial ESANE earnings figures for 2012; estimates by CCFA for 2013 and the following variables for 2012: staff numbers, exported sales, and capital expenditure.(2) Until 2007, these are actual employees: average employee numbers, corrected by the balance of employees hired (temporary staff) and quoted as hired staff.(3) the 2011 revised earnings figures report an OCF of € 675 million in 2011.
80_AnALysis And highLighTs / CoMIté DES ConStRuCtEuRS FRAnçAIS D’AutoMoBIlES CoMIté DES ConStRuCtEuRS FRAnçAIS D’AutoMoBIlES / AnALysis And highLighTs_8180_AnALysis And highLighTs / CoMIté DES ConStRuCtEuRS FRAnçAIS D’AutoMoBIlES CoMIté DES ConStRuCtEuRS FRAnçAIS D’AutoMoBIlES / AnALysis And highLighTs_81
FrANCEFrANCE
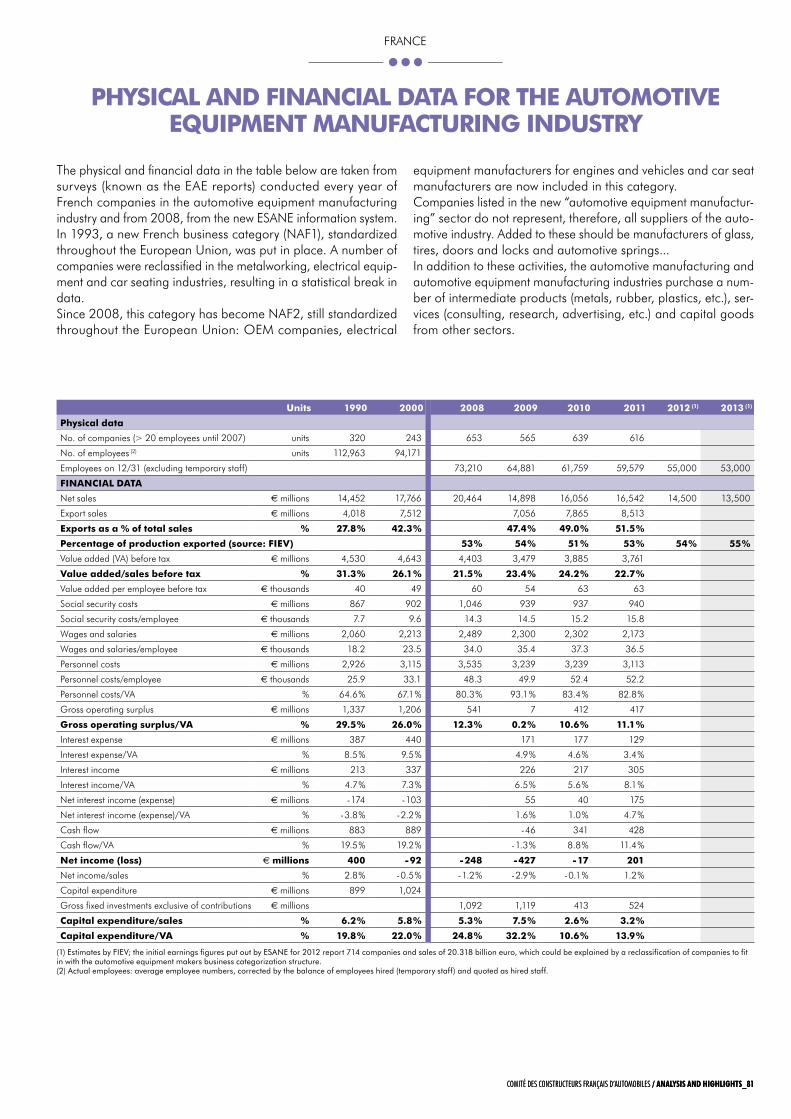
The physical and financial data in the table below are taken from surveys (known as the EAE reports) conducted every year of French companies in the automotive equipment manufacturing industry and from 2008, from the new ESANE information system.In 1993, a new French business category (NAF1), standardized throughout the European Union, was put in place. A number of companies were reclassified in the metalworking, electrical equip-ment and car seating industries, resulting in a statistical break in data.Since 2008, this category has become NAF2, still standardized throughout the European Union: OEM companies, electrical
equipment manufacturers for engines and vehicles and car seat manufacturers are now included in this category.Companies listed in the new “automotive equipment manufactur-ing” sector do not represent, therefore, all suppliers of the auto-motive industry. Added to these should be manufacturers of glass, tires, doors and locks and automotive springs...In addition to these activities, the automotive manufacturing and automotive equipment manufacturing industries purchase a num-ber of intermediate products (metals, rubber, plastics, etc.), ser-vices (consulting, research, advertising, etc.) and capital goods from other sectors.
phySICAl ANd FINANCIAl dAtA For thE AutomotIvE EquIpmENt mANuFACturING INduStry
units 1990 2000 2008 2009 2010 2011 2012 (1) 2013 (1)
physical data
No. of companies (> 20 employees until 2007) units 320 243 653 565 639 616
No. of employees (2) units 112,963 94,171
Employees on 12/31 (excluding temporary staff) 73,210 64,881 61,759 59,579 55,000 53,000
FINANCIAl dAtA
Net sales € millions 14,452 17,766 20,464 14,898 16,056 16,542 14,500 13,500
Export sales € millions 4,018 7,512 7,056 7,865 8,513
Exports as a % of total sales % 27.8 % 42.3 % 47.4 % 49.0 % 51.5 %
percentage of production exported (source: FIEv) 53 % 54 % 51 % 53 % 54 % 55 %
Value added (VA) before tax € millions 4,530 4,643 4,403 3,479 3,885 3,761
value added/sales before tax % 31.3 % 26.1 % 21.5 % 23.4 % 24.2 % 22.7 %
Value added per employee before tax € thousands 40 49 60 54 63 63
Social security costs € millions 867 902 1,046 939 937 940
Social security costs/employee € thousands 7.7 9.6 14.3 14.5 15.2 15.8
wages and salaries € millions 2,060 2,213 2,489 2,300 2,302 2,173
wages and salaries/employee € thousands 18.2 23.5 34.0 35.4 37.3 36.5
Personnel costs € millions 2,926 3,115 3,535 3,239 3,239 3,113
Personnel costs/employee € thousands 25.9 33.1 48.3 49.9 52.4 52.2
Personnel costs/VA % 64.6 % 67.1 % 80.3 % 93.1 % 83.4 % 82.8 %
Gross operating surplus € millions 1,337 1,206 541 7 412 417
Gross operating surplus/vA % 29.5 % 26.0 % 12.3 % 0.2 % 10.6 % 11.1 %
Interest expense € millions 387 440 171 177 129
Interest expense/VA % 8.5 % 9.5 % 4.9 % 4.6 % 3.4 %
Interest income € millions 213 337 226 217 305
Interest income/VA % 4.7 % 7.3 % 6.5 % 5.6 % 8.1 %
Net interest income (expense) € millions - 174 - 103 55 40 175
Net interest income (expense)/VA % - 3.8 % - 2.2 % 1.6 % 1.0 % 4.7 %
Cash flow € millions 883 889 - 46 341 428
Cash flow/VA % 19.5 % 19.2 % - 1.3 % 8.8 % 11.4 %
Net income (loss) € millions 400 - 92 - 248 - 427 - 17 201
Net income/sales % 2.8 % - 0.5 % - 1.2 % - 2.9 % - 0.1 % 1.2 %
Capital expenditure € millions 899 1,024
Gross fixed investments exclusive of contributions € millions 1,092 1,119 413 524
Capital expenditure/sales % 6.2 % 5.8 % 5.3 % 7.5 % 2.6 % 3.2 %
Capital expenditure/vA % 19.8 % 22.0 % 24.8 % 32.2 % 10.6 % 13.9 %
(1) Estimates by FIEv; the initial earnings figures put out by ESANE for 2012 report 714 companies and sales of 20.318 billion euro, which could be explained by a reclassification of companies to fit in with the automotive equipment makers business categorization structure.(2) Actual employees: average employee numbers, corrected by the balance of employees hired (temporary staff) and quoted as hired staff.
80_AnALysis And highLighTs / CoMIté DES ConStRuCtEuRS FRAnçAIS D’AutoMoBIlES CoMIté DES ConStRuCtEuRS FRAnçAIS D’AutoMoBIlES / AnALysis And highLighTs_8180_AnALysis And highLighTs / CoMIté DES ConStRuCtEuRS FRAnçAIS D’AutoMoBIlES CoMIté DES ConStRuCtEuRS FRAnçAIS D’AutoMoBIlES / AnALysis And highLighTs_81
FrANCE
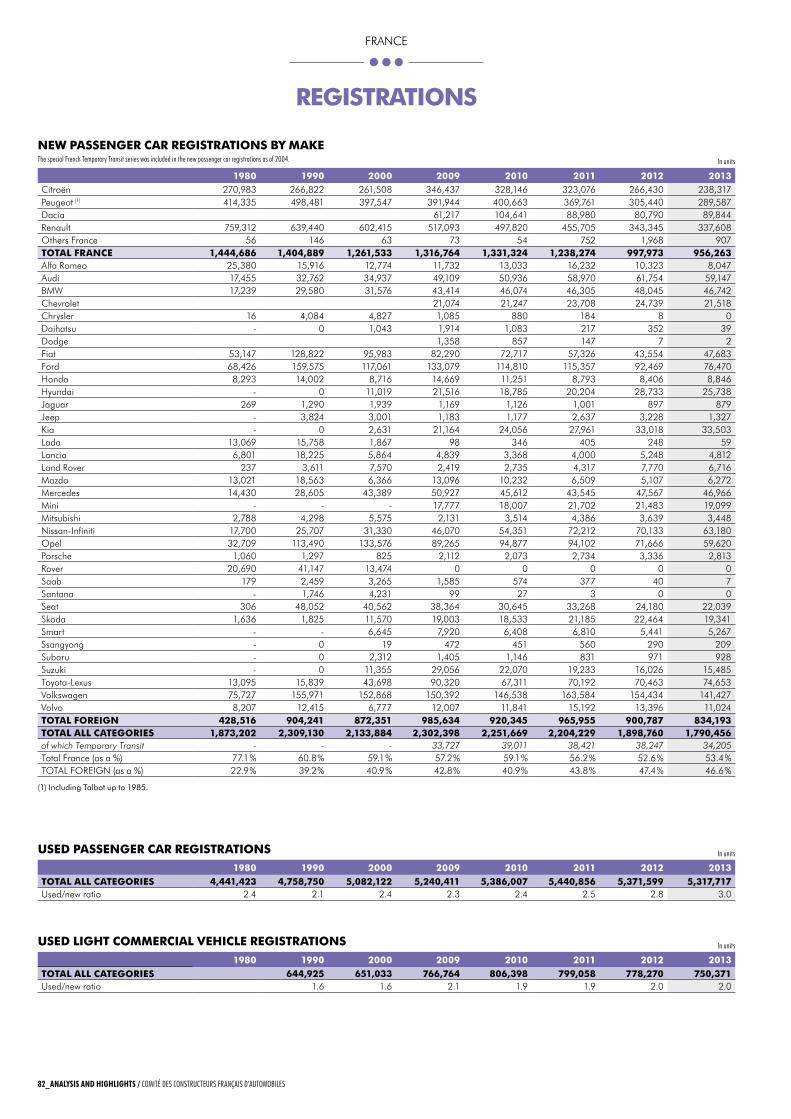
rEGIStrAtIoNS
NEw pASSENGEr CAr rEGIStrAtIoNS by mAkEthe special French temporary transit series was included in the new passenger car registrations as of 2004.
1980 1990 2000 2009 2010 2011 2012 2013Citroën 270,983 266,822 261,508 346,437 328,146 323,076 266,430 238,317Peugeot (1) 414,335 498,481 397,547 391,944 400,663 369,761 305,440 289,587Dacia 61,217 104,641 88,980 80,790 89,844renault 759,312 639,440 602,415 517,093 497,820 455,705 343,345 337,608Others France 56 146 63 73 54 752 1,968 907totAl FrANCE 1,444,686 1,404,889 1,261,533 1,316,764 1,331,324 1,238,274 997,973 956,263Alfa romeo 25,380 15,916 12,774 11,732 13,033 16,232 10,323 8,047Audi 17,455 32,762 34,937 49,109 50,936 58,970 61,754 59,147BMw 17,239 29,580 31,576 43,414 46,074 46,305 48,045 46,742Chevrolet 21,074 21,247 23,708 24,739 21,518Chrysler 16 4,084 4,827 1,085 880 184 8 0Daihatsu - 0 1,043 1,914 1,083 217 352 39Dodge 1,358 857 147 7 2Fiat 53,147 128,822 95,983 82,290 72,717 57,326 43,554 47,683Ford 68,426 159,575 117,061 133,079 114,810 115,357 92,469 76,470Honda 8,293 14,002 8,716 14,669 11,251 8,793 8,406 8,846Hyundai - 0 11,019 21,516 18,785 20,204 28,733 25,738Jaguar 269 1,290 1,939 1,169 1,126 1,001 897 879Jeep - 3,824 3,001 1,183 1,177 2,637 3,228 1,327Kia - 0 2,631 21,164 24,056 27,961 33,018 33,503lada 13,069 15,758 1,867 98 346 405 248 59lancia 6,801 18,225 5,864 4,839 3,368 4,000 5,248 4,812land rover 237 3,611 7,570 2,419 2,735 4,317 7,770 6,716Mazda 13,021 18,563 6,366 13,096 10,232 6,509 5,107 6,272Mercedes 14,430 28,605 43,389 50,927 45,612 43,545 47,567 46,966Mini - - - 17,777 18,007 21,702 21,483 19,099Mitsubishi 2,788 4,298 5,575 2,131 3,514 4,386 3,639 3,448Nissan-Infiniti 17,700 25,707 31,330 46,070 54,351 72,212 70,133 63,180Opel 32,709 113,490 133,576 89,265 94,877 94,102 71,666 59,620Porsche 1,060 1,297 825 2,112 2,073 2,734 3,336 2,813rover 20,690 41,147 13,474 0 0 0 0 0Saab 179 2,459 3,265 1,585 574 377 40 7Santana - 1,746 4,231 99 27 3 0 0Seat 306 48,052 40,562 38,364 30,645 33,268 24,180 22,039Skoda 1,636 1,825 11,570 19,003 18,533 21,185 22,464 19,341Smart - - 6,645 7,920 6,408 6,810 5,441 5,267Ssangyong - 0 19 472 451 560 290 209Subaru - 0 2,312 1,405 1,146 831 971 928Suzuki - 0 11,355 29,056 22,070 19,233 16,026 15,485Toyota-lexus 13,095 15,839 43,698 90,320 67,311 70,192 70,463 74,653Volkswagen 75,727 155,971 152,868 150,392 146,538 163,584 154,434 141,427Volvo 8,207 12,415 6,777 12,007 11,841 15,192 13,396 11,024totAl ForEIGN 428,516 904,241 872,351 985,634 920,345 965,955 900,787 834,193totAl All CAtEGorIES 1,873,202 2,309,130 2,133,884 2,302,398 2,251,669 2,204,229 1,898,760 1,790,456of which Temporary Transit - - - 33,727 39,011 38,421 38,247 34,205Total France (as a %) 77.1 % 60.8 % 59.1 % 57.2 % 59.1 % 56.2 % 52.6 % 53.4 %TOTAl FOrEIGN (as a %) 22.9 % 39.2 % 40.9 % 42.8 % 40.9 % 43.8 % 47.4 % 46.6 %
(1) Including talbot up to 1985.
In units
uSEd lIGht CommErCIAl vEhIClE rEGIStrAtIoNS1980 1990 2000 2009 2010 2011 2012 2013
totAl All CAtEGorIES 644,925 651,033 766,764 806,398 799,058 778,270 750,371Used/new ratio 1.6 1.6 2.1 1.9 1.9 2.0 2.0
In units
uSEd pASSENGEr CAr rEGIStrAtIoNS1980 1990 2000 2009 2010 2011 2012 2013
totAl All CAtEGorIES 4,441,423 4,758,750 5,082,122 5,240,411 5,386,007 5,440,856 5,371,599 5,317,717Used/new ratio 2.4 2.1 2.4 2.3 2.4 2.5 2.8 3.0
In units
82_AnALysis And highLighTs / CoMIté DES ConStRuCtEuRS FRAnçAIS D’AutoMoBIlES CoMIté DES ConStRuCtEuRS FRAnçAIS D’AutoMoBIlES / AnALysis And highLighTs_83
FrANCE
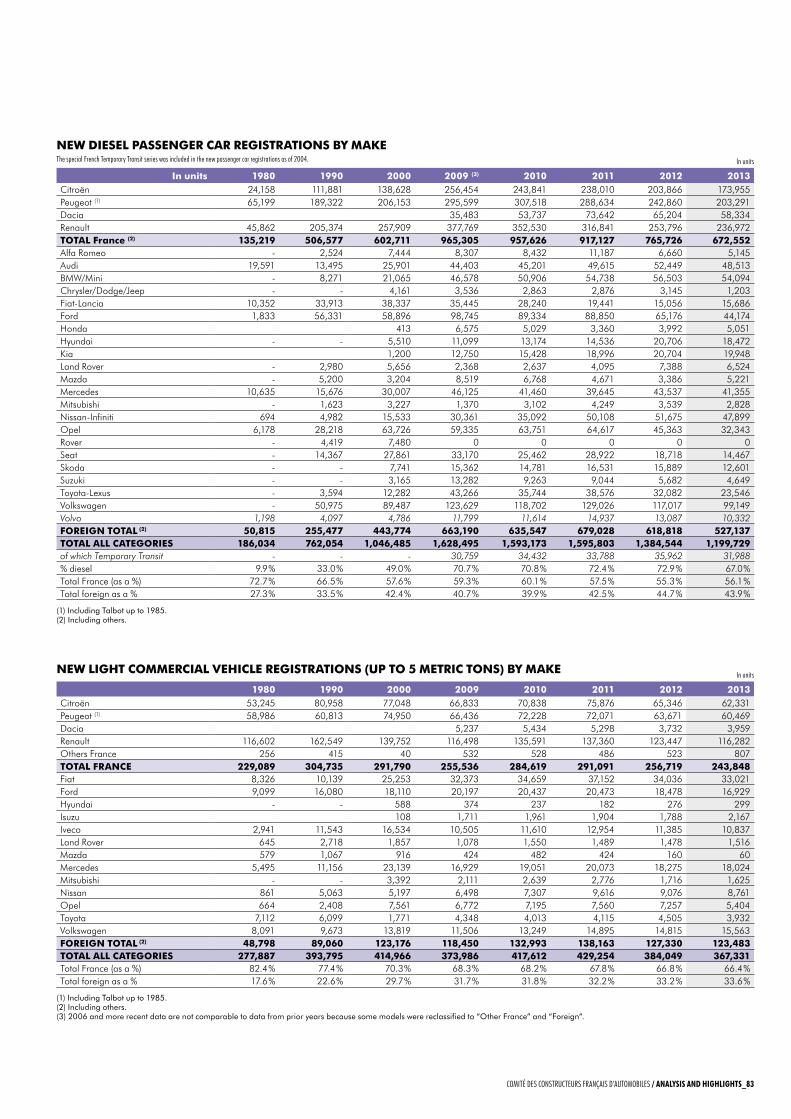
NEw dIESEl pASSENGEr CAr rEGIStrAtIoNS by mAkEthe special French temporary transit series was included in the new passenger car registrations as of 2004. In units
NEw lIGht CommErCIAl vEhIClE rEGIStrAtIoNS (up to 5 mEtrIC toNS) by mAkE
1980 1990 2000 2009 2010 2011 2012 2013Citroën 53,245 80,958 77,048 66,833 70,838 75,876 65,346 62,331Peugeot (1) 58,986 60,813 74,950 66,436 72,228 72,071 63,671 60,469Dacia 5,237 5,434 5,298 3,732 3,959renault 116,602 162,549 139,752 116,498 135,591 137,360 123,447 116,282Others France 256 415 40 532 528 486 523 807totAl FrANCE 229,089 304,735 291,790 255,536 284,619 291,091 256,719 243,848Fiat 8,326 10,139 25,253 32,373 34,659 37,152 34,036 33,021Ford 9,099 16,080 18,110 20,197 20,437 20,473 18,478 16,929Hyundai - - 588 374 237 182 276 299Isuzu 108 1,711 1,961 1,904 1,788 2,167Iveco 2,941 11,543 16,534 10,505 11,610 12,954 11,385 10,837land rover 645 2,718 1,857 1,078 1,550 1,489 1,478 1,516Mazda 579 1,067 916 424 482 424 160 60Mercedes 5,495 11,156 23,139 16,929 19,051 20,073 18,275 18,024Mitsubishi - - 3,392 2,111 2,639 2,776 1,716 1,625Nissan 861 5,063 5,197 6,498 7,307 9,616 9,076 8,761Opel 664 2,408 7,561 6,772 7,195 7,560 7,257 5,404Toyota 7,112 6,099 1,771 4,348 4,013 4,115 4,505 3,932Volkswagen 8,091 9,673 13,819 11,506 13,249 14,895 14,815 15,563ForEIGN totAl (2) 48,798 89,060 123,176 118,450 132,993 138,163 127,330 123,483totAl All CAtEGorIES 277,887 393,795 414,966 373,986 417,612 429,254 384,049 367,331Total France (as a %) 82.4 % 77.4 % 70.3 % 68.3 % 68.2 % 67.8 % 66.8 % 66.4 %Total foreign as a % 17.6 % 22.6 % 29.7 % 31.7 % 31.8 % 32.2 % 33.2 % 33.6 %
(1) Including talbot up to 1985.(2) Including others.(3) 2006 and more recent data are not comparable to data from prior years because some models were reclassified to “Other France” and “Foreign”.
In units
In units 1980 1990 2000 2009 (3) 2010 2011 2012 2013Citroën 24,158 111,881 138,628 256,454 243,841 238,010 203,866 173,955Peugeot (1) 65,199 189,322 206,153 295,599 307,518 288,634 242,860 203,291Dacia 35,483 53,737 73,642 65,204 58,334renault 45,862 205,374 257,909 377,769 352,530 316,841 253,796 236,972totAl France (2) 135,219 506,577 602,711 965,305 957,626 917,127 765,726 672,552Alfa romeo - 2,524 7,444 8,307 8,432 11,187 6,660 5,145Audi 19,591 13,495 25,901 44,403 45,201 49,615 52,449 48,513BMw/Mini - 8,271 21,065 46,578 50,906 54,738 56,503 54,094Chrysler/Dodge/Jeep - - 4,161 3,536 2,863 2,876 3,145 1,203Fiat-lancia 10,352 33,913 38,337 35,445 28,240 19,441 15,056 15,686Ford 1,833 56,331 58,896 98,745 89,334 88,850 65,176 44,174Honda 413 6,575 5,029 3,360 3,992 5,051Hyundai - - 5,510 11,099 13,174 14,536 20,706 18,472Kia 1,200 12,750 15,428 18,996 20,704 19,948land rover - 2,980 5,656 2,368 2,637 4,095 7,388 6,524Mazda - 5,200 3,204 8,519 6,768 4,671 3,386 5,221Mercedes 10,635 15,676 30,007 46,125 41,460 39,645 43,537 41,355Mitsubishi - 1,623 3,227 1,370 3,102 4,249 3,539 2,828Nissan-Infiniti 694 4,982 15,533 30,361 35,092 50,108 51,675 47,899Opel 6,178 28,218 63,726 59,335 63,751 64,617 45,363 32,343rover - 4,419 7,480 0 0 0 0 0Seat - 14,367 27,861 33,170 25,462 28,922 18,718 14,467Skoda - - 7,741 15,362 14,781 16,531 15,889 12,601Suzuki - - 3,165 13,282 9,263 9,044 5,682 4,649Toyota-lexus - 3,594 12,282 43,266 35,744 38,576 32,082 23,546Volkswagen - 50,975 89,487 123,629 118,702 129,026 117,017 99,149Volvo 1,198 4,097 4,786 11,799 11,614 14,937 13,087 10,332ForEIGN totAl (2) 50,815 255,477 443,774 663,190 635,547 679,028 618,818 527,137totAl All CAtEGorIES 186,034 762,054 1,046,485 1,628,495 1,593,173 1,595,803 1,384,544 1,199,729of which Temporary Transit - - - 30,759 34,432 33,788 35,962 31,988% diesel 9.9 % 33.0 % 49.0 % 70.7 % 70.8 % 72.4 % 72.9 % 67.0 %Total France (as a %) 72.7 % 66.5 % 57.6 % 59.3 % 60.1 % 57.5 % 55.3 % 56.1 %Total foreign as a % 27.3 % 33.5 % 42.4 % 40.7 % 39.9 % 42.5 % 44.7 % 43.9 %
(1) Including talbot up to 1985.(2) Including others.
82_AnALysis And highLighTs / CoMIté DES ConStRuCtEuRS FRAnçAIS D’AutoMoBIlES CoMIté DES ConStRuCtEuRS FRAnçAIS D’AutoMoBIlES / AnALysis And highLighTs_83
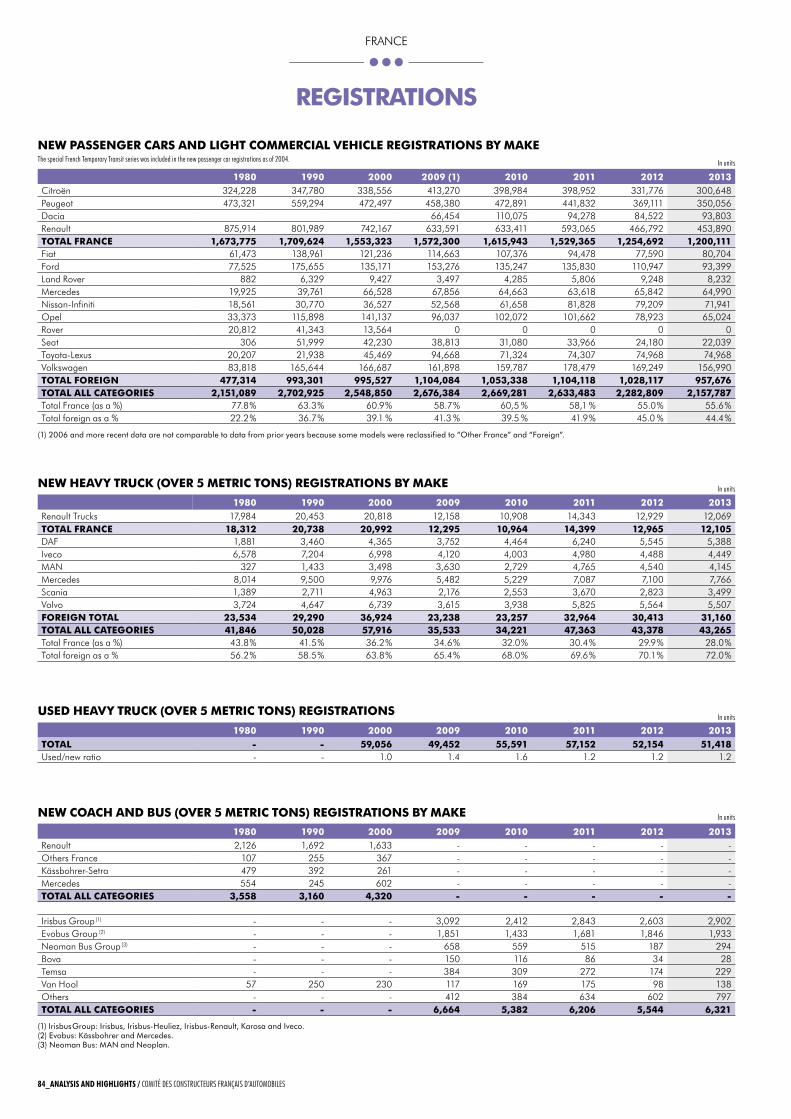
rEGIStrAtIoNS
NEw pASSENGEr CArS ANd lIGht CommErCIAl vEhIClE rEGIStrAtIoNS by mAkEthe special French temporary transit series was included in the new passenger car registrations as of 2004.
1980 1990 2000 2009 (1) 2010 2011 2012 2013 Citroën 324,228 347,780 338,556 413,270 398,984 398,952 331,776 300,648Peugeot 473,321 559,294 472,497 458,380 472,891 441,832 369,111 350,056Dacia 66,454 110,075 94,278 84,522 93,803renault 875,914 801,989 742,167 633,591 633,411 593,065 466,792 453,890totAl FrANCE 1,673,775 1,709,624 1,553,323 1,572,300 1,615,943 1,529,365 1,254,692 1,200,111Fiat 61,473 138,961 121,236 114,663 107,376 94,478 77,590 80,704Ford 77,525 175,655 135,171 153,276 135,247 135,830 110,947 93,399land rover 882 6,329 9,427 3,497 4,285 5,806 9,248 8,232Mercedes 19,925 39,761 66,528 67,856 64,663 63,618 65,842 64,990Nissan-Infiniti 18,561 30,770 36,527 52,568 61,658 81,828 79,209 71,941Opel 33,373 115,898 141,137 96,037 102,072 101,662 78,923 65,024rover 20,812 41,343 13,564 0 0 0 0 0Seat 306 51,999 42,230 38,813 31,080 33,966 24,180 22,039Toyota-lexus 20,207 21,938 45,469 94,668 71,324 74,307 74,968 74,968Volkswagen 83,818 165,644 166,687 161,898 159,787 178,479 169,249 156,990totAl ForEIGN 477,314 993,301 995,527 1,104,084 1,053,338 1,104,118 1,028,117 957,676totAl All CAtEGorIES 2,151,089 2,702,925 2,548,850 2,676,384 2,669,281 2,633,483 2,282,809 2,157,787Total France (as a %) 77.8 % 63.3 % 60.9 % 58.7 % 60,5 % 58,1 % 55.0 % 55.6 %Total foreign as a % 22.2 % 36.7 % 39.1 % 41.3 % 39.5 % 41.9 % 45.0 % 44.4 %
(1) 2006 and more recent data are not comparable to data from prior years because some models were reclassified to “Other France” and “Foreign”.
In units
NEw hEAvy truCk (ovEr 5 mEtrIC toNS) rEGIStrAtIoNS by mAkE
1980 1990 2000 2009 2010 2011 2012 2013renault Trucks 17,984 20,453 20,818 12,158 10,908 14,343 12,929 12,069totAl FrANCE 18,312 20,738 20,992 12,295 10,964 14,399 12,965 12,105DAF 1,881 3,460 4,365 3,752 4,464 6,240 5,545 5,388Iveco 6,578 7,204 6,998 4,120 4,003 4,980 4,488 4,449MAN 327 1,433 3,498 3,630 2,729 4,765 4,540 4,145Mercedes 8,014 9,500 9,976 5,482 5,229 7,087 7,100 7,766Scania 1,389 2,711 4,963 2,176 2,553 3,670 2,823 3,499Volvo 3,724 4,647 6,739 3,615 3,938 5,825 5,564 5,507ForEIGN totAl 23,534 29,290 36,924 23,238 23,257 32,964 30,413 31,160totAl All CAtEGorIES 41,846 50,028 57,916 35,533 34,221 47,363 43,378 43,265Total France (as a %) 43.8 % 41.5 % 36.2 % 34.6 % 32.0 % 30.4 % 29.9 % 28.0 %Total foreign as a % 56.2 % 58.5 % 63.8 % 65.4 % 68.0 % 69.6 % 70.1 % 72.0 %
In units
uSEd hEAvy truCk (ovEr 5 mEtrIC toNS) rEGIStrAtIoNS
1980 1990 2000 2009 2010 2011 2012 2013totAl - - 59,056 49,452 55,591 57,152 52,154 51,418Used/new ratio - - 1.0 1.4 1.6 1.2 1.2 1.2
In units
Irisbus Group (1) - - - 3,092 2,412 2,843 2,603 2,902Evobus Group (2) - - - 1,851 1,433 1,681 1,846 1,933Neoman Bus Group (3) - - - 658 559 515 187 294Bova - - - 150 116 86 34 28Temsa - - - 384 309 272 174 229Van Hool 57 250 230 117 169 175 98 138Others - - - 412 384 634 602 797totAl All CAtEGorIES - - - 6,664 5,382 6,206 5,544 6,321
(1) Irisbus group: Irisbus, Irisbus-heuliez, Irisbus-Renault, karosa and Iveco. (2) Evobus: kässbohrer and mercedes.(3) Neoman bus: mAN and Neoplan.
NEw CoACh ANd buS (ovEr 5 mEtrIC toNS) rEGIStrAtIoNS by mAkE
1980 1990 2000 2009 2010 2011 2012 2013renault 2,126 1,692 1,633 - - - - -Others France 107 255 367 - - - - -Kässbohrer-Setra 479 392 261 - - - - -Mercedes 554 245 602 - - - - -totAl All CAtEGorIES 3,558 3,160 4,320 - - - - -
In units
84_AnALysis And highLighTs / CoMIté DES ConStRuCtEuRS FRAnçAIS D’AutoMoBIlES CoMIté DES ConStRuCtEuRS FRAnçAIS D’AutoMoBIlES / AnALysis And highLighTs_85
FrANCE
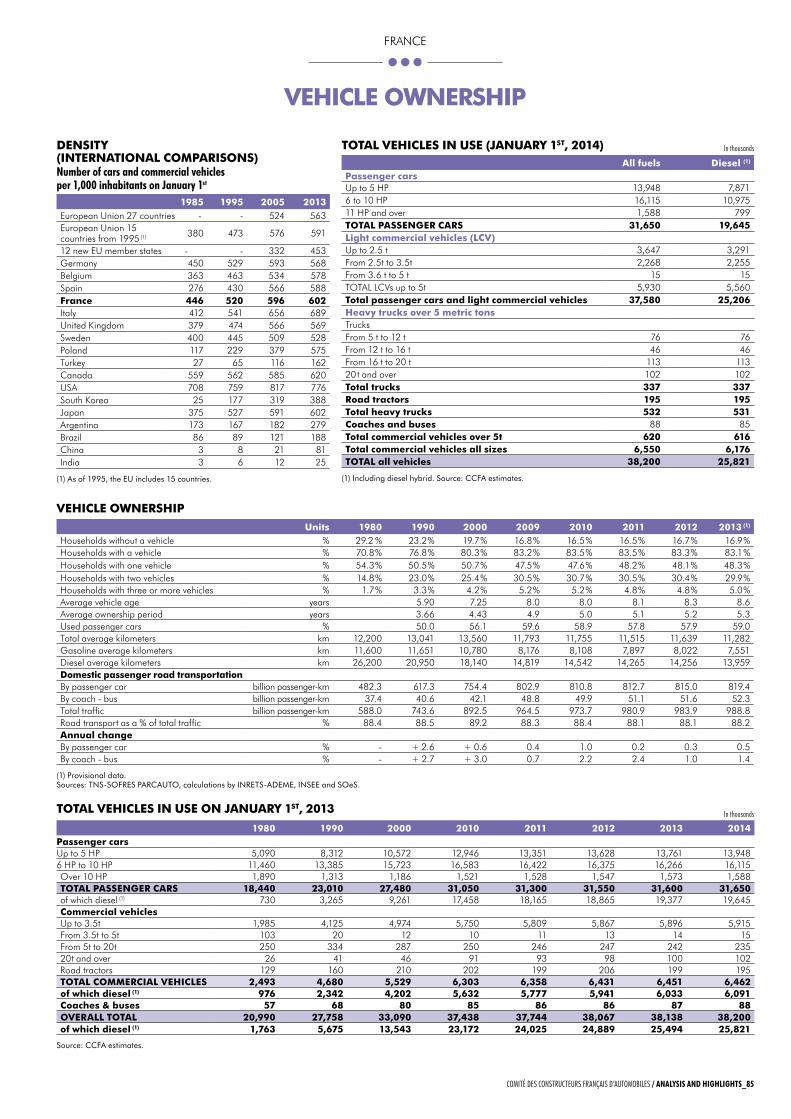
vEhIClE owNErShIp
dENSIty (INtErNAtIoNAl CompArISoNS)number of cars and commercial vehicles per 1,000 inhabitants on january 1st
1985 1995 2005 2013European Union 27 countries - - 524 563European Union 15 countries from 1995 (1) 380 473 576 591
12 new EU member states - - 332 453Germany 450 529 593 568Belgium 363 463 534 578Spain 276 430 566 588France 446 520 596 602Italy 412 541 656 689United Kingdom 379 474 566 569Sweden 400 445 509 528Poland 117 229 379 575Turkey 27 65 116 162Canada 559 562 585 620USA 708 759 817 776South Korea 25 177 319 388Japan 375 527 591 602Argentina 173 167 182 279Brazil 86 89 121 188China 3 8 21 81India 3 6 12 25
(1) As of 1995, the EU includes 15 countries.
totAl vEhIClES IN uSE (JANuAry 1St, 2014)All fuels diesel (1)
passenger carsUp to 5 HP 13,948 7,8716 to 10 HP 16,115 10,97511 HP and over 1,588 799totAl pASSENGEr CArS 31,650 19,645light commercial vehicles (lCv)Up to 2.5 t 3,647 3,291From 2.5t to 3.5t 2,268 2,255From 3.6 t to 5 t 15 15TOTAl lCVs up to 5t 5,930 5,560total passenger cars and light commercial vehicles 37,580 25,206heavy trucks over 5 metric tonsTrucksFrom 5 t to 12 t 76 76From 12 t to 16 t 46 46From 16 t to 20 t 113 11320 t and over 102 102total trucks 337 337road tractors 195 195total heavy trucks 532 531Coaches and buses 88 85total commercial vehicles over 5t 620 616total commercial vehicles all sizes 6,550 6,176totAl all vehicles 38,200 25,821
(1) Including diesel hybrid. Source: CCFA estimates.
In thousands
vEhIClE owNErShIpunits 1980 1990 2000 2009 2010 2011 2012 2013 (1)
Households without a vehicle % 29.2 % 23.2 % 19.7 % 16.8 % 16.5 % 16.5 % 16.7 % 16.9 %Households with a vehicle % 70.8 % 76.8 % 80.3 % 83.2 % 83.5 % 83.5 % 83.3 % 83.1 %Households with one vehicle % 54.3 % 50.5 % 50.7 % 47.5 % 47.6 % 48.2 % 48.1 % 48.3 %Households with two vehicles % 14.8 % 23.0 % 25.4 % 30.5 % 30.7 % 30.5 % 30.4 % 29.9 %Households with three or more vehicles % 1.7 % 3.3 % 4.2 % 5.2 % 5.2 % 4.8 % 4.8 % 5.0 %Average vehicle age years 5.90 7.25 8.0 8.0 8.1 8.3 8.6Average ownership period years 3.66 4.43 4.9 5.0 5.1 5.2 5.3Used passenger cars % 50.0 56.1 59.6 58.9 57.8 57.9 59.0Total average kilometers km 12,200 13,041 13,560 11,793 11,755 11,515 11,639 11,282Gasoline average kilometers km 11,600 11,651 10,780 8,176 8,108 7,897 8,022 7,551Diesel average kilometers km 26,200 20,950 18,140 14,819 14,542 14,265 14,256 13,959domestic passenger road transportationBy passenger car billion passenger-km 482.3 617.3 754.4 802.9 810.8 812.7 815.0 819.4By coach - bus billion passenger-km 37.4 40.6 42.1 48.8 49.9 51.1 51.6 52.3Total traffic billion passenger-km 588.0 743.6 892.5 964.5 973.7 980.9 983.9 988.8road transport as a % of total traffic % 88.4 88.5 89.2 88.3 88.4 88.1 88.1 88.2Annual changeBy passenger car % - + 2.6 + 0.6 0.4 1.0 0.2 0.3 0.5By coach - bus % - + 2.7 + 3.0 0.7 2.2 2.4 1.0 1.4
(1) Provisional data.Sources: tNS-SOFRES PARCAUtO, calculations by INREtS-AdEmE, INSEE and SOeS.
In thousandstotAl vEhIClES IN uSE oN JANuAry 1St, 2013
1980 1990 2000 2010 2011 2012 2013 2014passenger carsUp to 5 HP 5,090 8,312 10,572 12,946 13,351 13,628 13,761 13,9486 HP to 10 HP 11,460 13,385 15,723 16,583 16,422 16,375 16,266 16,115Over 10 HP 1,890 1,313 1,186 1,521 1,528 1,547 1,573 1,588totAl pASSENGEr CArS 18,440 23,010 27,480 31,050 31,300 31,550 31,600 31,650of which diesel (1) 730 3,265 9,261 17,458 18,165 18,865 19,377 19,645Commercial vehiclesUp to 3.5t 1,985 4,125 4,974 5,750 5,809 5,867 5,896 5,915From 3.5t to 5t 103 20 12 10 11 13 14 15From 5t to 20t 250 334 287 250 246 247 242 23520t and over 26 41 46 91 93 98 100 102road tractors 129 160 210 202 199 206 199 195totAl CommErCIAl vEhIClES 2,493 4,680 5,529 6,303 6,358 6,431 6,451 6,462of which diesel (1) 976 2,342 4,202 5,632 5,777 5,941 6,033 6,091Coaches & buses 57 68 80 85 86 86 87 88ovErAll totAl 20,990 27,758 33,090 37,438 37,744 38,067 38,138 38,200of which diesel (1) 1,763 5,675 13,543 23,172 24,025 24,889 25,494 25,821
Source: CCFA estimates.
84_AnALysis And highLighTs / CoMIté DES ConStRuCtEuRS FRAnçAIS D’AutoMoBIlES CoMIté DES ConStRuCtEuRS FRAnçAIS D’AutoMoBIlES / AnALysis And highLighTs_85
FrANCE
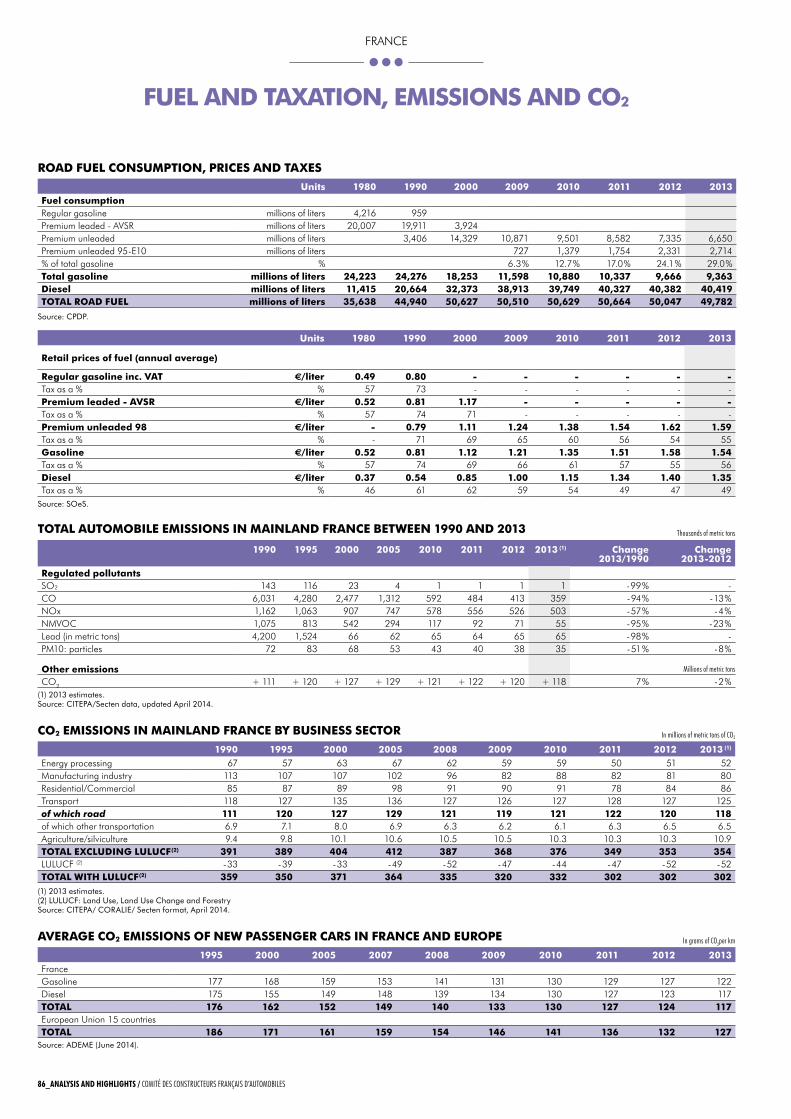
FuEl ANd tAxAtIoN, EmISSIoNS ANd Co2
units 1980 1990 2000 2009 2010 2011 2012 2013Fuel consumption regular gasoline millions of liters 4,216 959Premium leaded - AVSr millions of liters 20,007 19,911 3,924Premium unleaded millions of liters 3,406 14,329 10,871 9,501 8,582 7,335 6,650Premium unleaded 95-E10 millions of liters 727 1,379 1,754 2,331 2,714% of total gasoline % 6.3 % 12.7 % 17.0 % 24.1 % 29.0 %total gasoline millions of liters 24,223 24,276 18,253 11,598 10,880 10,337 9,666 9,363diesel millions of liters 11,415 20,664 32,373 38,913 39,749 40,327 40,382 40,419totAl roAd FuEl millions of liters 35,638 44,940 50,627 50,510 50,629 50,664 50,047 49,782
roAd FuEl CoNSumptIoN, prICES ANd tAxES
Source: CPdP.
units 1980 1990 2000 2009 2010 2011 2012 2013
retail prices of fuel (annual average)
regular gasoline inc. vAt €/liter 0.49 0.80 - - - - - -Tax as a % % 57 73 - - - - - -premium leaded - AvSr €/liter 0.52 0.81 1.17 - - - - -Tax as a % % 57 74 71 - - - - -premium unleaded 98 €/liter - 0.79 1.11 1.24 1.38 1.54 1.62 1.59Tax as a % % - 71 69 65 60 56 54 55Gasoline €/liter 0.52 0.81 1.12 1.21 1.35 1.51 1.58 1.54Tax as a % % 57 74 69 66 61 57 55 56diesel €/liter 0.37 0.54 0.85 1.00 1.15 1.34 1.40 1.35Tax as a % % 46 61 62 59 54 49 47 49
Source: SOeS.
totAl AutomobIlE EmISSIoNS IN mAINlANd FrANCE bEtwEEN 1990 ANd 2013
(1) 2013 estimates.Source: CItEPA/Secten data, updated April 2014.
1990 1995 2000 2005 2010 2011 2012 2013 (1) Change 2013/1990
Change 2013-2012
regulated pollutantsSO2 143 116 23 4 1 1 1 1 - 99 % - CO 6,031 4,280 2,477 1,312 592 484 413 359 - 94 % - 13 %NOx 1,162 1,063 907 747 578 556 526 503 - 57 % - 4 %NMVOC 1,075 813 542 294 117 92 71 55 - 95 % - 23 %lead (in metric tons) 4,200 1,524 66 62 65 64 65 65 - 98 % - PM10: particles 72 83 68 53 43 40 38 35 - 51 % - 8 %
other emissions Millions of metric tons
CO2 + 111 + 120 + 127 + 129 + 121 + 122 + 120 + 118 7 % - 2 %
thousands of metric tons
In millions of metric tons of Co2Co2 EmISSIoNS IN mAINlANd FrANCE by buSINESS SECtor
(1) 2013 estimates.(2) lUlUCF: land Use, land Use Change and ForestrySource: CItEPA/ CORAlIE/ Secten format, April 2014.
1990 1995 2000 2005 2008 2009 2010 2011 2012 2013 (1)
Energy processing 67 57 63 67 62 59 59 50 51 52Manufacturing industry 113 107 107 102 96 82 88 82 81 80residential/Commercial 85 87 89 98 91 90 91 78 84 86Transport 118 127 135 136 127 126 127 128 127 125of which road 111 120 127 129 121 119 121 122 120 118of which other transportation 6.9 7.1 8.0 6.9 6.3 6.2 6.1 6.3 6.5 6.5Agriculture/silviculture 9.4 9.8 10.1 10.6 10.5 10.5 10.3 10.3 10.3 10.9totAl ExCludING luluCF (2) 391 389 404 412 387 368 376 349 353 354lUlUCF (2) - 33 - 39 - 33 - 49 - 52 - 47 - 44 - 47 - 52 - 52totAl wIth luluCF (2) 359 350 371 364 335 320 332 302 302 302
In grams of Co2per kmAvErAGE Co2 EmISSIoNS oF NEw pASSENGEr CArS IN FrANCE ANd EuropE1995 2000 2005 2007 2008 2009 2010 2011 2012 2013
FranceGasoline 177 168 159 153 141 131 130 129 127 122Diesel 175 155 149 148 139 134 130 127 123 117totAl 176 162 152 149 140 133 130 127 124 117European Union 15 countriestotAl 186 171 161 159 154 146 141 136 132 127
Source: AdEmE (june 2014).
86_AnALysis And highLighTs / CoMIté DES ConStRuCtEuRS FRAnçAIS D’AutoMoBIlES CoMIté DES ConStRuCtEuRS FRAnçAIS D’AutoMoBIlES / AnALysis And highLighTs_87
FrANCE
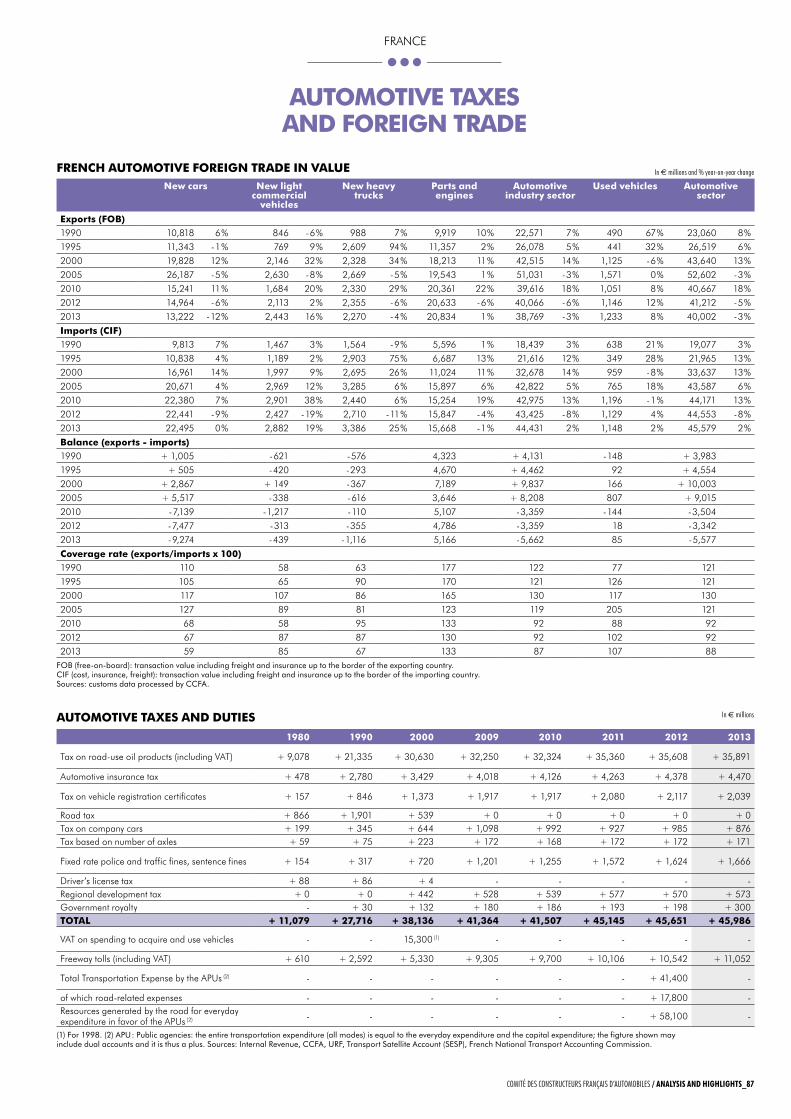
FrENCh AutomotIvE ForEIGN trAdE IN vAluENew cars New light
commercial vehicles
New heavy trucks
parts and engines
Automotive industry sector
used vehicles Automotive sector
Exports (Fob)1990 10,818 6 % 846 - 6 % 988 7 % 9,919 10 % 22,571 7 % 490 67 % 23,060 8 %1995 11,343 - 1 % 769 9 % 2,609 94 % 11,357 2 % 26,078 5 % 441 32 % 26,519 6 %2000 19,828 12 % 2,146 32 % 2,328 34 % 18,213 11 % 42,515 14 % 1,125 - 6 % 43,640 13 %2005 26,187 - 5 % 2,630 - 8 % 2,669 - 5 % 19,543 1 % 51,031 - 3 % 1,571 0 % 52,602 - 3 %2010 15,241 11 % 1,684 20 % 2,330 29 % 20,361 22 % 39,616 18 % 1,051 8 % 40,667 18 %2012 14,964 - 6 % 2,113 2 % 2,355 - 6 % 20,633 - 6 % 40,066 - 6 % 1,146 12 % 41,212 - 5 %2013 13,222 - 12 % 2,443 16 % 2,270 - 4 % 20,834 1 % 38,769 - 3 % 1,233 8 % 40,002 - 3 %
Imports (CIF)1990 9,813 7 % 1,467 3 % 1,564 - 9 % 5,596 1 % 18,439 3 % 638 21 % 19,077 3 %1995 10,838 4 % 1,189 2 % 2,903 75 % 6,687 13 % 21,616 12 % 349 28 % 21,965 13 %2000 16,961 14 % 1,997 9 % 2,695 26 % 11,024 11 % 32,678 14 % 959 - 8 % 33,637 13 %2005 20,671 4 % 2,969 12 % 3,285 6 % 15,897 6 % 42,822 5 % 765 18 % 43,587 6 %2010 22,380 7 % 2,901 38 % 2,440 6 % 15,254 19 % 42,975 13 % 1,196 - 1 % 44,171 13 %2012 22,441 - 9 % 2,427 - 19 % 2,710 - 11 % 15,847 - 4 % 43,425 - 8 % 1,129 4 % 44,553 - 8 %2013 22,495 0 % 2,882 19 % 3,386 25 % 15,668 - 1 % 44,431 2 % 1,148 2 % 45,579 2 %
balance (exports - imports)1990 + 1,005 - 621 - 576 4,323 + 4,131 - 148 + 3,9831995 + 505 - 420 - 293 4,670 + 4,462 92 + 4,5542000 + 2,867 + 149 - 367 7,189 + 9,837 166 + 10,0032005 + 5,517 - 338 - 616 3,646 + 8,208 807 + 9,0152010 - 7,139 - 1,217 - 110 5,107 - 3,359 - 144 - 3,5042012 - 7,477 - 313 - 355 4,786 - 3,359 18 - 3,3422013 - 9,274 - 439 - 1,116 5,166 - 5,662 85 - 5,577
Coverage rate (exports/imports x 100)1990 110 58 63 177 122 77 1211995 105 65 90 170 121 126 1212000 117 107 86 165 130 117 1302005 127 89 81 123 119 205 1212010 68 58 95 133 92 88 922012 67 87 87 130 92 102 922013 59 85 67 133 87 107 88
FOb (free-on-board): transaction value including freight and insurance up to the border of the exporting country.CIF (cost, insurance, freight): transaction value including freight and insurance up to the border of the importing country.Sources: customs data processed by CCFA.
AutomotIvE tAxES ANd dutIES
(1) For 1998. (2) APU : Public agencies: the entire transportation expenditure (all modes) is equal to the everyday expenditure and the capital expenditure; the figture shown may include dual accounts and it is thus a plus. Sources: Internal Revenue, CCFA, URF, transport Satellite Account (SESP), French National transport Accounting Commission.
1980 1990 2000 2009 2010 2011 2012 2013
Tax on road-use oil products (including VAT) + 9,078 + 21,335 + 30,630 + 32,250 + 32,324 + 35,360 + 35,608 + 35,891
Automotive insurance tax + 478 + 2,780 + 3,429 + 4,018 + 4,126 + 4,263 + 4,378 + 4,470
Tax on vehicle registration certificates + 157 + 846 + 1,373 + 1,917 + 1,917 + 2,080 + 2,117 + 2,039
road tax + 866 + 1,901 + 539 + 0 + 0 + 0 + 0 + 0Tax on company cars + 199 + 345 + 644 + 1,098 + 992 + 927 + 985 + 876Tax based on number of axles + 59 + 75 + 223 + 172 + 168 + 172 + 172 + 171
Fixed rate police and traffic fines, sentence fines + 154 + 317 + 720 + 1,201 + 1,255 + 1,572 + 1,624 + 1,666
Driver’s license tax + 88 + 86 + 4 - - - - -regional development tax + 0 + 0 + 442 + 528 + 539 + 577 + 570 + 573Government royalty - + 30 + 132 + 180 + 186 + 193 + 198 + 300totAl + 11,079 + 27,716 + 38,136 + 41,364 + 41,507 + 45,145 + 45,651 + 45,986
VAT on spending to acquire and use vehicles - - 15,300 (1) - - - - -
Freeway tolls (including VAT) + 610 + 2,592 + 5,330 + 9,305 + 9,700 + 10,106 + 10,542 + 11,052
Total Transportation Expense by the APUs (2) - - - - - - + 41,400 -
of which road-related expenses - - - - - - + 17,800 -resources generated by the road for everyday expenditure in favor of the APUs (2) - - - - - - + 58,100 -
In € millions
In € millions and % year-on-year change
AutomotIvE tAxES ANd ForEIGN trAdE
86_AnALysis And highLighTs / CoMIté DES ConStRuCtEuRS FRAnçAIS D’AutoMoBIlES CoMIté DES ConStRuCtEuRS FRAnçAIS D’AutoMoBIlES / AnALysis And highLighTs_87
FrANCE
FrENCh AutomotIvE mANuFACturErSPSA Peugeot Citroënpeugeot75, avenue de la Grande Armée - 75116 Paris Tel.:Tel.: +33 (0)1 40 66 55 11 - Fax: +33 (0)1 40 66 54 14www.psa.fr - www.peugeot.com
CitroënImmeuble Colisée III - 12, rue Fructidor75835 Paris Cedex 17Tel.: +33 (0)1 58 79 79 79 - Fax: +33 (0)1 58 79 72 25www.psa.fr - www.citroen.com
renault13-15, quai le Gallo - 92153 Boulogne-Billancourt CedexTel.: +33 (0)1 76 84 50 50 www.renault.com
renault trucks99, route de lyon - 69800 Saint-PriestTel.: +33 (0)4 72 96 51 11Direction des relations Extérieures15, bd de l’Amiral-Bruix - 75016 ParisTel.: +33 (0)1 58 44 19 71 - Fax: +33 (0)1 58 44 19 75www.renault-trucks.com
Alpine-renaultAvenue de Bréauté - 76885 Dieppe CedexTel.: +33 (0)1 76 86 31 50 - Fax: +33 (0)1 76 86 34 00
AutomotIvE orGANIZAtIoNS IN FrANCEAssociation Française du Gaz Naturel pour véhicules (AFGNv)10, rue Saint-Florentin - 75001 ParisTel.: +33 (0)1 42 97 97 99 - Fax: +33 (0)1 42 97 40 60www.afgnv.com
Chambre Syndicale Nationale des Carrossiers et Constructeursde Semi-remorques et Conteneurs (CArCoSErCo)Immeuble le Cardinet8, rue de Berri - 75017 ParisTel.: +33 (0)1 44 29 71 00 - Fax: +33 (0)1 42 67 48 21www.ffcarrosserie.org
Chambre Syndicale Internationale de l’Automobile et du motocycle (CSIAm)5, square de l’Avenue-du-BoisBP 2116 - 75771 Paris Cedex 16Tel.: +33 (0)1 53 64 50 30 - Fax: +33 (0)1 40 67 95 94www.csiam-fr.org
Comité d’organisation des salons internationaux de l’Automobile, du Cycle, du motocycle et des Sports(AmC promotion)39, avenue Franklin-roosevelt - 75008 ParisTel.: +33 (0)1 56 88 22 40 - Fax: +33 (0)1 42 56 50 80www.amcpromotion.com
Conseil National des professions de l’Automobile (CNpA)50, rue rouget-de-l’Isle - 92158 Suresnes CedexTel.: +33 (0)1 40 99 55 00 - Fax: +33 (0)1 47 28 44 15www.cnpa.fr
Fédération des Industries d’Équipementspour véhicules (FIEv)77-81, rue Jean-Jacques rousseau92158 Suresnes cedexTel.: +33 (0)1 46 25 02 30 - Fax: +33 (0)1 46 97 00 80www.fiev.fr
Groupement pour l’Amélioration des liaisons dans l’Automobile (GAlIA)20, rue Danjou - 92100 Boulogne-BillancourtTel.: +33 (0)1 41 31 68 68 - Fax: +33 (0)1 41 31 68 60www.galia.com
plateforme de la Filière Automobile (pFA)2, rue de Presbourg - 75008 ParisTel.: +33 (0)1 49 52 63 98www.pfa-auto.fr
Syndicat National des loueurs de véhicules en longue durée (SNlvld)Immeuble DIAPASON218, avenue de New-York - 75934 Paris Cedex 19Tel.: +33 (0)1 53 68 40 40 - Fax: +33 (0)1 53 68 40 99www.snlvld.com
Syndicat National des loueurs des véhicules de loisirs (uNIvdl)3, rue des Cordelières - 75013 ParisTel.: +33 (0)1 43 37 86 61Fax: +33 (0)1 45 35 07 39www.univdl.org
union des Industries et métiers de la métallurgie (uImm)56, avenue de wagram - 75017 ParisTel.: +33 (0)1 40 54 20 20 - Fax: +33 (0)1 47 66 22 74www.uimm.fr
union routière de France (urF)9, rue de Berri - 75008 Paris +33 (0)1 01 44.13 55 37.17 - Fax: +33 (0)1 44 13 32 98www.unionroutiere.fr
union technique de l’Automobile, du motocycle et du Cycle (utAC)BP 212 - 91311 Montlhéry CedexTel.: +33 (0)1 69 80 17 00 - Fax: +33 (0)1 69 80 17 17www.utac.com
INtErNAtIoNAl AutomotIvE orGANIZAtIoNSEuropean Automobile manufacturer’s Association (ACEA)85, avenue des Nerviens - 1040 Brussels (Belgium)Tel.: +33 (0)1 32 2732 55 50 - Fax: +32 2 738 73 10www.acea.be
International organization of motor vehicle manufacturers (oICA)4, rue de Berri - 75008 ParisTel.: +33 (0)1 43 59 00 13 - Fax: +33 (0)1 45 63 84 41www.oica.net
AutomotIvE ASSoCIAtIoNS IN FrANCE40 millions d’Automobilistes118, boulevard Haussmann - 75008 ParisTel.: +33 (0)2 43 50 06 30 - Fax: +33 (0)2 43 50 06 31www.40millionsdautomobilistes.com
l’Automobile Club – French drivers’ AssociationHead office: 5, avenue de la Paix - 67000 StrasbourgParis office: 14, avenue de la Grande-Armée - 75017 ParisTel.: +33 (0)821 74 11 11www.automobileclub.org
Fédération Française du Sport Automobile (FFSA)32, avenue de New-York - 75781 Paris Cedex 16Tel.: +33 (0)1 44 30 24 00 - Fax: +33 (0)1 42 24 16 80www.ffsa.org
la prévention routière4, rue Ventadour - 75001 ParisTel.: +33 (0)1 44 15 27 00 - Fax: +33 (0)1 42 27 98 03www.preventionroutiere.asso.fr
Société des Ingénieurs de l’Automobile (SIA)79, rue Jean-Jacques-rousseau - 92158 Suresnes CedexTel.: +33 (0)1 41 44 93 70 - Fax: +33 (0)1 41 44 93 79www.sia.fr
uSEFul AddrESSES
88_AnALysis And highLighTs / CoMIté DES ConStRuCtEuRS FRAnçAIS D’AutoMoBIlES CoMIté DES ConStRuCtEuRS FRAnçAIS D’AutoMoBIlES / AnALysis And highLighTs_np
FrANCE
88_AnALysis And highLighTs / CoMIté DES ConStRuCtEuRS FRAnçAIS D’AutoMoBIlES
AuTomoTive indusTry reseArch orgAnizATions in FrAnce
Association pour le développement du transport et de la mobilité électriques France (Avere France)112 quarter, rue marcadet - 75018 Paristel.: +33 (0)1 53 25 00 60www.france-mobilite-electrique.org
Fondation sécurité routière2, rue de Presbourg - 75008 Paris www.fondationsecuriteroutiere.org
groupe d’Études et de recherches Permanent sur l’industrie et les salariés de l’Automobile (gerPisA)École normale Supérieure de cachan - Bât. Desjardin - 61, avenue du Président-Wilson - 94235 cachan cedextel.: +33 (0)1 47 40 20 00 www.leblog.gerpisa.org
idforcArtechnocampus compositeschemin du chaffault - Zi du chaffault44340 Bouguenaistel.: +33 (0)2 28 44 36 50 - fax: +33 (0)2 99 34 10 61www.id4car.org
institut Français du Pétrole Énergies nouvelles (iFPen)1 & 4, avenue de Bois-Préau92852 rueil-malmaison cedextel.: +33 (0)1 47 52 60 00 - fax: +33 (0)1 47 52 70 00www.ifpenergiesnouvelles.fr
institut Français des sciences et Technologies des Transports, de l’Aménagement et des réseaux (iFsTTAr)ifSttar head officeDépartement Économie et Sociologie des transports (DeSt)14-20, boulevard newtoncité Descartes, champs-sur-marnef77447 marne-la-Vallée cedex 2tel.: +33 (0)1 81 66 80 00www.ifsttar.fr
luTB Transport & mobility systemsc/o cci de lyonPlace de la Bourse - 69289 lyon cedex 02tel.: +33 (0)4 72 40 57 00 - fax: +33 (0)4 72 40 58 60www.lutb.fr
mov’eo clustertechnopôle du madrillet50, rue ettore-Bugatti - 76800 Saint-Étienne-du-rouvray tel.: +33 (0)2 35 65 78 20 - fax: +33 (0)2 35 34 64 97www.pole-moveo.org
Pôle véhicule du Futurhead office: Étupescentre d’affaires technoland15, rue armand-Japy - 25461 Étupes cedexGeneral Secretariat: mulhousetechnopole de mulhouse - BP 2118 - 40, rue marc-Seguin68060 mulhouse cedextel.: +33 (0)3 89 32 76 44 - fax: +33 (0)3 89 32 76 45www.vehiculedufutur.com
Programme national de recherche et d’innovation dans les Transports Terrestres (PrediT)tour Voltaire - 92055 la Défense cedextel.: +33 (0)1 40 81 14 17 - fax: +33 (0)1 40 81 15 22www.predit.prd.fr
in the context of its communication actions, ccfa regularly publishes leaflets on various automobile-related subjects: press surveys, trend charts, etc.
All these publications can be consulted on our website
www.ccfa.fr
france

PARIS EXPO PORTE DE VERSAILLES — 10AM-8PM - LATE OPENING ON THURSDAY & FRIDAY UNTIL 10 PM TICKETS AVAILABLE — WWW.MONDIAL-AUTOMOBILE.COM
# MondialAuto - www.facebook.com/mondial.automobile
THE FUTURE OF THE AUTOMOBILEIS IN PARIS
Mondial 2014 - 210x297 (GB).indd 1 10/02/2014 11:04
Fren
ch au
tomo
tive i
ndus
try,
2014
editi
on