2014 financial report - · pdf filebombardier inc. financial report ... this new structure...
TRANSCRIPT

FISCAL YEAR ENDED DECEMBER 31, 2014
FINANCIAL REPORT
2014

In 2014, Bombardier continued to drive The Evolution of Mobility with new products, orders, deliveries and geographic markets. It was a year of change coupled with a sharper focus on customers and profitable execution. This led to a restructuring of both our aerospace and rail transportation businesses. Today as our new products approach entry-into-service, momentum is building. So is our determination and our focus on delivering as promised.
Pierre Beaudoin answers questions about the year gone by and the one to come.
Message to shareholders ....................................................................................................................1100
Management’s discussion and analysis .........................................................................................4100
Overview................................................................................................................................................6100
Aerospace .............................................................................................................................................39100
Transportation .....................................................................................................................................66100
Other .......................................................................................................................................................81100
Consolidated financial statements ..................................................................................................105100
Notes to consolidated financial statements ..........................................................................114100
Investor information ..............................................................................................................................180100
All amounts in this financial report are in U.S. dollars unless otherwise indicated.
DETERMINED AND FOCUSED ON DELIVERING

BOMBARDIER INC. FINANCIAL REPORT – FISCAL YEAR ENDED DECEMBER 31, 2014 1
Q. Looking back at 2014, what stands out for you?
A. Two areas are top of mind for me: our productsand our reorganization in aerospace and rail transporta-tion. Our businesses continued to evolve with exciting new products about to come on line and our existing portfolio taking us into promising new markets. With our streamlined structure, we’re becoming a more agile organization that’s focused on what counts: the people who buy our products and delivering on our project milestones.
We’ve aligned ourselves around four guiding principles —a focus on customer impact, agility, a global mind-set and accountability—all in the relentless pursuit of value creation. Today there is one overriding objective at Bombardier: execute better and improve margins, in other words, become a true high performance organization.
Q. Can you tell us a bit more aboutthis new structure and its benefits?
A. We will now have three aerospace businesssegments—Business Aircraft, Commercial Aircraft, and Aerostructures and Engineering Services—in addition to our rail transportation business segment. All of them report directly to me. This lighter, nimbler structure will enable us to more readily identify and remove obstacles to operational efficiency.
It will also give us more transparency across the company along with greater investor visibility into our profitability by market. This structure will position us to fully benefit from the growth that’s around the corner with our new products. We’ll also be able to better respond to our customers’ evolving needs.
In 2014, unanticipated world events, namely the Russia-Ukraine situation and turmoil in the Middle East, impacted our strategies. At the same time, we saw positive shifts such as the U.S. economy which posted good growth last year. These events also influence our plans. In today’s ever-changing global context, we must have the capability to share information more efficiently and make decisions faster. As this starts to happen at Bombardier, we’ll be able to adjust more quickly to our environment and take full advantage of new growth opportunities.
In each business segment, we’ve also laid the ground-work for greater employee accountability and a realigned cost base that will support our long-term competitive-ness. Over time, we’re going to see less waste and, I’m certain, improved profitability.
Q. How does this transformation, if that’s not toostrong a word, support Bombardier’s three growth strategies: invest in leading mobility solutions, achieve flawless execution and grow local roots in key markets?
A. This new structure—and yes, you could call ita transformation—is first and foremost about getting more focused on execution. This means delivering what we promised, on time and profitably. In some ways, by simplifying our structure we’ve gone back to basics. We’re making sure employees are focused on the concrete things they need to do each day so we can deliver profitably.
In terms of expanding our local roots globally, our market-specific orientation in aerospace will allow us to better understand the everyday needs of customers wherever they are. At Transportation, the OneBT trans-formation focuses on standardizing products and pro-cesses. This will give us the agility to go into different markets with robust platforms and a more efficient and profitable response to customer needs.
As for investing in leading mobility solutions, we know what we have to do. We’ve identified what it takes to win, both in terms of securing orders and executing profitably. I feel more confident than ever that we’re on the right track.
Q. What gives you this confidence?
A. Our excellent customer relationships and neworders. If you look at our backlog, it’s strong in both traditional and newer markets, which is the ultimate vote of confidence in our product strategy. Whether
Pierre BeaudoinPresident and Chief Executive Officer

BOMBARDIER INC. FINANCIAL REPORT – FISCAL YEAR ENDED DECEMBER 31, 2014 2
it’s the Global business jet or the CSeries commercial aircraft, our aerospace backlog is robust with new products accounting for 40% of orders in backlog.
On the rail transportation side, it’s been a year of growth across multiple geographies. We’ve seen sig- nificant order activity in Australia, the U.K. and South Africa as well as ongoing success in China. We were already in Ethiopia with our Q400 turboprops at one of the world’s best airlines, and now Transportation is there too with a new signalling contract. Overall we’re well positioned to gain market share and become an even bigger global player.
As I mentioned, there are signs of economic recovery in the U.S. after five difficult years. The U.S. represents 50% of the global aerospace market and things are starting to pick up. Some interesting transit projects are also in the works. We see great potential in the U.S. which is why we continue to focus on tapping into this powerful economic engine.
And with the significant reduction in oil prices, our aero- space customers are in a better position to implement their refleeting strategies. For consumers, lower prices at the gas pump translate into more disposable income for travel which in turn creates new capacity needs.
Q. As part of the restructuring, you createda new business segment—Aerostructures and Engineering Services. What does this signal for Bombardier?
A. It signals a great opportunity. This new businesssegment is part of our enhanced focus on growth areas. When we develop new aircraft, we invest sig- nificantly in advanced technologies that are potentially valuable to third parties. I’m talking about technologies such as complex composite and metallic aircraft struc-tures that can be used in all classes of civil aircraft and all categories of structures including fuselages and wings. We see tremendous potential in marketing these technologies to other manufacturers that are investing in updating their products and developing new platforms.
Q. Can you highlight some of the importantdeliveries and orders in 2014?
A. We certified the Challenger 350 businessaircraft and homologated the Regio 2N regional double-deck train in France. The INNOVIA monorail system entered into service in São Paulo, Brazil. We signed key new passenger rail contracts such as Transport for London’s Crossrail project in the U.K.,
the State of Queensland’s New Generation Rollingstock initiative in Australia and Transnet Freight Rail’s TRAXX Africa Locomotives program in South Africa.
In the U.S., we’re executing on the New York subway and nearing completion of the Chicago subway. Both of these cities have attractive transit opportunities on the horizon. San Francisco also ordered an additional 365 rapid transit vehicles from us.
As regional airlines gain traction in China, our CRJ regional jet is in demand. In fact, we recently announced our third CRJ contract in three years with China Express Airlines. In terms of the CSeries aircraft family, we received a major purchase agreement for 40 aircraft from the leasing arm of Australia’s Macquarie AirFinance. With orders and commitments for 563 CSeries airliners from 21 customers in 18 countries, including 243 firm orders, we’re well on our way to achieving our target of 300 orders at entry-into-service.
Q. In recent years, Bombardier allocatedsignificant resources to developing its maintenance services business in both aerospace and rail transportation. How is this going?
A. Our services continue to grow in both sectors.Examples include long-term maintenance contracts with NetJets in the U.S., GO Transit in Toronto and Transport for London in the U.K. Our services footprint is expanding and we recently opened our first wholly owned aerospace service centre in Singapore. Customers increasingly want to concentrate on their core business and growing revenue, not on maintaining their planes and trains. We’ve consistently shown them that we’re in the best position to service our products.
Q. What do you say to investors who may beanxious to see new programs enter into service and start generating revenue?
A. What we do is complex. It takes time to designand build a new plane or train. That can test investors’ patience and, on occasion, ours too. A lengthy product development cycle gives people the time to question our strategy, especially when major programs are late to schedule and cost more than planned.
It’s important to know that we’re constantly stress- testing our product strategy and development priori-ties. On occasion, this forces us to make difficult yet absolutely necessary decisions. Suspending our Learjet 85 business jet program due to persistent, multi-year weak demand in this light aircraft category was one of these decisions.
BOMBARDIER INC. FINANCIAL REPORT – FISCAL YEAR ENDED DECEMBER 31, 2014 3
In the meantime, we continue to move forward with our two other clean-sheet aircraft programs. The CSeries commercial aircraft is meeting performance targets and we’re making good progress towards certifi-cation in the second half of 2015. The Global 7000 and Global 8000 large business jets are also progressing well with the first flight test vehicle in final assembly. We’ll certify the Challenger 650 super-mid-size business jet in 2015. And with 600,000 kilometres of testing completed, the ZEFIRO 380 very high speed train received homologation in January 2015 and is now ready for delivery in China.
Today it’s a question of ensuring we have the best processes and of sharpening our game when it comes to execution. This is the final push before we see revenue from our new products.
In addition, the financing plan announced early 2015 will position the company with a flexible and strong financial profile.
Q. You often speak about Bombardier peoplebeing among the best. What drove that home for you in 2014?
A. When you restructure a company, it’s disruptivefor everyone. Despite the changes and distractions of the past year, our people remained committed and attentive to the tasks at hand. They’re focused on what needs to be done and determined to deliver. We’re aiming for a demonstrable and sustainable high performance mindset across our organization.
Q. In terms of people, you also saw a fewchanges on your Board in 2014.
A. Yes we did. André Bérard, who had been withus since 2004, reached retirement age and stepped down. André’s deep financial and banking expertise was a real asset over the years. Thierry Desmarest, who joined the Board in 2009, left to concentrate on his new duties as Chairman of the French energy company Total S.A. We thank both André and Thierry for their valuable guidance and wish them well. We also welcomed a new Board member, Vikram Pandit, Chairman of TGG Group and former Chief Executive Officer of Citigroup Inc. Vikram’s financial acumen will further strengthen our Board.
We’ve also made changes at the beginning of the current year with Laurent Beaudoin retiring as Chairman after more than 50 years at the helm of Bombardier. He will remain on the Board with the honorary title of Chairman
Emeritus. The Board and I wish to thank Laurent for his passion and his entrepreneurial spirit all through his tenure. Under his guidance, Bombardier became more than an iconic Canadian company; it became a global mobility leader with 74,000 employees and a presence in more than 60 countries across five continents.
I am taking the role of Executive Chairman, working with Bombardier’s new President and Chief Executive Officer, Alain Bellemare, and the senior management team.
Q. What are your expectations for the future?
A. 2015 will be a transitional year for us, withprofitability similar to 2014 levels.
The last stretch of any major development program always takes the most effort and that’s where we are right now. At the same time, we have robust product demand and backlog. We sell our products globally. We have the right people to be successful anywhere in the world. And now we have a structure that will allow us to improve our returns.
The companies that succeed over the long term are the ones able to adjust quickly. The appointment of Alain Bellemare is an example of our willingness to look at every opportunity for the benefit of the company. He’s an experienced executive with a deep knowledge of the manufacturing sector. We took advantage of his availability as we were convinced he had the right quali-ties to bring Bombardier to the next level.
In today’s world, it’s increasingly difficult to predict what’s going to happen three years down the road, never mind five or ten. That’s why we continuously monitor global events to stay attuned to the changing dynamics and mobility needs of countries and cities around the world. Now we’ll be able to move quickly to address these needs and participate in global growth as we help connect more and more people worldwide. That’s what Bombardier is all about: improving the way people move around the globe.
Our focus on executing better, improving margins and becoming a true high performance organization has never been sharper. That’s why we’re confident that the best is yet to come at Bombardier.
Pierre BeaudoinPresident and Chief Executive OfficerBombardier Inc.

4 BOMBARDIER INC. FINANCIAL REPORT - FISCAL YEAR ENDED DECEMBER 31, 2014
BOMBARDIER INC.MANAGEMENT’S DISCUSSION AND ANALYSIS
For the fiscal year ended December 31, 2014
PAGEOVERVIEW
AEROSPACE
TRANSPORTATION
OTHER
HISTORICAL FINANCIAL SUMMARY
All amounts in this report are expressed in U.S. dollars, and all amounts in the tables are in millions of U.S. dollars, unless otherwise indicated.
This MD&A is the responsibility of management and has been reviewed and approved by the Board of Directors of Bombardier Inc. (the “Corporation”, "Management" or "Bombardier"). This MD&A has been prepared in accordance with the requirements of the Canadian Securities Administrators. The Board of Directors is responsible for ensuring that the corporation fulfills its responsibilities for financial reporting and is ultimately responsible for reviewing and approving the MD&A. The Board of Directors carries out this responsibility principally through its Audit Committee. The Audit Committee is appointed by the Board of Directors and is comprised entirely of independent and financially literate directors. The Audit Committee reports its findings to the Board of Directors for its consideration when it approves the MD&A and financial statements for issuance to shareholders.
The data presented in this MD&A is structured by reportable segment: BA and BT, and then by market segment, which is reflective of the Corporation's organizational structure.
IFRS and non-GAAP measuresThis MD&A contains both IFRS and non-GAAP measures. Non-GAAP measures are defined and reconciled to the most comparable IFRS measure (see the Non-GAAP financial measures and Liquidity and capital resources sections in Overview and the Analysis of results sections in BA and BT).
Materiality for disclosuresManagement determines whether information is material based on whether they believe a reasonable investor’s decision to buy, sell or hold securities of the Corporation would likely be influenced or changed if the information were omitted or misstated.
Certain totals, subtotals and percentages may not agree due to rounding.
The Financial Report for fiscal year 2014 comprises the President’s message to shareholders, this MD&A and the consolidated financial statements.
6
39
66
81
103

BOMBARDIER INC. FINANCIAL REPORT - FISCAL YEAR ENDED DECEMBER 31, 2014 5
The following table shows the abbreviations used in the MD&A and the consolidated financial statements.
Term Description Term DescriptionAFS Available for sale FVTP&L Fair value through profit and lossAOCI Accumulated other comprehensive income GAAP Generally accepted accounting principlesBA Bombardier Aerospace GDP Gross domestic productBT Bombardier Transportation HFT Held for tradingCAGR Compound annual growth rate IAS International Accounting Standard(s)CCTD Cumulative currency translation difference IASB International Accounting Standards BoardCGU Cash generating unit IFRIC International Financial Reporting Interpretation
CommitteeCIS Commonwealth of Independent StatesDB Defined benefit IFRS International Financial Reporting Standard(s)DC Defined contribution L&R Loans and receivablesDDHR Derivative designated in a hedge relationship MD&A Management’s discussion and analysisDSU Deferred share unit NCI Non-controlling interestsEBIT Earnings before financing expense, financing
income and income taxesOCI Other comprehensive income
EBITDA Earnings before financing expense, financingincome, income taxes, amortization and impairmentcharges on PP&E and intangible assets
PP&E Property, plant and equipmentPSG Performance security guaranteePSU Performance share unit
EBT Earnings before income taxes R&D Research and developmentEIS Entry-into-service RVG Residual value guaranteeEPS Earnings per share attributable to equity holders of
Bombardier Inc.SG&A Selling, general and administrativeU.K. United Kingdom
FTV Flight test vehicle U.S. United States of America

6 BOMBARDIER INC. FINANCIAL REPORT - FISCAL YEAR ENDED DECEMBER 31, 2014
OVERVIEWPAGE
OVERVIEW OF ACTIVITIES Overview of operations
NEW ORGANIZATIONAL STRUCTURE Description of the new organizational structure effectiveJanuary 1, 2015
KEY PERFORMANCE MEASURES ANDMETRICS
Key performance measures and associated metrics that areused to monitor progress on a consolidated basis and keyfinancial data for the last five years
HIGHLIGHTS OF THE YEAR Highlights of the fiscal year with regard to results and keyevents
GUIDANCE AND FORWARD-LOOKINGSTATEMENTS
Guidance and disclaimers in connection with forward-lookingstatements
FINANCIAL PRIORITIES Key financial goals and leading initiatives to achieve thesegoals
RISK MANAGEMENT Key financing and market risks and related mitigationstrategies
CONSOLIDATED RESULTS OF OPERATIONS Consolidated results for the fourth quarter and fiscal yearended December 31, 2014
LIQUIDITY AND CAPITAL RESOURCES Cash flows, available short-term capital resources andexpected future liquidity requirements
OTHER CREDIT FACILITIES Committed and outstanding amounts
RETIREMENT BENEFITS Overview of retirement benefit plans, associated risks andrelated mitigation strategies as well as key financial data
CAPITAL STRUCTURE Global metrics used to monitor capital structureNON-GAAP FINANCIAL MEASURES Definitions of non-GAAP financial measures and
reconciliations to the most comparable IFRS financialmeasures
CONSOLIDATED FINANCIAL POSITION Explanations of significant variances in assets, liabilities andequity
7
8
9
10
13
14
18
23
26
2829
3435
38

BOMBARDIER INC. FINANCIAL REPORT - FISCAL YEAR ENDED DECEMBER 31, 2014 - OVERVIEW 7
OVERVIEW OF ACTIVITIESBombardier is the world’s leading manufacturer of both planes and trains, operating under two broad reportable segments during fiscal year 2014: aerospace through BA and rail transportation through BT. See the next page for a description of the new organizational structure effective January 1, 2015. Bombardier is driving the evolution of mobility worldwide by providing more efficient, sustainable and enjoyable transportation. The Corporation's products, services, and most of all its employees are what make it a global leader in mobility solutions.
BOMBARDIER AEROSPACE BOMBARDIER TRANSPORTATIONBA is a world leader in the design, manufacture and supportof innovative aviation products for the business, commercial,
specialized and amphibious aircraft markets.
BT is a world leader in the design, manufacture and supportof rail equipment and systems.
Revenues $10.5 billion Revenues $9.6 billionEBIT $(995) million EBIT $429 millionEBIT before special items(1) $437 million EBIT before special items(1) $486 millionFree cash flow usage(1) $(1.1) billion Free cash flow(1) $122 millionOrder backlog $36.6 billion Order backlog $32.5 billionNumber of employees(2) 34,100 Number of employees(2) 39,700
Every day around the globe, the Corporation's 74,000 dedicated employees work diligently to earn worldwide leadership in aerospace and rail transportation. As at the date of this report, the Corporation has 80 production and engineering sites in 28 countries and a worldwide network of service centres.
(1) Non-GAAP financial measures. Refer to the Non-GAAP financial measures section for definitions of these metrics and the Analysis of results sections in BA and BT for reconciliations to the most comparable IFRS measures.
(2) As at December 31, 2014, including contractual and inactive employees.

8 BOMBARDIER INC. FINANCIAL REPORT - FISCAL YEAR ENDED DECEMBER 31, 2014
NEW ORGANIZATIONAL STRUCTURE
Following the reorganization announced in July 2014, Bombardier has adopted a new organizational structure. The former BA has been divided into three segments: Bombardier Business Aircraft, Bombardier Commercial Aircraft and Bombardier Aerostructures and Engineering Services. Along with BT, these segments now report directly to the President and CEO in order to enhance agility. Corporate office expenses, previously allocated to BA and BT, will now be presented separately, along with intersegment eliminations. This new structure is effective January 1, 2015 and does not impact the presentation of 2014 results.
Bombardier Business AircraftBombardier Business Aircraft designs, manufactures and provides aftermarket support for three families of business jets (Learjet, Challenger and Global), spanning from the light to large categories.
Bombardier Commercial AircraftBombardier Commercial Aircraft designs and manufactures a broad portfolio of commercial aircraft in the 60- to 149-seat categories, including the Q400 NextGen turboprops, the CRJ700, 900 and 1000 NextGen regional jets as well as the clean-sheet CSeries mainline jet. Commercial Aircraft provides aftermarket support for these aircraft as well as for the 20- to 59-seat range category.
Bombardier Aerostructures and Engineering ServicesBombardier Aerostructures and Engineering Services designs and manufactures major aircraft structural components (such as engine nacelles, fuselages and wings) and provides aftermarket component repair and overhaul as well as other engineering services for both internal and external clients.
Bombardier TransportationBombardier Transportation, a global leader in rail technology, offers the broadest portfolio in the rail industry and delivers innovative products and services that set new standards in sustainable mobility.
Supplemental information regarding Bombardier's products and strategy can be found in Bombardier's Profile, Strategy and Market presentation available on the dedicated investor relations website at ir.bombardier.com.

BOMBARDIER INC. FINANCIAL REPORT - FISCAL YEAR ENDED DECEMBER 31, 2014 - OVERVIEW 9
KEY PERFORMANCE MEASURES AND METRICSBA and BT use multiple key performance measures to evaluate various key metrics. Refer to the respective Key performance measures and metrics sections in BA and BT for descriptions of these measures.
In addition, the table below summarizes other relevant key performance measures and associated metrics evaluated on a consolidated basis.
KEY PERFORMANCE MEASURES AND ASSOCIATED METRICSProfitability • Diluted EPS and adjusted EPS(1), as measures of global performance.Liquidity • Available short-term capital resources(2), as a measure of liquidity adequacy.Capitalstructure
• Adjusted EBIT(1) to adjusted interest(1) ratio, as a measure of interest coverage. • Adjusted debt(1) to adjusted EBITDA(1) ratio, as a measure of financial leverage.• Weighted-average long-term debt maturity, as a measure of debt term structure.
Five-year summaryFor the fiscal years ended and as at December 31 December 31 December 31 December 31 January 31
2014 2013 2012 2011 (4) 2011Revenues $ 20,111 $ 18,151 $ 16,414 $ 17,904 $ 17,497Order backlog (in billions of dollars) $ 69.1 $ 69.7 $ 64.9 $ 53.9 $ 51.9EBIT $ (566) $ 923 $ 666 $ 1,166 $ 1,198EBIT margin (2.8)% 5.1% 4.1% 6.5% 6.8%EBIT before special items(1) $ 923 $ 893 $ 806 $ 1,166 $ 1,198EBIT margin before special items(1) 4.6 % 4.9% 4.9% 6.5% 6.8%Effective income tax rate (68.4)% 25.8% 12.3% 13.9% 24.5%Net income (loss) $ (1,246) $ 572 $ 470 $ 737 $ 671Adjusted net income(1) $ 648 $ 608 $ 671 $ 887 $ 772Diluted EPS (in dollars) $ (0.74) $ 0.31 $ 0.25 $ 0.41 $ 0.36Adjusted EPS (in dollars)(1) $ 0.35 $ 0.33 $ 0.36 $ 0.49 $ 0.42Free cash flow (usage)(1) $ (1,117) $ (907) $ (636) $ (1,046) $ 426Available short-term capital resources(2) $ 3,846 $ 4,837 $ 3,967 $ 3,642 $ 4,059Interest coverage ratio(3) 3.1 2.8 3.2 4.5 5.0Financial leverage ratio(3) 4.7 5.4 4.2 3.3 3.1Weighted-average long-term debt maturity (in years) 6.4 6.4 7.4 8.0 8.9
(1) Non-GAAP financial measures. Refer to the Non-GAAP financial measures and Liquidity and capital resources sections for definitions of these metrics and reconciliations to the most comparable IFRS measures.
(2) Defined as cash and cash equivalents plus the amount available under the revolving credit facilities.(3) Refer to the Capital structure and Non-GAAP financial measures sections for computations of these ratios.(4) The fiscal year ended December 31, 2011 comprises 11 months of BA's results and 12 months of BT's results.

10 BOMBARDIER INC. FINANCIAL REPORT - FISCAL YEAR ENDED DECEMBER 31, 2014
HIGHLIGHTS OF THE YEAR
REVENUES ADJUSTED NET INCOME(1) ADJUSTED EPS(1) FREE CASH FLOW(1) ORDER BACKLOG
$20.1 billion $648 million $0.35 $(1.1) billion $69.1 billion
RESULTSFor the fiscal years ended and as at December 31 2014 2013 VarianceRevenues $ 20,111 $ 18,151 10.8 %Order backlog (in billions of dollars) $ 69.1 $ 69.7 (0.9)%EBIT $ (566) $ 923 nmfEBIT margin (2.8)% 5.1% nmfEBIT before special items(1) $ 923 $ 893 3.4 %EBIT margin before special items(1) 4.6 % 4.9% -30 bpsEffective income tax rate (68.4)% 25.8% nmfNet income (loss) $ (1,246) $ 572 nmfDiluted EPS (in dollars) $ (0.74) $ 0.31 nmfAdjusted net income(1) $ 648 $ 608 6.6 %Adjusted EPS (in dollars) $ 0.35 $ 0.33 6.1 %Net additions to PP&E and intangible assets $ 1,964 $ 2,287 (14.1)%Net additions to aerospace program tooling $ 1,655 $ 1,983 (16.5)%Free cash flow usage(1) $ (1,117) $ (907) (23.2)%Available short-term capital resources(2) $ 3,846 $ 4,837 (20.5)%
nmf: information not meaningfulbps: basis points(1) Non-GAAP financial measures. Refer to the Non-GAAP financial measures and Liquidity and capital resources sections for definitions of
these metrics and reconciliations to the most comparable IFRS measures.(2) Defined as cash and cash equivalents plus the amount available under the revolving credit facilities.
REVENUES(2)
(for the fiscal years ended; in billions of dollars)
ADJUSTED NET INCOME AND ADJUSTED EPS(1)(2)(3)(4)
(for the fiscal years ended; in millions of dollars, except per share amounts)
FREE CASH FLOW(1)(2)
(for the fiscal years ended; in millions of dollars)
ORDER BACKLOG(5)
(as at; in billions of dollars)
(1) Non-GAAP financial measures. Refer to the Non-GAAP financial measures and Liquidity and capital resources sections for definitions of these metrics and reconciliations to the most comparable IFRS measures.
(2) The fiscal year ended December 31, 2011 comprised 11 months of BA's results and 12 months of BT's results. (3) Net income (loss) is $671 million, $737 million, $470 million, $572 million, and $(1,246) million for the years ending January 31, 2011,
December 31, 2011, December 31, 2012, December 31, 2013 and December 31, 2014, respectively.(4) Diluted EPS of $0.36, $0.41, $0.25, $0.31, $(0.74) for the fiscal years ending January 31,2011, December 31, 2011, December 31, 2012,
December 31, 2013 and December 31, 2014, respectively.(5) Some totals do not agree due to rounding.

BOMBARDIER INC. FINANCIAL REPORT - FISCAL YEAR ENDED DECEMBER 31, 2014 - OVERVIEW 11
KEY EVENTS• On July 23, 2014, a new organizational structure was announced comprised of four business segments:
Bombardier Business Aircraft, Bombardier Commercial Aircraft, Bombardier Aerostructures and Engineering Services and Bombardier Transportation. These segments now report directly to the President and CEO in order to enhance agility. This new structure is effective as of January 1, 2015. Furthermore, in February 2015, the Corporation announced that Mr. Laurent Beaudoin is retiring as Chairman of the Board of Directors after more than 50 years at the helm of the Corporation. He will remain on the Board with the honorary title of Chairman Emeritus. Mr. Pierre Beaudoin is appointed Executive Chairman, while Mr. Alain Bellemare becomes President and Chief Executive Officer and member of the Board of Directors. These appointments will all be effective February 13, 2015.
• Subsequent to the end of the fiscal year, on January 15, 2015, Bombardier announced the pause of its Learjet 85 business aircraft program. The pause follows a downward revision of Bombardier’s business aircraft market forecast, primarily due the continued weakness of the light aircraft category since the economic downturn. As a result, the Corporation has recorded a pre-tax charge in special items in the fourth quarter of 2014 of $1.4 billion ($1.6 billion after tax), mainly related to the impairment of Learjet 85 development costs.
• The following workforce reductions were undertaken:• During the fiscal year 2014, workforce reductions were undertaken at BA for a total of approximately
3,700 employees. Related charges totaling $85 million were recorded as special items in 2014. • In July 2014, as part of its reorganization activities, BT announced the reduction of direct and indirect
positions by approximately 900 employees worldwide. A related charge of $57 million was recorded as a special item in 2014.
• Subsequent to the end of the fiscal year, in January 2015, as a result of the decision to pause the Learjet 85 business aircraft program, BA announced a workforce reduction of approximately 1,000 employees at the sites in Querétaro, Mexico, and Wichita, United States. A severance provision of approximately $20 million will be recorded as a special item during the first quarter of 2015.
• The first four CS100 FTVs continue with flight testing activities. On-the-ground testing activities on FTV5 are ongoing and FTV5 is expected to be handed over to the flight test team by the end of the first quarter of 2015. The first CS300 FTV has been handed over to the flight test team and is being readied for its first flight which is expected to take place by the end of the first quarter of 2015. As at the date of this report, the number of firm orders and other agreements(1) for the CSeries family of aircraft reached 563 with 21 customers in 18 countries, including 243 firm orders.
• Subsequent to the end of the fiscal year, on January 30, 2015, the ZEFIRO 380 very high speed train received homologation in China. Bombardier-Sifang Transportation, a Chinese entity in which Bombardier holds a 50 percent interest, is expected to start delivery during the first quarter of 2015.
• On June 27, 2014, the Challenger 350 aircraft entered into service.• In October 2014, BA launched the new Challenger 650 program, the evolution of the Challenger 605 aircraft.
EIS is scheduled for the second half of 2015.(1) The other agreements consist of conditional orders, letters of intent, options and purchase rights.

12 BOMBARDIER INC. FINANCIAL REPORT - FISCAL YEAR ENDED DECEMBER 31, 2014
Financing planSubsequent to the end of the fiscal year, in February 2015, Bombardier announced a plan to position the Corporation with a flexible and strong financial profile whereby the Corporation intends to access the capital markets, depending on market conditions, for the issuance of equity for approximately $600 million and new long-term debt capital for up to $1.5 billion.
In order to realize the capital raising plan, the Corporation has filed on February 12, 2015 a preliminary short form base shelf prospectus with the Canadian securities regulatory authorities, which will allow it to offer from time to time over a 25-month period up to approximately $2 billion ($2.5 billion Canadian) of debt, equity or other securities, including convertible securities. The Corporation may also offer the securities on a private placement basis in the U.S. and in other jurisdictions.
In keeping with the Corporation's objectives, the Board of Directors has concluded that the Corporation's free cash flow(1) would be more appropriately applied to bolstering the Corporation's financial structure and investing in its core programs and businesses. Therefore, the Corporation is suspending the declaration of dividends on the Class A and Class B shares. To complement this financing plan, the Corporation will explore other initiatives such as certain business activities' potential participation in industry consolidation in order to reduce debt.
The Corporation is not currently authorized to issue a sufficient number of its Class B shares to realize the capital raising plan, and provide ongoing flexibility to raise additional funds in the future. Accordingly, a special meeting of holders of Class A and Class B shares, for the purpose of approving an amendment of the articles of the Corporation to increase the number of Class A and Class B shares the Corporation is authorized to issue from 1,892,000,000 to 2,742,000,000, has been convened and will take place on or about March 27, 2015. Shareholders of record on February 24, 2015, will be entitled to vote at the special meeting of shareholders. Adoption of the special resolution approving the proposed amendment to the Corporation's articles requires the approval of the 66 2/3% of the holders of Class A and Class B shares, present or represented by proxy at the special meeting, voting together. Certain members of the Bombardier family currently exercising control or direction over 266,863,185 Class A shares and 2,700,858 Class B shares, representing 58.24% of the total votes attached to the Class A and Class B shares have agreed to vote in favour of the resolution approving the amendment of the articles of the Corporation. In the event the special resolution is duly adopted by shareholders, the amendment to the articles of the Corporation is expected to become effective on or about March 30, 2015.(1) Non-GAAP financial measures. Refer to the Non-GAAP financial measures, Liquidity and capital resources, and BA and BT analysis of
results sections for definitions of these metrics and reconciliations to the most comparable IFRS measures.

BOMBARDIER INC. FINANCIAL REPORT - FISCAL YEAR ENDED DECEMBER 31, 2014 - OVERVIEW 13
GUIDANCE AND FORWARD-LOOKING STATEMENTS
Summary of guidance for 2015 (1)
2015 guidance is provided under the new reporting segments as described in the New Organizational Structure section.
Profitability Liquidity Deliveries/ Growth and order intake
Business Aircraft
EBIT margin of approximately 7% an improvement of approximately 1% compared to 2014.
Cash flow from operating activities between $1.0 billion and $1.4 billion.Net additions to PP&E and intangible assets of approximately $1.0 billion.
Approximately 210aircraft deliveries.
CommercialAircraft
Negative EBIT of approximately $200 million including the dilutive impact of the initial years of production of the CSeries program.(2)
Neutral cash flows from operating activities.Net additions to PP&E and intangible assets of approximately $900 million.
Approximately 80 aircraft deliveries.
Aerostructuresand EngineeringServices
EBIT margin of approximately 4%.
Neutral cash flows from operating activities.Net additions to PP&E and intangible assets of approximately $100 million.
Revenues of approximately $1.8 billion, mainly from internal contracts with Business and Commercial aircraft segments.
Transportation Slight improvement in EBIT margin compared to 2014.
Improvement in free cash flow(3) compared to 2014 although it is expected to remain below EBIT.
Excluding currency impacts, revenues in 2015 are expected to be higher than in 2014, with percentage growth in the low-single digits.Book-to-bill ratio in excess of 1.0.(4)
(1) The guidance provided in the 2013 financial report with respect to BA's level of net additions to PP&E and intangible assets for 2016 has been withdrawn due to uncertainty with respect to longer term projections. See the Guidance and forward looking statements sections in Overview, BA and BT for details regarding forward-looking statements and the assumptions on which they are based.
(2) Includes the dilutive impact of the CSeries program including the write-down of inventory to net realizable value. Early production units in a new program incur higher costs and generally have lower selling prices than units produced later in the program's life cycle.
(3) See the Non-GAAP financial measures section for a definition of this metric.(4) Defined as new orders over revenues.
This MD&A includes forward-looking statements, which may involve, but are not limited to: statements with respect to the Corporation's objectives, guidance, targets, goals, priorities, market and strategies, financial position, beliefs, prospects, plans, expectations, anticipations, estimates and intentions; general economic and business outlook, prospects and trends of an industry; expected growth in demand for products and services; product development, including projected design, characteristics, capacity or performance; expected or scheduled entry-into-service of products and services, orders, deliveries, testing, lead times, certifications and project execution in general; competitive position; and the expected impact of the legislative and regulatory environment and legal proceedings on the Corporation's business and operations; the Corporation's available liquidities and the Corporation's capital raising plan. Forward-looking statements generally can be identified by the use of forward-looking terminology such as “may”, “will”, “expect”, “intend”, “anticipate”, “plan”, “foresee”, “believe”, “continue”, “maintain” or “align”, the negative of these terms, variations of them or similar terminology. By their nature, forward-looking statements require management to make assumptions and are subject to important known and unknown risks and uncertainties, which may cause actual results in future periods to differ materially from those forecasted. While management considers these assumptions to be reasonable and appropriate based on information currently available, there is risk that they may not be accurate. For additional information with respect to the assumptions underlying the forward-looking statements made in this MD&A, refer to the respective Guidance and forward-looking statements sections in BA and in BT.
Certain factors that could cause actual results to differ materially from those anticipated in the forward-looking statements include, but are not limited to, risks associated with general economic conditions, risks associated with the Corporation's business environment (such as risks associated with the financial condition of the airline industry and major rail operators), operational risks (such as risks related to developing new products and services; doing business with partners; product performance warranty and casualty claim losses; regulatory and legal proceedings; the environment; dependence on certain customers and suppliers; human resources; fixed-price commitments and production and project execution), financing risks (such as risks related to liquidity and access to capital markets, exposure to credit risk, certain restrictive debt covenants, financing support provided for the benefit of certain customers and reliance on government support) and market risks (such as risks related to foreign currency fluctuations, changing interest rates, decreases in residual values and increases in commodity prices). For more details, see the Risks and uncertainties section in Other. Readers are cautioned that the foregoing list of factors that may affect future growth, results and performance is not exhaustive and undue reliance should not be placed on forward-looking statements. The forward-looking statements set forth herein reflect management's expectations as at the date of this report and are subject to change after such date. Unless otherwise required by applicable securities laws, the Corporation expressly disclaims any intention, and assumes no obligation to update or revise any forward-looking statements, whether as a result of new information, future events or otherwise. The forward-looking statements contained in this MD&A are expressly qualified by this cautionary statement.

14 BOMBARDIER INC. FINANCIAL REPORT - FISCAL YEAR ENDED DECEMBER 31, 2014
FINANCIAL PRIORITIES
Strong financial disciplineis required to deliver on growth strategies
The Corporation operates in a competitive and capital-intensive environment. In recent years, extensive investments in industry-leading, cost-optimized products and solutions have been made in order to improve marketplace positioning and enhance the Corporation's ability to face competition in the aerospace and rail transportation industries.
These investments continued in 2014 as the Corporation continued to drive The Evolution of Mobility with new products, orders, deliveries and geographic markets. It was a year of change coupled with a sharper focus on customers and profitable execution. This led to a reorganization of both BA and BT into a leaner, more nimble structure. The new organization will enable management to more readily identify and remove obstacles to operational efficiency and better positions the Corporation to respond quickly to evolving consumer needs, changing market dynamics and world events. It will also provide more transparency across the business segments and enable greater investor visibility into profitability by market.
New products launched around six years ago are making headway, and some are approaching the end of their product development cycle. The CSeries commercial aircraft is meeting performance targets(1) and is making good progress towards certification in the second half of 2015, with EIS expected to occur shortly thereafter. On January 30, 2015, the Corporation received homologation for the ZEFIRO 380 very high speed train, following the successful completion of 600,000 kilometres of testing in China. In addition, the first Global 7000/8000 flight test vehicle is in final assembly. Both BA and BT have strong levels of order backlog, representing a leading indicator of future revenues and a vote of confidence in the Corporation's product strategy. The consolidated backlog reached $69.1 billion as at December 31, 2014, including a manufacturing backlog of $56.6 billion which represents more than three years of manufacturing revenues, based on revenues for fiscal year 2014.
The combination of this strong backlog and the arrival to market of these new products results in a promising future. The new structure that has been put in place puts the focus on better execution and will better enable the Corporation to take advantage of this growth opportunity.(1) Key performance targets under certain operating conditions when compared to aircraft currently in production for flights of 500 nautical
miles. See the CSeries family of aircraft program disclaimer at the end of this MD&A.
Increasing profitability is closely linked to improved execution and the successful EIS of new products
Increasing the level and consistency of profitability remains a key financial priority. The Corporation's significant investments in mobility solutions in recent years and the approaching EIS of industry-leading products are intended to generate multiple years of sustained growth. In the short term, reaching financial targets will require all business segments to improve their processes and execution.

BOMBARDIER INC. FINANCIAL REPORT - FISCAL YEAR ENDED DECEMBER 31, 2014 - OVERVIEW 15
BA achieved an EBIT margin before special items(1) of 4.2% in fiscal year 2014, compared to 4.1% last fiscal year. The variation compared to 2014 guidance of approximately 5% is mainly due to pricing pressure on new aircraft sold, increased provisions for credit and residual value guarantees as well as a decrease in the fair value of used aircraft.
In fiscal year 2015, Business Aircraft and Aerostructures and Engineering Services expect to achieve EBIT margins of approximately 7% and 4%, respectively while Commercial aircraft expects negative EBIT of approximately $200 million including the dilutive impact of the initial years of production of the CSeries program.(2)(3)
BT achieved an EBIT margin before special items of 5.1% in fiscal year 2014, compared to 5.8% last fiscal year. The variation compared to 2014 guidance of approximately 6% is mainly due to revised escalation assumptions for some contracts, mostly in rolling stock, which impacted estimated future revenues and resulted in a catch-up adjustment to reflect lower contract margins on revenues already recognized. BT expects a slight improvement in EBIT margin in 2015 compared to 2014, as BT continues to focus on contract execution and cost reduction while increasing investment in a harmonized I.T. landscape and in R&D to develop standardized vehicle and sub-systems platforms.(2)
At BT, the new OneBT organizational structure focuses on standardizing products and processes, as a part of continued efforts to resolve execution issues faced in recent years in certain large rolling stock contracts and to better position itself in the future. The new structure further empowers project management, reduces organizational layers and overhead cost, and implements leaner processes to speed up decision making. In addition, the increased share of services contracts in the backlog de-risks the portfolio, and, along with continued cost reduction initiatives, will help increase margins.
The new organizational structures at BA and BT are first and foremost about focusing on execution. These combined initiatives in BA and BT will support long-term competitiveness and improved profitability.(1) Non-GAAP financial measures. Refer to the Non-GAAP financial measures, Liquidity and capital resources, and BA and BT analysis of
results sections for definitions of these metrics and reconciliations to the most comparable IFRS measures.(2) See the Guidance and forward looking statements sections in Overview, BA and BT for details regarding forward-looking statements and the
assumptions on which they are based.(3) Includes the dilutive impact of the CSeries program including the write-down of inventory to net realizable value. Early production units in a
new program incur higher costs and generally have lower selling prices than units produced later in the program's life cycle.
Strong financial discipline will support planned investments in product development
Management continuously monitors liquidity levels, including available short-term capital resources and cash flows from operations, to meet expected requirements, including the support of product development initiatives and to ensure financial flexibility. In evaluating liquidity requirements, historic volatility and seasonal needs, the maturity profile of long-term debt, the funding of product development programs, the level of customer advances, working capital requirements, the economic environment and access to capital markets are all taken into account. Management uses scenario analyses to stress-test cash flow projections.
In April 2014, the Corporation took advantage of strong demand and good pricing conditions in the debt capital market in the U.S. to increase financial flexibility by issuing an aggregate of $1.8 billion in new unsecured Senior Notes due in April 2019 and October 2022 which, after refinancing $1.3 billion in existing debt, yielded additional liquidity of $0.5 billion.
The availability periods of the BT €500 million ($607 million) and the $750 million unsecured revolving credit facilities were both extended by one year in 2014, as were those of the BT and BA letter of credit facilities and the PSG facility. See the Liquidity and capital resources and Other credit facilities sections for further details of these facilities.

16 BOMBARDIER INC. FINANCIAL REPORT - FISCAL YEAR ENDED DECEMBER 31, 2014
On an on-going basis, the Corporation manages liabilities by taking into consideration expected free cash flows, debt repayments and other material cash outlays expected to occur in the future. There is no significant debt maturing before the year 2016.
As at December 31, 2014, $3.8 billion of short-term capital resources were available. Refer to the Liquidity and capital resources section for further details on these resources. The Corporation maintains various other facilities such as factoring facilities and sale and leaseback facilities, which also contribute to securing additional sources of liquidity.
BA’s cash flows from operations in 2014 were $798 million, compared to a guidance of between $1.2 billion and $1.6 billion, while net additions to PP&E and intangible assets were $1.9 billion in 2014, compared to a guidance of between $1.6 billion and $1.9 billion. The cash flows from operating activities were lower than expected due to a lower level of customer advances, lower EBIT and an increase in used aircraft inventory.
BT achieved free cash flow(1) of $122 million for the fiscal year ended December 31, 2014. Guidance indicated free cash flow would be generally in line with EBIT; however, it was lower mainly due to a different cash flow profile in some contracts and a lower level of advances on options in relation to framework contract agreements.
Business Aircraft expects cash flow from operating activities between $1.0 and $1.4 billion in 2015, with net additions to PP&E and intangible assets of approximately $1.0 billion. Commercial Aircraft expects neutral cash flows from operating activities in 2015, with net additions to PP&E and intangible assets of approximately $900 million. Aerostructures and Engineering Services expects neutral cash flows from operating activities and net additions to PP&E and intangibles of approximately $100 million in 2015.(2)
The overall level of capital expenditures at BA is expected to gradually return to more normal levels in the coming years following the peak of the investment cycle as significant programs approach the end of their product development cycles.
BT expects an improvement in free cash flow(1) compared to 2014 although it is expected to remain below EBIT as BT continues to ramp-up production related to several contracts and as a lower level of advances on large contracts is anticipated.(2)
Investment in product development is expected to be funded through cash flows from operating activities and available short-term capital resources of $3.8 billion. The Corporation may receive funding from governments and contributions from key suppliers for certain aircraft programs, which increases financing flexibility as these parties act as risk-sharing partners. (1) Non-GAAP financial measures. Refer to the Non-GAAP financial measures, Liquidity and capital resources, and BA and BT analysis of
results sections for definitions of these metrics and reconciliations to the most comparable IFRS measures.(2) See the Guidance and forward looking statements sections in Overview, BA and BT for details regarding forward-looking statements and the
assumptions on which they are based.
The Corporation remains committed to the global metric targets despite the impact of significant investments in industry-leading products on capital structure
The Corporation requires capital (predominantly for BA) to develop industry-leading products and to seize strategic opportunities to increase competiveness and execute growth strategies. The Corporation takes advantage of favourable capital market conditions when they materialize to extend debt maturity, reduce cost of funds and increase diversity of capital resources.
Subsequent to the end of the fiscal year, in February 2015, the Corporation announced a plan to position the Corporation with a flexible and strong financial profile. Pursuant to this plan, the Corporation intends to access the capital markets, depending on market conditions, for the issuance of equity for approximately $600 million and new long-term debt capital for up to $1.5 billion.

BOMBARDIER INC. FINANCIAL REPORT - FISCAL YEAR ENDED DECEMBER 31, 2014 - OVERVIEW 17
In order to realize the capital raising plan, the Corporation has filed on February 12, 2015 a preliminary short form base shelf prospectus with the Canadian securities regulatory authorities, which will allow it to offer from time to time over a 25-month period up to approximately $2 billion ($2.5 billion Canadian) of debt, equity or other securities, including convertible securities. The Corporation may also offer the securities on a private placement basis in the U.S. and in other jurisdictions.
The Board of Directors has concluded that the Corporation's free cash flow(1) would be more appropriately applied to bolstering the Corporation's financial structure and investing in its core programs and businesses. Therefore, the Corporation is suspending the declaration of dividends on the Corporation's Class A and Class B shares.
To complement this financing plan, the Corporation will explore other initiatives such as a certain business activities' potential participation in industry consolidation in order to reduce debt.
Management assesses and manages creditworthiness using the global metrics as described in the Capital structure section. Management continuously monitors the Corporation's capital structure to ensure sufficient liquidity to fund product development programs. The Corporation's long-term objective is to improve leverage metrics by de-leveraging the balance sheet with strategic long-term debt repayments, in line with active management of consolidated liquidity, weighted-average cost of capital and term structure.
WEIGHTED-AVERAGE LONG-TERM DEBT MATURITY (as at; in years)
DEBT MATURITY PROFILE (NOTIONAL AMOUNT) (for calendar years; in millions of dollars)
* Debt maturing in 2022 includes the $500 million and $1.2 billionSenior Notes due in March and October 2022, respectively.
Managing the net retirement benefit liability and the security of benefits is also a key part of the overall management of capital structure. Over the years, several initiatives were put in place to mitigate risks that stem from both pension liabilities and assets. Refer to the Retirement benefits section for details on the risk management initiatives related to the Corporation's retirement plans.(1) Non-GAAP financial measures. Refer to the Non-GAAP financial measures, Liquidity and capital resources, and BA and BT analysis of
results sections for definitions of these metrics and reconciliations to the most comparable IFRS measures.
18 BOMBARDIER INC. FINANCIAL REPORT - FISCAL YEAR ENDED DECEMBER 31, 2014
As at December 31, 2014, the Corporation's credit ratings were three notches below investment grade. In January 2015, Standard & Poors Rating Services changed their rating from BB- to B+.
Credit RatingsInvestment-grade rating Bombardier Inc.’s rating
February 11, 2015 December 31, 2013Fitch Ratings Ltd. BBB- BB- BBMoody’s Investors Service, Inc. Baa3 Ba3 Ba2Standard & Poor’s Rating Services BBB- B+ BB
Over the long term, management believes that the Corporation will be in a good position to improve credit ratings while progressing towards profitability targets and returning to a more normalized level of investment in product development.
RISK MANAGEMENT
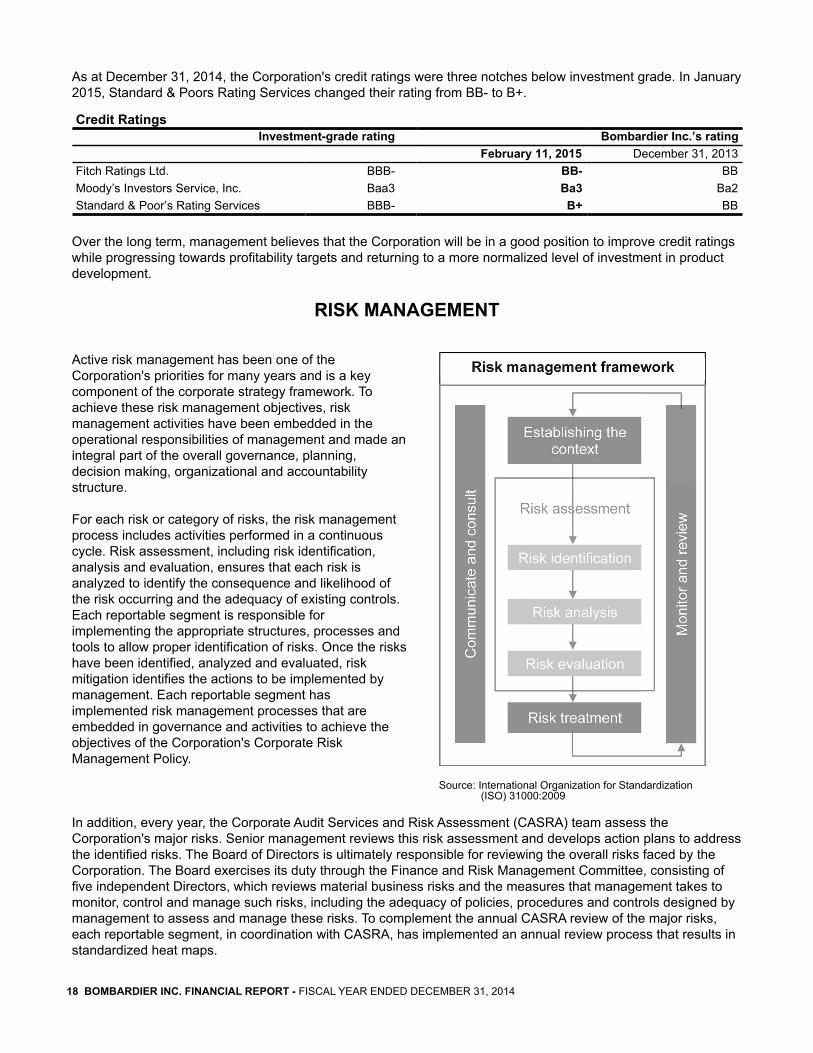
Active risk management has been one of the Corporation's priorities for many years and is a key component of the corporate strategy framework. To achieve these risk management objectives, risk management activities have been embedded in the operational responsibilities of management and made an integral part of the overall governance, planning, decision making, organizational and accountability structure.
For each risk or category of risks, the risk management process includes activities performed in a continuous cycle. Risk assessment, including risk identification, analysis and evaluation, ensures that each risk is analyzed to identify the consequence and likelihood of the risk occurring and the adequacy of existing controls. Each reportable segment is responsible for implementing the appropriate structures, processes and tools to allow proper identification of risks. Once the risks have been identified, analyzed and evaluated, risk mitigation identifies the actions to be implemented by management. Each reportable segment has implemented risk management processes that are embedded in governance and activities to achieve the objectives of the Corporation's Corporate Risk Management Policy.
Source: International Organization for Standardization(ISO) 31000:2009
In addition, every year, the Corporate Audit Services and Risk Assessment (CASRA) team assess the Corporation's major risks. Senior management reviews this risk assessment and develops action plans to address the identified risks. The Board of Directors is ultimately responsible for reviewing the overall risks faced by the Corporation. The Board exercises its duty through the Finance and Risk Management Committee, consisting of five independent Directors, which reviews material business risks and the measures that management takes to monitor, control and manage such risks, including the adequacy of policies, procedures and controls designed by management to assess and manage these risks. To complement the annual CASRA review of the major risks, each reportable segment, in coordination with CASRA, has implemented an annual review process that results in standardized heat maps.

BOMBARDIER INC. FINANCIAL REPORT - FISCAL YEAR ENDED DECEMBER 31, 2014 - OVERVIEW 19
Management has also designed disclosure controls and procedures to provide reasonable assurance that material information relating to the Corporation is properly communicated and that information required to be disclosed in public filings is recorded, processed, summarized and reported within the time periods specified in securities legislation. Refer to the Controls and procedures section in Other for more details.
Key exposures to financing and market risks and related mitigation strategies
The Corporation is exposed to various financing and market risks. The following is a description of key exposures to those risks together with the strategies in place to mitigate them. Market risks associated with pension plans are discussed in the Retirement benefits section.
Exposure to foreign exchange risk
The Corporation's main exposures to foreign currencies are managed in accordance with the Foreign Exchange Risk Management Policy in order to mitigate the impact of foreign exchange rate movements. This policy requires each reportable segment’s management to identify all actual and potential foreign currency exposures arising from their operations. This information is communicated to the Corporate Office central treasury function, which has the responsibility to execute hedging transactions in accordance with policy requirements. In addition, the central treasury function manages balance sheet exposures to foreign currency movements by matching asset and liability positions. This program consists mainly in matching long-term debt in a foreign currency with assets denominated in the same currency.
Foreign exchange management
Owner Hedged exposures Hedging policy(1) Risk-mitigation strategiesBA Forecast cash outflows denominated
in a currency other than thefunctional currency of the entityincurring the cash flows, mainly inCanadian dollars and poundssterling.
Hedge 85% of the identifiedexposures for the first threemonths, 75% for the next 15months and up to 50% for thefollowing six months.
Use of forward foreign exchangecontracts, mainly to sell U.S. dollars andbuy Canadian dollars and poundssterling.
BT Forecast cash inflows and outflowsdenominated in a currency otherthan the functional currency of theentity incurring the cash flows.
Hedge 100% of the identifiedexposures at the time of orderintake.
Use of forward foreign exchangecontracts, mainly to sell or purchaseCanadian dollars, euros, U.S. dollars,Swiss francs, Swedish kronor and otherWestern European currencies.
CorporateOffice
Forecast cash outflows other than interest, denominated in a currency other than the functional currency of the entity incurring the cash flows, mainly in Canadian dollars.
Hedge 85% of the identifiedexposures for the first 18months and up to 75% for thefollowing six months.
Use of forward foreign exchangecontracts mainly to sell U.S. dollars andbuy Canadian dollars.
Interest cash outflows in currenciesother than the U.S. dollar, i.e. theeuro and the Canadian dollar.
Hedge 100% of the identifiedexposure unless theexposure is recognized as aneconomic hedge of anexposure arising from thetranslation of financialstatements in foreigncurrencies to the U.S. dollar.
Use of forward foreign exchange contracts mainly to sell U.S. dollars and buy euros and Canadian dollars.
Balance sheet exposures, includinglong-term debt and net investmentsin foreign operations with non-U.S.dollar functional currencies.
Hedge 100% of the identifiedexposures affecting theCorporation's net income.
Asset/liability management techniques. Designation of long-term debt as hedges of the Corporation's net investments in foreign operations with non-U.S. dollar functional currencies.
(1) Deviations from the policy are allowed, subject to pre-authorization and maximum pre-determined risk limits.

20 BOMBARDIER INC. FINANCIAL REPORT - FISCAL YEAR ENDED DECEMBER 31, 2014
BAThe hedged portion of BA’s significant foreign currency denominated costs for the 12-month periods ending December 31, 2015 and 2016 was as follows as at December 31, 2014:
Canadian dollars Pounds sterlingFor the 12 month periods ending December 31 2015 2016 2015 2016Expected costs denominated in foreign currency $3,158 $3,107 £376 £390Hedged portion of expected costs denominated in foreign currency 80% 60% 80% 57%Weighted-average hedge rates – foreign currency/USD 0.94 0.89 1.60 1.61
Sensitivity analysisA U.S. one-cent change in the value of the Canadian dollar compared to the U.S. dollar would impact BA’s expected costs for the 12-month period ending December 31, 2015 by approximately $32 million before giving effect to forward foreign exchange contracts ($8 million impact after giving effect to such contracts).
A U.S. one-cent change in the value of the pound sterling compared to the U.S. dollar would impact BA’s expected costs for the 12-month period ending December 31, 2015 by approximately $4 million before giving effect to forward foreign exchange contracts ($1 million impact after giving effect to such contracts).
EVOLUTION OF FOREIGN EXCHANGE RATES(as at)
The CAD/USD and EUR/USD exchange rates have sincedecreased notably, to 0.80 and 1.13, respectively, as atFebruary 10, 2015
BT and Corporate OfficeBT’s foreign currency exposure, arising from its long-term contracts, spreads over many years. Such exposures are generally entirely hedged at the time of order intake, contract-by-contract, for a period that is often shorter than the maturity of the cash flow exposure. Upon maturity of the hedges, BT enters into new hedges in a rollover strategy for periods up to the maturity of the cash flow exposure. As such, BT’s results of operations are not significantly exposed to gains and losses from transactions in foreign currencies, but remain exposed to translation and cash flow risks on a temporary basis. On a cumulative basis, however, cash outflows or inflows upon rollover of these hedges are offset by cash inflows or outflows in opposite directions when the cash flow exposure materializes.
Corporate Office’s identified cash flow exposures are not significant and mainly arise from expenses denominated in Canadian dollars. Corporate Office’s balance sheet exposure arises mainly from investments in foreign operations and long-term debt. Despite the Corporation's risk mitigation strategies, the impact of foreign currency fluctuations on equity can be significant given the size of investments in foreign operations with non-U.S. dollar functional currencies, mainly the euro.
Sensitivity analysisFor investments in foreign operations exposed to foreign currency movements, a 1% fluctuation of the relevant currencies as at December 31, 2014 would have impacted equity, before the effect of income taxes, by $11 million.

BOMBARDIER INC. FINANCIAL REPORT - FISCAL YEAR ENDED DECEMBER 31, 2014 - OVERVIEW 21
Exposure to credit risk
The effective monitoring and controlling of credit risk is a key component of the Corporation's risk management activities. Credit risk is monitored on an ongoing basis using different systems and methodologies depending on the underlying exposure.
Credit risk management
Owner Key risks Risk mitigation measures initiated by managementCorporateOffice
Through normal treasuryactivities, the Corporation isexposed to credit riskthrough derivative financialinstruments and investinginstruments.
Credit risks arising from treasury activities are managed by a central treasuryfunction in accordance with the Corporate Foreign Exchange Risk ManagementPolicy and the Corporate Investment Management Policy. The objective ofthese policies is to minimize exposure to credit risk from treasury activities byensuring that the Corporation transacts strictly with investment-grade financialinstitutions and money market funds, based on pre-established consolidatedcounterparty risk limits per financial institution and fund.
BA and BT The Corporation is exposedto credit risk through tradereceivables arising fromnormal commercialactivities and lendingactivities, related primarilyto aircraft loans and leasereceivables provided to BAcustomers in connectionwith the sale of commercialaircraft.
Credit risks arising from normal commercial activities and lending activities aremanaged and controlled by BA and BT, in accordance with the Corporate Officepolicy. Customer credit ratings and credit limits are analyzed and established byinternal credit specialists, based on inputs from external rating agencies,recognized rating methods and experience with the customers. The credit riskand credit limits are dynamically reviewed based on fluctuations in thecustomers’ financial results and payment behaviour. These customer creditratings and credit limits are critical inputs in determining the conditions underwhich credit or financing is extended to customers, including obtaining collateralto reduce exposure to losses. Specific governance is in place to ensure thatcredit risk arising from large transactions are analyzed and approved by theappropriate level of management before financing or credit support is offered tothe customer.
BA In connection with the saleof certain products, mainlycommercial aircraft, theCorporation may providecredit guarantees in theform of lease and loanpayment guarantees.Substantially all financialsupport involving potentialcredit risk lies with regionalairline customers.
Credit guarantees provide support through contractually limited payments to the guaranteed party to mitigate default-related losses. Credit guarantees are usually triggered if customers do not perform during the term of the financing under the relevant financing arrangements. In the event of default, the Corporation usually acts as agent for the guaranteed parties for the repossession, refurbishment and re-marketing of the underlying assets.This exposure arising from credit guarantees is partially mitigated by the net benefit expected from the estimated value of aircraft and other assets available to mitigate exposure under these guarantees. In addition, lease subsidy liabilities would be extinguished in the event of credit default by certain customers.
Exposure to liquidity risk
The management of exposure to liquidity risk requires a constant monitoring of expected cash inflows and outflows, which is achieved through maintenance of detailed forecasts of cash flows and liquidity position, as well as long-term operating and strategic plans. Liquidity adequacy is continually monitored, taking into consideration historical volatility, the economic environment, seasonal needs, the maturity profile of indebtedness, access to capital markets, the level of customer advances, working capital requirements, the funding of product development and other financial commitments. Management also monitors any financing opportunities to optimize the capital structure and maintain appropriate financial flexibility. In addition, the Corporation engages in certain working capital financing initiatives such as the sale of receivables, aircraft sale and leaseback transactions and the negotiation of extended payment terms with certain suppliers.

22 BOMBARDIER INC. FINANCIAL REPORT - FISCAL YEAR ENDED DECEMBER 31, 2014
Exposure to interest rate risk
Future cash flows are exposed to fluctuations from changing interest rates, arising mainly from assets and liabilities indexed to variable interest rates, including fixed-rate long-term debt synthetically converted to variable interest rates. From time to time, the Corporation may also be exposed to changes in interest rates for certain financing commitments, when a fixed financing rate has been guaranteed to a customer. For these items, cash flows could be impacted by a change in benchmark rates such as Libor, Euribor or Banker’s Acceptance. The Corporate Office central treasury function manages these exposures as part of the overall risk management policy.
The Corporation is also exposed to gains and losses on certain assets and liabilities as a result of changes in interest rates, principally financial instruments carried at fair value and credit and residual value guarantees. The financial instruments carried at fair value include certain aircraft loans and lease receivables, investments in securities, investments in financing structures, lease subsidies and derivative financial instruments.
Sensitivity analysisA 100-basis point increase in interest rates impacting the measurement of financial instruments carried at fair value and credit and residual value guarantees, excluding net retirement benefit liabilities, would have negatively impacted EBT for fiscal year 2014 by $22 million.

BOMBARDIER INC. FINANCIAL REPORT - FISCAL YEAR ENDED DECEMBER 31, 2014 - OVERVIEW 23
CONSOLIDATED RESULTS OF OPERATIONSThe results of operations and cash flows for the fourth quarter are not necessarily indicative of the results of operations and cash flows for the full fiscal year. The fourth quarter has generally been the strongest in terms of revenues, profitability and cash flows.
Results of operationsFourth quarters
ended December 31Fiscal years
ended December 312014 2013 2014 2013
Revenues $ 5,960 $ 5,324 $ 20,111 $ 18,151Cost of sales 5,314 4,698 17,534 15,658Gross margin 646 626 2,577 2,493SG&A 351 351 1,358 1,417R&D 112 83 347 293Share of income of joint ventures and associates (25) (17) (89) (119)Other expense 52 23 38 9EBIT before special items(1) 156 186 923 893Special items(2) 1,357 1 1,489 (30)EBIT (1,201) 185 (566) 923Financing expense 65 75 249 271Financing income (17) (30) (75) (119)EBT (1,249) 140 (740) 771Income taxes 341 43 506 199Net income (loss) $ (1,590) $ 97 $ (1,246) $ 572Attributable toEquity holders of Bombardier Inc. $ (1,594) $ 95 $ (1,260) $ 564NCI $ 4 $ 2 $ 14 $ 8
EPS (in dollars)Basic and diluted $ (0.92) $ 0.05 $ (0.74) $ 0.31
Non-GAAP financial measures(1)
Fourth quarters ended December 31
Fiscal years ended December 31
2014 2013 2014 2013EBITDA $ 181 $ 291 $ 1,117 $ 1,314EBITDA before special items $ 272 $ 292 $ 1,340 $ 1,284Adjusted net income $ 83 $ 129 $ 648 $ 608Adjusted EPS $ 0.04 $ 0.07 $ 0.35 $ 0.33
(1) Refer to the Non-GAAP financial measures section for details, definitions and reconciliations of these metrics to the most comparable IFRS measures.
(2) Refer to the special items section on the next page.
24 BOMBARDIER INC. FINANCIAL REPORT - FISCAL YEAR ENDED DECEMBER 31, 2014
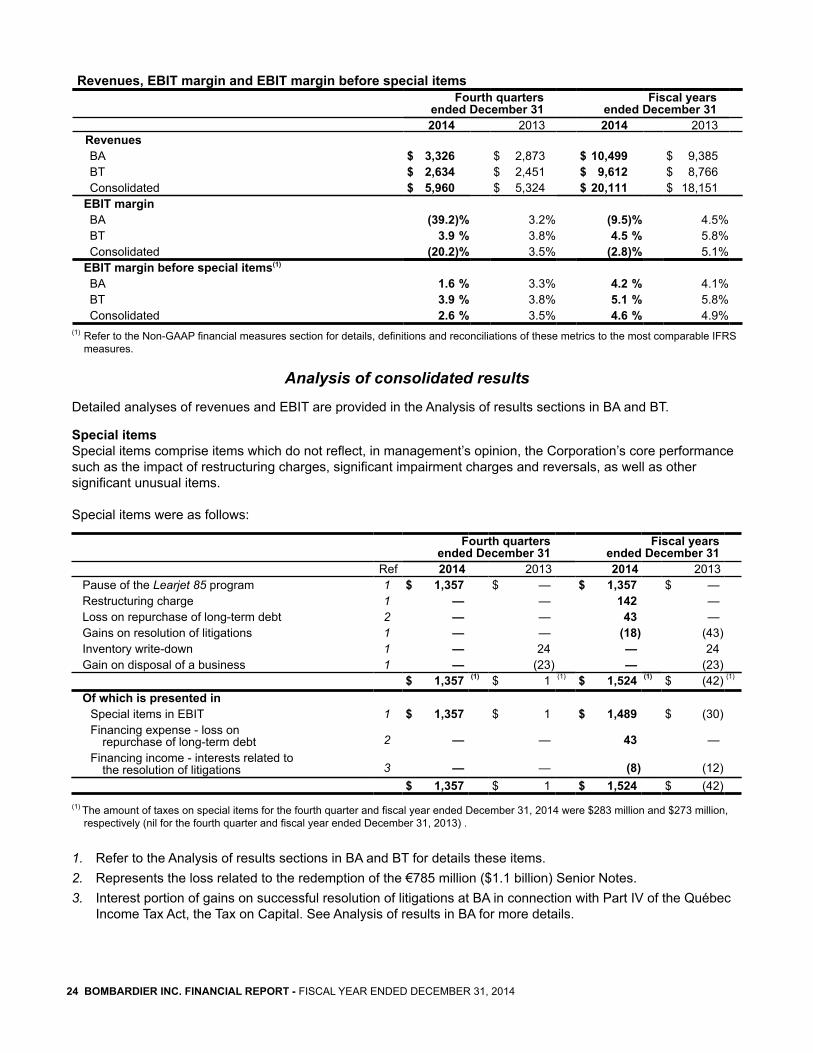
Revenues, EBIT margin and EBIT margin before special itemsFourth quarters
ended December 31Fiscal years
ended December 312014 2013 2014 2013
RevenuesBA $ 3,326 $ 2,873 $ 10,499 $ 9,385BT $ 2,634 $ 2,451 $ 9,612 $ 8,766Consolidated $ 5,960 $ 5,324 $ 20,111 $ 18,151
EBIT marginBA (39.2)% 3.2% (9.5)% 4.5%BT 3.9 % 3.8% 4.5 % 5.8%Consolidated (20.2)% 3.5% (2.8)% 5.1%
EBIT margin before special items(1)
BA 1.6 % 3.3% 4.2 % 4.1%BT 3.9 % 3.8% 5.1 % 5.8%Consolidated 2.6 % 3.5% 4.6 % 4.9%
(1) Refer to the Non-GAAP financial measures section for details, definitions and reconciliations of these metrics to the most comparable IFRS measures.
Analysis of consolidated results
Detailed analyses of revenues and EBIT are provided in the Analysis of results sections in BA and BT.
Special itemsSpecial items comprise items which do not reflect, in management’s opinion, the Corporation’s core performance such as the impact of restructuring charges, significant impairment charges and reversals, as well as other significant unusual items.
Special items were as follows:
Fourth quarters ended December 31
Fiscal years ended December 31
Ref 2014 2013 2014 2013Pause of the Learjet 85 program 1 $ 1,357 $ — $ 1,357 $ —Restructuring charge 1 — — 142 —Loss on repurchase of long-term debt 2 — — 43 —Gains on resolution of litigations 1 — — (18) (43)Inventory write-down 1 — 24 — 24Gain on disposal of a business 1 — (23) — (23)
$ 1,357 (1) $ 1 (1) $ 1,524 (1) $ (42) (1)
Of which is presented inSpecial items in EBIT 1 $ 1,357 $ 1 $ 1,489 $ (30)Financing expense - loss on
repurchase of long-term debt 2 — — 43 —Financing income - interests related to
the resolution of litigations 3 — — (8) (12)$ 1,357 $ 1 $ 1,524 $ (42)
(1) The amount of taxes on special items for the fourth quarter and fiscal year ended December 31, 2014 were $283 million and $273 million, respectively (nil for the fourth quarter and fiscal year ended December 31, 2013) .
1. Refer to the Analysis of results sections in BA and BT for details these items.2. Represents the loss related to the redemption of the €785 million ($1.1 billion) Senior Notes.3. Interest portion of gains on successful resolution of litigations at BA in connection with Part IV of the Québec
Income Tax Act, the Tax on Capital. See Analysis of results in BA for more details.

BOMBARDIER INC. FINANCIAL REPORT - FISCAL YEAR ENDED DECEMBER 31, 2014 - OVERVIEW 25
Net financing expenseNet financing expense amounted to $48 million and $174 million, respectively, for the fourth quarter and fiscal year ended December 31, 2014, compared to $45 million and $152 million for the corresponding periods last fiscal year.The $3 million increase for the three-month period is mainly due to:
• a prior year favourable variance related to changes in discount rates for provisions ($7 million); and• higher interest on long-term debt, after the effect of hedges ($7 million).Partially offset by:• lower accretion on retirement benefit obligations ($9 million).
The $22 million increase for the fiscal year is mainly due to:• a loss on repurchase of long-term debt(1) ($43 million);• a net loss on certain financial instruments compared to a net gain last fiscal year ($25 million); and• a prior year favourable variance related to changes in discount rates for provisions ($18 million).Partially offset by:• lower accretion on retirement benefit obligations ($37 million); and• higher borrowing costs capitalized to PP&E and intangible assets ($22 million).
(1) Following the redemption of the €785 million ($1.1 billion) Senior Notes, a related loss of $43 million was recorded in financing expense, which is treated as a special item.
Income taxes The effective income tax rates for the fourth quarter and fiscal year ended December 31, 2014 were (27.3)% and (68.4)%, respectively, compared to the statutory income tax rate in Canada of 26.8%. For the three-month period and for the fiscal year, the higher effective income tax rates are mainly due to the charge recorded as a special item in relation to the pause of the Learjet 85 program, which triggered a write-down of deferred income tax assets and the non-recognition of income tax benefits related to tax losses and temporary differences.
The effective income tax rates before special items for the fourth quarter and fiscal year ended December 31, 2014 were 53.0% and 31.1%, respectively, compared to the statutory income tax rate in Canada of 26.8%.
For the three-month period, the higher effective income tax rate is mainly due to: • the non-recognition of income tax benefits related to tax losses and temporary differences and the write
down of deferred income tax assets. Partially offset by:
• the positive impact of the recognition of previously unrecognized tax losses or temporary differences andpermanent differences.
For the fiscal year ended December 31, 2014, the higher effective income tax rate is mainly due to: • the non-recognition of income tax benefits related to tax losses and temporary differences.
Partially offset by: • the positive impact of the recognition of previously unrecognized tax losses or temporary differences and
permanent differences.
The effective income tax rates for the fourth quarter and fiscal year ended December 31, 2013 were 30.7% and 25.8%, respectively, compared to the statutory income tax rate in Canada of 26.8%.
For the three-month period, the higher effective tax rate is mainly due to: • the write down of deferred income tax assets and the non-recognition of income tax benefits related to tax
losses and temporary differences. Partially offset by:
• the recognition of previously unrecognized tax losses or temporary differences.
For the fiscal year ended December 31, 2013, the lower effective tax rate is mainly due: • to the positive impact of the recognition of previously unrecognized tax losses or temporary differences
and permanent differences. Partially offset by
• the non-recognition of income tax benefits related to tax losses and temporary differences and write downof deferred income tax assets.

26 BOMBARDIER INC. FINANCIAL REPORT - FISCAL YEAR ENDED DECEMBER 31, 2014
LIQUIDITY AND CAPITAL RESOURCES
Reconciliation of segmented free cash flow to cash flows from operating activitiesFourth quarters
ended December 31Fiscal years
ended December 312014 2013 2014 2013
Segmented free cash flow (usage)(1)
BA $ 29 $ 87 $ (1,059) $ (1,239)BT 506 767 122 668
Segmented free cash flow (usage) 535 854 (937) (571)Net income taxes and net interest (paid) received(2) 55 (83) (180) (336)Free cash flow (usage) 590 771 (1,117) (907)Add back: Net additions to PP&E and intangible assets 495 627 1,964 2,287Cash flows from operating activities $ 1,085 $ 1,398 $ 847 $ 1,380
(1) Non-GAAP financial measures. Refer to the Non-GAAP financial measures section for definitions of these metrics and the Analysis of results sections in BA and BT for reconciliations to the most comparable IFRS measures.
(2) Not allocated to reportable segments.
Variation in cash and cash equivalentsFourth quarters
ended December 31Fiscal years
ended December 312014 2013 2014 2013
Balance at the beginning of period/fiscal year $ 1,935 $ 2,590 $ 3,397 $ 2,557Net proceeds from issuance of long-term debt 5 3 1,820 1,983Repayments of long-term debt (16) (15) (1,334) (51)Free cash flow (usage)(1) 590 771 (1,117) (907)Dividends paid (45) (48) (182) (196)Effect of exchange rate changes on cash and cash equivalents (100) 33 (169) (2)Net proceeds from disposal of a business(2) — 83 25 83Net variation in AFS investments in securities 53 52 — (70)Other 67 (72) 49 —
Balance at the end of period/fiscal year $ 2,489 $ 3,397 $ 2,489 $ 3,397(1) Non-GAAP financial measures. Refer to the Non-GAAP financial measures section for definitions of these metrics and the Analysis of
results sections in BA and BT for reconciliations to the most comparable IFRS measures.(2) Related to the sale of the main assets and related liabilities of the Corporation’s Flexjet activities completed in December 2013. In fiscal
year 2014, the Corporation received the balance of the sale price.

BOMBARDIER INC. FINANCIAL REPORT - FISCAL YEAR ENDED DECEMBER 31, 2014 - OVERVIEW 27
Available short-term capital resourcesDecember 31, 2014 December 31, 2013
Cash and cash equivalents $ 2,489 $ 3,397Available revolving credit facilities 1,357 1,440Available short-term capital resources $ 3,846 $ 4,837
The Corporation's available short-term capital resources include cash and cash equivalents as well as the amounts available under the two unsecured revolving credit facilities. These facilities are available for cash drawings for the general needs of the Corporation. Under these facilities, the same financial covenants must be met as for the BA and BT letter of credit facilities. Refer to the Other credit facilities section for details of these financial covenants.
In March 2014, the Corporation extended the maturity dates of the BT €500 million ($607 million) and the $750 million unsecured revolving credit facilities by one year to March 2016 and June 2017, respectively.
AVAILABLE SHORT-TERM CAPITAL RESOURCES(1)
(as at; in billions of dollars)
(1)Some totals do not agree due to rounding.
In April 2014, the Corporation issued, at par, unsecured Senior Notes comprised of $600 million, bearing interest at 4.75%, due on April 15, 2019 and $1.2 billion, bearing interest at 6.00%, due on October 15, 2022.
The Corporation used the net proceeds of $1.8 billion to finance the redemption of the €785 million ($1.1 billion) Senior Notes due November 15, 2016 pursuant to an optional redemption exercised on April 4, 2014, to finance the repayment of the $162 million Notes due May 1, 2014 with the remainder being for general corporate purposes.
In May 2014, the Corporation entered into interest-rate swap agreements to convert the interest rate of the $1.2 billion 6.00% Senior Notes from fixed to variable 3-month Libor +3.5557.
The interest-rate swap agreement related to the €780 million Senior Notes was settled in the fourth quarter of fiscal year 2014. As this interest-rate swap was in a fair value hedge relationship, the related deferred gain recorded in the hedged item will be amortized in interest expense up to the maturity of the debt.
In February 2015, the Corporation announced a financing plan to position the Corporation with a flexible and strong financial profile. Pursuant to this plan, the Corporation intends to access capital markets, depending on market conditions, for the issuance of equity for approximately $600 million and long-term debt capital for up to $1.5 billion.
In order to realize the capital raising plan, the Corporation has filed on February 12, 2015 a preliminary short form base shelf prospectus with the Canadian securities regulatory authorities, which will allow it to offer from time to time over a 25-month period up to approximately $2 billion ($2.5 billion Canadian) of debt, equity or other securities, including convertible securities. The Corporation may also offer the securities on a private placement basis in the U.S. and in other jurisdictions.
In addition, the Corporation is suspending the declaration of dividends on the Class A and Class B shares. To complement this financing plan, the Corporation will explore other initiatives such as certain business activities' potential participation in industry consolidation in order to reduce debt.
Management considers that the Corporation's expected cash flows from operating activities, combined with available short-term capital resources of $3.8 billion, will enable the development of new products to enhance competitiveness and support growth; will allow the payment of dividends, if and when declared by the Board of Directors; and will enable the Corporation to meet all other expected financial requirements in the foreseeable future.
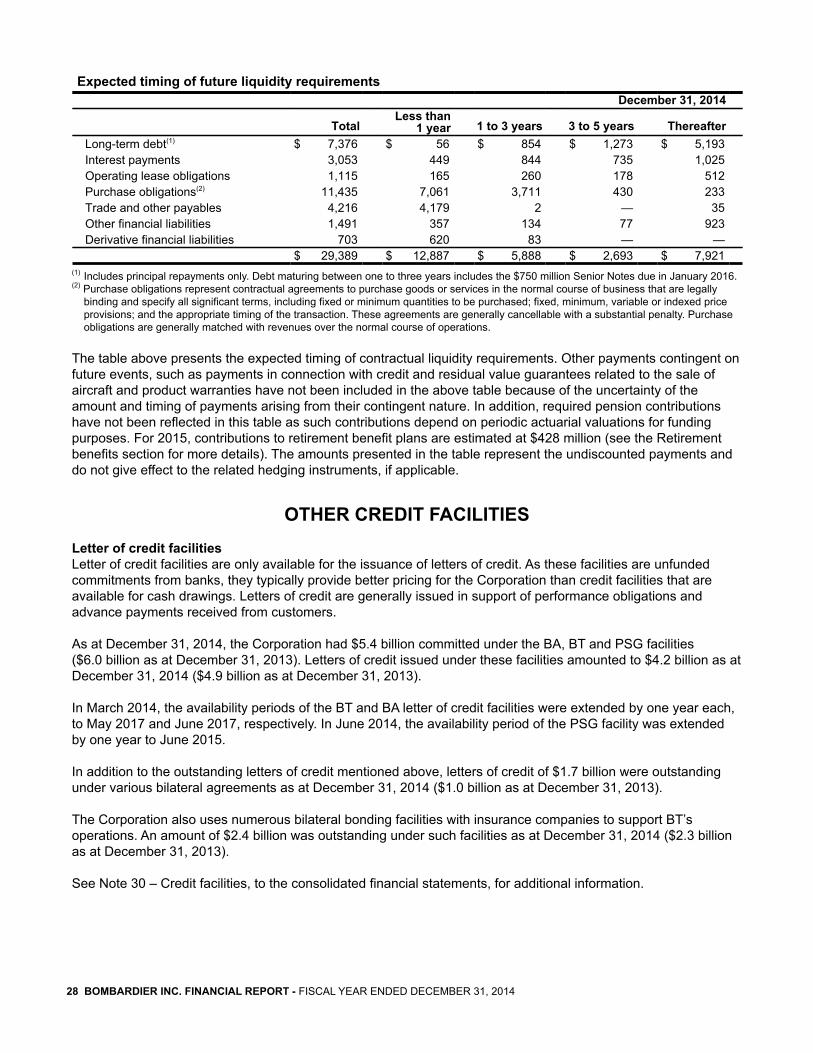
28 BOMBARDIER INC. FINANCIAL REPORT - FISCAL YEAR ENDED DECEMBER 31, 2014
Expected timing of future liquidity requirementsDecember 31, 2014
TotalLess than
1 year 1 to 3 years 3 to 5 years ThereafterLong-term debt(1) $ 7,376 $ 56 $ 854 $ 1,273 $ 5,193Interest payments 3,053 449 844 735 1,025Operating lease obligations 1,115 165 260 178 512Purchase obligations(2) 11,435 7,061 3,711 430 233Trade and other payables 4,216 4,179 2 — 35Other financial liabilities 1,491 357 134 77 923Derivative financial liabilities 703 620 83 — —
$ 29,389 $ 12,887 $ 5,888 $ 2,693 $ 7,921(1) Includes principal repayments only. Debt maturing between one to three years includes the $750 million Senior Notes due in January 2016.(2) Purchase obligations represent contractual agreements to purchase goods or services in the normal course of business that are legally
binding and specify all significant terms, including fixed or minimum quantities to be purchased; fixed, minimum, variable or indexed price provisions; and the appropriate timing of the transaction. These agreements are generally cancellable with a substantial penalty. Purchase obligations are generally matched with revenues over the normal course of operations.
The table above presents the expected timing of contractual liquidity requirements. Other payments contingent on future events, such as payments in connection with credit and residual value guarantees related to the sale of aircraft and product warranties have not been included in the above table because of the uncertainty of the amount and timing of payments arising from their contingent nature. In addition, required pension contributions have not been reflected in this table as such contributions depend on periodic actuarial valuations for funding purposes. For 2015, contributions to retirement benefit plans are estimated at $428 million (see the Retirement benefits section for more details). The amounts presented in the table represent the undiscounted payments and do not give effect to the related hedging instruments, if applicable.
OTHER CREDIT FACILITIESLetter of credit facilitiesLetter of credit facilities are only available for the issuance of letters of credit. As these facilities are unfunded commitments from banks, they typically provide better pricing for the Corporation than credit facilities that are available for cash drawings. Letters of credit are generally issued in support of performance obligations and advance payments received from customers.
As at December 31, 2014, the Corporation had $5.4 billion committed under the BA, BT and PSG facilities ($6.0 billion as at December 31, 2013). Letters of credit issued under these facilities amounted to $4.2 billion as at December 31, 2014 ($4.9 billion as at December 31, 2013).
In March 2014, the availability periods of the BT and BA letter of credit facilities were extended by one year each, to May 2017 and June 2017, respectively. In June 2014, the availability period of the PSG facility was extended by one year to June 2015.
In addition to the outstanding letters of credit mentioned above, letters of credit of $1.7 billion were outstanding under various bilateral agreements as at December 31, 2014 ($1.0 billion as at December 31, 2013).
The Corporation also uses numerous bilateral bonding facilities with insurance companies to support BT’s operations. An amount of $2.4 billion was outstanding under such facilities as at December 31, 2014 ($2.3 billion as at December 31, 2013).
See Note 30 – Credit facilities, to the consolidated financial statements, for additional information.

BOMBARDIER INC. FINANCIAL REPORT - FISCAL YEAR ENDED DECEMBER 31, 2014 - OVERVIEW 29
Financial covenantsUnder the BA and BT letter of credit facilities and the two unsecured revolving credit facilities available for cash drawings, various financial covenants must be maintained, which must be met on a quarterly basis. The BA $600 million letter of credit facility and the $750 million unsecured revolving facility include financial covenants requiring a minimum EBITDA to fixed charges ratio, a maximum net debt to EBITDA ratio and a minimum liquidity level of $500 million at the end of each quarter, all calculated based on an adjusted consolidated basis (i.e. excluding BT). BT’s €3.5 billion ($4.2 billion) letter of credit facility and €500 million ($607 million) unsecured revolving facility financial covenants require a minimum liquidity level of €600 million ($728 million) at the end of each quarter, as well as a minimum equity level and a maximum debt to EBITDA ratio, all calculated on a BT stand-alone basis. These terms and ratios are defined in the respective agreements and do not correspond to the Corporation's global metrics or to any specific terms used in the MD&A. A breach of any of these agreements or the inability to comply with these covenants could result in a default under these facilities, which would permit the Corporation's banks to request immediate defeasance or cash cover of all outstanding letters of credit, and bond holders and other lenders to declare amounts owed to them to be immediately payable.
The financial covenants under these credit facilities were all met as at December 31, 2014 and 2013 and as at January 1, 2013.
On balance sheet sale and leaseback facilities BA enters into sale and leaseback facilities with third parties under which it can sell certain pre-owned business aircraft and lease them back for a period not greater than 24 months. The Corporation has the right to buy the aircraft back during the term of the lease for predetermined amounts. As at December 31, 2014, the Corporation had sale and leaseback facilities with third parties under which a total of $260 million was outstanding as at December 31, 2014 ($138 million as at December 31, 2013).
RETIREMENT BENEFITS
Significant decrease in retirement benefit contributions
Overview of retirement benefit plans
The Corporation sponsors several Canadian and foreign retirement benefit plans consisting of funded and unfunded pension plans, as well as other unfunded defined benefit plans. Funded plans are plans for which segregated plan assets are invested in trusts. Unfunded plans are plans for which there are no segregated plan assets, as the establishment of segregated plan assets is generally not permitted or not in line with local practice. Therefore unfunded plans will always be in a deficit position.
Pension plans are categorized as DB or DC. DB plans specify the amount of benefits an employee is to receive at retirement, while DC plans specify how contributions are determined. As a result, there is no deficit or surplus for DC plans. Hybrid plans are a combination of DB and DC plans.
RETIREMENT BENEFIT CONTRIBUTIONS (for fiscal years ended; in millions of dollars)
F: Forecast*For the fiscal year ended December 31, 2011, contributions comprise 11 months for BA plans and 12 months for BT plans.
Retirement benefit contributions to DB pension plans decreased by $97 million to $370 million for the fiscal year ended December 31, 2014, compared to $467 million the previous year. This reduction in contributions result from the improvement in the funding ratio of the funded plans, which has improved from 74% to 87% since the fiscal year ended December 31, 2011.

30 BOMBARDIER INC. FINANCIAL REPORT - FISCAL YEAR ENDED DECEMBER 31, 2014
EVOLUTION OF PENSION PLAN ASSETS, FUNDED PLAN OBLIGATIONS AND DEFICIT(as at; in billions of dollars)
EVOLUTION OF FUNDING RATIO(as at; plan assets as a percentage of funded plan obligations)
Net retirement benefit liability
Discount rates dropped sharply to near their historical lows in 2014. This drop was the main reason for the increase in the net retirement benefit liability from $2.0 billion as at December 31,2013 to $2.5 billion as at December 31, 2014. Despite lower discount rates, the net retirement benefit liability has decreased by $748 million since reaching its peak on December 31, 2011.
EVOLUTION OF WEIGHTED-AVERAGE DISCOUNT RATE (as at; used to determine the defined benefit pension obligation)
NET RETIREMENT BENEFIT LIABILITY(as at; in millions of dollars)
* Includes liability arising from minimum funding requirement andimpact of asset ceiling test.
Variation in net retirement benefit liabilityBalance as at December 31, 2013 $ 1,987 (1)
Changes in discount rates and other financial assumptions 1,514Actuarial gains on pension plan assets (676)Employer contributions (386)Service costs 252Changes in foreign exchange rates (208)Accretion on net retirement benefit obligation 76Net actuarial gains on defined benefit obligations (71)Other (18)
Balance as at December 31, 2014 $ 2,470 (1)
(1) Includes retirement benefit assets of $159 million as at December 31, 2014 ($174 million as at December 31, 2013).
Bombardier's net retirement benefit liability increased by $483 million in 2014, mainly due to the reduction in discount rates in 2014. This increase was partly offset by actuarial gains on plan assets, excess of employer contributions over service costs and favourable foreign currency exchange rates.

BOMBARDIER INC. FINANCIAL REPORT - FISCAL YEAR ENDED DECEMBER 31, 2014 - OVERVIEW 31
The value of plan assets is highly dependent on the pension funds’ asset performance and on the level of contributions. The performance of the financial markets is a key driver in determining the funds’ asset performance as assets in the plans are composed mostly of publicly traded equity and fixed income securities. IFRS requires that the excess (deficit) of actual return on plan assets compared to the estimated return be reported as an actuarial gain or loss in other comprehensive income. The return on plan assets must be calculated using the discount rate that is used to measure the net retirement benefit liability, which is derived using high-quality corporate bond yields. During fiscal year 2014, the actual gain on plan assets was $1.1 billion, of which $676 million was accounted for as an actuarial gain.
INCREASE IN NET RETIREMENT BENEFIT LIABILITY (in millions of dollars)
* Other is mainly comprised of changes in other actuarial assumptions.
** Mainly comprised of changes in discount rates.
DB plan contributions for 2014 of $386 million were in excess of current service cost of $252 million, which helped to reduce the net retirement benefit liability. DB plan contributions are estimated at $337 million for 2015. The future level of contributions will be impacted by the evolution of market interest rates and the actual return on plan assets.
In Canada and the U.S., since September 1, 2013, all new non-unionized employees join DC plans (they no longer have the option of joining DB or hybrid plans). In the U.K., seven of nine DB plans are closed to new members. Employees who are members of a DB or hybrid plan closed to new members continue to accrue service in their original plan. As a result of these changes, contributions to DC plans have increased over the past several years. In fiscal year 2014, DC pension contributions were made totaling $90 million. These contributions are estimated at $91 million for 2015.
Investment Policy
The investment policies are established to achieve a long-term investment return so that, in conjunction with contributions, the plans have sufficient assets to pay for the promised benefits while maintaining a level of risk that is acceptable given the tolerance of plan stakeholders. See below for more information regarding risk management initiatives.
The target asset allocation is determined based on expected economic and market conditions, the maturity profile of the plans’ liabilities, the funded status of the respective plans and the plan stakeholders’ tolerance to risk.
The plans’ investment strategy is to invest broadly in fixed income and equity securities and to have a smaller portion of the funds’ assets invested in real return asset securities (including global infrastructure and real estate listed securities).
As at December 31, 2014, the average target asset allocation was as follows: • 52%, 50% and 51% in fixed income securities, for Canadian, U.K. and U.S. plans, respectively;• 38%, 35% and 44% in equity securities, for Canadian, U.K. and U.S. plans, respectively; and• 10%, 15% and 5% in real return asset securities, for Canadian, U.K. and U.S. plans, respectively.
In addition, to mitigate interest rate risk, interest rate hedging overlay portfolios (comprised of long-term interest rate swaps and long-term Gilt forwards) were implemented in 2013 for most of the plans. The interest rate hedging overlay portfolios were liquidated in 2014 to crystallize the gains realized from declining bond yields. These portfolios will be re-implemented when the market will be favorable.

32 BOMBARDIER INC. FINANCIAL REPORT - FISCAL YEAR ENDED DECEMBER 31, 2014
The plan administrators have also established dynamic de-risking strategies. As a result, asset allocation will likely become more conservative in the future and interest rate hedging overlay portfolios are likely to be established as plan funding status and market conditions continue to improve. Bombardier Inc. Pension Asset Management Services monitors the de-risking triggers on a daily basis to ensure timely and efficient implementation of these strategies. The Corporation and administrators periodically undertake asset and liability studies to determine the appropriateness of the investment policies and de-risking strategies.
Risk management initiatives
The Corporation's pension plans are exposed to various risks, including equity, interest rate, inflation, foreign exchange, liquidity and longevity risks. Several risk strategies and policies have been put in place to mitigate the impact these risks could have on the funded status of DB plans and on the future level of contributions. The following is a description of key risks together with the mitigation measures in place to address them.
Equity riskEquity risk is the risk that results from fluctuations in equity prices. This risk is managed by maintaining diversification of portfolios across geographies, industry sectors and investment strategies.
Interest rate riskInterest rate risk is the risk that results from fluctuations in the fair value of plan assets and liabilities due to movements in interest rates. This risk is managed by reducing the mismatch between the duration of plan assets and the duration of pension obligation. This is accomplished by having a significant portion of the portfolio invested in long-term fixed income securities and interest rate hedging overlay portfolios.
Inflation riskInflation risk is the risk that benefits indexed to inflation increase significantly as a result of changes in inflation rates. To manage this risk, the benefit indexation has been capped in certain plans and a portion of plan assets has been invested in real return asset securities and real return fixed income securities.
Foreign exchange riskCurrency risk exposure arises from fluctuations in the fair value of plan assets denominated in a currency other than the currency of the plan liabilities. Currency risk is managed with foreign currency hedging strategies as per plan investment policies.
Liquidity riskLiquidity risk is the risk stemming from holding assets which cannot be readily converted to cash when needed for the payment of benefits or to rebalance the portfolios. Liquidity risk is managed through investment in government bonds and equity futures and by having no investments in private placements or hedge funds.
Longevity riskLongevity risk is the risk that increasing life expectancy results in longer-than-expected benefit payments. This risk is mitigated by using the most recent mortality tables to set the level of contributions.
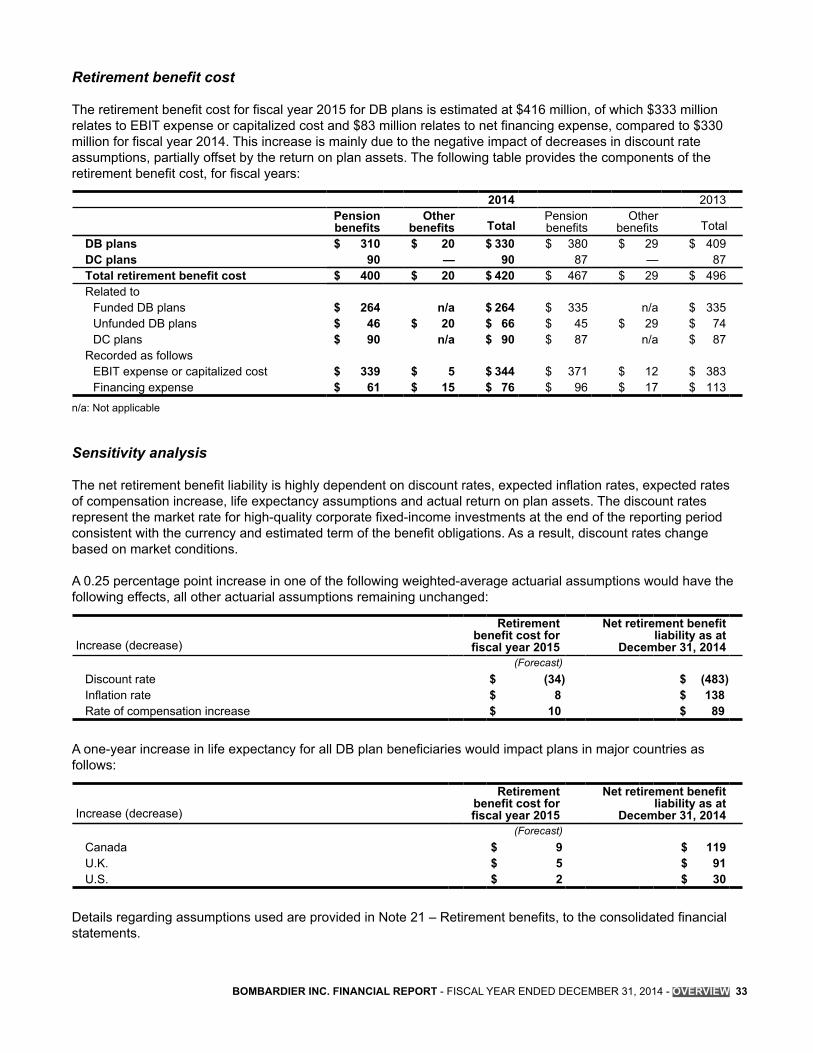
BOMBARDIER INC. FINANCIAL REPORT - FISCAL YEAR ENDED DECEMBER 31, 2014 - OVERVIEW 33
Retirement benefit cost
The retirement benefit cost for fiscal year 2015 for DB plans is estimated at $416 million, of which $333 million relates to EBIT expense or capitalized cost and $83 million relates to net financing expense, compared to $330 million for fiscal year 2014. This increase is mainly due to the negative impact of decreases in discount rate assumptions, partially offset by the return on plan assets. The following table provides the components of the retirement benefit cost, for fiscal years:
2014 2013Pensionbenefits
Otherbenefits Total
Pensionbenefits
Otherbenefits Total
DB plans $ 310 $ 20 $ 330 $ 380 $ 29 $ 409DC plans 90 — 90 87 — 87Total retirement benefit cost $ 400 $ 20 $ 420 $ 467 $ 29 $ 496Related to
Funded DB plans $ 264 n/a $ 264 $ 335 n/a $ 335Unfunded DB plans $ 46 $ 20 $ 66 $ 45 $ 29 $ 74DC plans $ 90 n/a $ 90 $ 87 n/a $ 87
Recorded as followsEBIT expense or capitalized cost $ 339 $ 5 $ 344 $ 371 $ 12 $ 383Financing expense $ 61 $ 15 $ 76 $ 96 $ 17 $ 113
n/a: Not applicable
Sensitivity analysis
The net retirement benefit liability is highly dependent on discount rates, expected inflation rates, expected rates of compensation increase, life expectancy assumptions and actual return on plan assets. The discount rates represent the market rate for high-quality corporate fixed-income investments at the end of the reporting period consistent with the currency and estimated term of the benefit obligations. As a result, discount rates change based on market conditions.
A 0.25 percentage point increase in one of the following weighted-average actuarial assumptions would have the following effects, all other actuarial assumptions remaining unchanged:
Increase (decrease)
Retirementbenefit cost forfiscal year 2015
Net retirement benefitliability as at
December 31, 2014(Forecast)
Discount rate $ (34) $ (483)Inflation rate $ 8 $ 138Rate of compensation increase $ 10 $ 89
A one-year increase in life expectancy for all DB plan beneficiaries would impact plans in major countries as follows:
Increase (decrease)
Retirementbenefit cost forfiscal year 2015
Net retirement benefitliability as at
December 31, 2014(Forecast)
Canada $ 9 $ 119U.K. $ 5 $ 91U.S. $ 2 $ 30
Details regarding assumptions used are provided in Note 21 – Retirement benefits, to the consolidated financial statements.

34 BOMBARDIER INC. FINANCIAL REPORT - FISCAL YEAR ENDED DECEMBER 31, 2014
CAPITAL STRUCTUREManagement analyzes capital structure using global metrics, which are based on a broad economic view of the Corporation, in order to assess the creditworthiness of the Corporation. These global metrics are managed and monitored in order to achieve an investment-grade profile.
Reconciliations of these measures to the most comparable IFRS financial measures are in the Non-GAAP financial measures section. Adjusted EBIT and adjusted EBITDA exclude special items, such as restructuring charges, significant impairment charges and reversals, as well as other significant unusual items, which management does not consider representative of the Corporation's core performance.
The Corporation's objectives with regard to the global metrics are as follows:• adjusted EBIT to adjusted interest ratio greater than 5.0; and• adjusted debt to adjusted EBITDA ratio lower than 2.5.
Global metrics(1)
December 312014
December 312013
Explanation of significantvariances
Interest coverage ratioImproved due to higher AdjustedEBIT, partially offset by higher netinterest paid.
Adjusted EBIT(2) $ 1,262 $ 967Adjusted interest(2) $ 401 $ 346Adjusted EBIT to adjusted interest ratio 3.1 2.8
Financial leverage ratio Improved due to higher AdjustedEBITDA and the repayment ofapproximately $1.3 billion ofexisting debt, partially offset by theissuance of $1.8 billion of long termdebt in April 2014.
Adjusted debt $ 8,401 $ 7,912Adjusted EBITDA(2) $ 1,775 $ 1,454Adjusted debt to adjusted EBITDA ratio 4.7 5.4
(1) Refer to the Non-GAAP financial measures section for definitions and reconciliations to the most comparable IFRS measures.(2) For the four-quarter trailing periods.
ADJUSTED DEBT(as at; in millions of dollars)
ADJUSTED EBIT TO ADJUSTED INTEREST RATIO(for fiscal years ended)
ADJUSTED DEBT TO ADJUSTED EBITDA RATIO(as at)
These global metrics do not represent the calculations required for bank covenants. They represent key business metrics and as such are used to analyze capital structure. For compliance purposes, management regularly monitors bank covenants to ensure they are met.

BOMBARDIER INC. FINANCIAL REPORT - FISCAL YEAR ENDED DECEMBER 31, 2014 - OVERVIEW 35
In addition to the above global metrics, management separately monitors the Corporation's net retirement benefit liability which amounted to $2.5 billion as at December 31, 2014 ($2.0 billion as at December 31, 2013). The measurement of this liability is dependent on numerous key long-term assumptions such as discount rates, future compensation increases, inflation rates and mortality rates. In recent years, this liability has been particularly volatile due to changes in discount rates. Such volatility is exacerbated by the long-term nature of the obligation. Management closely monitors the impact of the net retirement benefit liability on the Corporation's future cash flows and has introduced significant risk mitigation initiatives in recent years to gradually reduce key risks associated with the retirement benefit plans. (See the Retirement benefits section for further details.)
NON-GAAP FINANCIAL MEASURESThis MD&A is based on reported earnings in accordance with IFRS and on the following non-GAAP financial measures:
Non-GAAP financial measuresEBITDA Earnings before financing expense, financing income, income taxes, amortization and impairment
charges on PP&E and intangible assets.EBIT before specialitems
EBIT excluding the impact of restructuring charges, significant impairment charges and reversals,as well as other significant unusual items.
EBITDA before specialitems
EBIT before special items, amortization and impairment charges on PP&E and intangible assets.
Adjusted net income Net income excluding special items, accretion on net retirement benefit obligations, certain netgains and losses arising from changes in measurement of provisions and of financial instrumentscarried at FVTP&L and the related tax impacts of these items.
Adjusted EPS EPS calculated based on adjusted net income attributable to equity holders of Bombardier Inc.,using the treasury stock method, giving effect to the exercise of all dilutive elements.
Free cash flow Cash flows from operating activities less net additions to PP&E and intangible assets.Adjusted debt Long-term debt as presented in the consolidated statements of financial position adjusted for the
fair value of derivatives (or settled derivatives) designated in related hedge relationships plus saleand leaseback obligations and the net present value of operating lease obligations.
Adjusted EBIT EBIT before special items plus interest adjustment for operating leases and interest received (asper the supplemental information provided in the consolidated statements of cash flows, adjusted,if needed, for the settlement of fair value hedge derivatives before their contractual maturitydates).
Adjusted EBITDA Adjusted EBIT plus amortization and impairment charges on PP&E and intangible assets, andamortization adjustment for operating leases.
Adjusted interest Interest paid, as per the supplemental information provided in the consolidated statements ofcash flows, plus accretion expense on sale and leaseback obligations and interest adjustment foroperating leases.
Management believes that providing certain non-GAAP financial measures in addition to IFRS measures provides users of the consolidated financial statements with enhanced understanding of results and related trends and increases transparency and clarity of the core results of the business. For these reasons, a significant number of users of the MD&A analyze the Corporation's results based on these performance measures. EBIT before special items, EBITDA before special items, adjusted net income and adjusted EPS exclude items that do not reflect, in management's opinion, core performance and help users of the MD&A to better analyze results, enabling better comparability of these results from one period to another and with peers.
Non-GAAP financial measures are mainly derived from the consolidated financial statements but do not have standardized meanings prescribed by IFRS. The exclusion of certain items from non-GAAP performance measures does not imply that these items are necessarily non-recurring. From time to time, management may exclude additional items if they believe doing so would result in a more transparent and comparable disclosure. Other entities in the Corporation's industry may define the above measures differently than management does. In those cases, it may be difficult to compare the performance of those entities to the Corporation's based on these similarly-named non-GAAP measures.

36 BOMBARDIER INC. FINANCIAL REPORT - FISCAL YEAR ENDED DECEMBER 31, 2014
Reconciliations of non-GAAP financial measures to the most comparable IFRS financial measures are provided in the tables hereafter, except for the following reconciliations:
• EBIT before special items to EBIT – see the Results of operations table in BA, BT and the Consolidated results of operations section; and
• free cash flow usage to cash flows from operating activities – see the respective Free cash flow usage tables in BA and in BT and the Reconciliation of segmented free cash flow usage to cash flow from operating activities table in the Liquidity and capital resources section.
Reconciliation of EBITDA before special items and EBITDA to EBITFourth quarters
ended December 31Fiscal years
ended December 312014 2013 2014 2013
EBIT $ (1,201) $ 185 $ (566) $ 923Amortization 116 106 417 391Impairment charge on intangible assets(1) 1,266 — 1,266 —EBITDA 181 291 1,117 1,314Special items excluding impairment(2) 91 1 223 (30)EBITDA before special items $ 272 $ 292 $ 1,340 $ 1,284
Reconciliation of adjusted net income to net income (loss)Fourth quarters ended December 31
2014 2013(per share) (per share)
Net income (loss) $ (1,590) $ 97Adjustments to EBIT related to special items(1) 1,357 $ 0.78 1 $ —Adjustments to net financing expense related to:
Accretion on net retirement benefit obligations 19 0.01 28 0.02Net change in provisions arising from changes in interest ratesand net loss on certain financial instruments 12 0.01 7 —
Tax impact of special and other adjusting items 285 0.16 (4) —Adjusted net income $ 83 $ 129
Reconciliation of adjusted EPS to diluted EPS (in dollars)2014 2013
Diluted EPS $ (0.92) $ 0.05Impact of special and other adjusting items 0.96 0.02Adjusted EPS $ 0.04 $ 0.07
Reconciliation of adjusted net income to net income (loss)Fiscal years ended December 312014 2013
(per share) (per share)Net income (loss) $ (1,246) $ 572Adjustments to EBIT related to special items(2) 1,489 $ 0.86 (30) $ (0.02)Adjustments to net financing expense related to:
Loss on repurchase of long-term debt(2) 43 0.02 — —Accretion on net retirement benefit obligations 76 0.04 113 0.06Net change in provisions arising from changes in interest ratesand net loss (gain) on certain financial instruments 21 0.01 (22) (0.01)
Interest portion of gains related to special items(2) (8) — (12) —Tax impact of special and other adjusting items 273 0.16 (13) (0.01)Adjusted net income $ 648 $ 608
(1) Relates to the pause of the Learjet 85 program. Refer to Analysis of results in BA for further details.(2) Refer to the Analysis of results sections in Overview, BA and BT for details regarding special items.

BOMBARDIER INC. FINANCIAL REPORT - FISCAL YEAR ENDED DECEMBER 31, 2014 - OVERVIEW 37
Reconciliation of adjusted EPS to diluted EPS (in dollars)2014 2013
Diluted EPS $ (0.74) $ 0.31Impact of special and other adjusting items 1.09 0.02Adjusted EPS $ 0.35 $ 0.33
Reconciliation of adjusted debt to long-term debtAs at
December 31, 2014 December 31, 2013Long-term debt $ 7,683 $ 7,203Adjustment for the fair value of derivatives designated(or settled derivatives) in related hedge relationships (407) (293)
Long-term debt, net 7,276 6,910Sale and leaseback obligations 260 138Operating lease obligations(1) 865 864Adjusted debt $ 8,401 $ 7,912
(1) Discounted using the average five-year U.S. Treasury Notes plus the average credit spread, given the Corporation's credit rating, for the corresponding period.
Reconciliation of adjusted EBITDA and adjusted EBIT to EBITFiscal years
2014 2013EBIT $ (566) $ 923Special items(1) 1,489 (30)Interest received 298 36Interest adjustment for operating leases(2) 41 38Adjusted EBIT 1,262 967Amortization adjustment for operating leases(3) 96 96Amortization 417 391Adjusted EBITDA $ 1,775 $ 1,454
(1) Refer to Analysis of results in BA and BT for details of special items. (2) Represents the interest cost of a debt equivalent to operating lease obligations included in adjusted debt, bearing interest at the average
five-year U.S. swap rate plus the average credit default swap spread for the related period, given the Corporation's credit rating.(3) Represents a straight-line amortization of the amount included in adjusted debt for operating leases, based on a nine-year amortization
period.
Reconciliation of adjusted interest to interest paidFiscal years
2014 2013Interest paid $ 354 $ 303Accretion expense on sale and leaseback obligations 6 5Interest adjustment for operating leases(1) 41 38Adjusted interest $ 401 $ 346
(1) Represents the interest cost of a debt equivalent to operating lease obligations included in adjusted debt, bearing interest at the average five-year U.S. swap rate plus the average credit default swap spread for the related period, given the Corporation's credit rating.

38 BOMBARDIER INC. FINANCIAL REPORT - FISCAL YEAR ENDED DECEMBER 31, 2014
CONSOLIDATED FINANCIAL POSITION
The total assets for the fiscal year decreased by $1.7 billion including a decrease of $1.0 billion related to foreign exchange. The decrease excluding currency impacts is mainly explained by:
• a $739 million decrease in cash and cash equivalents. See the Variation in cash and cash equivalents table and Free cash flow in BA and BT for details;
• a $731 million increase in Advances and progress billings; and
• a $311 million decrease in deferred tax assets, mainly due to a write-down of deferred tax assets as a result of the charge recorded as a special item in relation to the pause of the Learjet 85 program.
Partially offset by:• a $644 million increase in gross inventory
following ramp-up of production ahead of deliveries in BT partly offset by a decrease in aerospace program work-in-process inventories.
CONSOLIDATED FINANCIAL POSITION - ASSETS
The total liabilities and equity for the fiscal year decreased by $1.7 billion including a decrease of liabilities of $886 million related to foreign exchange. The decrease excluding currency impacts is mainly explained by:
• a $2.4 billion decrease in equity, mainly due to the net loss for the fiscal year and an increase in net actuarial losses on retirement benefits; and
• a $529 million decrease in Advances and progress billings in excess of long-term contract inventories.
Partially offset by: • a $783 million increase in long-term debt,
mainly related to the $1.8 billion issuance of unsecured Senior Notes, partially offset by the redemption of the €785-million Senior Notes ($1.1 billion);
• a $579 million increase in Retirement benefit liability. See the Variation in net retirement benefit liability table for details;
• a $336 million increase in Trade and other payables in BT; and
• a $170 million increase in Provisions mainly due to provisions recorded related to the pause of the Learjet 85 program.
CONSOLIDATED FINANCIAL POSITION - LIABILITIES AND EQUITY
* Includes equity of $55 million.
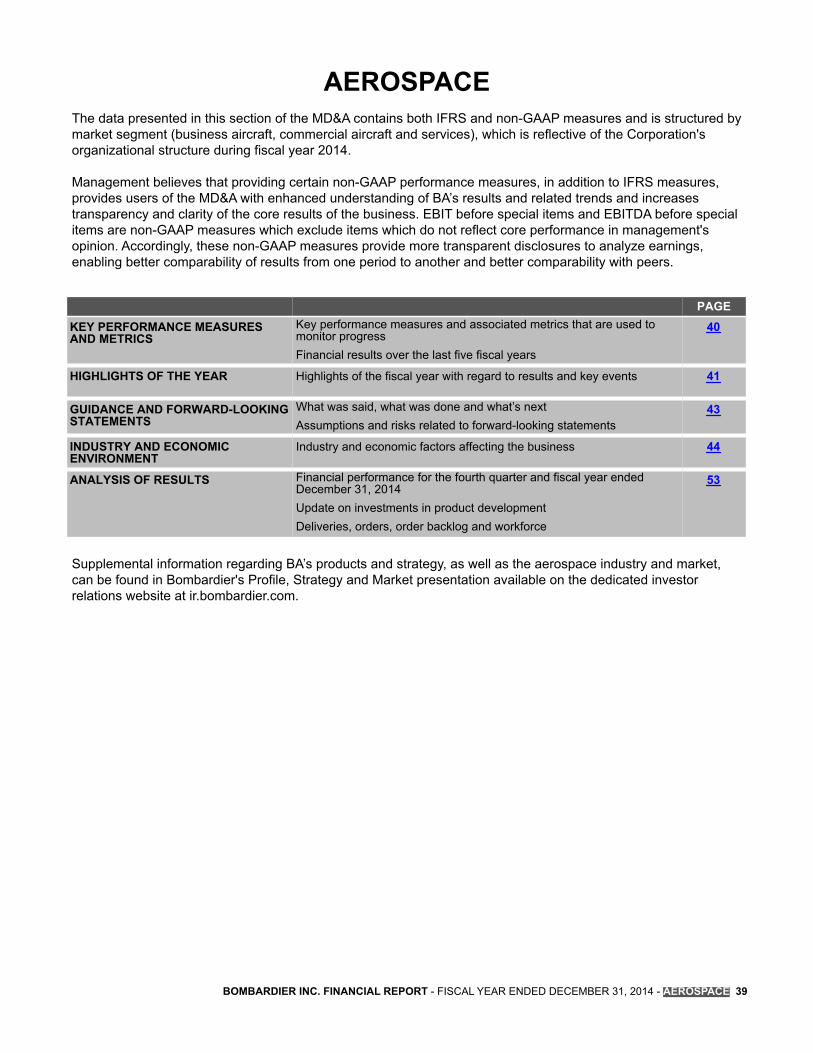
BOMBARDIER INC. FINANCIAL REPORT - FISCAL YEAR ENDED DECEMBER 31, 2014 - AEROSPACE 39
AEROSPACEThe data presented in this section of the MD&A contains both IFRS and non-GAAP measures and is structured by market segment (business aircraft, commercial aircraft and services), which is reflective of the Corporation's organizational structure during fiscal year 2014.
Management believes that providing certain non-GAAP performance measures, in addition to IFRS measures, provides users of the MD&A with enhanced understanding of BA’s results and related trends and increases transparency and clarity of the core results of the business. EBIT before special items and EBITDA before special items are non-GAAP measures which exclude items which do not reflect core performance in management's opinion. Accordingly, these non-GAAP measures provide more transparent disclosures to analyze earnings, enabling better comparability of results from one period to another and better comparability with peers.
PAGEKEY PERFORMANCE MEASURESAND METRICS
Key performance measures and associated metrics that are used to monitor progressFinancial results over the last five fiscal years
HIGHLIGHTS OF THE YEAR Highlights of the fiscal year with regard to results and key events
GUIDANCE AND FORWARD-LOOKINGSTATEMENTS
What was said, what was done and what’s nextAssumptions and risks related to forward-looking statements
INDUSTRY AND ECONOMICENVIRONMENT
Industry and economic factors affecting the business
ANALYSIS OF RESULTS Financial performance for the fourth quarter and fiscal year ended December 31, 2014Update on investments in product developmentDeliveries, orders, order backlog and workforce
Supplemental information regarding BA’s products and strategy, as well as the aerospace industry and market, can be found in Bombardier's Profile, Strategy and Market presentation available on the dedicated investor relations website at ir.bombardier.com.
40
41
43
44
53

40 BOMBARDIER INC. FINANCIAL REPORT - FISCAL YEAR ENDED DECEMBER 31, 2014
KEY PERFORMANCE MEASURES AND METRICSThe table below summarizes BA's most relevant key performance measures and associated metrics.
KEY PERFORMANCE MEASURES AND ASSOCIATED METRICSGrowth andcompetitivepositioning
• Order backlog, as a measure of future revenues. • Book-to-bill ratio(1), as an indicator of future revenues. • Revenues and delivery units, as measures of growth. • Market share (in terms of revenues and units delivered), as measures of competitive
positioning. Profitability • EBIT, EBIT margin, EBIT before special items(2) and EBIT margin before special items(2), as
measures of performance.Liquidity • Free cash flow(2), as a measure of liquidity generation. Customersatisfaction
• On-time aircraft deliveries, as a measure of meeting BA's commitment to customers. • Fleet dispatch reliability, as a measure of the products’ reliability. • Regional availability of parts and material to support customer requests, as a measure of
meeting customer needs for the entire life of the aircraft.Execution • Achievement of program development milestones, as a measure of flawless execution.
• Achievement of engagement and enablement targets, as a measure of employee engagement and motivation.
The incentive-based compensation plan for non-unionized employees across all BA sites rewards the collective efforts of employees in achieving objectives using performance indicator targets. A total of 18,200 employees worldwide, or 60% of permanent employees, participate in the program. In 2014, as part of this program, incentive-based compensation was linked to the achievement of targeted results, based on EBIT before special items, free cash flow, executing according to plan in new product development programs, on-time aircraft deliveries and fleet dispatch reliability. (1) Defined as net orders received over aircraft deliveries, in units.(2) Non-GAAP financial measures. Refer to the Non-GAAP financial measures section in Overview for definitions of these metrics. Refer to the
Analysis of results section for reconciliations to the most comparable IFRS measures.
Five-year summaryFor the fiscal years ended and as at December 31 December 31 December 31 December 31 January 31
2014 2013 2012 2011 (5) 2011Revenues $ 10,499 $ 9,385 $ 8,628 $ 8,594 $ 8,808Aircraft deliveries (in units)
Business aircraft 204 180 179 163 155Commercial aircraft 84 55 50 78 97Amphibious aircraft 2 3 4 4 4
290 238 233 245 256Net orders (in units) 282 388 481 249 201Book-to-bill ratio(1) 1.0 1.6 2.1 1.0 0.8Order backlog (in billions of dollars) $ 36.6 $ 37.3 $ 32.9 $ 23.9 $ 20.4EBIT $ (995) $ 418 $ 390 $ 491 $ 546EBIT margin (9.5)% 4.5% 4.5% 5.7% 6.2%EBIT before special items(2)(3) $ 437 $ 388 $ 367 $ 491 $ 546EBIT margin before special items(2)(3) 4.2 % 4.1% 4.3% 5.7% 6.2%Free cash flow (usage)(2) $ (1,059) $ (1,239) $ (867) $ (418) $ 3
Total number of employees(4) 34,100 37,700 35,500 33,600 30,300(1) Defined as net orders received over aircraft deliveries, in units.(2) Non-GAAP financial measures. Refer to the Non-GAAP financial measures section in Overview for definitions of these metrics. Refer to the
Analysis of results section for reconciliations to the most comparable IFRS measures.(3) Refer to the Analysis of results section for details of special items recorded in fiscal 2014 and 2013. The special item for the fiscal year
ended December 31, 2012 relates to a $23-million gain following the successful resolution of a litigation in connection with Part I.3 of the Canadian Income Tax Act, the Tax on Large Corporations.
(4) Including contractual and inactive employees.(5) The fiscal year ended December 31, 2011 comprises 11 months of results.

BOMBARDIER INC. FINANCIAL REPORT - FISCAL YEAR ENDED DECEMBER 31, 2014 - AEROSPACE 41
HIGHLIGHTS OF THE YEAR
Good revenue growth and significant investment in product development
REVENUESEBIT MARGIN
BEFORE SPECIAL ITEMS(1)
FREE CASH FLOW(1)NET ADDITIONS TO
PP&E & INTANGIBLEASSETS
ORDER BACKLOG
$10.5 billion 4.2% $(1.1) billion $1.9 billion $36.6 billion
RESULTSFor the fiscal years ended and as at December 31 2014 2013 VarianceRevenues $ 10,499 $ 9,385 11.9 %Aircraft deliveries (in units) 290 238 52Net orders (in units) 282 388 (106)Book-to-bill ratio(2) 1.0 1.6 nmfOrder backlog (in billions of dollars) $ 36.6 $ 37.3 (1.9)%EBIT $ (995) $ 418 nmfEBIT margin (9.5)% 4.5% nmfEBIT before special items(1) $ 437 $ 388 12.6 %EBIT margin before special items(1) 4.2 % 4.1% 10 bpsEBITDA before special items(1) $ 738 $ 655 12.7 %EBITDA margin before special items(1) 7.0 % 7.0% 0 bpsFree cash flow usage(1) $ (1,059) $ (1,239) 14.5 %Net additions to PP&E and intangible assets $ 1,857 $ 2,213 (16.1)%Net additions to aerospace program tooling $ 1,655 $ 1,983 (16.5)%
nmf: information not meaningfulbps: basis points
REVENUES(3)(4)
(for the fiscal years ended; in billions of dollars)
EBIT BEFORE SPECIAL ITEMS(1)(3)(5)
(for the fiscal years ended; in millions of dollars)
FREE CASH FLOW (USAGE)(1)(3)
(for the fiscal years ended; in millions of dollars)
ORDER BACKLOG(as at; in billions of dollars)
(1) Non-GAAP financial measures. Refer to the Non-GAAP financial measures section in Overview for definitions of these metrics and to the Analysis of results section for reconciliations to the most comparable IFRS measures.
(2) Defined as net orders received over aircraft deliveries, in units.(3) The fiscal year ended December 31, 2011 comprises 11 months of results.(4) Some totals do not agree due to rounding.(5) EBIT and EBIT margin of $546 million and 6.2%, $491 million and 5.7%, $390 million and 4.5%, $418 million and 4.5% and $(995) million
and (9.5%) for fiscal years ended January 31, 2011, December 31, 2011, December 31, 2012, December 31, 2013 and December 31, 2014, respectively. See the five-year summary on the prior page and the Analysis of results section for details regarding special items.

42 BOMBARDIER INC. FINANCIAL REPORT - FISCAL YEAR ENDED DECEMBER 31, 2014
KEY EVENTS
New organizational structure• On July 23, 2014, a new organizational structure was announced. The previous Bombardier Aerospace has
been divided into three reporting segments: Bombardier Business Aircraft, Bombardier Commercial Aircraft and Bombardier Aerostructures and Engineering Services. These segments now report directly to the President and CEO in order to enhance agility. This new structure is effective as of January 1, 2015.
Business aircraft• Subsequent to the end of the fiscal year, on January 15, 2015, Bombardier announced the pause of its
Learjet 85 business aircraft program. The pause follows a downward revision of Bombardier’s business aircraft market forecast, primarily due to the continued weakness of the light aircraft category since the economic downturn. As a result, the Company has recorded a pre-tax charge in special items in the fourth quarter of 2014 of $1.4 billion ($1.6 billion after tax), mainly related to the impairment of Learjet 85 development costs.
• On June 27, 2014, the Challenger 350 aircraft entered into service.• In October 2014, BA launched the new Challenger 650 aircraft, the evolution of the Challenger 605 aircraft.
EIS is scheduled in the second half of 2015.
Commercial aircraft • The first four CS100 FTVs continue with flight testing activities. On-the-ground testing activities on FTV5 are
ongoing and FTV5 is expected to be handed over to the flight test team by the end of the first quarter of 2015. The first CS300 FTV has been handed over to the flight test team and is being readied for its first flight which is expected to take place by the end of the first quarter of 2015.
• As at the date of this report, the number of firm orders and other agreements(1) for the CSeries family of aircraft reached 563 with 21 customers in 18 countries, including 243 firm orders:• In January 2014, a firm order for 16 CS300 aircraft with options for an additional 10 CS300 aircraft was
signed with Al Qahtani Aviation Company from the Kingdom of Saudi Arabia. Based on list price, the firm order is valued at approximately $1.2 billion.
• In September 2014, a firm order for 40 CS300 aircraft with options for an additional 10 CS300 aircraft was signed with a wholly owned affiliate of Macquarie AirFinance. Based on list price, the firm order is valued at approximately $3.1 billion.
• In December 2014, American Airlines, Inc., a wholly owned subsidiary of American Airlines Group Inc., converted 24 options for CRJ900 NextGen aircraft into a firm order. Based on list price, the firm order is valued at approximately $1.1 billion.
Workforce reductions• During the fiscal year 2014, workforce reductions were undertaken at BA for a total of approximately 3,700
employees. Related charges totaling $85 million were recorded as special items in 2014. • Subsequent to the end of the fiscal year, in January 2015, as a result of the decision to pause the Learjet 85
business aircraft program, BA announced a workforce reduction of approximately 1,000 employees at the sites in Querétaro, Mexico, and Wichita, United States. A severance provision of approximately $20 million will be recorded as a special item during the first quarter of 2015.
(1) The other agreements consist of conditional orders, letters of intent, options and purchase rights.

BOMBARDIER INC. FINANCIAL REPORT - FISCAL YEAR ENDED DECEMBER 31, 2014 - AEROSPACE 43
GUIDANCE AND FORWARD-LOOKING STATEMENTS
2014 Performance2014 Guidance 2014 Performance
Profitability EBIT margin of approximately 5%. EBIT margin before special items(1) of 4.2%. Liquidity Cash flows from operating activities between $1.2
billion and $1.6 billion.Cash flows from operating activities of $798 million.
Net additions to PP&E and intangible assets between$1.6 billion and $1.9 billion.
Net additions to PP&E and intangible assets of $1.9 billion.
2015 net additions to PP&E and intangible assetsbetween $1.2 billion and $1.5 billion.
See the 2015 guidance below for updates on expectednet additions to PP&E and intangible assets for 2015.
2016 net additions to PP&E and intangible assetsbelow $1.0 billion.
Previously issued guidance on net additions to PP&Eand intangible assets for 2016 is withdrawn. Seebelow for details.
Deliveries Approximately 200 business aircraft. 204 business aircraft deliveries.Approximately 80 commercial aircraft. 84 commercial aircraft deliveries.
The EBIT margin before special items(1) was lower than the guidance, mainly due to pricing pressure on new aircraft sold, increased provisions for credit and residual value guarantees as well as a decrease in fair value of used aircraft.
Cash flows from operating activities were lower than the guidance, mainly due to a lower level of customer advances, a lower EBIT and an increase in used aircraft inventory.
The guidance provided in the 2013 financial report with respect to BA's level of net additions to PP&E and intangible assets for 2016 has been withdrawn due to uncertainty with respect to longer term projections. (1) Non-GAAP financial measures. Refer to the Non-GAAP financial measures section in Overview for definitions of these metrics and to the
Analysis of results section for reconciliations to the most comparable IFRS measures.
2015 Guidance
Bombardier Business Aircraft2015 Guidance(1)
Profitability EBIT margin of approximately 7%, an improvement of approximately 1% compared to 2014.Liquidity Cash flows from operating activities between $1.0 billion and $1.4 billion.
Net additions to PP&E and intangible assets of approximately $1.0 billion.
Deliveries Approximately 210 aircraft deliveries.
Bombardier Commercial Aircraft2015 Guidance(1)
Profitability Negative EBIT of approximately $200 million including the dilutive impact of the initial years of production of the CSeries program.(2)
Liquidity Neutral cash flows from operating activities.
Net additions to PP&E and intangible assets of approximately $900 million.
Deliveries Approximately 80 aircraft deliveries.(1) See Forward-looking statements on the following page.(2) Includes the dilutive impact of the CSeries program including the write-down of inventory to net realizable value. Early production units in a
new program incur higher costs and generally have lower selling prices than units produced later in the program's life cycle.

44 BOMBARDIER INC. FINANCIAL REPORT - FISCAL YEAR ENDED DECEMBER 31, 2014
Bombardier Aerostructures and Engineering Services2015 Guidance(1)
Profitability EBIT margin of approximately 4%.Liquidity Neutral cash flows from operating activities.
Net additions to PP&E and intangible assets of approximately $100 million.Revenues Revenues of approximately $1.8 billion, mainly from internal contracts with Business and Commercial Aircraft
segments.(1) See Forward-looking statements below.
The overall increase to $2.0 billion in expected net additions to PP&E and intangible assets for 2015 compared to the previous guidance provided in the 2013 financial report of between $1.2 billion and $1.5 billion is mainly due to increased anticipated additions to intangible assets related to the CSeries, Global 7000 and 8000 aircraft programs, partially offset by lower additions related to the Learjet 85 as a result of the decision to pause the aircraft program.
Forward-looking statements:Forward-looking statements(2) in this section of the MD&A are based on:
• current firm order backlog and estimated future order intake;(3)
• a similar level of aircraft deliveries and improved pricing in fiscal year 2015 compared to fiscal year 2014;
• continued deployment and execution of strategic initiatives related to quality improvement and cost reductions;
• the ability to meet scheduled EIS dates and planned costs for new aircraft programs;
• the ability to recruit and retain highly skilled resources to deploy the product development strategy;
• the ability of the supply base to support planned production rates; and
• stability of foreign exchange rates.(2) Also see the Guidance and forward-looking statements section in Overview.(3) Demand forecast is based on the analysis of main market indicators, including real GDP growth, industry confidence, wealth creation
and profitability within BA customer base, aircraft utilization, pre-owned business jet inventory levels, pilot scope clauses, environmental regulations, globalization of trade, replacement demand, new aircraft programs and non-traditional markets and their accessibility. For more details, refer to the market indicators in the Industry and economic environment section.
INDUSTRY AND ECONOMIC ENVIRONMENT
Strong long-term potentialThe state of the world economy and those of individual countries are key factors in the demand for air travel. As such, the health of the aerospace industry is a function of general economic conditions, with a lag typically between economic recovery and the time it takes to reflect on the original equipment manufacturers’ deliveries and revenues. Real GDP growth is a widely accepted measure of economic activity.
Worldwide real GDP increased by 2.6% in 2014, which is slightly higher compared to the increase of 2.5% in 2013, but lower than the anticipated 3.2% increase. The world economy is predicted to grow by 2.8% in 2015.(1)
The GDP in the U.S., the largest market for business and commercial aircraft, is expected to grow at 3.1% in 2015, compared to the 2.4% GDP growth in 2014. In Europe, BA's second largest market in terms of sales, the GDP is expected to grow by 1.8% in 2015, compared to the 1.4% GDP growth in 2014.(1)
In regions with high growth potential for business and commercial aviation, growth in 2015 is expected to be at 6.5% and 6.7% for China and India, respectively. The CIS are expected to decline by 2.2%. In 2014, the GDP growth was at 7.3%, 5.9% and 0.8% for China, India and the CIS, respectively.(1) (1) According to IHS Global Insight’s Comparative World Overview dated January 15, 2015.
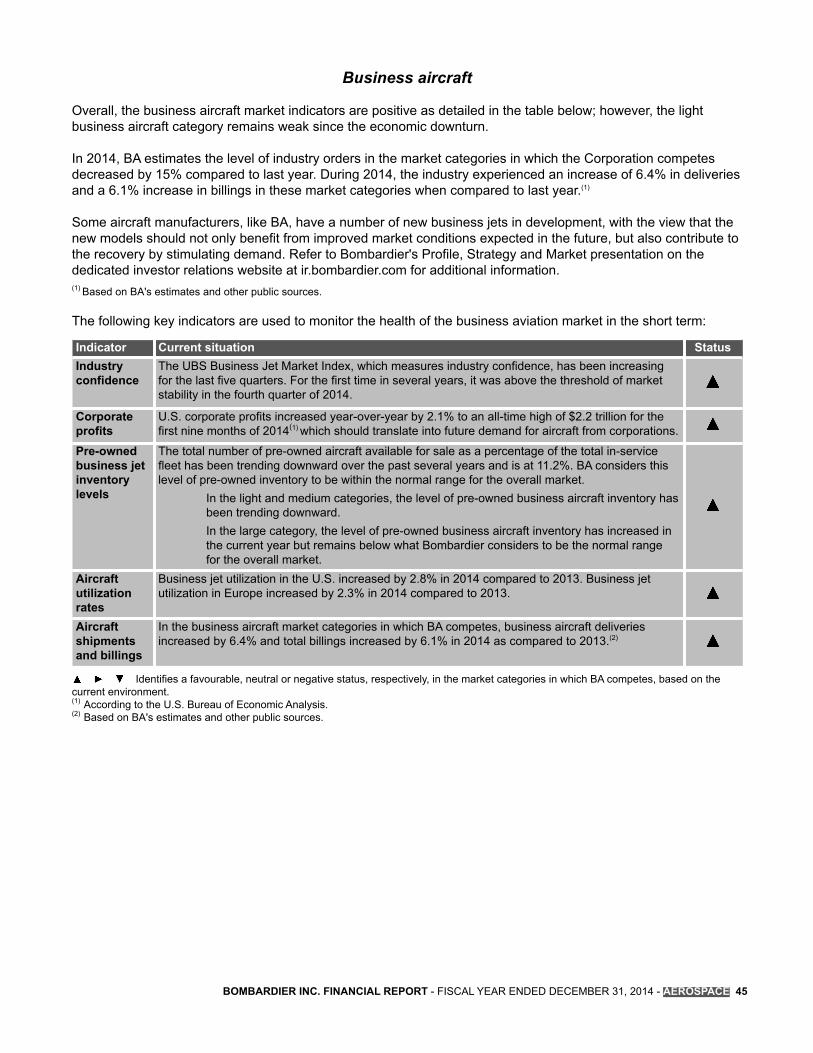
BOMBARDIER INC. FINANCIAL REPORT - FISCAL YEAR ENDED DECEMBER 31, 2014 - AEROSPACE 45
Business aircraft
Overall, the business aircraft market indicators are positive as detailed in the table below; however, the light business aircraft category remains weak since the economic downturn.
In 2014, BA estimates the level of industry orders in the market categories in which the Corporation competes decreased by 15% compared to last year. During 2014, the industry experienced an increase of 6.4% in deliveries and a 6.1% increase in billings in these market categories when compared to last year.(1)
Some aircraft manufacturers, like BA, have a number of new business jets in development, with the view that the new models should not only benefit from improved market conditions expected in the future, but also contribute to the recovery by stimulating demand. Refer to Bombardier's Profile, Strategy and Market presentation on the dedicated investor relations website at ir.bombardier.com for additional information.(1) Based on BA's estimates and other public sources.
The following key indicators are used to monitor the health of the business aviation market in the short term:
Indicator Current situation StatusIndustryconfidence
The UBS Business Jet Market Index, which measures industry confidence, has been increasingfor the last five quarters. For the first time in several years, it was above the threshold of marketstability in the fourth quarter of 2014.
Corporateprofits
U.S. corporate profits increased year-over-year by 2.1% to an all-time high of $2.2 trillion for the first nine months of 2014(1) which should translate into future demand for aircraft from corporations.
Pre-ownedbusiness jetinventorylevels
The total number of pre-owned aircraft available for sale as a percentage of the total in-service fleet has been trending downward over the past several years and is at 11.2%. BA considers this level of pre-owned inventory to be within the normal range for the overall market.
In the light and medium categories, the level of pre-owned business aircraft inventory has been trending downward. In the large category, the level of pre-owned business aircraft inventory has increased in the current year but remains below what Bombardier considers to be the normal range for the overall market.
Aircraftutilizationrates
Business jet utilization in the U.S. increased by 2.8% in 2014 compared to 2013. Business jetutilization in Europe increased by 2.3% in 2014 compared to 2013.
Aircraftshipmentsand billings
In the business aircraft market categories in which BA competes, business aircraft deliveries increased by 6.4% and total billings increased by 6.1% in 2014 as compared to 2013.(2)
Identifies a favourable, neutral or negative status, respectively, in the market categories in which BA competes, based on the current environment. (1) According to the U.S. Bureau of Economic Analysis.(2) Based on BA's estimates and other public sources.

46 BOMBARDIER INC. FINANCIAL REPORT - FISCAL YEAR ENDED DECEMBER 31, 2014
UBS BUSINESS JET MARKET INDEX(1) (for calendar quarters; average on a 100-point scale)
PRE-OWNED BUSINESS JET INVENTORY (for calendar years; as a percentage of total business jet fleet, excluding very light jets)
Source: UBS(1) The UBS Business Jet Market Index is a measure of market
confidence from industry professionals, gathered through bi-monthly surveys of brokers, dealers, manufacturers, fractional providers, financiers and others.
Sources: JETNET and Ascend Online
Shaded area indicates what BA considers to be a normal range of pre-owned business jet inventory available for sale, i.e. between 11% and 14%.
U.S. BUSINESS JET UTILIZATION (for calendar years; in thousands of departures and arrivals for all business jets)
EUROPEAN BUSINESS JET UTILIZATION (for calendar years; in thousands of departures and arrivals for all business jets)
Source: U.S. Federal Aviation Administration (FAA) website Source: Eurocontrol
Short-term outlook
Despite current favorable trends in the key indicators above, the business aviation market experiences a delay in the timing of the market upturn and BA anticipates that the light business aircraft category will continue to be weak in the short-term.
Long-term outlook
BA believes that the long-term market drivers of growth for the business jet industry, such as GDP growth, globalization of trade, fleet replacement, new aircraft programs and growth in non-traditional markets, remain solid. The continued wealth creation in major non-traditional markets, coupled with aviation infrastructure development, is expected to accelerate the use of business aircraft dramatically from levels seen today.

BOMBARDIER INC. FINANCIAL REPORT - FISCAL YEAR ENDED DECEMBER 31, 2014 - AEROSPACE 47
Bombardier estimates 22,000 aircraft deliveries in the light to large categories for the 20-year period from 2014 to 2033, valued at $617 billion in constant 2013 U.S. dollars.(1) The worldwide business aircraft fleet is expected to more than double from 15,200 aircraft at the end of 2013 to 32,450 aircraft in 2033. North America is expected to receive the greatest number of new business jet deliveries in the 20-year period with 8,760 aircraft, followed by Europe with 3,575 aircraft. Notably, China is expected to become the third largest market for business jet deliveries, with 2,225 deliveries between 2014 and 2033. BA also expects other key growth markets in non-traditional economies to receive a significant share of business jet deliveries during the next 20 years.(2)
BUSINESS AIRCRAFT FLEET EVOLUTION BY GEOGRAPHIC REGION(2)
(for calendar years 2014 to 2033; in units)
BUSINESS AIRCRAFT DELIVERIES FORECAST BY CATEGORY(2)
(for calendar years 2014 to 2033; in billions of constant 2013 U.S. dollars and in units)
*Includes 330, 130 and 30 retirements for Europe, the Other Asia-Pacific and China regions, respectively.
(1) Average worldwide GDP growth for the 20-year period is expected to be approximately 3.3%.(2) As stated in BA's Business Aircraft Market Forecast, published in July 2014 and available on Bombardier’s dedicated investor relations
website at ir.bombardier.com.
Commercial aircraft
The commercial aircraft market is building momentum. Passenger traffic levels and forecast airline financial performance have improved in 2014 and industry deliveries of aircraft in the 20- to 149-seat category have increased by 17.6% compared to last year.(1) The economic environment is improving in the U.S., the largest market for Bombardier's aircraft, and in most emerging economies, while some countries in Europe continue to lag.
Airline financial performance improved in all regions during the year, particularly in the U.S. where the improvement was driven by airline mergers.(2)
One significant market constraint, particularly evident in North America, has been “scope clauses” negotiated between network carriers and their unionized pilots. These contractual agreements restrict the use, number and seating capacity of regional aircraft flying on behalf of a network carrier. Orders for large regional aircraft are stimulated by the relaxation of restrictions defined by scope clauses. Over the next 20 years, the assumption - based on historical evidence - is that scope clauses are expected to continue to evolve, allowing the operation of larger regional aircraft by regional carriers. This evolution is driven by network airlines’ goals for cost efficiency and continued network coverage.(1) BA's estimates based on delivery data available from Ascend and other public sources.(2) Per IATA’s forecast for 2014 in the Economic Performance of the Airline Industry 2014 year-end report.

48 BOMBARDIER INC. FINANCIAL REPORT - FISCAL YEAR ENDED DECEMBER 31, 2014
The following key indicators are used to monitor the health of the commercial airline industry in the short term:
Indicator Current situation StatusPassengertraffic levels
The demand for new aircraft is primarily driven by the demand for air travel. Scheduled domestic and international passenger traffic, measured by revenue passenger kilometres (“RPK”), were 5.3% and 6.1% higher, respectively, for the year-to-date period ended November 2014 compared to the same period last year.(1) Airlines achieved both domestic and international average passenger load factors of 80.7% and 79.3%, respectively, for the year-to-date period ended November 2014 compared to 80.0% and 79.4%, respectively, for the same period last year. Continued increases in traffic over recent months resulted in upward movement of domestic load factors. Yields in the U.S., defined as average passenger revenue per revenue passenger kilometre, slightly increased in 2014 compared to 2013.(1) During 2014, regional passenger traffic measured by RPK for the four leading U.S. network carriers and their affiliates, which represent a major portion of the regional airline passenger traffic in the U.S., BA's largest market, remained essentially unchanged compared to fiscal year 2013. These airlines achieved an average passenger load factor of 80.6% for the year-to-date period ended December 2014, up from the 79.0% experienced in the same period last year.
Fuel prices Planning is difficult for airlines when the price for one of the largest components of their operating costs remains volatile. The average annual price of Brent crude oil decreased from $106 per barrel in 2013 to a $99 per barrel in 2014.(2)
. The price of Brent crude oil has dropped significantly in the last quarter of fiscal 2014 and as at the date of this report was at $56 per barrel. Although some airlines may delay their decision to renew their fleet, in the short term, this should help improve airline profitability, which in turn would provide an opportunity for airlines to reinvest in their fleets. The high volatility in crude oil prices should result in continued demand for more fuel efficient aircraft.
Airlineprofitability
Airline financial performance continued to improve in 2014. Airline profits are forecast to total $19.9 billion in 2014, a fifth consecutive year of positive net profits for the industry. North American airlines are forecast to generate the highest profit in terms of dollars and profit margins due to a combination of consolidation, a more efficient industry and an improving economy, followed by airlines in the Asia-Pacific region. European airlines are expected to generate the third highest net profit but lower profit margins than airlines in the Middle East, Latin America and Asia-Pacific. Airline financial performance is expected to increase to total profits of $25.0 billion in 2015.(3)
Environ-mentalregulations
Environmental issues and new environmental regulation should increasingly shape the world’s airline industry. These issues can be broadly categorized as: local air quality, aircraft emissions and community noise. The aviation industry has consistently improved its environmental performance throughout its history and is expected to continue to do so. The aviation industry has committed to carbon-neutral growth by 2020 and a 50% reduction in carbon emissions from 2005 levels by 2050. The application of new technology in aircraft designs is expected to be important in meeting these commitments and should speed up retirement of older aircraft worldwide.(4)
Aircraftshipments
In 2014, there were 327 deliveries for the industry of aircraft in the 20- to 149-seat category, an increase of 17.6% compared to 2013.(5)
Replace-mentdemand
Bombardier estimates that most commercial aircraft have life cycles ranging between 15 to 30 years. At the end of 2014, approximately 3,600 aircraft representing an estimated 37% of the world’s active fleet in the 20- to 149-seat aircraft category were over 15 years old compared to approximately 3,380 aircraft representing 34% at the end of 2013.(6)
Identifies a favourable, neutral or negative status, respectively, in the market categories in which BA competes, based on the current environment. (1) Per IATA’s November 2014 Air Passenger Market Analysis and Airlines Financial Monitor reports. (2) According to the U.S. Energy Information Administration’s (EIA) 2014 Annual Energy Outlook.(3) Per IATA's Economic Performance of the Airline Industry 2014 year-end report.(4) According to BA's Commercial Aircraft Market Forecast, published in July 2014 and available on Bombardier’s dedicated investor relations
website at ir.bombardier.com.(5) BA's estimates based on delivery data available from Ascend and other public sources.(6) Based on data obtained from Ascend fleet database. Comparative figures have been restated to reflect passenger aircraft only and to
exclude aircraft in business, executive, freight, specialized or missionized configurations or aircraft in storage.

BOMBARDIER INC. FINANCIAL REPORT - FISCAL YEAR ENDED DECEMBER 31, 2014 - AEROSPACE 49
FUEL PRICES (Brent crude oil prices; in dollars per barrel)
GLOBAL AIRLINES’ NET PROFIT (LOSS) (for calendar years; in billions of dollars)
Source: U.S. EIA Source: IATA Financial Forecast, December 2014F: Forecast
Short-term outlook
The world economy is projected to grow by 2.8%, 3.2% and 3.3% over each of the next three years.(1) Historically, as the world economy improves, demand for air travel increases and order intake follows. BA believes that the market for larger regional aircraft and smaller mainline aircraft should grow in North America as airlines continue to focus on fleet optimization, efficiency and reducing environmental impacts.
In Europe, GDP is expected to grow at only 1.8% in 2015. In this context, BA does not expect much growth in demand for regional aircraft in Europe in 2015. For 2016 and 2017, the expected growth is at 2.1%.(1) European airlines are likely to continue to focus on consolidation and operational restructuring.
The strong correlation between passenger traffic and economic growth in non-traditional markets should translate into continued aircraft demand in the near future. This demand is expected to be met by a combination of pre-owned and new aircraft.(1) According to IHS Global Insight’s Comparative World Overview dated January 15, 2015.

50 BOMBARDIER INC. FINANCIAL REPORT - FISCAL YEAR ENDED DECEMBER 31, 2014
Long-term outlook(1)
Bombardier remains confident that continuing economic growth should increase demand for air travel over the next 20 years. The financial outlook for the world’s airlines is improving as economic growth returns to most regions.
BA estimates 13,100 new aircraft deliveries for the 20- to 149-seat commercial aircraft category for the 20-year period from 2014 to 2033 valued at $658 billion in constant 2013 U.S. dollars.
WORLDWIDE FLEET FORECAST FOR 20- TO 149-SEAT COMMERCIAL AIRCRAFT(1)
(for calendar years 2014 to 2033; in units)
20- TO 149-SEAT COMMERCIAL AIRCRAFT DELIVERIES FORECAST BY REGION(1)
(for calendar years 2014 to 2033; in units)
Most new 20- to 149-seat aircraft deliveries to mature aviation markets such as North America, Europe, Oceania and Northeast Asia (Japan and South Korea) are expected to replace retiring aircraft fleets.
In emerging markets, demand for air travel is growing with increasing GDP and an expanding middle class. The airline industries in the emerging regions of Asia-Pacific, Greater China, India, Latin America and the CIS are at different stages of maturity, but all are expected to require aircraft with different seat capacities and operating economics to meet passenger demand. Fleet growth is expected to drive the majority of new 20- to 149-seat aircraft deliveries to emerging regions.
The 60- to 99-seat aircraft market should see substantial growth over the forecast period with delivery demand for 5,600 aircraft worth $185 billion. The outsourcing of regional aircraft operations to carriers with low-cost structures, namely regional airlines, continues to be the main thrust of network optimization efforts. Generally, regional airlines act as contractors for mainline airlines by connecting passengers from smaller cities to mainline hubs, thereby providing market access to smaller cities that would otherwise be cost-prohibitive to serve using larger mainline aircraft. Large regional jets and turboprops should become an increasingly important tool for network connectivity. Some of the fleet growth in this segment should be a result of airlines moving towards larger aircraft with more seat capacity, lower seat-kilometre costs and flexible cabins. Overall, demand for regional aircraft in the 60- to 99-seat aircraft market is expected to be evenly split in terms of units between turboprops and jets.
The 100- to 149-seat aircraft segment is expected to enjoy the strongest growth, with delivery demand for 7,100 aircraft worth $465 billion. This segment has not been the focus of aircraft development for at least the past two decades. The arrival of new-technology, clean-sheet design aircraft optimized for the 100- to 149-seat segment is expected to accelerate the economic obsolescence of previous-generation aircraft.(1) According to BA's Commercial Aircraft Market Forecast, published in July 2014 and available on Bombardier’s dedicated investor relations
website at ir.bombardier.com.

BOMBARDIER INC. FINANCIAL REPORT - FISCAL YEAR ENDED DECEMBER 31, 2014 - AEROSPACE 51
Customer services
BA's worldwide customer services network includes parts hubs, parts depots, authorized service facilities (“ASF”), line maintenance facilities (“LMF”), service centres, regional support offices (“RSO”), customer response centres (“CRC”), customer response teams (“CRT”), as well as training centres and authorized training providers (“ATP”).
Supplemental information regarding BA's support locations can be found in Bombardier's Profile, Strategy and Market presentation available on the dedicated investor relations website at ir.bombardier.com.
The demand for customer services is driven by the size of the fleet of Bombardier aircraft, by the number of hours flown by said fleet (aircraft utilization rates) and the average age of the fleet.
Customer services market indicators
Indicator Current situation StatusInstalledbase
The installed base for active in-service Bombardier commercial aircraft remained essentially at the same level in 2014 compared to 2013 with approximately 2,210 aircraft. The installed base for active in-service Bombardier business aircraft increased by 3.8% in 2014 compared to 2013 and is standing at more than 4,400 aircraft at the end of 2014.(1)
Aircraftutilizationrates
Based on BA's estimates, Bombardier aircraft fleet utilization, measured by the average hoursflown per aircraft, decreased by approximately 1.0% for commercial aircraft for the year-to-dateperiod ended October 31, 2014 compared to the same period last year mainly due to aircraftbeing transferred from one airline to another during the restructuring of the airline industry in theU.S. The business aircraft fleet utilization increased by approximately 2.0% for the year-to-dateperiod ended December 31, 2014, compared to the same period last year.
Averageage of fleet
Typically, aircraft direct maintenance costs increase as an aircraft ages. Therefore, the average age of the fleet of Bombardier aircraft is expected to impact the size of the maintenance market. There has been a slight increase in the average age of the Bombardier commercial aircraft fleet in 2014 compared to 2013. There was no significant change in the average age of the Bombardier business aircraft fleet in 2014 compared to 2013.(1)
Identifies a favourable, neutral or negative status, respectively, in the market categories in which BA competes, based on the current environment.(1) Based on data obtained from Ascend fleet database.
Short-term outlook
Based on the market indicators above, the demand for spare parts and service programs is expected to grow. Bombardier continues to actively seek out strategic locations for expansion in order to move closer to customers, improve response times and build stronger relationships around the globe.
Historically, the U.S. represented the largest share of deliveries for both business and commercial aircraft, however, wealth creation and economic development in non-traditional markets is driving a shift in the proportion of business and commercial aircraft delivered outside of the U.S. This trend in demand impacts the geographical layout of BA's support network. In the non-traditional markets, the strategy is to increase the Corporation's local customer support presence and leverage on third-parties to deploy the full span of services.

52 BOMBARDIER INC. FINANCIAL REPORT - FISCAL YEAR ENDED DECEMBER 31, 2014
Long-term outlook
The continued growth of the installed base is expected to stimulate demand for customer services. While traditional markets such as North America and Europe should dominate in terms of market size, the fleet growth in non-traditional markets is accelerating and creating new opportunities for customer services.
In the next 10 years, business aircraft industry deliveries should see the highest growth rates in emerging economies such as China and India. This growing demand along with Bombardier's customer support offerings is expected to drive growth outside of traditional markets.(1)
A key driver of the maintenance, repair and overhaul (“MRO”) market is aircraft utilization. The size of the commercial aircraft aviation MRO market is greater than that of the business and general aviation MRO market due to the significantly higher utilization of commercial aircraft. With respect to the commercial aircraft market, the global air transport MRO market in 2014 was expected to be approximately $58 billion for a current total global fleet of approximately 23,000 aircraft, over 25% of which are turboprops and regional jets. The global MRO market for commercial aircraft is expected to grow to approximately $87 billion by 2024, representing a 4.2% CAGR over the 10-year period. North America will remain the single largest region for the MRO value; however, Asia (including Asia-Pacific, China, and India) is expected to constitute the largest share of the MRO market in 2024.The growth will vary by region, with the highest growth rates expected in India and China. The lowest rates (those below the total MRO market CAGR of 4.2%) are expected in developed regions such as North America and Western Europe.(2)
(1) As stated in BA's Business Aircraft Market Forecast, published in July 2014 and available on Bombardier’s dedicated investor relations website at ir.bombardier.com.
(2) According to the January 2014 Global MRO Market Economic Assessment Air Transport report by Team SAI.

BOMBARDIER INC. FINANCIAL REPORT - FISCAL YEAR ENDED DECEMBER 31, 2014 - AEROSPACE 53
ANALYSIS OF RESULTS
Strong revenue growthResults of operations
Fourth quarters ended December 31
Fiscal years ended December 31
2014 2013 2014 2013RevenuesManufacturing
Business aircraft $ 2,038 $ 1,544 $ 5,744 $ 5,038Commercial aircraft 503 467 1,956 1,248Other 153 184 537 550
Total manufacturing 2,694 2,195 8,237 6,836Services(1) 419 508 1,619 1,897Other(2) 213 170 643 652
Total revenues 3,326 2,873 10,499 9,385Cost of sales 2,973 2,535 9,148 8,118Gross margin 353 338 1,351 1,267SG&A 182 176 672 699R&D 61 47 199 173Other expense(3) 56 21 43 7EBIT before special items(4) 54 94 437 388Special items(5) 1,357 1 1,432 (30)EBIT (1,303) 93 (995) 418Amortization(6) 88 74 301 267Impairment charge on intangible assets(7) 1,266 — 1,266 —EBITDA(4) $ 51 $ 167 $ 572 $ 685EBITDA before special items(4) $ 142 $ 168 $ 738 $ 655(as a percentage of total revenues)Gross margin 10.6 % 11.8% 12.9 % 13.5%EBIT before special items 1.6 % 3.3% 4.2 % 4.1%EBIT (39.2)% 3.2% (9.5)% 4.5%EBITDA before special items 4.3 % 5.8% 7.0 % 7.0%EBITDA 1.5 % 5.8% 5.4 % 7.3%
(1) Includes revenues from parts services, Flexjet fractional ownership and hourly flight entitlement programs’ service activities (prior to disposal on December 4, 2013), product support activities (including aircraft maintenance and commercial training), Specialized Aircraft Solutions and Military Aviation Training.
(2) Includes mainly sales of pre-owned aircraft.(3) Includes i) net loss (gain) on certain financial instruments measured at fair value and changes in estimates related to certain provisions or
certain financial instruments, excluding the losses (gains) arising from changes in interest rates; ii) severance and other involuntary termination costs (including changes in estimates); and iii) (gains) loss on disposals of PP&E; except when such items are reported as special items.
(4) Non-GAAP financial measures. Refer to the Non-GAAP financial measures section in Overview for definitions of these metrics.(5) Refer to the Special items section hereafter.(6) Amortization is included in cost of sales, SG&A and R&D expense based on the underlying function of the asset. (7) Relates to the pause of the Learjet 85 program. Refer to the Special items section hereafter.
Revenues by geographic region(1)
Fiscal years ended December 312014 2013
North America $ 5,215 50% $ 5,503 59%Europe 1,959 19% 2,036 22%Asia-Pacific 1,620 15% 1,170 12%Rest of world(2) 1,705 16% 676 7%
$ 10,499 100% $ 9,385 100%(1) Revenues are attributed to countries based on the location of the customer.(2) The Rest of world region includes South America, Central America, Africa, the Middle East and the CIS.

54 BOMBARDIER INC. FINANCIAL REPORT - FISCAL YEAR ENDED DECEMBER 31, 2014
Total aircraft deliveriesFourth quarters
ended December 31Fiscal years
ended December 31(in units) 2014 2013 2014 2013Business aircraft 78 60 204 180Commercial aircraft 22 21 84 55Amphibious aircraft 1 2 2 3
101 83 290 238
BUSINESS AIRCRAFT DELIVERIES(1)
(for the fiscal years ended; in units)COMMERCIAL AIRCRAFT DELIVERIES(1)
(for the fiscal years ended; in units) REVENUE DISTRIBUTION BY GEOGRAPHIC REGION(2) (for the fiscal years ended)
(1) The fiscal year ended December 31, 2011 comprises 11 months of results.(2) Revenues are attributed to countries based on the location of the customer.
Manufacturing revenuesThe $499 million increase for the three-month period is mainly due to higher revenues from business aircraft ($494 million).
The $1.4 billion increase for the fiscal year is mainly due to: • higher revenues from commercial aircraft ($708 million), mainly due to higher deliveries of regional jets,
partially offset by lower deliveries of turboprops; and• higher revenues from business aircraft ($706 million), mainly due to higher deliveries in all business
aircraft categories and a favorable mix.
Services revenuesThe $89 million decrease for the three-month period is mainly due to the sale of Flexjet’s fractional ownership and hourly flight entitlement programs’ service activities in the fourth quarter of 2013 and lower volume of activities for product support.
The $278 million decrease for the fiscal year is mainly due to the sale of Flexjet’s fractional ownership and hourly flight entitlement programs’ service activities in the fourth quarter of 2013 and lower volume of activities for product support, partially offset by higher volume of activities from parts services and Specialized Aircraft Solutions.
Other revenuesThe $43 million increase for the three-month period is mainly due to higher deliveries and favorable mix of pre-owned business aircraft, partially offset by lower deliveries of pre-owned commercial aircraft and the sale of Flexjet’s pre-owned fractional shares activities in the fourth quarter of 2013.
The $9 million decrease for the fiscal year is mainly due to the sale of Flexjet’s pre-owned fractional shares activities in the fourth quarter of 2013 and lower deliveries and unfavorable mix of pre-owned commercial aircraft, partially offset by higher deliveries and favorable mix of pre-owned business aircraft.

BOMBARDIER INC. FINANCIAL REPORT - FISCAL YEAR ENDED DECEMBER 31, 2014 - AEROSPACE 55
Special itemsSpecial items comprise items which do not reflect, in management’s opinion, the Corporation’s core performance such as the impact of restructuring charges, significant impairment charges and reversals, as well as other significant unusual items.
Special items in EBIT were as follows:
Fourth quarters ended December 31
Fiscal years ended December 31
Ref 2014 2013 2014 2013Pause of the Learjet 85 program 1 $ 1,357 $ — $ 1,357 $ —Restructuring charge 2 — — 85 —Gains on resolution of litigations 3 — — (10) (31)Inventory write-down 4 — 24 — 24Gain on disposal of a business 5 — (23) — (23)
$ 1,357 $ 1 $ 1,432 $ (30)EBIT % impact (40.8)% (0.1)% (13.7)% 0.4%
1. Loss related to the pause of the Learjet 85 aircraft program announced in January 2015, mainly comprised of a $1.3 billion impairment charge taken on the related aerospace program tooling.
2. Restructuring charges in fiscal year 2014 relate to:• a $63 million expense for the workforce reduction of approximately 2,000 positions, located mostly in
Canada, the U.S. and the U.K., related to the new organizational structure announced in July 2014; and• a $22 million expense for the workforce reduction announced in January 2014 of approximately 1,700
positions, located mostly in Canada and the U.S.3. Gains on resolution of litigations represent a gain upon the successful resolution of a litigation of $10 million in
connection with Part IV of the Quebec Income Tax Act, the Tax on Capital ($31 million in fiscal year 2013).4. Inventory write-down in fiscal year 2013 relates to the prolonged production pause for the Learjet 60 XR
program. 5. Gain on disposal of a business relates to the sale of the main assets and related liabilities of the Corporation's
Flexjet activities completed in December 2013.
EBIT marginThe EBIT margin before special items for the three-month period decreased by 1.7 percentage points mainly as a result of:
• higher write-down of inventory to net realizable value for the CSeries aircraft program(1);• higher other expenses, mainly due to a net negative variance of provisions for credit and residual
guarantees, partially offset by a net positive variance in other financial assets; and• the acceleration of recognition of fractional ownership deferred revenues in the fourth quarter of fiscal
year 2013.Partially offset by:• the mix of business aircraft deliveries; and• higher absorption of SG&A expenses.
(1) Early production units in a new aircraft program incur higher costs than units produced later in the program and the selling prices of early units are generally lower.

56 BOMBARDIER INC. FINANCIAL REPORT - FISCAL YEAR ENDED DECEMBER 31, 2014
The EBIT margin before special items for the twelve-month period increased by 0.1 percentage points mainly as a result of:
• higher absorption of lower SG&A expenses;• higher margins from commercial aircraft, mainly due to the mix of aircraft; and• costs incurred in Canadian dollars translated at lower exchange rates, after giving effect to hedges.Partially offset by: • higher write-down of inventory to net realizable value for the CSeries aircraft program(1);• the mix of commercial aircraft versus business aircraft deliveries;• higher other expenses, mainly due to a net negative variance of provisions for credit and residual
guarantees;• lower net selling prices for business aircraft; and • the acceleration of recognition of fractional ownership deferred revenues in the fourth quarter of fiscal
year 2013.(1) Early production units in a new aircraft program incur higher costs than units produced later in the program and the selling prices of early
units are generally lower.
Cash flows from operating activities partially financed the significant investment in product development
Free cash flow (usage)(1)
Fourth quarters ended December 31
Fiscal years ended December 31
2014 2013 2014 2013EBIT $ (1,303) $ 93 $ (995) $ 418Amortization 88 74 301 267Impairment charge on intangible assets 1,266 — 1,266 —EBITDA 51 167 572 685Other non-cash items
(Gains) losses on disposals of PP&E 1 — 1 (1)Share-based expense (income) 1 (8) 1 5
Dividends received from joint ventures and associates — — 2 —Net change in non-cash balances 425 519 222 285Cash flows from operating activities 478 678 798 974Net additions to PP&E and intangible assets (449) (591) (1,857) (2,213)Free cash flow (usage)(1) $ 29 $ 87 $ (1,059) $ (1,239)
(1) Non-GAAP financial measures. Refer to the Non-GAAP financial measures section in Overview for definitions of these metrics.
The $58 million decrease for the three-month period is mainly due to:• lower EBITDA ($116 million) (see analysis of results explanations above); and• a negative period-over-period variation in net change in non-cash balances ($94 million) (see explanation
below).Partially offset by:• lower net additions to PP&E and intangible assets ($142 million).
The $180 million improvement for the fiscal year is mainly due to:• lower net additions to PP&E and intangible assets ($356 million).Partially offset by:• lower EBITDA ($113 million) (see analysis of results explanations above); and• a negative period-over-period variation in net change in non-cash balances ($63 million) (see explanation
below).

BOMBARDIER INC. FINANCIAL REPORT - FISCAL YEAR ENDED DECEMBER 31, 2014 - AEROSPACE 57
Net change in non-cash balancesFor the three-month period ended December 31, 2014, the $425 million cash inflow is mainly due to:
• a decrease in aerospace program work-in-process inventories, mainly in business aircraft;• a decrease in finished product inventories, mainly due to a decrease in medium and light business aircraft
categories and turboprops;• an increase in provisions, mainly related to the pause of the Learjet 85 program; and• an increase in trade and other payables.Partially offset by:• a decrease in advances on aerospace programs, mainly in business aircraft.
For the three-month period ended December 31, 2013, the $519 million cash inflow was mainly due to: • a decrease in raw material and work-in-process inventories, mainly in the light and medium business
aircraft categories;• an increase in advances on aerospace programs, mainly in the medium business aircraft category; and• an increase in trade and other payables.Partially offset by:• an increase in finished product inventories, mainly due to business aircraft not associated with a firm order.
For the fiscal year ended December 31, 2014, the $222 million cash inflow is mainly due to: • a decrease in aerospace program work-in-process inventories, mainly in business aircraft and regional
jets;• an increase in provisions, mainly related to the pause of the Learjet 85 program; and• a decrease in finished product inventories, mainly due to a decrease in the medium business aircraft and
regional jets categories, partially offset by an increase in business aircraft pre-owned aircraft inventories.Partially offset by:• a decrease in trade and other payables.
For the fiscal year ended December 31, 2013, the $285 million cash inflow was mainly due to:• an increase in other liabilities, mainly related to supplier contributions to aerospace programs under
development;• an increase in advances on aerospace programs in commercial aircraft and in the large business aircraft
category; and• an increase in trade and other payables.Partially offset by:• an increase in aerospace program work-in-process inventories, mainly in the large business aircraft
category and in regional jets;• an increase in other assets, mainly in prepaid expenses and retirement benefit assets; and• an increase in finished product inventories, mainly due to business aircraft not associated with a firm
order.

58 BOMBARDIER INC. FINANCIAL REPORT - FISCAL YEAR ENDED DECEMBER 31, 2014
Continued significant investment in product developmentInvestment in product development
Fourth quarters ended December 31
Fiscal years ended December 31
2014 2013 2014 2013Program tooling(1) $ 389 $ 490 $ 1,655 $ 1,983R&D expense(2) 5 5 27 26
$ 394 $ 495 $ 1,682 $ 2,009As a percentage of manufacturing revenues 14.6% 22.6% 20.4% 29.4%
(1) Net amount capitalized in aerospace program tooling.(2) Excluding amortization of aerospace program tooling of $56 million and $172 million, respectively, for the fourth quarter and fiscal year ended
December 31, 2014 ($42 million and $147 million, respectively, for the fourth quarter and fiscal year ended December 31, 2013), as the related investments are already included in aerospace program tooling.
Program tooling additions essentially relate to the development of the CSeries family of aircraft, the Global 7000and Global 8000 aircraft programs as well as the Learjet 85 aircraft.
EXPENDITURES ON PRODUCT DEVELOPMENT(1)
(for the fiscal years ended) AEROSPACE PROGRAM TOOLING(1)(2)
(as at)
(1) Comparative expenditures figures have been restated to conform to the presentation adopted in the current period.
* The fiscal year ended December 31, 2011 comprises 11 months of operations.
(1) Capitalized borrowing costs included in the aerospace program tooling balance amounted to $731 million as at December 31, 2014 ($609 million as at December 31, 2013).
(2) The net carrying value of business aircraft tooling as at December 31, 2014 is net of an impairment charge of $1,266 million related to the pause of the Learjet 85 aircraft program announced in January 2015.
Until EIS of the CS300 aircraft program, CSeries aerospace program tooling is anticipated to increase by approximately $850 million in relation to development spending and approximately $225 million in relation to capitalized borrowing costs. In addition, $325 million related to acquired development costs carried out by BA's vendors, that will be repayable upon future delivery of aircraft, must be recognized as aerospace program tooling at the EIS of the aircraft. This latter amount is a non-cash item and will impact the net additions to PP&E and intangible assets in the cash flow once the payments are made to the suppliers upon delivery of the aircraft.
A thorough review process is followed which starts, before an aircraft is launched, by assessing all new programs through the Aircraft Portfolio Strategy Board (APSB). With representation from all key functions involved, APSB ensures alignment and capability to deliver on commitments at all levels of the organization. Among others, this review confirms the availability of human and financial resources, the maturity and manufacturing readiness of new technologies and the overall strength of the business case, by imposing increasingly strict business guidelines as a program approaches launch. This process is performed in parallel with the pre-launch Bombardier Engineering System stages (conceptual definition and launch preparation), and ultimately culminates with the approval of Bombardier’s Board of Directors, at which time capitalization of product development expenditures as program tooling usually begins.

BOMBARDIER INC. FINANCIAL REPORT - FISCAL YEAR ENDED DECEMBER 31, 2014 - AEROSPACE 59
Recognizing the long-term nature of product development activities, as well as the significant human and financial resources required, a gated product development process is followed focusing on early identification and mitigation of potential risks. All programs follow the Bombardier Engineering System, the heart of the process, throughout the product development cycle. The product development process is constantly refined to integrate the lessons learned from BA's programs and from the industry. The stages in the process are described hereafter and specific milestones must be met before a product can move from one stage of development to another. The gates consist of exit reviews with different levels of management and technical experts to demonstrate feasibility, customer acceptance and financial return. Designing products with minimal environmental impacts throughout their entire lifecycle is central to BA's product responsibility strategy. In addition to the Design for Environment approach, health and safety considerations are also embedded in product design.
The following tables explain the key elements of BA's product development process and the status of the most significant programs under development.
PRODUCT DEVELOPMENT PROCESSStage DescriptionConceptual definition JTAP Joint Technical Assessment Phase - Preliminary review with potential partners and
suppliers to analyze technologies desired to build or modify an aircraft.JCDP Joint Conceptual Definition Phase - Cooperative effort with potential partners and
suppliers to perform a configuration trade-off study and define the system architecture and functionality.
Launch preparation Continuation of the design definition and technical activities.Creation of a project plan to define the schedule, cost, scope, statement of work andresource requirements for the program.
Preliminary definition JDP Joint Definition Phase - Joint determination with partners and suppliers of the technical design of the aircraft and sharing of the work required. Optimization of the aircraft design with respect to manufacturing, assembly and total life-cycle costs.
Detail definition DDP Detailed Design Phase - Preparation of detailed production drawings and confirmation of the design based on the preliminary design definition agreed in the previous phase.
Product definition release Formal issue of the engineering drawings to manufacturing, allowing for the completionof tool designs and the assembly of the first produced aircraft.
Product certification Completion of certification activities to demonstrate that the aircraft complies with theoriginal design requirements and all regulatory airworthiness standards.
Program completion Conclusion of final design activity.Preparation for EIS.
THE CSERIES AIRCRAFT PROGRAMSBoth the CS100 and CS300 aircraft programs are in the product certification phase. The type certification for the CS100 aircraft is targeted for the second half of 2015 and the CS300 aircraft’s type certification is expected to follow approximately six months afterwards. The EIS of each program is expected to occur shortly after their respective type certification dates.Productionand testing
The first four CS100 FTVs continue with flight testing activities.FTV5, which is fitted with a full interior, has successfully completed the Emergency Passenger Evacuation test in the presence of representatives from Transport Canada (TC), the Federal Aviation Administration (FAA) and the European Aviation Safety Agency (EASA). FTV5 is expected to be handed over to the flight test team by the end of the first quarter of 2015. Additionally, the first CS300 FTV has been handed over to the flight test team and is being readied for its first flight which is expected to take place by the end of the first quarter of 2015. Assembly of the second CS300 FTV has started in the new Mirabel CSeries final assembly facility. While the Mirabel facility remains the primary flight test center for the CSeries aircraft, the Wichita facility is being leveraged for flight testing activities that require more favorable climate conditions in order to accelerate these activities.The majority of the fuel burn validation testing has been completed and results are in line with expectations.(1)
On-the-ground static testing, including all the baseline ultimate load certification tests, has also been completed successfully. The fatigue testing on the full fatigue aircraft article, as well as the wing fatigue article are progressing to plan.The initial on-the-ground, flight and aircraft structural test performance results are in line with expectations. The data received to date confirms that the aircraft development programs are on track to reach key performance targets.(1)
The assembly of CS100 production aircraft continues in the Mirabel CSeries final assembly facility.(1) Key performance targets under certain operating conditions when compared to aircraft currently in production for flights of 500 nautical miles.
See the CSeries family of aircraft program disclaimer at the end of this MD&A.

60 BOMBARDIER INC. FINANCIAL REPORT - FISCAL YEAR ENDED DECEMBER 31, 2014
THE LEARJET 85 AIRCRAFT PROGRAM The light business aircraft category has remained weak since the economic downturn. Due to the weak market demand in this category, in January 2015 Bombardier announced its decision to pause the Learjet 85 program and the flight testing activities. Bombardier believes the Learjet 85 program meets specific market requirements and that it has long-term market potential. The Corporation continues to monitor the market for light aircraft and will respond accordingly.
THE GLOBAL 7000 AND GLOBAL 8000 AIRCRAFT PROGRAMSDevelopment is in the product definition release phase and the assembly of the first FTV is progressing. Going forward, the Corporation will provide updates on the development program, including EIS, once significant milestones have been achieved.Productionand testing
Development is progressing as planned, with the majority of the production drawings already released. The experimental and ground test teams are progressing on the build and the commissioning of the various ground test rigs that should be used throughout the development and certification of the aircraft.
Suppliers Both internal and external major structural suppliers have begun the assembly of components for the remaining FTVs and the Complete Airframe Static Test (CAST) article.Major system level test rigs have been commissioned and various systems development and certification tests are ongoing.Engine development is progressing and ground test results are in line with GE Aviation's expectations. Flight testing of the engine has begun on GE Aviation’s flying test bed.
THE CHALLENGER 650 AIRCRAFT PROGRAMThe Challenger 650 aircraft program is in the product certification phase and is progressing towards EIS in the second half of 2015.Productionand testing
The Challenger 650 aircraft program, the evolution of the Challenger 605 aircraft, was launched in October 2014. A Challenger 605 aircraft with upgraded avionics is being used to perform certification testing.
Increase in business aircraft deliveries
Business aircraft deliveriesFourth quarters
ended December 31Fiscal years
ended December 31(in units) 2014 2013 2014 2013Light
Learjet 70/75 and Learjet 40 XR/45 XR 18 18 33 19Learjet 60 XR — 2 1 10
MediumChallenger 300/350 19 13 54 55Challenger 605 16 8 36 32Challenger 800 Series — 2 — 2
LargeGlobal 5000/Global 6000 25 17 80 62
78 60 204 180
Deliveries of business aircraft in the three-month period increased by 30% compared to the same period last year, mainly due to higher deliveries in the medium and large business aircraft categories. In the twelve-month period ended December 31, 2014, there were higher deliveries in the light and large business aircraft categories. The increase in the light business aircraft category is mainly due to the transition to the Learjet 70 and Learjet 75 aircraft, which negatively impacted the deliveries of Learjet aircraft in the previous fiscal year, offset by lower deliveries of Learjet 60 XR aircraft in fiscal year 2014 compared to last year.
In fiscal year 2014, BA captured 37% of the market share in the overall market in which the Corporation competes, based on revenue, and 34% of the market share based on units delivered. BA was the market leader in terms of units delivered and second in terms of revenues. This compares with a market share of 33% and 32%, based on revenues and units delivered respectively, in fiscal year 2013. In 2013, BA was also the market leader in terms of units delivered and second in terms of revenues.(1)
(1) Based on BA's estimates and other public sources.

BOMBARDIER INC. FINANCIAL REPORT - FISCAL YEAR ENDED DECEMBER 31, 2014 - AEROSPACE 61
Significant increase in commercial aircraft deliveries
Commercial aircraft deliveriesFourth quarters
ended December 31Fiscal years
ended December 31(in units) 2014 2013 2014 2013Regional jets
CRJ700 NextGen 1 — 7 1CRJ900 NextGen 13 11 48 18CRJ1000 NextGen — — 4 7
TurbopropsQ400 NextGen 8 10 25 29
22 21 84 55
Deliveries of commercial aircraft for the fiscal year ended December 31, 2014 increased compared to last year, mainly due to the deliveries of CRJ900 NextGen aircraft related to the significant orders received from Delta Air Lines, Inc. and American Airlines Group Inc. in December 2012 and 2013, respectively.
For the three-year period ended December 31, 2014, BA captured 27% of the market share in the 20- to 99-seat category based on units delivered. This compares to a market share of 31% for the three-year period ended December 31, 2013.(1)
(1) BA's estimates based on delivery data available from Ascend and other public sources.
Order intakeTotal aircraft net orders
December 31, 2014 December 31, 2013
(in units)Grossorders Cancellations
Netorders
Grossorders Cancellations
Netorders
Fourth quarters endedBusiness aircraft 49 (17) 32 231 (23) 208Commercial aircraft 32 — 32 42 — 42Amphibious aircraft 3 — 3 2 — 2
84 (17) 67 275 (23) 252Fiscal years ended
Business aircraft 181 (52) 129 369 (64) 305Commercial aircraft 149 (1) 148 92 (11) 81Amphibious aircraft 5 — 5 2 — 2
335 (53) 282 463 (75) 388

62 BOMBARDIER INC. FINANCIAL REPORT - FISCAL YEAR ENDED DECEMBER 31, 2014
Business aircraft
BUSINESS AIRCRAFT GROSS/NET ORDERS(1)
(for fiscal years ended; gross orders exclude swaps)
(1) The fiscal year ended December 31, 2011 comprises 11 months of results.
The high order intake of business aircraft during fiscal years 2011 to 2013 reflects the significant multi-aircraft orders signed with NetJets Inc., Flexjet, LLC as well as with Vistajet and various undisclosed customers.
Commercial aircraft
Commercial aircraft net ordersFourth quarters
ended December 31Fiscal years
ended December 31(in units) 2014 2013 2014 2013Regional jets
CRJ700 NextGen — — 1 2CRJ900 NextGen 25 33 45 25CRJ1000 NextGen — — — 3
Commercial jetsCS100 — — — (3)CS300 — 5 61 37
TurbopropsQ400 NextGen 7 4 41 17
32 42 148 81
COMMERCIAL AIRCRAFT GROSS/NET ORDERS(1)
(for fiscal years ended; gross orders exclude swaps)
(1) The fiscal year ended December 31, 2011 comprises 11 months of results.
There has been a significant order increase in all commercial aircraft categories in the twelve-month period ended December 31, 2014.

BOMBARDIER INC. FINANCIAL REPORT - FISCAL YEAR ENDED DECEMBER 31, 2014 - AEROSPACE 63
The following significant orders were received during the fiscal year ended December 31, 2014:
Customer Firm order Value(1) Options(2)
Fourth quarterAmerican Airlines, Inc. (U.S.)(3) 24 CRJ900 NextGen $ 1,140 —GE Capital Aviation Services (U.S.) 5 Q400 NextGen $ 160 10 Q400 NextGen
Third quarterMacquarie AirFinance (Australia) 40 CS300 $ 3,140 10 CS300Undisclosed customer 5 Q400 NextGen $ 168 —WestJet Encore Ltd. (Canada)(3) 5 Q400 NextGen $ 167 —
Second quarterChina Express Airlines (China) 16 CRJ900 NextGen $ 727 8 CRJ900 NextGen
First quarterAl Qahtani Aviation Company (Kingdom of Saudi Arabia) 16 CS300 $ 1,210 10 CS300
(1) Value of firm order based on list prices.(2) Not included in the order backlog.(3) These transactions are conversions of options to firm orders.
Subsequent to the end of the fiscal year, the following significant firm order, which is not included in the total order backlog as at December 31, 2014, was signed:
• A firm purchase agreement was signed with Chorus Aviation Inc. (Chorus), the parent company of Jazz Aviation LP (Jazz) for 13 Q400 NextGen aircraft, with options for an additional ten. Based on list price, the firm order is valued at approximately $424 million. Chorus and Jazz are the launch customer and operator for the industry's first Dash 8-300 aircraft Extended Service Program that will extend the life of the Dash 8-300 turboprop aircraft from the original 80,000 flight cycles to 120,000 flight cycles.
Book-to-bill ratio and order backlogBook-to-bill ratio(1)
Fourth quarters ended December 31
Fiscal years ended December 31
2014 2013 2014 2013Business aircraft 0.4 3.5 0.6 1.7Commercial aircraft 1.5 2.0 1.8 1.5
Total 0.7 3.0 1.0 1.6(1) Defined as net orders received over aircraft deliveries, in units.
The book-to-bill ratios for the three and twelve-month periods ended December 31, 2014 for business aircraft reflect lower order intake than deliveries. The book-to-bill ratio for the fourth quarter of 2014 for commercial aircraft reflects a strong order intake for CRJ900 NextGen aircraft while the book-to-bill ratio for the twelve-month period ended December 31, 2014 reflects a strong order intake for the CS300 aircraft and higher orders than deliveries for turboprops, partly offset by lower orders than deliveries for regional jets.
NET ORDERS AND BOOK-TO-BILL RATIO(1)
(for the fiscal years ended)
(1) The fiscal year ended December 31, 2011 comprises 11 months of results.

64 BOMBARDIER INC. FINANCIAL REPORT - FISCAL YEAR ENDED DECEMBER 31, 2014
Order backlogAs at
(in billions of dollars) December 31, 2014 December 31, 2013Aircraft programs $ 33.4 $ 33.9Long-term maintenance and spares support agreements 2.8 2.9Military Aviation Training(1) 0.4 0.5
$ 36.6 $ 37.3(1) On January 26, 2015, Bombardier announced that it has reached a definitive agreement for the sale of its Military Aviation Training (MAT)
activities to CAE Inc.
The decrease in order backlog as at December 31, 2014 reflects lower order intake than deliveries for business aircraft, partly offset by the order intake for the CSeries family of aircraft. The order backlog and the production horizon for programs are monitored to align production rates to reflect market demand.
ORDER BACKLOG IN MONTHS OF PRODUCTION(1) (as at December 31, 2014)
(1) The number of months in production is calculated by dividing the order backlog in units as at December 31, 2014 for each family of aircraft (excluding orders for the Learjet 85, Global 7000 and Global 8000 aircraft) by the number of aircraft delivered in the previous 12 months, converted into an equivalent number of months. The order backlog in months of production provides insight on the depth of the order backlog based on the last 12-month production rates. This metric is not forward-looking, and does not take into account potential changes in production rates or the ability of the customers to take delivery of the aircraft and the timing of such delivery.
Commercial aircraft order backlog and optionsAs at
December 31, 2014 December 31, 2013(in units) Firm orders Options Firm orders Options
Regional jetsCRJ700 NextGen 10 — 16 -CRJ900 NextGen 57 56 60 73CRJ1000 NextGen 31 22 35 22
Commercial jetsCS100 63 (1) 49 63 (2) 49CS300 180 (1) 113 119 (2) 93
TurbopropsQ400 NextGen 42 94 26 90
383 334 319 327(1) The total of 243 orders includes 86 firm orders with conversion rights to the other CSeries aircraft model.(2) The total of 182 orders includes 80 firm orders with conversion rights to the other CSeries aircraft model.
The total CSeries firm order backlog comprises 243 aircraft with 14 customers in 13 countries as at December 31, 2014. As at the date of this report, firm orders and other agreements(1) for a total of 563 CSeries aircraft have been signed with 21 customers in 18 countries, including 243 firm orders. (1) The other agreements consist of conditional orders, letters of intent, options and purchase rights.
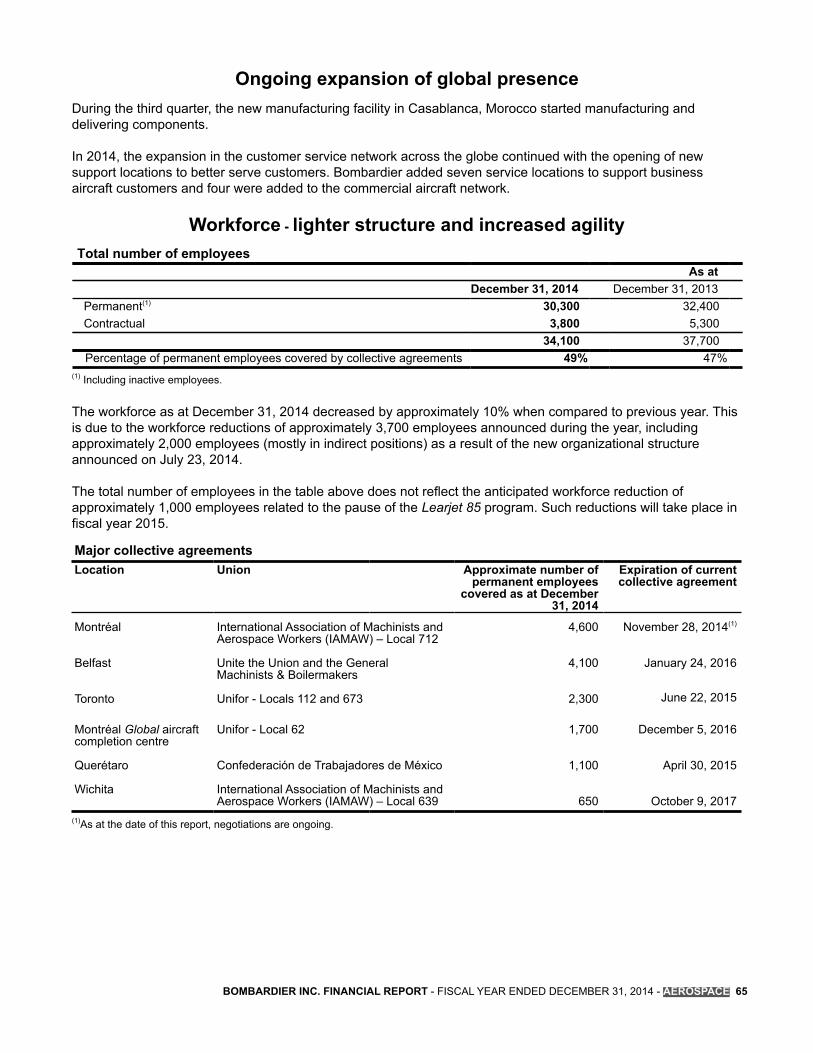
BOMBARDIER INC. FINANCIAL REPORT - FISCAL YEAR ENDED DECEMBER 31, 2014 - AEROSPACE 65
Ongoing expansion of global presenceDuring the third quarter, the new manufacturing facility in Casablanca, Morocco started manufacturing and delivering components.
In 2014, the expansion in the customer service network across the globe continued with the opening of new support locations to better serve customers. Bombardier added seven service locations to support business aircraft customers and four were added to the commercial aircraft network.
Workforce - lighter structure and increased agilityTotal number of employees
As atDecember 31, 2014 December 31, 2013
Permanent(1) 30,300 32,400Contractual 3,800 5,300
34,100 37,700Percentage of permanent employees covered by collective agreements 49% 47%
(1) Including inactive employees.
The workforce as at December 31, 2014 decreased by approximately 10% when compared to previous year. This is due to the workforce reductions of approximately 3,700 employees announced during the year, including approximately 2,000 employees (mostly in indirect positions) as a result of the new organizational structure announced on July 23, 2014.
The total number of employees in the table above does not reflect the anticipated workforce reduction of approximately 1,000 employees related to the pause of the Learjet 85 program. Such reductions will take place in fiscal year 2015.
Major collective agreementsLocation Union Approximate number of
permanent employees covered as at December
31, 2014
Expiration of currentcollective agreement
Montréal
Belfast
Toronto
International Association of Machinists and Aerospace Workers (IAMAW) – Local 712
Unite the Union and the General Machinists & Boilermakers
Unifor - Locals 112 and 673
4,600
4,100
2,300
November 28, 2014(1)
January 24, 2016
June 22, 2015
Montréal Global aircraft completion centre
Querétaro
Wichita
Unifor - Local 62
Confederación de Trabajadores de México
International Association of Machinists and Aerospace Workers (IAMAW) – Local 639
1,700
1,100
650
December 5, 2016
April 30, 2015
October 9, 2017(1)As at the date of this report, negotiations are ongoing.

66 BOMBARDIER INC. FINANCIAL REPORT - FISCAL YEAR ENDED DECEMBER 31, 2014
TRANSPORTATIONThe data presented in this section of the MD&A contains both IFRS and non-GAAP measures and is structured by market segment (rolling stock, services, system and signalling), which is reflective of the Corporation's organizational structure, and by geographic region (Europe, North America, Asia-Pacific and Rest of world).
Management believes that providing certain non-GAAP performance measures, in addition to IFRS measures, provides users of the MD&A with enhanced understanding of BT’s results and related trends and increases transparency and clarity of the core results of the business. EBIT before special items and EBITDA before special items are non-GAAP measures which exclude items which do not reflect core performance in management's opinion. Accordingly, these non-GAAP measures provide more transparent disclosures to analyze earnings, enabling better comparability of results from one period to another and better comparability with peers.
PAGEKEY PERFORMANCE MEASURESAND METRICS
Key performance measures and associated metrics that are used to monitor progressFinancial results over the last five fiscal years
HIGHLIGHTS OF THE YEAR Highlights of the fiscal year with regard to results and key events
GUIDANCE AND FORWARD-LOOKINGSTATEMENTS
What was said, what was done and what’s next Assumptions and risks related to forward-looking statements
INDUSTRY AND ECONOMICENVIRONMENT
Industry and economic factors affecting the business
ANALYSIS OF RESULTS Financial performance for the fourth quarter and fiscal year ended December 31, 2014Orders, order backlog and workforce
Supplemental information regarding BT’s products and strategy, as well as the rail industry and market, can be found in Bombardier’s Profile, Strategy and Market presentation available on the dedicated investor relations website at ir.bombardier.com.
67
6869
71
74

BOMBARDIER INC FINANCIAL REPORT - FISCAL YEAR ENDED DECEMBER 31, 2014 - TRANSPORTATION 67
KEY PERFORMANCE MEASURES AND METRICS
The table below summarizes BT's most relevant key performance measures and associated metrics.
KEY PERFORMANCE MEASURES AND ASSOCIATED METRICSGrowth and competitive positioning
• Order backlog, as a measure of future revenues.• Book-to-bill ratio(1), as an indicator of future revenues. • Revenues by product segments and the geographic diversification of revenues, as measures
of growth and sustainability of competitive positioning.• Market position, as a measure of BT's competitive positioning.
Profitability • EBIT, EBIT margin, EBIT before special items(2) and EBIT margin before special items(2), as measures of performance.
Liquidity • Free cash flow(2), as a measure of liquidity generation.Customersatisfaction
• Various customer satisfaction metrics, focusing on the four main dimensions: sales and prices, customer orientation, project execution and product offering.
Execution • Achievement of product development and delivery milestones, as a measure of flawless execution.
• Achievement of engagement and enablement targets, as a measure of employee engagement and motivation.
In 2014, BT's employee incentive-based compensation was linked to the achievement of targeted results, based on EBIT before special items, free cash flow and employee engagement.
Five-year summaryFor the fiscal years ended and as at December 31 December 31 December 31 December 31 January 31
2014 2013 2012 2011 2011Revenues
Rolling stock $ 6,330 $ 5,511 $ 5,071 $ 6,412 $ 5,991Services 1,717 1,596 1,437 1,409 1,308System and signalling 1,565 1,659 1,278 1,489 1,390
$ 9,612 $ 8,766 $ 7,786 $ 9,310 $ 8,689Order intake (in billions of dollars) $ 12.6 $ 8.8 $ 9.2 $ 9.5 $ 13.9Book-to-bill ratio(1) 1.3 1.0 1.2 1.0 1.6Order backlog (in billions of dollars) $ 32.5 $ 32.4 $ 32.0 $ 30.1 $ 31.5EBIT $ 429 $ 505 $ 276 $ 675 $ 652EBIT margin 4.5% 5.8% 3.5% 7.3% 7.5%EBIT before special items(2)(3) $ 486 $ 505 $ 439 $ 675 $ 652 EBIT margin before special items(2)(3) 5.1% 5.8% 5.6% 7.3% 7.5% Free cash flow (usage)(2) $ 122 $ 668 $ 488 $ (296) $ 586
Number of employees(4) 39,700 38,500 36,000 36,200 34,900(1) Defined as new orders over revenues.(2)
Non-GAAP financial measure. Refer to the Non-GAAP financial measures section in Overview for definitions of these metrics. Refer to the Analysis of results section for reconciliations to the most comparable IFRS measures.
(3) Refer to the Analysis of results section for details of special items recorded in fiscal 2014. The special items for the fiscal year ended December 31, 2012 include restructuring charges of $119 million related to the closure of a plant in Aachen, Germany, and the reduction of worldwide direct and indirect personnel by 1,200 employees; a foreign exchange hedging loss of $25 million; and a loss of $19 million related to flooding in New Jersey, U.S.
(4) Including contractual and inactive employees.
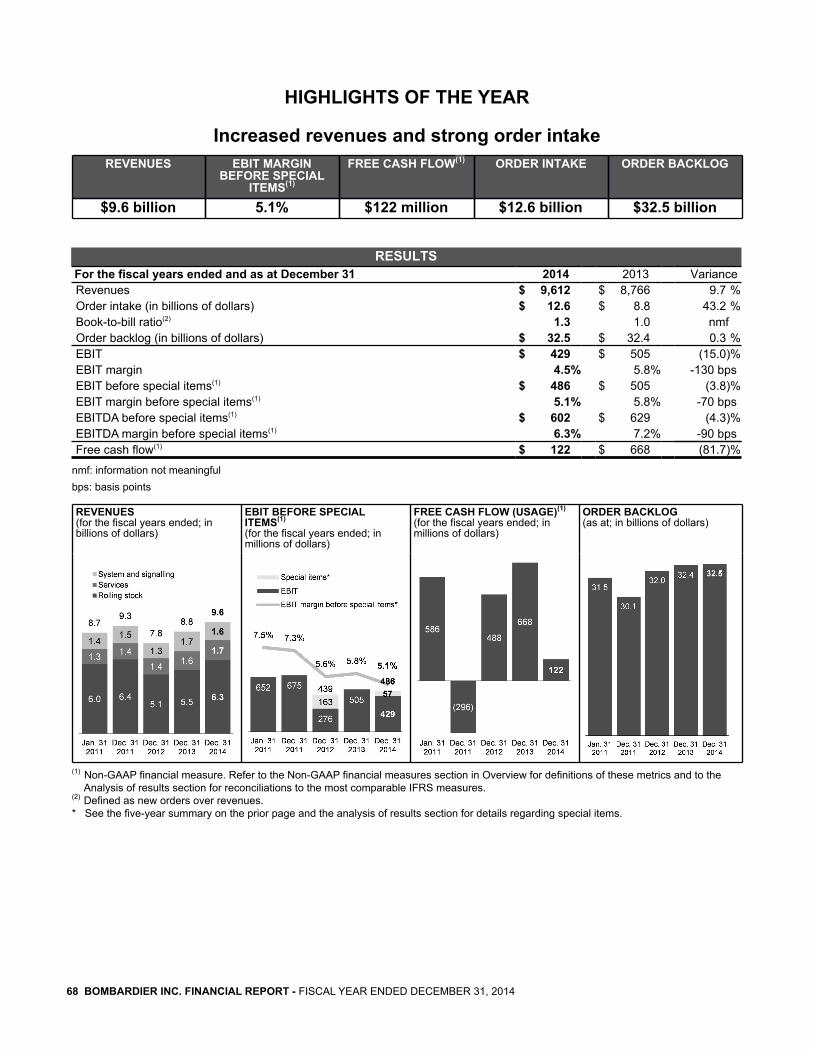
68 BOMBARDIER INC. FINANCIAL REPORT - FISCAL YEAR ENDED DECEMBER 31, 2014
HIGHLIGHTS OF THE YEAR
Increased revenues and strong order intakeREVENUES EBIT MARGIN
BEFORE SPECIAL ITEMS(1)
FREE CASH FLOW(1) ORDER INTAKE ORDER BACKLOG
$9.6 billion 5.1% $122 million $12.6 billion $32.5 billion
RESULTSFor the fiscal years ended and as at December 31 2014 2013 VarianceRevenues $ 9,612 $ 8,766 9.7 %Order intake (in billions of dollars) $ 12.6 $ 8.8 43.2 %Book-to-bill ratio(2) 1.3 1.0 nmfOrder backlog (in billions of dollars) $ 32.5 $ 32.4 0.3 %EBIT $ 429 $ 505 (15.0)%EBIT margin 4.5% 5.8% -130 bpsEBIT before special items(1) $ 486 $ 505 (3.8)%EBIT margin before special items(1) 5.1% 5.8% -70 bpsEBITDA before special items(1) $ 602 $ 629 (4.3)%EBITDA margin before special items(1) 6.3% 7.2% -90 bpsFree cash flow(1) $ 122 $ 668 (81.7)%
nmf: information not meaningfulbps: basis points
REVENUES(for the fiscal years ended; in billions of dollars)
EBIT BEFORE SPECIAL ITEMS(1) (for the fiscal years ended; in millions of dollars)
FREE CASH FLOW (USAGE)(1)
(for the fiscal years ended; in millions of dollars)
ORDER BACKLOG(as at; in billions of dollars)
(1) Non-GAAP financial measure. Refer to the Non-GAAP financial measures section in Overview for definitions of these metrics and to the Analysis of results section for reconciliations to the most comparable IFRS measures.
(2) Defined as new orders over revenues.* See the five-year summary on the prior page and the analysis of results section for details regarding special items.

BOMBARDIER INC FINANCIAL REPORT - FISCAL YEAR ENDED DECEMBER 31, 2014 - TRANSPORTATION 69
KEY EVENTS
• Strong order intake of $12.6 billion, leading to a backlog of $32.5 billion for the fiscal year, which included contracts worth $2.7 billion with the State of Queensland, Australia, for EMUs and fleet maintenance services; $2.1 billion with Transport for London, U.K., for AVENTRA trains and fleet maintenance services for the London Crossrail project; and $1.2 billion with Transnet Freight Rail, South Africa, for TRAXX locomotives.
• In July 2014, BT announced further cost reduction measures as part of the reorganization initiatives. These measures include the reduction of direct and indirect positions by approximately 900 employees worldwide, savings in non-product related costs and a general hiring freeze for all indirect functions. A restructuring charge of $57 million related to headcount reductions has been recorded as a special item in the third quarter.
• In August 2014, São Paulo’s new INNOVIA Monorail 300 system started passenger service. The line will carry over half a million passengers every day along the east side of São Paulo.
• In November 2014, BT announced that it has signed an agreement with CSR Puzhen Co. Ltd (CSR Puzhen) to create a joint venture to develop and manufacture INNOVIA vehicles for urban and airport transit systems, thus demonstrating the firm commitment of both parties to develop a long-term industrial partnership that addresses China’s need for urban and airport transportation.
• Subsequent to the end of the fiscal year, on January 30, 2015, the ZEFIRO 380 very high speed train received homologation in China. Bombardier-Sifang Transportation, a Chinese entity in which Bombardier holds a 50 percent interest, is expected to start delivery during the first quarter of 2015.
GUIDANCE AND FORWARD-LOOKING STATEMENTS
2014 Performance
2014 Guidance 2014 PerformanceProfitability While an EBIT margin of 8% remains the objective,
management expects an EBIT margin of approximately 6% in 2014 as BT focuses on contract execution improvement.
EBIT before special items(1) of 5.1%.
Liquidity Maintain a free cash flow(1) generally in line with EBIT, although it may vary significantly from quarter to quarter.
Free cash flow(1) of $122 million.
Growth andorder intake
Excluding currency impacts, revenues in 2014 are expected to be higher than in 2013, with percentage growth in the mid-single digits.
Revenue growth of 9.7% excluding currency impacts.
In fiscal year 2014, management expects a book-to-bill(2) ratio in excess of 1.0.
Book-to-bill(2) ratio of 1.3.
The EBIT before special items(1) is lower than BT’s guidance and is mainly due to revised escalation assumptions for some contracts, mainly in rolling stock, which impacted estimated future revenues and resulted in a catch-up adjustment to reflect lower contract margins on revenues already recognized.
The free cash flow(1) is lower than BT’s guidance and is mainly due to a different cash profile in some contracts and a lower level of advances on options in relation to framework contract agreements.(1) Non-GAAP financial measures. Refer to the Non-GAAP financial measures section in Overview for definitions of these metrics and to the
Analysis of results section for reconciliations to the most comparable IFRS measures.(2) Defined as new orders over revenues.

70 BOMBARDIER INC. FINANCIAL REPORT - FISCAL YEAR ENDED DECEMBER 31, 2014
2015 Guidance2015 Guidance(3)
Profitability Slight improvement in EBIT margin compared to 2014.Liquidity Improvement in free cash flow(1) compared to 2014 although it is expected to remain below EBIT.Growth andorder intake
Excluding currency impacts, revenues in 2015 are expected to be higher than in 2014, with percentage growth in the low-single digits.Book-to-bill ratio(2) in excess of 1.0.
A slight improvement in EBIT margin is expected in 2015 compared to 2014 as BT continues to focus on contract execution and cost reduction, while increasing investment in a harmonized I.T. landscape and R&D to develop standardized vehicle and sub-systems platforms.
An improvement in free cash flow(1) is expected in 2015 compared to 2014 although it is expected to remain below EBIT due to further ramp-up in production related to several contracts and as a lower level of advances on large contracts is anticipated.(1) Non-GAAP financial measures. Refer to the Non-GAAP financial measures section in Overview for definitions of these metrics and to the
Analysis of results section for reconciliations to the most comparable IFRS measures.(2) Defined as new orders over revenues.(3) See forward-looking statements below.
Focused on continuous improvement to reach profitability targets
The strong level of order activity across all segments and geographies in fiscal year 2014 is an expression of customers’ continued confidence in BT’s innovative products and services.
BT ended the year with a strong order intake of $12.6 billion leading to a backlog of $32.5 billion. The increased share of services in the backlog, as well as the balanced distribution of the order intake in 2014 with respect to the product portfolio and geographic regions, will enable BT to grow its profitability and at the same time de-risk project execution by reducing complexity.
In 2014, BT experienced a decrease in EBIT margin before special items mainly as a result of revised escalation assumptions that negatively impacted future revenues and resulted in lower contract margins, mostly in rolling stock. In addition, contracts with execution issues in the past continued to negatively impact the results.
BT established a new organizational structure in 2014, OneBT, putting measures in place to significantly reduce execution risk and secure long-term competitiveness. The new structure further empowers project management, reduces organizational layers and overhead cost, and implements leaner processes to speed up decision making.
In 2014, BT announced cost saving initiatives such as a reduction of direct and indirect positions by approximately 900 employees worldwide and savings in non-product related costs. The generated savings will be invested in a harmonized I.T. landscape as well as in a higher level of upfront R&D to develop standardized vehicle and sub-systems platforms.
BT’s commitment to customer support and flawless execution is based on continuously improving its project management capabilities. BT has continued sharing best practices across the global project management community in order to improve project execution via definition of integrated planning, improved handover from bid to project and simplified governance.
Management is confident that these measures in combination with an increasing share of services contracts in BT’s order backlog will reduce execution risk in the future and contribute to the growth of future profitability.
Forward-looking statementsForward-looking statements(1) in this section of the MD&A are based on:• current order backlog;• the realization of upcoming tenders and BT's ability to capture them; • normal contract execution and continued deployment and execution of leading initiatives, especially those linked to cost
reductions, including operational improvement initiatives;• a sustained level of public sector spending; and• the ability of BT's supply base to support the execution of projects.(1) Also see the Guidance and forward-looking statements section in Overview.

BOMBARDIER INC FINANCIAL REPORT - FISCAL YEAR ENDED DECEMBER 31, 2014 - TRANSPORTATION 71
INDUSTRY AND ECONOMIC ENVIRONMENTThe future outlook for the rail market remains positive supported by favorable long-term trends in the rail industry. Urbanization, population growth, and government policies aimed at reducing emissions will continue to positively impact demand for public transportation.
The following key indicators are used to monitor the health of the rail market:
Indicator Current situation StatusPopulation growth andmass urbanization
The worldwide population will increase from approximately 7.2 to 9.6 billion by 2050 together with a growing share of people living in urban areas from 54% to 66% in the same time period.(1) Population growth and urbanization create an increasing demand for high capacity solutions for public transport especially in congested cities and areas.
Environmental awareness Governments increasingly commit to long-term climate and energy goals. Measures to reach these goals include investments in eco-friendly transport solutions such as rail transport. Rail is responsible for less than 3.3% of the transport energy-related CO2 emissions compared to 72.6% for road transportation.(2)
Public funding Most of the rolling stock business is conducted with rail operators from the public sector. Public indebtedness and austerity measures may impede public tender processes for some new railway projects however, governments tend to increase investments in infrastructure during these times. Together with the long-term market environment and growing demand, a decrease in overall investments in rail transportation is not expected.
Liberalization Liberalization attracts more private operators to enter the market and invest in new rail equipment and services. The European Commission supports the liberalization of domestic passenger rail services within the EU.
Identifies a favourable, neutral or negative status, respectively, in the market categories in which BT competes, based on the current environment.(1) According to the United Nations: “World Urbanization Prospects: The 2014 Revision”. (2) According to the International Union of Railways: “Railway Handbook 2014. Energy Consumption & CO2 Emissions”.
The Association of the European Rail Industry (UNIFE) confirms the positive outlook for the global rail industry in its World Rail Market Study published in September 2014. The study expects the overall accessible rail market(1) to grow with a CAGR of 2.7%. As large rail projects are often delayed by several months, single year market volumes can be subject to a high degree of volatility. UNIFE therefore focuses on three-year average annual market volumes in order to facilitate comparison between different periods. While Europe remains the largest region in terms of order volumes, the study expects Asia-Pacific to show the highest annual growth rate. The overall order volume is expected to reach an annual average of approximately $111 billion in the period of 2017-2019. Rolling stock will remain the largest segment, but services and signalling will maintain the highest growth rates.
ANNUAL ACCESSIBLE MARKET(1) BY REGION(three-year average orders; in billions of dollars)
Source: UNIFE World Rail Market Study "Forecast 2014 to 2019" and extrapolated figures(2)
(1) The overall accessible rail market is the world rail market, excluding the share of markets associated with contracts that are awarded to local players without open-bid competition. BT’s accessible market also excludes the infrastructure, freight wagon and shunter segments.
(2) Based on data from the UNIFE World Rail Market Study “Forecast 2014 to 2019” published in September 2014 for BT's accessible markets only. UNIFE data is updated every two years based on the 55 largest rail markets worldwide. UNIFE figures are published in euro. An exchange rate of 1€ = $1.31475, the average cumulative exchange rate over the 2012-14 period, was used to convert all figures. Figures for 2012-14 were extrapolated based on UNIFE data for 2011-13 and 2014-16.

72 BOMBARDIER INC. FINANCIAL REPORT - FISCAL YEAR ENDED DECEMBER 31, 2014
Europe The European market continues to be the largest rail market and is characterized by a high degree of competition and challenging customer requirements. Highest standards for safety, performance, reliability and availability are key requirements demanded by European customers. Accordingly, customers recognize the ability to deliver highly innovative technology with a strong focus on reduced lifecycle cost.
Compared to 2013, the European market maintained a high level of order volume in 2014 driven by large rolling stock orders in Western Europe, especially in the U.K. for regional and commuter trains, in France for double-deck trains as well as in Switzerland for high-speed trains.
EUROPE ANNUAL ACCESSIBLE MARKET(1)
(three-year average orders; in billions of dollars)
Source: UNIFE World Rail Market Study "Forecast 2014 to 2019" and extrapolated figures(2)
In the upcoming years, Western Europe continues to be a strong market with further investments expected in regional and commuter trains in France, Belgium, Germany and the U.K. New metro trains for London and Paris are expected to be tendered in 2016. Aging fleets in Eastern Europe especially in Hungary, Poland and the Czech Republic denote potential for modernization or replacement. Furthermore, rolling stock and services orders are expected in Turkey, since the Turkish state intends to further extend its high-speed network.
North AmericaIn the last year, the rail market in North America showed a significant increase in order volume compared to 2013. The increased order volume was mainly driven by large metro as well as operations and maintenance contracts in the U.S. In the upcoming years, the U.S. is expected to continue investing in metros and services as well as in electric commuters due to the extension of the electric railway network. Canada’s market activity has been low in 2014 but opportunities for light rail vehicles, services and signalling are expected to generate a higher order level in the next years. Mexico is expected to continue investing in urban mobility such as commuter and metro trains.
NORTH AMERICA ANNUAL ACCESSIBLE MARKET(1)
(three-year average orders; in billions of dollars)
Source: UNIFE World Rail Market Study "Forecast 2014 to 2019" and extrapolated figures(2)
(1) The overall accessible rail market is the world rail market, excluding the share of markets associated with contracts that are awarded to local players without open-bid competition. BT’s accessible market also excludes the infrastructure, freight wagon and shunter segments.
(2) Based on data from the UNIFE World Rail Market Study “Forecast 2014 to 2019” published in September 2014 for BT's accessible markets only. UNIFE data is updated every two years based on the 55 largest rail markets worldwide. UNIFE figures are published in euro. An exchange rate of 1€ = $1.31475, the average cumulative exchange rate over the 2012-14 period, was used to convert all figures. Figures for 2012-14 were extrapolated based on UNIFE data for 2011-13 and 2014-16.

BOMBARDIER INC FINANCIAL REPORT - FISCAL YEAR ENDED DECEMBER 31, 2014 - TRANSPORTATION 73
Asia-PacificThe Asia-Pacific region maintained a high order-intake level in 2014, although at a lower level compared to 2013. Australia awarded a large commuter project in the State of Queensland and China further invested in high speed and metro projects. In the upcoming years, Australia is expected to invest in the segments of commuter trains, light rail vehicles and signalling. Further investments in urban rail especially in the metro segment are expected in China over the next years. With the recent decision to further enhance the Chinese high-speed network, additional trains will be required. The Services segment is also expected to continue to grow in China, as the large rolling stock orders of the past decade will require increasing maintenance efforts in the next years.
ASIA-PACIFIC ANNUAL ACCESSIBLE MARKET (1)
(three-year average orders; in billions of dollars)
Source: UNIFE World Rail Market Study "Forecast 2014 to 2019" and extrapolated figures(2)
India is expected to develop its freight rail network by placing large orders for locomotives and wagons. The new government in India also plans to further develop high-speed networks. Metro projects are also expected in the large urban centers of South-East Asia such as Bangkok and Ho Chi Minh.
Rest of world(3)
In 2014, the Rest of world region continued to show a high level of order intake, which was slightly above the 2013 level. Particularly in South Africa, large locomotive and commuter contracts were awarded, representing the largest rolling stock supply projects in the history of South Africa. In the Middle East, political and public interest in rail mobility is high and as such, large mass transit projects are expected to be tendered. Furthermore, the rapid urbanization in South America shows significant demand for high capacity transport solutions.
REST OF WORLD ANNUAL ACCESSIBLE MARKET (1)
(three-year average orders; in billions of dollars)
Source: UNIFE World Rail Market Study "Forecast 2014 to 2019" and extrapolated figures(2)
In 2014, the overall accessible rail market(1) experienced increased consolidation and competitiveness. Nevertheless, BT is well positioned in both mature and emerging markets, as the large order intake across regions and segments in the last years have shown.(1) The overall accessible rail market is the world rail market, excluding the share of markets associated with contracts that are awarded to local
players without open-bid competition. BT’s accessible market also excludes the infrastructure, freight wagon and shunter segments.(2) Based on data from the UNIFE World Rail Market Study “Forecast 2014 to 2019” published in September 2014 for BT's accessible markets
only. UNIFE data is updated every two years based on the 55 largest rail markets worldwide. UNIFE figures are published in euro. An exchange rate of 1€ = $1.31475, the average cumulative exchange rate over the 2012-14 period, was used to convert all figures. Figures for 2012-14 were extrapolated based on UNIFE data for 2011-13 and 2014-16.
(3) The Rest of world region includes South America, Central America, Africa, the Middle East and the CIS.

74 BOMBARDIER INC. FINANCIAL REPORT - FISCAL YEAR ENDED DECEMBER 31, 2014
ANALYSIS OF RESULTS
Results of operationsFourth quarters
ended December 31Fiscal years
ended December 312014 2013 2014 2013
RevenuesRolling stock(1) $ 1,746 $ 1,480 $ 6,330 $ 5,511Services(2) 434 450 1,717 1,596System and signalling(3) 454 521 1,565 1,659
Total revenues 2,634 2,451 9,612 8,766Cost of sales 2,341 2,163 8,386 7,540Gross margin 293 288 1,226 1,226SG&A 169 175 686 718R&D 51 36 148 120Share of income of joint ventures and associates (25) (17) (89) (119)Other expense (income)(4) (4) 2 (5) 2EBIT before special items(5) 102 92 486 505Special items(6) — — 57 —EBIT 102 92 429 505Amortization(7) 28 32 116 124EBITDA(5) $ 130 $ 124 $ 545 $ 629EBITDA before special items(5) $ 130 $ 124 $ 602 $ 629(as a percentage of total revenues)
Gross margin 11.1% 11.8% 12.8% 14.0%EBIT before special items 3.9% 3.8% 5.1% 5.8%EBIT 3.9% 3.8% 4.5% 5.8%EBITDA before special items 4.9% 5.1% 6.3% 7.2%EBITDA 4.9% 5.1% 5.7% 7.2%
(1) Comprised of revenues from light rail vehicles, metros, commuter and regional trains, intercity trains, high speed and very high speed trains, locomotives, propulsion and controls and bogies.
(2) Comprised of revenues from fleet maintenance, refurbishment and overhaul and material solutions.(3) Comprised of revenues from mass transit and airport systems, mainline systems, operation and maintenance services, e-mobility solutions,
mass transit signalling and mainline signalling. Excludes the rolling stock portion of system orders manufactured by BT's other divisions. (4)
Includes i) severance and other involuntary termination costs (including changes in estimates), ii) losses (gains) on sale of PPE; except when such items are reported as special items.
(5) Non-GAAP financial measures. Refer to Non-GAAP financial measures sections in Overview for definitions of these metrics.(6)
The special items for the fiscal year ended December 31, 2014 relate to a restructuring charge of $57 million related to the reduction of direct and indirect positions by approximately 900 employees worldwide.
(7) Amortization is included in cost of sales, SG&A and R&D expense, based on the nature of the underlying function of the asset.
Revenues by geographic regionFourth quarters ended December 31 Fiscal years ended December 31
2014 2013 2014 2013Europe(1) $ 1,728 66% $ 1,677 68% $ 6,471 67% $ 5,874 67%North America 393 15% 429 18% 1,527 16% 1,581 18%Asia-Pacific(1) 366 14% 189 8% 1,041 11% 770 9%Rest of world(1) (2) 147 5% 156 6% 573 6% 541 6%
$ 2,634 100% $ 2,451 100% $ 9,612 100% $ 8,766 100%(1) The increases in Europe reflect a negative currency impact of $114 million for the fourth quarter and a positive currency impact of $70
million for the fiscal year ended December 31, 2014, while the increases in Asia-Pacific reflect negative currency impacts of $12 million and $38 million respectively, and the variances in the Rest of world region reflect negative currency impacts of $17 million and $34 million respectively.
(2) The Rest of world region includes South America, Central America, Africa, the Middle East and the CIS.

BOMBARDIER INC FINANCIAL REPORT - FISCAL YEAR ENDED DECEMBER 31, 2014 - TRANSPORTATION 75
Revenues excluding currency impact(1)
Fourth quarters ended December 312014 2013 Variance
RevenuesCurrency
impact
Revenuesexcluding currency
impact RevenuesRevenues
Rolling stock $ 1,746 $ (92) $ 1,838 $ 1,480 $ 358Services 434 (20) 454 450 4System and signalling 454 (31) 485 521 (36)
$ 2,634 $ (143) $ 2,777 $ 2,451 $ 326
Fiscal years ended December 312014 2013 Variance
RevenuesCurrency
impact
Revenuesexcluding currency
impact RevenuesRevenues
Rolling stock $ 6,330 $ 19 $ 6,311 $ 5,511 $ 800Services 1,717 17 1,700 1,596 104System and signalling 1,565 (38) 1,603 1,659 (56)
$ 9,612 $ (2) $ 9,614 $ 8,766 $ 848(1) The results of operations of entities using functional currencies other than the U.S. dollar (mainly the euro, pound sterling and other
European currencies) are translated into U.S. dollars using the average exchange rates for the relevant periods. The impact of lower exchange rates of foreign currencies compared to the U.S. dollar negatively affects revenues and positively affects expenses, while higher exchange rates have the opposite impacts (defined as “negative currency impact” and “positive currency impact”). See the Foreign exchange rates section in Other for the average exchange rates used to translate revenues and expenses.
The following analysis is based on revenues excluding the impact of foreign exchange.
Total revenues for the fourth quarter and fiscal year ended December 31, 2014, have increased by $326 million, or 13.3%, and $848 million, or 9.7%, respectively, compared to the same periods last fiscal year. These increases were mostly driven by ramp-up in production related to contracts in Europe and Asia-Pacific.
Rolling stock revenuesThe $358 million increase for the fourth quarter is mainly explained by:
• higher activities in Europe and Asia-Pacific mainly due to ramp-up in production related to some commuter and regional train, locomotive and high speed train contracts in Europe as well as a very high speed train contract and some metro and commuter and regional train contracts in Asia-Pacific ($428 million).
Partially offset by:• lower activities in North America and the Rest of world region following completion of some commuter and
regional train contracts in North America and some commuter and regional train and propulsion contracts in the Rest of world region, partly offset by ramp-up in production related to some locomotive contracts in the Rest of world region ($70 million).

76 BOMBARDIER INC. FINANCIAL REPORT - FISCAL YEAR ENDED DECEMBER 31, 2014
The $800 million increase for the fiscal year is mainly explained by: • higher activities in Europe and Asia-Pacific mainly due to ramp-up in production related to some
commuter and regional train, locomotive, intercity and high speed train and metro contracts in Europe as well as some commuter and regional train and metro contracts and a very high speed train contract in Asia-Pacific, partly offset by completion of some high speed train and metro contracts in Asia-Pacific ($928 million).
Partially offset by:• lower activities in North America following completion of some commuter and regional train and metro
contracts ($127 million).
Service revenuesThe $104 million increase for the fiscal year is mainly due to higher activities in Asia-Pacific and North America($130 million), partly offset by lower activities in the Rest of world region ($31 million).
System and signalling revenuesThe $36 million decrease for the fourth quarter is mainly due to:
• lower activities in Europe mostly due to finalization of a systems project ($86 million).Partially offset by: • higher activities in the Rest of world region mostly due to increased activities in systems and in signalling
contracts ($50 million).
The $56 million decrease for the fiscal year is mainly due to:• lower activities in Europe mostly due to finalization of a systems project ($249 million).Partially offset by: • higher activities in the Rest of world region and North America, mostly due to increased activities in
systems and in signalling contracts ($174 million).
EBIT marginThe EBIT margin for the fourth quarter increased by 0.1 percentage points mainly as a result of:
• a higher gross margin in rolling stock due to a favourable contract mix in the quarter; • higher absorption of lower SG&A expenses; and• a higher share of income of joint ventures and associates. Partially offset by: • a negative impact on gross margin resulting from revised escalation assumptions for some contracts,
mainly in rolling stock, which impacted estimated future revenues and resulted in a catch-up adjustment to reflect lower contract margins on revenues already recognized;
• a lower gross margin in system and signalling due to finalization of a major systems project which had a favourable impact on the contract mix in the comparative period; and
• higher R&D expenses.
The EBIT margin for the fiscal year decreased by 1.3 percentage points. The EBIT margin before special items (see explanations of special items below) decreased by 0.7 percentage points mainly as a result of:
• a lower gross margin in system and signalling due to finalization of a major systems project which had a favourable impact on the contract mix in the comparative period;
• a negative impact on gross margin resulting from revised escalation assumptions for some contracts, mainly in rolling stock, which impacted estimated future revenues and resulted in a catch-up adjustment to reflect lower contract margins on revenues already recognized; and
• a lower share of income of joint ventures and associates.Partially offset by: • a higher gross margin in rolling stock due to a favourable contract mix in the current year; and • higher absorption of lower SG&A expenses.
For the fiscal year 2014, a special item negatively impacted the EBIT margin by 0.6 percentage points, related to a restructuring charge of $57 million recorded during the third quarter. The charge related to measures taken to further improve competitiveness and cost structure of indirect functions and align capacity, mainly the reduction of direct and indirect positions by approximately 900 employees worldwide.

BOMBARDIER INC FINANCIAL REPORT - FISCAL YEAR ENDED DECEMBER 31, 2014 - TRANSPORTATION 77
Free Cash Flow
Free cash flow(1)
Fourth quarters ended December 31
Fiscal years ended December 31
2014 2013 2014 2013EBIT $ 102 $ 92 $ 429 $ 505Amortization 28 32 116 124EBITDA (1) 130 124 545 629Other non-cash items
Share of income of joint ventures and associates (25) (17) (89) (119)(Gains) losses on disposals of PP&E — — (4) 1Share-based expense (income) 2 (6) 1 6
Dividends received from joint ventures and associates 38 18 99 115Net change in non-cash balances 407 684 (323) 110Cash flows from operating activities 552 803 229 742Net additions to PP&E and intangible assets (46) (36) (107) (74)Free cash flow $ 506 $ 767 $ 122 $ 668
(1) Non-GAAP financial measures. Refer to Non-GAAP financial measures sections in Overview for definitions of these metrics.
The $261 million deterioration for the fourth quarter is mainly due to: • a negative period-over-period variation in net change in non-cash balances ($277 million) (see
explanation below); and• higher net additions to PP&E and intangible assets ($10 million). Partially offset by:• higher dividends received from joint ventures and associates ($20 million).
The $546 million deterioration for the fiscal year is mainly due to:• a negative period-over-period variation in net change in non-cash balances ($433 million) (see
explanation below);• lower EBITDA ($84 million); • higher net additions to PP&E and intangible assets ($33 million); and • lower dividends received from joint ventures and associates ($16 million). Partially offset by:• lower negative impact arising from other non-cash items ($20 million), mainly from lower share of income
of joint ventures and associates.
Net change in non-cash balancesFor the fourth quarter ended December 31, 2014, the $407 million cash inflow is mainly due to:
• an increase in trade and other payables resulting from higher activities in the quarter;• a decrease in trade and other receivables;• an increase in advances and progress billings on existing contracts and new orders;• an increase in other liabilities mainly from higher accruals for long-term contract costs; and• a decrease in inventories following delivery in a few contracts ahead of ramp-up of production.
For the fourth quarter ended December 31, 2013, the $684 million cash inflow was mainly due to:• deliveries in several contracts as well as the impact of new orders received, which led to an increase in
advances and progress billings for new orders and existing contracts and a decrease in inventories; and • an increase in trade and other payables.
For the fiscal year ended December 31, 2014, the $323 million cash outflow is mainly due to: • an increase in inventories following ramp-up of production ahead of deliveries; • an increase in trade and other receivables; • an increase in other assets mainly related to sales and other taxes; • a decrease in other liabilities; and• a decrease in retirement benefit liabilities.

78 BOMBARDIER INC. FINANCIAL REPORT - FISCAL YEAR ENDED DECEMBER 31, 2014
Partially offset by:• an increase in trade and other payables resulting from higher activities in the year;• an increase in advances and progress billings on existing contracts and new orders;• an increase in other financial liabilities, mainly related to derivative liabilities; and, • a decrease in other financial assets, mainly related to derivative assets.
For the fiscal year ended December 31, 2013, the $110 million cash inflow was mainly due to: • deliveries in several contracts as well as the impact of new orders received which led to an increase in
advances and progress billings on existing contracts and new orders; and• an increase in trade and other payables.Partially offset by:• an increase in inventories due to ramp-up of production ahead of deliveries; and• lower provisions, mostly as a result of a decrease in product warranty provisions, mainly for contracts
nearing the end of their warranty periods.
Significant order intake in all regions
Order intake and book-to-bill ratioFourth quarters
ended December 31Fiscal years
ended December 31Order intake (in billions of dollars) 2014 2013 2014 2013Rolling stock $ 1.1 $ 1.4 $ 7.0 $ 5.4Services 0.5 0.5 4.4 2.0System and signalling 0.2 — 1.2 1.4
$ 1.8 $ 1.9 $ 12.6 $ 8.8Book-to-bill ratio(1) 0.7 0.8 1.3 1.0
(1) Ratio of new orders over revenues.
ORDER INTAKE BY REGION(for fiscal years ended; in billions of dollars)
ORDER INTAKE AND BOOK-TO-BILL RATIO (for the fiscal years ended)
The order intakes for the fourth quarter and fiscal year ended December 31, 2014 reflect negative currency impacts of $140 million and $247 million, respectively.
In the fiscal year of 2014, BT won several significant orders across various regions and product segments and maintained a leading position(1) in the overall accessible rail market(2) with a cumulative order intake of $30.6 billion over the past three years. (1) Based on a rolling 36-month order intake with latest data published by companies publishing order intake for at least 36 months.(2) The overall accessible rail market is the world rail market, excluding the share of markets associated with contracts that are awarded to local
players without open-bid competition. BT’s accessible market also excludes the infrastructure, freight wagon and shunter segments.

BOMBARDIER INC FINANCIAL REPORT - FISCAL YEAR ENDED DECEMBER 31, 2014 - TRANSPORTATION 79
The significant orders obtained during the fiscal year ended December 31, 2014 were as follows:
Customer Country Product or serviceNumber of cars
Marketsegment Value
Fourth quarterSyndicat des Transports d’Île-
de-France (STIF) and Société Nationale des Chemins de fer Français (SNCF)
France Double-deck Electrical MultipleUnits (EMUs)
336 Rolling stock $ 484
Govia Thameslink Railway(GTR)
U.K. ELECTROSTAR Electrical Multiple Units (EMUs)
108 Rolling stock $ 227
Trenitalia Italy Fleet maintenance n/a Services $ 191
Third quarterNew Jersey Transit Corporation
(NJ TRANSIT)U.S. Operations and maintenance
servicesn/a Services $ 296
Société Nationale des Cheminsde fer Français (SNCF)
France Electrical Multiple Units(EMUs)
176 Rolling stock $ 218
Second quarterUndisclosed Rolling stock $ 338Railpool GmbH Germany TRAXX locomotives 35 Rolling stock $ 184Virgin Trains U.K. Extension of fleet maintenance n/a Services $ 175
First quarterState of Queensland Australia Construction of a depot and
fleet maintenancen/a Services $ 1,700
(1)
Electrical Multiple Units(EMUs)
450 Rolling stock $ 1,000(1)
Transport for London (TfL) U.K. AVENTRA trains 585 Rolling stock $ 1,400Construction of a depot and
fleet maintenancen/a Services $ 700
Transnet Freight Rail (TFR) South Africa TRAXX locomotives 240 Rolling stock $ 1,200San Francisco Bay Area Rapid
Transit District (BART)U.S. Metro cars 365 Rolling stock $ 639
Deutsche Bahn AG (DB) Germany TALENT 2 EMUs 107 Rolling stock $ 203(1) Contract signed as part of a consortium. Only the value of BT's share is stated.n/a: Not applicable

80 BOMBARDIER INC. FINANCIAL REPORT - FISCAL YEAR ENDED DECEMBER 31, 2014
Order backlogAs at
(in billions of dollars) December 31, 2014 December 31, 2013Rolling stock(1) $ 19.9 $ 21.1Services 9.3 7.4System and signalling 3.3 3.9
$ 32.5 $ 32.4(1) Of which $9.9 billion, or 50% of rolling stock order backlog, had a percentage of completion from 0% to 25% as at December 31, 2014
($12.0 billion, or 57%, as at December 31, 2013).
The $0.1 billion increase in order backlog is due to order intake being higher than revenues recorded ($3.0 billion), partially offset by the weakening of some foreign currencies versus the U.S. dollar as at December 31, 2014, compared to December 31, 2013 ($2.9 billion), mainly the euro, pound sterling, Australian dollar and Swiss franc.
ORDER BACKLOG(as at; in billions of dollars)
Increase in workforce across all regions in line with higher level of activities
Total number of employeesAs at
December 31, 2014 December 31, 2013Permanent(1) 34,750 34,250Contractual 4,950 4,250
39,700 38,500
Percentage of permanent employees covered by collective agreements 69% 67%(1) Including inactive employees.
Since December 31, 2013 the number of employees has increased in all regions by 3% or 1,200 employees.
Headcount in Asia-Pacific, North America and the Rest of world region has increased mainly as a result of the start of work on major orders received in these regions in previous fiscal years.
The increase in Europe is mostly due to the hiring of contractual employees to support increased workload in connection with the development of new products as well as the start of work on major orders received this year and in previous years. At the same time, this increase in contractual workforce was partially offset by reduction of permanent headcount.
WORKFORCE BY GEOGRAPHIC REGION(as at)

BOMBARDIER INC. FINANCIAL REPORT - FISCAL YEAR ENDED DECEMBER 31, 2014 - OTHER 81
OTHERPAGE
OFF-BALANCE SHEET ARRANGEMENTS
RISKS AND UNCERTAINTIES
ACCOUNTING AND REPORTING DEVELOPMENTS
FINANCIAL INSTRUMENTS
RELATED PARTY TRANSACTIONS
CRITICAL JUDGMENTS AND ACCOUNTING ESTIMATES
CONTROLS AND PROCEDURES
FOREIGN EXCHANGE RATES
SHAREHOLDER INFORMATION
SELECTED FINANCIAL INFORMATION
QUARTERLY DATA (UNAUDITED)
82
83
91
92
93
94
98
99
100
101
102

82 BOMBARDIER INC. FINANCIAL REPORT - FISCAL YEAR ENDED DECEMBER 31, 2014
OFF-BALANCE SHEET ARRANGEMENTSFactoring facilities
In the normal course of its business, BT has set up factoring facilities under which it can sell, without credit recourse, qualifying trade receivables. For more details, refer to Note 15 - Trade and other receivables, to the consolidated financial statements.
Credit and residual value guarantees
In connection with the sale of certain of the Corporation's products, mainly commercial aircraft, the Corporation has provided financing support in the form of credit and residual value guarantees to enhance the ability of certain customers to arrange third-party financing for their acquisitions.
Credit guarantees provide support through contractually limited payments to the guaranteed party to mitigate default-related losses. Credit guarantees are triggered if customers do not perform during the term of the financing under the relevant financing arrangements. The remaining terms of these financing arrangements range from 1 to 12 years. In the event of default, the Corporation usually act as an agent for the guaranteed parties for the repossession, refurbishment and re-marketing of the underlying assets. The Corporation typically receives a fee for these services.
Residual value guarantees provide protection to the guaranteed parties in cases where the market value of the underlying asset falls below the guaranteed value at an agreed-upon date. In most cases, these guarantees are provided as part of a customer financing arrangement (these arrangements have remaining terms ranging from 1 to 12 years). The value of the underlying asset may be adversely affected by a number of factors. To mitigate the exposure, the financing arrangements generally require the aircraft used as collateral to meet certain contractual return conditions in order to exercise the guarantee. If a residual value guarantee is exercised, it provides for a contractually limited payment to the guaranteed parties, which is typically a specified maximum amount of the first losses incurred by the guaranteed party. A claim under the guarantee may typically be made only at the end of the financing arrangement, upon the sale of the underlying asset to a third party.
When credit and residual value guarantees are provided in connection with a financing arrangement for the same underlying asset, residual value guarantees can only be exercised if the credit guarantee expires without having been exercised and, as such, the guarantees are mutually exclusive.
For more details, refer to Note 37 – Commitments and contingencies, to the consolidated financial statements.
Financing commitments
The Corporation sometimes provides financing support to facilitate customers’ access to capital. This support may take a variety of forms, including providing assistance to customers in accessing and structuring debt and equity for aircraft acquisitions or providing assurance that debt and equity are available to finance such acquisitions.
As at December 31, 2014, the Corporation had no commitments to arrange financing for customers in relation to the future sale of aircraft.
Financing structures related to the sale of commercial aircraft
In connection with the sale of commercial aircraft, BA has provided credit and/or residual value guarantees and subordinated debt to, and retained residual interests in, certain entities created solely to provide financing related to the sale of commercial aircraft. BA also provides administrative services to certain of these entities in return for a market fee.
Typically, these entities are financed by third-party long-term debt and equity. Often, equity investors benefit from tax incentives. The aircraft serve as collateral for the entities’ long-term debt.
For more details, refer to Note 36 – Unconsolidated structured entities, to the consolidated financial statements.

BOMBARDIER INC. FINANCIAL REPORT - FISCAL YEAR ENDED DECEMBER 31, 2014 - OTHER 83
RISKS AND UNCERTAINTIESThe Corporation operates in industry segments which present a variety of risk factors and uncertainties. The risks and uncertainties described below are risks that could materially affect the business activities, financial condition, cash flows and results of operations of the Corporation, but are not necessarily the only risks that the Corporation faces. Additional risks and uncertainties, presently unknown to management or currently believed to be immaterial, may also adversely affect the business.
General economicrisk
Potential loss due to unfavourable economic conditions, such as a macroeconomic downturn in keymarkets, could result in potential buyers postponing the purchase of the Corporation's products orservices, lower order intake, order cancellations or deferral of deliveries, lower availability of customerfinancing, an increase in the Corporation's involvement in customer financing, downward pressure onselling prices, increased inventory levels, decreased level of customer advances, slower collection ofreceivables, reduction in production activities, paused or discontinued production of certain products,termination of employees or adverse impacts on suppliers.
Businessenvironment risk
Business environment risk is the risk of potential loss due to external risk factors. These factors mayinclude the financial condition of the airline industry, business aircraft customers and major railoperators; government policies related to import and export restrictions and business acquisitions;changing priorities and possible spending cuts by government agencies; government support forexport sales; world trade policies including specific regional trade practices; increased competitionfrom other businesses including new entrants in market segments in which the Corporation competes;as well as scope clauses in pilot union agreements restricting the operation of smaller jetliners bymajor airlines or by their regional affiliates. In addition, acts of terrorism, natural disasters, global healthrisks, political instability or the outbreak of war or continued hostilities in certain regions of the worldcould result in lower orders or the rescheduling or cancellation of part of the existing order backlog forsome of the Corporation's products.
Operational risk Operational risk is the risk of potential loss due to the nature of the Corporation's operations. Sourcesof operational risk include development of new products and services; development of new business;actions of business partners; product performance warranty and casualty claim losses; regulatory andlegal conditions; environmental, health and safety issues; as well as dependence on customers,suppliers, partners and human resources. In addition, the large and complex projects which arecommon in the Corporation's capital intensive businesses are often structured as fixed-price contractsand thus exposed to production and project execution risks. The Corporation is also subject to risksrelated to problems with supply chain management, reliance on information systems, reliance onintellectual property rights as well as the successful integration of new business acquisitions.
Financing plan The Corporation’s ability to achieve its business and cash generation plans is based on a number ofassumptions which involve significant judgments and estimates of future performance, borrowing capacity and credit availability, which cannot at all times be assured. The Corporation has taken the initiative to launch a financing plan. The components of this plan include, inter alia, potential equity financing and debt capital markets financings.To complement the financing plan, the Corporation will explore other initiatives such as certain business activities' potential participation in industry consolidation in order to reduce debt. There are no assurances that the Corporation will be able to implement this plan or any particular strategic options or complete on favourable terms and timing or at all, and, if implemented, that such actions would have the planned results, which may have an adverse effect on the Corporation’s business, results, liquidity and financial condition.
Financing risk Financing risk is the risk of potential loss related to the liquidity of the Corporation's financial assets,including counterparty credit risk; access to capital markets; restrictive debt covenants; financingsupport provided for the benefit of certain customers; and government support.
Market risk Market risk is the risk of potential loss due to adverse movements in market factors, including foreigncurrency fluctuations, changing interest rates, decreases in residual values of assets, increases incommodity prices and inflation rate fluctuations.
Business environment risk
Financial condition of the airline industry and business aircraft customers
The airline industry’s financial condition and viability, including airlines’ ability to secure financing, can influence the demand for BA’s commercial aircraft. The nature of the airline industry makes it difficult to predict when economic downturns or recoveries will impact the industry and economic cycles may be longer than expected. Continued cost pressures and efforts to achieve acceptable profitability in the airline industry may constrain the selling price of BA’s products. Scope clauses in pilot union agreements in the U.S. restrict the operation of smaller jetliners by major airlines or by their regional affiliates and, therefore, may restrict demand in the regional aircraft market.

84 BOMBARDIER INC. FINANCIAL REPORT - FISCAL YEAR ENDED DECEMBER 31, 2014
The purchase of BA's products and services may represent a significant investment for a corporation, an individual or a government. When economic or business conditions are unfavourable, potential buyers may delay the purchase of BA's products and services. The availability of financing is also an important factor and credit scarcity can cause customers to either defer deliveries or cancel orders.
An increased supply of used aircraft as companies restructure, downsize or discontinue operations could also add downward pressure on the selling price of new and used business and commercial aircraft. BA could then be faced with the challenge of finding ways to further reduce costs and improve productivity to sustain a favourable market position at acceptable profit margins. The loss of any major commercial airline or fractional ownership or charter operator as a customer or the termination of a contract could significantly impact BA's financial results.
These challenges could continue in 2015 and beyond. The Corporation recently announced the pause of its Learjet 85 business aircraft program due to weak market demand in that segment and following a downward revision of the Corporation's business aircraft market forecast. As a result of the Corporation’s continuing review of its businesses to reduce cost, improve its manufacturing platform, and better position itself in the marketplace, it may be necessary to curtail even more production or permanently shut down facilities, which could result in asset write-downs at the affected facilities and could materially adversely impact the Corporation’s cash flows, results of operations, financial condition and prospects.
Financial condition of the rail industry
The rail industry is usually resilient during economic downturns. Challenging economic and financial conditions in specific areas, however, may have a negative impact on some rail operators. As governments respond to economic crises with austerity measures or by increasing their level of indebtedness to fund economic stimulus plans, it may become more difficult for publicly-owned rail operators to obtain government funding. Funding shortages may result in projects being reduced in size, postponed or even cancelled. Such actions by rail operators or governments would negatively impact BT’s order intake and revenues and put pressure on the cost structure and prices. In addition, payment terms, including the level and timing of advance payments from BT's customers, may deteriorate and negatively impact cash flows.
Political instability
Political instability in certain regions of the world may be prolonged and unpredictable. A prolongation of political instability could lead to delays or cancellation of orders, deliveries or projects in which the Corporation has invested significant resources, particularly when the customers are state-owned or state-controlled entities.
Force majeure events or natural disasters
Force majeure events or natural disasters (including seismic and severe weather-related events such as ice storms, hurricanes, flooding, tornadoes or other calamities) are unpredictable and may have significant adverse results such as: personal injury or fatality; damage to or destruction of ongoing projects, facilities or equipment; environmental damage; delays or cancellations of orders and deliveries; delays in the receipt of materials from the Corporation's suppliers; delays in projects; or legal liability.
Operational risk
Developing new products and services
Changes as a result of global trends such as climate change, oil scarcity, the rising cost of energy, urbanization, population growth and demographic factors influence customer demands in the Corporation's main markets. To meet customers’ needs, the Corporation must continuously develop and design new products, improve existing products and services and invest in and develop new technologies. Introducing new products or technologies requires a significant commitment to R&D investment, including maintaining a significant level of highly skilled employees. Furthermore, the Corporation's investments in new products or technologies may or may not be successful.

BOMBARDIER INC. FINANCIAL REPORT - FISCAL YEAR ENDED DECEMBER 31, 2014 - OTHER 85
Results may be impacted if products are invested in that are not accepted in the marketplace, if customer demand or preferences change, if new products are not approved by regulatory authorities or are not brought to market in a timely manner or if the Corporation's products become obsolete. Cost overruns may be incurred in developing new products and there is the risk that new products will not meet performance specifications to which the Corporation has committed to customers. Despite measures used to protect proprietary information such as confidentiality agreements, patents and licenses, the Corporation may not always be able to enforce the right to intellectual property or preclude misuse of technology.
The Corporation is subject to stringent certification and approval requirements, as well as to the ability of regulatory bodies to perform these assessments on a timely basis, which vary by country and can delay the certification of products. Non-compliance with current or future regulatory requirements imposed by Transport Canada (TC), the U.S. Federal Aviation Administration (FAA), the European Aviation Safety Agency (EASA), the Transport Safety Institute in the U.S., national rail regulatory bodies or other regulatory authorities could result in service interruption of the Corporation's products, fewer sales or slower deliveries, reduction in inventory values or impairment of assets.
In the market segments in which BA competes, competitors are developing numerous aircraft programs, with entries-into-service expected throughout the next decade. BA faces the risk that market share may be eroded if potential customers opt for competitors’ products. The Corporation may also be negatively impacted if product support expectations are not met or exceeded or an international presence is not provided for a diverse customer base.
Customer acceptance of BT’s highly complex and customized products may be delayed for various reasons, including customer requirements not being met or a divergence in the interpretation of customer requirements, which may also result in delayed deliveries, a build-up of inventories and a consequential financial impact. BT’s results could also be negatively impacted if the Corporation fails to design or obtain accreditation for new technologies and platforms on budget and in a timely manner. Further, long-term growth, competitiveness and continued profitability are dependent on the ability to continue to develop product mix and align global presence with worldwide market opportunities.
In the market segments in which BT competes, increased consolidation and competitiveness was recognized in the last years. BT faces the risk that market share may be eroded if these competitors further grow their presence or that pressure on market prices lead to lower margins.
Fixed-price commitments, capital intensive businesses and production and project execution
The Corporation has historically offered, and will continue to offer, virtually all products on fixed price contracts rather than contracts under which payment is determined solely on a time and material basis. Generally, the Corporation cannot terminate contracts unilaterally.
Risks are associated with these fixed-price contracts, including unexpected technological problems, difficulties with partners and subcontractors, logistical difficulties and other execution issues that could lead to cost overruns, late delivery penalties or delays in receiving milestone payments. The Corporation may also incur late delivery penalties in the event of an inability to increase production rates quickly enough to meet commitments. In addition, due to the nature of the bidding process, long-term contract revenues are based, in part, on cost estimates which in turn are subject to a number of assumptions such as forecasted costs of materials, inflation rates, foreign exchange rates, labour productivity, employment levels and salaries, and are influenced by the nature and complexity of the work to be performed. Long-term contract revenues and costs may also vary from initial forecasts due to the impact of change orders and delayed deliveries.
In addition, the Corporation’s businesses are capital intensive and require that it regularly incur capital expenditures in order to, among other matters, maintain equipment, increase operating efficiency, continuously develop and design new products, improve existing products and services, invest in and develop new technologies and maintain a significant level of highly skilled employees. If the Corporation's cash flows and capital resources are insufficient to fund its programs and other capital expenditures and debt service obligations, the Corporation could be forced to reduce or delay investments and capital expenditures or to seek additional

86 BOMBARDIER INC. FINANCIAL REPORT - FISCAL YEAR ENDED DECEMBER 31, 2014
debt or equity capital. The Corporation may not be able to effect any such alternative measures, if necessary, on favorable terms or at all. Business partners
In some of the projects carried out through consortia or other partnership vehicles in which the Corporation participates, partners are jointly and severally liable to the customer. The success of these partnerships is dependent on satisfactory performance by the Corporation and business partners. Failure of the business partners to fulfill their contractual obligations could result in additional financial and performance obligations which could result in increased costs, unforeseen delays or impairment of assets. In addition, a partner withdrawing from a consortium during the bid phase may result in the loss of potential order intake.
Product performance warranty and casualty claim losses
The products that the Corporation manufactures are highly complex and sophisticated and may contain defects that are difficult to detect or correct. These products are subject to detailed specifications, which are listed in the individual contracts with customers, as well as to stringent certification or approval requirements. Defects may be found in products before and after they are delivered to the customer. When discovered, the Corporation may incur significant additional costs to modify and/or retrofit products and may not be able to correct defects in a timely manner or at all. The occurrence of defects and failures in products could give rise to non-conformity costs, including warranty and damage claims, negatively affects the Corporation's reputation and profitability and result in the loss of customers. Correcting such defects could require significant capital investment.
In addition, due to the nature of the Corporation's business, there may be liability claims arising from accidents, incidents or disasters involving products and services that the Corporation has provided, including claims for serious personal injuries or death. These accidents may include misfortunes caused by climatic factors or human error. The Corporation cannot be certain that current insurance coverage will be sufficient to cover one or more substantial claims. Furthermore, there can be no assurance that the Corporation will be able to obtain insurance coverage at acceptable levels and costs in the future.
Regulatory and legal risks
The Corporation is subject to numerous risks relating to current and future regulations, as well as legal proceedings, both present or that may arise in the future, like the harmonization of the European railway market through the new European standards which will require investments in upgrading existing products. The Corporation becomes party to lawsuits in the ordinary course of business, including those involving allegations of late deliveries of goods or services, product liability, product defects, quality problems and intellectual property infringement. Material losses may be incurred relating to litigation beyond the limits or outside the coverage of current insurance and existing provisions for litigation-related losses may not be sufficient to cover the ultimate loss or expenditure. In addition, employee, agent, supplier or partner misconduct or failure to comply with anti-bribery and other government laws and regulations could harm the Corporation's reputation, reduce revenues and profitability, and subject the Corporation to criminal and civil enforcement actions.
Also refer to Note 37 – Commitments and contingencies, to the consolidated financial statements, for information regarding current litigation proceedings, related to the S-Bahn claim and the investigation in Brazil.
Environmental, health and safety risks
The Corporation's products, as well as manufacturing and service activities, are subject to environmental laws and regulations in each operating jurisdiction, governing, among other things: product performance or materials content; energy use and greenhouse gas emissions; air, water and noise pollution; the use, storage, labelling, transportation and disposal or release of hazardous substances; human health risks arising from the exposure to hazardous or toxic materials; and the remediation of soil and groundwater contamination on or under the Corporation's properties (regardless of cause), or on or under other properties and caused by current or past corporate operations.

BOMBARDIER INC. FINANCIAL REPORT - FISCAL YEAR ENDED DECEMBER 31, 2014 - OTHER 87
Environmental regulatory requirements, or enforcements thereof, may become more stringent in the future and the Corporation may incur additional costs to be compliant with such future requirements or enforcements. In addition, there may be contractual or other liabilities for environmental matters relating to businesses, products or properties that the Corporation has closed, sold or otherwise disposed of, or will close, sell or dispose of in the future.
Dependence on customers
The Corporation depends on a limited number of customers and management believe that this dependence will persist. Consequently, the loss of such a customer could result in fewer sales and/or a lower market share. Since the majority of BT’s customers are public-sector companies or operate under public contracts, BT’s order intake is also dependent on public-sector budgets and spending policies.
Business development
The Corporation’s businesses are dependent on obtaining new orders and customers, thus continuously replenishing the order backlog. The Corporation’s results may be negatively impacted if the Corporation is unable to effectively execute strategies to gain access to new markets, capture growth or successfully establish roots in new markets.
Dependence on suppliers
The Corporation's manufacturing operations are dependent on a limited number of suppliers for the delivery of raw materials (mainly aluminum, advanced aluminum alloy and titanium) and major systems (such as engines, wings, nacelles, landing gear, avionics, flight controls and fuselages) at BA, and raw materials (mainly steel and aluminum), services (mainly engineering, civil and electrical subcontracts) and major systems (such as brakes, doors, heating, ventilation and air conditioning) at BT. A failure by one or more suppliers to meet performance specifications, quality standards or delivery schedules could adversely affect the Corporation's ability to meet commitments to customers.
Some of these suppliers participate in the development of products such as aircraft or rolling stock platforms. The advancement of many of the Corporation's new product development programs also relies on the performance of these key suppliers and, therefore, supplier delays which go unmitigated could result in delays to a program as a whole. These suppliers subsequently deliver major components and own some of the intellectual property related to key components they have developed. Contracts with these suppliers are therefore on a long-term basis. The replacement of such suppliers could be costly and take a significant amount of time.
Human resources (including collective agreements)
Human resource risk includes the risk of delays in the recruitment of or inability to retain and motivate highly skilled employees, including those involved in R&D and manufacturing activities that are essential to success. In addition, the Corporation is party to several collective agreements that are due to expire at various times in the future. An inability to renew these collective agreements on mutually agreeable terms, as they become subject to renegotiation from time to time, could result in work stoppages or other labour disturbances such as strikes, walk-outs or lock-outs, and/or increased costs of labour, which could adversely affect the Corporation's ability to deliver products and services in a timely manner.

88 BOMBARDIER INC. FINANCIAL REPORT - FISCAL YEAR ENDED DECEMBER 31, 2014
Financing risk
Liquidity and access to capital markets
Sufficient capital resources and continued access to capital markets are required to support the Corporation's capital intensive operating activities and the development of new products. To satisfy these financing needs, the Corporation relies on cash and cash equivalents, cash flows generated by operations, capital market resources such as debt and equity and other financing arrangements such as revolving credit facilities. A decline in credit ratings, a significant reduction in the surety or financing market global capacity, widening credit spreads, changes in the Corporation’s outlook or guidance, significant changes in market interest rates or general economic conditions or an adverse perception in bank and capital markets of the Corporation's financial condition or prospects could all significantly increase the cost of financing or impede the Corporation’s ability to access financial markets. The Corporation has recently experienced corporate credit ratings downgrades and has been placed under review for possible additional downgrade. The Corporation's credit ratings may be impacted by many factors, including factors outside of the Corporation’s control relating to the industries or countriesand regions in which it operates, and, accordingly, no assurance can be given that they may not be downgraded in the future. Actual or anticipated changes or downgrades in our credit ratings, including any announcement that our ratings are under further review for a downgrade, may increase the Corporation's borrowing costs.
The Corporation's right to convert into cash certain deposits or investments, held in financing structures to guarantee obligations, may be subject to restrictions. Additionally, in some countries, cash generated by operations may be subject to restrictions on the right to convert and/or repatriate money and may thus not be available for immediate use.
Retirement benefit plan risk
The Corporation is required to make contributions to a number of pension plans, most of which are presently in a deficit position. Pension funding requirements are dependent on regulatory requirements and on the valuations of plan assets and liabilities, which are subject to a number of factors, including expected returns on plan assets, long-term interest rates, as well as applicable actuarial practices and various other assumptions. The potential requirement to make additional contributions as a result of changes to regulations or other factors may reduce the amount of funds available for operating purposes, thus weakening the Corporation's financial condition.
There is no assurance that retirement benefit plan assets will earn the expected rates of return. The ability of retirement benefit plan assets to earn these expected rates of return depends in large part on the performance of capital markets. Market conditions also affect the discount rates used to calculate the Corporation's net retirement benefit liabilities and could also impact retirement benefit costs, cash funding requirements and liquidity position.
Credit risk
The Corporation is exposed to credit risk through derivative financial instruments and other investing activities carried out as part of normal treasury activities, as well as through trade receivables arising from normal commercial activities and through financing activities provided to BA customers primarily in the form of aircraft loans and lease receivables. Reduced liquidity may result if customers or other counterparties are unable to make payment of amounts owed to the Corporation, or delay these payments, which could lead to impairment losses on these assets. Furthermore, if customers experience deteriorating credit quality, the Corporation may need to: i) provide additional direct or indirect financing support to maintain sales, increasing exposure to credit risk, or ii) reduce customers’ credit limits, which could negatively affect revenues.
The Corporation also has exposure to banks in the form of i) deposits periodically placed and ii) credit commitments. In the case of the latter, in the event the banks with which the Corporation transacts are unable to withstand regulatory or liquidity pressures, credit facilities, including letter of credit facilities, may become unavailable or extension of such facilities upon their maturity might not be possible.

BOMBARDIER INC. FINANCIAL REPORT - FISCAL YEAR ENDED DECEMBER 31, 2014 - OTHER 89
Substantial debt and significant interest payment requirements
The Corporation currently has, and will continue to have, a substantial amount of debt and significant interest payment requirements. The Corporation’s level of indebtedness could have significant consequences, including the following:• making it more difficult for it to satisfy its obligations with respect to its indebtedness;• increasing its vulnerability to general adverse economic and industry conditions;• requiring it to dedicate a substantial portion of its cash flows from operations to making interest and principal
payments on its indebtedness, reducing the availability of its cash flows to fund capital expenditures, working capital, acquisitions, new business initiatives and other general corporate purposes;
• limiting its flexibility in planning for, or reacting to, changes in its businesses and the industries in which it operates;
• placing it at a disadvantage compared to its competitors that have less debt or greater financial resources;• limiting, along with the financial and other restrictive covenants in its indebtedness, among other things, its
ability to borrow additional funds on commercially reasonable terms, if at all;• cause it to monetize assets on terms that may be unfavourable to it; and• cause it to offer debt or equity securities on terms that may not be favourable to the Corporation or its
shareholders.
For more information regarding the Corporation’s long-term debt, see notes to the Corporation’s audited consolidated financial statements for the fiscal years ended December 31, 2014 and December 31, 2013.
Restrictive debt covenants
The indentures governing certain of the Corporation's indebtedness, revolving credit facilities and letter of credit facilities contain covenants that, among other things, restrict the ability of the Corporation, and in some cases the ability of its subsidiaries, to: • incur additional debt and provide guarantees;• repay subordinated debt;• create or permit certain liens;• use the proceeds from the sale of assets and capital stock of subsidiaries;• pay dividends and make certain other disbursements;• allow subsidiaries to pay dividends or make other payments;• engage in certain transactions with affiliates; and• enter into certain consolidations, mergers or transfers of all or certain assets.
These restrictions could impair the Corporation's ability to finance future operations or capital needs, or engage in other business activities that may be beneficial.
The Corporation is subject to various financial covenants under the BA and BT letter of credit facilities and unsecured revolving credit facilities which must be met on a quarterly basis. The BA $600-million letter of credit facility and the $750-million unsecured revolving facility include financial covenants requiring a minimum EBITDA to fixed charges ratio, a maximum net debt to EBITDA ratio and a minimum liquidity level of $500 million, all calculated based on an adjusted consolidated basis (i.e. excluding BT). BT’s €3.5-billion letter of credit facility and €500-million unsecured revolving facility require a minimum liquidity level of €600 million as well as a minimum equity level and a maximum debt to EBITDA ratio, all calculated on a BT stand-alone basis. These terms and ratios are defined in their respective agreements and do not correspond to the Corporation's global metrics or to specific terms used in the MD&A.

90 BOMBARDIER INC. FINANCIAL REPORT - FISCAL YEAR ENDED DECEMBER 31, 2014
The Corporation's ability to comply with these covenants may also be affected by events beyond its control. A breach of any of these agreements or the inability to comply with these covenants could result in a default under these facilities, which would permit the Corporation's banks to request immediate defeasance or cash cover of all outstanding letters of credit, and bond holders and other lenders to declare amounts owed to them to be immediately payable. If any of these facilities is accelerated, or the Corporation is subject to significant cash cover calls, the Corporation may not have access to sufficient liquidity or credit to refinance such facilities. In addition, if the Corporation incurs additional debt in the future, it may be subject to additional covenants, which may be more restrictive than those that it is subject to now.
Financing support provided for the benefit of certain customers
From time to time, the Corporation provides aircraft financing support to customers. This support may include, directly or indirectly, credit and residual value guarantees or guarantee of a maximum credit spread, to support financing for certain customers such as airlines or to support financing by certain special purpose entities created solely i) to purchase commercial aircraft and to lease those aircraft to airline companies or ii) to purchase financial assets such as loans and lease receivables related to the sale of commercial aircraft. Under these arrangements, the Corporation is obligated to make payments to a guaranteed party in the event that the original debtor or lessee does not make the loan or lease payments, or if the market or resale value of the aircraft is below the guaranteed residual value amount at an agreed-upon date. A substantial portion of these guarantees has been extended to support original debtors or lessees with less than investment grade credit ratings.
Government support
From time to time, the Corporation receives various types of government financial support. Some of these financial support programs require the repayment of amounts to the government at the time of product delivery. The level of government support reflects government policy and depends on fiscal spending levels and other political and economic factors. Management cannot predict if future government-sponsored support will be available. The loss of or any substantial reduction in the availability of government support could negatively impact liquidity assumptions related to the development of aircraft or rail products and services. In addition, any future government support received by competitors could have a negative impact on the Corporation's competitiveness, sales and market share.
Market risk
Foreign exchange risk
The Corporation's financial results are reported in U.S. dollars and a significant portion of sales and operating costs are transacted in currencies other than U.S. dollars, most often euros, Canadian dollars, pounds sterling, Swiss francs and Swedish kronor. The results of operations are therefore affected by movements in these currencies against the U.S. dollar. Significant fluctuations in relative currency values against the U.S. dollar could thus have a significant impact on future profitability. Additionally, the settlement timing of foreign currency derivatives could significantly impact liquidity.
Interest rate risk
Changes in interest rates may result in fluctuations in future cash flows related to variable rate financial assets and liabilities, including long-term fixed-rate debt synthetically converted to variable interest rates. Changes in interest rates may also affect future cash flows related to commitments to provide financing support to facilitate customers’ access to capital. For these items, cash flows could be impacted by changes in benchmark rates such as Libor, Euribor or Bankers’ Acceptance. In addition, the Corporation is exposed to gains and losses arising from changes in interest rates, including marketability risk, through financial instruments carried at fair value such as certain aircraft loans and lease receivables, investments in securities and certain derivatives.

BOMBARDIER INC. FINANCIAL REPORT - FISCAL YEAR ENDED DECEMBER 31, 2014 - OTHER 91
Residual value risk
The Corporation is exposed to residual value risks through RVGs provided in support of commercial aircraft sales. These RVGs may be provided either directly to an airline, a lessor or to a financing party that participates in a long-term financing associated with the sale of commercial aircraft. RVGs are offered as a strip of the value of an aircraft with a ceiling and a floor. If the underlying aircraft is sold at the end of the financing period (or during this period in limited circumstances), the resale value is compared to the RVG strip. The Corporation is required to make payments under these RVGs when the resale value of the aircraft falls below the ceiling of the strip covered by the guarantee, but payment is capped at the floor of the strip if the resale value of the aircraft is below that level.
Commodity price risk
The Corporation is exposed to commodity price risk relating principally to fluctuations in the cost of materials used in the supply chain, such as aluminum, advanced aluminum alloy, titanium and steel, which could adversely affect the business and results of operations.
Inflation risk
BA is exposed to inflation risk relating to fluctuations in costs and revenue for aircraft orders received but for which the delivery of the aircraft will take place several years in the future. Revenues for these orders are adjusted for price escalation clauses linked to inflation. At BT, contract cost estimates are subject to inflation rate assumptions. Estimated revenues at completion are adjusted for price escalation clauses, several of which are linked to inflation. Fluctuations in inflation rates could have a significant impact on future profitability if the inflation rate assumption used varies from the actual inflation rate.
ACCOUNTING AND REPORTING DEVELOPMENTS
Future changes in accounting policiesFinancial instruments In July 2014, the IASB completed the three-part project to replace IAS 39, Financial instruments: recognition and measurement by issuing IFRS 9, Financial instruments. IFRS 9, Financial instruments includes classification and measurement of financial assets and financial liabilities, a forward-looking ‘expected loss’ impairment model and a substantially-reformed approach to hedge accounting.
IFRS 9 uses a new approach to determine whether a financial asset is measured at amortized cost or fair value, replacing the multiple rules in IAS 39. The approach in IFRS 9 is based on how an entity manages its financial instruments and the contractual cash flow characteristics of the financial assets. Most of the requirements in IAS 39 for classification and measurement of financial liabilities were carried forward in IFRS 9. However, the portion of the changes in fair value related to the entity’s own credit risk, in measuring a financial liability at FVTP&L, will be presented in OCI rather than in the statement of income.
IFRS 9 also introduced a new, expected-loss impairment model that will require more timely recognition of expected credit losses. Specifically, the new Standard requires entities to account for expected credit losses from when financial instruments are first recognized and to recognize full lifetime expected losses on a more timely basis.
Lastly, IFRS 9 introduced a new hedge accounting model, together with corresponding disclosures about risk management activities. The new hedge accounting model, represents a substantial overhaul of hedge accounting that will enable entities to better reflect their risk management activities in their financial statements.
IFRS 9 will be effective for the Corporation’s fiscal year beginning on January 1, 2018, with earlier application permitted. The Corporation has not yet assessed the impact of the adoption of this standard on its consolidated financial statements.

92 BOMBARDIER INC. FINANCIAL REPORT - FISCAL YEAR ENDED DECEMBER 31, 2014
Employee benefits In November 2013, the IASB amended IAS 19, Employee benefits, in order to simplify the accounting for contributions of defined benefit plans that are independent of the number of years of employee service, for example, employee contributions that are calculated according to a fixed percentage of salary. This amendment will be effective for the Corporation’s fiscal year beginning on January 1, 2015, with earlier application permitted. The Corporation has started to assess the impact the adoption of this standard will have on its consolidated financial statements and no significant impact is expected.
Revenue Recognition In May 2014, the IASB released IFRS 15, Revenue from contracts with customers, which supersedes IAS 11, Construction Contracts, IAS 18, Revenues, IFRIC 13, Customer Loyalty Programs, IFRIC 15, Agreement for the Construction of Real Estate, IFRIC 18, Transfers of Assets from Customers and SIC-31, Revenue – Barter Transactions Involving Advertising Services. The core principle of IFRS 15 is that an entity should recognize revenue to depict the transfer of promised goods or services to customers in an amount that reflects the consideration to which the entity expects to be entitled in exchange for those goods or services. IFRS 15 will also result in enhanced disclosures about revenue, provide guidance for transactions that were not previously addressed comprehensively (for example, service revenue and contract modifications) and improve guidance for multiple-element arrangements. IFRS 15 will be effective for the Corporation’s fiscal year beginning on January 1, 2017, with earlier application permitted. The Corporation has not yet assessed the impact of the adoption of this standard on its consolidated financial statements.
FINANCIAL INSTRUMENTSAn important portion of the consolidated balance sheets is composed of financial instruments. Financial assets of the Corporation include cash and cash equivalents, trade and other receivables, aircraft loans and lease receivables, investments in securities, investments in financing structures, long-term contract receivables, restricted cash and derivative financial instruments with a positive fair value. Financial liabilities of the Corporation include trade and other payables, long-term debt, lease subsidies, government refundable advances, vendor non-recurring costs, sale and leaseback obligations and derivative financial instruments with a negative fair value. Derivative financial instruments are mainly used to manage exposure to foreign exchange and interest rate risks. They consist mostly of forward foreign exchange contracts, interest rate swap agreements and cross-currency interest rate swap agreements.
The use of financial instruments exposes the Corporation primarily to credit, liquidity and market risks, including foreign exchange and interest rate risks. A description on how these risks are managed is included in the Risk management section of Overview and in Note 32 – Financial risk management, to the consolidated financial statements.
Fair value of financial instruments
All financial instruments are required to be recognized at their fair value on initial recognition, plus transaction costs for financial instruments not at FVTP&L. Subsequent measurement is at amortized cost or fair value depending on the classifications of the financial instruments. Financial instruments classified as FVTP&L or AFS are carried at fair value, while all others are carried at amortized cost. The classification of financial instruments as well as the revenues, expenses, gains and losses associated with these instruments are provided in Note 2 - Summary of significant accounting policies and in Note 13 – Financial instruments, to the consolidated financial statements.

BOMBARDIER INC. FINANCIAL REPORT - FISCAL YEAR ENDED DECEMBER 31, 2014 - OTHER 93
Note 33 - Fair value of financial instruments, to the consolidated financial statements, provides a detailed description of the methods and assumptions used to determine the fair values of financial instruments. These values are point-in-time estimates that may change in subsequent reporting periods due to market conditions or other factors. Fair value is determined by reference to quoted prices in the principal market for that instrument to which the Corporation has immediate access. However, there is no active market for most of the Corporation’s financial instruments. In the absence of an active market, the Corporation determines fair value based on internal or external valuation models, such as stochastic models, option-pricing models and discounted cash flow models. Fair value determined using valuation models requires the use of assumptions concerning the amount and timing of estimated future cash flows, discount rates, the creditworthiness of the borrower, the aircraft’s expected future value, default probability, generic industrial bond spreads and marketability risk. In determining these assumptions, the Corporation uses primarily external, readily observable market inputs, including factors such as interest rates, credit ratings, credit spreads, default probabilities, currency rates, and price and rate volatilities, as applicable. Assumptions or inputs that are not based on observable market data are used when external data are unavailable. These calculations represent management’s best estimates. Since they are based on estimates, the fair values may not be realized in an actual sale or immediate settlement of the instruments.
Note 33 – Fair value of financial instruments, to the consolidated financial statements, also provides a three-level fair value hierarchy, categorizing financial instruments by the inputs used to measure their fair value. The fair value hierarchy gives the highest priority to unadjusted quoted prices in active markets (Level 1) and the lowest priority to unobservable inputs (Level 3). In cases where the inputs used to measure fair value are categorized within different levels of hierarchy, the fair value measurement is reported at the lowest level of the input that is significant to the entire measurement. Assessing the significance of a particular input to the fair value measurement in its entirety requires judgment, taking into account factors specific to the asset or liability. The fair value hierarchy is not meant to provide insight on the liquidity characteristics of a particular asset or on the degree of sensitivity of an asset or liability to other market inputs or factors.
The Corporation considers gains and losses arising from certain changes in fair value of financial instruments incidental to core performance, such as those arising from changes in market yields, as the Corporation's intention is to continue to hold these instruments for the foreseeable future. These gains and losses are excluded from adjusted net income and adjusted EPS to provide users of the financial statements a better understanding of the core results of business and enable better comparability of results from one period to another and with peers.
In connection with the sale of commercial aircraft, the Corporation holds financial assets and has incurred financial liabilities, measured at fair value, some of which are reported as Level 3 financial instruments, including certain aircraft loans and lease receivables, certain investments in financing structures and lease subsidies. The fair values of these financial instruments are determined using various assumptions, with the assumption on marketability risk being the most likely to change the fair value significantly from period to period. The fair value of aircraft loans and lease receivables was also moderately impacted by credit rating changes in the recent past.
Sensitivity analysisThe Corporation's main exposures to changes in fair value of financial instruments are related to changes in foreign exchange, interest rates, aircraft residual value curves, credit ratings and marketability adjustments. Note 32 – Financial risk management and Note 33 – Fair value of financial instruments, to the consolidated financial statements, present sensitivity analyses assuming variations in foreign exchange and interest rates.
RELATED PARTY TRANSACTIONSRelated parties, as defined by IFRS, are the Corporation's joint ventures, associates and key management personnel. A description of transactions with these related parties is included in Note 35 – Transactions with related parties, to the consolidated financial statements.

94 BOMBARDIER INC. FINANCIAL REPORT - FISCAL YEAR ENDED DECEMBER 31, 2014
CRITICAL JUDGMENTS AND ACCOUNTING ESTIMATESThe Corporation's significant accounting policies and use of estimates and judgment are described in Note 2 – Summary of significant accounting policies and Note 4 – Use of estimates and judgment, to the consolidated financial statements. The preparation of financial statements in conformity with IFRS requires the use of estimates and judgment. Critical accounting estimates, which are evaluated on a regular ongoing basis and can change from period to period, are described in this section. An accounting estimate is considered critical if:
• the estimate requires management to make assumptions about matters that are highly uncertain at the time the estimate is made; and
• management could have reasonably used different estimates in the current period, or changes in the estimate are reasonably likely to occur from period to period that would have a material impact on the Corporation's financial condition, changes in financial condition or results of operations.
Management’s best estimates regarding the future are based on the facts and circumstances available at the time estimates are made. Management uses historical experience, general economic conditions and trends, as well as assumptions regarding probable future outcomes as the basis for determining estimates. Estimates and their underlying assumptions are reviewed periodically and the effects of any changes are recognized immediately. Actual results will differ from the estimates used, and such differences could be material.
Management’s budget and strategic plan cover a three-year period and are fundamental information used as a basis for many estimates necessary to prepare financial information. Management prepares a budget and strategic plan covering a three-year period, on an annual basis, using a process whereby a detailed one-year budget and two-year strategic plan are prepared by each business unit and then consolidated at the reportable segment and Corporation levels. Cash flows and profitability included in the budget and strategic plan are based on existing and future contracts and orders, general market conditions, current cost structures, anticipated cost variations and in-force collective agreements. The budget and strategic plan are subject to approval at various levels, including senior management and the Board of Directors. Management uses the budget and strategic plan as well as additional projections or assumptions to derive the expected results for periods thereafter. Management then tracks performance as compared to the budget and strategic plan at various levels within the Corporation. Significant variances in actual performance are a key trigger to assess whether certain estimates used in the preparation of financial information must be revised.
The following areas require management’s most critical estimates and judgments. The sensitivity analyses below should be used with caution as the changes are hypothetical and the impact of changes in each key assumption may not be linear.
Long-term contracts
BT conducts most of its business under long-term manufacturing and service contracts and BA has some long-term maintenance service contracts, as well as design and development contracts for third parties. Revenues and margins from long-term contracts relating to the designing, engineering or manufacturing of specially designed products (including rail vehicles and component overhaul) and service contracts are recognized using the percentage-of-completion method of accounting. The long-term nature of these contracts requires estimates of total contract costs and revenues at completion.
Estimated revenues at completion are adjusted for change orders, claims, performance incentives, price escalation clauses and other contract terms that provide for the adjustment of prices. If it is probable that changes in revenues will occur, they are included in estimated revenues at completion.
Contract costs include material, direct labour, manufacturing overhead and other costs, such as warranty and freight. Estimated contract costs at completion incorporate forecasts for material and labour usage and costs, foreign exchange rates (including the effect of hedges) and labour productivity. These costs are influenced by the nature and complexity of the work to be performed, as well as the impact of change orders and potential delays in delivery. Cost estimates are based mainly on historical performance trends, economic trends, collective agreements and contracts signed with suppliers. Management applies judgment to determine the probability that the Corporation will incur additional costs from delays or other penalties and such costs, if probable, are included in estimated costs at completion.

BOMBARDIER INC. FINANCIAL REPORT - FISCAL YEAR ENDED DECEMBER 31, 2014 - OTHER 95
Recognized revenues and margins are subject to revisions as contracts progress towards completion. Management conducts quarterly reviews of estimated costs and revenues to completion on a contract-by-contract basis. In addition, a detailed annual review is performed on a contract-by-contract basis as part of the budget and strategic plan process. The effect of any revision may be significant and is recorded by way of a cumulative catch-up adjustment in the period in which the estimates are revised. In the fourth quarter of fiscal year 2014, the Corporation revised the escalation assumptions for some contracts, mainly in rolling stock, which impacted estimated future revenues and resulted in a catch-up adjustment to reflect lower contract margins on revenue already recognized.
Sensitivity analysisA 1% increase in the estimated future costs to complete all ongoing long-term contracts would have decreased BT’s gross margin for fiscal year 2014 by approximately $97 million.
Aerospace program tooling
BA capitalizes development costs as aerospace program tooling when certain criteria for deferral are met. Aerospace program tooling is amortized over the expected number of aircraft to be produced, beginning on the delivery date of the first aircraft of a program, and an impairment test is performed at least annually for aircraft programs under development and, for all programs, when there is an indication that the asset may be impaired. An impairment charge is recorded when the recoverable amount of a group of assets generating independent cash inflows (a CGU) is less than the carrying value of those assets.
If key estimates change significantly, amortization expense may be understated or capitalized costs may not be recoverable and aerospace program tooling may be overstated.
Aerospace program tooling amortization and the calculation of recoverable amounts used in impairment testing require estimates of the expected number of aircraft to be delivered over the life of each program. The expected number of aircraft is based on management’s aircraft market forecasts and the Corporation's expected share of each market. Such estimates are reviewed in detail as part of the budget and strategic plan process. For purposes of impairment testing, management exercises judgment to identify independent cash inflows to identify CGUs by family of aircraft. The recoverable amount of a group of assets is based on fair value less costs of disposal, generally determined using a discounted cash flow model. Other key estimates used to determine the recoverable amount include the applicable discount rate, the expected future cash flows over the remaining life of each program, which include costs to complete the development activities, if any, as well as potential upgrades and derivatives expected over the life of the program. The estimated cost of potential upgrades and derivatives is based on past experience with previous programs. They also include future cash flows from aftermarket activities, as well as expected cost savings due to synergies from the perspective of a market participant.
The discount rate is based on a weighted average cost of capital calculated using market-based inputs, available directly from financial markets or based on a benchmark sampling of representative publicly traded companies in the aerospace sector.
The estimated future cash flows for the first three years are based on the budget and strategic plan. After the initial three years, long-range forecasts prepared by management are used. Forecast future cash flows are based on management’s risk-adjusted best estimate of future sales under existing firm orders, expected future orders, timing of payments based on expected delivery schedule, revenues from related services, procurement costs based on existing contracts with suppliers, future labour costs, general market conditions, foreign exchange rates and applicable income tax rates. The recoverable amounts were established during the fourth quarter of fiscal year 2014 using the assumptions described above. A post-tax discount rate of 8.0% was used.
On January 15, 2015 the Corporation announced its decision to pause the Learjet 85 business aircraft program. The pause follows a downward revision of Bombardier’s business aircraft market forecast, primarily due the continued weakness of the light aircraft category since the economic downturn. As a result, the Corporation has recorded an impairment charge in the fourth quarter of fiscal year 2014 of $1.3 billion. See Note 20 - Intangible assets to the consolidated financial statements for further details.

96 BOMBARDIER INC. FINANCIAL REPORT - FISCAL YEAR ENDED DECEMBER 31, 2014
Sensitivity analysisThe following analyses are presented in isolation from one another, i.e. all other estimates left unchanged:
A 10% decrease in the expected future net cash inflows for all programs evenly distributed over future periods, would have resulted in an additional impairment charge of approximately $410 million in fiscal year 2014 for certain programs under development.
An increase of 100-basis points in the discount rate used to perform the impairment test would have resulted in an additional impairment charge of approximately $440 million in fiscal year 2014 for certain programs under development.
Goodwill
Goodwill is related to the DaimlerChrysler Rail Systems GmbH (Adtranz) acquisition in May 2001. This goodwill is monitored by management at the BT operating segment level. An impairment assessment is performed at least annually, and whenever circumstances such as significant declines in expected sales, earnings or cash flows indicate that it is more likely than not that goodwill might be impaired. The Corporation selected the fourth quarter to perform an annual impairment assessment of goodwill.
During the fourth quarter of fiscal year 2014, an impairment test was completed. The recoverable amount of the BT operating segment was calculated based on fair value less costs to sell using a discounted cash flow model. The Corporation did not identify any impairment.
Estimated future cash flows were based on the budget and strategic plan for the first three years and a constant growth rate of 1% was applied to derive estimated cash flows beyond the initial three-year period. The post-tax discount rate is also a key estimate in the discounted cash flow model and was based on a representative weighted average cost of capital. The post-tax discount rate used to calculate the recoverable amount in fiscal year 2014 was 7.25%. A 100-basis point change in the post-tax discount rate would not have resulted in an impairment charge in fiscal year 2014. A 10% decrease on the growth rate of 1% would not have resulted in an impairment charge in fiscal year 2014.
Valuation of deferred income tax assets
To determine the extent to which deferred income tax assets can be recognized, management estimates the amount of probable future taxable profits that will be available against which deductible temporary differences and unused tax losses can be utilized. Such estimates are made as part of the budget and strategic plan by tax jurisdiction on an undiscounted basis and are reviewed on a quarterly basis. Management exercises judgment to determine the extent to which realization of future taxable benefits is probable, considering factors such as the number of years to include in the forecast period, the history of taxable profits and availability of conservative tax strategies. On January 15, 2015 the Corporation announced its decision to pause the Learjet 85 business aircraft program. The pause follows a downward revision of Bombardier’s business aircraft market forecast, primarily due the continued weakness of the light aircraft category since the economic downturn. As a result, the Corporation has recorded a write-down of deferred income tax assets in the fourth quarter of fiscal year 2014. See Note 11 - Income taxes for more details.
Tax contingencies
Uncertainties exist with respect to the interpretation of complex tax regulations, changes in tax laws, and the amount and timing of future taxable income. Given the wide range of international business relationships and the long-term nature and complexity of existing contractual agreements, differences arising between the actual results and the assumptions made, or future changes to such assumptions, could necessitate future adjustments to tax income and expense already recorded. The Corporation establishes tax provisions for possible consequences of audits by the tax authorities of each country in which it operates. The amount of such provisions is based on various factors, such as experience of previous tax audits and differing interpretations of tax regulations by the taxable entity and the responsible tax authority. Such differences in interpretation may arise for a wide variety of issues depending on the conditions prevailing in the respective domicile of the legal entities.

BOMBARDIER INC. FINANCIAL REPORT - FISCAL YEAR ENDED DECEMBER 31, 2014 - OTHER 97
Credit and residual value guarantees
Credit and residual value guarantees are generally provided to airlines or to participants in financing structures created in connection with the sale of commercial aircraft. A corresponding provision is recorded, measured at the amounts expected to be paid under the guarantees, using an internal valuation model based on stochastic simulations to measure the amounts expected to be paid under credit and residual value guarantees.
The amounts expected to be paid under the guarantees depend on whether credit defaults occur during the term of the original financing. When a credit default occurs, the credit guarantee may be called upon. In the absence of a credit default the residual value guarantee may be triggered. In both cases, the guarantees can only be called upon if there is a loss upon the sale of the aircraft. Therefore, the value of the guarantee is in large part impacted by the future value of the underlying aircraft. Aircraft residual value curves, prepared by management based on information from external appraisals and adjusted to reflect specific factors of the current aircraft market and a balanced market in the medium and long term, are used to estimate this future value. The amount of the liability is also significantly impacted by the current market assumption for interest rates since payments under these guarantees are mostly expected to be made in the medium to long term. Other key estimates in calculating the value of the guarantees include default probabilities, estimated based on published credit ratings when available or, when not available, on internal assumptions regarding the credit risk of customers, as well as on the likelihood that credit or residual value guarantees will be called upon at the expiry of the financing arrangements. The estimates are reviewed on a quarterly basis.
Sensitivity analysisThe following analyses are presented in isolation from one another, i.e. all other estimates left unchanged:
Assuming a decrease of 5% in the residual value curves of all aircraft as at December 31, 2014, EBIT for fiscal year 2014 would have been negatively impacted by $18 million.
Assuming a 100-basis point decrease in interest rates as at December 31, 2014, EBT for fiscal year 2014 would have been negatively impacted by $16 million. Assuming a 100-basis point increase in interest rates as at December 31, 2014, EBT for fiscal year 2014 would have been positively impacted by $15 million.
Retirement and other long-term employee benefits
The actuarial valuation process used to measure pension and other post-employment benefit costs, assets and obligations is dependent on assumptions regarding discount rates, compensation and pre-retirement benefit increases, inflation rates, health-care cost trends, as well as demographic factors such as employee turnover, retirement and mortality rates. The impacts from changes in discount rates and, when significant, from key events and other circumstances, are recorded quarterly.
Discount rates are used to determine the present value of the expected future benefit payments and represent the market rates for high-quality corporate fixed-income investments consistent with the currency and the estimated term of the retirement benefit liabilities.
As the Canadian high-quality corporate bond market, as defined under IFRS, includes relatively few medium- and long-term maturity bonds, the discount rate for the Corporation's Canadian pension and other post-employment plans is established by constructing a yield curve using four maturity ranges. The first maturity range of the curve was based on observed market rates for AA-rated corporate bonds with maturities of less than six years. In the longer maturity ranges, due to the smaller number of high-quality bonds available, the curve is derived using market observations and extrapolated data. The extrapolated data points were created by adding a term-based yield spread over long-term provincial bond yields. This spread is based on the observed spreads between AA-rated corporate bonds and AA-rated provincial bonds in the last three maturity ranges of the curve.
Expected rates of compensation increases are determined considering the current salary structure, as well as historical and anticipated wage increases, in the context of current economic conditions.
See Note 21 – Retirement benefits for further details regarding assumptions used and sensitivity to changes in critical actuarial assumptions.

98 BOMBARDIER INC. FINANCIAL REPORT - FISCAL YEAR ENDED DECEMBER 31, 2014
Consolidation
Entities are consolidated when, based on an evaluation of the substance of the relationship, it is established that the Corporation controls the investee. An investee is controlled when the Corporation is exposed to, or has rights to, variable returns from involvement with the investee and the ability to use power over the investee to affect the amount of those returns. Management reassess the initial determination of control if facts or circumstances indicate that there may be changes to one or more elements of control.
From time to time, the Corporation participates in structured entities where voting rights are not the dominant factor in determining control. In these situations, management may use a variety of complex estimation processes involving both qualitative and quantitative factors to determine whether the Corporation is exposed to, or has rights to, significant variable returns. The quantitative analyses involve estimating the future cash flows and performance of the investee and analyzing the variability in those cash flows. The qualitative analyses involve consideration of factors such as the purpose and design of the investee and whether the Corporation is acting as an agent or principal. There is a significant amount of judgment exercised in evaluating the results of these analyses as well as in determining if the Corporation has power to affect the investee’s returns, including an assessment of the impact of potential voting rights, contractual agreements and de facto control. Management reassesses its initial determination of control if facts or circumstances indicate that there may be changes to one or more elements of control.
CONTROLS AND PROCEDURESIn compliance with the Canadian Securities Administrators’ Regulation the Corporation has filed certificates signed by the Chief Executive Officer (“CEO”) and the Chief Financial Officer (“CFO”) that, among other things, report on the design and effectiveness of disclosure controls and procedures and the design and effectiveness of internal controls over financial reporting.
Disclosure controls and procedures
The CEO and the CFO have designed disclosure controls and procedures, or have caused them to be designed under their supervision, in order to provide reasonable assurance that:• material information relating to the Corporation has been made known to them; and• information required to be disclosed in the Corporation’s filings is recorded, processed, summarized and
reported within the time periods specified in securities legislation.
An evaluation was carried out, under the supervision of the CEO and the CFO, of the design and effectiveness of the Corporation's disclosure controls and procedures. Based on this evaluation, the CEO and the CFO concluded that the disclosure controls and procedures are effective.
Internal controls over financial reporting
The CEO and the CFO have also designed internal controls over financial reporting, or have caused them to be designed under their supervision, in order to provide reasonable assurance regarding the reliability of financial reporting and the preparation of financial statements for external purposes in accordance with IFRS.
An evaluation was carried out, under the supervision of the CEO and the CFO, of the design and effectiveness of the Corporation's internal controls over financial reporting. Based on this evaluation, the CEO and the CFO concluded that the internal controls over financial reporting are effective, using the criteria set forth by the Committee of Sponsoring Organizations of the Treadway Commission (COSO) on Internal Control – Integrated Framework (2013 Framework).

BOMBARDIER INC. FINANCIAL REPORT - FISCAL YEAR ENDED DECEMBER 31, 2014 - OTHER 99
Changes in internal controls over financial reporting
No changes were made to the Corporation's internal controls over financial reporting that occurred during the quarter and fiscal year ended December 31, 2014 that have materially affected, or are reasonably likely to materially affect, the internal controls over financial reporting.
FOREIGN EXCHANGE RATESThe Corporation is subject to currency fluctuations from the translation of revenues, expenses, assets and liabilities of foreign operations with non-U.S. dollar functional currencies, mainly the euro, pound sterling and other European currencies, and from transactions denominated in foreign currencies, mainly the Canadian dollar and pound sterling.
The foreign exchange rates used to translate assets and liabilities into U.S. dollars were as follows, as at:
December 31, 2014 December 31, 2013 Increase (decrease)Euro 1.2141 1.3791 (12%)Canadian dollar 0.8633 0.9400 (8%)Pound sterling 1.5587 1.6542 (6%)
The average foreign exchange rates used to translate revenues and expenses into U.S. dollars were as follows, for the fourth quarters ended:
December 31, 2014 December 31, 2013 Increase (decrease)Euro 1.2496 1.3616 (8%)Canadian dollar 0.8809 0.9537 (8%)Pound sterling 1.5839 1.6194 (2%)
The average foreign exchange rates used to translate revenues and expenses into U.S. dollars were as follows, for the fiscal years ended:
December 31, 2014 December 31, 2013 Increase (decrease)Euro 1.3297 1.3285 0%Canadian dollar 0.9061 0.9717 (7%)Pound sterling 1.6483 1.5654 5%

100 BOMBARDIER INC. FINANCIAL REPORT - FISCAL YEAR ENDED DECEMBER 31, 2014
SHAREHOLDER INFORMATION
Authorized, issued and outstanding share data, as at February 10, 2015
AuthorizedIssued and
outstandingClass A Shares (multiple voting)(1) 1,892,000,000 (4) 314,273,255Class B Shares (subordinate voting)(2) 1,892,000,000 (4) 1,425,395,218 (3)
Series 2 Cumulative Redeemable Preferred Shares 12,000,000 9,692,521Series 3 Cumulative Redeemable Preferred Shares 12,000,000 2,307,479Series 4 Cumulative Redeemable Preferred Shares 9,400,000 9,400,000
(1) Ten votes each, convertible at the option of the holder into one Class B Share (subordinate voting).(2) Convertible at the option of the holder into one Class A Share (multiple voting) under certain conditions.(3) Net of 18,736,908 Class B Shares (subordinate voting) purchased and held in trust in connection with the PSU plan. (4) A special meeting of holders of Class A and Class B shares will take place on March 27, 2015 to approve the amendment of the articles of
the Corporation to increase the number of Class A and Class B shares the Corporation is authorized to issue from 1,892,000,000 to 2,742,000,000.
Share option, PSU and DSU data as at December 31, 2014Options issued and outstanding under the share option plans 31,446,124PSUs and DSUs issued and outstanding under the PSU and DSU plans 33,712,400Class B Shares held in trust to satisfy PSU obligations 18,736,908
InformationBombardier Inc.Investor Relations800 René-Lévesque Blvd. WestMontréal, Québec, Canada H3B 1Y8Telephone: +1 514 861 9481, extension 13273Fax: +1 514 861 2420Email: [email protected]
Additional information relating to the Corporation, including the annual information form, are available on SEDAR at sedar.com or on the Corporation's dedicated investor relations website at ir.bombardier.com.
The CSeries family of aircraft, Global 7000 and Global 8000 aircraft and Challenger 650 aircraft programs are currently in development, and as such are subject to changes in family strategy, branding, capacity, performance, design and/or systems. All specifications and data are approximate, may change without notice and are subject to certain operating rules, assumptions and other conditions. This document does not constitute an offer, commitment, representation, guarantee or warranty of any kind. On January 15, 2015, the Corporation announced the pause of the Learjet 85 aircraft program.
AVENTRA, Bombardier, Challenger, Challenger 300, Challenger 350, Challenger 605, Challenger 650, Challenger 800, CRJ, CRJ700, CRJ900, CRJ1000, CSeries, CS100, CS300, Dash 8, ELECTROSTAR, Global, Global 5000, Global 6000, Global 7000, Global 8000, INNOVIA, Learjet, Learjet 40, Learjet 45, Learjet 60, Learjet 70, Learjet 75, Learjet 85, NextGen, Q400, TALENT, The Evolution of Mobility, TRAXX, XR and ZEFIRO are trademarks of Bombardier Inc. or its subsidiaries.
The printed version of this financial report uses Rolland Opaque paper, containing 30% post-consumer fibres, certified Eco-Logo, processed chlorine free. Using this paper, instead of virgin paper, saves the equivalent of 61 mature trees, 2,713 kg of solid waste, 24,847 kg of atmospheric emissions (equivalent to the annual emissions of 8 cars) and 221,322 litres of water.
Bombardier Inc., 800 René-Lévesque Blvd. West, Montréal, Québec, Canada H3B 1Y8
Telephone: +1 514 861 9481; fax: +1 514 861 2420; website: bombardier.com
Un exemplaire en français est disponible sur demande adressée auprès du service des Relations avec les investisseurs ou sur le site Internet de la Société dédié aux relations avec les investisseurs, à l'adresse ri.bombardier.com.

BOMBARDIER INC. FINANCIAL REPORT - FISCAL YEAR ENDED DECEMBER 31, 2014 - OTHER 101
SELECTED FINANCIAL INFORMATION
The following selected financial information has been derived from, and should be read in conjunction with, the consolidated financial statements for fiscal years ended December 31, 2012, 2013 and 2014.
The following table provides selected financial information for the last three fiscal years.
Fiscal years 2014 2013 2012Revenues $ 20,111 $ 18,151 $ 16,414Net income (loss) attributable to equity holders of Bombardier Inc. $ (1,260) $ 564 $ 460
EPS (in dollars)Basic and diluted $ (0.74) $ 0.31 $ 0.25
Cash dividends declared per share (in Canadian dollars)Class A Shares (multiple voting) $ 0.10 $ 0.10 $ 0.10Class B Shares (subordinate voting) $ 0.10 $ 0.10 $ 0.10Series 2 Preferred Shares $ 0.75 $ 0.75 $ 0.75Series 3 Preferred Shares $ 0.78 $ 0.78 $ 1.05Series 4 Preferred Shares $ 1.56 $ 1.56 $ 1.56
As atDecember 31
2014December 31
2013December 31
2012Total assets $ 27,614 $ 29,363 $ 25,175Non-current financial liabilities $ 8,229 $ 7,705 $ 5,961
The quarterly data table is shown hereafter.
February 11, 2015

102 BOMBARDIER INC. FINANCIAL REPORT - FISCAL YEAR ENDED DECEMBER 31, 2014
BOMBARDIER INC.QUARTERLY DATA (UNAUDITED)(the quarterly data has been prepared in accordance with IAS 34, Interim financial reporting, except market price ranges)(in millions of U.S. dollars, except per share amounts)
Fiscal years 2014 2013
TotalFourth
quarterThird
quarterSecondquarter
Firstquarter Total
Fourthquarter
Thirdquarter
Secondquarter
Firstquarter
Revenues
BA $ 10,499 $ 3,326 $ 2,572 $ 2,512 $ 2,089 $ 9,385 $ 2,873 $ 1,999 $ 2,255 $ 2,258BT 9,612 2,634 2,334 2,379 2,265 8,766 2,451 2,059 2,175 2,081
$ 20,111 $ 5,960 $ 4,906 $ 4,891 $ 4,354 $ 18,151 $ 5,324 $ 4,058 $ 4,430 $ 4,339EBIT
BA $ (995) $ (1,303) $ 74 $ 141 $ 93 $ 418 $ 93 $ 86 $ 138 $ 101BT 429 102 97 116 114 505 92 124 150 139
(566) (1,201) 171 257 207 923 185 210 288 240Financing expense(1) 249 65 66 90 51 271 75 58 83 75Financing income(1) (75) (17) (15) (49) (17) (119) (30) (22) (47) (40)EBT (740) (1,249) 120 216 173 771 140 174 252 205Income taxes 506 341 46 61 58 199 43 27 72 57Net income (loss) $ (1,246) $ (1,590) $ 74 $ 155 $ 115 $ 572 $ 97 $ 147 $ 180 $ 148Attributable to
Equity holders of Bombardier Inc. $ (1,260) $ (1,594) $ 68 $ 153 $ 113 $ 564 $ 95 $ 145 $ 181 $ 143NCI 14 4 6 2 2 8 2 2 (1) 5
$ (1,246) $ (1,590) $ 74 $ 155 $ 115 $ 572 $ 97 $ 147 $ 180 $ 148EPS (in dollars)
Basic and diluted $ (0.74) $ (0.92) $ 0.03 $ 0.08 $ 0.06 $ 0.31 $ 0.05 $ 0.08 $ 0.10 $ 0.08
Market price range of Class B Shares (in Canadian dollars)High $ 4.68 $ 4.43 $ 3.89 $ 4.43 $ 4.68 $ 5.43 $ 5.43 $ 5.18 $ 5.00 $ 4.35Low $ 3.41 $ 3.41 $ 3.42 $ 3.54 $ 3.44 $ 3.80 $ 4.32 $ 4.55 $ 3.80 $ 3.81
(1) The amounts presented on a yearly basis may not correspond to the sum of the four quarters as certain reclassifications to quarterly figures to or from financing income and financing expense may be required on a cumulative basis.

BOMBARDIER INC. FINANCIAL REPORT - FISCAL YEAR ENDED DECEMBER 31, 2014 - HISTORICAL FINANCIAL SUMMARY 103
BOMBARDIER INC.HISTORICAL FINANCIAL SUMMARY(in millions of U.S. dollars, except per share amounts, number of common shares and shareholders of record)
December 31 December 31 December 31 December 31 January 31For the fiscal years ended 2014 2013 2012 2011
(1)2011
RevenuesBA $ 10,499 $ 9,385 $ 8,628 $ 8,594 $ 8,808BT 9,612 8,766 7,786 9,310 8,689
$ 20,111 $ 18,151 $ 16,414 $ 17,904 $ 17,497EBIT before special items
BA $ 437 $ 388 $ 367 $ 491 $ 546BT 486 505 439 675 652
923 893 806 1,166 1,198Special items
BA 1,432 (30) (23) — —BT 57 — 163 — —
1,489 (30) 140 — —EBIT
BA (995) 418 390 491 546BT 429 505 276 675 652
(566) 923 666 1,166 1,198Financing expense 249 271 295 380 395Financing income (75) (119) (165) (70) (86)EBT (740) 771 536 856 889Income taxes 506 199 66 119 218Net income (loss) $ (1,246) $ 572 $ 470 $ 737 $ 671Attributable to
Equity holders of Bombardier Inc. $ (1,260) $ 564 $ 460 $ 737 $ 658NCI $ 14 $ 8 $ 10 $ — $ 13
Adjusted net income $ 648 $ 608 $ 671 $ 887 $ 772EPS (in dollars)
Basic $ (0.74) $ 0.31 $ 0.25 $ 0.41 $ 0.37Diluted $ (0.74) $ 0.31 $ 0.25 $ 0.41 $ 0.36Adjusted $ 0.35 $ 0.33 $ 0.36 $ 0.49 $ 0.42
General informationExport revenues from Canada $ 8,086 $ 6,767 $ 6,129 $ 5,866 $ 6,285Net additions to PP&E and intangible assets $ 1,964 $ 2,287 $ 2,074 $ 1,447 $ 1,189Amortization $ 417 $ 391 $ 364 $ 325 $ 413Impairment charges on PP&E and intangible assets $ 1,266 $ — $ 9 $ — $ 8Dividend per common share (in Canadian dollars)
Class A $ 0.10 $ 0.10 $ 0.10 $ 0.10 $ 0.10Class B $ 0.10 $ 0.10 $ 0.10 $ 0.10 $ 0.10
Dividend per preferred share (in Canadian dollars)
Series 2 $ 0.75 $ 0.75 $ 0.75 $ 0.69 $ 0.66Series 3 $ 0.78 $ 0.78 $ 1.05 $ 1.32 $ 1.32Series 4 $ 1.56 $ 1.56 $ 1.56 $ 1.56 $ 1.56
Market price ranges (in Canadian dollars)Class A
High $ 4.68 $ 5.42 $ 5.00 $ 7.29 $ 6.24Low $ 3.30 $ 3.81 $ 3.08 $ 3.41 $ 4.28Close $ 4.13 $ 4.60 $ 3.83 $ 4.06 $ 5.72
Class BHigh $ 4.68 $ 5.43 $ 4.93 $ 7.29 $ 6.24Low $ 3.41 $ 3.80 $ 2.97 $ 3.30 $ 4.25Close $ 4.15 $ 4.61 $ 3.76 $ 4.06 $ 5.70
As atNumber of common shares (in millions) 1,740 1,739 1,730 1,724 1,726Book value per common share (in dollars) $ (0.18) $ 1.20 $ 0.50 $ 0.10 $ 0.58Shareholders of record 14,166 13,503 13,544 13,427 13,591
(1) The fiscal year ended December 31, 2011 comprises 11 months of BA’s results and 12 months of BT’s results.

104 BOMBARDIER INC. FINANCIAL REPORT - FISCAL YEAR ENDED DECEMBER 31, 2014
BOMBARDIER INC.HISTORICAL FINANCIAL SUMMARY (CONTINUED)CONSOLIDATED STATEMENTS OF FINANCIAL POSITION(in millions of U.S. dollars)
December 31 December 31 December 31 December 31 January 31As at 2014 2013 2012 2011 2011AssetsCash and cash equivalents $ 2,489 $ 3,397 $ 2,557 $ 2,892 $ 3,559Trade and other receivables 1,538 1,492 1,311 1,342 1,356Inventories 7,970 8,234 7,540 7,305 7,191Other financial assets 530 637 443 522 690Other assets 592 626 564 559 648Current assets 13,119 14,386 12,415 12,620 13,444
Invested collateral — — — — 676PP&E 2,092 2,066 1,933 1,779 1,816Aerospace program tooling 6,823 6,606 4,770 3,168 2,088Goodwill 2,127 2,381 2,316 2,244 2,349Deferred income taxes 875 1,231 1,421 1,476 1,210Investments in joint ventures and associates 294 318 311 275 259Other financial assets 1,328 1,568 1,339 1,311 1,111Other assets 956 807 670 466 403Non-current assets 14,495 14,977 12,760 10,719 9,912
$ 27,614 $ 29,363 $ 25,175 $ 23,339 $ 23,356LiabilitiesTrade and other payables $ 4,216 $ 4,089 $ 3,310 $ 3,032 $ 2,857Provisions 990 881 1,000 1,019 1,136Advances and progress billings in excess of long-term contract inventories 1,698 2,352 1,763 1,638 1,971Advances on aerospace programs 3,339 3,228 3,053 2,788 2,989Other financial liabilities 1,010 1,009 455 732 860Other liabilities 2,182 2,227 2,212 2,208 2,168Current liabilities 13,435 13,786 11,793 11,417 11,981
Provisions 562 584 608 726 709Advances on aerospace programs 1,608 1,688 1,600 1,266 1,193Long-term debt 7,627 6,988 5,360 4,748 4,645Retirement benefits 2,629 2,161 2,999 3,231 1,978Other financial liabilities 602 717 601 502 532Other liabilities 1,096 990 957 902 908Non-current liabilities 14,124 13,128 12,125 11,375 9,965
27,559 26,914 23,918 22,792 21,946EquityAttributable to equity holders of Bombardier Inc. 42 2,426 1,211 515 1,343Attributable to NCI 13 23 46 32 67
55 2,449 1,257 547 1,410$ 27,614 $ 29,363 $ 25,175 $ 23,339 $ 23,356

BOMBARDIER INC. FINANCIAL REPORT - FISCAL YEAR ENDED DECEMBER 31, 2014 - FINANCIAL STATEMENTS 105
CONSOLIDATED FINANCIAL STATEMENTS
For the fiscal years endedDecember 31, 2014 and 2013
106 BOMBARDIER INC. FINANCIAL REPORT - FISCAL YEAR ENDED DECEMBER 31, 2014
MANAGEMENT’S RESPONSIBILITY FOR FINANCIAL REPORTING
The consolidated financial statements and MD&A of Bombardier Inc. and all other information in the financial report are the responsibility of management and have been reviewed and approved by the Board of Directors.
The consolidated financial statements have been prepared by management in accordance with IFRS as issued by the International Accounting Standards Board. The MD&A has been prepared in accordance with the requirements of Canadian Securities Administrators. The financial statements and MD&A include items that are based on best estimates and judgments of the expected effects of current events and transactions. Management has determined such items on a reasonable basis in order to ensure that the financial statements and MD&A are presented fairly in all material respects. Financial information presented in the MD&A is consistent with that in the consolidated financial statements.
Bombardier Inc.’s Chief Executive Officer (“CEO”) and Chief Financial Officer (“CFO”) have designed disclosure controls and procedures and internal controls over financial reporting, or have caused them to be designed under their supervision, to provide reasonable assurance that material information relating to Bombardier Inc. has been made known to them; and information required to be disclosed in Bombardier Inc.’s filings is recorded, processed, summarized and reported within the time periods specified in Canadian securities legislation.
Bombardier Inc.’s CEO and CFO have also evaluated the effectiveness of Bombardier Inc.’s disclosure controls and procedures and internal controls over financial reporting as of the end of the fiscal year 2014. Based on this evaluation, the CEO and the CFO concluded that the disclosure controls and procedures and internal controls over financial reporting were effective as of that date, using the criteria set forth by the Committee of Sponsoring Organizations of the Treadway Commission (COSO) on Internal Control – Integrated Framework (2013 framework). In addition, based on this assessment, they determined that there were no material weaknesses in internal control over financial reporting as of the end of the fiscal year 2014. In compliance with the Canadian Securities Administrators’ National Instrument 52-109, Bombardier Inc.’s CEO and CFO have provided a certification related to Bombardier Inc.’s annual disclosure to the Canadian Securities Administrators, including the consolidated financial statements and MD&A.
The Board of Directors is responsible for ensuring that management fulfills its responsibilities for financial reporting and is ultimately responsible for reviewing and approving the consolidated financial statements and MD&A. The Board of Directors carries out this responsibility principally through its Audit Committee.
The Audit Committee is appointed by the Board of Directors and is comprised entirely of independent and financially literate directors. The Audit Committee meets periodically with management, as well as with the internal and independent auditors, to review the consolidated financial statements, independent auditors’ report, MD&A, auditing matters and financial reporting issues, to discuss internal controls over the financial reporting process, and to satisfy itself that each party is properly discharging its responsibilities. In addition, the Audit Committee has the duty to review the appropriateness of the accounting policies and significant estimates and judgments underlying the consolidated financial statements as presented by management, and to review and make recommendations to the Board of Directors with respect to the independence and the fees of the independent auditors. The Audit Committee reports its findings to the Board of Directors for its consideration when it approves the consolidated financial statements and MD&A for issuance to shareholders.
The consolidated financial statements have been audited by Ernst & Young LLP, the independent auditors, in accordance with Canadian generally accepted auditing standards and International Standards on auditing on behalf of the shareholders. The independent auditors have full and free access to the Audit Committee to discuss their audit and related matters.
Pierre Beaudoin, Pierre Alary, FCPA, FCAPresident and Chief Executive Officer Senior Vice President and Chief Financial Officer
February 11, 2015
BOMBARDIER INC. FINANCIAL REPORT - FISCAL YEAR ENDED DECEMBER 31, 2014 - AUDITORS' REPORT 107
INDEPENDENT AUDITORS’ REPORT
TO THE SHAREHOLDERS OF BOMBARDIER INC.
We have audited the accompanying consolidated financial statements of Bombardier Inc. which comprise the consolidated statements of financial position as at December 31, 2014, 2013 and January 1, 2013, and the consolidated statements of income, comprehensive income, changes in equity and cash flows for fiscal years ended December 31, 2014 and 2013, and a summary of significant accounting policies and other explanatory information.
Management's Responsibility for the consolidated financial statements Management is responsible for the preparation and fair presentation of these consolidated financial statements in accordance with International Financial Reporting Standards, as issued by the International Accounting Standards Board, and for such internal control as Management determines is necessary to enable the preparation of consolidated financial statements that are free from material misstatement, whether due to fraud or error.
Auditors’ Responsibility Our responsibility is to express an opinion on these consolidated financial statements based on our audits. We conducted our audits in accordance with Canadian generally accepted auditing standards and International Standards on auditing. Those standards require that we comply with ethical requirements and plan and perform the audit to obtain reasonable assurance about whether the consolidated financial statements are free from material misstatement.
An audit involves performing procedures to obtain audit evidence about the amounts and disclosures in the consolidated financial statements. The procedures selected depend on the auditors’ judgment, including the assessment of the risks of material misstatement of the consolidated financial statements, whether due to fraud or error. In making those risk assessments, the auditors consider internal control relevant to the entity's preparation and fair presentation of the consolidated financial statements in order to design audit procedures that are appropriate in the circumstances, but not for the purpose of expressing an opinion on the effectiveness of the entity's internal control. An audit also includes evaluating the appropriateness of accounting policies used and the reasonableness of accounting estimates made by Management, as well as evaluating the overall presentation of the consolidated financial statements. We believe that the audit evidence we have obtained in our audits is sufficient and appropriate to provide a basis for our audit opinion.
Opinion In our opinion, the consolidated financial statements present fairly, in all material respects, the financial position of Bombardier Inc. as at December 31, 2014, 2013 and January 1, 2013, and its financial performance and its cash flows for fiscal years ended December 31, 2014 and 2013 in accordance with International Financial Reporting Standards, as issued by the International Accounting Standards Board.
(1)
Ernst & Young LLPMontréal, Canada
February 11, 2015
(1) CPA auditor, CA, public accountancy permit no. A112431

108 BOMBARDIER INC. FINANCIAL REPORT - FISCAL YEAR ENDED DECEMBER 31, 2014
CONSOLIDATED FINANCIAL STATEMENTSFor fiscal years 2014 and 2013 (Tabular figures are in millions of U.S. dollars, unless otherwise indicated)
1.2. SUMMARY OF SIGNIFICANT ACCOUNTING POLICIES3.4. USE OF ESTIMATES AND JUDGMENT5.6.7.8.9.10. EMPLOYEE BENEFITS COSTS11. INCOME TAXES12.13.14. CASH AND CASH EQUIVALENTS15. TRADE AND OTHER RECEIVABLES16.17.18.19. PROPERTY, PLANT AND EQUIPMENT20. INTANGIBLE ASSETS21. RETIREMENT BENEFITS22. TRADE AND OTHER PAYABLES23.24.25.26.27. SHARE-CAPITAL28.29.30.31. CAPITAL MANAGEMENT32. FINANCIAL RISK MANAGEMENT33.34. INVESTMENTS IN JOINT VENTURES AND ASSOCIATES35. TRANSACTIONS WITH RELATED PARTIES36. UNCONSOLIDATED STRUCTURED ENTITIES37.38. RECLASSIFICATION
See MD&A for the abbreviations used in the consolidated financial statements.
Consolidated financial statements 109Notes to consolidated financial statements 114
BASIS OF PREPARATION 114114
FUTURE CHANGES IN ACCOUNTING POLICIES 124126
SEGMENT DISCLOSURE 130RESEARCH AND DEVELOPMENT 132OTHER EXPENSE 133SPECIAL ITEMS 133FINANCING EXPENSE AND FINANCING INCOME 134
134135
EARNINGS PER SHARE 137FINANCIAL INSTRUMENTS 137
140140
INVENTORIES 141OTHER FINANCIAL ASSETS 142OTHER ASSETS 142
143144145154
PROVISIONS 155OTHER FINANCIAL LIABILITIES 156OTHER LIABILITIES 156LONG-TERM DEBT 157
158SHARE-BASED PLANS 161NET CHANGE IN NON-CASH BALANCES 163CREDIT FACILITIES 164
165166
FAIR VALUE OF FINANCIAL INSTRUMENTS 170173174175
COMMITMENTS AND CONTINGENCIES 176179

BOMBARDIER INC. FINANCIAL REPORT - FISCAL YEAR ENDED DECEMBER 31, 2014 - FINANCIAL STATEMENTS 109
BOMBARDIER INC.CONSOLIDATED STATEMENTS OF INCOMEFor the fiscal years ended December 31(in millions of U.S. dollars, except per share amounts)
Notes 2014 2013Revenues $ 20,111 $ 18,151Cost of sales 16 17,534 15,658Gross margin 2,577 2,493SG&A 1,358 1,417R&D 6 347 293Share of income of joint ventures and associates 34 (89) (119)Other expense 7 38 9Special items 8 1,489 (30)EBIT (566) 923Financing expense 9 249 271Financing income 9 (75) (119)EBT (740) 771Income taxes 11 506 199Net income (loss) $ (1,246) $ 572Attributable to
Equity holders of Bombardier Inc. $ (1,260) $ 564NCI 14 8
$ (1,246) $ 572EPS (in dollars) 12
Basic and diluted $ (0.74) $ 0.31
The notes are an integral part of these consolidated financial statements.

110 BOMBARDIER INC. FINANCIAL REPORT - FISCAL YEAR ENDED DECEMBER 31, 2014
BOMBARDIER INC.CONSOLIDATED STATEMENTS OF COMPREHENSIVE INCOMEFor the fiscal years ended December 31(in millions of U.S. dollars)
Note 2014 2013Net income (loss) $ (1,246) $ 572OCI
Items that may be reclassified to net incomeNet change in cash flow hedges
Foreign exchange re-evaluation 17 (6)Net gain (loss) on derivative financial instruments (389) 26Reclassification to income or to the related non-financial asset(1)(2) 216 (32)Income taxes 37 6
(119) (6)AFS financial assets
Net unrealized gain (loss) 7 (5)CCTD
Net investments in foreign operations (146) 36Net gain (loss) on related hedging items 4 (15)
(142) 21Items that are never reclassified to net income
Retirement benefitsRemeasurements of defined benefit plans(3) (646) 911Income taxes 21 (45) (87)
(691) 824Total OCI (945) 834Total comprehensive income (loss) $ (2,191) $ 1,406Attributable to
Equity holders of Bombardier Inc. $ (2,198) $ 1,399NCI 7 7
$ (2,191) $ 1,406(1) Include $97 million of loss reclassified to the related non-financial asset for fiscal year 2014 ($10 million of gain for fiscal year 2013).(2) $196 million of net deferred loss is expected to be reclassified from OCI to the carrying amount of the related non-financial asset or to
income during fiscal year 2015.(3) Include net actuarial gains (losses).
The notes are an integral part of these consolidated financial statements.

BOMBARDIER INC. FINANCIAL REPORT - FISCAL YEAR ENDED DECEMBER 31, 2014 - FINANCIAL STATEMENTS 111
BOMBARDIER INC.CONSOLIDATED STATEMENTS OF FINANCIAL POSITIONAs at(in millions of U.S. dollars)
December 31 December 31 January 1Notes 2014 2013 2013
AssetsCash and cash equivalents 14 $ 2,489 $ 3,397 $ 2,557Trade and other receivables 15 1,538 1,492 1,311Inventories 16 7,970 8,234 7,540Other financial assets 17 530 637 443Other assets 18 592 626 564Current assets 13,119 14,386 12,415PP&E 19 2,092 2,066 1,933Aerospace program tooling 20 6,823 6,606 4,770Goodwill 20 2,127 2,381 2,316Deferred income taxes 11 875 1,231 1,421Investments in joint ventures and associates 294 318 311Other financial assets 17 1,328 1,568 1,339Other assets 18 956 807 670Non-current assets 14,495 14,977 12,760
$ 27,614 $ 29,363 $ 25,175LiabilitiesTrade and other payables 22 $ 4,216 $ 4,089 $ 3,310Provisions 23 990 881 1,000Advances and progress billings in excess of long-term contract inventories 16 1,698 2,352 1,763Advances on aerospace programs 3,339 3,228 3,053Other financial liabilities 24 1,010 1,009 455Other liabilities 25 2,182 2,227 2,212Current liabilities 13,435 13,786 11,793Provisions 23 562 584 608Advances on aerospace programs 1,608 1,688 1,600Long-term debt 26 7,627 6,988 5,360Retirement benefits 21 2,629 2,161 2,999Other financial liabilities 24 602 717 601Other liabilities 25 1,096 990 957Non-current liabilities 14,124 13,128 12,125
27,559 26,914 23,918EquityAttributable to equity holders of Bombardier Inc. 42 2,426 1,211Attributable to NCI 13 23 46
55 2,449 1,257$ 27,614 $ 29,363 $ 25,175
Commitments and contingencies 37
The notes are an integral part of these consolidated financial statements.
On behalf of the Board of Directors,
Laurent Beaudoin, C.C., FCPA, FCA Sheila Fraser, FCPA, FCADirector Director

112 BOMBARDIER INC. FINANCIAL REPORT - FISCAL YEAR ENDED DECEMBER 31, 2014
BOMBARDIER INC.CONSOLIDATED STATEMENTS OF CHANGES IN EQUITYFor the fiscal years ended (in millions of U.S. dollars)
Attributable to equity holders of Bombardier Inc.
Share capitalRetained earnings
(deficit) Accumulated OCI
Preferredshares
Commonshares
Otherretainedearnings
Remea-surement
lossesContributed
surplus
AFSfinancial
assetsCash flow
hedges CCTD Total NCITotal
EquityAs at January 1, 2013 $ 347 $ 1,342 $ 2,239 $ (2,794) $ 109 $ 10 $ (197) $ 155 $ 1,211 $ 46 $ 1,257
Total comprehensive incomeNet income — — 564 — — — — — 564 8 572OCI — — — 824 — (5) (6) 22 835 (1) 834
— — 564 824 — (5) (6) 22 1,399 7 1,406Options exercised — 13 — — (3) — — — 10 — 10Dividends
Common shares — — (173) — — — — — (173) — (173)Preferred shares — — (32) — — — — — (32) — (32)
Capital distribution — — — — — — — — — (30) (30)Shares distributed - PSU plans — 25 — — (25) — — — — — —Share-based expense — — — — 11 — — — 11 — 11
As at December 31, 2013 $ 347 $ 1,380 $ 2,598 $ (1,970) $ 92 $ 5 $ (203) $ 177 $ 2,426 $ 23 $ 2,449Total comprehensive income
Net income (loss) — — (1,260) — — — — — (1,260) 14 (1,246)OCI — — — (691) — 7 (119) (135) (938) (7) (945)
— — (1,260) (691) — 7 (119) (135) (2,198) 7 (2,191)Dividends
Common shares — — (160) — — — — — (160) — (160)Preferred shares — — (27) — — — — — (27) — (27)
Capital distribution — — — — — — — — — (17) (17)Shares distributed - DSU plans — 1 — — (2) — — — (1) — (1)Share-based expense — — — — 2 — — — 2 — 2
As at December 31, 2014 $ 347 $ 1,381 $ 1,151 $ (2,661) $ 92 $ 12 $ (322) $ 42 $ 42 $ 13 $ 55
The notes are an integral part of these consolidated financial statements.
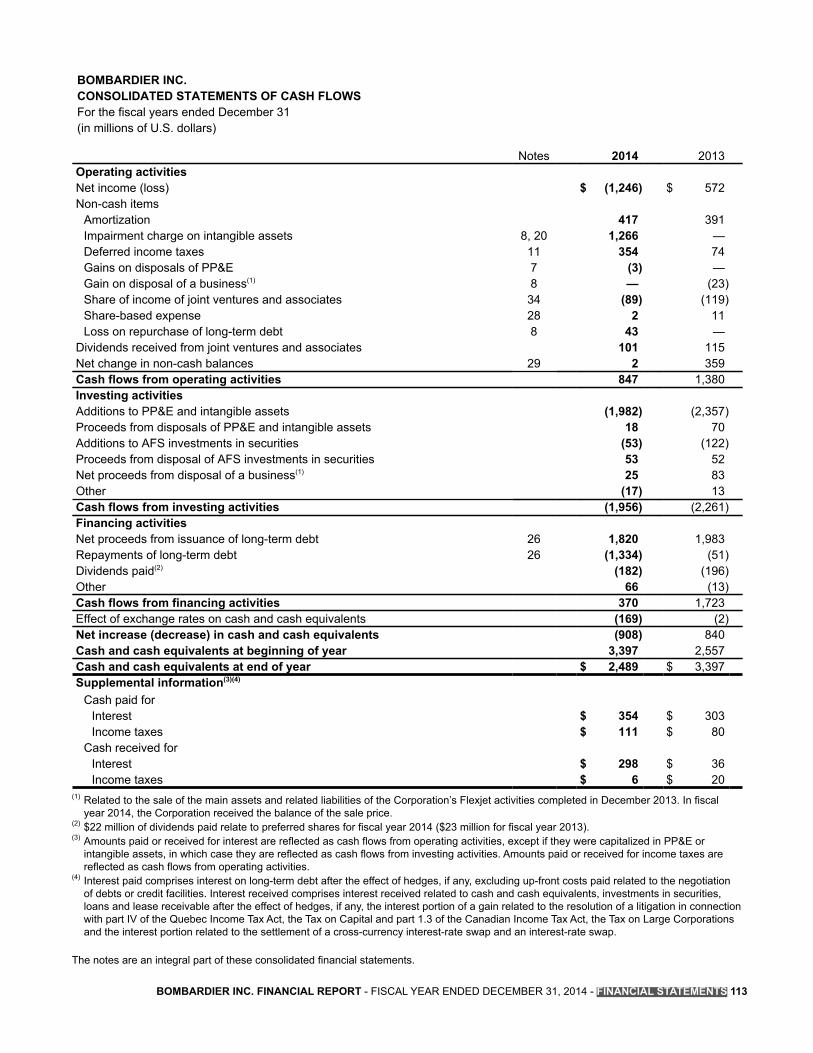
BOMBARDIER INC. FINANCIAL REPORT - FISCAL YEAR ENDED DECEMBER 31, 2014 - FINANCIAL STATEMENTS 113
BOMBARDIER INC.CONSOLIDATED STATEMENTS OF CASH FLOWSFor the fiscal years ended December 31(in millions of U.S. dollars)
Notes 2014 2013Operating activitiesNet income (loss) $ (1,246) $ 572Non-cash items
Amortization 417 391Impairment charge on intangible assets 8, 20 1,266 —Deferred income taxes 11 354 74Gains on disposals of PP&E 7 (3) —Gain on disposal of a business(1) 8 — (23)Share of income of joint ventures and associates 34 (89) (119)Share-based expense 28 2 11Loss on repurchase of long-term debt 8 43 —
Dividends received from joint ventures and associates 101 115Net change in non-cash balances 29 2 359Cash flows from operating activities 847 1,380Investing activitiesAdditions to PP&E and intangible assets (1,982) (2,357)Proceeds from disposals of PP&E and intangible assets 18 70Additions to AFS investments in securities (53) (122)Proceeds from disposal of AFS investments in securities 53 52Net proceeds from disposal of a business(1) 25 83Other (17) 13Cash flows from investing activities (1,956) (2,261)Financing activitiesNet proceeds from issuance of long-term debt 26 1,820 1,983Repayments of long-term debt 26 (1,334) (51)Dividends paid(2) (182) (196)Other 66 (13)Cash flows from financing activities 370 1,723Effect of exchange rates on cash and cash equivalents (169) (2)Net increase (decrease) in cash and cash equivalents (908) 840Cash and cash equivalents at beginning of year 3,397 2,557Cash and cash equivalents at end of year $ 2,489 $ 3,397Supplemental information(3)(4)
Cash paid forInterest $ 354 $ 303Income taxes $ 111 $ 80
Cash received forInterest $ 298 $ 36Income taxes $ 6 $ 20
(1) Related to the sale of the main assets and related liabilities of the Corporation’s Flexjet activities completed in December 2013. In fiscal year 2014, the Corporation received the balance of the sale price.
(2) $22 million of dividends paid relate to preferred shares for fiscal year 2014 ($23 million for fiscal year 2013). (3) Amounts paid or received for interest are reflected as cash flows from operating activities, except if they were capitalized in PP&E or
intangible assets, in which case they are reflected as cash flows from investing activities. Amounts paid or received for income taxes are reflected as cash flows from operating activities.
(4) Interest paid comprises interest on long-term debt after the effect of hedges, if any, excluding up-front costs paid related to the negotiation of debts or credit facilities. Interest received comprises interest received related to cash and cash equivalents, investments in securities, loans and lease receivable after the effect of hedges, if any, the interest portion of a gain related to the resolution of a litigation in connection with part IV of the Quebec Income Tax Act, the Tax on Capital and part 1.3 of the Canadian Income Tax Act, the Tax on Large Corporations and the interest portion related to the settlement of a cross-currency interest-rate swap and an interest-rate swap.
The notes are an integral part of these consolidated financial statements.

114 BOMBARDIER INC. FINANCIAL REPORT - FISCAL YEAR ENDED DECEMBER 31, 2014
NOTES TO THE CONSOLIDATED FINANCIAL STATEMENTSFor the fiscal years ended December 31, 2014 and 2013 (Tabular figures are in millions of U.S. dollars, unless otherwise indicated)
1. BASIS OF PREPARATION
Bombardier Inc. is incorporated under the laws of Canada. The consolidated financial statements include the accounts of Bombardier Inc. and its subsidiaries (“the Corporation”). The Corporation is a manufacturer of transportation equipment, including business and commercial aircraft and rail transportation equipment and systems, and is a provider of related services. The Corporation carries out its operations in two distinct segments, the aerospace segment (BA) and the transportation segment (BT). The main activities of the Corporation are described in Note 5 - Segment disclosure.
The Corporation’s consolidated financial statements for fiscal years 2014 and 2013 were authorized for issuance by the Board of Directors on February 11, 2015.
The comparative year includes the results of the Corporation’s Flexjet activities which have been disposed of on December 4, 2013.
Statement of complianceThe Corporation’s consolidated financial statements are expressed in U.S. dollars and have been prepared in accordance with IFRS, as issued by the IASB.
2. SUMMARY OF SIGNIFICANT ACCOUNTING POLICIES
The accounting policies set out below have been applied consistently to all periods presented in these consolidated financial statements, unless otherwise stated.
Basis of consolidationSubsidiaries – Subsidiaries are fully consolidated from the date of acquisition and continue to be consolidated until the date control over the subsidiaries ceases.
The Corporation consolidates investees, including structured entities when, based on the evaluation of the substance of the relationship with the Corporation, it concludes that it controls the investees. The Corporation controls an investee when it is exposed, or has rights, to variable returns from its involvement with the investee and has the ability to affect those returns through its power over the investee.
The Corporation’s principal subsidiaries, whose revenues represent more than 10% of total revenues of their respective segment, are as follows:
Subsidiary LocationBombardier Transportation GmbH GermanyBombardier Transportation (Holdings) UK Ltd. U.K.Bombardier Transportation S.A.S. FranceLearjet Inc. U.S.
Revenues of these subsidiaries combined with those of Bombardier Inc. totalled 71% of consolidated revenues for fiscal year 2014 (69% for fiscal year 2013).

BOMBARDIER INC. FINANCIAL REPORT - FISCAL YEAR ENDED DECEMBER 31, 2014 - NOTES 115
Joint ventures – Joint ventures are those entities over which the Corporation exercises joint control, requiring unanimous consent of the parties sharing control of relevant activities such as, strategic financial and operating decision making and where the parties have rights to the net assets of the arrangement. The Corporation recognizes its interest in joint ventures using the equity method of accounting.
Associates – Associates are entities in which the Corporation has the ability to exercise significant influence over the financial and operating policies. Investments in associates are accounted for using the equity method of accounting.
Foreign currency translationThe consolidated financial statements are expressed in U.S. dollars, the functional currency of Bombardier Inc. The functional currency is the currency of the primary economic environment in which an entity operates. The functional currency of most foreign subsidiaries is their local currency, mainly the U.S. dollar in BA, and the euro, pound sterling, various other European currencies and the U.S. dollar in BT.
Foreign currency transactions – Transactions denominated in foreign currencies are initially recorded in the functional currency of the related entity using the exchange rates in effect at the date of the transaction. Monetary assets and liabilities denominated in foreign currencies are translated using the closing exchange rates. Any resulting exchange difference is recognized in income except for exchange differences related to retirement benefits asset and liability, as well as financial liabilities designated as hedges of the Corporation’s net investments in foreign operations, which are recognized in OCI. Non-monetary assets and liabilities denominated in foreign currencies and measured at historical cost are translated using historical exchange rates, and those measured at fair value are translated using the exchange rate in effect at the date the fair value is determined. Revenues and expenses are translated using the average exchange rates for the period or the exchange rate at the date of the transaction for significant items.
Foreign operations – Assets and liabilities of foreign operations whose functional currency is other than the U.S. dollar are translated into U.S. dollars using closing exchange rates. Revenues and expenses, as well as cash flows, are translated using the average exchange rates for the period. Translation gains or losses are recognized in OCI and are reclassified in income on disposal or partial disposal of the investment in the related foreign operation.
The exchange rates for the major currencies used in the preparation of the consolidated financial statements were as follows:
Exchange ratesas at
Average exchange ratesfor fiscal years
December 31 December 31 January 12014 2013 2013 2014 2013
Euro 1.2141 1.3791 1.3194 1.3297 1.3285Canadian dollar 0.8633 0.9400 1.0043 0.9061 0.9717Pound sterling 1.5587 1.6542 1.6167 1.6483 1.5654
Revenue recognition Long-term contracts – Revenues from long-term contracts related to designing, engineering or manufacturing specifically designed products (including rail vehicles and component overhaul) and service contracts are recognized using the percentage-of-completion method of accounting. The percentage of completion is generally determined by comparing the actual costs incurred to the total costs anticipated for the entire contract, excluding costs that are not representative of the measure of performance. Estimated revenues at completion are adjusted for change orders, claims, performance incentives, price escalation clauses and other contract terms that provide for the adjustment of prices. If it is probable that changes in revenues will occur, they are included in estimated revenues at completion. If a contract review indicates a negative gross margin, the entire expected loss on the contract is recognized in cost of sales in the period in which the negative gross margin is identified. When the contract outcome cannot be measured reliably, revenue is recognized only to the extent that the expenses incurred are expected to be recovered.

116 BOMBARDIER INC. FINANCIAL REPORT - FISCAL YEAR ENDED DECEMBER 31, 2014
When a contract covers a number of products, the construction of each product is treated as a separate contract when (1) separate proposals have been submitted for each product, (2) each product has been subject to separate negotiation, and (3) the costs and revenues of each product can be identified. A group of contracts, whether with a single customer or with several customers, are treated as a single contract when (1) the group of contracts is negotiated as a single package, (2) the contracts are so closely interrelated that they are, in effect, part of a single project with an overall profit margin, and (3) the contracts are performed concurrently or in a continuous sequence. Options for additional assets are treated as a separate contract when (1) the asset differs significantly in design, technology or function from the asset or assets covered by the original contract or (2) the price of the asset is negotiated without regard to the original contract price.
Aerospace programs – Revenues from the sale of new aircraft are recognized when the aircraft has been delivered, risks and rewards of ownership have been transferred to the customer, the amount of revenue can be measured reliably, and collection of the related receivable is reasonably assured. All costs incurred or to be incurred in connection with the sale, including warranty costs and sales incentives, are charged to cost of sales or as a deduction from revenues at the time revenue is recognized.
Multiple deliverables – Sales of goods and services sometimes involve the provision of multiple components. In these cases, the Corporation determines whether the contract or arrangement contains more than one unit of accounting. When certain criteria are met, such as when the delivered item has value to the customer on a stand-alone basis, the recognition criteria are applied to the separate identifiable components of a single transaction to reflect the substance of the transaction. Conversely, two or more transactions may be considered together for revenue recognition purposes, when the commercial effect cannot be understood without reference to a series of transactions as a whole. Revenue is allocated to the separate components based on their relative fair value.
Sales of aircraft fractional shares are considered together with the related service agreement for purpose of revenue recognition. Accordingly, revenues from such sales are recognized over the period during which the related services are rendered to the customer, generally five years. At the time of sale, the proceeds from the sale are recorded in other liabilities, under Flexjet fractional ownership deferred revenues. The carrying value of the related aircraft is transferred to other assets, under Flexjet fractional ownership deferred costs, and is charged to cost of sales over the same period.
Other – Revenues from the sale of pre-owned aircraft and spare parts are recognized when the goods have been delivered, risks and rewards of ownership have been transferred to the customer, the amount of revenue can be measured reliably, and collection of the related receivable is reasonably assured.
Government assistance and refundable advancesGovernment assistance, including investment tax credits, is recognized when there is a reasonable assurance that the assistance will be received and that the Corporation will comply with all relevant conditions. Government assistance related to the acquisition of inventories, PP&E and intangible assets is recorded as a reduction of the cost of the related asset. Government assistance related to current expenses is recorded as a reduction of the related expenses.
Government refundable advances are recorded as a financial liability if there is reasonable assurance that the amount will be repaid.
Special itemsSpecial items comprise items which do not reflect, in management’s opinion, the Corporation’s core performance such as the impact of restructuring charges, significant impairment charges and reversals, as well as other significant unusual items.
Income taxesThe Corporation applies the liability method of accounting for income taxes. Deferred income tax assets and liabilities are recognized for the future income tax consequences of temporary differences between the carrying amounts of assets and liabilities and their respective tax bases, and for tax losses carried forward. Deferred income tax assets and liabilities are measured using the substantively enacted tax rates that will be in effect for the year in which the differences are expected to reverse.

BOMBARDIER INC. FINANCIAL REPORT - FISCAL YEAR ENDED DECEMBER 31, 2014 - NOTES 117
Deferred income tax assets are recognized to the extent that it is probable that future taxable income will be available against which the deductible temporary differences and unused tax losses can be utilized.
Deferred income tax assets and liabilities are recognized directly in income, OCI or equity based on the classification of the item to which they relate.
Earnings per shareBasic EPS is computed based on net income attributable to equity holders of Bombardier Inc. less dividends on preferred shares, including taxes, divided by the weighted-average number of Class A Shares (Multiple Voting) and Class B Shares (Subordinate Voting) outstanding during the fiscal year.
Diluted EPS are computed using the treasury stock method, giving effect to the exercise of all dilutive elements.
Financial instrumentsA financial instrument is any contract that gives rise to a financial asset of one party and a financial liability or equity instrument of another party. Financial assets of the Corporation include cash and cash equivalents, trade and other receivables, aircraft loans and lease receivables, investments in securities, investments in financing structures, long-term contract receivables, restricted cash and derivative financial instruments with a positive fair value. Financial liabilities of the Corporation include trade and other payables, long-term debt, lease subsidies, government refundable advances, vendor non-recurring costs, sale and leaseback obligations and derivative financial instruments with a negative fair value.
Financial instruments are recognized in the consolidated statement of financial position when the Corporation becomes a party to the contractual obligations of the instrument. On initial recognition, financial instruments are recognized at their fair value plus, in the case of financial instruments not at FVTP&L, transaction costs that are directly attributable to the acquisition or issue of financial instruments. Subsequent to initial recognition, financial instruments are measured according to the category to which they are classified, which are: a) financial instruments classified as HFT, b) financial instruments designated as FVTP&L, c) AFS financial assets, d) L&R, or e) other than HFT financial liabilities. Their classification is determined by management on initial recognition based on the purpose for their acquisition. Financial instruments are subsequently measured at amortized cost, unless they are classified as AFS or HFT or designated as FVTP&L, in which case they are subsequently measured at fair value.
A financial asset is derecognized when the rights to receive cash flows from the asset have expired, or the Corporation has transferred its rights to receive cash flows from the asset and either (a) the Corporation has transferred substantially all the risks and rewards of the asset, or (b) the Corporation has neither transferred nor retained substantially all the risks and rewards of the asset, but has transferred control of the asset.
For transactions where it is not obvious whether the Corporation has transferred or retained substantially all the risks and rewards of ownership, the Corporation performs a quantitative analysis to compare its exposure to the variability in asset cash flows before and after the transfer. Judgment is applied in determining a number of reasonably possible scenarios that reflect the expected variability in the amount and timing of net cash flows, and then in assigning each scenario a probability with greater weighting being given to those outcomes which are considered more likely to occur.
A financial liability is derecognized when the obligation under the liability is discharged or cancelled or expires. When an existing liability is replaced by another from the same creditor on substantially different terms, or the terms of the liability are substantially modified, such an exchange or modification is treated as the derecognition of the original liability and the recognition of a new liability. The difference in the respective carrying amounts is recognized in the statement of income.
a) Financial instruments classified as HFT
Cash and cash equivalents – Cash and cash equivalents consist of cash and highly liquid investments held with investment-grade financial institutions and money market funds, with maturities of three months or less from the date of acquisition.

118 BOMBARDIER INC. FINANCIAL REPORT - FISCAL YEAR ENDED DECEMBER 31, 2014
Derivative financial instruments – Derivative financial instruments are mainly used to manage the Corporation’s exposure to foreign exchange and interest-rate market risks, generally through forward foreign exchange contracts, interest rate swap agreements and cross-currency interest-rate swap agreements. Derivative financial instruments include derivatives that are embedded in financial or non-financial contracts that are not closely related to the host contracts.
Derivative financial instruments are classified as HFT, unless they are designated as hedging instruments for which hedge accounting is applied (see below). Changes in the fair value of derivative financial instruments not designated in a hedging relationship, excluding embedded derivatives, are recognized in cost of sales or financing expense or financing income, based on the nature of the exposure.
Embedded derivatives of the Corporation include financing rate commitments related to the sale of aircraft, call options on long-term debt and foreign exchange instruments included in sale or purchase agreements. Upon initial recognition, the fair value of financing rate commitments linked to the sale of products is recognized as deferred charge in other assets. The deferred charge is recorded as an adjustment of the sale price of the related products. Call options on long-term debt that are not closely related to the host contract are measured at fair value, with the initial value recognized as an increase of the related long-term debt and amortized to net income using the effective interest method. Upon initial recognition, the fair value of the foreign exchange instruments not designated in a hedge relationship is recognized in cost of sales. Subsequent changes in fair value of embedded derivatives are recorded in cost of sales, other expense (income) or financing expense or financing income, based on the nature of the exposure.
b) Financial instruments designated as FVTP&LFinancial instruments may be designated on initial recognition as FVTP&L if any of the following criteria is met: (i) the financial instrument contains one or more embedded derivatives that otherwise would have to be accounted for separately; (ii) the designation eliminates or significantly reduces a measurement or recognition inconsistency that would otherwise arise from measuring the financial asset or liability or recognizing the gains and losses on them on a different basis; or (iii) the financial asset and financial liability are part of a group of financial assets, financial liabilities, or both that is managed and its performance is evaluated on a fair value basis, in accordance with a documented risk management or investment strategy. The Corporation has designated as FVTP&L, certain aircraft loans and lease receivables, certain investments in financing structures and lease subsidies, which were all designated as FVTP&L based on the above criterion (iii).
Subsequent changes in fair value of such financial instruments are recorded in other expense (income), except for the fair value changes arising from a change in interest rates which are recorded in financing expense or financing income.
c) AFS financial assetsInvestments in securities are usually classified as AFS. They are accounted for at fair value if reliably measurable, with unrealized gains and losses included in OCI, except for foreign exchange gains and losses on monetary investments, such as fixed income investments, which are recognized in income. Equity instruments that do not have a quoted market price in an active market and whose fair value cannot be reliably measured are recorded at cost.
When a decline in the fair value of an AFS financial asset has been recognised in OCI and there is objective evidence that the asset is impaired, the cumulative loss equal to the difference between the acquisition cost of the investments and its current fair value, less any impairment loss on that financial asset previously recognized in net income, is removed from AOCI and recognized in net income. Impairment losses recognized in net income for financial instruments classified as AFS can be reversed, except for investments in equity instruments.
d) L&RTrade and other receivables, restricted cash, certain aircraft loans and lease receivables, certain investments in financing structures, long-term contract receivables and other financial assets, are

BOMBARDIER INC. FINANCIAL REPORT - FISCAL YEAR ENDED DECEMBER 31, 2014 - NOTES 119
classified as L&R. Financial assets classified as L&R are measured at amortized cost using the effective interest rate method less any impairment losses.
Trade receivables as well as other financial assets classified as L&R are subject to periodic impairment review and are classified as impaired when there is objective evidence that an impairment loss has been incurred. The amount of the loss is measured as the difference between the asset's carrying amount and the present value of estimated future cash flows discounted at the original effective interest rate. If, in a subsequent period, the amount of the impairment loss decreases and the decrease can be related objectively to an event occurring after the impairment was recognized, the previously recognized impairment loss is reversed.
e) Other than HFT financial liabilitiesTrade and other payables, long-term debt, government refundable advances, vendor non-recurring costs, sale and leaseback obligations and certain other financial liabilities are classified as other than HFT liabilities and are measured at amortized cost using the effective interest rate method.
Hedge accountingDesignation as a hedge is only allowed if, both at the inception of the hedge and throughout the hedge period, the changes in the fair value of the derivative and non-derivative hedging financial instruments are expected to substantially offset the changes in the fair value of the hedged item attributable to the underlying risk exposure.
The Corporation formally documents all relationships between the hedging instruments and hedged items, as well as its risk management objectives and strategy for undertaking various hedge transactions. This process includes linking all derivatives to forecasted cash flows or to a specific asset or liability. The Corporation also formally documents and assesses, both at the hedge’s inception and on an ongoing basis, whether the hedging instruments are highly effective in offsetting the changes in the fair value or cash flows of the hedged items. There are three permitted hedging strategies.
Fair value hedges – The Corporation generally applies fair value hedge accounting to certain interest-rate derivatives and forward foreign exchange contracts hedging the exposures to changes in the fair value of recognised financial assets and financial liabilities. In a fair value hedge relationship, gains or losses from the measurement of derivative hedging instruments at fair value are recorded in net income, while gains or losses on hedged items attributable to the hedged risks are accounted for as an adjustment to the carrying amount of hedged items and are recorded in net income.
Cash flow hedges – The Corporation generally applies cash flow hedge accounting to forward foreign exchange contracts and interest-rate derivatives entered into to hedge foreign exchange risks on forecasted transactions and recognized assets and liabilities. In a cash flow hedge relationship, the portion of gains or losses on the hedging item that is determined to be an effective hedge is recognized in OCI, while the ineffective portion is recorded in net income. The amounts recognized in OCI are reclassified in net income as a reclassification adjustment when the hedged item affects net income. However, when an anticipated transaction is subsequently recorded as a non-financial asset, the amounts recognized in OCI are reclassified in the initial carrying amount of the related asset.
Hedge of net investments in foreign operations – The Corporation generally designates certain long-term debt as hedges of its net investments in foreign operations. The portion of gains or losses on the hedging instrument that is determined to be an effective hedge is recognized in OCI, while the ineffective portion is recorded in net income. The amounts recognized in OCI are reclassified in net income when corresponding exchange gains or losses arising from the translation of the foreign operations are recorded in net income.
The portion of gains or losses on the hedging instrument that is determined to be an effective hedge is recorded as an adjustment of the cost or revenue of the related hedged item. Gains and losses on derivatives not designated in a hedge relationship and gains and losses on the ineffective portion of effective hedges are recorded in cost of sales or financing expense or financing income for the interest component of the derivatives or when the derivatives were entered into for interest rate management purposes.

120 BOMBARDIER INC. FINANCIAL REPORT - FISCAL YEAR ENDED DECEMBER 31, 2014
Hedge accounting is discontinued prospectively when it is determined that the hedging instrument is no longer effective as a hedge, the hedging instrument is terminated or sold, or upon the sale or early termination of the hedged item.
Leases The determination of whether an arrangement is or contains a lease is based on the substance of the arrangement and requires an assessment of whether the arrangement conveys a right to use the asset. When substantially all risks and rewards of ownership are transferred from the lessor to the lessee, lease transactions are accounted for as finance leases. All other leases are accounted for as operating leases.
When the Corporation is the lessee – Leases of assets classified as finance leases are presented in the consolidated statements of financial position according to their nature. The interest element of the lease payment is recognized over the term of the lease based on the effective interest rate method and is included in financing expense. Payments made under operating leases are recognized in income on a straight-line basis over the term of the lease.
When the Corporation is the lessor – Assets subject to finance leases, mainly commercial aircraft, are initially recognized at an amount equal to the net investment in the lease and are included in aircraft lease receivables. Interest income is recognized over the term of the applicable leases based on the effective interest rate method. Assets under operating leases, mostly pre-owned regional and business aircraft, are included in PP&E. Lease income from operating leases is recognized on a straight-line basis over the term of the lease and is included in revenues.
Inventory valuation Long-term contracts – Long-term contract inventories include materials, direct labour, manufacturing overhead and other costs incurred in bringing the inventories to their present location and condition, as well as estimated contract margins. Advances and progress billings received on accounts of work performed for long-term contracts are deducted from related long-term contract inventories. Advances and progress billings received in excess of related long-term contract inventories are shown as liabilities.
Aerospace program and finished products – Aerospace program work in progress, raw materials, and finished product inventories are valued at the lower of cost or net realizable value. Cost is generally determined using the unit cost method, except for the cost of spare part inventory that is determined using the moving average method. The cost of manufactured inventories comprises all costs that are directly attributable to the manufacturing process, such as materials, direct labour, manufacturing overhead, and other costs incurred in bringing the inventories to their present location and condition. Net realizable value is the estimated selling price in the ordinary course of business less the estimated costs of completion and the estimated selling costs, except for raw materials for which it is determined using replacement cost. The Corporation estimates the net realizable value using both external and internal aircraft valuations, including information developed from the sale of similar aircraft in the secondary market.
Impairment of inventories – Inventories are written down to net realizable value when the cost of inventories is determined not to be recoverable. When the circumstances that previously caused inventories to be written down no longer exist or when there is clear evidence of an increase in net realizable value because of changed economic circumstances, the amount of the write-down is reversed.
Retirement and other long-term employee benefits Retirement benefit plans are classified as either defined benefit plans or defined contribution plans.
Defined benefit plans Retirement benefit liability or asset recognised on the consolidated statement of financial position is measured at the difference between the present value of the defined benefit obligation and the fair value of plan asset at the reporting date. When the Corporation has a surplus in a defined benefit plan, the value of any plan asset recognized is restricted to the asset ceiling - i.e. the present value of economic benefits available in the form of refunds from the plan or reductions in future contributions to the plan (“asset ceiling test”). A minimum liability is recorded when legal minimum funding requirements for past services exceed economic benefits available in the

BOMBARDIER INC. FINANCIAL REPORT - FISCAL YEAR ENDED DECEMBER 31, 2014 - NOTES 121
form of refunds from the plan or reductions in future contributions to the plan. A constructive obligation is recorded as a defined benefit obligation when there is no realistic alternative but to pay employee benefits. Retirement benefit liability or asset includes the effect of any asset ceiling, minimum liability and constructive obligation.
The cost of pension and other benefits earned by employees is actuarially determined for each plan using the projected unit credit method, and management’s best estimate of salary escalation, retirement ages, life expectancy, inflation, discount rates and health care costs. Plan assets are assets that are held by a long-term employee benefit fund or qualifying insurance policies. These assets are measured at fair value at the end of the reporting period, which is based on published market mid-price information in the case of quoted securities. The discount rates are determined at each reporting date by reference to market yields at the end of the reporting period on high quality corporate fixed-income investments consistent with the currency and the estimated terms of the related retirement benefit liability.
The remeasurement gains and losses (including the foreign exchange impact) arising on the plan assets and defined benefit obligation and the effect of any asset ceiling and minimum liability are recognized directly in OCI in the period in which they occur and are never reclassified to net income. Past service costs (credits) are recognized directly in income in the period in which they occur.
The accretion on net retirement benefit obligations is included in financing income or financing expense. The remaining components of the benefit cost are either capitalized as part of labour costs and included in inventories and in certain PP&E and intangible assets during their construction, or are recognized directly in income. The benefit cost recorded in net income is allocated to labour costs based on the function of the employee accruing the benefits.
Defined contribution plansContributions to defined contribution plans are recognized in net income or are either capitalized as part of labour costs and included in inventories and in certain PP&E and intangible assets during their construction. The benefit cost recorded in net income is allocated to labour costs based on the function of the employee accruing the benefits.
Other long-term employee benefits – The accounting method is similar to the method used for defined benefit plans, except that all actuarial gains and losses are recognized immediately in income. Other long-term employee benefits are included in other liabilities.
Property, plant and equipmentPP&E are carried at cost less accumulated amortization and impairment losses. The cost of an item of PP&E includes its purchase price or manufacturing cost, borrowing costs as well as other costs incurred in bringing the asset to its present location and condition. If the cost of certain components of an item of PP&E is significant in relation to the total cost of the item, the total cost is allocated between the various components, which are then separately depreciated over the estimated useful lives of each respective component. The amortization of PP&E is computed on a straight-line basis over the following useful lives:
Buildings 5 to 75 yearsEquipment 2 to 15 yearsOther 3 to 20 years
The amortization method and useful lives are reviewed on a regular basis, at least annually, and changes are accounted for prospectively. The amortization expense and impairments are recorded in cost of sales, SG&A or R&D expenses based on the function of the underlying asset or in special items. Amortization of assets under construction begins when the asset is ready for its intended use.
When a significant part is replaced or a major inspection or overhaul is performed, its cost is recognized in the carrying amount of the PP&E if the recognition criteria are satisfied, and the carrying amount of the replaced part or previous inspection or overhaul is derecognized. All other repair and maintenance costs are charged to income when incurred.

122 BOMBARDIER INC. FINANCIAL REPORT - FISCAL YEAR ENDED DECEMBER 31, 2014
Intangible assets Internally generated intangible assets include development costs (mostly aircraft prototype design and testing costs) and internally developed or modified application software. These costs are capitalized when certain criteria for deferral such as proven technical feasibility are met. The costs of internally generated intangible assets include the cost of materials, direct labour, manufacturing overheads and borrowing costs.
Acquired intangible assets include the cost of development activities carried out by vendors for which the Corporation controls the underlying output from the usage of the technology, as well as the cost related to externally acquired licences, patents and trademarks.
Intangible assets are recorded at cost less accumulated amortization and impairment losses and include goodwill, aerospace program tooling, as well as other intangible assets such as licenses, patents and trademarks. Other intangible assets are included in other assets.
Amortization of aerospace program tooling begins at the date of completion of the first aircraft of the program. Amortization of other intangibles begins when the asset is ready for its intended use. Amortization expense is recognized as follows:
Method Estimated useful lifeAerospace program tooling Unit of production Expected number of aircraft to be produced(1)
Other intangible assetsLicenses, patent and trademarks Straight-line 3 to 20 yearsOther Straight-line 3 to 5 years
(1) As at December 31, 2014, the remaining number of units to fully amortize the aerospace program tooling, except for aerospace program tooling under development, is expected to be produced over the next 6 years.
The amortization methods and estimated useful lives are reviewed on a regular basis, at least annually, and changes are accounted for prospectively. The amortization expense is recorded in cost of sales, SG&A or R&D expenses based on the function of the underlying assets.
The Corporation does not have indefinite-life intangible assets, other than goodwill. Goodwill represents the excess of the purchase price over the fair value of the identifiable net assets acquired in a business acquisition. After initial recognition, goodwill is measured at cost less any accumulated impairment losses.
Borrowing costsBorrowing costs consist of interest on long-term debt and other costs that the Corporation incurs in connection with the borrowing of funds. Borrowing costs directly attributable to the acquisition, construction or production of a qualifying asset are capitalised as part of the cost of that asset and are deducted from the financing expense to which they relate. The Corporation suspends the capitalisation of borrowing costs during extended periods in which it suspends active development of a qualifying asset. All other borrowing costs are expensed in the period they occur.
Impairment of PP&E and intangible assets The Corporation assesses at each reporting date whether there is an indication that a PP&E or intangible asset may be impaired. If any indication exists, the Corporation estimates the recoverable amount of the individual asset, when possible.
When the asset does not generate cash inflows that are largely independent of those from other assets or group of assets, the asset is tested at the CGU level. Most of the Corporation’s non-financial assets are tested for impairment at the CGU level. The recoverable amount of an asset or CGU is the higher of its fair value less costs to sell and its value in use.
• The fair value less costs to sell reflects the amount the Corporation could obtain from the asset’s disposal in an arm’s length transaction between knowledgeable, willing parties, after deducting the costs of disposal. If there is no binding sales agreement or active market for the asset, the fair value is assessed by using appropriate valuation models dependent on the nature of the asset or CGU, such as the discounted cash flow models.

BOMBARDIER INC. FINANCIAL REPORT - FISCAL YEAR ENDED DECEMBER 31, 2014 - NOTES 123
• The value in use is calculated using estimated net cash flows, with detailed projections generally over a three-year period and subsequent years being extrapolated using a growth assumption. The estimated net cash flows are discounted to their present value using a discount rate before income taxes that reflects current market assessments of the time value of money and the risk specific to the asset or CGU.
When the recoverable amount is less than the carrying value of the related asset or CGU, the related assets are written down to their recoverable amount and an impairment loss is recognized in net income.
For PP&E and intangible assets other than goodwill, an assessment is made at each reporting date as to whether there is any indication that previously recognized impairment losses may no longer exist or may have decreased. If such indication exists, the Corporation estimates the recoverable amount of the asset or CGU. A previously recognized impairment loss is reversed only if there has been a change in the estimates used to determine the recoverable amount since the last impairment loss was recognized. The reversal of impairment losses is limited to the amount that would bring the carrying value of the asset or CGU to the amount that would have been recorded, net of amortization, had no impairment loss been recognized for the asset or CGU in prior years. Such reversal is recognized to income in the same line item where the original impairment was recognized.
Intangible assets and PP&E not yet available for use and goodwill are reviewed for impairment at least annually or more frequently if circumstances such as significant declines in expected sales, earnings or cash flows indicate that it is more likely than not that the asset or CGU might be impaired. Impairment losses relating to goodwill are not reversed in future periods.
Provisions Provisions are recognised when the Corporation has a present legal or constructive obligation as a result of a past event, it is probable that an outflow of resources will be required to settle the obligation and the cost can be reliably estimated. These liabilities are presented as provisions when they are of uncertain timing or amount. Provisions are measured at their present value.
Product warranties – A provision for warranty cost is recorded in cost of sales when the revenue for the related product is recognized. The interest component associated with product warranties, when applicable, is recorded in financing expense. The cost is estimated based on a number of factors, including the historical warranty claims and cost experience, the type and duration of warranty coverage, the nature of products sold and in service and counter-warranty coverage available from the Corporation’s suppliers. Claims for reimbursement from third parties are recorded if their realization is virtually certain. Product warranties typically range from one to five years, except for aircraft structural and bogie warranties that extend up to 20 years.
Credit and residual value guarantees – Credit and residual value guarantees related to the sale of aircraft are recorded at the amount the Corporation expects to pay under these guarantees when the revenue for the related product is recognized. Subsequent to initial recognition, changes in the value of these guarantees are recorded in other expense (income), except for the changes in value arising from a change in interest rates, which are recorded in financing expense or financing income.
Credit guarantees provide support through contractually limited payments to the guaranteed party to mitigate default-related losses. Credit guarantees are triggered if customers do not perform during the term of the financing.
Residual value guarantees provide protection, through contractually limited payments, to the guaranteed parties in cases where the market value of the underlying asset falls below the guaranteed value. In most cases, these guarantees are provided as part of a financing arrangement.
Restructuring provisions – Restructuring provisions are recognised only when the Corporation has an actual or a constructive obligation. The Corporation has a constructive obligation when a detailed formal plan identifies the business or part of the business concerned, the location and number of employees affected, a detailed estimate of the associated costs and an appropriate timeline. Furthermore, the affected employees or worker councils must have been notified of the plan’s main features.

124 BOMBARDIER INC. FINANCIAL REPORT - FISCAL YEAR ENDED DECEMBER 31, 2014
Onerous contracts – If it is more likely than not that the unavoidable costs of meeting the obligations under a contract, other than a long-term contract, exceed the economic benefits expected to be received under it, a provision for onerous contracts is recorded in cost of sales, except for the interest component, which is recorded in financing expense. Unavoidable costs include anticipated cost overruns, as well as expected costs associated with late delivery penalties and technological problems. Costs incurred to set up an efficient manufacturing process in the early phase of an aircraft program are not considered unavoidable costs related to a specific contract. Provisions for onerous contracts are measured at the lower of the expected cost of fulfilling the contract and the expected cost of terminating the contract.
Termination benefits – Termination benefits are usually paid when employment is terminated before the normal retirement date or when an employee accepts voluntary redundancy in exchange for these benefits. The Corporation recognizes termination benefits when it is demonstrably committed, through a detailed formal plan without possibility of withdrawal, to terminate the employment of current employees. Termination benefits are included in provisions.
Environmental costs – A provision for environmental costs is recorded when environmental claims or remedial efforts are probable and the costs can be reasonably estimated. Legal asset retirement obligations and environmental costs of a capital nature that extend the life, increase the capacity or improve the safety of an asset or that mitigate, or prevent environmental contamination that has yet to occur, are included in PP&E and are generally amortized over the remaining useful life of the underlying asset. Costs that relate to an existing condition caused by past operations and that do not contribute to future revenue generation are expensed and included in cost of sales.
Litigation – A provision for litigation is recorded in case of legal actions, governmental investigations or proceedings when it is probable that an outflow of resources will be required to settle the obligation and the cost can be reliably estimated.
Share-based payments Equity-settled share-based payment plans – Equity-settled share-based payments are measured at fair value at the grant date. For the PSUs and DSUs, the value of the compensation is measured based on the closing price of a Class B Share (Subordinate Voting) of the Corporation on the Toronto Stock Exchange adjusted to take into account the terms and conditions upon which the shares were granted, if any, and is based on the PSUs and DSUs that are expected to vest. For share option plans, the value of the compensation is measured using a Black-Scholes option pricing model. The effect of any change in the number of options, PSUs and DSUs that are expected to vest is accounted for in the period in which the estimate is revised. Compensation expense is recognized on a straight-line basis over the vesting period, with a corresponding increase in contributed surplus. Any consideration paid by plan participants on the exercise of stock options is credited to share capital.
Employee share purchase plan – The Corporation’s contributions to the employee share purchase plan are measured at cost and accounted for in the same manner as the related employee payroll costs. Compensation expense is recorded at the time of the employee contribution.
3. FUTURE CHANGES IN ACCOUNTING POLICIES
Financial instruments In July 2014, the IASB completed the three-part project to replace IAS 39, Financial instruments: recognition and measurement by issuing IFRS 9, Financial instruments. IFRS 9, Financial instruments includes classification and measurement of financial assets and financial liabilities, a forward-looking ‘expected loss’ impairment model and a substantially-reformed approach to hedge accounting.
IFRS 9 uses a new approach to determine whether a financial asset is measured at amortized cost or fair value, replacing the multiple rules in IAS 39. The approach in IFRS 9 is based on how an entity manages its financial instruments and the contractual cash flow characteristics of the financial assets. Most of the requirements in IAS 39 for classification and measurement of financial liabilities were carried forward in IFRS 9. However, the

BOMBARDIER INC. FINANCIAL REPORT - FISCAL YEAR ENDED DECEMBER 31, 2014 - NOTES 125
portion of the changes in fair value related to the entity’s own credit risk, in measuring a financial liability at FVTP&L, will be presented in OCI rather than in the statement of income.
IFRS 9 also introduced a new, expected-loss impairment model that will require more timely recognition of expected credit losses. Specifically, the new Standard requires entities to account for expected credit losses from when financial instruments are first recognized and to recognize full lifetime expected losses on a more timely basis.
Lastly, IFRS 9 introduced a new hedge accounting model, together with corresponding disclosures about risk management activities. The new hedge accounting model, represents a substantial overhaul of hedge accounting that will enable entities to better reflect their risk management activities in their financial statements.
IFRS 9 will be effective for the Corporation’s fiscal year beginning on January 1, 2018, with earlier application permitted. The Corporation has not yet assessed the impact of the adoption of this standard on its consolidated financial statements.
Employee benefits In November 2013, the IASB amended IAS 19, Employee benefits, in order to simplify the accounting for contributions of defined benefit plans that are independent of the number of years of employee service, for example, employee contributions that are calculated according to a fixed percentage of salary. This amendment will be effective for the Corporation’s fiscal year beginning on January 1, 2015, with earlier application permitted. The Corporation has started to assess the impact the adoption of this standard will have on its consolidated financial statements and no significant impact is expected.
Revenue Recognition In May 2014, the IASB released IFRS 15, Revenue from contracts with customers, which supersedes IAS 11, Construction Contracts, IAS 18, Revenues, IFRIC 13, Customer Loyalty Programs, IFRIC 15, Agreement for the Construction of Real Estate, IFRIC 18, Transfers of Assets from Customers and SIC-31, Revenue – Barter Transactions Involving Advertising Services. The core principle of IFRS 15 is that an entity should recognize revenue to depict the transfer of promised goods or services to customers in an amount that reflects the consideration to which the entity expects to be entitled in exchange for those goods or services. IFRS 15 will also result in enhanced disclosures about revenue, provide guidance for transactions that were not previously addressed comprehensively (for example, service revenue and contract modifications) and improve guidance for multiple-element arrangements. IFRS 15 will be effective for the Corporation’s fiscal year beginning on January 1, 2017, with earlier application permitted. The Corporation has not yet assessed the impact of the adoption of this standard on its consolidated financial statements.

126 BOMBARDIER INC. FINANCIAL REPORT - FISCAL YEAR ENDED DECEMBER 31, 2014
4. USE OF ESTIMATES AND JUDGMENT
The application of the Corporation’s accounting policies requires management to use estimates and judgments that can have a significant effect on the revenues, expenses, comprehensive income, assets and liabilities recognized and disclosures made in the consolidated financial statements. Estimates and judgments are significant when:
• the outcome is highly uncertain at the time the estimates and judgments are made; and • if different estimates or judgments could reasonably have been used that would have had a material
impact on the consolidated financial statements.
Management’s best estimates regarding the future are based on the facts and circumstances available at the time estimates are made. Management uses historical experience, general economic conditions and trends, as well as assumptions regarding probable future outcomes as the basis for determining estimates. Estimates and their underlying assumptions are reviewed periodically and the effects of any changes are recognized immediately. Actual results will differ from the estimates used, and such differences could be material.
Management’s budget and strategic plan cover a three-year period and are fundamental information used as a basis for many estimates necessary to prepare financial information. Management prepares a budget and strategic plan covering a three-year period, on an annual basis, using a process whereby a detailed one-year budget and two-year strategic plan are prepared by each business unit and then consolidated at the reportable segment and Corporation levels. Cash flows and profitability included in the budget and strategic plan are based on existing and future contracts and orders, general market conditions, current cost structures, anticipated cost variations and in-force collective agreements. The budget and strategic plan are subject to approval at various levels, including senior management and the Board of Directors. Management uses the budget and strategic plan as well as additional projections or assumptions to derive the expected results for periods thereafter. Management then tracks performance as compared to the budget and strategic plan at various levels within the Corporation. Significant variances in actual performance are a key trigger to assess whether certain estimates used in the preparation of financial information must be revised.
The following areas require management’s most critical estimates and judgments. The sensitivity analyses below should be used with caution as the changes are hypothetical and the impact of changes in each key assumption may not be linear.
Long-term contracts – BT conducts most of its business under long-term manufacturing and service contracts and BA has some long-term maintenance service contracts, as well as design and development contracts for third parties. Revenues and margins from long-term contracts relating to the designing, engineering or manufacturing of specially designed products (including rail vehicles and component overhaul) and service contracts are recognized using the percentage-of-completion method of accounting. The long-term nature of these contracts requires estimates of total contract costs and revenues at completion.
Estimated revenues at completion are adjusted for change orders, claims, performance incentives, price escalation clauses and other contract terms that provide for the adjustment of prices. If it is probable that changes in revenues will occur, they are included in estimated revenues at completion.
Estimated contract costs at completion incorporate forecasts for material and labour usage and costs, foreign exchange rates (including the effect of hedges) and labour productivity. These costs are influenced by the nature and complexity of the work to be performed, as well as the impact of change orders and potential delays in delivery. Cost estimates are based mainly on historical performance trends, economic trends, collective agreements and contracts signed with suppliers. Management applies judgment to determine the probability that the Corporation will incur additional costs from delays or other penalties and such costs, if probable, are included in estimated costs at completion.
Recognized revenues and margins are subject to revisions as contracts progress towards completion. Management conducts quarterly reviews of estimated costs and revenues to completion on a contract-by-contract basis. In addition, a detailed annual review is performed on a contract-by-contract basis as part of the budget and strategic plan process. The effect of any revision may be significant and is recorded by way of a cumulative catch-

BOMBARDIER INC. FINANCIAL REPORT - FISCAL YEAR ENDED DECEMBER 31, 2014 - NOTES 127
up adjustment in the period in which the estimates are revised. In the fourth quarter of fiscal year 2014, the Corporation revised the escalation assumptions for some contracts, mainly in rolling stock, which impacted estimated future revenues and resulted in a catch-up adjustment to reflect lower contract margins on revenue already recognized.
Sensitivity analysisA 1% increase in the estimated future costs to complete all ongoing long-term contracts would have decreased BT’s gross margin for fiscal year 2014 by approximately $97 million.
Aerospace program tooling – Aerospace program tooling amortization and the calculation of recoverable amounts used in impairment testing require estimates of the expected number of aircraft to be delivered over the life of each program. The expected number of aircraft is based on management’s aircraft market forecasts and the Corporation’s expected share of each market. Such estimates are reviewed in detail as part of the budget and strategic plan process. For purposes of impairment testing, management exercises judgment to identify independent cash inflows to identify CGUs by family of aircraft. The recoverable amount of a group of assets is based on fair value less costs of disposal, generally determined using a discounted cash flow model. Other key estimates used to determine the recoverable amount include the applicable discount rate, the expected future cash flows over the remaining life of each program, which include costs to complete the development activities, if any, as well as potential upgrades, and derivatives expected over the life of the program. The estimated cost of potential upgrades and derivatives is based on past experience with previous programs. They also include future cash flows from aftermarket activities, as well as expected cost savings due to synergies from the perspective of a market participant. The inputs used in the discounted cash flow model are Level 3 inputs (inputs that are not based on observable market data).
The discount rate is based on a weighted average cost of capital calculated using market-based inputs, available directly from financial markets or based on a benchmark sampling of representative publicly traded companies in the aerospace sector.
The estimated future cash flows for the first three years are based on the budget and strategic plan. After the initial three years, long-range forecasts prepared by management are used. Forecast future cash flows are based on management’s risk-adjusted best estimate of future sales under existing firm orders, expected future orders, timing of payments based on expected delivery schedule, revenues from related services, procurement costs based on existing contracts with suppliers, future labour costs, general market conditions, foreign exchange rates and applicable income tax rates.
The recoverable amounts were established during the fourth quarter of fiscal year 2014 using the assumptions described above. A post-tax discount rate of 8.0% was used.
On January 15, 2015 the Corporation announced its decision to pause the Learjet 85 business aircraft program. The pause follows a downward revision of Bombardier’s business aircraft market forecast, primarily due the continued weakness of the light aircraft category since the economic downturn. As a result, the Corporation has recorded an impairment charge in the fourth quarter of fiscal year 2014 of $1.3 billion. See Note 20 - Intangible assets for more details.
Sensitivity analysisThe following analyses are presented in isolation from one another, i.e. all other estimates left unchanged:
A 10% decrease in the expected future net cash inflows for all programs evenly distributed over future periods, would have resulted in an additional impairment charge of approximately $410 million in fiscal year 2014 for certain programs under development.
An increase of 100-basis points in the discount rate used to perform the impairment test would have resulted in an additional impairment charge of approximately $440 million in fiscal year 2014 for certain programs under development.

128 BOMBARDIER INC. FINANCIAL REPORT - FISCAL YEAR ENDED DECEMBER 31, 2014
Goodwill – The recoverable amount of the BT operating segment, the group of CGUs at which level goodwill is monitored by management, is based on the higher of fair value less costs to sell and value in use. During fiscal year 2014, the Corporation completed an impairment test. The recoverable amount was calculated based on fair value less costs to sell using a discounted cash flow model. The inputs used in the discounted cash flow model are Level 3 inputs (inputs that are not based on observable market data). The Corporation did not identify any impairment.
Estimated future cash flows were based on the budget and strategic plan for the first three years and a constant growth rate of 1% was applied to derive estimated cash flows beyond the initial three-year period. The post-tax discount rate is also a key estimate in the discounted cash flow model and was based on a representative weighted average cost of capital. The post-tax discount rate used to calculate the recoverable amount in fiscal year 2014 was 7.25%. A 100-basis point change in the post-tax discount rate would not have resulted in an impairment charge in fiscal year 2014. A 10% decrease on the growth rate of 1% would not have resulted in an impairment charge in fiscal year 2014.
Valuation of deferred income tax assets – To determine the extent to which deferred income tax assets can be recognized, management estimates the amount of probable future taxable profits that will be available against which deductible temporary differences and unused tax losses can be utilized. Such estimates are made as part of the budget and strategic plan by tax jurisdiction on an undiscounted basis and are reviewed on a quarterly basis. Management exercises judgment to determine the extent to which realization of future taxable benefits is probable, considering factors such as the number of years to include in the forecast period, the history of taxable profits and availability of conservative tax strategies. On January 15, 2015 the Corporation announced its decision to pause the Learjet 85 business aircraft program. The pause follows a downward revision of Bombardier’s business aircraft market forecast, primarily due the continued weakness of the light aircraft category since the economic downturn. As a result, the Corporation has recorded a write-down of deferred income tax assets in the fourth quarter of fiscal year 2014. See Note 11 - Income taxes for more details.
Tax contingencies – Uncertainties exist with respect to the interpretation of complex tax regulations, changes in tax laws, and the amount and timing of future taxable income. Given the wide range of international business relationships and the long-term nature and complexity of existing contractual agreements, differences arising between the actual results and the assumptions made, or future changes to such assumptions, could necessitate future adjustments to tax income and expense already recorded. The Corporation establishes tax provisions for possible consequences of audits by the tax authorities of each country in which it operates. The amount of such provisions is based on various factors, such as experience of previous tax audits and differing interpretations of tax regulations by the taxable entity and the responsible tax authority. Such differences in interpretation may arise for a wide variety of issues depending on the conditions prevailing in the respective domicile of the legal entities.
Credit and residual value guarantees – The Corporation uses an internal valuation model based on stochastic simulations to measure the amounts expected to be paid under credit and residual value guarantees. The amounts expected to be paid under the guarantees depend on whether credit defaults occur during the term of the original financing. When a credit default occurs, the credit guarantee may be called upon. In the absence of a credit default the residual value guarantee may be triggered. In both cases, the guarantees can only be called upon if there is a loss upon the sale of the aircraft. Therefore, the value of the guarantee is in large part impacted by the future value of the underlying aircraft. Aircraft residual value curves, prepared by management based on information from external appraisals and adjusted to reflect specific factors of the current aircraft market and a balanced market in the medium and long term, are used to estimate this future value. The amount of the liability is also significantly impacted by the current market assumption for interest rates since payments under these guarantees are mostly expected to be made in the medium to long term. Other key estimates in calculating the value of the guarantees include default probabilities, estimated based on published credit ratings when available or, when not available, on internal assumptions regarding the credit risk of customers, as well as on the likelihood that credit or residual value guarantees will be called upon at the expiry of the financing arrangements. The estimates are reviewed on a quarterly basis.

BOMBARDIER INC. FINANCIAL REPORT - FISCAL YEAR ENDED DECEMBER 31, 2014 - NOTES 129
Sensitivity analysisThe following analyses are presented in isolation from one another, i.e. all other estimates left unchanged:
Assuming a decrease of 5% in the residual value curves of all aircraft as at December 31, 2014, EBIT for fiscal year 2014 would have been negatively impacted by $18 million.
Assuming a 100-basis point decrease in interest rates as at December 31, 2014, EBT for fiscal year 2014 would have been negatively impacted by $16 million. Assuming a 100-basis point increase in interest rates as at December 31, 2014, EBT for fiscal year 2014 would have been positively impacted by $15 million.
Retirement and other long-term employee benefits – The actuarial valuation process used to measure pension and other post-employment benefit costs, assets and obligations is dependent on assumptions regarding discount rates, compensation and pre-retirement benefit increases, inflation rates, health-care cost trends, as well as demographic factors such as employee turnover, retirement and mortality rates. The impacts from changes in discount rates and, when significant, from key events and other circumstances, are recorded quarterly.
Discount rates are used to determine the present value of the expected future benefit payments and represent the market rates for high-quality corporate fixed-income investments consistent with the currency and the estimated term of the retirement benefit liabilities. As the Canadian high-quality corporate bond market, as defined under IFRS, includes relatively few medium- and long- term maturity bonds, the discount rate for the Corporation's Canadian pension and other post-employment plans is established by constructing a yield curve using four maturity ranges. The first maturity range of the curve was based on observed market rates for AA-rated corporate bonds with maturities of less than six years. In the longer maturity ranges, due to the smaller number of high-quality bonds available, the curve is derived using market observations and extrapolated data. The extrapolated data points were created by adding a term-based yield spread over long-term provincial bond yields. This spread is based on the observed spreads between AA-rated corporate bonds and AA-rated provincial bonds in the last three maturity ranges of the curve.
Expected rates of compensation increases are determined considering the current salary structure, as well as historical and anticipated wage increases, in the context of current economic conditions.
See Note 21 – Retirement benefits for further details regarding assumptions used and sensitivity to changes in critical actuarial assumptions.
Consolidation – From time to time, the Corporation participates in structured entities where voting rights are not the dominant factor in determining control. In these situations, management may use a variety of complex estimation processes involving both qualitative and quantitative factors to determine whether the Corporation is exposed to, or has rights to, significant variable returns. The quantitative analyses involve estimating the future cash flows and performance of the investee and analyzing the variability in those cash flows. The qualitative analyses involve consideration of factors such as the purpose and design of the investee and whether the Corporation is acting as an agent or principal. There is a significant amount of judgment exercised in evaluating the results of these analyses as well as in determining if the Corporation has power to affect the investee’s returns, including an assessment of the impact of potential voting rights, contractual agreements and de facto control. Management reassesses its initial determination of control if facts or circumstances indicate that there may be changes to one or more elements of control.

130 BOMBARDIER INC. FINANCIAL REPORT - FISCAL YEAR ENDED DECEMBER 31, 2014
5. SEGMENT DISCLOSURE
The Corporation has two reportable segments: BA and BT. Each reportable segment offers different products and services and requires different technology and marketing strategies.
BA BTBA is a world leader in the design, manufacture and support ofinnovative aviation products. BA's aircraft portfolio includes acomprehensive line of business aircraft, commercial aircraftincluding regional jets, turboprops and single-aisle mainline jets,as well as specialized and amphibious aircraft. BA also offersaftermarket services. BA was also offering Flexjet fractionalownership and flight entitlement programs up to December 4,2013.
BT is a world leader in the design, manufacture andsupport of rail equipment and systems, offering a fullrange of passenger railcars, locomotives, light railvehicles and automated people movers. It also providesbogies, electric propulsion, control equipment andmaintenance services, as well as complete railtransportation systems and rail control solutions.
The segmented information is prepared using the accounting policies described in Note 2 – Summary of significant accounting policies.
Management assesses segment performance based on EBIT and EBIT before special items. Corporate charges are allocated to segments mostly based on each segment’s revenues. The segmented results of operations and other information are as follows, for fiscal years:
2014 2013BA BT Total BA BT Total
Results of operationsRevenues $ 10,499 $ 9,612 $ 20,111 $ 9,385 $ 8,766 $ 18,151Cost of sales 9,148 8,386 17,534 8,118 7,540 15,658Gross margin 1,351 1,226 2,577 1,267 1,226 2,493SG&A 672 686 1,358 699 718 1,417R&D 199 148 347 173 120 293Share of income of joint ventures and associates — (89) (89) — (119) (119)Other expense (income) 43 (5) 38 7 2 9EBIT before special items 437 486 923 388 505 893Special items(1) 1,432 57 1,489 (30) — (30)EBIT $ (995) $ 429 (566) $ 418 $ 505 923Financing expense 249 271Financing income (75) (119)EBT (740) 771Income taxes 506 199Net income (loss) $ (1,246) $ 572
Other informationNet additions to PP&E and
intangible assets(2) $ 1,857 $ 107 $ 1,964 $ 2,213 $ 74 $ 2,287Amortization $ 301 $ 116 $ 417 $ 267 $ 124 $ 391Impairment charge on intangible assets(3) $ 1,266 $ — $ 1,266 $ — $ — $ —
(1) See Note 8 – Special items for more details.(2) As per the consolidated statements of cash flows. (3) See Note 20 – Intangible assets for more details.
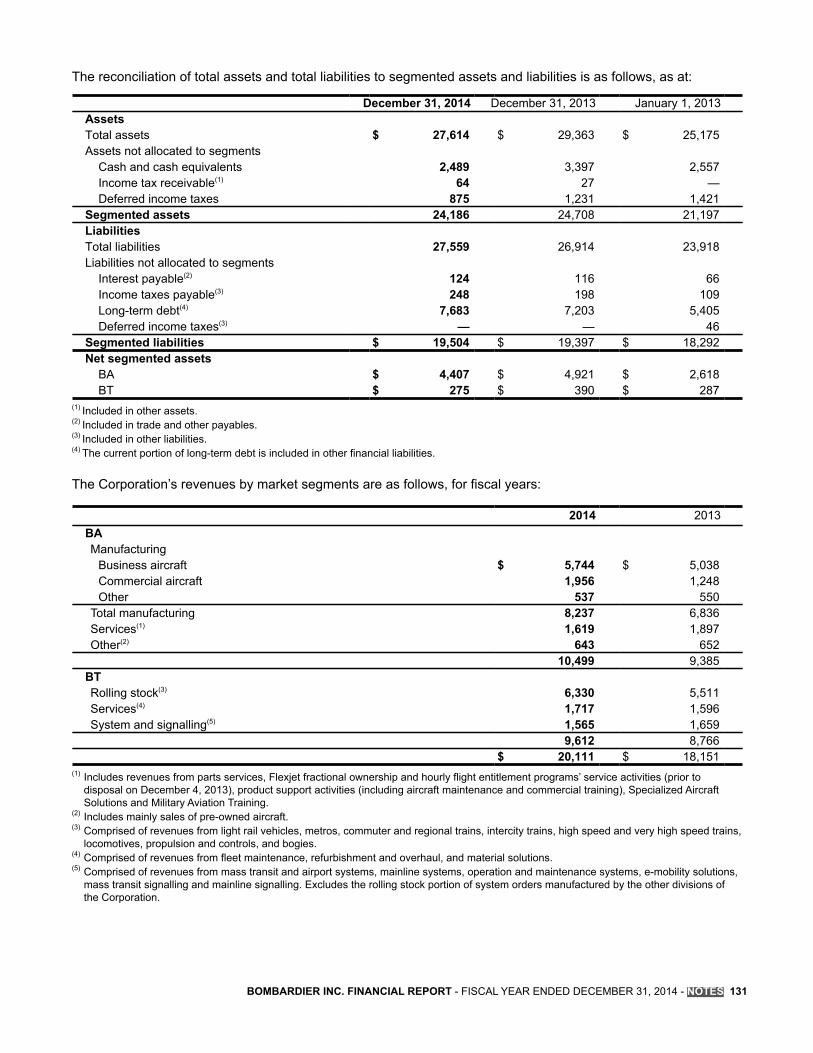
BOMBARDIER INC. FINANCIAL REPORT - FISCAL YEAR ENDED DECEMBER 31, 2014 - NOTES 131
The reconciliation of total assets and total liabilities to segmented assets and liabilities is as follows, as at:
December 31, 2014 December 31, 2013 January 1, 2013AssetsTotal assets $ 27,614 $ 29,363 $ 25,175Assets not allocated to segments
Cash and cash equivalents 2,489 3,397 2,557Income tax receivable(1) 64 27 —Deferred income taxes 875 1,231 1,421
Segmented assets 24,186 24,708 21,197LiabilitiesTotal liabilities 27,559 26,914 23,918Liabilities not allocated to segments
Interest payable(2) 124 116 66Income taxes payable(3) 248 198 109Long-term debt(4) 7,683 7,203 5,405Deferred income taxes(3) — — 46
Segmented liabilities $ 19,504 $ 19,397 $ 18,292Net segmented assets
BA $ 4,407 $ 4,921 $ 2,618BT $ 275 $ 390 $ 287
(1) Included in other assets.(2) Included in trade and other payables.(3) Included in other liabilities.(4) The current portion of long-term debt is included in other financial liabilities.
The Corporation’s revenues by market segments are as follows, for fiscal years:
2014 2013BAManufacturing
Business aircraft $ 5,744 $ 5,038Commercial aircraft 1,956 1,248Other 537 550
Total manufacturing 8,237 6,836Services(1) 1,619 1,897Other(2) 643 652
10,499 9,385BTRolling stock(3) 6,330 5,511Services(4) 1,717 1,596System and signalling(5) 1,565 1,659
9,612 8,766$ 20,111 $ 18,151
(1) Includes revenues from parts services, Flexjet fractional ownership and hourly flight entitlement programs’ service activities (prior to disposal on December 4, 2013), product support activities (including aircraft maintenance and commercial training), Specialized Aircraft Solutions and Military Aviation Training.
(2) Includes mainly sales of pre-owned aircraft.(3) Comprised of revenues from light rail vehicles, metros, commuter and regional trains, intercity trains, high speed and very high speed trains,
locomotives, propulsion and controls, and bogies.(4) Comprised of revenues from fleet maintenance, refurbishment and overhaul, and material solutions.(5) Comprised of revenues from mass transit and airport systems, mainline systems, operation and maintenance systems, e-mobility solutions,
mass transit signalling and mainline signalling. Excludes the rolling stock portion of system orders manufactured by the other divisions of the Corporation.
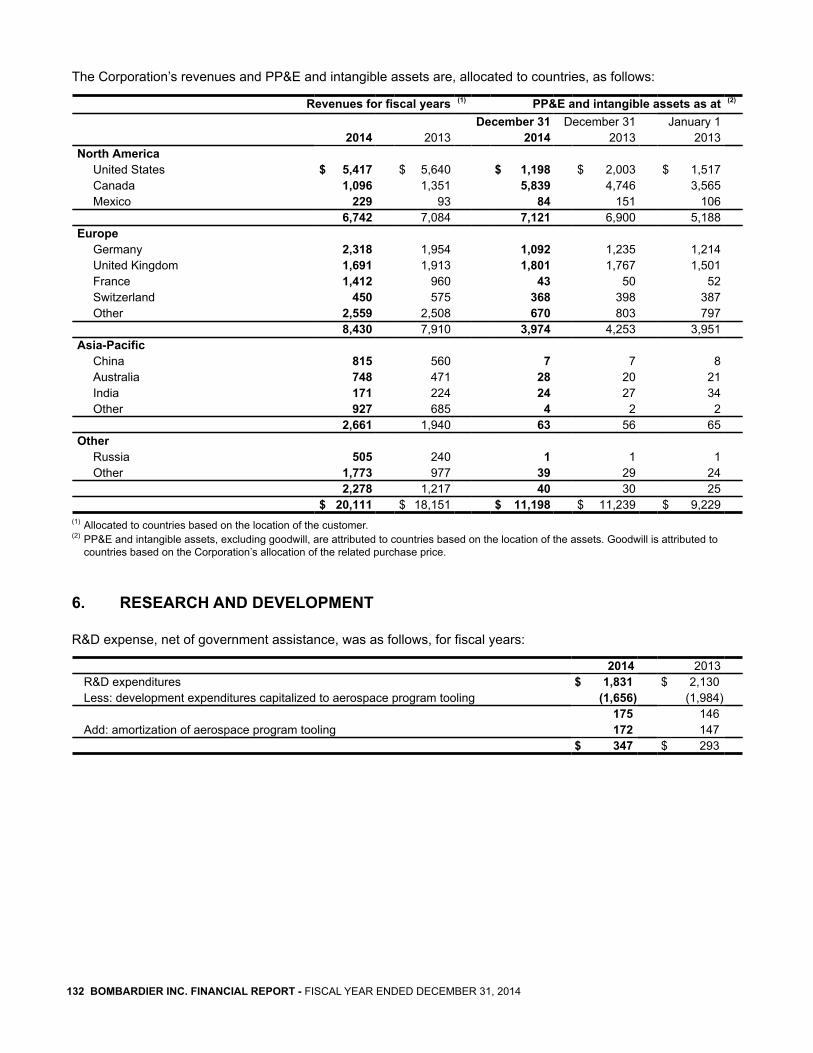
132 BOMBARDIER INC. FINANCIAL REPORT - FISCAL YEAR ENDED DECEMBER 31, 2014
The Corporation’s revenues and PP&E and intangible assets are, allocated to countries, as follows:
Revenues for fiscal years (1) PP&E and intangible assets as at (2)
December 31 December 31 January 12014 2013 2014 2013 2013
North AmericaUnited States $ 5,417 $ 5,640 $ 1,198 $ 2,003 $ 1,517Canada 1,096 1,351 5,839 4,746 3,565Mexico 229 93 84 151 106
6,742 7,084 7,121 6,900 5,188Europe
Germany 2,318 1,954 1,092 1,235 1,214United Kingdom 1,691 1,913 1,801 1,767 1,501France 1,412 960 43 50 52Switzerland 450 575 368 398 387Other 2,559 2,508 670 803 797
8,430 7,910 3,974 4,253 3,951Asia-Pacific
China 815 560 7 7 8Australia 748 471 28 20 21India 171 224 24 27 34Other 927 685 4 2 2
2,661 1,940 63 56 65Other
Russia 505 240 1 1 1Other 1,773 977 39 29 24
2,278 1,217 40 30 25$ 20,111 $ 18,151 $ 11,198 $ 11,239 $ 9,229
(1) Allocated to countries based on the location of the customer.(2) PP&E and intangible assets, excluding goodwill, are attributed to countries based on the location of the assets. Goodwill is attributed to
countries based on the Corporation’s allocation of the related purchase price.
6. RESEARCH AND DEVELOPMENT
R&D expense, net of government assistance, was as follows, for fiscal years:
2014 2013R&D expenditures $ 1,831 $ 2,130Less: development expenditures capitalized to aerospace program tooling (1,656) (1,984)
175 146Add: amortization of aerospace program tooling 172 147
$ 347 $ 293

BOMBARDIER INC. FINANCIAL REPORT - FISCAL YEAR ENDED DECEMBER 31, 2014 - NOTES 133
7. OTHER EXPENSE
Other expense was as follows, for fiscal years:
2014 2013Changes in estimates and fair value(1) $ 42 $ 17Severance and other involuntary termination costs (including changes in estimates)(2) 4 (2)Gains on disposals of PP&E (3) —Other (5) (6)
$ 38 $ 9(1) Includes net loss (gain) on certain financial instruments measured at fair value and changes in estimates related to certain provisions or
certain financial instruments, excluding losses (gains) arising from changes in interest rates.(2) Excludes those presented in special items for fiscal year 2014.
8. SPECIAL ITEMS
Special items were as follows, for fiscal years:
2014 2013Impairment charge and other(1) $ 1,357 $ —Restructuring charge(2) 142 —Loss on repurchase of long-term debt(3) 43 —Gains on resolution of litigations(4) (18) (43)Inventory write-down(5) — 24Gain on disposal of a business(6) — (23)
$ 1,524 $ (42)Of which is presented in
Special items in EBIT $ 1,489 $ (30)Financing expense - loss on repurchase of long-term debt 43 —Financing income - interests related to the resolution of litigations (8) (12)
$ 1,524 $ (42)(1) As a result of the decision to pause the Learjet 85 program, an impairment charge of $1,266 million, an inventory write-down of $21 million
and $71 million of other provisions were recorded as special items. See Note 20 - Intangible assets for more details. (2) Represents restructuring charges of $155 million and a curtailment gain of $13 million related to the workforce reduction announced in
January and July 2014, of which $85 million relates to BA and $57 million to BT, for fiscal year 2014. These measures include the reduction of approximately 3,700 employees at BA and 900 employees at BT.
(3) Represents the loss related to the redemption of the €785 million ($1,093 million) Senior Notes. (4) Represent a gain at BA upon the successful resolution of a litigation of $18 million in connection with Part IV of the Quebec Income Tax Act,
the Tax on Capital, of which $8 million represents the interest portion of the gain for fiscal year 2014 ($43 million of which $12 million represents the interest portion of the gain for fiscal year 2013).
(5) Represents a BA inventory write-down related to the prolonged production pause for the Learjet 60 program.(6) Related to the sale of the main assets and related liabilities of the Corporation's Flexjet activities completed in December 2013.
Subsequent to the end of the fiscal year, in January 2015, as a result of the decision to pause the Learjet 85 business aircraft program, BA announced a workforce reduction of approximately 1,000 employees at the sites in Querétaro, Mexico, and Wichita, United States. A severance provision of approximately $20 million will be recorded as a special item during the first quarter of 2015.

134 BOMBARDIER INC. FINANCIAL REPORT - FISCAL YEAR ENDED DECEMBER 31, 2014
9. FINANCING EXPENSE AND FINANCING INCOME
Financing expense and financing income were as follows, for fiscal years:
2014 2013Financing expense
Loss on repurchase of long-term debt(1) $ 43 $ —Accretion on net retirement benefit obligations 76 113Amortization of letter of credit facility costs 16 16Accretion on other financial liabilities 19 29Accretion on provisions 8 4Net loss on certain financial instruments(2) 21 —Other 29 21
212 183Interest on long-term debt, after effect of hedges 37 88
$ 249 (3) $ 271 (3)
Financing income
Interest related to the resolution of litigations(4) $ (8) $ (12)Changes in discount rates of provisions — (18)Net gain on certain financial instruments(2) — (4)Other (17) (27)
(25) (61)Interest on loans and lease receivables, after effect of hedges (27) (33)Interest on cash and cash equivalents (11) (14)Income from investment in securities (12) (11)
(50) (58)$ (75) (5) $ (119) (5)
(1) Represents the loss related to the redemption of the €785 million ($1,093 million) Senior Notes, which was recorded as a special item. (2) Net losses (gains) on certain financial instruments classified as FVTP&L, including losses (gains) arising from changes in interest rates.(3) Of which $70 million represents the interest expense calculated using the effective interest rate method for financial liabilities classified as
other than HFT for fiscal year 2014 ($125 million for fiscal year 2013).(4) Represents the interest portion of a gain of $18 million for fiscal year 2014 upon the successful resolution of a litigation in connection with
Part IV of the Quebec Income Tax Act, the Tax on Capital ($43 million for fiscal year 2013). The remaining $10 million of the gain was recorded in EBIT as special items for fiscal year 2014 ($31 million for fiscal year 2013).
(5) Of which $9 million represents the interest income calculated using the effective interest rate method for financial assets classified as L&R for fiscal year 2014 ($16 million for fiscal year 2013).
Borrowing costs capitalized to PP&E and intangible assets totalled $293 million for fiscal year 2014, using an average capitalization rate of 4.88% ($271 million and 5.48% for fiscal year 2013). Capitalized borrowing costs are deducted from the related interest expense (i.e. interest on long-term debt or accretion on other financial liabilities, if any).
10. EMPLOYEE BENEFIT COSTS
Employee benefit costs(1) were as follows, for fiscal years:
Notes 2014 2013Wages, salaries and other employee benefits $ 5,893 $ 5,961Retirement benefits(2) 21 420 496Share-based expense 28 2 11Restructuring, severance and other involuntary termination costs 7, 8 142 (2)
$ 6,457 $ 6,466(1) Employee benefit costs include costs capitalized as part of the cost of inventories and other self-constructed assets. (2) Includes defined benefit and defined contribution plans.

BOMBARDIER INC. FINANCIAL REPORT - FISCAL YEAR ENDED DECEMBER 31, 2014 - NOTES 135
11. INCOME TAXES
Analysis of income tax expenseDetails of income tax expense were as follows, for fiscal years:
2014 2013Current income taxes $ 152 $ 125Deferred income taxes 354 74
$ 506 $ 199
The reconciliation of income taxes, computed at the Canadian statutory rates, to income tax expense was as follows, for fiscal years:
2014 2013EBT $ (740) $ 771Canadian statutory tax rate 26.8% 26.8%Income tax expense (recovery) at statutory rate (198) 207Increase (decrease) resulting from
Non-recognition of tax benefits related to tax losses and temporary differences 488 200Write-down of deferred income tax assets 409 51Income tax rates differential of foreign subsidiaries and other investees (139) (33)Recognition of previously unrecognized tax losses or temporary differences (57) (211)Permanent differences (36) (36)Effect of substantively enacted income tax rate changes and tax status changes in certain entities — (6)Other 39 27
Income tax expense $ 506 (1) $ 199Effective tax rate (68.4)% 25.8%
(1) An income tax expense of $283 million was recorded as a result of the special item in relation to the pause of the Learjet 85 program.
The Corporation’s applicable Canadian statutory tax rate is the Federal and Provincial combined tax rate applicable in the jurisdiction in which the Corporation operates.
Details of deferred income tax expense were as follows, for fiscal years:
2014 2013Non-recognition of tax benefits related to tax losses and temporary differences $ 488 $ 200Origination and reversal of temporary differences (486) 40Write-down of deferred income tax assets 409 51Recognition of previously unrecognized tax losses or temporary differences (57) (211)Effect of substantively enacted income tax rate changes and tax status changes in certain entities — (6)
$ 354 $ 74
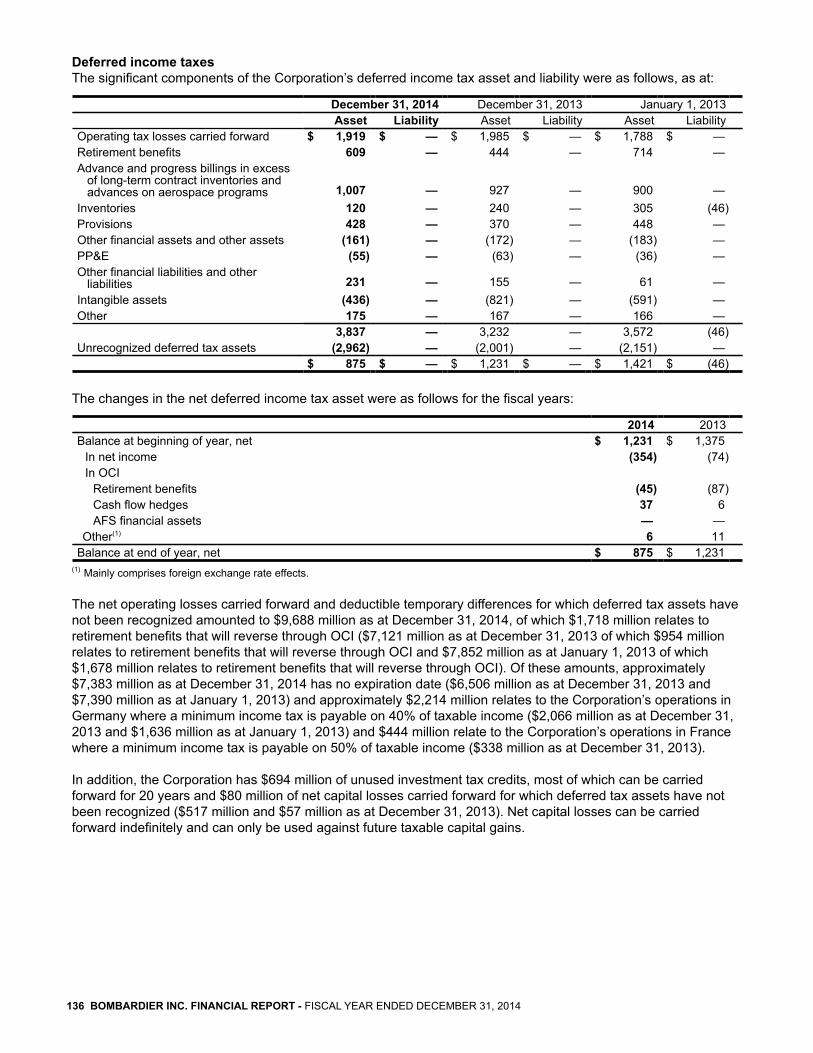
136 BOMBARDIER INC. FINANCIAL REPORT - FISCAL YEAR ENDED DECEMBER 31, 2014
Deferred income taxes The significant components of the Corporation’s deferred income tax asset and liability were as follows, as at:
December 31, 2014 December 31, 2013 January 1, 2013Asset Liability Asset Liability Asset Liability
Operating tax losses carried forward $ 1,919 $ — $ 1,985 $ — $ 1,788 $ —Retirement benefits 609 — 444 — 714 —Advance and progress billings in excess of long-term contract inventories and advances on aerospace programs 1,007 — 927 — 900 —Inventories 120 — 240 — 305 (46)Provisions 428 — 370 — 448 —Other financial assets and other assets (161) — (172) — (183) —PP&E (55) — (63) — (36) —Other financial liabilities and other liabilities 231 — 155 — 61 —Intangible assets (436) — (821) — (591) —Other 175 — 167 — 166 —
3,837 — 3,232 — 3,572 (46)Unrecognized deferred tax assets (2,962) — (2,001) — (2,151) —
$ 875 $ — $ 1,231 $ — $ 1,421 $ (46)
The changes in the net deferred income tax asset were as follows for the fiscal years:
2014 2013Balance at beginning of year, net $ 1,231 $ 1,375
In net income (354) (74)In OCI
Retirement benefits (45) (87)Cash flow hedges 37 6AFS financial assets — —
Other(1) 6 11Balance at end of year, net $ 875 $ 1,231
(1) Mainly comprises foreign exchange rate effects.
The net operating losses carried forward and deductible temporary differences for which deferred tax assets have not been recognized amounted to $9,688 million as at December 31, 2014, of which $1,718 million relates to retirement benefits that will reverse through OCI ($7,121 million as at December 31, 2013 of which $954 million relates to retirement benefits that will reverse through OCI and $7,852 million as at January 1, 2013 of which $1,678 million relates to retirement benefits that will reverse through OCI). Of these amounts, approximately $7,383 million as at December 31, 2014 has no expiration date ($6,506 million as at December 31, 2013 and $7,390 million as at January 1, 2013) and approximately $2,214 million relates to the Corporation’s operations in Germany where a minimum income tax is payable on 40% of taxable income ($2,066 million as at December 31, 2013 and $1,636 million as at January 1, 2013) and $444 million relate to the Corporation’s operations in France where a minimum income tax is payable on 50% of taxable income ($338 million as at December 31, 2013).
In addition, the Corporation has $694 million of unused investment tax credits, most of which can be carried forward for 20 years and $80 million of net capital losses carried forward for which deferred tax assets have not been recognized ($517 million and $57 million as at December 31, 2013). Net capital losses can be carried forward indefinitely and can only be used against future taxable capital gains.

BOMBARDIER INC. FINANCIAL REPORT - FISCAL YEAR ENDED DECEMBER 31, 2014 - NOTES 137
Net deferred tax assets of $242 million were recognized as at December 31, 2014 ($639 million as at December 31, 2013 and $821 million as at January 1, 2013) in jurisdictions that incurred losses this fiscal year or the preceding fiscal year. Based upon the level of historical taxable income, projections for future taxable income and prudent tax planning strategies, management believes it is probable the Corporation will realize the benefits of these deductible differences and operating tax losses carried forward. A write-down of $283 million of previously recognized tax assets was recorded in fiscal year 2014. As a result of the pause of the Learjet 85 program, management believes there is uncertainty related to the recoverability of these deferred tax assets. See Note 4 – Use of estimates and judgment for more information on how the Corporation determines the extent to which deferred income tax assets are recognized.
No deferred tax liabilities have been recognized on undistributed earnings of the Corporation’s foreign subsidiaries, joint ventures and associates when they are considered to be indefinitely reinvested, unless it is probable that these temporary differences will reverse. Upon distribution of these earnings in the form of dividends or otherwise, the Corporation may be subject to corporation and/or withholding taxes. Taxable temporary differences for which a deferred tax liability was not recognized amount to approximately $343 million as at December 31, 2014 ($364 million as at December 31, 2013 and $269 million as at January 1, 2013).
12. EARNINGS PER SHARE
Basic and diluted EPS were computed as follows, for fiscal years:
2014 2013(Number of shares, stock options, PSUs and DSUs, in thousands)Net income (loss) attributable to equity holders of Bombardier Inc. $ (1,260) $ 564Preferred share dividends, including taxes (27) (32)Net income (loss) attributable to common equity holders of Bombardier Inc. $ (1,287) $ 532Weighted-average number of common shares outstanding 1,741,733 1,738,916Net effect of stock options, PSUs and DSUs 733 2,213Weighted-average diluted number of common shares 1,742,466 1,741,129EPS (in dollars)
Basic and diluted $ (0.74) $ 0.31
The effect of the exercise of stock options, PSUs and DSUs was included in the calculation of diluted EPS in the above table, except for 41,274,213 stock options, PSUs and DSUs for fiscal year 2014 (45,300,120 stock options, PSUs and DSUs for fiscal year 2013) since the average market value of the underlying shares was lower than the exercise price, or because the predetermined target market price thresholds of the Corporation’s Class B Shares (subordinate voting) or predetermined financial performance targets had not been met.
13. FINANCIAL INSTRUMENTS
Net gains (losses) on financial instruments recognized in income were as follows, for fiscal years:
2014 2013Financial instruments measured at amortized cost
L&R - impairment charges $ (5) $ (13)Financial instruments measured at fair value
FVTP&L - changes in fair valueDesignated as FVTP&L
Financial assets $ 15 $ (37)Financial liabilities $ (14) $ (13)
Required to be classified as HFTDerivatives not designated in hedging relationships $ (101) $ (20)Other(1) $ (12) $ 37
(1) Excluding the interest income portion related to cash and cash equivalents of $11 million for the fiscal year 2014 ($14 million for fiscal year 2013).

138 BOMBARDIER INC. FINANCIAL REPORT - FISCAL YEAR ENDED DECEMBER 31, 2014
Carrying amounts and fair value of financial instrumentsThe classification of financial instruments and their carrying amounts and fair value of financial instruments were as follows as at:
FVTP&L
HFT Designated AFSAmortized
cost(1)
DDHR
Totalcarrying
value Fair valueDecember 31, 2014
Financial assetsCash and cash equivalents $ 2,489 $ — $ — $ — $ — $ 2,489 $ 2,489Trade and other receivables — — — 1,538 — 1,538 1,538Other financial assets 43 578 330 422 485 1,858 1,869
$ 2,532 $ 578 $ 330 $ 1,960 $ 485 $ 5,885 $ 5,896Financial liabilities
Trade and other payables $ — $ 18 n/a $ 4,198 $ — $ 4,216 $ 4,216Long-term debt(2) — — n/a 7,683 — 7,683 7,692Other financial liabilities 73 172 n/a 719 592 1,556 1,655
$ 73 $ 190 n/a $ 12,600 $ 592 $ 13,455 $ 13,563
December 31, 2013Financial assets
Cash and cash equivalents $ 3,397 $ — $ — $ — $ — $ 3,397 $ 3,397Trade and other receivables — — — 1,492 — 1,492 1,492Other financial assets 129 673 315 425 663 2,205 2,203
$ 3,526 $ 673 $ 315 $ 1,917 $ 663 $ 7,094 $ 7,092Financial liabilities
Trade and other payables $ — $ — n/a $ 4,089 $ — $ 4,089 $ 4,089Long-term debt(2) — — n/a 7,203 — 7,203 7,346Other financial liabilities 25 142 n/a 958 386 1,511 1,656
$ 25 $ 142 n/a $ 12,250 $ 386 $ 12,803 $ 13,091
January 1, 2013Financial assets
Cash and cash equivalents $ 2,557 $ — $ — $ — $ — $ 2,557 $ 2,557Trade and other receivables — — — 1,311 — 1,311 1,311Other financial assets 92 697 217 133 643 1,782 1,782
$ 2,649 $ 697 $ 217 $ 1,444 $ 643 $ 5,650 $ 5,650Financial liabilities
Trade and other payables $ — $ — n/a $ 3,310 $ — $ 3,310 $ 3,310Long-term debt(2) — — n/a 5,405 — 5,405 5,272Other financial liabilities 15 158 n/a 712 126 1,011 1,146
$ 15 $ 158 n/a $ 9,427 $ 126 $ 9,726 $ 9,728(1) Financial assets are classified as L&R and financial liabilities as other than HFT. (2) Includes the current portion of long-term debt. n/a: Not applicable

BOMBARDIER INC. FINANCIAL REPORT - FISCAL YEAR ENDED DECEMBER 31, 2014 - NOTES 139
Offsetting financial assets and financial liabilitiesThe Corporation is subject to enforceable master netting agreements related mainly to its derivative financial instruments and cash and cash equivalents which contain a right of set-off in case of default, insolvency or bankruptcy. The amounts that are subject to the enforceable master netting agreements, but which do not meet some or all of the offsetting criteria, are as follows as at :
Description of recognized financial assets and liabilities
Amount recognizedin the financial
statements
Amounts subjectto master netting
agreements
Net amount notsubject to master
netting agreements
December 31, 2014Derivative financial instruments - assets $ 528 $ (271) $ 257Derivative financial instruments - liabilities $ (665) $ 344 $ (321)Cash and cash equivalents $ 2,489 $ (73) $ 2,416
December 31, 2013Derivative financial instruments - assets $ 792 $ (304) $ 488Derivative financial instruments - liabilities $ (411) $ 316 $ (95)Cash and cash equivalents $ 3,397 $ (12) $ 3,385
Derivatives and hedging activitiesThe carrying amounts of all derivative and non-derivative financial instruments in a hedge relationship were as follows, as at:
December 31, 2014 December 31, 2013 January 1, 2013Assets Liabilities Assets Liabilities Assets Liabilities
Derivative financial instruments designated as fair value hedges
Cross-currency interest-rate swaps $ — $ — $ 36 $ — $ 17 $ 6Interest-rate swaps 226 — 296 67 394 —
226 — 332 67 411 6Derivative financial instruments designated as cash flow hedges(1)
Forward foreign exchange contracts 259 592 331 319 232 120Derivative financial instruments classified as HFT(2)
Forward foreign exchange contracts 29 72 27 22 13 12Interest-rate swaps — 1 — 2 — 2Embedded derivative financial instruments
Foreign exchange — — 1 1 3 1Call options on long-term debt 14 — 101 — 76 —
43 73 129 25 92 15Total derivative financial instruments $ 528 $ 665 $ 792 $ 411 $ 735 $ 141Non-derivative financial instruments designated as hedges of net investment
Long-term debt $ — $ 23 $ — $ 517 $ — $ 1,042(1) The maximum length of time of derivative financial instruments hedging the Corporation’s exposure to the variability in future cash flows for
anticipated transactions is 35 months as at December 31, 2014.(2) Held as economic hedges, except for embedded derivative financial instruments.
The net gains on hedging instruments designated in fair value hedge relationships and net losses on the related hedged items attributable to the hedged risk recognized in financing expense, amounted to $173 million and $168 million respectively for fiscal year 2014 (net losses of $205 million and net gains of $213 million respectively for fiscal year 2013).
The methods and assumptions used to measure the fair value of financial instruments are described in Note 33 –Fair value of financial instruments.

140 BOMBARDIER INC. FINANCIAL REPORT - FISCAL YEAR ENDED DECEMBER 31, 2014
14. CASH AND CASH EQUIVALENTS
Cash and cash equivalents were as follows, as at:
December 31, 2014 December 31, 2013 January 1, 2013Cash $ 997 $ 1,475 $ 916Cash equivalents
Term deposits 796 762 656Money market funds 696 1,160 985
Cash and cash equivalents $ 2,489 $ 3,397 $ 2,557
See Note 30 – Credit facilities for details on covenants related to cash and cash equivalents.
15. TRADE AND OTHER RECEIVABLES
Trade and other receivables were as follows, as at:
Past due but not impaired (3)
TotalNot past
due less than
90 daysmore than
90 days Impaired (4)
December 31, 2014(1)(2)
Trade receivables, gross $ 1,453 $ 717 $ 238 $ 381 $ 117Allowance for doubtful accounts (39) — — — (39)
1,414 $ 717 $ 238 $ 381 $ 78Other 124Total $ 1,538
December 31, 2013(1)(2)
Trade receivables, gross $ 1,430 $ 796 $ 194 $ 359 $ 81Allowance for doubtful accounts (44) — — — (44)
1,386 $ 796 $ 194 $ 359 $ 37Other 106Total $ 1,492
January 1, 2013(1)(2)
Trade receivables, gross $ 1,256 $ 813 $ 204 $ 200 $ 39Allowance for doubtful accounts (34) — — — (34)
1,222 $ 813 $ 204 $ 200 $ 5Other 89Total $ 1,311
(1) Of which $355 million and $475 million are denominated in euros and other foreign currencies, respectively, as at December 31, 2014 ($465 million and $411 million, respectively, as at December 31, 2013 and $396 million and $356 million, respectively, as at January 1, 2013).
(2) Of which $419 million represents customer retentions relating to long-term contracts as at December 31, 2014 based on normal terms and conditions ($392 million as at December 31, 2013 and $240 million as at January 1, 2013).
(3) Of which $525 million of trade receivables relates to BT long-term contracts as at December 31, 2014, of which $376 million were more than 90 days past due ($509 million as at December 31, 2013, of which $353 million were more than 90 days past due and $335 million as at January 1, 2013, of which $190 million were more than 90 days past due). BT assesses whether these receivables are collectible as part of its risk management practices applicable to long-term contracts as a whole.
(4) Of which a gross amount of $71 million of trade receivables are individually impaired as at December 31, 2014 ($73 million as at December 31, 2013 and $34 million as at January 1, 2013).
The factors that the Corporation considers to classify trade receivables as impaired are as follows: the customer is in bankruptcy or under administration, payments are in dispute, or payments are in arrears. Further information on financial risk is provided in Note 32 – Financial risk management.

BOMBARDIER INC. FINANCIAL REPORT - FISCAL YEAR ENDED DECEMBER 31, 2014 - NOTES 141
Allowance for doubtful accounts – Changes in the allowance for doubtful accounts were as follows, for fiscal years:
2014 2013Balance at beginning of year $ (44) $ (34)
Provision for doubtful accounts (5) (13)Amounts written-off (1) 3Recoveries 8 3Effect of foreign currency exchange rate changes 3 (3)
Balance at end of year $ (39) $ (44)
Off-balance sheet factoring facilitiesIn the normal course of its business, BT has factoring facilities to which it can sell, without credit recourse, qualifying trade receivables. Trade receivables of €974 million ($1,183 million) were outstanding under such facilities as at December 31, 2014 (€1,084 million ($1,495 million) as at December 31, 2013 and €886 million ($1,169 million) as at January 1, 2013). Trade receivables of €1,287 million ($1,712 million) were sold to these facilities during fiscal year 2014 (€1,213 million ($1,611 million) during fiscal year 2013).
16. INVENTORIES
Inventories were as follows, as at:
December 31, 2014 December 31, 2013 January 1, 2013Aerospace programs $ 4,600 $ 4,847 $ 4,345Long-term contracts
Production contractsCost incurred and recorded margins 7,369 7,064 5,387Less: advances and progress billings (5,558) (5,406) (4,014)
1,811 1,658 1,373Service contracts
Cost incurred and recorded margins 310 420 408Less: advances and progress billings (17) (19) (15)
293 401 393Finished products(1) 1,266 1,328 1,429
$ 7,970 $ 8,234 $ 7,540(1) Finished products include 1 new aircraft not associated with a firm order and 57 pre-owned aircraft, totalling $485 million as at
December 31, 2014 (11 new aircraft and 43 pre-owned aircraft, totalling $535 million as at December 31, 2013 and 3 new aircraft and 74 pre-owned aircraft, totalling $551 million as at January 1, 2013).
Finished products as at December 31, 2014 include $248 million of pre-owned aircraft legally sold to third parties and leased back under sale and leaseback facilities ($134 million as at December 31, 2013 and $147 million as at January 1, 2013). The related sales proceeds are accounted for as sale and leaseback obligations.
The amount of inventories recognized as cost of sales totalled $16,426 million for fiscal year 2014 ($14,106 million for fiscal year 2013). These amounts include $172 of write-downs for fiscal year 2014 ($147 million for fiscal year 2013). An additional write-down of $21 million is recognized in special items for fiscal year 2014 ($24 million for fiscal year 2013). See Note 8 – Special items for more details.
Under certain contracts, title to inventories is vested to the customer as the work is performed, in accordance with contractual arrangements and industry practice. In addition, in the normal course of business, the Corporation provides performance bonds, bank guarantees and other forms of guarantees to customers, mainly in BT, as security for advances received from customers pending performance under certain contracts. In accordance with industry practice, the Corporation remains liable to the purchasers for the usual contractor’s obligations relating to contract completion in accordance with predetermined specifications, timely delivery and product performance.
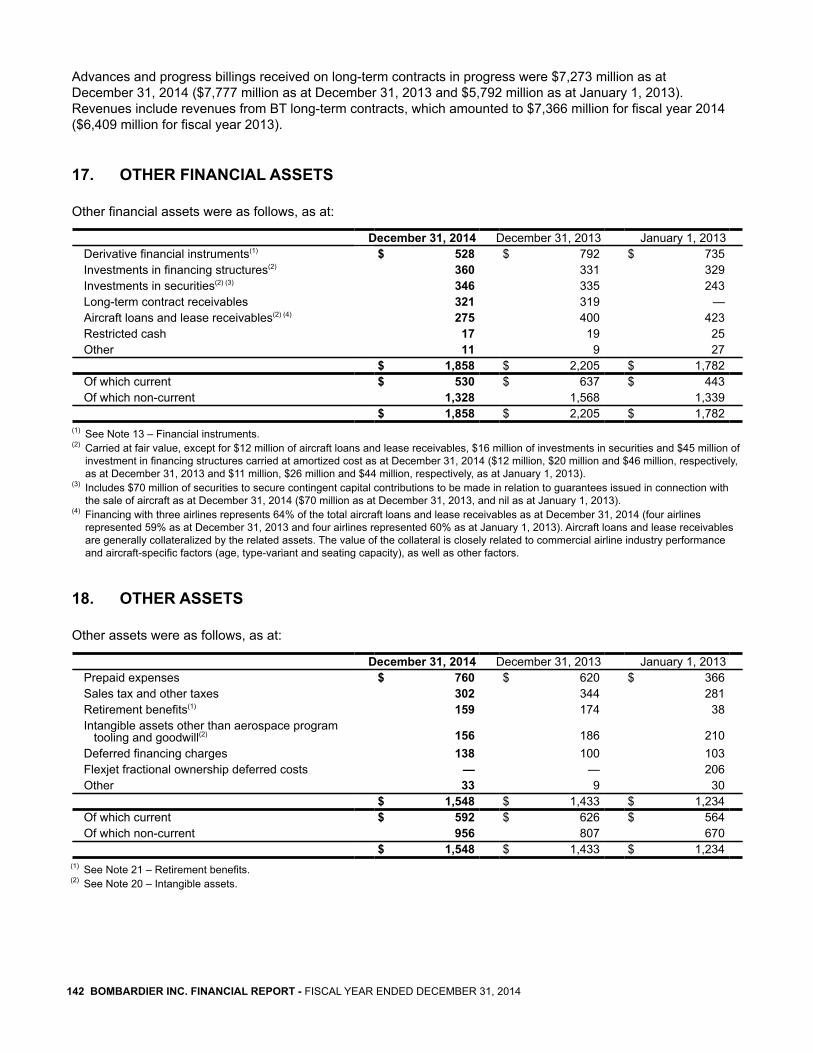
142 BOMBARDIER INC. FINANCIAL REPORT - FISCAL YEAR ENDED DECEMBER 31, 2014
Advances and progress billings received on long-term contracts in progress were $7,273 million as at December 31, 2014 ($7,777 million as at December 31, 2013 and $5,792 million as at January 1, 2013). Revenues include revenues from BT long-term contracts, which amounted to $7,366 million for fiscal year 2014 ($6,409 million for fiscal year 2013).
17. OTHER FINANCIAL ASSETS
Other financial assets were as follows, as at:
December 31, 2014 December 31, 2013 January 1, 2013Derivative financial instruments(1) $ 528 $ 792 $ 735Investments in financing structures(2) 360 331 329Investments in securities(2) (3) 346 335 243Long-term contract receivables 321 319 —Aircraft loans and lease receivables(2) (4) 275 400 423Restricted cash 17 19 25Other 11 9 27
$ 1,858 $ 2,205 $ 1,782Of which current $ 530 $ 637 $ 443Of which non-current 1,328 1,568 1,339
$ 1,858 $ 2,205 $ 1,782(1) See Note 13 – Financial instruments.(2) Carried at fair value, except for $12 million of aircraft loans and lease receivables, $16 million of investments in securities and $45 million of
investment in financing structures carried at amortized cost as at December 31, 2014 ($12 million, $20 million and $46 million, respectively, as at December 31, 2013 and $11 million, $26 million and $44 million, respectively, as at January 1, 2013).
(3) Includes $70 million of securities to secure contingent capital contributions to be made in relation to guarantees issued in connection with the sale of aircraft as at December 31, 2014 ($70 million as at December 31, 2013, and nil as at January 1, 2013).
(4) Financing with three airlines represents 64% of the total aircraft loans and lease receivables as at December 31, 2014 (four airlines represented 59% as at December 31, 2013 and four airlines represented 60% as at January 1, 2013). Aircraft loans and lease receivables are generally collateralized by the related assets. The value of the collateral is closely related to commercial airline industry performance and aircraft-specific factors (age, type-variant and seating capacity), as well as other factors.
18. OTHER ASSETS
Other assets were as follows, as at:
December 31, 2014 December 31, 2013 January 1, 2013Prepaid expenses $ 760 $ 620 $ 366Sales tax and other taxes 302 344 281Retirement benefits(1) 159 174 38Intangible assets other than aerospace program tooling and goodwill(2) 156 186 210Deferred financing charges 138 100 103Flexjet fractional ownership deferred costs — — 206Other 33 9 30
$ 1,548 $ 1,433 $ 1,234Of which current $ 592 $ 626 $ 564Of which non-current 956 807 670
$ 1,548 $ 1,433 $ 1,234(1) See Note 21 – Retirement benefits.(2) See Note 20 – Intangible assets.

BOMBARDIER INC. FINANCIAL REPORT - FISCAL YEAR ENDED DECEMBER 31, 2014 - NOTES 143
19. PROPERTY, PLANT AND EQUIPMENT
PP&E were as follows, as at:
Land Buildings EquipmentConstruction
in progress Other TotalCost
Balance as at December 31, 2013 $ 98 $ 2,218 $ 1,287 $ 356 $ 429 $ 4,388Additions — 41 45 228 2 316Disposals — (5) (81) — (12) (98)Transfers — 279 124 (407) 4 —Effect of foreign currency exchange rate changes (7) (120) (28) (6) (1) (162)
Balance as at December 31, 2014 $ 91 $ 2,413 $ 1,347 $ 171 $ 422 $ 4,444Accumulated amortization and impairment
Balance as at December 31, 2013 $ — $ (1,232) $ (825) $ — $ (265) $ (2,322)Amortization — (65) (107) — (17) (189)Disposals — 4 66 — 10 80Effect of foreign currency exchange rate changes — 81 2 — (4) 79
Balance as at December 31, 2014 $ — $ (1,212) $ (864) $ — $ (276) $ (2,352)Net carrying value $ 91 $ 1,201 $ 483 $ 171 $ 146 $ 2,092
Land Buildings EquipmentConstruction
in progress Other TotalCost
Balance as at January 1, 2013 $ 99 $ 2,132 $ 1,333 $ 179 $ 447 $ 4,190Additions 1 68 41 254 27 391Disposals (3) (29) (149) — (42) (223)Transfers — 13 68 (78) (3) —Effect of foreign currency exchange rate changes 1 34 (6) 1 — 30
Balance as at December 31, 2013 $ 98 $ 2,218 $ 1,287 $ 356 $ 429 $ 4,388Accumulated amortization and impairment
Balance as at January 1, 2013 $ — $ (1,164) $ (832) $ — $ (261) $ (2,257)Amortization — (60) (104) — (18) (182)Disposals — 17 101 — 12 130Effect of foreign currency exchange rate changes — (25) 10 — 2 (13)
Balance as at December 31, 2013 $ — $ (1,232) $ (825) $ — $ (265) $ (2,322)Net carrying value $ 98 $ 986 $ 462 $ 356 $ 164 $ 2,066
Included in the above table are assets under finance lease, where the Corporation is the lessee, presented in Other, with cost and accumulated amortization amounting to $243 million and $91 million, respectively, as at December 31, 2014 ($195 million and $83 million as at December 31, 2013 and $225 million and $103 million as at January 1, 2013).
Also included in the previous table are aircraft under operating leases where the Corporation is the lessor, presented in Other, with a cost and accumulated amortization amounting to $35 million and $14 million, respectively, as at December 31, 2014 ($40 million and $12 million as at December 31, 2013 and $51 million and $12 million as at January 1, 2013). Rental income from operating leases and amortization of assets under operating leases amounted to $5 million and $2 million, respectively, for fiscal year 2014 ($10 million and $3 million, respectively, for fiscal year 2013).

144 BOMBARDIER INC. FINANCIAL REPORT - FISCAL YEAR ENDED DECEMBER 31, 2014
20. INTANGIBLE ASSETS
Intangible assets were as follows, as at:
Aerospace program tooling Goodwill Other (1)(2) Total
AcquiredInternally
generated Total (3)
CostBalance as at December 31, 2013 $ 1,404 $ 8,503 $ 9,907 $ 2,381 $ 739 $ 13,027
Additions 235 1,421 1,656 11 33 1,700Disposals — (1) (1) — (10) (11)Effect of foreign currency exchange rate changes — — — (265) (48) (313)
Balance as at December 31, 2014 $ 1,639 $ 9,923 $ 11,562 $ 2,127 $ 714 $ 14,403Accumulated amortization and impairment
Balance as at December 31, 2013 $ (620) $ (2,681) $ (3,301) $ — $ (553) $ (3,854)Amortization (11) (161) (172) — (56) (228)Impairment (69) (1,197) (1,266) — — (1,266)Disposals — — — — 10 10Effect of foreign currency exchange rate changes — — — — 41 41
Balance as at December 31, 2014 $ (700) $ (4,039) $ (4,739) $ — $ (558) $ (5,297)Net carrying value $ 939 $ 5,884 $ 6,823 $ 2,127 $ 156 $ 9,106
Aerospace program tooling Goodwill Other (1) (2) Total
AcquiredInternally
generated Total (3)
CostBalance as at January 1, 2013 $ 1,254 $ 6,670 $ 7,924 $ 2,316 $ 737 $ 10,977
Additions 150 1,834 1,984 — 44 2,028Disposals — (1) (1) — (56) (57)Effect of foreign currency exchange rate changes — — — 65 14 79
Balance as at December 31, 2013 $ 1,404 $ 8,503 $ 9,907 $ 2,381 $ 739 $ 13,027Accumulated amortization and impairment
Balance as at January 1, 2013 $ (604) $ (2,550) $ (3,154) $ — $ (527) $ (3,681)Amortization (16) (131) (147) — (62) (209)Disposals — — — — 47 47Effect of foreign currency exchange rate changes — — — — (11) (11)
Balance as at December 31, 2013 $ (620) $ (2,681) $ (3,301) $ — $ (553) $ (3,854)Net carrying value $ 784 $ 5,822 $ 6,606 $ 2,381 $ 186 $ 9,173
(1) Presented in Note 18 – Other assets.(2) Includes internally generated intangible assets with a cost and accumulated amortization of $367 million and $254 million, respectively, as
at December 31, 2014 ($359 million and $243 million as at December 31, 2013 and $325 million and $207 million as at January 1, 2013).(3) Includes intangible assets under development with a cost of $6,126 million as at December 31, 2014 ($5,923 million as at
December 31, 2013 and $4,059 million as at January 1, 2013).
Aerospace program toolingThe net carrying value of aerospace program tooling comprises $4,359 million for commercial aircraft and $2,464 million for business aircraft as at December 31, 2014 ($3,746 million and $2,860 million, respectively, as at December 31, 2013 and $2,766 million and $2,004 million, respectively, as at January 1, 2013).
BOMBARDIER INC. FINANCIAL REPORT - FISCAL YEAR ENDED DECEMBER 31, 2014 - NOTES 145
Learjet 85 business aircraft program On January 15, 2015 the Corporation announced its decision to pause the Learjet 85 business aircraft program. The pause follows a downward revision of Bombardier’s business aircraft market forecast, primarily due the continued weakness of the light aircraft category since the economic downturn. As a result, the Corporation performed an impairment test on the Learjet 85 cash generating unit (the “Learjet 85 program”) which principally consists of capitalized development costs. The Corporation determined that the Learjet 85 program carrying amount exceeded its recoverable amount, and accordingly recorded an impairment charge of $1,266 million in special items related to the Learjet 85 development costs.
The recoverable amount of the Learjet 85 program was based on fair value less costs of disposal. The fair value measurement of the Learjet 85 program is categorized within level 3 of the fair value hierarchy. The estimate of the fair value less costs of disposal was determined using forecasted cash flows based on long-range forecasts prepared by management thereafter, and an after tax discount rate of 8% based on a benchmark sampling of publicly traded companies in the aerospace sector. The forecasted cash flows for the Learjet 85 recoverable amount assume a 25 year program life which reflects incremental investments related to improvements and variants, followed by an additional 10 year period of after-market sales. Additional information related to the Corporation’s impairment testing methodology for aerospace program tooling is included in Note 4 - Use of estimates and judgment.
GoodwillGoodwill is related to the DaimlerChrysler Rail Systems GmbH (Adtranz) acquisition in May 2001. Goodwill is monitored by management at the BT operating segment level. During the fourth quarter of fiscal year 2014, the Corporation completed an impairment test. The Corporation did not identify any impairment. See Note 4 – Use of estimates and judgment for more details.
21. RETIREMENT BENEFITS
The Corporation sponsors several funded and unfunded defined benefit pension plans as well as defined contribution pension plans in Canada and abroad, covering a majority of its employees. The Corporation also provides other unfunded defined benefit plans, covering certain groups of employees mainly in Canada and the U.S.
Pension plans are categorized as defined benefit (“DB”) or defined contribution (“DC”). DB plans specify the amount of benefits an employee is to receive at retirement, while DC plans specify how contributions are determined. As a result, there is no deficit or surplus for DC plans. Hybrid plans are a combination of DB and DC plans.
Funded plans are plans for which segregated plan assets are invested in trust. Unfunded plans are plans for which there are no segregated plan assets, as the establishment of segregated plan assets is generally not permitted or not in line with local practice.
FUNDED DB PLANS
The Corporation’s major DB plans reside in Canada, the U.K. and the U.S., therefore very significant portions of the DB pension plan assets and benefit obligation are located in those countries. The following text focuses mainly on plans registered in these three countries.
Governance
Under applicable pension legislations, the administrator of each plan is either the Corporation, in the case of U.S. plans and Canadian plans registered outside of Québec, or a pension committee, board of trustees or corporate trustee in the case of plans registered in Québec and the U.K.

146 BOMBARDIER INC. FINANCIAL REPORT - FISCAL YEAR ENDED DECEMBER 31, 2014
Plan administrators are responsible for the management of plan assets and the establishment of investment policies, which define, for each plan, investment objectives, target asset allocation, risk mitigation strategies, and other elements required by pension legislation.
Plan assets are pooled in three common investment funds (CIFs) for Canadian, U.K. and U.S. plans, respectively, in order to achieve economies of scale and greater efficiency, diversification and liquidity. The CIFs are broken down by sub-funds or asset classes in order to allow each plan to have its own asset allocation given its associated pension obligation liability profile.
The management of the CIFs has been delegated to three (Canadian, U.K. and U.S.) investment committees (ICs). The ICs are responsible for allocating assets among various sub-funds and asset classes in accordance with each plan’s investment policy. They are also responsible for hiring, monitoring and terminating investment managers and have established a multi-manager structure for each sub-fund and asset class. They are supported by Bombardier Inc. Pension Asset Management Services, who oversee the management of the plans’ assets and of the CIFs on a daily basis. Daily administration of the plans is delegated to either Bombardier Inc. or to external pension administration service providers. The administrators, the ICs and Bombardier Inc. also rely on the expertise of external legal advisors, actuaries, auditors and investment consultants.
Benefit Policy
DB plan benefits are based on salary and years of service. In Canada and the U.S., since September 1, 2013, all new non-unionized employees join DC plans (i.e. they no longer have the option of joining DB or hybrid plans). Employees who are members of a DB or hybrid plan closed to new members continue to accrue service in their original plan.
In the U.K., seven out of nine DB plans are closed to new members. New employees join DC plans. Pension entitlements are indexed to inflation according to pension legislation and plan rules.
Funding requirements
Actuarial valuations are conducted by independent firms hired by the Corporation or the administrators, as required by pension legislation. The purpose of the valuations is to determine the plans’ financial position and the annual contributions to be made by the Corporation to fund both benefits accruing in the year (normal cost) and deficits accumulated over prior years. Minimum funding requirements are set out by applicable pension legislations.
Pension plans in Canada are governed under the Supplemental Pension Plans Act in Québec, the Pension Benefits Act in Ontario, the Pension Benefits Standards Act of 1985 for plans under federal authority, and the Income Tax Act. Actuarial valuations are required at least every three years. Depending on the jurisdiction and the funded status of the plan, actuarial valuations may be required annually. Contributions are determined by the appointed actuary and cover the going-concern normal costs and deficits (established under the assumption that the plan will continue to be in force) or solvency deficits (established under the assumption that the plan stops its operations and is being liquidated), as prescribed by laws and actuarial practices. Under the laws in effect, minimum contributions are required to amortize the going-concern deficits over a period of fifteen years and solvency deficits over a period of five years. Temporary solvency relief measures put in place to mitigate the adverse effects of the 2008 financial crisis allow for the amortization of solvency deficits over a period of up to ten years.
Pension plans in the U.S. are mainly governed under the Employee Retirement Income Security Act, the Internal Revenue Code, the Pension Protection Act of 2006 and the Highway and Transportation Funding Act. Actuarial valuations are required annually. Contributions are determined by appointed actuaries and cover normal cost and deficits as prescribed by law. Funding deficits are generally amortized over a period of seven years.
Pension plans in the U.K. are governed under the Pensions Act of 2004. Actuarial valuations are required at least every three years. The funding deficit amortization period is determined jointly by the administrators and the Corporation.

BOMBARDIER INC. FINANCIAL REPORT - FISCAL YEAR ENDED DECEMBER 31, 2014 - NOTES 147
Investment Policy
The investment policies are established to achieve a long-term investment return so that, in conjunction with contributions, the plans have sufficient assets to pay for the promised benefits while maintaining a level of risk that is acceptable given the tolerance of plan stakeholders. See below for more information about risk management initiatives.
The target asset allocation is determined based on expected economic and market conditions, the maturity profile of the plans’ liabilities, the funded status of the respective plans and the plan stakeholders’ tolerance to risk.
The plans’ investment strategy is to invest broadly in fixed income and equity securities and to have a smaller portion of the funds’ assets invested in real return asset securities (global infrastructure and real estate listed securities).
As at December 31, 2014, the average target asset allocation was as follows:
- 52%, 50% and 51% in fixed income securities, for Canadian, U.K. and U.S. plans, respectively;- 38%, 35% and 44% in equity securities, for Canadian, U.K. and U.S. plans, respectively; and- 10%, 15% and 5% in real return asset securities, for Canadian, U.K. and U.S. plans, respectively.
In addition, to mitigate interest rate risk, interest rate hedging overlay portfolios (comprised of long-term interest rate swaps and long-term Gilt forwards) were implemented in 2013 for most of the plans. The interest rate hedging overlay portfolios were liquidated in 2014 to crystallize the gains realized from declining bond yields. These portfolios will be re-implemented when the market will be favorable.
The plan administrators have also established dynamic de-risking strategies. As a result, asset allocation will likely become more conservative in the future and interest rate hedging overlay portfolios are likely to be established as plan funding status and market conditions continue to improve. Bombardier Inc. Pension Asset Management Services monitors the de-risking triggers on a daily basis to ensure timely and efficient implementation of these strategies. The Corporation and administrators periodically undertake asset and liability studies to determine the appropriateness of the investment policies and de-risking strategies.
Risk management initiatives
The Corporation’s pension plans are exposed to various risks, including equity, interest rate, inflation, foreign exchange, liquidity and longevity risks. Several risk strategies and policies have been put in place to mitigate the impact these risks could have on the funded status of DB plans and on the future level of contributions by the Corporation. The following is a description of key risks together with the mitigation measures in place to address them.
Equity riskEquity risk is the risk that results from fluctuations in equity prices. This risk is managed by maintaining diversification of portfolios across geographies, industry sectors and investment strategies.
Interest rate riskInterest rate risk is the risk that results from fluctuations in the fair value of plan assets and liabilities due to movements in interest rates. This risk is managed by reducing the mismatch between the duration of plan assets and the duration of pension obligation. This is accomplished by having a portion of the portfolio invested in long-term fixed income securities and interest rate hedging overlay portfolios.
Inflation riskInflation risk is the risk that benefits indexed to inflation increase significantly as a result of changes in inflation rates. To manage this risk, the benefit indexation has been capped in certain plans and a portion of plan assets has been invested in real return asset securities and real return fixed income securities.
Foreign exchange riskCurrency risk exposure arises from fluctuations in the fair value of plan assets denominated in a currency other than the currency of the plan liabilities. Currency risk is managed with foreign currency hedging strategies as per plan investment policies.

148 BOMBARDIER INC. FINANCIAL REPORT - FISCAL YEAR ENDED DECEMBER 31, 2014
Liquidity riskLiquidity risk is the risk stemming from holding assets which cannot be readily converted to cash when needed for the payment of benefits or to rebalance the portfolios. Liquidity risk is managed through investment in government bonds and equity futures and by having no investments in private placements or hedge funds.
Longevity riskLongevity risk is the risk that increasing life expectancy results in longer-than-expected benefit payments. This risk is mitigated by using the most recent mortality tables to set the level of contributions.
UNFUNDED DB PLANS
Unfunded plans are located in countries where the establishment of funds for segregated plan assets is generally not permitted or not in line with local practice. The Corporation's main unfunded DB plans are located in Germany. Nearly half of the German unfunded DB plan liability relates to plans for which benefits no longer accrue. The Corporation contributes annually to the Pensions Sicherungs Verein, Germany’s pension protection association, which provides protection for pension benefits up to certain limits in the event that plan sponsors become insolvent.
DC PLANS
A growing proportion of employees are participating in DC plans and, as a result, contributions to DC plans have increased over the past several years. The largest DC plans are located in Canada and in the U.S. The plan administrators and ICs oversee the management of DC plan assets.
OTHER PLANS
The Corporation also provides other unfunded defined benefit plans, consisting essentially of post-retirement healthcare coverage, life insurance benefits and retirement allocations mainly in Canada for BA. The Corporation provides post-retirement life insurance and post-retirement health care, with provisions that vary between groups of employees in Canada. New non-unionized hires are generally no longer offered post-retirement health care and receive, instead, lump sum retirement allocations.
RETIREMENT BENEFITS PLANS
The following table provides the components of the retirement benefit cost, for fiscal years:
2014 2013Pensionbenefits
Otherbenefits Total
Pensionbenefits
Otherbenefits Total
Current service cost $ 273 $ 7 $ 280 $ 301 $ 12 $ 313Accretion expense 61 15 76 96 17 113Past service cost (credit) (2) (3) (5) — — —Curtailment (22) 1 (21) (15) — (15)Settlement (2) — (2) (3) — (3)Other 2 — 2 1 — 1
DB plans 310 20 330 380 29 409DC plans 90 — 90 87 — 87Total retirement benefit cost $ 400 $ 20 $ 420 $ 467 $ 29 $ 496
Related toFunded DB plans $ 264 n/a $ 264 $ 335 n/a $ 335Unfunded DB plans $ 46 $ 20 $ 66 $ 45 $ 29 $ 74DC plans $ 90 n/a $ 90 $ 87 n/a $ 87
Recorded as followsEBIT expense or capitalized cost $ 339 $ 5 $ 344 $ 371 $ 12 $ 383Financing expense $ 61 $ 15 $ 76 $ 96 $ 17 $ 113
n/a: Not applicable

BOMBARDIER INC. FINANCIAL REPORT - FISCAL YEAR ENDED DECEMBER 31, 2014 - NOTES 149
Changes in the cumulative amount of remeasurements gains (losses) of defined benefit plans recognized in OCI, and presented as a separate component of deficit, were as follows, for fiscal years:
Gains (losses)Balance as at January 1, 2013 $ (2,794)
Impact of asset ceiling (30)Actuarial gains, net 865Effect of exchange rate changes 76Income taxes (87)
Balance as at December 31, 2013 (1,970)Impact of asset ceiling 28Actuarial gains, net (767)Effect of exchange rate changes 93Income taxes (45)
Balance as at December 31, 2014 $ (2,661)
The following tables present the changes in the defined benefit obligation and fair value of pension plan assets, for fiscal years:
2014 2013Pensionbenefits
Otherbenefits Total
Pensionbenefits
Otherbenefits Total
Change in benefit obligationObligation at beginning of year $ 9,955 $ 335 $ 10,290 $ 9,979 $ 416 $ 10,395 Accretion 444 15 459 416 17 433 Current service cost 273 7 280 301 12 313 Plan participants' contributions 39 — 39 41 — 41 Past service cost (credit) (2) (3) (5) — — — Actuarial losses (gains) - changes in financial assumptions 1,470 44 1,514 (432) (34) (466) Actuarial losses (gains) - changes in experience adjustments (98) (23) (121) 65 (6) 59 Actuarial losses (gains) - changes in demographic assumptions 58 (8) 50 104 (34) 70 Benefits paid (333) (16) (349) (294) (14) (308) Curtailment (22) 1 (21) (15) — (15) Settlement (26) — (26) (3) — (3) Other 2 — 2 (26) — (26) Effect of exchange rate changes (797) (25) (822) (181) (22) (203)Obligation at end of year $ 10,963 $ 327 $ 11,290 $ 9,955 $ 335 $ 10,290Obligation is attributable toActive members $ 5,912 $ 200 $ 6,112 $ 5,485 $ 207 $ 5,692Deferred members 1,443 — 1,443 1,298 — 1,298Retirees 3,608 127 3,735 3,172 128 3,300
$ 10,963 $ 327 $ 11,290 $ 9,955 $ 335 $ 10,290Change in plan assetsFair value at beginning of year $ 8,332 $ — $ 8,332 $ 7,434 $ — $ 7,434 Employer contributions 370 16 386 467 14 481 Plan participants' contributions 39 — 39 41 — 41 Interest income on plan assets 383 — 383 320 — 320 Actuarial gains 676 — 676 528 — 528 Benefits paid (333) (16) (349) (294) (14) (308) Settlement (24) — (24) — — — Administration costs (9) — (9) (9) — (9) Effect of exchange rate changes (614) — (614) (155) — (155)Fair value at end of year $ 8,820 $ — $ 8,820 $ 8,332 $ — $ 8,332

150 BOMBARDIER INC. FINANCIAL REPORT - FISCAL YEAR ENDED DECEMBER 31, 2014
The following table presents the reconciliation of plan assets and obligations to the amount recognized in the consolidated statements of financial position, as at:
December 31, 2014 December 31, 2013 January 1, 2013Pensionbenefits
Otherbenefits
Pensionbenefits
Otherbenefits
Pensionbenefits
Otherbenefits
Present value of defined benefit obligation $ 10,963 $ 327 $ 9,955 $ 335 $ 9,979 $ 416Fair value of plan assets (8,820) — (8,332) — (7,434) —
2,143 327 1,623 335 2,545 416Impact of asset ceiling test(1) — — 29 — — —Net amount recognized $ 2,143 $ 327 $ 1,652 $ 335 $ 2,545 $ 416Amounts included in:Retirement benefit
Liability $ 2,302 $ 327 $ 1,826 $ 335 $ 2,583 $ 416Asset(2) (159) — (174) — (38) —
Net liability $ 2,143 $ 327 $ 1,652 $ 335 $ 2,545 $ 416(1) Comprises the effect of exchange rate changes.(2) Presented in Note 18 – Other assets.
The following table presents the allocation of the net retirement benefit liability by major countries, as at:
December 31, 2014 December 31, 2013 January 1, 2013Pensionbenefits
Otherbenefits
Pensionbenefits
Otherbenefits
Pensionbenefits
Otherbenefits
Funded pension plansCanada $ 826 $ — $ 502 $ — $ 1,138 $ —U.S. 347 — 186 — 333 —U.K. 74 — 125 — 170 —Other 103 — 114 — 167 —
1,350 — 927 — 1,808 —Unfunded pension plans
Germany 560 — 515 — 517 —Canada 29 290 29 301 33 373U.S. 32 26 26 25 27 28Other 172 11 155 9 160 15
793 327 725 335 737 416Net liability $ 2,143 $ 327 $ 1,652 $ 335 $ 2,545 $ 416
The following table presents the allocation of benefit obligation and plan assets by major countries, as at:
December 31, 2014 December 31, 2013 January 1, 2013Benefit
obligationPlan
assetsBenefit
obligationPlan
assetsBenefit
obligationPlan
assetsFunded pension plans
Canada $ 5,015 $ 4,189 $ 4,479 $ 4,006 $ 4,823 $ 3,685U.K. 3,805 3,731 3,570 3,445 3,121 2,951U.S. 946 599 750 564 846 513Other 404 301 431 317 452 285
10,170 8,820 9,230 8,332 9,242 7,434Unfunded pension plans 1,120 — 1,060 — 1,153 —
$ 11,290 $ 8,820 $ 10,290 $ 8,332 $ 10,395 $ 7,434

BOMBARDIER INC. FINANCIAL REPORT - FISCAL YEAR ENDED DECEMBER 31, 2014 - NOTES 151
The fair value of plan assets by level of hierarchy, was as follows, as at:
December 31, 2014Total Level 1 Level 2 Level 3
Cash and cash equivalents $ 673 $ 548 $ 125 $ —Equity securities
U.S. 931 927 — 4U.K. 389 371 18 —Canada 359 359 — —Other 1,110 1,110 — —
2,789 2,767 18 4Fixed-income securities
Corporate 1,201 — 1,201 —Government 2,642 — 2,642 —Other 27 — 27 —
3,870 — 3,870 —Real return asset securities 911 911 — —Other 577 — 503 74
$ 8,820 $ 4,226 $ 4,516 $ 78
December 31, 2013Total Level 1 Level 2 Level 3
Cash and cash equivalents $ 503 $ 398 $ 105 $ —Equity securities
U.S. 1,022 1,018 — 4U.K. 509 489 20 —Canada 409 409 — —Other 1,290 1,288 — 2
3,230 3,204 20 6Fixed-income securities
Corporate 855 — 855 —Government 2,483 — 2,483 —Other 23 — 23 —
3,361 — 3,361 —Real return asset securities 876 876 — —Other 362 — 289 73
$ 8,332 $ 4,478 $ 3,775 $ 79
January 1, 2013Total Level 1 Level 2 Level 3
Cash and cash equivalents $ 215 $ 90 $ 125 $ —Equity securities
U.S. 1,009 1,006 — 3U.K. 465 445 20 —Canada 446 446 — —Other 1,260 1,258 — 2
3,180 3,155 20 5Fixed-income securities
Corporate 970 — 970 —Government 2,089 — 2,089 —Other 22 — 22 —
3,081 — 3,081 —Real return asset securities 653 653 — —Other 305 — 238 67
$ 7,434 $ 3,898 $ 3,464 $ 72
Plan assets did not include any of the Corporation’s shares, nor any property occupied by the Corporation or other assets used by the Corporation as at December 31, 2014, 2013 and January 1, 2013.

152 BOMBARDIER INC. FINANCIAL REPORT - FISCAL YEAR ENDED DECEMBER 31, 2014
The following table presents the contributions made for fiscal year 2014 and 2013 as well as the estimated contributions for fiscal year 2015:
2015 2014 2013Estimated
Contribution toFunded pension plans $ 296 $ 342 $ 440Unfunded pension plans 24 28 27Other benefits 17 16 14Total defined benefits plans 337 386 481DC pension plans 91 90 87
Total contributions $ 428 $ 476 $ 568
The following table presents information about the maturity profile of the defined benefit obligation expected to be paid, as at:
December 31, 2014Benefits expected to be paid
Within 1 year $ 298Between 1 and 5 years 1,405Between 5 and 10 years 2,262Between 10 and 15 years 2,824Between 15 and 20 years 3,161
$ 9,950
The following table provides the weighted average duration of the defined benefit obligations related to pension plans, as at:
Duration in years as at December 31, 2014Funded pension plans Canada 17.8 U.S. 15.6 U.K. 20.7 Other 13.9Unfunded pension plans Germany 17.7 Canada 13.7 U.S. 13.7 Other 16.0
The following table provides the expected payments to be made under the unfunded plans, as at December 31, 2014:
Germany Other TotalBenefits expected to be paid
Within 1 year $ 18 $ 22 $ 40Between 1 and 5 years 82 98 180Between 5 and 10 years 123 145 268Between 10 and 15 years 158 164 322Between 15 and 20 years 184 172 356
$ 565 $ 601 $ 1,166

BOMBARDIER INC. FINANCIAL REPORT - FISCAL YEAR ENDED DECEMBER 31, 2014 - NOTES 153
The significant actuarial assumptions reflect the economic situation of each country. The weighted-average assumptions used to determine the benefit cost and obligation were as follows, as at:
December 31, 2014 December 31, 2013 January 1, 2013
(in percentage)Pensionbenefits
Otherbenefits
Pensionbenefits
Otherbenefits
Pensionbenefits
Otherbenefits
Benefit costDiscount rate 4.59% 4.97% 4.25% 4.38% 4.44% 4.25%Rate of compensation increase 3.36% 3.25% 3.35% 3.25% 3.71% 3.50%Inflation rate 2.34% 2.40% 2.19% 2.00% 2.24% 3.15%Ultimate health care cost trend rate n/a 4.98% n/a 5.00% n/a 5.00%Benefit obligationDiscount rate 3.69% 4.07% 4.59% 4.97% 4.25% 4.38%Rate of compensation increase 3.26% 3.25% 3.36% 3.25% 3.35% 3.25%Inflation rate 2.21% 2.05% 2.34% 2.40% 2.19% 3.00%Initial health care cost trend rate n/a 6.08% n/a 6.55% n/a 7.00%Ultimate health care cost trend rate n/a 4.99% n/a 4.98% n/a 5.00%
n/a: Not applicable
The mortality tables and the average life expectancy in years of a member at age 45 or 65 is as follows, as at December 31:
(in years) Life expectancy over 65 for a male member currentlyAged 65 on December Aged 45 on December
Country Mortality tables 2014 2013 2014 2013Canada 2014 Private Sector Mortality Table ("CPM2014Priv")
projected generationally using the CMP Improvement Scale B ("CPM-B")(1)
21.6 21.3 22.7 22.9
U.K. SNA02M_CMI 2010 and S1P(M/F)A CMI 2012(2) 22.0 21.8 23.8 23.9U.S. RP-2014 mortality table projected generationally
using the MP-2014 improvement scale(3) 21.7 19.1 23.4 19.1Germany Dr. K Heubeck 2005 20.1 20.0 22.8 22.6
Life expectancy over 65 for a female member currentlyAged 65 on December Aged 45 on December
Country Mortality tables 2014 2013 2014 2013Canada 2014 Private Sector Mortality Table ("CPM2014Priv")
projected generationally using the CMP Improvement Scale B ("CPM-B")(1)
24.1 23.5 25.1 24.5
U.K. SNA02M_CMI 2010 and S1P(M/F)A CMI 2012(2) 24.2 24.0 26.2 26.1U.S. RP-2014 mortality table projected generationally
using the MP-2014 improvement scale(3) 23.9 21.0 25.5 21.0Germany Dr. K Heubeck 2005 23.9 23.7 26.4 26.2
(1) RPP2014Priv using draft improvement scale A1-2014 (CPM-A1D2014) as at December 31, 2013.(2) S1NA_L CMI 2010 G as at December 31, 2013.(3) PPA mandated mortality table per IRC as at December 31, 2013.

154 BOMBARDIER INC. FINANCIAL REPORT - FISCAL YEAR ENDED DECEMBER 31, 2014
A 0.25 percentage point increase in one of the following actuarial assumptions would have the following effects, all other actuarial assumptions remaining unchanged:
Retirement benefit costfor fiscal year
Net retirement benefitliability as at
Assumption 2014 December 31, 2014Discount rate $ (34) $ (483)Rate of compensation increase $ 8 $ 89Inflation rate $ 9 $ 138
A one year additional life expectancy as at December 31, 2014 for all DB plans would increase the net retirement benefit liability by $272 million and the retirement benefit cost for fiscal year 2014 by $17 million, all other actuarial assumptions remaining unchanged.
As at December 31, 2014, the health care cost trend rate for retirement benefits other than pension, which is a weighted-average annual rate of increase in the per capita cost of covered health and dental care benefits, is assumed to be 6.08% and to decrease progressively to 4.99% by calendar year 2017 and then remain at that level for all participants. A one percentage point change in assumed health care cost trend rates would have the following effects, as at December 31, 2014 and for fiscal year 2014:
One percentage pointincrease
One percentage pointdecrease
Effect on the net retirement benefit liability $ 30 $ (26)Effect on the retirement benefit cost $ 2 $ (2)
22. TRADE AND OTHER PAYABLES
Trade and other payables were as follows, as at:
December 31, 2014 December 31, 2013 January 1, 2013Trade payables $ 3,037 $ 2,959 $ 2,398Accrued liabilities 566 623 519Interest 124 116 66Other 489 391 327
$ 4,216 $ 4,089 $ 3,310
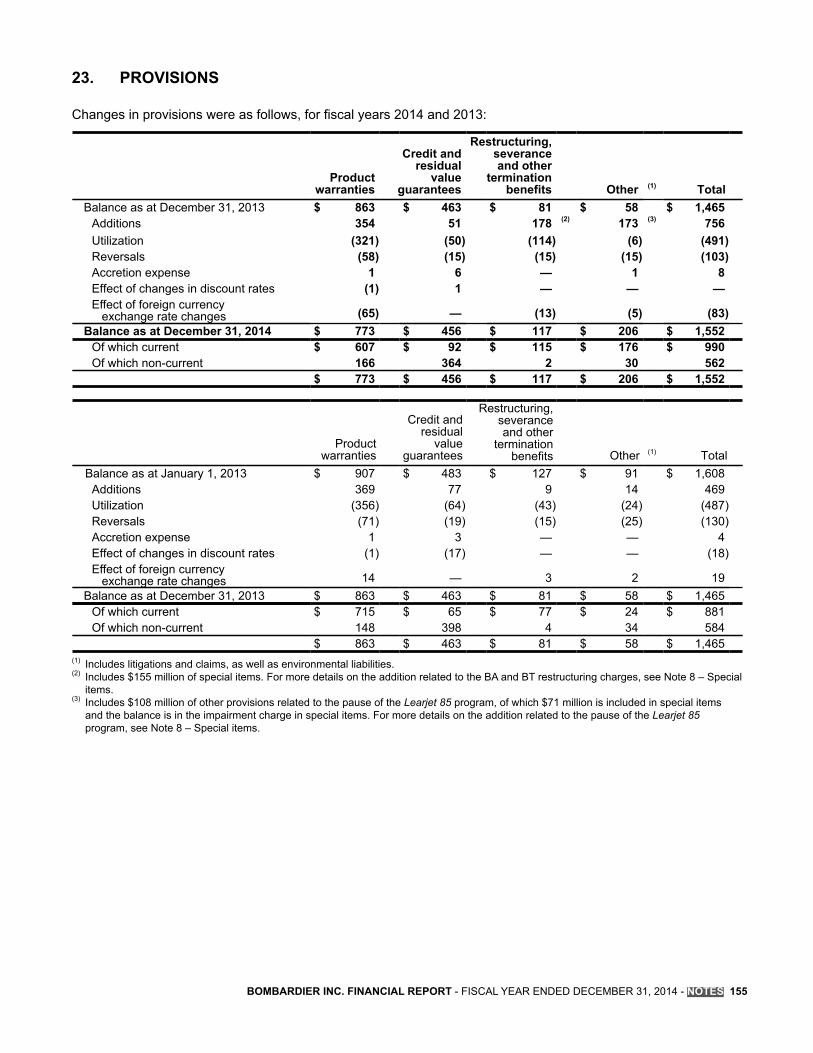
BOMBARDIER INC. FINANCIAL REPORT - FISCAL YEAR ENDED DECEMBER 31, 2014 - NOTES 155
23. PROVISIONS
Changes in provisions were as follows, for fiscal years 2014 and 2013:
Productwarranties
Credit andresidual
valueguarantees
Restructuring,severanceand other
terminationbenefits Other (1) Total
Balance as at December 31, 2013 $ 863 $ 463 $ 81 $ 58 $ 1,465Additions 354 51 178 (2) 173 (3) 756Utilization (321) (50) (114) (6) (491)Reversals (58) (15) (15) (15) (103)Accretion expense 1 6 — 1 8Effect of changes in discount rates (1) 1 — — —Effect of foreign currency exchange rate changes (65) — (13) (5) (83)
Balance as at December 31, 2014 $ 773 $ 456 $ 117 $ 206 $ 1,552Of which current $ 607 $ 92 $ 115 $ 176 $ 990Of which non-current 166 364 2 30 562
$ 773 $ 456 $ 117 $ 206 $ 1,552
Productwarranties
Credit andresidual
valueguarantees
Restructuring,severanceand other
terminationbenefits Other (1) Total
Balance as at January 1, 2013 $ 907 $ 483 $ 127 $ 91 $ 1,608Additions 369 77 9 14 469Utilization (356) (64) (43) (24) (487)Reversals (71) (19) (15) (25) (130)Accretion expense 1 3 — — 4Effect of changes in discount rates (1) (17) — — (18)Effect of foreign currency exchange rate changes 14 — 3 2 19
Balance as at December 31, 2013 $ 863 $ 463 $ 81 $ 58 $ 1,465Of which current $ 715 $ 65 $ 77 $ 24 $ 881Of which non-current 148 398 4 34 584
$ 863 $ 463 $ 81 $ 58 $ 1,465(1) Includes litigations and claims, as well as environmental liabilities. (2) Includes $155 million of special items. For more details on the addition related to the BA and BT restructuring charges, see Note 8 – Special
items.(3) Includes $108 million of other provisions related to the pause of the Learjet 85 program, of which $71 million is included in special items
and the balance is in the impairment charge in special items. For more details on the addition related to the pause of the Learjet 85 program, see Note 8 – Special items.

156 BOMBARDIER INC. FINANCIAL REPORT - FISCAL YEAR ENDED DECEMBER 31, 2014
24. OTHER FINANCIAL LIABILITIES
Other financial liabilities were as follows, as at:
December 31, 2014 December 31, 2013 January 1, 2013Derivative financial instruments(1) $ 665 $ 411 $ 141Government refundable advances 363 481 398Sale and leaseback obligations 260 138 168Lease subsidies(2) 172 142 158Current portion of long-term debt(3) 56 215 45Vendor non-recurring costs 36 38 53Other 60 301 93
$ 1,612 $ 1,726 $ 1,056Of which current $ 1,010 $ 1,009 $ 455Of which non-current 602 717 601
$ 1,612 $ 1,726 $ 1,056(1) See Note 13 – Financial instruments.(2) The amount contractually required to be paid is $206 million as at December 31, 2014 ($172 million as at December 31, 2013 and
$203 million as at January 1, 2013).(3) See Note 26 – Long-term debt.
Sale and leaseback obligations The Corporation has set up sale and leaseback facilities, which may be used to sell pre-owned business aircraft. For accounting purposes, amounts outstanding under certain of these arrangements are considered financial obligations secured by the pre-owned business aircraft. The arrangements are generally for a term no longer than 24 months. The Corporation may settle the obligation at any time during the arrangement.
25. OTHER LIABILITIES
Other liabilities were as follows, as at:
December 31, 2014 December 31, 2013 January 1, 2013Employee benefits(1) $ 661 $ 750 $ 645Accruals for long-term contract costs 631 630 677Supplier contributions to aerospace programs 601 529 364Deferred revenues 450 460 499Income and other taxes payable 367 368 252Deferred income taxes(2) — — 46Flexjet fractional ownership deferred revenues — — 241Other 568 480 445
$ 3,278 $ 3,217 $ 3,169Of which current $ 2,182 $ 2,227 $ 2,212Of which non-current 1,096 990 957
$ 3,278 $ 3,217 $ 3,169(1) Comprises all employee benefits excluding those related to retirement benefits, which are reported in the line items Retirement benefits and
in Other assets (see Note 21 – Retirement benefits).(2) See Note 11 – Income taxes.

BOMBARDIER INC. FINANCIAL REPORT - FISCAL YEAR ENDED DECEMBER 31, 2014 - NOTES 157
26. LONG-TERM DEBT
Long-term debt was as follows, as at:
December 312014
December 312013
January 12013
Interest rate
Amount incurrency of
origin Currency Contractual (1)
After effectof fair value
hedges Maturity Amount Amount Amount
Senior notes 750 USD 4.25% n/a Jan. 2016 $ 746 $ 742 $ —650 USD 7.50% 3-month
Libor + 4.19Mar. 2018 686 695 724
600 USD 4.75% n/a Apr. 2019 593 — —
850 USD 7.75% 3-month Libor + 4.14
Mar. 2020 922 915 978
780 EUR 6.13% 3-month Euribor + 2.87(6)
May 2021 1,110 1,187 1,183
500 USD 5.75% 3-month Libor + 3.37
Mar. 2022 504 478 492
1,200 USD 6.00% 3-month Libor + 3.56
Oct. 2022 1,219 — —
1,250 USD 6.13% 3-month Libor + 3.50
Jan. 2023 1,277 1,200 —
785(5) EUR 7.25% 3-month Libor + 4.83
n/a — 1,171 1,162
Notes 250 USD 7.45% n/a May 2034 248 248 247162 USD 6.30% 3-month
Libor + 1.59n/a — 164 171
Debentures 150 CAD 7.35% n/a Dec. 2026 129 140 150Other(2) Various(3) Various Various(3) n/a 2015-2026 249 263 298
$ 7,683 $ 7,203 $ 5,405Of which current(4) $ 56 $ 215 $ 45Of which non-current 7,627 6,988 5,360
$ 7,683 $ 7,203 $ 5,405(1) Interests on long-term debt as at December 31, 2014 are payable semi-annually, except for the other debts for which the timing of interest
payments is variable. (2)
Includes obligations under finance leases. (3) The notional amount of other long-term debt is $249 million as at December 31, 2014 ($263 million as at December 31, 2013 and $298
million as at January 1, 2013). The contractual interest rate, which represents a weighted average rate, is 4.46% as at December 31, 2014 (4.62% as at December 31, 2013 and 4.65% as at January 1, 2013).
(4) See Note 24 – Other financial liabilities.(5) Repurchased pursuant to an optional redemption exercised in April, 2014.(6) The interest-rate swap agreement related to the €780 million Senior Notes was settled in the fourth quarter of fiscal year 2014. As this
interest-rate swap was in a fair value hedge relationship, the related deferred gain recorded in the hedged item will be amortized in interest expense up to the maturity of the debt.
n/a: Not applicable
All Senior notes and Notes rank pari-passu and are unsecured. The Corporation is subject to various financial covenants under the BA and BT letter of credit facilities and the two unsecured revolving credit facilities, which must be met on a quarterly basis, see Note 30 - Credit facilities for more details. A breach of any of these agreements or the inability to comply with these covenants could result in a default under these facilities, which would permit the Corporation's banks to request immediate defeasance or cash cover of all outstanding letters of credit, and bond holders and other lenders to declare amounts owed to them to be immediately payable. These conditions were all met as at December 31, 2014 and 2013 and January 1, 2013.

158 BOMBARDIER INC. FINANCIAL REPORT - FISCAL YEAR ENDED DECEMBER 31, 2014
The carrying value of long-term debt includes principal repayments, transaction costs, unamortized discounts and the basis adjustments related to derivatives designated in fair value hedge relationships. The following table presents the contractual principal repayments of the long-term debt, as at:
December 31, 2014 December 31, 2013 January 1, 2013Within 1 year $ 56 $ 213 $ 45Between 1 and 5 years 2,127 2,630 1,358More than 5 years 5,193 4,130 3,522
$ 7,376 $ 6,973 $ 4,925
27. SHARE CAPITAL
Preferred sharesThe preferred shares authorized were as follows, as at December 31, 2014, and 2013 and January 1, 2013:
Authorized for the specific series
Series 2 Cumulative Redeemable Preferred Shares 12,000,000Series 3 Cumulative Redeemable Preferred Shares 12,000,000Series 4 Cumulative Redeemable Preferred Shares 9,400,000
The preferred shares issued and fully paid were as follows, as at:
December 31, 2014 December 31, 2013 January 1, 2013Series 2 Cumulative Redeemable Preferred Shares 9,692,521 9,692,521 9,692,521Series 3 Cumulative Redeemable Preferred Shares 2,307,479 2,307,479 2,307,479Series 4 Cumulative Redeemable Preferred Shares 9,400,000 9,400,000 9,400,000
Series 2 Cumulative Redeemable Preferred SharesRedemption: Redeemable, at the Corporation’s option, at $25.50 Cdn per share.Conversion: Convertible on a one-for-one basis, at the option of the holder, on August 1, 2017 and on August 1 of every
fifth year thereafter into Series 3 Cumulative Redeemable Preferred Shares. Fourteen days before the conversion date, if the Corporation determines, after having taken into account all shares tendered for conversion by holders, that there would be less than 1,000,000 outstanding Series 2 Cumulative Redeemable Preferred Shares, such remaining number shall automatically be converted into an equal number of Series 3 Cumulative Redeemable Preferred Shares. Likewise, if the Corporation determines fourteen days before the conversion date that, at such time, there would be less than 1,000,000 outstanding Series 3 Cumulative Redeemable Preferred Shares, then no Series 2 Cumulative Redeemable Preferred Shares may be converted.
Dividend: Since August 1, 2002, the variable cumulative preferential cash dividends are payable monthly on the 15th day of each month, if declared, with the annual variable dividend rate being set between 50% to 100% of the Canadian prime rate, and adjusted as follows. The dividend rate will vary in relation to changes in the prime rate and will be adjusted upwards or downwards on a monthly basis to a monthly maximum of 4% if the trading price of Series 2 Cumulative Redeemable Preferred Shares is less than $24.90 Cdn per share or more than $25.10 Cdn per share.

BOMBARDIER INC. FINANCIAL REPORT - FISCAL YEAR ENDED DECEMBER 31, 2014 - NOTES 159
Series 3 Cumulative Redeemable Preferred SharesRedemption: Redeemable, at the Corporation’s option, at $25.00 Cdn per share on August 1, 2017 and on August 1 of
every fifth year thereafter.Conversion: Convertible on a one-for-one basis, at the option of the holder, on August 1, 2017 and on August 1 of every
fifth year thereafter into Series 2 Cumulative Redeemable Preferred Shares. Fourteen days before the conversion date, if the Corporation determines, after having taken into account all shares tendered for conversion by holders, that there would be less than 1,000,000 outstanding Series 3 Cumulative Redeemable Preferred Shares, such remaining number shall automatically be converted into an equal number of Series 2 Cumulative Redeemable Preferred Shares. Likewise, if the Corporation determines fourteen days before the conversion date that, at such time, there would be less than 1,000,000 outstanding Series 2 Cumulative Redeemable Preferred Shares, then no Series 3 Cumulative Redeemable Preferred Shares may be converted.
Dividend: For the five-year period from August 1, 2012 and including July 31, 2017, the Series 3 CumulativeRedeemable Preferred Shares carry fixed cumulative preferential cash dividends at a rate of 3.134% or$0.7835 Cdn per share per annum, payable quarterly on the last day of January, April, July and October ofeach year at a rate of $0.195875 Cdn, if declared. For each succeeding five-year period, the applicable fixedannual rate of the cumulative preferential cash dividends calculated by the Corporation shall not be less than80% of the Government of Canada bond yield, as defined in the Articles of Amalgamation.
Series 4 Cumulative Redeemable Preferred SharesRedemption: The Corporation may, subject to certain provisions, on not less than 30 nor more than 60 days’ notice, redeem
for cash the Series 4 Cumulative Redeemable Preferred Shares at $25.00 Cdn.Conversion: The Corporation may, subject to the approval of the Toronto Stock Exchange and such other stock exchanges
on which the Series 4 Cumulative Redeemable Preferred Shares are then listed, at any time convert all or any of the outstanding Series 4 Cumulative Redeemable Preferred Shares into fully paid and non-assessable Class B Shares (Subordinate Voting) of the Corporation. The number of Class B Shares (Subordinate Voting) into which each Series 4 Cumulative Redeemable Preferred Shares may be so converted will be determined by dividing the then applicable redemption price together with all accrued and unpaid dividends to, but excluding the date of conversion, by the greater of $2.00 Cdn and 95% of the weighted-average trading price of such Class B Shares (Subordinate Voting) on the Toronto Stock Exchange for the period of 20 consecutive trading days, which ends on the fourth day prior to the date specified for conversion or, if that fourth day is not a trading day, on the trading day immediately preceding such fourth day. The Corporation may, at its option, at any time, create one or more further series of Preferred Shares of the Corporation, into which the holders of Series 4 Cumulative Redeemable Preferred Shares could have the right, but not the obligation, to convert their shares on a share-for-share basis.
Dividend: The holders of Series 4 Cumulative Redeemable Preferred Shares are entitled to fixed cumulative preferential cash dividends, if declared, at a rate of 6.25% or $1.5625 Cdn per share per annum, payable quarterly on the last day of January, April, July and October of each year at a rate of $0.390625 Cdn per share.
Common sharesAll common shares are without nominal or par value.
Class A Shares (Multiple Voting)Voting rights: Ten votes each.Conversion: Convertible, at any time, at the option of the holder, into one Class B Share (Subordinate Voting).Dividend: After payment of the priority dividend on the Class B Shares (Subordinate Voting) mentioned below, the Class
A Shares (Multiple Voting) shall share equally, share for share, with respect to any additional dividends whichmay be declared in respect of the Class A Shares (Multiple Voting) and Class B Shares (Subordinate Voting).These dividends, if declared, shall be payable quarterly on the last day of March, June, September andDecember of each year.

160 BOMBARDIER INC. FINANCIAL REPORT - FISCAL YEAR ENDED DECEMBER 31, 2014
Class B Shares (Subordinate Voting)Voting rights: One vote each.Conversion: Convertible, at the option of the holder, into one Class A Share (Multiple Voting): (i) if an offer made to Class A
(Multiple Voting) shareholders is accepted by the present controlling shareholder (the Bombardier family); or(ii) if such controlling shareholder ceases to hold more than 50% of all outstanding Class A Shares (MultipleVoting) of the Corporation.
Dividend: The holders of Class B Shares (Subordinate Voting) are entitled, in priority to the holders of Class A Shares (Multiple Voting) to non-cumulative dividends of $0.0015625 Cdn per share, payable quarterly on the last day of March, June, September and December of each year at a rate of $0.000390625 Cdn per share, if declared. After payment of said priority dividend, the Class B Shares (Subordinate Voting) shall share equally, share for share, with respect to any additional dividends which may be declared in respect of the Class A Shares (Multiple Voting) and the Class B Shares (Subordinate Voting). These dividends, if declared, shall be payable quarterly on the last day of March, June, September and December of each year.
The change in the number of common shares issued and fully paid and in the number of common shares authorized was as follows as at:
Class A Shares (multiple voting)December 31, 2014 December 31, 2013
Issued and fully paidBalance at beginning of year 314,530,462 314,537,162
Converted to Class B (257,207) (6,700)Balance at end of year 314,273,255 314,530,462Authorized 1,892,000,000 1,892,000,000
Class B Shares (subordinate voting)December 31, 2014 December 31, 2013
Issued and fully paidBalance at beginning of year 1,443,496,418 1,440,364,381
Issuance of shares 378,501 3,125,337Converted from Class A 257,207 6,700
1,444,132,126 1,443,496,418Held in trust under the PSU plan
Balance at beginning of year (18,736,908) (24,542,027)Distributed — 5,805,119
(18,736,908) (18,736,908)Balance at end of year 1,425,395,218 1,424,759,510Authorized 1,892,000,000 1,892,000,000
Dividends Dividends declared were as follows:
Dividend declared for fiscal years Dividend declared afterDecember 31, 2014 December 31, 2013 December 31, 2014
Total Total TotalPer share
(Cdn$)(in millions
of U.S.$)Per share
(Cdn$)(in millions
of U.S.$)Per share
(Cdn$)(in millions
of U.S.$)Class A common shares 0.10 $ 29 0.10 $ 31 — $ —Class B common shares 0.10 131 0.10 142 — —
160 173 —Series 2 Preferred Shares 0.75 7 0.75 7 0.13 1Series 3 Preferred Shares 0.78 2 0.78 2 0.20 —Series 4 Preferred Shares 1.56 13 1.56 14 0.39 4
22 23 5$ 182 $ 196 $ 5

BOMBARDIER INC. FINANCIAL REPORT - FISCAL YEAR ENDED DECEMBER 31, 2014 - NOTES 161
28. SHARE-BASED PLANS
PSU and DSU plansThe Board of Directors of the Corporation approved a PSU plan under which PSUs may be granted to executives and other designated employees. The PSUs give recipients the right, upon vesting, to receive a certain number of the Corporation’s Class B Shares (Subordinate Voting). The Board of Directors of the Corporation has also approved a DSU plan under which DSUs may be granted to senior officers. The DSU plan is similar to the PSU plan, except that their exercise can only occur upon retirement or termination of employment. During fiscal year 2014, a combined value of $53 million of DSUs and PSUs were authorized for issuance ($52 million during fiscal year 2013).
The number of PSUs and DSUs has varied as follows, for fiscal years:
2014 2013PSU DSU PSU DSU
Balance at beginning of year 23,596,681 8,169,850 24,179,840 6,673,447Granted 9,971,382 2,377,003 7,884,242 2,229,555Performance adjustment — — (1,543,133) (333,900)Exercised — (500,771) (5,805,119) (109,240)Cancelled (7,522,127) (2,379,618) (1,119,149) (290,012)
Balance at end of year 26,045,936 7,666,464 (1) 23,596,681 8,169,850 (1)
(1) Of which 2,008,128 DSUs are vested as at December 31, 2014 (2,448,572 as at December 31, 2013).
PSUs and DSUs granted will vest if a financial performance threshold is met. The conversion ratio for vested PSUs and DSUs ranges from 70% to 150%. PSUs and DSUs generally vest three years following the grant date if the financial performance thresholds are met. For grants issued between January 1, 2012 and December 31, 2014, the vesting dates range from August 14, 2015 to August 7, 2017.
The weighted-average grant date fair value of PSUs and DSUs granted during fiscal year 2014 was $3.38 ($4.63 during fiscal year 2013). The fair value of each PSUs and DSUs granted was measured based on the closing price of a Class B Share (Subordinate Voting) of the Corporation on the Toronto Stock Exchange.
From time to time, the Corporation provides instructions to a trustee under the terms of a Trust Agreement to purchase Class B Shares (Subordinate Voting) of the Corporation in the open market (see Note 27 – Share capital) in connection with the PSU plan. These shares are held in trust for the benefit of the beneficiaries until the PSUs become vested or are cancelled. The cost of these purchases has been deducted from share capital.
A compensation revenue of $3 million was recorded during fiscal year 2014 with respect to the PSU and DSU plans (a compensation expense of $4 million during fiscal year 2013). The compensation revenue is due to the revision, in the third quarter of fiscal year 2014, of assumptions related to future performance.
Share option plans Under share option plans, options are granted to key employees to purchase Class B Shares (Subordinate Voting). Of the 135,782,688 Class B Shares (Subordinate Voting) reserved for issuance, 61,068,883 were available for issuance under these share option plans, as at December 31, 2014.
Current share option plan - Effective June 1, 2009, the Corporation amended the share option plan for key employees for options granted after this date. The most significant terms and conditions of the amended plan are as follows: • The exercise price is equal to the weighted-average trading prices on the stock exchange during the five
trading days preceding the date on which the options were granted.• The options vest at the expiration of the third year following the grant date. • The options terminate no later than seven years after the grant date.

162 BOMBARDIER INC. FINANCIAL REPORT - FISCAL YEAR ENDED DECEMBER 31, 2014
The summarized information on the current share option plan is as follows as at December 31, 2014:
Issued and outstanding Exercisable
Exercise price range (Cdn$)Number of
options
Weighted-average
remaininglife (years)
Weighted-averageexercise
price (Cdn$)Number of
options
Weighted-averageexercise
price (Cdn$)2 to 4 16,398,065 5.40 3.68 2,065,000 3.454 to 6 8,286,637 4.33 4.79 3,476,528 4.726 to 8 3,127,022 3.62 7.01 3,127,022 7.01
27,811,724 8,668,550
The weighted-average share price of options exercised during fiscal year 2014 was $3.71 ($4.68 during fiscal year 2013).
The number of options issued and outstanding under the current share option plan has varied as follows, for fiscal years:
2014 2013
Number ofoptions
Weighted-averageexercise
price (Cdn$)Number of
options
Weighted-averageexercise
price (Cdn$)Balance at beginning of year 20,654,419 4.66 15,891,601 4.57
Granted 8,630,184 3.77 5,478,566 4.86Exercised (110,000) 3.45 (174,414) 3.45Cancelled (1,351,310) 4.62 (541,334) 4.65Expired (11,569) 3.45 — —
Balance at end of year 27,811,724 4.39 20,654,419 4.66Options exercisable at end of year 8,668,550 5.24 5,783,097 4.24
Performance share option plan - For options issued to key employees after May 27, 2003, and before June 1, 2009, the exercise price is equal to the weighted-average trading prices on the stock exchange during the five trading days preceding the date on which the options were granted. These options vest at 25% per year during a period beginning one year following the grant date. However, predetermined target market price thresholds must be achieved in order for the options to be exercised. Such options may be exercised if within the 12-month period preceding the date on which such options vest, the weighted-average trading price on the stock exchange (during a period of 21 consecutive trading days) is greater than or equal to the target price threshold established at the time the options were granted. If within such 12-month period, the weighted-average trading price has not been reached, the target price threshold applicable to the next vesting tranche becomes effective. The options terminate no later than seven years after the grant date. As at December 31, 2014, target prices ranged between $6 Cdn and $8 Cdn.
The summarized information on the performance share option plan is as follows, as at December 31, 2014:
Issued and outstanding Exercisable
Exercise price range(Cdn$)
Number ofoptions
Weighted-average
target price(Cdn$)
Weighted-average
remaininglife (years)
Weighted-averageexercise
price (Cdn$)Number of
options
Weighted-averageexercise
price (Cdn$)4 to 6 105,000 7.52 0.74 5.75 25,000 5.898 to 10 3,529,400 8.00 0.63 8.53 — —
3,634,400 25,000
The weighted-average share price of options exercised during fiscal year 2014 was nil ($4.45 during fiscal year 2013).

BOMBARDIER INC. FINANCIAL REPORT - FISCAL YEAR ENDED DECEMBER 31, 2014 - NOTES 163
The number of options has varied as follows, for fiscal years:
2014 2013
Number ofoptions
Weighted-averageexercise
price (Cdn$)Number of
options
Weighted-averageexercise
price (Cdn$)Balance at beginning of year 8,701,338 7.08 12,598,488 6.05
Exercised — — (2,898,350) 3.22Cancelled (1,198,000) 8.15 (474,050) 7.00Expired (3,868,938) 5.48 (524,750) 3.55
Balance at end of year 3,634,400 8.44 8,701,338 7.08Options exercisable at end of year 25,000 5.89 4,027,938 5.48
Share-based compensation expense for optionsThe weighted-average grant date fair value of stock options granted during fiscal year 2014 was $0.78 per option ($1.51 per option for fiscal year 2013). The fair value of each option granted was determined using a Black-Scholes option pricing model, which incorporates the share price at the grant date, and the following weighted-average assumptions, for fiscal years:
2014 2013Risk-free interest rate 1.52% 1.73%Expected life 5 years 5 yearsExpected volatility in market price of shares 32.32% 43.18%Expected dividend yield 2.51% 2.50%
A compensation expense of $5 million was recorded during fiscal year 2014 with respect to share option plans ($7 million during fiscal year 2013).
Employee share purchase planUnder the employee share purchase plan, employees of the Corporation are eligible to purchase Class B Shares (Subordinate Voting) of the Corporation up to a maximum of 20% of their base salary to a yearly maximum of $30,000 Cdn per employee. The Corporation contributes to the plan an amount equal to 20% of the employees’ contributions. The contributions are used to purchase the Corporation’s Class B Shares (Subordinate Voting) in the open market on monthly investment dates or as otherwise determined by the Corporation, but not less frequently than monthly. The Corporation’s contribution to the plan amounted to $8 million for fiscal year 2014 ($8 million for fiscal year 2013). Shares purchased by the Corporation are subject to a mandatory 12-month holding period that must be completed at the anniversary date of January 1.
29. NET CHANGE IN NON-CASH BALANCES
Net change in non-cash balances was as follows, for fiscal years:
2014 2013Trade and other receivables $ (184) $ (134)Inventories 87 (631)Other financial assets and liabilities, net 184 (15)Other assets (175) (437)Trade and other payables 327 749Provisions 169 (161)Advances and progress billings in excess of long-term contract inventories (529) 301Advances on aerospace programs 31 334Retirement benefits liability (104) (8)Other liabilities 196 361
$ 2 $ 359

164 BOMBARDIER INC. FINANCIAL REPORT - FISCAL YEAR ENDED DECEMBER 31, 2014
30. CREDIT FACILITIES
Letter of credit facilitiesThe letter of credit facilities and their maturities were as follows, as at:
Amountcommitted
Letters ofcredit issued
Amountavailable Maturity
December 31, 2014BT facility $ 4,249 (1) $ 3,573 $ 676 2018 (2)
BA facility 600 261 339 2017 (3)
PSG facility 600 327 273 2015 (4)
$ 5,449 $ 4,161 $ 1,288December 31, 2013
BT facility $ 4,827 (1) $ 4,132 $ 695 2018BA facility 600 403 197 2016PSG facility 600 393 207 2014 (4)
$ 6,027 $ 4,928 $ 1,099January 1, 2013
BT facility $ 4,486 (1) $ 3,291 $ 1,195 2017BA facility 600 430 170 2015PSG facility 900 339 561 2013 (4)
$ 5,986 $ 4,060 $ 1,926(1) €3,500 million as at December 31, 2014 (€3,500 million as at December 31, 2013 and €3,400 million as at January 1, 2013).(2) The facility has an initial three year availability period, when new letters of credit can be issued up to the maximum commitment amount of
the facility, plus a one year amortization period during which new letters of credit cannot be issued. The final maturity date of the facility is 2018.
(3) The facility has an initial three year availability period, when new letters of credit can be issued up to the maximum commitment of the facility. The facility can be extended annually on the anniversary date for an additional year subject to approval by a majority of the bank syndicate members.
(4) The PSG facility is renewed and extended annually if mutually agreed. In June 2014, the facility was extended until June 2015 and is intended to be renewed in annual increments thereafter. If the facility is not extended, the letters of credit issued under this facility will amortize over their maturity.
In addition to the outstanding letters of credit shown in the above table, letters of credit of $1,731 million were outstanding under various bilateral agreements as at December 31, 2014 ($1,018 million as at December 31, 2013 and $875 million as at January 1, 2013).
The Corporation also uses numerous bilateral bonding facilities with insurance companies to support BT’s operations. An amount of $2.4 billion was outstanding under such facilities as at December 31, 2014 ($2.3 billion as at December 31, 2013 and $2.3 billion as at January 1, 2013).
Revolving credit facilities The Corporation has a $750-million unsecured revolving credit facility (“revolving credit facility”) that matures in June 2017 and bears interest at the applicable base rate (Libor, in the case of a U.S. dollar cash drawing) plus a margin based on the Corporation’s credit ratings. This facility is available for cash drawings for the general working capital needs of the Corporation. In addition, the Corporation has an unsecured revolving credit facility (“BT revolving credit facility”) amounting to €500 million ($607 million), available to BT for cash drawings. The facility matures in March 2016 and bears interest at EURIBOR plus a margin.
Financial covenantsThe Corporation is subject to various financial covenants under the BA and BT letter of credit facilities and the two unsecured revolving credit facilities, which must be met on a quarterly basis. The BA letter of credit and revolving credit facility include financial covenants requiring a minimum EBITDA to fixed charges ratio, as well as a maximum net debt to EBITDA ratio, all calculated based on an adjusted consolidated basis i.e. excluding BT. The BT letter of credit and BT revolving credit facility include financial covenants requiring minimum equity as well as a maximum debt to EBITDA ratio, all calculated based on BT stand-alone financial data. These terms and ratios are defined in the respective agreements and do not correspond to the Corporation’s global metrics as described in Note 31 – Capital management or to the specific terms used in the MD&A. In addition, the Corporation must

BOMBARDIER INC. FINANCIAL REPORT - FISCAL YEAR ENDED DECEMBER 31, 2014 - NOTES 165
maintain a minimum BT liquidity of €600 million ($728 million) and a minimum BA liquidity of $500 million at the end of each quarter. These conditions were all met as at December 31, 2014 and 2013 and January 1, 2013.
The Corporation regularly monitors these ratios to ensure it meets all financial covenants, and has controls in place to ensure that contractual covenants are met.
31. CAPITAL MANAGEMENT
The Corporation’s capital management strategy is designed to maintain strong liquidity and to optimize its capital structure in order to reduce costs and improve its ability to seize strategic opportunities. The Corporation analyzes its capital structure using global metrics, which are based on a broad economic view of the Corporation. The Corporation manages and monitors its global metrics such that it can achieve an investment-grade profile.
The Corporation’s objectives with regard to its global metrics are as follows: • adjusted EBIT to adjusted interest ratio greater than 5.0; and• adjusted debt to adjusted EBITDA ratio lower than 2.5.
Global metrics – The following global metrics do not represent the ratios required for bank covenants. A reconciliation of the global metrics to the most comparable IFRS financial measures are provided in the Non-GAAP financial measures section of the MD&A for fiscal year 2014.
2014 2013Adjusted EBIT(1) $ 1,262 $ 967Adjusted interest(2) $ 401 $ 346Adjusted EBIT to adjusted interest ratio 3.1 2.8Adjusted debt(3) $ 8,401 $ 7,912Adjusted EBITDA(4) $ 1,775 $ 1,454Adjusted debt to adjusted EBITDA ratio 4.7 5.4
(1) Represents EBIT before special items plus interest adjustment for operating leases, and interest received as per the supplemental information provided in the consolidated statements of cash flows, adjusted, if needed, for the settlement of fair value hedge derivatives before their contractual maturity dates.
(2) Represents interest paid as per the supplemental information provided in the consolidated statements of cash flows, plus accretion expense on sale and leaseback obligations and interest adjustment for operating leases.
(3) Represents long-term debt adjusted for the fair value of derivatives (or settled derivatives) designated in related hedge relationships plus sale and leaseback obligations and the net present value of operating lease obligations.
(4) Represents adjusted EBIT plus amortization and impairment charges of PP&E and intangible assets and amortization adjustment for operating leases.
In addition to the above global level metrics, the Corporation separately monitors its net retirement benefit liability which amounted to $2.5 billion as at December 31, 2014 ($2.0 billion as at December 31, 2013). The measurement of this liability is dependent on numerous key long-term assumptions such as current discount rates, future compensation increases, inflation rates and mortality rates. In recent years, this liability has been particularly volatile due to changes in discount rates. Such volatility is exacerbated by the long-term nature of the obligation. The Corporation closely monitors the impact of the net retirement benefit liability on its future cash flows and has introduced significant risk mitigation initiatives in recent years in this respect.
In order to adjust its capital structure, the Corporation may issue or reduce long-term debt, make discretionary contributions to pension funds, repurchase or issue share capital, or vary the amount of dividends paid to shareholders.
See Note 30 – Credit facilities for a description of bank covenants.

166 BOMBARDIER INC. FINANCIAL REPORT - FISCAL YEAR ENDED DECEMBER 31, 2014
32. FINANCIAL RISK MANAGEMENT
The Corporation is primarily exposed to credit risk, liquidity risk and market risk as a result of holding financial instruments.
Credit risk Risk that one party to a financial instrument will cause a financial loss for the other party by failing todischarge an obligation.
Liquidity risk Risk that an entity will encounter difficulty in meeting its obligations associated with financial liabilities.Market risk Risk that the fair value or future cash flows of a financial instrument will fluctuate because of changes in
market prices, whether those changes are caused by factors specific to the individual financial instrumentor its issuer, or factors affecting all similar financial instruments traded in the market. The Corporation isprimarily exposed to foreign exchange risk and interest rate risk.
Credit risk The Corporation is exposed to credit risk through its normal treasury activities on its derivative financial instruments and other investing activities. The Corporation is also exposed to credit risk through its trade receivables arising from its normal commercial activities. Credit exposures arising from lending activities relate primarily to aircraft loans and lease receivables provided to BA customers in connection with the sale of commercial aircraft.
The effective monitoring and controlling of credit risks is a key component of the Corporation’s risk management activities. Credit risks arising from the treasury activities are managed by a central treasury function in accordance with the Corporate Foreign Exchange Risk Management Policy and Corporate Investment Management Policy (the “Policy”). The objective of the policy is to minimize the Corporation’s exposure to credit risk from its treasury activities by ensuring that the Corporation transacts strictly with investment-grade financial institutions and money market funds based on pre-established consolidated counterparty risk limits per financial institution and fund.
Credit risks arising from the Corporation’s normal commercial activities, lending activities and under indirect financing support are managed and controlled by the two reportable segments, BA and BT. The main credit exposure managed by the segments arises from customer credit risk. Customer credit ratings and credit limits are analyzed and established by internal credit specialists, based on inputs from external rating agencies, recognized rating methods and the Corporation’s experience with the customers. The credit risks and credit limits are dynamically reviewed based on fluctuations in the customer’s financial results and payment behaviour.
These customer credit risk assessments and credit limits are critical inputs in determining the conditions under which credit or financing will be offered to customers, including obtaining collateral to reduce the Corporation’s exposure to losses. Specific governance is in place to ensure that financial risks arising from large transactions are analyzed and approved by the appropriate management level before financing or credit support is offered to the customer.
Credit risk is monitored on an ongoing basis using different systems and methodologies depending on the underlying exposure. Various accounting and reporting systems are used to monitor trade receivables, lease receivables and other direct financings.
Maximum exposure to credit risk – The maximum exposures to credit risk for financial instruments is usually equivalent to their carrying value, as presented in Note 13 – Financial instruments, except for the financial instruments in the table below, for which the maximum exposures were as follows, as at:
December 31, 2014 December 31, 2013 January 1, 2013Aircraft loans and lease receivables $ 243 $ 371 $ 392Derivative financial instruments $ 514 $ 690 $ 656Investments in securities $ 295 $ 287 $ 197Investments in financing structures $ 331 $ 305 $ 304
Credit quality – The credit quality, using external and internal credit rating system, of financial assets that are neither past due nor impaired is usually investment grade, except for BA receivables, aircraft loans and lease receivables and certain investments in financing structures. BA receivables are usually not externally or internally quoted, however the credit quality of customers are dynamically reviewed and is based on the Corporation’s

BOMBARDIER INC. FINANCIAL REPORT - FISCAL YEAR ENDED DECEMBER 31, 2014 - NOTES 167
experience with the customers and payment behaviour. The Corporation usually holds underlying assets or security deposits as collateral or letters of credit for the receivables. The Corporation’s customers for aircraft loans and lease receivables are mainly regional airlines with a credit rating below investment grade. The credit quality of the Corporation’s aircraft loans and lease receivables portfolio is strongly correlated to the credit quality of the regional airline industry. The financed aircraft is used as collateral to reduce the Corporation’s exposure to credit risk.
Refer to Note 37 – Commitment and Contingencies for the Corporation’s off-balance sheet credit risk, including credit risk related to support provided for sale of aircraft.
Liquidity riskThe Corporation manages liquidity risk by maintaining detailed cash forecasts, as well as long-term operating and strategic plans. The management of consolidated liquidity requires a constant monitoring of expected cash inflows and outflows, which is achieved through a detailed forecast of the Corporation’s liquidity position, as well as long-term operating and strategic plans, to ensure adequacy and efficient use of cash resources. Liquidity adequacy is continually monitored, taking into consideration historical volatility and seasonal needs, the maturity profile of indebtedness, access to capital markets, the level of customer advances, working capital requirements, the funding of product developments and other financial commitments. The Corporation also monitors any financing opportunities to optimize its capital structure and maintain appropriate financial flexibility. In addition, the Corporation engages in certain working capital financing initiatives such as the sale of receivables, aircraft sale and leaseback transactions and the negotiation of extended payment terms with certain suppliers.
Maturity analysis –The maturity analysis of financial assets and financial liabilities, excluding derivative financial instruments, was as follows, as at December 31, 2014:
Carryingamount
Undiscounted cash flows(before giving effect to the related hedging instruments)
Lessthan 1
year1 to 3years
3 to 5years
5 to 10years
Over 10years
With no specific maturity Total
Cash and cash equivalents $ 2,489 $ 2,489 $ — $ — $ — $ — $ — $ 2,489Trade and other receivables $ 1,538 1,356 54 15 41 4 72 1,542Other financial assets(1) $ 1,330 143 173 98 891 399 60 1,764Assets 3,988 227 113 932 403 132 5,795Trade and other payables $ 4,216 4,179 2 — 7 — 28 4,216Other financial liabilities(1) $ 891 357 134 77 362 561 — 1,491Long-term debt Principal $ 7,683 56 854 1,273 4,796 397 — 7,376 Interest 449 844 735 829 196 — 3,053Liabilities 5,041 1,834 2,085 5,994 1,154 28 16,136Net amount $ (1,053) $ (1,607) $ (1,972) $ (5,062) $ (751) $ 104 $ (10,341)
(1) The carrying amount of other financial assets excludes the carrying amount of derivative financial instruments and the carrying amount of other financial liabilities excludes the carrying amount of derivative financial instruments and the current portion of long-term debt.
Other financial assets include long-term contract receivables. Under the respective agreements, the Corporation will receive incentive payments related to the reliability of manufactured trains. Due to future variations in the relevant index and reassessment of the achievement of the reliability targets, the amounts shown in the table above may vary. Also, termination of a related service contract in case of our non-performance would extinguish our right to future payments.
The Corporation, mainly in BT, negotiated extended payment terms of 240 days after delivery with certain of its suppliers. Trade payables with these extended terms totaled $372 million and bore interest at a weighted average rate of 2% as at December 31, 2014.
Other financial liabilities include government refundable advances. Under the respective agreements, the Corporation is required to pay amounts to governments at the time of the delivery of aircraft. Due to uncertainty about the number of aircraft to be delivered and the timing of delivery of aircraft, the amounts shown in the table above may vary.

168 BOMBARDIER INC. FINANCIAL REPORT - FISCAL YEAR ENDED DECEMBER 31, 2014
The maturity analysis of derivative financial instruments, excluding embedded derivatives, was as follows, as at December 31, 2014:
Nominalvalue (USDequivalent) Undiscounted cash flows (1)
Lessthan 1
year 1 year2 to
3 years3 to
5 yearsOver
5 years TotalDerivative financial assets
Forward foreign exchange contracts $ 8,669 $ 278 $ 47 $ — $ — $ — $ 325Interest-rate derivatives 4,445 114 79 39 18 (24) 226
$ 13,114 $ 392 $ 126 $ 39 $ 18 $ (24) $ 551Derivative financial liabilities
Forward foreign exchange contracts $ 14,156 $ (619) $ (83) $ — $ — $ — $ (702)Interest-rate derivatives 16 (1) — — — — (1)
$ 14,172 $ (620) $ (83) $ — $ — $ — $ (703)Net amount $ (228) $ 43 $ 39 $ 18 $ (24) $ (152)
(1) Amounts denominated in foreign currency are translated at the period end exchange rate.
Market riskForeign exchange risk The Corporation is exposed to significant foreign exchange risks in the ordinary course of business through its international operations, in particular to the canadian dollar, pound sterling, swiss franc and euro. The Corporation employs various strategies, including the use of derivative financial instruments and by matching asset and liability positions, to mitigate these exposures.
The Corporation’s main exposures to foreign currencies are managed by the segments and covered by a central treasury function. Foreign currency exposures are managed in accordance with the Corporation’s Foreign Exchange Risk Management Policy (the “FX Policy”). The objective of the FX Policy is to mitigate the impact of foreign exchange movements on the Corporation’s consolidated financial statements. Under the FX Policy, potential losses from adverse movements in foreign exchange rates should not exceed pre-set limits. Potential loss is defined as the maximum expected loss that could occur if an unhedged foreign currency exposure was exposed to an adverse change of foreign exchange rates over a one-quarter period. The FX Policy also strictly prohibits any speculative foreign exchange transactions that would result in the creation of an exposure in excess of the maximum potential loss approved by the Board of Directors of the Corporation.
Under the FX Policy, it is the responsibility of the segments’ management to identify all actual and potential foreign exchange exposures arising from their operations. This information is communicated to the central treasury group, which has the responsibility to execute the hedge transactions in accordance with the FX Policy.
In order to properly manage their exposures, each segment maintains long-term cash flow forecasts in each currency. BA has adopted a progressive hedging strategy while BT hedges all its identified foreign currency exposures to limit the effect of currency movements on their results. The segments also mitigate foreign currency risks by maximizing transactions in their functional currency for their operations such as material procurement, sale contracts and financing activities.
In addition, the central treasury function manages balance sheet exposures to foreign currency movements by matching asset and liability positions. This program consists mainly in matching the long-term debt in foreign currency with long-term assets denominated in the same currency.
The Corporation mainly uses forward foreign exchange contracts to manage the Corporation’s exposure from transactions in foreign currencies and to synthetically modify the currency of exposure of certain balance sheet items. The Corporation applies hedge accounting for a significant portion of anticipated transactions and firm commitments denominated in foreign currencies, designated as cash flow hedges. Notably, the Corporation enters into forward foreign exchange contracts to reduce the risk of variability of future cash flows resulting from forecasted sales and purchases and firm commitments.
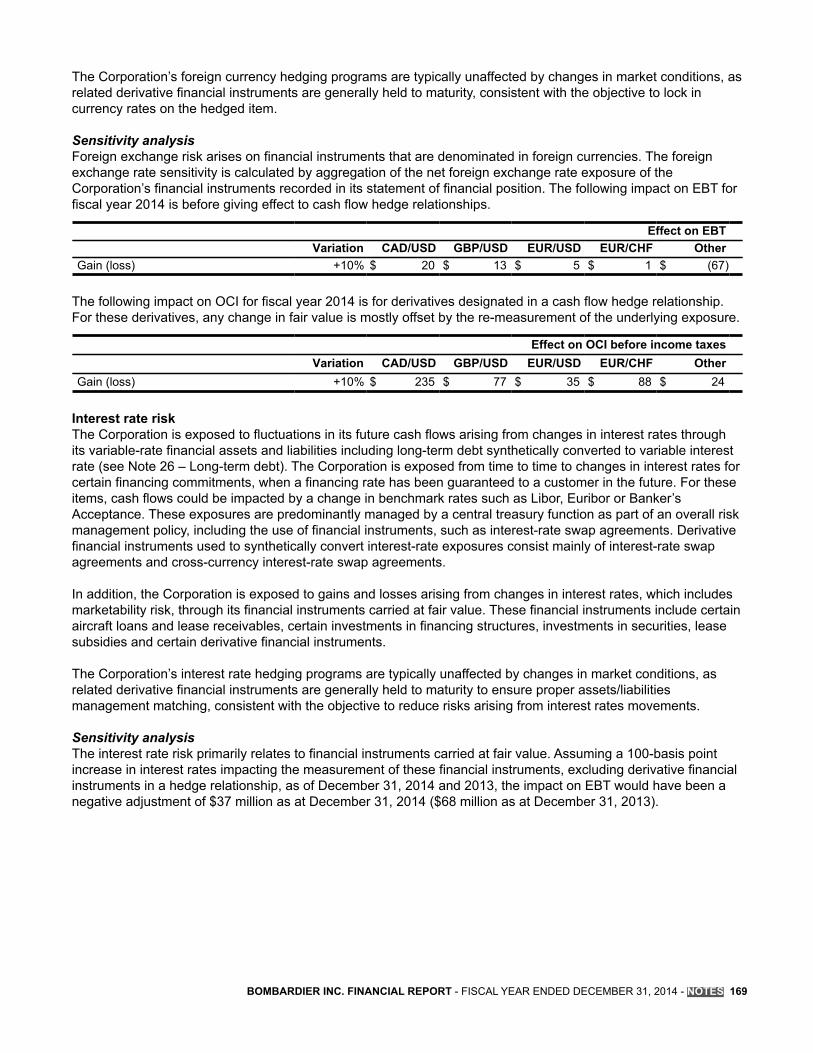
BOMBARDIER INC. FINANCIAL REPORT - FISCAL YEAR ENDED DECEMBER 31, 2014 - NOTES 169
The Corporation’s foreign currency hedging programs are typically unaffected by changes in market conditions, as related derivative financial instruments are generally held to maturity, consistent with the objective to lock in currency rates on the hedged item.
Sensitivity analysis Foreign exchange risk arises on financial instruments that are denominated in foreign currencies. The foreign exchange rate sensitivity is calculated by aggregation of the net foreign exchange rate exposure of the Corporation’s financial instruments recorded in its statement of financial position. The following impact on EBT for fiscal year 2014 is before giving effect to cash flow hedge relationships.
Effect on EBTVariation CAD/USD GBP/USD EUR/USD EUR/CHF Other
Gain (loss) +10% $ 20 $ 13 $ 5 $ 1 $ (67)
The following impact on OCI for fiscal year 2014 is for derivatives designated in a cash flow hedge relationship. For these derivatives, any change in fair value is mostly offset by the re-measurement of the underlying exposure.
Effect on OCI before income taxesVariation CAD/USD GBP/USD EUR/USD EUR/CHF Other
Gain (loss) +10% $ 235 $ 77 $ 35 $ 88 $ 24
Interest rate risk The Corporation is exposed to fluctuations in its future cash flows arising from changes in interest rates through its variable-rate financial assets and liabilities including long-term debt synthetically converted to variable interest rate (see Note 26 – Long-term debt). The Corporation is exposed from time to time to changes in interest rates for certain financing commitments, when a financing rate has been guaranteed to a customer in the future. For these items, cash flows could be impacted by a change in benchmark rates such as Libor, Euribor or Banker’s Acceptance. These exposures are predominantly managed by a central treasury function as part of an overall risk management policy, including the use of financial instruments, such as interest-rate swap agreements. Derivative financial instruments used to synthetically convert interest-rate exposures consist mainly of interest-rate swap agreements and cross-currency interest-rate swap agreements.
In addition, the Corporation is exposed to gains and losses arising from changes in interest rates, which includes marketability risk, through its financial instruments carried at fair value. These financial instruments include certain aircraft loans and lease receivables, certain investments in financing structures, investments in securities, lease subsidies and certain derivative financial instruments.
The Corporation’s interest rate hedging programs are typically unaffected by changes in market conditions, as related derivative financial instruments are generally held to maturity to ensure proper assets/liabilities management matching, consistent with the objective to reduce risks arising from interest rates movements.
Sensitivity analysisThe interest rate risk primarily relates to financial instruments carried at fair value. Assuming a 100-basis point increase in interest rates impacting the measurement of these financial instruments, excluding derivative financial instruments in a hedge relationship, as of December 31, 2014 and 2013, the impact on EBT would have been a negative adjustment of $37 million as at December 31, 2014 ($68 million as at December 31, 2013).

170 BOMBARDIER INC. FINANCIAL REPORT - FISCAL YEAR ENDED DECEMBER 31, 2014
33. FAIR VALUE OF FINANCIAL INSTRUMENTS
Fair value amounts disclosed in these consolidated financial statements represent the Corporation’s estimate of the price at which a financial instrument could be exchanged in a market in an arm's length transaction between knowledgeable, willing parties who are under no compulsion to act. They are point-in-time estimates that may change in subsequent reporting periods due to market conditions or other factors. Fair value is determined by reference to quoted prices in the principal market for that instrument to which the Corporation has immediate access. However, there is no active market for most of the Corporation’s financial instruments. In the absence of an active market, the Corporation determines fair value based on internal or external valuation models, such as stochastic models, option-pricing models and discounted cash flow models. Fair value determined using valuation models requires the use of assumptions concerning the amount and timing of estimated future cash flows, discount rates, the creditworthiness of the borrower, the aircraft’s expected future value, default probability, generic industrial bond spreads and marketability risk. In determining these assumptions, the Corporation uses primarily external, readily observable market inputs, including factors such as interest rates, credit ratings, credit spreads, default probabilities, currency rates, and price and rate volatilities, as applicable. Assumptions or inputs that are not based on observable market data are used when external data are unavailable. These calculations represent management’s best estimates. Since they are based on estimates, the fair values may not be realized in an actual sale or immediate settlement of the instruments.
Methods and assumptionsThe methods and assumptions used to measure fair value for items recorded at FVTP&L and AFS are as follows:
Aircraft loans and lease receivables and investments in financing structures – The Corporation uses an internal valuation model based on stochastic simulations and discounted cash flow analysis to estimate fair value. Fair value is calculated using market data for interest rates, published credit ratings when available, yield curves and default probabilities. The Corporation uses market data to determine the marketability adjustments and also uses internal assumptions to take into account factors that market participants would consider when pricing these financial assets. The Corporation also uses internal assumptions to determine the credit risk of customers without published credit rating. In addition, the Corporation uses aircraft residual value curves reflecting specific factors of the current aircraft market and a balanced market in the medium and long term.
Investments in securities – The Corporation uses discounted cash flow models to estimate the fair value of unquoted investments in fixed-income securities, using market data such as interest-rate.
Lease subsidies – The Corporation uses an internal valuation model based on stochastic simulations to estimate fair value of lease subsidies incurred in connection with the sale of commercial aircraft. Fair value is calculated using market data for interest rates, published credit ratings when available, default probabilities from rating agencies and the Corporation’s credit spread. The Corporation also uses internal assumptions to determine the credit risk of customers without published credit rating.
Derivative financial instruments – Fair value of derivative financial instruments generally reflects the estimated amounts that the Corporation would receive to sell favourable contracts i.e. taking into consideration the counterparty credit risk, or pays to transfer unfavourable contracts i.e. taking into consideration the Corporation’s credit risk, at the reporting dates. The Corporation uses discounted cash flow analyses and market data such as interest rates, credit spreads and foreign exchange spot rate to estimate the fair value of forward agreements and interest-rate derivatives.
The Corporation uses an option-adjusted spread model and a discounted cash flow model to estimate the fair value of call features on long-term debt, using market data such as interest-rate swap curves and external quotations.

BOMBARDIER INC. FINANCIAL REPORT - FISCAL YEAR ENDED DECEMBER 31, 2014 - NOTES 171
The methods and assumptions used to measure fair value for items recorded at amortized cost are as follows:
Financial instruments whose carrying value approximates fair value – The fair values of trade and other receivables, certain aircraft loans and lease receivables, certain investments in securities, certain investments in financing structures, restricted cash, trade and other payables, and sales and leaseback obligations measured at amortized cost, approximate their carrying value due to the short-term maturities of these instruments, because they bear variable interest-rate or because the terms and conditions are comparable to current market terms and conditions for similar items.
Long-term contract receivables – The Corporation uses discounted cash flow analyses to estimate the fair value using market data for interest rates.
Long-term debt – The fair value of long-term debt is estimated using public quotations, when available, or discounted cash flow analyses, based on the current corresponding borrowing rate for similar types of borrowing arrangements.
Government refundable advances and vendor non-recurring costs – The Corporation uses discounted cash flow analyses to estimate the fair value using market data for interest rates and credit spreads.
Fair value hierarchy The following tables present financial assets and financial liabilities measured at fair value on a recurring basis categorized using the fair value hierarchy as follows:• quoted prices (unadjusted) in active markets for identical assets or liabilities (Level 1);• inputs from observable markets other than quoted prices included in Level 1, including indirectly observable
data (Level 2); and• inputs for the asset or liability that are not based on observable market data (Level 3).
Assessing the significance of a particular input to the fair value measurement in its entirety requires judgment. The fair value of financial assets and liabilities by level of hierarchy was as follows, as at December 31, 2014:
Total Level 1 Level 2 Level 3Financial assetsAircraft loans and lease receivables $ 263 $ — $ — $ 263Derivative financial instruments(1) 528 — 528 —Investments in securities 317 (2) 38 279 —Investments in financing structures 315 — 150 165
$ 1,423 $ 38 $ 957 $ 428Financial liabilitiesTrade and other payables $ (18) $ — $ — $ (18)Lease subsidies (172) — — (172)Derivative financial instruments(1) (665) — (665) —
$ (855) $ — $ (665) $ (190)(1) Derivative financial instruments consist of forward foreign exchange contracts, interest-rate swap agreements and embedded derivatives.(2) Excludes $13 million of AFS investments carried at cost.

172 BOMBARDIER INC. FINANCIAL REPORT - FISCAL YEAR ENDED DECEMBER 31, 2014
Changes in the fair value of Level 3 financial instruments were as follows, for fiscal years 2014 and 2013:
Aircraft loansand lease
receivables
Investmentsin financing
structures
Trade andother
payablesLease
subsidiesBalance as at January 1, 2013 $ 412 $ 135 $ — $ (158)
Net gains (losses) and interest included in net income(1) 3 2 — (18)Issuances 8 — — 1Settlements (35) (2) — 33
Balance as at December 31, 2013 388 135 — (142)Net gains (losses) and interest included in net income(1) 20 32 — (19)Issuances 3 — (18) (38)Settlements (148) (2) — 27
Balance as at December 31, 2014 $ 263 $ 165 $ (18) $ (172)(1) Of which an amount of $2 million represents realized losses for fiscal year 2014 ($5 million represents realized gains for fiscal year 2013).
Main assumptions developed internally for Level 3 hierarchyWhen measuring Level 3 financial instruments at fair value, some assumptions are not derived from an observable market. The main assumptions developed internally relate to credit risks of customers without published credit rating and marketability adjustments to discount rates specific to our financial assets.
These main assumptions are as follows as at December 31, 2014:
Main assumptions (weighted average)
Aircraft loans andlease receivables
Investments in financingstructures Lease subsidies
Internally assigned credit rating Between BB to C (B) Between BB- to CCC+ (B+) Between BB- to CCC (B+)Discount rate adjustments
for marketability Between 3.17%
and 5.29% (5.07%)Between 1.59%
and 7.40% (5.78%) n/a
Also, aircraft residual value curves are important inputs in assessing the fair value of certain financial instruments. These curves are prepared by management based on information obtained from external appraisals and reflect specific factors of the current aircraft market and a balanced market in the medium and long term.
Sensitivity to selected changes of assumptions for Level 3 hierarchyThese assumptions, not derived from an observable market, are established by management using estimates and judgments that can have a significant effect on revenues, expenses, assets and liabilities. Changing one or more of these assumptions to other reasonably possible alternative assumptions, for which the impact on their fair value would be significant, would change their fair value as follows as at December 31, 2014:
Impact on EBT Change of assumptions
Gain (loss)
Change in fair valuerecognized in EBT for
fiscal year 2014
Decrease in aircraftresidual value curves by 5%
Downgrade the internally assigned
credit rating of unrated customers
by 1 notch
Increase the marketability
adjustments by 100 bps
Aircraft loans andlease receivables $ (6) $ (4) $ (11) $ (15)
Investment in financingstructures $ 21 $ (4) $ (11) $ (11)
Lease subsidies $ (14) n/a $ 3 n/a
n/a: Not applicable

BOMBARDIER INC. FINANCIAL REPORT - FISCAL YEAR ENDED DECEMBER 31, 2014 - NOTES 173
Fair value hierarchy for items recorded at amortized costThe following tables present financial assets and financial liabilities measured at amortized cost on a non-recurring basis categorized using the fair value hierarchy as follows:• quoted prices (unadjusted) in active markets for identical assets or liabilities (Level 1);• inputs from observable markets other than quoted prices included in Level 1, including indirectly observable
data (Level 2); and• inputs for the asset or liability that are not based on observable market data (Level 3).
The fair value of financial assets and liabilities by level of hierarchy was as follows, as at December 31, 2014:
Total Level 1 Level 2 Level 3Financial assetsTrade and other receivables $ 1,538 $ — $ — $ 1,538Other financial assets Investments in financing structures 45 — — 45 Other 388 — — 388
$ 1,971 $ — $ — $ 1,971Financial liabilitiesTrade and other payables $ (4,198) $ — $ — $ (4,198)Long-term debt (7,692) — (7,692) —Other financial liabilities Government refundable advances (456) — — (456) Other (362) — — (362)
$ (12,708) $ — $ (7,692) $ (5,016)
34. INVESTMENTS IN JOINT VENTURES AND ASSOCIATES
In the normal course of business, the Corporation carries out a portion of its businesses through joint ventures and associates, mainly in BT, none of which are individually material.
The Corporation’s aggregate pro rata shares of net income of joint ventures and associates, were as follows, for fiscal years:
2014 2013Joint ventures $ 72 $ 91Associates 17 28Net income $ 89 $ 119
The Corporation has pledged shares in associates, with a carrying value of $18 million as at December 31, 2014 ($12 million as at December 31, 2013 and $60 million as at January 1, 2013).

174 BOMBARDIER INC. FINANCIAL REPORT - FISCAL YEAR ENDED DECEMBER 31, 2014
35. TRANSACTIONS WITH RELATED PARTIES
The Corporation’s related parties are its joint ventures, associates and key management personnel.
Joint ventures and associatesThe Corporation buys and sells products and services on arm’s length terms with some of its joint ventures and associates in the ordinary course of business. The following table presents the portion of these transactions that is attributable to the interests of the other venturers, and transaction with associates, for fiscal years:
2014 2013Joint ventures Associates Joint ventures Associates
Sales of products and services, and other income $ 128 $ — $ 161 $ 33Purchase of products and services, and other expenses $ 109 $ 6 $ 41 $ 49
The following table presents the Corporation’s outstanding balances with joint ventures and associates, as at:
December 31, 2014 December 31, 2013 January 1, 2013Joint ventures Associates Joint ventures Associates Joint ventures Associates
Receivables $ 39 $ 5 $ 62 $ 1 $ 147 $ 26Payables $ 6 $ 6 $ 14 $ 10 $ 8 $ 28
Compensation paid to key management personnelThe annual remuneration and related compensation costs of the executive and non-executive board members and key Corporate management, defined as the President and Chief Executive Officer of Bombardier Inc., the Presidents and Chief Operating Officers of BA and BT, and the Senior Vice Presidents of Bombardier Inc., were as follows, for fiscal years:
2014 2013Share-based benefits $ 11 $ 13Salaries, bonuses and other short-term benefits 11 13Retirement benefits 4 5Other long-term benefits 1 2
$ 27 $ 33

BOMBARDIER INC. FINANCIAL REPORT - FISCAL YEAR ENDED DECEMBER 31, 2014 - NOTES 175
36. UNCONSOLIDATED STRUCTURED ENTITIES
The following table presents the assets and liabilities of unconsolidated structured entities in which the Corporation had a significant exposure, as at:
December 31, 2014 December 31, 2013 January 1, 2013Assets Liabilities Assets Liabilities Assets Liabilities
Financing structures related to the sale of commercial aircraft $ 7,380 $ 4,796 $ 7,965 $ 5,452 $ 8,881 $ 6,294
The Corporation has provided credit and/or residual value guarantees to certain structured entities created solely to provide financing related to the sale of commercial aircraft.
Typically, these structured entities are financed by third-party long-term debt and by third-party equity investors who benefit from tax incentives. The aircraft serve as collateral for the structured entities long-term debt. The Corporation retains certain interests in the form of credit and residual value guarantees, subordinated debt and residual interests. Residual value guarantees typically cover a percentage of the first loss from a guaranteed value upon the sale of the underlying aircraft at an agreed upon date. The Corporation also provides administrative services to certain of these structured entities in return for a market fee.
The Corporation’s maximum potential exposure was $1.8 billion, of which $295 million was recorded as provisions and related liabilities as at December 31, 2014 ($1.8 billion and $291 million, respectively, as at December 31, 2013 and $1.9 billion and $352 million, respectively, as at January 1, 2013). The Corporation’s maximum exposure under these guarantees is included in Note 37 – Commitments and contingencies.
The Corporation concluded that it did not control these structured entities.

176 BOMBARDIER INC. FINANCIAL REPORT - FISCAL YEAR ENDED DECEMBER 31, 2014
37. COMMITMENTS AND CONTINGENCIES
The Corporation enters into various sale support arrangements, including credit and residual value guarantees and financing rate commitments, mostly provided in connection with sales of commercial aircraft and related financing commitments. The Corporation is also subject to other off-balance sheet risks described in the following table. These off-balance sheet risks are in addition to the commitments and contingencies described elsewhere in these consolidated financial statements. Some of these off-balance sheet risks are also included in Note 36 – Unconsolidated special purposes entities. The maximum potential exposure does not reflect payments expected to be made by the Corporation.
The table below presents the maximum potential exposure for each major group of exposure, as at:
December 31, 2014 December 31, 2013 January 1, 2013Aircraft sales
Residual value (a) $ 1,749 $ 1,828 $ 1,812Credit (a) 1,275 1,297 1,218Mutually exclusive exposure(1) (628) (639) (594)Total credit and residual value exposure $ 2,396 $ 2,486 $ 2,436Trade-in commitments (b) $ 2,696 $ 3,416 $ 3,098Conditional repurchase obligations (c) $ 204 $ 472 $ 489
Other(2)
Credit (d) $ 48 $ 48 $ 47Performance guarantees (e) $ 38 $ 43 $ 41
(1) Some of the residual value guarantees can only be exercised once the credit guarantees have expired without exercise. Therefore, the guarantees must not be added together to calculate the combined maximum exposure for the Corporation.
(2) The Corporation has also provided other guarantees (see section f) below).
The Corporation’s maximum exposure in connection with credit and residual value guarantees related to the sale of aircraft represents the face value of the guarantees before giving effect to the net benefit expected from the estimated value of the aircraft and other assets available to mitigate the Corporation’s exposure under these guarantees. Provisions for anticipated losses amounting to $456 million as at December 31, 2014 ($463 million as at December 31, 2013 and $483 million as at January 1, 2013) have been established to cover the risks from these guarantees after considering the effect of the estimated resale value of the aircraft, which is based on information obtained from external appraisals and reflect specific factors of the current aircraft market and a balance market in the medium and long-term, and the anticipated proceeds from other assets covering such exposures. In addition, lease subsidies, which would be extinguished in the event of credit default by certain customers, amounted to $172 million as at December 31, 2014 ($142 million as at December 31, 2013 and $158 million as at January 1, 2013). The provisions for anticipated losses are expected to cover the Corporation’s total credit and residual value exposure, after taking into account the anticipated proceeds from the sale of underlying aircraft and the extinguishment of certain lease subsidies obligations.
Aircraft sales
a) Credit and residual value guarantees - The Corporation has provided credit guarantees in the form of lease and loan payment guarantees, as well as services related to the remarketing of aircraft. These guarantees, which are mainly issued for the benefit of providers of financing to customers, mature in different periods up to 2025. Substantially all financial support involving potential credit risk lies with regional airline customers. The credit risk relating to three regional airline customers accounted for 71% of the total maximum credit risk as at December 31, 2014 (70% as at December 31, 2013 and 67% as at January 1, 2013).
In addition, the Corporation may provide a guarantee for the residual value of aircraft at an agreed-upon date, generally at the expiry date of related financing and lease arrangements. The arrangements generally include operating restrictions such as maximum usage and minimum maintenance requirements. The guarantee provides for a contractually limited payment to the guaranteed party, which is typically a percentage of the first loss from a guaranteed value. In most circumstances, a claim under such guarantees may be made only upon resale of the underlying aircraft to a third party.

BOMBARDIER INC. FINANCIAL REPORT - FISCAL YEAR ENDED DECEMBER 31, 2014 - NOTES 177
The following table summarizes the outstanding residual value guarantees, at the earliest exercisable date, and the period in which they can be exercised, as at:
December 31, 2014 December 31, 2013 January 1, 2013Less than 1 year $ 56 $ 64 $ 41From 1 to 5 years 777 860 850From 5 to 10 years 880 872 855From 10 to 15 years 36 32 66
$ 1,749 $ 1,828 $ 1,812
b) Trade-in commitments - In connection with the signing of firm orders for the sale of new aircraft, the Corporation enters into specified-price trade-in commitments with certain customers. These commitments give customers the right to trade-in their pre-owned aircraft as partial payment for the new aircraft purchased.
The Corporation’s trade-in commitments were as follows, as at:
December 31, 2014 December 31, 2013 January 1, 2013Less than 1 year $ 687 $ 1,452 $ 865From 1 to 3 years 627 355 869Thereafter 1,382 1,609 1,364
$ 2,696 $ 3,416 $ 3,098
c) Conditional repurchase obligations - In connection with the sale of new aircraft, the Corporation enters into conditional repurchase obligations with certain customers. Under these obligations, the Corporation agrees to repurchase the initial aircraft at predetermined prices, during predetermined periods or at predetermined dates, conditional upon mutually acceptable agreement for the sale of a new aircraft. At the time the Corporation enters into an agreement for the sale of a subsequent aircraft and the customer exercises its right to partially pay for the subsequent aircraft by trading-in the initial aircraft to the Corporation, a conditional repurchase obligation is accounted for as a trade-in commitment.
The Corporation’s conditional repurchase obligations, as at the earliest exercise date, were as follows, as at:
December 31, 2014 December 31, 2013 January 1, 2013Less than 1 year $ 195 $ 378 $ 248From 1 to 3 years 9 94 232Thereafter — — 9
$ 204 $ 472 $ 489
Other guarantees
d) Credit and residual value guarantees - In connection with the sale of certain transportation rail equipment, the Corporation has provided a credit guarantee of lease payments amounting to $48 million as at December 31, 2014 ($48 million as at December 2013 and $47 million as at January 1, 2013). This guarantee matures in 2025.
e) Performance guarantees - In certain projects carried out through consortia or other partnership vehicles in BT, partners may be jointly and severally liable to the customer for a default by the other partners. In such cases partners would normally provide counter indemnities to each other. These obligations and guarantees typically extend until final product acceptance by the customer and in some cases to the warranty period.
The Corporation’s maximum net exposure to projects for which the exposure of the Corporation is capped, amounted to $38 million as at December 31, 2014 ($43 million as at December 31, 2013 and $41 million as at January 1, 2013), assuming all counter indemnities are fully honoured. For projects where the Corporation’s exposure is not capped, such exposure has been determined in relation to the Corporation’s partners’ share of the total contract value. Under this methodology, the Corporation’s net exposure is not significant, assuming all counter indemnities are fully honoured. Such joint and several obligations and guarantees have been rarely called upon in the past.

178 BOMBARDIER INC. FINANCIAL REPORT - FISCAL YEAR ENDED DECEMBER 31, 2014
f) Other - In the normal course of its business, the Corporation has entered into agreements that include indemnities in favour of third parties, mostly tax indemnities. These agreements generally do not contain specified limits on the Corporation’s liability and therefore, it is not possible to estimate the Corporation’s maximum liability under these indemnities.
Operating leasesThe Corporation leases buildings and equipment and assumes aircraft operating lease obligations in connection with the sale of new aircraft. Future minimum lease payments, mostly related to buildings and equipment, under non-cancellable operating leases are due as follows, as at:
December 31, 2014 December 31, 2013 January 1, 2013Within 1 year $ 165 $ 161 $ 130Between 1 to 5 years 438 413 247More than 5 years 512 504 266
$ 1,115 $ 1,078 $ 643
Rent expense was $175 million for fiscal year 2014 ($174 million for fiscal year 2013).
Other commitmentsThe Corporation also has purchase obligations, under various agreements, made in the normal course of business. The purchase obligations are as follows, as at:
December 31, 2014 December 31, 2013 January 1, 2013Within 1 year $ 7,061 $ 8,026 $ 7,062Between 1 to 5 years 4,141 3,667 3,943More than 5 years 233 207 361
$ 11,435 $ 11,900 $ 11,366
The purchase obligations of the Corporation include capital commitments for the purchase of PP&E and intangible assets amounting to $196 million and $432 million, respectively, as at December 31, 2014 ($331 million and $435 million as at December 31, 2013 and $292 million and $356 million as at January 1, 2013).
LitigationIn the normal course of operations, the Corporation is a defendant in certain legal proceedings currently pending before various courts in relation to product liability and contract disputes with customers and other third parties. The Corporation intends to vigorously defend its position in these matters.
While the Corporation cannot predict the final outcome of all legal proceedings pending as at December 31, 2014, based on information currently available, management believes that the resolution of these legal proceedings will not have a material adverse effect on its financial position.
S-Bahn claim
On March 4, 2013, S-Bahn Berlin GMBH (“SB”) filed a claim against Bombardier Transportation GmbH, a wholly owned subsidiary of the Corporation, in the Berlin District Court (“Landgericht Berlin”), concerning the trains of the 481 Series delivered to SB between 1996 and 2004.
This lawsuit alleges damages of an aggregate value of €348 million ($423 million) related to allegedly defective wheels and braking systems. The claim is for payment of €241 million ($293 million) and also for a declaratory judgment obliging the Corporation to compensate SB for further damages. SB currently alleges such further damages to be €107 million ($130 million).
It is the Corporation’s position that this claim i) is filed in absence of any defect, ii) is not founded on any enforceable warranty, iii) is filed after the expiry of any statute of limitations and iv) is based on inapplicable standards. The lawsuit contains allegations against the Corporation which the Corporation rejects as unfounded and defamatory.

BOMBARDIER INC. FINANCIAL REPORT - FISCAL YEAR ENDED DECEMBER 31, 2014 - NOTES 179
The Corporation intends to vigorously defend its position and will undertake all actions necessary to protect its reputation.
Investigation in Brazil
On March 20, 2014, Bombardier Transportation Brasil Ltda (“BT Brazil”), a wholly owned subsidiary of the Corporation, received notice that it was among the 18 companies and over 100 individuals named in administrative proceedings initiated by governmental authorities in Brazil, including the Administrative Council for Economic Protection (“CADE”), and the Sao Paulo Public Prosecutor’s office, following previously disclosed investigations carried on by such governmental authorities with respect to allegations of cartel activity in the public procurement of railway equipment and the construction and maintenance of railway lines in Sao Paulo and other areas.
Companies found to have engaged in unlawful cartel conduct are subject to administrative fines, state actions for repayment of overcharges and potentially disqualification for a certain period. The Corporation and BT Brazil continue to cooperate with investigations relating to the administrative proceedings and intend to defend themselves vigorously.
38. RECLASSIFICATION
Certain comparative figures have been reclassified to conform to the presentation adopted in the current period, mainly a reclassification from current other assets to non-current other assets.

180 BOMBARDIER INC. FINANCIAL REPORT - FISCAL YEAR ENDED DECEMBER 31, 2014
INVESTOR INFORMATIONOur performance at a glance
STOCK EXCHANGE LISTINGSClass A and Class B shares Toronto (Canada)Preferred shares, Series 2, Series 3 and Series 4 Toronto (Canada)
Stock listing ticker BBD (Toronto)
FISCAL YEAR 2015 FINANCIAL RESULTSFirst quarterly report May 7, 2015Second quarterly report July 30, 2015Third quarterly report October 29, 2015Financial report, 2015 year-end February 11, 2016
(1) The fiscal year ended December 31, 2011 comprises 11 months of BA’s results and 12 months of BT’s results.(2) Some totals do not agree due to rounding. (3) Non-GAAP financial measure. Refer to the Non-GAAP financial measures section in the MD&A for a definition of this measure.

BOMBARDIER INC FINANCIAL REPORT - FISCAL YEAR ENDED DECEMBER 31, 2014 - INVESTOR INFORMATION 181
DIVIDENDS PER SHARE DECLARED IN 2014 ON AN ANNUAL BASISPreferred Shares
Class A(1) Class B(1) Series 2 Series 3 Series 4Dividends declared in 2014(in Canadian dollars) $0.10 $0.10 $0.75 $0.78 $1.56Yields(2) 2.4% 2.4% 6.3% 6.6% 7.1%
(1) Dividends on Common shares (Class A and Class B) have been suspended until further notice.(2) Based on dividends declared in 2014 and share prices as at December 31, 2014.
PREFERRED DIVIDEND PAYMENT DATESPayment subject to approval by the Board of Directors
Series 2Record date Payment date Record date Payment date2014-12-31 2015-01-15 2015-06-30 2015-07-152015-01-30 2015-02-15 2015-07-31 2015-08-152015-02-27 2015-03-15 2015-08-31 2015-09-152015-03-31 2015-04-15 2015-09-30 2015-10-152015-04-30 2015-05-15 2015-10-30 2015-11-152015-05-29 2015-06-15 2015-11-30 2015-12-15
PREFERRED DIVIDEND PAYMENT DATESPayment subject to approval by the Board of Directors
Series 3 Series 4Record date Payment date Record date Payment date2015-01-16 2015-01-31 2015-01-16 2015-01-312015-04-17 2015-04-30 2015-04-17 2015-04-302015-07-17 2015-07-31 2015-07-17 2015-07-312015-10-16 2015-10-31 2015-10-16 2015-10-31
Please note that unless stated otherwise, all dividends paid by Bombardier since January 2006 on all of its common and preferred shares are considered “eligible dividends” as per the Canadian Income Tax Act and any corresponding provincial or territorial legislation. The same designation applies under the Quebec Taxation Act for dividends declared after March 23, 2006.

182 BOMBARDIER INC. FINANCIAL REPORT - FISCAL YEAR ENDED DECEMBER 31, 2014
SHAREHOLDERSIf you wish to obtain a copy of this Financial Report, or other corporate documents, we encourage you to download them from our website at www.bombardier.com, which provides practical, timely and environmentally friendly access. You can, however, order paper copies from our website or by contacting:
Bombardier Inc. Public Affairs800 René-Lévesque Blvd. WestMontréal, QuébecCanada H3B 1Y8Tel.: +1 514 861 9481, extension 13390Fax: +1 514 861 2420
INVESTORSBombardier Inc., Investor Relations800 René-Lévesque Blvd. WestMontréal, QuébecCanada H3B 1Y8Tel.: +1 514 861 9481, extension 13273Fax: +1 514 861 2420Email: [email protected]
DUPLICATIONAlthough Bombardier strives to ensure that registered shareholders receive only one copy of corporate documents, duplication is unavoidable if securities are registered under different names and addresses. If this is the case, please call Computershare Investor Services at one of the following numbers: +1 514 982 7555 or +1 800 564 6253 (toll-free, North America only) or send an email to [email protected].
ONLINE INFORMATIONFor additional information, we invite you to visit our websites at:bombardier.comandir.bombardier.com
TRANSFER AGENT AND REGISTRARShareholders with inquiriesconcerning their shares shouldcontact:
Computershare Investor Services Inc.100 University Avenue, 8th FloorToronto, OntarioCanada M5J 2Y1or1500 University Street, Suite 700Montréal, QuébecCanada H3A 3S8Tel.: +1 514 982 7555 or +1 800 564 6253(toll-free, North America only)Fax: +1 416 263 9394 or +1 888 453 0330(toll-free, North America only)Email: [email protected]
AUDITORSErnst & Young LLP800 René-Lévesque Blvd. WestMontréal, QuébecCanada H3B 1X9
ANNUAL MEETINGThe annual meeting of shareholders will be held on Thursday, May 7, 2015, at 9:30 a.m. at the following address:
La PlazaAmbassadeur Room420, Sherbrooke Street WestMontréal, Québec, Canada H3A 1B4
The annual meeting will also be broadcast live on our website at bombardier.com.

BOMBARDIER.COM