2014 florida county profiles baybay - · pdf file2014 florida county profiles . 25.8%....
TRANSCRIPT

2014 Florida County Profiles
Adult Day Care Facilities 0 Capacity 0
Grandparents (60+) Total 60+ Living With Own Grandchildren (Under Age 18)
1,232
Grandparent Responsible for Own Grandchildren (Under Age 18)
619
Grandparent Not Responsible for Own Grandchildren (Under Age 18)
613
60+ Not Living With Own Grandchildren (Under Age 18)
35,795
Skilled Nursing Facility Utilization
SNF Beds 974 Community Beds 854 Sheltered Beds 0 Veterans Administration Beds 120 Other Beds 0
SNFs With Beds 9 Community Beds 8 Sheltered Beds 0 Veterans Administration Beds 1 Other Beds 0
SNFs With Community Beds 8 Community Bed Days 311,710 Community Patient Days 279,335 Medicaid Patient Days 185,987 Occupancy Rate 89.6% Percent Medicaid 66.6%
Adult Family Care Homes Homes 0 Beds 0
Home Health Agencies Agencies 15
Medicaid Certified Agencies 7
Medicare Certified Agencies 9
Homemaker & Companion Service Companies
Companies 6
Ambulatory Surgical Centers Facilities 6 Operating Rooms Recovery Beds
14 51
Population by Age Category All Ages 170,781 100.0% Under 60 133,755 78.3% 60+ 37,026 21.7% 65+ 26,795 15.7% 70+ 18,121 10.6% 75+ 11,715 6.9% 80+ 7,041 4.1% 85+ 3,305 1.9%
Population by Race (60+) White 33,563 90.6% Non-White 3,574 9.7% Black 2,687 7.3% Other Minorities 887 2.4%
Population by Ethnicity (60+) Total Hispanic 681 1.8% White 600 1.6% Non-White 81 0.2% Total Non-Hispanic 36,345 98.2% Total Minorities1 4,063 11.0%
Population by Gender (60+) Population 60+ 37,026 21.7%
Male 17,061 46.1% Female 19,965 53.9%
Financial Status (60+, % 60+)
Below Poverty Guideline 3,460 9.3%
Below 125% of Poverty Guideline
4,998 13.5%
Minorities Below Poverty Guideline
690 1.9%
Minorities Below 125% of Poverty Guideline
904 2.4%
Medically Underserved (65+) Total Medically Underserved 16,557
Medically Underserved Populations - Living in Areas Defined as Having Medically Underserved Populations
0
Medically Underserved Areas - Living in Medically Underserved Areas
16,557
Living Situation (60+)
Living Alone 9,379
Male 3,024 Female 6,355
BayBay
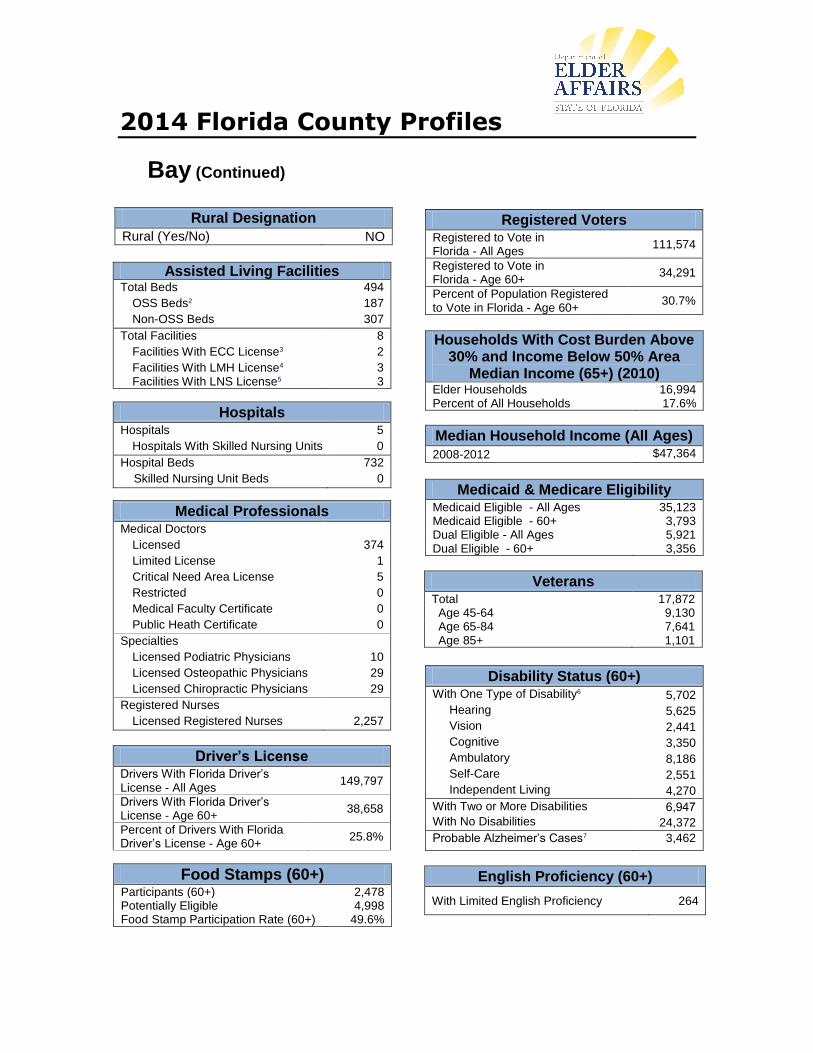
2014 Florida County Profiles
Assisted Living Facilities Total Beds 494
OSS Beds2 187
Non-OSS Beds 307
Total Facilities 8
Facilities With ECC License3 2
Facilities With LMH License4 Facilities With LNS License5
3 3
Hospitals Hospitals 5
Hospitals With Skilled Nursing Units 0
Hospital Beds 732
Skilled Nursing Unit Beds 0
Medical Professionals Medical Doctors
Licensed 374
Limited License 1
Critical Need Area License 5
Restricted 0
Medical Faculty Certificate 0
Public Heath Certificate 0
Specialties
Licensed Podiatric Physicians 10
Licensed Osteopathic Physicians 29
Licensed Chiropractic Physicians 29
Registered Nurses
Licensed Registered Nurses 2,257
Driver’s License Drivers With Florida Driver’s License - All Ages
149,797
Drivers With Florida Driver’s License - Age 60+
38,658
Percent of Drivers With Florida Driver’s License - Age 60+
25.8%
Registered Voters Registered to Vote in Florida - All Ages
111,574
Registered to Vote in Florida - Age 60+
34,291
Percent of Population Registered to Vote in Florida - Age 60+
30.7%
Food Stamps (60+) Participants (60+) 2,478 Potentially Eligible 4,998 Food Stamp Participation Rate (60+) 49.6%
Rural Designation
Rural (Yes/No) NO
Veterans Total 17,872 Age 45-64 9,130 Age 65-84 7,641 Age 85+ 1,101
Median Household Income (All Ages)
2008-2012 $47,364
Households With Cost Burden Above 30% and Income Below 50% Area
Median Income (65+) (2010) Elder Households 16,994 Percent of All Households 17.6%
Medicaid & Medicare Eligibility Medicaid Eligible - All Ages 35,123 Medicaid Eligible - 60+ 3,793 Dual Eligible - All Ages 5,921 Dual Eligible - 60+ 3,356
Disability Status (60+) With One Type of Disability6 5,702
Hearing 5,625
Vision 2,441
Cognitive 3,350
Ambulatory 8,186
Self-Care 2,551
Independent Living 4,270
With Two or More Disabilities 6,947
With No Disabilities 24,372
Probable Alzheimer’s Cases7 3,462
English Proficiency (60+)
With Limited English Proficiency 264
Bay (Continued)

2014 Florida County Profiles
Useful Websites
County Chronic Disease Profile (Bay) Florida Housing Data Clearinghouse (Bay) Behavioral Risk Factors (BRFSS) (Bay)
Cost of Living Annual Expenses8
Single Elders
Owner without Mortgage $20,532 Renter, one bedroom $24,744 Owner with Mortgage $29,532
Elder Couple
Owner without Mortgage $33,144 Renter, one bedroom $37,356 Owner with Mortgage $42,144
Note: Wider Opportunities for Women Elder Economic Security Standard™ Index (Elder Index) measures how much income retired older adults require to meet their basic needs—without public or private assistance. The Elder Index measures basic expenses for elders age 65+ living in the community, not in institutions.
Bay (Continued)

2014 Florida County Profiles
1 Total Minorities = (60+ Population) – (White Non-Hispanic 60+)
2 OSS beds: Optional State Supplementation beds
3 ECC License: Extended Congregate Care License
4 LMH License: Limited Mental Health License
5 LNS License: Limited Nursing Services License
6 With One Type of Disability: 60+ people who have only one type of disability
7 Probable Alzheimer’s Cases = (65-74 Population x 0.0336) + (75-84 Population x 0.1767) + (85+ Population x
0.4441)
8 Annual expenses include: housing, including utilities, taxes, insurance; food; transportation; health care, based
on good health; and miscellaneous.
Sources
Population: Florida Population by County, Age, Race, Ethnicity and Gender provided by Florida Legislature, Office of Economic
and Demographic Research
Financial Status & Living Situation: Department of Elder Affairs calculations based on Florida Population data and 2008-2012 American Community Survey
Medically Underserved Population: Florida Department of Health and U.S. Department of Health and Human Services
Grandparents: Department of Elder Affairs calculations based on Florida Population data and 2008-2012 American Community
Survey, Special Tabulation on Aging
Skilled Nursing Facility Utilization, Adult Day Care, Adult Family Care Home, Ambulatory Surgical Centers, Assisted Living
Facilities, Home Health Agencies, Homemakers & Companion Service Companies, Hospitals: Florida Agency for Health Care Administration
Rural Designation: Based on the definition of Rural Designation by Rural Economic Development Initiative
Medical Professionals: Florida Department of Health
Driver’s License: Florida Department of Highway Safety & Motor Vehicles
Food Stamps: Florida Department of Children and Families
Registered Voters: Florida Department of State
Households with Cost Burden Above 30% and income below 50% Area Median Income: The Shimberg Center for Housing Studies
Median Household Incomes: U.S. Census Bureau: State and County QuickFacts
Medicaid & Medicare Eligibility and Medicaid Eligibility: Florida Agency for Health Care Administration
Veterans Demographics: Florida Department of Veterans' Affairs
Disability Status: Department of Elder Affairs calculations based on Florida Population data and 2008-2012 American Community Survey Data
Probable Alzheimer’s Cases: Department of Elder Affairs calculations based on Florida Population data and Alzheimer’s by Age
in 2014 Alzheimer’s Disease Facts and Figures report, retrieved from http://www.alz.org/documents_custom/facts_2014/alz_ff_florida.pdf?type=interior_map&facts=undefined&facts=factsThe report was created based on the article, Hebert, L. E., Weuve, J., Scherr, P. A., & Evans, D. A. (2013). Alzheimer disease in the United States (2010–2050) estimated using the 2010 census. Neurology, 80(19), 1778-1783English Proficiency: Department of Elder Affairs calculations based on Florida Population data and 2008-2012 American
Community Survey, Special Tabulation on Aging
Cost of Living: Wider Opportunities for Women Elder Economic Security Standard™ Index (Elder Index)
at http://www.basiceconomicsecurity.org/EI/