2014 florida youth substance abuse survey · handgun selling drugs attempting to steal a vehicle...
TRANSCRIPT

2014FLORIDA YOUTHSUBSTANCE ABUSE SURVEY
Holmes County

Methodology
Survey administration: February of 2014.
Sampling strategy: schools and classrooms wereselected to generate statistically representative county-level estimates.
Final sample size was 575 across grades 6 through 12.
The margin of error is less than 6.2 percentage pointsfor M.S. prevalence rates and 7.0 percentage points forH.S. prevalence rates.

Lifetime and Past-30-DayATOD Prevalence Rates
2014 Results

Graph1
Lifetime use of alcohol, tobacco and other drugs among HolmesCounty students, 2014
38.0
29.521.4
17.414.1
7.0 6.8 6.0 5.5 3.1 2.5 1.8 1.8 0.8 0.6 0.30
20
40
60
80
100
Perc
enta
ge U
se
* High School Only
Graph2
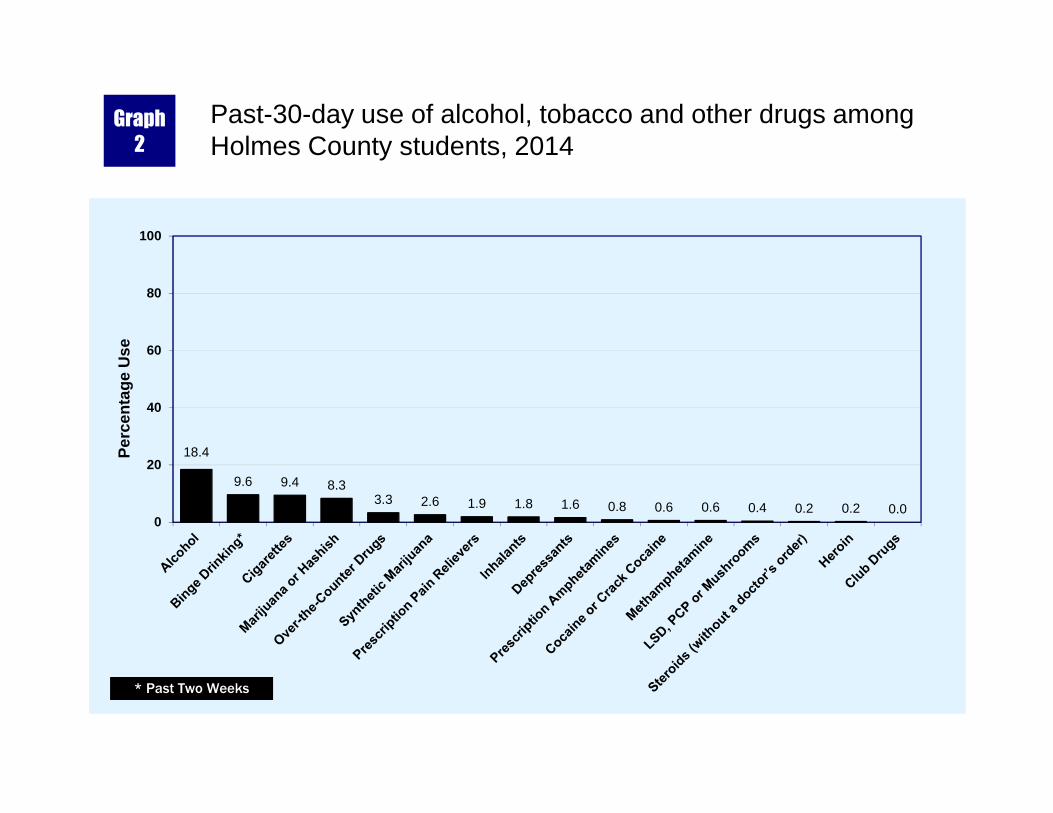
Past-30-day use of alcohol, tobacco and other drugs amongHolmes County students, 2014
18.4
9.6 9.4 8.33.3 2.6 1.9 1.8 1.6 0.8 0.6 0.6 0.4 0.2 0.2 0.0
0
20
40
60
80
100
Perc
enta
ge U
se
* Past Two Weeks

Key Findings
With overall prevalence rates of 38.0% for lifetime use and18.4% for past-30-day use, alcohol is the most commonlyused drug among Holmes County students.
After alcohol, students reported cigarettes (29.5% lifetimeand 9.4% past-30-day) and marijuana (17.4% lifetime and8.3% past-30-day) as the most commonly used drugs.
21.4% of high school students reported blacking out afterdrinking on one or more occasions.
For other ATOD categories, past-30-day prevalence rangesfrom 3.3% for over-the-counter drugs to 0.1% for heroinand steroids.

Alcohol, Cigarettesand Marijuana
2004-2014 TrendsEarly Initiation and Risk of Harm
ATODs and Driving

0.0
20.0
40.0
60.0
80.0
Middle School High School Overall
Perc
enta
ge U
seGraph3
Past-30-day alcohol use, Holmes County 2004-2014 andFlorida Statewide 2014
Holmes County 2004-2014 Florida Statewide 2014

0.0
20.0
40.0
60.0
80.0
Middle School High School Overall
Perc
enta
ge U
seGraph4
Binge Drinking, Holmes County 2004-2014 and FloridaStatewide 2014
Holmes County 2004-2014 Florida Statewide 2014

Graph5 Alcohol trends summary for Holmes County, 2004-2014
0.0
20.0
40.0
60.0
2004 2006 2008 2010 2012 2014
Perc
enta
ge U
se
Past-30-Day Use Binge Drinking Use by Age 13 Great Risk of Harm
4.7
0.0 0.9
32.2
46.1
0.0
4.7
11.58.1
1.7 0.8
17.5
43.0
0.3
11.0
17.5
0
25
50
75
Bought in astore
Bought in arestaurant,bar, or club
Bought at apublic event
Someonebought it for
me
Someone gaveit to me
Took it from astore
Took it from afamily member
Some otherway
Perc
enta
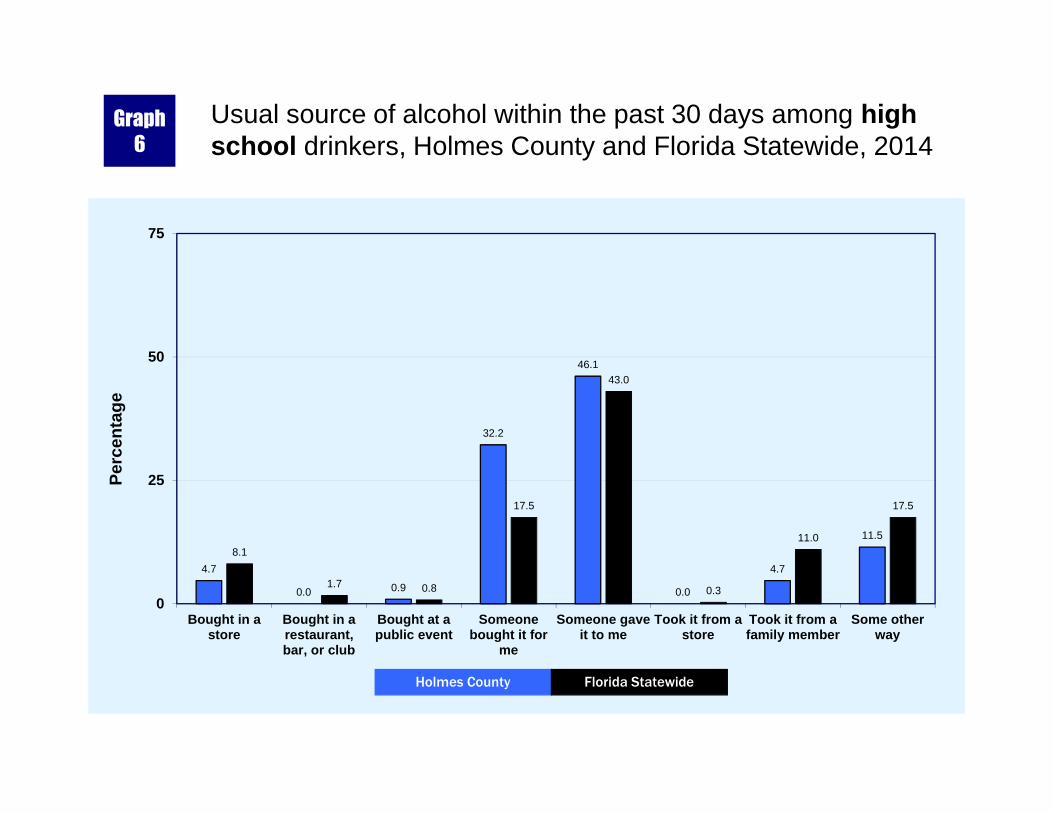
geGraph6
Usual source of alcohol within the past 30 days among highschool drinkers, Holmes County and Florida Statewide, 2014
Holmes County Florida Statewide

Graph7
Usual drinking location within the past 30 days among highschool drinkers, Holmes County and Florida Statewide, 2014
24.3
48.8
7.2
0.02.1
0.02.1
15.5
32.5
46.3
1.6 2.7 3.91.6 1.2
10.3
0
25
50
75
My home Anotherperson's home
Car or othervehicle
Restaurant,bar, or club
Public place Public event Schoolproperty
Some otherplace
Perc
enta
ge
Holmes County Florida Statewide

Graph8
Past-30-day cigarette use, Holmes County 2004-2014 andFlorida Statewide 2014
0.0
10.0
20.0
30.0
Middle School High School Overall
Perc
enta
ge U
se
Holmes County 2004-2014 Florida Statewide 2014

Graph9 Cigarette trends summary for Holmes County, 2004-2014
0.0
20.0
40.0
60.0
80.0
100.0
2004 2006 2008 2010 2012 2014
Perc
enta
ge U
se
Past-30-Day Use Use by Age 13 Great Risk of Harm

Graph10
Past-30-day marijuana use, Holmes County 2004-2014 andFlorida Statewide 2014
0.0
10.0
20.0
30.0
Middle School High School Overall
Perc
enta
ge U
se
Holmes County 2004-2014 Florida Statewide 2014

Graph11 Marijuana trends summary for Holmes County, 2004-2014
0.0
20.0
40.0
60.0
80.0
100.0
2004 2006 2008 2010 2012 2014
Perc
enta
ge U
se
Past-30-Day Use Use by Age 13 Great Risk of Harm

Graph12
ATOD Use Before or During School, Holmes County and FloridaStatewide, 2014
5.5 6.0
3.0
5.7
9.6
3.1
0
10
20
30
Alcohol Marijuana Another Drug
Perc
enta
ge u
se
Holmes County Florida Statewide

Graph13
DUI or riding with a driver under the influence, Holmes County2012-2014 and Florida Statewide 2014
Note: DUI does not imply intoxication but only indicates use prior to driving.
22.5
19.1
7.79.1
17.519.8
8.2 8.9
18.1
23.5
6.6
10.9
0
10
20
30
40
50
Riding with a DUI Driver(Alcohol)
Riding with a DUI Driver(Marijuana)
Driving Under the Influence(Alcohol)
Driving Under the Influence(Marijuana)
Perc
enta
ge u
se
Holmes County 2012-2014 Florida Statewide 2014

Key Findings In Holmes County, past-30-day alcohol use was
reported at 18.4%, compared to 24.6% across thestatewide sample.
After increasing slightly in 2010 (15.4%), binge drinkingdeclined in 2014 to 9.6%.
After increasing in 2010 (11.6%), past-30-day marijuanause decreased to 8.3% in 2014.
17.5% of high school students have ridden in a car witha driver who was under the influence of alcohol, and19.8% have ridden with a driver under the influence ofmarijuana.

Other Illicit,Over-the-Counter, and
Prescription Drugs
2004-2014 Trends

Graph14
Past-30-day inhalant use, Holmes County 2004-2014 andFlorida Statewide 2014
0.0
5.0
10.0
15.0
20.0
Middle School High School Overall
Perc
enta
ge U
se
Holmes County 2004-2014 Florida Statewide 2014

Graph15
Past-30-day over-the-counter drug use, Holmes County 2010-2014 and Florida Statewide 2014
0.0
5.0
10.0
15.0
20.0
Middle School High School Overall
Perc
enta
ge U
se
Holmes County 2010-2014 Florida Statewide 2014

Graph16
Past-30-day depressants use, Holmes County 2004-2014 andFlorida Statewide 2014
0.0
5.0
10.0
15.0
20.0
Middle School High School Overall
Perc
enta
ge U
se
Holmes County 2004-2014 Florida Statewide 2014

Graph17
Past-30-day prescription pain reliever use, Holmes County2004-2014 and Florida Statewide 2014
0.0
5.0
10.0
15.0
20.0
Middle School High School Overall
Perc
enta
ge U
se
Holmes County 2004-2014 Florida Statewide 2014

Graph18
Past-30-day prescription amphetamines use, Holmes County2004-2014 and Florida Statewide 2014
0.0
5.0
10.0
15.0
20.0
Middle School High School Overall
Perc
enta
ge U
se
Holmes County 2004-2014 Florida Statewide 2014

Graph19
Past-30-day drug combination rates for Holmes County andFlorida Statewide, 2014
13.1
7.7
11.6
24.4
6.3
16.4
7.510.9
27.0
6.7
0
20
40
60
Any illicit drug Any illicit drug otherthan marijuana
Alcohol only Alcohol or any illicitdrug
Any illicit drug, but noalcohol
Perc
enta
ge u
se
Holmes County Florida Statewide

Key Findings In Holmes County, 7.7% of surveyed students reported
the use of any illicit drug other than marijuana in thepast 30 days, compared to 8.2% across the statewidesample.
Past-30-day inhalant use decreased from 2.0% in 2012to 1.8% in 2014.
Past-30-day Rx pain reliever use was reported at 1.9%,compared to 2.3% across the statewide survey.
Among middle school students, 2.5% reported the useof over-the-counter drugs in the past 30 days, a ratehigher than any other illicit drug (except marijuana).

Other Antisocial Behaviors,Including Bullying-Related
Behaviors
2014 Results

Graph20
Comparisons of past-12-month delinquent behavior for HolmesCounty and Florida Statewide, 2014
8.5
3.51.8
2.8
0.9
9.7
3.95.3 4.9
1.42.8
0.7
10.3
6.9
0
10
20
30
Carrying ahandgun
Selling drugs Attempting tosteal a vehicle
Being arrested Taking ahandgun to
school
Gettingsuspended
Attackingsomeone withintent to harm
Perc
enta
ge u
se
Holmes County Florida Statewide

38.9
6.6
14.4
39.0
8.16.1
12.1
2.7
27.4
7.810.4
22.1
5.33.6
8.6
2.5
0.0
20.0
40.0
60.0
Bullyingcaused worry
Skippedschool
because ofbullying
Was kicked orshoved in
past 30 days
Was tauntedor teased inpast 30 days
Was victim ofcyber bullying
in past30 days
Physicallybullied others
in past30 days
Verballybullied others
in past30 days
Cyber bulliedothers in past
30 days
Perc
enta
ge u
seGraph21
Bullying-related behaviors among Holmes County middle andhigh school students, 2014
Middle School High School

Graph22
Gang involvement, Holmes County and Florida Statewide, 2014
2.7
16.6
1.53.7
20.0
2.1
0
10
20
30
40
50
Have you ever belonged to a gang? Did that gang have a name? Are you a gang member now?(High School Only)
Perc
enta
ge u
se
Holmes County Florida Statewide
Key Findings In Holmes County, prevalence rates for Attempting to Steal
a Vehicle (1.8%) and Taking a Handgun to School (0.9%) areless than 2.0%.
Higher prevalence rates were reported for GettingSuspended (9.7%) and Carrying a Handgun (8.5%).
In Holmes County, 29.6% of students have been sociallybullied, 12.2% have been physically bullied, and 6.5% havebeen cyber bullied.
2.7% of students have belonged to a gang, and 1.5% ofhigh school students are currently gang members.

Risk and Protective FactorPrevalence Rates for
M.S. and H.S. Students
2014 Results

Graph23
Protective factor prevalence rates for Holmes County andFlorida Statewide middle school students, 2014
57
70
62
54
53
64
48
60
55
51
50
47
0 50 100
Community Rewards forProsocial Involvement
Family Opportunities forProsocial Involvement
Family Rewards forProsocial Involvement
School Opportunities forProsocial Involvement
School Rewards forProsocial Involvement
Religiosity
Holmes County Florida Statewide

Graph24
Community domain and family domain risk factor prevalencerates for Holmes County and Florida Statewide middle schoolstudents, 2014
46
43
43
39
34
35
36
44
58
36
40
24
40
38
0 50 100
Community Disorganization
Transitions and Mobility
Laws and NormsFavorable to Drug Use
Perceived Availabilityof Drugs
Perceived Availabilityof Handguns
Poor Family Management
Family Conflict
Holmes County Florida Statewide

Graph25
School domain and peer and individual domain risk factorprevalence rates for Holmes County and Florida Statewidemiddle school students, 2014
43
48
34
29
24
42
52
38
32
25
0 50 100
Poor Academic Performance
Lack of Commitmentto School
Favorable Attitudes towardAntisocial Behavior
Favorable Attitudes towardATOD Use
Early Initiation of Drug Use
Holmes County Florida Statewide
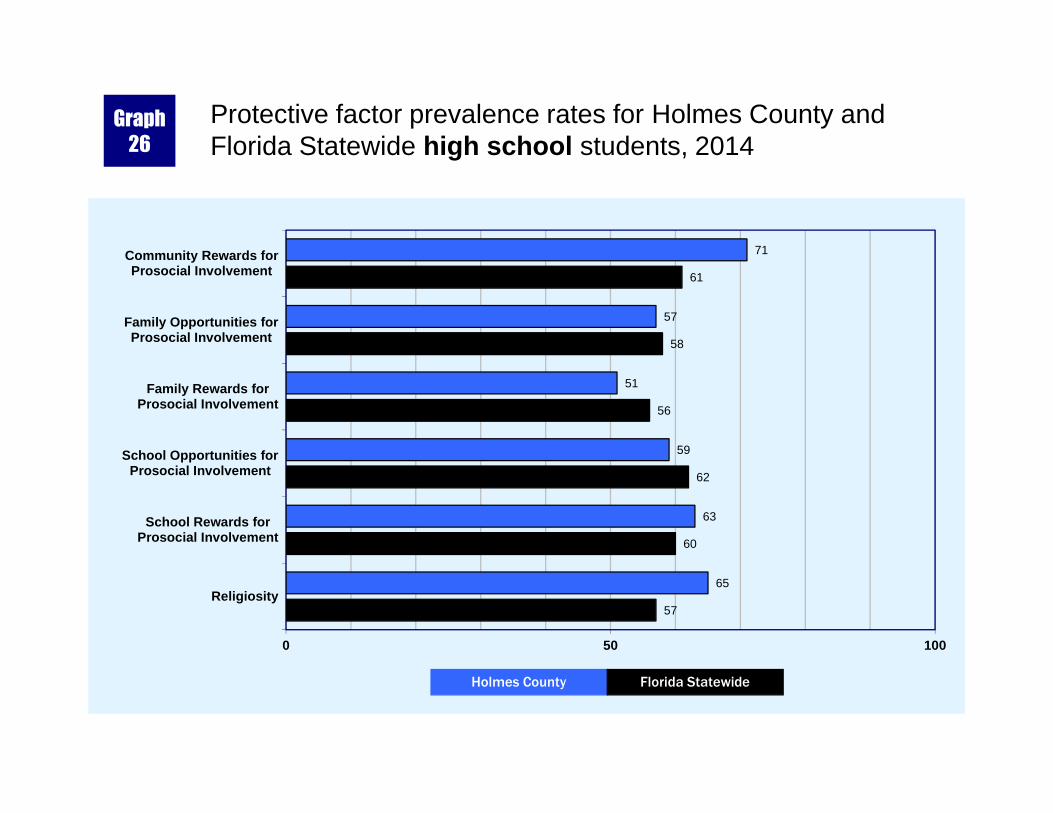
Graph26
Protective factor prevalence rates for Holmes County andFlorida Statewide high school students, 2014
71
57
51
59
63
65
61
58
56
62
60
57
0 50 100
Community Rewards forProsocial Involvement
Family Opportunities forProsocial Involvement
Family Rewards forProsocial Involvement
School Opportunities forProsocial Involvement
School Rewards forProsocial Involvement
Religiosity
Holmes County Florida Statewide

Graph27
Community domain and family domain risk factor prevalencerates for Holmes County and Florida Statewide high schoolstudents, 2014
57
51
38
34
54
39
33
46
62
33
31
37
38
33
0 50 100
Community Disorganization
Transitions and Mobility
Laws and NormsFavorable to Drug Use
Perceived Availabilityof Drugs
Perceived Availabilityof Handguns
Poor Family Management
Family Conflict
Holmes County Florida Statewide

Graph28
School domain and peer and individual domain risk factorprevalence rates for Holmes County and Florida Statewide highschool students, 2014
43
47
34
37
35
43
52
36
38
26
0 50 100
Poor Academic Performance
Lack of Commitmentto School
Favorable Attitudes towardAntisocial Behavior
Favorable Attitudes towardATOD Use
Early Initiation of Drug Use
Holmes County Florida Statewide

Key Findings
Protective factor prevalence rates—opportunities forimprovement:
Middle school students reported the lowest ratesof protection for the School Rewards for ProsocialInvolvement (53%) and School Opportunities forProsocial Involvement (54%) scales.
High school students reported the lowest rates ofprotection for the Family Rewards for ProsocialInvolvement (51%) and Family Opportunities forProsocial Involvement (57%) scales.

Key Findings
Risk factor prevalence rates—opportunities forimprovement:
Middle school students reported the highest ratesof risk for the Lack of Commitment to School (48%)and Community Disorganization (46%) scales.
High school students reported the highest ratesof risk for the Transitions and Mobility (57%) andPerceived Availability of Handguns (54%) scales.