2014 george b thomas report
TRANSCRIPT

.
Sites Sept Oct Nov Dec Jan Feb Mar Apr May Jun Total
Gaithersburg 6 18 12 9 5 7 - - - - 57 I
Burtonsville 4 10 9 12 6 10 - - - - 51 I
I TOTAL 10 28 21 21 11 17 I - - - - 1141
FYl 4 Referral and C Ietion D
% students% students attending
# # completed fromstudents students #students 75%>of students
Site referred admitted completed assignments referredGaithersburg 70 57 57 100% 81.42%Burtonsville *120 51 **47 100% 42.50%TOTAL 190 108 104 100% 56.84%
*Burtonsville (B-Sharp) receives a list of all suspended students as referrals.**3 students dismissed for behavioral issues and 1for health reasons. Allcompleted assignments while at program.
I Presented data is a compilation from Sep-2013 throuah Feb-2014.
• Please explain what the $100,000 increase for the George B. Thomas Learning Academywill be used for. For FY13 and FY14 to date, the fees charged for services, totalrevenues collected from fees, academic outcomes i.nformation, and service data.
The George B. Thomas Learning FY13 FY14-YTDAcademy, IncNumber of students 3,350 3,340 (as of Apr-2014)Attendance of >80% 486 680 (as of Dec-2013)Attendance of <50% 1,070 452{as ofDec-2013)Honor Roll (3.0-3.49) 422 n/a (end of year data)Honor Roll plus (3.5 -4.0) 288 n/a (end of year data)
Total revenue collected from Fees* 116,311.96 105,802.78 (as of Apr-2014
FARM Eligible 60% 60% (as of Apr-2014)

FY13 FY14-YTD
Number of students 3,350 3,340 (as of Apr-2014)
Attendance of >80% 486 680 (as ofDec-2013)
Attendance of <50% 1,070 452 (as of Dec-2013)
Honor Roll- (3.0-3.49) 422 n/a (end of year data)
Honor Roll plus (3.5-4.0) 288 n/a (end of year data)
Total revenue collected from Fees * 116,311.96 105,802.78 (as of Apr-2014
FARM Eligible 60% 60% (as of Apr-2014)*$50 regular registration fee and $30 discounted fee for FARM eligible children.
• $30,000 will enhance quality of tutoring services by adding 10 tutors to thecurrent staff in order to maintain a lower teacher-student ratio.
• $70,000 will secure the provision of the Saturday School program and services tolow-income residents by funding a Director of Development position to continueimplementing a comprehensive development plan with the goal to increase privatesector funding and financial sustainability. This position was funded for twoconsecutive years through a CE Community Grant.
• Increasing outreach efforts to our diverse stakeholders in multiple languages.• Implementing a revised algebra curriculum for grades 1 through 8 to maintain
alignment with the Common Core state standards and curriculum 2.0• Students self-reported increase in confidence on their ability to do well in school
and reach academic goals; improvement in their math and reading skills andgrades.
Service Area Administration• What is the Children's Trust? What will $100,000 be used for? Please identify the
mission, goals, anticipated outcomes, community partners, and any anticipated contractsrelated to this effort.The Children's Trust is a model that is developed based on similar trusts in other statesincluding Florida and California. It is a bold vision to develop a strong menu of children'sservices that help close the achievement gap and address the social determinants thatimpact that gap in a multi-generational way. The Trust is funded with a renewablesource of revenue and supports various services for specific age groups of children. Thehope is that in FY 16 and beyond there will be a renewable fund source for the Trust. InFlorida and California, the trust fund focused on the 0-5 age group; however, inMontgomery County we are choosing to design the Trust as applicable to the 0-18 agegroup. This could be a vehicle to fund early care and education, the services plus modelin schools, after school time activities, the redesigned Wheaton High School model, moreLTL or Kennedy Cluster type programming, Explorers etc.
The Trust has three components:A governing board made up of the County Executive, The Council President or designee,The Superintendent and School Board President and a business member selected by the

EXECUTIVE SUMMARY
The racial/ethnic gap in academic achievement is a long-standingconcern in education. Someof the root causesof the gap are betterunderstood by examining the issues and challenges that confrontAfrican American and Hispanic students from low-income families,many of whom also live in households where English is a secondlanguage. In these situations, solutions to closingthe achievement gapmust include accessto a broader range of servicesthan are availablethrough a school system. Out-of-schooltime {OST)programshave thepotential to provide some of the services that students need toovercome barriers to achieving their academic potential. Thisevaluation describes the results of one OSTprogram, The George B.Thomas,Sr. LearningAcademySaturdaySchoolprogram.
The George B. Thomas, Sr. Learning Academy, Inc. {GBTLA)wasestablishedin 1986 by membersof the Mu NuChapterof OmegaPsiPhiFraternity, Inc. The first learning academy,the Olney SaturdaySchool,beganin 1986with 21 children and 19volunteers at a day carecenter atthe Housing Opportunities Commission in Olney, Maryland. Theprogram has grown significantly since then. The current SaturdaySchool program serves more than 3,000 students per year at 12Montgomery County PublicSchools{MCPS)highschools.
TheGBTLAfounders recognizedthat an increasingnumber of poor andminority children in the community needed additional academicsupport to be successful in school. They believed that self-confidencewas key to academic success. Saturday School activities werestructured to provide a nurturing environment that would enhancestudents' positive beliefs about themselves as well as build theirknowledgeandskills.
Over the past 28 years, GBTLAhas provided services to tens ofthousands of at-risk students. During that time, there has beenabundant qualitative and anecdotalevidencethat students benefit fromprogram participation. This evaluation is the first to use a quasiexperimental design to describe quantitative academic outcomes fortreatment and comparisongroups.
The evaluation design ensured that any differences in performance atthe end of the year could be attributed validly to program effects. To
An Evaluation of The George B. Thomas, Sr. Learning Academy Saturday School Program

accomplish that, the evaluation sampling procedure randomly selected
matched pairs of students who were expected to have the same levels
of performance at the end of the school year. The statistical controls
and matching procedures accounted for differences in academic
outcomes that might be explained by participants' grade levels,
demographics, or prior achievement.
Between October 2012 and April 2013, Saturday School offered
program participants more than 65 hours of focused academic
instruction. Program participation of 35 hours or more was associated
with positive academic outcomes among students in Grades 1 to 12.
The effects are noteworthy for two reasons-the consistency in
program effects across multiple measures and grade levels; and the
relative magnitude compared with outcomes reported in the literature
for other OSTprograms.
Among students in Grades 1 to 12, Saturday School participation was
associated with higher levels of academic performance that were both
statistically and practically significant. Participants in the treatment
group had higher performance in these areas:
• Grades 1 and 2
o School attendance
• Grade 3o Reading benchmark attainment
o Mathematics benchmark attainment
• Grades 4 'and 5
o Semester 2 Reading GPA
o Semester 2 Mathematics GPA
• Grades 6 and 7o Semester 2 English GPAo End-of-Year English Course Marks of B or Higher
o Semester 2 Mathematics GPA
o End-of-Year Mathematics Course Marks of B or Higher
• Grades 9 to12o End-of-Year GPA
Program participation also was associated with small to moderate,
mostly non-significant, practical differences in the academic attainment
of elementary and middle school students who were performing below
An Evaluation of The George B. Thomas, Sr. Leaming Academy Saturday School Program

grade level in fall 2012. Participants in the treatment group had higher
performance in these areas:
• Grades 1 and 2o School Attendance (also statistically significant)
o Reading Benchmark Attainment
• Grade 3
o Reading Benchmark Attainment
o Mathematics Benchmark Attainment
• Grade 4 and 5o Semester 2 Reading GPA
o Semester 2 Mathematics GPA
o End-of-Year Mathematics Course Marks of Bor Higher
• Grades 6 to 8
o Semester 2 English GPA
o End-of-Year English Course Marks of B or Higher
o Semester 2 Mathematics GPA
o End-of-Year Mathematics Course Marks of B or Higher
(also statistically significant)
There were small, non-significant, practical differences in the academic
attainment of high school students who were performing above grade
level in fall 2012. High school students in the treatment group were
more likely to be academically eligible in spring 2013 and had higher
end-of-year marking period averages.
Saturday School narrowed achievement gaps by helping students
overcome barriers to achievement that are associated with
race/ethnicity and poverty. The program provided rigorous instructionthat was delivered by teachers who were familiar with students'
academic and emotional needs. The combined program characteristics
of academic rigor and a nurturing environment were associated with
significant academic outcomes. Elementary, middle and high school
students of all ability levels were able to use this resource to betterachieve their academic potential.
The results of this program evaluation provide quantitative evidence of
the importance of OSTprograms such as Saturday School for helping to
narrow achievement gaps. In addition, the statistical analyses provide
support for anecdotal evidence from students, teachers, and parents
who served as key informants for this evaluation.
An Evaluation of The George B. Thomas, Sr. Learning Academy Saturday School Program

The evaluation design for this study included a program site visit to
collect data from key informants about their reasons for participating inSaturday School and the impact that participation has had for them.
Their remarks reinforced the GBTLAfounders' beliefs that a program to
build academic skills and personal self-confidence could help close
achievement gaps.
"Icame here because Iwasn't that good inmath. I wasn't alwaysable to grasp the mathematical skills as quickly as some of myother classmates.... I also wanted to better my analyticalskillsand [reading comprehension]skills. And Saturday School hasdefinitely helped me.... When I go back to school it feels kind oflike I'm more advanced than the others now. My gradesimproved. I'm able to maintain a 3.5. I'm proud of myself AndI'm taking harder classes which means I push myself more."-African AmericanHighSchoolStudent
"Studentsget to practicethe skillsthat maybe they don't have thetime to practice [at school]at their own pace. We are able to sortout or target and differentiate the needs they have asstudents. "-Saturday SchoolTeacher
"Thesixth day of learningjust gives students an extra boost. ... Alot of times being in a classroomallweek [the children]are not asrelaxed as they are on Saturday and not as willing to takechances. I think Saturday School gives them the opportunity totake more chancesand become risk takers in their education andit also builds their confidence. They do well in Saturday Schooland they bring that back to the classroom. And then they do alittle better in the classroom."-Saturday School Teacher
"Theyteach ... confidencehere. When [teachers]call on them,they have to stand and give their answers. They are supposed tobe really respectful too. My son really knows you have to takeyour hat off when you come in. Theyare ready to work. Isee himbeing very confident as part of the program. Forreading I wasconcerned ... his marks were not as high as the math ... and thewritingwas just atrocious.... When he came here, the [readinginstruction]started with writing in a journal or on a topic. He'llwrite pages and then get up and read it in front of the wholeclass."r-Parentof 2nd GradeSaturdaySchoolStudent
An Evaluation ofThe George B. Thomas, Sr. Learning Academy Saturday School Program
The Saturday School instructional staff are employees of the GBTLAwhoremain with the same students throughout the academic year. The
Saturday School instructors for Grades 1 to 8 are certified teachers who
are familiar with MCPS curriculum and instructional practices. The
Saturday School volunteer tutors include advanced high school students
who earn SSL4 hours, undergraduate students from Bowie StateUniversity and University of Maryland, retired professors fromMontgomery College,graduate students from JohnsHopkinsUniversity,and medicalstudents from the U.S.UniformedHealthServices(USUHS}.
The stable staffing arrangement allows staff to build relationships withstudents and monitor their progressduring the school year. SaturdaySchool teachers in Grades 1 to 8 receive feedback from the CenterDirector about the academic progress of program participants. Highschool participants and their tutors monitor performance on classroomassignments, homework, and tests via on-line access to the MCPSelectronic gradebooks.
At the beginning of the school year, Saturday School staff attend atraining session that provides an update on the Saturday Schoolprogram; discussionabout the Saturday School program format andinstructional approaches, materials, management techniques, andassessmenttools; and other logistical information. Throughout theyear, staff receiveon-site administrative and technical support.
METHODOLOGY
This evaluation describes the impact of the GBTLASaturday Schoolprogram on student achievement in Grades 1 to 12. Results forelementary and middle school students were further disaggregatedtoexamineoutcomes for students who were performing below grade levelat the beginningof the schoolyear. Theevaluation questionswere:
1. Is SaturdaySchool participation associatedwith higher rates ofreadingbenchmark attainment and schoolattendance in Grades1and2?
2. Is SaturdaySchool participation associatedwith higher reading,English,and mathematicscoursemarksin Grades3 to 8?
4 To meetMaryland high school graduation requirements, students must earn75 Student Service Learning (SSL)hours by the end of Grade 12 (MCPS, 2012).
An Evaluation of The George B. Thomas, Sr. Learning Academy Saturday School Program
3. Is Saturday School participation associated with more positive
attendance, reading, English, and mathematics outcomes forstudents in Grades 1 to 8 who are performing below grade level
at the beginning of the school year?
4. Is Saturday School participation associated with better overall
academic outcomes for high-achieving high school students?
PROGRAM POPULATION
The students included in this analysis were drawn from a population of
3,287 students who enrolled in Saturday School in 2012-2013 (Appendix
A). Students who attended at more than 55 percent of the 24 Saturday
School sessions were assigned to the treatment group (high level of
participation). Students who enrolled in Saturday School but attended
less than 55 percent of the sessions were assigned to the comparison
group (low level of participation).
PRELIMINARY ANALYSIS
Preliminary descriptive statistical analysis of academic outcomes for all
program participants suggested that higher levels of Saturday School
attendance were associated with better academic performance and
better school attendance (Appendix A). Participants in the treatment
group consistently outperformed participants in the comparison group.
Further analysis was conducted on a sample of the program population
in order to test the validity of inferences about program impact based
on preliminary findings.
ANALYTIC PROCEDURES
One of the challenges for evaluating the impact of the Saturday School
program was the non-random assignment of individuals to treatment
and comparison groups. Saturday School participation is voluntary. In
order to attribute outcomes to program participation, the analyses
needed to control for confounding factors that might influence program
attendance and offer alternative explanations of observed program
effects.
RANDOMLY MATCHED PAIRS COMPARISONS
The best solution to non-random program assignmentwas a matchedpairs analytic design in which a random sample of participants in the
An Evaluation of The George B. Thomas, Sr. Learning Academy Saturday School Program

treatment group was matched with a random sample of participants in
the comparison group (Rosenbaum & Rubin, 1983; Rudner & Peyton,
2006). Matched pair designs ensure that the characteristics of
participants and non-participants are comparable. This analysis used
propensity score matching procedures to overcome the limitations of
non-random assignment and get unbiased estimates of program effects.
Logistic regression procedures for each grade level were used to
calculate a propensity score for each individual based on five covariate
characteristics that could influence attendance-gender; race/ethnicity;
participation in Free and Reduced-price Meals System (FARMS) and/or
limited English proficiency (LEP) services; and prior achievement. The
propensity scores obtained by logistic regression were the conditional
probabilities that students would be in the treatment group. The values
of the propensity scores ranged from 0 to 1. Students with the same
gender, race/ethnicity, FARMSstatus, LEPstatus, and prior achievement
level had the same propensity score (probability of program
attendance) regardless of whether theywere assigned to the treatment
or comparison groups.
Participants selected at random from the treatment group were
matched with randomly selected participants in the comparison group
who had the same propensity scores. Unmatched participants in the
population of all Saturday School enrollees were excluded from the
matched pairs analyses. The matching procedure produced pairs of
participants with identical covariate characteristics (Appendix B). The
pairs were compared to determine whether program participation was
associated with the academic outcomes of interest.
OUTCOME MEASURES
Student outcome data obtained by the ExecutiveDirector from MCPSincluded attendance for the months of October 2012 to April 2013,assessmentdata, course marks, and academic eligibility. In Grades 1and2, outcomeswere availablefor attainment of primary MCPSreadingbenchmarks and school attendance. In Grade 3, outcomes wereavailablefor MCPSreading and mathematics benchmarks. In Grades4to 8, secondsemester course markswere available in reading, English,and mathematics. In Grades9 to 12, available data included academiceligibility, overall marking period averages (MPAs), and cumulativegradepoint averages(GPA). Thesedatawere usedto conductstatisticalanalysesthat could answer the evaluation questions posedin this study.
An Evaluation of The George B. Thomas, Sr. Learning Academy Saturday School Program

MATCHED PAIRS ANALYSIS
Descriptiveanalyseson the matched pairssamplewas usedto generatemeansandstandard deviations for eachgrade-level outcome. Pairedttests and logistic regression analyses were used to evaluate thestatistical significanceof continuous (e.g., GPA)and dichotomous (e.g.,
academiceligibility) outcome variables, respectively. The results of theanalysesare presented in terms of effect sizes(ES)aswell as statisticalsignificance{p < 0.05).
The effect sizesare included evenwhen the results are not statisticallysignificant becausethe resultsof significancetesting can underestimateprogram effects (Type II error), especiallywhen sample sizesare small.Effect sizes provide policy-relevant information for practitioners andfacilitate comparisonswith outcomes of other evaluation studies. Thisanalysis uses Cohen's d to compare effect sizes of matched pairs ofparticipants. The calculations for d were adjusted for estimation biasthat would occur if the effect sizecalculation did not take into accountcorrelations between the matched pairs outcomes (Dunlap, et al.,1996). Effect size values of 0.10, 0.20, and 0.50 represent very small,small, andmedium programeffects, respectively(Cohen,1988).
QUALITATIVE MEASURES
A Saturday School site visit in February 2014 collected programfeedback from a non-random sample of key informants whoparticipated in the program in 2012-2013. The key informants includedprogram staff, students, and parents. Key informants were askedwhythey participated in the program and what benefits they had observedas a result of their participation. Quotations from key informantsprovide further context for interpreting the quantitative outcomes. Thekey informants are identified by SaturdaySchool role (student, teacher,or parent), but not by name or program site. Selectedcomments areincluded in the ExecutiveSummary to provide additional context forinterpreting the quantitative results.
RESULTS
The results reported for the matched pairs of participants control fordifferences in program effects that could be attributed to variation ingrade levels, demographics, or prior achievement. Each treatment
An Evaluation of The George B. Thomas, Sr. Learning Academy Saturday School Program 14 ~

group participant was randomly paired with a comparison groupparticipant at his or her grade level who had the same gender;
race/ethnicity; FARMS and LEP service status; and prior academic
performance. Descriptions of the characteristics of the matched pairs
are provided in Appendix B. The program effects are reported for all
matched pairs with available outcome data. In addition, outcomes are
reported for matched pairs of participants in Grades 1 to 8 who were
performing below grade level in the fall of 2012 (low achievers).
READING AND ENGAGEMENT IN GRADES 1 AND 2
TheSaturdaySchool reading instructional componentsfor Grades1 and2 are structured lessonplansthat reinforce attainment of foundationalreading skills. Students learn to use patterns of letters in words anddevelop understanding of the relationships between letters and sound.TheSaturdaySchoolteachers usethe sixth dayof instruction to provideextra support in areas where students need more practice. Thedifferentiated lessonsboth reinforce and extend the lessonsthat aretaught during the prior week at the students' elementaryschools.
End-of-year reading benchmarks evaluate whether students masteredreading skills at the text levels that are set as goals (benchmarks)fortheir grade levels. Saturday School participation was associatedwithhigher rates of primary reading benchmark attainment among lowachievers(Table 1). The percentageof low achieversin the treatmentgroup who met the end-of-year grade level reading benchmarks was14.8 points higher than the percentage in the comparisongroup (ES=0.32). There was a non-significant, but slightly higher, difference inbenchmarkattainment of all readers.
TABLE 12012-2013 PRIMARY READING BENCHMARK OUTCOMES FORSATURDAY SCHOOL PARTICIPANTS IN GRADES 1 AND 2End-of-Year All Students Low AchieversReading Grades land 2 Grades land 2Benchmarks byGroup N % Met ES N % Met ESTreatment 152 75.0 0.06 27 29.6 0.32
compartso n 152 72.4 27 14.8
An Evaluation ofThe George B. Thomas, Sr. Learning Academy Saturday School Program

Saturday School instruction in the primary grades focuses explicitly on
building student self-confidence. Teachers "make learning fun" and
encourage first and second graders to take chances and become risk
takers in a learning environment that is more relaxed than a regular
classroom. The confidence students gain in Saturday School can
contribute to students' more positive feelings of school engagement
when they return to their regular classrooms.
School attendance provided an indirect measure of the impact of
Saturday School on first and second graders' feelings of self-confidence
and school engagement (Table 2}. More frequent program participationbetween the months of October and April was associated withsignificantly higher school attendance during those same months.Overall, participants in the treatment group were absent 1.6 days lessthan comparison group participants (ES= 0.35). Low achievers in thetreatment group were absent 3.5 days lessthan comparisongroup lowachievers(ES=0.51), a rate more than twice that of all students.
TABLE 22012-2013 ATTENDANCE OUTCOMES FOR SATURDAY SCHOOLPARTICIPANTS IN GRADES 1AND 2Grades 1 and 2 All Students Low AchieversDays Absent Grades land 2 Grades land 2October to April % %by Group N Met ES N Met ESTreatment 152 4.4 0.35" 28 3.7 0.51"
Comparison 152 6.0 28 7.2
* p < 0.05
ELEMENTARY READING AND ENGLISH IN GRADES 3 TO 8
ByGrade3, the instructional emphasisin reading shifts from learningtoread to reading to learn. The Saturday School reading instructionalcomponents for Grades 3 to 8 are aligned with the instructionalactivities that are taught during the prior week at the students'elementary or middle school. Thestructured lessonsemphasizereadingfluency and comprehension,strategy use,writing, and critical thinking.
ELEMENTARY READING IN GRADE 3
MCPSGrade 3 reading benchmarks measure student attainment ofreading skills in three areas-language/vocabulary, informational text,
An Evaluation of The George B. Thomas, Sr. Learning Academy Saturday School Program
and literature (MCPS, 2013). By the end of the school year, Grade 3students who meet language/vocabulary benchmarks are able to
engage in collaborative discussions; determine main ideas and details of
a text; ask and answer questions about information from a speaker;
determine meaning of unknown and multiple meaning words/phrases;
understand word relationships and meanings; and use spatial and
temporal words in conversation. Students who master the end-of-year
Grade 3 informational text benchmark are able to comprehend and
analyze literary non-fiction and use text features and illustrations to
locate information. Students who master the end-of-year Grade 3
literature benchmark are able to read, analyze, and discuss literary
elements of fiction.
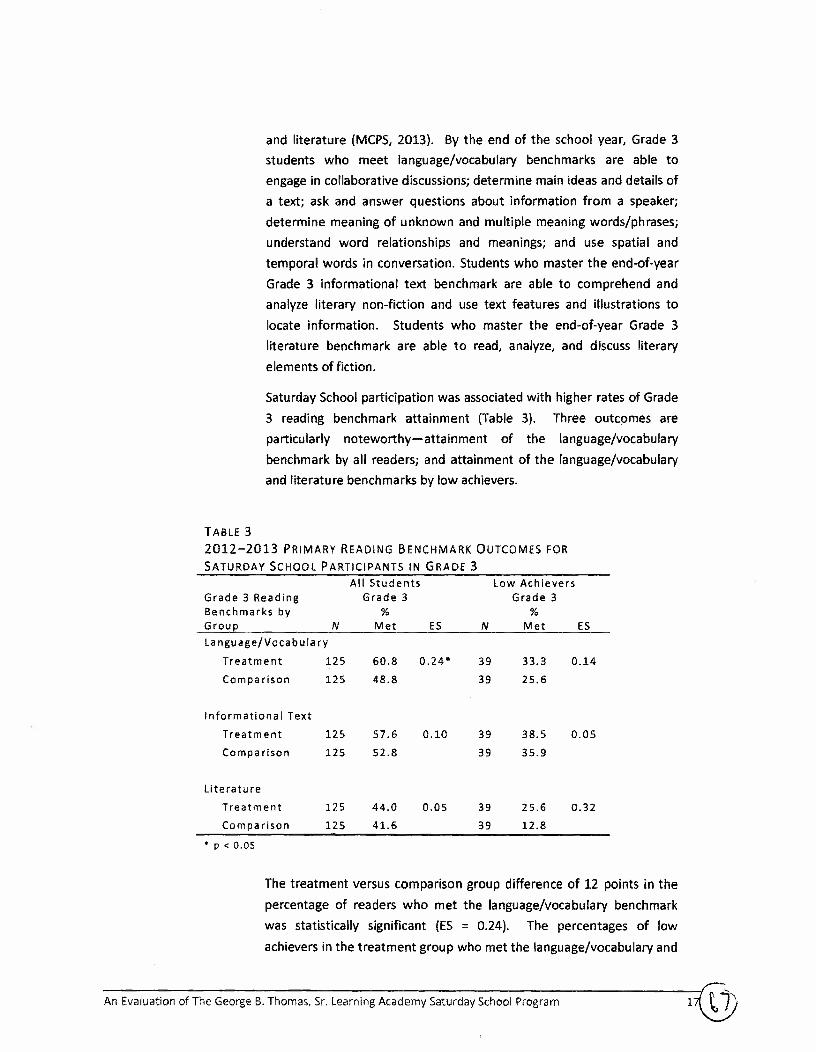
Saturday School participation was associated with higher rates of Grade
3 reading benchmark attainment (Table 3). Three outcomes are
particularly noteworthy-attainment of the language/vocabulary
benchmark by all readers; and attainment of the language/vocabulary
and literature benchmarks by low achievers.
TABLE 32012-2013 PRIMARYREADINGBENCHMARKOUTCOMESFORSATURDAYSCHOOLPARTICIPANTSIN GRADE3
All Students LowAchieversGrade3 Reading Grade 3 Grade3Benchmarksby % %GrOUJ:! N Met ES N Met ESLanguage/Vocabulary
Treatment 125 60.8 0.24* 39 33.3 0.14
Comparison 125 48.8 39 25.6
Informational TextTreatment 125 57.6 0.10 39 38.5 0.05
Comparison 125 52.8 39 35.9
LiteratureTreatment 125 44.0 0.05 39 25.6 0.32
Comparison 125 41.6 39 12.8
•p<0.05
The treatment versus comparison group difference of 12 points in thepercentage of readers who met the language/vocabulary benchmarkwas statistically significant (ES = 0.24}. The percentages of lowachieversin the treatment group who met the language/vocabularyand
1An Evaluation of The George B. Thomas, Sr. Learning Academy Saturday School Program

literature benchmarks were 7.7 points higher {ES= .14) and 12.8 pointshigher (ES= .32), respectively, than the percentages in the comparison
group.
ELEMENTARY READING IN GRADES 4 AND 5SaturdaySchoolparticipationwasassociatedwith higher readingcoursemarks in Grades4 and 5 (Table4). The difference in the semester twograde point averages(GPA)in reading for all students in the treatmentgroup compared with the comparisongroup was statistically significant(ES= 0.23). Therewas a similar difference in the semester two GPAoflow achievers {ES= 0.29). Overall, the percentageof treatment groupparticipants who completed the year with a B or higher in reading was6.1 points higher than the comparisongroup percentage(ES=0.14).
TABLE 42012-2013 ELEMENTARY READING OUTCOMES FORSATURDAY SCHOOL PARTICIPANTS IN GRADES 4 AND 5
Elementary All Students Low Achievers
Reading by Grades 4 and 5 Grades 4 and 5
Group flJ Mean ES flJ Mean ESReading GPA Semester 2
Treatment 130 3.1 0.23* 23 2.5 0.29
Comparison 130 2.9 23 2.2
Percent Earned a B or Higher 4th Marking Period
Treatment 130 79.2 0.14 23 52.2 0.17
Comparison 130 73.1 23 43.5
* p < 0.05
The pattern of ESresults for the two elementary reading outcomessuggeststhat SaturdaySchoolhad a small to moderate practical impacton the achievement of low achievers. The semester two reading GPAfor low achievers in the treatment group was higher than for theirmatched pairs in the comparison group (ES= 0.29). By the fourthmarking period (MP), the percentage of the low achievers in thetreatment group who earned a B or higher in reading was nearly 9points higher than for their comparisongroup counterparts {ES=0.17).
MIDDLE SCHOOL ENGLISH IN GRADES 6 TO 8
SaturdaySchoolparticipationwas associatedwith higher Englishcoursemarks in Grades6 to 8 (Table5). The higher semester two EnglishGPA
An Evaluation of The George B. Thomas, Sr. Learning Academy Saturday School Program

of students in the treatment group was statistically significant (ES =0.37). In addition, there was a statistically significant difference of more
than 18 points in the percentage of all students in the treatment group
who earned a B or higher in the fourth marking period (ES= 0.37).
The semester two English GPA for low achievers in the treatment group
was higher than for the comparison group (ES= 0.36). By the fourth
marking period, the percentage of the low achievers who earned a B or
higher in English was more than 9 points higher than for their
comparison group counterparts (ES= 0.20).
TABLE 52012-2013 MIDDLE SCHOOLENGLISHOUTCOMESFORSATURDAYSCHOOLPARTICIPANTSIN GRADES6 TO 8
All Students Low AchieversMiddle School Grades 6 to 8 Grades 6 to 8English by Grou e N Mean ES N Mean ESEnglish GPA Semester 2
Treatment 159 2.7 0.37* 22 2.1 0.36Comparison 159 2.3 22 1.9
Percent Earned a B or Higher 4th Marking PeriodTreatmentComparison
159159
64.2 0.37*45.9
2222
31.822.7
0.20
* p < 0.05
MATHEMATICS IN GRADES 3 TO 8
The Saturday School mathematics instructional lessons for Grades 3 to 8are structured academic activities that support and reinforce grade
level mathematics concepts and skills. The content is aligned with the
MCPScurriculum but the sequence of instruction is flexible so teacherscan provide additional support where it is most needed. The pattern of
mathematics attainment was consistently higher for elementary and
middle school students who attended Saturday School more frequently.
ELEMENTARYMATHEMATICS IN GRADE 3MCPS Grade 3 mathematics benchmarks measure student attainment
of foundational mathematics skills in two Numbers and Operations
areas-Base Ten and Fractions (MCPS, 2013). Students who attain the
Base Ten benchmark are able to multiply 1-digit numbers by multiples
An Evaluation of The George B. Thomas, Sr. Learning Academy Saturday School Program

of ten and understand place value strategies. Students who attain the
Fractions benchmark are able to represent fractions on a number line,compare equivalent fractions, and represent whole numbers as
fractions.
Saturday School participation was associated with higher rates of
Numbers and Operations benchmark attainment in Grade 3 (Table 6).
There was a statistically significant difference of nearly 15 points in the
percentage of treatment group students who met the Base Ten
benchmark compared with the comparison group (ES= 0.30).
TABLE 62012-2013 MATHEMATICS BENCHMARK OUTCOMES FORSATURDAY SCHOOL PARTICIPANTS IN GRADE 3Grade 3 All Students Low AchieversMathematics Grade 3 Grade 3Benchmarks by % %Group N Met ES N Met ESNumber and Operations: Base Ten
Treatment 131 47.3 o.so- 55 21.8 a.19Comparison 131 32.8 SS 14.5
Number and Operations: Fractions
Treatment 131 42.a a.14 SS 16.4 o.osComparison 131 3S.1 55 14.5
• p < 0.05
The percentage of low achievers in the treatment group who met theBase Ten benchmark was more than 7 points higher than thecomparison group percentage (ES = 0.19). The percentage of alltreatment group participants who met the Fractions benchmark wasnearly 7 points higher than the comparisongroup (ES=0.14).
ELEMENTARY MATHEMATICS IN GRADES 4 AND 5
Saturday School participation was associatedwith higher mathematicscourse marks in Grades 4 and 5 {Table 7). The difference in thesemester two GPAsin mathematics for all students was statisticallysignificant and had a small practical significance {ES = 0.29). Thepercentage of treatment group participants who completed the yearwith a B or higher in mathematicswas nearly 9 points higher than thepercentagefor comparisongroup participants (ES= 0.18).
An Evaluation of The George B. Thomas, Sr. Learning Academy Saturday School Program 2\jj
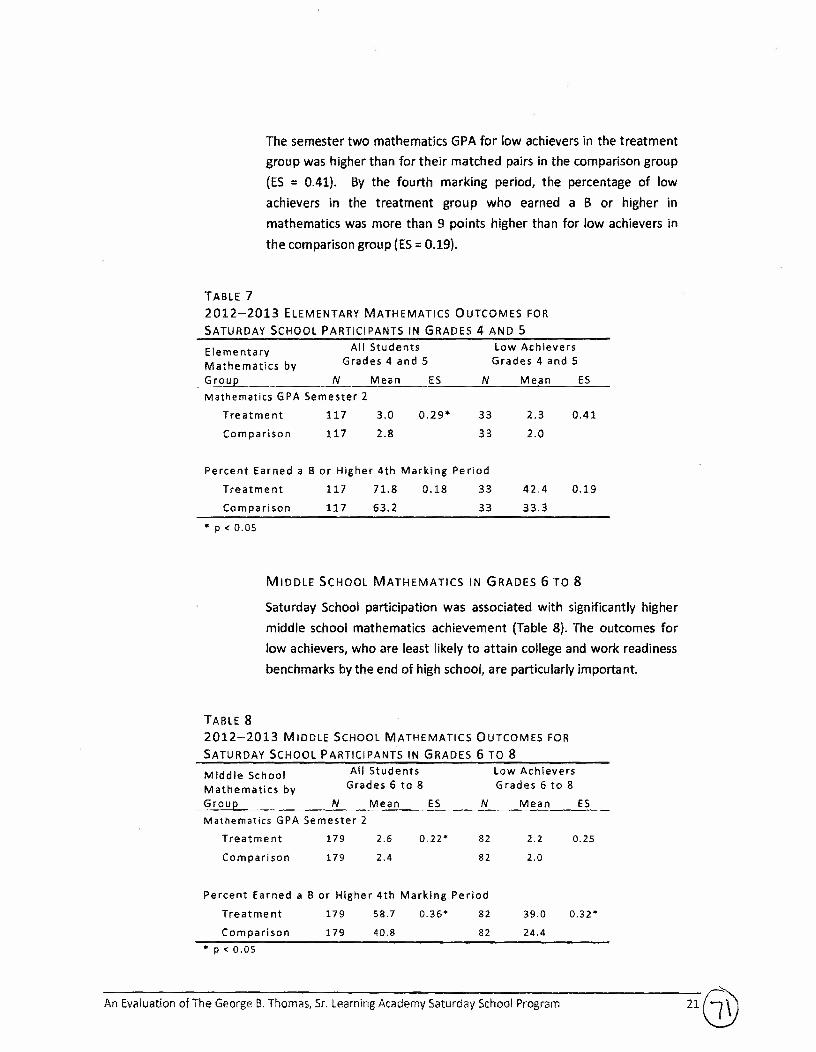
The semester two mathematics GPA for low achieversin the treatmentgroup was higher than for their matched pairs in the comparisongroup(ES = 0.41). By the fourth marking period, the percentage of lowachievers in the treatment group who earned a B or higher inmathematics was more than 9 points higher than for low achievers inthe comparisongroup (ES= 0.19).
TABLE 72012-2013 ELEMENTARY MATHEMATICS OUTCOMES FORSATURDAY SCHOOL PARTICIPANTS IN GRADES 4 AND 5ElementaryMathematics by
All StudentsGrades 4 and 5
Low AchieversGrades 4 and 5
Group N Mean ES N Mean ESMathematics GPA Semester 2
Treatment 117 3.0 0.29* 33 2.3 0.41
Comparison 117 2.8 33 2.0
Percent Earned a B or Higher 4th Marking Period
Treatment 117 71.8 0.18 33 42.4 0.19
Comparison 117 63.2 33 33.3
• p < 0.05
MIDDLE SCHOOL MATHEMATICS IN GRADES 6 TO 8
Saturday School participation was associatedwith significantly highermiddle school mathematics achievement (Table 8). The outcomes forlow achievers,who are least likely to attain collegeandwork readinessbenchmarksby the end of high school, are particularly important.
TABLE 82012-2013 MIDDLE SCHOOL MATHEMATICS OUTCOMES FORSATURDAY SCHOOL PARTICIPANTS IN GRADES 6 TO 8Middle SchoolMathematics byGrou2
All StudentsGrades 6 to 8
Low AchieversGrades 6 to 8
N Mean ES N Mean ESMathematics GPA Semester 2
Treatment
Comparison
179
179
2.6
2.4
0.22• 82
82
2.2
2.0
0.25
Percent Earned a B or Higher 4th Marking Period
Treatment 179 58.7 0.36* 82
Comparison 179 40.8 82
39.0
24.4
0.32*
* p < o.os
An Evaluation of The George B.Thomas, Sr. Learning Academy Saturday School Program

The higher semester two mathematics GPA of students in the treatment
group was statistically significant (ES= 0.22). In addition, there was astatistically significant difference of nearly 18 points in the percentageof all students in the treatment versuscomparisongroupswho earned aBor higher in the fourth markingperiod (ES=0.36).
The semester two mathematicsGPAfor low achieversin the treatmentgroup was hfgher than for their matched pairs in the comparisongroup(ES= 0.25). By the fourth marking period (MP), the percentageof thelow achieverswho earned a Bor higher in mathematics was nearly 15points higher than the comparisongroup percentage,a difference thatwasstatistically significant (ES=0.32).
ACADEMIC OUTCOMES IN GRADES 9 TO 12
The SaturdaySchool high school program is different from the focusedinstructional program for elementary and middle school students. Highschoolstudents work one-on-onewith tutors and mentors to get help inwhatever academic area needs the most support. Some high schoolstudents attend a few sessionsto get help with specific course projectsor to prepare for a standardized test. Others attend regularly toreinforce and clarify what they are learning in their English,mathematics, or advanced courses. The Saturday sessions provideopportunities for students to deepen their understanding of coursecontent, improve their course marks, and strengthen their readingcomprehension and analytic skills. Skills and strategies that studentslearn in one content area can be applied to improve their coursemarksinother content areas.
In 2012-2013, the majority of Grade 9 to 12 Saturday Schoolparticipants were moderate to high-achievingminority students, manyof whom were from poor families. About 85 percent were AfricanAmerican or Hispanic,and nearly 55 percent received FARMSservices.Of the 84 pairs of students included in this analysis,nearly 90 percentwere enrolled in one or more Honors-level courses, and nearly 95percent were academically eligible to participate in extra-curricularactivities in fall 2012 (AppendixB).
Overall, Saturday School participation was associatedwith higher endof-year academicachievementfor high-performing highschool students
An Evaluation pf The George B. Thomas, Sr. Learning Academy Saturday School Program

(Table 9). The percentage of treatment group participants who were
academically eligible in the fourth marking period was nearly 10 pointshigher than the percentage for comparison group participants (ES=0.28). The fourth quarter marking period average (MPA) of thetreatment group was higher than for the comparisongroup (ES= 0.19).Overall, the difference in the end-of-year cumulative Grade PointAverages (GPAs) of treatment and comparison participants wasstatistieallysignificant (ES=0.27).
TABLE 92012-2013 HIGH SCHOOL OUTCOMES FOR SATURDAY SCHOOLPARTICIPANTS IN GRADES 9 TO 12High SchoolAcademic Outcomeby Group
All Students" Grades 9 to 12
N Mean ESPercent Academically Eligible 4th MP
Treatment
Comparison
8383
91.681.9
0.28
MPA 4th Marking Period
Treatment
Comparison
8383
2.8
2.70.19
Cumulative GPA
Treatment
Comparison
84
84
2.8
2.6
0.27*
* p < 0.05
COMPARISONS WITH OTHER OST PROGRAM EFFECTS
The effect sizes observed for Saturday School are noteworthy whencompared with those reported for other OSTprograms. OSTprogramevaluations that report results for treatment and comparison groupstypically find outcomes with small practical significance even whenoutcomes are statistically significant (Durlak, Weissberg, & Pachan,2010; Lauer,et al., 2004; Lauer,et al., 2006; Vandell, Reisner,& Pierce,2007; Zief, Lauver, & Maynard, 2006). The statistically significantoutcomes reported in this study included small to medium effect sizesranging from 0.22 to 0.51. In addition, there were statistically nonsignificant effect sizedifferences between 0.10 and 0.36 that had smallpractical significance.
An Evaluation of The George B. Thomas, Sr. Learning Academy Saturday School Program

Elementary and middle school treatment group participants consistentlyoutperformed their comparison group counterparts on measures of
reading and mathematics attainment and overall course performance.
On a variety of elementary and middle school measures, the effect size
differences were highest among pairs of students who were performing
below grade level in reading or mathematics at the beginning of the
school year. In high school, where most participants were already
above-average achievers, the treatment group participants
outperformed their comparison group counterparts on measures of
academic eligibility and overall course performance.
DISCUSSION
Over the past 28 years, The George B. Thomas, Sr. Learning Academy,
Inc. has provided services to tens of thousands of .at-rlsk students.
During that time, there has been abundant qualitative and anecdotal
evidence that students benefit from program participation. This
evaluation is the first to use a quasi-experimental design to describe
quantitative academic outcomes for treatment and comparison groups
of Saturday School participants.
The evaluation design ensured that any differences in performance at
the end of the year could be attributed validly to program effects. To
accomplish that, the evaluation sampling procedure randomly selected
matched pairs of students who were expected to have the same levels
of performance at the end of the school year. The statistical controls
and matching procedures accounted for differences in academic
outcomes that might be explained by participants' grade levels,demographics, or prior achievement.
Between October 2012 and April 2013, Saturday School offered
program participants 60 hours of focused academic instruction.Program participation of 35 hours or more was associated with positive
academic outcomes among students in Grades 1 to 12. The effects are
noteworthy for two reasons-the consistency in program effects across
multiple measures and grade levels; and the relative magnitude
compared with other OST programs.
One of the challenges associated with closing achievement gaps is that
racial/ethnic differences in reading and mathematics achievement
widen as students move from first to eighth grade. Participation in
An Evaluation of The George B. Thomas, Sr. Learning Academy Saturday School Program

Saturday School provided support that helped overcome that challenge.The impact of program participation was greatest in upper elementary
and middle school, the grade levels at which African American and
Hispanic student are most at-risk for slower rates of achievement
growth compared with their White and Asian classmates. Higher levels
of program participation among students in Grades 4 to 8 were
associated with statistically significantly higher course marks in reading,
English, and mathematics.
Saturday School participation had significant practical impact on the
reading, English, and mathematics achievement of elementary and
middle school students who were performing below grade level at the
beginning of the school year {low achievers). These students are at
greatest risk for dropping out of high school and failing to attain college
and work readiness outcomes. The risks are even greater among
students from families who live in poverty or who do not speak English
at home. Analysis of outcomes for matched pairs of low achievers
found that greater program participation was associated with higher
rates of reading and mathematics benchmark attainment; and higher
course marks in reading, English, and mathematics.
Nearly all of the high school participants in 2012-2013 were enrolled inhonors-level or advanced courses and were academically eligible toparticipate in extracurricular activities. Studentssuchasthese often areoverlooked by OST programs that serve low achievers primarily.Analysisof outcomes for matched pairs of high school students foundthat greater program participation was associatedwith higher end-ofyear academiceligibility rates,marking period averages,and cumulativegradepoint averages.
SaturdaySchoolprovides learningopportunities and resourcesthat helpovercome barriers to educational attainment associatedwith race andpoverty. Saturday School participation in 2012-2013 was associatedwith better academic outcomes among low performing students andamong students who were performing at or above grade level. Thebenefits students received from a sixth day of instruction on Saturdayhad a positive impact on academic performance every day. Resultsofthis evaluation contribute compelling quantitative evidence that showsthe importance of OSTprogramssuch asSaturdaySchoolfor helping tonarrow achievementgaps.
An Evaluation of The George B. Thomas, Sr. Learning Academy Saturday School Program 2

APPENDIX A: PRELIMINARY FINDINGS FOR THE2012-2013 SATURDAY SCHOOL PROGRAMPOPULATION
TAB.LE AlDEMOGRAPHIC COMPARISON OF MCPS STUDENTS WHO ENROLLED IN THE2012-2013 GEORGE B. THOMAS SATURDAY SCHOOL PROGRAMBY LEVEL OF PARTICIPATION
Total N N by Participation Level % by Participation Level
Demo11raehic Group• Students Hi!i!h Low High LowGenderFemale 1449 640 809 50.6 45.5
Male 1594 626 968 49.4 54.5
Race/EthnicityAfrican American 1338 534 804 42.3 45.6
Hispanic 1030 433 597 34.3 33.9
Asian 415 225 190 17.8 10.8
White 241 69 172 5.5 9.8
Service GroupFARMSC 1837 798 1039 63.0 58.5LEPd 583 261 322 20.6 18.1• Data were provided by Montgomery County Public Schools (MCPS). Data were not available for
all Saturday School enrollees.Students who attended more than SS percent of the 24 Saturday School sessions were assignedto the treatment group (high level of participation). Students who enrolled in the SaturdaySchool but attended less than 55 percent of the sessions were assigned to the comparison group(low level of participation).
' Free and Reduced-price Meals System services.Limited English proficiency services.
An Evaluation ofThe George B. Thomas, Sr. Leaming Academy Saturday School Program31~

TABLE A22012-2013 ACADEMIC OUTCOMES FOR STUDENTS IN GRADES 1 TO 5BY LEVEL OF PARTICIPATION IN THE GEORGE B. THOMAS SATURDAY SCHOOL PROGRAM
Academic Outccme s"Participation
Leve lbReading Grades 1 and 2
Percent Met or Exceeded ReadingBenchmark
Reading Grade 3
Reading Vocabulary:% At or AboveGrade Level
High
Low
High
Low
High
Low
High
Low
Reading Informational Text:% At orAbove Grade Level
Reading Literature:% At or AboveGrade Level
Reading Grades 4 and 5
Reading GPA Semester 2High
Low
High
LowPercent Earned a B or Higher MP4
Mathematics Grade 3
Number and Operations in Base Ten:% At or Above Grade level
High
Low
High
LowNumber and Operations, Fractions:% At or Above Grade Level
Mathematics Grades 4 and 5
GPA Semester 2High
Low
High
LowPerc.ent Earned a B or Higher MP4
ValidN
226
336
227
194
227
194
227
194
263
263
261
263
227
191227
196
263
264
259260
Mean
74.8
65.8
56.8
46.4
51.152.6
40.S
43.3
3.0
2.9
74.3
70.7
43.2
32.5
41.4
34.7
3.0
2.8
77.2
63.5
43.5
47 .5
49.6
50.050.150.1
49.2
49.7
0.8
0.8
43.8
45.6
49.646.9
49.4
47. 7
0.8
0.9
42.0
48.2
SDMeanDif.°
PositiveTrendd
•
•
•
•
9.0
10.4
-1.5
-2.8
0.1
3.6
10.7
6.7
0.2
13.8
• Data were provided by Montgomery County Public Schools (MCPS). Results are reported by Marking Period(MP) when applicable.
' Students who attended more than 55 percent of the 24 Saturday School sessions were assigned to thetreatment group (high level of participation). Students who enrolled in the Saturday School but attended lessthan SS percent of the sessions were assigned to the comparison group (low level of participation).
' The mean difference is calculated from unrounded values and may differ by 0.1 from the rounded valuesshown in the table.
• • Mean results were better for the treatment group (high level of participation).
An Evaluation of The George B. Thomas, Sr. Learning Academy Saturday School Program

TABLE A32012-2013 ACADEMIC OUTCOMES FOR STUDl;:NTS IN GRADES 6 TO 12BY LEVEL OF PARTICIPATION IN THE GEORGE B. THOMAS SATURDAY SCHOOL PROGRAM
Academic Outcorne s"Participation
Leve lbPositiveTrendd
ValidN Mean SD Mean
Dif.°English Grades 6 to 8
English GPA Semester 2High
Low
High
LOW
Percent Earned a B or Higher inEnglish MP4
Mathematics Grades 6 to 8
Math GPA Semester 2High
lowHigh
LowPercent Earned a B or Higher inMath MP4
Overall Academics Grades 9 to 12
MPA Grades 9 to 12 {MP4)High
Low
High
Low
High
Low
End-of-Year Grade Point Average(GPA)
End-of-Year Academic Eligibility(MP4)
289
353
287
352
319417318
415
125
430
125450
125
430
2.7
2.3
63.844.3
2.6
2.358.8
39.8
2.82.3
2.7
2.3
88.0
67.9
0.8
1.048.249.7
1.0
1.049.349.0
0.8
0.9
0.6
0.8
32.6
46.7
0.4 •
19.4
0.3
19.0
o.s
o.s
20.1 •
' Data were provided by Montgomery County Public Schools (MCPS). Results are reported by Marking Period(MP) when applicable.
• Students who attended more than 55 percent of the 24 Saturday School sessions were assigned to thetreatment group (high level of participation). Students who enrolled in the Saturday School but attended lessthan SS percent of the sessions were assigned to the comparison group (low level of participation).
' The mean difference is calculated from unrounded values and may differ by 0.1 from the rounded valuesshown in the table.•Mean results were better for the treatment group (high level of participation).
An Evaluation of The George B. Thomas, Sr. Learning Academy Saturday School Program

APPENDIX B: CHARACTERISTICS OF THE MATCHED
PAIRS SAMPLE USED FOR THE 2012-2013SATURDAY SCHOOL PROGRAM EVALUATION
TABLE BlCHARACTERISTICS OF TREATMENT AND COMPARISON GROUPS IDENTIFIEDTHROUGH PROPENSITY SCORE MATCHING, GRADES 1 AND 2
Grades 1 and 2N Students Prior Reading Level"
Group Treatment Comearison Treatment ComparisonAll 155 155 2.7 2.7African
63 63 2.9 2.9AmericanHispanic 67 67 2.4 2.4
Asian 18 18 3.2 3.2
White 7 7 2.9 2.9
Male 76 76 2.7 2.7
Female 79 79 2.7 2.7
FARM Sb 119 119 2.6 2.6
LEP0 61 61 2.2 2.2'Reading level is a categorical assignment on a scale of 1 to 4 based on fallreading text level.Free and reduced-price Meals System services.
e Limited English proficiency services.
TABLE 82CHARACTERISTICS OF RANDOMLY SELECTED TREATMENT AND COMPARISON GROUPSIDENTIFIED THROUGH PROPENSITY SCORE MATCHING, GRADES 3 TO 5
Reading Grades 3 to 5 Mathematics Grades 3 to 5Prior Reading Prior Mathematics
N Students Levelb N Students Levet"
Grou2 Treatment Come:ariso n 'r r e e em e n t Comear!son Treatment Comeer!son 'rr e e tm e nt Com1:11rlson
All 331 331 3.4 3.4 319 319 1.8 1.8
African Am. 156 156 3.4 3.4 151 151 1.8 1.8
Hispanic 118 118 3.0 3.0 120 120 1.7 1.7
Asian 36 36 3.9 3.9 30 30 2.3 2.3
White 21 21 3.7 3.7 18 18 1.8 1.8
Male 153 153 3.2 3.2 154 154 1.8 1.8
Female 178 178 3.5 3.5 165 165 1.8 1.8
FARMS 236 236 3.2 3.2 225 225 1.7 1.7
LEP 36 36 1.9 1.9 34 34 1.2 1.2'Reading level is a categorical assignment on a scale of 1 to 5 based on fall MAP-R scores.•Prior mathematics level is a categorical assignment on a scale of 1 to 3 based on predicted MSAMath scores.
Note. Matching was conducted separately for reading and mathematics due to small sample size.
An Evaluation of The George B. Thomas, Sr. Learning Academy Saturday School Program
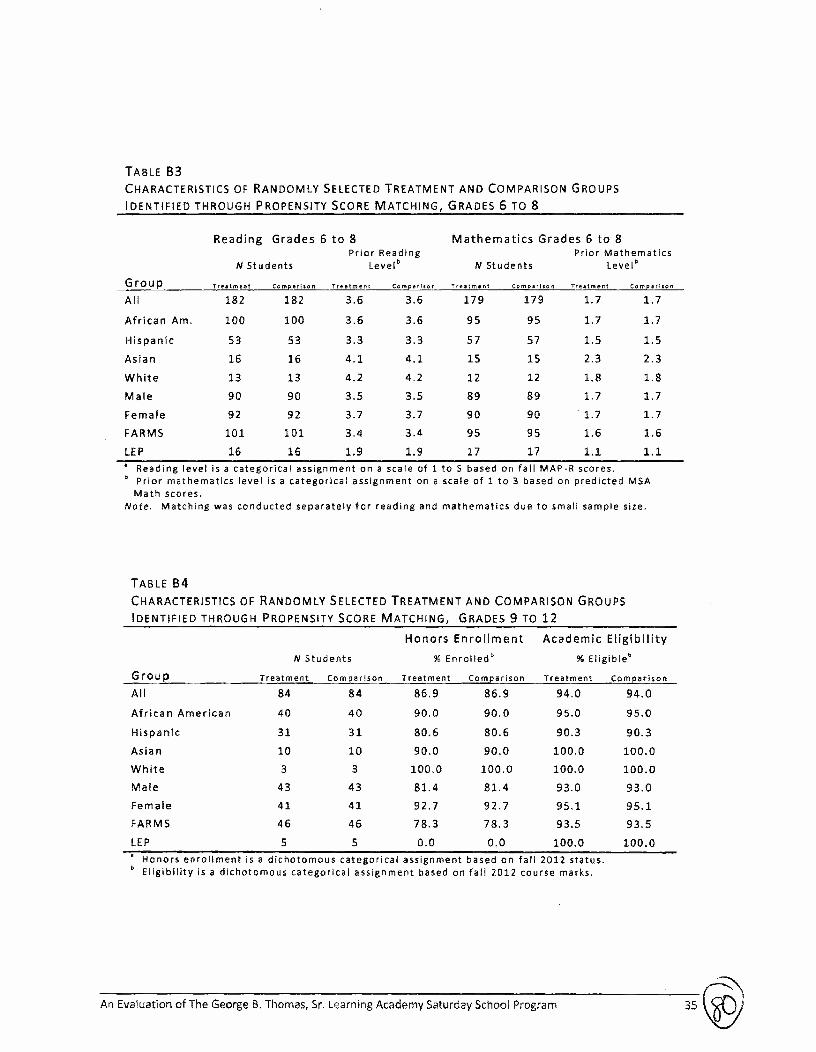
TABLE B3CHARACTERISTICS OF RANDOMLY SELECTED TREATMENT AND COMPARISON GROUPSIDENTIFIED THROUGH PROPENSITY SCORE MATCHING, GRADES 6 TO 8
Reading Grades 6 to 8 Mathematics Grades 6 to 8Prior Reading Prior Mathematics
N Students Levelb N Students Levelb
Group t r e e t m ent Comf:!trison r r e e tme n t ComE!:arison r r e at rn e nt Corne;.rl•on 'rr e atm e nt Come:uison
All 182 182 3.6 3.6 179 179 1. 7 1.7
African Am. 100 100 3.6 3.6 9S 95 1.7 1. 7
Hispanic 53 53 3.3 3.3 57 57 1.5 1.5
Asian 16 16 4.1 4.1 15 lS 2.3 2.3
White 13 13 4.2 4.2 12 12 1.8 1.8
Male 90 90 3.5 3.S 89 89 1. 7 1. 7
Female 92 92 3.7 3.7 90 90 1.7 1. 7
FARMS 101 101 3.4 3.4 9S 95 1.6 1.6
LEP 16 16 1.9 1.9 17 17 1.1 1.1. Reading level is a categorical assignment on a scale of 1 to S based on fall MAP-R scores.• Prior mathematics level is a categorical assignment on a scale of 1 to 3 based on predicted MSAMath scores.
Note. Matching was conducted separately for reading and mathematics due to small sample size.
TABLE B4CHARACTERISTICS OF RANDOMLY SELECTED TREATMENT AND COMPARISON GROUPSIDENTIFIED THROUGH PROPENSITY SCORE MATCHING, GRADES 9 TO 12
Honors Enrollment Academic Eligibility
N Students % Enr clte d" % Eligibleb
Group Treatment Comearison Treatment Com2arison Treatment ComparisonAll 84 84 86.9 86.9 94.0 94.0
African American 40 40 90.0 90.0 95.0 95.0
Hispanic 31 31 80.6 80.6 90.3 90.3
Asian 10 10 90.0 90.0 100.0 100.0White 3 3 100.0 100.0 100.0 100.0Male 43 43 81.4 81.4 93.0 93.0Female 41 41 92. 7 92. 7 95.1 95.1FARMS 46 46 78.3 78.3 93.5 93.5
LEP 5 s 0.0 0.0 100.0 100.0Honors enrollment is a dichotomous categorical assignment based on fall 2012 status.Eligibility is a dichotomous categorical assignment based on fall 2012 course marks.
An Evaluation of The George B. Thomas, Sr. Learning Academy Saturday School Program