2014 growth & infrastructure - la city planning monitoring changes in los angeles’ growth and...
TRANSCRIPT

L O S A N G E L E S D E P A R T M E N T O F C I T Y P L A N N I N G
R E P O R T
2 0 1 4G R O W T H & I N F R A S T R U C T U R E

L O S A N G E L E S D E P A R T M E N T O F C I T Y P L A N N I N G
The Department of City Planning is pleased to present the 2014 Report on Growth and Infrastructure. It is the sixth in a series of reports providing detailed information on City demographics, development activity, infrastructure and public facilities.
The report is a program of the Framework Element of the General Plan. Its aim is to synthesize information about the City’s growth and infrastructure in one place. The first half of the report focuses on population, housing and employment growth since the 2000 Census. Information is organized around the City’s 35 Community Plan Areas, 2 Special Purpose Districts (the port and airport) and 7 Area Planning Commission areas. The second half focuses on the range of available and planned/completed infrastructure facilities to support that growth.
The report largely summarizes existing public reports, plans and other publications from the State, regional and other local agencies. It will be made available as an interactive resource on the Internet.
It is our hope that this and future reports become useful tools in understanding growth and change in the City. The reports provide an important window into understanding changing needs, demographics and infrastructure, thereby informing public debate on these topics.
The Department of City Planning is committed to providing this information to you and the public, and to assisting public policy and decision-making.
Michael LoGrande Director of City Planning smallest size
November 7, 2014
Dear Members of the City Planning Commission, City Council and Mayor Garcetti:
3
table of contents growth&infrastructure2014
Table of Contents
chapter one: population, housing and development activity � � � � � � � � � � � � � � � � � � � � � � � � � � 7
chapter two: transportation � � � � � � � � � � � � � � � � � � � � � � � � � � � � � � � � � � � 30
chapter three: water � � � � � � � � � � � � � � � � � � � � � � � � � � � � � � � � � � � � � � 38
chapter four: wastewater/sewer � � � � � � � � � � � � � � � � � � � � � � � � � � � � � � � � � � 44
chapter five: stormwater and urban runoff � � � � � � � � � � � � � � � � � � � � � � � � � � � � � � � 48
chapter six: solid waste � � � � � � � � � � � � � � � � � � � � � � � � � � � � � � � � � � � � � 53
chapter seven: power � � � � � � � � � � � � � � � � � � � � � � � � � � � � � � � � � � � � � 57
chapter eight: fire � � � � � � � � � � � � � � � � � � � � � � � � � � � � � � � � � � � � � � � 61
chapter nine: police � � � � � � � � � � � � � � � � � � � � � � � � � � � � � � � � � � � � � � 64
chapter ten: schools � � � � � � � � � � � � � � � � � � � � � � � � � � � � � � � � � � � � � � 66
chapter eleven: cultural resources � � � � � � � � � � � � � � � � � � � � � � � � � � � � � � � � � 69
chapter twelve: libraries � � � � � � � � � � � � � � � � � � � � � � � � � � � � � � � � � � � � � 72
chapter thirteen: parks � � � � � � � � � � � � � � � � � � � � � � � � � � � � � � � � � � � � � 74
chapter fourteen: airports � � � � � � � � � � � � � � � � � � � � � � � � � � � � � � � � � � � � 76
chapter fifteen: harbor � � � � � � � � � � � � � � � � � � � � � � � � � � � � � � � � � � � � � 80
4
growth&infrastructure2014table of contents
TABLES
TABLE 1. Comparison Of General Plan Framework Projections And Existing Estimates . . . . . . . . . . . . . . . . . . . . . . . . . . . . . . . . . . . . . . . . . . . . . . . . . . . . . . . . . . . . . . . 6
TABLE 2. Population Trends 2000-2014, By Area Planning Commission . . . . . . . . . . . . . . . . . . . . . . . . . . . . . . . . . . . . . . . . . . . . . . . . . . . . . . . . . . . . . . . . . . . . . . . . 13
TABLE 3. Total Housing Units Trends 2000-2014, By Area Planning Commission. . . . . . . . . . . . . . . . . . . . . . . . . . . . . . . . . . . . . . . . . . . . . . . . . . . . . . . . . . . . . . . . . . 14
TABLE 4. Comparison of General Plan Framework Population and 2014 Estimates, by Area Planning Commission (APC) . . . . . . . . . . . . . . . . . . . . . . . . . . . . . . . . . . . . 16
TABLE 5. Estimated 2014 Total Housing Units, By Type, By Area Planning Commission (APC) . . . . . . . . . . . . . . . . . . . . . . . . . . . . . . . . . . . . . . . . . . . . . . . . . . . . 17
TABLE 6. Population In The City Of Los Angeles, By Community Plan Area, 2000-2014 . . . . . . . . . . . . . . . . . . . . . . . . . . . . . . . . . . . . . . . . . . . . . . . . . . . . . . . . . . . . . 18
TABLE 7. Total Housing Units In The City Of Los Angeles, By Community Plan Area, 2000-2014. . . . . . . . . . . . . . . . . . . . . . . . . . . . . . . . . . . . . . . . . . . . . . . . . . . . . . . 21
TABLE 8. Estimated Change In Permitted Units From 2010 Census To July 1, 2014 . . . . . . . . . . . . . . . . . . . . . . . . . . . . . . . . . . . . . . . . . . . . . . . . . . . . . . . . . . . . . . . . 24
TABLE 9: Estimated Change In Permitted Units From 2010 Census To July 1, 2014 . . . . . . . . . . . . . . . . . . . . . . . . . . . . . . . . . . . . . . . . . . . . . . . . . . . . . . . . . . . . . . . . 25
TABLE 10. Estimated Change In Non-Residential Development From 2010 Census To July 1, 2014 . . . . . . . . . . . . . . . . . . . . . . . . . . . . . . . . . . . . . . . . . . . . . . . . . . . . . 27
TABLE 11: Estimated Change In Non-Residential Development (Sqft) Since 2010 Census . . . . . . . . . . . . . . . . . . . . . . . . . . . . . . . . . . . . . . . . . . . . . . . . . . . . . . . . . . . . 28
CHARTS
CHART 1. Population Trends And Projections . . . . . . . . . . . . . . . . . . . . . . . . . . . . . . . . . . . . . . . . . . . . . . . . . . . . . . . . . . . . . . . . . . . . . . . . . . . . . . . . . . . . . . . . . . . . 9
CHART 2. Change in Population vs. Housing Units, 2000-2010, By Area Planning Commission . . . . . . . . . . . . . . . . . . . . . . . . . . . . . . . . . . . . . . . . . . . . . . . . . . . . . . . 15
MAPS
MAP 1. Change in Population, 2000-2010 . . . . . . . . . . . . . . . . . . . . . . . . . . . . . . . . . . . . . . . . . . . . . . . . . . . . . . . . . . . . . . . . . . . . . . . . . . . . . . . . . . . . . . . . . . . . . 20
MAP 2. Change in Number of Households 2000-2010 . . . . . . . . . . . . . . . . . . . . . . . . . . . . . . . . . . . . . . . . . . . . . . . . . . . . . . . . . . . . . . . . . . . . . . . . . . . . . . . . . . . . 23
MAP 3. LED Street Light Conversion Program Completed Areas . . . . . . . . . . . . . . . . . . . . . . . . . . . . . . . . . . . . . . . . . . . . . . . . . . . . . . . . . . . . . . . . . . . . . . . . . . . . . . 37

5
growth&infrastructure2014executive summary
This Growth and Infrastructure Report summarizes and
provides links to growth and infrastructure related plans,
reports and data produced across the various City departments�
By monitoring changes in Los Angeles’ growth and
infrastructure trends, the Report provides a basis for evaluating
the City’s progress towards meeting the goals and policies of
its General Plan�
The Report looks at the growth (or decline) of population, housing units and employment as well as the infrastructure and public services in place to support it. Summaries of current infrastructure status and planned/completed infrastructure improvements deemed to be relevant to the City’s growth and development are provided by topic area. The data is collected from public
documents, departmental reports, and data from the State, regional, and other local agencies. The Report is meant to be a living document where, on an ongoing basis, updated information will be added.
Documents included as of the release of the Growth and Infrastructure Report are the most recent available as of September 2014. Each department may have updated documents available on their website since then. These sources will be reviewed and updated periodically, as resources allow.
The Framework Element and Population Growth The General Plan Framework Element was originally adopted by the City Council in December 1996 as part of the City’s General Plan. It establishes a comprehensive citywide strategy for long-term growth of the City and intended to guide the development of the other elements of the General Plan. The plan is a “smart growth” strategy that generally seeks to accommodate growth near transit and other existing infrastructure to assure a sustainable, economically viable future for Los Angeles. The Framework Element identifies a projected population of 4.3 million people living in 1,566,108 housing units.
An Environmental Impact Report (EIR) was prepared for the Framework Element that analyzed the environmental impacts of the plan on all of the infrastructure and services required to support that population. The EIR was certified and determined that the Framework Plan for accommodating 4.3 million people would have no significant impacts on the environment with the implementation of mitigations, with the exception of Land Use, Urban Form, Air Quality—Particulate Emissions, and Biological Resources. In other words, the infrastructure and services that were in place in 2001 (when the Framework was re-adopted and its EIR certified), were adequate to serve 4.3 million people. With regard to the impacts created by the Framework Element on land use, urban form, air quality and biological resources, the City Council determined that, despite such potential impacts, it was critical to adopt a sustainable, smart growth plan to accommodate the projected growth of Los Angeles and adopted “overriding considerations” for the approval of the Framework Plan and the certification of its EIR.
growth&infrastructure2014
6
executive summary
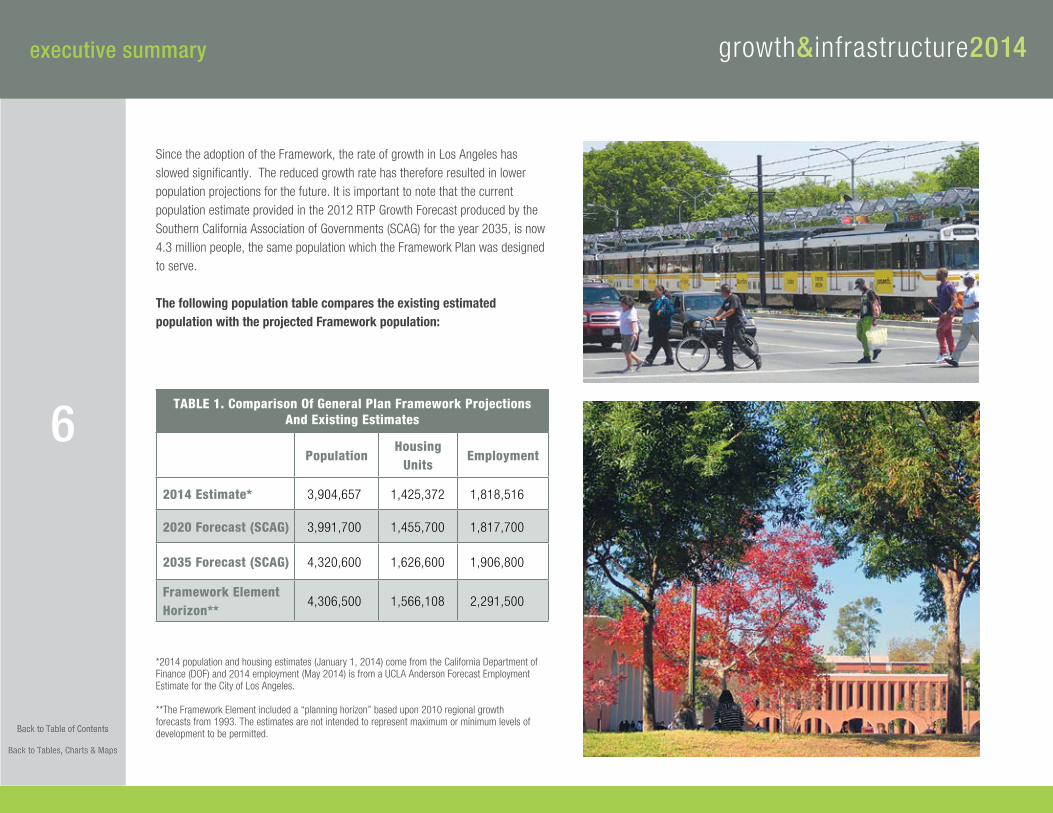
Since the adoption of the Framework, the rate of growth in Los Angeles has slowed significantly. The reduced growth rate has therefore resulted in lower population projections for the future. It is important to note that the current population estimate provided in the 2012 RTP Growth Forecast produced by the Southern California Association of Governments (SCAG) for the year 2035, is now 4.3 million people, the same population which the Framework Plan was designed to serve.
The following population table compares the existing estimated population with the projected Framework population:
*2014 population and housing estimates (January 1, 2014) come from the California Department of Finance (DOF) and 2014 employment (May 2014) is from a UCLA Anderson Forecast Employment Estimate for the City of Los Angeles.
**The Framework Element included a “planning horizon” based upon 2010 regional growth forecasts from 1993. The estimates are not intended to represent maximum or minimum levels of development to be permitted.
TABLE 1. Comparison Of General Plan Framework Projections And Existing Estimates
PopulationHousing
UnitsEmployment
2014 Estimate* 3,904,657 1,425,372 1,818,516
2020 Forecast (SCAG) 3,991,700 1,455,700 1,817,700
2035 Forecast (SCAG) 4,320,600 1,626,600 1,906,800
Framework Element Horizon**
4,306,500 1,566,108 2,291,500
chapter one: population, housing and development activity growth&infrastructure2014
7
chapter one: population, housing and development activity
SCAG Local Profile of the City of Los Angeles May 2013Since 2009, the Southern California Association of Governments (SCAG) has been preparing biennial Local Profile reports for every member city and six counties. The Local Profiles contain detailed demographic and socioeconomic data and analysis for population, income, housing, employment, and education. The 2013 reports feature additional information including median household income, single-family and multi-family permits, types and age of the housing stock, foreclosures, major work destinations for residents, and educational attainment for residents. Local Profiles provide a portrait of each city and its changes since 2000 and demonstrates current trends occurring in the city. SCAG released the 2013 Local Profiles at the 2013 General Assembly on May 2, 2013.
PopulationPopulation Growth
Between 2000 and 2012, the total population increased by 3.5 percent from 3,694,742 in 2000 to 3,825,297 in 2012. The City’s population growth rate of 3.5 percent was lower than the Los Angeles County’s growth rate of 3.8 percent.
HouseholdsNumber of Households
Between 2000 and 2012, the total number of households in the City of Los Angeles increased by 47,014 units (3.7%), to total 1,322,374. The City’s household growth rate of 3.7 percent was the same as the Los Angeles County. In 2012, the City’s average household size was 2.8, which is lower than the County average of 3.0.
Households by Size
In 2012, 71 percent of all households in the City had three people or fewer, and approximately 17 percent of all households had 5 people or more. Single-person households represented the largest percentage of all households in the City with 29 percent in 2012. About five percent of all households in the City had seven people or more.
Renters and Homeowners
Between 2000 and 2012, homeownership rates decreased by 0.5 percent while the share of renters increased by 0.5 percent. In 2012, renters’ share was about 61.9 percent, and the homeownership rate was approximately 38.1 percent.
The Southern California Association of Governments (SCAG)
is the Metropolitan Planning Organization (MPO) for six counties: Los Angeles,
Orange, San Bernardino, Riverside, Ventura and Imperial. SCAG includes 67
districts which represent 191 member cities, including the City of Los Angeles.
The region has a population of more than 18 million persons in an area
encompassing more than 38,000 square miles. As the designated MPO, the
Association of Governments is mandated by federal and state law to research
and draw up plans for transportation, growth management, hazardous waste
management, and air quality as well as additional mandates at the state level.

chapter one: population, housing and development activity
8
growth&infrastructure2014
HousingTotal Permits Issued for All Residential Units
In 2012, a total of 11,828 permits were issued for all types of work on residential units (not just new construction) in the City of Los Angeles, according to the Construction Research Industry Board. Between 2000 and 2012, permits were issued for 114,140 residential units.
Single-Family Housing Permits
In 2012, the City of Los Angeles issued 1,081 single-family permits for all kinds of work, compared to 1,679 permits issued in 2000. Between 2000 and 2012, a total of 18,048 permits were issued for new single-family homes in the City of Los Angeles. About 12.7 percent of these permits were issued during 2009-2012.
In 2012, the number of single-family permits issued per 1,000 residents decreased to 0.3 permits compared to 0.5 permits in 2000. Los Angeles County had 0.4 single-family permits per 1,000 residents in 2012.
Multi-Family Housing Permits
In 2012, a total of 10,747 multi-family permits for all types of work were issued in the City of Los Angeles. Between 2000 and 2012, the City issued 96,092 permits for new multi-family residential units. About 21.1 percent of these permits were issued during 2009-2012.
Housing Units by Housing Type
In 2012, the City of Los Angeles had a total of 1,418,581 housing units. Approximately 45.4 percent were single-family homes and 53.9 percent were multi-family homes. The most common housing type was multi-family housing with five units or more.
Age of Housing Stock
63 percent of the housing stock in the City was built before 1970, and 36 percent of the housing stock was built during 1970-2012.
Employment
Southern California Association of Governments (SCAG) identified the top 10 places where the City of Los Angeles’ residents commute to work in 2010: Los Angeles, Burbank, Santa Monica, Glendale, Beverly Hills, Culver City, Pasadena, Long Beach, Torrance, and West Hollywood. 51.04 percent of commuters work within the City of Los Angeles, while 17.55 percent commute to the other nine cities. 31.41 percent of all commuters work at other destinations.
Total Jobs
In 2012, the City of Los Angeles had a total of 1,688,584 jobs compared to 1,807,175 jobs in 2007, representing a decrease of 6.6 percent.
Jobs in Specific Sectors
SCAG provides the total number of jobs in the following sectors: manufacturing, construction, retail trade, and professional and management.
Manufacturing jobs refer to people employed in the following sectors: food, apparel, metal, petroleum and coal, machinery, computer and electronic product, and transportation equipment. In 2012, the total number of manufacturing jobs in the City of Los Angeles was 108,382, a decrease of 20 percent compared to 2007.
Construction jobs refer to those involved in both residential and non-residential construction. Between 2007 and 2012, construction jobs in the City of Los Angeles decreased from 83,491 to 57,252, a 31.4 percent decrease.
Retail trade jobs consists of workers in the following retailers: motor vehicle and parts dealers, furniture, electronics and appliance, building material, food and beverage, clothing, sporting goods, books, and office supplies. In 2012, the City had 154,499 retail trade jobs, a decrease of 6.9 percent compared to 2007.

chapter one: population, housing and development activity growth&infrastructure2014
9
Professional and management jobs include professional and technical services, management of companies, and administration support. In 2012, the City had a total of 300,799 professional and management jobs compared to 325,862 jobs in 2007.
SCAG Adopted 2012 RTP Integrated Growth Forecast The Southern California Association of Governments (SCAG) produces an Integrated Growth Forecast every four years. The Forecast provides socio-economic estimates and projections by geographic areas in multiple years. The estimates and projections are used for long-range planning efforts by the federal, state and local governments to produce the Regional Transportation Plan (RTP), the Air Quality Management Plan (AQMP), the Regional Transportation Improvement Program (RTIP), and the Regional Housing Needs Assessment (RHNA).
CHART 1� Population Trends And Projections
The City of Los Angeles is expected to reach a population of 3,991,700 by 2020 and 4,320,600 by 2035. The Southern California Association of Governments projects that the City would have 1,455,700 households by 2020 and 1,626,600 households by 2035. Employment in the City are also expected to increase from 1,817,700 in 2020 and 1,906,800 in 2035.

chapter one: population, housing and development activity
10
growth&infrastructure2014
Regional Housing Needs Assessment (RHNA)The RHNA quantifies the need for housing production within each jurisdiction during specified planning periods, based on population and employment projections. The 5th cycle 2013-2021 RHNA allocation for the City of Los Angeles is 82,002 housing units. Fifty-seven percent of this figure is assigned to households with incomes below moderate (120% of Area Median Income).
California Department of Finance Demographic Research UnitThe Demographic Research Unit within the California Department of Finance serves as the official source of demographic data for the State of California planning and budgeting. The Research Unit provides annual population estimates for the State, counties, and cities. Information on housing units, vacancies, average household size, components of population change, and special populations are also available. The population estimates are used for a variety of purposes including research and planning by federal, state and local agencies, the academic community, and the private sector.
The Unit also forecasts population, births, and public school enrollment in various jurisdictions within the State of California. The State and counties’ population projections are made for 50 years into the future and include age, sex, and race/ethnic detail. Calendar-year births are projected 10 years into the future at the State level with the projections distributed across the counties. The birth projections are categorized into six age groups and seven race/ethnic groups. The public school enrollment is forecasted for 10 years into the future. The enrollment projections are available at the county level for kindergarten through high school graduates.
Population and Housing Estimates for Cities, Counties and the State May 2014The Report titled Population and Housing Estimates for Cities, Counties, and the State provides population and housing estimates for January 1, 2011-2013 and provisional population and housing estimates for January 1, 2014 for the state, counties, and cities.
Population
The City of Los Angeles population estimate increased by 38,524 from 3,866,133 in 2013 to 3,904,657 in 2014. The City’s population represents approximately 38.8 percent of Los Angeles County’s total population.
The total number of households (occupied housing units) is estimated to be 1,335,399 in 2014 with an average household size of 2.85.
Housing Units
In 2014, the City of Los Angeles is estimated to have 1,432,553 housing units. Approximately 44.9 percent are single-family units and 54.3 percent are multi-family housing units. A total residential vacancy rate of 6.8% was recorded.
City of Los Angeles Department of City Planning (DCP)The Department of City Planning is charged with the responsibility of preparing, maintaining, and implementing a General Plan for the Development of the City of Los Angeles. The Planning Department implements the General Plan utilizing a variety of tools through the application of zoning regulations.

chapter one: population, housing and development activity growth&infrastructure2014
11Housing Element of the General PlanThe Housing Element of the General Plan is the City’s blueprint for meeting the City’s housing and growth challenges. It identifies housing conditions and needs, reiterates goals, objectives, and policies that are the foundation of the City’s housing strategy, and provides an array of programs to create sustainable, mixed-income neighborhoods across the City. The Housing Element must be updated every eight years, with the 2013-2021 Housing Element update adopted in late 2013. Annual Progress Reports must also be submitted to the State each year reporting progress on meeting Housing Element objectives.
2012 Annual Progress Report for the Housing Element
A total of 4,943 housing units were permitted in 2012. Of those, 872 units were affordable to households with moderate-incomes or below (6 moderate-income, 315 low-income and 515 very-low income). The Annual Progress Report also lists the yearly progress of each individual program listed in the Housing Element.
2013 Housing Change Report for the California Department of Finance The Demographics Research Unit of the Department of City Planning prepares reports on the change in housing units each year for the State Department of Finance. The report uses building permit data compiled from the Department of Building and Safety. The information includes new construction, demolitions and conversions. The methodology employs a lag time between the issuance of permits and completion of construction and/or demolition. The lag times are six months for construction of single-family dwellings and one year for multiple-family dwellings. Demolitions or removal of units from the housing stock are not lagged.
The 2013 report identifies a gain of 6,762 total dwelling units during the 2012 calendar year. This includes a decline of 183 single-family dwelling units and an increase of 6,945 multiple-family dwelling units.
Los Angeles Department of TransportationThe Los Angeles Department of Transportation is a leader in the planning, design, construction, and operation of transportation systems in the City of Los Angeles. The Department partners with sister agencies to improve transportation service and infrastructure in the city and the region.
2014 Congestion Management Program Local Development ReportThe State-mandated Congestion Management Program (CMP) requires local jurisdictions to submit to Metro an annual Local Implementation Report (LIR) enumerating all development activity and all traffic mitigation projects/programs benefiting the CMP transportation network.
Since 1994, the City of Los Angeles has maintained a positive balance of transportation improvement credits over new development debits to preserve compliance with the CMP. To date, the city has accumulated 2,107,508 in net credit points. For the current reporting period, June 1, 2013 to May 31, 2014, the LIR has been replaced with the Local Development Report (LDR). Reporting

chapter one: population, housing and development activity
12
growth&infrastructure2014
of traffic mitigation projects/programs has been suspended indefinitely while Metro conducts studies on the best approach for compliance with the Congestion Management Program. However, all new development activity must continue to be reported annually in the LDR to meet CMP compliance.
Development Activity
For the period June 1, 2013 to May 31, 2014, The LDR determined a total of 9,751 net housing units were added in Los Angeles (8,916 multi-family,725 single-family, 110 group quarters). This includes the construction of 11,469 new housing units and the demolition or permit withdrawal of 1,710 units. 1,333,000 sq. ft. of net commercial space was added during the same time. Total net non-retail development includes 584,000 sq. ft. of industrial space, 318,000 sq. ft. of office space, 243,000 sq. ft. of medical space, 72,000 government space and 326,000 sq. ft. of institutional/educational space.
Exempted development activity (not included in the development totals above) includes 83 units of low/very low-income housing, 753 units of high density residential housing near rail stations, 804,000 sq. ft. of non-residential mixed-use development space near rail stations and 933 units of mixed-use development near rail (a total of 1,769 dwelling units and 804,000 sq. ft. of non-residential sq. ft.).
Department of Building and SafetyThe mission of the Department of Building and Safety is to protect the lives and safety of the residents and visitors of the City of Los Angeles and enhance the quality of life, housing, economic prosperity, and job creation. This is accomplished through advising, guiding, and assisting customers to achieve compliance with the Building, Zoning, Plumbing, Mechanical, Electrical, Disabled Access, Energy, and Green codes; and local and State laws, through a timely, ethical, cooperative, and transparent process for the facilitation of construction and maintenance of commercial, industrial, and residential buildings throughout the City.
Building and Safety Newsletter
Various statistics on growth and development are compiled in monthly newsletters distributed by the Department of Building and Safety.
Building Valuation/Plan Check Revenue
In fiscal year 2013-2014, total building permit valuation was $5.3 billion, compared to $3.8 billion for the prior year. Total permits issued was at 134,000 in fiscal year 2013-2014 compared to 136,000 the previous year.
Housing Starts (Units)
In fiscal year 2013-2014, there were a total of 11,035 permitted housing starts (units). Housing units permitted in fiscal year 2012-13 ended at 7,923.
Office of the MayorPerformance MeasuresAs part of Mayor Garcetti’s commitment to data and transparency, a new website has been developed that provides performance metrics to track the city’s progress toward key priorities. Included in those metrics are several key growth and development measures such as building permit valuation and new business license registration. The measures are intended to be added to over time.

chapter one: population, housing and development activity growth&infrastructure2014
13
2014 Department of City Planning Estimates
In order to present the most up to date growth data the Department of City Planning’s Demographic Research Unit has provided population and housing estimates through to July 1, 2014 based on current building permit data. The data has been pegged to the April 1, 2010 US Census, in order to track growth since this data benchmark.
TABLE 2. Population Trends 2000-2014, By Area Planning Commission
Area Planning Commission 2000 Census1 2010 Census2 2014 Estimate32000-2010 %
Change2000-2014 %
Change3
Central LA 658,928 647,211 682,012 -1.8% 3.5%
East LA 405,192 391,963 401,928 -3.3% -0.8
West LA 394,689 408,721 428,411 3.6% 8.5%
South LA 688,108 723,748 744,641 5.2% 8.2%
Harbor 193,265 195,486 197,904 1.2% 2.4%
South Valley 703,139 729,702 752,038 3.8% 7.0%
North Valley 651,967 695,790 719,457 6.7% 10.4%
Citywide 3,695,288 3,792,621 3,926,391 2.6% 6.3%
1Bureau of Census, Decennial Census 2000, SF12Bureau of Census, Decennial Census 2010, SF13Department of City Planning, DRU, Population/Housing Estimate 07/01/2014*
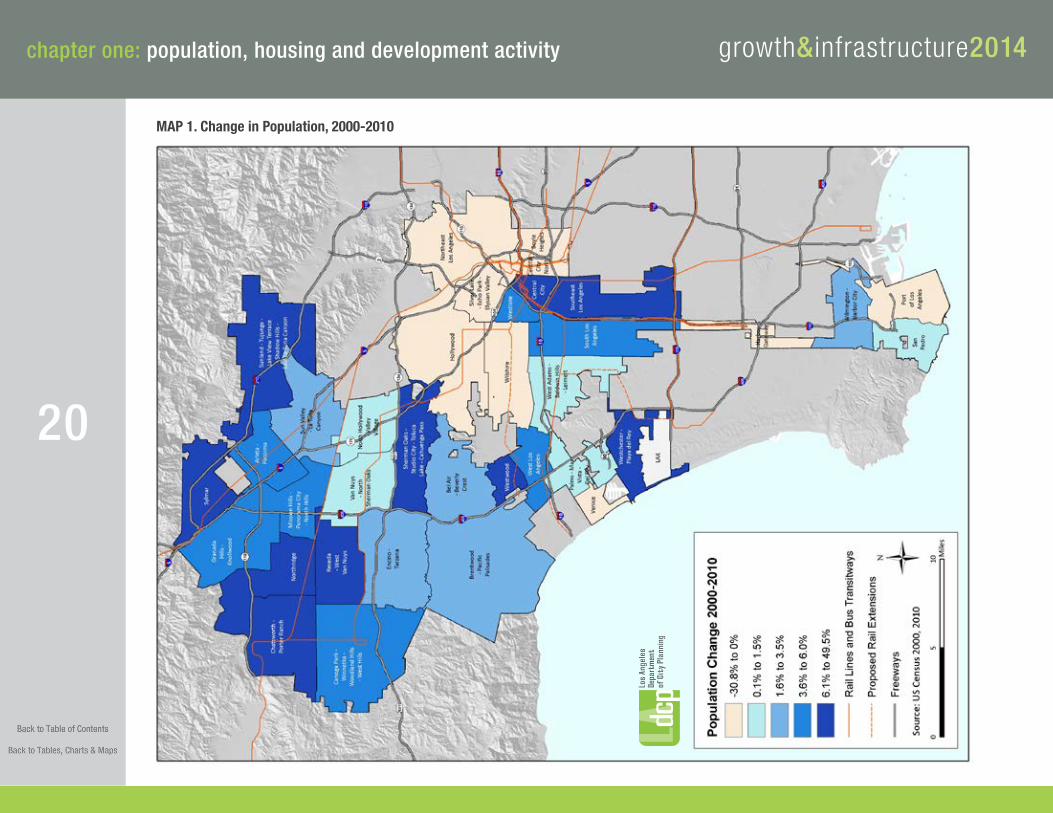
From 2000 to 2010, the population in the City of Los Angeles increased 2.6%. This compares to 6% growth during the 1990s and 17.5% during the 1980s (Chart 1). The City’s growth rate is much slower than the State of California’s (10%) and slightly below Los Angeles County’s (3.1%) during the same time period.
Population growth in Los Angeles is estimated to have increased significantly since the 2010 Census. While total population increased by about 97,000 from 2000 to 2010, since the 2010 Census the figure is estimated to have increased by almost 134,000. Within the City, the fastest growing area was the North Valley, while population has declined in East Los Angeles
*The Department of City Planning Population/Housing Estimates utilizes the “new housing unit method”.

chapter one: population, housing and development activity
14
growth&infrastructure2014
tTABLE 3. Total Housing Units Trends 2000-2014, By Area Planning Commission
2000 Census1
2010 Census2tt 2014 Estimate3
2000-2010 % Change
2000-2014 % Change
Central LA 273,756 300,149 307,376 9.6% 12.3%
East LA 127,301 130,390 130,915 2.4% 2.8%
West LA 185,548 197,025 198,341 6.2% 6.9%
South LA 213,551 217,413 219,234 1.8% 2.7%
Harbor 64,908 67,557 67,614 4.1% 4.2%
South Valley 276,903 292,586 295,415 5.7% 6.7%
North Valley 195,267 208,877 210,918 7.0% 8.0%
Citywide 1,337,234 1,413,995 1,429,813 5.7% 6.9%1Bureau of Census, Decennial Census 2000, SF12Bureau of Census, Decennial Census 2010, SF13Department of City Planning, DRU, Population/Housing Estimate 07/01/2014Note: Rounding may cause the summation not to equal
In contrast to population growth, the increase in housing units occurred largely between 2000 and 2010. About 76,000 units were added from 2000 to 2010, while just under 16,000 have been added since then. In terms of housing units, the fastest growth during both periods has occurred in Central Los Angeles, followed by the North Valley. South Los Angeles and East Los Angeles have seen the smallest increase in housing.

chapter one: population, housing and development activity growth&infrastructure2014
15
-0.04%
-0.02%
0.00%
0.02%
0.04%
0.06%
0.08%
0.10%Housing Units Change Population Change
CitywideNorth ValleySouth ValleyHarborSouth LAWest LAEast LACentral LA
CHART 2� Change in Population vs� Housing Units, 2000-2010, By Area Planning Commission
Comparing the growth in population to housing units helps to identify mismatches between supply and demand. For example, South Los Angeles has the second highest population growth from 2000 to 2010 but the lowest rate of new housing. On the other extreme, Central Los Angeles has seen the fastest rate of housing growth, while population has fallen.
2The housing unit estimate for 2014 is smaller than the totals of permit data on subsequent pages, as it takes into account estimates of vacancy rates and buildings that are not constructed.

chapter one: population, housing and development activity
16
growth&infrastructure2014
TABLE 4. Comparison of General Plan Framework Population and 2014 Estimates, by Area Planning Commission (APC)
Area Planning Commission
Estimated Population
(2014)1 % of City
Framework Projected 2010
Populatio2 % of City
Central 682,012 17.4% 784,090 18.2%
East 401,928 10.2% 517,220 12.0%
West 428,411 10.9% 446,595 10.4%
South 744,641 19.0% 804,035 18.7%
Harbor 197,904 5.0% 227,045 5.3%
South Valley 752,038 19.2% 789,935 18.3%
North Valley 719,457 18.3% 737,639 17.1%
Citywide 3,926,390 100% 4,306,559 100%
1Department of City Planning, DRU, Population/Housing Estimate (7/01/2014)2Department of City Planning, Framework Element (1996)Note: Rounding may cause the summation not to equal
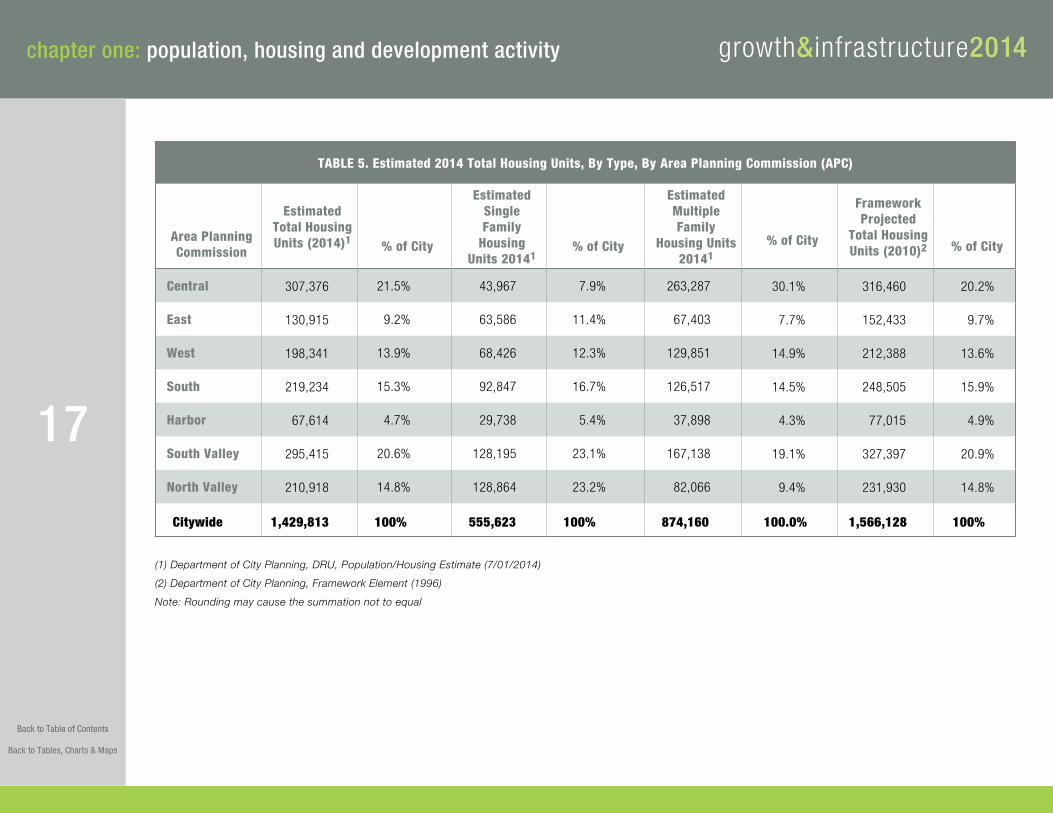
Tables 4 and 5 compare current estimated population and housing growth with the 2010 projections provided in the City’s Framework Element. Both population and total housing unit estimates for 2014 are at 91% of the Framework Element projections. SCAG projects both population and household units to surpass the Framework’s projections sometime between 2035 and 2040.
Compared to the 2010 Framework projections, population has grown more slowly in Central LA, East LA and the Harbor area than had been anticipated. However, the San Fernando Valley has grown faster than anticipated - comprising 37.5% of the City in 2014, vs. the projected 35.4% in the Framework. Yet, from a housing unit perspective, the Valley is slightly below the projections.
chapter one: population, housing and development activity growth&infrastructure2014
17
TABLE 5. Estimated 2014 Total Housing Units, By Type, By Area Planning Commission (APC)
Area Planning Commission
Estimated Total Housing Units (2014)1 % of City
Estimated Single Family
Housing Units 20141
% of City
Estimated Multiple Family
Housing Units 20141
% of City
Framework Projected
Total Housing Units (2010)2 % of City
Central 307,376 21.5% 43,967 7.9% 263,287 30.1% 316,460 20.2%
East 130,915 9.2% 63,586 11.4% 67,403 7.7% 152,433 9.7%
West 198,341 13.9% 68,426 12.3% 129,851 14.9% 212,388 13.6%
South 219,234 15.3% 92,847 16.7% 126,517 14.5% 248,505 15.9%
Harbor 67,614 4.7% 29,738 5.4% 37,898 4.3% 77,015 4.9%
South Valley 295,415 20.6% 128,195 23.1% 167,138 19.1% 327,397 20.9%
North Valley 210,918 14.8% 128,864 23.2% 82,066 9.4% 231,930 14.8%
Citywide 1,429,813 100% 555,623 100% 874,160 100.0% 1,566,128 100%
(1) Department of City Planning, DRU, Population/Housing Estimate (7/01/2014)(2) Department of City Planning, Framework Element (1996)Note: Rounding may cause the summation not to equal
chapter one: population, housing and development activity
18
growth&infrastructure2014
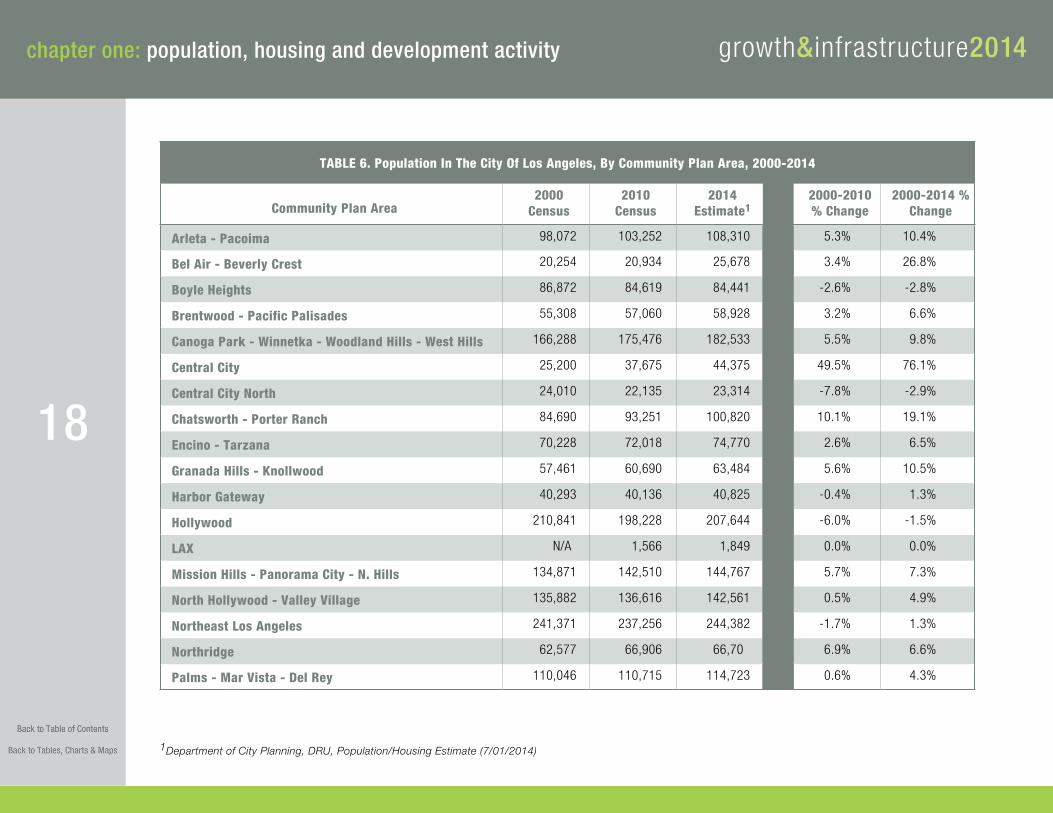
TABLE 6. Population In The City Of Los Angeles, By Community Plan Area, 2000-2014
Community Plan Area2000
Census2010
Census2014
Estimate12000-2010 % Change
2000-2014 % Change
Arleta - Pacoima 98,072 103,252 108,310 5.3% 10.4%
Bel Air - Beverly Crest 20,254 20,934 25,678 3.4% 26.8%
Boyle Heights 86,872 84,619 84,441 -2.6% -2.8%
Brentwood - Pacific Palisades 55,308 57,060 58,928 3.2% 6.6%
Canoga Park - Winnetka - Woodland Hills - West Hills 166,288 175,476 182,533 5.5% 9.8%
Central City 25,200 37,675 44,375 49.5% 76.1%
Central City North 24,010 22,135 23,314 -7.8% -2.9%
Chatsworth - Porter Ranch 84,690 93,251 100,820 10.1% 19.1%
Encino - Tarzana 70,228 72,018 74,770 2.6% 6.5%
Granada Hills - Knollwood 57,461 60,690 63,484 5.6% 10.5%
Harbor Gateway 40,293 40,136 40,825 -0.4% 1.3%
Hollywood 210,841 198,228 207,644 -6.0% -1.5%
LAX N/A 1,566 1,849 0.0% 0.0%
Mission Hills - Panorama City - N. Hills 134,871 142,510 144,767 5.7% 7.3%
North Hollywood - Valley Village 135,882 136,616 142,561 0.5% 4.9%
Northeast Los Angeles 241,371 237,256 244,382 -1.7% 1.3%
Northridge 62,577 66,906 66,70 6.9% 6.6%
Palms - Mar Vista - Del Rey 110,046 110,715 114,723 0.6% 4.3%
1Department of City Planning, DRU, Population/Housing Estimate (7/01/2014)
chapter one: population, housing and development activity growth&infrastructure2014
19
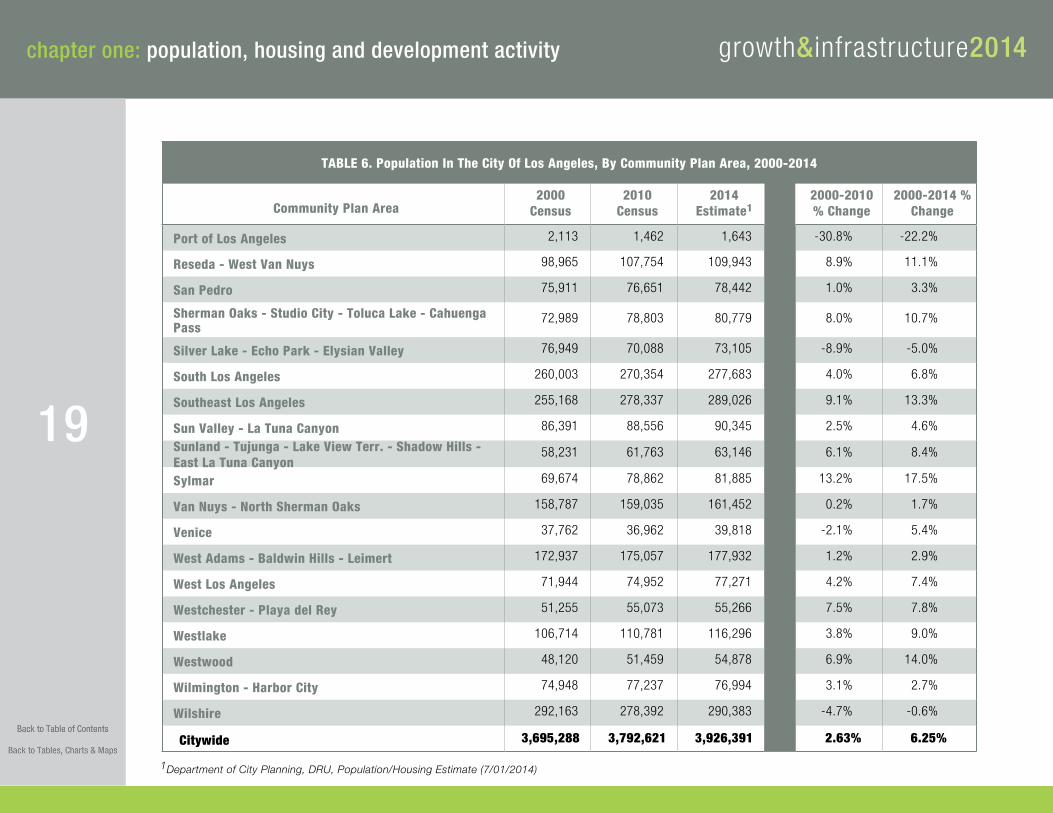
TABLE 6. Population In The City Of Los Angeles, By Community Plan Area, 2000-2014
Community Plan Area2000
Census2010
Census2014
Estimate12000-2010 % Change
2000-2014 % Change
Port of Los Angeles 2,113 1,462 1,643 -30.8% -22.2%
Reseda - West Van Nuys 98,965 107,754 109,943 8.9% 11.1%
San Pedro 75,911 76,651 78,442 1.0% 3.3%
Sherman Oaks - Studio City - Toluca Lake - Cahuenga Pass
72,989 78,803 80,779 8.0% 10.7%
Silver Lake - Echo Park - Elysian Valley 76,949 70,088 73,105 -8.9% -5.0%
South Los Angeles 260,003 270,354 277,683 4.0% 6.8%
Southeast Los Angeles 255,168 278,337 289,026 9.1% 13.3%
Sun Valley - La Tuna Canyon 86,391 88,556 90,345 2.5% 4.6%
Sunland - Tujunga - Lake View Terr. - Shadow Hills - East La Tuna Canyon
58,231 61,763 63,146 6.1% 8.4%
Sylmar 69,674 78,862 81,885 13.2% 17.5%
Van Nuys - North Sherman Oaks 158,787 159,035 161,452 0.2% 1.7%
Venice 37,762 36,962 39,818 -2.1% 5.4%
West Adams - Baldwin Hills - Leimert 172,937 175,057 177,932 1.2% 2.9%
West Los Angeles 71,944 74,952 77,271 4.2% 7.4%
Westchester - Playa del Rey 51,255 55,073 55,266 7.5% 7.8%
Westlake 106,714 110,781 116,296 3.8% 9.0%
Westwood 48,120 51,459 54,878 6.9% 14.0%
Wilmington - Harbor City 74,948 77,237 76,994 3.1% 2.7%
Wilshire 292,163 278,392 290,383 -4.7% -0.6%
Citywide 3,695,288 3,792,621 3,926,391 2.63% 6.25%
1Department of City Planning, DRU, Population/Housing Estimate (7/01/2014)
chapter one: population, housing and development activity
20
growth&infrastructure2014
MAP 1� Change in Population, 2000-2010

chapter one: population, housing and development activity growth&infrastructure2014
21
TABLE 7. Total Housing Units In The City Of Los Angeles, By Community Plan Area, 2000-2014
Community Plan Area2000 Census 2010 Census 2014
Estimate12000-2010 %
Change2000-2014 %
Change
Arleta - Pacoima 22,035 23,368 23,586 6.0% 7.0%
Bel Air - Beverly Crest 8,814 9,079 9,107 3.0% 3.3%
Boyle Heights 22,742 23,054 23,260 1.4% 2.3%
Brentwood - Pacific Palisades 25,951 27,391 27,450 5.5% 5.8%
Canoga Park - Winnetka - Woodland Hills - West Hills
61,177 66,016 66,949 7.9% 9.4%
Central City 13,269 23,626 26,010 78.1% 96.0%
Central City North 4,759 6,618 7,113 39.1% 49.5%
Chatsworth - Porter Ranch 30,713 34,031 35,020 10.8% 14.0%
Encino - Tarzana 30,747 31,686 31,747 3.1% 3.3%
Granada Hills - Knollwood 19,961 20,735 20,834 3.9% 4.4%
Harbor Gateway 12,028 12,398 12,404 3.1% 3.1%
Hollywood 99,939 103,187 105,212 3.2% 5.3%
LAX N/A 743 704 N/A N/A
Mission Hills - Panorama City - North Hills 37,700 39,652 39,878 5.2% 5.8%
North Hollywood - Valley Village 52,513 56,579 57,314 7.7% 9.1%
Northeast Los Angeles 75,290 77,644 77,804 3.1% 3.3%
Northridge 22,421 23,794 23,846 6.1% 6.4%
Palms - Mar Vista - Del Rey 50,063 52,570 53,239 5.0% 6.3%
Port of Los Angeles 471 397 397 -15.7% -15.7%
Reseda - West Van Nuys 33,995 35,837 36,228 5.4% 6.6%
San Pedro 30,745 31,662 31,819 3.0% 3.5%
Sherman Oaks - Studio City - Toluca Lake - Cahuenga Pass
39,903 42,055 42,307 5.4% 6.0%
Silver Lake - Echo Park - Elysian Valley 29,269 29,692 29,851 1.4% 2.0%

chapter one: population, housing and development activity
22
growth&infrastructure2014
TABLE 7. Total Housing Units In The City Of Los Angeles, By Community Plan Area, 2000-2014
Community Plan Area2000 Census 2010 Census 2014
Estimate12000-2010 %
Change2000-2014 %
Change
South Los Angeles 81,906 82,186 82,735 0.3% 1.0%
Southeast Los Angeles 66,156 68,651 69,885 3.8% 5.6%
Sun Valley - La Tuna Canyon 23,210 24,045 24,184 3.6% 4.2%Sunland - Tujunga - Lake View Terrace - Shadow Hills - East La Tuna Canyon
20,569 21,898 22,037 6.5% 7.1%
Sylmar 18,658 21,372 21,533 14.5% 15.4%
Van Nuys - North Sherman Oaks 58,568 60,429 60,870 3.2% 3.9%
Venice 20,637 21,568 21,727 4.5% 5.3%
West Adams - Baldwin Hills - Leimert 65,489 66,573 66,614 1.7% 1.7%
West Los Angeles 36,687 38,501 38,738 4.9% 5.6%
Westchester - Playa del Rey 22,794 25,267 25,346 10.8% 11.2%
Westlake 35,711 40,847 41,501 14.4% 16.2%
Westwood 20,602 21,908 22,030 6.3% 6.9%
Wilmington - Harbor City 22,135 23,104 22,994 4.4% 3.9%
Wilshire 120,078 125,832 127,540 4.8% 6.2%
Citywide 1,337,706 1,413,995 1,429,813 5.7% 6.9%

chapter one: population, housing and development activity growth&infrastructure2014
23£ ¤10
1£ ¤10
1
¬«118
§̈¦ 5
¬ «170
§̈ ¦210
§̈ ¦405
§̈¦ 5
§̈¦ 5
§̈ ¦405
§̈ ¦405
§̈ ¦405
§̈ ¦710
§̈¦ 5
§̈¦10
§̈¦10
§̈¦10
§̈ ¦210
£ ¤101
¬«110
¬ «103
¬«91
¬«90
¬ «134
¬« 2
§̈ ¦105
§̈¦110
¬«60
¬ «134
Sylm
arGr
anad
aHi
lls -
Knol
lwoo
d
Chat
swor
th -
Port
er R
anch
Sunl
and
- Tuj
unga
-La
ke V
iew
Ter
race
- Sha
dow
Hill
s -Ea
st L
a Tu
na C
anyo
n
Arle
ta -
Paco
ima
Mis
sion
Hills
-Pa
nora
ma
City
- Nor
th H
ills
Nor
thrid
geSu
n Va
lley
- La
Tuna
Cany
on
Cano
ga P
ark
-W
inne
tka
-W
oodl
and
Hills
- Wes
t Hill
s
Rese
da- W
est
Van
Nuy
sVa
n N
uys
- Nor
thSh
erm
an O
aks
Nor
th H
olly
woo
d- V
alle
yVi
llage
Enci
no -
Tarz
ana
Holly
woo
d
Sher
man
Oak
s -St
udio
City
- To
luca
Lake
- Ca
huen
ga P
ass
Nor
thea
stLo
s An
gele
s
Bren
twoo
d- P
acifi
cPa
lisad
es
Bel A
ir- B
ever
lyCr
est
Silv
er L
ake
- Ech
o Pa
rk -
Elys
ian
Valle
y
Wils
hire
Wes
twoo
dW
estla
ke
Cent
ral
City
Nor
th
Wes
t Los
Ange
les
Cent
ral
City
Boyl
eHe
ight
sW
est A
dam
s -Ba
ldw
in H
ills
- Lei
mer
t
Sout
h Lo
sAn
gele
s
Sout
heas
tLo
s An
gele
sPa
lms -
Mar
Vist
a -
Del R
eyVe
nice
Wes
tche
ster
-Pl
aya
del R
ey
LAX
Harb
orGa
tew
ay
Wilm
ingt
on -
Harb
or C
ity
Port
of L
osAn
gele
sSa
nPe
dro
Ü0
105
Mile
s
Sour
ce: U
S Ce
nsus
200
0, 2
010
Chan
ge in
Num
ber o
fHo
useh
olds
200
0-20
10
Rail
Line
s and
Bus
Tra
nsitw
ays
-9.6
% to
0%
0.1%
to 1
.5%
1.6%
to 3
.5%
3.6%
to 6
.0%
6.1%
to 7
1.4%
Prop
osed
Rai
l Ext
ensio
ns
Free
way
s
MAP 2� Change in Number of Households 2000-2010

chapter one: population, housing and development activity
24
growth&infrastructure2014
TABLE 8. Estimated Change In Permitted Units From 2010 Census To July 1, 2014
Area Planning Commission New SFDUs1Demolished
SFDUs New MFDUs2 Demolished MFDUs
Total Net Dwelling Units
North Valley 534 -107 1,600 -43 1,984
South Valley 496 -523 3,730 -201 3,502
West 760 -807 2,467 -601 1,819
Central 353 -365 7,879 -540 7,327
East 246 -116 728 -59 799
South 157 -588 2,498 -170 1,897
Harbor 42 -16 353 -254 125
Citywide 2,588 -2,522 19,255 -1868 17,4531SFDU: Single family Dwelling Unit, 6 month lag time applied2MFDU: Multiple Family Dwelling Unit, 10 month lag time applied
Development Activity from 2010 to July 1, 2014

chapter one: population, housing and development activity growth&infrastructure2014
25
TABLE 9: Estimated Change In Permitted Units From 2010 Census To July 1, 2014
Community Plan AreaNew
SFDUs1Demolished
SFDUs Net
SFDUsNew
MFDUs2Demolished
MFDUs Net MFDUsTotal Net Dwelling
Units
Arleta - Pacoima 19 -17 2 84 -2 82 84
Bel Air - Beverly Crest 96 -70 26 23 -15 8 34
Boyle Heights 7 -20 -13 239 -20 219 206
Brentwood - Pacific Palisades 318 -363 -45 207 -108 99 54
Canoga Park - Winnetka - Woodland Hills - West Hills
70 -23 47 1,280 0 1,280 1,327
Central City 0 0 0 2,652 0 2,652 2,652
Central City North 0 -1 -1 506 0 506 505
Chatsworth - Porter Ranch 185 -4 181 807 0 807 988
Encino - Tarzana 83 -91 -8 52 -2 50 42
Granada Hills - Knollwood 27 -3 24 68 0 68 92
Harbor Gateway 11 -3 8 97 0 97 105
Hollywood 198 -185 13 2,024 -130 1,894 1,907
Los Angeles International Airport 0 -11 -11 0 -24 -24 -35
Mission Hills - Panorama City - North Hills 11 -13 -2 255 -35 220 218
North Hollywood - Valley Village 52 -79 -27 1,105 -85 1,020 993
Northeast Los Angeles 145 -53 92 324 -2 322 414
Northridge 14 -12 2 47 -4 43 45
Palms - Mar Vista - Del Rey 76 -80 -4 790 -25 765 761
Reseda - West Van Nuys 26 -16 10 392 0 392 402
San Pedro 20 -8 12 113 -4 109 121

chapter one: population, housing and development activity
26
growth&infrastructure2014
TABLE 9: Estimated Change In Permitted Units From 2010 Census To July 1, 2014
Community Plan AreaNew
SFDUs1Demolished
SFDUs Net
SFDUsNew
MFDUs2Demolished
MFDUs Net MFDUsTotal Net Dwelling
Units
Sherman Oaks - Studio City - Toluca Lake - Cahuenga Pass
209 -236 -27 348 -98 250 223
Silver Lake - Echo Park - Elysian Valley 94 -43 51 165 -37 128 179
South Los Angeles 40 -161 -121 603 -45 558 437
Southeast Los Angeles 86 -391 -305 1,780 -101 1,679 1,374
Sun Valley - La Tuna Canyon 23 -19 4 137 0 137 141
Sunland - Tujunga - Lake View Terrace - Shadow Hills - East La Tuna Canyon
137 -28 109 118 -2 116 225
Sylmar 118 -11 107 84 0 84 191
Van Nuys - North Sherman Oaks 56 -78 -22 553 -16 537 515
Venice 99 -98 1 190 -39 151 152
West Adams - Baldwin Hills - Leimert 31 -36 -5 115 -24 91 86
West Los Angeles 119 -140 -21 431 -127 304 283
Westchester - Playa del Rey 24 -12 12 582 -77 505 517
Westlake 3 -6 -3 746 -69 677 674
Westwood 28 -33 -5 244 -186 58 53
Wilmington - Harbor City 11 -5 6 143 -250 -107 -101
Wilshire 152 -173 -21 1,951 -341 1,610 1,589
Citywide 2,588 -2,522 66 19,255 -1,868 17,387 17,4531SFDU: Single family Dwelling Unit, 6 month lag time applied2MFDU: Multiple Family Dwelling Unit, 10 month lag time applied

chapter one: population, housing and development activity growth&infrastructure2014
27
TABLE 10. Estimated Change In Non-Residential Development From 2010 Census To July 1, 2014
Area Planning Commission Total Retail Space (Square Feet)1
Total Office Space (Square Feet)
Total Industrial Space (Square Feet)
North Valley 311,346 552,741 462,140
South Valley 1,176,188 -13,177 -579,348
West 1,517,318 -843,535 -454,449
Central 3,091,817 308,824 820,562
East 317,942 299,461 -532,797
South -38,276 112,076 -4,475
Harbor 520,446 63,843 -223,241
Citywide 6,896,781 480,233 -511,608
1Department of Building & Safety, PCIS. In Square Feet. 04/02/2010-06/30/2014

chapter one: population, housing and development activity
28
growth&infrastructure2014
TABLE 11: Estimated Change In Non-Residential Development (Sqft) Since 2010 Census
Community Plan Area
Total Retail Space (Square
Feet)1
Total Office Space (Square
Feet)
Total Industrial Space (Square
Feet)
Total Net Permits
Arleta - Pacoima 71,408 64,878 90,478 84
Bel Air - Beverly Crest 13,042 4,691 0 34
Boyle Heights 1,572 51,868 -214,403 206
Brentwood - Pacific Palisades 54,250 -8,477 -359 54
Canoga Park - Winnetka - Woodland Hills - West Hills 517,308 -21,653 -172,415 1,327
Central City -549,671 20,597 789,052 2,652
Central City North 363,676 -14,813 208,054 505
Chatsworth - Porter Ranch -143,594 350,269 -72,170 988
Encino - Tarzana 72,886 -11,020 762 42
Granada Hills - Knollwood 55,876 -24,383 -700 92
Harbor Gateway 269,782 93,873 -245,452 105
Hollywood 1,095,758 424,517 -139,870 1,907
Los Angeles International Airport 2,880 13,107 -15,826 -35
Mission Hills - Panorama City - North Hills 107,036 46,207 394 218
North Hollywood - Valley Village 211,688 79,721 -104,819 993
Northeast Los Angeles 159,070 264,708 -273,264 414
Northridge 17,622 -11,907 7,450 45
Palms - Mar Vista - Del Rey 51,250 163,505 -127,801 761
Port of Los Angeles 135,800 -35,526 -88,747 0
1Department of Building & Safety, PCIS. In Square Feet. 04/02/2010-06/30/2014

chapter one: population, housing and development activity growth&infrastructure2014
29
TABLE 11: Estimated Change In Non-Residential Development (Sqft) Since 2010 Census
Community Plan Area
Total Retail Space (Square
Feet)1
Total Office Space (Square
Feet)
Total Industrial Space (Square
Feet)
Total Net Permits
Reseda - West Van Nuys -37,658 -7,816 -60,825 402
San Pedro 56,290 -12,192 104,763 121
Sherman Oaks - Studio City - Toluca Lake - Cahuenga Pass 141,266 58,290 57 223
Silver Lake - Echo Park - Elysian Valley 157,300 -17,115 -45,130 179
South Los Angeles -72,064 71,011 -173,287 437
Southeast Los Angeles 400,174 12,790 198,724 1,374
Sun Valley - La Tuna Canyon 143,168 43,190 315,455 141
Sunland - Tujunga - Lake View Terrace - Shadow Hills - East La Tuna Canyon
34,976 5,639 1,716 225
Sylmar 24,854 78,848 119,517 191
Van Nuys - North Sherman Oaks 270,698 -110,699 -242,108 515
Venice 156,144 -12,858 -10,299 152
West Adams - Baldwin Hills - Leimert -366,386 28,275 -29,912 86
West Los Angeles -65,930 -999,652 -164,796 283
Westchester - Playa del Rey 1,296,746 -36,236 -135,368 517
Westlake 201,678 -111,259 -54,423 674
Westwood 8,936 32,385 0 53
Wilmington - Harbor City 58,574 17,688 6,195 -101
Wilshire 1,980,376 -10,218 17,749 1,589
Citywide Total 6,896,781 480,233 -511,608 17,4531Department of Building & Safety, PCIS. In Square Feet. 04/02/2010-06/30/2014

30
growth&infrastructure2014chapter two: transportation
The City of Los Angeles transportation system and services
are provided by a variety of jurisdictions and agencies: California Department of
Transportation (Caltrans), County Metropolitan Transportation Authority (Metro),
Los Angeles Department of Transportation (LADOT), Los Angeles Department of
City Planning (DCP), and Department of Public Works Bureau of Street Services.
Transportation infrastructure and public services in the City include networks
of highways and roads, sidewalks and paths, bikeways, bridges, transit, and
supporting assets such as lights and signals.
This transportation section provides an overview of
transportation infrastructure and services in the City
of Los Angeles.
California Department of Transportation (Caltrans)The California Department of Transportation (Caltrans) is responsible for planning, design, construction, maintenance, and operation of the state highway system. The City of Los Angeles is located within the jurisdiction of Caltrans District 7, which includes Los Angeles and Ventura counties. District 7 is responsible for 42 freeways and highways consisting of 915 freeway and highway miles in Los Angeles County and 273 miles in Ventura County. On average, 100 million vehicle miles are traveled daily on District 7 freeways.
High Occupancy Vehicle (HOV) Annual Report 2011Caltrans District 7 (Los Angeles and Ventura Counties) has the nation’s most extensive High Occupancy Vehicle (HOV) lane program, which will be adding carpool lanes to virtually every freeway in the Los Angeles area. The HOV program increases mobility in the region and is also the least expensive method for accommodating economic growth and development.
As of August 2011, there were 514 HOV lane miles built, 39 under construction, 77 in design process, and 70 miles in planning process in Los Angeles and Ventura Counties. HOV facilities in Los Angeles County carry approximately 331,000 vehicles or 780,000 people per day.
Caltrans prepares an Annual Report of its High Occupancy Vehicle program. The Report provides information on the status of HOV projects, capacity, and other facility and infrastructure related to the project.
Los Angeles County Metropolitan Transportation Authority (Metro)The Los Angeles County Metropolitan Transportation Authority (Metro) serves as transportation planner and coordinator, designer, builder, and operator for the 1,433 square mile service within the Los Angeles County.
Long Range Transportation Plan 2009-2040Metro’s 2009 Long Range Transportation Plan provides a 30-year vision for Los Angeles County’s transportation system to the year 2040. The Plan identifies public transportation and highway projects, funding forecasts over a 30-year timeframe, multi-modal funding availability, sub-regional needs, and project performance measures.
chapter two: transportation growth&infrastructure2014
31
Los Angeles Department of Transportation (LADOT)Short Range Transit Plan 2012-13 (March 2013)The Short Range Transit Plan provides an overview of the transit system in the City of Los Angeles including transit services provided and areas served, ridership, and inventory of fleet and equipment. The Plan also discusses budget and financial resources to support the Department’s goals and objectives for fiscal years 2012-15. The City of Los Angeles, through LADOT’s Transit Bureau, provides fixed-route and demand-response (paratransit) services throughout the City.
Commuter Express
LADOT provides a suburb-to-Downtown or suburb-to-suburb Commuter Express bus service via 14 routes. Most buses operate primarily during peak commute periods from 5:00 AM to 9:00 AM (AM Peak) and from 3:00 PM to 7:00 PM (PM Peak). Commuter Express carried about 2.1 million passengers in FY 2011-12.
LADOT operates a fleet of 103 Commuter Express buses. All vehicles are powered by cleaner burning compressed natural gas (CNG).
DASH
DASH Downtown Los Angeles and community DASH are shuttle bus services designed to provide localized service in Downtown LA and in 26 neighborhoods all across the City. Each route serves trips within that neighborhood and connects to other regional transit services such as Metro Rapid and local routes, Metrolink and Metro rail lines. DASH buses typically travel circuitous fixed routes and provide access to various activity centers, such as parks, recreation centers, cultural sites, medical facilities and retail areas. DASH buses carried about 21.8 million passengers in FY 2011-12.
LADOT operates a total of 209 DASH buses. All buses are powered by cleaner burning liquid propane gas (LPG) or CNG.
Cityride
Cityride is a transportation assistance program for individuals age 65 or older and qualified persons with disabilities in the City of Los Angeles and select areas
of Los Angeles County. The program offers reduced costs for participants to purchase rides on City of Los Angeles permitted taxis or LADOT operated dial-a-ride services (DAR). Cityride, DAR and taxi service carried about 221,000 passengers in FY 2011-12.
The dial-a-ride service operates with 44 cut-away vehicles, each seating 6 to 10 passengers and equipped with a wheelchair lift.
All LADOT transit services are funded by City Proposition A Local Transit Assistance (PALTA) funds and administered by LADOT. In addition, LADOT also receives operating assistance from Metro and capital funding from Metro and the Federal Transit Administration (FTA).
LADOT Annual Report 2013-14 The Los Angeles Department of Transportation (LADOT) prepares an annual report
that highlights key elements of the City’s transportation infrastructure and recent
accomplishments.
The following list highlights some of LADOT’s accomplishments and milestones in the
FY 2013-14:
• Installed 40 miles of new bike lanes, 20 miles of sharrows, 180 bicycle racks, 5
bicycle corrals and 4 repair stations.
• Continental Crosswalks are the standard. As the first initiative of the Active
Transportation team, the city has already installed highly visible continental
crosswalks with advance limit lines at over 800 intersections, providing a clear zone
for pedestrians and bicyclists.
• Many safety improvement projects were completed citywide, including 12 funded
under the Highway Safety Improvement Program (HSIP). Safety improvements for this
fiscal year included 11 new traffic signals, left turn phasing at 7 intersections and 62
speed feedback signs.
• Continued to pursue the goal of having 80% of the non-wheelchair accessible fleet
changed to “green” taxicabs by the end of calendar year 2015.

chapter two: transportation
32
growth&infrastructure2014
• To further enhance our public space, the People Street program was launched, a
citywide program for installing plazas, parklets and bicycle corrals. These below-
the curb projects transform underused roadway to create vibrant spaces in our
neighborhoods. Please visit peoplest.lacity.org.
• Continued to enhance LADOT’s real-time bus arrival time information for all LADOT
DASH and Commuter Express transit services. The real time information can be
accessed anytime, anywhere through our dedicated website at ladotbus.com using a
computer or mobile device.
• Through Express Park, continued to implement one of the first in the world real-
time demand-based parking pricing in Downtown. Demand-based pricing is a
concept used to better match the availability of parking spaces to the demand for
those spaces – when demand for parking is low, rates are low and when demand is
high, rates increase.
Traffic Safety and Operational Improvement Projects 2011-12 (June 1, 2012)The Traffic Safety and Operational Improvement Projects Report lists traffic safety and operational improvement projects by Council District. Projects include 42 new signals, 84 left turn arrows, 29 bike lane projects, 92 speed feedback signs, 9 ATSAC system, 1 pedestrian warning devices, and 3 safety improvements.
The City of Los Angeles Transportation Profile 2013-14 The Department of Transportation prepared the Los Angeles Transportation Profile to provide a comprehensive overview of the transportation system in the City of Los Angeles. The Report provides an inventory of the City’s airport and harbor system, street and freeway network, parking, taxi, and transit facilities. In addition, the Report includes data on the City’s goods movement, mode share, commuting, traffic congestion, and pedestrian and bicyclists.
As described in the LADOT Annual Report – Fiscal Year 2013-
14, key facts for the City of Los Angeles include:
Citywide Streets Inventory and Freeway System ■ Approximately 6,500 miles of dedicated public streets
■ 181 miles of freeway
■ 4,300 signalized intersections and 1,800 signalized approaches with left-turn arrows
■ 40,000 intersections
■ 22,000 marked crosswalks
■ 1,200 miles of red, yellow, white, geen and blue curb markings
Inventory of Citywide On-and-Off Street Parking Controls ■ 35,244 on-street parking meters
■ 33,556 on-street card & coin
chapter two: transportation growth&infrastructure2014
33
■ 2,269 off-street metered spaces
■ 391 off-street card & coin
■ 118 off-street parking facilities
Parking
■ LADOT manages 135 established Preferential Parking Districts (PPDs)
Commute ■ According to the 2005 U.S. Census Bureau data, the City of Los Angeles has
approximately 1.7 million workers over 16. About 1.6 million workers work outside of the home. 52 percent of workers who work outside of the home spend less than half an hour commuting to work and 12 percent of workers spend an hour or more commuting to work. The average commute time was 29.6 minutes.
Traffic Volume CountsLADOT’s Traffic Volume Counts webpage provides data on both historic and current traffic counts. Detailed traffic count data at the intersection level can also be found on the NavigateLA system.
In addition, LADOT collects traffic counts and conducts performance level evaluation of 47 major intersections throughout the City. This effort is conducted biennially pursuant to the State-mandated Congestion Management Program.
City of Los Angeles Department of City Planning (DCP) Transportation/Mobility Element of The General Plan The Transportation Element in the General Plan sets forth transportation goals, objectives, and policies to achieve long-term mobility and accessibility within the City of Los Angeles. The City has three transportation goals: adequate accessibility to work and services; well-maintained street system; and an integrated system of pedestrian-friendly streets, bikeways, and scenic highways. Each goal is supplemented by objectives and policies, which establish a citywide strategy to maintain and improve transportation conditions in the City of Los Angeles.
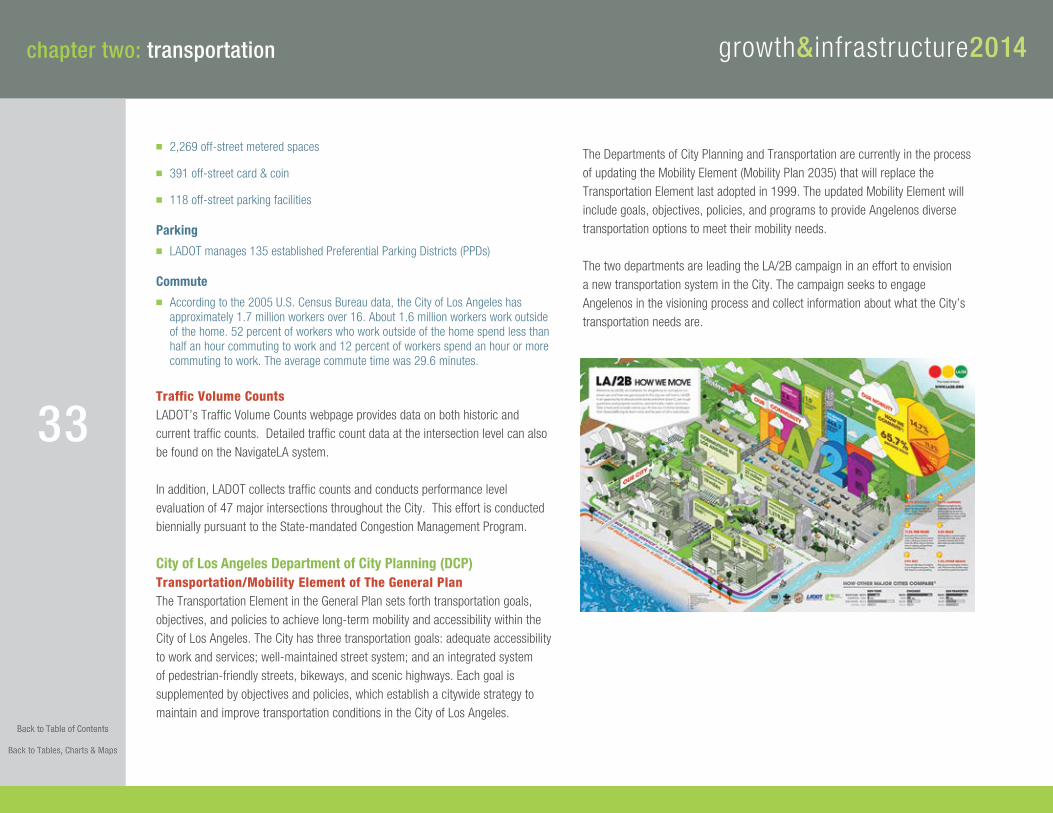
The Departments of City Planning and Transportation are currently in the process of updating the Mobility Element (Mobility Plan 2035) that will replace the Transportation Element last adopted in 1999. The updated Mobility Element willinclude goals, objectives, policies, and programs to provide Angelenos diverse transportation options to meet their mobility needs.
The two departments are leading the LA/2B campaign in an effort to envision a new transportation system in the City. The campaign seeks to engage Angelenos in the visioning process and collect information about what the City’s transportation needs are.

chapter two: transportation
34
growth&infrastructure2014
Transportation Improvement and Mitigation Programs (TIMPs)The Department of City Planning, with assistance from the Department of Transportation, develops Transportation Improvement and Mitigation Plans (TIMPs) for each Community Plan area as part of the Community Plan Update Program. TIMPs set forth recommended measures to mitigate impacts of future traffic growth. In addition, TIMPs define neighborhood traffic management strategies to protect residential areas from the intrusion of traffic from nearby commercial and/or industrial development and of regional traffic.
Department of Public Works Bureau of Street ServicesThe Bureau of Street Services is responsible for maintenance, repairing, resurfacing, and cleaning improved streets, alleys, bridges, tunnels, pedestrian subways, and related structures. The Bureau also maintains street trees and landscaped median islands and embankments.
Bureau of Street Services Master Plan 2011-13The Master Plan provides a guiding blueprint for the Bureau of Street Services for two years from 2011 to 2013. The Plan introduces key strategies, initiatives, and programs to improve street infrastructure in the City of Los Angeles.
The Bureau has adopted two implementation strategies to improve infrastructure sustainability, transportation, and new technology. The two strategies are the One
Hundred Days Initiatives and Two-Year Rollout.
The One Hundred Days strategy included ten programs to deliver multi-functional
targeted services:
1. Signature Streets Program
2. BSS Service Centers
3. Operation Smooth Lanes
4. Intersection Repair Program
5. Operation Downtown
6. “City of LA Cold Patch” Pilot Project
7. Transfer Site Compactors
8. Operation Safe Schools
9. BSS Bikeway Steward Program
10. New BSS Website

chapter two: transportation growth&infrastructure2014
35
The Two-Year Rollout strategy includes four projects and programs:
1. New Rubberized Slurry Seal mix
2. New asphalt plant with increased recycling capacity
3. Cool Street Program pilot
4. New rut-resistant asphalt mix (LA MIX)
State of the Streets Report 2011The Bureau of Street Services completed an assessment of the City of Los Angeles’ street network in the State of the Streets Report. This triennial report also identifies funding needs and strategies to minimize the impacts created by insufficient preventive maintenance and resurfacing funding.
Street Inventory
The City of Los Angeles has approximately 6,500 centerline miles of improved streets that are categorized into two types of street systems: Select and Local streets.
Select streets are considered “non-residential” streets, which are 45 feet to 100 feet wide throughways that connect distant locations. There are approximately 2,600 centerline miles of the entire network. Select streets are expected to last about 15 to 20 years.
Local roadways are known as “residential” streets, and their street width varies between 15 feet and 45 feet. The City has approximately 3,900 centerline miles of Local roadways, and this class of roads is expected to last 30 to 35 years.
Street Infrastructure Condition Assessment
The Bureau of Street Services adopted the Pavement Management System and the MicroPAVER system to monitor and maintain the City’s 6,500 centerline mile street system. Using the system, the City’s streets were identified and rated from A to F with A being the best, and F being the poorest. The condition levels were
chapter two: transportation
36
growth&infrastructure2014
determined by using the internationally accepted Pavement Condition Index (PCI). The PCI is an index of the pavements’ structural and surface operational condition and has a numerical rating index, ranging from 0 for a failed pavement to 100 for a pavement in perfect condition.
The results of the City of Los Angeles Street Infrastructure Condition Assessment
are as follows:
■ 21 percent of the street system is in condition “A” (PCI 86 to 100)
■ 23 percent of the street system is in condition “B” (PCI 71 to 85)
■ 18 percent of the street system is in condition “C” (PCI 56 to 70)
■ 13 percent of the street system is in condition “D” (PCI 41 to 55)
■ 25 percent of the street system is in condition “F” (PCI 0 to 40)
The results indicate that the entire street system has an average PCI of 61.52, or a grade C.
Funding Needs
Based on the results of the Street Infrastructure Condition Assessment, the Bureau of Street Services set a goal to improve the street system to an average street network PCI of 80, or an average condition level of B. To maintain the street network at the Bureau’s goal, the Bureau of Street Service estimates the total annual expenditure of approximately $263 million.
Year End Report 2011-12The Bureau of Street Services produces an annual report called the Year End Report. This report provides an overview of the Bureau’s accomplishments and milestones through their Pavement Preservation Program, Street Cleaning Program, Urban Forestry Division, and Investigation and Enforcement Division. During the year 2011-12, the Bureau of Street Services completed 747 miles of pavement preservation work. Some of the works include resurfacing 236
centerline miles of streets, applying slurry seal to 401 centerline miles of streets, and repairing more than 300,000 potholes.
The Bureau’s Street Cleaning Program is responsible for sweeping approximately 13,000 curb miles of streets. This program is essential to maintaining sanitary environmental and public conditions. In 2011-12, the Bureau removed 6,000 cubic yards of green waste as part of the City’s weed abatement program and 95,500 cubic yards of debris from streets and alleys.
The Bureau is responsible for maintaining and preserving the City’s urban forest, one of the important elements of the public works infrastructure. In 2011-12, the Bureau planted more than 3,000 trees and maintained over 300 acres of improved median islands.
chapter two: transportation growth&infrastructure2014
37
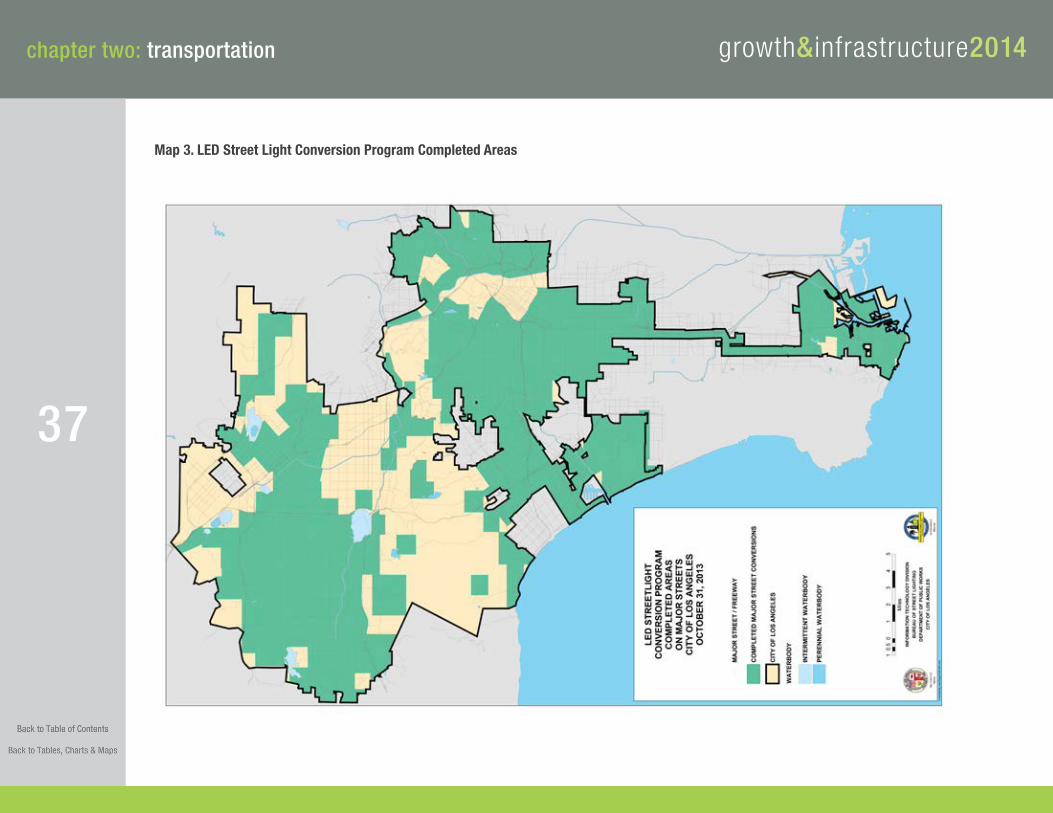
Map 3� LED Street Light Conversion Program Completed Areas

chapter three: water
38
growth&infrastructure2014chapter three: water
The City of Los Angeles created a municipal water system
by acquiring title to all properties of a private water company and established the
Los Angeles Department of Water and Power (LADWP) in 1902. Since then, LADWP
has become the largest municipally owned and operated retail water utility in the
nation, providing water supply of about 168 billion gallons to 3.8 million residents
in the City of Los Angeles. Primary sources of water for the LADWP service area are
the Los Angeles Aqueducts, local groundwater, recycled water, and imported water
purchased from the Metropolitan Water District of Southern California.
LADWP delivers water to its customers through a complex and expansive network water system. The system consists of large and small pipes measuring more than 7,200 miles in length. Trunk lines are pipes with a diameter greater than 20 inches that transport water from wells and aqueducts to reservoirs. These trunk lines are connected to smaller pipes called distribution mains that supply water to the customers’ service connection.
This water section provides an overview of agencies responsible for water supply in the City of Los Angeles. The Metropolitan Water District of Southern California and the Los Angeles Department of Water and Power produce annual reports, management plans, and other documents to provide information about water demand, supply, capacity, and infrastructure. Metropolitan Water District of Southern California The Metropolitan Water District of Southern California (MWD) is a consortium of 26 cities and water districts that provides drinking water to approximately 19 million people in parts of Los Angeles, Orange, San Diego, Riverside, San Bernardino and Ventura counties. The MWD is the largest water supplier for the City of Los Angeles.
The MWD owns and operates an extensive range of capital facilities including the Colorado River Aqueduct, 16 hydroelectric facilities, nine reservoirs, about 1,000 miles of large-scale pipes and five water treatment plants. For detailed information about the District’s capital facilities, please visit the MWD at a Glance website: http://www.mwdh2o.com.
The MWD delivers an average of 1.7 billion gallons of water per day to a 5,200 square mile service area, a six-county region from Ventura County in the north to San Diego County in the south through a conveyance and distribution system.
The Metropolitan Water District of Southern California Annual Report 2013The Metropolitan Water District of Southern California (MWD) produces an annual report each Fiscal Year. The Annual Report 2012 provides detailed information about the MWD and summarizes the district’s priorities, key policy issues, and accomplishments during 2012-13.

growth&infrastructure2014
39
chapter three: water
AccomplishmentsThe District was able to begin the year 2013 with record-high water reserves because of its strategic investments in infrastructure and water conservation projects. However, record and near-record dry conditions impacted California throughout the year. Lake Powell and Lake Mead’s lower water levels increase the probability of a shortage declaration in the coming years; however, Metropolitan is approaching the challenge with assurances of key supplemental baseline supplies from the Imperial and Palo Verde valleys along with stored reserves in Lake Mead thanks to extraordinary conservation efforts.
Meanwhile, an aging distribution system presented new needs for reinvestment. By 2012/13, about 40 percent of Metropolitan’s water delivery system was more than 60 years old. Metropolitan continued systematically modernizing its system through capital reinvestments, as exemplified by the upgrade of the Upper Feeder pipeline delivering treated drinking water from the F.E. Weymouth Water Treatment Plant in La Verne. In April 2012, the Board of Directors adopted a two-year budget that directs more than 50 percent of its capital budget to refurbishment and replacement.
Water SupplyThe Metropolitan Water District currently has three main sources of water: State Water Project; Colorado River; and local resources including recycled water, groundwater, and seawater desalination.
The State Water Project experienced record rainfall in December 2012 throughout the SWP watershed and SWP supplies for CY 2013 were off to a good start. However, the weather changed, and SWP precipitation during the second half of FY 2012/13 was the lowest on record. By the end of FY 2012/13, the final SWP allocation for CY 2013 was set at 35 percent. In addition to Table A water, Metropolitan purchased 32,000 AF of Turnback Pool supplies and 11,000 AF of Yuba Accord supplies, and had about 900,000 AF of Colorado River Aqueduct water.
These supplies, along with projected CY 2013 demands of nearly 2.0 MAF, mean that storage at the end of CY 2013 will drop by about 400,000 AF. Total dry-year storage reserves are expected to end the 2013 calendar year at roughly 2.3 million AF, a drop from the prior year, but still the second highest end of year storage in Metropolitan history.
Water SalesIn fiscal year 2012/13, Metropolitan sold more than 1.68 million acre-feet (AF) of water, with daily system deliveries as high as 7,000 AF per day. An acre-foot will serve two households in and around their homes for a year. Treated water sales were 984,000 AF and untreated water sales were 700,000 AF. Generally drier conditions and a recovering economy this fiscal year contributed to water sales that were about 140,000 AF higher than the prior fiscal year. Although sales were higher than in FY 2011/12, they remained below the 10-year annual average of 2.0 million AF. This was due to various factors, including continued conservation, milder temperatures and a softer economy.
The City of Los Angeles was the fourth largest water customer of the MWD in 2012 with water sales of 181,090 acre-ft (9% increase since 2011). The City bought about 9.6% of the MWD’s water reserve (down from 10.2% in 2011).

chapter three: water
40
growth&infrastructure2014
Los Angeles Department of Water and PowerThe Los Angeles Department of Water and Power (LADWP) is responsible for the delivery of water and electricity to residents and businesses in the City of Los Angeles. The LADWP provides about 168 billion gallons of water to 3.9 million residents and 676,000 customers each year.
Urban Water Management Plan 2010-2015The Los Angeles Department of Water and Power (LADWP) prepares and adopts an Urban Water Management Plan (UWMP) every five years to evaluate future water demands and supplies under average and dry year conditions.
Water Issues
As demands for additional water supplies increases, LADWP and other water agencies in Southern California are faced with the challenge of providing a reliable water supply for a growing population. Water supplies in California and locally have become scarcer in the past five years due to multi-year dry weather conditions. The challenge of water management in the State is the year-to-year variability in availability of surface water due to hydrologic conditions from wet to dry years. Global climate change is projected to adversely impact future imported and local water supplies. Also, environmental regulations can result in temporary or permanent
restrictions in certain water supplies. Finally, local groundwater contamination has resulted in reduced groundwater supplies for the City of Los Angeles.
Existing Water Supply
The primary sources of water supply for the City of Los Angeles are the Los Angeles Aqueducts, local groundwater, recycled water, and supplemental water purchased from the Metropolitan Water District of Southern California (MWD). The Los Angeles Aqueduct (LAA) has been a significant water supply source since its construction in the early 1900’s. It provided an average of 36 percent of total water supplies from FY 2005/06 to 2009/10.
The City has been relying on local groundwater as the major component of its local water supply. Over the last ten years, local groundwater has provided approximately 11 percent of the total water supply for Los Angeles.
Recycled water is increasingly becoming a larger source in the overall water supply. In 1979, LADWP began delivering recycled water for irrigation of areas in Griffith Park. This service expanded throughout the years to include city parks, golf courses, freeway landscaping, and non-governmental uses. Recycled water is produced by the Hyperion Treatment Plant, Terminal Island Water Reclamation Plant, Donald C. Tillman Water Reclamation Plant, and the Los Angeles-Glendale Water Reclamation Plant. Recycled water currently supplies about 1 percent of total water supplies. LADWP expects to increase the use of recycled water to 59,000 acre-feet per year by 2035, or 8% of total water supplies.
LADWP is exclusively a retailer and has historically purchased water from the Metropolitan Water District to make up the deficit between demand and other City supplies. Historically, purchases of MWD water have varied from 4 percent in FY 1983/84 to 71 percent in FY 2008/09. Between FY 2005/06 and FY 2009/10, a 5-year average of 52 percent of water was purchased from MWD. Sourcing from the Los Angeles Aqueduct has declined in order to provide environmental mitigation in the Owens Valley, resulting in generally higher levels of MWD purchases.

growth&infrastructure2014
41
chapter three: water
LADWP Service Area Demographic Projection
LADWP provides water service to the City of Los Angeles as well as outside the City’s boundary to portions of West Hollywood, Culver City, Universal City, and small parts of the County of Los Angeles. The population within LADWP’s service area increased from 2.97 million in 1980 to 4.1 million in 2009, representing an average annual growth rate of 1.3 percent. The total number of housing units within the service area increased from 1.10 million in 1980 to 1.38 million in 2009, representing an average annual growth rate of 0.9 percent. Employment increased by about 0.3 percent annually from 1990 to 2009.Demographic projections for LADWP’s service area are based on the 2008 forecast generated by the Southern California Association of Governments (SCAG). Service area population is expected to increase at a rate of 0.4 annually over the next 25 years. While this growth is substantially less than the historical 1.3 percent annual growth rate from 1980 to 2009, it projects about 367,300 new residents over the next 25 years.
Historical Water Demand
Total water demand varies from year to year due to a number of factors such as population growth, weather, water conservation, drought, and economic activity. In Fiscal Year 1989/90, per capita water use was 173 gallons per day (GPD). By FY 1999/00, per capita water use fell to 159 GPD, a 10 percent reduction from 1990. In FY 2009/10, per capita water use was estimated to be 117 GPD. Although water usage has been decreasing over the years, it is important to note that mandatory conservation and a severe economic recession were occurring at this time.
In 2009, a 3-year water supply shortage coinciding with an economic recession required LADWP to impose mandatory conservation, which resulted in water usage decrease by 19 percent in Fiscal Year 2009/10 from Fiscal Year 2006/07.
LADWP maintains historical water use data based on the following categories: single-family residential, multifamily residential, commercial, industrial, government, and non-revenue water. Single-family residential water use comprises the largest category of demand in LADWP’s service area, representing about 36 percent of the total. Multifamily residential water use is the next largest category of demand, representing about 29 percent of the total. Industrial use represents the smallest category with only 4 percent of the total demand. Total water use has varied substantially from year to year, but the percentage breakdown of total demand between major billing categories has not.
Water Demand Forecast
LADWP has developed a water demand forecast methodology for each of its major categories of demand. This allows the City to better understand trends in water use and target conservation programs.

chapter three: water
42
growth&infrastructure2014
By 2030, water demand is expected to increase from 554,556 acre-feet in 2010 (estimated) to 701,164 acre-feet with passive water conservation efforts. With both passive and active water conservation measures, water demand is expected to increase from 545,771 acre-feet in 2010 (actual) to 643,785 acre-feet in 2030.
Future Water SuppliesRecycled water
LADWP expects to increase recycled use by approximately 1,500 AFY annually and have a total recycled water use of 59,000 AFY by 2035. Stormwater Capture
The 2010 UWMP projects that stormwater capture can potentially increase the water supply by a total of 25,000 AFY by Fiscal Year 2034/35. Water Transfers
LADWP plans on acquiring water through transfers to replace a portion of LAA water used for environmental enhancements in the eastern Sierra Nevada. The City is seeking non-State Water Project water to replace the reallocation of LAA water supply. LADWP is constructing an interconnection called the Neenach Pumping Station between the LAA and the State Water Project’s California
Aqueduct. This new interconnection will allow for the water transfers from the East Branch of the State Water Project to the LAA System. The current goal is to transfer up to 40,000 AF per year once the Neenach Pumping Station facilities are in place.
Water Supply Reliability
With its investments in storage, water transfers, and improvements to the reliability of the Delta, LADWP does not expect to experience water shortage within the next 25 years. Increased local water supplies coupled with additional water conservation efforts is projected to increase local supply from the current 12 percent to 43 percent by 2035. This increase of local supply mix is expected to allow LADWP to reduce purchases from the MWD water supply from 28 percent by Fiscal Year 2034/35.
Water System Ten-Year Capital Improvement Program 2010-2019The Water System Capital Improvement Program is a ten-year plan focusing on maintaining or replacing existing infrastructure and constructing new facilities. The ten-year capital budget for 2010-2019 is approximately $6.6 billion, which is segmented into four major categorie: Infrastructure Reliability, Water Supply, Regulatory Compliance, and Other Strategic Activities.
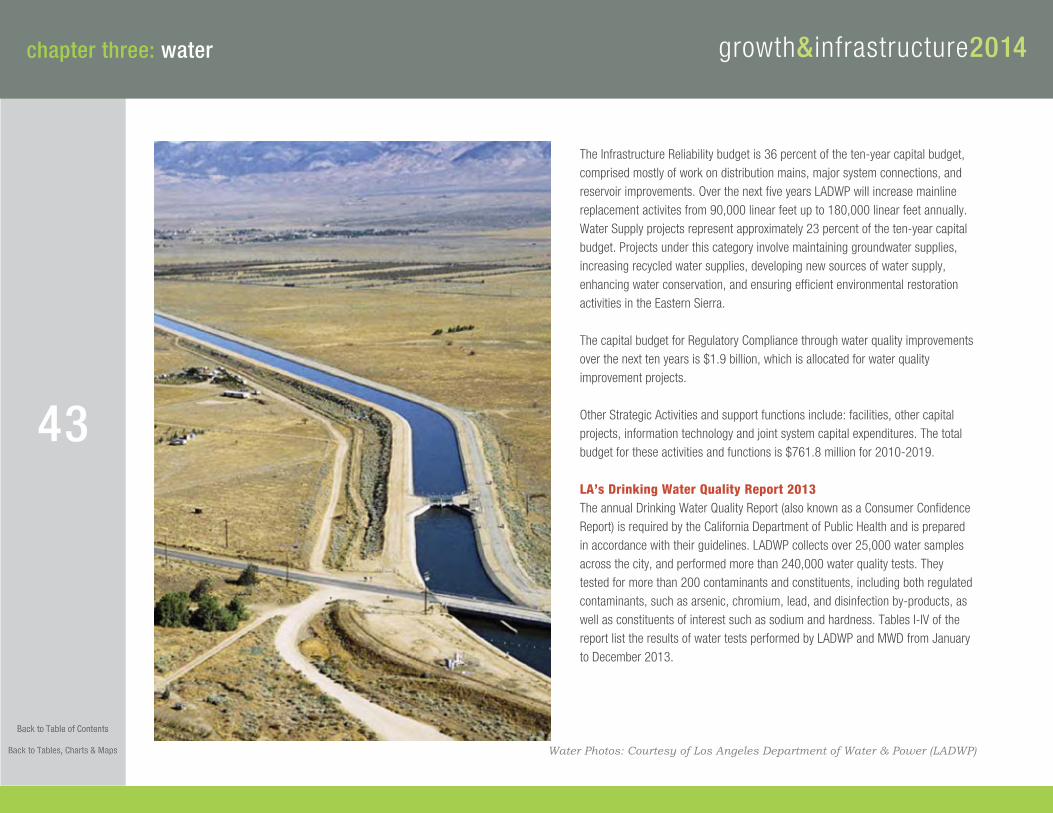
growth&infrastructure2014
43
chapter three: water
The Infrastructure Reliability budget is 36 percent of the ten-year capital budget, comprised mostly of work on distribution mains, major system connections, and reservoir improvements. Over the next five years LADWP will increase mainline replacement activites from 90,000 linear feet up to 180,000 linear feet annually. Water Supply projects represent approximately 23 percent of the ten-year capital budget. Projects under this category involve maintaining groundwater supplies, increasing recycled water supplies, developing new sources of water supply, enhancing water conservation, and ensuring efficient environmental restoration activities in the Eastern Sierra.
The capital budget for Regulatory Compliance through water quality improvements over the next ten years is $1.9 billion, which is allocated for water quality improvement projects.
Other Strategic Activities and support functions include: facilities, other capital projects, information technology and joint system capital expenditures. The total budget for these activities and functions is $761.8 million for 2010-2019.
LA’s Drinking Water Quality Report 2013The annual Drinking Water Quality Report (also known as a Consumer Confidence Report) is required by the California Department of Public Health and is prepared in accordance with their guidelines. LADWP collects over 25,000 water samples across the city, and performed more than 240,000 water quality tests. They tested for more than 200 contaminants and constituents, including both regulated contaminants, such as arsenic, chromium, lead, and disinfection by-products, as well as constituents of interest such as sodium and hardness. Tables I-IV of the report list the results of water tests performed by LADWP and MWD from January to December 2013.
Water Photos: Courtesy of Los Angeles Department of Water & Power (LADWP)

44
growth&infrastructure2014chapter four: wastewater/sewer
Wastewater generated within the City of Los Angeles
is collected and treated by two agencies: the Sanitation Districts of Los Angeles
County and the Department of Public Works Bureau of Sanitation. The Sanitation
Districts (1,2,3,4,5,8,9, and 16) serve a small portion of the City of Los Angeles.
The majority of the City receives wastewater collection and treatment service from
the Department of Public Works Bureau of Sanitation.
Sanitation Districts of Los Angeles CountyThe Sanitation Districts of Los Angeles County consist of 23 independent districts providing wastewater and solid waste management service to approximately 5.4 million people in the county. Their service area covers approximately 820 square miles and encompasses 78 cities and unincorporated areas within the county. The City of Los Angeles receives service from Districts 1,2,3,4,5,8,9, and 16.
Within the Sanitation Districts’ service area, cities and county own and operate approximately 9,500 miles of sewers that are tributary to the Sanitation Districts’ wastewater collection system. The Sanitation Districts own, operate, and maintain approximately 1,400 miles of sewers, which range from 8 to 144 inches in diameter. The sewers convey approximately 500 million gallons per day (MGD) of
wastewater to 11 wastewater treatment plants. The total permitted capacity of the 11 wastewater treatment plants is 650 MGD.
Joint Outfall System (JOS) is a regional, interconnected sewage system which is shared by 17 of the 23 independent districts in the Sanitation Districts’ partnership. These 17 Sanitation Districts serve 73 cities and unincorporated areas of Los Angeles County. The JOS covers approximately 660 square miles, from the foothills of the San Gabriel Mountains in the north to San Pedro Bay in the south, and from the Los Angeles city limits on the west to the Los Angeles County border on the east. Wastewater is collected by approximately 8,500 miles of city- and county-owned local sewers and then conveyed, primarily via gravity, through the Sanitation Districts’ 1,230 miles of sewers that interconnect seven JOS wastewater treatment plants.
The largest JOS treatment facility is the Joint Water Pollution Control Plant (JWPCP). The other facilities are water reclamation plants: Pomona Water Reclamation Plant (POWRP), San Jose Creek Water Reclamation Plant (SJCWRP), Whittier Narrows Water Reclamation Plant (WNWRP), Los Coyotes Water Reclamation Plant (LCWRP), Long Beach Water Reclamation Plant (LBWRP), and La Cañada Water Reclamation Plant (LACAWRP). The total treatment capacity of these treatment plants is 592.5 MGD.
Clearwater Program Master Facilities Plan 2012The Clearwater Program Master Facilities Plan (MFP) is a long-range planning document for the Joint Outfall System (JOS), a regional wastewater management system serving 73 cities and unincorporated county areas, including portions of the City of Los Angeles.
The Clearwater Program Master Facilities Plan identifies a recommended plan that will meet the wastewater management needs of the JOS through the year 2050. It evaluates infrastructure and facilities and makes recommendations on how to maintain a reliable wastewater management system.

growth&infrastructure2014
45
chapter four: wastewater/sewer
Department of Public Works Bureau of SanitationThe Bureau of Sanitation’s three primary programs are: wastewater collection, conveyance, treatment, and disposal; watershed protection; and solid resources, collection, recycling, and disposal.
The City’s wastewater service area consists of two drainage basin areas: the Hyperion Service Area (HSA) and the Terminal Island Service Area (TISA). The HSA covers approximately 515 square miles and serves the majority of the Los Angeles population as well as non-City agencies that contract with the City for wastewater service. The TISA is approximately 18 square miles and serves the Los Angeles Harbor Area. The wastewater collection system’s physical structure includes over 6,700 miles of major interceptors and mainline sewers, 54 pumping plants, and various diversion structures and other support facilities. More facts and figures regarding wastewater can be found here.
The City owns and operates four major wastewater treatment facilities: Hyperion Treatment Plant (HTP), the Donald C. Tillman Water Reclamation Plant (DTWRP), Los Angeles-Glendale Water Reclamation Plant (LAGWRP), and the Terminal Island Water Reclamation Plant (TIWRP).
2012 Five-Year Review of the 2006 Water Integrated Resources PlanIn 2006, the City of Los Angeles adopted the Water Integrated Resources Plan (IRP), an implementable facilities plan through the year 2020 that integrates water supply, water conservation, water recycling, runoff management, and wastewater facilities planning. Since the adoption of the 2006 Water IRP, the City developed the Water IRP 5-Year Review to revisit the IRP recommendations, to reflect changes in the year 2006-2011, and to review recommendations accordingly.
In 2006, the population of the wastewater service area was expected to expand by 700,000 people before the year 2020, according to projections of the Southern California Association of Governments (SCAG) in 2001. Based on the population projection, the 2006 IRP projected the wastewater flow to increase 16 percent by the year 2020, totaling 531 million gallons per day (MGD).
However, the 5-Year Review document identified that there has been a significant decrease in wastewater over the years. Based on historical wastewater flow data
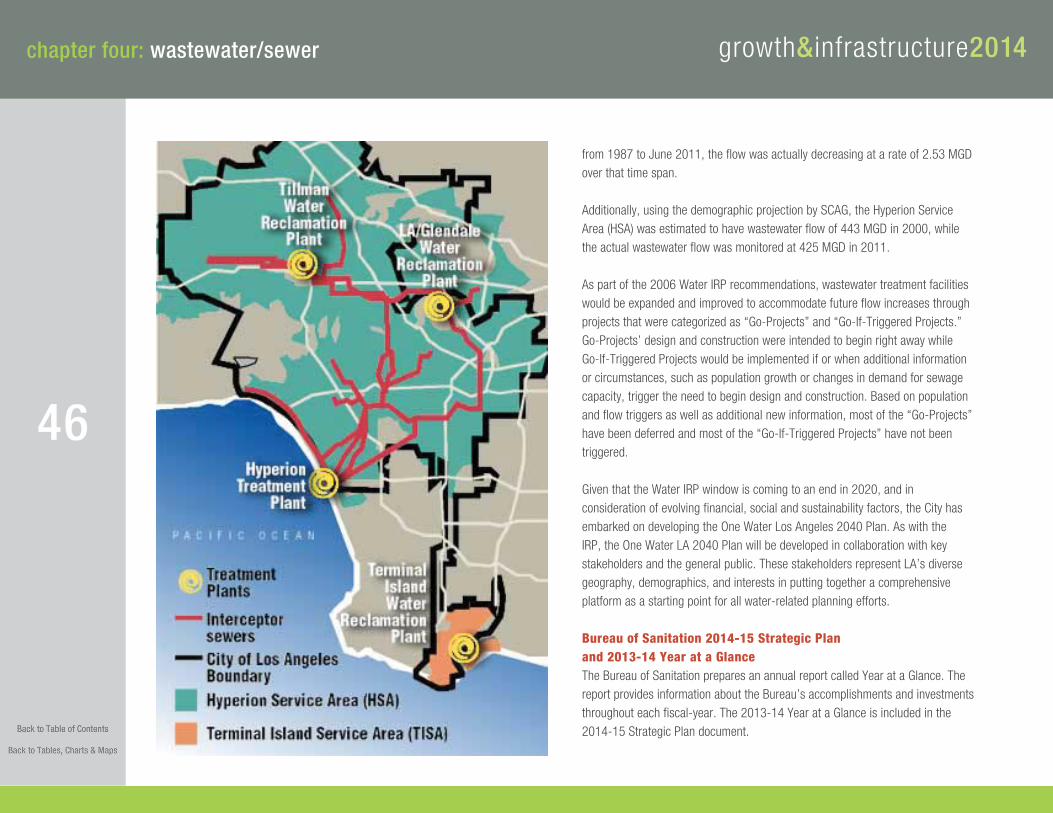
chapter four: wastewater/sewer
46
growth&infrastructure2014
from 1987 to June 2011, the flow was actually decreasing at a rate of 2.53 MGD over that time span.
Additionally, using the demographic projection by SCAG, the Hyperion Service Area (HSA) was estimated to have wastewater flow of 443 MGD in 2000, while the actual wastewater flow was monitored at 425 MGD in 2011.
As part of the 2006 Water IRP recommendations, wastewater treatment facilities would be expanded and improved to accommodate future flow increases through projects that were categorized as “Go-Projects” and “Go-If-Triggered Projects.” Go-Projects’ design and construction were intended to begin right away while Go-If-Triggered Projects would be implemented if or when additional information or circumstances, such as population growth or changes in demand for sewage capacity, trigger the need to begin design and construction. Based on population and flow triggers as well as additional new information, most of the “Go-Projects” have been deferred and most of the “Go-If-Triggered Projects” have not been triggered.
Given that the Water IRP window is coming to an end in 2020, and in consideration of evolving financial, social and sustainability factors, the City has embarked on developing the One Water Los Angeles 2040 Plan. As with the IRP, the One Water LA 2040 Plan will be developed in collaboration with key stakeholders and the general public. These stakeholders represent LA’s diverse geography, demographics, and interests in putting together a comprehensive platform as a starting point for all water-related planning efforts. Bureau of Sanitation 2014-15 Strategic Plan and 2013-14 Year at a GlanceThe Bureau of Sanitation prepares an annual report called Year at a Glance. The report provides information about the Bureau’s accomplishments and investments throughout each fiscal-year. The 2013-14 Year at a Glance is included in the 2014-15 Strategic Plan document.
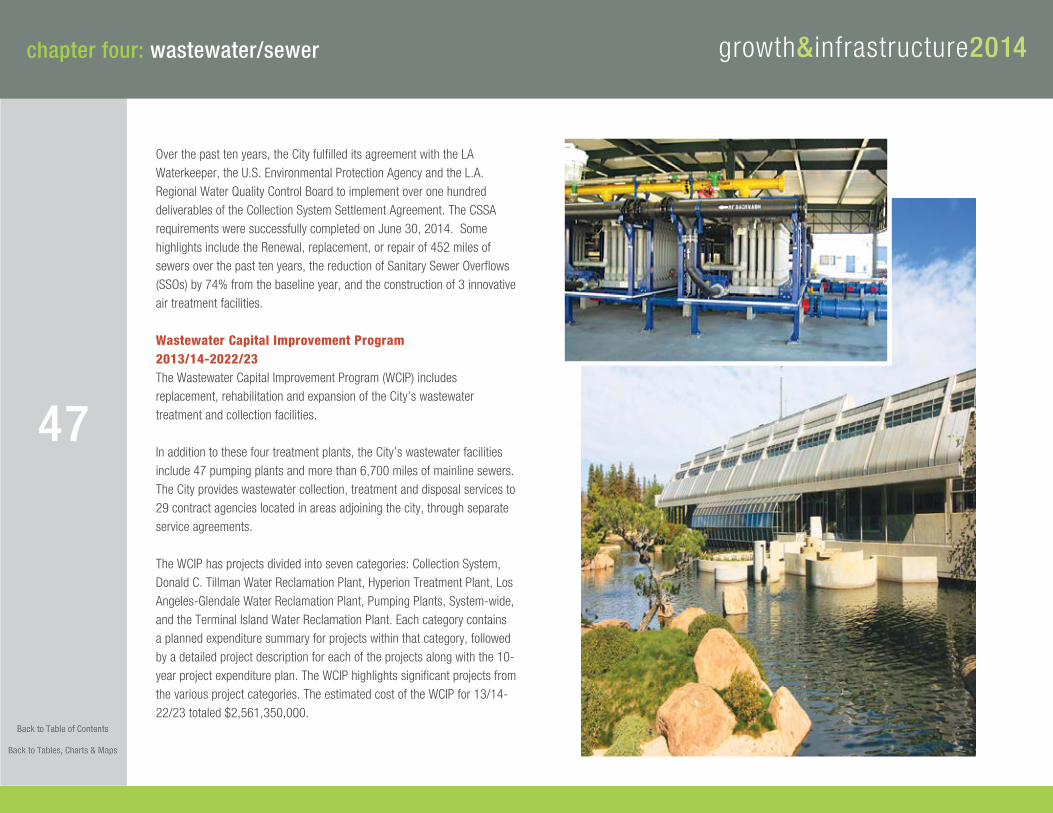
growth&infrastructure2014
47
chapter four: wastewater/sewer
Over the past ten years, the City fulfilled its agreement with the LA Waterkeeper, the U.S. Environmental Protection Agency and the L.A. Regional Water Quality Control Board to implement over one hundred deliverables of the Collection System Settlement Agreement. The CSSA requirements were successfully completed on June 30, 2014. Some highlights include the Renewal, replacement, or repair of 452 miles of sewers over the past ten years, the reduction of Sanitary Sewer Overflows (SSOs) by 74% from the baseline year, and the construction of 3 innovative air treatment facilities.
Wastewater Capital Improvement Program 2013/14-2022/23 The Wastewater Capital Improvement Program (WCIP) includes replacement, rehabilitation and expansion of the City’s wastewater treatment and collection facilities.
In addition to these four treatment plants, the City’s wastewater facilities include 47 pumping plants and more than 6,700 miles of mainline sewers. The City provides wastewater collection, treatment and disposal services to 29 contract agencies located in areas adjoining the city, through separate service agreements.
The WCIP has projects divided into seven categories: Collection System, Donald C. Tillman Water Reclamation Plant, Hyperion Treatment Plant, Los Angeles-Glendale Water Reclamation Plant, Pumping Plants, System-wide, and the Terminal Island Water Reclamation Plant. Each category contains a planned expenditure summary for projects within that category, followed by a detailed project description for each of the projects along with the 10-year project expenditure plan. The WCIP highlights significant projects from the various project categories. The estimated cost of the WCIP for 13/14-22/23 totaled $2,561,350,000.

48
growth&infrastructure2014chapter five: stormwater and urban runoff
Department of Public Works Bureau of Sanitation The Bureau is responsible for the collection, transport, and disposal of stormwater
through the City’s system of natural and constructed channels, debris basins,
pump plants, storm drain pipes, and catch basins. The City owns the following
stormwater management facilities and infrastructure: 1,125 miles of pipelines;
66,260 catch basin; and 11 pump plants.
Water Quality Compliance Master Plan for Urban Runoff (WQCMPUR) 2009In 2009, the City of Los Angeles adopted the WQCMP. This document is a 20-year strategy for clean stormwater and urban runoff in the City of Los Angeles and to meet all water quality regulations for the City’s rivers, lakes, and coastal waters. The Master Plan provides an overview of the existing status of urban runoff management in the City, including a description of watersheds in the City, urban runoff pollutant sources, regulatory requirements for water quality, existing watershed management, and plans for compliance with regulatory requirements. In addition, the Master Plan plans for the future of urban runoff management in the City and discusses three initiatives: Water Quality Management Initiative, Citywide Collaboration Initiative, and Outreach Initiative. Lastly, the Plan contains a financial outlook that evaluates current and future revenues, provides an estimate of the costs needed for implementing the strategies proposed, and presents opportunities for funding.
WatershedsThe term “watershed” refers to all the land that drains to a common low point. Water moves through both underground and surface drainage pathways that converge into streams and rivers. Eventually, the water reaches a receiving water body such as a river, stream, lake, wetland, or the ocean.
The City of Los Angeles collects urban runoff through its storm drain system, which is comprised of underground pipes, devices, conveyance networks, and treatments. This system is completely separate from the City’s sewer system, which collects residential, commercial, and industrial wastewater. The storm drain system generally starts on City streets with the gutters that convey runoff to the storm drain inlets or catch basins. The catch basins are considered as a link between the City’s watersheds and an underground pipe network of small pipes that connect to larger pipes. Urban runoff ultimately gets emptied into constructed channels or streams and creeks. Smaller creeks and streams may empty into wetlands, lakes, or flood control basins. The larger water flows generally end up in rivers that discharge into harbors or directly into the ocean.
The City of Los Angeles has four watersheds that encompass the City: Los Angeles River, Ballona Creek, Dominguez Channel, and Santa Monica Bay. The Los Angeles River watershed is the largest regional watershed and significant portions of impaired sub-watersheds are within City boundaries. It includes all the lands draining into the Los Angeles River, which is 51 miles long. The first 30

growth&infrastructure2014
49
chapter five: stormwater and urban runoff
miles of the River are within the City of Los Angeles. The total watershed area is 833 square miles, and about 33 percent, or 277 square miles, of this watershed is located within the City of Los Angeles.
The Santa Monica Bay watershed is comprised of numerous sub-watersheds emptying into Santa Monica Bay. The watershed runs along the coast from the Ventura-Los Angeles County line in the north to the Palos Verdes Peninsula in the south. The total watershed area is 285 square miles, and 12 percent of this watershed is located within the City of Los Angeles.
The Ballona Creek watershed is comprised of the Ballona Creek, Ballona Creek Estuary, and Ballona Creek Wetlands. This watershed is located on the coastal plain of the Los Angeles basin, with the Santa Monica Mountains to the north and the Baldwin Hills to the south. The total watershed area is 128 square miles, and about 81 percent is located within the City of Los Angeles. The Ballona Creek is predominantly channelized and the watershed is highly developed with both residential and commercial properties.
The Dominguez Channel watershed includes the drainage areas of the Dominguez Channel, the Wilmington Drain/Machado Lake, Dominguez Channel Estuary, and the Torrance-Carson Channel that all eventually discharge through the Dominguez Channel into the Los Angeles Harbor area. The total watershed area is 109 square miles, and about 32 percent of this watershed is located within the limits of City of Los Angeles.
Factors Affecting Runoff and Water QualityRainfall
The City of Los Angeles has a semi-arid climate with average annual rainfall of 15 inches per year. Statistically, there are 33 measurable rain events per year, which may be as little as 0.01 inches of rain. However, according to the Los Angeles County rainfall data, the one-year storm event (the highest amount of rain expected from one storm in any given year) in Los Angeles is 1.7 inches of rain, the 5-year event is 3.5 inches of rain, and the 25-year event is 5.3 inches of rain. This may vary depending on the varied topography in the Los Angeles region.
Runoff Rates
The WQCMP provides estimates of the dry-weather runoff flow, average annual runoff, and seasonal event storm runoff. During most of the year, runoff

chapter five: stormwater and urban runoff
50
growth&infrastructure2014
management focuses on the relatively low-volumetric, dry-weather runoff. Dry-weather sources include landscape irrigation, street washing, car washing, groundwater seepage, illegal connections, hydrant flushing, construction runoff, and other commercial activities. The total dry-weather runoff for the four watersheds in the city of Los Angeles is estimated at 29 billion gallons per year. The dry-weather runoff for portions of watersheds located within City limits is 16 billion gallons per year.
The average annual runoff for all four watersheds is estimated at 353 billion gallons per year. Average annual runoff for portions of watersheds located within City limits is estimated at 56 billion gallons per year.
For a breakdown of runoff rates and estimates in each of the four watersheds, please see the document.
Land Use and Imperviousness
Urban development leads to areas becoming significantly impervious to rainfall infiltration, which increases the percentage of runoff entering the stormwater system. This increase in the percentage may result in potential threat of major flooding. The WQCMP provides a breakdown of land use by watershed with
corresponding impervious factors, which is a scale on how resistant the ground surface is to water infiltration. Commercial and industrial areas have very high impervious factors (>0.9), which usually generate more pollution than other land use categories.
Watersheds within the City limits are highly developed with residential, commercial, and light industrial land use categories. Although major parts of the Los Angeles River and Santa Monica Bay watersheds are relatively open with low imperviousness factors, much of this land is located in the mountains and generally upstream from suspected pollution sources.
Demographics
Increase in population, number of residences and commercial/industrial activity affect runoff pollution in two ways: increase in generation of runoff pollutants and increase in redevelopment and new development which may increase the imperviousness of the area. The WQCMP uses Southern California Association of Governments’ (SCAG) population projection to determine future growth. The City of Los Angeles population is expected to increase by 11.8 percent, from 3.86 million people in 2013 to 4.32 million by 2035.

growth&infrastructure2014
51
chapter five: stormwater and urban runoff
According to the document, future growth is not likely to result in a proportional increase of the runoff volume as the City of Los Angeles is already highly developed. However, the Master Plan discusses an implementation strategy to regulate future redevelopment to increase open areas and to limit the impact of urban sprawl.
Water Quality
The WQCMP summarizes water quality standards that are defined by the Los Angeles Regional Water Quality Control Board (LARWQCB). These standards are used for establishing water quality numeric targets for Total Maximum Daily Loads (TMDLs). City departments and other agencies monitor the quality of the City’s waters on a regular basis by taking samples and analyzing these samples in the laboratory for pollutant concentrations. The Master Plan compares the existing water quality of the City’s rivers, lakes, and coastal water with the water quality numeric targets. This comparison allows the City to determine the current status of the City’s waters. The LARWQCB has established water quality numeric targets for the following impairment categories: trash, bacteria, metals, toxic pollutants, and nutrients. For a more detailed description of each category and the City’s compliance, please see the WQCMP document.
TMDL Implementation Plans
As of 2009, the City of Los Angeles had two TMDL Implementation Plans (Marina Del Rey Harbor and Santa Monica Bay Beaches) and a number of others in the process of being developed.
Watershed Management Plans
The City of Los Angeles has several watershed management plans for the area. The WQCMP provides a description of each management plan prepared since 1994. Examples of the plans include the Los Angeles River Revitalization Master Plan and the City’s Water Integrated Resources Plan.
Los Angeles River Revitalization Master Plan
chapter five: stormwater and urban runoff
52
growth&infrastructure2014
Implementation Strategy
The WQCMP provides implementation strategies, which are long-term watershed-specific management plans. The strategies include general guidelines and technical, physical, and procedural methods to achieve water quality goals. Each of the four watersheds in the Los Angeles area has its own water quality goals, which are defined by the NPDES MS4 Permit. WQCMP identifies three initiatives for the implementation strategies: Water Quality Management Initiative, Citywide Collaboration Initiative, and Outreach Initiative. For more detailed information about the WQCMP implementation strategies, please see the document.
Enhanced Watershed Management Plans
On November 8, 2012, the Regional Board adopted the current municipal stormwater permit (NPDES Permit No. CAS004001, Order No. R4-2012-0175. This Permit contains the most extensive provisions to date with 32 incorporated TMDLs, of which 22 affect the City, expanded programs for Minimum Control Measures (MCMs), development and implementation of watershed management plans, and expanded monitoring provisions.
This 2012 Stormwater NPDES Permit provides for the development of Enhanced Watershed Management Programs (EWMPs) by the MS4 permittees to implement the requirements of the Permit on a watershed scale through customized strategies, control measures, and Best Management Practices. These EWMPs will also address the compliance requirements of the 22 TMDLs that currently are effective, as well other elements of the City’s Stormwater Program. As the largest agency within its own watersheds, the City will coordinate the development of four EWMPs, engage the technical services of a consultant, and coordinate the planning activities with other municipalities in the watersheds, the County, and stakeholder organizations. The EWMPs are due to the RWQCB as draft documents by June 2015, and as final documents by April 2016.

53
growth&infrastructure2014chapter six: solid waste
City of Los Angeles Department of Public Works Bureau of Sanitation
(see section IV.2 above for Bureau description). The solid resources program’s
primary responsibility is to collect, clean, and recycle solid waste generated in the
City of Los Angeles and surrounding communities.
Solid Waste Planning Background Studies Summary Report January 2006The Bureau of Sanitation (BOS) has prepared the Background Studies Summary Report to establish a baseline of system operating conditions by consolidating the Bureau’s planning and implementation documents from years 1989 through 2005. This document will facilitate the Bureau’s future planning efforts and decisions on the development of infrastructure required to continue to manage the City’s solid resources.
Solid Waste Integrated Resources PlanThe Bureau of Sanitation is currently in the process of developing the Solid Waste Integrated Resources Plan (SWIRP). SWIRP serves as a master plan for the City of Los Angeles’ solid waste and recycling programs through the year 2030. The document will outline important changes in the Bureau’s programs, infrastructure needs, legislative goals, a financial plan, and the environmental impact report. The Plan will support the City’s objectives to provide sustainability, resource conservation, source reduction, recycling, renewable energy, maximum material recovery, public health, and environmental protection for solid waste management. The goals of the SWIRP are: to eliminate the use of urban landfills; develop alternative technologies for long term waste disposal; increase recycling and resource recovery; and to convert the entire Sanitation fleet to clean fuel Liquid Natural Gas Vehicles. These goals and the Bureau’s implementation programs will lead the City towards being a “zero waste” city.
The Bureau provides fact sheets on its SWIRP website to provide information on solid waste regulations, waste generation and projection, city policies and programs, facility infrastructure, and alternative technology.
Solid Waste GeneratorsThe Bureau of Sanitation classifies solid waste generators in four sectors: single-family residences (includes detached homes to up to four-unit dwellings); multi-family residential units (residences of more than four units); commercial business; and construction and demolition sites. In 2006, the City of Los Angeles generated a total of 9.62 million tons of potential waste. The Bureau diverted 5.97 million tons (62 percent) of the total potential waste from landfill disposal. The remaining 3.65 million tons of solid waste were disposed in landfills. The composition of the waste disposed in landfills in 2006 is: organics 40 percent; paper 29 percent; plastic 11 percent; construction and demolition materials 8 percent; and other materials 12 percent.

growth&infrastructure2014
54
chapter six: solid waste
Solid Waste Facilities: Transfer StationsIn 2006, approximately 58 percent (a total of about 2.11 million tons) of the solid waste generated in the City of Los Angeles is taken to 17 regional transfer stations:
■ American Waste Transfer Station
■ Athens Transfer Station
■ Bel-Art Waste Transfer Station
■ Carson Transfer Station
■ Central Los Angeles Recycling Center and Transfer Station
■ Community Recycling
■ Compton Recycling and Transfer Station
■ Downey Area Recycling and Transfer Station
■ East Los Angeles Recycling and Transfer Station
■ Falcon Refuse
■ Innovative Waste Control
■ Mission Road Recycling and Transfer Station
■ Paramount Resource Recycling Facility
■ South Gate Transfer Station – Sanitation District
■ South Gate Transfer Station – Waste Management
■ Southern California Disposal
■ Waste Resources Recovery
Solid Waste Facilities: LandfillsIn 2006, solid waste collected by the Bureau of Sanitation was delivered to landfills: Sunshine Canyon Landfill for disposal, to Calabasas Landfill only during Service Disruptions, and to Southeast Resources Recovery Facility for energy conversion. Solid waste collected by private haulers is taken directly to 16 regional landfills and two waste-to-energy facilities for disposal.
Solid Waste Facilities: RecyclablesIn 2006, approximately 2.44 million tons of recyclables were collected from single-family residents and businesses within the City of Los Angeles. The City of Los Angeles contracts with various material recovery facilities (MRFs) that process the curbside recyclables collected by the Bureau of Sanitation.
Plastic
1% Electronics4% Metal
3% Glass
29% Paper
4% Special8% C&D
40% Organics
2006 Disposed Waste Composition, Citywide
Source for above chart: City of Los Angeles Waste Characterization Study, 2002 Supplemental information from California Integrated Waste Management Board Self-Haul Waste Characterization Study, 2003

chapter six: solid waste
55
growth&infrastructure2014
The contracted MRFs include: ■ Angelus Western Paper Fibers (transfer station and MRF)
■ Bestway Recycling (Main Street)
■ Bestway Recycling (Jefferson Blvd.)
■ Bestway Recycling (Firestone Blvd.)
■ City Fibers (Schoenborn St.)
■ City Fibers, Inc. (Santa Fe Ave.)
■ Community Recycling (transfer station and MRF)
■ CR&R
■ Potential Industries
■ Sun Valley Paper Stock
In 2007, 14 major processors of commercially generated recyclables processed about 750,000 tons of commercial recyclables. These facilities include:
■ Allan Company
■ Angelus Western Paper Fibers (MRF)
■ Athens Disposal Co.
■ Bestway Recycling (Firestone Blvd.)
■ Burbank Recycling
■ Los Angeles Recycling Center
■ City Fibers (Santa Fe Ave.)
■ City Fibers (Schoenborn St.)
■ Potential Industries
■ Recycle America Alliance
■ Smurfit Recycling
■ South Coast Recycling
■ Sun Valley Paper Stock
■ West Valley Fibers

growth&infrastructure2014
56
chapter six: solid waste
Solid Waste Facilities: Construction and Demolition Materials Facilities that process C&D materials generated in the City are: nine transfer stations, eight landfills that process C&D for beneficial reuse (i.e. wood or crushed concrete), and eight inert landfills that accept C&D for disposal.
In 2006, approximately 2.06 million tons of the disposed construction and demolition (C&D) materials generated within the City of Los Angeles were delivered to a municipal solid waste (MSW) landfill for beneficial uses. In addition to the C&D materials taken to an MSW landfill, 190,000 tons of C&D materials were recycled, and 370,000 tons of C&D materials were disposed in inert landfills.
Solid Waste Facilities: Yard TrimmingsIn 2006, approximately 900,000 tons of yard trimmings were generated by residents and businesses within the City of Los Angeles. The Bureau of Sanitation (BOS) collected 58 percent of total yard trimmings from single-family residences. These yard trimmings are taken to: a green waste processing facility to be mulched and/or composted or a transfer station to be transported to a
green waste processing facility. Commercial yard trimmings were collected by permitted waste haulers. They collected approximately 19 percent of the total yard trimmings. Private haulers bring yard trimmings to a landfill for beneficial use such as alternative daily cover (cover material on the surface of an active face of a landfill) or a green waste processing facility to be mulched and/or composted.
In 2006, about 30 percent of the green waste generated within the City was taken to green waste processing facilities where the waste is converted into various grades of compost, mulch, soil amendment, and similar products. The remaining 70 percent is beneficially used as alternative daily cover at various landfills.

growth&infrastructure2014
57
chapter seven: power
The Los Angeles Department of Water and Power (LADWP) is responsible for delivery of water and electricity to residents and businesses
in the City of Los Angeles. LADWP supplies more than 26 million megawatt
hours of electricity annually for the City of Los Angeles’ 1.4 million residential
and business customers. The average resident uses about 5,900 kilowatt-
hours of electricity per year. Business and industry consume about 70 percent
of the electricity in Los Angeles, but residents constitute the largest number of
customers. In addition to serving residential and other customers, the LADWP
lights public streets and highways, powers part of the City’s water system, and
sells electricity to other utilities.
Integrated Resource Plan 2013The Los Angeles Department of Water and Power (LADWP) annually prepares a Power Integrated Resource Plan (IRP), a planning document that provides a 20-year framework to meet the City of Los Angeles’ current and future energy needs. The document provides forecasts of electricity demand, discusses the resources available or needed to meet the demand, and addresses the issue associated with each resource and the Power System in general. The IRP also identifies long term goals and strategies, near term actions, and financial requirements to meet the City’s projected electricity demand.
LADWP Power System LADWP is a vertically integrated utility: The majority of its generation, transmission, and distribution systems are owned and operated by LADWP. Approximately 25 percent of the State of California’s total transmission capacity is owned by LADWP, which extends beyond California to transport power across the Western United States.
Challenges to Power ReliabilityLADWP defines power reliability as a utility’s ability to provide continuous electric service to its customers in order to support their lifestyles and run their businesses. While customers have high expectations of uninterrupted service, all public power utilities face challenges to ensuring continued reliable electricity service.
One of the challenges is the aging facilities and infrastructure. Between 2003 and 2005, LADWP experienced an increase in the number of distribution outages due to deferred maintenance and asset replacement and aging infrastructure. As of April 2012, more than 50 percent of the poles were 50 years or older and more than 25 percent already exceeded the average life span of 60 years.
In response to the decline in service reliability, LADWP has upgraded many of its generating units, which were built in the late 1950s and early 1960s. As other generating units are nearing the end of their service lives, LADWP began a replacement project in 1994 that will continue through 2029. The new repowered units will be substantially cleaner, more reliable, community-friendly, and efficient

chapter seven: power
58
growth&infrastructure2014
than the units the Department is replacing. Gas-fired units are also in the process of being repowered, which will also assist in integrating renewable resources into LADWP’s energy mix.
In addition, LADWP established a comprehensive Power Reliability Program (PRP) in 2005. The program had three goals: problem mitigation based on the types of outages specific to a given facility; proactive maintenance and capital improvements; and establishment of replacement cycles for facilities.
Major Power System Activities 2012-2017LADWP’s Power System is currently in the process of transformation. Within the next 15 years, approximately 70 percent of the Department’s Power System generation will be replaced. Programs currently in progress include: Haynes 5&6 Repowering, Scattergood Repowering, Coal Replacement Planning and Implementation, Replacing aging distribution infrastructure, RPS procurement, Solar Program Development, and Existing EE program elements. LADWP has new initiatives and program areas which include: Demand Response Program, New EE program elements, Smart Grid Implementation, Transmission Line Improvements, Grid Reliability Improvements, Haynes 1&2 Repowering, and Distributed Generation.
Customer Demand ForecastTo meet the customer’s current and future needs, LADWP assesses energy demand forecast for retail sales and peak demand over the next 20 years. The retail sales forecast is the sum of seven separate customer class forecasts: residential, commercial, industrial, plug-in electric vehicle (PEV), intradepartmental, streetlight, and Owens Valley.
The retail demand for electricity within LADWP’s service area is projected to rise 0.8 percent over the next five years. The growth in peak demand over the next 20 years is forecasted to be about 0.6 percent – approximately 40 megawatts (MW) per year – with less growth over the next few years due to current recession. LADWP uses this forecast for Power System planning activities including integrated resource planning, transmission and distribution planning, and wholesale marketing.
Demand Management ProgramsLADWP incorporates Demand Side Resource (DSR) programs in the Integrated Resources Planning (IRP) to counter or minimize energy demand growth and thereby lessen the need to build more infrastructural assets and improve load factor. The IRP identifies three DSR initiatives: Energy Efficiency, Demand Response, and Distributed Generation. For more detailed information about the initiatives, visit the Integrated Resources Planning webpage.
Generation ResourcesLADWP’s sources of electricity generation include: natural gas, coal, nuclear, large hydro, renewable resources, and other power purchases.
Natural gas is the most important source of energy due to abundant supply levels. LADWP has four electric generating stations which utilize natural gas as a fuel source: Haynes Generating Stations in Long Beach, Harbor Generating Station in Wilmington, Scattergood Generating Station in Playa del Rey, and Valley Generating Station in the San Fernando Valley. The net maximum plant capability for each station is: 466 MW; 1,555.6 MW;
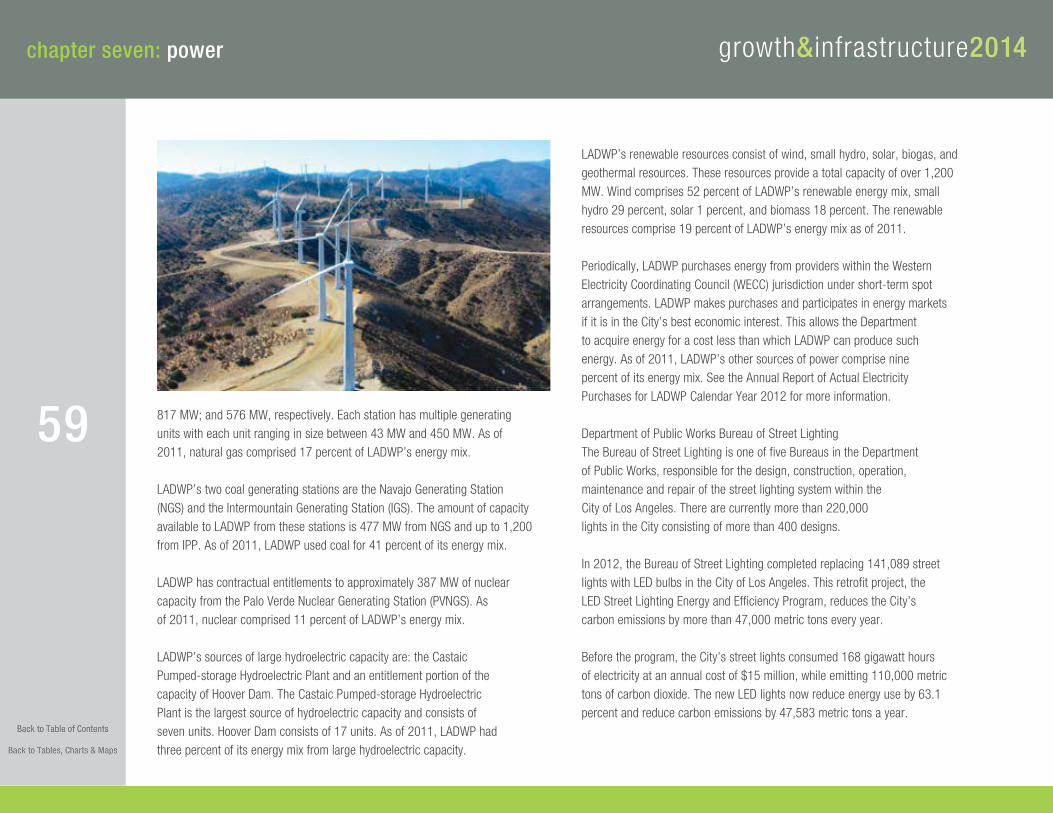
growth&infrastructure2014
59
chapter seven: power
817 MW; and 576 MW, respectively. Each station has multiple generating units with each unit ranging in size between 43 MW and 450 MW. As of 2011, natural gas comprised 17 percent of LADWP’s energy mix.
LADWP’s two coal generating stations are the Navajo Generating Station (NGS) and the Intermountain Generating Station (IGS). The amount of capacity available to LADWP from these stations is 477 MW from NGS and up to 1,200 from IPP. As of 2011, LADWP used coal for 41 percent of its energy mix.
LADWP has contractual entitlements to approximately 387 MW of nuclear capacity from the Palo Verde Nuclear Generating Station (PVNGS). As of 2011, nuclear comprised 11 percent of LADWP’s energy mix.
LADWP’s sources of large hydroelectric capacity are: the Castaic Pumped-storage Hydroelectric Plant and an entitlement portion of the capacity of Hoover Dam. The Castaic Pumped-storage Hydroelectric Plant is the largest source of hydroelectric capacity and consists of seven units. Hoover Dam consists of 17 units. As of 2011, LADWP had three percent of its energy mix from large hydroelectric capacity.
LADWP’s renewable resources consist of wind, small hydro, solar, biogas, and geothermal resources. These resources provide a total capacity of over 1,200 MW. Wind comprises 52 percent of LADWP’s renewable energy mix, small hydro 29 percent, solar 1 percent, and biomass 18 percent. The renewable resources comprise 19 percent of LADWP’s energy mix as of 2011.
Periodically, LADWP purchases energy from providers within the Western Electricity Coordinating Council (WECC) jurisdiction under short-term spot arrangements. LADWP makes purchases and participates in energy markets if it is in the City’s best economic interest. This allows the Department to acquire energy for a cost less than which LADWP can produce such energy. As of 2011, LADWP’s other sources of power comprise nine percent of its energy mix. See the Annual Report of Actual Electricity Purchases for LADWP Calendar Year 2012 for more information.
Department of Public Works Bureau of Street LightingThe Bureau of Street Lighting is one of five Bureaus in the Department of Public Works, responsible for the design, construction, operation, maintenance and repair of the street lighting system within the City of Los Angeles. There are currently more than 220,000 lights in the City consisting of more than 400 designs.
In 2012, the Bureau of Street Lighting completed replacing 141,089 street lights with LED bulbs in the City of Los Angeles. This retrofit project, the LED Street Lighting Energy and Efficiency Program, reduces the City’s carbon emissions by more than 47,000 metric tons every year.
Before the program, the City’s street lights consumed 168 gigawatt hours of electricity at an annual cost of $15 million, while emitting 110,000 metric tons of carbon dioxide. The new LED lights now reduce energy use by 63.1 percent and reduce carbon emissions by 47,583 metric tons a year.

chapter seven: power
60
growth&infrastructure2014
The project cost an estimated $57 million over the four years. It was funded through a $40 million loan from the Los Angeles Department of Water and Power (LADWP), which will be paid entirely through savings in energy and maintenance costs by 2019. Once the loan is repaid, the City will begin to save $10 million annually. Additionally, $16 million in LADWP rebate funds and $3.5 million from the Street Lighting Maintenance Assessment Fund were used.

growth&infrastructure2014
61
chapter eight: fire
The Los Angeles Fire Department (LAFD) is a full-spectrum life safety agency providing services to the City of Los Angeles
residents. The LAFD’s services include fire prevention, firefighting, emergency
medical care, technical rescue, hazardous materials mitigation, disaster response,
public education, and community service. There are 3,260 uniformed fire
personnel who protect life, property, and the environment and non-sworn cadre
of 363 professional support personnel who provide technical and administrative
expertise in their corresponding pursuit of the Department’s mission.
A total of 984 uniformed firefighters, including 270 serving as firefighter/paramedics, are always on duty at fire departments citywide. The City has 106 neighborhood fire stations located across the Department’s 471 square-mile jurisdiction.
The Los Angeles Fire Department utilizes an array of sophisticated software to determine emergency responses throughout the city. To help the public relative to each type of emergency response, a series of response maps has been developed.
LAFD Deployment Plan 2011-2012The Los Angeles Fire Department has implemented a deployment plan to efficiently and effectively allocate resources, create long term structural change, and provide stable and permanent savings in the City budgetary constraints. The new Deployment Plan allows the LAFD to permanently end the Modified Coverage Plan (MCP), ending the disruptive rotating closures that resulted from the MCP.
Fiscal Year 2011-2012 Resource Allocation The Department implemented the Deployment Plan on July 3, 2011, including:
■ Permanently closing one Division Office
■ Permanently closing two Battalion Offices
■ Permanently closing 12 Engines and opening one Engine (net loss of eleven)
■ Permanently closing seven Light Forces
■ Permanently closing seven 800-Series Ambulances and opening three 800-Series Ambulances (net loss of four)
Under the Deployment Plan, staffing increased from 933 firefighters deployed daily under the Expanded Modified Coverage Plan (EMCP), to 986 firefighters.
As of the FY 11-12 Deployment Plan, the LAFD deployed the following resources
on a daily basis:
■ 89 two-person Advanced Life Support (ALS) rescue ambulances
■ 34 two-person Basic Life Support (BLS) rescue ambulances
■ 7 one-person EMS district units
■ 2 two-person Division command teams
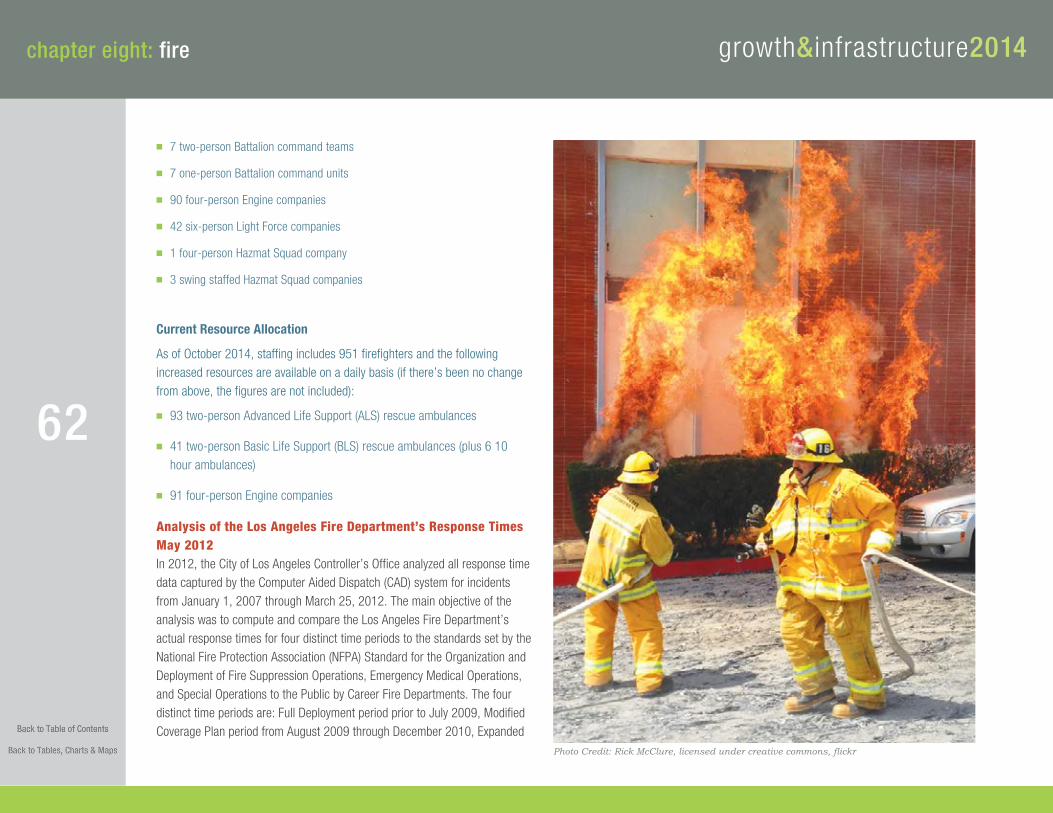
chapter eight: fire
62
growth&infrastructure2014
■ 7 two-person Battalion command teams
■ 7 one-person Battalion command units
■ 90 four-person Engine companies
■ 42 six-person Light Force companies
■ 1 four-person Hazmat Squad company
■ 3 swing staffed Hazmat Squad companies
Current Resource Allocation
As of October 2014, staffing includes 951 firefighters and the following increased resources are available on a daily basis (if there’s been no change from above, the figures are not included):
■ 93 two-person Advanced Life Support (ALS) rescue ambulances
■ 41 two-person Basic Life Support (BLS) rescue ambulances (plus 6 10 hour ambulances)
■ 91 four-person Engine companies
Analysis of the Los Angeles Fire Department’s Response Times May 2012In 2012, the City of Los Angeles Controller’s Office analyzed all response time data captured by the Computer Aided Dispatch (CAD) system for incidents from January 1, 2007 through March 25, 2012. The main objective of the analysis was to compute and compare the Los Angeles Fire Department’s actual response times for four distinct time periods to the standards set by the National Fire Protection Association (NFPA) Standard for the Organization and Deployment of Fire Suppression Operations, Emergency Medical Operations, and Special Operations to the Public by Career Fire Departments. The four distinct time periods are: Full Deployment period prior to July 2009, Modified Coverage Plan period from August 2009 through December 2010, Expanded
Photo Credit: Rick McClure, licensed under creative commons, flickr
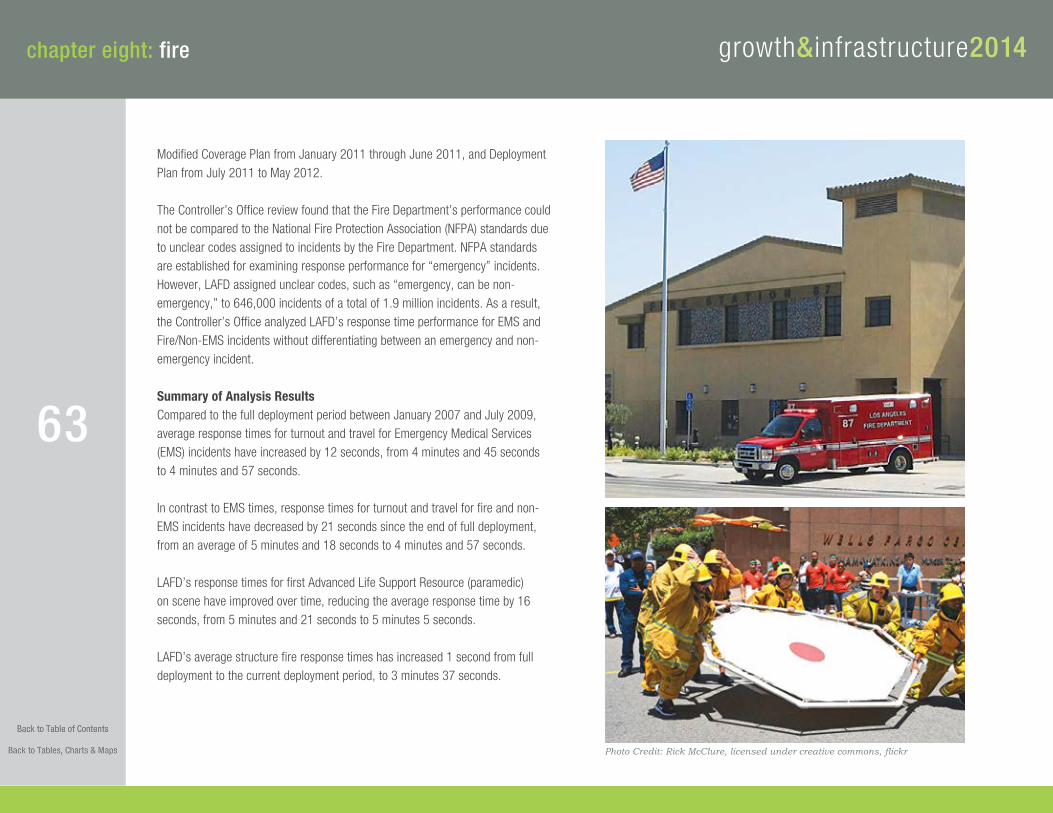
growth&infrastructure2014
63
chapter eight: fire
Modified Coverage Plan from January 2011 through June 2011, and Deployment Plan from July 2011 to May 2012.
The Controller’s Office review found that the Fire Department’s performance could not be compared to the National Fire Protection Association (NFPA) standards due to unclear codes assigned to incidents by the Fire Department. NFPA standards are established for examining response performance for “emergency” incidents. However, LAFD assigned unclear codes, such as “emergency, can be non-emergency,” to 646,000 incidents of a total of 1.9 million incidents. As a result, the Controller’s Office analyzed LAFD’s response time performance for EMS and Fire/Non-EMS incidents without differentiating between an emergency and non-emergency incident.
Summary of Analysis ResultsCompared to the full deployment period between January 2007 and July 2009, average response times for turnout and travel for Emergency Medical Services (EMS) incidents have increased by 12 seconds, from 4 minutes and 45 seconds to 4 minutes and 57 seconds.
In contrast to EMS times, response times for turnout and travel for fire and non-EMS incidents have decreased by 21 seconds since the end of full deployment, from an average of 5 minutes and 18 seconds to 4 minutes and 57 seconds.
LAFD’s response times for first Advanced Life Support Resource (paramedic) on scene have improved over time, reducing the average response time by 16 seconds, from 5 minutes and 21 seconds to 5 minutes 5 seconds.
LAFD’s average structure fire response times has increased 1 second from full deployment to the current deployment period, to 3 minutes 37 seconds.
Photo Credit: Rick McClure, licensed under creative commons, flickr

64
growth&infrastructure2014chapter nine: police
The Los Angeles Police Department’s
mission is to safeguard the lives and property of the people it serves, to reduce
the incidence and fear of crime, and to enhance public safety while working with
diverse communities to improve their quality of life.
Year in Review 2012The Los Angeles Police Department (LAPD) prepares annual Year in Review Reports to provide statistical and historical information on the Department. The Year in Review includes Annual Report, Crime Statistics Summary, Statistical Digest, and the Departmental newsletter and magazine.
The Los Angeles Police Department (LAPD) serves approximately 3.8 million residents in the service area. Police services in the City of Los Angeles are administered through 21 police station areas located within four police bureaus:
Central, South, West, and Valley. The Central Bureau has five police stations serving approximately 776,000 residents within a 54 square mile service area. The South Bureau has four stations serving about 688,000 residents within a 60 square mile service area. The West Bureau has five police stations with a population of about 900,000 within a 121.77 square mile service area. Lastly, the Valley Bureau serves about 1.4 million residents in a 226.47 square mile service area through seven police stations.
Crime Statistics
Part I offenses refer to crimes in the following categories: homicide, rape, aggravated assault, robbery, burglary, larceny, and vehicle theft. Over the ten years, LAPD has been experiencing a decrease in Part I crime rates. In 2011, there were a total of 104,996 crimes, representing a 44.3 percent decrease since 2002. The crime rate remained its downward trend with a 5.3 percent decrease in 2011 from 2010. The citywide clearance rate for Part I offenses was 11 percent in 2011. The Central Bureau had the highest rate of clearance rate of 15 percent, while other bureaus’ clearance rates were at 10-11 percent. Part II offenses include all other crimes other than the eight Part I offenses. In 2011, there were 87,865 Part II offenses, an increase of 13.63 percent from 2010.
In 2011, LAPD dispatched units to 727,842 calls for service: 110,246 units to emergency calls; 251,871 to urgent calls; and 365,725 to routine calls. Emergency calls involve human life at risk and are likely to imply violent crime. Urgent calls involve other serious crimes. Routine calls involve property and are the least serious classification used by the Police Department.
Sworn Personnel by Rank, Gender, and Ethnicity Report (SPRGE) 2014The Los Angeles Police Department keeps track of its workforce and growth through the Sworn Personnel by Rank, Gender, and Ethnicity Report (SPRGE). According to the Report, the Department has a total of 12,803 sworn and civilian personnel as of September 2014.
Photos Credit: Los Angeles Police Department (LAPD)

growth&infrastructure2014
65
chapter nine: police
End of Year Crime Snapshot 2013The Los Angeles Police Department produced a End of Year Crime Snapshot Report from January 1, 2013 through December 31st, 2013 to provide statistical data on citywide Part I crime rates. According to the Report, all eight categories of Part I crime rates (homicide, rape, aggravated assault, robbery, burglary, larceny, and vehicle theft) maintained a downward trend since 2008 until 2013: homicide by 34.6 percent; rape by 32.7 percent; aggravated assault by 35.8 percent; robbery by 41.4 percent; burglary by 21.6 percent; larceny by 6.6 percent; and vehicle theft by 37.6 percent.

66
growth&infrastructure2014chapter ten: schools
The Los Angeles Unified School District (LAUSD) enrolls more than 640,000 students in kindergarten through 12th grade at over
900 schools and 187 public charter schools. The boundaries spread over 720
square miles and include the City of Los Angeles as well as all or parts of 31
smaller municipalities and several unincorporated sections of Southern California.
In addition to the City of Los Angeles, other cities located entirely within LAUSD are Cudahy, Maywood, Gardena, San Fernando, Huntington Park, Vernon, Lomita, and West Hollywood. Cities partially located within LAUSD are Alhambra, Bell, Bell Gardens, Beverly Hills, Calabasas, Carson, City of Commerce, Culver City, Downey, El Segundo, Hawthorne, Inglewood, Long Beach, Lynwood, Montebello, Monterey Park, Rancho Palos Verdes, Rolling Hills Estates, Santa Clarita, Santa Monica, South Gate, South Pasadena, and Torrance.
LAUSD Fingertip Facts 2011-2012Fingertip Facts, prepared by the Los Angeles Unified School District, provides a general overview about LAUSD, student enrollment, number of schools and facilities, and finance during 2011-12 school year.
Quick Facts ■ The LAUSD has a total of 1,235 schools and education centers within the District.
■ During 2011-12, total student enrollment in LAUSD, including Adult Education, was 919,930
■ The LAUSD receives over 80 percent of its General Fund Restricted and Unrestricted money from Base Revenue Limit and other State sources. The LAUSD General Fund pays for schools expenses including certified salaries, classified salaries, employee benefits, books and supplies, other operating expenses, capital outlay, and other outgoing expenses. The total General Fund expenses during 2011-12 school year was $6.5 billion.
Strategic Execution Plan 2013The Facilities Services Division within Los Angeles Unified School District prepares a Strategic Execution Plan annually to outline plans to build new schools, repair and modernize existing schools, and assess capital needs and master planning. In an effort to meet the needs of students and communities of LAUSD, the Division executes a variety of projects under their programs: New School Construction Program, Repair and Modernization Program, and the Capital Improvement Program.
New School Construction Program
The New School Construction Program is an approach to relieve overcrowding and address facilities needs through the construction of new classroom seats and the replacement or expansion of athletic and play space at school sites.
Under the New School Construction Program, 18 new K-12 schools, four new K-12 addition projects, and one new adult education center were built during the 2012-13 school year. In addition, 129 new school projects and 372 additional projects within the New School Construction Program delivered 164,000 new

growth&infrastructure2014
67
chapter ten: schools
seats. The Program is in the process of delivering one new K-12 school and two new early education centers in 2013.
Repair and Modernization Program
The main goal of the Repair and Modernization Program is to repair and modernize existing schools to improve deteriorating, aging, and outdated conditions.
The Repair and Modernization Program has completed more than 23,000 construction projects since the program began. The Facilities Services Division planned to complete construction for more than 300 projects at existing LAUSD campuses as part of the Repair and Modernization Program.
Capital Improvement Program
Capital Improvement Program (CIPR), which allocates local bond funds previously held in a program reserve for the New School Construction Program as well as project savings realized from a favorable bidding environment to the CIPR. The CIPR establishment approved a list of priority projects to be undertaken and allocated funds to assess and plan for the capital needs of LAUSD schools that may not have been addressed by Board-approved projects.
The Capital Improvement Program completed two new K-12 schools and one new adult education center as well as more than 200 repair and modernization projects, photovoltaic installations, sustainability projects, and facelift projects. The Capital Improvement Program will deliver two new K-12 schools, two new K-12 redevelopment projects, and more than 200 additional projects in the next year.
Funding and Cost
The Facilities Services Division addresses the LAUSD’s needs for additional classroom capacity and modernized schools through four local bonds:

chapter ten: schools
68
growth&infrastructure2014
Proposition BB and Measures K, R, and Y. These bonds were passed by the voters within LAUSD boundaries and provide for the majority of the funds. Measure Q, a fifth local bond, is not part of the current program. However, the bond is anticipated as the primary funding source for future capital projects. The balance of program funding is comprised of State bonds approved through ballot initiatives (Propositions 1A, 47, 55, and 1D), Federal funding, grants, and various local matching funds.
The current bond program is valued at approximately $19.5 billion with two primary funding sources: local bonds and matching funds from State bonds. Approximately 89 percent of total program funding is provided by the two sources. Other sources include developer fees, Certificates of Participation (COPs), and special funding sources such as Federal Emergency Management Agency (FEMA) grants, local sources of matching funds, etc.
Uses of funds are reported in three major budget categories: direct project costs, indirect costs, and program reserve. The direct project costs include construction, site related costs, design, project management, other project costs, and additional estimated cost to complete projects. Approximately 92 percent of funds are used for direct costs. The indirect costs include program management, non-Facility Services Division support, and other costs.
Detailed lists of construction and repair and modernization projects
are provided in the Strategic Execution Plan.

growth&infrastructure2014
69
chapter eleven: cultural resources
The Office of Historic Resources
in the Department of City Planning coordinates the City of Los Angeles’ historic
preservation activities. The mission of the Office of Historic Resources is to create
a comprehensive, state-of-the-art, and balanced historic preservation program for
the City of Los Angeles. The key goals of the Office are: to complete a pioneering
citywide historic resources survey; to achieve “Certified Local Government” status
in historic preservation (approved in 2007); to integrate historic preservation fully
into Los Angeles’ planning process; to serve as an expert resource on preservation
for the Department of City Planning and for other City departments; to provide
responsive customer service in conducting historic preservation reviews; and to
create additional incentives and creative partnerships for historic preservation.
Historic-Cultural Monument Report (HCMs)In 1962, the City of Los Angeles enacted the Cultural Heritage Ordinance, which allows the designation of buildings and sites as individual local landmarks called “Historic-Cultural Monuments” (HCMs). The Ordinance establishes the designation criteria, which are contained in the definition of a Monument in the Ordinance. The Ordinance also identifies the procedures for the Cultural Heritage Commission
and Historic-Cultural Monument designations. Currently, the City has over 1000 Historic-Cultural Monuments.
The Office of Historic Resources (OHR) provides a Historic-Cultural Monument Report that lists historic resources in each of the City of Los Angeles’ 35 Community Plan areas. OHR maintains a database of all HCMs.
Historic Preservation Overlay Zones (HPOZs)The City of Los Angeles has developed Historic Preservation Overlay Zones (HPOZs) to identify and protect neighborhoods with distinct architectural and cultural resources. An HPOZ consists of buildings and structures from a similar time period that have kept most of their original design features. HPOZs are established and administered by the Los Angeles City Planning Department (in concert with the City Council). The Department reviews proposed exterior alterations and additions to properties located within designated HPOZ districts.
The City currently has 29 designated HPOZs: Adams-Normandie, Angelino Heights, Balboa Highlands, Banning Park, Carthay Circle, Country Club Park, Gregory Ain Mar Vista Tract, Hancock Park, Harvard Heights, Highland Park-Garvanza, Hollywood Grove, Jefferson Park, Lafayette Square, Lincoln Heights, Melrose Hill, Miracle Mile North, Pico-Union, South Carthay, Spaulding Square, Stonehurst, University Park, Van Nuys, Vinegar Hill, West Adams Terrace, Western Heights, Whitley Heights, Wilshire Park, Windsor Square, and Windsor Village. HPOZ areas range in size from approximately 50 parcels to more than 3,000 properties. Additional neighborhoods being considered for HPOZ status are listed on the DCP website.
El Pueblo de Los Angeles Historical Monument AuthorityThe El Pueblo de Los Angeles Historical Monument Authority is a department of the City of Los Angeles that manages 22 historic buildings surrounding Plaza Park. El Pueblo is governed by the El Pueblo Board of Commissioners that was established in 1992 by the Los Angeles City Council. The nine Commission

chapter eleven: cultural resources
70
growth&infrastructure2014
members are appointed by the Mayor of Los Angeles. The Commission establishes policies, sets lease rates, and provides long-term oversight for the 44-acre Monument including five museums, 28 historical buildings, and over 10,000 historical artifacts.
Los Angeles Department of Cultural Affairs (LADCA)The Los Angeles Department of Cultural Affairs (DCA) supports the quality of life for Los Angeles’ 4 million residents and 25 million annual visitors by assuring access to the arts, cultural experiences, and heritage through activities such as programming, marketing and development, grant making, communication, and building relationships with community partners. The DCA creates partnerships that aids in leveraging public funds to generate and support residents and visitors’ cultural experiences in the City. The public funds include: the City’s General Fund, the Los Angeles Endowment for the Arts, and the Arts Development Fee Ordinance. A Mayor-appointed Commission serves as an advisory body to the Department.
Department of Cultural Affairs Identity Brochure 2009-10The Identity Brochure provides an overview of the Department of Cultural Affairs (DCA), its funding history, and future plans. The Brochure was prepared in response to the City’s financial short-falls and economic challenges. The DCA’s ability to provide services and programs to the City’s residents and visitors has been challenged as its human and financial resources dwindled. The DCA recognizes the importance of arts and culture in improving the quality of life for the City’s residents and visitors.
Facilities
In Fiscal Year 2009/10, DCA managed eight Neighborhood Arts and Cultural Centers, three theaters, two galleries, and two historic sites. The Neighborhood Arts and Cultural Centers provide instructional programs to young people and adults in the performing, visual, and new media arts. The DCA’s theater facilities offer year-round dance, music, theater, literacy, and multi-disciplinary performances; supports the development of emerging performing and media artists; and offers workshops for playwrights and writers of all ages. DCA galleries’ main goal is to promote the visual arts and artist of the Los Angeles region. Lastly, the Department provides conservation services and educational programming and tours for two historic sites in the City: Hollyhock House and Watts Towers.

chapter eleven: cultural resources growth&infrastructure2014
71
Impact of Department of Cultural Affairs Facilities
■ Number of young people served at DCA managed Neighborhood Arts and Cultural Center programs: 16,345
■ Number of young people served at DCA managed theaters: 23,330
■ Number of young people served at DCA managed galleries: 20,950
■ Number of adults served at DCA managed Neighborhood Arts and Cultural Centers: 6,766
■ Number of adults served at DCA managed theaters: 53,872
■ Number of adults served at DCA managed art galleries: 75,000
■ Number of adults served by guided tours of Watts Towers: 5,405
■ Number of young people served by guided tours of Watts Towers: 2,240
■ Number of drop-in visitors to Watts Towers: 37,900
■ Number of young people served by guided Hollyhock house tours: 354
■ Number of adults served by guided Hollyhock house tours: 15,672
■ Number of full-time and part-time staff at DCA managed Neighborhood Arts and Cultural Centers, theaters, galleries, and historic sites: 75
■ Number of volunteers at DCA managed Neighborhood Arts and Cultural Centers, theaters, galleries, and historic sites: 168
DCA Finance Summary
In Fiscal Year 2009/10, DCA’s total budgeted revenue was $36.70 million. 33 percent of the total budget was funded by the Public Works Improvements Arts Program. DCA’s total budgeted expenses in Fiscal Year 2009/10 were $23.60 million.

72
growth&infrastructure2014chapter twelve: libraries
The Los Angeles Public Library (LAPL) provides free and easy access to information and learning opportunities for infants,
children, teens, and adults. The LAPL can be accessed through the Central
Library in downtown Los Angeles, eight regional branch libraries, 64 community
branches, four bookmobiles, and the Internet.
Los Angeles Public Library Strategic Plan 2007-2010The Los Angeles Public Library (LAPL) Strategic Plan is a blueprint that identifies the library’s strengths and opportunities, goals, objectives, and activities and initiatives to provide new facilities, technology, materials, and programs.
Los Angeles Public Library Branch Facilities Plan 2007The Los Angeles Public Library (LAPL) Branch Facilities Plan was initially adopted by the Board of Library Commissioners in 1988. The Facilities Plan was the most significant infrastructure blueprint in the history of the Los Angeles Public Library. It guided the construction, maintenance, and organization of public libraries and set specific standards to define service areas and the size of branch facilities. Based on the Plan, 90 percent of the library infrastructure was replaced in a fifteen-year period. The new and renovated facilities more than doubled from 700,000 square feet to more than 1,400,000 square feet in the City of Los Angeles.
In 2005, the Los Angeles Public Library began to plan for the future by analyzing current and future library services and facilities needs and population growth projections to the year 2030. Based on the library’s service and facility needs assessments and public input, the LAPL prepared a revised Branch Facilities Plan. The new Plan was approved by the Board of Library Commissioners on February 9, 2007.
The 1988 Branch Facilities Plan’s specific standards consisted of two com-ponents: a Criteria for New Libraries (formerly Site Selection Guidelines) and a List of Projects.
Facilities Criteria for New LibrariesThe Criteria for New Libraries are standards for the size and features of branches based on location and the population served in each community. The Criteria for New Libraries proposes building larger libraries than proposed in the 1988 Branch Facilities Plan. The recommended library sizes are 12,500 square feet facilities for communities with less than 45,000 population and 14,500 square feet facilities for communities with more than 45,000 residents. It also recommends that when a community reaches a population of 90,000, a second branch library should be considered for that area

growth&infrastructure2014
73
chapter twelve: libraries
Proposed Project List
The proposed List of Projects identifies facility status of existing library branches and the need for new branch libraries in communities without libraries.
The list includes:
■ 2 renovations – Atwater and Echo Park;
■ 3 new buildings on same sites – Benjamin Franklin, Eagle Rock, and West Los Angeles
■ 6 relocations with new buildings on new sites – Angeles Mesa, Felipe de Neve, Granada Hills, Robert L. Stevenson, Van Nuys and Vermont Square;
■ 8 new libraries in areas that currently do not have a library – Arleta, East Valley/ Valley Glen, Lake Balboa, Mission Hills, Mulholland, Southeast Los Angeles, West Hills and West San Pedro.

74
growth&infrastructure2014chapter thirteen: parks
The Department of Recreation and Parks maintains and operates more than 40 sites for recreational use. The Department
establishes, operates and maintains parks, swimming pools, public golf courses,
recreation centers, museums, youth camps, tennis courts, sports programs and
programs for senior citizens. It also supervises construction of new facilities and
improvements to existing ones.
2009 Citywide Community Needs AssessmentThe Department of Recreation and Parks conducted the Citywide Community Needs Assessment as the first step in the preparation of a Citywide Recreation and Parks Master/Strategic Plan and a Five-year Capital Improvement Plan. The Needs Assessment identifies, quantifies, and preliminarily prioritizes the tremendous need for recreation and open space in the City. A high level review was also performed of the Department’s facilities in an attempt to address the various facilities needing improvements to meet current and future needs, prevent future maintenance problems, and offer positive alternatives to an increasingly dense and urbanized population. Service Area Maps showing existing park and recreation facilities can be found here.
Parks and Open Space
There are more than 36,000 acres of all public parks and open space, which include Recreation and Park lands and county land within the city-limits.
Total acreages by category are:
■ Mini parks – 50.46 total acres; 94.7 percent of total mini park acreage inventoried is City owned
■ Neighborhood parks – 773.72 total acres; 94.0 percent of total neighborhood park acreage inventoried is City owned
■ Community parks – 2,966.43 total acres; 87.3 percent of total community park acreage inventoried is City owned
■ Regional and large urban parks – 32,288.98 total acres; 38.3 percent of total regional/large urban park acreage inventoried is City owned
■ Regional/large urban park land is the only category of which the City does not own the gross majority of total acreage; much of the non-City owned acreage is attributable to the Santa Monica Mountain Conservancy, the Angeles National Forest, Topanga State Park, and Santa Anta Susana Pass State Historic Park
Based on these inventories, the service level for all park land is 9.231 acres per 1,000 persons; however, this number is drastically skewed by the large number of regional/large urban park land (89.5 percent of all acreage falls into the regional/large urban park classification).
The service levels for all four park classifications are:
■ Mini Parks - 0.013 acres per 1,000 persons
■ Neighborhood parks – 0.198 acres per 1,000 persons
■ Community parks – 0.759 acres per 1,000 persons
■ Regional and large urban parks – 8.261 acres per 1,000 persons
■ Total parks – 9.231 acres per 1,000 persons

chapter thirteen: parks growth&infrastructure2014
75
Preliminary recommended service level guidelines for park classifications are:
■ Mini parks – 0.10 acres per 1,000 persons
■ Neighborhood parks – 1.50 acres per 1,000 persons
■ Community parks – 2.00 acres per 1,000 persons
■ Regional and large urban parks – 6.00 acres per 1,000 persons
■ Total parks – 9.60 acres per 1,000 persons
Any recommended guidelines in the Needs Assessment are preliminary
only and need additional research and analysis to determine final
guidelines, goals, and objectives.
Public Recreational Assets and Amenities
Inventories and service levels of major assets and amenities are listed below. Service levels are based on inventories for all public recreational assets and amenities. Inventories include only those assets and amenities owned by the Recreation and Park Department and the Los Angeles County.
■ Playground – 383 total; 1 structure per 10,205 persons
■ Swimming pools – 58 total; 1 site per 67,388 persons
■ Splashpad – 9 total; 1 site per 434,280 persons
■ Picnic areas – 286 total; 1 site per 13,666 persons
■ Baseball/softball fields – 253 total; 1 field per 15,449 persons
■ Rectangular fields (football, soccer, lacrosse, et al.) – 170 total; 1 field per 22,991 persons
■ Basketball courts – 212 total; 1 court per 18,436 persons
■ Tennis courts – 321 total; 1 court per 12,176 persons
■ Volleyball courts – 32 total; 1 court per 122,141 persons
■ Dog parks – 9 total; 1 sit e per 434,280 persons
■ Skate parks – 0 total; 1 site per 434,280 persons
■ Community/cultural center space (square feet) – 1,502,000 square feet; 0.38 square feet per person
■ Recreation/fitness center space (square feet) – 2,101,000 square feet; 0.54 square feet per person
Quimby Quarterly Report April 2012The State Quimby Act, established in 1965, provides provisions in the State Subdivision Map Act for the dedication of parkland and/or payment of in-lieu fees as a condition of approval of certain types of residential development projects. The legislation was initiated in response to California’s increased rate of urbanization and the need to preserve open space and provide parks and recreation facilities for a growing population.
Any fees collected and/or land dedicated pursuant to the City’s Quimby Code are to be used to acquire new parkland or fund capital improvements at existing recreational and park facilities which will serve residents of the new development. Currently, fees can be only spent and land can only be dedicated within a service radius of one to two miles from the development that paid the fee.
The City’s Quimby Program is administered by the Department of Recreation and Parks (RAP) Planning and Construction Division. The Division prepares Quimby Status Reports every quarter to provide information about net collections, approved project allocations, completed and cancelled projects, and identified the maximum potential of Quimby funds per park.

76
growth&infrastructure2014chapter fourteen: airports
The Los Angeles World Airports (LAWA) is a proprietary department of the City of Los Angeles, under the management
and control of a seven-member Board of Airport Commissioners appointed by the
Mayor and confirmed by the City Council. LAWA operated three airports in the
Los Angeles Air Trade Area: Los Angeles International Airport (LAX), LA/Ontario
International Airport (ONT), and Van Nuys Airport (VNY). LAWA also maintains LA/
Palmdale Regional Airport (PMD).
Los Angeles International Airport (LAX)LAX is the major airport of LAWA, located approximately 15 miles from downtown Los Angeles on the western boundary of the City. LAX covers approximately 3,673 acres with Manchester Avenue located on the north, Aviation Boulevard on the east, Imperial Highway on the South, and Pacific Ocean on the west. LAX is the dominant airport in the five-county area comprised of Los Angeles, Orange, Riverside, San Bernardino, and Ventura.
LAX is the sixth busiest airport in the world and third busiest in the United States, offering 680 daily flights to 96 domestic cities and 910 weekly nonstop flights
to 59 cities in 30 countries on 60 commercial air carriers. In 2012, LAX served about 63.7 million passengers, processed over 1.9 million tons of air cargo valued at over $86.9 billion, and handled 605,480 aircraft operations. Additional information on LAX volume of air traffic, market share, and a ten-year summary can be found here.
LA/Ontario International Airport (ONT)ONT is a medium hub, full-service airport with commercial jet service to major cities in the United States and connecting service to international destinations. ONT is located in the City of Ontario, California, approximately 35 miles east of downtown Los Angeles and approximately 50 miles east of LAX. ONT occupies about 1,463 acres and serves a population of six million people in San Bernardino and Riverside counties and portions of north Orange County and east Los Angeles County. Additional information on ONT volume of air traffic, market share, and a ten-year summary can be found here.
Van Nuys Airport (VNY)VNY is a general aviation airport located approximately 20 miles northwest of downtown Los Angeles, in the San Fernando Valley. VNY occupies approximately 730 acres and is one of the busiest general aviation airports in the United States. Additional information on VNY volume of air traffic, based aircraft, total operations history, and traffic comparison count can be found here.
Project Fact Sheets
Los Angeles World Airport (LAWA) currently has a multi-billion-
dollar capital improvement program underway at Los Angeles
International Airport (LAX). On the Airports Development
Group website, LAWA provides a comprehensive fact sheet
for each project in the capital improvement program. Each fact
sheet presents a project description, traveler benefits, traveler
impacts, environmental impacts, construction dates, and cost
and funding.

growth&infrastructure2014
77
chapter fourteen: airports
Highlights of Major Projects Currently Under Construction at LAX
■ The Central Utility Plant Replacement project will replace the 50 year-old, existing Central Utility Plan (CUP) with a more modern and more efficient facility to be located west of the LAX Theme Building. Project costs are $438 million with funding from the LAX Airport Revenue Fund and proceeds from revenue bonds. The project is expected to be completed in 2014.
■ The Terminal 5 Renovation Project began to improve passenger service and security with a completed new in-line baggage screening system, expansion, and streamlining of the passenger screening check points and international passenger processing facilities. By the end of 2013, Delta Air Lines completed renovation of the baggage claim areas. It will also renovate the ticketing/check-in lobby, boarding gates and other parts of the passenger security screening area. A total of thirteen passenger boarding bridges will also be replaced. The cost of this project is $229 million, and it is expected to be completed in 2015.
Completed Projects at LAX
■ Tom Bradley International Terminal Modernization project was completed in May 2010. This $737-million renovation project included major interior renovations to the departures and ticketing lobby, customs and immigration arrivals hall, arrival corridors, and waiting area. The project also made modifications to two ___ gates to accommodate new aircraft. The addition of 45,000 square feet of space reduced passenger congestion in the airline ticketing lobby. Other elements of this project included improvements and upgrades to utilities, facility, and infrastructure. The overall cost was $737 million with $567 million of the total cost used for construction work and another $170 million allocated for architectural and engineering designs.
Airports Development Executive Management Program Status Report (Monthly)The Airports Development Group of the Los Angeles World Airport (LAWA) prepares monthly Program Status Reports to provide updates on the capital improvement projects. These reports present project description followed by the master program schedule, a financial section with budget, cash flow and change orders, owner-controlled insurance program (OCIP), and a subcontractor utilization summary report.
Los Angeles International Airport Master Plan 2004The Los Angeles International Airport (LAX) Master Plan is a modernization plan that accounts for the growth of the airport since 1984. The Draft LAX Master Plan and Draft Environmental Impact Statement and Environmental Impact Report were published in 2000-2001, which included three project alternatives: A, B, and C. The Draft documents was publicly circulated for public input. LAWA then developed a new alternative, Alternative D, with public comments taken into account. The Alternative D is a regional approach alternative for the LAX Master Plan that represents the communities’ priorities and increases safety and security of the airport.
The Final LAX Master Plan provides the basis for a broad policy statement regarding the conceptual strategic framework for future improvements at LAX and as working guidelines to be consulted by LAWA as it develops future projects

chapter fourteen: airports
78
growth&infrastructure2014
under the Master Plan. The following documents are regulatory entitlements and/or mitigation measures that implement Alternative D: the LAX Plan, the LAX Specific Plan, the Airport Layout Plan, the Tentative Tract Maps, the Mitigation Monitoring and Reporting Program, and the LAX Master Plan Program Relocation Plan.
LAX Plan 2004The LAX Plan is the City of Los Angeles’ general plan for the airport that sets goals, policies, objectives, and programs for long-term development. The Plan ensures that the use of airport is consistent with the vision established by Alternative D. The LAX Plan establishes a land use policy framework.
LAX Specific Plan 2013The LAX Specific Plan establishes zoning and development regulations and standards consistent with the LAX Plan for the airport and LAX Northside. It also establishes procedures for processing future projects and activities under the LAX Master Plan Program.
Airport Layout Plan
The Airport Layout Plan consists of a series of drawings that illustrate the layout of existing facilities at LAX and proposed facilities, consistent with Alternative D. Its goal is to serve as a record drawing for the airport and a guide for future development.
Tentative Tract Maps
The Tentative Tract Maps’ primary purpose is to vacate public streets that would no longer be necessary if Alternative D is approved and to provide for the orderly and proper abandonment or relocation of utilities that may be affected. It consolidates parcels that are no longer necessary.
Mitigation Monitoring and Reporting Program 2013 and Annual Progress Report (2011)The Mitigation Monitoring and Reporting Program (MMRP) ensures compliance with the proposed mitigation measures identified in the Final Environmental Impact Report (EIR). It describes the method and timing of implementation, monitoring frequency, and actions indicating compliance.
LAX Master Plan Program Relocation Plan The Relocation Plan addresses the acquisition of properties and relocation of businesses and residents, if any, associated with Alternative D. The Los Angeles World Airports (LAWA) will adopt a residential and business relocation plan in compliance with federal, state, and local law prior to the commencement of acquisition.
Los Angeles International Airport Specific Plan Amendment Study The Specific Plan Amendment Study (SPAS) identifies and evaluates potential alternatives to the projects that were previously analyzed as part of the LAX Master Plan Program required further evaluation prior to implementation.

growth&infrastructure2014
79
chapter fourteen: airports
Los Angeles International Airport Traffic Generation Report August 2013In 2004, the City of Los Angeles approved the LAX Master Plan to modernize airport infrastructure, improves accessibility, and enhance public service. The City also adopted the LAX Specific Plan at the same time to guide the Master Plan implementation. In 2006, LAWA initiated the Specific Plan Amendment Study process to evaluate the five Master Plan projects and to develop options for potential issues that may arise.
Per Section G, Monitoring and Reporting, of the LAX Airport Specific Plan, LAWA is required to prepare an annual Traffic Generation Report. This Report presents the number of trips being generated by LAX in the survey year of 2012, the number of trips anticipated to be generated at the completion of any Master Plan Projects in development at the time of the report, the trips proposed to be generated following the implementation of the Master Plan as informed by current and Project-based trip counts, and the number of trips anticipated to be generated by on-going Master Plan construction activities.
The Los Angeles World Airports (LAWA) conducted the airport trips monitoring during the airport’s peak weekday hour of 11 a.m. to noon and during the month of August, as required by the LAX Specific Plan. This allows LAWA to use the airport peak hour as its basis for comparison between the 1996 base year volume, the current traffic volume, and the projected 2015 traffic volume under the LAX Master Plan Environmental Impact Report (EIR).
The LAX Master Plan EIR forecasted that the total vehicle trips of all airport-related uses will be 26,011 during the airport peak hour at full build-out of the approved alternative in the Plan. This represents a net increase of 8,286 trips from the 1996 base year volume of 17,725. If the annual traffic volume report reveals that the development of the LAX Master Plan is likely to increase airport trips by more than 8,286 trips, LAWA will be responsible for completing a Specific Plan Amendment Study.
In 2012, LAX generated a total of 14,281 vehicle trips during the airport peak hour on a Friday in August. This total is 3,444 lower than the 17,725 vehicle trips for the 1996 base year. Since the 2012 total trip generation of 14,281 is well below the estimated trip generation projected for LAX after build-out of the Master Plan, LAWA is not required to prepare a Specific Plan Amendment Study until the next survey.
Aviation Activity Analysis Report 2013The Los Angeles World Airports (LAWA) prepares an annual Aviation Activity Analysis per Section 7 Subsection G, Monitoring and Reporting, of the Los Angeles International Airport Specific Plan. The Analysis Report identifies the number of passengers, volume of air cargo, and aircraft operations at the Los Angeles International Airport (LAX).
Statistics Summary
■ In 2013, the total passenger volume was 66.7 Million Annual Passengers (MAP), a 4.68 percent increase compared to 2012.
■ The total cargo volume in 2013 was 1.92 Million Annual Tons, a decrease of 1.5 percent compared to 2012.
■ The number of commercial aircraft operations (landings and takeoffs) totaled 559,080 in 2013, a 7 percent decrease from 2012.
Airport photos: Courtesy of Los Angeles World Airports (LAX)

80
growth&infrastructure2014chapter fifteen: harbor
The Port of Los Angeles is located in San Pedro Bay 20 miles south of downtown Los Angeles, the gateway
for international commerce. The Port of Los Angeles covers 7,500 acres of land
and water along 43 miles of waterfront. It has 24 passenger and cargo terminals,
including automobile, breakbulk, container, dry and liquid bulk, and warehouse
facilities. The Port is also home to the nation’s cruise passenger complex, the
World Cruise Center. This seaport features record-setting cargo operations as
well as environmental initiatives, security measures, diverse recreational and
educational facilities, and Los Angeles’ waterfront destination.
The Port of Los Angeles is a proprietary department of the City of Los Angeles. It is self-supporting and does not receive taxpayer dollars. The Port is directed by a five-member Board of Harbor Commissioners, whose members are appointed by the Mayor and approved by the Los Angeles City Council. The Port derives its fees from shipping and other services and is considered a landlord port, leasing property to tenants who, in turn, operate their own facilities.
Annual container counts for Port of Los Angeles are measured in twenty-foot equivalent units (TEUs), a standard measurement used in the maritime industry for measuring containers of varying lengths. In Fiscal Year (FY) 2012, the Port of Los Angeles handled 8.1 million TEUs, a 2.5 percent increase from FY 2011. The Port ranked 1st place in the United States and 16th in the world in the container volume ranking.
In CY 2012, the Port’s top five containerized imports were furniture (412,057 TEU), apparel (327,070 TEU), auto parts (318,808 TEU), electronic products (217,707 TEU), and footwear (145,905 TEU). The top five containerized exports in CY 2012 were wastepaper (332,054 TEU), animal feeds (197,013 TEU), scrap metal (196,845 TEU), cotton (108,700 TEU), and resins (68,309).
The Port of Los Angeles’ top trading partners in CY 2012 were China/Hong Kong ($138 billion), Japan ($46 billion), South Korea ($17 billion), Taiwan ($13 billion), and Vietnam ($10 billion).
The Port of Los Angeles has a significant economic impact on the region as well as the nation with total operating revenue of $409.8 million and net income of $101.9 million in FY 2012. The Port generates about 994 jobs at the City of Los Angeles Harbor Department. In California, there are about 1.2 million jobs related to the Port of Los Angeles and about 3.6 million jobs throughout the United States.
The Port Master Plan August 2013The Port Master Plan is a long-range plan that establishes policies and guidelines for future development within the coastal zone boundary of the Port of Los Angeles. The California Coastal Act of 1976 requires a Port Master Plan, which should respond to the demands of international and domestic waterborne commerce, navigation, and fisheries.
The original Port Master Plan was first approved and certified by the Los Angeles Harbor Commission in 1980. Since then, there have been twenty amendments to the original Master Plan.
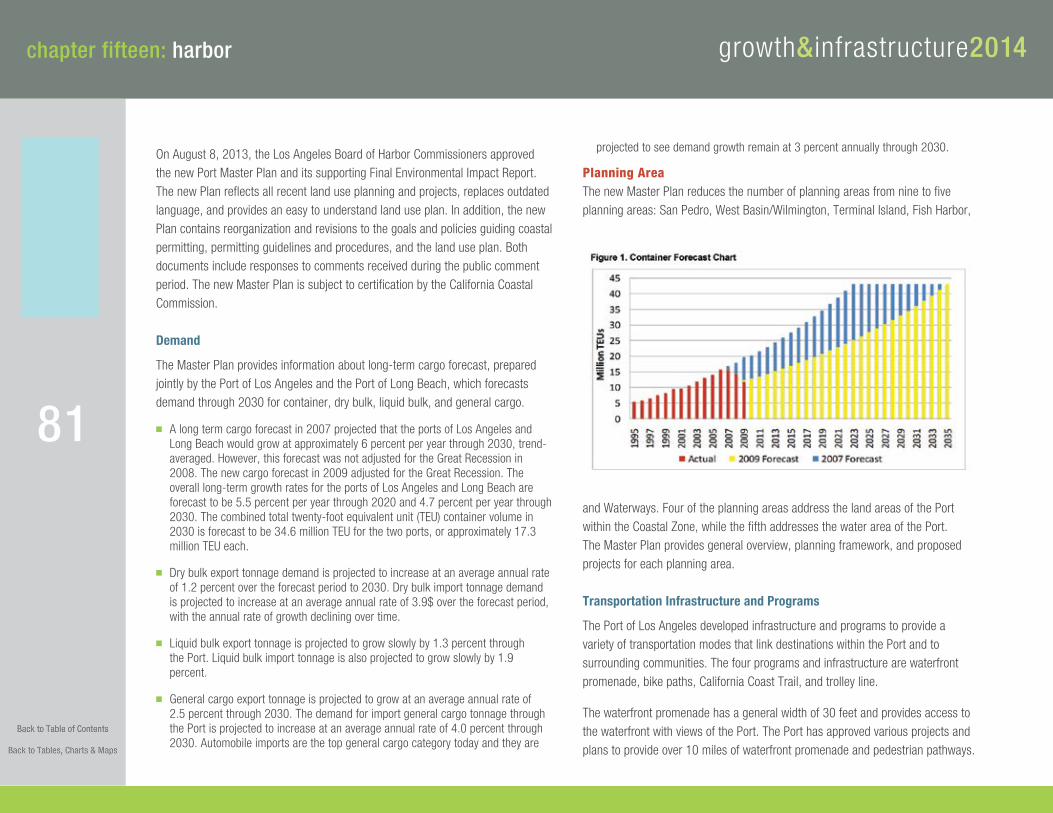
growth&infrastructure2014
81
chapter fifteen: harbor
On August 8, 2013, the Los Angeles Board of Harbor Commissioners approved the new Port Master Plan and its supporting Final Environmental Impact Report. The new Plan reflects all recent land use planning and projects, replaces outdated language, and provides an easy to understand land use plan. In addition, the new Plan contains reorganization and revisions to the goals and policies guiding coastal permitting, permitting guidelines and procedures, and the land use plan. Both documents include responses to comments received during the public comment period. The new Master Plan is subject to certification by the California Coastal Commission.
Demand
The Master Plan provides information about long-term cargo forecast, prepared jointly by the Port of Los Angeles and the Port of Long Beach, which forecasts demand through 2030 for container, dry bulk, liquid bulk, and general cargo.
■ A long term cargo forecast in 2007 projected that the ports of Los Angeles and Long Beach would grow at approximately 6 percent per year through 2030, trend- averaged. However, this forecast was not adjusted for the Great Recession in 2008. The new cargo forecast in 2009 adjusted for the Great Recession. The overall long-term growth rates for the ports of Los Angeles and Long Beach are forecast to be 5.5 percent per year through 2020 and 4.7 percent per year through 2030. The combined total twenty-foot equivalent unit (TEU) container volume in 2030 is forecast to be 34.6 million TEU for the two ports, or approximately 17.3 million TEU each.
■ Dry bulk export tonnage demand is projected to increase at an average annual rate of 1.2 percent over the forecast period to 2030. Dry bulk import tonnage demand is projected to increase at an average annual rate of 3.9$ over the forecast period, with the annual rate of growth declining over time.
■ Liquid bulk export tonnage is projected to grow slowly by 1.3 percent through the Port. Liquid bulk import tonnage is also projected to grow slowly by 1.9 percent.
■ General cargo export tonnage is projected to grow at an average annual rate of 2.5 percent through 2030. The demand for import general cargo tonnage through the Port is projected to increase at an average annual rate of 4.0 percent through 2030. Automobile imports are the top general cargo category today and they are
projected to see demand growth remain at 3 percent annually through 2030.
Planning AreaThe new Master Plan reduces the number of planning areas from nine to five planning areas: San Pedro, West Basin/Wilmington, Terminal Island, Fish Harbor,
and Waterways. Four of the planning areas address the land areas of the Port within the Coastal Zone, while the fifth addresses the water area of the Port. The Master Plan provides general overview, planning framework, and proposed projects for each planning area.
Transportation Infrastructure and Programs
The Port of Los Angeles developed infrastructure and programs to provide a variety of transportation modes that link destinations within the Port and to surrounding communities. The four programs and infrastructure are waterfront promenade, bike paths, California Coast Trail, and trolley line.
The waterfront promenade has a general width of 30 feet and provides access to the waterfront with views of the Port. The Port has approved various projects and plans to provide over 10 miles of waterfront promenade and pedestrian pathways.

chapter fifteen: harbor
82
growth&infrastructure2014
The Port, in coordination with the City of Los Angeles Department of City Planning, has developed bicycle access throughout the outer edges of the Port. The bicycle paths range from designated bike lanes within streets to multipurpose pathways that accommodate bicycles along the promenade.
The California Coastal Trail is a network of public trails along the 1,200-mile California coastline. The Port promenade is linked to the Coastal Trail’s upper and lower coastal trails.
The Port of Los Angeles has a 1.5-mile vintage trolley line called Waterfront Red Car Line that connects the World Cruise Center with sites along the San Pedro Waterfront to the Outer Harbor. In addition, the San Pedro Historic Business Improvement District provides a rubber-tired trolley that serves the World Cruise Center, Ports O’Call Village, and Downtown San Pedro.
Development Guidelines and Policies
The Master Plan outlines the development guidelines, process for issuing coastal permits, and coastal development permit policies. Information about application procedures, permit types and general procedures, public hearing, board action, revocation, reapplication, and approval can be found in the document.
The Port of Los Angeles Strategic Plan 2012-2017The Strategic Plan is a visioning document that aligns the broad spectrum of activities of the Port of Los Angeles. The Plan outlines both Port-wide priorities and objectives and Bureau-specific initiatives. Each initiative is paired with metrics that will be used to measure the Port’s performance and success.
Port of Los Angeles Adopted Annual Budget Fiscal Year 2013-2014The Los Angeles Harbor Commission adopted an annual budget of $1.1 billion for Fiscal Year 2013-14. The adopted budget includes $451.9 million for Capital, $236.2 million as the unappropriated balance, $209.1 million in operating expenses, $130.1 million in restricted cash/future commitments, and $43.8 million in debt repayments/non-operating expenses. The total capital spending includes one of the largest annual Capital Improvement Programs (CIPs) in Port
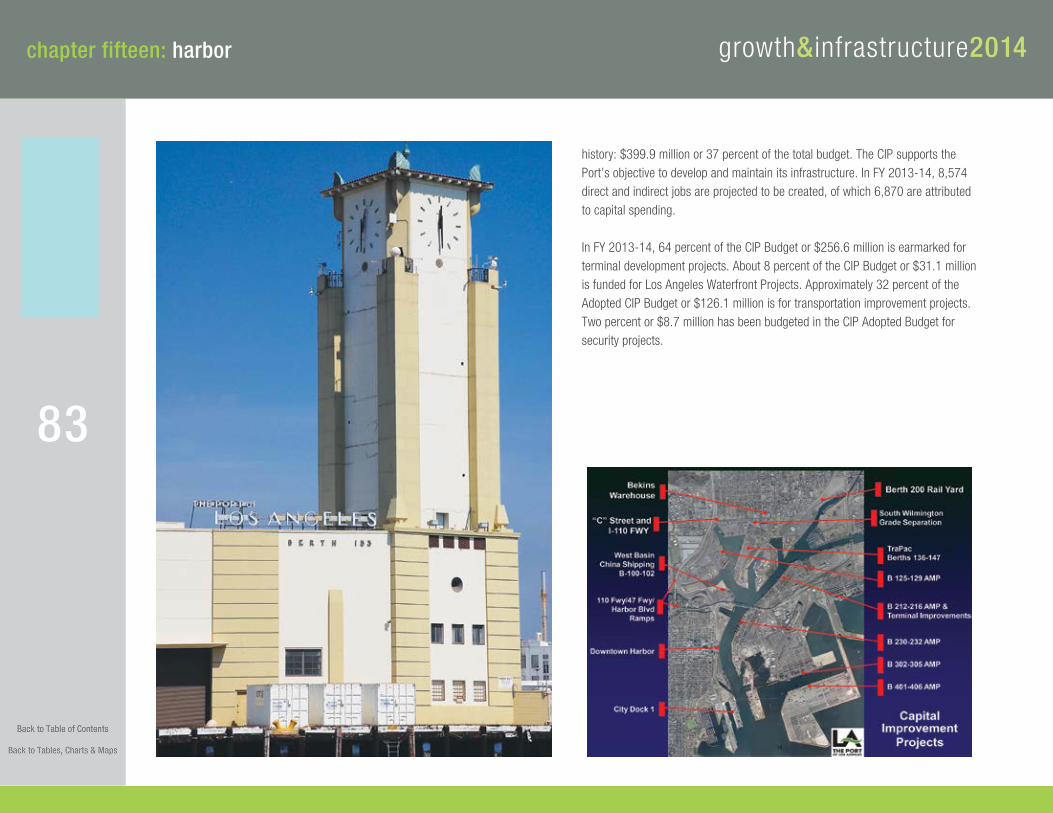
growth&infrastructure2014
83
chapter fifteen: harbor
history: $399.9 million or 37 percent of the total budget. The CIP supports the Port’s objective to develop and maintain its infrastructure. In FY 2013-14, 8,574 direct and indirect jobs are projected to be created, of which 6,870 are attributed to capital spending.
In FY 2013-14, 64 percent of the CIP Budget or $256.6 million is earmarked for terminal development projects. About 8 percent of the CIP Budget or $31.1 million is funded for Los Angeles Waterfront Projects. Approximately 32 percent of the Adopted CIP Budget or $126.1 million is for transportation improvement projects. Two percent or $8.7 million has been budgeted in the CIP Adopted Budget for security projects.