2014 investor update - ubs investor update ceo, wealth management jürg zeltner ... this...
TRANSCRIPT
CEO, Wealth Management Americas and UBS Group Americas
Bob McCann
May 6, 2014
2014 Investor Update
CEO, Wealth Management Jürg Zeltner
Leading Global Franchise with Superior Growth Prospects

Cautionary statement regarding forward-looking statements This presentation contains statements that constitute “forward-looking statements”, including but not limited to management’s outlook for UBS’s financial performance and statements relating to the anticipated effect of transactions and strategic initiatives on UBS’s business and future development. While these forward-looking statements represent UBS’s judgments and expectations concerning the matters described, a number of risks, uncertainties and other important factors could cause actual developments and results to differ materially from UBS’s expectations. These factors include, but are not limited to: (i) the degree to which UBS is successful in executing its announced strategic plans, including its efficiency initiatives and its planned further reduction in its Basel III risk-weighted assets (RWA) and leverage ratio denominator; (ii) developments in the markets in which UBS operates or to which it is exposed, including movements in securities prices or liquidity, credit spreads, currency exchange rates and interest rates and the effect of economic conditions and market developments on the financial position or creditworthiness of UBS’s clients and counterparties; (iii) changes in the availability of capital and funding, including any changes in UBS’s credit spreads and ratings, or arising from requirements for bail-in debt or loss-absorbing capital; (iv) changes in or the implementation of financial legislation and regulation in Switzerland, the US, the UK and other financial centers that may impose more stringent capital (including leverage ratio), liquidity and funding requirements, incremental tax requirements, additional levies, limitations on permitted activities, constraints on remuneration or other measures; (v) uncertainty as to when and to what degree the Swiss Financial Market Supervisory Authority (FINMA) will approve reductions to the incremental RWA resulting from the supplemental operational risk-capital analysis mutually agreed to by UBS and FINMA effective 31 December 2013, or will approve a limited reduction of capital requirements due to measures to reduce resolvability risk; (vi) the degree to which UBS is successful in executing the announced creation of a new Swiss banking subsidiary, a holding company for the UBS Group, a US intermediate holding company, changes in the operating model of UBS Limited and other changes which UBS may make in its legal entity structure and operating model, including, the possible consequences of such changes, and the potential need to make other changes to the legal structure or booking model of UBS Group in response to legal and regulatory requirements, including capital requirements, resolvability requirements and the pending Swiss parliamentary proposals and proposals in other countries for mandatory structural reform of banks; (vii) changes in UBS’s competitive position, including whether differences in regulatory capital and other requirements among the major financial centers will adversely affect UBS’s ability to compete in certain lines of business; (viii) the liability to which UBS may be exposed, or possible constraints or sanctions that regulatory authorities might impose on UBS, due to litigation, contractual claims and regulatory investigations; (ix) the effects on UBS’s cross-border banking business of tax or regulatory developments and of possible changes in UBS’s policies and practices relating to this business; (x) UBS’s ability to retain and attract the employees necessary to generate revenues and to manage, support and control its businesses, which may be affected by competitive factors including differences in compensation practices; (xi) changes in accounting or tax standards or policies, and determinations or interpretations affecting the recognition of gain or loss, the valuation of goodwill, the recognition of deferred tax assets and other matters; (xii) limitations on the effectiveness of UBS’s internal processes for risk management, risk control, measurement and modeling, and of financial models generally; (xiii) whether UBS will be successful in keeping pace with competitors in updating its technology, particularly in trading businesses; (xiv) the occurrence of operational failures, such as fraud, unauthorized trading and systems failures; and (xv) the effect that these or other factors or unanticipated events may have on our reputation and the additional consequences that this may have on our business and performance. The sequence in which the factors above are presented is not indicative of their likelihood of occurrence or the potential magnitude of their consequences. Our business and financial performance could be affected by other factors identified in our past and future filings and reports, including those filed with the SEC. More detailed information about those factors is set forth in documents furnished by UBS and filings made by UBS with the SEC, including UBS’s Annual Report on Form 20-F for the year ended 31 December 2013. UBS is not under any obligation to (and expressly disclaims any obligation to) update or alter its forward-looking statements, whether as a result of new information, future events, or otherwise. Disclaimer: This presentation and the information contained herein are provided solely for information purposes, and are not to be construed as a solicitation of an offer to buy or sell any securities or other financial instruments in Switzerland, the United States or any other jurisdiction. No investment decision relating to securities of or relating to UBS AG or its affiliates should be made on the basis of this document. Refer to UBS's first quarter 2014 report and its Annual report on Form 20-F for the year ended 31 December 2013. No representation or warranty is made or implied concerning, and UBS assumes no responsibility for, the accuracy, completeness, reliability or comparability of the information contained herein relating to third parties, which is based solely on publicly available information. UBS undertakes no obligation to update the information contained herein. © UBS 2014. The key symbol and UBS are among the registered and unregistered trademarks of UBS. All rights reserved.
WM/WMA 1

1,593 1,769
31.12.12 31.3.14
2.73.3
2012 2013
4754
2012 2013
Our wealth management franchise is unrivalled
Refer to slide 31 for details about adjusted numbers, Basel III numbers and FX rates in this presentation 1 Scorpio Partnership Private Banking Benchmark, Private Banker International, UBS Estimates; 2 Euromoney 2013; 3 Figure corrected after publication of the presentation, to align with figure reported in UBS's 1Q14 report
"Best Private Bank Globally 2013" and "Best Global Wealth Manager 2013"2
8993 872
Profit before tax: WM + WMA adjusted, 2013, CHF billion
Invested assets: WM + WMA CHF billion
Net new money: WM + WMA CHF billion
+25% +14% +11%
USD 1 trillion invested assets, USD 1 billion adjusted pre-tax profit USD 1 million in revenue per FA
Well positioned to capture growth opportunities; continued progress in banking initiatives
Wealth Management Americas 2013
Wealth Management 2013
CHF 0.9 trillion invested assets, CHF 2.4 billion adjusted pre-tax profit CHF 1.8 million in revenue per CA
Leading position in Europe, APAC, Emerging Markets, Switzerland and UHNW segment by invested assets1
Invested assets of CHF 1.8 trillion managed by over 11,000 advisors
Invested assets 31.3.14, CHF billion
WM/WMA 2

UBS is best positioned to seize the global wealth management opportunity
North America1,2 estimated market growth CAGR 2012-2017
Emerging markets1,2,4 estimated market growth CAGR 2012-2017
Europe including Switzerland1,3 estimated market growth CAGR 2012-2017
APAC1 estimated market growth CAGR 2012-2017
~2%
~3%
~8%
~8%
1 BCG World Wealth Report 2013; incl. retail households; 2013 growth based on growth forecast; 2 WMA's Latin America business is included in the North America invested assets, not in emerging markets; 3 Includes Western Europe and all other countries not covered elsewhere, beneficiary owner domicile view, invested assets are the sum of the invested assets usually reported in Europe and Switzerland; 4 Middle East & Africa, Latin America and Eastern Europe; 5 UHNW invested assets overlap with the regional split; 6 Figure corrected after publication of the presentation, to align with figure reported in UBS's 1Q14 report
Fundamentally attractive industry economics
Compelling growth prospects
– UHNW ~8%1
– HNW ~6%1
Still highly fragmented industry
Our footprint is unique with a strong presence in growth markets
UHNW globally1,5 estimated market growth CAGR 2012-2017
~8%
872
5126
1546
2236
424
UBS invested assets 31.3.14
CHF billion
WM/WMA 3

Wide range of investment products
Strength in Equities, Alternatives, and Real Estate
Tailored solutions
Financial strength
Strong brand
Efficiency opportunity
Leveraging the Group capabilities to serve our clients
4
Access to capital markets and product development
Top-notch execution & institutional-like client coverage
Strength in Equities and FX
Research
M&A advisory/Corporate Finance
Joint venture with wealth management businesses: Global Family Office
Client referrals
Largest and most efficient booking center
Domestic reach in Swiss market
Investment Bank
Retail & Corporate (for WM)
Global Asset Management
Corporate Center
WM/WMA
Client

Management agenda to drive profit growth
Apply our unique set of global capabilities across both businesses UHNW/GFO
Prudently expand services to lending and financing solutions Banking products and lending
Implement pricing aligned with value proposition Pricing
Manage direct costs to stay within the new cost/income targets Cost efficiency
Leverage our global expertise across the entire client base Investment engine
WM/WMA
We aspire to 10-15% adjusted pre-tax profit growth
5

Wealth Management Business Division
WMA WMWM
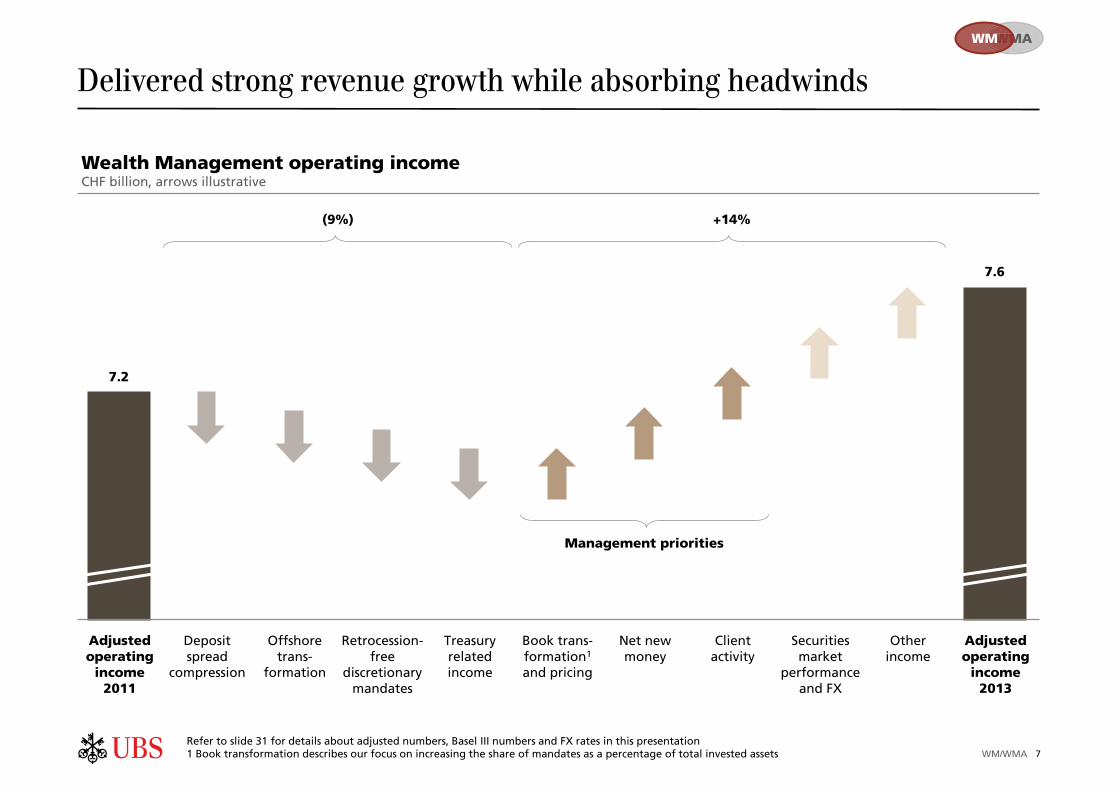
Delivered strong revenue growth while absorbing headwinds
(9%) +14%
Adjusted operating
income 2013
Treasury related income
Deposit spread
compression
Adjusted operating
income 2011
Offshore trans-
formation
Retrocession- free
discretionary mandates
Book trans-formation1 and pricing
7.2
7.6
Refer to slide 31 for details about adjusted numbers, Basel III numbers and FX rates in this presentation 1 Book transformation describes our focus on increasing the share of mandates as a percentage of total invested assets
Wealth Management operating income CHF billion, arrows illustrative
Other income
Securities market
performance and FX
Client activity
Net new money
Management priorities
WM/WMA 7

Over 40% of revenues from Asia Pacific and Emerging Markets
Operating income by business area adjusted, CHF billion
By client segment 2013
20112
Operating income
~72%
~28%
~70%
~30%
Other UHNW
UHNW cost/income ratio: ~63%
Refer to slide 31 for details about adjusted numbers, Basel III numbers and FX rates in this presentation 1 Adjusted, excluding CHF 107 million for Swiss/UK tax agreement and CHF 58 million for cross-border litigation provisions; 2 Excluding the gain on the sale of the strategic investment portfolio of CHF 433 million
35%
44%
21%
17%
18%
Europe
Switzerland
Asia Pacific
Emerging markets 41%
40%
19%
22%
18%
WMA WMWM
2013
7.2 7.6
WM/WMA
Profit before tax1
Substantial increase in profit contribution from APAC
Continued investments in Emerging Markets
Europe and Switzerland most affected by low levels of interest rates and transactions
8
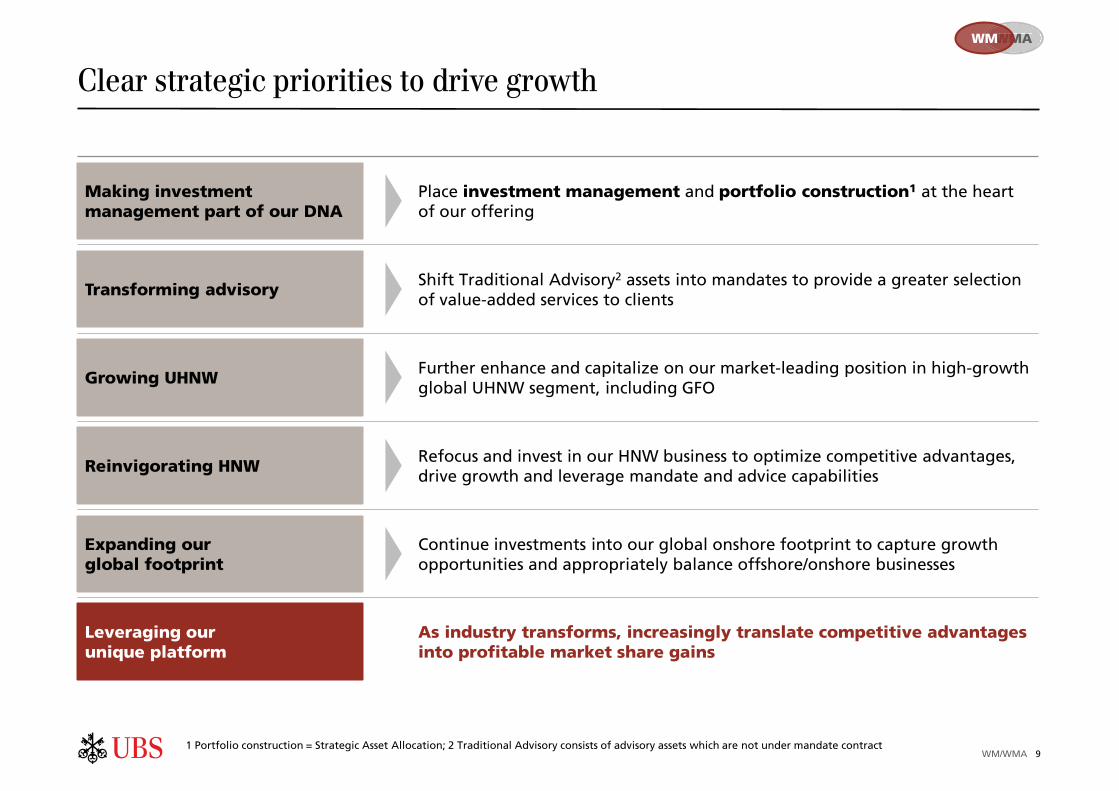
Clear strategic priorities to drive growth
Shift Traditional Advisory2 assets into mandates to provide a greater selection of value-added services to clients
Transforming advisory
Continue investments into our global onshore footprint to capture growth opportunities and appropriately balance offshore/onshore businesses
Expanding our global footprint
Further enhance and capitalize on our market-leading position in high-growth global UHNW segment, including GFO
Growing UHNW
Refocus and invest in our HNW business to optimize competitive advantages, drive growth and leverage mandate and advice capabilities
Reinvigorating HNW
Place investment management and portfolio construction1 at the heart of our offering
Making investment management part of our DNA
WMA WMWM
WM/WMA 1 Portfolio construction = Strategic Asset Allocation; 2 Traditional Advisory consists of advisory assets which are not under mandate contract
9
As industry transforms, increasingly translate competitive advantages into profitable market share gains
Leveraging our unique platform

Taking care of our clients' wealth
UBS House View tailored to regional and local demands
Ability to customize
Extensive external and internal communication to support implementation and build reputation as an investment manager
Clear and consistent views on markets and asset classes used by all advisors around the world
Input from >850 in-house specialists and renowned external money managers
Institutional-type response time to market events
Deep understanding of our clients' investment needs and risk tolerance
Six consistent risk/return profiles used across all products
House View
Return
Risk
Client profiling
WMA WMWM
WM/WMA
Traditional Advisory
Discretionary mandates
Advisory mandates
Leveraging our investment engine across the entire client base
10

Benefits
Superior client value proposition allowing for premium pricing
Gross margin pick-up
Increasing share of higher-quality recurring revenues
Scalability of mandate platform: low marginal costs
Institutionalization of relationships
Scope for cost savings as book shift progresses
Lower regulatory risk exposure
Potential for positive performance impact on asset base
~40%
We aspire to manage a larger proportion of invested assets
22%
56%
22% Traditional Advisory
(Cash and cash-equivalent1)
Traditional Advisory
(Non-cash assets)
Discretionary and advisory
mandates
Current book structure2
Aspirational book structure
Positive impact on gross margin
1 Cash and cash-equivalent include all accounts, short-term deposit and money market instruments (including funds); 2 As at 31.12.13
WMA WMWM
WM/WMA
Trad
itio
nal
Ad
viso
ry 1
00%
28%
72%
11
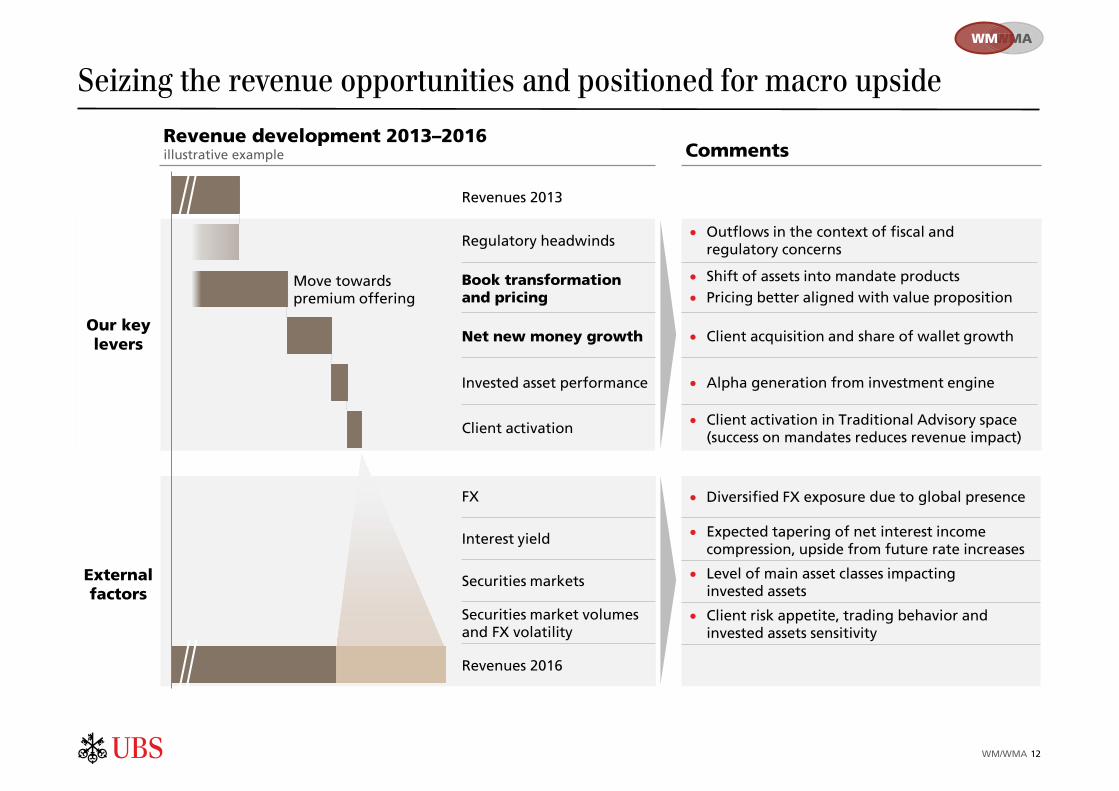
Comments
Seizing the revenue opportunities and positioned for macro upside
Outflows in the context of fiscal and regulatory concerns
Expected tapering of net interest income compression, upside from future rate increases
Shift of assets into mandate products Pricing better aligned with value proposition
Client activation in Traditional Advisory space (success on mandates reduces revenue impact)
Client acquisition and share of wallet growth
Alpha generation from investment engine
Diversified FX exposure due to global presence
Client risk appetite, trading behavior and invested assets sensitivity
Level of main asset classes impacting invested assets
Move towards premium offering
Revenues 2013
Regulatory headwinds
Book transformation and pricing
Client activation
Net new money growth
FX
Interest yield
Securities markets
Securities market volumes and FX volatility
Revenues 2016
Invested asset performance
Revenue development 2013–2016 illustrative example
WMA WMWM
WM/WMA 12

Low marginal costs from additional revenues
Scalable platform
Capitalizing on our investments
Positive operating leverage
Positive operating leverage supported by business model, mix shift, and cost savings
Increasing focus on costs
Realizing efficiency improvements to fund investments
Continued annual investments of 3-5% of revenues
Natural cost growth
Rising regulatory expenses
Strategic investments
Front office efficiency
Non-revenue-generating population and rank structure
Organization design
Successful execution of Corporate Center model
Net cost growth and investments
Front office cost savings
Allocated cost savings
Structural "positive jaws"
Operating leverage illustrative example, bars not to scale
Pre-tax profit t Pre-tax profit t+1
WMA WMWM
WM/WMA
Low marginal costs from additional revenues
13

Wealth Management Americas Business Division

WM MWMA
Accelerate growth through transformation
WMA's unique positioning and global reach enabling growth through transformation 3 pillars of growth
WM/WMA
Banking products and lending
Wealth Management advice
Cross-business collaboration
Source: Company filings, McKinsey analyses, and WMA analyses Note: Wirehouse data based on wealth management businesses of Bank of America, Morgan Stanley and Wells Fargo. Percentage of invested assets greater than USD 1 million based on McKinsey analysis; pre-tax profit margin and asset size derived by WMA
(2%)
4%
9%
14%
19%
24%
29%
60% 65% 70% 75% 80% 85% 90% 95% 100%
Clients with invested assets USD >1 million
Pre
-tax p
rofi
t m
arg
in
= USD 500 billion
2011
2013
WMA Future
Wire-house
median
US private bank median
2009
30%
25%
20%
15%
10%
5%
0%
15

17.922.8
29.2
0.1
2.0
6.4
2.8
4.9
3.5
20.8
29.7
39.1
31.12.09 31.12.11 31.12.13
Pillars of further growth—Banking and lending
Lending balances USD billion
Mortgage balances and securities-based lending increased by 220% and 28%, respectively, between 2011 and 2013
Over 99% of loans secured by securities (83%) and residential property (16%)
Since 2010 average spreads earned on securities-based lending increased by 29 bps
Strong advisor engagement, well positioned for further growth:
– Advisor penetration1 in mortgage products increased from 8% in 2009 to more than 26% in 2013; ambition to double
– Clients with new securities-based lending approvals in 2013 generated ~USD 10 billion in net new money
WM MWMA
+88%
Securities-based lending Mortgages Other
WM/WMA 16 1 Advisor penetration defined as an advisor originating more than 1 mortgage in a rolling 12-month period

79 96
Pillars of further growth—Holistic wealth management advice
WM MWMA
WM/WMA
Clients need wealth management advice
Executing programs to support advice delivery
Aligned incentive programs
Developing advisors
Team formation
Advisor training/eLearning
Practice management
Client focus/efficiency
Supporting advisors in delivering holistic advice
Global CIO
Marketing
Clients more satisfied when receiving more holistic wealth management advice
Breadth of advice1
Source: UBS Investor Survey (March 2014), 1,145 respondents with more than USD 1 million in invested assets 1 Breadth of advice represents number of advice dimensions received by investor (shown 1 advice dimension vs. 7 advice dimensions)
Satisfaction with advisor
Plan
Access
Save
Borrow
Grow
Give
Protect
% likely to refer advisor
Satisfaction with firm
Satisfaction with value of fees
% of assets with advisor
79 98
6385
61 73
74 98
17

Financial plans drive deeper relationships and stronger economics1
WM MWMA
WM/WMA
1 Based on internal analysis of WMA (sample of existing and new) households who received a financial plan vs. equivalent households who did not, comparing their change in key performance metrics between the pre-plan and post-plan time periods; figures above represent differences in period-over-period change between plan households and non-plan equivalent households
Existing clients YoY change
New clients YoY change
A financial plan drives stronger economics A financial plan drives asset growth
Revenues
Advisory program penetration
Client retention
NNM
NNM New clients with plan prior to account opening
57%
539%
22%
306%
261%
18

Pillars of further growth—Cross-collaboration to deliver the firm
WM MWMA
WM/WMA
3,488 referrals and 943 wins in 2013; 1Q14 IB referral revenue up 2.3x YoY
Fostering a culture of collaboration
Accomplished:
Stronger Americas regional governance with cross-business leadership
Created regional client committee
Defined referral incentive structure
Underway:
Developing trust and business relationships between bankers and advisors
Proactively identifying opportunities – WMA C-Suite/Board member
relationships – Corporate services opportunities
from IB relationships – IPO and liquidity event transactions
Collaboration within organization to meet client needs
Global Asset Management
Investment Bank
Corporate Services
WM/WMA
Global CIO and Wealth Management Research
Global Family Office
Private Bank
Wealth Advice Center
Equity plan advisory services
Institutional consulting and 401k
Corporate cash management
Directed share programs
M&A and IPOs
Block trades
Corporate and structured lending
Investment solutions for retirement plans
and institutions Corporate cash
management
19

Targets

2011 2012 2013 Old target
New target
2011 2012 2013 Target
2011 2012 2013 Target
2011 2012 2013 Old target
New target
2011 2012 2013 Target
2011 2012 2013 Target
Targets1
Very limited capital consumption required for capturing structural growth potential
Cost/income ratio adjusted
Gross margin bps
Net new money growth annual % of invested assets
Wealth Management Americas Wealth Management
WM/WMA
91% 90% 86% 80-90% 75-85%
79 78 79 75-85
1.9% 2.9% 2.3%
2-4%
68% 71% 66% 60-70% 55-65%
96 89 88 95-105
3.1% 3.5% 4.4% 3-5%
Refer to slide 31 for details about adjusted numbers, Basel III numbers and FX rates in this presentation 1 Annual performance targets. Performance targets assume constant FX rates 21

Key messages
Our wealth management businesses are uniquely positioned to capture the global wealth management opportunity
We leverage our global platform and the capabilities of the entire Group to serve the needs of our clients
We aspire to deliver 10-15% adjusted pre-tax profit growth per year over the cycle across both our wealth management businesses
WM/WMA 22

Appendix

Key elements of our platform
WM platform
Clients from >200 domiciles covered via 25 booking centres globally Presences in >40 countries with increasing share of total assets Global reach allowing to capture growth in APAC, GEM and UHNW segment
Highly scalable investment management and advice engine, large product shelf Close cooperation with all other UBS divisions Most of the value chain across markets/client segments covered in-house, broad pool of specialists
Executed WM order flow of >CHF 2,500 billion across all asset classes in 2013; ~590k products ready to trade Custody offering allowing maximum safety and flexibility Global customized consolidated reporting including in-depth performance analytics
Robust framework in place supporting our front-to-back offering across multiple jurisdictions Fully embedded product and investment suitability rules Strong risk management track record
Unique global platform covering the entire value chain across many markets and client segments
Given barriers of entry, impossible to replicate organically
Global reach and leading market positions
Global compliance and risk management framework
Comprehensive investment and advice offering
Unrivalled execution, custody and reporting capabilities
WM/WMA 24

Process behind our investment engine
Client profiling
Analysis UBS House View Investment strategy
Investment solutions
Portfolio management goals
Client advisors gather and maintain deep understanding of our clients' investment needs and risk tolerance
Six consistent risk/ return profiles used across all products
Large scale investment in systems allowing real time scenario analysis
>850 economists, analysts and investment experts within UBS
Coverage of all major asset classes
Reconciling local, bottom up input with top down macro views
Constant monitoring, adjustment, communication, and implementation
Formation of the single UBS House View with clear and consistent positions on markets and asset classes
Tailored communication to internal and external clients
"Avoiding tunnel vision" through systematic feedback from external fund managers as well as input from client-facing front-end
Based on UBS House View, determination of strategic asset allocation (SAA) and tactical asset allocation (TAA), augmented by thematic and tactical satellite investment ideas
Local, regional, and global opportunities presented in one consistent framework
Extensive quantitative modeling to ground qualitative assessments
Delegated, segregated investment management portfolios reflecting UBS House View, tailored to client's profile
Contract-based advisory enabling clients to monitor and correct portfolios against their profile and UBS House View
Providing Traditional Advisory clients with solutions aligned with UBS House View
Investment and advisory mandates aligned to client profiles, reference currencies and investment strategies
Investment mandates: Optimal instrument selection within portfolio construction; ability to accomplish personal investment instructions
Advisory mandates with daily health checks and customized solutions
Leverage single instrument expertise for optimizing Traditional Advisory portfolios
IPS CIO Office
WM/WMA 25

Chief Investment Office
Fully institutionalized, state-of-the-art and highly scalable Chief Investment Office
Objective: achieving best risk/return outcomes while matching client needs
Strategic Asset Allocation with a 5- to 7-year time horizon, expected to deliver majority of investment performance
CIO Global Unconstrained Investment View (tactical 6-month horizon): deploying tactical trades to SAAs within pre-defined and limited risk budget => 122 bps of alpha in 20131
Resources Processes Performance
CIO office staff ~180 in 12 locations
Next to buy-side investment experts, significant resources dedicated to communication and process management
Given front-end demand, dedicated regional and UHNW CIO offices
Ability to draw input from >850 specialists within UBS Group and to leverage real-time input from the IB's direct market presence
Heavy technology spending to develop necessary internal IT capabilities
– Built scalable proprietary computer systems to run client portfolio health checks
– Created automated client alerts on needed adjustments to optimize risk/return
Sophisticated processes to form investment strategies and manage positions, incorporating
– Best practice quantitative and qualitative components
– Extensive challenge process, including external and client feedback
– Real-time, live updating capability
Since 2010, developed and embedded fully integrated value chain together with internal partners
Ensuring impact of formed investment views and aligned product solutions on
– Discretionary mandates
– Advisory mandates
– Traditional Advisory business
– UBS mutual funds
Benefiting individual wealth management clients by delivering institutional quality services in customized ways
125 bps
100 bps
75 bps
50 bps
25 bps
0 bps
Dec 2012
Dec 2013
Aug 2013
Apr 2013
122 bps
Target range
1 Comparative results based on market indices representing the relevant asset sub-classes, measured on a currency hedged basis with the exception of emerging market equities. The performance calculation does not take into account any transaction costs or fees WM/WMA 26

Investment Products and Services (IPS)
Enabling the transformation of the WM book of business
Fee-based advice in portfolio context Daily monitoring of portfolio against pre-defined criteria with CA alerts Daily customized investment opportunities in line with UBS House View, portfolio risk/return contribution and suitability ~30,000 mandates across asset classes and geographies ~130 specialists
Personalized wealth life-cycle advice
Highly specialised experts across disciplines and markets
Ability to deliver sophisticated and bespoke client solutions in-house
Broad product offering
~420 specialists
Traditional Advisory and shelf engine
Advice in line with UBS House View
Offering includes Equities, Fixed income, FX, Structured Products, Investment Funds, Alternatives and Precious Metal
Monitoring of ~26,000 securities, of which 6,000 actively offered
~300 specialists
Discretionary investment management with broad product offering
Ability to customize though personal instructions
~100,000 discretionary mandates across asset classes and geographies
Consistent translation of UBS House View into ~10,000 model portfolios
~400 specialists
DiscretionaryMandates
Wealth Planning
Non-contract Advice and Brokerage
Advisory Mandates
Clients
IPS1
Integral part of value chain and transformation enabler
Focus on customization, innovation and scalability
First point of contact for client advisors 1 As well as the functions highlighted on the slide, IPS is also responsible for handling the WM order management/execution, risk and regulatory management, distribution and sales support WM/WMA 27

We deliver differentiated solutions to our clients
Average industry standard
Discretionary mandates
Investment process driven by individuals
Limited customization potential
Retrocessions in mandates
Fully-institutionalized process
Optimal instrument selection within defined portfolio construction1
Individual client instructions
Investment performance
Advisory assets
Advice driven by individual CAs
Single-product brokerage focus without portfolio context
Limited product shelf
Advice in line with portfolio construction, reflecting client profile
Daily portfolio health checks2
Daily opportunity offering2
Access to specialists
Traditional Advisory
Advice reflecting UBS House View across all asset classes
Access to extensive product shelf
Access to institutional execution capabilities
Discretionary mandates
Advisory mandates
Comprehensive wealth planning approach
Focus on customization at the client level
1 Portfolio construction = Strategic Asset Allocation; 2 UBS Advice only, relating to the identification of new health check issues that have arisen in the last 24 hours. UBS Advice is our flagship advisory mandate product which we started to roll out in 2013 – it is tailored to clients who do not require regular access to an investment specialist
WM/WMA 28

Revenue sensitivity to management actions and market factors1
Positive external factors
Execution of management priorities
10% of clients shift from conservative to a more balanced portfolio based on current book concentration: ~CHF 140 million per year (~1.6 bps RoA)
Less conservative investment behavior
2 additional mandate sales (CHF 1 million each) for every client advisor per quarter: ~CHF 100 million per year (~1.1 bps RoA)
Book transformation
50% of client advisors increase their current book size by 5% NNM growth: ~CHF 100-150 million per year
Net new money
50% of client advisors remove discounts on invested assets by 10%: ~CHF 90 million per year (~1 bp RoA)
Pricing
10% depreciation in the CHF vs. USD: ~CHF 250 million 10% depreciation in the CHF vs. EUR: ~CHF 190 million 10% depreciation in the CHF vs. GBP: ~CHF 40 million
Foreign exchange2
100 bps parallel shift in the yield curves of all currencies: ~CHF 700 million per year, based on constant deposit and loan volumes (~8 bps RoA)
Interest yield
10% rise in global securities prices (equities and fixed income): ~CHF 200-350 million per year (incremental recurring income)
Securities markets
10% increase in traded securities and FX market volumes (equities, fixed income and FX): of ~CHF 90 million per year (~1 bp RoA)
Securities market volumes & FX volatility
1 Estimated based on FY13 revenues and 31.12.13 invested assets, deposits, and loan volumes; 2 10% depreciation in the CHF would also result in incremental costs not reflected on this slide
WMA WMWM
WM/WMA 29

Strong financial performance
Net new money growth (%, annualized)
Pre-tax profit growth (1H12=100)
Indexed RoA (1H12=100)
Cost/income ratio (%)
UBS WM WM peers1
(2) ppt
(1) ppt
(2%)
(3%)
YoY 2H12/13
90
92
94
96
98
100
2H13 1H13 2H12 1H12
60
65
70
75
80
2H13 1H13 2H12 1H12
+0.8%
+4.4%
FY13
(2)
0
2
4
6
8
2H13 1H13 2H12 1H12
Europe Best private banking services overall Best relationship management Best range of investment products Best range of advisory services Best HNW services
APAC Best private banking services overall Best range of investment products Best range of advisory services Best UHNW services
Switzerland Best Private Banking Services overall Best range of investment products Best range of advisory services Best UHNW services
Emerging markets Best relationship management (CEE) #1 Inheritance & succession planning (ME)
YoY 2H12/13
UBS WM WM peers1 UBS WM WM peers2
UBS WM WM peers1
+14%
+7%
YoY 2H12/13
90
100
110
120
130
2H13 1H13 2H12 1H12
WMA WMWM
1 Peer group: Credit Suisse, Julius Baer, HSBC PB, Société Générale PB, Crédit Agricole PB, ABN AMRO PB, Nordea PB, JP Morgan (only for RoA); WM peer averages are weighted based on 4Q13 invested assets (figures only adjusted for official one-offs); 2 Peer group: Credit Suisse, Julius Baer, HSBC PB, BNP Paribas WM, Société Générale PB, Crédit Agricole PB, ABN AMRO PB (FY11 taken as proxy for 2H11), Nordea PB; WM peer averages are weighted based on 4Q13 invested assets
WM/WMA 30

Important information related to numbers shown in this presentation Use of adjusted numbers Adjusted results are non-GAAP financial measures as defined by SEC regulations. Refer to page 12 of the first quarter 2014 report and pages 76-77 of our 2013 annual report for an overview of adjusted numbers.
Basel III RWA, Basel III capital and Basel III liquidity ratios Basel III numbers are based on the BIS Basel III framework, as applicable for Swiss Systemically relevant banks (SRB). In the presentation are SRB Basel III numbers unless otherwise stated. Our fully applied and phase-in Swiss SRB Basel III and BIS Basel III capital components have the same basis of calculation, except for differences disclosed on page 80 of the 1Q14 financial report.
Basel III risk-weighted assets in the presentation are calculated on the basis of Basel III fully applied unless otherwise stated. Our RWA under BIS Basel III are the same as under Swiss SRB Basel III.
Leverage ratio and leverage ratio denominator in this presentation are calculated on the basis of fully applied Swiss SRB Basel III, unless otherwise stated.
From 1Q13 Basel III requirements apply. All Basel III numbers prior to 1Q13 are on a pro-forma basis. Some of the models applied when calculating pro-forma information required regulatory approval and included estimates (discussed with our primary regulator) of the effect of these new capital charges.
Refer to the “Capital Management” section in the 1Q14 financial report for more information.
Currency translation Monthly income statement items of foreign operations with a functional currency other than Swiss francs are translated with month-end rates into Swiss francs. Refer to “Note 36 Currency translation rates” in the 2013 Annual Report for more information.
Performance targets Unless otherwise stated, performance targets exclude, where applicable, items considered non-recurring and certain other items that management believes are not representative of the underlying performance of our businesses, such as own credit gains and losses, restructuring-related charges and gain and losses on sales of businesses and real estate. Additionally, where applicable, performance targets assume constant foreign currency translation rates.
Rounding Numbers presented throughout this presentation may not add up precisely to the totals provided in the tables and text. Percentages, percent changes and absolute variances are calculated based on rounded figures displayed in the tables and text and may not precisely reflect the percentages, percent changes and absolute variances that would be derived based on figures that are not rounded.
WM/WMA 31