2014 job vacancy survey 45.6% local area ii 46.1% … local...jvs home . 2014 job vacancy survey -...
TRANSCRIPT
2014 Job Vacancy Survey – Local Area II JVS Home
KLIC Home
Education &
Recruitment Industries Occupations Summary Local Area
Comparison Wages & Benefits
Vacancies by Length of Vacancy Vacancies by Benefits Offered Vacancies by Type of Position
Vacancies by Education Requirement Vacancies by Employment Size Vacancies by Lowest Hourly Wage Offer
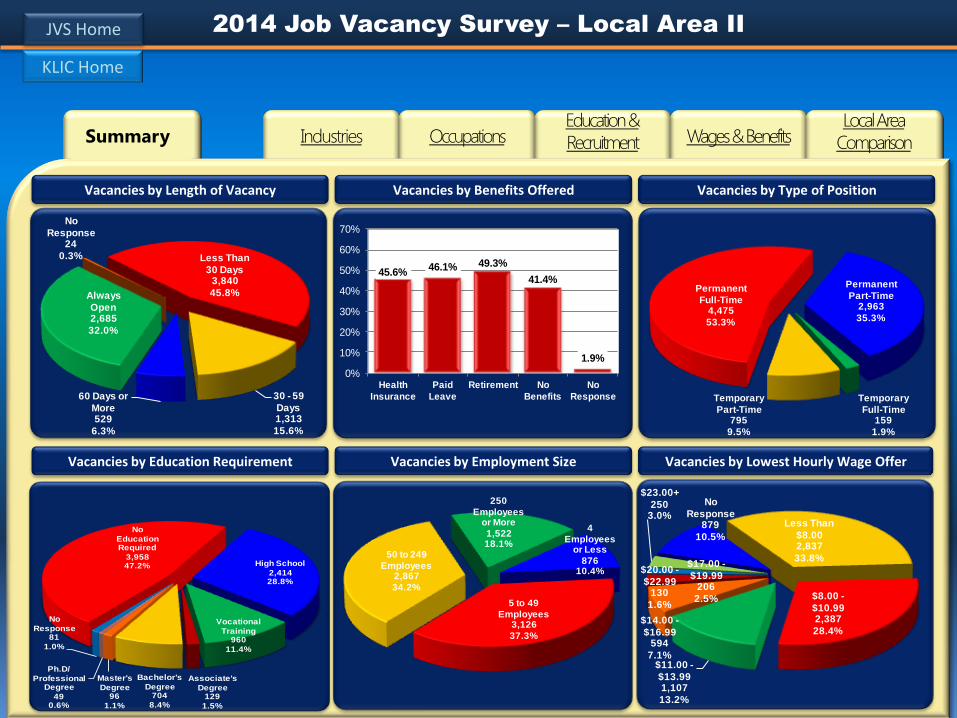
45.6%46.1% 49.3%
41.4%
1.9%
0%
10%
20%
30%
40%
50%
60%
70%
Health
Insurance
Paid
Leave
Retirement No
Benefits
No
Response
Less Than
$8.002,837
33.8%
$8.00 -
$10.992,387
28.4%
$11.00 -
$13.991,107
13.2%
$14.00 -
$16.99594
7.1%
$17.00 -
$19.99206
2.5%
$20.00 -
$22.99130
1.6%
$23.00+
2503.0%
No
Response879
10.5%
Less Than
30 Days3,840
45.8%
30 - 59
Days1,313
15.6%
60 Days or
More529
6.3%
Always
Open2,685
32.0%
No
Response24
0.3%
Permanent
Full-Time4,475
53.3%
Permanent
Part-Time2,963
35.3%
Temporary
Full-Time159
1.9%
Temporary
Part-Time795
9.5%
No
Response81
1.0%
No
Education Required
3,95847.2% High School
2,41428.8%
Vocational
Training960
11.4%
Associate's
Degree129
1.5%
Bachelor's
Degree704
8.4%
Master's
Degree96
1.1%
Ph.D/
Professional Degree
490.6%
4
Employees or Less
87610.4%
5 to 49
Employees3,126
37.3%
50 to 249
Employees2,867
34.2%
250
Employees or More
1,52218.1%

2014 Job Vacancy Survey - Local Area II JVS Home
KLIC Home
Education &
Recruitment Industries Occupations Summary Local Area
Comparison Wages & Benefits
Less Than 30 Days 3,840 45.8%
30 - 59 Days 1,313 15.6%
60 Days or More 529
6.3%
Always Open 2,685 32.0%
No Response 24
0.3%
Vacancies by Length of Vacancy Second Quarter, 2014
Source: Kansas Department of Labor, Labor Market Information Services, Second Quarter 2014 Job Vacancy Survey Back

2014 Job Vacancy Survey - Local Area II JVS Home
KLIC Home
Education &
Recruitment Industries Occupations Summary Local Area
Comparison Wages & Benefits
45.6% 46.1% 49.3%
41.4%
1.9%
0%
10%
20%
30%
40%
50%
60%
70%
Health Insurance
Paid Leave
Retirement No Benefits
No Response
Pe
rce
nt
of
Jo
b V
ac
an
cie
s
Benefits
Vacancies by Benefits Offered Second Quarter, 2014
Source: Kansas Department of Labor, Labor Market Information Services, Second Quarter 2014 Job Vacancy Survey Back

2014 Job Vacancy Survey - Local Area II JVS Home
KLIC Home
Education &
Recruitment Industries Occupations Summary Local Area
Comparison Wages & Benefits
Permanent Full-Time 4,475 53.3%
Permanent Part-Time 2,963 35.3%
Temporary Full-Time 159
1.9%
Temporary Part-Time 795
9.5%
Vacancies by Type of Position Second Quarter, 2014
Source: Kansas Department of Labor, Labor Market Information Services, Second Quarter 2014 Job Vacancy Survey Back

2014 Job Vacancy Survey - Local Area II JVS Home
KLIC Home
Education &
Recruitment Industries Occupations Summary Local Area
Comparison Wages & Benefits
No Response 81
1.0%
No Education Required
3,958 47.2% High School
2,414 28.8%
Vocational Training 960
11.4% Associate's Degree
129 1.5%
Bachelor's Degree 704
8.4%
Master's Degree 96
1.1%
Ph.D/ Professional Degree
49 0.6%
Vacancies by Education Requirement Second Quarter, 2014
Source: Kansas Department of Labor, Labor Market Information Services, Second Quarter 2014 Job Vacancy Survey Back

2014 Job Vacancy Survey - Local Area II JVS Home
KLIC Home
Education &
Recruitment Industries Occupations Summary Local Area
Comparison Wages & Benefits
4 employees or less 876
10.4%
5 to 49 employees 3,126 37.3%
50 to 249 employees 2,867 34.2%
250 employees or more 1,522 18.1%
Vacancies by Employment Size Second Quarter, 2014
Source: Kansas Department of Labor, Labor Market Information Services, Second Quarter 2014 Job Vacancy Survey Back

2014 Job Vacancy Survey - Local Area II JVS Home
KLIC Home
Education &
Recruitment Industries Occupations Summary Local Area
Comparison Wages & Benefits
Less Than $8.00 2,837 33.8%
$8.00 - $10.99 2,387 28.4%
$11.00 - $13.99 1,107 13.2%
$14.00 - $16.99
594 7.1%
$17.00 - $19.99
206 2.5%
$20.00 - $22.99
130 1.6%
$23.00+ 250
3.0% No Response
879 10.5%
Vacancies by Lowest Hourly Wage Offer Second Quarter, 2014
Source: Kansas Department of Labor, Labor Market Information Services, Second Quarter 2014 Job Vacancy Survey Back

2014 Job Vacancy Survey - Local Area II JVS Home
KLIC Home
Local Area
Comparison
Education &
Recruitment Occupations Summary Industries Wages & Benefits
Vacancies by Industry Supersector and Type of Position Vacancy Rate and Employment by Industry Supersector
•There were 8,391 vacancies during the second quarter of 2014 in Local Area II. The job vacancy rate for this same time period was 3.3 percent, meaning that for every 100 positions, 3.3 were vacant and 96.7 were filled. •There were 1.7 unemployed persons per vacancy during this time span. • Leisure and hospitality reported the largest number of job vacancies of any industry supersector with 2,606 vacancies. •At 18.3 percent, the natural resources and mining industry recorded the highest job vacancy rate. This was due to a large number of openings in farmworkers and laborers, crop, nursery and greenhouse along with heavy and tractor-trailer truck drivers.
• Three other industries record a job vacancy rate higher than the local area average. Leisure and hospitality had a rate of 9.9 percent. Approximately 39 percent of the vacancies were in two occupations: combined food preparation and serving workers, including fast food and waiters and waitresses. • Construction and trade, transportation and utilities both recorded a job vacancy rate of 3.6 percent. Construction laborers was the most vacant occupation in construction while retail salespersons accounted for approximately 43 percent of the vacancies in trade, transportation and utilities.
Number
of
Vacancies
Permanent
Full-Time
Permanent
Part-Time
Temporary
Full-Time
Temporary
Part-Time
Total 8,391 53.3% 35.3% 1.9% 9.5%
Leisure and Hospitality 2,606 33.0% 65.4% 0.0% 1.7%
Trade, Transportation and Utilities 1,556 25.3% 48.0% 0.6% 26.1%
Government 1,054 81.7% 6.2% 1.9% 10.2%
Education and Health Services 813 71.0% 26.3% 0.5% 2.1%
Professional and Business Services 617 38.3% 20.3% 8.6% 32.8%
Manufacturing 587 93.4% 0.4% 3.8% 2.4%
Natural Resources and Mining 455 99.3% 0.0% 0.0% 0.7%
Construction 396 62.7% 24.9% 12.4% 0.0%
Financial Activities 138 100.0% 0.0% 0.0% 0.0%
Other Services 129 98.8% 0.0% 1.2% 0.0%
Information 40 86.9% 13.1% 0.0% 0.0%
Supersector
(Ordered by Number of Job
Vacancies)
Percent of Vacancies
18.3%
3.6%2.8%
3.6%
1.1% 1.1%
2.7% 2.3%
9.9%
1.6% 1.6%
0%
5%
10%
15%
20%
25%
0
10
20
30
40
50
60
70
80
90
100
Natu
ral R
eso
urc
es
an
d M
inin
g
Co
nstructio
n
Man
ufa
ctu
ring
Tra
de, T
ran
sportation,
an
d U
tilities
Info
rmatio
n
Fin
an
cial A
ctiv
ities
Pro
fessio
nal a
nd
Busin
ess
Serv
ices
Ed
ucation a
nd
Health
Serv
ices
Leis
ure
an
d H
ospita
lity
Oth
er S
erv
ices
Go
vern
ment
Jo
b V
acan
cy R
ate
Em
plo
ym
en
t (I
n T
ho
usan
ds)
Employment Job Vacancy Rate

2014 Job Vacancy Survey - Local Area II JVS Home
KLIC Home
Local Area
Comparison
Education &
Recruitment Occupations Summary Industries Wages & Benefits
Vacancies by Industry Supersector and Type of Position Second Quarter, 2014
Source: Kansas Department of Labor, Labor Market Information Services, Second Quarter 2014 Job Vacancy Survey * Sum of all permanent and temporary vacancies may not equal 100 percent due to rounding. Back
Supersector
(Ordered by Number of Job Vacancies)
Percent of Vacancies*
Number of
Vacancies
Permanent Full-
Time
Permanent Part-
Time
Temporary Full-
Time
Temporary Part-
Time
Total 8,391 53.3% 35.3% 1.9% 9.5%
Leisure and Hospitality 2,606 33.0% 65.4% 0.0% 1.7%
Trade, Transportation and Utilities 1,556 25.3% 48.0% 0.6% 26.1%
Government 1,054 81.7% 6.2% 1.9% 10.2%
Education and Health Services 813 71.0% 26.3% 0.5% 2.1%
Professional and Business Services 617 38.3% 20.3% 8.6% 32.8%
Manufacturing 587 93.4% 0.4% 3.8% 2.4%
Natural Resources and Mining 455 99.3% 0.0% 0.0% 0.7%
Construction 396 62.7% 24.9% 12.4% 0.0%
Financial Activities 138 100.0% 0.0% 0.0% 0.0%
Other Services 129 98.8% 0.0% 1.2% 0.0%
Information 40 86.9% 13.1% 0.0% 0.0%

2014 Job Vacancy Survey - Local Area II JVS Home
KLIC Home
Local Area
Comparison
Education &
Recruitment Occupations Summary Industries Wages & Benefits
18.3%
3.6% 2.8%
3.6%
1.1% 1.1% 2.7% 2.3%
9.9%
1.6% 1.6%
0%
5%
10%
15%
20%
25%
0
10
20
30
40
50
60
70
80
90
100
Na
tura
l R
eso
urc
es
an
d M
inin
g
Con
str
uctio
n
Ma
nu
factu
rin
g
Tra
de
, T
ran
sp
ort
ation
, a
nd
Utilit
ies
Info
rma
tio
n
Fin
an
cia
l Activitie
s
Pro
fessio
na
l an
d
Bu
sin
ess S
erv
ices
Ed
uca
tio
n a
nd
H
ea
lth
Se
rvic
es
Le
isure
an
d H
osp
ita
lity
Oth
er
Se
rvic
es
Go
ve
rnm
en
t
Jo
b V
acan
cy R
ate
Em
plo
ym
en
t (I
n T
ho
usan
ds)
Vacancy Rate and Employment by Industry Supersector Second Quarter, 2014
Employment Job Vacancy Rate
Source: Kansas Department of Labor, Labor Market Information Services, Second Quarter 2014 Job Vacancy Survey Back

Summary
2014 Job Vacancy Survey - Local Area II JVS Home
KLIC Home
Occupations Local Area
Comparison Wages & Benefits Industries Education &
Recruitment
Vacancies by Major Occupational Group Top 25 Occupations With the Most Vacancies
• To view the full list of occupations by number of vacancies click here.
• Food preparation and serving related occupations recorded 1,736 job vacancies in the second quarter of 2014--the highest amount in Local Area II.
• Farming, fishing and forestry occupations had the highest job vacancy rate during the same time period at 31.5 percent.
• There were 666 job vacancies for combined food preparation and serving workers, including fast food, the most of any occupation.
• Heavy and tractor-trailer truck drivers recorded the highest average lowest wage offer of any occupation in the top 25 of job vacancies at $19.91 per hour.
Food Preparation and
Serving Related1,73620.7%
Transportation and Material
Moving1,09013.0%
Sales and Related
93211.1%
Building and Grounds
Cleaning and Maintenance
5897.0%
Education, Training and
Library586
7.0%
Construction and Extraction
4505.4%
Healthcare Support
4004.8%
Production387
4.6%
Farming, Fishing, and
Forestry341
4.1%
Office and Administrative
Support3123.7%
All Other Occupational
Groups Combined
1,56918.7%
Occupational Title
(Ordered by Number of Vacancies)
Number of
Vacancies
Average
Lowest
Wage Offer
Average
Highest
Wage Offer
Combined Food Preparation and Serving
Workers, Including Fast Food666 $7.40 $8.22
Retail Salespersons 665 $8.51 $8.91
Nursing Assistants 381 $10.40 $10.81
Waiters and Waitresses 350 $7.32 $7.33
Heavy and Tractor-Trailer Truck Drivers 282 $19.91 $20.26
Bus Drivers, School or Special Client 277 $12.85 $12.91
Driver/Sales Workers 260 $7.25 $7.25
Farmworkers and Laborers, Crop, Nursery, and
Greenhouse257 NA NA
Cashiers 252 $7.35 $7.56
Landscaping and Groundskeeping Workers 227 $9.50 $10.98
Maids and Housekeeping Cleaners 213 $7.58 $7.77
Construction Laborers 210 $10.00 $12.48
Cooks, Fast Food 162 $7.60 $9.80
Secondary School Teachers, Except Special
and Career/Technical Education162 NA NA
Janitors and Cleaners, Except Maids and
Housekeeping Cleaners147 $8.94 $11.56
Protective Service Workers, All Other 140 $7.88 $7.89
Laborers and Freight, Stock, and Material
Movers, Hand134 $13.55 $16.26
Elementary School Teachers, Except Special
Education134 NA NA
Dining Room and Cafeteria Attendants and
Bartender Helpers126 NA NA
Maintenance and Repair Workers, General 124 $9.43 $11.13
Personal Care Aides 111 $8.30 $8.69
Secretaries and Administrative Assistants,
Except Legal, Medical, and Executive106 $11.09 $11.45
Helpers--Carpenters 96 NA NA
Recreation Workers 88 NA NA
Dishwashers 87 NA NA

Summary
2014 Job Vacancy Survey - Local Area II JVS Home
KLIC Home
Occupations Local Area
Comparison Wages & Benefits Industries Education &
Recruitment
Food Preparation and Serving Related
1,736 20.7%
Transportation and Material Moving
1,090 13.0%
Sales and Related 932
11.1%
Building and Grounds Cleaning and Maintenance
589 7.0%
Education, Training and Library
586 7.0%
Construction and Extraction
450 5.4%
Healthcare Support 400
4.8%
Production 387
4.6%
Farming, Fishing, and Forestry
341 4.1%
Office and Administrative
Support 312
3.7%
All Other Occupational Groups
Combined 1,569 18.7%
Vacancies by Major Occupational Group Second Quarter, 2014
Source: Kansas Department of Labor, Labor Market Information Services, Second Quarter 2014 Job Vacancy Survey Back

Summary
2014 Job Vacancy Survey - Local Area II JVS Home
KLIC Home
Occupations Local Area
Comparison Wages & Benefits Industries Education &
Recruitment
Top 25 Occupations With the Most Vacancies Second Quarter, 2014
Source: Kansas Department of Labor, Labor Market Information Services, Second Quarter 2014 Job Vacancy Survey * Sum of all permanent and temporary vacancies may not equal the total number of vacancies due to rounding. Back
Permanent
Full-Time
Permanent
Part-Time
Temporary
Full-Time
Temporary
Part-Time
Combined Food Preparation and Serving Workers, Including Fast Food 666 94 572 0 0 17.5% $7.40 $8.22
Retail Salespersons 665 130 527 0 8 9.0% $8.51 $8.91
Nursing Assistants 381 334 47 0 0 9.0% $10.40 $10.81
Waiters and Waitresses 350 112 238 0 0 6.8% $7.32 $7.33
Heavy and Tractor-Trailer Truck Drivers 282 282 0 0 0 8.4% $19.91 $20.26
Bus Drivers, School or Special Client 277 1 9 0 266 20.1% $12.85 $12.91
Driver/Sales Workers 260 0 260 0 0 21.3% $7.25 $7.25
Farmworkers and Laborers, Crop, Nursery, and Greenhouse 257 217 0 0 40 78.6% NA NA
Cashiers 252 0 249 0 3 3.3% $7.35 $7.56
Landscaping and Groundskeeping Workers 227 48 0 29 150 13.2% $9.50 $10.98
Maids and Housekeeping Cleaners 213 127 43 0 43 11.2% $7.58 $7.77
Construction Laborers 210 48 99 49 14 12.7% $10.00 $12.48
Cooks, Fast Food 162 119 43 0 0 7.8% $7.60 $9.80
Secondary School Teachers, Except Special and Career/Technical
Education162
154 7 1 0 8.7% NA NA
Janitors and Cleaners, Except Maids and Housekeeping Cleaners 147 66 81 0 0 3.1% $8.94 $11.56
Protective Service Workers, All Other 140 0 7 0 133 34.1% $7.88 $7.89
Laborers and Freight, Stock, and Material Movers, Hand 134 112 3 20 0 4.1% $13.55 $16.26
Elementary School Teachers, Except Special Education 134 134 0 0 0 4.8% NA NA
Dining Room and Cafeteria Attendants and Bartender Helpers 126 101 25 0 0 12.5% NA NA
Maintenance and Repair Workers, General 124 55 11 31 27 4.8% $9.43 $11.13
Personal Care Aides 111 29 83 0 0 3.7% $8.30 $8.69
Secretaries and Administrative Assistants, Except Legal, Medical, and
Executive106
68 37 0 0 1.9% $11.09 $11.45
Helpers--Carpenters 96 96 0 0 0 70.5% NA NA
Recreation Workers 88 0 87 1 0 10.6% NA NA
Dishwashers 87 87 0 0 0 8.4% NA NA
Number of Vacancies*Number of
Vacancies
Occupational Title
(Ordered by Number of Vacancies)
Job
Vacancy
Rate
Average
Lowest
Wage Offer
Average
Highest
Wage Offer

2014 Job Vacancy Survey - Local Area II JVS Home
KLIC Home
Occupations Summary Local Area
Comparison Wages & Benefits Industries Education &
Recruitment
Vacancies by Education Requirement Vacancies by Education and Length of Vacancy
• The majority of job vacancies, 76 percent, had no educational requirements or required a high school diploma or GED. This is compared to the 10.1 percent of vacancies that required a bachelor’s degree or higher. • The average lowest hourly wage offer generally increased with the level of education required, ranging from $8.89 for vacancies that required no education to $40.38 for those that required a doctoral or professional degree. The exception is that wages for vacancies requiring a master’s degree were less on average than those requiring a bachelor’s degree.
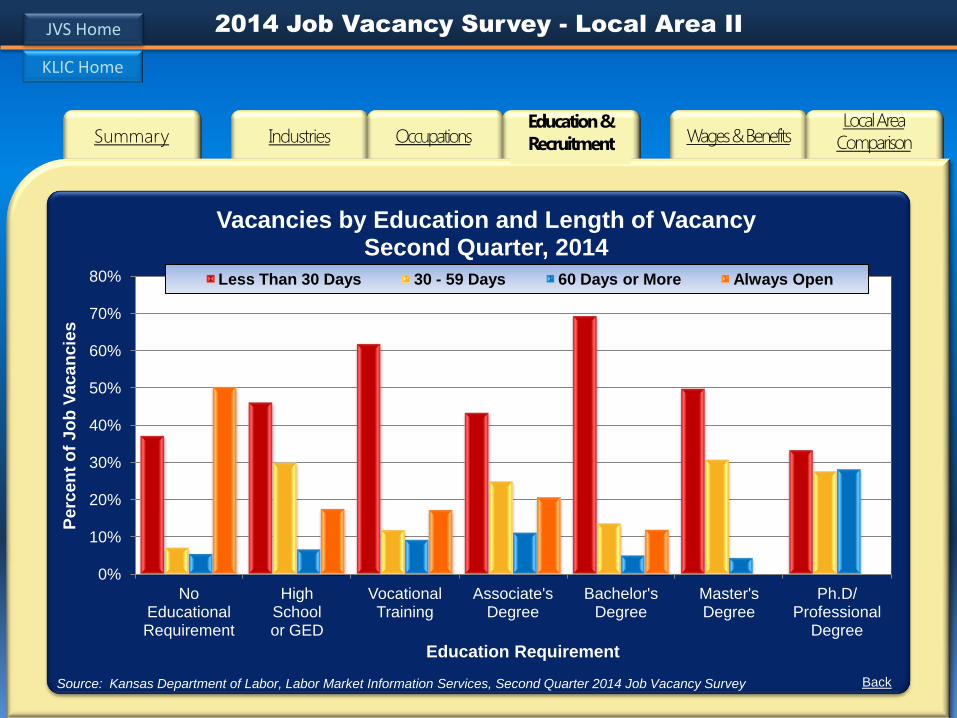
• In six out of the seven educational groups, the plurality of job vacancies had been open for less than 30 days, indicating that jobs are being filled quickly. • A majority of job vacancies, 50.2 percent, with no educational requirements were always open. • For vacancies requiring a doctoral or professional degree, 55.7 percent were open for 30 days or longer. This was the only education level where the majority of jobs were open for this long of a period indicating a possible shortage of people with this education level in the area.
0%
10%
20%
30%
40%
50%
60%
70%
80%
NoEducationalRequirement
HighSchoolor GED
VocationalTraining
Associate'sDegree
Bachelor'sDegree
Master'sDegree
Ph.D/Professional
Degree
Perc
en
t o
f Jo
b V
acan
cie
s
Education Requirement
Less Than 30 Days 30 - 59 Days 60 Days or More Always Open
$8.89 $9.55
$14.73
$19.60 $21.63
$21.04
$40.38
$0
$10
$20
$30
$40
$50
$60
0%
10%
20%
30%
40%
50%
60%
NoEducation
Required
HighSchool/
GED
VocationalTraining
Associate'sDegree
Bachelor'sDegree
Master'sDegree
Ph.D/Professional
Degree
Lo
west H
ou
rly W
ag
e O
ffer
Perc
en
t o
f Jo
b V
acan
cie
s
Education Requirement
% of Job Vacancies Lowest Hourly Wage Offer

2014 Job Vacancy Survey - Local Area II JVS Home
KLIC Home
Occupations Summary Local Area
Comparison Wages & Benefits Industries Education &
Recruitment
$8.89 $9.55
$14.73
$19.60 $21.63
$21.04
$40.38
$0
$10
$20
$30
$40
$50
$60
0%
10%
20%
30%
40%
50%
60%
No Education Required
High School/
GED
Vocational Training
Associate's Degree
Bachelor's Degree
Master's Degree
Ph.D/ Professional
Degree
Lo
we
st
Ho
ulr
y W
ag
e O
ffe
r
Perc
en
t o
f Jo
b V
acan
cie
s
Education Requirement
Vacancies by Education Requirement Second Quarter, 2014
% of Job Vacancies Lowest Hourly Wage Offer*
Source: Kansas Department of Labor, Labor Market Information Services, Second Quarter 2014 Job Vacancy Survey
*Only jobs that reported hourly wages are used in the analysis. Back
2014 Job Vacancy Survey - Local Area II JVS Home
KLIC Home
Occupations Summary Local Area
Comparison Wages & Benefits Industries Education &
Recruitment
0%
10%
20%
30%
40%
50%
60%
70%
80%
No Educational Requirement
High School or GED
Vocational Training
Associate's Degree
Bachelor's Degree
Master's Degree
Ph.D/ Professional
Degree
Perc
en
t o
f Jo
b V
acan
cie
s
Education Requirement
Vacancies by Education and Length of Vacancy Second Quarter, 2014
Less Than 30 Days 30 - 59 Days 60 Days or More Always Open
Source: Kansas Department of Labor, Labor Market Information Services, Second Quarter 2014 Job Vacancy Survey Back
2014 Job Vacancy Survey - Local Area II JVS Home
KLIC Home
Education &
Recruitment Summary Occupations Wages &
Benefits
Local Area
Comparison Industries
Vacancies by Lowest Hourly Wage Offer Vacancies by Benefits Offered and Employment Size
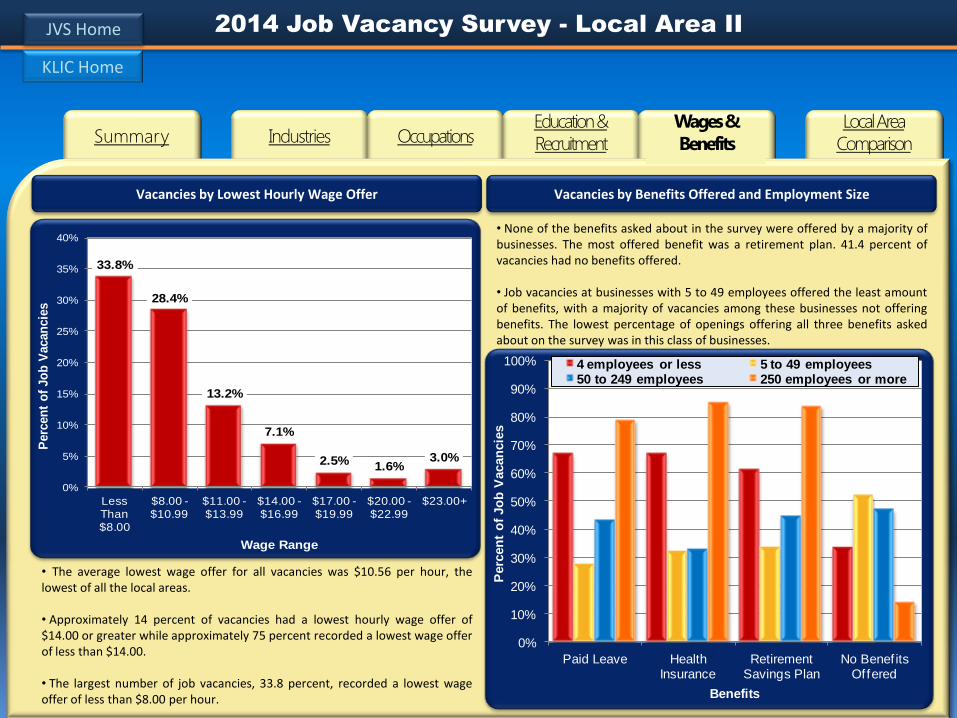
• The average lowest wage offer for all vacancies was $10.56 per hour, the lowest of all the local areas. • Approximately 14 percent of vacancies had a lowest hourly wage offer of $14.00 or greater while approximately 75 percent recorded a lowest wage offer of less than $14.00. • The largest number of job vacancies, 33.8 percent, recorded a lowest wage offer of less than $8.00 per hour.
• None of the benefits asked about in the survey were offered by a majority of businesses. The most offered benefit was a retirement plan. 41.4 percent of vacancies had no benefits offered. • Job vacancies at businesses with 5 to 49 employees offered the least amount of benefits, with a majority of vacancies among these businesses not offering benefits. The lowest percentage of openings offering all three benefits asked about on the survey was in this class of businesses.
33.8%
28.4%
13.2%
7.1%
2.5% 1.6%3.0%
0%
5%
10%
15%
20%
25%
30%
35%
40%
LessThan$8.00
$8.00 -$10.99
$11.00 -$13.99
$14.00 -$16.99
$17.00 -$19.99
$20.00 -$22.99
$23.00+
Perc
en
t o
f Jo
b V
acan
cie
s
Wage Range
0%
10%
20%
30%
40%
50%
60%
70%
80%
90%
100%
Paid Leave Health Insurance
Retirement Savings Plan
No Benef its Of fered
Perc
en
t o
f Jo
b V
acan
cie
s
Benefits
4 employees or less 5 to 49 employees50 to 249 employees 250 employees or more

2014 Job Vacancy Survey - Local Area II JVS Home
KLIC Home
Education &
Recruitment Summary Occupations Wages &
Benefits
Local Area
Comparison Industries
33.8%
28.4%
13.2%
7.1%
2.5% 1.6% 3.0%
0%
5%
10%
15%
20%
25%
30%
35%
40%
Less Than $8.00
$8.00 - $10.99
$11.00 - $13.99
$14.00 - $16.99
$17.00 - $19.99
$20.00 - $22.99
$23.00+
Perc
en
t o
f Jo
b V
acan
cie
s
Wage Range
Vacancies by Lowest Hourly Wage Offer* Second Quarter, 2014
Source: Kansas Department of Labor, Labor Market Information Services, Second Quarter 2014 Job Vacancy Survey
*Only jobs that are reported in hourly wages are used in the analysis. Back

2014 Job Vacancy Survey - Local Area II JVS Home
KLIC Home
Education &
Recruitment Summary Occupations Wages &
Benefits
Local Area
Comparison Industries
0%
10%
20%
30%
40%
50%
60%
70%
80%
90%
100%
Paid Leave Health Insurance Retirement Savings Plan No Benefits Offered
Perc
en
t o
f Jo
b V
acan
cie
s
Benefits
Vacancies by Benefits Offered and Employment Size Second Quarter, 2014
4 employees or less 5 to 49 employees 50 to 249 employees 250 employees or more
Source: Kansas Department of Labor, Labor Market Information Services, Second Quarter 2014 Job Vacancy Survey Back

2014 Job Vacancy Survey – Local Area II JVS Home
KLIC Home
Education &
Recruitment Summary Occupations Wages & Benefits Local Area
Comparison Industries
Vacancies by Local Area 5-Year Trend
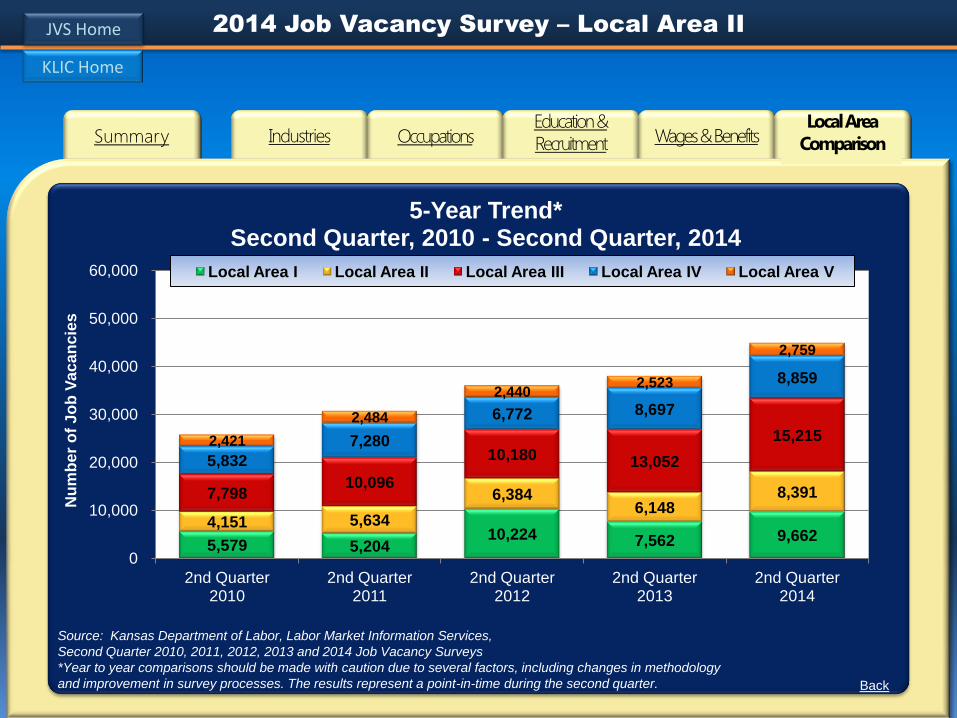
• Local Area III had the most job vacancies in the second quarter of 2014 with 15,215 vacancies. This accounted for 33.9 percent of all vacancies in the state of Kansas. • Local Area V recorded 2.8 unemployed persons per job vacancy in the second quarter of 2014, the most of any local area, while Local Area I was the lowest with 1.2 unemployed persons per job vacancy. • Four of the five local areas recorded an increase in the job vacancy rate during the second quarter of 2014. Local Area I had the highest job vacancy rate at 3.5 percent, a 0.8 percent increase over the year. Local Area II also recorded a gain of 0.8 percent from 2013 to 2014. Local Area IV was the only area not to see a gain in the job vacancy rate, with its rate remaining unchanged at 3 percent.
• The number of job vacancies in Kansas increased from the second quarter of 2013 to the second quarter of 2014 by 18.2 percent and has grown by 74.1 percent since the 2010 survey. • All five local areas recorded an increase in job vacancies from 2010 to 2014, with four of the five local areas experiencing at least 50 percent growth. Vacancies in Local Area II has more than doubled in this time frame, increasing from 4,151 openings in 2010 to 8,391 in 2014, while the number of vacancies in Local Area III has nearly doubled with a 95.1 percent increase.
5,579 5,20410,224
7,562 9,6624,151 5,634
6,3846,148
8,3917,798 10,096
10,18013,052
15,215
5,832
7,280
6,772 8,697
8,859
2,421
2,484
2,4402,523
2,759
0
10,000
20,000
30,000
40,000
50,000
60,000
2nd Quarter2010
2nd Quarter2011
2nd Quarter2012
2nd Quarter2013
2nd Quarter2014
Nu
mb
er o
f Jo
b V
acan
cie
s
Local Area I Local Area II Local Area III
Local Area IV Local Area V

2014 Job Vacancy Survey – Local Area II JVS Home
KLIC Home
Education &
Recruitment Summary Occupations Wages & Benefits Local Area
Comparison Industries
Source: Kansas Department of Labor, Labor Market Information Services, Second Quarter 2014 Job Vacancy Survey
Vacancies and Wage Offers by Local Area Second Quarter, 2014
Back
2014 Job Vacancy Survey – Local Area II JVS Home
KLIC Home
Education &
Recruitment Summary Occupations Wages & Benefits Local Area
Comparison Industries
5,579 5,204 10,224 7,562 9,662
4,151 5,634
6,384 6,148
8,391 7,798 10,096
10,180 13,052
15,215
5,832
7,280
6,772 8,697
8,859
2,421
2,484
2,440 2,523
2,759
0
10,000
20,000
30,000
40,000
50,000
60,000
2nd Quarter 2010
2nd Quarter 2011
2nd Quarter 2012
2nd Quarter 2013
2nd Quarter 2014
Nu
mb
er
of
Jo
b V
ac
an
cie
s
5-Year Trend* Second Quarter, 2010 - Second Quarter, 2014
Local Area I Local Area II Local Area III Local Area IV Local Area V
Source: Kansas Department of Labor, Labor Market Information Services,
Second Quarter 2010, 2011, 2012, 2013 and 2014 Job Vacancy Surveys
*Year to year comparisons should be made with caution due to several factors, including changes in methodology
and improvement in survey processes. The results represent a point-in-time during the second quarter. Back