2014 jp morgan-taylor fry general insurance barometer · see page 185 for analyst certification and...
TRANSCRIPT

www.morganmarkets.com
Australia Equity Research 13 January 2015
2014 J.P. Morgan Taylor Fry General Insurance Barometer
Direct Underwriters, Reinsurers and Brokers
Insurance
Siddharth Parameswaran AC
(61-2) 9003-8629
Alvin Liu
(61-2) 9003-8622
J.P. Morgan Securities Australia Limited
See page 185 for analyst certification and important disclosures, including non-US analyst disclosures. J.P. Morgan does and seeks to do business with companies covered in its research reports. As a result, investors should be aware that the firm may have a conflict of interest that could affect the objectivity of this report. Investors should consider this report as only a single factor in making their investment decision.
This is the result of a joint research effort between J.P. Morgan and Taylor Fry.
Deloitte
Taylor Fry
Kevin Gomes
(61-2) 9249-2918
Sharanjit Paddam
(61-2) 9249-2914
Joshua Jaroudy
(61-2) 9249-2934
____________________________________

2
Australia Equity Research 13 January 2015
Table of Contents
Survey Description ...................................................................3
Executive Summary .................................................................4
Macro backdrop for Australian insurers ................................6
What history / the survey say about growth ........................ 17
The Impact of Technology on Insurance .............................. 30
The Political Impact of Climate Change on Insurers ........... 36
Alternative Capital .................................................................. 40
Survey Participants ................................................................ 43

3
Australia Equity Research 13 January 2015
Survey Description
This is the third edition of The Barometer, a joint effort between J.P. Morgan and
Taylor Fry. The publication continues from 19 editions of the J.P. Morgan Deloitte
General Insurance Survey, the last of which was published in 2012, for the year to
2011, with the first edition of the Barometer published the following year.
The 2014 J.P. Morgan Taylor Fry General Insurance Barometer provides a detailed
overview of the current state of the Australian general insurance industry and the
industry’s expectations. The report conveys analyses on the key elements of the
industry from the perspective of direct underwriters, reinsurers and brokers,
including:
detailed product information for the current period and industry expectations for
the next two years, covering issues such as premium rate trends, capacity
changes, claims trends, loss and expense ratios
perceptions of product profitability
distribution trends
practitioner views on key issues affecting the industry and particular classes
brokers’ perceptions of underwriters.
As has been our longstanding custom, we have also provided editorial comments
from J.P. Morgan and Taylor Fry on key industry issues which serve as a
commentary on industry developments to complement the survey results and
respondent feedback.
Sources of Information
All information in this report is sourced from a survey of the major underwriters,
reinsurers and brokers in the Australian general insurance industry, along with
certain APRA data. A complete list of participating companies is contained at the end
of this report.
The survey is the 22nd
consecutive data collection and accordingly there is now a
substantial body of trend data available, and many of the comments and observations
in the report have been drawn from this information.
Acknowledgments
This report has been produced with the support of the Australian insurance industry.
The insurance industry’s support has been generous and is greatly appreciated.
The J.P. Morgan and Taylor Fry teams hope you find this a valuable reference.

4
Australia Equity Research 13 January 2015
Executive Summary
The key themes to emerge from the 2014 survey and our analysis are outlined below.
Another great set of combined ratios…but as good as it gets
The 2014 year saw very strong combined ratios for the insurance industry, primarily
due to the impact of previous rate increases, a soft period for natural peril claims and
a continuation of reserve releases, though at reduced levels. Survey respondents
reported overall combined ratios of 87% in 2014 – same as in 2013. This was
matched by a Direct Insurer APRA RoE of 18%, flat on the 2013 level. For the
straight domestic lines that we cover in the survey, the combined ratio improved to
86% from 89% in 2013. This is supported by very strong results in householders,
offset by some deterioration (though still good results) in motor, and tough trends
again in NSW CTP. In the commercial classes, the combined ratio was 91%, a slight
deterioration from 2013 (90%). Reserve release continued in both commercial and
personal lines, although at a reduced rate compared to 2013. The COR trends in 2014
were better than the industry expected in the 2013 survey (92%).
Premium rate pressures are strong, with outlook quite weak
Participants said that domestic class rates slowed to 2% (nominal), below claims
inflation of 3%. Domestic class rates were expected to slow further in 2015.
Householders in particular slowed from 5 years of double digit rises from 2009 to
4% in 2014, with more softness expected going forward. This class had by far been
the biggest driver of growth in premium in the last few years, so its slowdown should
leave a hole in GWP growth. In commercial lines, rate trends were much weaker as
well (-6% reduction overall on weighted average basis, on largely an inflation
adjusted basis) – significantly less than the flat result expected in the 2013 survey.
We note that underwriters recorded better rate results than brokers – which may
reflect brokers focusing on 30 June, top end results. Fire/ISR showed very soft trends
for both underwriters and brokers - averaging -12%. The industry is expecting
negative commercial rate trends for both 2015 and 2016.
Claims trends – claim size inflation continuing at moderate levels, frequency
favourable again
For both domestic lines and commercial lines, inflation in 2014 was at similar levels
overall to 2013 (3% and 4%, respectively). The only class showing some claim size
inflation was workers compensation (both WA and in TAS/ ACT / NT). The outlook
is reasonably similar. Frequency trends in most classes were favourable in 2014 (0%
in domestic lines, -3.2% in commercial lines), although both NSW CTP and D&O
showed some increases. Whilst inflation / frequency trends are subdued, some
insurers expressed concern around the ability to maintain margins in an environment
of premium pressures, and low yields on investment income.
Top concerns for the insurance industry
69% of underwriters in the survey identified competition /rates / capacity as a key
concern (up from 2nd spot last year where it was behind regulation). This was
followed by 50% identifying technology as a key concern (double the figure in
2013). Regulation and staff development tied for 3rd place with 38%.
75% of insurance brokers worried about an excessively competitive rates
environment, up from 43% last year. 63% indicated concerns regarding staff
retention, also up on last year.
Reinsurers flagged regulatory issues as their key concern, followed by excess capital
and competition in the market.

5
Australia Equity Research 13 January 2015
Pa
rt 1
: E
dito
ria
l C
om
me
nts

6
Australia Equity Research 13 January 2015
Australia’s economic
environment had been a relative
‘safe haven’ compared to global
peers – but that may be set to
change
The J.P. Morgan economist’s
base case for Australia is for
below trend growth – but still
positive for the 24th year in a row.
We note history suggests that the
end of mining booms are often
associated with recessions
Macro backdrop for Australian insurers
Siddharth Parameswaran, Alvin Liu, J.P. Morgan
The economic environment since the ‘global financial crisis’ (GFC) of 2008/2009
proved to be one of low global growth prospects, but without the extreme downside
economic outcomes feared. Australia had been a relative outperformer when
compared against other “developed” economies although the prospects going
forward may be different with the US and UK rebounding and Australia facing the
prospects of falling commodity prices, and considerably reduced business
investment.
From a global perspective, 2014 saw modest rates of economic growth in developed
economies such as the US and UK but weak growth in Europe. Europe continues to
show uncertainty with the initial recovery seen from Mar13 to Mar14 appearing to
have plateaued between Mar14 to Sep14. With weak growth in Europe our
J.P.Morgan economists expect the ECB to announce a €500m sovereign QE program
at its next meeting on 22 January 2015, which may be able to stimulate growth going
for CY151. Unemployment rate for Europe remains high at 9.6%, although below its
peak of ~10% for the Jun13 quarter. The U.S. appears to be recovering, showing real
GDP growth of 2.2% for CY14, which is in line with their long term average and
unemployment has improved significantly from ~10% in Dec-09 to ~6% in Jun-14.
Similar positive trends have also been observed for UK. Figure 20 - Figure 21.
Australia arguably faced fewer concerns than some of its developed world peers
during 2014, but arguably it was sub long term trend levels. The J.P. Morgan
Economist and Strategists suggest there may similar pressures for Australia in 2015
being sub-par growth and increasing unemployment2. This may have implications for
the Australian economy, and ultimately for our insurance sector.
We focus in this section of the report on the macro drivers affecting the outlook for
the general insurance industry.
Economic indicators in Australia
The outlook based on recent research by the J.P. Morgan Economist is that
Australia could grow close to trend in 2015 (CY15) at 2.9%, which is above the
2.7% expected for 2014. He does, warn that the composition of the growth will
be driven largely by exports stemming from previous capital expenditure in
mining (as the resources are extracted and sold overseas, thereby boosting net
exports), rather than consumption or investment led growth. As such he suggests
that much of the growth will not be apparent to other parts of the economy.
The unemployment rate in Australia was 6.3% in November 2014 according to
statistics from the ABS and has been rising slowly from 5.8% a year earlier. This
is above the generally accepted target for NAIRU (non-accelerating inflation rate
of unemployment) of 5%; however, we note in recent times the NAIRU may be
considered to have increased slightly above this level3. The J.P. Morgan Australia
1 We reference research by J.P. Morgan Economist on 9 January 2015 “Global Data Watch”.
2 We reference research by J.P. Morgan Economist on 9 January 2015 “Outlook for Australia
in 2015: is there an echo in here?”. 3 We reference research by J.P. Morgan Economist on 19 November 2010 “Australia: lack of
slack to change inflation tack” & on 20 January 2012 “Does the RBA care about the
distribution of growth?” to form our view on the NAIRU.

7
Australia Equity Research 13 January 2015
Economist predicts an increase in the unemployment rate to peak at 6.5% in the
second half of 2015 as a result of continued forecasted sub-trend GDP growth.4
RBA currently has a record low cash rate of 2.5% which gives RBA less room for
further monetary policy expansion should it be needed (having already used this
tool – see Figure 7). According to the J.P. Morgan Australia Economist, RBA
may jettison their "period of stability" comment the RBA made last February and
our economist forecasts that there will be a rate hike in late 2015.
Housing sales volumes and prices were strong in 2014 and the J.P. Morgan
Australian economist expects this to continue to be the case in 2015 although at a
slower pace than in 2014. Our economist expects an increase in home
construction will follow solid house price growth (forecasted at a single digit
pace) for 2015.5
The Australian dollar touched a five year low of US$0.81 this month following
comments by RBA that they preferred a lower AUD as the method to deliver
easier monetary conditions. A depreciating Australian dollar can pose some cost
push inflation risk for insurers.
4 We reference research by J.P. Morgan Economist on 9 January 2015 “Outlook for Australia
in 2015: is there an echo in here?” 5 We reference research by J.P. Morgan Economist on 9 January 2015 “Outlook for Australia
in 2015: is there an echo in here?”

8
Australia Equity Research 13 January 2015
Figure 1: Unemployment rate Australia
Source: Bloomberg (12/1/20115)
Figure 2: Real GDP growth in Australia
Figure 3: Government fiscal rectification a drag to GDP growth
Source: JPM
Figure 4: Investments as % of GDP – mining /non-mining
Source: JPM
Figure 5: Price in US$ of commodities falling (Iron ore, Oil)
Source: Bloomberg
Figure 6: A big risk is a highly leveraged consumer
Source: JPM

9
Australia Equity Research 13 January 2015
Figure 7: Inflation rate indices vs. bond yields – Australia
Source: Bloomberg
Figure 8: A$ weakened but arguably still too strong for RBA’s liking
Source: Bloomberg
Claims: some inflation risks worsened by any economic deterioration
Consumer price inflation metrics are within the RBA’s long-term target range of
2-3%, with the inflation rate for the year to September 2014 being 2.4%. The
generally soft economic environment, and falls in petrol prices may offset some
of the cost-push inflation that may be expected from a depreciating exchange
rate. If CPI remains at reasonable levels, this is positive for the insurance industry
– particularly short tail insurers (to the extent that CPI can be used as a proxy
indicator of claims inflation).
Average Weekly Earnings rose 2.4% in the year to May 2014 (ABS), which is at
the lower end of recent historical levels. This is unsurprising given the softening
economic climate. This may be a slight negative for some classes such as
workers’ compensation whose premiums are levied as a % of wage roll (whereas
certain claim costs such as medical and legal may move independently of wage
inflation). However, for other classes, there are likely to have a positive effect to
the extent that the wage components of repair costs could increase at a slower rate
in short tail lines, and costs of compensation in court awards (where the award
takes into account salary levels) could be subdued in long tail lines.
Another key area highlighted in terms of claims inflation is the legal
environment, with respondents referring to a slow and effective erosion of tort
reforms over time. This particularly affects the liability and CTP classes,
however, we believe the impact is still quite limited, and the reforms have by and
large held up quite favourably.

10
Australia Equity Research 13 January 2015
Catastrophe experience
2014 catastrophe losses were below-trend for the global insurance industry,
according to our estimates. A similar benign CAT environment was observed in
Australia, where catastrophe claims were significantly below the 10 year trailing
average.
Figure 9: Australian catastrophe loss experience favourable in 2014, but has had increasing trends over the past 5 years
Source: J.P. Morgan estimates, ICA. Note: the 2014 figure includes the latest ICA estimate
(11/12/2014) of the Queensland hailstorm of ~$804m. The figures are inflation and exposure
adjusted
Figure 10: US industry catastrophe trends ($bn)– inflation adjusted, but not exposure adjusted
Source: J.P. Morgan estimates, Insurance Institute Information
Figure 11: Lloyds CAT claims (£m) in 1H14 was extremely benign
Source: J.P. Morgan estimates, Lloyds. Note: All figures are indexed to 2013, except 1H2014,
which is indexed to 1H14. These trends are inflation but not exposure adjusted.
Figure 12: 1H14 a relatively light period for catastrophe losses worldwide
Source: Swiss Re, Munich Re.. Inflation but not exposure adjusted.
Catastrophe costs globally have
been benign in 2014.

11
Australia Equity Research 13 January 2015
In Australia, weather changes can be a significant driver of catastrophe costs.
Adverse trends can impact loss ratios in short tail classes (fire/ISR &
householders in particular). The current 2014/15 summer has neutral conditions
forecast for the Southern Oscillation Index (which seems to be a major driver of
catastrophe costs) according to the Bureau of Meteorology. This continues a shift
away from the La Nina episode of 2011 and prior, which saw higher rainfall and
cyclone activity particularly on the east coast of Australia.
The charts below show a forecast for a below average cyclone season in 2014/15
and a relatively dry period for the 3 months to February 2015.
Figure 13: Normal season for parts of eastern Australia - Forecast for 3 months to February 2015
Source: Bureau of Meteorology
Figure 14: Average to below-average cyclone season most likely for Australia
Source: Bureau of Meteorology
The shift from La Nina to more neutral conditions, according to the Bureau of
Meteorology, could benefit insurers in terms of catastrophe costs. On average
since 1967, neutral years have had an average catastrophe cost (excluding
earthquakes) of $902m, which is significantly below the $3,043m during La Nina
years. Compared to the overall average annual catastrophe cost of $1,098m since
1967, a neutral year would represent on average a ~$200m benefit to the general
insurance industry.

12
Australia Equity Research 13 January 2015
Figure 15: Catastrophe losses, excluding earthquake (A$m in 2011 normalised costs) – against the Southern Oscillation Index (indicator of El Nino, Neutral and La Nina Years )
Source: BOM, ICA, J.P. Morgan estimates. Note: the latest ICA estimate (11/12/2014) of the
Queensland hailstorm of ~$804m is included for 2014.
Figure 16: Average catastrophe losses (excl. earthquake) for El Nino, Neutral and La Nina years using ICA data for catastrophes (excluding earthquake losses).
Source: ICA, BOM, J.P. Morgan estimates. Note: the latest ICA estimate (11/12/2014) of the
Queensland hailstorm of ~$804m is included for 2014.
Investment markets – falling investment yields hurting outlook for all classes.
Yields on fixed interest investments (typically held by insurance companies in
Australia to back their liabilities), have been falling as the RBA continues to work to
boost the economy through monetary stimulus in light of global and domestic
weakness. Falling yields have been further exacerbated by credit spreads contracting
in line with a hunt for yield by investors. As seen below, current yields on fixed
income assets of 3-year duration in Australia (of all credit grades) are even lower
than the levels seen during the GFC. We note that yields post the ‘as at date’ for the
survey had not moved substantially.
Figure 17: Yields on fixed income assets of 3 year duration in Australia
Source: Bloomberg
Equity markets were volatile in 2014, but the ASX200 Accumulation index
ultimately finished up 6% including dividends.
Yields on fixed income assets
appear to continue to fall, albeit
at a slower rate than previously
observed between 2010- 2012.
This is a concern for long tail
lines in particular.
The extent of reductions is large
enough to even affect short tail
RoEs.

13
Australia Equity Research 13 January 2015
Figure 18: ASX 200 Accumulation Index
Source: Bloomberg
Figure 19: ZCB bonds rates has flattened considerably – signaling uncertainty and weak outlook for the economy
Source: Bloomberg

14
Australia Equity Research 13 January 2015
Macro factors overseas impacting global insurance markets
Macro trends in the U.S. and U.K. improving but still uncertain for Europe
The charts below show that in the US and UK, economic growth data is now at
levels matching Australia. In Europe also, growth has recovered (still below other
markets). Unemployment levels there still remain challenging. Our global
economics team6 is forecasting an improvement in developed market growth
driven in part by lower oil prices and continued central bank stimulus in Europe
and Japan. Top-line (i.e. premium) growth may return in such an environment.
Historically there has often been a correlation between weak economic activity
and a rise in claims. Given that we didn’t see that pressure in any region when
economic growth was weak this cycle, we think that it is unlikely we will see an
improvement in claims trends in line with expected economic growth trends.
Figure 20: Real GDP Growth – Selected Developed Markets
Source: Bloomberg (15/12/2014)
Figure 21: Unemployment Levels – U.S. and U.K.
Source: Bloomberg (15/12/2014)
Inflation continues to remain while real yields remain weak
The threat of high inflation in conjunction with negative real yields is a very
detrimental combination for insurers. Yields in the US fixed income markets have
been improving although are still at historically low levels. As a result the
continuing low yielding environment continues to be a threat to the insurance
industry as the inflation drivers of claims (now and in the future) were arguably
remaining constant, while the expected investment earnings on the assets backing
claims liabilities remain poor.
Figure 22: Implied inflation and real yields in U.S. bond market
Source: Bloomberg (15/12/2014)
6 “Deus ex Machina: 2015 Global Outlook”, Bruce Kasman
Growth in UK in particular has
improved over the past 2 years
but latest trends for Europe
continue weak, having initially
shown positive trends in FY14.
Claims trends are potentially a
concern with inflation remaining
and low yields as seen in
previous years

15
Australia Equity Research 13 January 2015
With the view in the market that tapering of the U.S. Federal Reserves’ asset
purchase programme is likely, long-term interest rates have been starting to rise,
which is a boost for investment income available for insurers on government
bonds. Upward pressure on interest rates, which should be a benefit for the
insurance industry, although we note that in the US due to accounting standards
that do not require insurers to mark assets to market, disclosed running yields we
think are still likely to increase.
Premium rates increases tending to zero but capital levels are strengthening
The outlook on global premium rates has weakened since the peak in 1Q13 and
there has been negative to minimal premium rate growth observed in 2Q14 and
3Q14 across the small, middle and large corporate market. Capital levels however
are still quite strong in the U.S. and appear to be trending positively (see Figure
24).
Figure 23: Premium rate movements in U.S. commercial markets
Source: CIAB
Figure 24: U.S. surplus capital - from amalgamated accounts
Source: Insurance Information Institute
Reserve releases are expected to decline going forward in the U.S. (see Figure 25,
based on information from the Insurance Information Institute) although there
still appears to be the ability to support reported profits to some extent through
reserve releases. Inflation data overall remains relatively subdued.
Figure 25: U.S. P/C surpluses – JPM estimate of surpluses in the market reducing (JPM Australia estimate of the US market).
Source: JPM analysis on reserve surplus position of the US market at Dec 2013
0%
2%
4%
6%
8%
10%
12%
14%
0
10,000,000
20,000,000
30,000,000
40,000,000
50,000,000
2007 2008 2009 2010 2011 2012 2013
US$000s
US Industry Reserve Surplus / (Deficiency) - Direct business excluding latest accy (LHS)
Current Surplus for all accident years / Latest Annual NEP (RHS)
Commercial rates trends have
continued to slow - trending to
zero.

16
Australia Equity Research 13 January 2015
Figure 26: U.S. Towers Watson – inflation indices
Source: CIAB
Figure 27: U.S. Towers Watson – inflation indices (superimposed)
Source: Insurance Information Institute
Global reinsurance rates have been trending downwards as expected, as a result
of a benign CAT environment as well as the excess capital in the market. In the
US, there has also been a significant growth in collateralised reinsurance over the
past 4 years.
Figure 28: Global rate-on-line index by region, 1990 - 2014
Source: As of Jan 1 2014. Guy Carpenter
Figure 29: US Reinsurance Trends – sharp rise in collateralised reinsurance over the past 4 year
Source: Insurance Information Institute
Implications for the outlook for Australian Insurers
The 2015 outlook for the Australian economy appears relatively weak with similar
sub-par growth trends observed in 2014, likely to be seen in 2015. For Australian
insurers this should mean weaker growth prospects and increasing competitive and
claims pressures.
Low investment yields continue to be a concern. For long tail lines in particular, this
can make a substantial difference to returns in the absence of adequate premium rate
increases.
Globally, economic trends are strengthening in the US and UK, which should boost
premium volumes in those markets. Growth remains challenging in Europe, with
some reinsurers entering into deals with brokers to increase capacity in the market, in
what is a low growth environment. In the U.S. rate increases are trending towards
zero. Australian insurance companies in this environment are likely to receive no
favours from the economic cycle for the growth or profit prospects.
-6.00%
-4.00%
-2.00%
0.00%
2.00%
4.00%
6.00%
8.00%
10.00%
12.00%
2000 2001 2002 2003 2004 2005 2006 2007 2008 2009 2010 2011 2012 2013*
Auto, subtotal Workers compensation Other, bodily injuryOther, property damage Fire Commercial multiple perilCPI, all items
-8.00%
-6.00%
-4.00%
-2.00%
0.00%
2.00%
4.00%
6.00%
8.00%
2000 2001 2002 2003 2004 2005 2006 2007 2008 2009 2010 2011 2012 2013*
Auto Workers' Other Bodily injuryOther, property damage Fire Commercial multiple peril

17
Australia Equity Research 13 January 2015
What history / the survey say about growth
Siddharth Parameswaran, Alvin Liu; J.P. Morgan
Sharanjit Paddam, Kevin Gomes; Taylor Fry
In this article, we provide thoughts on the outlook for growth in the general
insurance industry in Australia. We examine historical statistics on growth in
premiums around the world, outline views from participants in the survey on growth
prospects and overlay that with our thoughts on forward looking challenges the
industry faces.
Historical GWP Growth statistics
Australian Experience
We have analysed growth and profitability data from the last 20 years of data in the
Australian industry. Whilst that is a very long history, we caution about using this
alone as a guide to future growth prospects due to the following: (1) 20 years of data
is a little limited and can be influenced by the number of phases of different
insurance cycles that are included (if more up-swings in the cycle than down-swings
are included, it can limit the extent to which one can draw meaningful conclusions
(2) the data is impacted by collection problems – as there are significant periods
where APRA / ISC did not collect data, which led to us interpolate some premium
figures; We also note that APRA has not been consistent over time in its definition of
profits and premium - which can distort the trends seen (3) there have been changes
in government involvement in underwriting some workers' compensation schemes
that has influenced growth seen (and this may not continue in the future) (4) history
does not always repeat.
Long Term Average Growth ~ matches GDP: The charts below show that
nominal growth in GWP has matched nominal GDP. The 20 years to 2013
showed average GWP of 6.61% p.a., whilst nominal GDP averaged 6.33% p.a.
We think this trend was artificially boosted in part by the very high initial figure
in 1994, driven by a very sharp hard market (poor profitability) and some
exceptionally strong growth in workers' compensation. Excluding 1994 - GWP
grew about 0.4% p.a. lower than nominal GDP.
Figure 30: Australia GWP growth vs. Nominal GDP growth Time Series – APRA/ ISC statistics
Source: ISC, JPM interpolation, APRA, Bloomberg. APRA has been inconsistent in its definition of premium (it was prospective
contracts at one stage, in between matching the accounting definition of GWP). They also did not collect data between 2002 and 2004
(we have interpolated figures).
In Australia, Premium growth
averaged close to GDP in the
last 20 years- but this may have
been influenced by 3 hard cycles
and only 2 prolonged soft cycles
Home has been the class
showing the strongest growth,
along with professional
indemnity.
Motor and Workers’
Compensation have been the
weakest classes for growth.
Growth is currently slowing in
Australia – as (a) the economy is
slowing (b) there is a soft market
market in commercial lines – and
no signs of superimposed
inflation (c) competition in
personal lines

18
Australia Equity Research 13 January 2015
Figure 31: Australia GWP growth Time Series vs. Normalised RoEs– APRA/ ISC statistics. JPM
Source: ISC, JPM interpolation, APRA, Bloomberg. APRA has been inconsistent in its definition of premium (it was prospective
contracts at one stage, in between matching the accounting definition of GWP). They also did not collect data between 2002 and 2004
(we have interpolated figures). JPM Estimates of RoEs. using consistent calculation of Capital
Home and professional indemnity have shown strongest growth: The
charts below show the growth by class of business. It appears that
professional indemnity and home have been the fastest growing classes.
Workers' compensation and motor appear to be quite weak. Within home –
the last 4 years have boosted that average growth figure by 1.3% p.a.,
reflecting the extent of rates increases we have seen in the class in recent
times. In fact – in the last 4 years it has only been home and Fire/ ISR that
have been driving the growth at an overall level above long run averages
(all other classes have been at or below long run averages). The long tail
classes have been influenced by 3 factors in our view: (1) superimposed
inflation that can take a while for insurers to recognise – but is then
followed by extremely high rate increases (2) tort reforms – that often
follow the rate increases - which then lead to gradual reductions in rates (3)
changing investment yields - which if large can influence the premium rates
environment. In the early and late 1990s we saw elevated levels of inflation
that lead to reforms, and that then resulted in prolonged soft markets.
Figure 32: Australia GWP growth % p.a. Time Series by class of business– APRA/ ISC statistics
Source: ISC, JPM interpolation, APRA, Bloomberg. APRA has been inconsistent in its definition of premium (it was prospective
contracts at one stage, in between matching the accounting definition of GWP). They also did not collect data between 2002 and 2004
(we have interpolated figures).

19
Australia Equity Research 13 January 2015
Figure 33: Australia Average GWP growth by class – 1993 to 2013 Class Average Growth %
Fire and ISR 6.69 Houseowners/householders 8.12 CTP Motor vehicle 7.00 Commercial Motor Vehicle 5.59 Domestic Motor Vehicle 5.91 Professional Indemnity 8.47 Public and Product Liability 6.31 Employers' Liability 5.09 Other 6.14
Commercial Direct 6.00 Personal Direct 7.08
Total ex Re 6.61 Nominal GDP 6.33
Source: ISC, JPM interpolation, APRA, Bloomberg. APRA has been inconsistent in its definition of premium (it was prospective
contracts at one stage, in between matching the accounting definition of GWP). They also did not collect data between 2002 and 2004
(we have interpolated figures).
Figure 34: Growth in GWP in Fire and ISR – Australia 1993 - 2013
Source: APRA, ISC
Figure 35: Growth in GWP in Home – Australia 1993 - 2013
Source: APRA, ISC
Figure 36: Growth in GWP in CTP – Australia 1993 - 2013
Source: APRA, ISC
Figure 37: Growth in GWP in Commercial Motor – Australia 1993 - 2013
Source: APRA, ISC

20
Australia Equity Research 13 January 2015
Figure 38: Growth in GWP in Domestic Motor – Australia 1993 - 2013
Source: APRA, ISC
Figure 39: Growth in GWP in Prof Indemnity – Australia 1993 - 2013
Source: APRA, ISC
Figure 40: Growth in GWP in Public and Product Liab – Australia 1993 - 2013
Source: APRA, ISC
Figure 41: Growth in GWP in Employers' Liability – Australia 1993 - 2013
Source: APRA, ISC
Figure 42: Growth in GWP in Commercial Direct – Australia 1993 - 2013
Source: APRA, ISC
Figure 43: Growth in GWP in Personal Direct – Australia 1993 - 2013
Source: APRA, ISC

21
Australia Equity Research 13 January 2015
US Experience
We have 43 years of data on growth in premium and return statistics from the US.
Given the long time periods included, and the very limited involvement of
government as an underwriter, growth statistics are likely to be less impacted by the
phases of different insurance cycles or significant changes in government
involvement in underwriting.
Long Term Average Growth slightly below GDP: The charts below show that
nominal growth in Net Written Premium in the US P&C industry has averaged
6.21% p.a. since 1971. This is slightly below nominal GDP growth (6.72%p.a.
since 1971). This suggests that historically the growth of the sector has been
averaged 0.51 p.a. slower than GDP. For investors – assuming constant margins,
we think that all else being the same – we think this implies a PE that should have
been ~0.5x lower than the broader market assuming a 15% RoE for both.
Figure 44: US P&C Nominal Net Premium Growth Time Series
Source: III, AM Best
Figure 45: US P&C Nominal Net Premium vs. Nominal GDP growth
Source: III, AM Best,. Bloomberg
Insurance premiums in the US
grew slightly slower than
nominal GDP. Within this, most
years were sub nominal GDP –
whilst there were a few very
large peaks that made up for
this.
If history is a guide - soft cycles
remain soft for quite long
periods of time.

22
Australia Equity Research 13 January 2015
Figure 46: Difference between P&C NWP and GDP growth
Source: III, AM Best
Likelihood that a weak growth period will continue for some time: What is
clear is that most periods show NWP growth being lower than GDP (i.e. the
mode [most commonly occurring outcome] is for NWP growth to be less than
GDP). This is however offset by a few periods (hard cycles) where the growth in
NWP is well above GDP. If history follows that pattern, it suggests that when
growth in premium starts slowing, it will remain weak for some time. The last 2
hard periods (mid 1980s and 2001) were triggered by several preceding years of
falling profitability (see below) in part driven by competition causing premium
growth to be well below inflation, and also the response of insurers to
acknowledging some superimposed inflation.
Figure 47: US P&C Net Premium Growth against US P&C RoEs
Source: III, AM Best
US recently showing some growth: The current environment in the US has
shown a return in the last 3 years to growth in Net Premium in line with GDP
(largely premium rate driven - although this is petering out).
Other experience
We show in the table below inflation adjusted (i.e. “real”) growth in regions
according to Swiss Re.

23
Australia Equity Research 13 January 2015
What it shows is that there has been reasonably strong growth in “South and
East” Asia and to some extent Africa. Growth in most other regions has been
rather weak. It seems that growth in premium is stronger than GDP in countries
where per capita income, and capital stock values are low but where both are
growing quickly.
Figure 48: Growth in “inflation adjusted” P&C Premium by Region
Source: Swiss Re, JPM compilation of figure
Our explanation of drivers of growth
We think the drivers of growth in GWP include the following:
1. Nominal Economic growth (see Figure 30 – which shows a strong link between
the two). As the economy grows, more material goods and potential future
production can be insured.
2. Catastrophe Events: A collection of these (or lack of) can lead to changes in
estimates on long term claims costs / as well as some retrospective pricing. This
usually has a lagged impact on GWP growth (it takes a year or more to feed
changed perceptions on risk into achieved increases in rates). The increases in
Fire / ISR and home post 2009 were arguably driven by such events.
Figure 49: Catastrophe against short tail cat exposed premium growth (LHS = growth; RHS = $m gross catastrophe costs I n 2011 dollars)
Source: JP Morgan, ICA, APRA / ISC
Growth in premium is stronger
than GDP in countries where per
capita income, and capital stock
values are low but where both
are growing quickly.
We think GWP growth rates are
influenced by:
- Nominal economic growth
- Perceptions/ experience
on catastrophe costs
- superimposed inflation /
tort reforms
- yields
- capital / returns
- rate of improvement in risk
management
- extent to which new
products of insurance
arrive

24
Australia Equity Research 13 January 2015
3. Superimposed inflation / tort reforms: As we have explained earlier, in ~1994
and ~2000 we saw some very hard markets in long tail classes stemming in part
from re-estimates of inflation. Post 2002 in particular, there were very significant
tort reforms across Australia that curbed court awards in liability and professional
indemnity and to some extent CTP classes. In 1999 there were reforms affecting
NSW CTP / Workers Compensation. All of these lead to a significant soft period
in long tail lines. See Figure 36, Figure 39, Figure 40, Figure 41. As a general
rule most insurers believe that there is underlying superimposed inflation (in
terms of average claim size) evident in most classes over time – perhaps as
society believes that it can compensate more generously for loss as it gets richer
over time.
4. Changing investment yields: In 2009 in response to large falls in yields, there
were large increases in rates on long tail lines to compensate for reduced
investment income.
5. Capital levels: Increased capital levels usually are caused by the factors
described above (e.g. a lack of catastrophe can boost retained earnings).
Nevertheless – it is often mechanistically quoted as a factor leading to reduced
rates (we think it is at best only part causation, part correlation). We think high
levels of profits attract incremental capital into the market. The chart below
shows that profitability is now very high by historical standards –suggesting that
there could be some incremental.
Figure 50: Historical Notional Industry ROE* (smoothed investment return, hypothetical capital based on current APRA standards - if capital levels were set for a large diversified insurer)
Source: JPM calculations, J.P. Morgan Taylor Fry Barometer
6. Improvements in risk mitigation / management: We think some classes such
as motor and workers compensation have seen ever reducing costs of risks on a
per unit basis, which means that GWP growth has tended through the cycle to be
less than for many other classes. We show this in the charts below. In motor for
example, fatality rates have been falling for a very long time (we estimate that
between 1970 and 2010 the rate of improvement was 3.3% p.a.). We can also see
that whilst vehicles have been growing faster than population (suggesting motor
should be a growth class), the statistics show that GWP growth has been weaker
than nominal GDP (and actually one of the weakest classes) and that despite the
weak GWP trends profitability has not been affected. This all suggests that
underlying frequency of risk must be getting much better (i.e. cars are getting
safer etc). We argue that the only reason that motor insurance has not been a class
that declined quicker is that average claim size has risen as the components in
cars have become more expensive to replace. Similar improving statistics are

25
Australia Equity Research 13 January 2015
evident in workers compensation (see below) where we estimate that between
2001 and 2013 the serious injury frequency rate improved by 3.1% p.a.
Figure 51: Frequency of Road Deaths – Australia. Improved dramatically
Source: ABS, DITRD
Figure 52: Growth in Motor Vehicles vs. Population Growth - Australia
Source: ABS
Figure 53: Growth in GWP in Domestic Motor – Australia 1993 - 2013
Source: APRA, ISC
Figure 54: Combined Ratios and premium rate increases in Australia – Domestic and Commercial Motor Combined
Source: JP Morgan Taylor Fry Barometer, APRA
Figure 55: Workers' Compensation Serious Injury Frequency Statistics (per 1000 employees) - Australia
Age Group 2000-01 2007-08 2008-09 2009-10 2010-11 2011-12 2012-13p
Change from 2001
to 2013 <20 years 9.7 8.5 7.7 6.8 7.2 6.9 6.4 -34% 20-24 years 13.3 10.6 10.0 9.2 9.3 9.3 9.2 -31% 25-29 years 14.7 11.1 10.5 9.7 9.5 9.5 9.1 -38% 30-34 years 16.7 12.3 11.6 11.2 10.8 10.3 9.4 -44% 35-39 years 18.2 13.8 13.4 13.0 12.4 11.8 10.8 -41% 40-44 years 18.1 15.1 14.5 14.4 14.0 13.5 12.2 -32% 45-49 years 18.1 15.9 15.1 15.2 15.4 15.0 13.4 -26% 50-54 years 19.3 16.5 16.0 16.0 16.0 15.6 14.2 -26% 55-59 years 18.0 15.9 15.8 15.6 15.3 15.3 14.0 -22% 60-64 years 19.2 15.6 14.3 15.0 14.9 15.4 14.2 -26% Total claims 16.3 13.3 12.8 12.4 12.3 12.0 11.1 -32%
Source: http://www.safeworkaustralia.gov.au/sites/swa/about/publications/pages/australian-workers-compensation-statistics-2012-13
7. New classes / heads of damage: Given our comments above that we think that
frequency in most classes are likely to be improving, we think that insurance
companies have to keep innovating to find new risks to insure. As an example,
we note that the insurance industry has recently started providing much greater
coverage for flood on home insurance policies. This would have increased some

26
Australia Equity Research 13 January 2015
of the costs of the events. Other examples of growth into new areas include
growth in cyber insurance and pet insurance. It is notable that both of these are
being pioneered by overseas insurers operating here either through their Lloyds
or domestic license. As such – the large domestic insurers are largely not
partaking in that new growth at the moment.
Thoughts on growth from survey participants
As part of this survey, we specifically included questions on the issue of growth
prospects for the industry. We outline below a summary of the survey participant's
responses:
Survey Participants expectations on growth: In the section of the survey “Issues
Confronting the Underwriters” we summarise answers from respondents where we
asked participants questions about growth. These included (a) whether they saw the
general insurance industry as a growth industry, (b) whether the industry was
expanding its product range and (c) whether alternatives e.g. alternative capital,
mitigation of risks were reducing demand for traditional insurance. We also
separately asked about the cycle. We outline below the findings:
Most think the general insurance industry is a GDP or sub GDP growth business.
In the short run - many made comments about the cycle in particular and
competition in personal lines being a near term headwind. The more bullish
participants said that in the medium term improved risk management would be
offset by higher weather related claims from climate change, new products and
privatization of government insurance schemes. Nevertheless, in the long run –
most participants thought growth would be GDP or sub GDP.
Table 1: Responses in Survey from Participants on whether General Insurance is a growth industry in the near term and medium term (number of respondents)
Near Term
~Medium Term
Sub GDP ~GDP More than GDP Sub GDP GDP More than GDP 4 1 3 3 1
Source: JPM Taylor Fry Barometer 2014. There were 16 respondents but some left responses blank or did not provide enough information to decide exactly where they stood on this issue
We also asked 3 questions about (a) the cycle (b) which class respondents saw the
greatest change in capacity and whether it was positive or negative (c) which
class respondents saw the greatest risks to profits.
Figure 56: Questions asked of respondents on competition in personal lines and commercial lines
Source: JPM Taylor Fry Barometer
Please indicate the level of competition in the personal and commercial lines markets, on the following scale:
1 2 3 4 5
Personal lines
Commercial lines
1 2 3 4 5
Personal lines
Commercial lines
Not rational,
unprofitable
Target ROEs
being met
Excessively competitive,
lapse rates rising, rates
falling significantly
Rates and
lapse rates
holding
Not competiitve,
rates falling,
premium rates
rising
Please indicate how rational you believe the pricing in the personal and commerical lines markets to be, on the
following scale:
Very profitable, above
target profit levels
Most survey participants
thought that in the near term the
industry would be a sub GDP
growth business.
In the medium term it was more
mixed – but most seemed to
think that the industry was either
a GDP or sub GDP growth
business

27
Australia Equity Research 13 January 2015
Table 2: Answers to competition question
1 2 3 4 5 Average
Personal lines competition 0 0 2 8 0 3.80 Commercial lines competition 1 0 2 6 4 3.92 Personal lines rationality 1 0 10 1 0 2.92 Commercial lines rationality 0 7 6 0 0 2.46
Source JPM Taylor Fry Barometer
Table 3: Answers to capacity question and profit risks.
Greatest change in capacity Profit Risk
Votes Positive Negative Votes
Domestic Motor Vehicle 4 3 1 4 Householders 2 1 1* 1 CTP(NSW & QLD) 0 0 0 1 Underwritten Workers' Comp (WA) 0 0 0 0 Underwritten Workers' Comp (TAS ACT & NT) 0 0 0 1 Fire / ISR 6 3 3* 2 Commercial Motor Vehicle 0 0 0 0 Public & Product Liability 1 1 0 2 Professional Indemnity 1 1 0 2 Directors' & Officers' 1 0 1* 2
Source: JPM Taylor Fry Barometer. * we think these respondents said the class faced a negative change in capacity when they intended to say they had a positive change in capacity.
What is clear is that there is considerable pressure on premium rates in
commercial and personal lines according to the industry, with participants saying
both classes had scores near 4 (“lapse rates rising, premium rates falling”). In
commercial lines – there was a bit more concern about the pressure leading to
irrational rates. In terms of change - participants signaled large increases in
capacity in domestic motor, householders and Fire / ISR. In terms of changes in
profitability - it seemed that participants were most concerned about growth in
capacity in Fire / ISR, motor and householders.
JPM Views on Outlook for growth
In the near term – we are very cautious about the outlook for growth in the industry,
due to the following:
Growth now slowest rate in the last 20 years: A confluence of factors has led
to the GWP growth trends in the 2 quarters to September 2014 being the lowest
they have been in the last 20 years (see charts below). We don’t think there is any
respite likely in the quarters ahead.
We are very cautious on growth
prospects:
- current growth rates are
lowest ever
- competition is very strong in
personal and commercial lines
due to all time high RoEs
- economic growth could be a lot
slower
- frequency has been falling at
3% p.a. + in key classes
- there are no offsetting claims
size inflation driven drivers
boosting growth
- domestic insurers not
expanding into new classes

28
Australia Equity Research 13 January 2015
Figure 57: Long Term trends on GWP Growth – Australia
Source: APRA, ISC, JPM estimates
Figure 58: Latest trends on GWP growth - current levels of Growth are the lowest in 20 years - Australia
Source: APRA
Cycle: We believe that premium rates in both personal lines and commercial
lines are under pressures.
RoEs are as high on an underlying basis as we have ever seen them – which is
inviting competition in from overseas (e.g. Lloyds) as well as domestically e.g.
from banks in personal lines.
Superimposed Trends: There have been no signs of superimposed inflation for
some time – which means growth in premium in response to this is unlikely.
There are also likely to be fewer incremental boosts to profitability to come from
weakening claims trends in long tail lines in our view (insurers are getting much
closer to setting assumptions assuming minimal inflation).
Lack of expansion into new classes: There are no new classes that domestic
Australian insurers seem to be pushing in a big way to make up for some of the
pressures we have seen. Most of the expansion into cyber insurance / pet
insurance has been made by foreign insurers. There could be some respite from
privatization of South Australian compensation schemes.
Frequency continuing to fall – but maybe even claim size: Classes such as
motor could see accelerated reductions in frequency from new technologies.
There is even a risk that average claim sizes could start falling in classes such as
motor due to the new technology, and the cost of that technology coming down.
This is something we have not seen for a while.

29
Australia Equity Research 13 January 2015
Table 4: Summary of JPM Views on Growth Outlook
Driver Outlook - in terms of impact on premium rates Comment
Growth -ve This is expected to be weak Catastrophe - Arguably 2014 may be slightly above average
Superimposed inflation flat to –ve This has not been evident for some time. Insurers are talking about reducing assumptions on these.
Changing investment yields +ve Interest rates could fall - thereby forcing insurers and regulators to consider increases in long tail rates
Capital -ve There is still inflow of capital into commercial markets, returns are at all-time highs in the sector.
Risk Mitigation / Management -ve
The outlook for motor in particular in the long run (driverless cars, technology assisting in avoiding collisions) should be weak in the medium to longer term. This may be offset partially by some increases in property classes from climate change related risk
New classes Flat At this stage - the domestic industry has been slow to embrace new classes such as cyber insurance etc.
Source: JPM
30
Australia Equity Research 13 January 2015
The Impact of Technology on Insurance
Kevin Gomes, Sharanjit Paddam, Catherine Weston; Taylor Fry
Siddharth Parameswaran, Alvin Liu; J.P. Morgan
The current strongly competitive market is driving demand for innovation in insurance. Technology is supplying innovation, and is impacting all aspects of insurance – from products, through rating, distribution, and claims management. In this article, we discuss the different opportunities and challenges to insurers from recent and future
technological advances.
Products
The major impact of technology on insurance has been the potential for new
insurance policies to cover new and emerging risks, including cyber insurance,
transport networking companies, home sharing, and drones. However, each of these
new products presents new challenges for insurers.
Cyber insurance
Technology has transformed businesses over the last twenty years as companies have
gone online in order to access customers, and to store their information in the
“cloud”. However, this has also exposed them to the risk of a cyber attack.
Traditional commercial insurance products often did not respond to these risks, as
they generally only provided cover for tangible property.
Cyber insurance has been offered for many years now, and covers loss due to a
cyber-attack, data protection laws, and the mismanagement of personal data. Policies
are usually written on a claims made basis, with the main cover being liability, and
additional coverage provided for legal, investigation, fines and other expenses.
Damages from a cyber-attack can be large. Publically known examples of cyber
attacks include the recent hacking of the Sony corporate network, including the
demand for the movie The Interview not to be released. However, many cyber
attacks, particularly those affecting small and medium companies, will go
unreported.
Given the lack of historical data, Cyber insurance can be difficult for insurers to
price. There are, however, at least two risk modelling companies in the process of
cyber risk modelling.7
Transportation Network Companies (TNCs)
The smartphone app taxi service, Uber, has risen in popularity since expanding its
services in 2012 to UberX with non-luxury cars and non-commercial drivers. Other
relatively new companies in the US based on a similar ride share model are Lyft and
Sidecar. Low costs are possible not only due to the nature of drivers owning their
own vehicle, but also because TNCs typically take out “contingent” insurance
(details varying depending on the country) - effectively a ‘Plan B’ to the driver’s
personal insurance policy.
7 http://www.theage.com.au/it-pro/security-it/insurance-risk-modelers-look-to-clarify-cyber-risk-
costs-20141222-12c2tw.html

31
Australia Equity Research 13 January 2015
The insurance implications for Uber users are particularly concerning in Australia, as
The Insurance Council of Australia (ICA) is not aware of insurance products in
Australia that cover ride sharing8. A car ride share warning was released by the ICA
in June 2014 stating “any motorist considering providing a ride sharing service
should first discuss this with their insurer to check the impact this might have on
their motor vehicle insurance policies, in particular third party property or
comprehensive car insurance”9. If an insurance company proves a driver’s actions to
be illegal (for example, a non-commercial driver in a non-commercial vehicle
receiving a fee for service), a claim against the insurance policy can be declined.
In Australia, Uber requires drivers to have a full license, CTP coverage and third
party property damage insurance, however it is likely that a personal insurance claim
will be denied. Uber therefore provides “contingent coverage” (in the event that a
driver’s personal insurance does not apply) in the amount of US$5 million for bodily
injury and property damage to third parties. This would still leave the driver’s vehicle
uncovered in the case of a personal comprehensive claim being declined.10
TNCs provide unique challenges for insurers, including if any such service is in fact
legal. A Roads and Maritime Services spokeswoman stated that “while Uber is not
breaching the Passenger Transport Act 1990 by offering the service, motorists
transporting passengers for a fare are”. NSW Roads and Maritime Services has
issued five $2,500 fines, threatening legal action against UberX drivers. The
Victorian Government issued more than $50,000 worth of $1,700 fines to drivers
around May 201411
.
Airbnb
The home hosting website, Airbnb, has faced similar insurance issues to TNCs,
providing secondary liability coverage which push the insurance onus onto ‘primary’
insurance - the host’s home insurance policy, which will often not cover commercial
activity. This was put to the test as described in December 2014 by The New York
Times, reporting that one host: “talked to an agent about her rental activity, it quickly
became clear that it could not offer her any kind of liability rider and no longer
wanted her as a customer”12
. Another insurance company in the US sets a cap on
rental income, which appears to be a good interim measure until sufficient Home
hosting data can be analysed to better determine appropriate insurance cover and
pricing.
It appears that in the US, where Airbnb has 177,539 listings (and over 1 million
worldwide)13
, the insurance industry is not well prepared. CNBC reported in
December 2014 that "If Airbnb succeeds in sharing risk with personal insurance
companies, then everyone's premiums have to rise to cover it. ... Insurance
companies could solve this by asking all policyholders about their hosting habits, but
none of the 10 … contacted said that they had made any changes to their policies as
home-renting has grown."14
8 http://www.smh.com.au/digital-life/smartphone-apps/nsw-cracks-down-on-uber-ridesharing-
20140617-zsabx.html 9
http://www.insurancecouncil.com.au/assets/media_release/2014/030614%20FINAL%20Car%20ride%20share%20warning.pdf 10
http://blog.uber.com/OzRidesharing 11
http://www.smh.com.au/digital-life/smartphone-apps/nsw-cracks-down-on-uber-ridesharing-20140617-zsabx.html 12
http://www.nytimes.com/2014/12/20/your-money/the-insurance-market-mystifies-an-airbnb-host.html?_r=0 13
as at 22 December 2014 14
http://www.cnbc.com/id/102245404

32
Australia Equity Research 13 January 2015
Drones
Drones have been used for military purposes for many years, however drones have
also been tested for the delivery of books and food (including pizza, taco’s and
Indian food). The first regulatory hurdle in Australia for the use of Remotely Piloted
Aircraft (RPA) is obtaining an Unmanned Operators Certificate (UOC), which is
approved by the Civil Aviation Safety Authority (CASA). CASA also “recommends
that you contact your insurance provider to obtain information surrounding public
liability insurance. Insurance costs can be significant and could influence your
decision to apply”15
. The UOC requirement and the insurance issues could be factors
in drones being slow to ‘take off’ in Australia.
Rating
The pricing of insurance products is improving with more accurate rating factor data
and the introduction of additional rating factors available due to advances in
technology. An example of this is using mapping technology to assess fire and flood
danger zones to price property insurance. Information such as the landscape on the
property, the proximity to bush-land or rivers and the construction of the building
itself can be valuable in assessing the risk of bushfire or flood. Another example of
advances in rating factors is telematics, used for motor vehicle insurance.
Telematics
The data collection for pay as you drive (PAYD) is designed to capture usage based
driving and driver behaviour. The question: ‘are you willing to put a black box in
your car?’ is a rating factor in itself. Customers who drive less often, less often in
peak hour, and less often in dangerous areas have a lower claim risk due to the nature
of their usage. Steering, braking and acceleration are assumed to be factors in motor
vehicle claims risk and are used for telematics. The less erratic a driver is, the lower
risk of a claim and therefore the lower the premium. There may be a critical point in
time whereby insurers not offering telematics may be left with the worst drivers.
Telematics is also assisting insurers in the faster management of claims as well as
being used as a launch pad for other services such as traffic alerts, collision warning
systems, anti-theft, fuel consumption analysis and post-accident services.
Another insurance line that has plans to utilise monitoring/tracking technology in
2015 is pet insurance. In the UK, an insurer is offering a 20% discount on a pet
insurance policy if the pet wears a micro chipped GPS collar16
. The collar will not
only be used for lost pets, but its primary purpose will be to track the exercise routine
of the pet due to increasing costs in pet insurance which are assumed to be largely
due to higher obesity levels. Lower premiums and other rewards will be given to
owners who follow the applicable exercise guidelines.
To date, telematics has not seen widespread take-up in Australia. One factor has been
the large expense associated with installing a black box in a policyholder’s car.
Recently however, smartphones with inbuilt GPS chips have provided an alternative,
and much cheaper means of tracking individual drivers, although such data is more
difficult to verify – e.g. was the policyholder a driver or a passenger when the data
was collected?
15
http://www.casa.gov.au/scripts/nc.dll?WCMS:STANDARD::pc=PC_101985 16
http://www.telegraph.co.uk/health/petshealth/11206443/Track-your-dog-with-a-GPS-collar-to-save-20pc-on-insurance.html

33
Australia Equity Research 13 January 2015
Distribution
Technology has changed the way insurance is sold and has also allowed insurers to
segment their markets and target specific groups of customers. Arguably many new
entrants to the Australian motor and home markets have been successful in cherry
picking profitable segments of the incumbents’ market through the use of
sophisticated data analytics.
Insurers have also started to make use of additional sources of data on their
customers, such as credit card purchase history, loyalty programs, social media,
general smart phone and tablet use, as well as equipment such as GPS – all of which
are now part of everyday life.
Internet giants may also prove to be an insurance industry game changer, as Google
makes further inroads into the insurance industry. In 2012, Google launched ‘Google
Compare’, providing quotes in the UK for banking products, motor vehicle and travel
insurance. Google’s plans for 2015 are to expand its insurance interests and sell
motor vehicle insurance online in the US.17
Claims management
After the Brisbane storms of November 2014, a record proportion of claims were
lodged online rather than over the phone. There are several possible reasons for this,
including: the possibility that people are less likely to require human advice for
hailstorm claims; smartphone use becoming mainstream; as well as customers
preferring the convenience of the online channel compared to being kept on hold on
the phone.
Automated claims management software is also being used to identify high risk
claims in much shorter time frames than previous manual processes.
Once a claim has been accepted, advances in technology can be used to reduce
claims cost. One example is the robotic spraying of cars which reduces repair
expenses.
Claims costs are experiencing a long term reduction in frequency, both through
reduced numbers of accidents and a reduction in fraudulent claims. Cameras have
been used for many years in reducing fraudulent claims. Telematics can be used to
encourage better driver behaviour. Driverless cars have the potential to significantly
reduce accidents by removing the component of human error.
Driverless cars
Driverless cars are not the fictitious idea they once were, having been approved to be
tested in several states in the US, albeit with a hefty insurance bond requirement -
California’s requirement being USD 5 million18
. Germany and the UK have also
been making inroads. Germany has tested driverless cars on the Autobahn, and the
UK recently announced a government project to test the suitability of driverless cars.
The UK testing aims to investigate driver behaviour, and will also include examining
issues such as risk, liability and insurance as well as the practicalities of integrating
driverless cars with traffic and pedestrians. Kenny Leitch, the Global Telematics
Director of the firm that won the contract, RSA, said: "Driverless cars are a fantastic
innovation which will fundamentally change the world of motoring and car
insurance. There are many unanswered questions around how these cars will be
17
http://www.insurancejournal.com/news/national/2015/01/09/353593.htm 18
http://www.businessinsider.com.au/audi-jumps-to-the-front-of-the-line-for-self-driving-cars-in-california-2014-9

34
Australia Equity Research 13 January 2015
insured and through our involvement in this project we will be one of the first
insurers to gain first-hand knowledge of the technology. As a result, we’ll be strongly
positioned to educate drivers and also offer the most appropriate insurance for these
cars.”19
Testing driverless cars has expanded, with plans to test the car on multi-level
highways in Shanghai and Beijing.20
Driverless cars are a game changer and insurers will have to make considerable
adjustments in order to adapt to a world with driverless cars. We expect the
following changes to occur:
Fewer accidents as ‘human error’ is removed as a potential cause of
accident, provided the technology used is sound and durable
New challenges to materialise for lawmakers regarding licensing,
responsibility for vehicle operation and liability
Fewer cars on the road if this technology is employed successfully
Insurers will need to be able to respond to these social and technological changes,
and the following represent real challenges insurers will need to address.
Who is liable?
If an accident occurs where an autonomous car is at fault, who is deemed liable?
Would liability fall on the car manufacturer, the technical systems manufacturer, the
network supplying GPS information, or will the occupant still be deemed as having
ultimate responsibility for the vehicle’s operation? If manufacturers are considered
liable, we could expect an increase in the number of product liability claims — and
an increase in premiums.
Any alterations to the concept of liability which stems from system failure that result
in accidents will carry across to CTP insurance. If manufacturers are deemed liable,
the concept of driver fault may come under pressure and some of the Australian CTP
schemes may need to change.
Determining premiums
How will premiums for autonomous vehicles be determined? Removing driver
judgment and ability from the equation means a 21 year old male may have the same
expected claims cost as a 40 year old female. The usual rating variables of age,
gender, license tenure and claims history will no longer be good predictors of claim
frequency and severity.
We might expect an increase in repair costs for autonomous vehicles damaged in
road accidents relative to conventional vehicles. These automobiles are likely to
require the services of specialised repairers when system repairs are needed. This
would impact the premiums paid by the owners of both the driverless and regular
cars, the latter incurring higher expected repair costs upon colliding with a driverless
car.
Insurers will have to establish premiums in the absence of a claims history and
judicial precedents. Provided the technology employed is reliable and durable we
19
http://www.actuarialpost.co.uk/article/rsa-chosen-as-insurance-partner-for-driverless-cars-project-6996.htm 20
http://www.techtimes.com/articles/16791/20141001/bmw-partners-with-baidu-to-test-self-driving-cars-in-china.htm

35
Australia Equity Research 13 January 2015
could expect the reduction in claim frequency to be sizeable. While we acknowledge
that other factors will need to be considered in the setting of premiums, when looking
at the effects on premiums from this angle alone, we may expect comprehensive
motor premiums to reduce for autonomous cars compared to their driver operated
counterparts.
Premium setting for shared vehicles
Given that autonomous cars have the potential to be easily shared between owners,
how will premiums be set? Should a large scale car sharing scheme be introduced
there will be fewer cars on the road, less cars manufactured and a reduction in the
number of cars that require insurance. If cars are able to drive to their owners, car
sharing becomes easier and the demand for taxis will reduce. Insurers will need to
consider that such cars will be on the road more often and factors including where
located and if garaged will have less relevance where there are multiple owners.
Whilst the propensity to cause an accident may be lower in the case of driverless
cars, the frequency of ‘not at fault collision’, storm and windshield claims may
increase due to increased time vehicles are on the road. Will insurance premiums
change on a trip by trip basis, depending on whether the driver will be in control or
not, or even depending on the weather forecast and time of day?
Additional challenges in a driverless car society
The proliferation of autonomous cars must be accompanied by stable and secure
infrastructure. In other words, there can be no network crashes and back-up systems
must be installed in vehicles to seamlessly take over if components fail. In addition,
this increased reliance on technology means the risk of system hacking needs to be
minimised and consideration should be given to what type of personal information is
collected and stored.
In highly automated commercial aircraft, pilot error is still reported as the leading
cause of aviation accidents21
. Despite simulator emergency training and currency
requirements, there have been several major accidents where the pilots have failed to
undertake the most basic of recovery procedures, such as recovering from a stall.
Would ‘drivers’ of driverless cars lose their skills, becoming reliant on automation?
Society will need to consider these issues and respond if driverless cars become part
of everyday life.
Conclusion
Advances in technology have the potential to transform and challenge the insurance
industry. Improvements in rating and fraud detection are already being seen on the
international insurance scene. These are clearly benefits to the insurance industry,
and those not keeping up with technology could suffer. For example, a strong
increase in the number of insurers offering competitive telematics car insurance
could leave the cautious insurers with the worst drivers. Challenges to the insurance
industry are the emergence of companies such as ride-sharing and home hosting,
where insurance companies would benefit from reconsidering their insurance
provisions. A little further away is the driverless car society, which is likely to reduce
claims from driver error, however introduce complexities such as liability and
technology malfunctions and/or hacking. Will advances in technology increase the
demand for Cyber insurance, or would breach notification legislation be the driver
for Cyber insurance demand?
21 http://www.newyorker.com/science/maria-konnikova/hazards-automation

36
Australia Equity Research 13 January 2015
The Political Impact of Climate Change on Insurers
Sharanjit Paddam, Taylor Fry
Climate change is likely to exacerbate affordability issues for Australian
homeowners, as noted in a recent research paper: Can actuaries really afford to
ignore climate change? by actuaries Jon Harwood, Sharanjit Paddam, and Jessica
Egan, and Andy Pittman, Professor of climate science at UNSW.22
These affordability issues will pose significant challenges for insurers, who already
face widespread negative publicity for increases in insurance premiums for properties
located in areas exposed to natural perils, such as bushfires, cyclones and flood. In
turn, these will generate political issues, as consumers perceive higher premiums as
being unfair.
A number of potential changes in climate systems could also have a significant and
relatively sudden impact on claims costs. As home insurance policies usually only
offer cover on an annual basis, this could leave communities exposed very abruptly if
there is significant increases in premium, or the removal of cover, or the exit of
insurers from unprofitable markets.
Location, location, location
Figure 59: Buildings insurance premium as a proportion of annual income under various climate change scenarios
Source: Harwood et al.
The box-chart above shows the variation in ratio of buildings insurance premiums to
average annual income for different geographic locations across Australia. It is
based on the current premium rating structure of a major Australian insurer (Base
22
Available at
http://www.actuaries.asn.au/Library/Events/GIS/2014/GIS2014EganEtAlClimateChangePres.

37
Australia Equity Research 13 January 2015
Scenario), and also shows the same information under different future climate change
impacts on Bushfire, Cyclone and Flood perils. The base scenario already shows
substantial variability in the affordability of buildings insurance. To some extent this
affordability is underestimated in the chart, as properties that are currently uninsured
have been excluded from the sample set.
The chart shows that Climate change impacts are likely to be minimal for the median
household as most Australian homes do not have any significant material bushfire,
flood or cyclone risk at the current time. However, the worst affected homes could
see buildings premiums of about 38% of annual income under certain scenarios by
2100. This is a significant affordability problem that impacts homes in high risk
areas. As the real estate saying goes, it’s all about location, location, location.
In terms of increases in buildings premiums under the modelled scenarios, over
300,000 households could see a buildings increase of up to 48% by 2100. 60,000-
80,000 households could see increases of up to 104% by 2100. These changes will
exacerbate existing affordability issues.
Political impact of risk pricing vs risk pooling
As increasing amounts of data on natural perils becomes available – in particular
flood maps, and cyclone studies – insurers have been increasingly pricing property
insurance based on the risks to individual properties, rather than pooling the risk
across a wide geographic area.
As noted in a recent report by the Australian Government Actuary, this increased risk
pricing for cyclone losses has been the main driver of recent substantial increases in
premiums for home, contents and strata insurance in Northern Queensland compared
to other parts of Australia. This trend is likely to continue into the future as insurers
seek to remain competitive in low risk areas, but reduce cross-subsidies of premiums
to high risk areas.
These trends pose significant political problems, particularly for politicians whose
constituents live in high risk areas and perceive the relatively higher premiums as
inequitable. Unlike insurers operating in a free market, politicians tend to prefer risk
pooling to risk pricing.
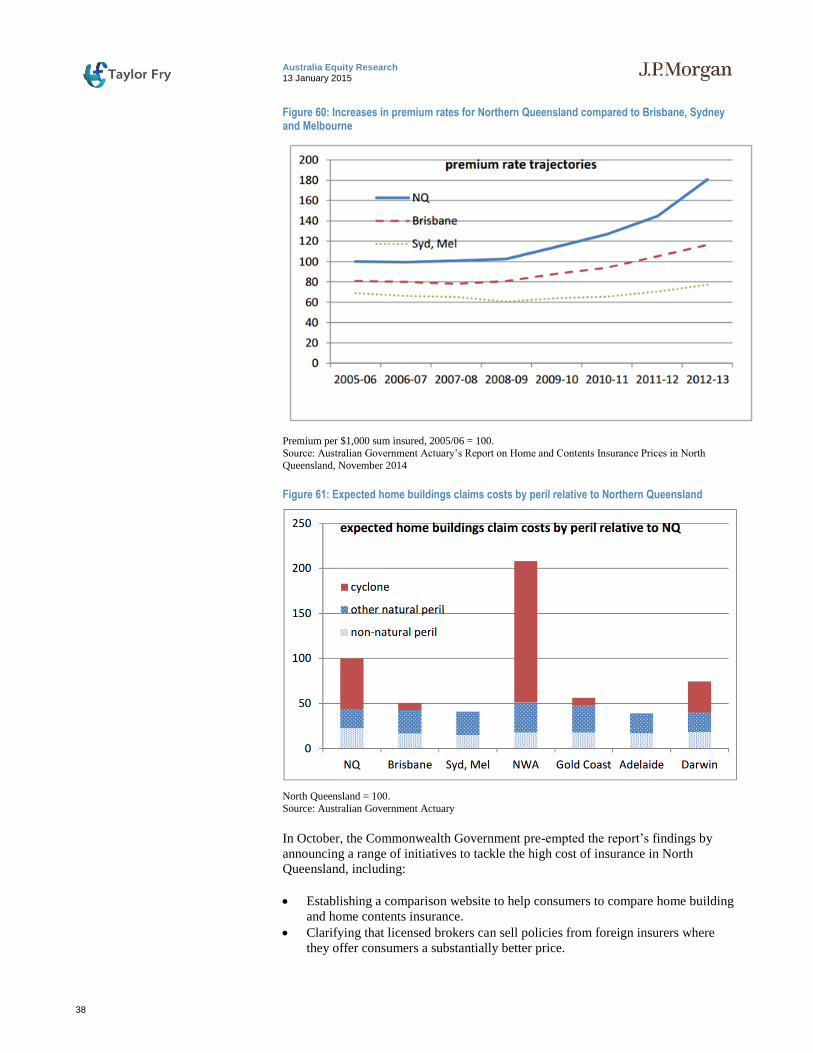
38
Australia Equity Research 13 January 2015
Figure 60: Increases in premium rates for Northern Queensland compared to Brisbane, Sydney and Melbourne
Premium per $1,000 sum insured, 2005/06 = 100.
Source: Australian Government Actuary’s Report on Home and Contents Insurance Prices in North
Queensland, November 2014
Figure 61: Expected home buildings claims costs by peril relative to Northern Queensland
North Queensland = 100.
Source: Australian Government Actuary
In October, the Commonwealth Government pre-empted the report’s findings by
announcing a range of initiatives to tackle the high cost of insurance in North
Queensland, including:
Establishing a comparison website to help consumers to compare home building
and home contents insurance.
Clarifying that licensed brokers can sell policies from foreign insurers where
they offer consumers a substantially better price.

39
Australia Equity Research 13 January 2015
Developing a program of engineering assessments for strata properties in North
Queensland, to improve information available on buildings’ susceptibility to
storm damage and promote resilience.
Of these changes, the first is likely to have a limited impact as in the long run,
insurers are unlikely to reduce premium rates below the expected cost of claims,
especially for relatively small and volatile markets such as North Queensland. The
second is not actually a change in policy, and again, in the long run foreign insurers
are unlikely to under-price the risk. The last initiative is likely to exacerbate
individual risk pricing by insurers, leading to an even wider range of premiums, and
possibly even higher premiums for some properties.
Mitigation, Mitigation, Mitigation
In the longer run, the government has recognised that Australia’s resilience to natural
perils needs to be substantially improved. Insurance can assist during a transition
period, but over the long term, the risk to property needs to be brought under control
or insurance becomes unaffordable.
The government has commissioned a Productivity Commission Inquiry into National
Disaster Funding Arrangements, which produced a draft report in 2014. The draft
report noted that “price signals provided by insurance can be an effective way to
convey information about risk and encourage risk management” and that the signal
“should not be distorted by insurance taxes or subsidised premiums”. So whilst
painful, the insurance price signals act as an incentive for the householder to reduce
their risk.
There is a cost to risk management, whether it is through transferring the risk or
reducing it, and this cost needs to be traded off against stakeholder risk appetites and
financial capacity. Insurance is a risk transfer for the householder, however when the
risk being transferred to the insurer is high, the associated cost may prove
prohibitive. Ideally the risk needs to be reduced to an acceptable level; however there
is a cost to this as well. The economic benefits need to outweigh the costs of the risk
reduction and the cost of doing nothing in order for change to occur.
There are a wide range of potentially effective mitigation measures that require
political support and action. Examples include building flood levees and changing
land use laws to prohibit construction on flood plains or storm surge red zones. In the
absence of mitigation, policyholders may need to take adaption measures, such as
raising floor height and retrofitting houses to current cyclone building standards, and
governments can encourage such activities by subsidising the cost of adaption.
One recent example of effective flood mitigation is in the town of Roma in South
West Queensland. Roma had been flooded three times in as many years from 2010 to
2012. Since 2008, Suncorp had paid out over $100m in claims and consequently, in
addition to steep price increases for renewal customers at risk, had decided to not
underwrite new business in the area. Suncorp declared it would continue this strategy
until the town took steps to mitigate against the unacceptable level of flood risk. The
local council did respond and a flood levee was built in early 2014 at a cost of $16m.
Suncorp subsequently honoured its commitment by resuming cover in the area and
passing through significant premium reductions, with a 30% reduction for the
average home, and as much as 80% for high risk properties.
The Productivity Commission recommended that local councils, insurers and
governments will continue to work together to improve risk mitigation, leading to
increased resilience, and the continued affordability and even viability of insurance.

40
Australia Equity Research 13 January 2015
Alternative Capital
Kevin Gomes, Sharanjit Paddam; Taylor Fry
In this article, we summarise ongoing developments in alternative capital solutions
for reinsurance (including catastrophe bonds, industry loss warranties and
collateralized reinsurance) and examine the implications for the Australian
insurance industry.
Alternative Capital Growth Alternative capital market capacity is growing more quickly than traditional
reinsurance capital. Although precise measurement of the total alternative capital
market size is problematic (particularly for collateralized reinsurance), we estimate
that approximately US$50B in capital in 2013 came from alternative markets.
Although this appears relatively small compared to the global reinsurer capital of
US$540B, alternative capital enjoyed significantly higher growth than global
reinsurer capital over each of the 3 preceding years, with further significant growth
(as yet unquantified) likely to have occurred during 2014.
Figure 62: Alternative Capital Market Growth
Pricing Spreads The “pricing spread” on a catastrophe bond represents the additional interest
payment made to compensate investors for the catastrophe insurance risk. The
pricing spread will typically increase as the level of expected catastrophe loss
increases, with the ratio of pricing spread to expected loss equating conceptually to a
“loss ratio”.
Catastrophe bond pricing spreads for given levels of expected loss have reduced
significantly over time. For example, a catastrophe bond issued in 2000 with 1.5%
expected loss may have been placed with a 7% pricing spread (i.e. “loss ratio” of
1.5/7 = 21%). In comparison, a catastrophe bond with 1.5% expected loss issued in
2014 would have a significantly lower pricing spread of approximately 4.5 (i.e. “loss
ratio” of 1.5/4.5 = 33%). The lower pricing spreads are resulting in catastrophe bonds
being seen as increasingly competitive relative to the rates offered by traditional
reinsurers.
Alternative Capital

41
Australia Equity Research 13 January 2015
Figure 63: Catastrophe Bond Pricing: Spreads vs Expected Loss
Implications for Australia There has been limited direct use of alternative capital by Australian insurers to date,
partly due to regulatory hurdles whereby insurers need to apply to APRA to have
alternative capital instruments recognized in their Insurance Concentration Risk
Capital calculation. Nonetheless, the growth in alternative capital has had secondary
effects in Australia, with the increase in alternative capital global capacity leading to
increased overall reinsurance capacity which has in turn contributed to lower
reinsurance rates globally (including Australia). Furthermore, reductions in pricing
for alternative capital globally are putting increasing price pressure on traditional
reinsurance. Although the observed impacts have been mainly on property classes to
date, we may see some spill over into casualty classes over time. Longer term, we
may also see alternative capital competing for a share of the direct insurance market
as capacity chases risk.
2000
2014
Cat bond pricing spreads continue to reduce
Source: InsuranceLinked.com

42
Australia Equity Research 13 January 2015
Pa
rt 2
: S
urv
ey P
art
icip
an
ts

43
Australia Equity Research 13 January 2015
Survey Participants
The participants in this year’s survey are listed below. Where an international
organisation is shown, the response is from its Australian-based subsidiary or branch.
Underwriters AIG Hollard ACE Insurance Limited Liberty International Underwriters Allianz Australia Insurance Ltd NTI Axis Onepath Calliden RACQ CGU Suncorp Chubb Insurance TIO CommInsure Zurich Brokers Aon Risk Services Australia OAMPS (Wesfarmers) Fitzpatrick & Co. Insurance Brokers Philp, Newby & Owen Jardine Lloyd Thompson Steadfast Macey Insurance Brokers Marsh Reinsurers Berkley Re SCOR Asia Pacific Hannover Re Swiss Re General Reinsurance
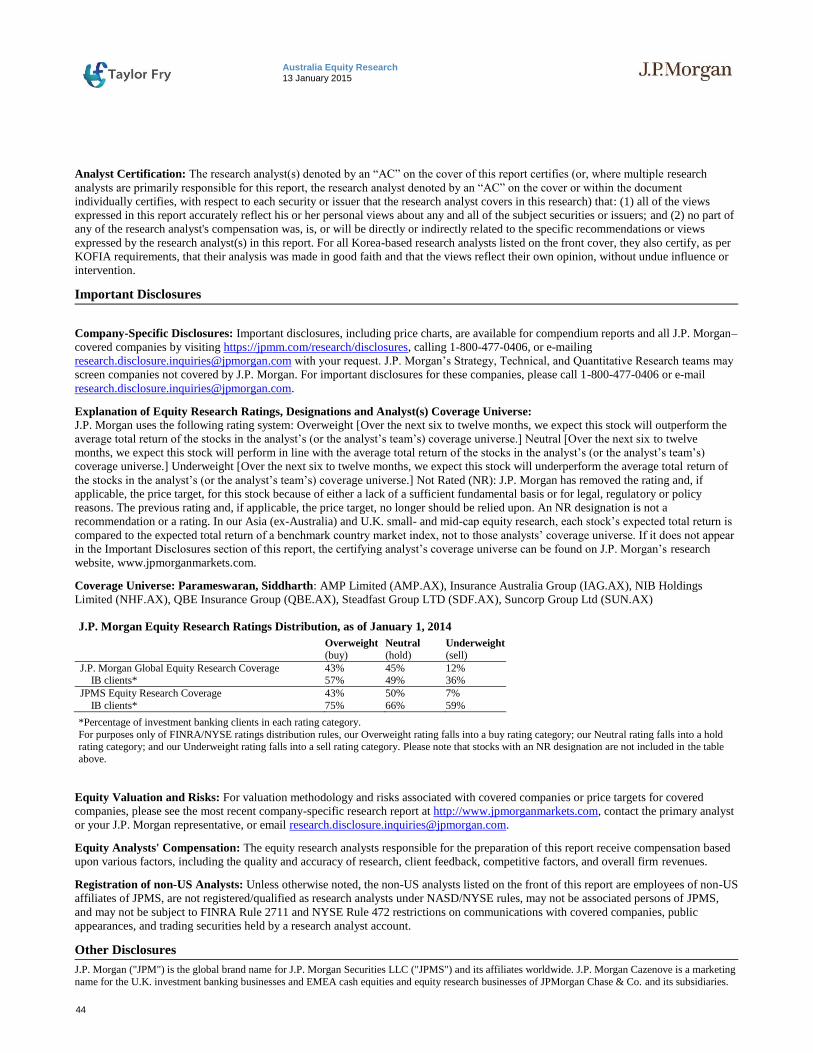
44
Australia Equity Research 13 January 2015
Analyst Certification: The research analyst(s) denoted by an “AC” on the cover of this report certifies (or, where multiple research
analysts are primarily responsible for this report, the research analyst denoted by an “AC” on the cover or within the document
individually certifies, with respect to each security or issuer that the research analyst covers in this research) that: (1) all of the views
expressed in this report accurately reflect his or her personal views about any and all of the subject securities or issuers; and (2) no part of
any of the research analyst's compensation was, is, or will be directly or indirectly related to the specific recommendations or views
expressed by the research analyst(s) in this report. For all Korea-based research analysts listed on the front cover, they also certify, as per
KOFIA requirements, that their analysis was made in good faith and that the views reflect their own opinion, without undue influence or
intervention.
Important Disclosures
Company-Specific Disclosures: Important disclosures, including price charts, are available for compendium reports and all J.P. Morgan–
covered companies by visiting https://jpmm.com/research/disclosures, calling 1-800-477-0406, or e-mailing
[email protected] with your request. J.P. Morgan’s Strategy, Technical, and Quantitative Research teams may
screen companies not covered by J.P. Morgan. For important disclosures for these companies, please call 1-800-477-0406 or e-mail
Explanation of Equity Research Ratings, Designations and Analyst(s) Coverage Universe:
J.P. Morgan uses the following rating system: Overweight [Over the next six to twelve months, we expect this stock will outperform the
average total return of the stocks in the analyst’s (or the analyst’s team’s) coverage universe.] Neutral [Over the next six to twelve
months, we expect this stock will perform in line with the average total return of the stocks in the analyst’s (or the analyst’s team’s)
coverage universe.] Underweight [Over the next six to twelve months, we expect this stock will underperform the average total return of
the stocks in the analyst’s (or the analyst’s team’s) coverage universe.] Not Rated (NR): J.P. Morgan has removed the rating and, if
applicable, the price target, for this stock because of either a lack of a sufficient fundamental basis or for legal, regulatory or policy
reasons. The previous rating and, if applicable, the price target, no longer should be relied upon. An NR designation is not a
recommendation or a rating. In our Asia (ex-Australia) and U.K. small- and mid-cap equity research, each stock’s expected total return is
compared to the expected total return of a benchmark country market index, not to those analysts’ coverage universe. If it does not appear
in the Important Disclosures section of this report, the certifying analyst’s coverage universe can be found on J.P. Morgan’s research
website, www.jpmorganmarkets.com.
Coverage Universe: Parameswaran, Siddharth: AMP Limited (AMP.AX), Insurance Australia Group (IAG.AX), NIB Holdings
Limited (NHF.AX), QBE Insurance Group (QBE.AX), Steadfast Group LTD (SDF.AX), Suncorp Group Ltd (SUN.AX)
J.P. Morgan Equity Research Ratings Distribution, as of January 1, 2014
Overweight (buy)
Neutral (hold)
Underweight (sell)
J.P. Morgan Global Equity Research Coverage 43% 45% 12% IB clients* 57% 49% 36%
JPMS Equity Research Coverage 43% 50% 7%
IB clients* 75% 66% 59%
*Percentage of investment banking clients in each rating category.
For purposes only of FINRA/NYSE ratings distribution rules, our Overweight rating falls into a buy rating category; our Neutral rating falls into a hold rating category; and our Underweight rating falls into a sell rating category. Please note that stocks with an NR designation are not included in the table
above.
Equity Valuation and Risks: For valuation methodology and risks associated with covered companies or price targets for covered
companies, please see the most recent company-specific research report at http://www.jpmorganmarkets.com, contact the primary analyst
or your J.P. Morgan representative, or email [email protected].
Equity Analysts' Compensation: The equity research analysts responsible for the preparation of this report receive compensation based
upon various factors, including the quality and accuracy of research, client feedback, competitive factors, and overall firm revenues.
Registration of non-US Analysts: Unless otherwise noted, the non-US analysts listed on the front of this report are employees of non-US
affiliates of JPMS, are not registered/qualified as research analysts under NASD/NYSE rules, may not be associated persons of JPMS,
and may not be subject to FINRA Rule 2711 and NYSE Rule 472 restrictions on communications with covered companies, public
appearances, and trading securities held by a research analyst account.
Other Disclosures
J.P. Morgan ("JPM") is the global brand name for J.P. Morgan Securities LLC ("JPMS") and its affiliates worldwide. J.P. Morgan Cazenove is a marketing
name for the U.K. investment banking businesses and EMEA cash equities and equity research businesses of JPMorgan Chase & Co. and its subsidiaries.
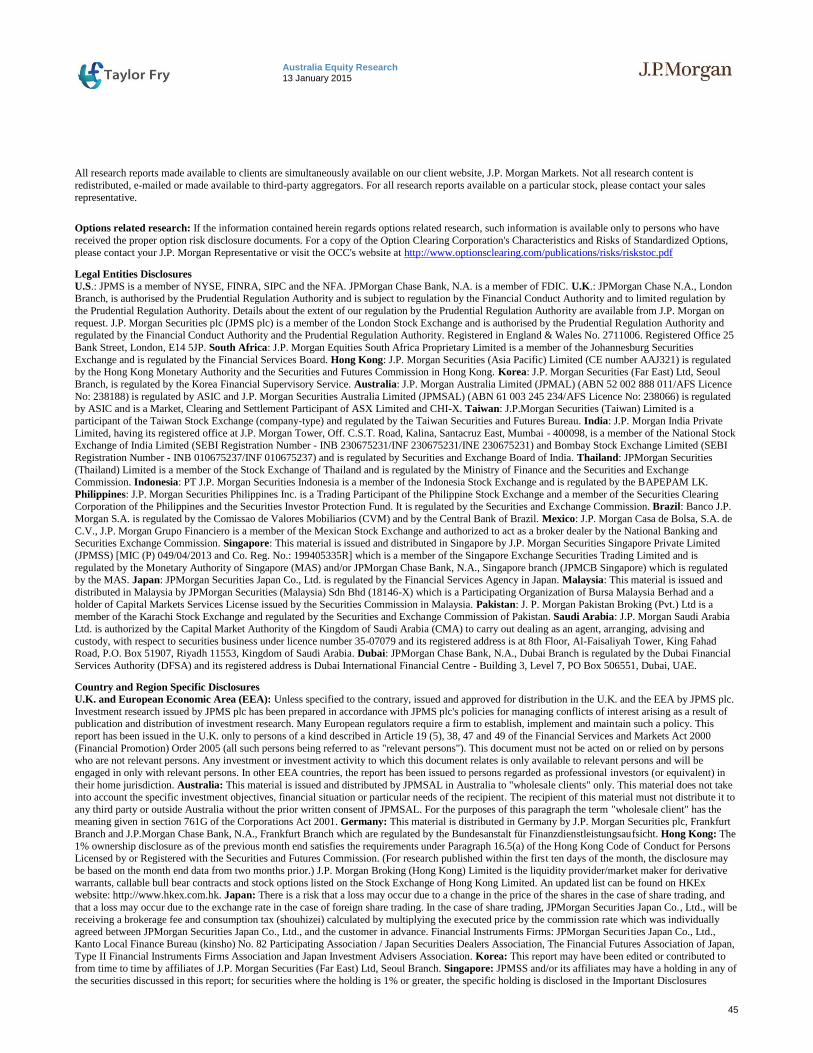
45
Australia Equity Research 13 January 2015
All research reports made available to clients are simultaneously available on our client website, J.P. Morgan Markets. Not all research content is
redistributed, e-mailed or made available to third-party aggregators. For all research reports available on a particular stock, please contact your sales
representative.
Options related research: If the information contained herein regards options related research, such information is available only to persons who have
received the proper option risk disclosure documents. For a copy of the Option Clearing Corporation's Characteristics and Risks of Standardized Options,
please contact your J.P. Morgan Representative or visit the OCC's website at http://www.optionsclearing.com/publications/risks/riskstoc.pdf
Legal Entities Disclosures
U.S.: JPMS is a member of NYSE, FINRA, SIPC and the NFA. JPMorgan Chase Bank, N.A. is a member of FDIC. U.K.: JPMorgan Chase N.A., London Branch, is authorised by the Prudential Regulation Authority and is subject to regulation by the Financial Conduct Authority and to limited regulation by
the Prudential Regulation Authority. Details about the extent of our regulation by the Prudential Regulation Authority are available from J.P. Morgan on
request. J.P. Morgan Securities plc (JPMS plc) is a member of the London Stock Exchange and is authorised by the Prudential Regulation Authority and
regulated by the Financial Conduct Authority and the Prudential Regulation Authority. Registered in England & Wales No. 2711006. Registered Office 25
Bank Street, London, E14 5JP. South Africa: J.P. Morgan Equities South Africa Proprietary Limited is a member of the Johannesburg Securities
Exchange and is regulated by the Financial Services Board. Hong Kong: J.P. Morgan Securities (Asia Pacific) Limited (CE number AAJ321) is regulated by the Hong Kong Monetary Authority and the Securities and Futures Commission in Hong Kong. Korea: J.P. Morgan Securities (Far East) Ltd, Seoul
Branch, is regulated by the Korea Financial Supervisory Service. Australia: J.P. Morgan Australia Limited (JPMAL) (ABN 52 002 888 011/AFS Licence
No: 238188) is regulated by ASIC and J.P. Morgan Securities Australia Limited (JPMSAL) (ABN 61 003 245 234/AFS Licence No: 238066) is regulated by ASIC and is a Market, Clearing and Settlement Participant of ASX Limited and CHI-X. Taiwan: J.P.Morgan Securities (Taiwan) Limited is a
participant of the Taiwan Stock Exchange (company-type) and regulated by the Taiwan Securities and Futures Bureau. India: J.P. Morgan India Private
Limited, having its registered office at J.P. Morgan Tower, Off. C.S.T. Road, Kalina, Santacruz East, Mumbai - 400098, is a member of the National Stock Exchange of India Limited (SEBI Registration Number - INB 230675231/INF 230675231/INE 230675231) and Bombay Stock Exchange Limited (SEBI
Registration Number - INB 010675237/INF 010675237) and is regulated by Securities and Exchange Board of India. Thailand: JPMorgan Securities
(Thailand) Limited is a member of the Stock Exchange of Thailand and is regulated by the Ministry of Finance and the Securities and Exchange Commission. Indonesia: PT J.P. Morgan Securities Indonesia is a member of the Indonesia Stock Exchange and is regulated by the BAPEPAM LK.
Philippines: J.P. Morgan Securities Philippines Inc. is a Trading Participant of the Philippine Stock Exchange and a member of the Securities Clearing Corporation of the Philippines and the Securities Investor Protection Fund. It is regulated by the Securities and Exchange Commission. Brazil: Banco J.P.
Morgan S.A. is regulated by the Comissao de Valores Mobiliarios (CVM) and by the Central Bank of Brazil. Mexico: J.P. Morgan Casa de Bolsa, S.A. de
C.V., J.P. Morgan Grupo Financiero is a member of the Mexican Stock Exchange and authorized to act as a broker dealer by the National Banking and Securities Exchange Commission. Singapore: This material is issued and distributed in Singapore by J.P. Morgan Securities Singapore Private Limited
(JPMSS) [MIC (P) 049/04/2013 and Co. Reg. No.: 199405335R] which is a member of the Singapore Exchange Securities Trading Limited and is
regulated by the Monetary Authority of Singapore (MAS) and/or JPMorgan Chase Bank, N.A., Singapore branch (JPMCB Singapore) which is regulated by the MAS. Japan: JPMorgan Securities Japan Co., Ltd. is regulated by the Financial Services Agency in Japan. Malaysia: This material is issued and
distributed in Malaysia by JPMorgan Securities (Malaysia) Sdn Bhd (18146-X) which is a Participating Organization of Bursa Malaysia Berhad and a
holder of Capital Markets Services License issued by the Securities Commission in Malaysia. Pakistan: J. P. Morgan Pakistan Broking (Pvt.) Ltd is a member of the Karachi Stock Exchange and regulated by the Securities and Exchange Commission of Pakistan. Saudi Arabia: J.P. Morgan Saudi Arabia
Ltd. is authorized by the Capital Market Authority of the Kingdom of Saudi Arabia (CMA) to carry out dealing as an agent, arranging, advising and
custody, with respect to securities business under licence number 35-07079 and its registered address is at 8th Floor, Al-Faisaliyah Tower, King Fahad Road, P.O. Box 51907, Riyadh 11553, Kingdom of Saudi Arabia. Dubai: JPMorgan Chase Bank, N.A., Dubai Branch is regulated by the Dubai Financial
Services Authority (DFSA) and its registered address is Dubai International Financial Centre - Building 3, Level 7, PO Box 506551, Dubai, UAE.
Country and Region Specific Disclosures
U.K. and European Economic Area (EEA): Unless specified to the contrary, issued and approved for distribution in the U.K. and the EEA by JPMS plc.
Investment research issued by JPMS plc has been prepared in accordance with JPMS plc's policies for managing conflicts of interest arising as a result of publication and distribution of investment research. Many European regulators require a firm to establish, implement and maintain such a policy. This
report has been issued in the U.K. only to persons of a kind described in Article 19 (5), 38, 47 and 49 of the Financial Services and Markets Act 2000
(Financial Promotion) Order 2005 (all such persons being referred to as "relevant persons"). This document must not be acted on or relied on by persons who are not relevant persons. Any investment or investment activity to which this document relates is only available to relevant persons and will be
engaged in only with relevant persons. In other EEA countries, the report has been issued to persons regarded as professional investors (or equivalent) in
their home jurisdiction. Australia: This material is issued and distributed by JPMSAL in Australia to "wholesale clients" only. This material does not take into account the specific investment objectives, financial situation or particular needs of the recipient. The recipient of this material must not distribute it to
any third party or outside Australia without the prior written consent of JPMSAL. For the purposes of this paragraph the term "wholesale client" has the meaning given in section 761G of the Corporations Act 2001. Germany: This material is distributed in Germany by J.P. Morgan Securities plc, Frankfurt
Branch and J.P.Morgan Chase Bank, N.A., Frankfurt Branch which are regulated by the Bundesanstalt für Finanzdienstleistungsaufsicht. Hong Kong: The
1% ownership disclosure as of the previous month end satisfies the requirements under Paragraph 16.5(a) of the Hong Kong Code of Conduct for Persons Licensed by or Registered with the Securities and Futures Commission. (For research published within the first ten days of the month, the disclosure may
be based on the month end data from two months prior.) J.P. Morgan Broking (Hong Kong) Limited is the liquidity provider/market maker for derivative
warrants, callable bull bear contracts and stock options listed on the Stock Exchange of Hong Kong Limited. An updated list can be found on HKEx website: http://www.hkex.com.hk. Japan: There is a risk that a loss may occur due to a change in the price of the shares in the case of share trading, and
that a loss may occur due to the exchange rate in the case of foreign share trading. In the case of share trading, JPMorgan Securities Japan Co., Ltd., will be
receiving a brokerage fee and consumption tax (shouhizei) calculated by multiplying the executed price by the commission rate which was individually agreed between JPMorgan Securities Japan Co., Ltd., and the customer in advance. Financial Instruments Firms: JPMorgan Securities Japan Co., Ltd.,
Kanto Local Finance Bureau (kinsho) No. 82 Participating Association / Japan Securities Dealers Association, The Financial Futures Association of Japan,
Type II Financial Instruments Firms Association and Japan Investment Advisers Association. Korea: This report may have been edited or contributed to from time to time by affiliates of J.P. Morgan Securities (Far East) Ltd, Seoul Branch. Singapore: JPMSS and/or its affiliates may have a holding in any of
the securities discussed in this report; for securities where the holding is 1% or greater, the specific holding is disclosed in the Important Disclosures

46
Australia Equity Research 13 January 2015
section above. India: For private circulation only, not for sale. Pakistan: For private circulation only, not for sale. New Zealand: This material is issued
and distributed by JPMSAL in New Zealand only to persons whose principal business is the investment of money or who, in the course of and for the purposes of their business, habitually invest money. JPMSAL does not issue or distribute this material to members of "the public" as determined in
accordance with section 3 of the Securities Act 1978. The recipient of this material must not distribute it to any third party or outside New Zealand without
the prior written consent of JPMSAL. Canada: The information contained herein is not, and under no circumstances is to be construed as, a prospectus, an advertisement, a public offering, an offer to sell securities described herein, or solicitation of an offer to buy securities described herein, in Canada or any
province or territory thereof. Any offer or sale of the securities described herein in Canada will be made only under an exemption from the requirements to
file a prospectus with the relevant Canadian securities regulators and only by a dealer properly registered under applicable securities laws or, alternatively, pursuant to an exemption from the dealer registration requirement in the relevant province or territory of Canada in which such offer or sale is made. The
information contained herein is under no circumstances to be construed as investment advice in any province or territory of Canada and is not tailored to
the needs of the recipient. To the extent that the information contained herein references securities of an issuer incorporated, formed or created under the laws of Canada or a province or territory of Canada, any trades in such securities must be conducted through a dealer registered in Canada. No securities
commission or similar regulatory authority in Canada has reviewed or in any way passed judgment upon these materials, the information contained herein
or the merits of the securities described herein, and any representation to the contrary is an offence. Dubai: This report has been issued to persons regarded
as professional clients as defined under the DFSA rules. Brazil: Ombudsman J.P. Morgan: 0800-7700847 / [email protected].
General: Additional information is available upon request. Information has been obtained from sources believed to be reliable but JPMorgan Chase & Co.
or its affiliates and/or subsidiaries (collectively J.P. Morgan) do not warrant its completeness or accuracy except with respect to any disclosures relative to
JPMS and/or its affiliates and the analyst's involvement with the issuer that is the subject of the research. All pricing is as of the close of market for the securities discussed, unless otherwise stated. Opinions and estimates constitute our judgment as of the date of this material and are subject to change
without notice. Past performance is not indicative of future results. This material is not intended as an offer or solicitation for the purchase or sale of any
financial instrument. The opinions and recommendations herein do not take into account individual client circumstances, objectives, or needs and are not intended as recommendations of particular securities, financial instruments or strategies to particular clients. The recipient of this report must make its own
independent decisions regarding any securities or financial instruments mentioned herein. JPMS distributes in the U.S. research published by non-U.S.
affiliates and accepts responsibility for its contents. Periodic updates may be provided on companies/industries based on company specific developments or announcements, market conditions or any other publicly available information. Clients should contact analysts and execute transactions through a J.P.
Morgan subsidiary or affiliate in their home jurisdiction unless governing law permits otherwise.
"Other Disclosures" last revised December 7, 2013.
Copyright 2014 JPMorgan Chase & Co. All rights reserved. This report or any portion hereof may not be reprinted, sold or
redistributed without the written consent of J.P. Morgan. #$J&098$#*P

47
Australia Equity Research 13 January 2015
J.P. Morgan Australasia Research Responsibilities
Rob Stanton, Head of Research (61-2) 9003 8638
Banks
Healthcare Scott Manning (61-2) 9003 8643 [email protected]
Steven Wheen (61-2) 9003 8627 [email protected]
James Nicholias (61-2) 9003 8644 [email protected]
Anasuya Ramesh (61-2) 9003 8626 [email protected]
Bharat Anand (61-2) 90038642 [email protected]
REITs
Insurance
Richard Jones (61-3) 9633 4038 [email protected]
Siddharth Parameswaran (61-2) 9003 8629 [email protected]
Rob Stanton (61-2) 9003 8638 [email protected]
Ismar Tuzovic (61-2) 9003 8624 [email protected]
Scott Molloy (61-2) 9003 8635 [email protected]
Diversified Financials Ismar Tuzovic (61-2) 9003 8624 ismar.tuzovic @jpmorgan.com
Emerging Companies
Siddharth Parameswaran (61-2) 9003 8629 siddharth.x.parameswaran @jpmorgan.com
Russell Gill (61-2) 9003 8625 [email protected]
Russell Gill (61-2) 9003 8625 [email protected]
Garry Sherriff (61-2) 9003 8621 [email protected]
Armina Soemino (61-2) 9003 8620 [email protected]
Media Jarrod McDonald (61-2) 9003 8604 [email protected]
Resources
Thomas Beadle (61-2) 9003 8603 [email protected]
Lyndon Fagan (61-2) 9003 8648 [email protected]
Mark Busuttil (61-2) 9003 8619 [email protected]
Telecommunications
Andrew Muir (61-2) 9003 8617 [email protected]
Paul Brunker (61-2) 9003 8641 [email protected]
Joseph Kim (61-2) 9003 8615 [email protected]
Thomas Beadle (61-2) 9003 8603 [email protected]
Luke Nelson (61-2) 9003 8618 [email protected]
Transport Scott Carroll (61-2) 9003 8610 scott.j.carroll @jpmorgan.com
Energy
Megan Freeman (61-2) 9003 8633 [email protected]
Ben Wilson (61-2) 9003 8612 [email protected]
Daniel Butcher (61-2) 9003 8611 [email protected]
Beverages & Food, Paper & Packaging, Chemicals
Stuart Jackson (61-2) 9003 8631 [email protected] Richard Szabo (61-2) 9003 8630 [email protected]
Strategy
Gaming
Paul Brunker (61-2) 9003 8641 [email protected]
Matt Ryan (61-2) 9003 8634 [email protected]
Cheryl Ng (61-2) 9003 8640 [email protected]
William Loh (61-2) 9003 8633 [email protected]
Retail
Economics Shaun Cousins (61-2) 9003 8623 [email protected]
Stephen Walters (61-2) 9003 7980 [email protected]
Uma Joshi (61-2) 9003 8628 [email protected]
Tom Kennedy (61-2) 9003 7981 [email protected]
Ben Jarman (61-2) 9003 7982 [email protected]
Infrastructure Carolyn Holmes (61-2) 9003 8647 [email protected]
Megan Freeman (61-2) 9003 8633 [email protected]
Quantitative & ESG
Berowne Hlavaty (61-2) 9003 8602 [email protected]
Utilities & Building Materials
James Eustace (61-2) 9003 8601 [email protected]
Jason Steed (61-2) 9003 8609 jason.h.steed @jpmorgan.com Chris Laybutt (61-2) 9003 8608 [email protected]
ESG Keith Chau (61-2) 9003 8607 [email protected]
Carolyn Holmes (61-2) 9003 8647 [email protected]
Megan Freeman (61-2) 9003 8633 [email protected]
Property Developers & Contractors Anthony Passe-De Silva (61-2) 9003 8614 [email protected]
Database William Loh (61-2) 9003 8613 [email protected]
Stephen Blagg (61-2) 9220 1584 [email protected]

48
Australia Equity Research 13 January 2015
2014 J.P. Morgan Taylor Fry General Insurance Barometer Direct Underwriters, Reinsurers and Brokers