2014 - jsa.com.pkjsa.com.pk/pdf/banking-survey-2014.pdfbanking survey 2014 . ... we have tried to...
TRANSCRIPT
BANKING SURVEY
2014
Prepared by Junaidy Shoaib Asad Chartered Accountant

Banking Survey 2014
Junaidy Shoaib Asad Chartered Accountants
2
Table of Contents
Purpose of the survey .................................................................................................................................................................. 4
Structure of the survey ................................................................................................................................................................ 4
About Us ...................................................................................................................................................................................... 5
Liability Disclaimer ....................................................................................................................................................................... 5
Banking Activities ......................................................................................................................................................................... 9
Income Streams ........................................................................................................................................................................ 9
Expenses ................................................................................................................................................................................. 19
Profitability ............................................................................................................................................................................. 25
Value Addition ........................................................................................................................................................................ 29
Gross Advances ....................................................................................................................................................................... 32
Non-Performing Assets ........................................................................................................................................................... 35
Non-Performing Advances and Corresponding Provisions ...................................................................................................... 38
Banking Liabilities: Deposits ....................................................................................................................................................... 44
Deposits .................................................................................................................................................................................. 44
Deposits Composition ............................................................................................................................................................. 45
Growth in Deposits ................................................................................................................................................................. 47
Current and Savings Deposits ................................................................................................................................................. 52

Banking Survey 2014
Junaidy Shoaib Asad Chartered Accountants
3
Ratio Analysis ............................................................................................................................................................................. 54
Advance to Deposit Ratio ........................................................................................................................................................ 54
Capital Adequacy Ratio ........................................................................................................................................................... 58
Earnings per Share (After Tax) ................................................................................................................................................ 60
Asset Quality: Non-Performing Assets over Performing Assets ............................................................................................... 62
Mark-up Spread ...................................................................................................................................................................... 65
Other Banking Ratios .............................................................................................................................................................. 67
Credit Rating .............................................................................................................................................................................. 87
Glossary ..................................................................................................................................................................................... 89
Banking Survey 2014
Junaidy Shoaib Asad Chartered Accountants
4
Purpose of the survey
The purpose of this survey is to summarize the financial performance of the banking industry of Pakistan during the year 2014 and comparing the performance of different banks when compared with the year 2013. For this intended purpose, the banking sector is divided into following three categories, namely:
• Private Banks • Public Sector Banks • Islamic Banks
There are other classifications of the banking sector as well, but the selected categories provide the major insight into each sector. The information contained in this survey has been obtained from the published consolidated financial statements of the banks, statistical bulletins and quarterly / annual reports published by State Bank of Pakistan (“SBP”), analysts and research reports and information published in business magazines and newspapers.
To enhance the understanding of ratios and analysis of performance of a particular bank, reference should be made to the published financial statements of the banks and glossary included at the end of this survey. We have tried to provide relevant financial analysis of banks, which we thought would be useful for benchmarking and comparison purposes.
Structure of the survey
As mentioned earlier, the banking industry is broken into three sectors. These three sectors are evaluated under perspectives of Profitability, Asset Allocation and Liability. Under these perspectives, the banks are individually analyzed and compared with their peers. The Profitability perspective analysis the revenue streams of the banks with stress on mark-up income and non-mark-up income. While under the Assets Allocation perspective, the performing and non-performing assets are discussed on the basis of available information. The survey then discusses the liabilities of the respective banks with a focus on the composition and growth in deposits. At the end of this survey, some significant ratios are calculated for each bank and discussed in detail with the aim of highlighting the respective banks’ performance. A detailed list of banks operating in Pakistan is presented on the pg. 5.

Banking Survey 2014
Junaidy Shoaib Asad Chartered Accountants
5
We feel that the performance could be analyzed in more detail however given the availability of limited information and time we have restrained the survey to the analysis as desired in this survey. We would however encourage readers to provide further insight for making the survey more meaningful and useful for banking regulators, banking sector and deposit holders. You can email your suggestion to [email protected]
About Us
The firm was established in 2007 and represent Morison International as its member in Pakistan.
The firm is delivering value added prompt professional services to its valued clients with strong professional team lead by its Partners and qualified staff through its offices in Karachi, Lahore and Islamabad.
Over the last nine years that the firm is operating, it has made its presence felt in the market and has built strong reputation as providers of quality services with almost respect for the Ethical & Moral Standards. The list of our clients to whom we provide professional services include Non Banking Financial Institutions, Public and Private Limited Companies operating in manufacturing, service and trading sectors.
JSA provides industry-focused services to its clients in order to build public trust and enhance value through the application of what we call Linked Ideas. Our service culture combined with our cumulative knowledge culminates into innovative solutions to help promote the growth of our client’s business. Before rendering innovative advice we minutely ensure that all the legal and ethical obligations are respected. This is what we call Innovative Solutions.
In brief our firm is in the profession of audit, accountancy, taxation, corporate finance and corporate advisory services which include professional services on other related laws like competition law, Foreign Exchange Regulations, etc.
Liability Disclaimer
Junaidy Shoaib Asad, Chartered Accountants makes no warranties or representations about this survey or any of its content. We are not responsible for any direct, indirect or consequential loss suffered in connection with the use of this survey. We exclude, to the extent permitted by law, any liability which may arise as a result of use of this survey.

Banking Survey 2014
Junaidy Shoaib Asad Chartered Accountants
6
By using this survey on the Banking Industry of Pakistan, you agree to indemnify us for any loss or liability arising out of your use of this survey. This material is produced by Junaidy Shoaib Asad, Chartered Accountants under the voluntary capacity and is based on public information.
It is intended to provide general information in summary form on banking industry performance for the year 2013 and 2014. The contents do not constitute advice and should not be relied upon as such. However, formal advice may be sought in particular matters, if considered necessary.
To the extent possible we have avoided expressing opinion on the performance of banking companies analyzed in this survey. However if any analyses is purported to constitute our opinion the same could only be inadvertent.
We have also endeavored to carry out the analysis on uniform criterion which we consider necessary for establishing benchmarking criteria. Readers are therefore encouraged to enlighten us if they feel some additional criterion or further refinement in the criterion used is necessitated.
Date: April 2015 Karachi

Banking Survey 2014
Junaidy Shoaib Asad Chartered Accountants
7
PRIVATE SECTOR BANKS
PUBLIC SECTOR BANKS
1- National Bank of Pakistan (NBP);
2- Sindh Bank Limited;
3- First Women Bank Limited (FWBL);
4- The Bank of Punjab(BOP); and
5- The Bank of Khyber (BOK)
1- Allied Bank Limited (ABL);
2- Askari Bank Limited;
3- Bank Alfalah Limited (BAF);
4- Bank Al Habib Limited (BAH);
5- Faysal Bank Limited;
6- Habib Bank Limited (HBL);
7- Habib Metropolitan Bank Limited (HMB);
8- JS Bank Limited;
9- KASB Bank Limited;
10- MCB Bank Limited;
11- NIB Bank Limited;
12- SAMBA Bank Limited;
13- SILK Bank Limited
14- Soneri Bank Limited;
15- Standard Chartered Bank (Pakistan) Limited (SCB);
16- Summit Bank Limited; and
17- United Bank Limited (UBL)
ISLAMIC BANKS
1- AlBaraka Bank (Pakistan) Limited (AB);
2- BankIslami Pakistan Limited (BI);
3- Burj Bank Limited;
4- Dubai Islamic Bank Pakistan Limited (DIB);
5- Meezan Bank Limited (MB)
FOREIGN BANKS
1- Barclays Bank PLC;
2- Citibank N.A.- Pakistan Operations;
3- HSBC Bank – Pakistan Operations;
4- Industrial and Commercial Bank of China Limited – Pakistan Branches; and
5- The Bank of Tokyo-Mitsubishi UFJ Limited – Pakistan Operations
MICROFINANCE BANKS
1- Khushhali Bank Limited;
2- APNA Microfinance Bank Limited;
3- NRSP Microfinance Bank Limited;
4- Pak Oman Microfinance Bank Limited;
5- Tameer Microfinance Bank Limited;
6- Waseela Microfinance Bank Limited; and
7- ADVANS Pakistan Microfinance Bank Limited

BANKING ACTIVITIES
Banking Survey 2014
Junaidy Shoaib Asad Chartered Accountants
9
Banking Activities
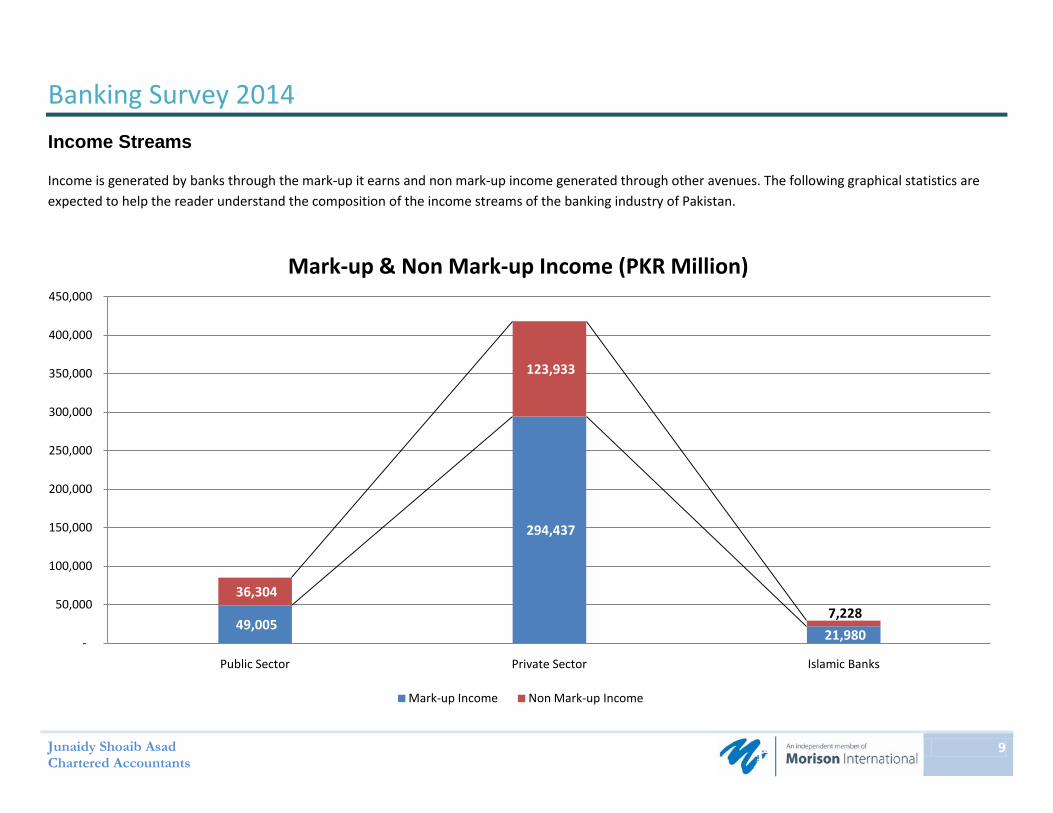
Income Streams
Income is generated by banks through the mark-up it earns and non mark-up income generated through other avenues. The following graphical statistics are expected to help the reader understand the composition of the income streams of the banking industry of Pakistan.
49,005
294,437
21,980
36,304
123,933
7,228
-
50,000
100,000
150,000
200,000
250,000
300,000
350,000
400,000
450,000
Public Sector Private Sector Islamic Banks
Mark-up & Non Mark-up Income (PKR Million)
Mark-up Income Non Mark-up Income

Banking Survey 2014
Junaidy Shoaib Asad Chartered Accountants
10
0%
10%
20%
30%
40%
50%
60%
70%
80%
90%
100%
FWBL NBP Sindh BOK BOP
37
34,4
50
3,41
4
3,30
6
7,79
8
83
31,3
99
956
1,06
6
2,80
0
Public Sector: Income Compsition (PKR Million)
Mark-Up Income Non Mark-up Income

Banking Survey 2014
Junaidy Shoaib Asad Chartered Accountants
11
0%
10%
20%
30%
40%
50%
60%
70%
80%
90%
100%
ABL HBL MCB UBL Askari BAF BAH FAYSAL HMB JS NIB SAMBA SILK SONERI SCB SUMMIT
26,9
18
67,3
08
45,0
14
45,3
01
11,5
41
19,9
45
18,5
07
11,5
61
9,13
2
3,62
4
2,15
9
1,85
7
3,13
1
5,69
6
20,9
12
1,83
1
13,1
85
23,5
13
14,3
34
21,3
56
5,52
6
9,03
6 3,94
9
4,37
4
5,76
6
3,57
7
4,12
9
218
1,72
0
2,64
5
7,40
0
3,20
5
Private Sector: Income Compsition (PKR Million)
Mark-up Income Non Mark-Up Income

Banking Survey 2014
Junaidy Shoaib Asad Chartered Accountants
12
0%
10%
20%
30%
40%
50%
60%
70%
80%
90%
100%
AlBaraka Islami DIB Meezan
726
631 1,11
7
4,75
4
2,06
6
3,31
3
3,80
1
12,8
00
Islamic Banks: Income Compsition (PKR Million)
Non Mark-Up Income Mark-up Income

Banking Survey 2014
Junaidy Shoaib Asad Chartered Accountants
13
0% 10% 20% 30% 40% 50% 60% 70% 80% 90% 100%
BOK
BOP
FWBL
NBP
Sindh
0
14,761,929
978,390
4,170,261
0
36,523
22,195
621,258
5,266,354
12,105,586
453,565
33,251,478
3,675,290
160,678
1,365,808
332,036
9,947,062
708,600
3,312,174
68,623,830
126,795
Mark-up Income Composition: Public Banks (PKR Million)
on loans & advances from customers on loans & advances from financial institutions on investments in securities available for sale
on investments in securities held to maturity on investments in securities held for trading on deposits with financial institutions
on securities purchased under resale agreement Others
Banking Survey 2014
Junaidy Shoaib Asad Chartered Accountants
14
0% 10% 20% 30% 40% 50% 60% 70% 80% 90% 100%
ABL
Askari
BAF
BAH
Faysal
HBL
HMBL
JS Bank
MCB
NIB
Samba
Silk
Soneri
SCB
Summit
UBL
30,044,307
17,653,400
27,497,999
15,090,563
21,041,398
52,890,270
11,157,916
4,957,184
28,921,508
9,215,769
1,981,172
7,834,980
9,706,279
15,473,675
5,855,532
37,157,993
19,925,295
15,777,191
17,826,937
16,446,465
8,645,104
64,785,406
17,756,220
4,033,390
47,052,221
4,719,368
881,739
1,327,841
6,235,462
17,591,049
3,588,239
28,102,249
16,009,049
120,918
6,219,695
11,970,285
1,643,252
8,227,545
2,470,273
781,608
36,078
1,016,155
0
346,974
0
195,594
16,990,543
84,839
0
992,063
1,472,409
254,428
121,306
301,894
1,598,121
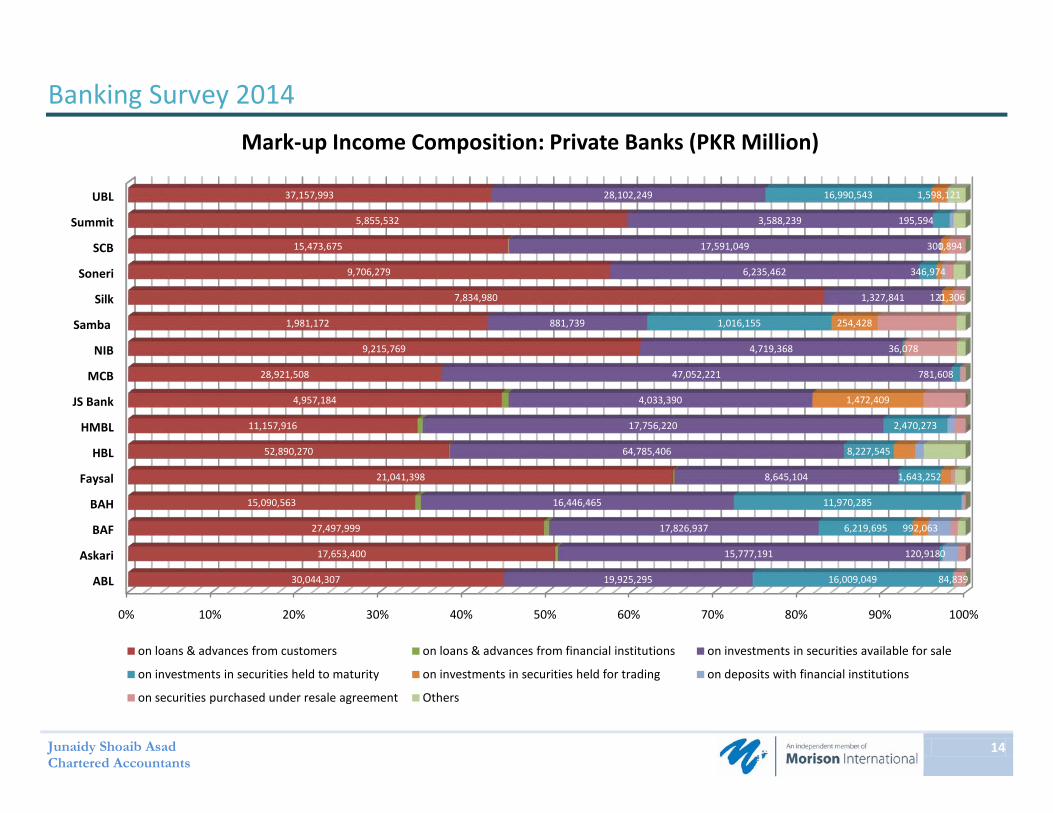
Mark-up Income Composition: Private Banks (PKR Million)
on loans & advances from customers on loans & advances from financial institutions on investments in securities available for sale
on investments in securities held to maturity on investments in securities held for trading on deposits with financial institutions
on securities purchased under resale agreement Others
Banking Survey 2014
Junaidy Shoaib Asad Chartered Accountants
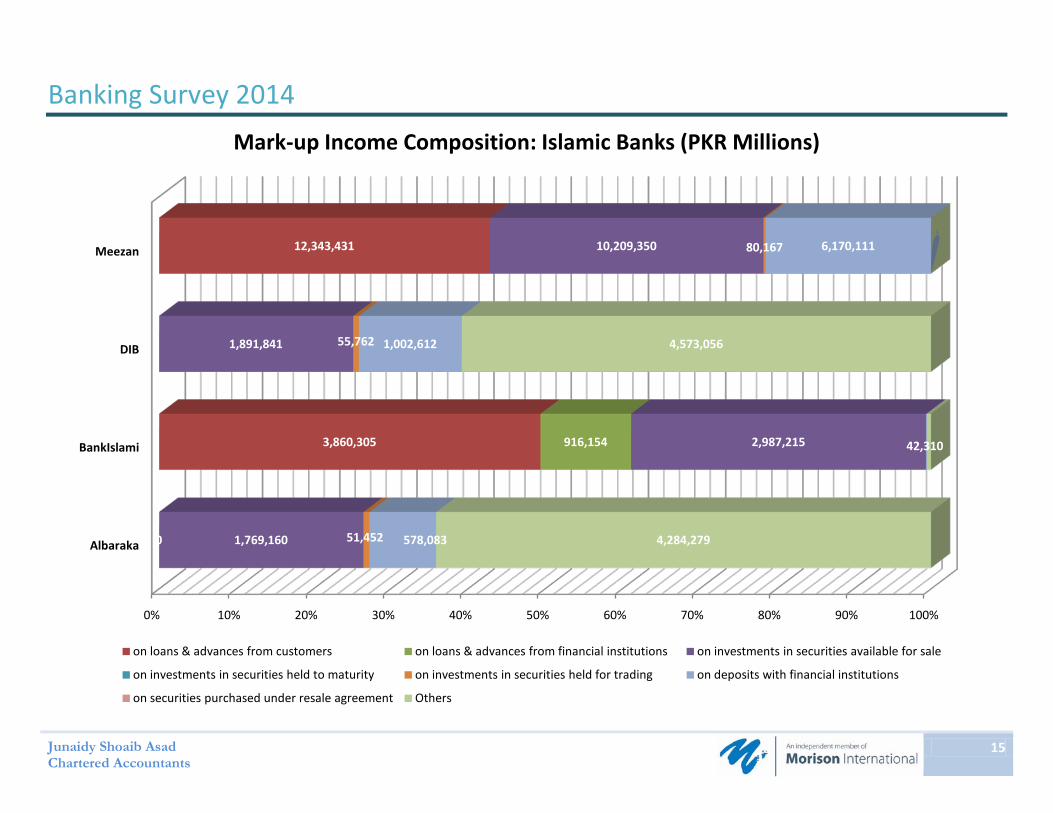
15
0% 10% 20% 30% 40% 50% 60% 70% 80% 90% 100%
Albaraka
BankIslami
DIB
Meezan
3,860,305
12,343,431
0
916,154
1,769,160
2,987,215
1,891,841
10,209,350
51,452
55,762
80,167
578,083
1,002,612
6,170,111
4,284,279
42,310
4,573,056
Mark-up Income Composition: Islamic Banks (PKR Millions)
on loans & advances from customers on loans & advances from financial institutions on investments in securities available for sale
on investments in securities held to maturity on investments in securities held for trading on deposits with financial institutions
on securities purchased under resale agreement Others

Banking Survey 2014
Junaidy Shoaib Asad Chartered Accountants
16
0% 10% 20% 30% 40% 50% 60% 70% 80% 90% 100%
BOK
BOP
FWBL
NBP
Sindh
233,055
909,596
34,676
12,931,130
184,366
83,629
39,918
9,241
2,076,669
180,603
179,002
183,830
10,986
4,735,988
66,217
469,586
667,322
6,938
8,660,224
521,365
70,836
1,000,173
20,943
3,608,540
3,914
Non Mark-up Income Composition: Public Banks (PKR Million)
Fee, commission and brokerage income Dividend income Income from dealing in foreign currencies Gain on sale of securities Other Income
Banking Survey 2014
Junaidy Shoaib Asad Chartered Accountants
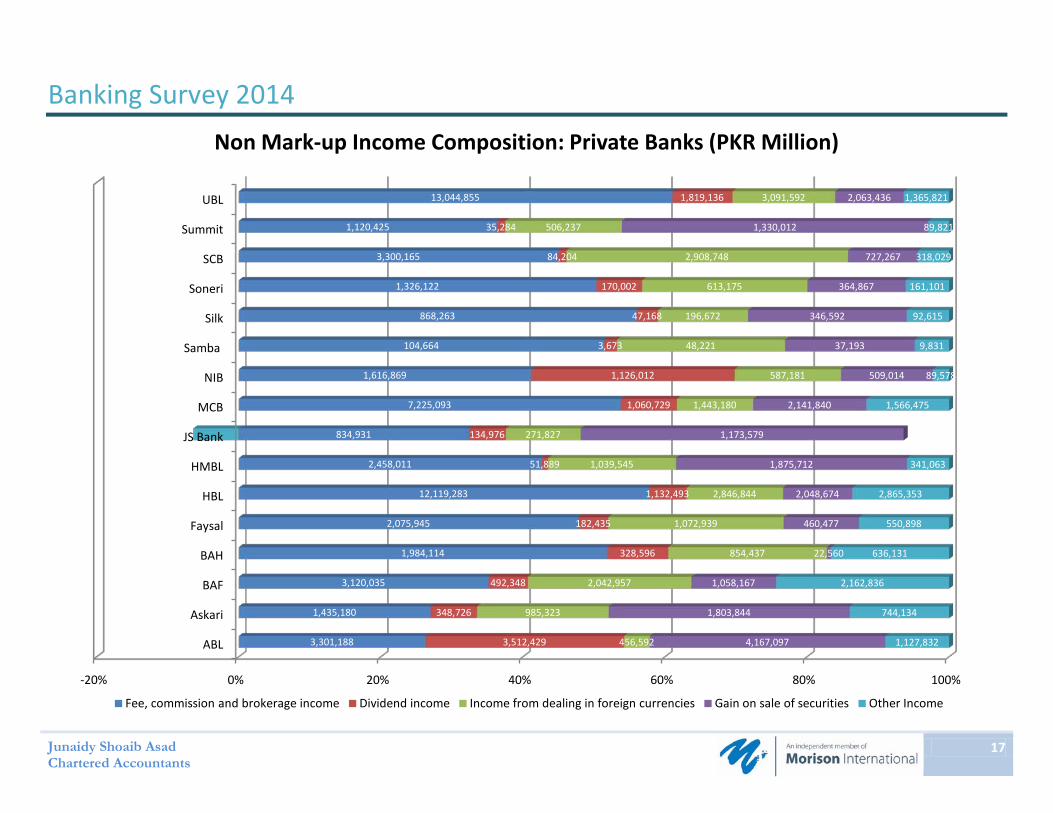
17
-20% 0% 20% 40% 60% 80% 100%
ABL
Askari
BAF
BAH
Faysal
HBL
HMBL
JS Bank
MCB
NIB
Samba
Silk
Soneri
SCB
Summit
UBL
3,301,188
1,435,180
3,120,035
1,984,114
2,075,945
12,119,283
2,458,011
834,931
7,225,093
1,616,869
104,664
868,263
1,326,122
3,300,165
1,120,425
13,044,855
3,512,429
348,726
492,348
328,596
182,435
1,132,493
51,889
134,976
1,060,729
1,126,012
3,673
47,168
170,002
84,204
35,284
1,819,136
456,592
985,323
2,042,957
854,437
1,072,939
2,846,844
1,039,545
271,827
1,443,180
587,181
48,221
196,672
613,175
2,908,748
506,237
3,091,592
4,167,097
1,803,844
1,058,167
22,560
460,477
2,048,674
1,875,712
1,173,579
2,141,840
509,014
37,193
346,592
364,867
727,267
1,330,012
2,063,436
1,127,832
744,134
2,162,836
636,131
550,898
2,865,353
341,063
1,566,475
89,578
9,831
92,615
161,101
318,029
89,821
1,365,821
Non Mark-up Income Composition: Private Banks (PKR Million)
Fee, commission and brokerage income Dividend income Income from dealing in foreign currencies Gain on sale of securities Other Income

Banking Survey 2014
Junaidy Shoaib Asad Chartered Accountants
18
0% 10% 20% 30% 40% 50% 60% 70% 80% 90% 100%
Albaraka
BankIslami
DIB
Meezan
401,845
387,333
806,451
1,569,327
7,862
283,633
194,963
172,356
122,501
1,626,363
135,759
32,173
197,190
1,148,499
5,242
40,074
309
127,062
Non Mark-up Income Composition: Islamic Banks (PKR Million)
Fee, commission and brokerage income Dividend income Income from dealing in foreign currencies Gain on sale of securities Other Income

Banking Survey 2014
Junaidy Shoaib Asad Chartered Accountants
19
Expenses
The following graphical statistics are expected to be helpful in understanding the respective composition of the administrative expenses of the banks from the three sectors under survey.
0%
10%
20%
30%
40%
50%
60%
70%
80%
90%
100%
BOK BOP FWBL NBP Sindh Bank
1,309,858 3,214,300 375,00223,412,089
1,221,050
343,037406,003 120,766
2,723,267554,195
443,5882,073,892
154,423 10,873,895 626,933
Admin Expenses Composition: Public Banks (PKR Million)
Salaries Rents, Taxes, Insurance and Electricity Legal & Professional Charges
Communications Repairs & Maintenance Stationary & Printing
Advertisment & Publicity Auditor's Remuneration Travelling & Entertainment
Donation Others
Banking Survey 2014
Junaidy Shoaib Asad Chartered Accountants
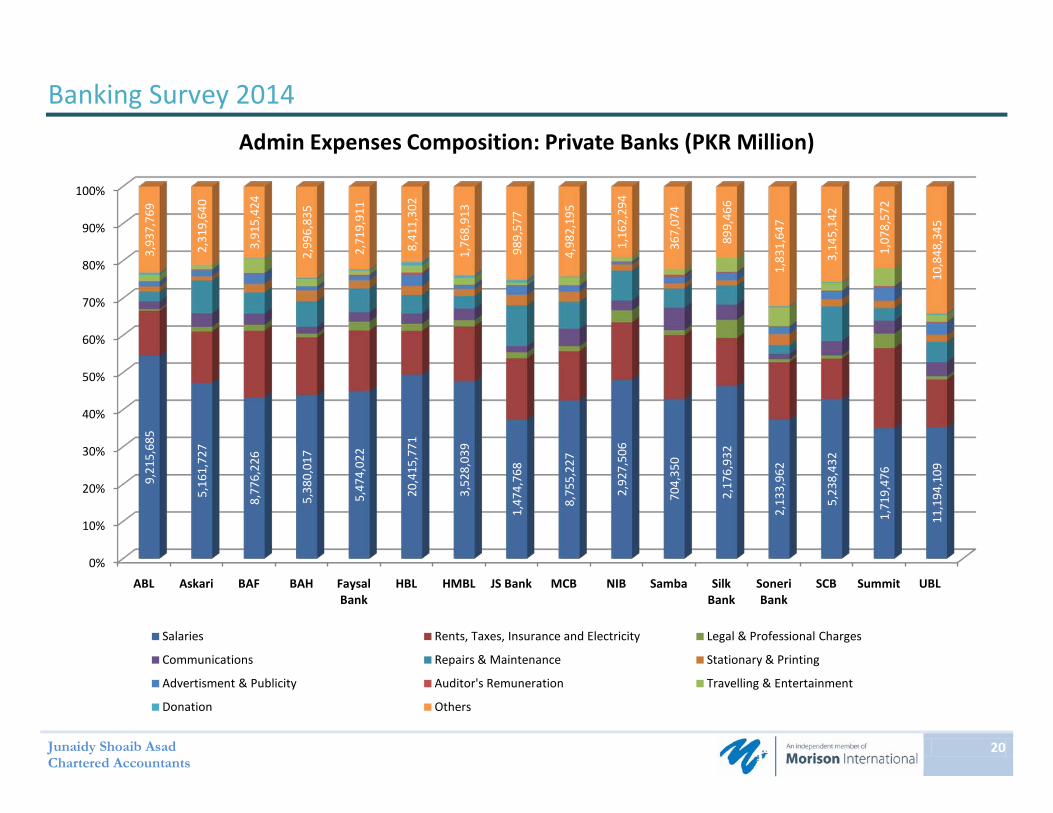
20
0%
10%
20%
30%
40%
50%
60%
70%
80%
90%
100%
ABL Askari BAF BAH Faysal Bank
HBL HMBL JS Bank MCB NIB Samba Silk Bank
Soneri Bank
SCB Summit UBL
9,21
5,68
5
5,16
1,72
7
8,77
6,22
6
5,38
0,01
7
5,47
4,02
2
20,4
15,7
71
3,52
8,03
9
1,47
4,76
8
8,75
5,22
7
2,92
7,50
6
704,
350
2,17
6,93
2
2,13
3,96
2
5,23
8,43
2
1,71
9,47
6
11,1
94,1
09
3,93
7,76
9
2,31
9,64
0
3,91
5,42
4
2,99
6,83
5
2,71
9,91
1
8,41
1,30
2
1,76
8,91
3
989,
577
4,98
2,19
5
1,16
2,29
4
367,
074
899,
466
1,83
1,64
7
3,14
5,14
2
1,07
8,57
2
10,8
48,3
45
Admin Expenses Composition: Private Banks (PKR Million)
Salaries Rents, Taxes, Insurance and Electricity Legal & Professional Charges
Communications Repairs & Maintenance Stationary & Printing
Advertisment & Publicity Auditor's Remuneration Travelling & Entertainment
Donation Others
Banking Survey 2014
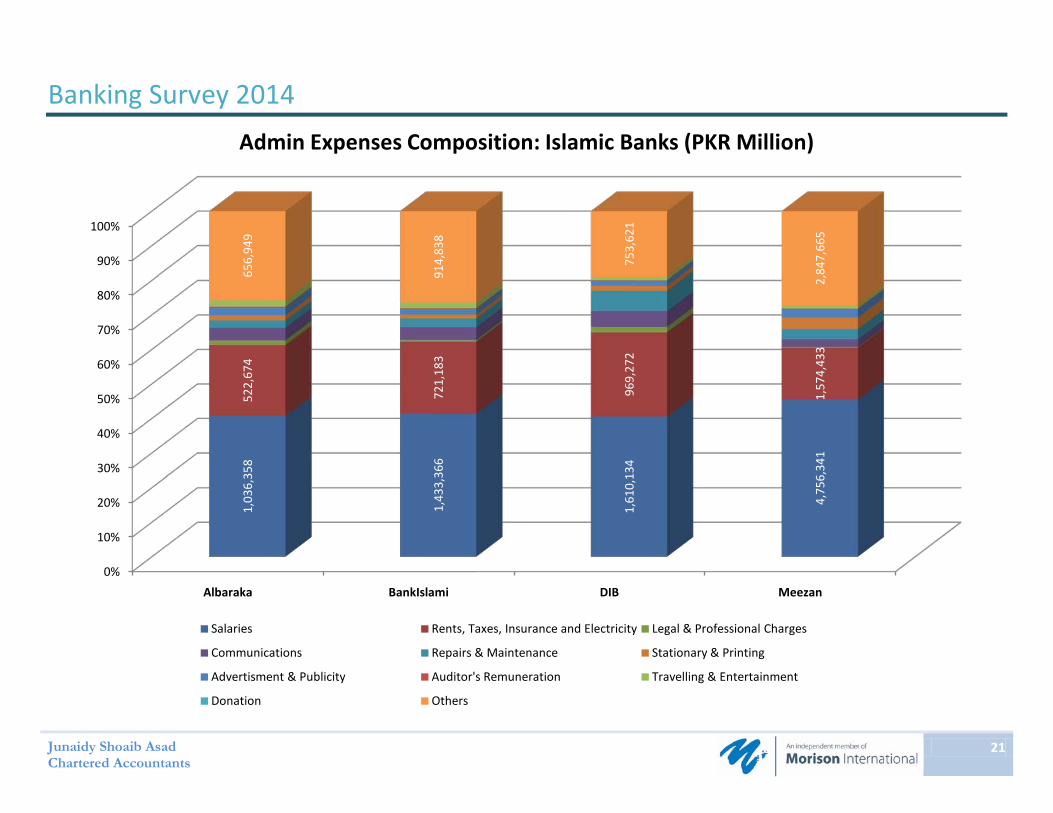
Junaidy Shoaib Asad Chartered Accountants
21
0%
10%
20%
30%
40%
50%
60%
70%
80%
90%
100%
Albaraka BankIslami DIB Meezan
1,03
6,35
8
1,43
3,36
6
1,61
0,13
4
4,75
6,34
1
522,
674
721,
183
969,
272
1,57
4,43
3
656,
949
914,
838
753,
621
2,84
7,66
5
Admin Expenses Composition: Islamic Banks (PKR Million)
Salaries Rents, Taxes, Insurance and Electricity Legal & Professional Charges
Communications Repairs & Maintenance Stationary & Printing
Advertisment & Publicity Auditor's Remuneration Travelling & Entertainment
Donation Others
Banking Survey 2014
Junaidy Shoaib Asad Chartered Accountants
22
0%
10%
20%
30%
40%
50%
60%
70%
80%
90%
100%
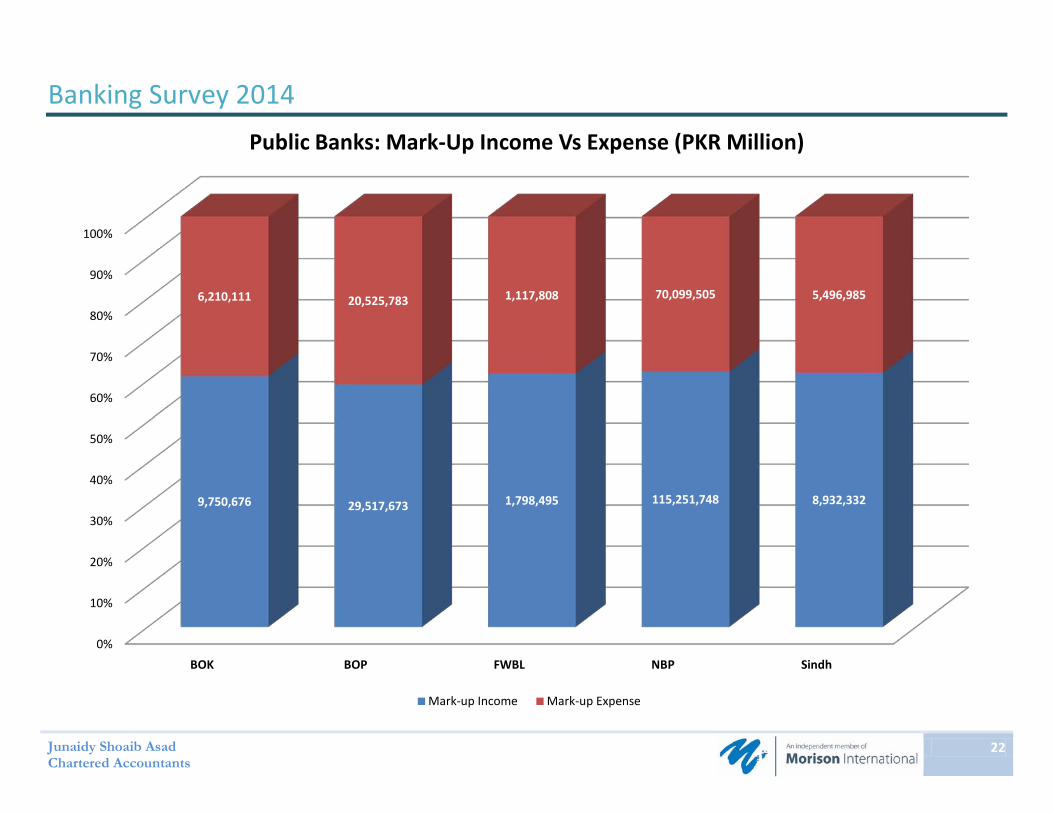
BOK BOP FWBL NBP Sindh
9,750,676 29,517,673 1,798,495 115,251,748 8,932,332
6,210,111 20,525,783 1,117,808 70,099,505 5,496,985
Public Banks: Mark-Up Income Vs Expense (PKR Million)
Mark-up Income Mark-up Expense
Banking Survey 2014
Junaidy Shoaib Asad Chartered Accountants
23
0%
10%
20%
30%
40%
50%
60%
70%
80%
90%
100%
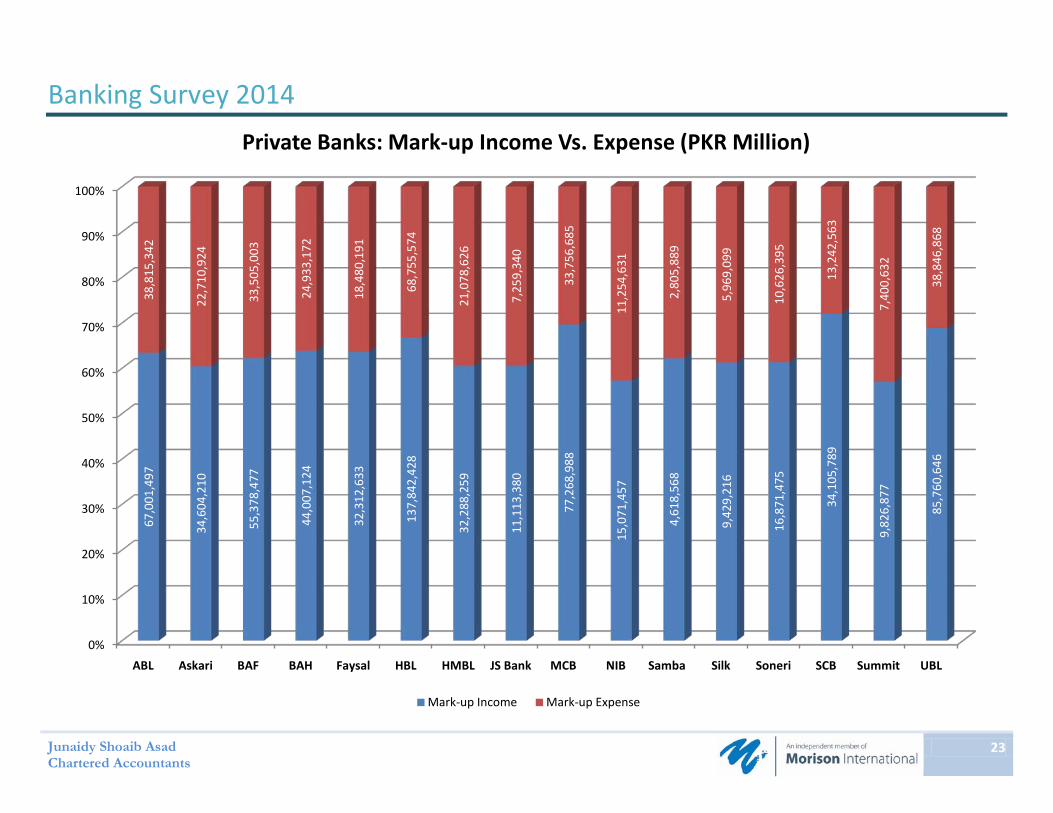
ABL Askari BAF BAH Faysal HBL HMBL JS Bank MCB NIB Samba Silk Soneri SCB Summit UBL
67,0
01,4
97
34,6
04,2
10
55,3
78,4
77
44,0
07,1
24
32,3
12,6
33
137,
842,
428
32,2
88,2
59
11,1
13,3
80
77,2
68,9
88
15,0
71,4
57
4,61
8,56
8
9,42
9,21
6
16,8
71,4
75
34,1
05,7
89
9,82
6,87
7
85,7
60,6
46
38,8
15,3
42
22,7
10,9
24
33,5
05,0
03
24,9
33,1
72
18,4
80,1
91
68,7
55,5
74
21,0
78,6
26
7,25
9,34
0
33,7
56,6
85
11,2
54,6
31
2,80
5,88
9
5,96
9,09
9
10,6
26,3
95
13,2
42,5
63
7,40
0,63
2
38,8
46,8
68
Private Banks: Mark-up Income Vs. Expense (PKR Million)
Mark-up Income Mark-up Expense

Banking Survey 2014
Junaidy Shoaib Asad Chartered Accountants
24
0%
10%
20%
30%
40%
50%
60%
70%
80%
90%
100%
Albaraka BankIslami DIB Meezan
6,68
2,97
4
7,81
2,30
2
7,52
3,27
1
28,8
03,0
59
4,51
3,25
0
4,45
9,07
0
3,43
3,96
9
15,4
40,2
50
Islamic Banks: Mark-Up Earned over Expensed (PKR Million)
Interest Earned Interest Expensed
Banking Survey 2014
Junaidy Shoaib Asad Chartered Accountants
25
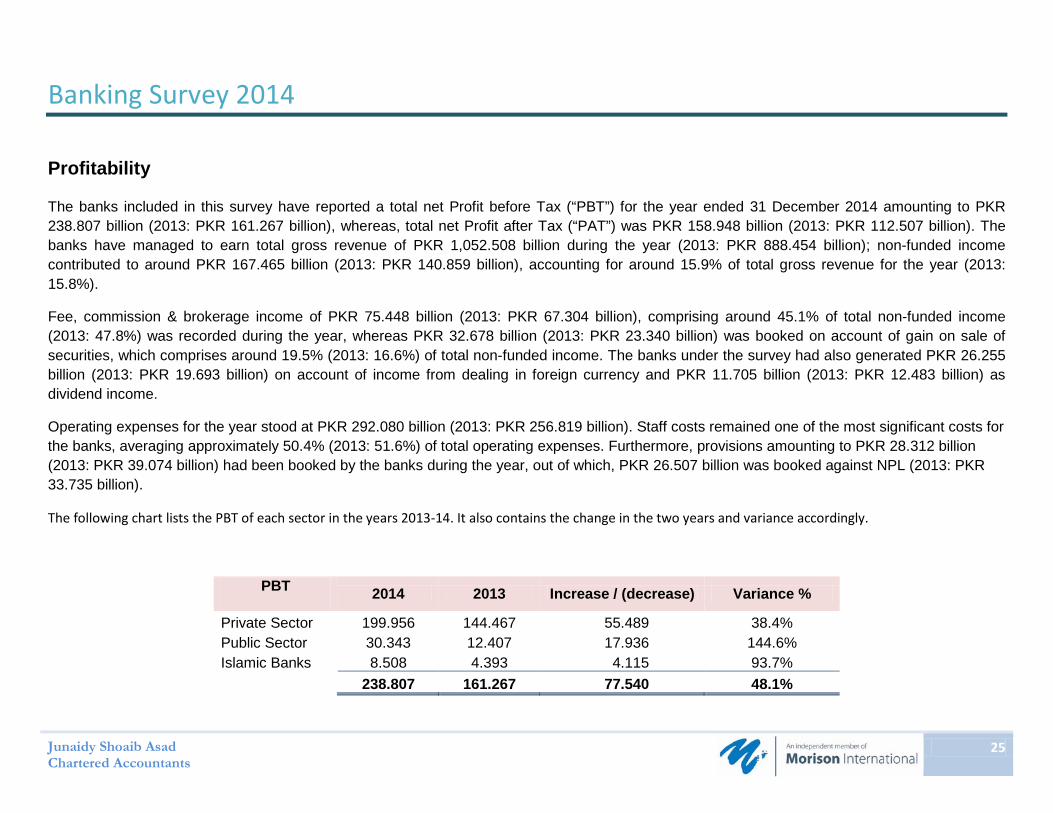
Profitability
The banks included in this survey have reported a total net Profit before Tax (“PBT”) for the year ended 31 December 2014 amounting to PKR 238.807 billion (2013: PKR 161.267 billion), whereas, total net Profit after Tax (“PAT”) was PKR 158.948 billion (2013: PKR 112.507 billion). The banks have managed to earn total gross revenue of PKR 1,052.508 billion during the year (2013: PKR 888.454 billion); non-funded income contributed to around PKR 167.465 billion (2013: PKR 140.859 billion), accounting for around 15.9% of total gross revenue for the year (2013: 15.8%).
Fee, commission & brokerage income of PKR 75.448 billion (2013: PKR 67.304 billion), comprising around 45.1% of total non-funded income (2013: 47.8%) was recorded during the year, whereas PKR 32.678 billion (2013: PKR 23.340 billion) was booked on account of gain on sale of securities, which comprises around 19.5% (2013: 16.6%) of total non-funded income. The banks under the survey had also generated PKR 26.255 billion (2013: PKR 19.693 billion) on account of income from dealing in foreign currency and PKR 11.705 billion (2013: PKR 12.483 billion) as dividend income.
Operating expenses for the year stood at PKR 292.080 billion (2013: PKR 256.819 billion). Staff costs remained one of the most significant costs for the banks, averaging approximately 50.4% (2013: 51.6%) of total operating expenses. Furthermore, provisions amounting to PKR 28.312 billion (2013: PKR 39.074 billion) had been booked by the banks during the year, out of which, PKR 26.507 billion was booked against NPL (2013: PKR 33.735 billion).
The following chart lists the PBT of each sector in the years 2013-14. It also contains the change in the two years and variance accordingly.
PBT 2014 2013 Increase / (decrease) Variance %
Private Sector 199.956 144.467 55.489 38.4% Public Sector 30.343 12.407 17.936 144.6% Islamic Banks 8.508 4.393 4.115 93.7%
238.807 161.267 77.540 48.1%
Banking Survey 2014
Junaidy Shoaib Asad Chartered Accountants
26
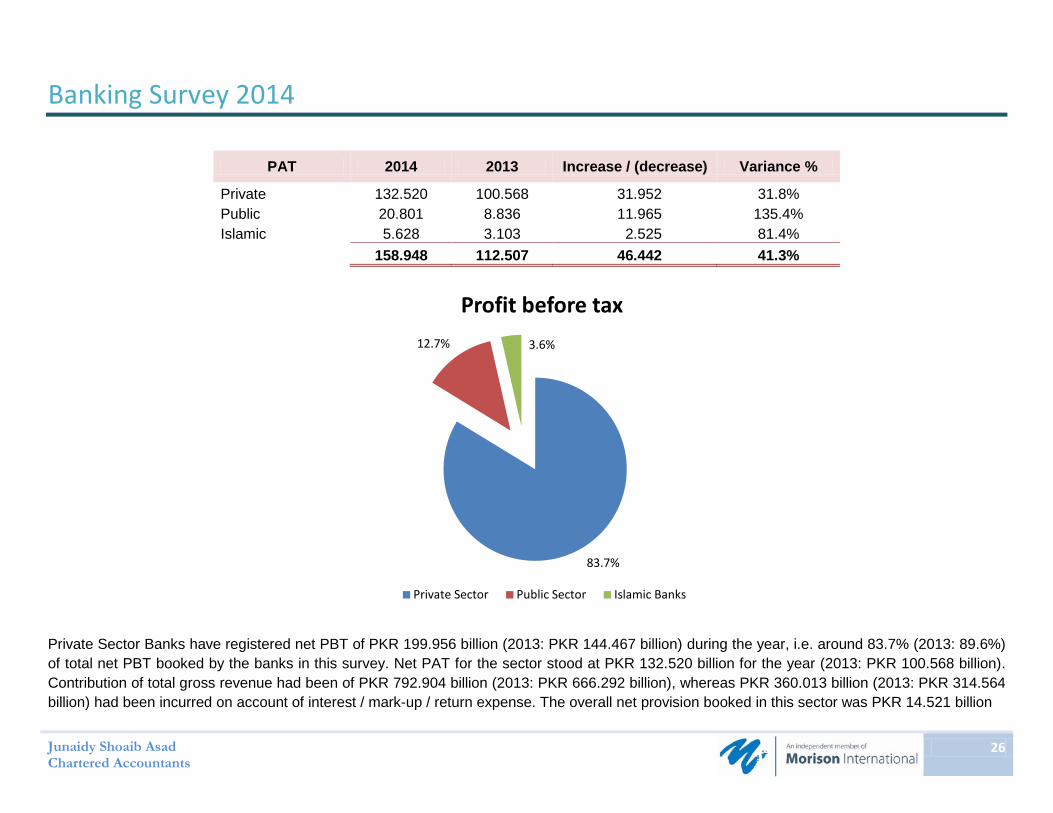
83.7%
12.7% 3.6%
Profit before tax
Private Sector Public Sector Islamic Banks
PAT 2014 2013 Increase / (decrease) Variance %
Private 132.520 100.568 31.952 31.8% Public 20.801 8.836 11.965 135.4% Islamic 5.628 3.103 2.525 81.4%
158.948 112.507 46.442 41.3%
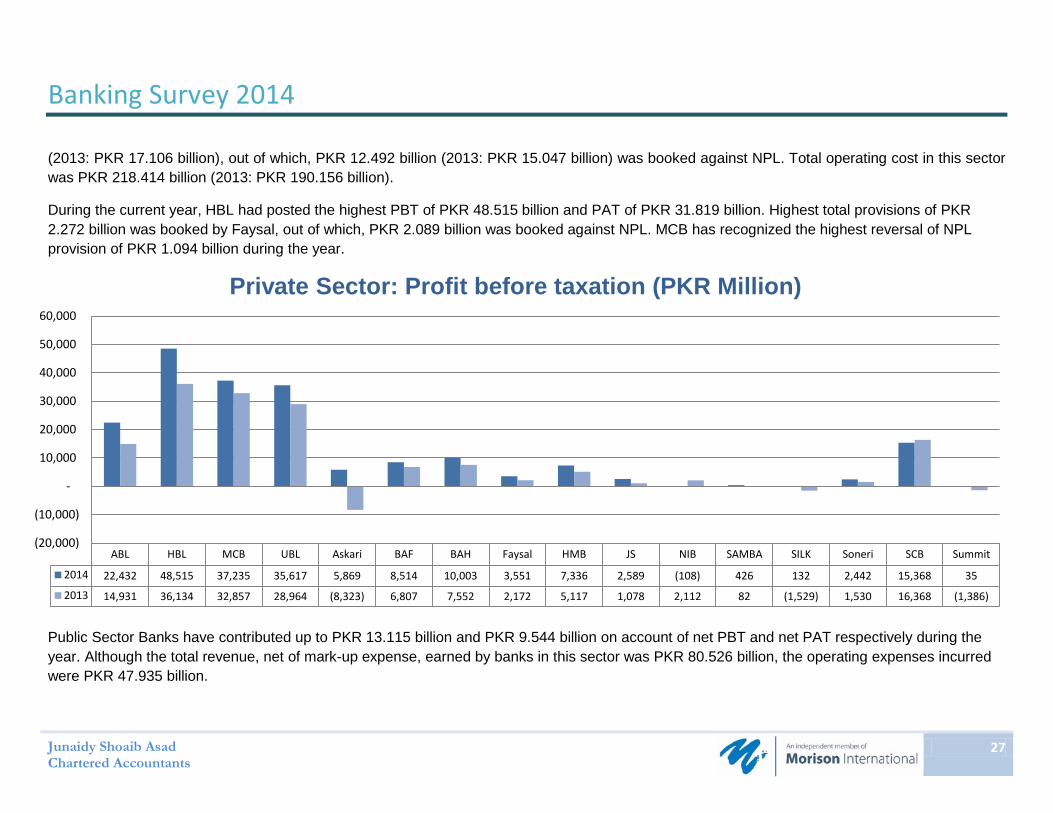
Private Sector Banks have registered net PBT of PKR 199.956 billion (2013: PKR 144.467 billion) during the year, i.e. around 83.7% (2013: 89.6%) of total net PBT booked by the banks in this survey. Net PAT for the sector stood at PKR 132.520 billion for the year (2013: PKR 100.568 billion). Contribution of total gross revenue had been of PKR 792.904 billion (2013: PKR 666.292 billion), whereas PKR 360.013 billion (2013: PKR 314.564 billion) had been incurred on account of interest / mark-up / return expense. The overall net provision booked in this sector was PKR 14.521 billion
Banking Survey 2014
Junaidy Shoaib Asad Chartered Accountants
27
ABL HBL MCB UBL Askari BAF BAH Faysal HMB JS NIB SAMBA SILK Soneri SCB Summit
2014 22,432 48,515 37,235 35,617 5,869 8,514 10,003 3,551 7,336 2,589 (108) 426 132 2,442 15,368 35
2013 14,931 36,134 32,857 28,964 (8,323) 6,807 7,552 2,172 5,117 1,078 2,112 82 (1,529) 1,530 16,368 (1,386)
(20,000)
(10,000)
-
10,000
20,000
30,000
40,000
50,000
60,000
Private Sector: Profit before taxation (PKR Million)
(2013: PKR 17.106 billion), out of which, PKR 12.492 billion (2013: PKR 15.047 billion) was booked against NPL. Total operating cost in this sector was PKR 218.414 billion (2013: PKR 190.156 billion).
During the current year, HBL had posted the highest PBT of PKR 48.515 billion and PAT of PKR 31.819 billion. Highest total provisions of PKR 2.272 billion was booked by Faysal, out of which, PKR 2.089 billion was booked against NPL. MCB has recognized the highest reversal of NPL provision of PKR 1.094 billion during the year.
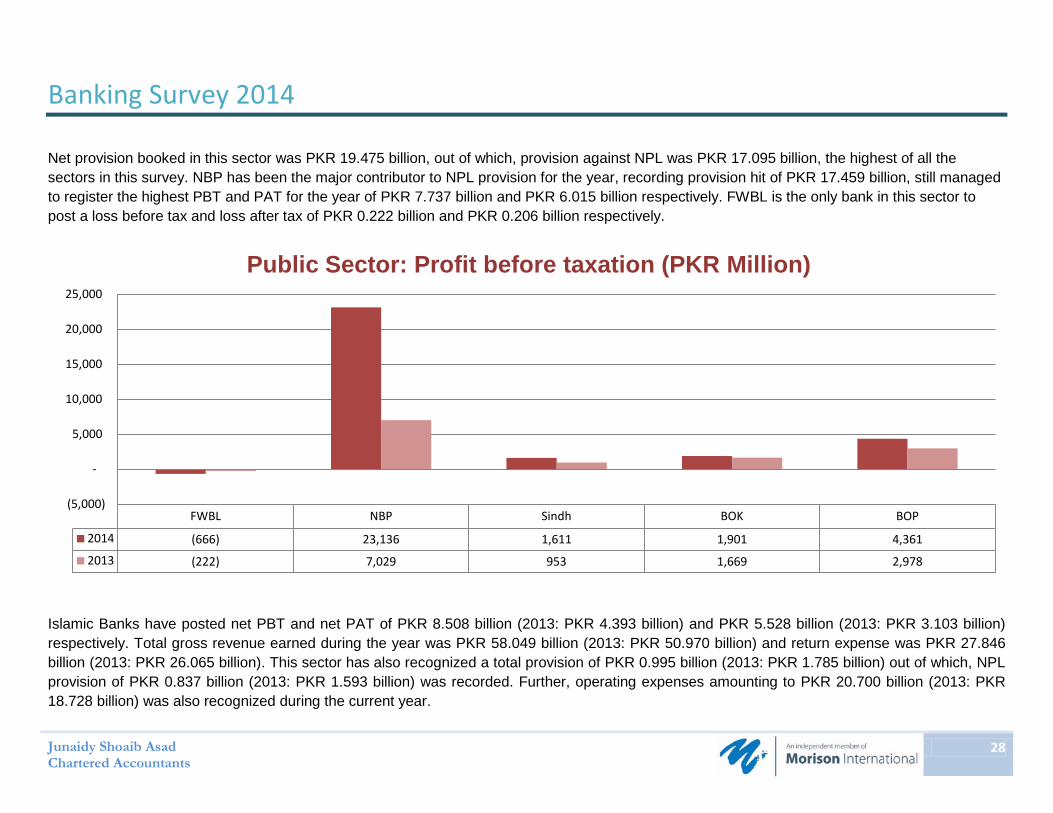
Public Sector Banks have contributed up to PKR 13.115 billion and PKR 9.544 billion on account of net PBT and net PAT respectively during the year. Although the total revenue, net of mark-up expense, earned by banks in this sector was PKR 80.526 billion, the operating expenses incurred were PKR 47.935 billion.
Banking Survey 2014
Junaidy Shoaib Asad Chartered Accountants
28
Net provision booked in this sector was PKR 19.475 billion, out of which, provision against NPL was PKR 17.095 billion, the highest of all the sectors in this survey. NBP has been the major contributor to NPL provision for the year, recording provision hit of PKR 17.459 billion, still managed to register the highest PBT and PAT for the year of PKR 7.737 billion and PKR 6.015 billion respectively. FWBL is the only bank in this sector to post a loss before tax and loss after tax of PKR 0.222 billion and PKR 0.206 billion respectively.
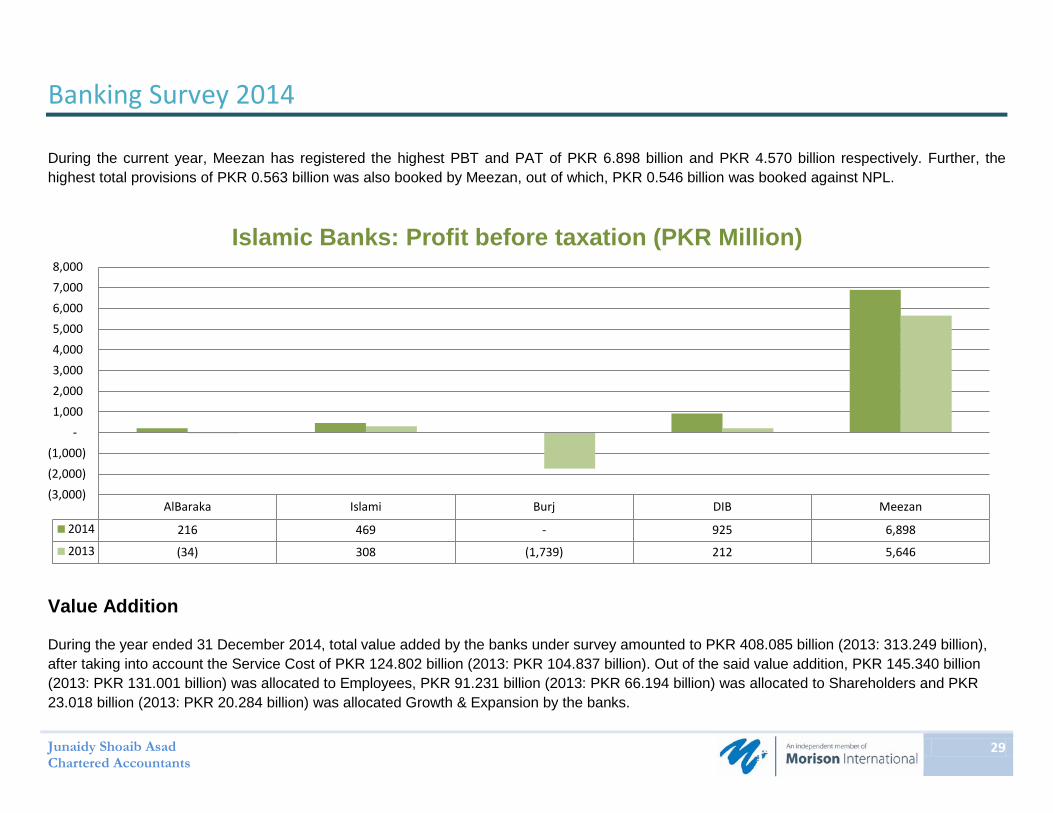
Islamic Banks have posted net PBT and net PAT of PKR 8.508 billion (2013: PKR 4.393 billion) and PKR 5.528 billion (2013: PKR 3.103 billion) respectively. Total gross revenue earned during the year was PKR 58.049 billion (2013: PKR 50.970 billion) and return expense was PKR 27.846 billion (2013: PKR 26.065 billion). This sector has also recognized a total provision of PKR 0.995 billion (2013: PKR 1.785 billion) out of which, NPL provision of PKR 0.837 billion (2013: PKR 1.593 billion) was recorded. Further, operating expenses amounting to PKR 20.700 billion (2013: PKR 18.728 billion) was also recognized during the current year.
FWBL NBP Sindh BOK BOP
2014 (666) 23,136 1,611 1,901 4,361
2013 (222) 7,029 953 1,669 2,978
(5,000)
-
5,000
10,000
15,000
20,000
25,000
Public Sector: Profit before taxation (PKR Million)
Banking Survey 2014
Junaidy Shoaib Asad Chartered Accountants
29
AlBaraka Islami Burj DIB Meezan
2014 216 469 - 925 6,898
2013 (34) 308 (1,739) 212 5,646
(3,000)(2,000)(1,000)
-1,000 2,000 3,000 4,000 5,000 6,000 7,000 8,000
Islamic Banks: Profit before taxation (PKR Million)
During the current year, Meezan has registered the highest PBT and PAT of PKR 6.898 billion and PKR 4.570 billion respectively. Further, the highest total provisions of PKR 0.563 billion was also booked by Meezan, out of which, PKR 0.546 billion was booked against NPL.
Value Addition
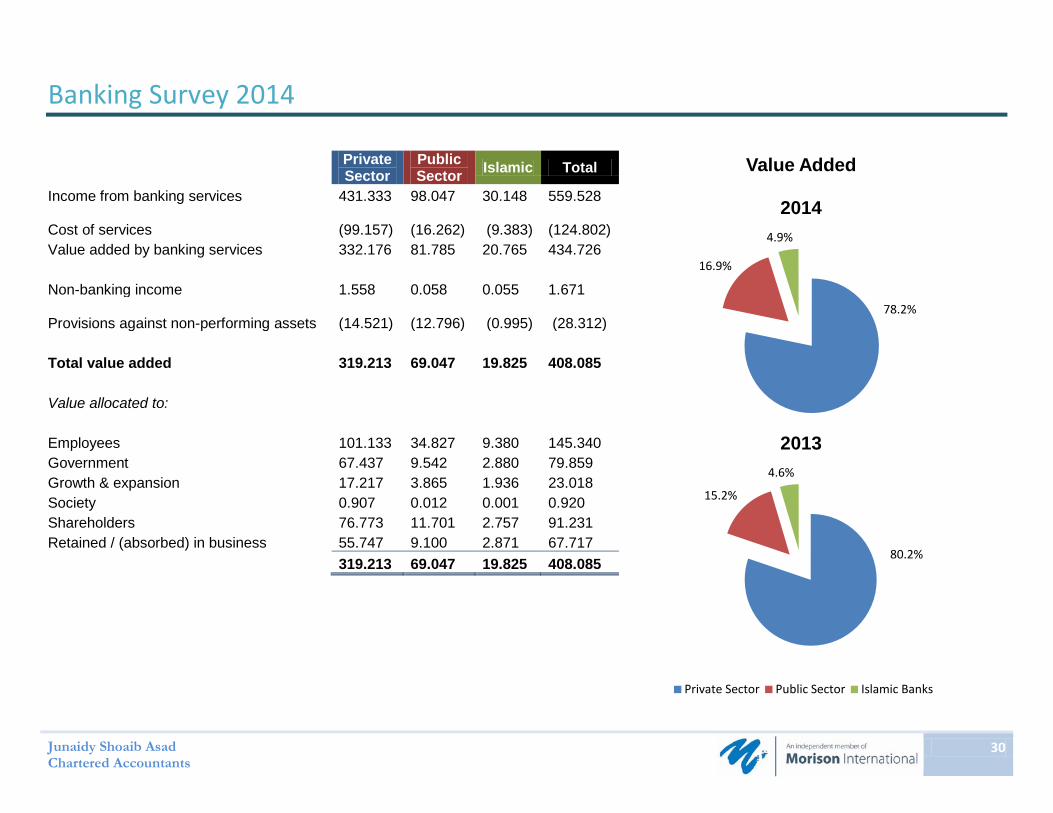
During the year ended 31 December 2014, total value added by the banks under survey amounted to PKR 408.085 billion (2013: 313.249 billion), after taking into account the Service Cost of PKR 124.802 billion (2013: PKR 104.837 billion). Out of the said value addition, PKR 145.340 billion (2013: PKR 131.001 billion) was allocated to Employees, PKR 91.231 billion (2013: PKR 66.194 billion) was allocated to Shareholders and PKR 23.018 billion (2013: PKR 20.284 billion) was allocated Growth & Expansion by the banks.
Banking Survey 2014
Junaidy Shoaib Asad Chartered Accountants
30
78.2%
16.9%
4.9%
Value Added
2014
80.2%
15.2%
4.6%
2013
Private Sector Public Sector Islamic Banks
Private Sector
Public Sector Islamic Total
Income from banking services 431.333 98.047 30.148 559.528
Cost of services (99.157)
(16.262) (9.383)
(124.802)
Value added by banking services 332.176 81.785 20.765 434.726
Non-banking income 1.558 0.058 0.055 1.671
Provisions against non-performing assets (14.521)
(12.796) (0.995) (28.312)
Total value added 319.213 69.047 19.825 408.085
Value allocated to:
Employees 101.133 34.827 9.380 145.340 Government 67.437 9.542 2.880 79.859 Growth & expansion 17.217 3.865 1.936 23.018 Society 0.907 0.012 0.001 0.920 Shareholders 76.773 11.701 2.757 91.231 Retained / (absorbed) in business 55.747 9.100 2.871 67.717
319.213 69.047 19.825 408.085

BANKING ASSETS

Banking Survey 2014
Junaidy Shoaib Asad Chartered Accountants
32
Gross Advances
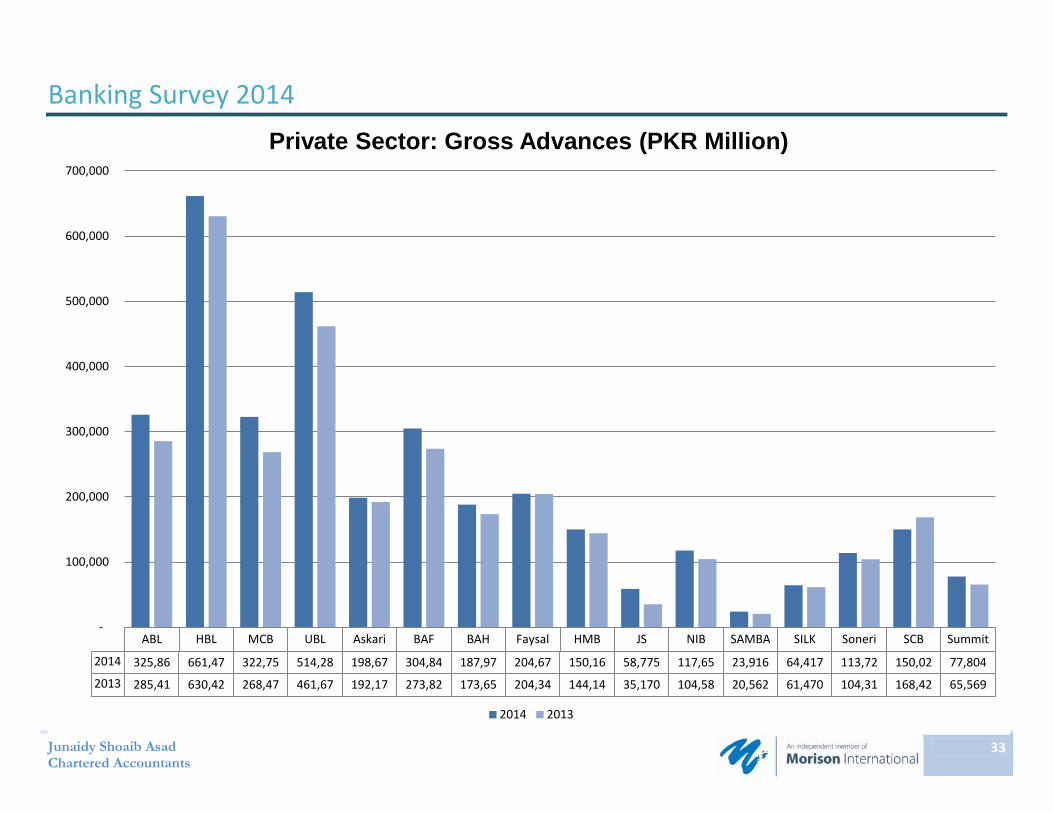
Total gross loans, advances, Islamic financing and related assets (“Advances”) of banks under review stood at PKR 4,835.117 billion as at 31 December 2014 (2013: PKR 4,443.709 billion). Sector wise break-up of Advances is as under:
Gross Advances 2014 2013 Increase / (decrease) Variance %
Private Sector 3,477.038 3,194.219 282.819 8.9%
Public Sector 1,022.911 970.530 52.381 5.4%
Islamic Banks 335.168 278.961 56.207 20.1%
4,835.117 4,443.709 391.408
8.8%
Net Advances 2014 2013 Increase / (decrease) Variance %
Private Sector 3,162.857
2,888.204 274.653 9.5%
Public Sector 890.090
848.681 41.409 4.9%
Islamic Banks 322.672
266.947 55.725 20.9%
4,375.619
4,003.832 371.787 9.3%
71.9%
21.2%
6.9%
2014
71.9%
21.8%
6.3%
2013
Private Sector Public Sector Islamic Banks
Banking Survey 2014
Junaidy Shoaib Asad Chartered Accountants
33
ABL HBL MCB UBL Askari BAF BAH Faysal HMB JS NIB SAMBA SILK Soneri SCB Summit
2014 325,86 661,47 322,75 514,28 198,67 304,84 187,97 204,67 150,16 58,775 117,65 23,916 64,417 113,72 150,02 77,804
2013 285,41 630,42 268,47 461,67 192,17 273,82 173,65 204,34 144,14 35,170 104,58 20,562 61,470 104,31 168,42 65,569
-
100,000
200,000
300,000
400,000
500,000
600,000
700,000
Private Sector: Gross Advances (PKR Million)
2014 2013

Banking Survey 2014
Junaidy Shoaib Asad Chartered Accountants
34
AlBaraka Islami Burj DIB Meezan
2014 49,835 41,698 - 60,350 183,285
2013 39,314 38,932 30,481 36,759 133,475
-20,000 40,000 60,000 80,000
100,000 120,000 140,000 160,000 180,000 200,000
Islamic Banks: Gross Advances (PKR Million)
2014 2013
FWBL NBP Sindh BOK BOP
2014 9,401 731,980 41,204 43,243 197,083
2013 9,669 713,042 26,565 38,339 182,915
-100,000 200,000 300,000 400,000 500,000 600,000 700,000 800,000
Public Sector: Gross Advance (PKR Million)
2014 2013

Banking Survey 2014
Junaidy Shoaib Asad Chartered Accountants
35
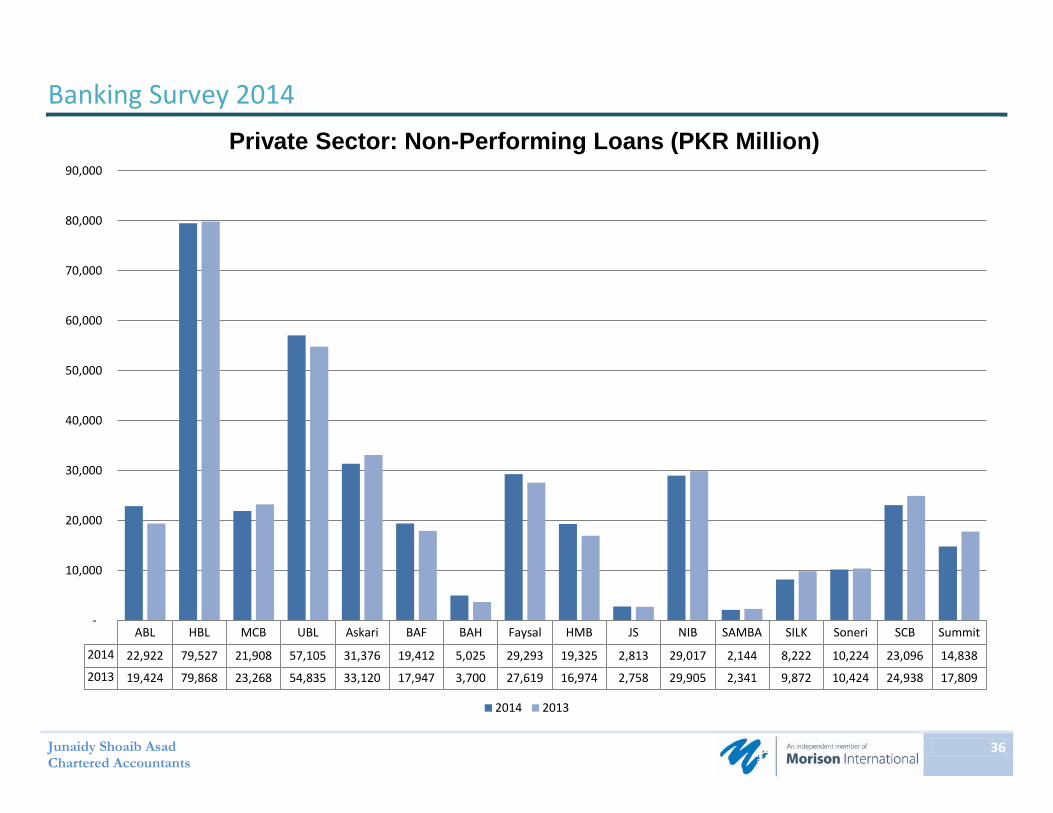
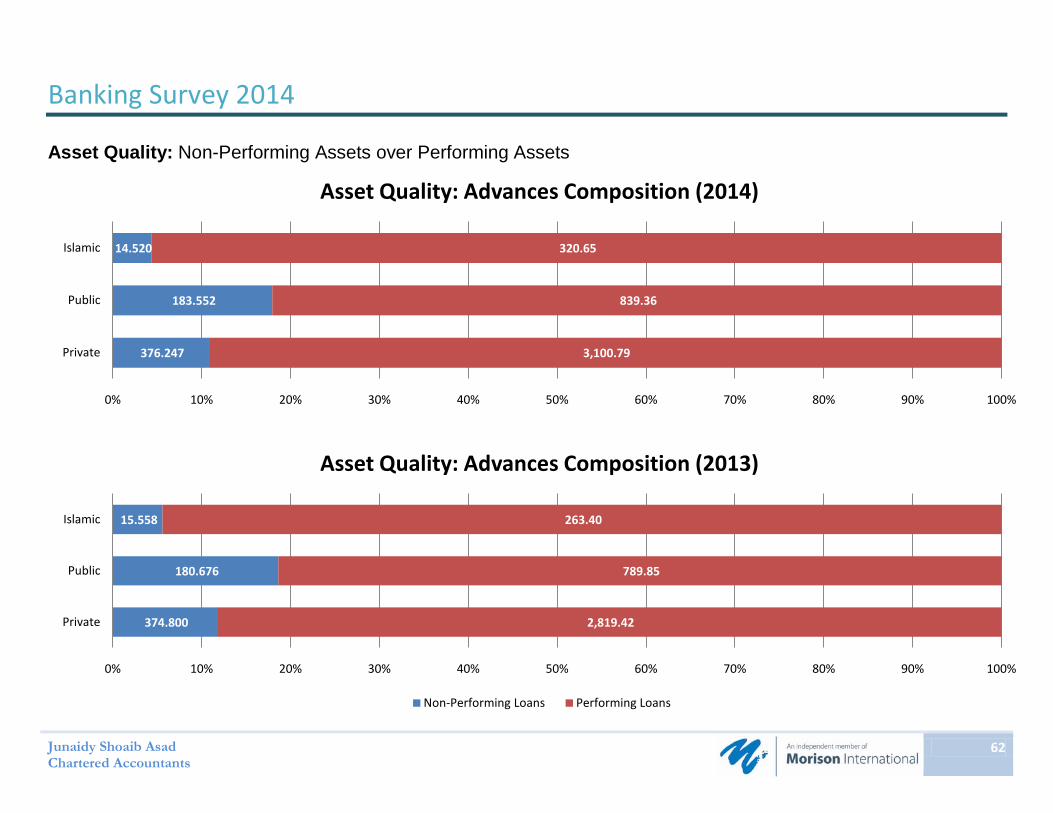
Non-Performing Assets Gross Advances include PKR 574.319 billion (2013: PKR 571.034 billion), which had been placed under non-performing status, against which, provision of PKR 459.498 billion (2013: PKR 439.877 billion) had been booked by the banks under survey. Aggregate provision to NPL ratio stood at 80.01% (2013: 77.03%)
2014 2013
NPL Provision NPL Provision Private Sector 376.247 314.181 374.800 306.015 Public Sector 183.552 132.821 180.676 121.849 Islamic Banks 14.520 12.496 15.558 12.013
574.319 459.498 571.034 439.877
65.5%
32.0%
2.5%
2014
65.6%
31.6%
2.7%
2013
Private Sector Public Sector Islamic Banks
Banking Survey 2014
Junaidy Shoaib Asad Chartered Accountants
36
ABL HBL MCB UBL Askari BAF BAH Faysal HMB JS NIB SAMBA SILK Soneri SCB Summit
2014 22,922 79,527 21,908 57,105 31,376 19,412 5,025 29,293 19,325 2,813 29,017 2,144 8,222 10,224 23,096 14,838
2013 19,424 79,868 23,268 54,835 33,120 17,947 3,700 27,619 16,974 2,758 29,905 2,341 9,872 10,424 24,938 17,809
-
10,000
20,000
30,000
40,000
50,000
60,000
70,000
80,000
90,000
Private Sector: Non-Performing Loans (PKR Million)
2014 2013
Banking Survey 2014
Junaidy Shoaib Asad Chartered Accountants
37
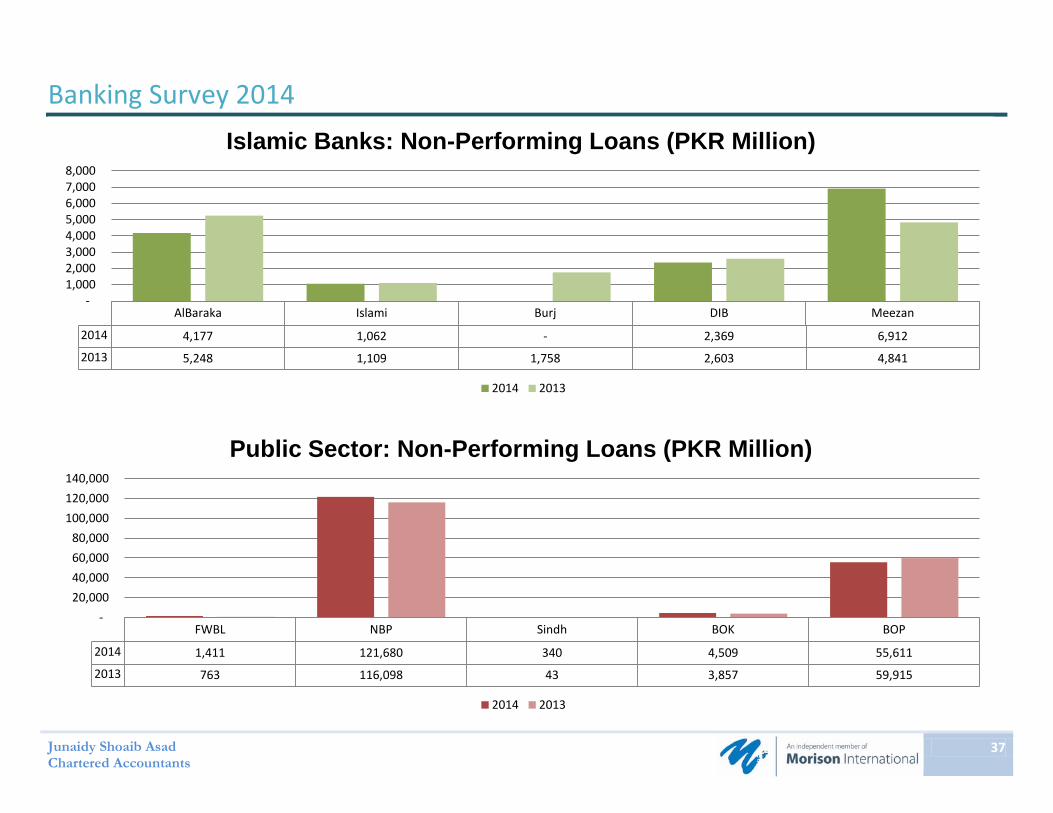
AlBaraka Islami Burj DIB Meezan
2014 4,177 1,062 - 2,369 6,912
2013 5,248 1,109 1,758 2,603 4,841
-1,000 2,000 3,000 4,000 5,000 6,000 7,000 8,000
Islamic Banks: Non-Performing Loans (PKR Million)
2014 2013
FWBL NBP Sindh BOK BOP
2014 1,411 121,680 340 4,509 55,611
2013 763 116,098 43 3,857 59,915
-20,000 40,000 60,000 80,000
100,000 120,000 140,000
Public Sector: Non-Performing Loans (PKR Million)
2014 2013

Banking Survey 2014
Junaidy Shoaib Asad Chartered Accountants
38
Non-Performing Advances and Corresponding Provisions
Overall NPL to gross advances has slightly improved by around 1% during the year ended 31 December 2014. The same stood at 11.9% as at year end (2013: 12.9%). Major contribution to NPL to Gross Advances ratio was made by Public Sector Banks of 17.9% during the year (2013: 18.6%).
Provision to NPL ratio has further deteriorated to 80% during the current year (2013: 77%), majorly due to deteriorated ratio in Islamic Bank under survey to 86.1% during the current year (2013: 77.2%).
2014 2013
NPL to Gross
Advances Provision
to NPL NPL to Gross
Advances Provision
to NPL
2014 2014 2013 2013 Private Sector 10.8% 83.5% 11.7% 81.6% Public Sector 17.9% 72.4% 18.6% 67.4% Islamic Banks 4.3% 86.1% 5.6% 77.2%
11.9% 80.0% 12.9% 77.0%

Banking Survey 2014
Junaidy Shoaib Asad Chartered Accountants
39
10.8%11.7%
17.9% 18.6%
4.3%5.6%
0.0%2.0%4.0%6.0%8.0%
10.0%12.0%14.0%16.0%18.0%20.0%
2014 2013
NPL to Gross Advances
83.5% 81.6%72.4%
67.4%
86.1%77.2%
0.0%10.0%20.0%30.0%40.0%50.0%60.0%70.0%80.0%90.0%
100.0%
2014 2013
Provision to NPL
Private Sector Public Sector Islamic Banks
Banking Survey 2014
Junaidy Shoaib Asad Chartered Accountants
40
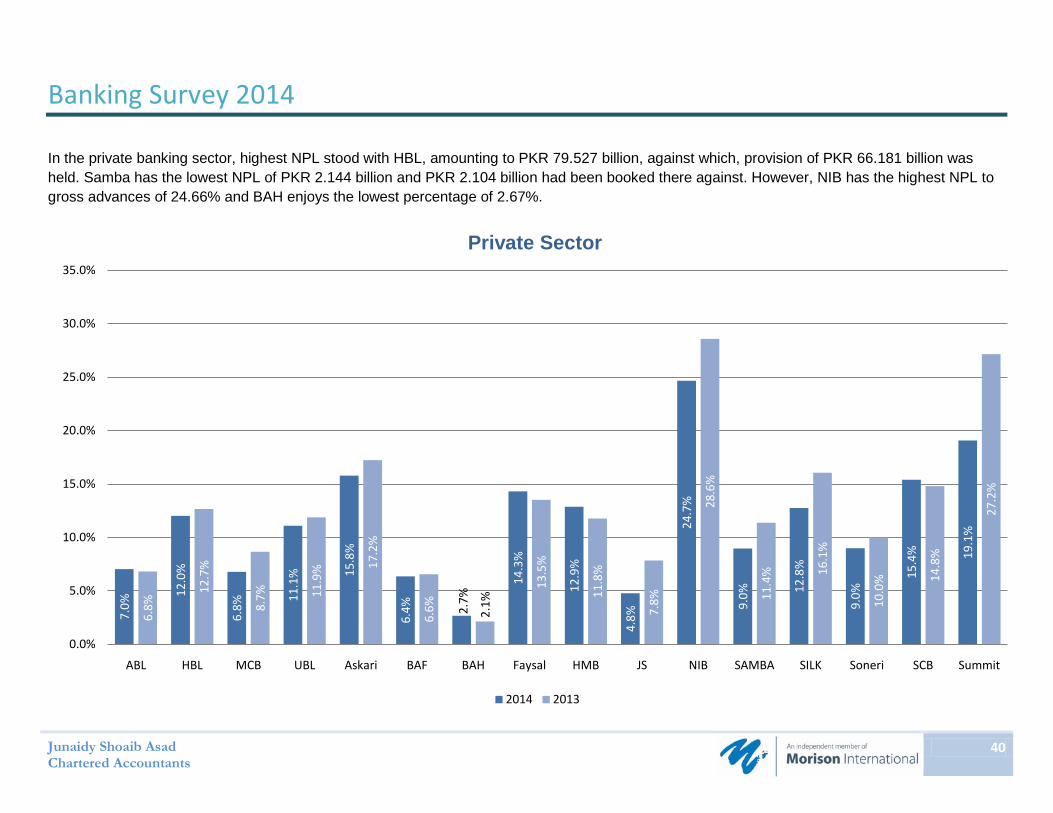
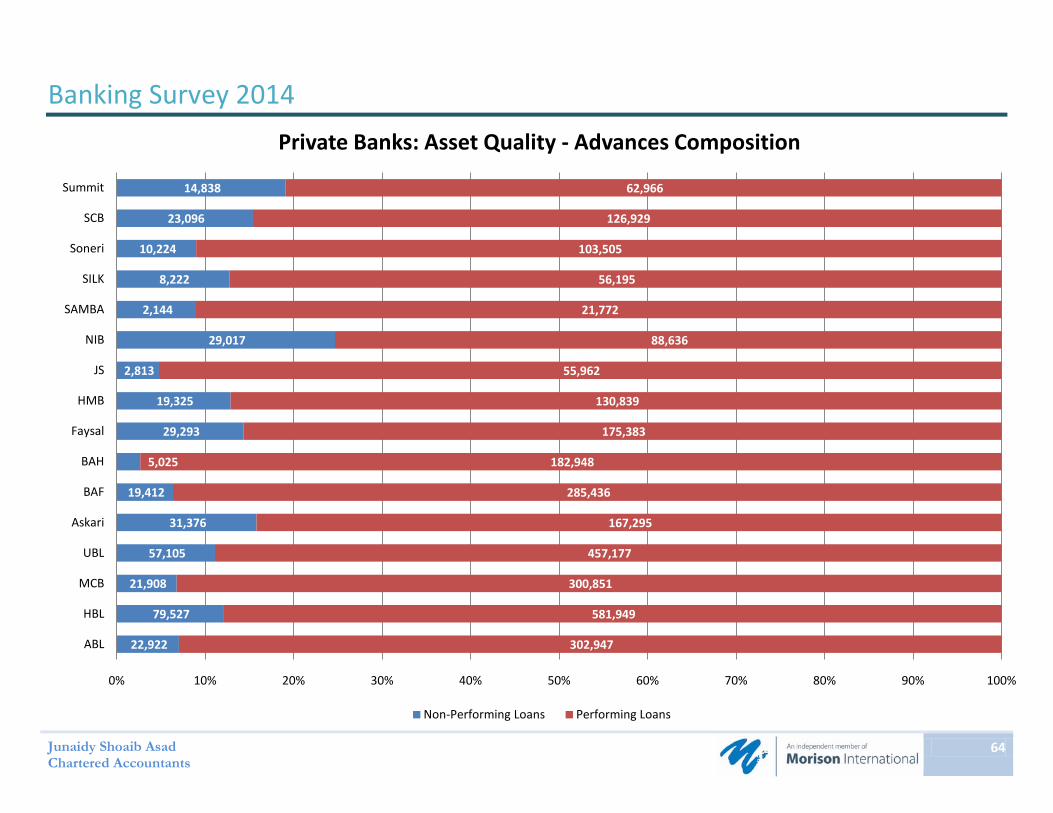
In the private banking sector, highest NPL stood with HBL, amounting to PKR 79.527 billion, against which, provision of PKR 66.181 billion was held. Samba has the lowest NPL of PKR 2.144 billion and PKR 2.104 billion had been booked there against. However, NIB has the highest NPL to gross advances of 24.66% and BAH enjoys the lowest percentage of 2.67%.
7.0%
12.0
%
6.8%
11.1
% 15.8
%
6.4% 2.
7%
14.3
%
12.9
%
4.8%
24.7
%
9.0% 12
.8%
9.0%
15.4
% 19.1
%
6.8%
12.7
%
8.7% 11
.9% 17
.2%
6.6% 2.1%
13.5
%
11.8
%
7.8%
28.6
%
11.4
% 16.1
%
10.0
% 14.8
%
27.2
%
0.0%
5.0%
10.0%
15.0%
20.0%
25.0%
30.0%
35.0%
ABL HBL MCB UBL Askari BAF BAH Faysal HMB JS NIB SAMBA SILK Soneri SCB Summit
Private Sector
2014 2013

Banking Survey 2014
Junaidy Shoaib Asad Chartered Accountants
41
In the public banking sector, NBP held the highest NPL of PKR 121.680 billion and had booked provision of PKR 101.751 billion there against. Sindh had the lowest NPL of PKR 0.340 billion. Maximum NPL to gross advances percentage is held by BOP of 28.22%.
15.0
%
16.6
%
0.8% 10
.4%
28.2
%
7.9%
16.3
%
0.2%
10.1
%
32.8
%
0.0%
5.0%
10.0%
15.0%
20.0%
25.0%
30.0%
35.0%
FWBL NBP Sindh BOK BOP
Public Sector
2014 2013
Banking Survey 2014
Junaidy Shoaib Asad Chartered Accountants
42
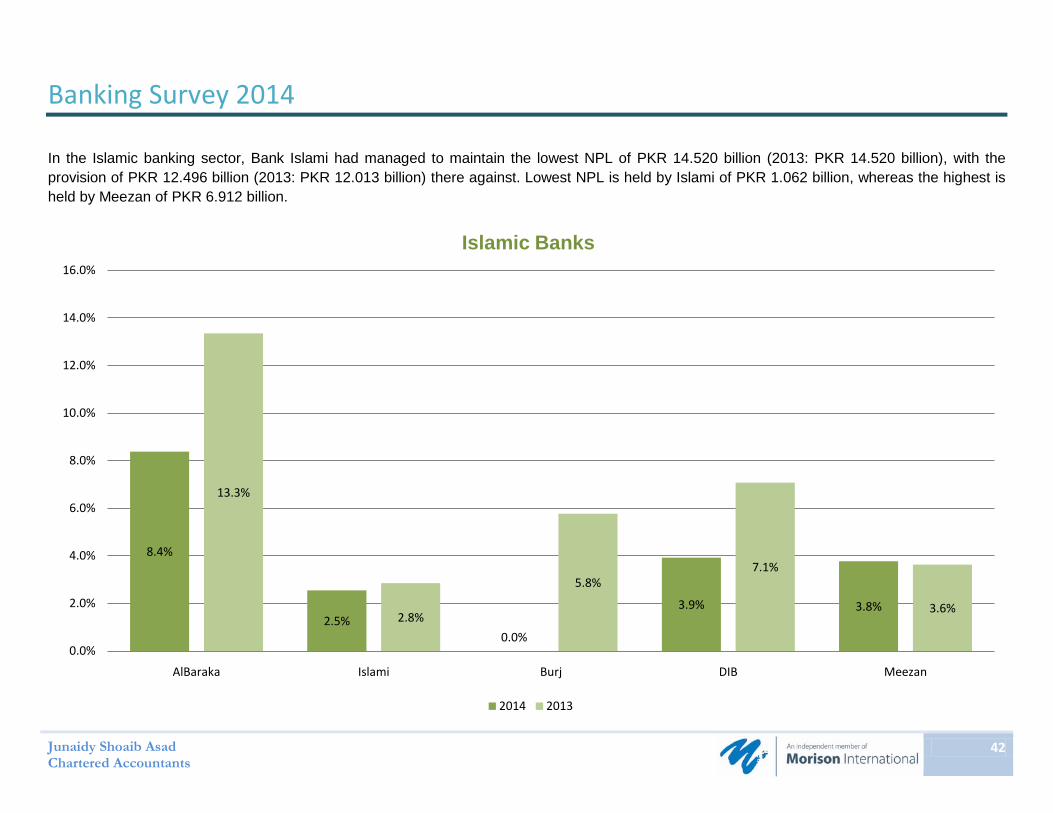
In the Islamic banking sector, Bank Islami had managed to maintain the lowest NPL of PKR 14.520 billion (2013: PKR 14.520 billion), with the provision of PKR 12.496 billion (2013: PKR 12.013 billion) there against. Lowest NPL is held by Islami of PKR 1.062 billion, whereas the highest is held by Meezan of PKR 6.912 billion.
8.4%
2.5%0.0%
3.9% 3.8%
13.3%
2.8%
5.8%7.1%
3.6%
0.0%
2.0%
4.0%
6.0%
8.0%
10.0%
12.0%
14.0%
16.0%
AlBaraka Islami Burj DIB Meezan
Islamic Banks
2014 2013
BANKING
LIABILITIES
Banking Survey 2014
Junaidy Shoaib Asad Chartered Accountants
44
Banking Liabilities: Deposits
Deposits
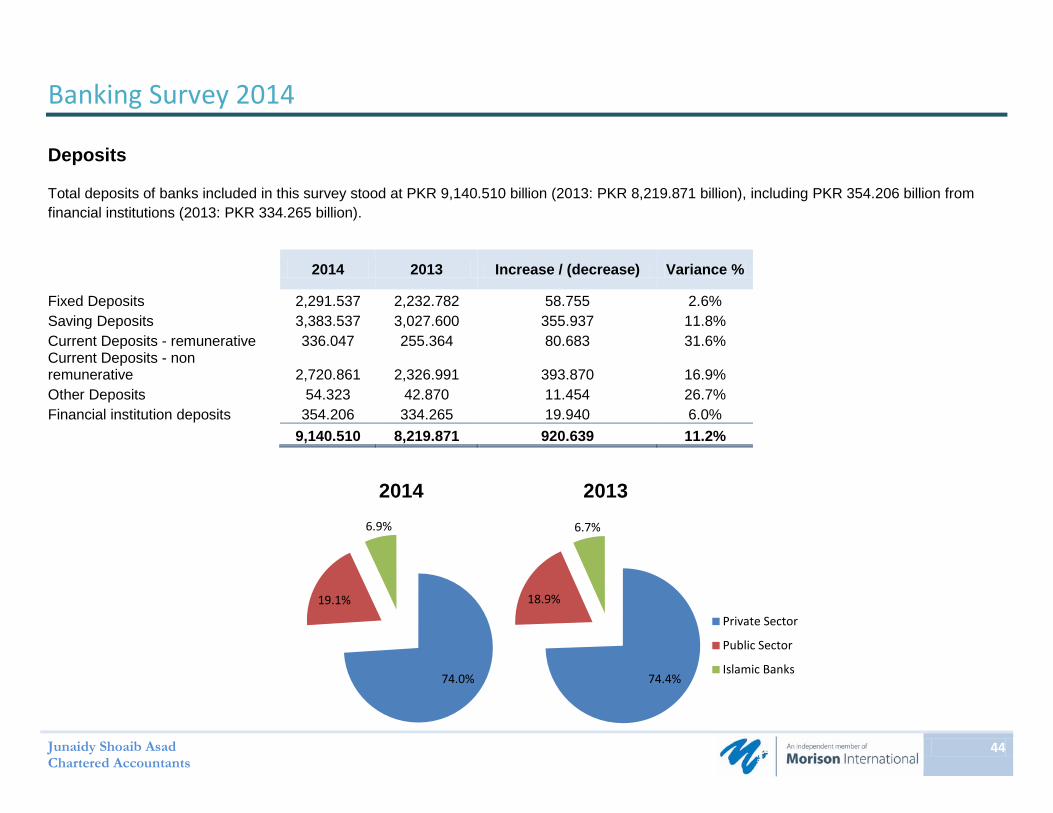
Total deposits of banks included in this survey stood at PKR 9,140.510 billion (2013: PKR 8,219.871 billion), including PKR 354.206 billion from financial institutions (2013: PKR 334.265 billion).
2014 2013 Increase / (decrease) Variance %
Fixed Deposits 2,291.537 2,232.782 58.755 2.6% Saving Deposits 3,383.537 3,027.600 355.937 11.8% Current Deposits - remunerative 336.047 255.364 80.683 31.6% Current Deposits - non remunerative 2,720.861 2,326.991 393.870 16.9% Other Deposits 54.323 42.870 11.454 26.7% Financial institution deposits 354.206 334.265 19.940 6.0%
9,140.510 8,219.871 920.639 11.2%
74.0%
19.1%
6.9%
2014
74.4%
18.9%
6.7%
2013
Private Sector
Public Sector
Islamic Banks

Banking Survey 2014
Junaidy Shoaib Asad Chartered Accountants
45
0% 10% 20% 30% 40% 50% 60% 70% 80% 90% 100%
2014
2013
2,291.537
2,232.782
3,383.537
3,027.600
336.047
255.364
2,720.861
2,326.991
354.206
334.265
Banking Industry (PKR Million)
Fixed Deposits Saving Deposits Current Deposits - remunerativeCurrent Deposits - non remunerative Other Deposits Financial institution deposits
Deposits Composition

Banking Survey 2014
Junaidy Shoaib Asad Chartered Accountants
46
Major contribution towards this deposit base had been from Private Sector Banks of PKR 6,761.399 billion (2013: PKR 6,119.133 billion).
Private Sector Public Sector Islamic Total
Fixed Deposits 1,629.129 463.543 198.864 2,291.537 Saving Deposits 2,590.772 546.875 245.889 3,383.537 Current Deposits - remunerative 174.394 161.653 - 336.047 Current Deposits - non remunerative 2,165.146 384.025 171.690 2,720.861 Other Deposits 40.619 11.740 1.964 54.323 Financial institution deposits 161.338 176.456 16.412 354.206
6,761.399 1,744.292 634.819 9,140.510
0% 10% 20% 30% 40% 50% 60% 70% 80% 90% 100%
Private Sector
Public Sector
Islamic
1,629.129
463.543
198.864
2,590.772
546.875
245.889
174.394
161.653
2,165.146
384.025
171.690
161.338
176.456
16.412
Sectoral Deposit Composition (PKR Million)
Fixed Deposits Saving Deposits Current Deposits - remunerativeCurrent Deposits - non remunerative Other Deposits Financial institution deposits
Banking Survey 2014
Junaidy Shoaib Asad Chartered Accountants
47
-
1,000.000
2,000.000
3,000.000
4,000.000
5,000.000
6,000.000
7,000.000
2014 2013
6,761.399
6,119.133
1,744.292 1,549.718
634.819 551.021
Deposits Comparison (PKR Million)
Private Banks Public Banks Islamic Banks
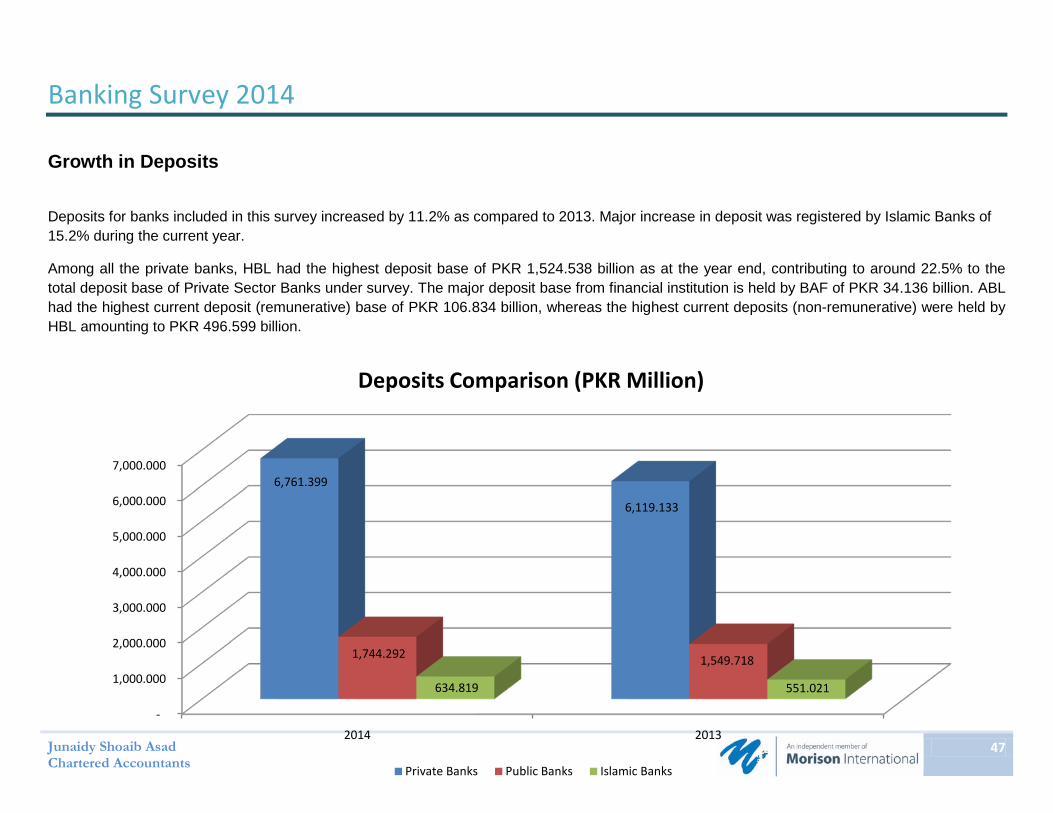
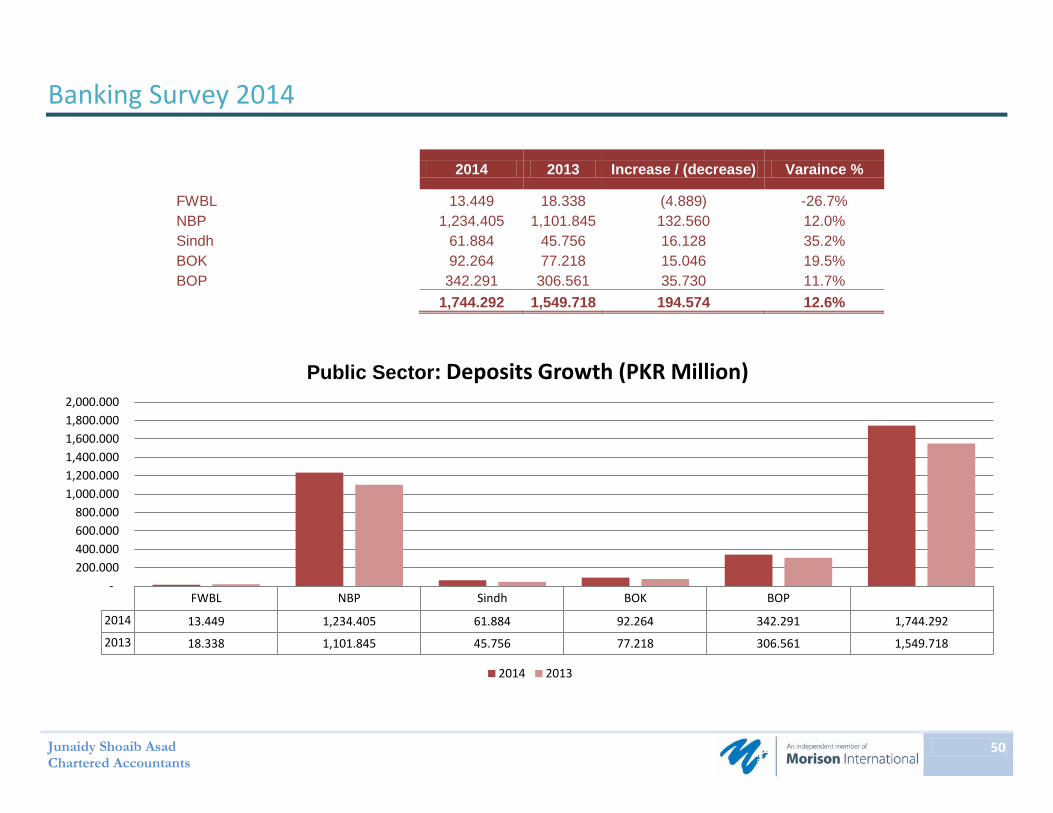
Growth in Deposits
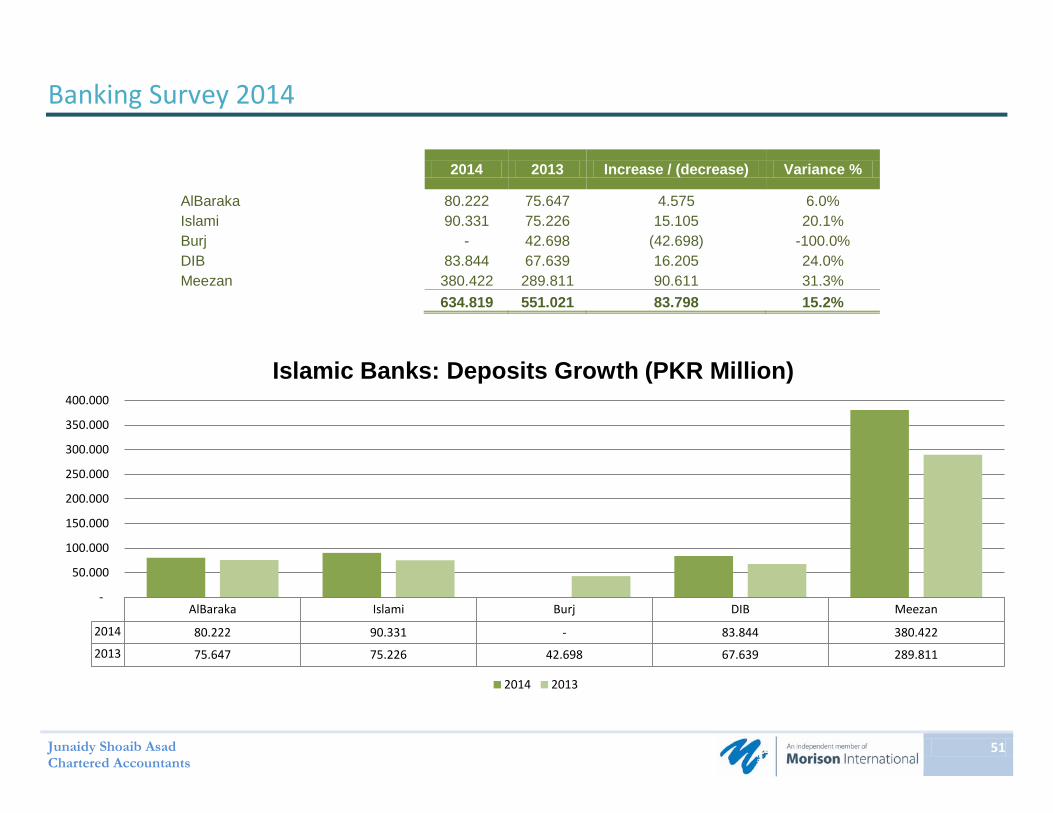
Deposits for banks included in this survey increased by 11.2% as compared to 2013. Major increase in deposit was registered by Islamic Banks of 15.2% during the current year.
Among all the private banks, HBL had the highest deposit base of PKR 1,524.538 billion as at the year end, contributing to around 22.5% to the total deposit base of Private Sector Banks under survey. The major deposit base from financial institution is held by BAF of PKR 34.136 billion. ABL had the highest current deposit (remunerative) base of PKR 106.834 billion, whereas the highest current deposits (non-remunerative) were held by HBL amounting to PKR 496.599 billion.

Banking Survey 2014
Junaidy Shoaib Asad Chartered Accountants
48
2014 2013 Increase / (decrease) Variance %
ABL 667.864 608.407 59.457 9.8% HBL 1,524.538 1,401.230 123.308 8.8% MCB 688.270 632.309 55.961 8.9% UBL 951.902 889.526 62.376 7.0% Askari 387.535 335.173 52.362 15.6% BAF 605.963 525.526 80.437 15.3% BAH 446.311 386.099 60.213 15.6% Faysal 283.346 271.134 12.211 4.5% HMB 319.948 247.508 72.440 29.3% JS 107.430 80.055 27.375 34.2% NIB 105.103 104.888 0.215 0.2% SAMBA 31.642 24.633 7.010 28.5% SILK 68.770 69.433 (0.664) -1.0% Soneri 163.250 140.580 22.670 16.1% SCB 304.305 296.377 7.928 2.7% Summit 105.222 106.256 (1.034) -1.0%
6,761.399 6,119.133 642.266 10.5%

Banking Survey 2014
Junaidy Shoaib Asad Chartered Accountants
49
ABL HBL MCB UBL Askari BAF BAH Faysal HMB JS NIB SAMBA SILK Soneri SCB Summit
2014 667.86 1,524. 688.27 951.90 387.53 605.96 446.31 283.34 319.94 107.43 105.10 31.642 68.770 163.25 304.30 105.22
2013 608.40 1,401. 632.30 889.52 335.17 525.52 386.09 271.13 247.50 80.055 104.88 24.633 69.433 140.58 296.37 106.25
-
200.000
400.000
600.000
800.000
1,000.000
1,200.000
1,400.000
1,600.000
1,800.000
Private Sector: Deposits Growth (PKR Million)
2014 2013
Banking Survey 2014
Junaidy Shoaib Asad Chartered Accountants
50
2014 2013 Increase / (decrease) Varaince %
FWBL 13.449 18.338 (4.889) -26.7% NBP 1,234.405 1,101.845 132.560 12.0% Sindh 61.884 45.756 16.128 35.2% BOK 92.264 77.218 15.046 19.5% BOP 342.291 306.561 35.730 11.7%
1,744.292 1,549.718 194.574 12.6%
FWBL NBP Sindh BOK BOP
2014 13.449 1,234.405 61.884 92.264 342.291 1,744.292
2013 18.338 1,101.845 45.756 77.218 306.561 1,549.718
-200.000 400.000 600.000 800.000
1,000.000 1,200.000 1,400.000 1,600.000 1,800.000 2,000.000
Public Sector: Deposits Growth (PKR Million)
2014 2013
Banking Survey 2014
Junaidy Shoaib Asad Chartered Accountants
51
2014 2013 Increase / (decrease) Variance %
AlBaraka 80.222 75.647 4.575 6.0% Islami 90.331 75.226 15.105 20.1% Burj - 42.698 (42.698) -100.0% DIB 83.844 67.639 16.205 24.0% Meezan 380.422 289.811 90.611 31.3%
634.819 551.021 83.798 15.2%
AlBaraka Islami Burj DIB Meezan
2014 80.222 90.331 - 83.844 380.422
2013 75.647 75.226 42.698 67.639 289.811
-
50.000
100.000
150.000
200.000
250.000
300.000
350.000
400.000
Islamic Banks: Deposits Growth (PKR Million)
2014 2013

Banking Survey 2014
Junaidy Shoaib Asad Chartered Accountants
52
72.9
%
62.6
%
65.8
%
71.3
%
59.3
%
59.8
%
0.0%
10.0%
20.0%
30.0%
40.0%
50.0%
60.0%
70.0%
80.0%
Private Public Islamic
CASA to Deposits
2014 2013
Current and Savings Deposits
Overall Current & Saving Deposits (“CASA”) for the current year was slightly increased to 70.46% (2013: 68.25%), the highest held by Private Sector Banks of 72.92% (2013: 71.27%).
2014 2013 Increase / (decrease) Variance
Private 72.9% 71.3% 1.6% 2.3% Public 62.6% 59.3% 3.3% 5.6% Islamic 65.8% 59.8% 6.0% 10.0%
201.3% 190.4% 11.0% 5.8%

RATIO ANALYSIS
Banking Survey 2014
Junaidy Shoaib Asad Chartered Accountants
54
Ratio Analysis
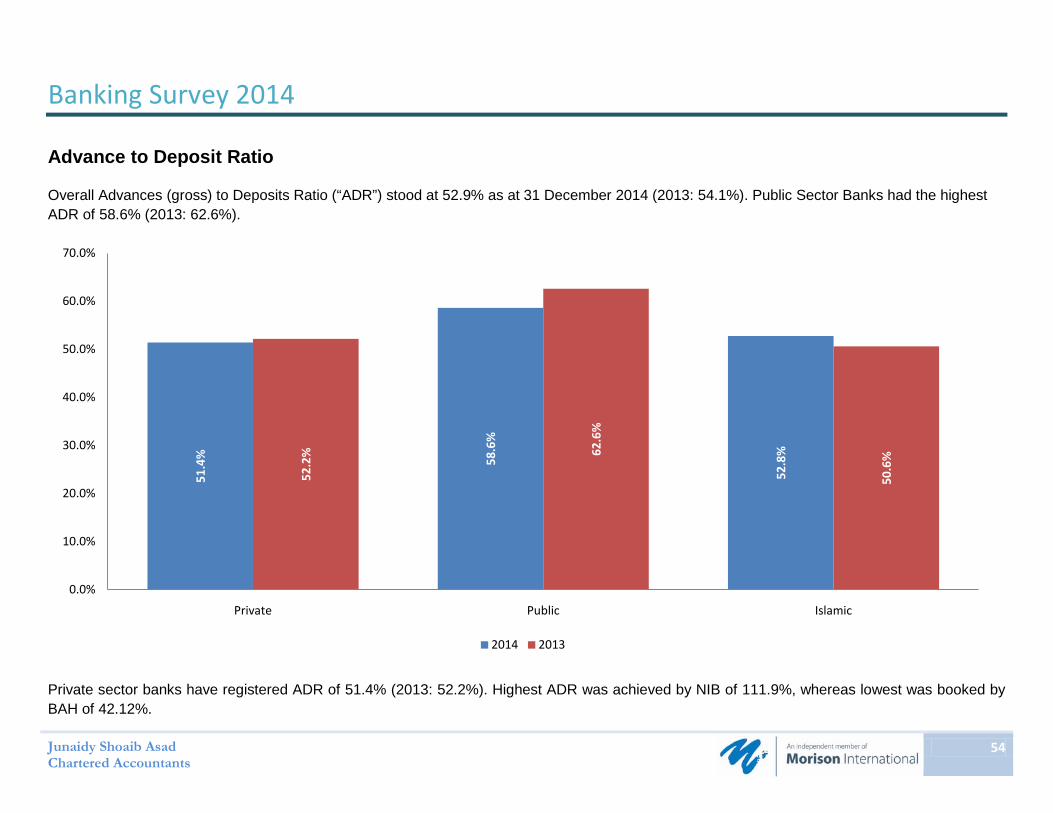
Advance to Deposit Ratio
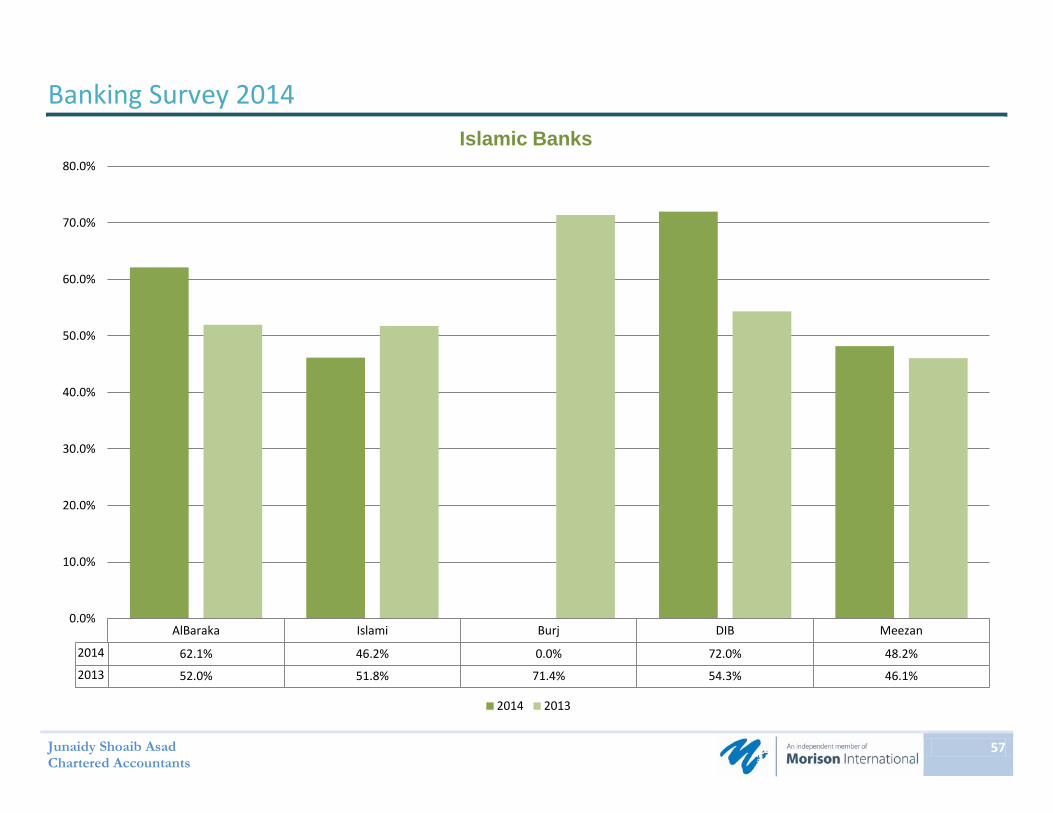
Overall Advances (gross) to Deposits Ratio (“ADR”) stood at 52.9% as at 31 December 2014 (2013: 54.1%). Public Sector Banks had the highest ADR of 58.6% (2013: 62.6%).
Private sector banks have registered ADR of 51.4% (2013: 52.2%). Highest ADR was achieved by NIB of 111.9%, whereas lowest was booked by BAH of 42.12%.
51.4
% 58.6
%
52.8
%
52.2
% 62.6
%
50.6
%
0.0%
10.0%
20.0%
30.0%
40.0%
50.0%
60.0%
70.0%
Private Public Islamic
2014 2013
Banking Survey 2014
Junaidy Shoaib Asad Chartered Accountants
55
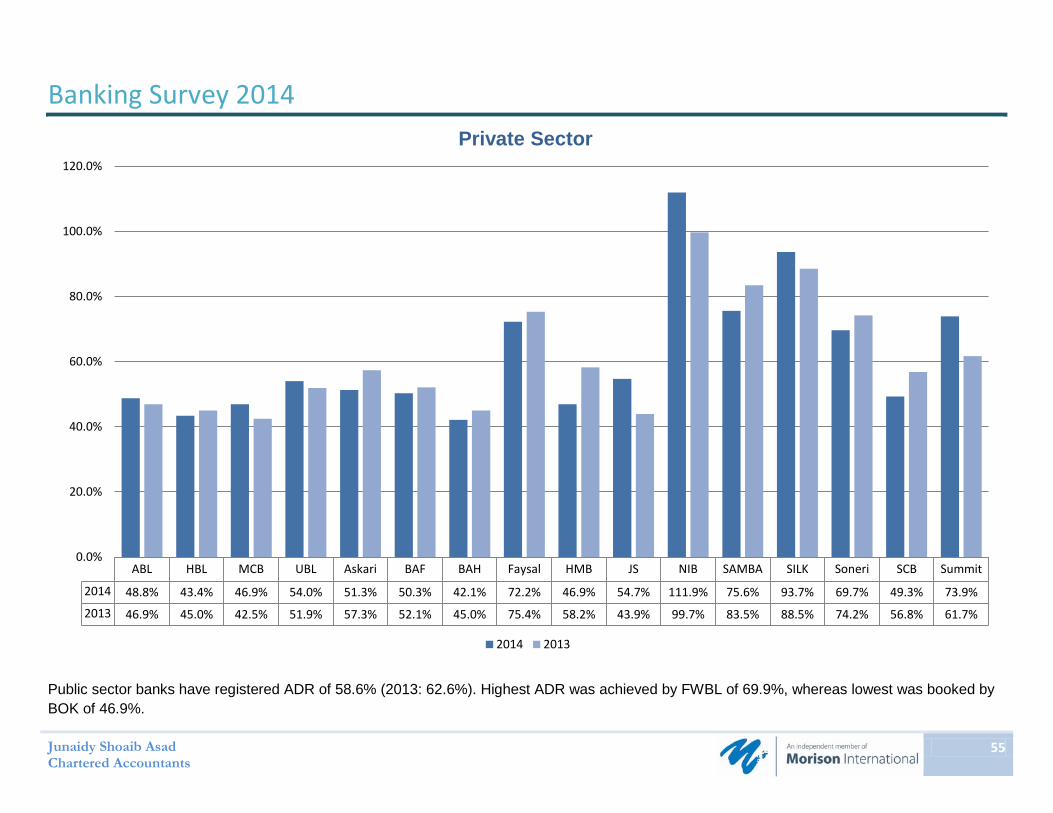
Public sector banks have registered ADR of 58.6% (2013: 62.6%). Highest ADR was achieved by FWBL of 69.9%, whereas lowest was booked by BOK of 46.9%.
ABL HBL MCB UBL Askari BAF BAH Faysal HMB JS NIB SAMBA SILK Soneri SCB Summit
2014 48.8% 43.4% 46.9% 54.0% 51.3% 50.3% 42.1% 72.2% 46.9% 54.7% 111.9% 75.6% 93.7% 69.7% 49.3% 73.9%
2013 46.9% 45.0% 42.5% 51.9% 57.3% 52.1% 45.0% 75.4% 58.2% 43.9% 99.7% 83.5% 88.5% 74.2% 56.8% 61.7%
0.0%
20.0%
40.0%
60.0%
80.0%
100.0%
120.0%
Private Sector
2014 2013

Banking Survey 2014
Junaidy Shoaib Asad Chartered Accountants
56
Islamic banks have registered ADR of 52.8% (2013: 50.6%). Highest ADR was achieved by DIB of 71.9%, whereas lowest was booked by Bank Islami of 46.2%.
FWBL NBP Sindh BOK BOP
2014 69.9% 59.3% 66.6% 46.9% 57.6%
2013 52.7% 64.7% 58.1% 49.7% 59.7%
0.0%
10.0%
20.0%
30.0%
40.0%
50.0%
60.0%
70.0%
80.0%
Public Sector
2014 2013
Banking Survey 2014
Junaidy Shoaib Asad Chartered Accountants
57
AlBaraka Islami Burj DIB Meezan
2014 62.1% 46.2% 0.0% 72.0% 48.2%
2013 52.0% 51.8% 71.4% 54.3% 46.1%
0.0%
10.0%
20.0%
30.0%
40.0%
50.0%
60.0%
70.0%
80.0%
Islamic Banks
2014 2013
Banking Survey 2014
Junaidy Shoaib Asad Chartered Accountants
58
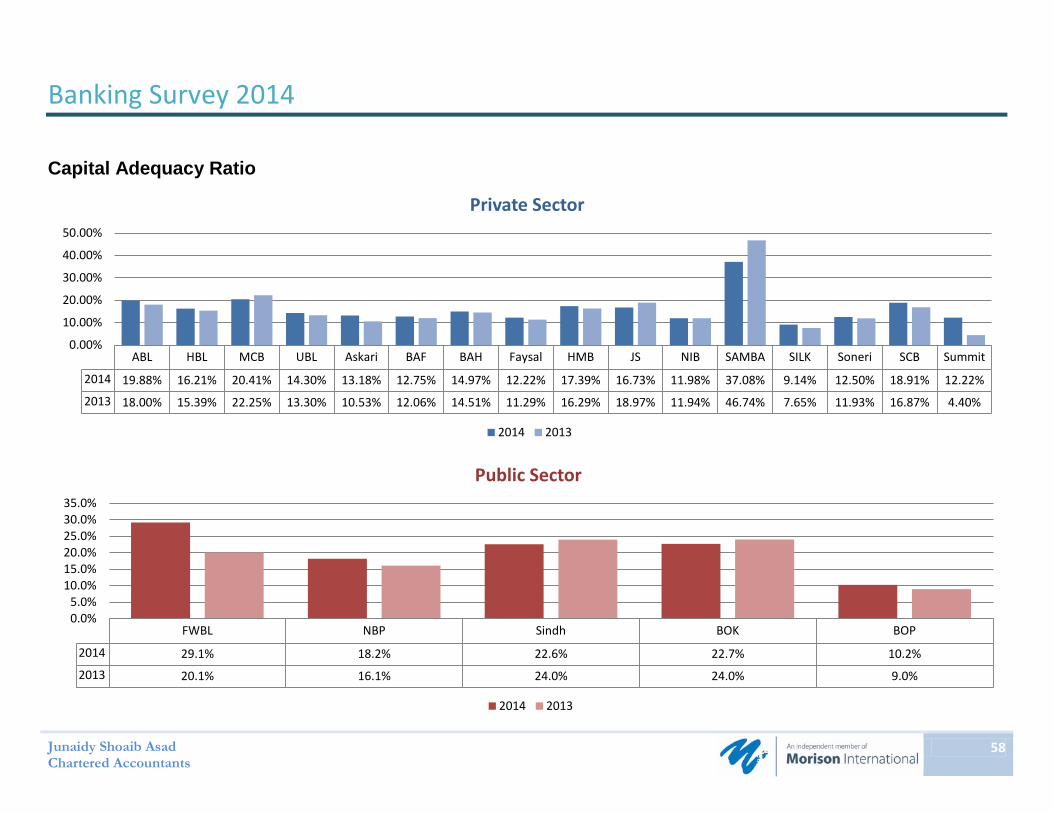
FWBL NBP Sindh BOK BOP
2014 29.1% 18.2% 22.6% 22.7% 10.2%
2013 20.1% 16.1% 24.0% 24.0% 9.0%
0.0%5.0%
10.0%15.0%20.0%25.0%30.0%35.0%
Public Sector
2014 2013
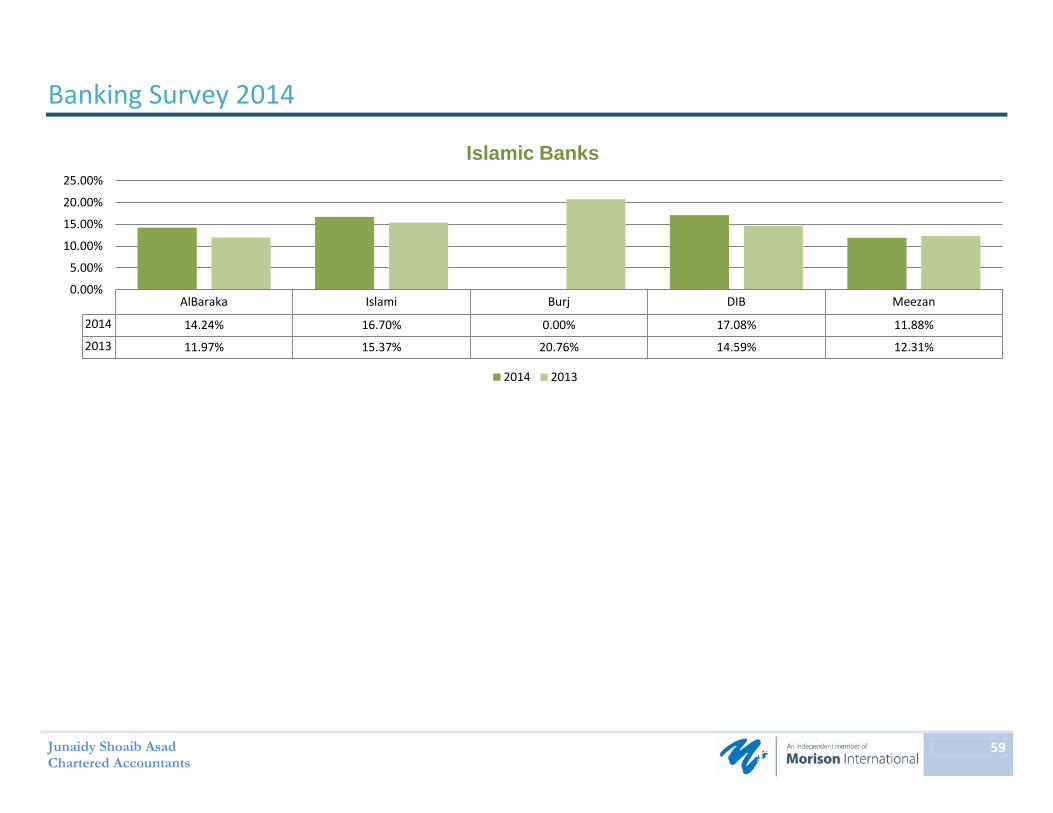
Capital Adequacy Ratio
ABL HBL MCB UBL Askari BAF BAH Faysal HMB JS NIB SAMBA SILK Soneri SCB Summit
2014 19.88% 16.21% 20.41% 14.30% 13.18% 12.75% 14.97% 12.22% 17.39% 16.73% 11.98% 37.08% 9.14% 12.50% 18.91% 12.22%
2013 18.00% 15.39% 22.25% 13.30% 10.53% 12.06% 14.51% 11.29% 16.29% 18.97% 11.94% 46.74% 7.65% 11.93% 16.87% 4.40%
0.00%
10.00%
20.00%
30.00%
40.00%
50.00%
Private Sector
2014 2013
Banking Survey 2014
Junaidy Shoaib Asad Chartered Accountants
59
AlBaraka Islami Burj DIB Meezan
2014 14.24% 16.70% 0.00% 17.08% 11.88%
2013 11.97% 15.37% 20.76% 14.59% 12.31%
0.00%
5.00%
10.00%
15.00%
20.00%
25.00%
Islamic Banks
2014 2013

Banking Survey 2014
Junaidy Shoaib Asad Chartered Accountants
60
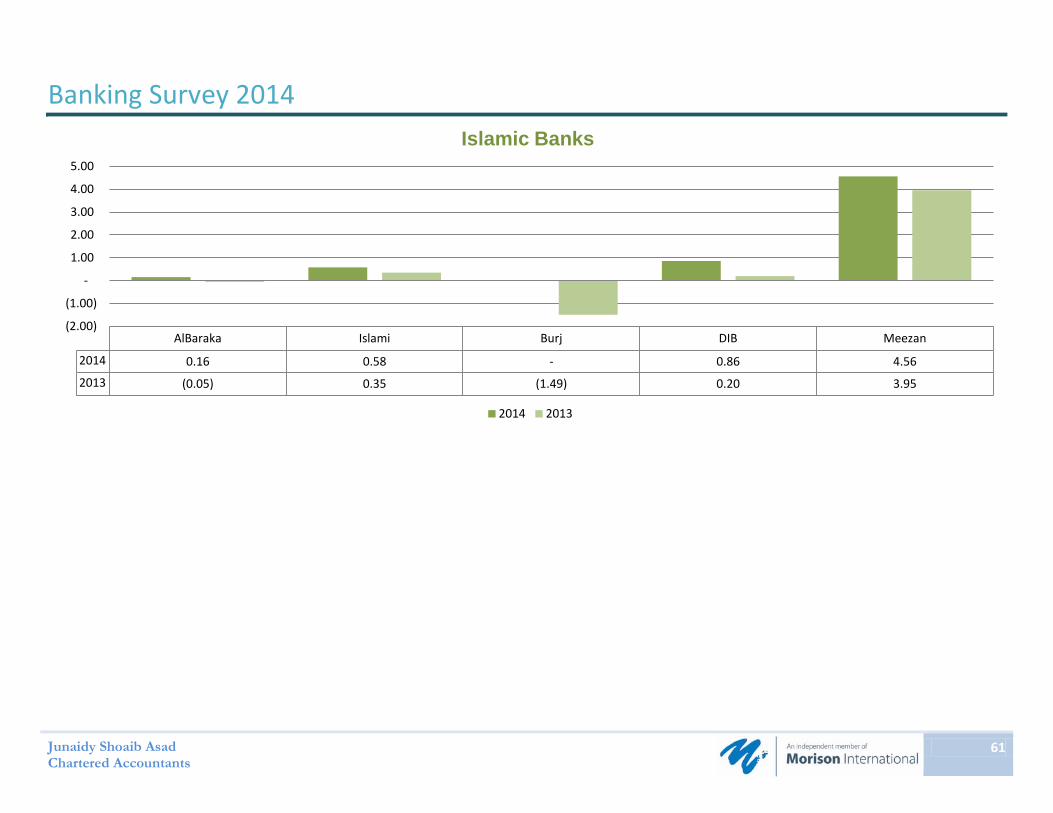
Earnings per Share (After Tax)
ABL HBL MCB UBL Askari BAF BAH Faysal HMB JS NIB SAMBA SILK Soneri SCB Summit
2014 13.28 21.63 22.15 19.32 3.19 4.08 5.79 2.37 4.72 1.35 (0.07) 0.24 0.03 1.44 2.49 0.16
2013 12.91 15.59 19.65 15.75 (5.90) 3.41 4.67 1.77 3.37 0.44 0.15 0.10 (0.43) 0.94 2.73 1.51
(10.00)(5.00)
-5.00
10.00 15.00 20.00 25.00
Private Sector
2014 2013
FWBL NBP Sindh BOK BOP
2014 (2.75) 7.56 1.08 1.31 1.97
2013 (1.38) 2.48 0.67 1.15 2.31
(4.00)(2.00)
-2.00 4.00 6.00 8.00
10.00
Public Sector
2014 2013
Banking Survey 2014
Junaidy Shoaib Asad Chartered Accountants
61
AlBaraka Islami Burj DIB Meezan
2014 0.16 0.58 - 0.86 4.56
2013 (0.05) 0.35 (1.49) 0.20 3.95
(2.00)
(1.00)
-
1.00
2.00
3.00
4.00
5.00
Islamic Banks
2014 2013
Banking Survey 2014
Junaidy Shoaib Asad Chartered Accountants
62
Asset Quality: Non-Performing Assets over Performing Assets
376.247
183.552
14.520
3,100.79
839.36
320.65
0% 10% 20% 30% 40% 50% 60% 70% 80% 90% 100%
Private
Public
Islamic
Asset Quality: Advances Composition (2014)
374.800
180.676
15.558
2,819.42
789.85
263.40
0% 10% 20% 30% 40% 50% 60% 70% 80% 90% 100%
Private
Public
Islamic
Asset Quality: Advances Composition (2013)
Non-Performing Loans Performing Loans

Banking Survey 2014
Junaidy Shoaib Asad Chartered Accountants
63
1,411
121,680
340
4,509
55,611
7,990
610,300
40,863
38,733
141,472
0% 10% 20% 30% 40% 50% 60% 70% 80% 90% 100%
FWBL
NBP
Sindh
BOK
BOP
Public Banks: Asset Quality - Advances Composition
4,177
1,062
-
2,369
6,912
45,658
40,636
-
57,981
176,373
0% 10% 20% 30% 40% 50% 60% 70% 80% 90% 100%
AlBaraka
Islami
Burj
DIB
Meezan
Islamic Banks: Asset Quality - Advances Composition (2013)
Non-Performing Loans Performing Loans
Banking Survey 2014
Junaidy Shoaib Asad Chartered Accountants
64
22,922
79,527
21,908
57,105
31,376
19,412
5,025
29,293
19,325
2,813
29,017
2,144
8,222
10,224
23,096
14,838
302,947
581,949
300,851
457,177
167,295
285,436
182,948
175,383
130,839
55,962
88,636
21,772
56,195
103,505
126,929
62,966
0% 10% 20% 30% 40% 50% 60% 70% 80% 90% 100%
ABL
HBL
MCB
UBL
Askari
BAF
BAH
Faysal
HMB
JS
NIB
SAMBA
SILK
Soneri
SCB
Summit
Private Banks: Asset Quality - Advances Composition
Non-Performing Loans Performing Loans
Banking Survey 2014
Junaidy Shoaib Asad Chartered Accountants
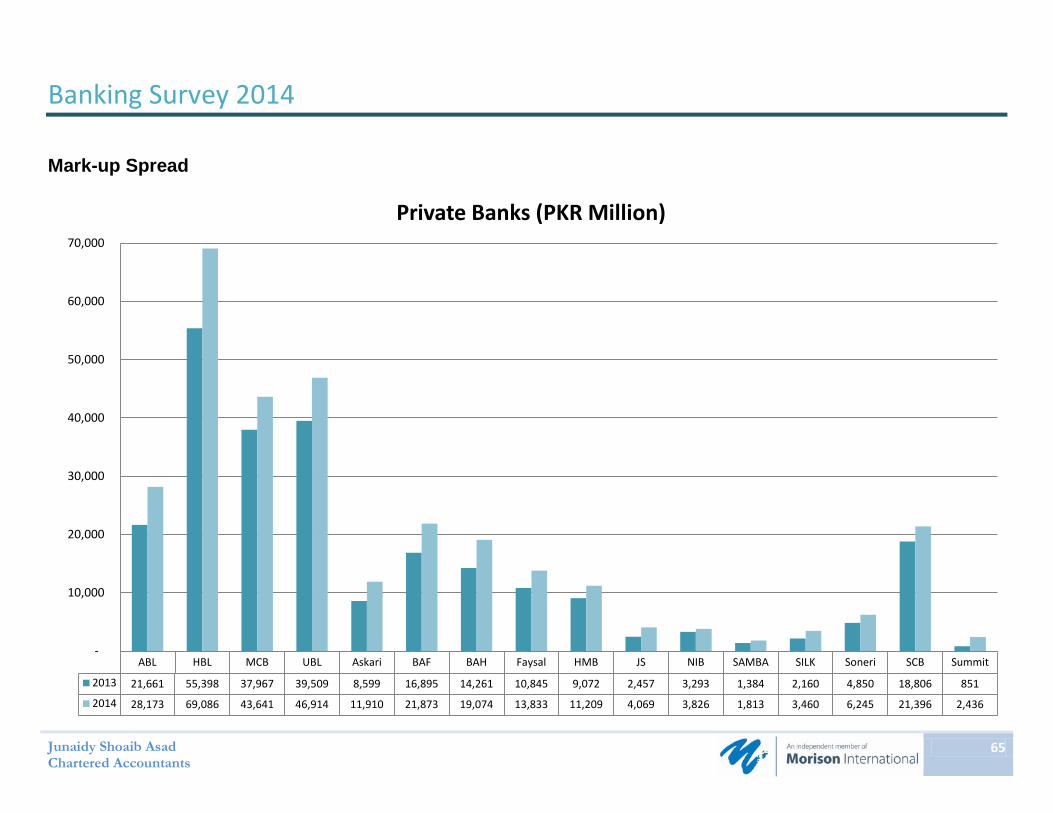
65
ABL HBL MCB UBL Askari BAF BAH Faysal HMB JS NIB SAMBA SILK Soneri SCB Summit
2013 21,661 55,398 37,967 39,509 8,599 16,895 14,261 10,845 9,072 2,457 3,293 1,384 2,160 4,850 18,806 851
2014 28,173 69,086 43,641 46,914 11,910 21,873 19,074 13,833 11,209 4,069 3,826 1,813 3,460 6,245 21,396 2,436
-
10,000
20,000
30,000
40,000
50,000
60,000
70,000
Private Banks (PKR Million)
Mark-up Spread
Banking Survey 2014
Junaidy Shoaib Asad Chartered Accountants
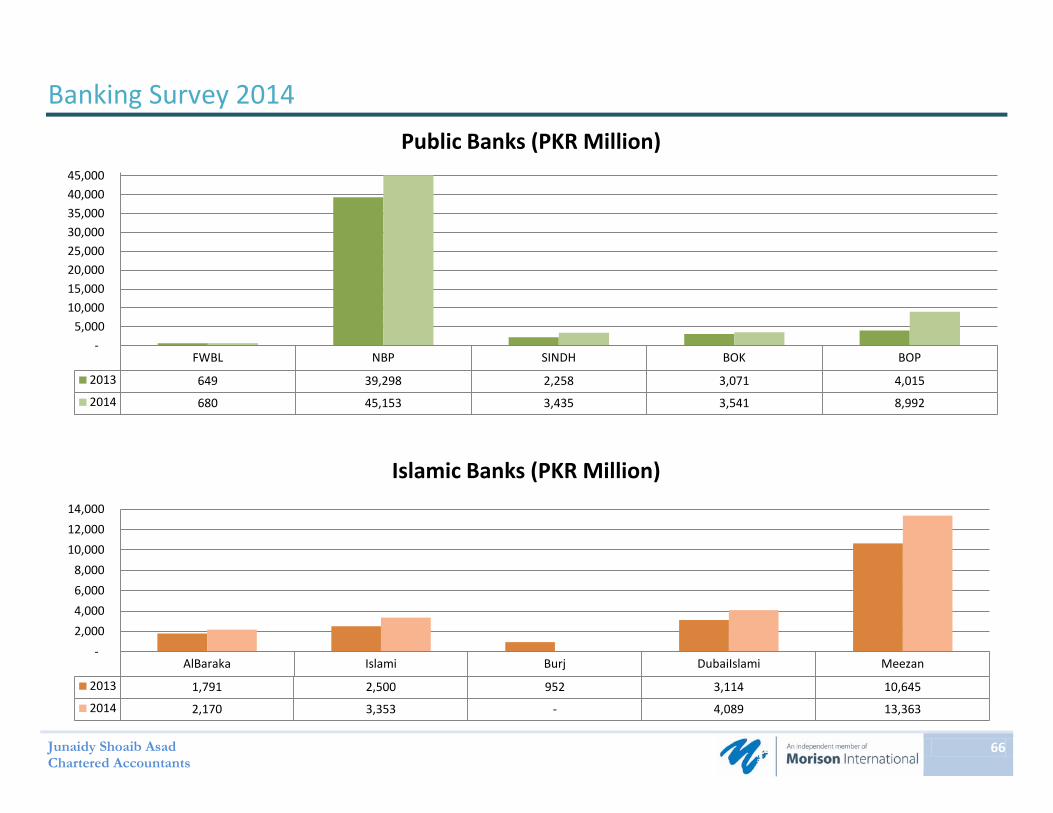
66
FWBL NBP SINDH BOK BOP
2013 649 39,298 2,258 3,071 4,015
2014 680 45,153 3,435 3,541 8,992
-5,000
10,000 15,000 20,000 25,000 30,000 35,000 40,000 45,000
Public Banks (PKR Million)
AlBaraka Islami Burj DubaiIslami Meezan
2013 1,791 2,500 952 3,114 10,645
2014 2,170 3,353 - 4,089 13,363
-2,000 4,000 6,000 8,000
10,000 12,000 14,000
Islamic Banks (PKR Million)
Banking Survey 2014
Junaidy Shoaib Asad Chartered Accountants
67
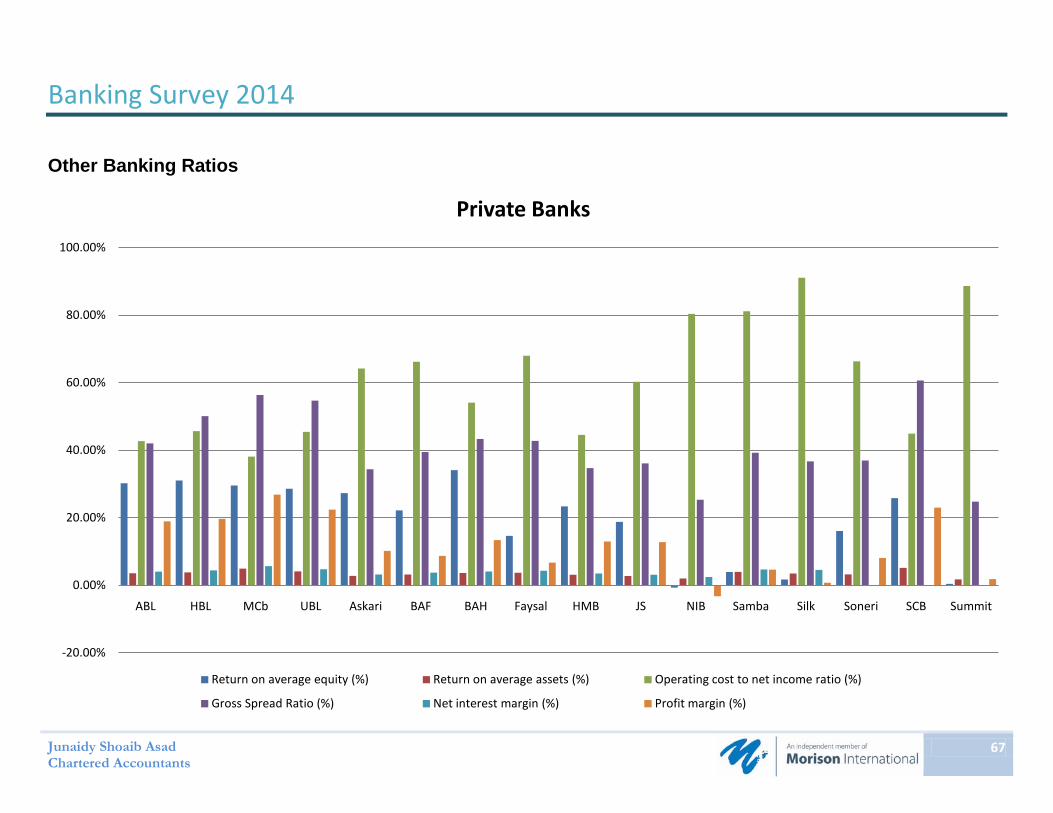
-20.00%
0.00%
20.00%
40.00%
60.00%
80.00%
100.00%
ABL HBL MCb UBL Askari BAF BAH Faysal HMB JS NIB Samba Silk Soneri SCB Summit
Private Banks
Return on average equity (%) Return on average assets (%) Operating cost to net income ratio (%)
Gross Spread Ratio (%) Net interest margin (%) Profit margin (%)
Other Banking Ratios
Banking Survey 2014
Junaidy Shoaib Asad Chartered Accountants
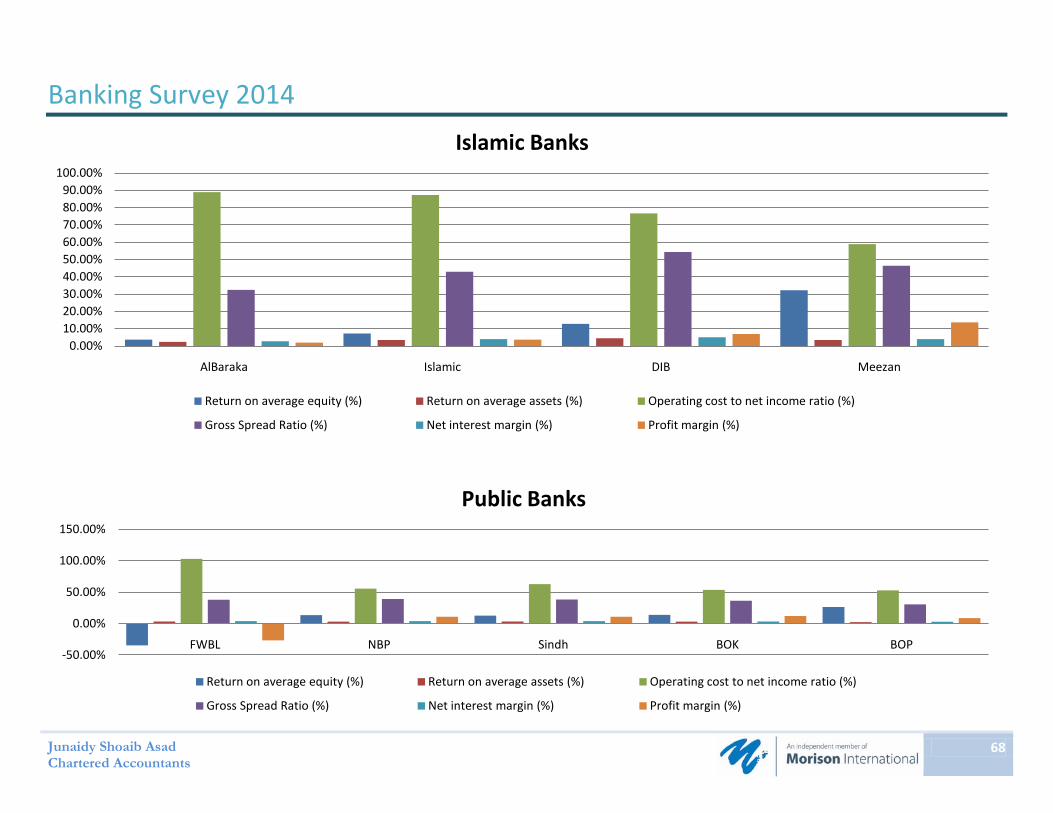
68
-50.00%
0.00%
50.00%
100.00%
150.00%
FWBL NBP Sindh BOK BOP
Public Banks
Return on average equity (%) Return on average assets (%) Operating cost to net income ratio (%)
Gross Spread Ratio (%) Net interest margin (%) Profit margin (%)
0.00%10.00%20.00%30.00%40.00%50.00%60.00%70.00%80.00%90.00%
100.00%
AlBaraka Islamic DIB Meezan
Islamic Banks
Return on average equity (%) Return on average assets (%) Operating cost to net income ratio (%)
Gross Spread Ratio (%) Net interest margin (%) Profit margin (%)

Banking Survey 2014
Junaidy Shoaib Asad Chartered Accountant
69
Commercial Banks
1.3
1.2 1.2 1.3 1.4
1.2
1.2 1.
6
1.4 1.
8
1.6
1.5
1.3
1.3 1.4
1.2
ABL Askari BAF BAH Faysal HBL HMBL JS Bank MCB NIB Samba Silk Soneri SCB Summit UBL
Assets over Deposits
669,216
1,207,435951,277 972,356 1,034,109 927,334
1,591,782
456,891 563,281 614,678
1,130,077781,480 663,619
2,625,032
560,157735,060
ABL (998) Askari (321)
BAF (637) BAH (459) Faysal Bank (274)
HBL (1644)
HMBL (201)
JS Bank (238)
MCB (1222)
NIB (171) Samba (28)
Silk Bank (88)
Soneri Bank (246)
SCB (116) Summit (188)
UBL (1296)
Deposits per Branch (PKR '000)

Banking Survey 2014
Junaidy Shoaib Asad Chartered Accountant
70
ABL (10121)
Askari (5913)
BAF (7785)
BAH (8122)
Faysal Bank
(5120)
HBL (14123)
HMBL (3934)
JS Bank (2442)
MCB (12113)
NIB (3096)
Samba (602)
Silk Bank (2906)
Soneri Bank
(3524)
SCB (4400)
Summit (2702)
UBL (13771)
Salaries per Employee 911 873 1,127 662 1,069 1,446 897 604 723 946 1,170 749 606 1,191 636 813
Travelling per Employee 16 20 67 13 26 41 35 10 26 21 38 50 48 57 70 28
Salaries & Travelling Expense Per Employee (PKR '000)

Banking Survey 2014
Junaidy Shoaib Asad Chartered Accountant
71
ABL (998)
Askari (321)
BAF (637)
BAH (459)
Faysal Bank (274)
HBL (1644)
HMBL (201)
JS Bank (238)
MCB (1222)
NIB (171)
Samba (28)
Silk Bank (88)
Soneri Bank (246)
SCB (116)
Summit (188)
UBL (1296)
Communications per Branch 350 1,237 950 496 1,126 696 1,160 276 790 952 3,572 2,166 336 4,066 908 924
Stationary per Branch 229 375 720 784 966 587 682 479 459 563 801 741 701 2,075 503 467
Repairs & Maintainance per Branch 448 3,021 1,820 1,825 2,849 1,261 1,235 1,823 1,227 2,849 3,033 2,740 542 9,847 889 1,333
Rents & Electricity per Branch 2,062 4,717 5,711 4,153 7,240 2,965 5,445 2,743 2,237 5,523 10,168 6,881 3,569 11,598 5,601 3,159
Legal Charges per Branch 73 424 509 265 1,062 479 618 267 231 1,143 775 2,624 188 901 1,009 218
Expenses Per Branch (PKR '000)
Banking Survey 2014
Junaidy Shoaib Asad Chartered Accountant
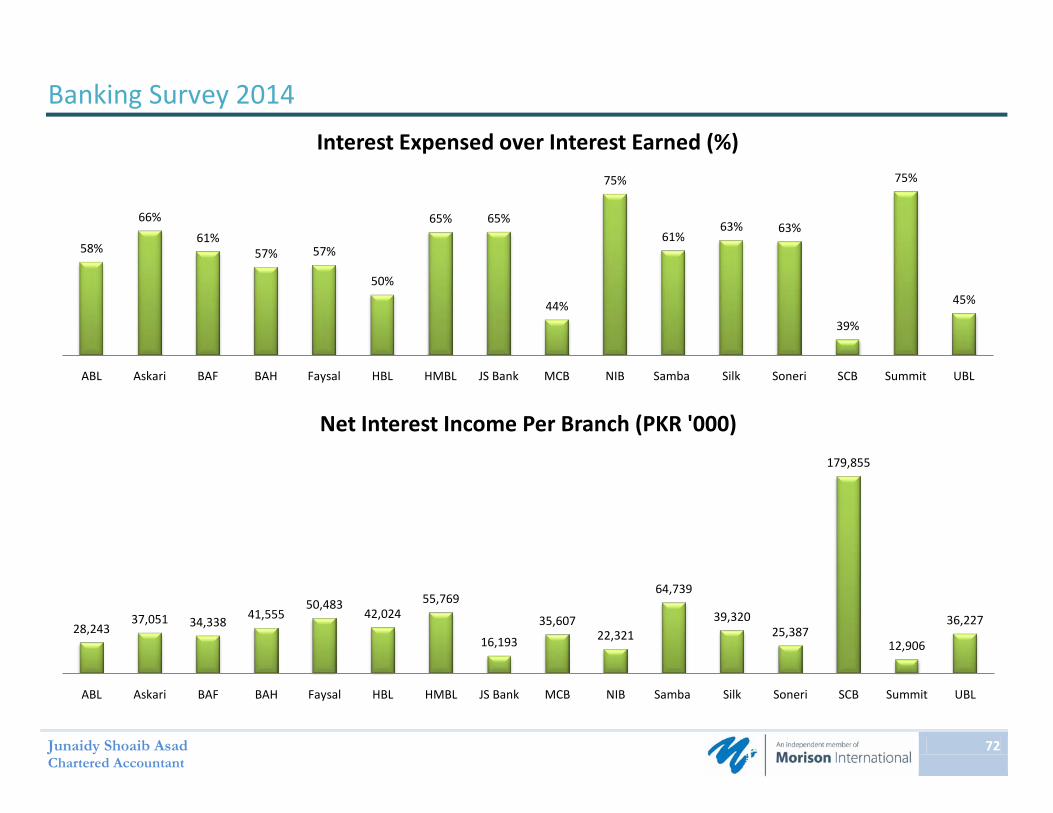
72
58%
66%61%
57% 57%
50%
65% 65%
44%
75%
61%63% 63%
39%
75%
45%
ABL Askari BAF BAH Faysal HBL HMBL JS Bank MCB NIB Samba Silk Soneri SCB Summit UBL
Interest Expensed over Interest Earned (%)
28,24337,051 34,338 41,555
50,48342,024
55,769
16,193
35,60722,321
64,739
39,32025,387
179,855
12,906
36,227
ABL Askari BAF BAH Faysal HBL HMBL JS Bank MCB NIB Samba Silk Soneri SCB Summit UBL
Net Interest Income Per Branch (PKR '000)

Banking Survey 2014
Junaidy Shoaib Asad Chartered Accountant
73
3,308 4,471 4,898 4,323
7,576 7,372
12,229
3,5085,913
9,455
3,738
9,867
5,391
28,450
5,960
10,073
ABL Askari BAF BAH Faysal HBL HMBL JS Bank MCB NIB Samba Silk Soneri SCB Summit UBL
Fee, Commission & Brokerage Income Per Branch (PKR '000)
4583,070 3,207
1,8623,916
1,732
5,172
1,142 1,1813,434
1,722 2,235 2,493
25,075
2,693 2,387
ABL Askari BAF BAH Faysal HBL HMBL JS Bank MCB NIB Samba Silk Soneri SCB Summit UBL
Income from dealing in foreign currencies Per Branch (PKR '000)
Banking Survey 2014
Junaidy Shoaib Asad Chartered Accountant
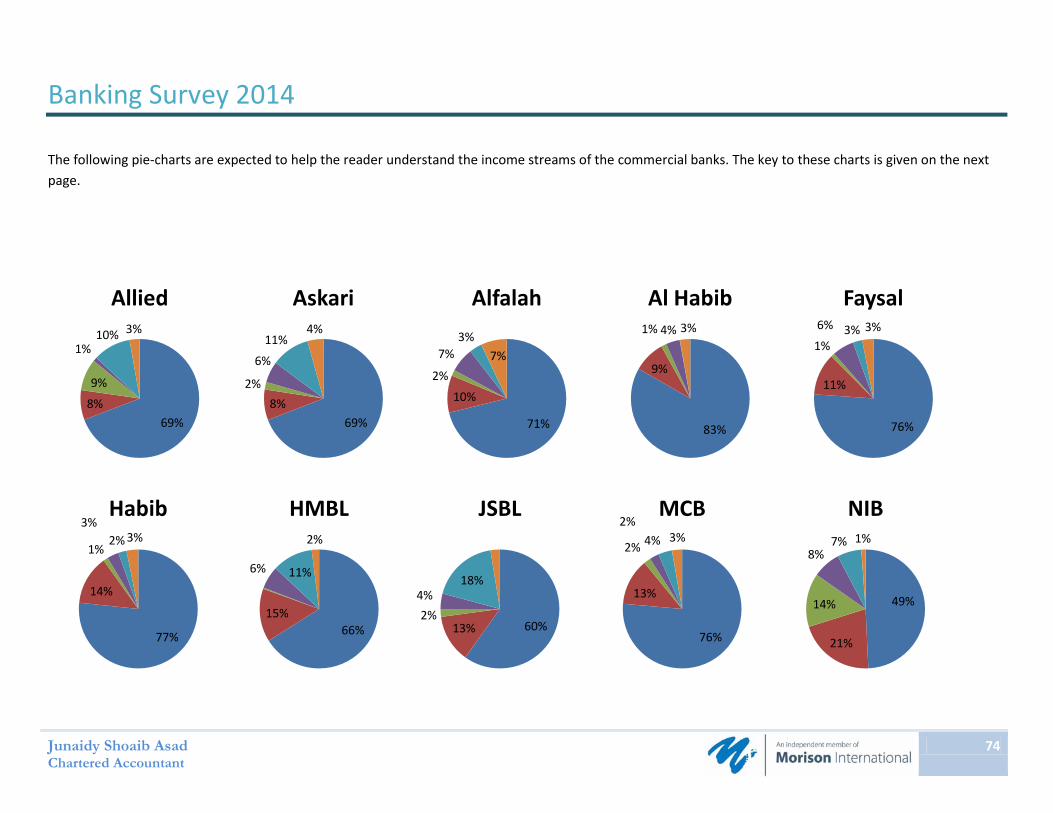
74
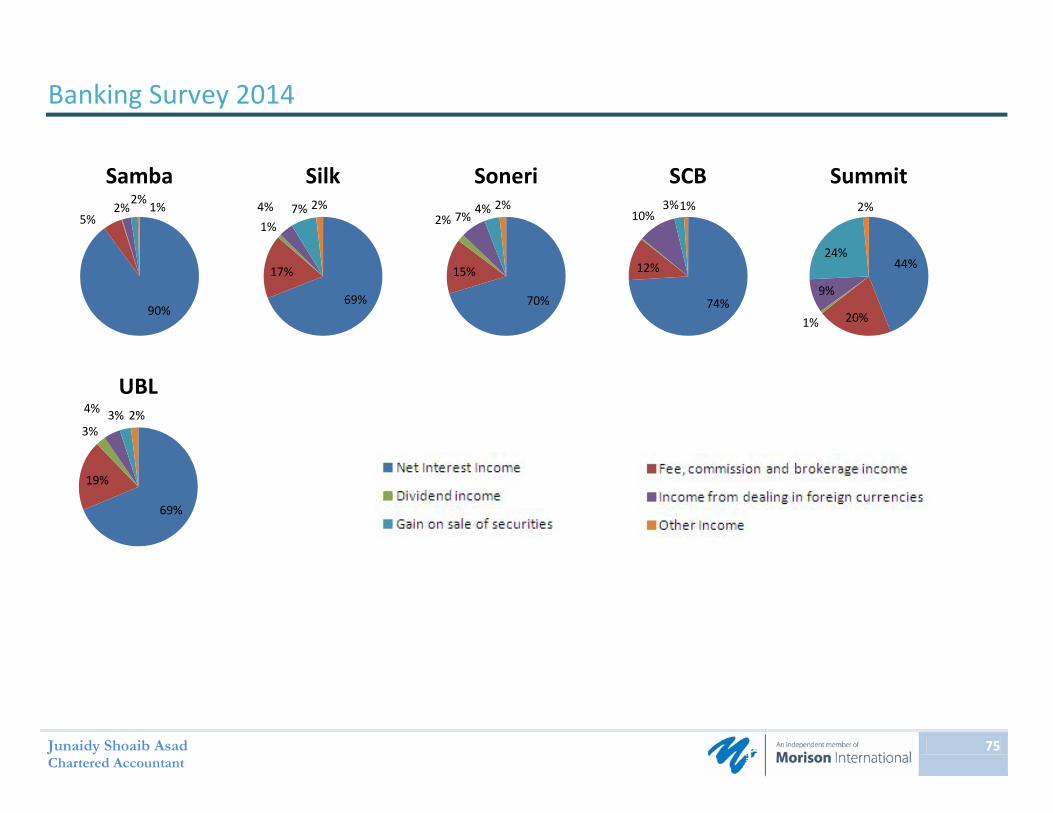
The following pie-charts are expected to help the reader understand the income streams of the commercial banks. The key to these charts is given on the next page.
69%8%
9%
1%10% 3%
Allied
69%8%
2%
6%
11%4%
Askari
71%
10%
2%
7%3%
7%
Alfalah
83%
9%
1% 4% 3%
Al Habib
76%
11%
1%
6% 3% 3%
Faysal
77%
14%
1%
3%2% 3%
Habib
66%15%
6% 11%
2%
HMBL
60%13%2%
4%18%
JSBL
76%
13%
2%
2%4% 3%
MCB
49%
21%
14%
8%7% 1%
NIB
Banking Survey 2014
Junaidy Shoaib Asad Chartered Accountant
75
90%
5%2%
2% 1%
Samba
69%
17%
1%4% 7% 2%
Silk
70%
15%
2% 7% 4% 2%
Soneri
74%
12%
10%3%1%
SCB
44%
20%1%
9%
24%
2%
Summit
69%
19%
3%
4% 3% 2%
UBL

Banking Survey 2014
Junaidy Shoaib Asad Chartered Accountant
76
Islamic Banks
1.2
1.1
1.2
1.1
Albaraka BankIslami DIB Meezan
Assets over Deposits
617,097
424,089479,111
888,835
Albaraka (130) BankIslami (213) DIB (175) Meezan (428)
Deposits per Branch (PKR '000)
Banking Survey 2014
Junaidy Shoaib Asad Chartered Accountant
77
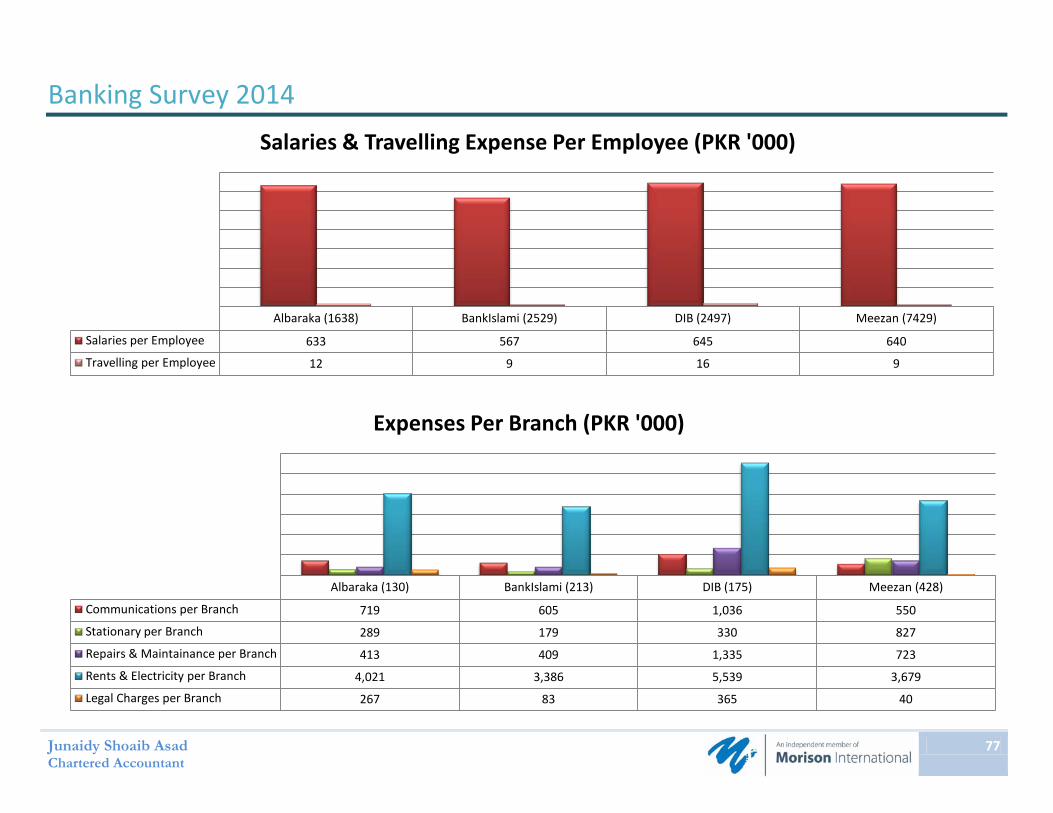
Albaraka (1638) BankIslami (2529) DIB (2497) Meezan (7429)
Salaries per Employee 633 567 645 640
Travelling per Employee 12 9 16 9
Salaries & Travelling Expense Per Employee (PKR '000)
Albaraka (130) BankIslami (213) DIB (175) Meezan (428)
Communications per Branch 719 605 1,036 550
Stationary per Branch 289 179 330 827
Repairs & Maintainance per Branch 413 409 1,335 723
Rents & Electricity per Branch 4,021 3,386 5,539 3,679
Legal Charges per Branch 267 83 365 40
Expenses Per Branch (PKR '000)
Banking Survey 2014
Junaidy Shoaib Asad Chartered Accountant
78
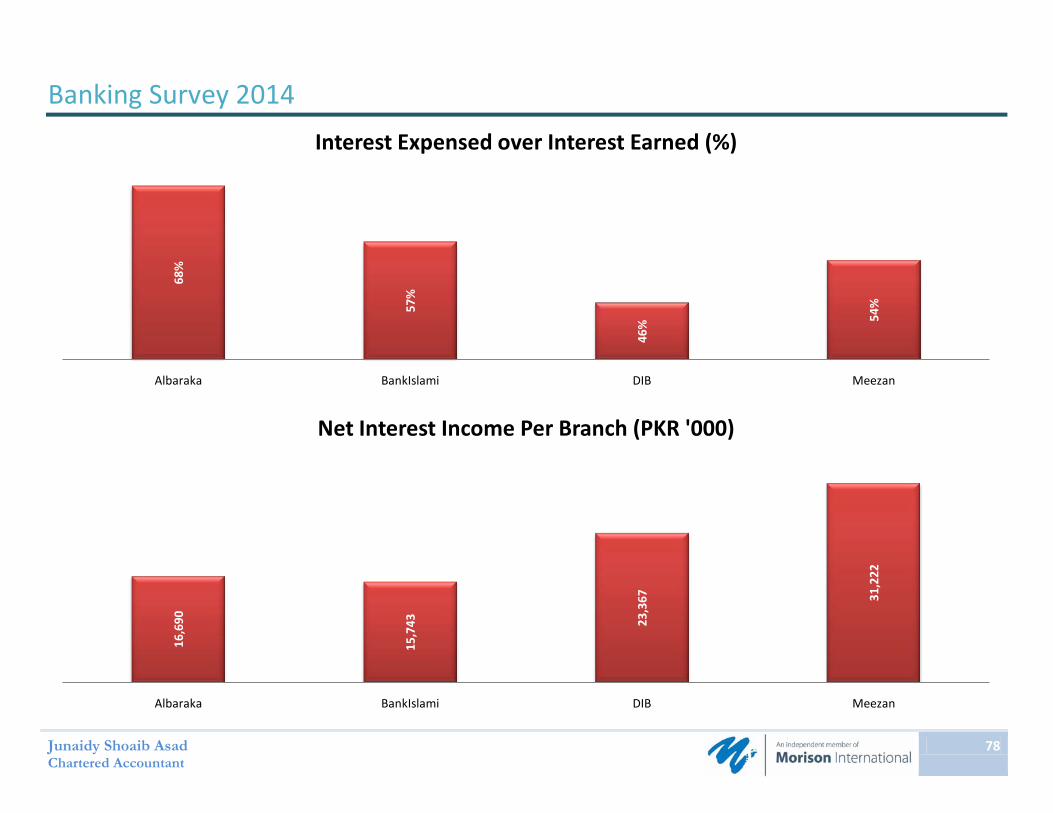
68%
57%
46% 54
%
Albaraka BankIslami DIB Meezan
Interest Expensed over Interest Earned (%)16
,690
15,7
43 23,3
67 31,2
22
Albaraka BankIslami DIB Meezan
Net Interest Income Per Branch (PKR '000)

Banking Survey 2014
Junaidy Shoaib Asad Chartered Accountant
79
3,09
1
1,81
8
4,60
8
3,66
7
Albaraka BankIslami DIB Meezan
Fee, Commission & Brokerage Income Per Branch (PKR '000)
1,500
809 700
3,800
Albaraka BankIslami DIB Meezan
Income from dealing in foreign currencies Per Branch (PKR '000)

Banking Survey 2014
Junaidy Shoaib Asad Chartered Accountant
80
The following pie-charts are expected to help the reader understand the income stream of the Islamic banks.
74%
14%
0%
7%5% 0%
Albaraka
74%
9%
1% 9%
6% 1%
Meezan
78%
16%
2% 4% 0%
DubaiIslamic
84%
10%4% 1%1%
BankIslami

Banking Survey 2014
Junaidy Shoaib Asad Chartered Accountant
81
Public Banks
1.4
1.2 1.4
1.3
2.0
BOK BOP FWBL NBP Sindh
Assets over Deposits
795,377
940,359
328,021
911,673
269,061
BOK (116) BOP (364) FWBL (41) NBP (1354) Sindh Bank (230)
Deposits per Branch (PKR '000)
Banking Survey 2014
Junaidy Shoaib Asad Chartered Accountant
82
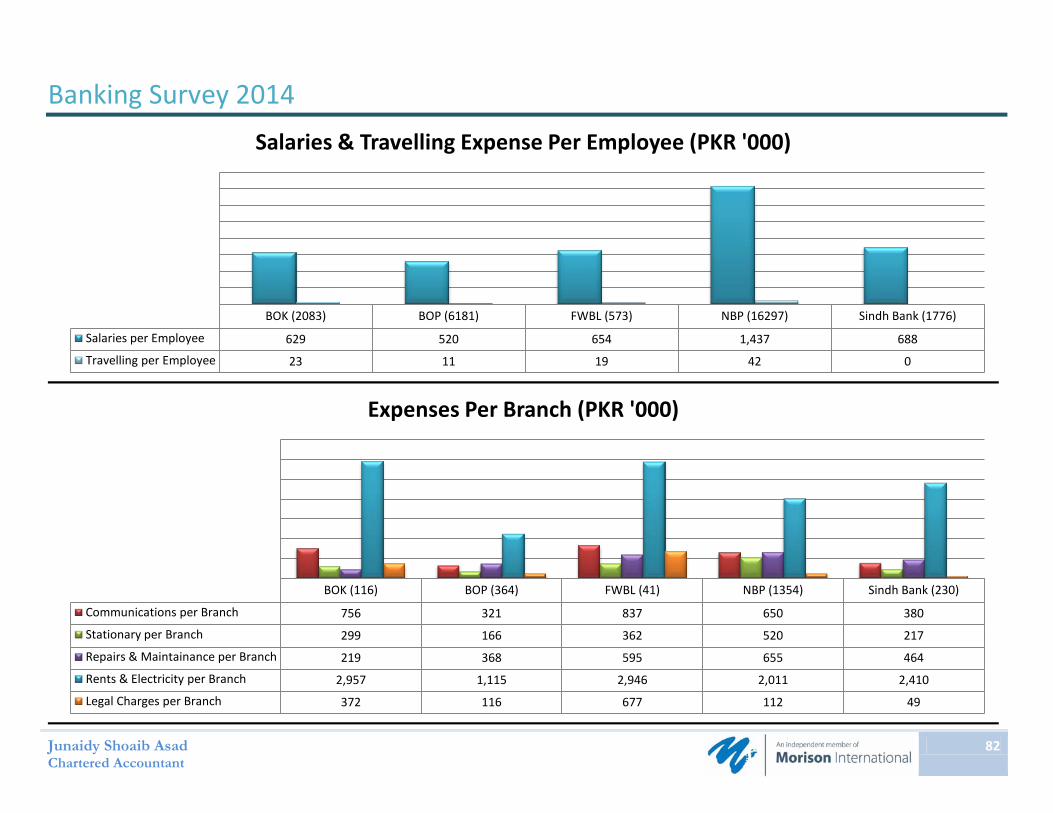
BOK (2083) BOP (6181) FWBL (573) NBP (16297) Sindh Bank (1776)
Salaries per Employee 629 520 654 1,437 688
Travelling per Employee 23 11 19 42 0
Salaries & Travelling Expense Per Employee (PKR '000)
BOK (116) BOP (364) FWBL (41) NBP (1354) Sindh Bank (230)
Communications per Branch 756 321 837 650 380
Stationary per Branch 299 166 362 520 217
Repairs & Maintainance per Branch 219 368 595 655 464
Rents & Electricity per Branch 2,957 1,115 2,946 2,011 2,410
Legal Charges per Branch 372 116 677 112 49
Expenses Per Branch (PKR '000)

Banking Survey 2014
Junaidy Shoaib Asad Chartered Accountant
83
64%
70%
62% 61% 62%
BOK BOP FWBL NBP Sindh
Interest Expensed over Interest Earned (%)
30,522
24,703
16,602
33,347
14,936
BOK BOP FWBL NBP Sindh
Net Interest Income Per Branch (PKR '000)
Banking Survey 2014
Junaidy Shoaib Asad Chartered Accountant
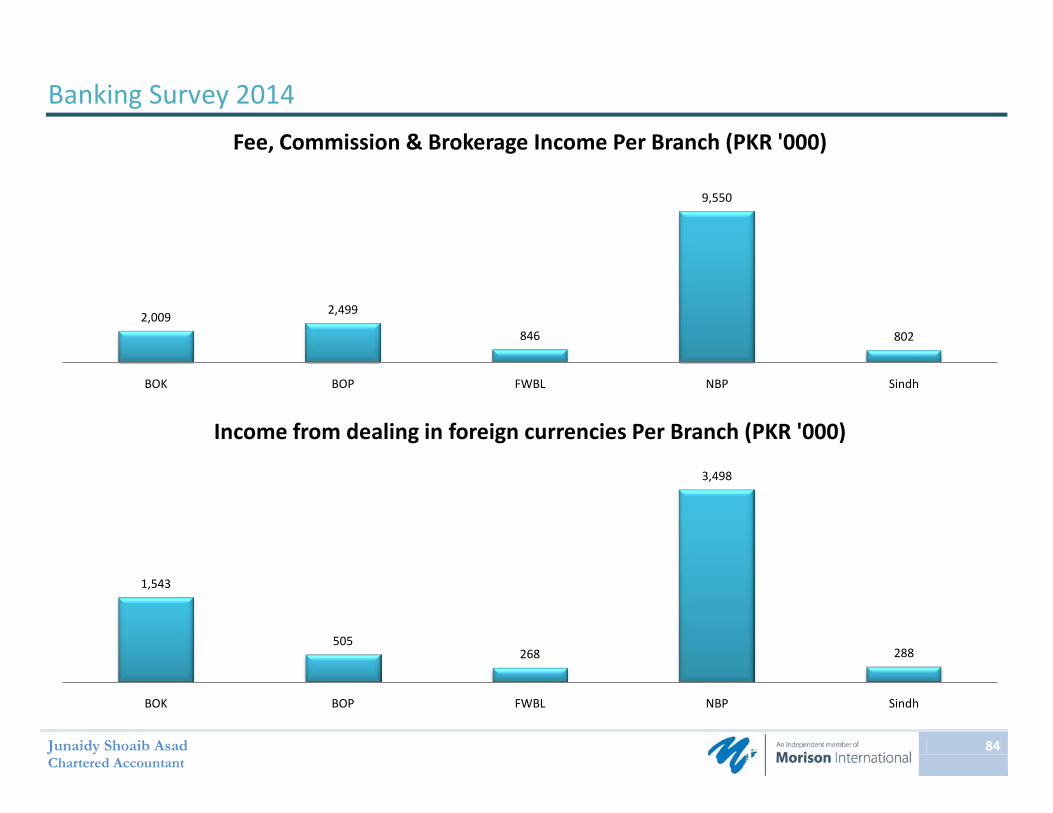
84
2,009 2,499
846
9,550
802
BOK BOP FWBL NBP Sindh
Fee, Commission & Brokerage Income Per Branch (PKR '000)
1,543
505268
3,498
288
BOK BOP FWBL NBP Sindh
Income from dealing in foreign currencies Per Branch (PKR '000)
Banking Survey 2014
Junaidy Shoaib Asad Chartered Accountant
85
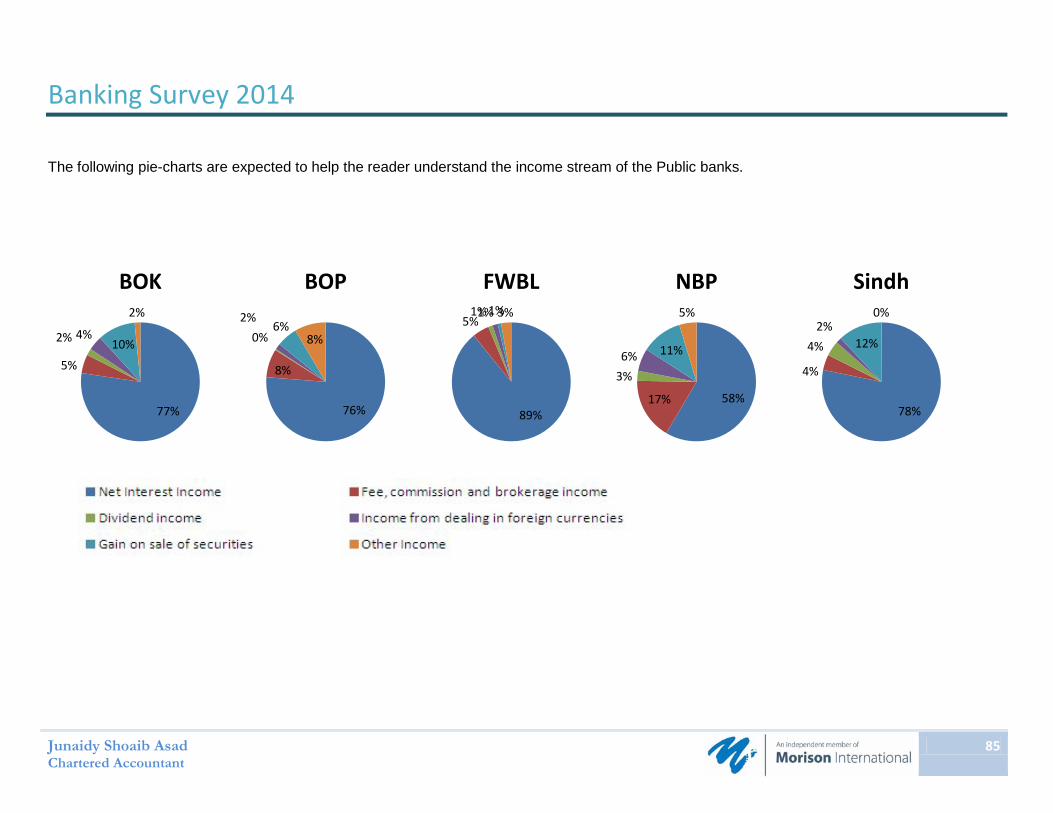
The following pie-charts are expected to help the reader understand the income stream of the Public banks.
77%
5%
2% 4%10%
2%
BOK
76%
8%
0%2%
6%8%
BOP
89%
5%1%1%1%3%
FWBL
58%17%
3%6% 11%
5%
NBP
78%
4%
4%2%
12%
0%
Sindh
CREDIT RATING
Banking Survey 2014
Junaidy Shoaib Asad Chartered Accountants
87
C
Rating
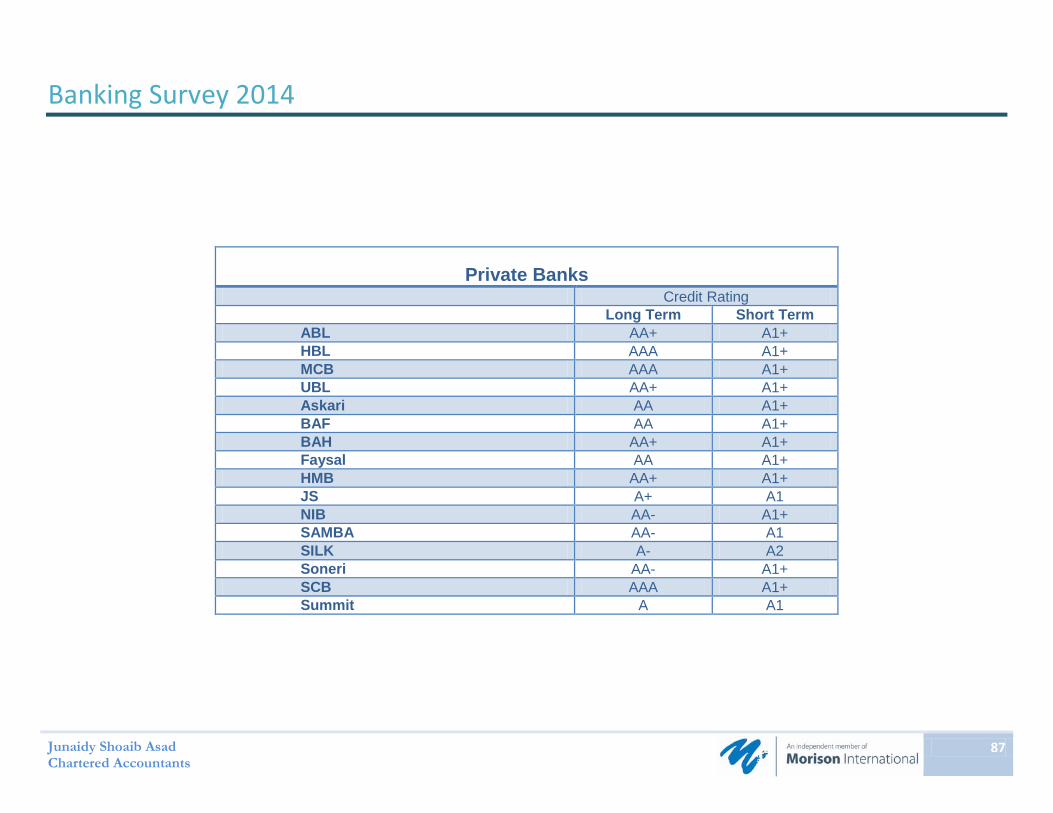
Private Banks Credit Rating Long Term Short Term
ABL AA+ A1+ HBL AAA A1+ MCB AAA A1+ UBL AA+ A1+ Askari AA A1+ BAF AA A1+ BAH AA+ A1+ Faysal AA A1+ HMB AA+ A1+ JS A+ A1 NIB AA- A1+ SAMBA AA- A1 SILK A- A2 Soneri AA- A1+ SCB AAA A1+ Summit A A1

Banking Survey 2014
Junaidy Shoaib Asad Chartered Accountants
88
Public Banks Credit Rating Long Term Short Term
FWBL BBB+ A2 NBP AAA A1 + Sindh AA A1 + BOK A A1 BOP AA- A1+
Islamic Banks Credit Rating Long Term Short Term
AlBaraka A A1 Islami A+ A1 Burj A A1 DIB A+ A1 Meezan AA A1+
Banking Survey 2014
Junaidy Shoaib Asad Chartered Accountants
89
Glossary
Average Advances The average of opening and closing advances at two year ends.
Average Assets The average of opening and closing total assets at two year ends.
Average Deposits The average of opening and closing deposits at two year ends.
Average Earning Assets The average of opening and closing earning assets at two year ends.
Average Equity The average of opening and closing equity at two year ends.
Earning Assets Deposits with treasury & other banks, lending to financial institutions, investments and advances.
Equity Equity includes shares capital, reserves, unappropriated profit/accumulated loss, minority interest and surplus / deficit on revaluation of assets.
Gross Advances Loans, cash credits, overdrafts, ijaras, etc. and local & foreign bills discounted &purchased before provisions.
Gross Spread Ratio Net mark-up return as a percentage of total mark-up income earned.
Non-funded Income Non-funded income comprises of non mark-up based income, which consists of fee, commission & brokerage income, income from dealing in foreign currencies, realized and un-realized gain on sale of assets & securities, etc.
Net interest margin Mark-up / return / interest earned (before provisions) as a percentage of interest bearing assets less markup / return / interest expensed as a percentage of interest bearing liabilities.
Operating costs Includes all expenses charged to arrive at profit before tax excluding cost of funds and provisions.
Operating fixed assets Operating fixed assets include intangible assets.
Banking Survey 2014
Junaidy Shoaib Asad Chartered Accountants
90
Other assets Other assets include deferred tax assets.
Other liabilities Other liabilities include deferred tax liabilities and liabilities against assets subject to finance lease.
Provisions Total of specific and general provisions against gross advances, charge & reversal of provision against non-performing advances, for diminution in value of investments, bad debts directly written-off and recoveries of previously written-off debts.
Return on Average Assets Net Income as a percentage of average total assets.
Return on Average Equity Profit before tax as a percentage of average equity.
Staff Cost Salaries, allowances, etc., staff retirement benefits and cost of redundancy / voluntary retirement etc., excluding Workers’ Welfare Fund.
Taxations Charge for current (including prior) and deferred taxation in the profit and loss account.
Banking Survey 2014
Junaidy Shoaib Asad Chartered Accountants
91
Junaidy Shoaib Asad, Chartered Accountants, a Partnership firm registered in Pakistan, is an independent member firm of Morison International.
The firm is in the profession of audit, accountancy, taxation, corporate affairs management advisory services corporate and other related legal advisory services. The firm is poised to deliver value added prompt professional services to its valued clientele, with strong professional team lead by its Partners and professional staff with country wide reach through its offices in Karachi, Lahore and Islamabad.
The information contained herein is of a general nature and is not intended to address the circumstances of any particular individual or entity. Although we endeavor to provide accurate and timely information, there can be no guarantee that such information is accurate as of the date it is received or that it will continue to be accurate in the future. No one should act on such information without appropriate professional advice after a thorough examination of the particular situation.
REGISTERED OFFICES
KARACHI LAHORE ISLAMABAD
1/6 - P, Block 6, P.E.C.H.S., Room No. 9A, #77 A, St. 45, Mohtarma Laqeeq Begum Road, Third Floor F-10/4 Off Shara-e-Faisal, Imtiaz Plaza Islamabad Main Nursery Flyover, Shahra-e-Quaid-e-Azam Karachi Lahore
For feedback, please email us at [email protected]
CONTACT US Phone: +92-021- 34371910-3 Fax: +92-021- 34371916 Email: [email protected] URL: www.jsa.com.pk