2014 school quality rating report
TRANSCRIPT

Overall Rating
School Quality Rating
Accountability Status
Performance Indicators
All Students 3
African-American Priority Group 4
Hispanic Priority Group 3
English Learners Priority Group
Diverse Learners Priority Group 1
All Students 3
African-American Priority Group 3
Hispanic Priority Group 3
English Learners Priority Group
Diverse Learners Priority Group 2
Percent Making National Average Growth 4
Reading attainment for 2nd grade 5
Math attainment for 2nd grade 5
Reading attainment for 3rd - 8th grade 3
Math attainment for 3rd - 8th grade 3
Average Daily Attendance Rate 3
Overall Rating 4
Growth on ACCESS exam 4
Data Quality Index score 4
For more information…
1 point
2 points
3 points
4 points
5 points
2014 School Quality Rating Report
Reading Growth on NWEA MAP (grades 3-8)
Not Applicable
NWEA Growth Percentage
Math Growth on NWEA MAP (grades 3-8)
Performance
Better than 48% of schools nationally
Better than 62% of schools nationally
Better than 43% of schools nationally
Better than 1% of schools nationally
Level 2+
Chicago Intl Charter - Bucktown
Better than 39% of schools nationally
Rating
Better than 45% of schools nationally
Attainment on NWEA
Better than 44% of schools nationally
Better than 12% of schools nationally
64.3% of students making target growth
Better than 94% of schools nationally
Better than 93% of schools nationally
Better than 56% of schools nationally
The School Quality Rating Policy (SQRP) is the district's policy for evaluating each school's
academic performance each year. The rating on this report is based on how the school
performed in the 2013-2014 school year, and it is used to determine the school's
accountability status for the 2014-2015 school year. You can find more information about
the SQRP at http://www.cps.edu/sqrp.
Ratings Legend
Organized
Better than 49% of schools nationally
94.3% attendance
English Learner Progress
Data Quality
51.4% of students making target growth
98.4% success
Attendance Rate
My Voice, My School Survey Results

Overall Rating
School Quality Rating
Accountability Status
Performance Indicators
All Students 1
African-American Priority Group 1
Hispanic Priority Group
English Learners Priority Group
Diverse Learners Priority Group
All Students 1
4-year cohort graduation rate 1
Early college and career credientials 1
College enrollment rate (Class of 2013) 1
College persistence rate (Class of 2012) 1
Average Daily Attendance Rate 1
1-year dropout rate 1
Freshman on-track rate 2
Overall Rating
Data Quality Index score 4
For more information…
1 point
2 points
3 points
4 points
5 points
Growth on EPAS assessment series (grades 9-11)
2014 School Quality Rating Report
Emil G Hirsch Metropolitan High School
Intensive Support (7 years)
Performance Rating
Level 3
Better than 18% of schools nationally
Better than 18% of schools nationally
Attainment on EPAS assessment series (grades 9-11)
Better than 5% of schools nationally
Not Enough Data
Graduation and Post-Secondary Success
44 % of graduates persisting in college
47.9% graduation rate
2 % of graduates earning credentials
26.3 % of graduates enrolling in college
Data Quality
97.9% success
Ratings Legend
The School Quality Rating Policy (SQRP) is the district's policy for evaluating each school's
academic performance each year. The rating on this report is based on how the school
performed in the 2013-2014 school year, and it is used to determine the school's
accountability status for the 2014-2015 school year. You can find more information about
the SQRP at http://www.cps.edu/sqrp.
Progress to Graduation
24.8% dropout rate
63.5% of freshmen on-track to graduate
My Voice, My School Survey Results
69.6% attendance rate

Overall Rating
School Quality Rating
Accountability Status
Performance Indicators
All Students 4
African-American Priority Group 5
Hispanic Priority Group 4
English Learners Priority Group
Diverse Learners Priority Group
All Students 3
4-year cohort graduation rate
Early college and career credientials
College enrollment rate (Class of 2013)
College persistence rate (Class of 2012)
Average Daily Attendance Rate 4
1-year dropout rate 5
Freshman on-track rate 3
Overall Rating 4
Data Quality Index score 4
For more information…
1 point
2 points
3 points
4 points
5 points
Growth on EPAS assessment series (grades 9-11)
2014 School Quality Rating Report
Intrinsic Charter HS
Not Applicable
Performance Rating
Level 1
Better than 73% of schools nationally
Better than 89% of schools nationally
Better than 66% of schools nationally
Attainment on EPAS assessment series (grades 9-11)
Better than 40% of schools nationally
Organized
Graduation and Post-Secondary Success
Data Quality
98.6% success
Ratings Legend
The School Quality Rating Policy (SQRP) is the district's policy for evaluating each school's
academic performance each year. The rating on this report is based on how the school
performed in the 2013-2014 school year, and it is used to determine the school's
accountability status for the 2014-2015 school year. You can find more information about
the SQRP at http://www.cps.edu/sqrp.
Progress to Graduation
1.1% dropout rate
79.9% of freshmen on-track to graduate
My Voice, My School Survey Results
91.9% attendance rate

Overall Rating
School Quality Rating
Accountability Status
Performance Indicators
All Students 4
African-American Priority Group 4
Hispanic Priority Group 5
English Learners Priority Group
Diverse Learners Priority Group 4
All Students 4
African-American Priority Group 2
Hispanic Priority Group 4
English Learners Priority Group
Diverse Learners Priority Group 3
Percent Making National Average Growth 4
Reading attainment for 2nd grade 5
Math attainment for 2nd grade 4
Reading attainment for 3rd - 8th grade 5
Math attainment for 3rd - 8th grade 5
Average Daily Attendance Rate 5
Overall Rating 5
Growth on ACCESS exam 3
Data Quality Index score 5
For more information…
1 point
2 points
3 points
4 points
5 points
2014 School Quality Rating Report
Reading Growth on NWEA MAP (grades 3-8)
Not Applicable
NWEA Growth Percentage
Math Growth on NWEA MAP (grades 3-8)
Performance
Better than 86% of schools nationally
Better than 64% of schools nationally
Better than 86% of schools nationally
Better than 66% of schools nationally
Level 1+
Chicago Intl Charter - Irving Park
Better than 28% of schools nationally
Rating
Better than 69% of schools nationally
Attainment on NWEA
Better than 72% of schools nationally
Better than 34% of schools nationally
66.6% of students making target growth
Better than 91% of schools nationally
Better than 86% of schools nationally
Better than 93% of schools nationally
The School Quality Rating Policy (SQRP) is the district's policy for evaluating each school's
academic performance each year. The rating on this report is based on how the school
performed in the 2013-2014 school year, and it is used to determine the school's
accountability status for the 2014-2015 school year. You can find more information about
the SQRP at http://www.cps.edu/sqrp.
Ratings Legend
Well Organized
Better than 94% of schools nationally
96.2% attendance
English Learner Progress
Data Quality
43.2% of students making target growth
100% success
Attendance Rate
My Voice, My School Survey Results
Overall Rating
School Quality Rating
Accountability Status
Performance Indicators
All Students 2
African-American Priority Group 1
Hispanic Priority Group 4
English Learners Priority Group
Diverse Learners Priority Group
All Students 2
African-American Priority Group 3
Hispanic Priority Group 3
English Learners Priority Group
Diverse Learners Priority Group
Percent Making National Average Growth 4
Reading attainment for 2nd grade 4
Math attainment for 2nd grade 3
Reading attainment for 3rd - 8th grade 2
Math attainment for 3rd - 8th grade 2
Average Daily Attendance Rate 4
Overall Rating 3
Growth on ACCESS exam 3
Data Quality Index score 5
For more information…
1 point
2 points
3 points
4 points
5 points
2014 School Quality Rating Report
Reading Growth on NWEA MAP (grades 3-8)
Not Applicable
NWEA Growth Percentage
Math Growth on NWEA MAP (grades 3-8)
Performance
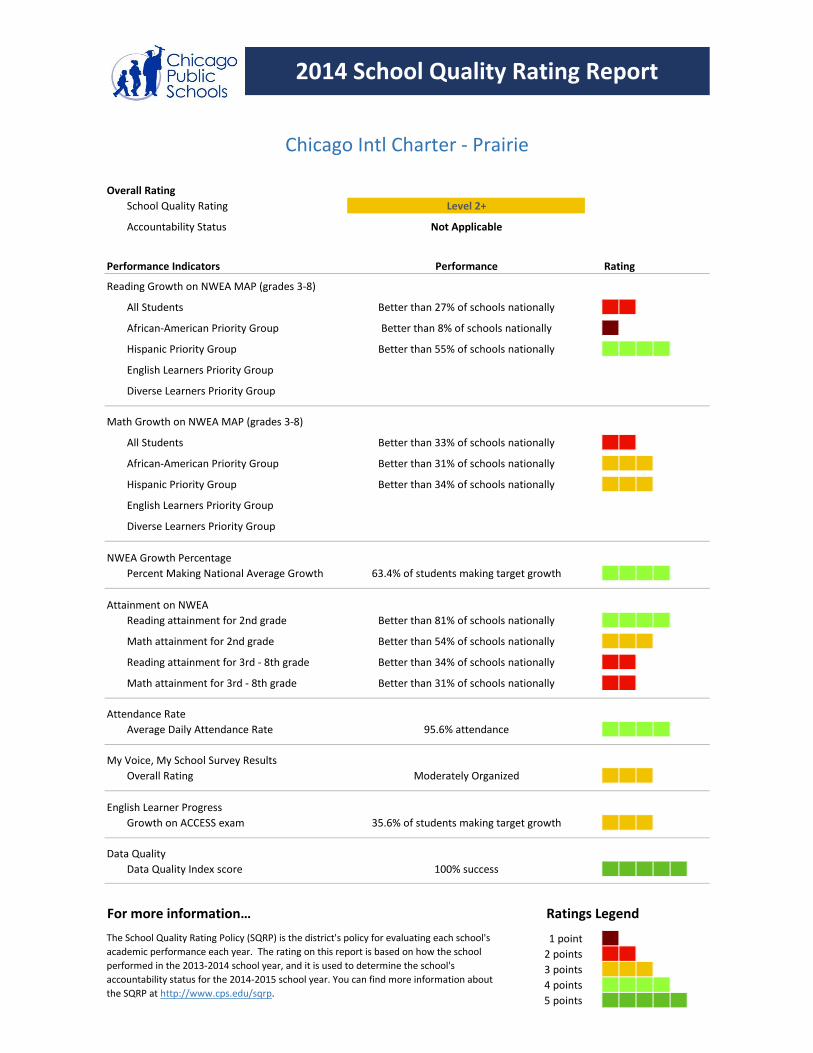
Better than 27% of schools nationally
Better than 8% of schools nationally
Better than 55% of schools nationally
Level 2+
Chicago Intl Charter - Prairie
Better than 31% of schools nationally
Rating
Better than 34% of schools nationally
Attainment on NWEA
Better than 33% of schools nationally
63.4% of students making target growth
Better than 81% of schools nationally
Better than 54% of schools nationally
Better than 34% of schools nationally
The School Quality Rating Policy (SQRP) is the district's policy for evaluating each school's
academic performance each year. The rating on this report is based on how the school
performed in the 2013-2014 school year, and it is used to determine the school's
accountability status for the 2014-2015 school year. You can find more information about
the SQRP at http://www.cps.edu/sqrp.
Ratings Legend
Moderately Organized
Better than 31% of schools nationally
95.6% attendance
English Learner Progress
Data Quality
35.6% of students making target growth
100% success
Attendance Rate
My Voice, My School Survey Results
Overall Rating
School Quality Rating
Accountability Status
Performance Indicators
All Students 5
African-American Priority Group
Hispanic Priority Group 5
English Learners Priority Group
Diverse Learners Priority Group 3
All Students 4
African-American Priority Group
Hispanic Priority Group 5
English Learners Priority Group
Diverse Learners Priority Group 2
Percent Making National Average Growth 5
Reading attainment for 2nd grade 5
Math attainment for 2nd grade 5
Reading attainment for 3rd - 8th grade 4
Math attainment for 3rd - 8th grade 4
Average Daily Attendance Rate 5
Overall Rating 5
Growth on ACCESS exam 4
Data Quality Index score 5
For more information…
1 point
2 points
3 points
4 points
5 points
2014 School Quality Rating Report
Reading Growth on NWEA MAP (grades 3-8)
Not Applicable
NWEA Growth Percentage
Math Growth on NWEA MAP (grades 3-8)
Performance
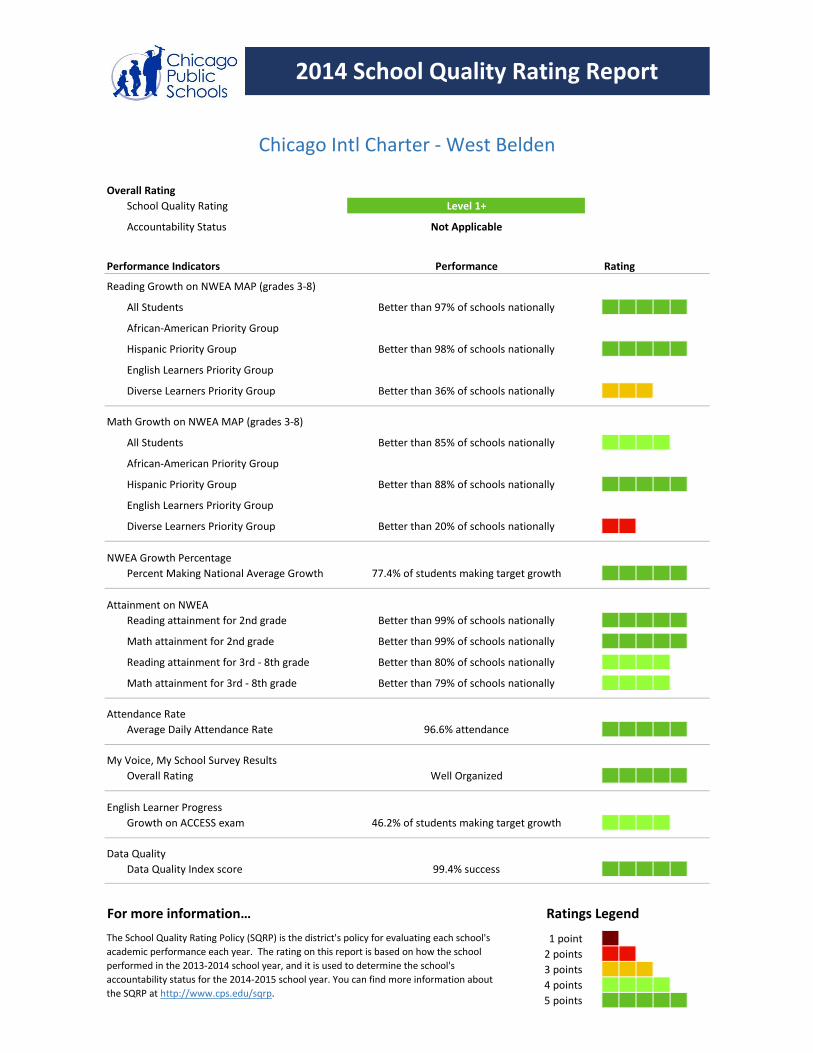
Better than 97% of schools nationally
Better than 98% of schools nationally
Better than 36% of schools nationally
Level 1+
Chicago Intl Charter - West Belden
Rating
Better than 88% of schools nationally
Attainment on NWEA
Better than 85% of schools nationally
Better than 20% of schools nationally
77.4% of students making target growth
Better than 99% of schools nationally
Better than 99% of schools nationally
Better than 80% of schools nationally
The School Quality Rating Policy (SQRP) is the district's policy for evaluating each school's
academic performance each year. The rating on this report is based on how the school
performed in the 2013-2014 school year, and it is used to determine the school's
accountability status for the 2014-2015 school year. You can find more information about
the SQRP at http://www.cps.edu/sqrp.
Ratings Legend
Well Organized
Better than 79% of schools nationally
96.6% attendance
English Learner Progress
Data Quality
46.2% of students making target growth
99.4% success
Attendance Rate
My Voice, My School Survey Results
Overall Rating
School Quality Rating
Accountability Status
Performance Indicators
All Students 2
African-American Priority Group 2
Hispanic Priority Group 3
English Learners Priority Group
Diverse Learners Priority Group 1
All Students 2
African-American Priority Group 2
Hispanic Priority Group 3
English Learners Priority Group
Diverse Learners Priority Group 3
Percent Making National Average Growth 2
Reading attainment for 2nd grade 4
Math attainment for 2nd grade 4
Reading attainment for 3rd - 8th grade 3
Math attainment for 3rd - 8th grade 3
Average Daily Attendance Rate 3
Overall Rating 4
Growth on ACCESS exam 4
Data Quality Index score 5
For more information…
1 point
2 points
3 points
4 points
5 points
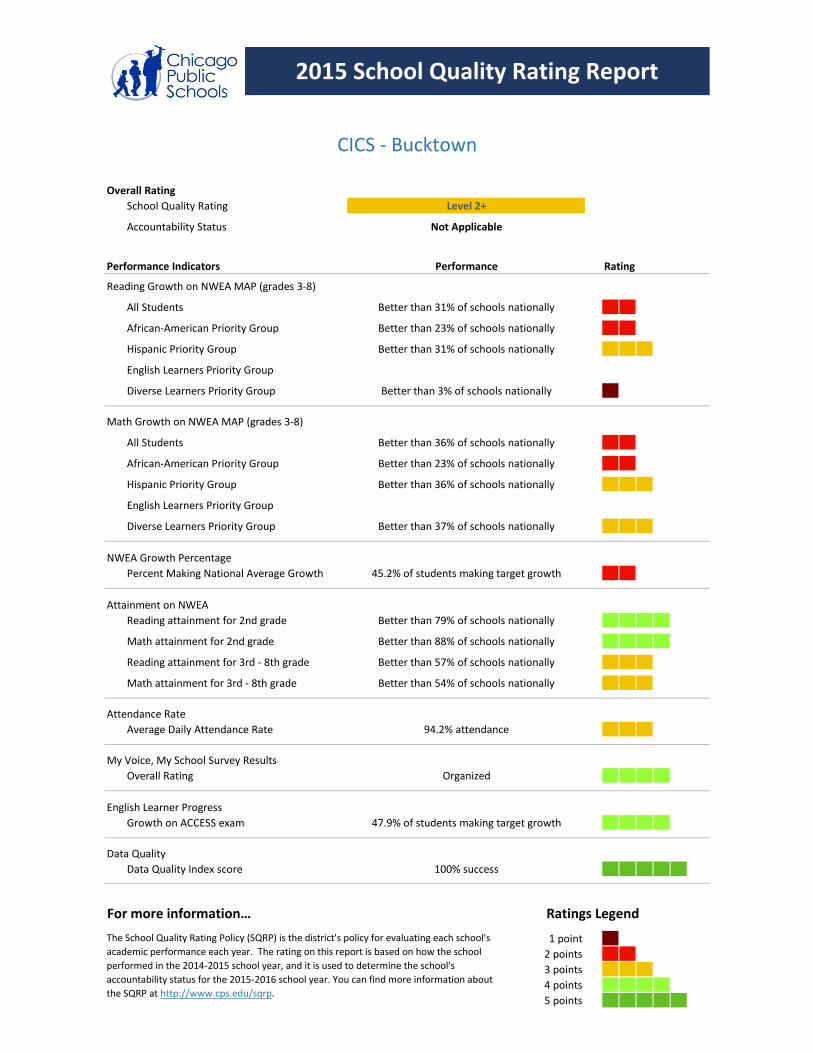
Better than 79% of schools nationally
Better than 88% of schools nationally
Better than 57% of schools nationally
The School Quality Rating Policy (SQRP) is the district's policy for evaluating each school's
academic performance each year. The rating on this report is based on how the school
performed in the 2014-2015 school year, and it is used to determine the school's
accountability status for the 2015-2016 school year. You can find more information about
the SQRP at http://www.cps.edu/sqrp.
Ratings Legend
Organized
Better than 54% of schools nationally
94.2% attendance
English Learner Progress
Data Quality
47.9% of students making target growth
100% success
Attendance Rate
My Voice, My School Survey Results
Attainment on NWEA
Better than 36% of schools nationally
Better than 37% of schools nationally
45.2% of students making target growth
2015 School Quality Rating Report
Reading Growth on NWEA MAP (grades 3-8)
Not Applicable
NWEA Growth Percentage
Math Growth on NWEA MAP (grades 3-8)
Performance
Better than 31% of schools nationally
Better than 23% of schools nationally
Better than 31% of schools nationally
Better than 3% of schools nationally
Level 2+
CICS - Bucktown
Better than 23% of schools nationally
Rating
Better than 36% of schools nationally
Overall Rating
School Quality Rating
Accountability Status
Performance Indicators
All Students 1
African-American Priority Group
Hispanic Priority Group
English Learners Priority Group
Diverse Learners Priority Group
All Students 1
4-year cohort graduation rate 1
Early college and career credentials 1
College enrollment rate (Class of 2014) 1
College persistence rate (Class of 2013) 1
Average Daily Attendance Rate 1
1-year dropout rate 1
Freshman on-track rate 1
Overall Rating 1
Data Quality Index score 4
For more information…
1 point
2 points
3 points
4 points
5 points
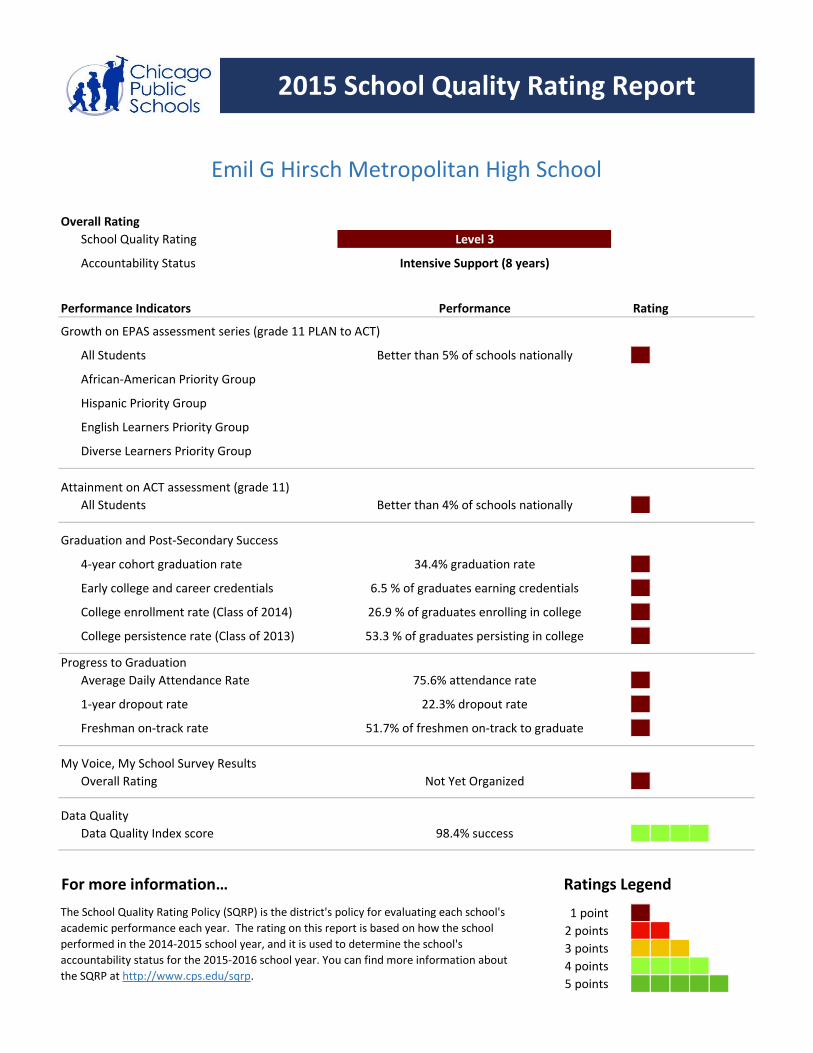
Growth on EPAS assessment series (grade 11 PLAN to ACT)
2015 School Quality Rating Report
Emil G Hirsch Metropolitan High School
Intensive Support (8 years)
Performance Rating
Level 3
Better than 5% of schools nationally
Attainment on ACT assessment (grade 11)
Better than 4% of schools nationally
Not Yet Organized
Graduation and Post-Secondary Success
53.3 % of graduates persisting in college
34.4% graduation rate
6.5 % of graduates earning credentials
26.9 % of graduates enrolling in college
Data Quality
98.4% success
Ratings Legend
The School Quality Rating Policy (SQRP) is the district's policy for evaluating each school's
academic performance each year. The rating on this report is based on how the school
performed in the 2014-2015 school year, and it is used to determine the school's
accountability status for the 2015-2016 school year. You can find more information about
the SQRP at http://www.cps.edu/sqrp.
Progress to Graduation
22.3% dropout rate
51.7% of freshmen on-track to graduate
My Voice, My School Survey Results
75.6% attendance rate

Overall Rating
School Quality Rating
Accountability Status
Elementary School Performance Indicators
All Students 3
African-American Priority Group
Hispanic Priority Group 4
English Learners Priority Group
Diverse Learners Priority Group
All Students 3
African-American Priority Group
Hispanic Priority Group 3
English Learners Priority Group
Diverse Learners Priority Group
Percent Making National Average Growth 3
Reading attainment for 2nd grade
Math attainment for 2nd grade
Reading attainment for 3rd - 8th grade 4
Math attainment for 3rd - 8th grade 4
Average Daily Attendance Rate 5
Overall Rating 5
Growth on ACCESS exam
Data Quality Index score 5
See back page for high school data.
1 point
2 points
3 points
4 points
5 points
Data Quality
99.5% success
Ratings Legend
English Learner Progress
NWEA Growth Percentage
54.1% of students making target growth
Attainment on NWEA
Better than 72% of schools nationally
Better than 77% of schools nationally
Attendance Rate
97.2% attendance
My Voice, My School Survey Results
Well Organized
Reading Growth on NWEA MAP (grades 3-8)
Better than 65% of schools nationally
Better than 58% of schools nationally
Math Growth on NWEA MAP (grades 3-8)
Better than 48% of schools nationally
Better than 34% of schools nationally
2015 School Quality Rating Report
Intrinsic Charter School
Level 1+
Not Applicable
Performance Rating

High School Performance Indicators
All Students
African-American Priority Group
Hispanic Priority Group
English Learners Priority Group
Diverse Learners Priority Group
All Students
4-year cohort graduation rate
Early college and career credentials
College enrollment rate (Class of 2014)
College persistence rate (Class of 2013)
Average Daily Attendance Rate 4
1-year dropout rate 4
Freshman on-track rate 4
Overall Rating 5
Data Quality Index score 5
For more information…
1 point
2 points
3 points
4 points
5 points
Ratings Legend
The School Quality Rating Policy (SQRP) is the district's policy for evaluating each school's
academic performance each year. The rating on this report is based on how the school
performed in the 2014-2015 school year, and it is used to determine the school's
accountability status for the 2015-2016 school year. You can find more information about
the SQRP at http://www.cps.edu/sqrp.
Attainment on ACT assessment (grade 11)
Graduation and Post-Secondary Success
Progress to Graduation
93.9% attendance rate
2.4% dropout rate
86.4% of freshmen on-track to graduate
My Voice, My School Survey Results
Well Organized
Data Quality
99.5% success
Growth on EPAS assessment series (grade 11 PLAN to ACT)
2015 School Quality Rating Report
Performance Rating

Overall Rating
School Quality Rating
Accountability Status
Performance Indicators
All Students 3
African-American Priority Group
Hispanic Priority Group 3
English Learners Priority Group
Diverse Learners Priority Group 1
All Students 2
African-American Priority Group
Hispanic Priority Group 2
English Learners Priority Group
Diverse Learners Priority Group 1
Percent Making National Average Growth 2
Reading attainment for 2nd grade 4
Math attainment for 2nd grade 4
Reading attainment for 3rd - 8th grade 5
Math attainment for 3rd - 8th grade 5
Average Daily Attendance Rate 4
Overall Rating 5
Growth on ACCESS exam 3
Data Quality Index score 5
For more information…
1 point
2 points
3 points
4 points
5 points
Better than 72% of schools nationally
Better than 88% of schools nationally
Better than 90% of schools nationally
The School Quality Rating Policy (SQRP) is the district's policy for evaluating each school's
academic performance each year. The rating on this report is based on how the school
performed in the 2014-2015 school year, and it is used to determine the school's
accountability status for the 2015-2016 school year. You can find more information about
the SQRP at http://www.cps.edu/sqrp.
Ratings Legend
Well Organized
Better than 92% of schools nationally
95.9% attendance
English Learner Progress
Data Quality
38.8% of students making target growth
99.9% success
Attendance Rate
My Voice, My School Survey Results
Attainment on NWEA
Better than 34% of schools nationally
Better than 2% of schools nationally
44% of students making target growth
2015 School Quality Rating Report
Reading Growth on NWEA MAP (grades 3-8)
Not Applicable
NWEA Growth Percentage
Math Growth on NWEA MAP (grades 3-8)
Performance
Better than 55% of schools nationally
Better than 31% of schools nationally
Better than 1% of schools nationally
Level 1+
CICS - Irving Park
Rating
Better than 26% of schools nationally
Overall Rating
School Quality Rating
Accountability Status
Performance Indicators
All Students 2
African-American Priority Group 1
Hispanic Priority Group 2
English Learners Priority Group
Diverse Learners Priority Group
All Students 2
African-American Priority Group 2
Hispanic Priority Group 2
English Learners Priority Group
Diverse Learners Priority Group
Percent Making National Average Growth 2
Reading attainment for 2nd grade 4
Math attainment for 2nd grade 4
Reading attainment for 3rd - 8th grade 2
Math attainment for 3rd - 8th grade 2
Average Daily Attendance Rate 4
Overall Rating 3
Growth on ACCESS exam 2
Data Quality Index score 5
For more information…
1 point
2 points
3 points
4 points
5 points
Better than 79% of schools nationally
Better than 80% of schools nationally
Better than 26% of schools nationally
The School Quality Rating Policy (SQRP) is the district's policy for evaluating each school's
academic performance each year. The rating on this report is based on how the school
performed in the 2014-2015 school year, and it is used to determine the school's
accountability status for the 2015-2016 school year. You can find more information about
the SQRP at http://www.cps.edu/sqrp.
Ratings Legend
Moderately Organized
Better than 24% of schools nationally
95.6% attendance
English Learner Progress
Data Quality
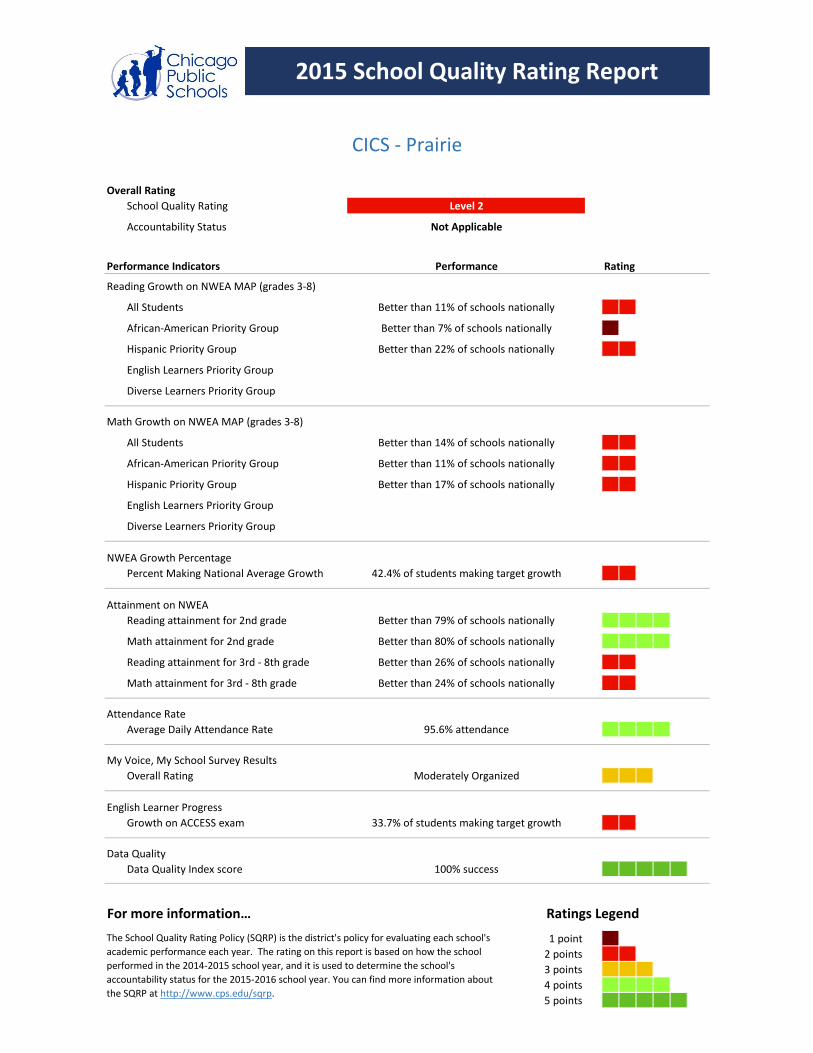
33.7% of students making target growth
100% success
Attendance Rate
My Voice, My School Survey Results
Attainment on NWEA
Better than 14% of schools nationally
42.4% of students making target growth
2015 School Quality Rating Report
Reading Growth on NWEA MAP (grades 3-8)
Not Applicable
NWEA Growth Percentage
Math Growth on NWEA MAP (grades 3-8)
Performance
Better than 11% of schools nationally
Better than 7% of schools nationally
Better than 22% of schools nationally
Level 2
CICS - Prairie
Better than 11% of schools nationally
Rating
Better than 17% of schools nationally
Overall Rating
School Quality Rating
Accountability Status
Performance Indicators
All Students 3
African-American Priority Group
Hispanic Priority Group 3
English Learners Priority Group 1
Diverse Learners Priority Group 1
All Students 3
African-American Priority Group
Hispanic Priority Group 3
English Learners Priority Group 2
Diverse Learners Priority Group 2
Percent Making National Average Growth 2
Reading attainment for 2nd grade 5
Math attainment for 2nd grade 5
Reading attainment for 3rd - 8th grade 4
Math attainment for 3rd - 8th grade 4
Average Daily Attendance Rate 5
Overall Rating 5
Growth on ACCESS exam 3
Data Quality Index score 5
For more information…
1 point
2 points
3 points
4 points
5 points
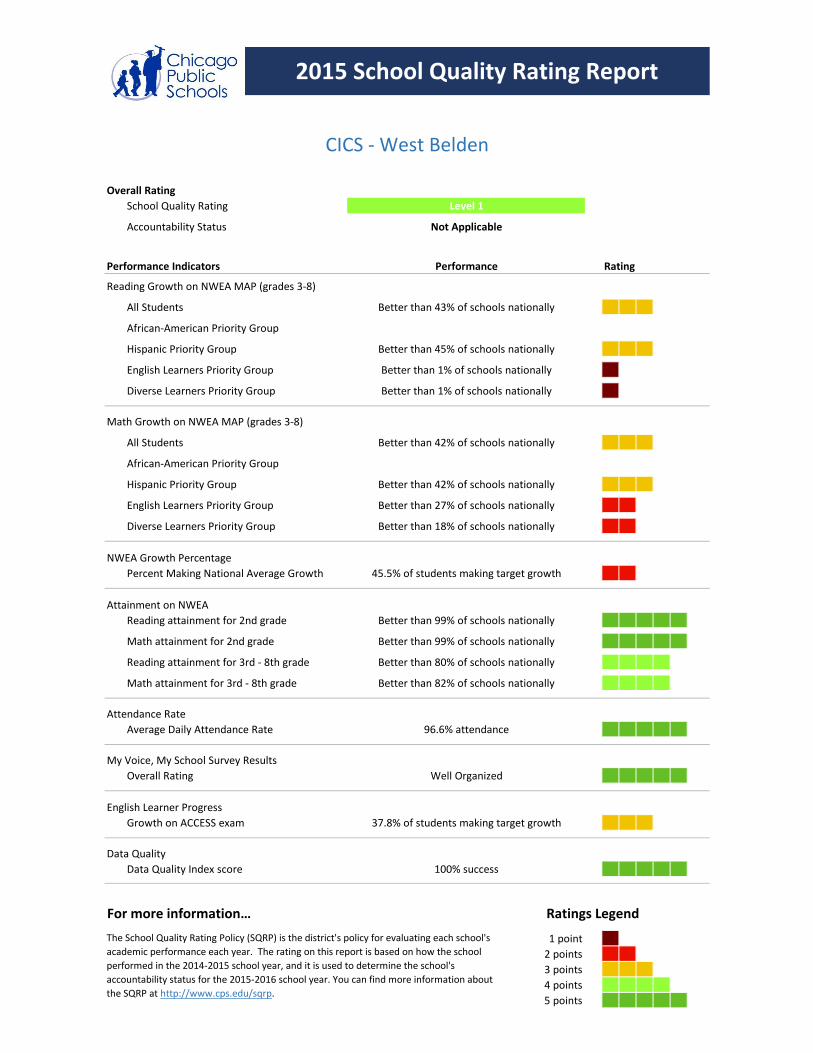
Better than 99% of schools nationally
Better than 99% of schools nationally
Better than 80% of schools nationally
The School Quality Rating Policy (SQRP) is the district's policy for evaluating each school's
academic performance each year. The rating on this report is based on how the school
performed in the 2014-2015 school year, and it is used to determine the school's
accountability status for the 2015-2016 school year. You can find more information about
the SQRP at http://www.cps.edu/sqrp.
Ratings Legend
Well Organized
Better than 82% of schools nationally
96.6% attendance
English Learner Progress
Data Quality
37.8% of students making target growth
100% success
Attendance Rate
My Voice, My School Survey Results
Attainment on NWEA
Better than 42% of schools nationally
Better than 27% of schools nationally
Better than 18% of schools nationally
45.5% of students making target growth
2015 School Quality Rating Report
Reading Growth on NWEA MAP (grades 3-8)
Not Applicable
NWEA Growth Percentage
Math Growth on NWEA MAP (grades 3-8)
Performance
Better than 43% of schools nationally
Better than 45% of schools nationally
Better than 1% of schools nationally
Better than 1% of schools nationally
Level 1
CICS - West Belden
Rating
Better than 42% of schools nationally

Overall Rating
School Quality Rating
Accountability Status
Performance Indicators
All Students 3
African-American Priority Group 3
Hispanic Priority Group 5
English Learners Priority Group
Diverse Learners Priority Group 4
All Students 2
African-American Priority Group 4
Hispanic Priority Group 3
English Learners Priority Group
Diverse Learners Priority Group 3
Percent Making National Average Growth 3
Reading attainment for 2nd grade 5
Math attainment for 2nd grade 5
Reading attainment for 3rd - 8th grade 3
Math attainment for 3rd - 8th grade 3
Average Daily Attendance Rate 4
Overall Rating 5
Growth on ACCESS exam 1
Data Quality Index score 5
For more information…
1 point
2 points
3 points
4 points
5 points
2016 School Quality Rating Report
Reading Growth on NWEA MAP (grades 3-8)
Not Applicable
NWEA Growth Percentage
Math Growth on NWEA MAP (grades 3-8)
Performance
Better than 68% of schools nationally
Better than 40% of schools nationally
Better than 75% of schools nationally
Better than 60% of schools nationally
Level 2+
CICS - Bucktown
Better than 53% of schools nationally
Rating
Better than 31% of schools nationally
Attainment on NWEA
Better than 34% of schools nationally
Better than 45% of schools nationally
51.5% of students making target growth
Better than 99% of schools nationally
Better than 99% of schools nationally
Better than 60% of schools nationally
The School Quality Rating Policy (SQRP) is the district's policy for evaluating each school's
academic performance each year. The rating on this report is based on how the school
performed in the 2015-2016 school year, and it is used to determine the school's
accountability status for the 2016-2017 school year. You can find more information about
the SQRP at http://www.cps.edu/sqrp.
Ratings Legend
Well Organized
Better than 43% of schools nationally
95.2% attendance
English Learner Progress
Data Quality
24.4% of students making target growth
99.9% success
Attendance Rate
My Voice, My School Survey Results
Overall Rating
School Quality Rating
Accountability Status
Performance Indicators
All Students 1
African-American Priority Group
Hispanic Priority Group
English Learners Priority Group
Diverse Learners Priority Group
All Students 1
4-year cohort graduation rate 1
Early college and career credentials 1
College enrollment rate (Class of 2015) 1
College persistence rate (Class of 2014) 2
Average Daily Attendance Rate 1
1-year dropout rate 1
Freshman on-track rate 4
Overall Rating 5
Data Quality Index score 4
For more information…
1 point
2 points
3 points
4 points
5 points
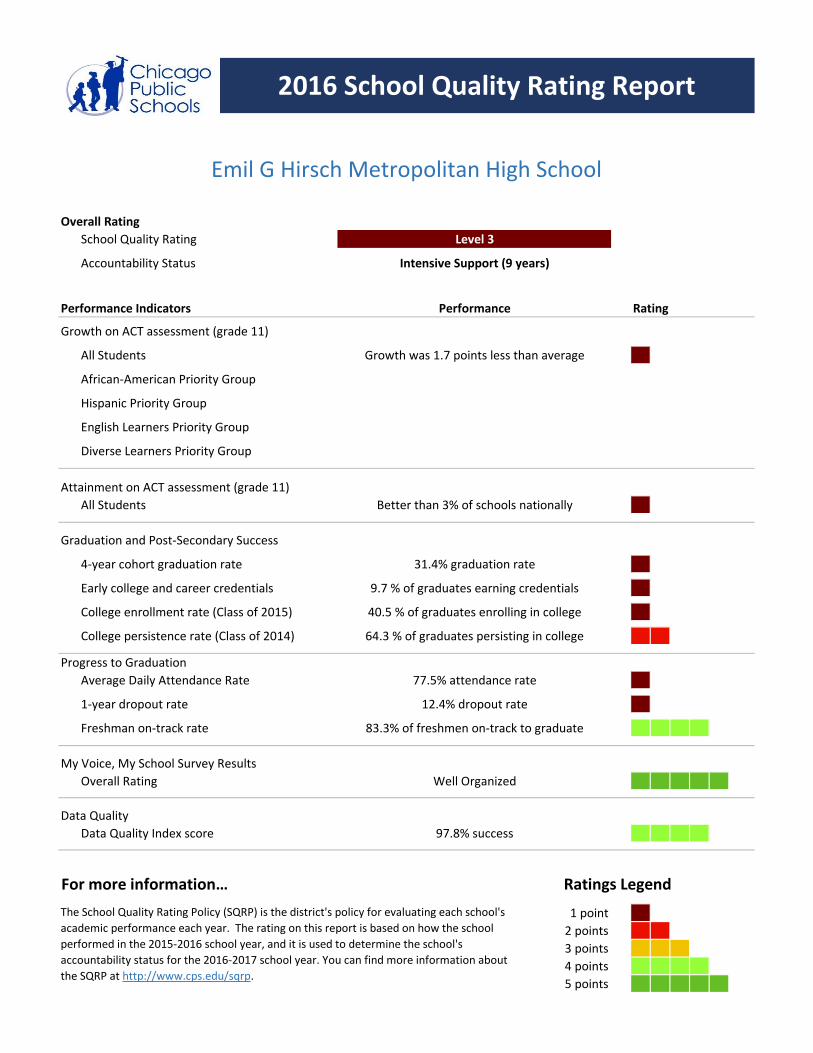
Data Quality
97.8% success
Ratings Legend
The School Quality Rating Policy (SQRP) is the district's policy for evaluating each school's
academic performance each year. The rating on this report is based on how the school
performed in the 2015-2016 school year, and it is used to determine the school's
accountability status for the 2016-2017 school year. You can find more information about
the SQRP at http://www.cps.edu/sqrp.
Progress to Graduation
12.4% dropout rate
83.3% of freshmen on-track to graduate
My Voice, My School Survey Results
77.5% attendance rate
Attainment on ACT assessment (grade 11)
Better than 3% of schools nationally
Well Organized
Graduation and Post-Secondary Success
64.3 % of graduates persisting in college
31.4% graduation rate
9.7 % of graduates earning credentials
40.5 % of graduates enrolling in college
Growth was 1.7 points less than average
Growth on ACT assessment (grade 11)
2016 School Quality Rating Report
Emil G Hirsch Metropolitan High School
Intensive Support (9 years)
Performance Rating
Level 3
Overall Rating
School Quality Rating
Accountability Status
Elementary School Performance Indicators
All Students 4
African-American Priority Group
Hispanic Priority Group 5
English Learners Priority Group
Diverse Learners Priority Group 5
All Students 5
African-American Priority Group
Hispanic Priority Group 5
English Learners Priority Group
Diverse Learners Priority Group 3
Percent Making National Average Growth 4
Reading attainment for 2nd grade
Math attainment for 2nd grade
Reading attainment for 3rd - 8th grade 4
Math attainment for 3rd - 8th grade 4
Average Daily Attendance Rate 4
Overall Rating 5
Growth on ACCESS exam 1
Data Quality Index score 5
See back page for high school data.
1 point
2 points
3 points
4 points
5 points
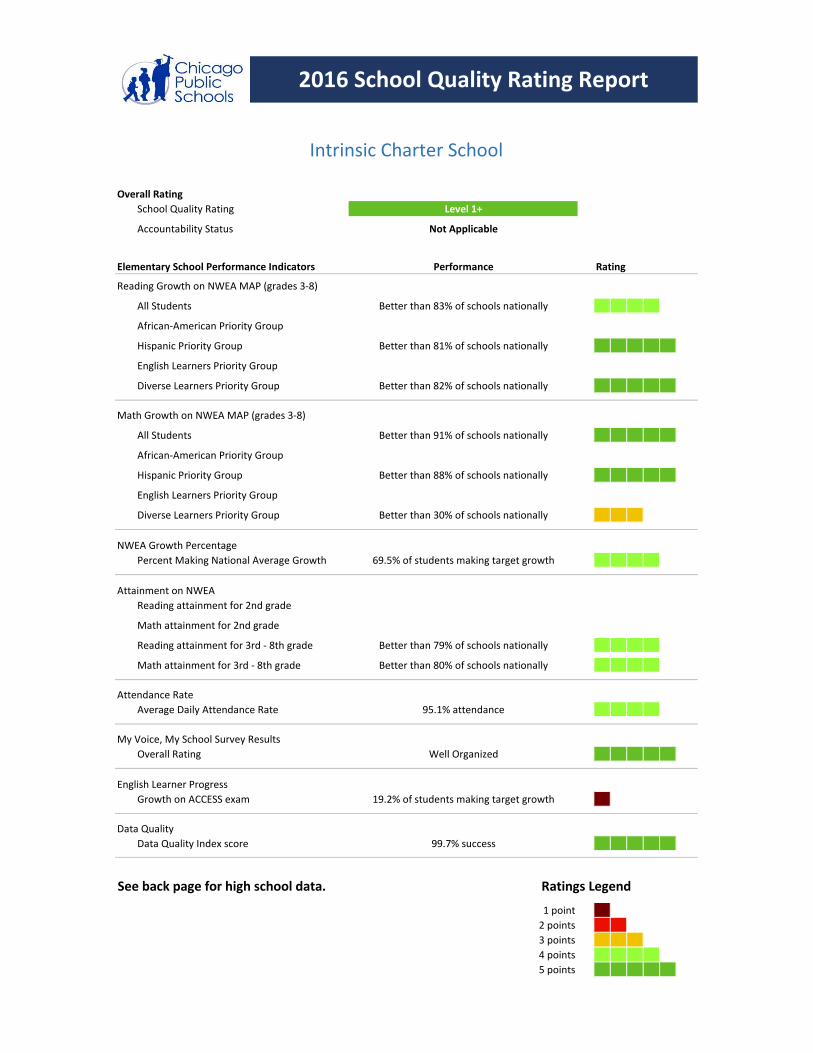
19.2% of students making target growth
Data Quality
99.7% success
Ratings Legend
English Learner Progress
NWEA Growth Percentage
69.5% of students making target growth
Attainment on NWEA
Better than 79% of schools nationally
Better than 80% of schools nationally
Attendance Rate
95.1% attendance
My Voice, My School Survey Results
Well Organized
Better than 30% of schools nationally
Reading Growth on NWEA MAP (grades 3-8)
Better than 83% of schools nationally
Better than 81% of schools nationally
Better than 82% of schools nationally
Math Growth on NWEA MAP (grades 3-8)
Better than 91% of schools nationally
Better than 88% of schools nationally
2016 School Quality Rating Report
Intrinsic Charter School
Level 1+
Not Applicable
Performance Rating
High School Performance Indicators
All Students 4
African-American Priority Group
Hispanic Priority Group 5
English Learners Priority Group
Diverse Learners Priority Group
All Students 3
4-year cohort graduation rate
Early college and career credentials
College enrollment rate (Class of 2015)
College persistence rate (Class of 2014)
Average Daily Attendance Rate 4
1-year dropout rate 4
Freshman on-track rate 5
Overall Rating 5
Data Quality Index score 5
For more information…
1 point
2 points
3 points
4 points
5 points
Ratings Legend
The School Quality Rating Policy (SQRP) is the district's policy for evaluating each school's
academic performance each year. The rating on this report is based on how the school
performed in the 2015-2016 school year, and it is used to determine the school's
accountability status for the 2016-2017 school year. You can find more information about
the SQRP at http://www.cps.edu/sqrp.
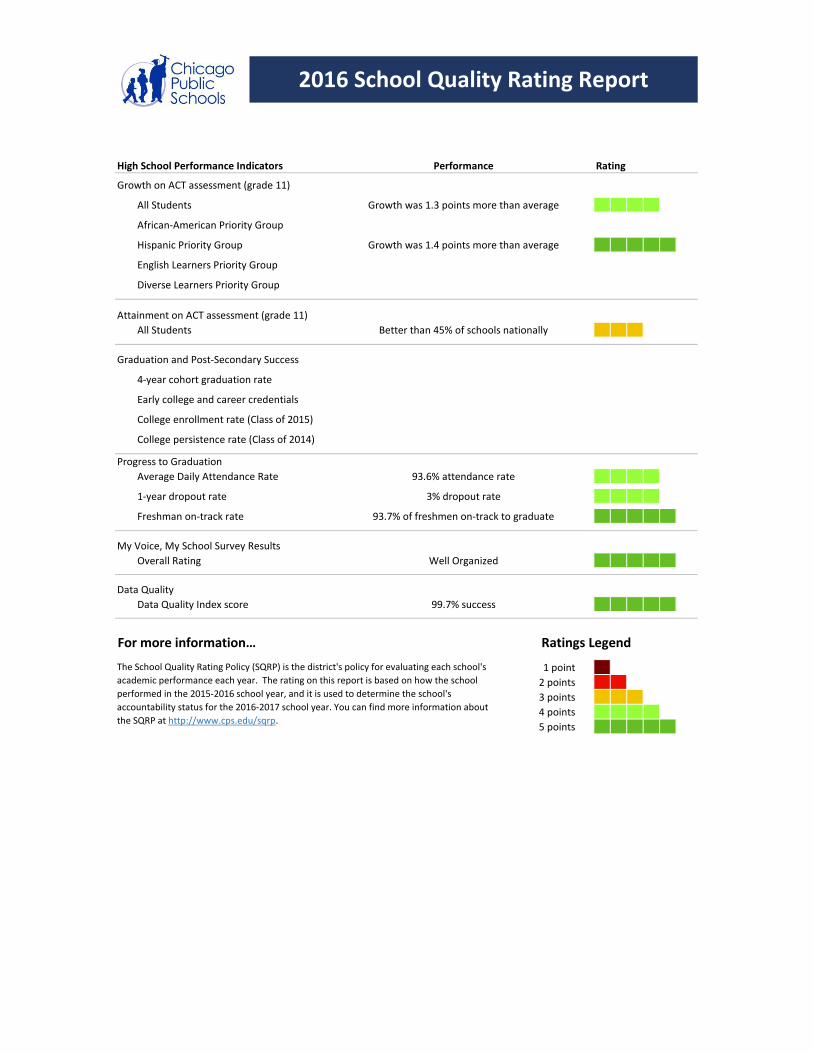
Growth was 1.3 points more than average
Attainment on ACT assessment (grade 11)
Better than 45% of schools nationally
Graduation and Post-Secondary Success
Progress to Graduation
93.6% attendance rate
3% dropout rate
93.7% of freshmen on-track to graduate
My Voice, My School Survey Results
Well Organized
Data Quality
99.7% success
Growth was 1.4 points more than average
Growth on ACT assessment (grade 11)
2016 School Quality Rating Report
Performance Rating
Overall Rating
School Quality Rating
Accountability Status
Performance Indicators
All Students 4
African-American Priority Group
Hispanic Priority Group 5
English Learners Priority Group
Diverse Learners Priority Group 4
All Students 3
African-American Priority Group
Hispanic Priority Group 3
English Learners Priority Group
Diverse Learners Priority Group 4
Percent Making National Average Growth 4
Reading attainment for 2nd grade 4
Math attainment for 2nd grade 4
Reading attainment for 3rd - 8th grade 4
Math attainment for 3rd - 8th grade 4
Average Daily Attendance Rate 3
Overall Rating 5
Growth on ACCESS exam 1
Data Quality Index score 5
For more information…
1 point
2 points
3 points
4 points
5 points
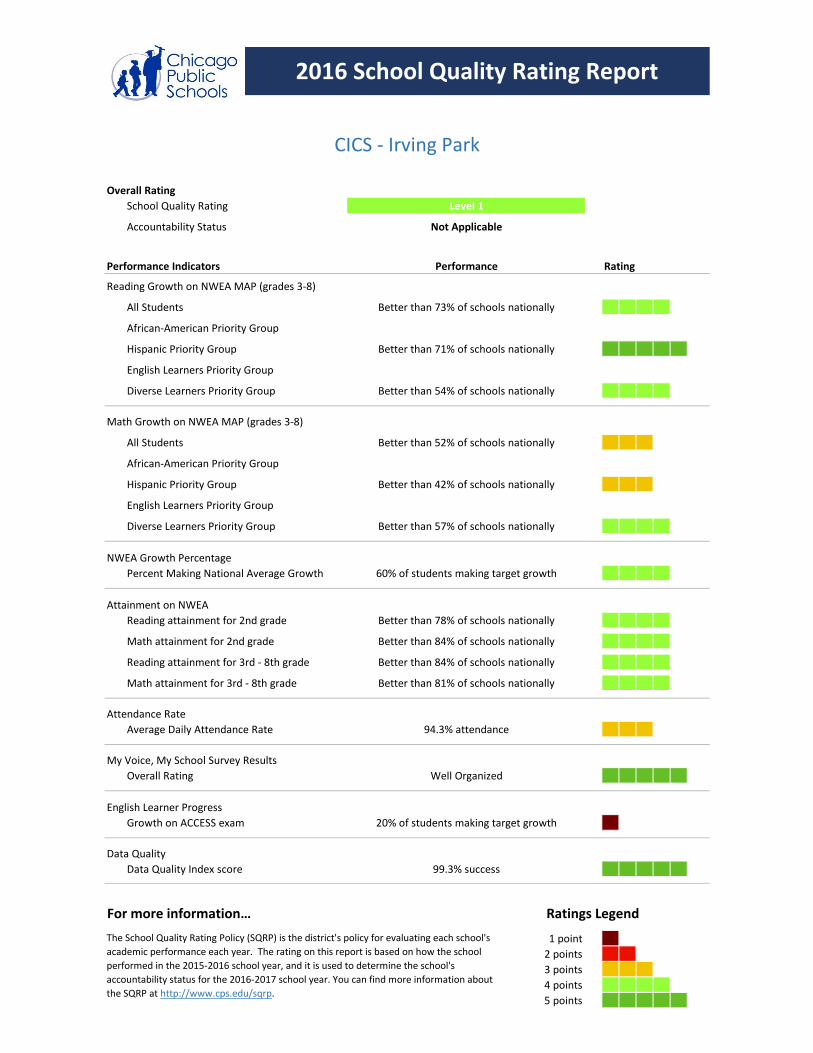
2016 School Quality Rating Report
Reading Growth on NWEA MAP (grades 3-8)
Not Applicable
NWEA Growth Percentage
Math Growth on NWEA MAP (grades 3-8)
Performance
Better than 73% of schools nationally
Better than 71% of schools nationally
Better than 54% of schools nationally
Level 1
CICS - Irving Park
Rating
Better than 42% of schools nationally
Attainment on NWEA
Better than 52% of schools nationally
Better than 57% of schools nationally
60% of students making target growth
Better than 78% of schools nationally
Better than 84% of schools nationally
Better than 84% of schools nationally
The School Quality Rating Policy (SQRP) is the district's policy for evaluating each school's
academic performance each year. The rating on this report is based on how the school
performed in the 2015-2016 school year, and it is used to determine the school's
accountability status for the 2016-2017 school year. You can find more information about
the SQRP at http://www.cps.edu/sqrp.
Ratings Legend
Well Organized
Better than 81% of schools nationally
94.3% attendance
English Learner Progress
Data Quality
20% of students making target growth
99.3% success
Attendance Rate
My Voice, My School Survey Results
Overall Rating
School Quality Rating
Accountability Status
Performance Indicators
All Students 3
African-American Priority Group 3
Hispanic Priority Group 5
English Learners Priority Group
Diverse Learners Priority Group
All Students 3
African-American Priority Group 3
Hispanic Priority Group 4
English Learners Priority Group
Diverse Learners Priority Group
Percent Making National Average Growth 3
Reading attainment for 2nd grade 3
Math attainment for 2nd grade 3
Reading attainment for 3rd - 8th grade 2
Math attainment for 3rd - 8th grade 2
Average Daily Attendance Rate 4
Overall Rating 2
Growth on ACCESS exam 3
Data Quality Index score 5
For more information…
1 point
2 points
3 points
4 points
5 points
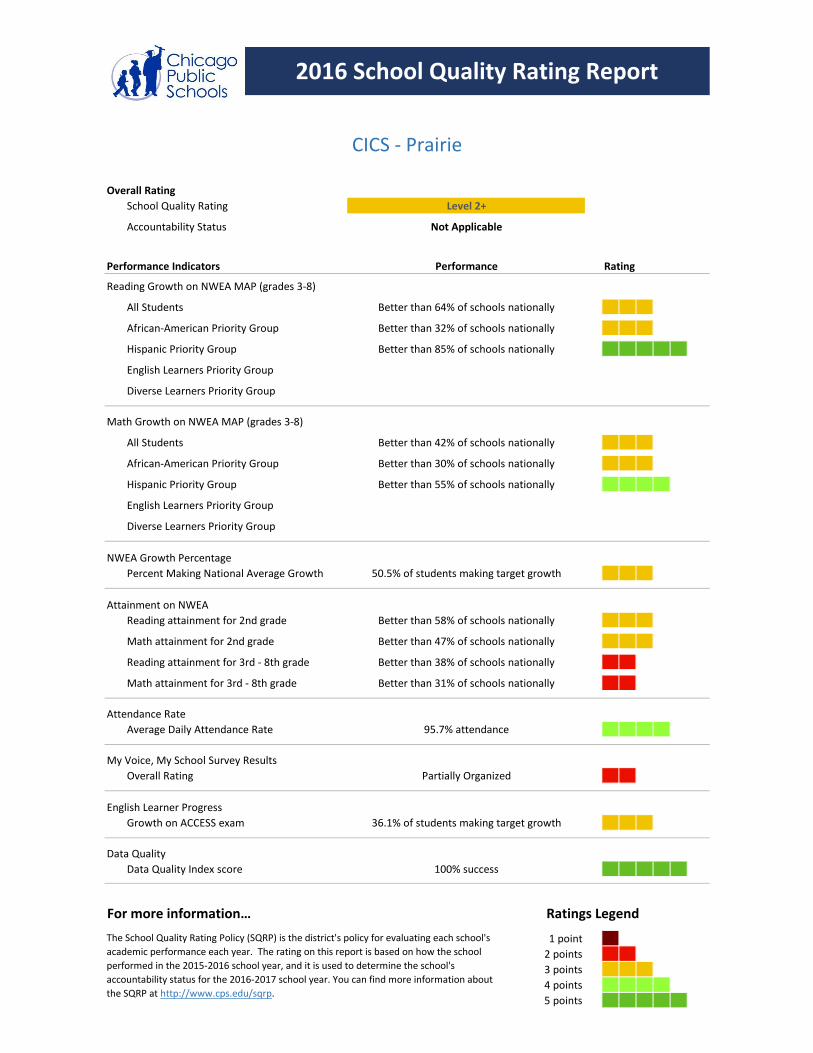
2016 School Quality Rating Report
Reading Growth on NWEA MAP (grades 3-8)
Not Applicable
NWEA Growth Percentage
Math Growth on NWEA MAP (grades 3-8)
Performance
Better than 64% of schools nationally
Better than 32% of schools nationally
Better than 85% of schools nationally
Level 2+
CICS - Prairie
Better than 30% of schools nationally
Rating
Better than 55% of schools nationally
Attainment on NWEA
Better than 42% of schools nationally
50.5% of students making target growth
Better than 58% of schools nationally
Better than 47% of schools nationally
Better than 38% of schools nationally
The School Quality Rating Policy (SQRP) is the district's policy for evaluating each school's
academic performance each year. The rating on this report is based on how the school
performed in the 2015-2016 school year, and it is used to determine the school's
accountability status for the 2016-2017 school year. You can find more information about
the SQRP at http://www.cps.edu/sqrp.
Ratings Legend
Partially Organized
Better than 31% of schools nationally
95.7% attendance
English Learner Progress
Data Quality
36.1% of students making target growth
100% success
Attendance Rate
My Voice, My School Survey Results
Overall Rating
School Quality Rating
Accountability Status
Performance Indicators
All Students 4
African-American Priority Group
Hispanic Priority Group 5
English Learners Priority Group 4
Diverse Learners Priority Group 5
All Students 3
African-American Priority Group
Hispanic Priority Group 3
English Learners Priority Group 3
Diverse Learners Priority Group 3
Percent Making National Average Growth 3
Reading attainment for 2nd grade 5
Math attainment for 2nd grade 5
Reading attainment for 3rd - 8th grade 4
Math attainment for 3rd - 8th grade 4
Average Daily Attendance Rate 5
Overall Rating 5
Growth on ACCESS exam 3
Data Quality Index score 5
For more information…
1 point
2 points
3 points
4 points
5 points
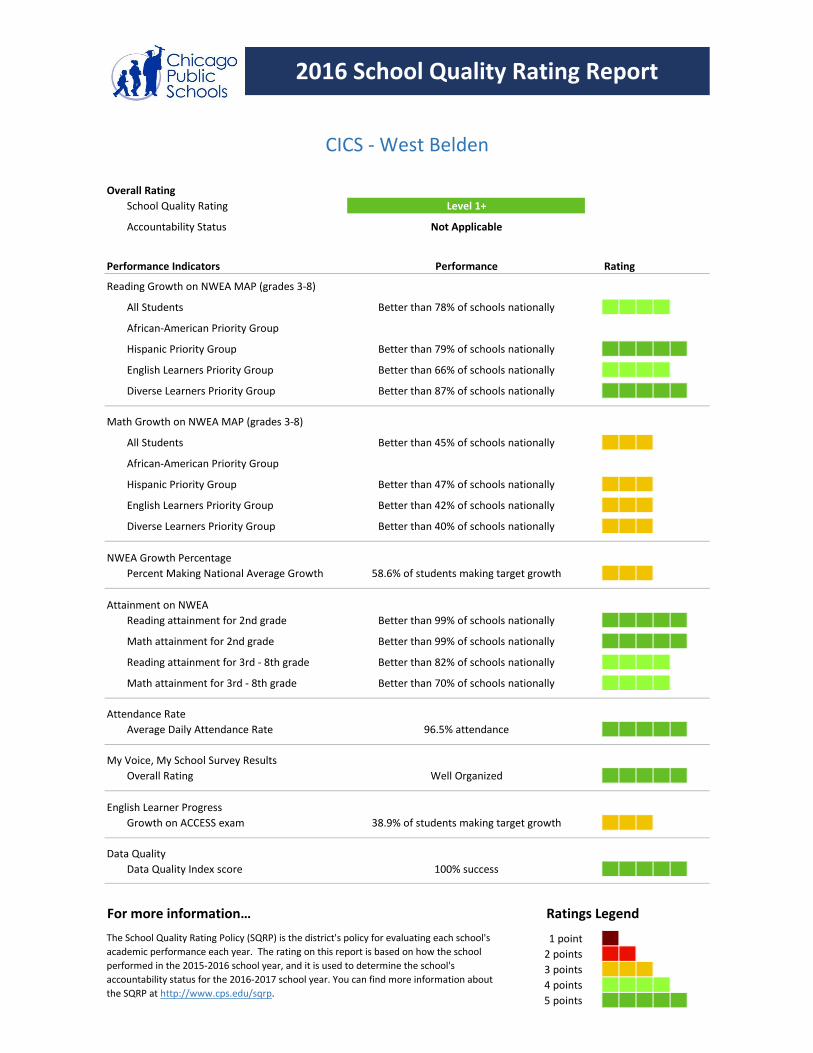
2016 School Quality Rating Report
Reading Growth on NWEA MAP (grades 3-8)
Not Applicable
NWEA Growth Percentage
Math Growth on NWEA MAP (grades 3-8)
Performance
Better than 78% of schools nationally
Better than 79% of schools nationally
Better than 66% of schools nationally
Better than 87% of schools nationally
Level 1+
CICS - West Belden
Rating
Better than 47% of schools nationally
Attainment on NWEA
Better than 45% of schools nationally
Better than 42% of schools nationally
Better than 40% of schools nationally
58.6% of students making target growth
Better than 99% of schools nationally
Better than 99% of schools nationally
Better than 82% of schools nationally
The School Quality Rating Policy (SQRP) is the district's policy for evaluating each school's
academic performance each year. The rating on this report is based on how the school
performed in the 2015-2016 school year, and it is used to determine the school's
accountability status for the 2016-2017 school year. You can find more information about
the SQRP at http://www.cps.edu/sqrp.
Ratings Legend
Well Organized
Better than 70% of schools nationally
96.5% attendance
English Learner Progress
Data Quality
38.9% of students making target growth
100% success
Attendance Rate
My Voice, My School Survey Results