2014 scientific assessment panel report assessment for decision-makers scientific assessment of...
TRANSCRIPT

MOP High Level Presentation 2014 1
2014 Scientific Assessment Panel Report
Assessment for Decision-Makers
Scientific Assessment of Ozone Depletion: 2014
This is the effort of 282 scientists from 36 countries with the help of numerous individuals and organizations. Please see the Assessment for Decision-Makers (ADM) for the list of all who contributed to the success of this assessment report.
Co-Chairs:Ayité-Lô AjavonPaul NewmanJohn PyleA.R. Ravishankara
Scientific Steering Committee:Co-Chairs +David KarolyMalcolm KoTheodore ShepherdSusan Solomon
Coordinating Editor:Christine Ennis
November 20, 2014

MOP High Level Presentation 2014 2
Scientific Assessment Panel’s new approach in 2014 Assessment
Assessment for Decision-Makers
Scientific Assessment of Ozone Depletion: 2014
Detailed science assessment done as in the past—but published only on the web (five scientific chapters).Assessment for Decision-Makers (ADM): Synthesized relevant material into a short document for you—the
decision-makers. A very short (3-page) executive summary.
November 20, 2014
Findings of the 2014 Ozone Layer Assessment
The Executive Summary summarizes the key findings.
The “Assessment for Decision-Makers” (ADM) discusses these findings in more detail.
The ADM and Executive Summary are derived from the 5 science chapters of the 2014 Assessment (available in January 2015).
A few key issues are highlighted here:1. Changes in ozone-depleting substances (ODSs) and the
ozone layer2. The emerging issue of hydrofluorocarbons and
connection to climate change3. A few options for the Parties to consider
MOP High Level Presentation 2014 3November 20, 2014

Ozone is now increasing in the upper stratosphere
1979-1997 2000-2013During the 1979-1997
period, ODSs were increasing, ozone was
declining.
During the 2000-2013 period, ODSs were
declining, and ozone appears to be increasing
Observations (black) 35-60˚N
MOP High Level Presentation 2014 4November 20, 2014

Models are able to reproduce both the 1979-97 depletion and the 2000-13 increase
1979-1997 2000-2013
Observations (black) 35-60˚NModel trends and uncertainty (grey)
MOP High Level Presentation 2014 5November 20, 2014

We cannot attribute the increase solely to ODS decline. GHG increases are also responsible.
1979-1997 2000-2013
Observations (black) 35-60˚NModel trends and uncertainty (grey)
Model with only GHGsModels with only ODSsADM Fig. 3-2
MOP High Level Presentation 2014 6November 20, 2014

Levels of ozone- depleting substances were rapidly rising in the 1979-1987 period
Ozone levels were declining, and the ozone hole had opened up over
Antarctica
Oct. 1985
Mon
trea
l Pro
toco
l is
sign
ed
MOP High Level Presentation 2014 7November 20, 2014
(ppt
)

Levels of ozone- depleting substances continued to grow till
mid-1990s
Ozone levels continue to decline. The ozone
hole worsened till then
Oct. 2000
MOP High Level Presentation 2014 8November 20, 2014
(ppt
)

Levels of ozone-depleting substances have been declining since the mid-1990s
to the present
Ozone levels seem to have improved, but we cannot say that this is “statistically
significant.”
Oct. 2013
MOP High Level Presentation 2014 9November 20, 2014
(ppt
)

Ozone-depleting substances are
projected to continue to decline through the
21st century- assuming continued compliance with the
Protocol
MOP High Level Presentation 2014 10November 20, 2014
(ppt
)

Models simulate current global ozone levels
reasonably well, and indicate the ozone layer should recover to 1980
levels around 2030.
Ozone-depleting substances are projected
to continue to decline through the 21st century- assuming continued compliance with the
Protocol
MOP High Level Presentation 2014 11November 20, 2014
(ppt
)

Model uncertainties and differences
suggest that recovery to 1980 levels will occur in the 2025-
2040 period.
November 20, 2014 MOP High Level Presentation 2014 12
(ppt
)

Models show differing amounts of ozone
changes for different greenhouse gas
Scenarios- ozone layer recovery is influenced
by climate change.
ADM Fig. 6-2November 20, 2014 MOP High Level Presentation 2014 13
(ppt
)

MOP High Level Presentation 2014 14
Background: The Montreal Protocol has also benefitted climate
Warming emissions avoided by Ozone-Layer agreement(Montreal Protocol)
Warming emissions reduction targeted by the first phase of the 1997 international Climate agreement (Kyoto Protocol)
• Most ozone-depleting substances are also potent greenhouse gases.
• MP avoided their build up and is reducing their abundance; thus, it helped reduce climate forcing.
The ozone depleting substances are decreasing due to the MP Climate change influenced (influences) ozone layer Flip-side: Ozone layer change issue has influences on climate change
November 20, 2014

MOP High Level Presentation 2014 15
Background: HFCs came about as substitutes of ODSs
Hydrofluorocarbons (HFCs) do not deplete the
ozone layer.They are being used to transition out of using
ozone-depleting substances.HFCs are the main replacements for ozone-
depleting substances in many applications.The use of HFCs has increased and is increasing
rapidly.
November 20, 2014

MOP High Level Presentation 2014 16
HFCs are increasing in the atmosphere
e.g., HFC-134a used in mobile air conditioners has increased about 7% a year over the past two years.
HFC-23, a byproduct of HCFC-22 production, is also increasing.
The current contribution of HFCs to climate change is still small (<1% of GHGs).
November 20, 2014
HFC-23 HFC-23
Abundances (ppt)
1995 2000 2005 2010 1980 1990 2000 2010
Emissions (kT/yr)
1995 2000 2005 2010 1990 2000 2010
0
20
40
60
50
100
150
10
15
20
25
0
4
8
12
16

Future emissions HFCs could make a large contribution to climate change
Future HFC contribution to climate change (as measured by radiative forcing) can be large.o Radiative forcing by future HFC emissions can be ~25% of that of
CO2 future emissions.o Future HFC emissions can significantly hinder the 450 ppm CO2
stabilization target. 17
Various HFC
Scenarios

There are ways to avoid large climate effects of HFCs
Possible to retain a <1% contribution in 2050 by using low-GWP HFCs (GWP <20) and other alternatives, even for the upper range emissions Scenarios.
Such alternatives appear to be available.
Replacement of current mix of high-GWP HFCs with low-GWP compounds and not-in-kind technologies would essentially avoid these climate effects of HFCs.
TFA from HFO-1234yf, a potential substitute, is considered to be negligible over the the next few decades. Potential longer-term impacts require future evaluations.
MOP High Level Presentation 2014 18November 20, 2014

MOP High Level Presentation 2014 19
Possible Options to Advance Ozone Layer Return to 1980 levels
Options to advance the return of the ozone layer to 1980 levels are not as extensive as in the past- Montreal Protocol has done a lot!
The cumulative effects of the elimination of emissions from all banks and production advances the return to 1980 levels by 11 years.
November 20, 2014

We highlighted a few key issues:1. Changes in ozone-depleting substances and the ozone
layer.2. Increases in hydrofluorocarbons (HFCs) and their
consequences. 3. Some information asked for by the parties in the remit for
the SAP worth noting:- Differences in estimated emissions of Carbon
tetrachloride (CTC): atmospheric observations vs. reported values.
- Details of methyl bromide trends.- Role of banks in the future of the ozone layer and impacts
on climate.
Findings of the 2014 Ozone-Layer Assessment
November 20, 2014 MOP High Level Presentation 2014 20

For further details, we refer you to:
• The Executive Summary - key findings• The ADM- more detail• Soon-to-be released science chapters
Findings of the 2014 Ozone-Layer Assessment
MOP High Level Presentation 2014 21November 20, 2014

Thank you for your attention
MOP High Level Presentation 2014 22November 20, 2014

MOP High Level Presentation 2014 23
Backup slides
November 20, 2014
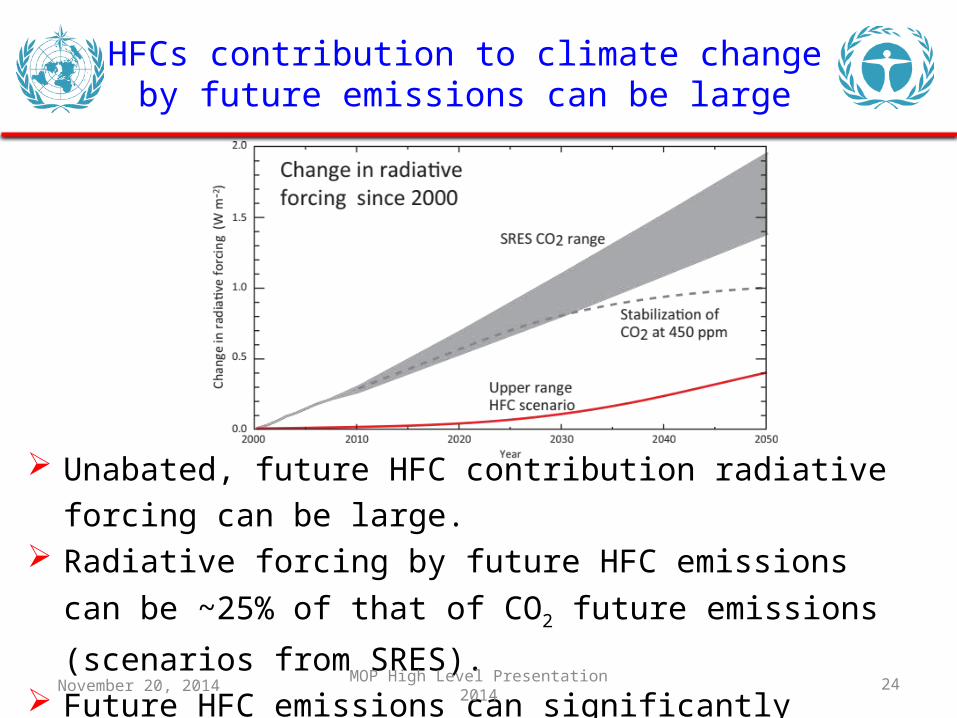
HFCs contribution to climate change by future emissions can be large
Unabated, future HFC contribution radiative forcing can be large. Radiative forcing by future HFC emissions can be ~25% of that of
CO2 future emissions (scenarios from SRES).
Future HFC emissions can significantly hinder achieving the 450
ppm stabilization target.MOP High Level Presentation 2014 24November 20, 2014

MOP High Level Presentation 2014 25
Montreal Protocol’s substitution strategy
Tho
usan
ds o
f to
nnes
November 20, 2014

Climate Benefits of Montreal Protocol
Reduction Montreal Protocol of ~11 GtCO2-eq/yr
Role of ozone depletion cooling due to CFCs? Could reduce this by perhaps a third but….
MOP High Level Presentation 2014 26
Many ODSs are potent greenhouse gases - Ramanathan
November 20, 2014
Velders et al., 2007