2014 state of georgia hazard mitigation strategy ghms.pdf · georgia hazard mitigation strategy ......
TRANSCRIPT
2014 State of Georgia 2014 State of Georgia 2014 State of Georgia Hazard Mitigation Strategy Hazard Mitigation Strategy Hazard Mitigation Strategy
Georgia Hazard Mitigation Strategy
Standard and Enhanced Plan
Effective April 1, 2014-March 31, 2017
Prepared by the Georgia Emergency Management Agency
i
TABLE OF CONTENTS Chapter 1: Introduction to Planning Process 1 1.1 OVERVIEW AND PURPOSE 1 1.2 STATE ADOPTION AND FEDERAL STATUTE COMPLIANCE 3
1.2.1 State Adoption 3 1.2.2 Federal Statute Compliance 3
1.3 PLANNING PROCESS 3 1.3.1 Plan Update Narrative 3 1.3.2 State Plan Update Participants 6 1.3.3 Plan Review and Revisions 7 1.3.4 Post-Disaster Review 9
1.4 COORDINATION AMONG AGENCIES 9 1.4.1 State and Federal Agency Participation 9 1.4.2 Changes in Participant Coordination 9
1.5 PROGRAM INTEGRATION 11 1.5.1 State Planning Programs 11 1.5.2 FEMA Mitigation Programs 12
Chapter 2: Hazard, Risk, and Vulnerability Assessment 13 2.1 OVERVIEW 13 2.2 DEFINITION OF TERMS 14 2.3 METHODOLOGY 16 2.3.1 2014 Risk Assessment 16 2.3.2 Hazard Risk Ranking 16 2.4 OVERVIEW OF NATURAL HAZARDS IN GEORGIA 19 2.4.1 Introduction 19
2.4.2 Hazard Profiling and Characteristics 19 2.4.3 Presidential Declared Disasters 23
2.5 HAZARD-SPECIFIC ASSESSMENTS 24 2.5.1 Hurricane Wind 25 2.5.2 Coastal Hazards 30 2.5.3 Wind 34 2.5.4 Severe Weather 37 2.5.5 Tornadoes 40 2.5.6 Inland Flooding 44 2.5.7 Severe Winter Weather 49 2.5.8 Drought 53 2.5.9 Wildfire 57 2.5.10 Earthquake 62 2.5.11 Geologic Hazards 69 2.5.12 Dam Failure 73
2.6 SOCIAL VULNERABILITY ASSESSMENT 78 2.6.1 Methods 78 2.6.2 Assessing Vulnerability by Jurisdiction 79 2.7 COMPOSITE ASSESSMENT 80
ii
2.8 LOSS POTENTIAL 83 2.8.1 Estimating Potential Losses by Jurisdiction 84 2.8.2 Assessing Vulnerability of State Facilities 86 2.8.3 Repetitive Loss Properties 89 Chapter 3: State Mitigation Strategy 93 3.1 OVERVIEW 93 3.2 GEORGIA MITIGATION STRATEGY 94 3.2.1 Overview 94 3.2.2 Review and Assessment of 2011 GHMS Goals 95 3.2.3 Updating the Mitigation Action Plan 96 3.2.4 Local Plan Review 99 3.2.5 Action Plan 100 3.3 STATE CAPABILITY ASSESSMENT 114 3.3.1 State Policies and Programs 115 3.3.2 State Capability Related to Development 120 3.4 LOCAL CAPABILITY ASSESSMENT 121 3.4.1 Local Mitigation Policies: Building Codes and Zoning And Floodplain Development Regulations and Mitigation Planning 123 3.4.2 Community Rating System 125 3.5 STATE AND LOCAL FUNDING SOURCES 127 Chapter 4: Coordination of Local Mitigation Planning 129 4.1 LOCAL TECHNICAL ASSISTANCE 129 4.1.1 Plan Development Process 129 4.1.2 Local Planning Tools 134 4.2 LOCAL FUNDING 134 4.2.1 Disaster Related Mitigation Programs 135 4.2.2 Non-Disaster Related Mitigation Programs 135 4.2.3 Other Mitigation Funding Programs 136 4.3 LOCAL PLAN INTEGRATION 136 4.4 PRIORITIZING LOCAL ASSISTANCE 137 4.4.1 Prioritization of Local Plan Updates 137 4.4.2 Prioritization of Local Plan Funding 139 4.4.3 Prioritization of Project Funding 139 4.4.4 Repetitive Loss Properties 140 4.4.5 Coordination with Repetitive Loss Jurisdictions 145 Chapter 5: Plan Maintenance 147 5.1 MONITORING, EVALUATING, AND UPDATING THE PLAN 147 5.2 MONITORING PROGRESS OF MITIGATION ACTIVITIES 149 Chapter 6: Enhanced Plan 151 6.1 INTEGRATION WITH OTHER PLANNING INITIATIVES 151 6.1.1 Integration with Other Planning Initiatives 151
iii
6.1.2 Integration with Regional Planning Initiatives 153 6.1.3 Integration with Federal Programs and Planning
Initiatives 158 6.2 PROJECT IMPLEMENTATION CAPABILITY 168 6.2.1 Eligibility Criteria 168 6.2.2 Cost Effectiveness Determination 170 6.2.3 System to Rank Projects 172 6.3 PROGRAM MANAGEMENT CAPABILITY 174 6.3.1 Meet HMA Application Timeframe and Submission of Eligible Project Applications 176 6.3.2 Preparing and Submitting Accurate Environmental
Reviews and Benefit-Cost Analysis 180 6.3.3 Quarterly Reports 181 6.3.4 Grant Completion and Closeout 183 6.4 ASSESSMENT OF MITIGATION ACTIONS 184 6.4.1 System to Track the Assessment of Mitigation Actions 184 6.4.2 Strategy to Assess Mitigation Actions 185 6.5 EFFECTIVE USE OF AVAILABLE MITIGATION FUNDING 187 6.6 COMMITMENT TO A COMPREHENSIVE MITIGATION PROGRAM 194 6.6.1 Local Mitigation Planning Support 194 6.6.2 Statewide Program of Hazard Mitigation 194 6.6.3 State Match Assistance for Mitigation Programs 196 6.6.4 Construction Standards for Mitigation 197 6.6.5 Mitigating Risks to Critical and Essential Facilities 197 6.6.6 Integrating Mitigation to Post Disaster Recovery Operations 198 APPENDIX A: Adoption and Approval Letters APPENDIX B: Planning Process Documentation APPENDIX C: Risk Ranking Methodology APPENDIX D: Additional Risk Information APPENDIX E: Mitigation Strategy Documentation APPENDIX F: Coordination of Local Planning Documentation APPENDIX G: List of Tables and Figures APPENDIX H: Enhanced Plan Information APPENDIX I: Georgia Disaster Resilient Construction Codes APPENDIX J: Georgia State Laws Relating to Mitigation
1
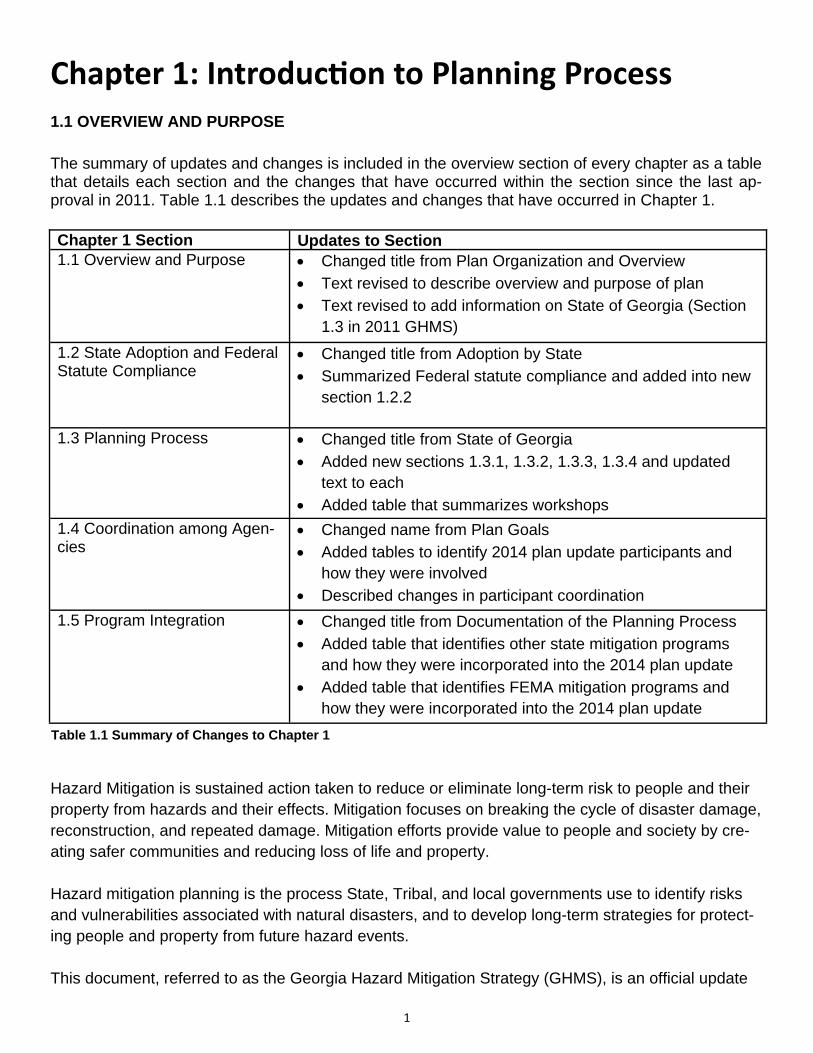
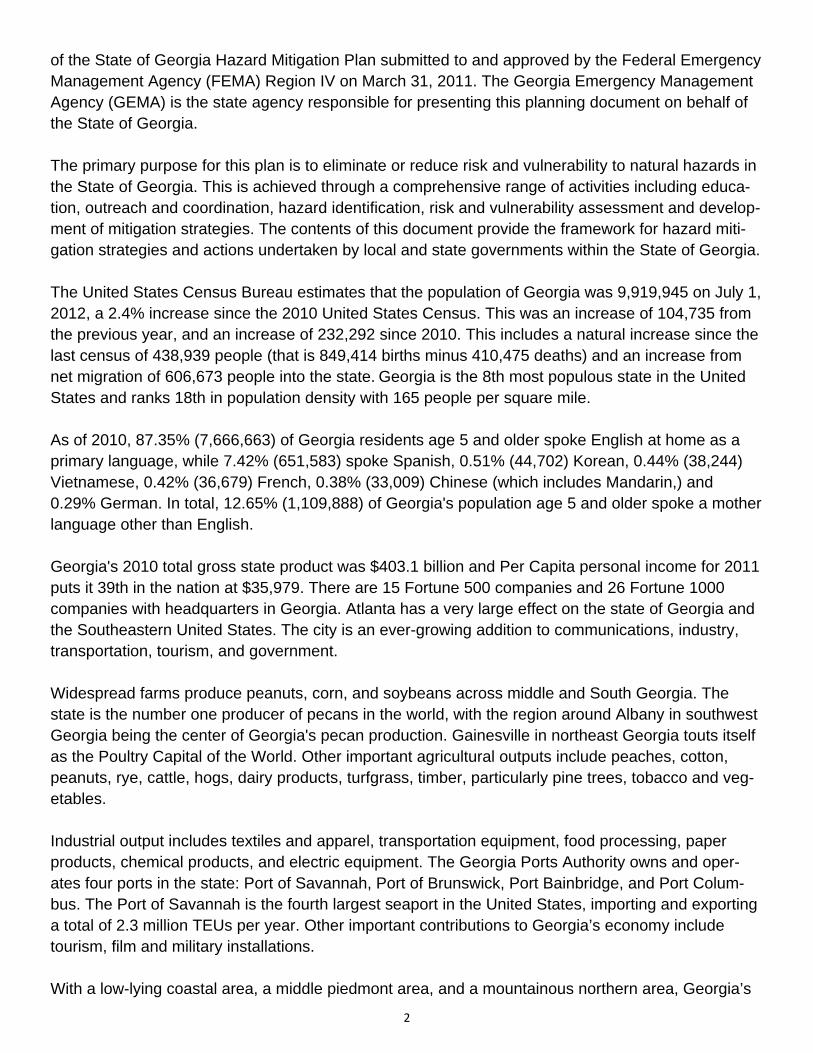
Chapter 1: Introduc on to Planning Process 1.1 OVERVIEW AND PURPOSE The summary of updates and changes is included in the overview section of every chapter as a table that details each section and the changes that have occurred within the section since the last ap-proval in 2011. Table 1.1 describes the updates and changes that have occurred in Chapter 1.
Hazard Mitigation is sustained action taken to reduce or eliminate long-term risk to people and their property from hazards and their effects. Mitigation focuses on breaking the cycle of disaster damage, reconstruction, and repeated damage. Mitigation efforts provide value to people and society by cre-ating safer communities and reducing loss of life and property. Hazard mitigation planning is the process State, Tribal, and local governments use to identify risks and vulnerabilities associated with natural disasters, and to develop long-term strategies for protect-ing people and property from future hazard events. This document, referred to as the Georgia Hazard Mitigation Strategy (GHMS), is an official update
Chapter 1 Section Updates to Section
1.1 Overview and Purpose Changed title from Plan Organization and Overview
Text revised to describe overview and purpose of plan Text revised to add information on State of Georgia (Section
1.3 in 2011 GHMS)
1.2 State Adoption and Federal Statute Compliance
Changed title from Adoption by State
Summarized Federal statute compliance and added into new section 1.2.2
1.3 Planning Process Changed title from State of Georgia
Added new sections 1.3.1, 1.3.2, 1.3.3, 1.3.4 and updated text to each
Added table that summarizes workshops
1.4 Coordination among Agen-cies
Changed name from Plan Goals
Added tables to identify 2014 plan update participants and how they were involved
Described changes in participant coordination
1.5 Program Integration Changed title from Documentation of the Planning Process
Added table that identifies other state mitigation programs and how they were incorporated into the 2014 plan update
Added table that identifies FEMA mitigation programs and how they were incorporated into the 2014 plan update
Table 1.1 Summary of Changes to Chapter 1
2
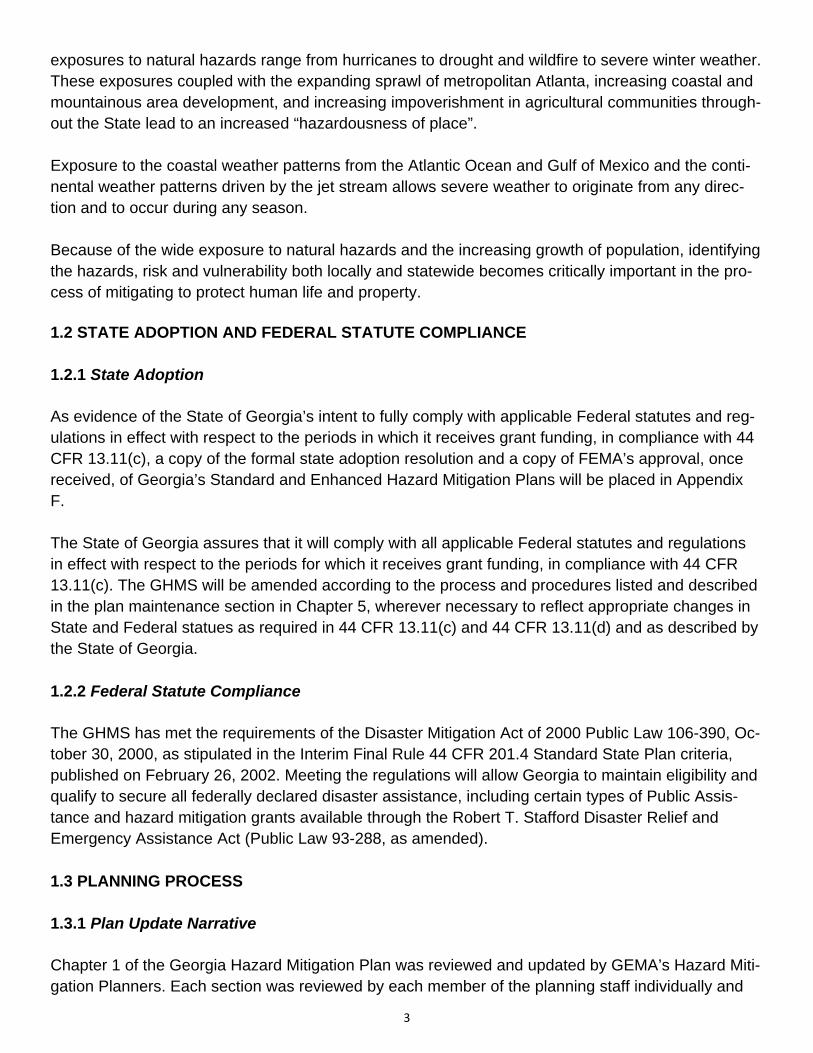
of the State of Georgia Hazard Mitigation Plan submitted to and approved by the Federal Emergency Management Agency (FEMA) Region IV on March 31, 2011. The Georgia Emergency Management Agency (GEMA) is the state agency responsible for presenting this planning document on behalf of the State of Georgia. The primary purpose for this plan is to eliminate or reduce risk and vulnerability to natural hazards in the State of Georgia. This is achieved through a comprehensive range of activities including educa-tion, outreach and coordination, hazard identification, risk and vulnerability assessment and develop-ment of mitigation strategies. The contents of this document provide the framework for hazard miti-gation strategies and actions undertaken by local and state governments within the State of Georgia. The United States Census Bureau estimates that the population of Georgia was 9,919,945 on July 1, 2012, a 2.4% increase since the 2010 United States Census. This was an increase of 104,735 from the previous year, and an increase of 232,292 since 2010. This includes a natural increase since the last census of 438,939 people (that is 849,414 births minus 410,475 deaths) and an increase from net migration of 606,673 people into the state. Georgia is the 8th most populous state in the United States and ranks 18th in population density with 165 people per square mile. As of 2010, 87.35% (7,666,663) of Georgia residents age 5 and older spoke English at home as a primary language, while 7.42% (651,583) spoke Spanish, 0.51% (44,702) Korean, 0.44% (38,244) Vietnamese, 0.42% (36,679) French, 0.38% (33,009) Chinese (which includes Mandarin,) and 0.29% German. In total, 12.65% (1,109,888) of Georgia's population age 5 and older spoke a mother language other than English. Georgia's 2010 total gross state product was $403.1 billion and Per Capita personal income for 2011 puts it 39th in the nation at $35,979. There are 15 Fortune 500 companies and 26 Fortune 1000 companies with headquarters in Georgia. Atlanta has a very large effect on the state of Georgia and the Southeastern United States. The city is an ever-growing addition to communications, industry, transportation, tourism, and government. Widespread farms produce peanuts, corn, and soybeans across middle and South Georgia. The state is the number one producer of pecans in the world, with the region around Albany in southwest Georgia being the center of Georgia's pecan production. Gainesville in northeast Georgia touts itself as the Poultry Capital of the World. Other important agricultural outputs include peaches, cotton, peanuts, rye, cattle, hogs, dairy products, turfgrass, timber, particularly pine trees, tobacco and veg-etables. Industrial output includes textiles and apparel, transportation equipment, food processing, paper products, chemical products, and electric equipment. The Georgia Ports Authority owns and oper-ates four ports in the state: Port of Savannah, Port of Brunswick, Port Bainbridge, and Port Colum-bus. The Port of Savannah is the fourth largest seaport in the United States, importing and exporting a total of 2.3 million TEUs per year. Other important contributions to Georgia’s economy include tourism, film and military installations. With a low-lying coastal area, a middle piedmont area, and a mountainous northern area, Georgia’s
3
exposures to natural hazards range from hurricanes to drought and wildfire to severe winter weather. These exposures coupled with the expanding sprawl of metropolitan Atlanta, increasing coastal and mountainous area development, and increasing impoverishment in agricultural communities through-out the State lead to an increased “hazardousness of place”. Exposure to the coastal weather patterns from the Atlantic Ocean and Gulf of Mexico and the conti-nental weather patterns driven by the jet stream allows severe weather to originate from any direc-tion and to occur during any season. Because of the wide exposure to natural hazards and the increasing growth of population, identifying the hazards, risk and vulnerability both locally and statewide becomes critically important in the pro-cess of mitigating to protect human life and property.
1.2 STATE ADOPTION AND FEDERAL STATUTE COMPLIANCE 1.2.1 State Adoption As evidence of the State of Georgia’s intent to fully comply with applicable Federal statutes and reg-ulations in effect with respect to the periods in which it receives grant funding, in compliance with 44 CFR 13.11(c), a copy of the formal state adoption resolution and a copy of FEMA’s approval, once received, of Georgia’s Standard and Enhanced Hazard Mitigation Plans will be placed in Appendix F. The State of Georgia assures that it will comply with all applicable Federal statutes and regulations in effect with respect to the periods for which it receives grant funding, in compliance with 44 CFR 13.11(c). The GHMS will be amended according to the process and procedures listed and described in the plan maintenance section in Chapter 5, wherever necessary to reflect appropriate changes in State and Federal statues as required in 44 CFR 13.11(c) and 44 CFR 13.11(d) and as described by the State of Georgia. 1.2.2 Federal Statute Compliance
The GHMS has met the requirements of the Disaster Mitigation Act of 2000 Public Law 106-390, Oc-tober 30, 2000, as stipulated in the Interim Final Rule 44 CFR 201.4 Standard State Plan criteria, published on February 26, 2002. Meeting the regulations will allow Georgia to maintain eligibility and qualify to secure all federally declared disaster assistance, including certain types of Public Assis-tance and hazard mitigation grants available through the Robert T. Stafford Disaster Relief and Emergency Assistance Act (Public Law 93-288, as amended). 1.3 PLANNING PROCESS 1.3.1 Plan Update Narrative Chapter 1 of the Georgia Hazard Mitigation Plan was reviewed and updated by GEMA’s Hazard Miti-gation Planners. Each section was reviewed by each member of the planning staff individually and
4
as a group. As a group, the planning staff revised each section as necessary to reflect the current update process utilized for this plan document, including the methodology, timeline and the partici-pating Federal and State agencies. Since the creation of the 2005 Georgia Hazard Mitigation Strategy, the State of Georgia has main-tained a series of quarterly meetings of State agencies, called the State Hazard Mitigation Planning Team (SHMPT). The purpose of these meetings is to establish and maintain relationships between state agencies with a focus on hazard mitigation within the State of Georgia. These quarterly meet-ings provide a means for the State Hazard Mitigation Staff to update other state agencies, and re-ceive feedback from those agencies, on mitigation activities throughout the State, including the GHMS. In addition to the quarterly meetings, the SHMPT meets in the aftermath of major disasters. The pur-pose of these post-disaster meetings are to review and, if necessary, update the plan with any infor-mation related to the disaster and for the State Mitigation Staff to be made aware of any disaster or damage information the other agencies may have to determine possibilities for mitigation assistance to the affected agencies. The SHMPT conducted a post-disaster review of the 2011 GHMS in the aftermath of the 2011 major tornado outbreak in Northern and Central Georgia (DR 1973). The de-tails of this post-disaster review meeting are described in Section 1.3.4 below. Beginning in the Spring of 2012, the GEMA hazard mitigation planning staff began a more active up-date phase by conducting a summary review of the 2011 plan and update process. Each chapter was examined and the following list of suggested changes and areas to update was compiled:
Update the risk assessment to reflect new hazard data including maps and occurrences of hazard events since the previous state plan update.
Update the mitigation strategy to reflect a broader spectrum of mitigation partners and stakeholders, as well as increase connectivity to the risk assessment.
Streamline the planning document itself by simplifying chapter contents and moving more detailed and technical information to supplemental annexes.
Increase the number and diversity of participants.
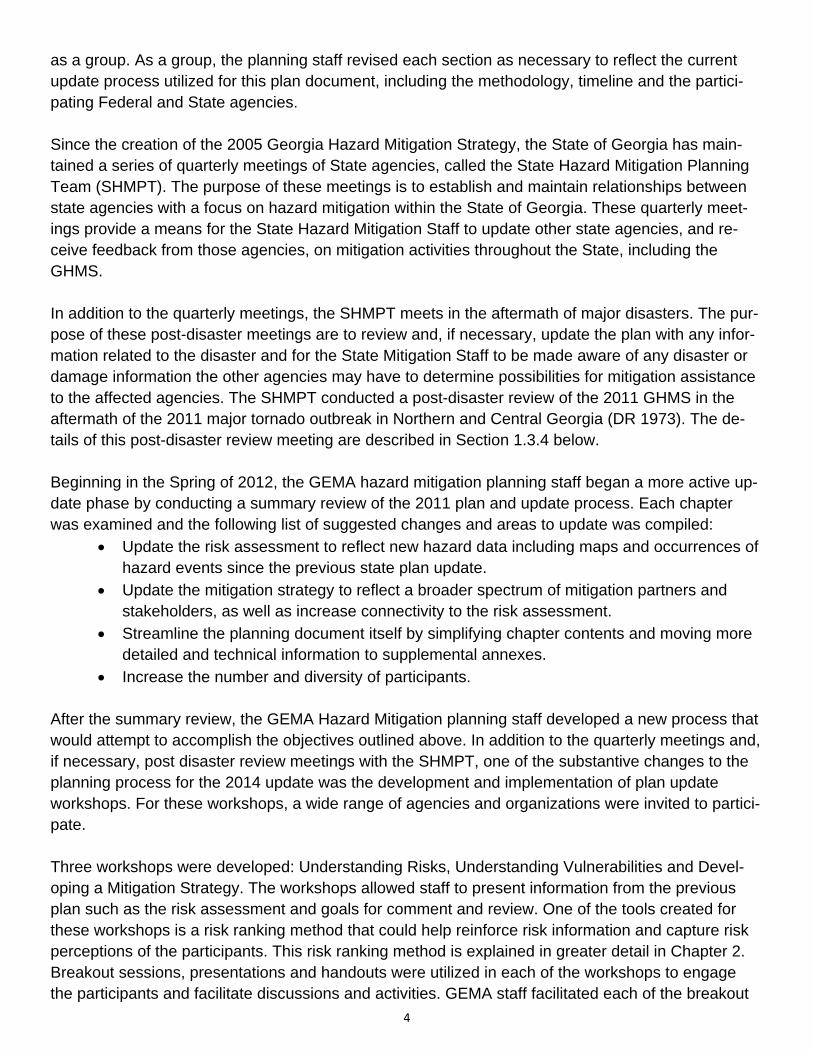
After the summary review, the GEMA Hazard Mitigation planning staff developed a new process that would attempt to accomplish the objectives outlined above. In addition to the quarterly meetings and, if necessary, post disaster review meetings with the SHMPT, one of the substantive changes to the planning process for the 2014 update was the development and implementation of plan update workshops. For these workshops, a wide range of agencies and organizations were invited to partici-pate. Three workshops were developed: Understanding Risks, Understanding Vulnerabilities and Devel-oping a Mitigation Strategy. The workshops allowed staff to present information from the previous plan such as the risk assessment and goals for comment and review. One of the tools created for these workshops is a risk ranking method that could help reinforce risk information and capture risk perceptions of the participants. This risk ranking method is explained in greater detail in Chapter 2. Breakout sessions, presentations and handouts were utilized in each of the workshops to engage the participants and facilitate discussions and activities. GEMA staff facilitated each of the breakout
5
sessions and led the presentations and group discussions. The GEMA Hazard Mitigation website was used to publish results from each of the workshops. The first workshop, Understanding Risks, was held on December 6, 2012 and included almost 70 participants from federal and state agencies, local government, non-government/non-profit organiza-tions and the private sector. The definition of risk as a combination of hazard of vulnerability was presented to the participants. This workshop focused on identifying and profiling the natural hazards Georgia is exposed to. Handouts were developed that listed the twelve hazards identified in 2011 GHMS and included characteristics of these hazards in Georgia such as history, frequency, extent and locations at risk. GEMA staff presented overview of the planning process that includes these three workshops. A presentation was also given providing specifics on each of the twelve hazards. After these presentations, the participants were divided into three breakout groups. The breakouts involved discussion of hazard information and hazard scoring and ranking. After the breakout ses-sions, each group presented summary of comments from the discussion and hazard rankings. The second workshop, Understanding Vulnerability, was held on February 6, 2013 and included 44 participants. In this workshop, the participants were given a presentation on the definition of vulnera-bility and information on impacts from the 12 natural hazards identified in the 2011 GHMS. Handouts were provided which described information on the historical and potential impacts of each hazard including adjusted losses, injuries and deaths, property damage, critical facilities, economic disrup-tion and natural and cultural resources. The participants were divided into breakout groups where they scored and ranked each of the hazards in respect to the vulnerability. Each of the participants were given score sheets to rank the vulnerability of each hazard. Participants also added these scores to the average hazard scores from Workshop 1 to calculate the total risk score and rankings for all 12 hazards. After the breakout sessions, each group presented summary of comments from the discussion and vulnerability and total risk rankings. The results of the hazard scores and ranking are presented in Chapter 2. The third workshop, Developing Georgia’s Mitigation Strategy, was held on April 25, 2013 and in-cluded 25 participants. Risk summaries and findings from the previous two workshops were present-ed to the participants. This included the total risk scores and rankings for all the hazards. The partici-pants were given a presentation on what mitigation means and the four categories of mitigation ac-
Workshop Date Information Presented Results
1: Understanding Risks
December 6, 2012
12 hazards in 2011 GHMS and profiles; Hazard risk ranking methodology
Breakout group discussion on hazards; hazards scored and ranked based on profile
2: Understanding Vulnerability
February 6, 2013
Vulnerability definition; his-torical and potential impacts of 12 hazards
Breakout group discussion on hazard vulnerabilities; hazards scored and ranked based on vul-
3: Developing Georgia’s Mitiga-tion Strategy
April 25, 2013
Risk summary from first 2 workshops; types of mitiga-tion actions
Lists of potential mitigation ac-tions for each hazard with prioriti-zation
Table 1.2 State Plan Update Workshops
6
tions along with examples. The participants were divided into breakout groups with each assigned a different set of hazards. Each group developed a list of possible mitigation actions for their assigned hazards. These lists were compiled and presented to the entire group. Afterwards, the participants were given opportunity to prioritize these actions by placing sticker dots on the actions they believed are most important to reduce long-term risks. Some of the results from this workshop are presented in Chapter 3. Another substantial change in the planning process for the 2014 GHMS was for the mitigation plan-ning staff to proactively reach out, individually, to state agencies to discuss hazard mitigation and find out what type activities each agency was doing or had plans to do that have mitigation effects. These identified mitigation activities and priorities were reviewed by GEMA Hazard Mitigation Plan-ning staff for inclusion into the State mitigation strategy. 1.3.2 State Plan Update Participants As noted above, the State of Georgia has historically involved multiple other State and Federal agencies in the development and subsequent updates of the GHMS, primarily through the planning staff and the SHMPT meetings. One of the goals for the 2014 update was to broaden participation by involving more Federal and State agencies and partnering non-governmental organizations. The 2014 GHMS was developed utilizing three core groups:
1. GEMA Hazard Mitigation Planning staff 2. University of Georgia Information Technology Outreach Services (ITOS) 3. Other agencies and partners
The planning process for the 2014 Update to the GHMS was led by the GEMA Hazard Mitigation Planning staff which consists of four planners and a manager. This team developed the process to the update the plan, facilitated the update implementation and drafted the planning document. The Office of Information Technology Outreach Services (ITOS), a Division of the Carl Vinson Insti-tute of Government of the University of Georgia, updated and developed data that was integrated into the risk assessment. This includes collection of hazard history from SHELDUS and NCDC, maps used in risk analysis and other hazard information. Other agencies and partner organizations were invited and contributed to the development of the risk assessment and mitigation strategies. These organizations included federal, state and local rep-resentatives, non-government organizations and the private sector. Coordination among these or-ganizations was completed with three mechanisms: the State Hazard Mitigation Planning Team (SHMPT), planning workshops and individual interviews with State agencies. Details on participants and how they participated in the state planning process is provided in section 1.4. As described above, previous planning process utilized a group called the State Hazard Mitigation Planning Team (SHMPT). The SHMPT has evolved with each plan update and largely includes state agencies that meet quarterly. The quarterly meetings provide an opportunity for participants to re-ceive updates on GEMA Hazard Mitigation activities as well as mitigation-related activities from other
7
agencies. During the state plan update, the SHMPT is informed of progress and given the opportuni-ty to provide feedback on the planning process and completed sections. For more information on the history to the SHMPT and agencies actively participating, please see Appendix B. For this plan update, the GEMA Hazard Mitigation Planning staff developed a new mechanism to ex-pand participation to other agencies and organizations to reflect a broader representation of state interests. The result was a series of three workshops that would be designed to inform participants about hazard risks, vulnerabilities and mitigation strategies through the review of information from the 2011 GHMS. GEMA staff coordinated with federal and state agencies, local governments, re-gional planning organizations, non-government organizations and the private sector to participate.
1.3.3 Plan Review and Revisions
Since the adoption of the 2011 GHMS, the document has been available on the GEMA website for public view. During local plan update meetings, communities are informed about the availability of the GHMS as a resource and also encouraged to provide feedback on how the document could be improved to assist their needs. Some of these comments that have been received are that the GHMS is difficult to read and find useful information. Many of the sections are burdensome in length and contain highly technical language. Including more useful figures, tables and maps into the chap-ters would help communities find the information they need. This feedback was taken into considera-tion in the process and development of the 2014 update to the GHMS. Relevant maps that support text have been moved from appendices and integrated into the appropriate sections of the plan. Ta-bles were formatted to improve clarity. The GHMS has been streamlined by removing redundant and superfluous information. New figures that support plan text and provide relevant information have been integrated into the chapters. As described above in Section 1.3.1, the active update process began with a summary review of each section of the plan to note which items needed updating, as well as identifying any necessary changes to the planning process that would be needed in order to accomplish the goals the staff had for the 2014 plan. The review of the planning process, as well as the evaluation, monitoring and up-dating process to be used in the future, revealed changes that were necessary in order to accom-plish the goal of broadening participation and input by other Federal and State agencies and non-governmental organizations. Therefore, the description of the planning process was revised to re-flect, not only the quarterly and post disaster review meetings of the SHMPT and the planning work done by the mitigation staff, but also the workshops and agency interviews described in Section 1.3.1. The evaluation, monitoring and updating description was revised to reflect a similar process that was used to create the current update, with notation that the process may be modified as neces-sary to continually improve the state plan. The planning staff’s review also revealed much of the information in the discussion on program inte-gration contained much information not related to hazard mitigation. This information was stream-lined to focus only on details related to hazard mitigation and how those programs were integrated into hazard mitigation as well as how hazard mitigation is integrated into them. Upon review of the integration of local plan information into the State plan, the planning staff realized
8
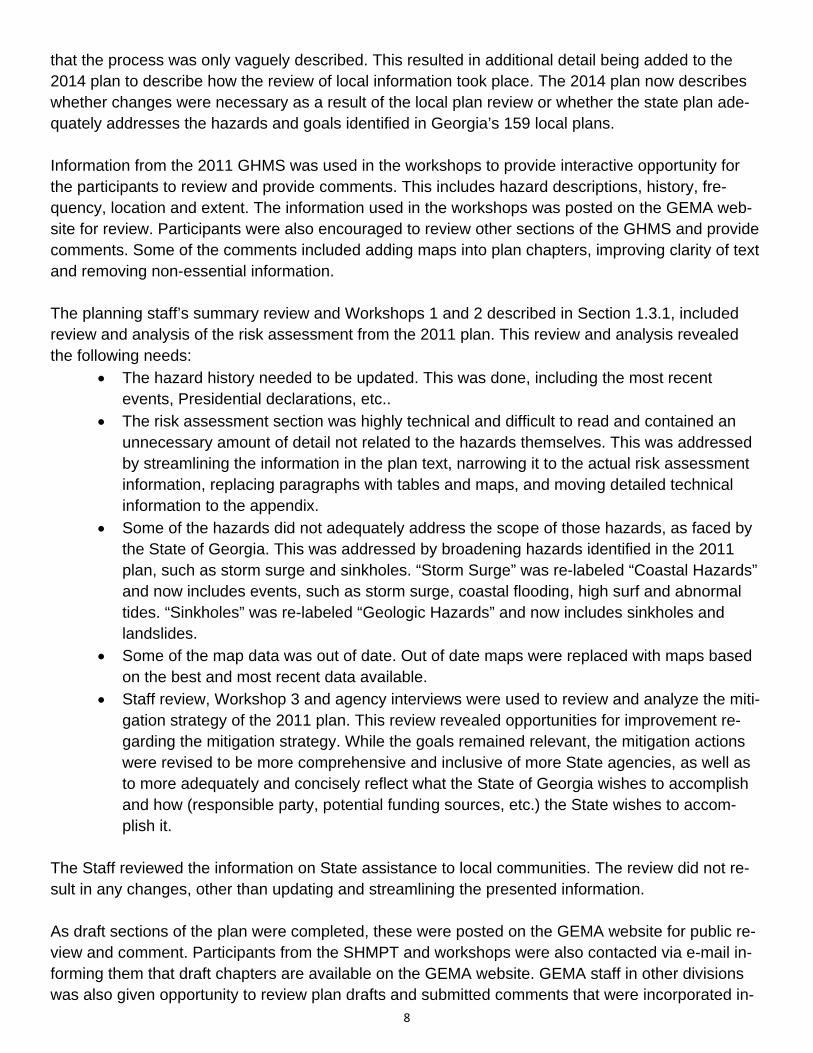
that the process was only vaguely described. This resulted in additional detail being added to the 2014 plan to describe how the review of local information took place. The 2014 plan now describes whether changes were necessary as a result of the local plan review or whether the state plan ade-quately addresses the hazards and goals identified in Georgia’s 159 local plans. Information from the 2011 GHMS was used in the workshops to provide interactive opportunity for the participants to review and provide comments. This includes hazard descriptions, history, fre-quency, location and extent. The information used in the workshops was posted on the GEMA web-site for review. Participants were also encouraged to review other sections of the GHMS and provide comments. Some of the comments included adding maps into plan chapters, improving clarity of text and removing non-essential information. The planning staff’s summary review and Workshops 1 and 2 described in Section 1.3.1, included review and analysis of the risk assessment from the 2011 plan. This review and analysis revealed the following needs:
The hazard history needed to be updated. This was done, including the most recent events, Presidential declarations, etc..
The risk assessment section was highly technical and difficult to read and contained an unnecessary amount of detail not related to the hazards themselves. This was addressed by streamlining the information in the plan text, narrowing it to the actual risk assessment information, replacing paragraphs with tables and maps, and moving detailed technical information to the appendix.
Some of the hazards did not adequately address the scope of those hazards, as faced by the State of Georgia. This was addressed by broadening hazards identified in the 2011 plan, such as storm surge and sinkholes. “Storm Surge” was re-labeled “Coastal Hazards” and now includes events, such as storm surge, coastal flooding, high surf and abnormal tides. “Sinkholes” was re-labeled “Geologic Hazards” and now includes sinkholes and landslides.
Some of the map data was out of date. Out of date maps were replaced with maps based on the best and most recent data available.
Staff review, Workshop 3 and agency interviews were used to review and analyze the miti-gation strategy of the 2011 plan. This review revealed opportunities for improvement re-garding the mitigation strategy. While the goals remained relevant, the mitigation actions were revised to be more comprehensive and inclusive of more State agencies, as well as to more adequately and concisely reflect what the State of Georgia wishes to accomplish and how (responsible party, potential funding sources, etc.) the State wishes to accom-plish it.
The Staff reviewed the information on State assistance to local communities. The review did not re-sult in any changes, other than updating and streamlining the presented information. As draft sections of the plan were completed, these were posted on the GEMA website for public re-view and comment. Participants from the SHMPT and workshops were also contacted via e-mail in-forming them that draft chapters are available on the GEMA website. GEMA staff in other divisions was also given opportunity to review plan drafts and submitted comments that were incorporated in-
9
to the plan update.
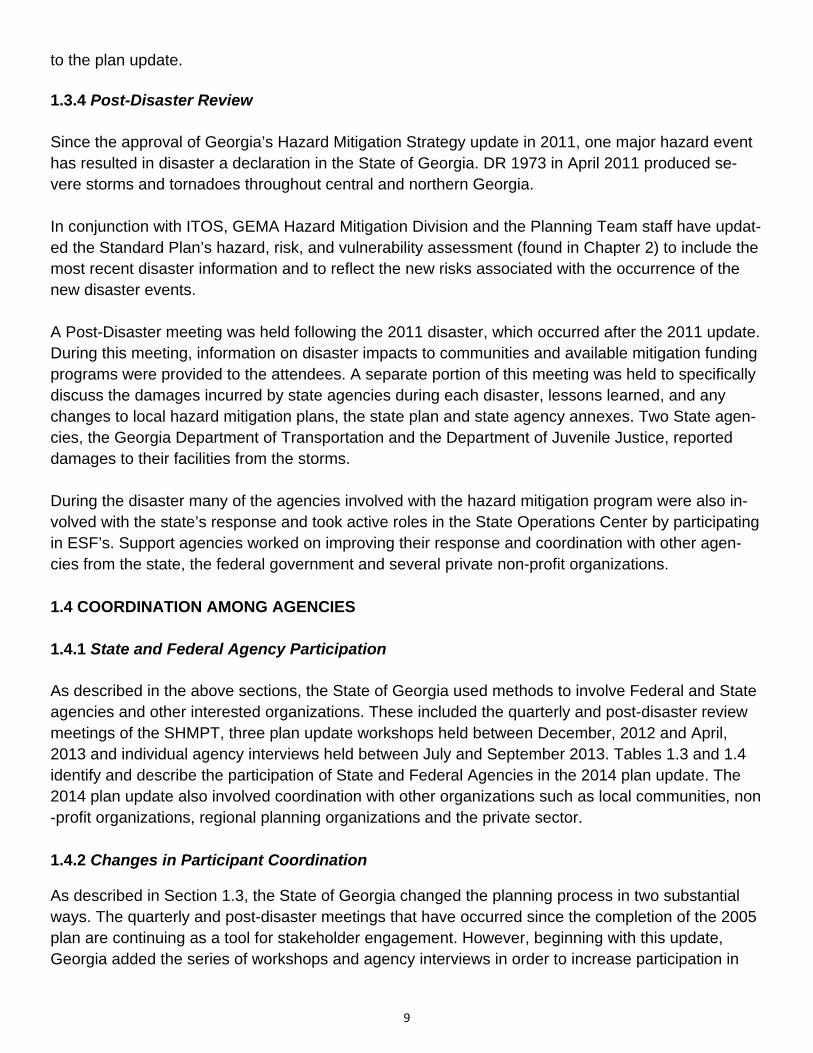
1.3.4 Post-Disaster Review Since the approval of Georgia’s Hazard Mitigation Strategy update in 2011, one major hazard event has resulted in disaster a declaration in the State of Georgia. DR 1973 in April 2011 produced se-vere storms and tornadoes throughout central and northern Georgia. In conjunction with ITOS, GEMA Hazard Mitigation Division and the Planning Team staff have updat-ed the Standard Plan’s hazard, risk, and vulnerability assessment (found in Chapter 2) to include the most recent disaster information and to reflect the new risks associated with the occurrence of the new disaster events. A Post-Disaster meeting was held following the 2011 disaster, which occurred after the 2011 update. During this meeting, information on disaster impacts to communities and available mitigation funding programs were provided to the attendees. A separate portion of this meeting was held to specifically discuss the damages incurred by state agencies during each disaster, lessons learned, and any changes to local hazard mitigation plans, the state plan and state agency annexes. Two State agen-cies, the Georgia Department of Transportation and the Department of Juvenile Justice, reported damages to their facilities from the storms. During the disaster many of the agencies involved with the hazard mitigation program were also in-volved with the state’s response and took active roles in the State Operations Center by participating in ESF’s. Support agencies worked on improving their response and coordination with other agen-cies from the state, the federal government and several private non-profit organizations. 1.4 COORDINATION AMONG AGENCIES 1.4.1 State and Federal Agency Participation As described in the above sections, the State of Georgia used methods to involve Federal and State agencies and other interested organizations. These included the quarterly and post-disaster review meetings of the SHMPT, three plan update workshops held between December, 2012 and April, 2013 and individual agency interviews held between July and September 2013. Tables 1.3 and 1.4 identify and describe the participation of State and Federal Agencies in the 2014 plan update. The 2014 plan update also involved coordination with other organizations such as local communities, non-profit organizations, regional planning organizations and the private sector. 1.4.2 Changes in Participant Coordination
As described in Section 1.3, the State of Georgia changed the planning process in two substantial ways. The quarterly and post-disaster meetings that have occurred since the completion of the 2005 plan are continuing as a tool for stakeholder engagement. However, beginning with this update, Georgia added the series of workshops and agency interviews in order to increase participation in
10
the planning process and to improve coordination of Federal and State agencies into the 2014 State Plan.
State Agency Participation
Administrative Office of the Courts Workshops
GA Forestry Commission Workshops, quarterly meetings, risk analysis, SHMPT
GA Dept of Driver Services Workshops
GA Dept of Behavioral Health & Dev Dis Workshops
Soil & Water Conservation Commission Workshops
DNR Workshops, quarterly meetings, risk analysis, SHMPT
GA State Patrol Workshops
GEMA Workshops
Georgia Lottery Workshops
GA Dept of Community Affairs Workshops, quarterly meetings, risk analysis, SHMPT
DOAS Risk Mgmt Services Workshops
Dept. of Human Resources Workshops, quarterly meetings, SHMPT
West Central Health District 7 Workshops
BOR-USG Workshops
Dept. of Revenue Agency telephone Interviews
Board of Regents Workshops, Agency telephone Interviews
Georgia Port Authority Workshops, Agency telephone Interviews
Dept. of Highway Safety Workshops, quarterly meetings, SHMPT
Dept. of Audits Workshops
GA Assoc. of Soil & Water Conservation Commission
Workshops
Dept. of Administrative Services Workshops, SHMPT
GA Dept. of Veterans Affairs Workshops
State Property Office Workshops
Table 1.3 State Agency Participation in 2014 GHMS Update
Federal Agency Participation
FEMA Mitigation Division - Risk Analysis Workshops
National Weather Service Workshops
Table 1.4 Federal Agency Participation in 2014 GHMS Update
11
1.5 PROGRAM INTEGRATION
1.5.1 State Planning Programs
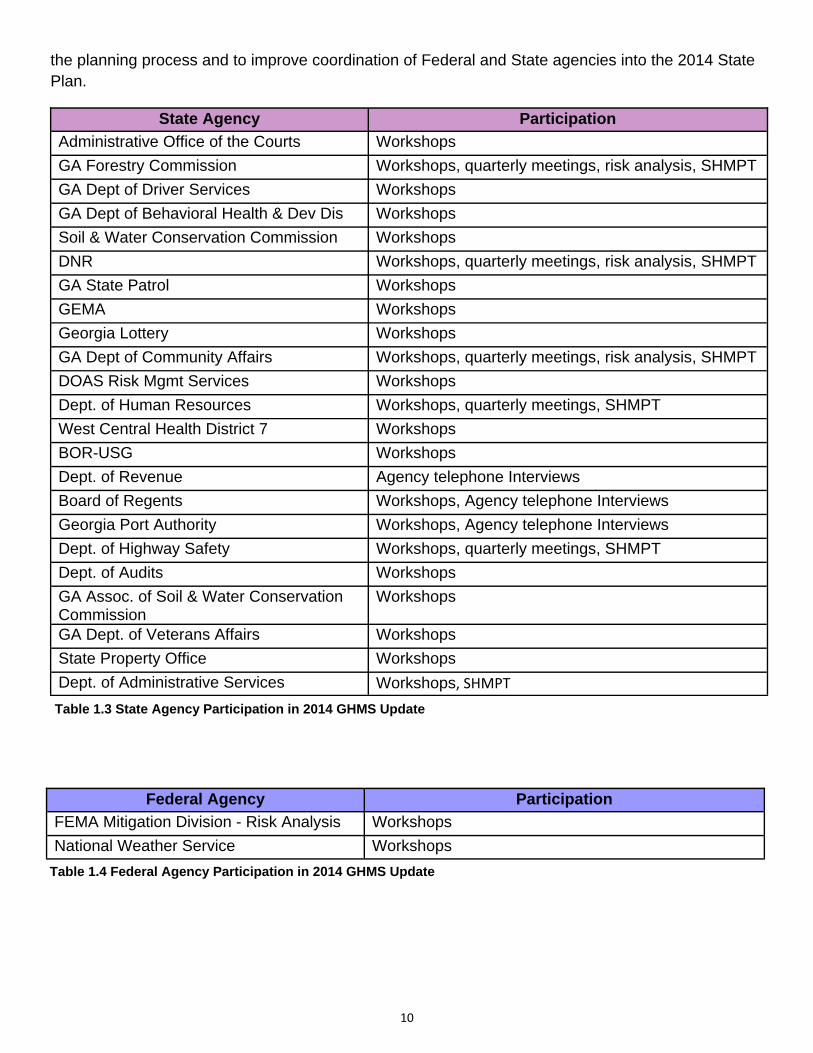
GEMA Hazard Mitigation planning staff has identified fourteen programs and initiatives that are rele-vant to hazard mitigation. These were reviewed for their effectiveness and incorporated into this plan update where appropriate. All of the programs and initiatives align with the overall goals of Georgia’s Hazard Mitigation Strategy: reducing human vulnerability to hazard events; reducing the losses as-
Other Organization Participation
GA 4 MW Workshops
Family Intervention Specialists, Inc. Workshops
Odyssey Family Counseling Center Workshops
Cherokee Briggs & Associates Workshops
Oconee Center - CSB Workshops
UGA-ITOS Workshops, risk analysis
Advantage Behavioral Health Systems Workshops
CBF of Georgia Workshops
Volunteers of America, SE Workshops
Noah's Ark Workshops
Children's Healthcare of Atlanta Workshops
ACTS Retirement-Life Communities Workshops
Lynndale, Inc. Workshops
Hope Animal-Assisted Crisis Response (AACR) Workshops
GA Community Support & Solutions Workshops
Pudar Mitigation Consulting, Inc. Workshops
Devereux Workshops
Meritan, Inc. Workshops
River Valley Regional Commission Workshops
Cross Plains Community Partner Workshops
Behavioral Health Link Workshops
Volunteer Organizations Active in Disaster (VOAD) Workshops
United Way 211 Workshops
Rockdale County Workshops
Volunteers of America Workshops
Salvation Army Workshops
Child & Family Guidance Workshops
Humane Assoc of GA Workshops
Georgia Power Company Workshops
Table 1.5 Other Organizations Participation in the 2014 GHMS Update
12
sociated with hazard events; and reducing the people and property of Georgia’s overall exposure to hazard events. Specific program and initiatives that are represented in the State mitigation strategy include Safe Dams, Community Wildfire Protection Plans and Risk MAP. GEMA Hazard Mitigation planning staff will continue to review other state programs and initiatives for review and inclusion into the GHMS. Additional information on these programs is provided in Section 3.3.
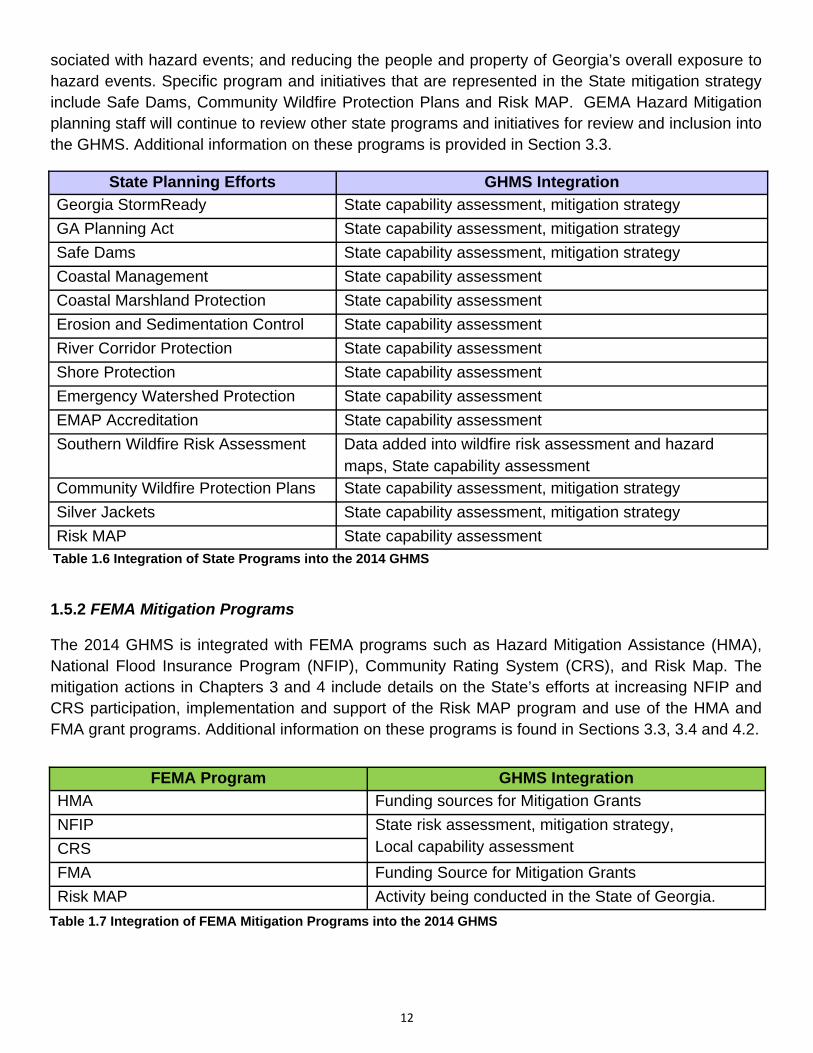
1.5.2 FEMA Mitigation Programs
The 2014 GHMS is integrated with FEMA programs such as Hazard Mitigation Assistance (HMA), National Flood Insurance Program (NFIP), Community Rating System (CRS), and Risk Map. The mitigation actions in Chapters 3 and 4 include details on the State’s efforts at increasing NFIP and CRS participation, implementation and support of the Risk MAP program and use of the HMA and FMA grant programs. Additional information on these programs is found in Sections 3.3, 3.4 and 4.2.
FEMA Program GHMS Integration
HMA Funding sources for Mitigation Grants
NFIP State risk assessment, mitigation strategy, Local capability assessment CRS
FMA Funding Source for Mitigation Grants
Risk MAP Activity being conducted in the State of Georgia.
Table 1.7 Integration of FEMA Mitigation Programs into the 2014 GHMS
State Planning Efforts GHMS Integration
Georgia StormReady State capability assessment, mitigation strategy
GA Planning Act State capability assessment, mitigation strategy
Safe Dams State capability assessment, mitigation strategy
Coastal Management State capability assessment
Coastal Marshland Protection State capability assessment
Erosion and Sedimentation Control State capability assessment
River Corridor Protection State capability assessment
Shore Protection State capability assessment
Emergency Watershed Protection State capability assessment
EMAP Accreditation State capability assessment
Southern Wildfire Risk Assessment Data added into wildfire risk assessment and hazard maps, State capability assessment
Community Wildfire Protection Plans State capability assessment, mitigation strategy
Silver Jackets State capability assessment, mitigation strategy
Risk MAP State capability assessment Table 1.6 Integration of State Programs into the 2014 GHMS
13
Chapter 2: Risk Assessment 2.1 OVERVIEW The Hazard, Risk, and Vulnerability Assessment of the Georgia Hazard Mitigation Strategy provides the scientifically-sound foundation for the goals, objectives, tasks, and actions steps that are pro-posed in the plan. This chapter of the plan consists of the following sections: Overview, Definition of Terms, Methodology, Overview of Natural Hazards in Georgia, Hazard-Specific Assessments, Vul-nerability Assessment, Composite Assessment, and Loss Potential. The Definition of Terms section includes definitions of the terms hazard, risk, risk assessment, vul-nerability, and mitigation utilized in this plan. The Methodology section outlines the processes used in developing the risk assessment, including data manipulation and analyses that led to the presented conclusions. The All-Hazard Assessment section discusses the hazard event and loss history for the State of Georgia without regard for specific hazard types. This section includes analysis of losses associated with all hazard events and claims associated with Presidential Disaster Declarations (PDDs). The Hazard Specific Assessments section identifies the specific hazards affecting Georgia by re-counting each hazard’s event and loss history, Presidential Disaster Declarations history, and nota-ble event history. Also, this section includes hazard-specific occurrence probabilities (risk). The Vulnerability Assessments section addresses both social and environmental vulnerability to haz-ard events at a state level. This also includes an analysis of vulnerable state buildings and critical facilities. The Composite Assessment section attempts to address the concept of “hazardousness of place” by combining the composite of hazards with vulnerability in order to highlight areas of concern. The last section, which relates to Loss Potential, presents the state assets and locally-defined critical facilities in conjunction with the composite hazard scores in order to determine the areas with the highest potential for loss. The summary of changes that occurred to the updated mitigation strategy from the 2011 plan is rec-orded in the following table, Table 2.1. Chapter 2 of the Georgia Hazard Mitigation Plan was updated with assistance by the Carl Vinson Institute’s Information Technology Outreach Service (ITOS) at the University of Georgia. The risk as-sessment is based on best available risk and vulnerability statistics and data available as of June 30, 2013.
14
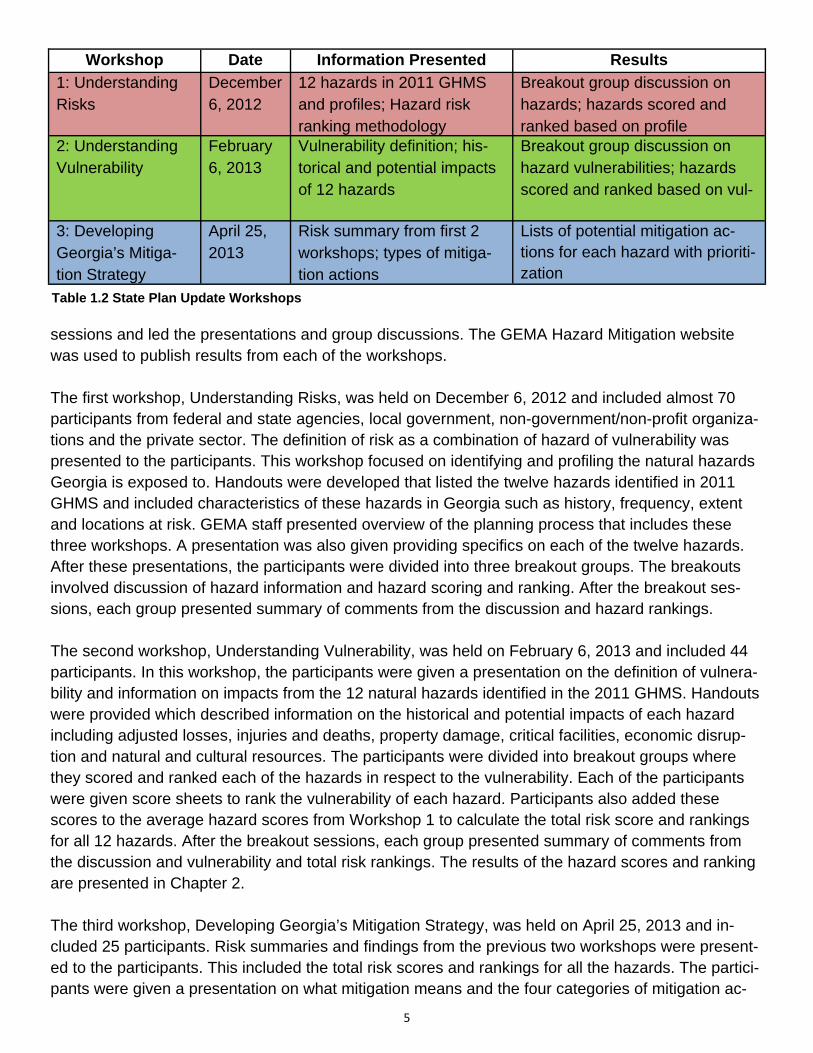
2.2 DEFINITION OF TERMS Risk, for the purpose of hazard mitigation planning, is the potential for damage, loss, or other im-pacts created by the interaction of natural hazards with community assets. Hazards are natural pro-cesses, such as tornados and earthquakes. The exposure of people, property, and other community assets to natural hazards can result in disasters depending on the impacts. Impacts are the conse-quences or effects of the hazard on the community and its assets. The type and severity of impacts are based on the extent of the hazard and the vulnerability of the asset, as well as the community’s capabilities to mitigate, prepare for, respond to, and recover from events. The following are FEMA definitions of terms used in risk assessments.
Hazard: A source of potential danger or adverse condition. Natural hazards are created by a meteorological, environmental, or geological event. Risk: The estimated impact that a hazard would have on people, services, facilities, and structures in a community; the likelihood of a hazard event resulting in an adverse condition
Chapter 2 Section Updates to Section
2.1 Overview Changed dates to reflect new plan Text changes to describe structure of chapter
2.2 Definition of Terms Changed name from Context Definitions changed and new term added
2.3 Methodology New text added to describe risk assessment process New section 2.3.2 describing risk ranking
2.4 Overview of Natural Hazards in Georgia
Changed title from All-Hazard Assessment Reformatted and revised all sections Added maps and tables into sections Updated dates to section to reflect the dates as they per-
tain to the plan update
2.5 Hazard-Specific Assessments Tropical cyclone to Hurricane Wind New geologic hazards section; includes sinkhole and
landslide New coastal hazards section; includes previous storm
surge and coastal flooding; adds related hazards Seismic changed to Earthquake Added text to each section Added maps and figures Updated tables, text, and maps to reflect the current
available data for hazards 2.6 Social Vulnerability Assessment Updated data, tables and maps
Name changed from Vulnerability Assessment 2.7 Composite Assessment Updated tables, text, and maps to reflect the current
available data for composite assessment 2.8 Loss Potential Updated tables, text, and maps to reflect the current
available data for hazard risk Table 2.1: Overview of Updates to Chapter 2: Hazard, Risk, and Vulnerability Assessment
15
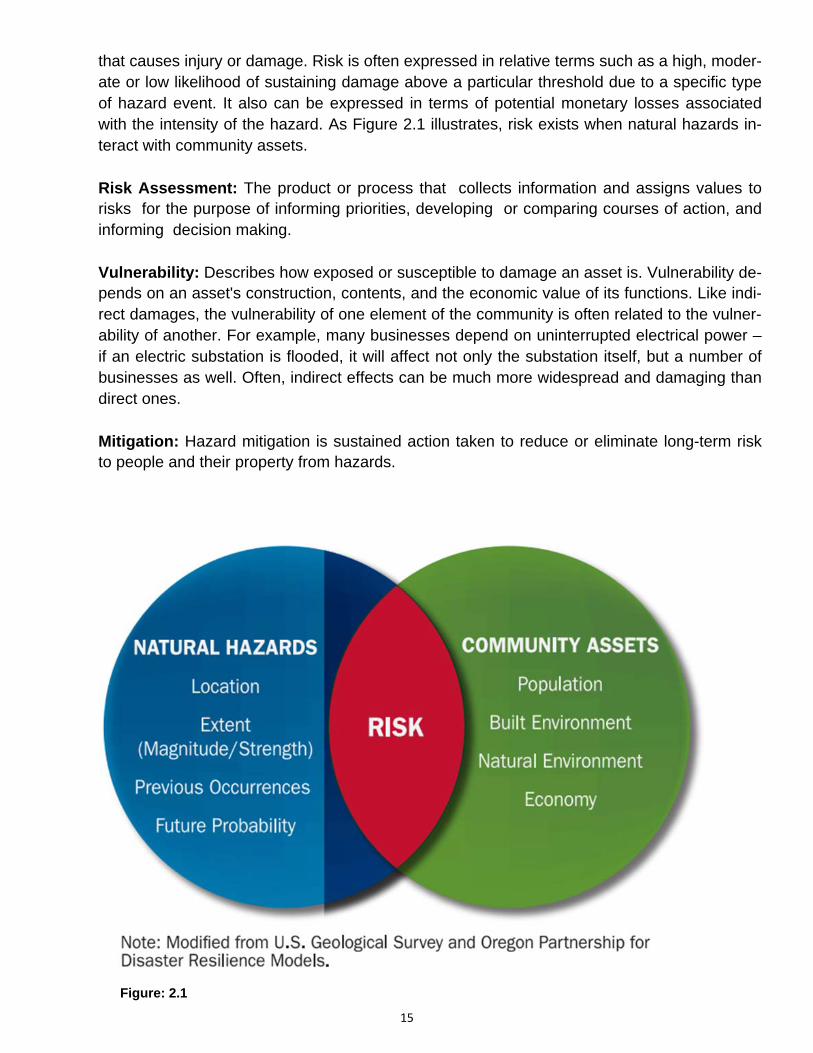
that causes injury or damage. Risk is often expressed in relative terms such as a high, moder-ate or low likelihood of sustaining damage above a particular threshold due to a specific type of hazard event. It also can be expressed in terms of potential monetary losses associated with the intensity of the hazard. As Figure 2.1 illustrates, risk exists when natural hazards in-teract with community assets. Risk Assessment: The product or process that collects information and assigns values to risks for the purpose of informing priorities, developing or comparing courses of action, and informing decision making. Vulnerability: Describes how exposed or susceptible to damage an asset is. Vulnerability de-pends on an asset's construction, contents, and the economic value of its functions. Like indi-rect damages, the vulnerability of one element of the community is often related to the vulner-ability of another. For example, many businesses depend on uninterrupted electrical power – if an electric substation is flooded, it will affect not only the substation itself, but a number of businesses as well. Often, indirect effects can be much more widespread and damaging than direct ones. Mitigation: Hazard mitigation is sustained action taken to reduce or eliminate long-term risk to people and their property from hazards.
Figure: 2.1
16
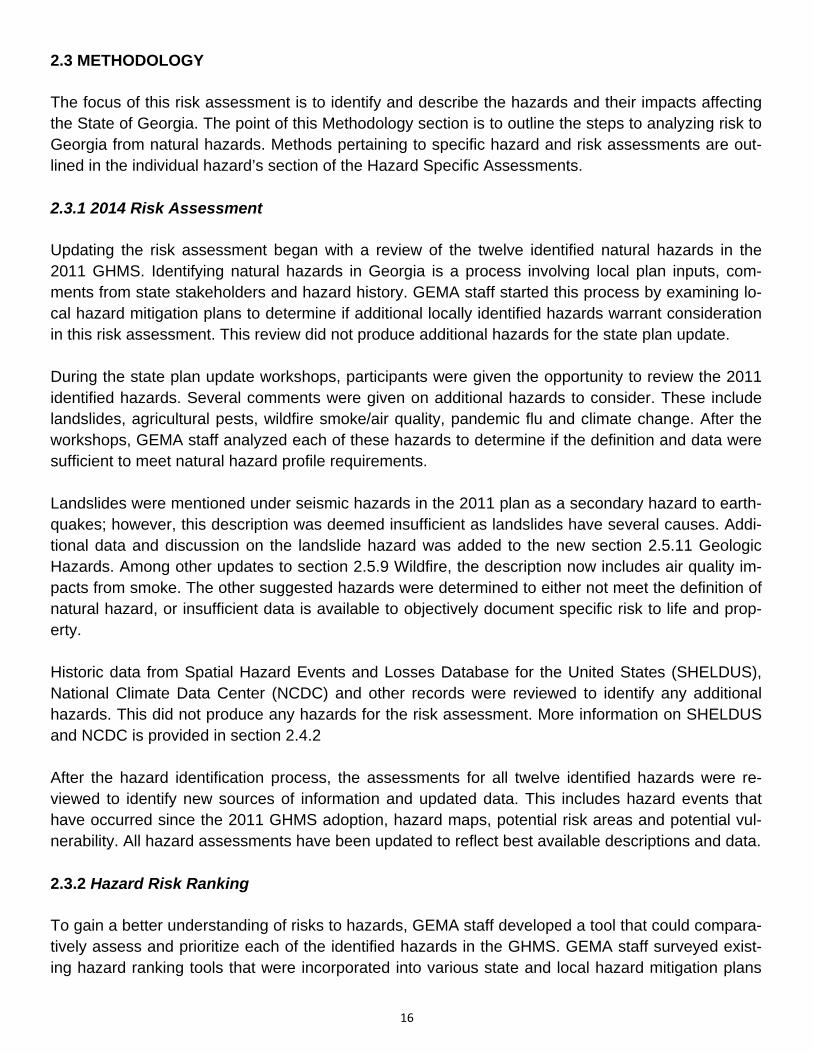
2.3 METHODOLOGY The focus of this risk assessment is to identify and describe the hazards and their impacts affecting the State of Georgia. The point of this Methodology section is to outline the steps to analyzing risk to Georgia from natural hazards. Methods pertaining to specific hazard and risk assessments are out-lined in the individual hazard’s section of the Hazard Specific Assessments. 2.3.1 2014 Risk Assessment Updating the risk assessment began with a review of the twelve identified natural hazards in the 2011 GHMS. Identifying natural hazards in Georgia is a process involving local plan inputs, com-ments from state stakeholders and hazard history. GEMA staff started this process by examining lo-cal hazard mitigation plans to determine if additional locally identified hazards warrant consideration in this risk assessment. This review did not produce additional hazards for the state plan update. During the state plan update workshops, participants were given the opportunity to review the 2011 identified hazards. Several comments were given on additional hazards to consider. These include landslides, agricultural pests, wildfire smoke/air quality, pandemic flu and climate change. After the workshops, GEMA staff analyzed each of these hazards to determine if the definition and data were sufficient to meet natural hazard profile requirements. Landslides were mentioned under seismic hazards in the 2011 plan as a secondary hazard to earth-quakes; however, this description was deemed insufficient as landslides have several causes. Addi-tional data and discussion on the landslide hazard was added to the new section 2.5.11 Geologic Hazards. Among other updates to section 2.5.9 Wildfire, the description now includes air quality im-pacts from smoke. The other suggested hazards were determined to either not meet the definition of natural hazard, or insufficient data is available to objectively document specific risk to life and prop-erty. Historic data from Spatial Hazard Events and Losses Database for the United States (SHELDUS), National Climate Data Center (NCDC) and other records were reviewed to identify any additional hazards. This did not produce any hazards for the risk assessment. More information on SHELDUS and NCDC is provided in section 2.4.2 After the hazard identification process, the assessments for all twelve identified hazards were re-viewed to identify new sources of information and updated data. This includes hazard events that have occurred since the 2011 GHMS adoption, hazard maps, potential risk areas and potential vul-nerability. All hazard assessments have been updated to reflect best available descriptions and data. 2.3.2 Hazard Risk Ranking To gain a better understanding of risks to hazards, GEMA staff developed a tool that could compara-tively assess and prioritize each of the identified hazards in the GHMS. GEMA staff surveyed exist-ing hazard ranking tools that were incorporated into various state and local hazard mitigation plans
17
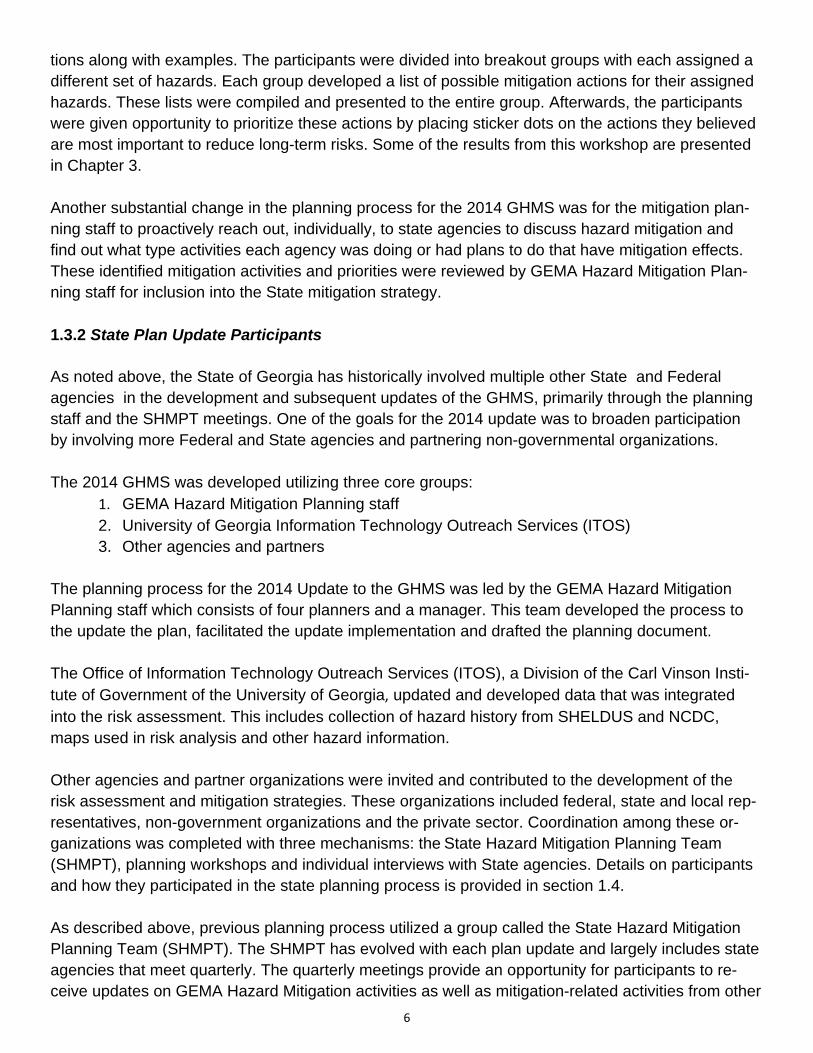
around the nation. While many of those ranking tools in other mitigation plans had useful or insightful components or methods, GEMA staff created its own methodology incorporating best practices from other examples. Among the problems this methodology attempts to resolve includes developing a priority ranking based on total risk, factoring vulnerability into risk and potential for events not recorded in data sources. An example of the latter is hurricanes. While some major hurricanes have made impact in the past, none have in over a century therefore data event and impact sources such as SHELDUS and NCDC do not have information on this hazard since those records begin in the 1950’s. The basic definition that GEMA staff operated from to create this methodology is that Risk = Hazard + Vulnerability. Specific categories were identified based on common definitions of hazard and vul-nerability. Where possible, objective data was utilized such as events per year and annualized loss-es. Only data was from 1992-2012 was incorporated since older records are often incomplete. This methodology is not intended to be a scientific process, but rather an additional tool for understanding natural hazards in Georgia. The results are presented in Tables 2.2, 2.3 and 2.4.
Hazard:
Vulnerability:
Blue: Historical Impact (SHELDUS data) Green: Potential Hazard Red: Potential Vulnerability
Historical Frequency
Duration Area
Impacted
Annualized Losses
Injuries and Deaths Per
Year
Human Loss
Property Damage &
Effect
Critical Facilities Impacted
Economy Disruption
Natural and Cul-tural Resources (Environment)
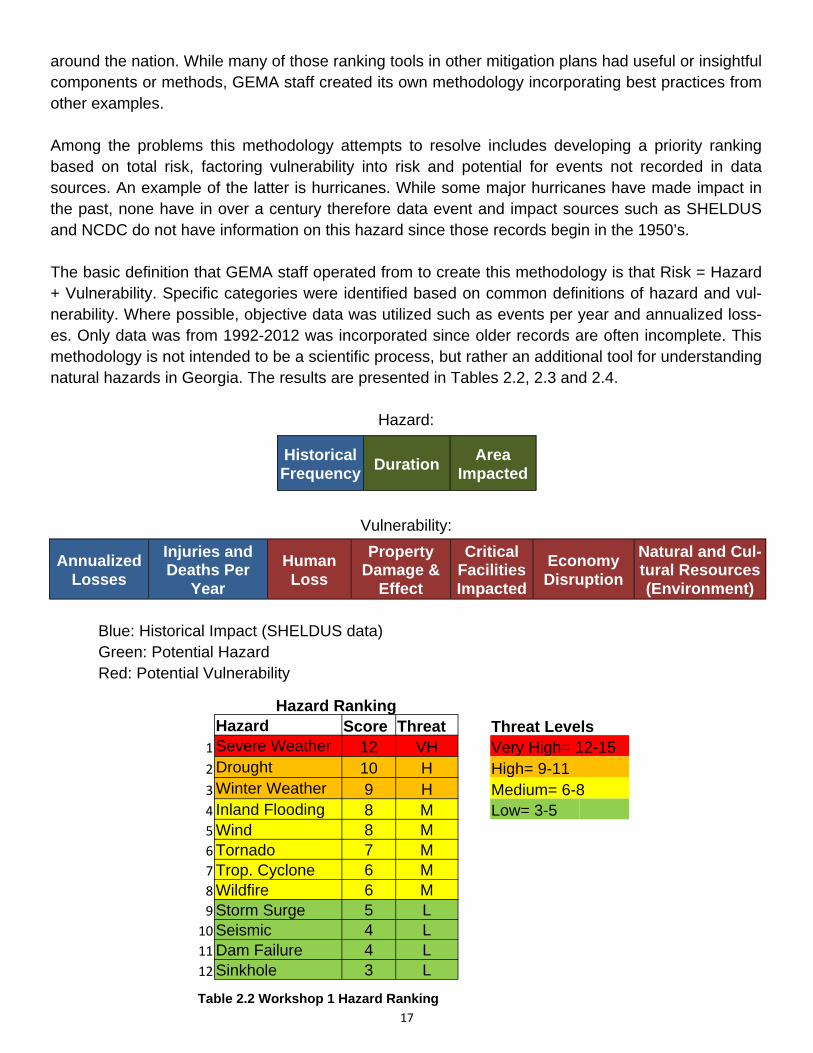
Hazard Ranking
Hazard Score Threat Threat Levels 1 Severe Weather 12 VH Very High= 12-15 2 Drought 10 H High= 9-11 3 Winter Weather 9 H Medium= 6-8 4 Inland Flooding 8 M Low= 3-5 5 Wind 8 M 6 Tornado 7 M
7 Trop. Cyclone 6 M
8 Wildfire 6 M
9 Storm Surge 5 L
10 Seismic 4 L
11 Dam Failure 4 L
12 Sinkhole 3 L
Table 2.2 Workshop 1 Hazard Ranking
18
This ranking methodology was presented in the state plan update workshops and participants were given the opportunity to present their perspectives of these hazards based on their understanding of the hazards and the scoring criteria presented. Worksheets used in this ranking are included in Ap-pendix C. The hazard specific assessments in section 2.5 include the hazard, vulnerability and risk levels as well as the total rank out of the 12 hazards.
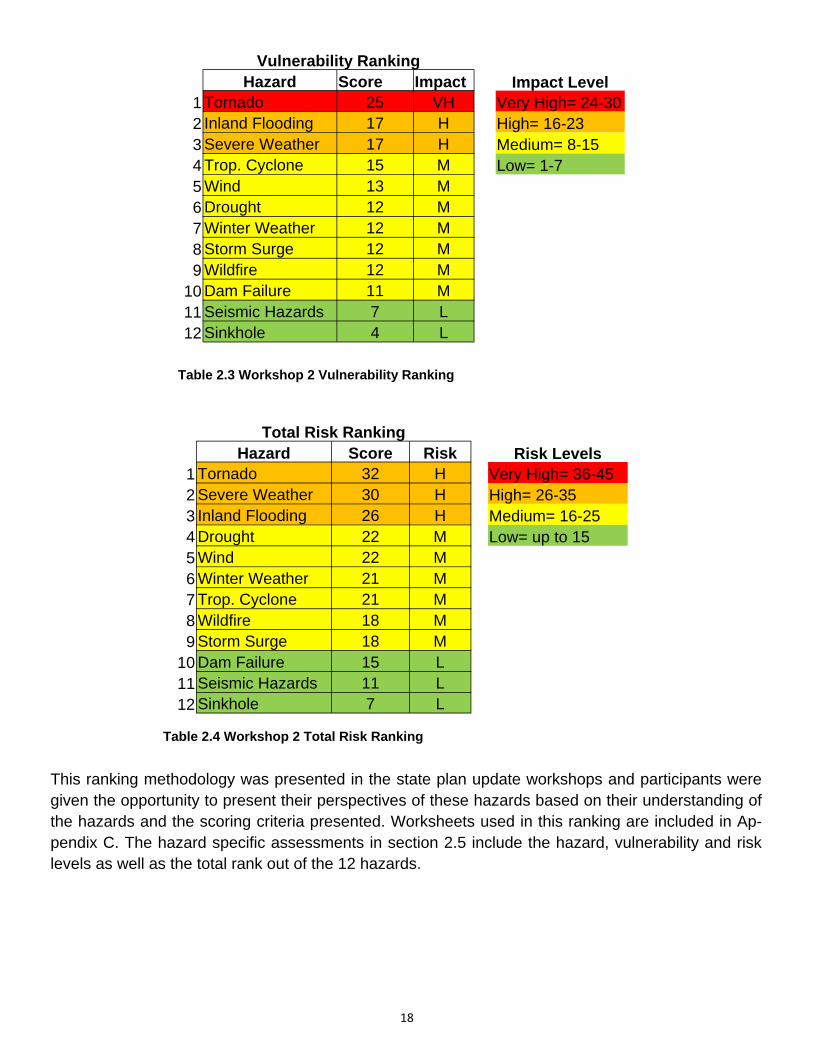
Vulnerability Ranking
Hazard Score Impact Impact Level 1 Tornado 25 VH Very High= 24-30 2 Inland Flooding 17 H High= 16-23 3 Severe Weather 17 H Medium= 8-15 4 Trop. Cyclone 15 M Low= 1-7 5 Wind 13 M
6 Drought 12 M
7 Winter Weather 12 M
8 Storm Surge 12 M
9 Wildfire 12 M
10 Dam Failure 11 M
11 Seismic Hazards 7 L
12 Sinkhole 4 L
Table 2.3 Workshop 2 Vulnerability Ranking
Total Risk Ranking
Hazard Score Risk Risk Levels 1 Tornado 32 H Very High= 36-45 2 Severe Weather 30 H High= 26-35 3 Inland Flooding 26 H Medium= 16-25 4 Drought 22 M Low= up to 15 5 Wind 22 M
6 Winter Weather 21 M
7 Trop. Cyclone 21 M
8 Wildfire 18 M
9 Storm Surge 18 M
10 Dam Failure 15 L
11 Seismic Hazards 11 L
12 Sinkhole 7 L
Table 2.4 Workshop 2 Total Risk Ranking
19
2.4 OVERVIEW OF NATURAL HAZARDS IN GEORGIA
2.4.1 Introduction
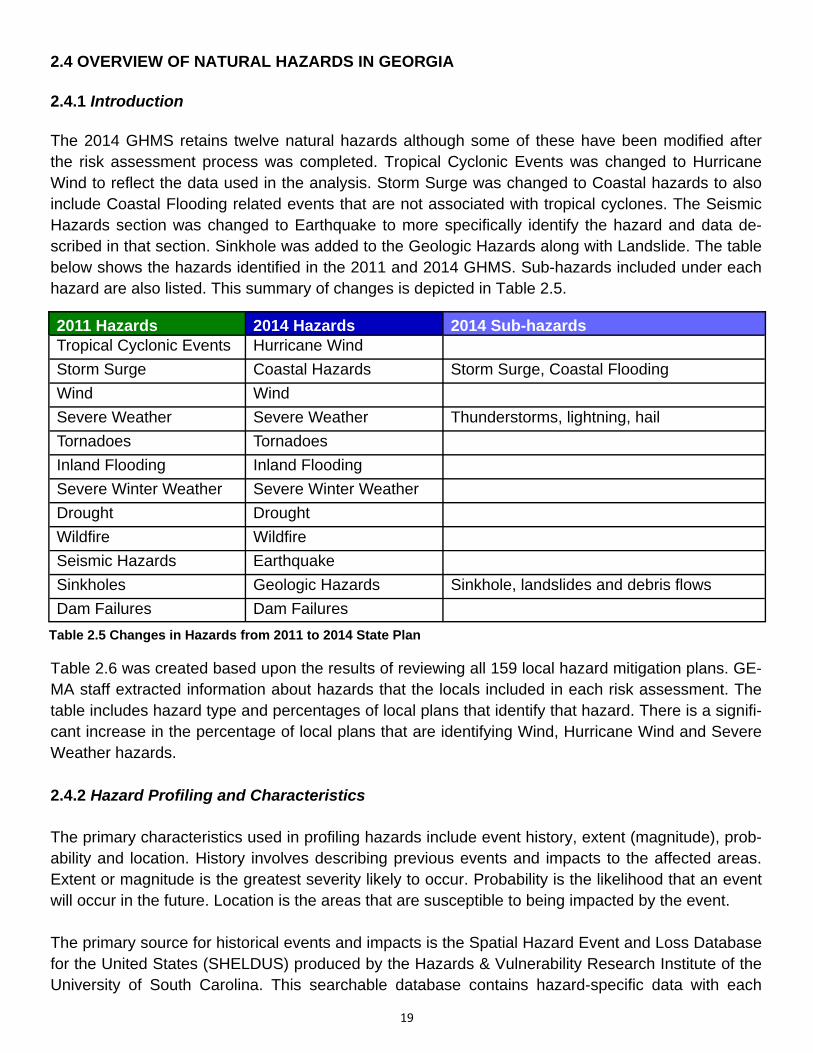
The 2014 GHMS retains twelve natural hazards although some of these have been modified after the risk assessment process was completed. Tropical Cyclonic Events was changed to Hurricane Wind to reflect the data used in the analysis. Storm Surge was changed to Coastal hazards to also include Coastal Flooding related events that are not associated with tropical cyclones. The Seismic Hazards section was changed to Earthquake to more specifically identify the hazard and data de-scribed in that section. Sinkhole was added to the Geologic Hazards along with Landslide. The table below shows the hazards identified in the 2011 and 2014 GHMS. Sub-hazards included under each hazard are also listed. This summary of changes is depicted in Table 2.5.
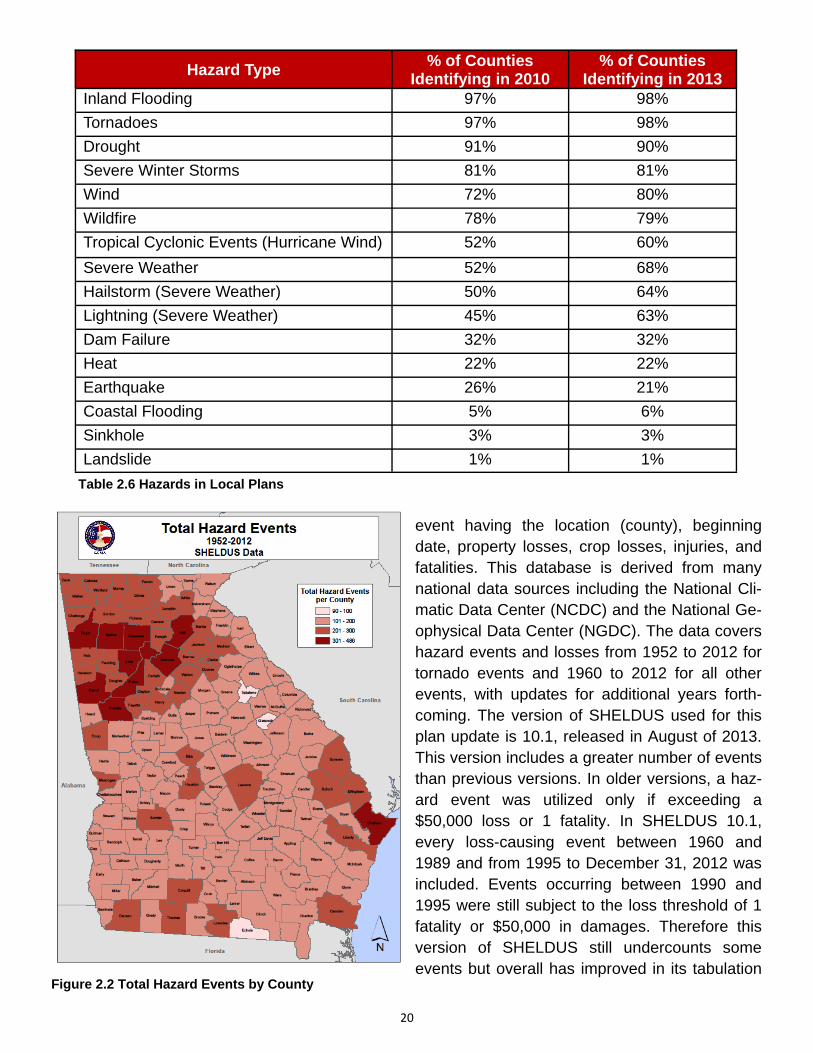
Table 2.6 was created based upon the results of reviewing all 159 local hazard mitigation plans. GE-MA staff extracted information about hazards that the locals included in each risk assessment. The table includes hazard type and percentages of local plans that identify that hazard. There is a signifi-cant increase in the percentage of local plans that are identifying Wind, Hurricane Wind and Severe Weather hazards. 2.4.2 Hazard Profiling and Characteristics The primary characteristics used in profiling hazards include event history, extent (magnitude), prob-ability and location. History involves describing previous events and impacts to the affected areas. Extent or magnitude is the greatest severity likely to occur. Probability is the likelihood that an event will occur in the future. Location is the areas that are susceptible to being impacted by the event. The primary source for historical events and impacts is the Spatial Hazard Event and Loss Database for the United States (SHELDUS) produced by the Hazards & Vulnerability Research Institute of the University of South Carolina. This searchable database contains hazard-specific data with each
2011 Hazards 2014 Hazards 2014 Sub-hazards Tropical Cyclonic Events Hurricane Wind
Storm Surge Coastal Hazards Storm Surge, Coastal Flooding
Wind Wind
Severe Weather Severe Weather Thunderstorms, lightning, hail
Tornadoes Tornadoes
Inland Flooding Inland Flooding
Severe Winter Weather Severe Winter Weather
Drought Drought
Wildfire Wildfire
Seismic Hazards Earthquake
Sinkholes Geologic Hazards Sinkhole, landslides and debris flows
Dam Failures Dam Failures
Table 2.5 Changes in Hazards from 2011 to 2014 State Plan
20
event having the location (county), beginning date, property losses, crop losses, injuries, and fatalities. This database is derived from many national data sources including the National Cli-matic Data Center (NCDC) and the National Ge-ophysical Data Center (NGDC). The data covers hazard events and losses from 1952 to 2012 for tornado events and 1960 to 2012 for all other events, with updates for additional years forth-coming. The version of SHELDUS used for this plan update is 10.1, released in August of 2013. This version includes a greater number of events than previous versions. In older versions, a haz-ard event was utilized only if exceeding a $50,000 loss or 1 fatality. In SHELDUS 10.1, every loss-causing event between 1960 and 1989 and from 1995 to December 31, 2012 was included. Events occurring between 1990 and 1995 were still subject to the loss threshold of 1 fatality or $50,000 in damages. Therefore this version of SHELDUS still undercounts some events but overall has improved in its tabulation
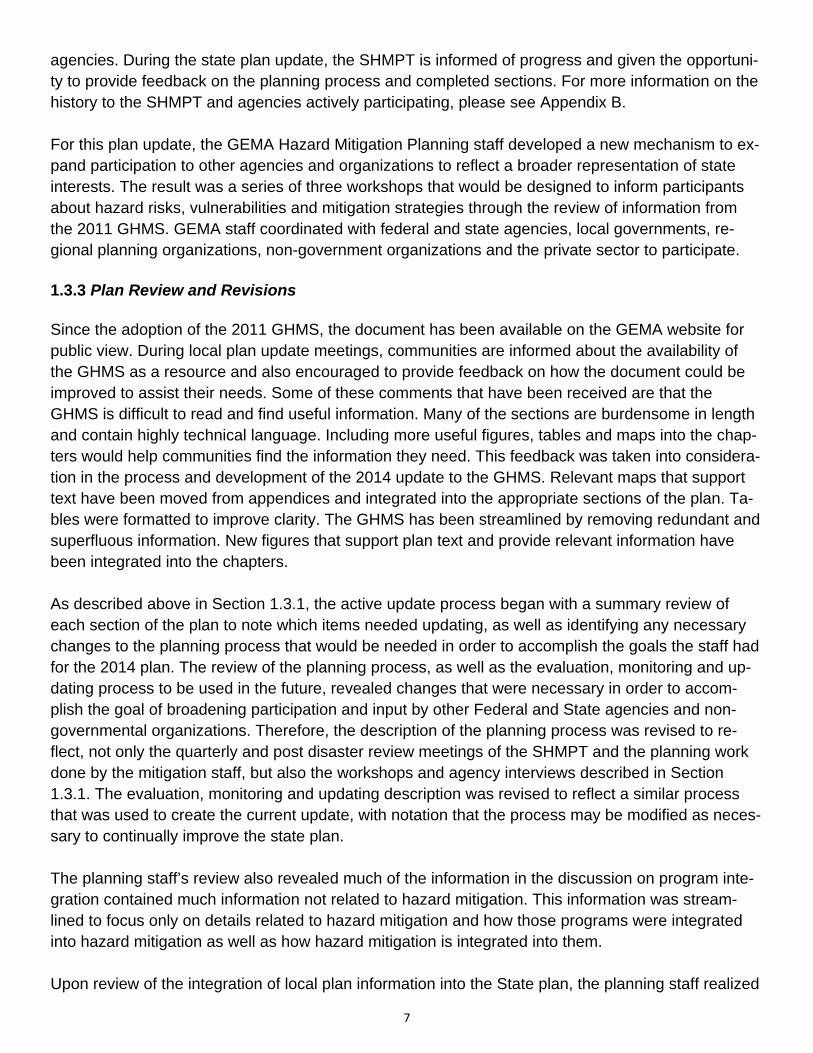
Figure 2.2 Total Hazard Events by County
Hazard Type % of Counties
Identifying in 2010 Inland Flooding 97%
Tornadoes 97%
Drought 91%
Severe Winter Storms 81%
Wind 72%
Wildfire 78%
Tropical Cyclonic Events (Hurricane Wind) 52%
Severe Weather 52%
Hailstorm (Severe Weather) 50%
Lightning (Severe Weather) 45%
Dam Failure 32%
Heat 22%
Earthquake 26%
Coastal Flooding 5%
Sinkhole 3%
Landslide 1%
% of Counties Identifying in 2013
98%
98%
90%
81%
80%
79%
60%
68%
64%
63%
32%
22%
21%
6%
3%
1%
Table 2.6 Hazards in Local Plans
21
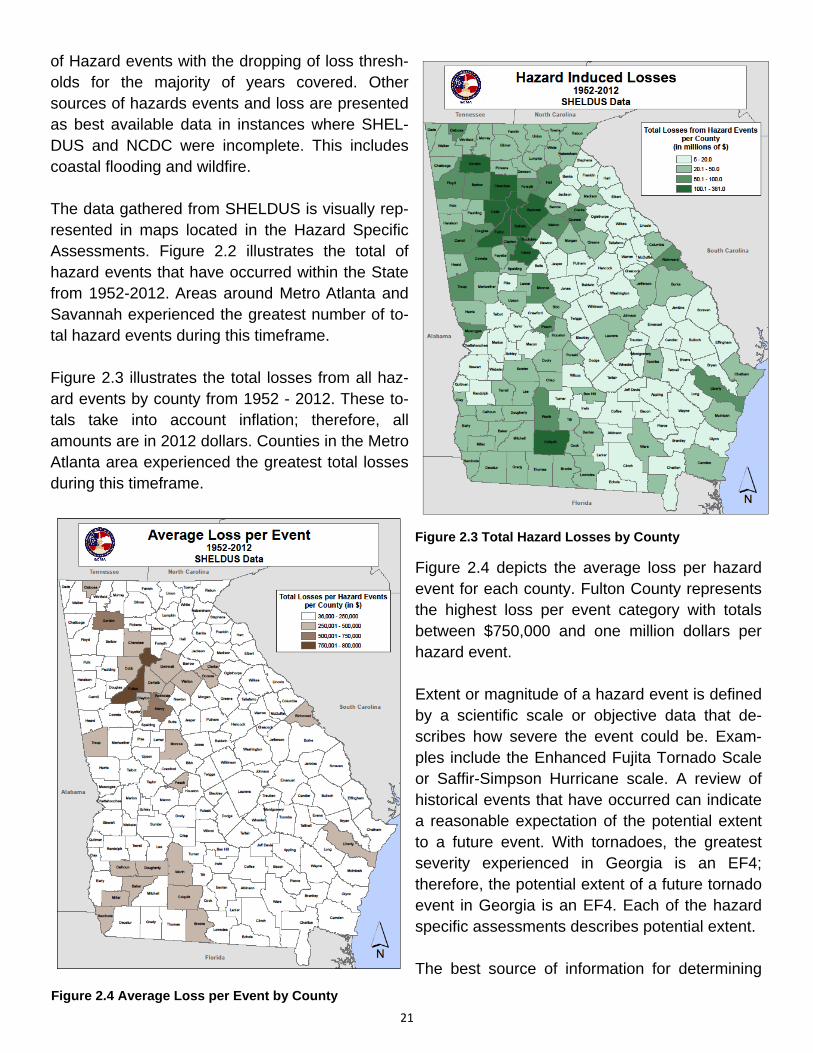
of Hazard events with the dropping of loss thresh-olds for the majority of years covered. Other sources of hazards events and loss are presented as best available data in instances where SHEL-DUS and NCDC were incomplete. This includes coastal flooding and wildfire. The data gathered from SHELDUS is visually rep-resented in maps located in the Hazard Specific Assessments. Figure 2.2 illustrates the total of hazard events that have occurred within the State from 1952-2012. Areas around Metro Atlanta and Savannah experienced the greatest number of to-tal hazard events during this timeframe. Figure 2.3 illustrates the total losses from all haz-ard events by county from 1952 - 2012. These to-tals take into account inflation; therefore, all amounts are in 2012 dollars. Counties in the Metro Atlanta area experienced the greatest total losses during this timeframe.
Figure 2.4 depicts the average loss per hazard event for each county. Fulton County represents the highest loss per event category with totals between $750,000 and one million dollars per hazard event. Extent or magnitude of a hazard event is defined by a scientific scale or objective data that de-scribes how severe the event could be. Exam-ples include the Enhanced Fujita Tornado Scale or Saffir-Simpson Hurricane scale. A review of historical events that have occurred can indicate a reasonable expectation of the potential extent to a future event. With tornadoes, the greatest severity experienced in Georgia is an EF4; therefore, the potential extent of a future tornado event in Georgia is an EF4. Each of the hazard specific assessments describes potential extent. The best source of information for determining
Figure 2.3 Total Hazard Losses by County
Figure 2.4 Average Loss per Event by County
22
future probability is to review the historic occurrence or frequency of a hazard event. This is limited depending on the quality of historical records and availability of data. For example, no major hurri-cane has made landfall since 1898; however, between 1854 and 1898 there were three. There is not enough scientific data to determine the exact probability of a future event. Location of the areas susceptible to the hazard event also takes into consideration previous occur-rences. However, just as the case with other profile characteristics location depends on the availabil-ity and quality of data. Maps are included in the hazard specific assessments to help indicate sus-ceptible locations either by historical events or other data sources such as floodplain maps and wild-fire risk.
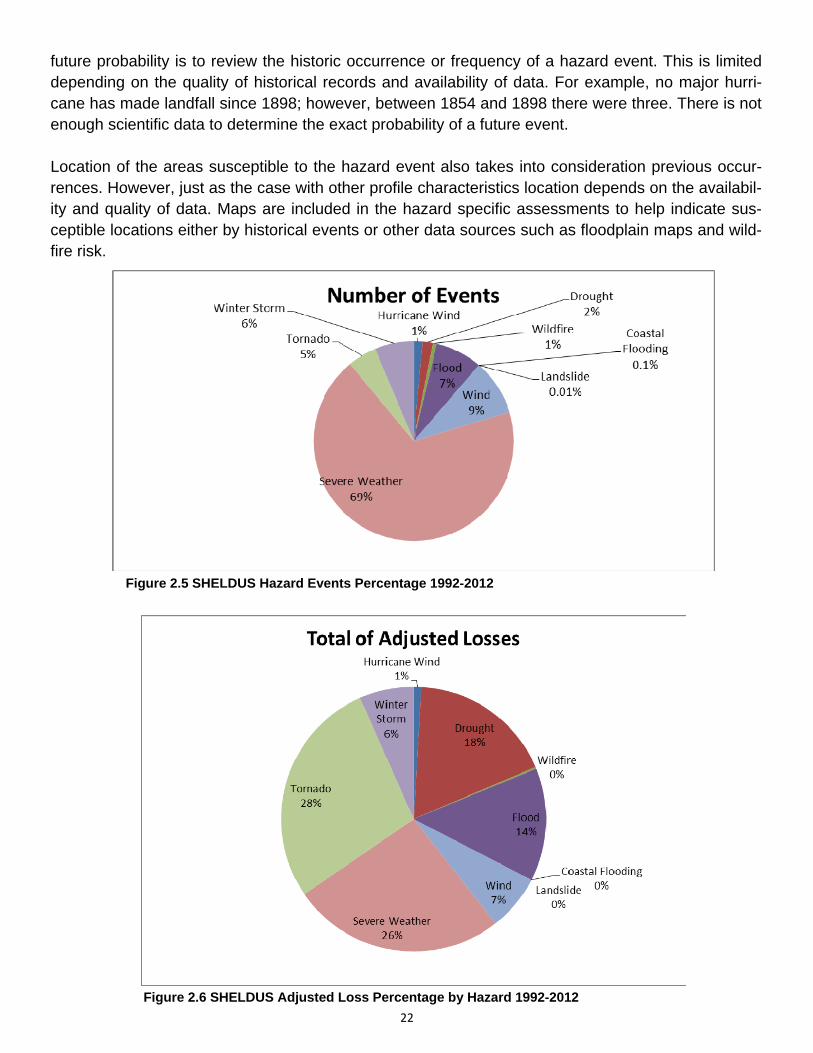
Figure 2.5 SHELDUS Hazard Events Percentage 1992-2012
Figure 2.6 SHELDUS Adjusted Loss Percentage by Hazard 1992-2012
23
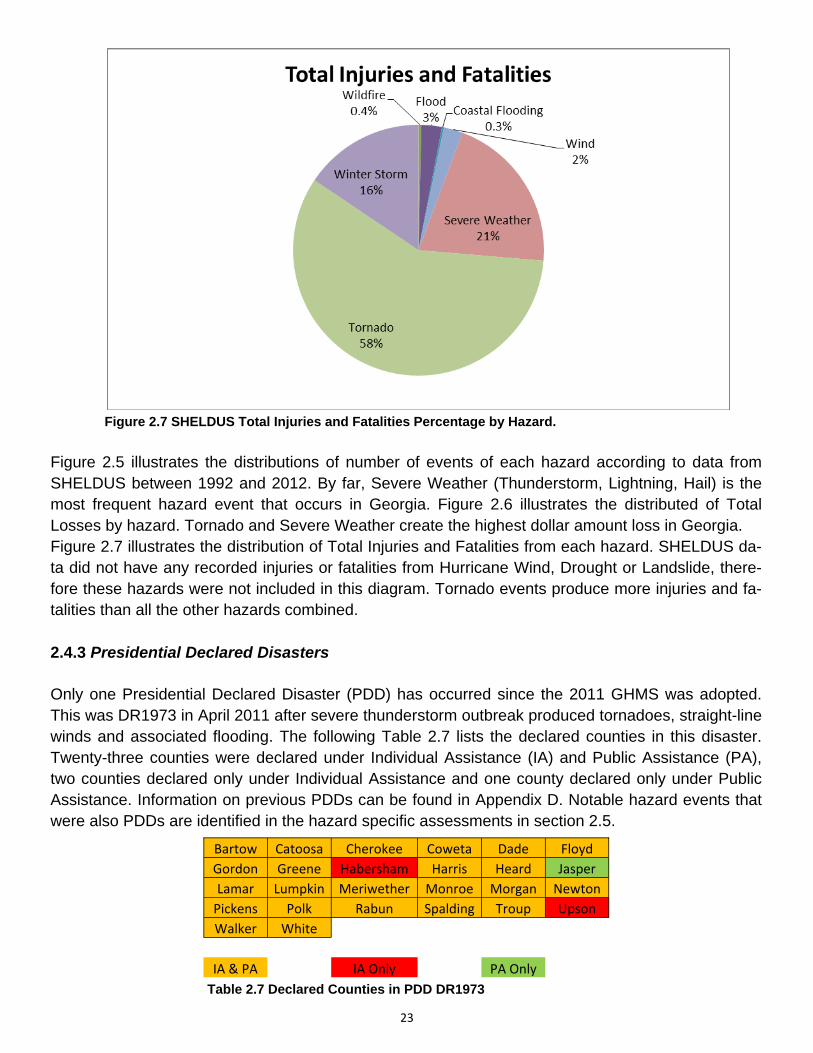
Figure 2.5 illustrates the distributions of number of events of each hazard according to data from SHELDUS between 1992 and 2012. By far, Severe Weather (Thunderstorm, Lightning, Hail) is the most frequent hazard event that occurs in Georgia. Figure 2.6 illustrates the distributed of Total Losses by hazard. Tornado and Severe Weather create the highest dollar amount loss in Georgia. Figure 2.7 illustrates the distribution of Total Injuries and Fatalities from each hazard. SHELDUS da-ta did not have any recorded injuries or fatalities from Hurricane Wind, Drought or Landslide, there-fore these hazards were not included in this diagram. Tornado events produce more injuries and fa-talities than all the other hazards combined. 2.4.3 Presidential Declared Disasters Only one Presidential Declared Disaster (PDD) has occurred since the 2011 GHMS was adopted. This was DR1973 in April 2011 after severe thunderstorm outbreak produced tornadoes, straight-line winds and associated flooding. The following Table 2.7 lists the declared counties in this disaster. Twenty-three counties were declared under Individual Assistance (IA) and Public Assistance (PA), two counties declared only under Individual Assistance and one county declared only under Public Assistance. Information on previous PDDs can be found in Appendix D. Notable hazard events that were also PDDs are identified in the hazard specific assessments in section 2.5.
Figure 2.7 SHELDUS Total Injuries and Fatalities Percentage by Hazard.
Bartow Catoosa Cherokee Coweta Dade Floyd
Gordon Greene Habersham Harris Heard Jasper
Lamar Lumpkin Meriwether Monroe Morgan Newton
Pickens Polk Rabun Spalding Troup Upson
Walker White
IA & PA IA Only PA Only
Table 2.7 Declared Counties in PDD DR1973
24
2.5 HAZARD SPECIFIC ASSESSMENTS The hazard-specific assessments contained within this section follow the subsequent order:
2.5.1 Hurricane Wind 2.5.2 Coastal Hazards (includes storm surge and coastal flooding) 2.5.3 Wind 2.5.4 Severe Weather (includes lightning and hail) 2.5.5 Tornado 2.5.6 Inland Flooding 2.5.7 Severe Winter Weather 2.5.8 Drought 2.5.9 Wildfire 2.5.10 Earthquake 2.5.11 Geologic Hazards (includes sinkhole and landslide) 2.5.12 Dam Failure
Within each hazard’s assessment will be a description of the event and a hazard profile. The description defines what the hazard is and general information on characteristics. The hazard profile describes the history of the hazard in Georgia, locations susceptible to the hazard, prob-ability of occurrence and extent. Hazard history includes SHELDUS data where this infor-mation is available. Maps, tables and other related figures are also included to describe and profile each hazard.
25
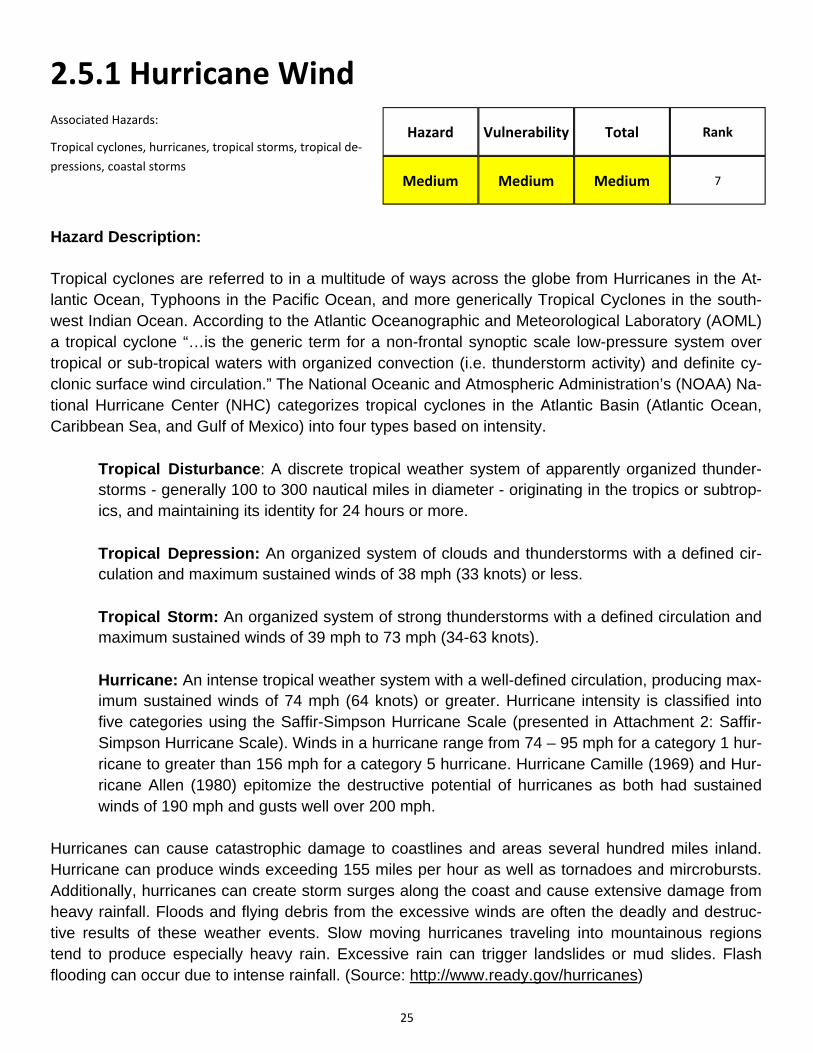
2.5.1 Hurricane Wind Associated Hazards:
Tropical cyclones, hurricanes, tropical storms, tropical de‐
pressions, coastal storms
Hazard Vulnerability Total
Medium Medium Medium
Rank
7
Hazard Description: Tropical cyclones are referred to in a multitude of ways across the globe from Hurricanes in the At-lantic Ocean, Typhoons in the Pacific Ocean, and more generically Tropical Cyclones in the south-west Indian Ocean. According to the Atlantic Oceanographic and Meteorological Laboratory (AOML) a tropical cyclone “…is the generic term for a non-frontal synoptic scale low-pressure system over tropical or sub-tropical waters with organized convection (i.e. thunderstorm activity) and definite cy-clonic surface wind circulation.” The National Oceanic and Atmospheric Administration’s (NOAA) Na-tional Hurricane Center (NHC) categorizes tropical cyclones in the Atlantic Basin (Atlantic Ocean, Caribbean Sea, and Gulf of Mexico) into four types based on intensity.
Tropical Disturbance: A discrete tropical weather system of apparently organized thunder-storms - generally 100 to 300 nautical miles in diameter - originating in the tropics or subtrop-ics, and maintaining its identity for 24 hours or more. Tropical Depression: An organized system of clouds and thunderstorms with a defined cir-culation and maximum sustained winds of 38 mph (33 knots) or less. Tropical Storm: An organized system of strong thunderstorms with a defined circulation and maximum sustained winds of 39 mph to 73 mph (34-63 knots). Hurricane: An intense tropical weather system with a well-defined circulation, producing max-imum sustained winds of 74 mph (64 knots) or greater. Hurricane intensity is classified into five categories using the Saffir-Simpson Hurricane Scale (presented in Attachment 2: Saffir-Simpson Hurricane Scale). Winds in a hurricane range from 74 – 95 mph for a category 1 hur-ricane to greater than 156 mph for a category 5 hurricane. Hurricane Camille (1969) and Hur-ricane Allen (1980) epitomize the destructive potential of hurricanes as both had sustained winds of 190 mph and gusts well over 200 mph.
Hurricanes can cause catastrophic damage to coastlines and areas several hundred miles inland. Hurricane can produce winds exceeding 155 miles per hour as well as tornadoes and mircrobursts. Additionally, hurricanes can create storm surges along the coast and cause extensive damage from heavy rainfall. Floods and flying debris from the excessive winds are often the deadly and destruc-tive results of these weather events. Slow moving hurricanes traveling into mountainous regions tend to produce especially heavy rain. Excessive rain can trigger landslides or mud slides. Flash flooding can occur due to intense rainfall. (Source: http://www.ready.gov/hurricanes)
26
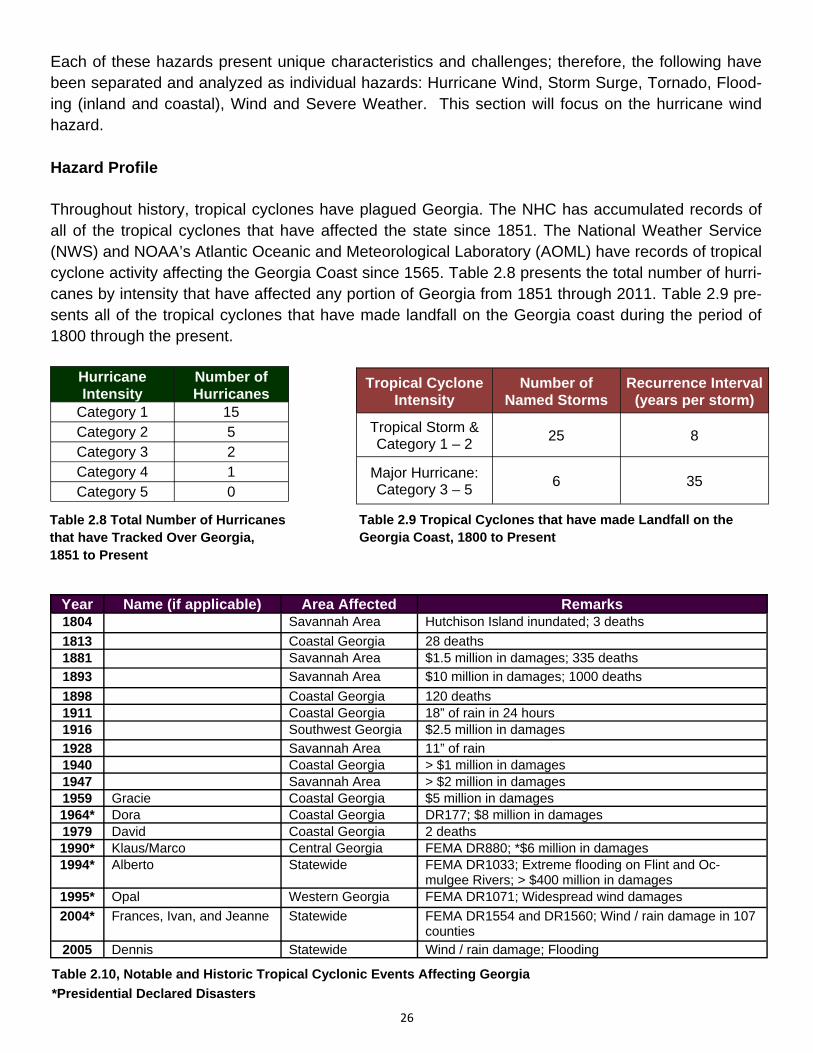
Each of these hazards present unique characteristics and challenges; therefore, the following have been separated and analyzed as individual hazards: Hurricane Wind, Storm Surge, Tornado, Flood-ing (inland and coastal), Wind and Severe Weather. This section will focus on the hurricane wind hazard. Hazard Profile Throughout history, tropical cyclones have plagued Georgia. The NHC has accumulated records of all of the tropical cyclones that have affected the state since 1851. The National Weather Service (NWS) and NOAA’s Atlantic Oceanic and Meteorological Laboratory (AOML) have records of tropical cyclone activity affecting the Georgia Coast since 1565. Table 2.8 presents the total number of hurri-canes by intensity that have affected any portion of Georgia from 1851 through 2011. Table 2.9 pre-sents all of the tropical cyclones that have made landfall on the Georgia coast during the period of 1800 through the present.
Year Name (if applicable) Area Affected Remarks 1804 Savannah Area Hutchison Island inundated; 3 deaths
1813 Coastal Georgia 28 deaths 1881 Savannah Area $1.5 million in damages; 335 deaths
1893 Savannah Area $10 million in damages; 1000 deaths
1898 Coastal Georgia 120 deaths 1911 Coastal Georgia 18” of rain in 24 hours 1916 Southwest Georgia $2.5 million in damages
1928 Savannah Area 11” of rain 1940 Coastal Georgia > $1 million in damages 1947 Savannah Area > $2 million in damages 1959 Gracie Coastal Georgia $5 million in damages 1964* Dora Coastal Georgia DR177; $8 million in damages 1979 David Coastal Georgia 2 deaths 1990* Klaus/Marco Central Georgia FEMA DR880; *$6 million in damages 1994* Alberto Statewide FEMA DR1033; Extreme flooding on Flint and Oc-
mulgee Rivers; > $400 million in damages 1995* Opal Western Georgia FEMA DR1071; Widespread wind damages
2004* Frances, Ivan, and Jeanne Statewide FEMA DR1554 and DR1560; Wind / rain damage in 107 counties
2005 Dennis Statewide Wind / rain damage; Flooding
Table 2.10, Notable and Historic Tropical Cyclonic Events Affecting Georgia
*Presidential Declared Disasters
Table 2.8 Total Number of Hurricanes that have Tracked Over Georgia, 1851 to Present
Hurricane Intensity
Number of Hurricanes
Category 1 15 Category 2 5 Category 3 2 Category 4 1 Category 5 0
Tropical Cyclone Intensity
Number of Named Storms
Recurrence Interval (years per storm)
Tropical Storm & Category 1 – 2
25 8
Major Hurricane: Category 3 – 5
6 35
Table 2.9 Tropical Cyclones that have made Landfall on the Georgia Coast, 1800 to Present
27
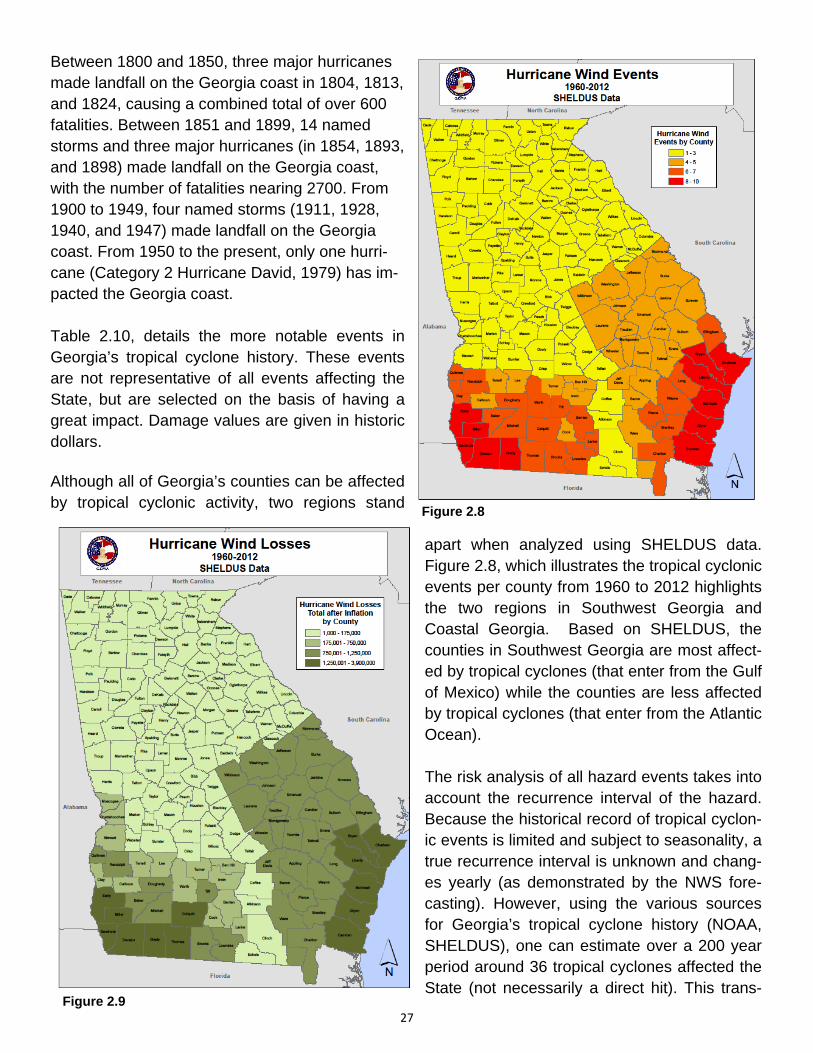
Between 1800 and 1850, three major hurricanes made landfall on the Georgia coast in 1804, 1813, and 1824, causing a combined total of over 600 fatalities. Between 1851 and 1899, 14 named storms and three major hurricanes (in 1854, 1893, and 1898) made landfall on the Georgia coast, with the number of fatalities nearing 2700. From 1900 to 1949, four named storms (1911, 1928, 1940, and 1947) made landfall on the Georgia coast. From 1950 to the present, only one hurri-cane (Category 2 Hurricane David, 1979) has im-pacted the Georgia coast. Table 2.10, details the more notable events in Georgia’s tropical cyclone history. These events are not representative of all events affecting the State, but are selected on the basis of having a great impact. Damage values are given in historic dollars.
Although all of Georgia’s counties can be affected by tropical cyclonic activity, two regions stand
apart when analyzed using SHELDUS data. Figure 2.8, which illustrates the tropical cyclonic events per county from 1960 to 2012 highlights the two regions in Southwest Georgia and Coastal Georgia. Based on SHELDUS, the counties in Southwest Georgia are most affect-ed by tropical cyclones (that enter from the Gulf of Mexico) while the counties are less affected by tropical cyclones (that enter from the Atlantic Ocean). The risk analysis of all hazard events takes into account the recurrence interval of the hazard. Because the historical record of tropical cyclon-ic events is limited and subject to seasonality, a true recurrence interval is unknown and chang-es yearly (as demonstrated by the NWS fore-casting). However, using the various sources for Georgia’s tropical cyclone history (NOAA, SHELDUS), one can estimate over a 200 year period around 36 tropical cyclones affected the State (not necessarily a direct hit). This trans-
Figure 2.9
Figure 2.8
28
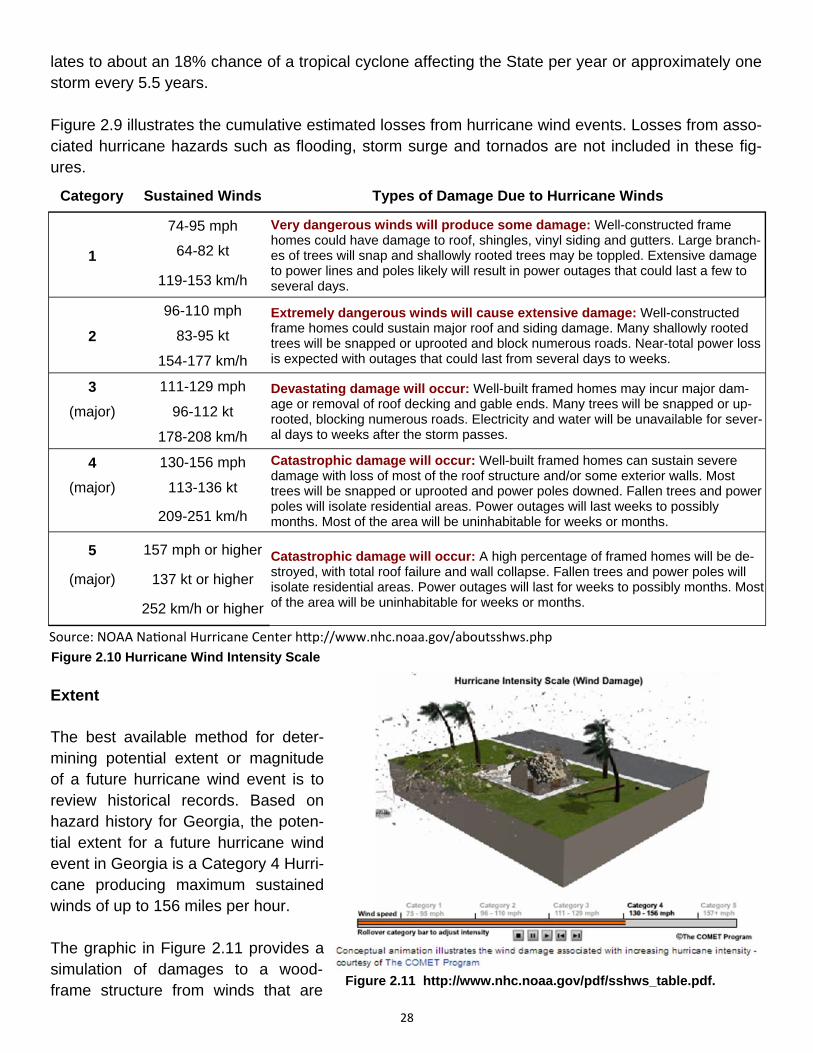
lates to about an 18% chance of a tropical cyclone affecting the State per year or approximately one storm every 5.5 years. Figure 2.9 illustrates the cumulative estimated losses from hurricane wind events. Losses from asso-ciated hurricane hazards such as flooding, storm surge and tornados are not included in these fig-ures.
Extent The best available method for deter-mining potential extent or magnitude of a future hurricane wind event is to review historical records. Based on hazard history for Georgia, the poten-tial extent for a future hurricane wind event in Georgia is a Category 4 Hurri-cane producing maximum sustained winds of up to 156 miles per hour. The graphic in Figure 2.11 provides a simulation of damages to a wood-frame structure from winds that are
Figure 2.11 http://www.nhc.noaa.gov/pdf/sshws_table.pdf.
Category Sustained Winds Types of Damage Due to Hurricane Winds
1
74-95 mph Very dangerous winds will produce some damage: Well-constructed frame homes could have damage to roof, shingles, vinyl siding and gutters. Large branch-es of trees will snap and shallowly rooted trees may be toppled. Extensive damage to power lines and poles likely will result in power outages that could last a few to several days.
64-82 kt
119-153 km/h
2
96-110 mph Extremely dangerous winds will cause extensive damage: Well-constructed frame homes could sustain major roof and siding damage. Many shallowly rooted trees will be snapped or uprooted and block numerous roads. Near-total power loss is expected with outages that could last from several days to weeks.
83-95 kt
154-177 km/h
3 111-129 mph Devastating damage will occur: Well-built framed homes may incur major dam-age or removal of roof decking and gable ends. Many trees will be snapped or up-rooted, blocking numerous roads. Electricity and water will be unavailable for sever-al days to weeks after the storm passes.
(major) 96-112 kt
178-208 km/h
4 130-156 mph Catastrophic damage will occur: Well-built framed homes can sustain severe damage with loss of most of the roof structure and/or some exterior walls. Most trees will be snapped or uprooted and power poles downed. Fallen trees and power poles will isolate residential areas. Power outages will last weeks to possibly months. Most of the area will be uninhabitable for weeks or months.
(major) 113-136 kt
209-251 km/h
5 157 mph or higher Catastrophic damage will occur: A high percentage of framed homes will be de-stroyed, with total roof failure and wall collapse. Fallen trees and power poles will isolate residential areas. Power outages will last for weeks to possibly months. Most of the area will be uninhabitable for weeks or months.
(major) 137 kt or higher
252 km/h or higher
Source: NOAA Na onal Hurricane Center h p://www.nhc.noaa.gov/aboutsshws.php
Figure 2.10 Hurricane Wind Intensity Scale
29
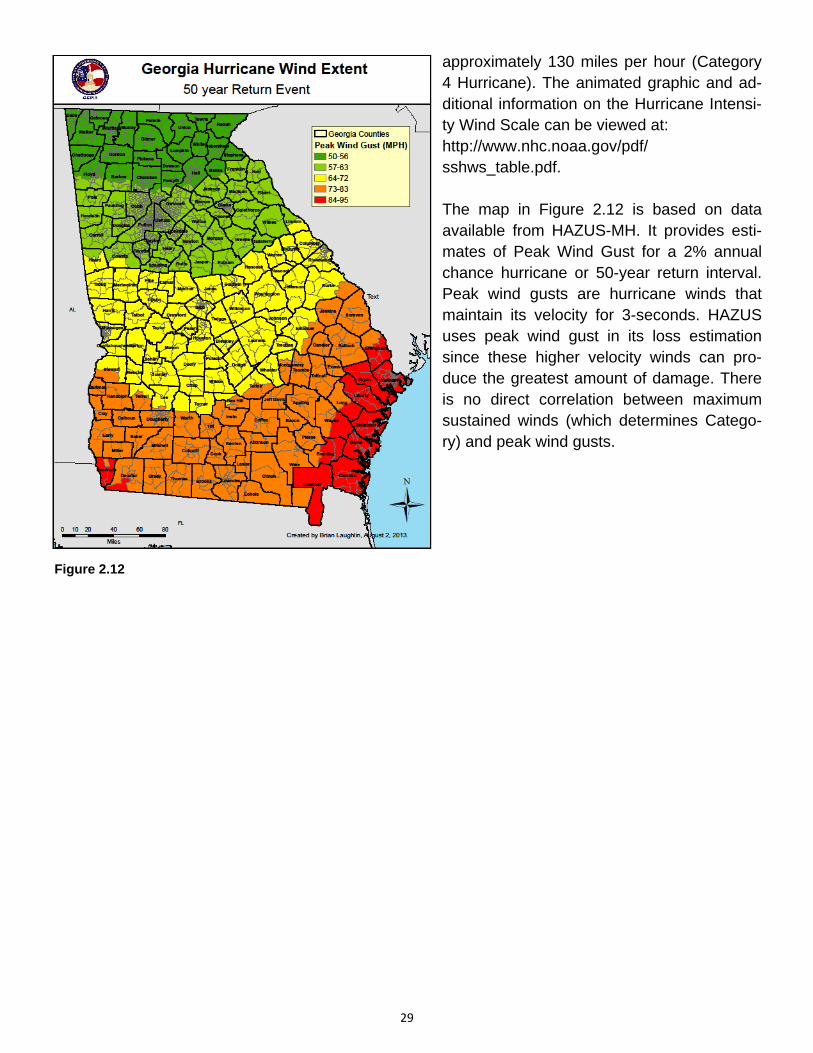
approximately 130 miles per hour (Category 4 Hurricane). The animated graphic and ad-ditional information on the Hurricane Intensi-ty Wind Scale can be viewed at: http://www.nhc.noaa.gov/pdf/sshws_table.pdf. The map in Figure 2.12 is based on data available from HAZUS-MH. It provides esti-mates of Peak Wind Gust for a 2% annual chance hurricane or 50-year return interval. Peak wind gusts are hurricane winds that maintain its velocity for 3-seconds. HAZUS uses peak wind gust in its loss estimation since these higher velocity winds can pro-duce the greatest amount of damage. There is no direct correlation between maximum sustained winds (which determines Catego-ry) and peak wind gusts.
Figure 2.12
30
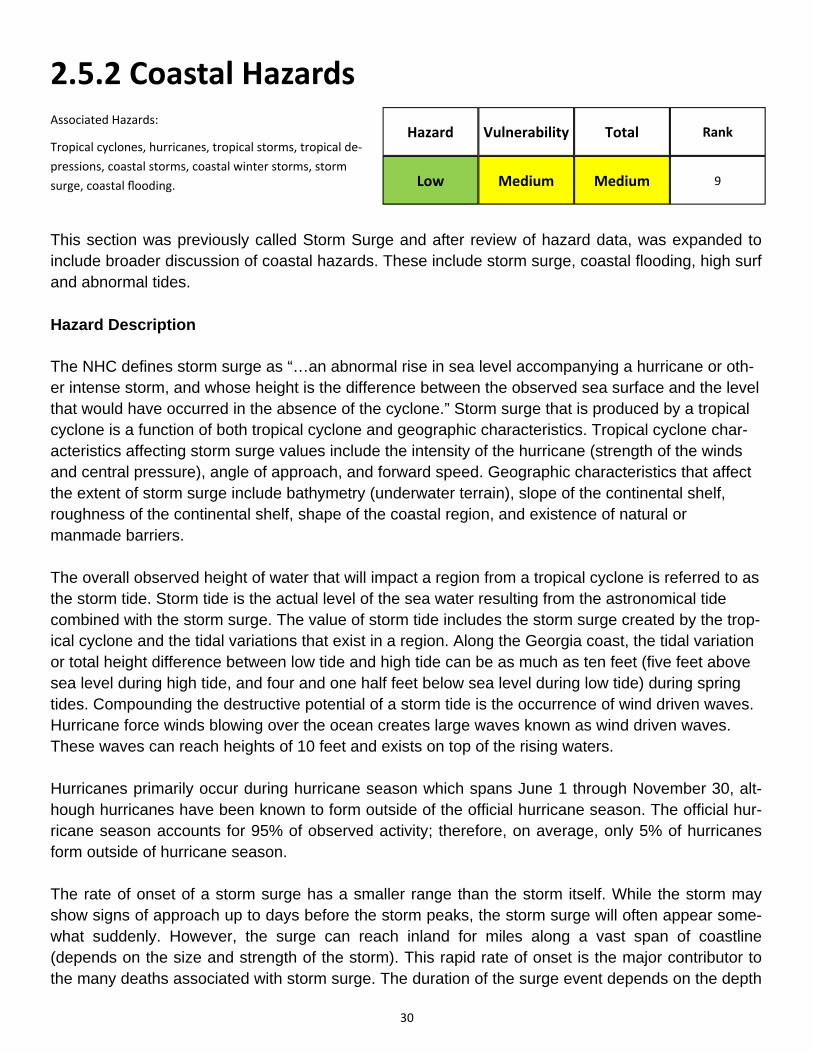
2.5.2 Coastal Hazards Associated Hazards:
Tropical cyclones, hurricanes, tropical storms, tropical de‐
pressions, coastal storms, coastal winter storms, storm
surge, coastal flooding.
Hazard Vulnerability Total
Low Medium Medium
Rank
9
This section was previously called Storm Surge and after review of hazard data, was expanded to include broader discussion of coastal hazards. These include storm surge, coastal flooding, high surf and abnormal tides. Hazard Description The NHC defines storm surge as “…an abnormal rise in sea level accompanying a hurricane or oth-er intense storm, and whose height is the difference between the observed sea surface and the level that would have occurred in the absence of the cyclone.” Storm surge that is produced by a tropical cyclone is a function of both tropical cyclone and geographic characteristics. Tropical cyclone char-acteristics affecting storm surge values include the intensity of the hurricane (strength of the winds and central pressure), angle of approach, and forward speed. Geographic characteristics that affect the extent of storm surge include bathymetry (underwater terrain), slope of the continental shelf, roughness of the continental shelf, shape of the coastal region, and existence of natural or manmade barriers. The overall observed height of water that will impact a region from a tropical cyclone is referred to as the storm tide. Storm tide is the actual level of the sea water resulting from the astronomical tide combined with the storm surge. The value of storm tide includes the storm surge created by the trop-ical cyclone and the tidal variations that exist in a region. Along the Georgia coast, the tidal variation or total height difference between low tide and high tide can be as much as ten feet (five feet above sea level during high tide, and four and one half feet below sea level during low tide) during spring tides. Compounding the destructive potential of a storm tide is the occurrence of wind driven waves. Hurricane force winds blowing over the ocean creates large waves known as wind driven waves. These waves can reach heights of 10 feet and exists on top of the rising waters. Hurricanes primarily occur during hurricane season which spans June 1 through November 30, alt-hough hurricanes have been known to form outside of the official hurricane season. The official hur-ricane season accounts for 95% of observed activity; therefore, on average, only 5% of hurricanes form outside of hurricane season. The rate of onset of a storm surge has a smaller range than the storm itself. While the storm may show signs of approach up to days before the storm peaks, the storm surge will often appear some-what suddenly. However, the surge can reach inland for miles along a vast span of coastline (depends on the size and strength of the storm). This rapid rate of onset is the major contributor to the many deaths associated with storm surge. The duration of the surge event depends on the depth
31
of the surge and other environmental factors such as drainage capability. The waters from the surge may remain for days in certain areas. The frequency of storm surges of a certain magnitude greatly depends on the frequency of tropical cyclones with the ability to produce the surge. The measure of magnitude of storm surge is largely based upon height above mean water level. It should be noted that tropical cyclones are not the only type of storms that can cause destructive storm surge. Albeit less common in Georgia, nor’easters and strong winter storms can result in ele-vated water levels, which while not as high at their peak, may be more destructive over a sustained period of time. Coastal flooding is defined as flooding of coastal areas not associated with tropical cyclone events. Coastal flooding is caused by strong, persistent onshore wind, high astronomical tide, and/or low at-mospheric pressure and results in damage, erosion, flooding, fatalities, or injuries. Coastal areas are defined as those portions of coastal land zones adjacent to the waters and bays of the oceans. High surf is defined as large waves breaking on or near shore, resulting from swell spawned by a distant storm or from strong onshore winds, causing a fatality, injury or damage. In addition, if ac-companied by anomalous astronomical high tides, high surf may produce beach erosion and possi-ble damage to beachfront structures. High surf conditions are usually accompanied by rip currents and near-shore breaks.
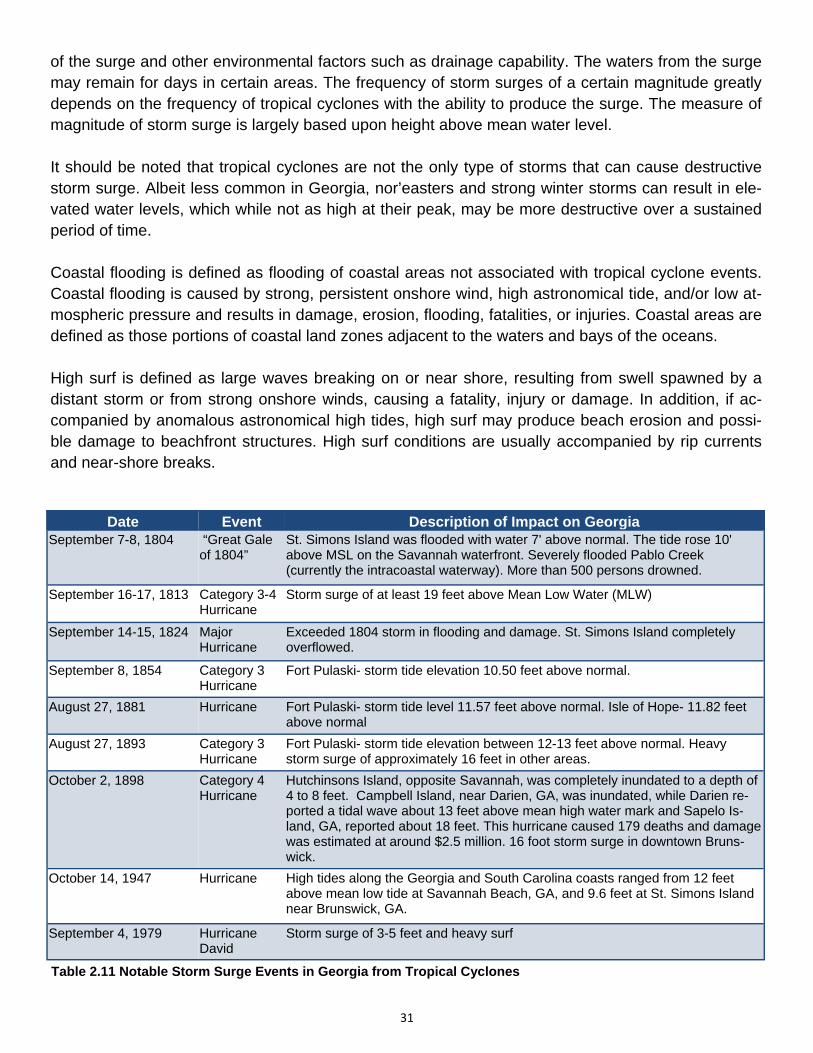
Date Event Description of Impact on Georgia September 7-8, 1804 “Great Gale
of 1804” St. Simons Island was flooded with water 7' above normal. The tide rose 10' above MSL on the Savannah waterfront. Severely flooded Pablo Creek (currently the intracoastal waterway). More than 500 persons drowned.
September 16-17, 1813 Category 3-4 Hurricane
Storm surge of at least 19 feet above Mean Low Water (MLW)
September 14-15, 1824 Major Hurricane
Exceeded 1804 storm in flooding and damage. St. Simons Island completely overflowed.
September 8, 1854 Category 3 Hurricane
Fort Pulaski- storm tide elevation 10.50 feet above normal.
August 27, 1881 Hurricane Fort Pulaski- storm tide level 11.57 feet above normal. Isle of Hope- 11.82 feet above normal
August 27, 1893 Category 3 Hurricane
Fort Pulaski- storm tide elevation between 12-13 feet above normal. Heavy storm surge of approximately 16 feet in other areas.
October 2, 1898 Category 4 Hurricane
Hutchinsons Island, opposite Savannah, was completely inundated to a depth of 4 to 8 feet. Campbell Island, near Darien, GA, was inundated, while Darien re-ported a tidal wave about 13 feet above mean high water mark and Sapelo Is-land, GA, reported about 18 feet. This hurricane caused 179 deaths and damage was estimated at around $2.5 million. 16 foot storm surge in downtown Bruns-wick.
October 14, 1947 Hurricane High tides along the Georgia and South Carolina coasts ranged from 12 feet above mean low tide at Savannah Beach, GA, and 9.6 feet at St. Simons Island near Brunswick, GA.
September 4, 1979 Hurricane David
Storm surge of 3-5 feet and heavy surf
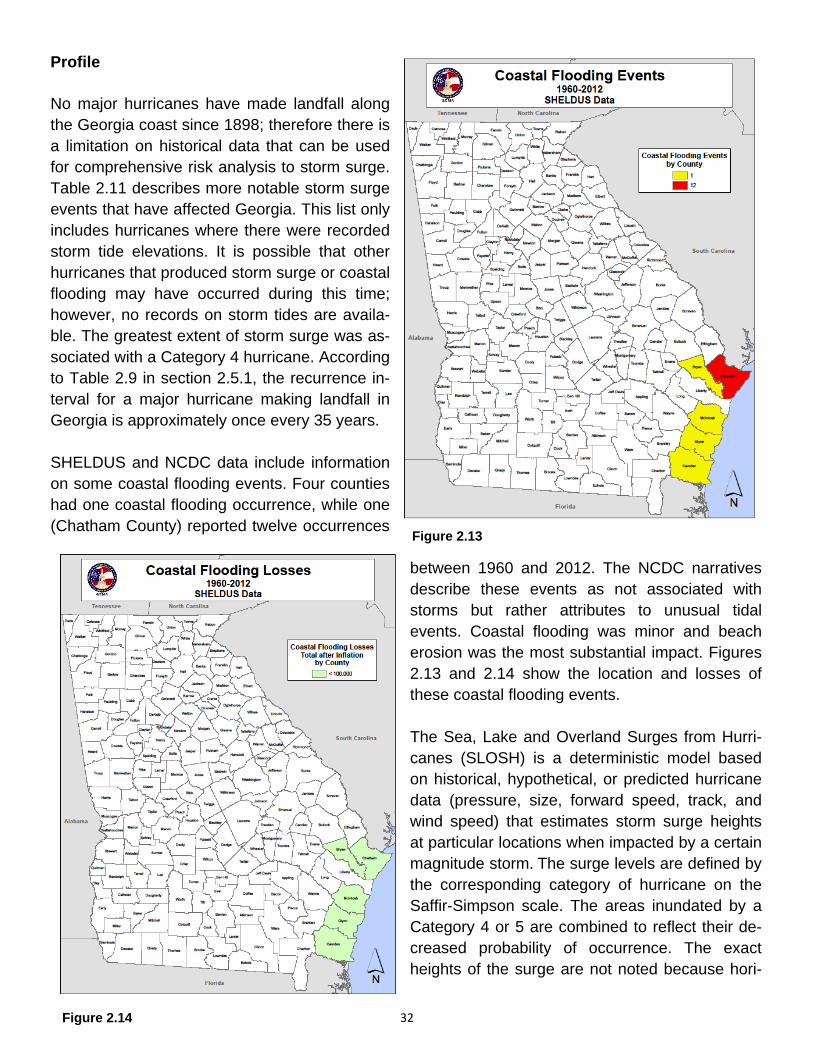
Table 2.11 Notable Storm Surge Events in Georgia from Tropical Cyclones
32
Profile No major hurricanes have made landfall along the Georgia coast since 1898; therefore there is a limitation on historical data that can be used for comprehensive risk analysis to storm surge. Table 2.11 describes more notable storm surge events that have affected Georgia. This list only includes hurricanes where there were recorded storm tide elevations. It is possible that other hurricanes that produced storm surge or coastal flooding may have occurred during this time; however, no records on storm tides are availa-ble. The greatest extent of storm surge was as-sociated with a Category 4 hurricane. According to Table 2.9 in section 2.5.1, the recurrence in-terval for a major hurricane making landfall in Georgia is approximately once every 35 years. SHELDUS and NCDC data include information on some coastal flooding events. Four counties had one coastal flooding occurrence, while one (Chatham County) reported twelve occurrences
between 1960 and 2012. The NCDC narratives describe these events as not associated with storms but rather attributes to unusual tidal events. Coastal flooding was minor and beach erosion was the most substantial impact. Figures 2.13 and 2.14 show the location and losses of these coastal flooding events. The Sea, Lake and Overland Surges from Hurri-canes (SLOSH) is a deterministic model based on historical, hypothetical, or predicted hurricane data (pressure, size, forward speed, track, and wind speed) that estimates storm surge heights at particular locations when impacted by a certain magnitude storm. The surge levels are defined by the corresponding category of hurricane on the Saffir-Simpson scale. The areas inundated by a Category 4 or 5 are combined to reflect their de-creased probability of occurrence. The exact heights of the surge are not noted because hori-
Figure 2.13
Figure 2.14
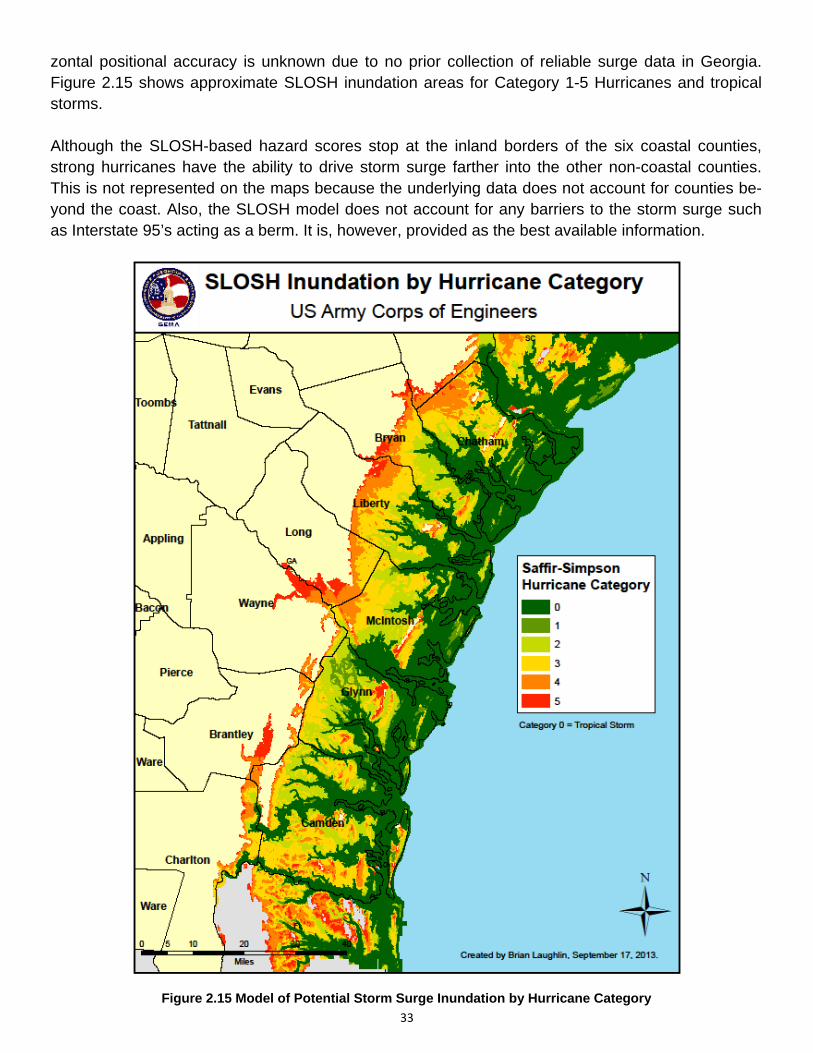
33
zontal positional accuracy is unknown due to no prior collection of reliable surge data in Georgia. Figure 2.15 shows approximate SLOSH inundation areas for Category 1-5 Hurricanes and tropical storms. Although the SLOSH-based hazard scores stop at the inland borders of the six coastal counties, strong hurricanes have the ability to drive storm surge farther into the other non-coastal counties. This is not represented on the maps because the underlying data does not account for counties be-yond the coast. Also, the SLOSH model does not account for any barriers to the storm surge such as Interstate 95’s acting as a berm. It is, however, provided as the best available information.
Figure 2.15 Model of Potential Storm Surge Inundation by Hurricane Category
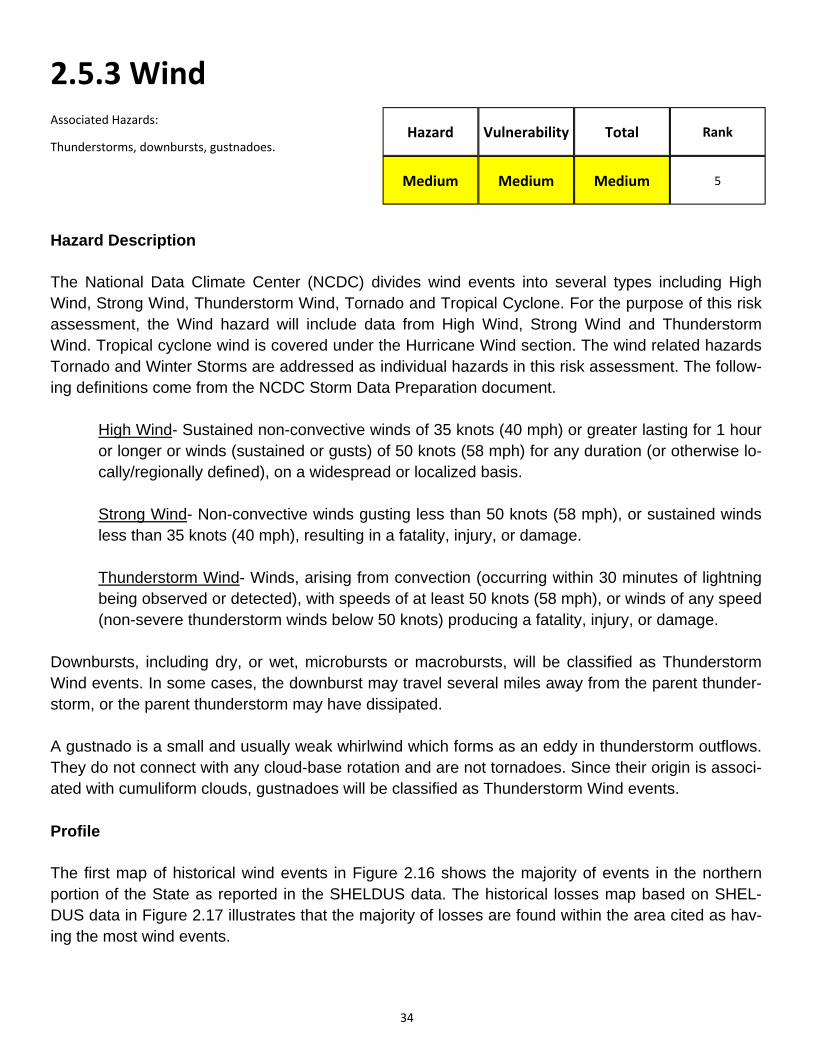
34
2.5.3 Wind Associated Hazards:
Thunderstorms, downbursts, gustnadoes. Hazard Vulnerability Total
Medium Medium Medium
Rank
5
Hazard Description The National Data Climate Center (NCDC) divides wind events into several types including High Wind, Strong Wind, Thunderstorm Wind, Tornado and Tropical Cyclone. For the purpose of this risk assessment, the Wind hazard will include data from High Wind, Strong Wind and Thunderstorm Wind. Tropical cyclone wind is covered under the Hurricane Wind section. The wind related hazards Tornado and Winter Storms are addressed as individual hazards in this risk assessment. The follow-ing definitions come from the NCDC Storm Data Preparation document.
High Wind- Sustained non-convective winds of 35 knots (40 mph) or greater lasting for 1 hour or longer or winds (sustained or gusts) of 50 knots (58 mph) for any duration (or otherwise lo-cally/regionally defined), on a widespread or localized basis.
Strong Wind- Non-convective winds gusting less than 50 knots (58 mph), or sustained winds less than 35 knots (40 mph), resulting in a fatality, injury, or damage.
Thunderstorm Wind- Winds, arising from convection (occurring within 30 minutes of lightning being observed or detected), with speeds of at least 50 knots (58 mph), or winds of any speed (non-severe thunderstorm winds below 50 knots) producing a fatality, injury, or damage.
Downbursts, including dry, or wet, microbursts or macrobursts, will be classified as Thunderstorm Wind events. In some cases, the downburst may travel several miles away from the parent thunder-storm, or the parent thunderstorm may have dissipated. A gustnado is a small and usually weak whirlwind which forms as an eddy in thunderstorm outflows. They do not connect with any cloud-base rotation and are not tornadoes. Since their origin is associ-ated with cumuliform clouds, gustnadoes will be classified as Thunderstorm Wind events. Profile The first map of historical wind events in Figure 2.16 shows the majority of events in the northern portion of the State as reported in the SHELDUS data. The historical losses map based on SHEL-DUS data in Figure 2.17 illustrates that the majority of losses are found within the area cited as hav-ing the most wind events.
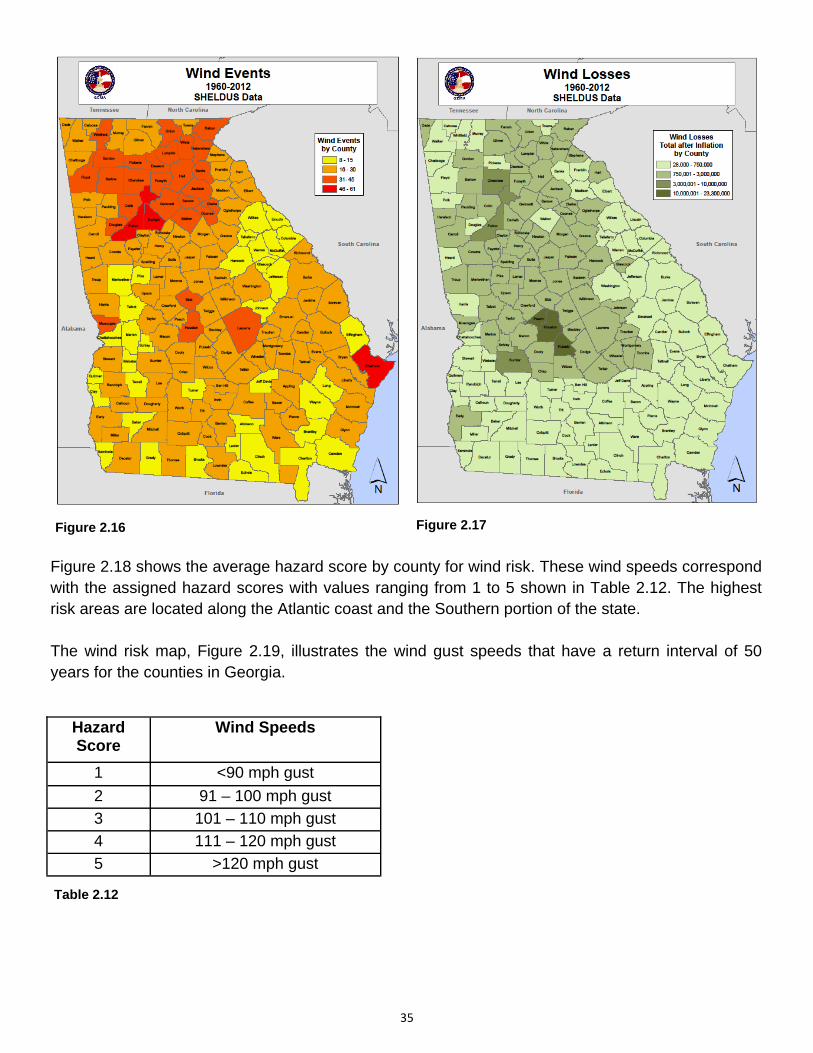
35
Figure 2.18 shows the average hazard score by county for wind risk. These wind speeds correspond with the assigned hazard scores with values ranging from 1 to 5 shown in Table 2.12. The highest risk areas are located along the Atlantic coast and the Southern portion of the state. The wind risk map, Figure 2.19, illustrates the wind gust speeds that have a return interval of 50 years for the counties in Georgia.
Figure 2.16
Hazard Score
Wind Speeds
1 <90 mph gust
2 91 – 100 mph gust
3 101 – 110 mph gust
4 111 – 120 mph gust
5 >120 mph gust
Figure 2.17
Table 2.12
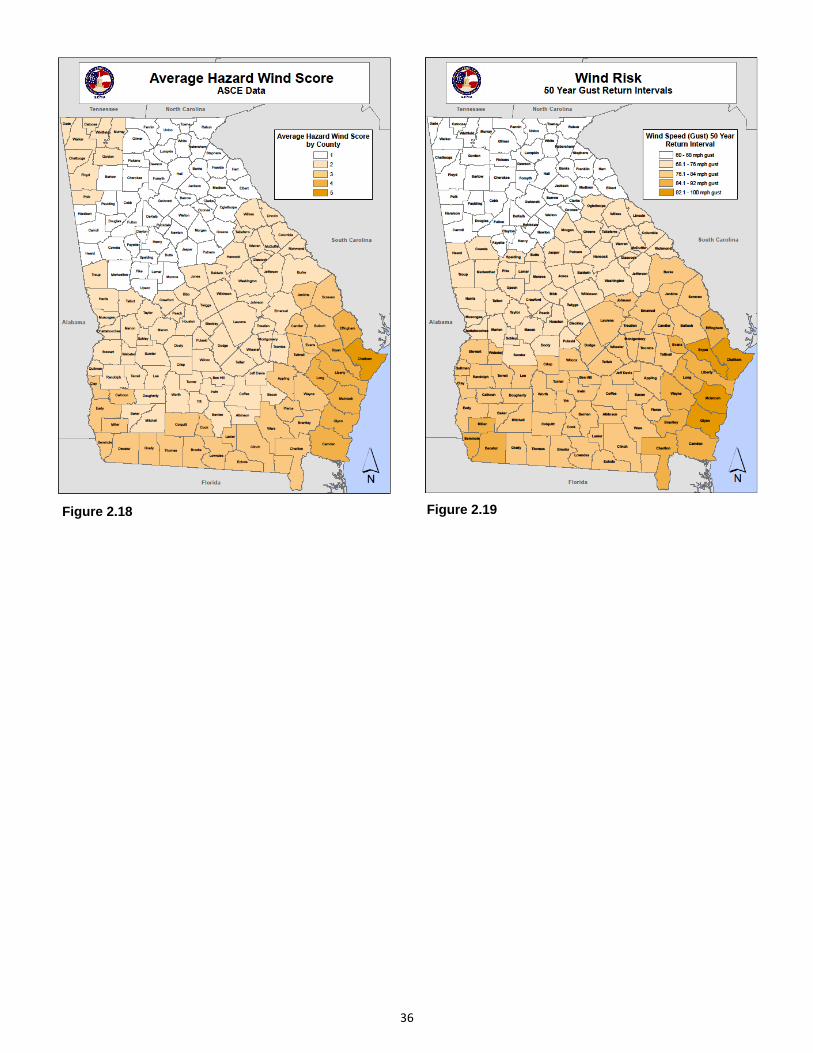
36
Figure 2.18 Figure 2.19
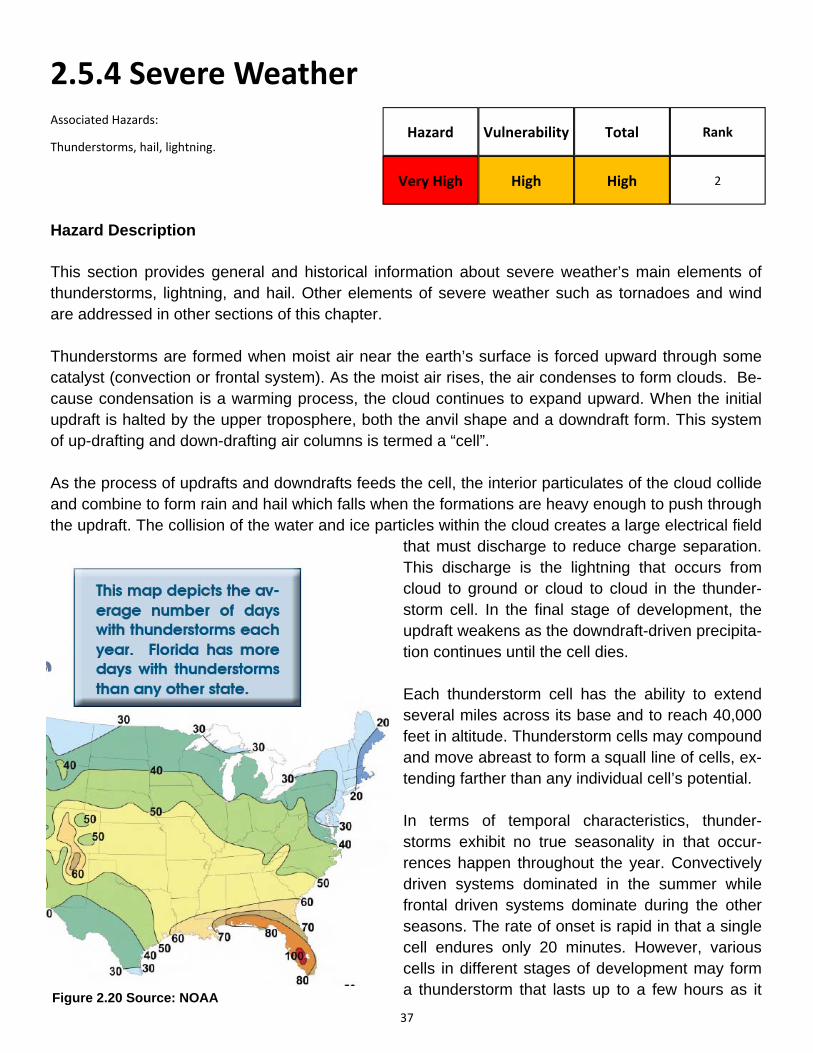
37
2.5.4 Severe Weather Associated Hazards:
Thunderstorms, hail, lightning. Hazard Vulnerability Total
Very High High High
Rank
2
Hazard Description This section provides general and historical information about severe weather’s main elements of thunderstorms, lightning, and hail. Other elements of severe weather such as tornadoes and wind are addressed in other sections of this chapter. Thunderstorms are formed when moist air near the earth’s surface is forced upward through some catalyst (convection or frontal system). As the moist air rises, the air condenses to form clouds. Be-cause condensation is a warming process, the cloud continues to expand upward. When the initial updraft is halted by the upper troposphere, both the anvil shape and a downdraft form. This system of up-drafting and down-drafting air columns is termed a “cell”. As the process of updrafts and downdrafts feeds the cell, the interior particulates of the cloud collide and combine to form rain and hail which falls when the formations are heavy enough to push through the updraft. The collision of the water and ice particles within the cloud creates a large electrical field
that must discharge to reduce charge separation. This discharge is the lightning that occurs from cloud to ground or cloud to cloud in the thunder-storm cell. In the final stage of development, the updraft weakens as the downdraft-driven precipita-tion continues until the cell dies. Each thunderstorm cell has the ability to extend several miles across its base and to reach 40,000 feet in altitude. Thunderstorm cells may compound and move abreast to form a squall line of cells, ex-tending farther than any individual cell’s potential. In terms of temporal characteristics, thunder-storms exhibit no true seasonality in that occur-rences happen throughout the year. Convectively driven systems dominated in the summer while frontal driven systems dominate during the other seasons. The rate of onset is rapid in that a single cell endures only 20 minutes. However, various cells in different stages of development may form a thunderstorm that lasts up to a few hours as it
Figure 2.20 Source: NOAA
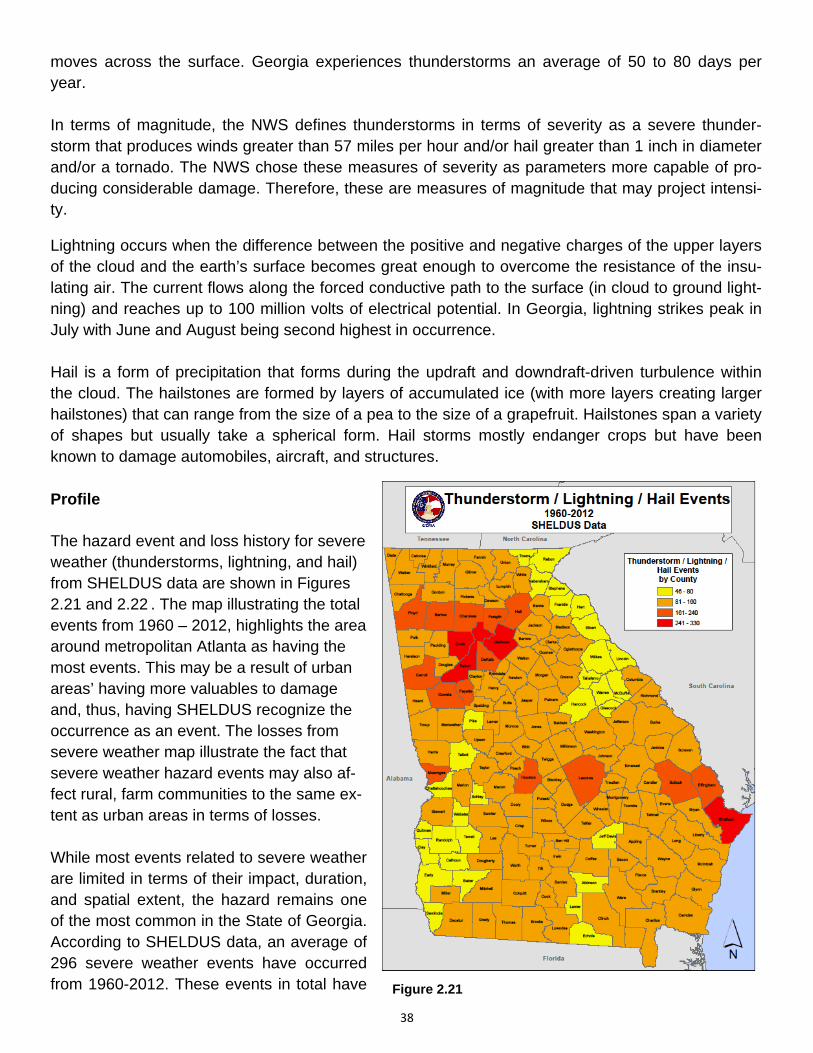
38
moves across the surface. Georgia experiences thunderstorms an average of 50 to 80 days per year. In terms of magnitude, the NWS defines thunderstorms in terms of severity as a severe thunder-storm that produces winds greater than 57 miles per hour and/or hail greater than 1 inch in diameter and/or a tornado. The NWS chose these measures of severity as parameters more capable of pro-ducing considerable damage. Therefore, these are measures of magnitude that may project intensi-ty.
Lightning occurs when the difference between the positive and negative charges of the upper layers of the cloud and the earth’s surface becomes great enough to overcome the resistance of the insu-lating air. The current flows along the forced conductive path to the surface (in cloud to ground light-ning) and reaches up to 100 million volts of electrical potential. In Georgia, lightning strikes peak in July with June and August being second highest in occurrence. Hail is a form of precipitation that forms during the updraft and downdraft-driven turbulence within the cloud. The hailstones are formed by layers of accumulated ice (with more layers creating larger hailstones) that can range from the size of a pea to the size of a grapefruit. Hailstones span a variety of shapes but usually take a spherical form. Hail storms mostly endanger crops but have been known to damage automobiles, aircraft, and structures. Profile The hazard event and loss history for severe weather (thunderstorms, lightning, and hail) from SHELDUS data are shown in Figures 2.21 and 2.22 . The map illustrating the total events from 1960 – 2012, highlights the area around metropolitan Atlanta as having the most events. This may be a result of urban areas’ having more valuables to damage and, thus, having SHELDUS recognize the occurrence as an event. The losses from severe weather map illustrate the fact that severe weather hazard events may also af-fect rural, farm communities to the same ex-tent as urban areas in terms of losses. While most events related to severe weather are limited in terms of their impact, duration, and spatial extent, the hazard remains one of the most common in the State of Georgia. According to SHELDUS data, an average of 296 severe weather events have occurred from 1960-2012. These events in total have Figure 2.21
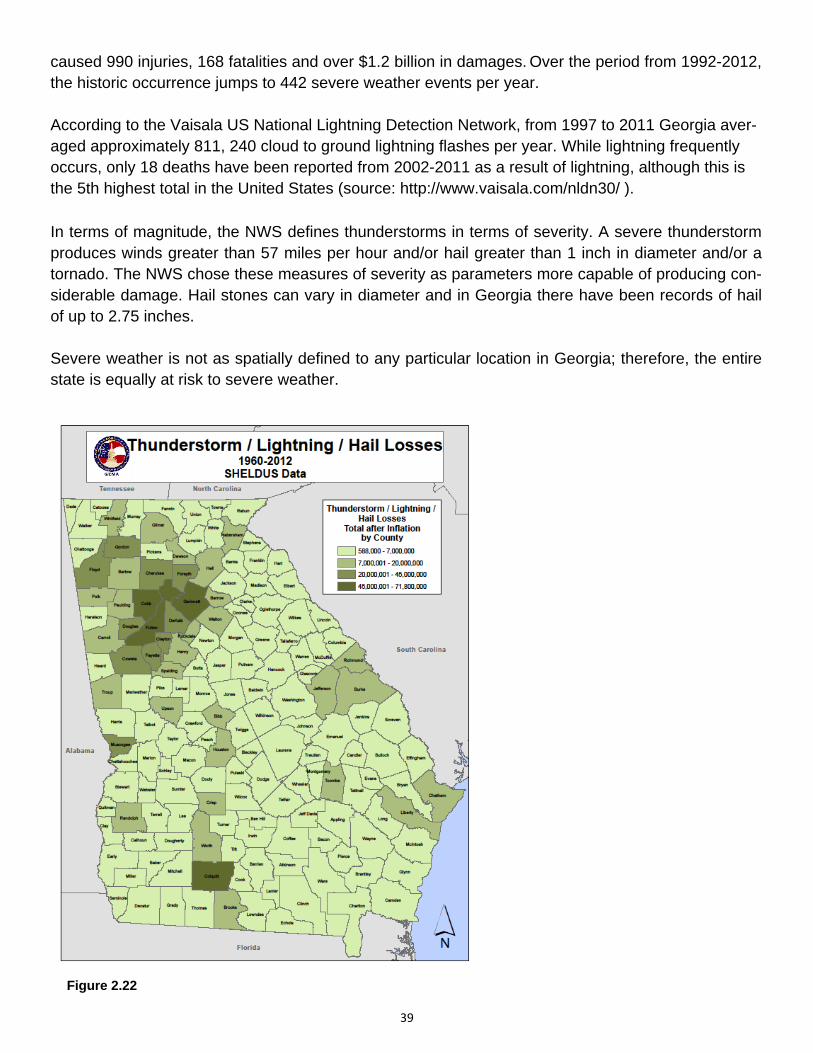
39
caused 990 injuries, 168 fatalities and over $1.2 billion in damages. Over the period from 1992-2012, the historic occurrence jumps to 442 severe weather events per year. According to the Vaisala US National Lightning Detection Network, from 1997 to 2011 Georgia aver-aged approximately 811, 240 cloud to ground lightning flashes per year. While lightning frequently occurs, only 18 deaths have been reported from 2002-2011 as a result of lightning, although this is the 5th highest total in the United States (source: http://www.vaisala.com/nldn30/ ).
In terms of magnitude, the NWS defines thunderstorms in terms of severity. A severe thunderstorm produces winds greater than 57 miles per hour and/or hail greater than 1 inch in diameter and/or a tornado. The NWS chose these measures of severity as parameters more capable of producing con-siderable damage. Hail stones can vary in diameter and in Georgia there have been records of hail of up to 2.75 inches. Severe weather is not as spatially defined to any particular location in Georgia; therefore, the entire state is equally at risk to severe weather.
Figure 2.22
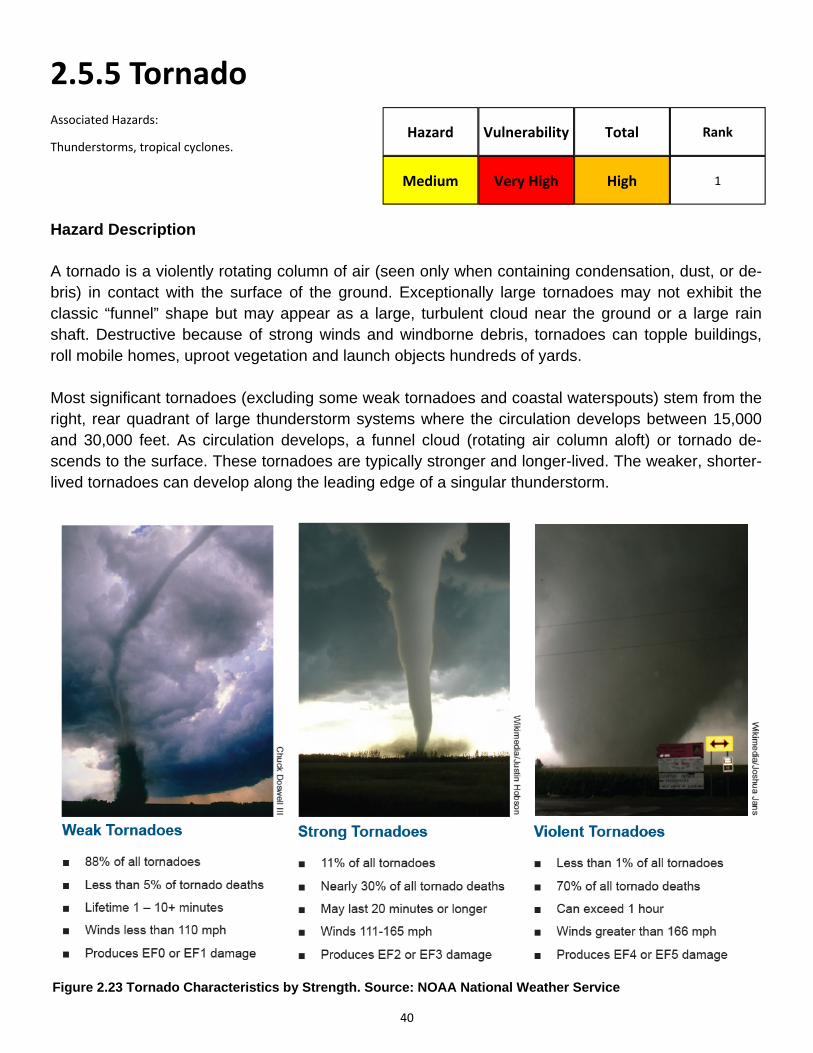
40
2.5.5 Tornado Associated Hazards:
Thunderstorms, tropical cyclones. Hazard Vulnerability Total
Medium Very High High
Rank
1
Hazard Description A tornado is a violently rotating column of air (seen only when containing condensation, dust, or de-bris) in contact with the surface of the ground. Exceptionally large tornadoes may not exhibit the classic “funnel” shape but may appear as a large, turbulent cloud near the ground or a large rain shaft. Destructive because of strong winds and windborne debris, tornadoes can topple buildings, roll mobile homes, uproot vegetation and launch objects hundreds of yards. Most significant tornadoes (excluding some weak tornadoes and coastal waterspouts) stem from the right, rear quadrant of large thunderstorm systems where the circulation develops between 15,000 and 30,000 feet. As circulation develops, a funnel cloud (rotating air column aloft) or tornado de-scends to the surface. These tornadoes are typically stronger and longer-lived. The weaker, shorter-lived tornadoes can develop along the leading edge of a singular thunderstorm.
Figure 2.23 Tornado Characteristics by Strength. Source: NOAA National Weather Service
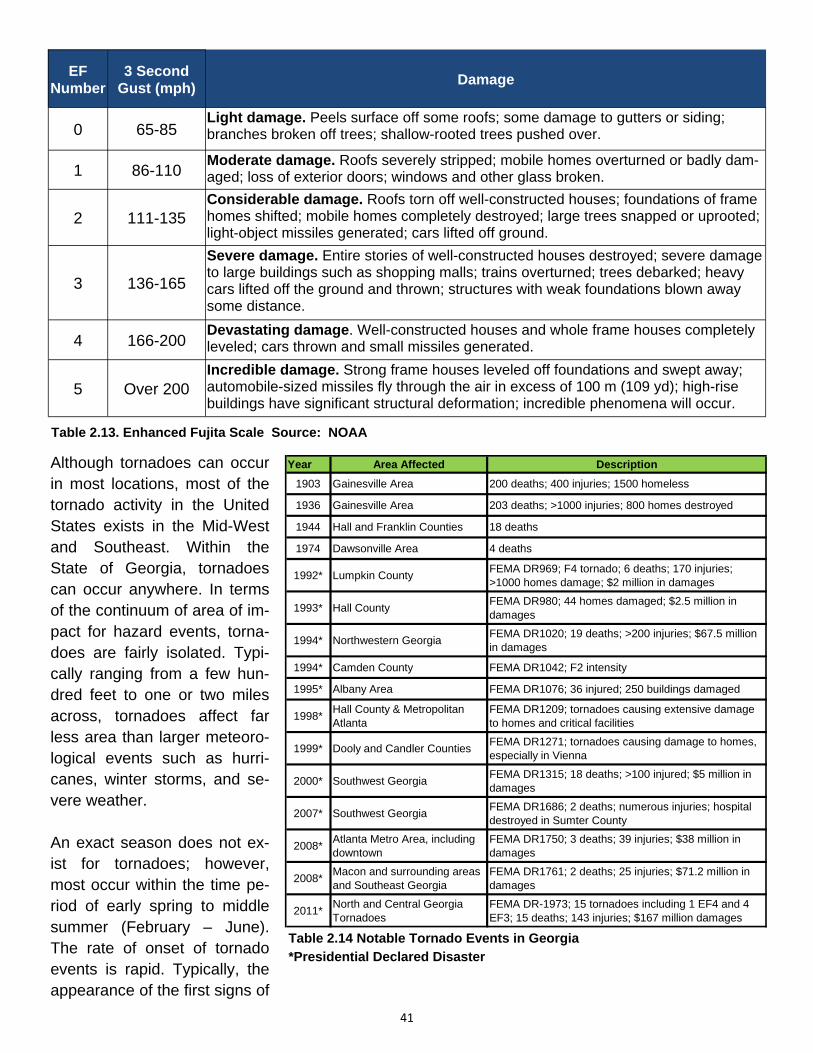
41
Although tornadoes can occur in most locations, most of the tornado activity in the United States exists in the Mid-West and Southeast. Within the State of Georgia, tornadoes can occur anywhere. In terms of the continuum of area of im-pact for hazard events, torna-does are fairly isolated. Typi-cally ranging from a few hun-dred feet to one or two miles across, tornadoes affect far less area than larger meteoro-logical events such as hurri-canes, winter storms, and se-vere weather. An exact season does not ex-ist for tornadoes; however, most occur within the time pe-riod of early spring to middle summer (February – June). The rate of onset of tornado events is rapid. Typically, the appearance of the first signs of
Table 2.14 Notable Tornado Events in Georgia *Presidential Declared Disaster
Table 2.13. Enhanced Fujita Scale Source: NOAA
EF Number
3 Second Gust (mph)
Damage
0 65-85 Light damage. Peels surface off some roofs; some damage to gutters or siding; branches broken off trees; shallow-rooted trees pushed over.
1 86-110 Moderate damage. Roofs severely stripped; mobile homes overturned or badly dam-aged; loss of exterior doors; windows and other glass broken.
2 111-135 Considerable damage. Roofs torn off well-constructed houses; foundations of frame homes shifted; mobile homes completely destroyed; large trees snapped or uprooted; light-object missiles generated; cars lifted off ground.
3 136-165
Severe damage. Entire stories of well-constructed houses destroyed; severe damage to large buildings such as shopping malls; trains overturned; trees debarked; heavy cars lifted off the ground and thrown; structures with weak foundations blown away some distance.
4 166-200 Devastating damage. Well-constructed houses and whole frame houses completely leveled; cars thrown and small missiles generated.
5 Over 200 Incredible damage. Strong frame houses leveled off foundations and swept away; automobile-sized missiles fly through the air in excess of 100 m (109 yd); high-rise buildings have significant structural deformation; incredible phenomena will occur.
Year Area Affected Description
1903 Gainesville Area 200 deaths; 400 injuries; 1500 homeless
1936 Gainesville Area 203 deaths; >1000 injuries; 800 homes destroyed
1944 Hall and Franklin Counties 18 deaths
1974 Dawsonville Area 4 deaths
1992* Lumpkin CountyFEMA DR969; F4 tornado; 6 deaths; 170 injuries; >1000 homes damage; $2 million in damages
1993* Hall CountyFEMA DR980; 44 homes damaged; $2.5 million in damages
1994* Northwestern GeorgiaFEMA DR1020; 19 deaths; >200 injuries; $67.5 million in damages
1994* Camden County FEMA DR1042; F2 intensity
1995* Albany Area FEMA DR1076; 36 injured; 250 buildings damaged
1998*Hall County & Metropolitan Atlanta
FEMA DR1209; tornadoes causing extensive damage to homes and critical facilities
1999* Dooly and Candler CountiesFEMA DR1271; tornadoes causing damage to homes, especially in Vienna
2000* Southwest GeorgiaFEMA DR1315; 18 deaths; >100 injured; $5 million in damages
2007* Southwest GeorgiaFEMA DR1686; 2 deaths; numerous injuries; hospital destroyed in Sumter County
2008*Atlanta Metro Area, including downtown
FEMA DR1750; 3 deaths; 39 injuries; $38 million in damages
2008*Macon and surrounding areas and Southeast Georgia
FEMA DR1761; 2 deaths; 25 injuries; $71.2 million in damages
2011*North and Central Georgia Tornadoes
FEMA DR-1973; 15 tornadoes including 1 EF4 and 4 EF3; 15 deaths; 143 injuries; $167 million damages
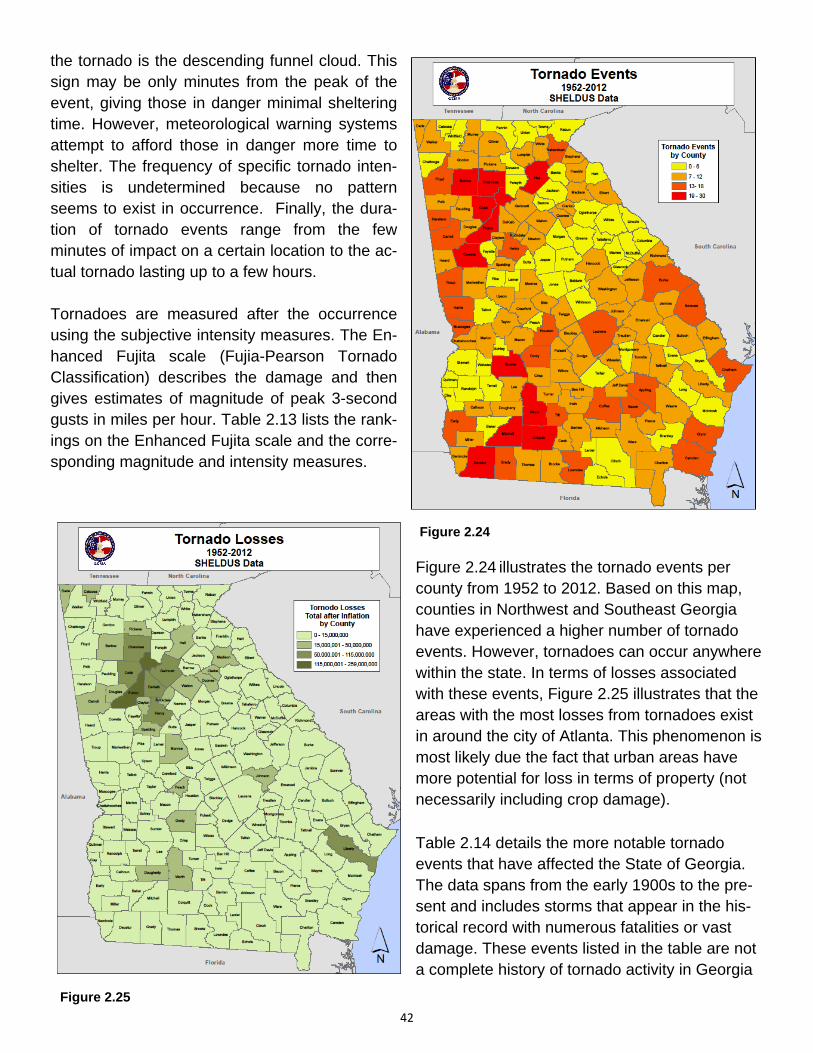
42
the tornado is the descending funnel cloud. This sign may be only minutes from the peak of the event, giving those in danger minimal sheltering time. However, meteorological warning systems attempt to afford those in danger more time to shelter. The frequency of specific tornado inten-sities is undetermined because no pattern seems to exist in occurrence. Finally, the dura-tion of tornado events range from the few minutes of impact on a certain location to the ac-tual tornado lasting up to a few hours. Tornadoes are measured after the occurrence using the subjective intensity measures. The En-hanced Fujita scale (Fujia-Pearson Tornado Classification) describes the damage and then gives estimates of magnitude of peak 3-second gusts in miles per hour. Table 2.13 lists the rank-ings on the Enhanced Fujita scale and the corre-sponding magnitude and intensity measures.
Figure 2.24 illustrates the tornado events per county from 1952 to 2012. Based on this map, counties in Northwest and Southeast Georgia have experienced a higher number of tornado events. However, tornadoes can occur anywhere within the state. In terms of losses associated with these events, Figure 2.25 illustrates that the areas with the most losses from tornadoes exist in around the city of Atlanta. This phenomenon is most likely due the fact that urban areas have more potential for loss in terms of property (not necessarily including crop damage).
Table 2.14 details the more notable tornado events that have affected the State of Georgia. The data spans from the early 1900s to the pre-sent and includes storms that appear in the his-torical record with numerous fatalities or vast damage. These events listed in the table are not a complete history of tornado activity in Georgia
Figure 2.24
Figure 2.25
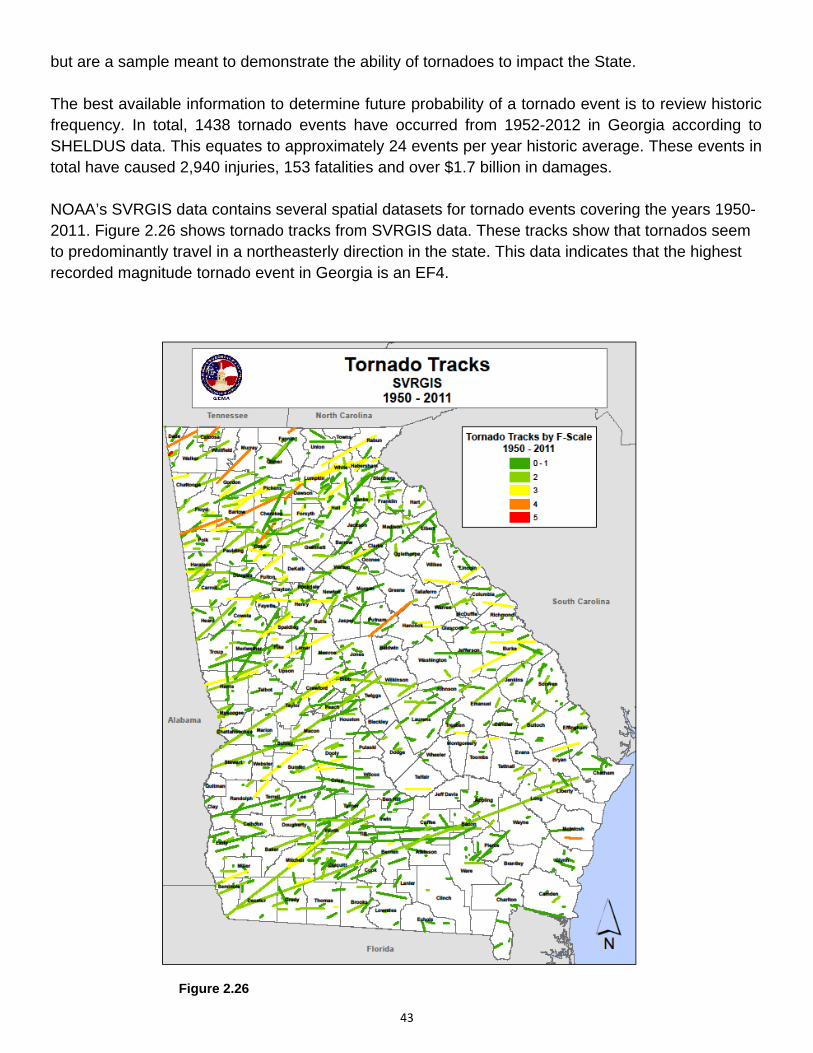
43
but are a sample meant to demonstrate the ability of tornadoes to impact the State. The best available information to determine future probability of a tornado event is to review historic frequency. In total, 1438 tornado events have occurred from 1952-2012 in Georgia according to SHELDUS data. This equates to approximately 24 events per year historic average. These events in total have caused 2,940 injuries, 153 fatalities and over $1.7 billion in damages. NOAA’s SVRGIS data contains several spatial datasets for tornado events covering the years 1950-2011. Figure 2.26 shows tornado tracks from SVRGIS data. These tracks show that tornados seem to predominantly travel in a northeasterly direction in the state. This data indicates that the highest recorded magnitude tornado event in Georgia is an EF4.
Figure 2.26
44
2.5.6 Inland Flooding Associated Hazards:
Thunderstorms, tropical cyclones, dam failure Hazard Vulnerability Total
Medium High High
Rank
3
Hazard Description Flooding is a temporary overflow of water on normally dry lands adjacent to the source of water (river, stream, or lake). The causes of flooding include mass sources of precipitation such as tropical cyclonic systems, frontal systems, and isolated thunderstorms combined with other environmental variables such as changes to physical environment, topography, ground saturation, soil types, basin size, drainage patterns, and vegetative cover. Adverse impacts may include structural damages, temporary backwater effects in sewers and drainage systems, death of livestock, agricultural crop loss, loss of egress and access to critical facilities due to roads being washed-out or over-topped and unsanitary conditions by deposition of materials during recession. Floods are loosely classified as either coastal or riverine. Coastal flooding is addressed in the Coastal Hazards section of this chapter. Riverine flooding occurs from inland water bodies such as streams and rivers. Riverine flooding is often classified based on rate of onset. The first is slow to build, peak, and recede often allowing sufficient time for evacuations. The other type of riverine flood is referred to as a “flash” flood which rapidly peak and recedes and gives insufficient time for evacu-ations. The more dangerous flash floods are common to the mountainous, impermeable surfaces of northern Georgia. Urban flash flooding can also present dangerous conditions, especially with roads washing out. On a broad scale, flooding can occur around any body of water or low-lying surface given enough precipitation or snow melt. The spatial extent of the flooding event depends on the amount of water overflow but can usually be mapped because of existing floodplains (areas already prone to flood-ing). In the State of Georgia, flooding is highly dependent of precipitation amounts and is highly variable within the State. Georgia’s climate is primarily affected by latitude, proximity to the Atlantic Ocean and Gulf of Mexico, and topography. Certain seasons are more prone to flooding due to their prone-ness to excessive precipitation. Typically, the wet seasons are during the winter, early spring and midsummer while the drier seasons are in the fall and late spring. However, this varies across the State with the northern portion receiving maximum precipitation amounts during the winter as a re-sult of frontal systems while central and coastal Georgia receive maximums in the mid to late sum-mer as a result of tropical cyclones and convective thunderstorm activity. Profile The rate of onset and duration of flooding events depends on the type of flooding (typical flood or
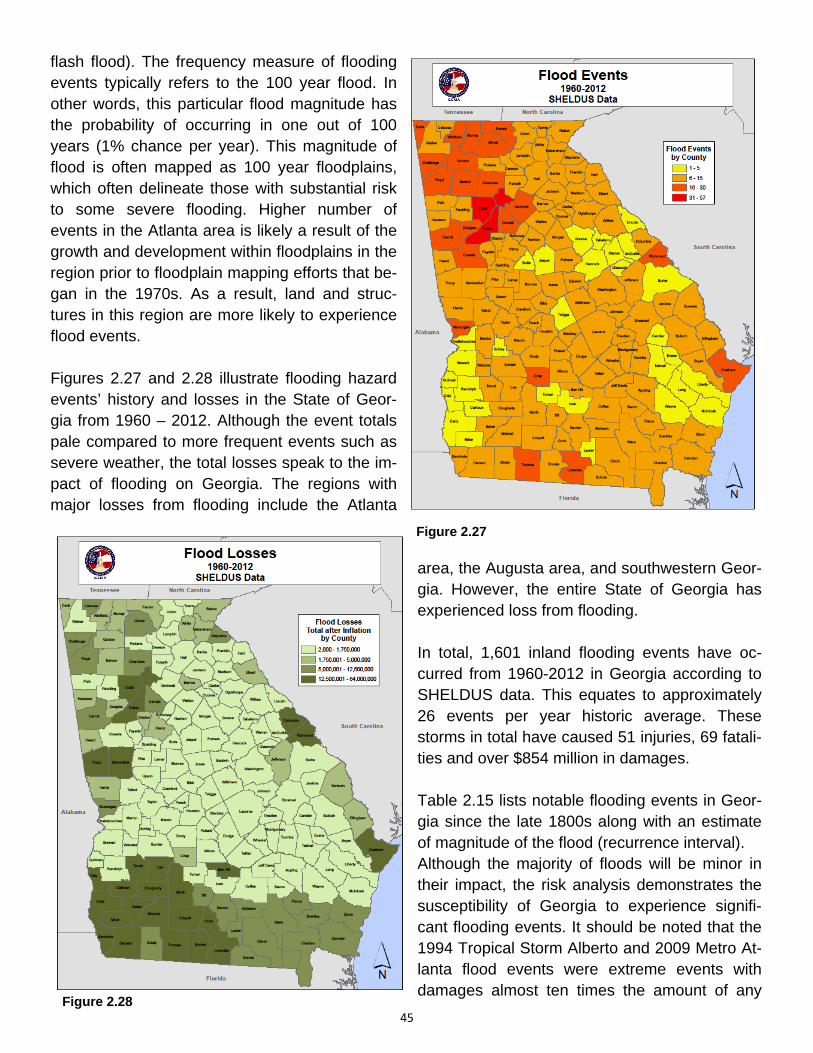
45
flash flood). The frequency measure of flooding events typically refers to the 100 year flood. In other words, this particular flood magnitude has the probability of occurring in one out of 100 years (1% chance per year). This magnitude of flood is often mapped as 100 year floodplains, which often delineate those with substantial risk to some severe flooding. Higher number of events in the Atlanta area is likely a result of the growth and development within floodplains in the region prior to floodplain mapping efforts that be-gan in the 1970s. As a result, land and struc-tures in this region are more likely to experience flood events. Figures 2.27 and 2.28 illustrate flooding hazard events’ history and losses in the State of Geor-gia from 1960 – 2012. Although the event totals pale compared to more frequent events such as severe weather, the total losses speak to the im-pact of flooding on Georgia. The regions with major losses from flooding include the Atlanta
area, the Augusta area, and southwestern Geor-gia. However, the entire State of Georgia has experienced loss from flooding. In total, 1,601 inland flooding events have oc-curred from 1960-2012 in Georgia according to SHELDUS data. This equates to approximately 26 events per year historic average. These storms in total have caused 51 injuries, 69 fatali-ties and over $854 million in damages. Table 2.15 lists notable flooding events in Geor-gia since the late 1800s along with an estimate of magnitude of the flood (recurrence interval). Although the majority of floods will be minor in their impact, the risk analysis demonstrates the susceptibility of Georgia to experience signifi-cant flooding events. It should be noted that the 1994 Tropical Storm Alberto and 2009 Metro At-lanta flood events were extreme events with damages almost ten times the amount of any
Figure 2.27
Figure 2.28
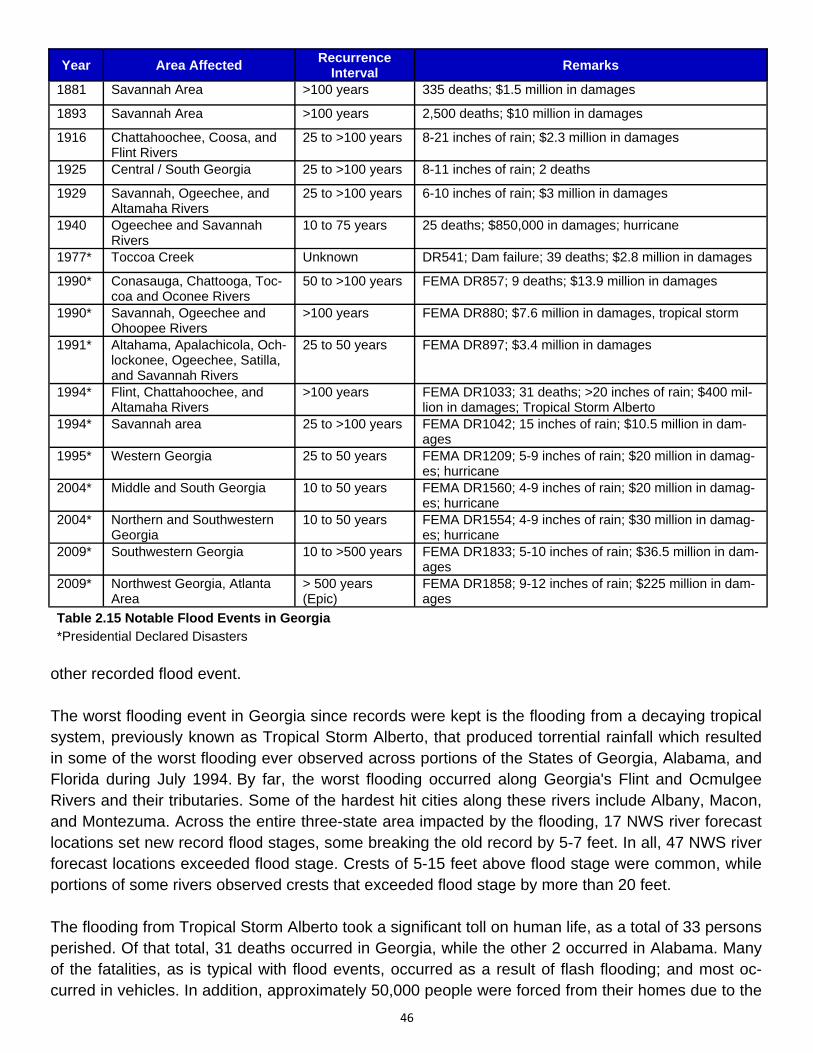
46
other recorded flood event. The worst flooding event in Georgia since records were kept is the flooding from a decaying tropical system, previously known as Tropical Storm Alberto, that produced torrential rainfall which resulted in some of the worst flooding ever observed across portions of the States of Georgia, Alabama, and Florida during July 1994. By far, the worst flooding occurred along Georgia's Flint and Ocmulgee Rivers and their tributaries. Some of the hardest hit cities along these rivers include Albany, Macon, and Montezuma. Across the entire three-state area impacted by the flooding, 17 NWS river forecast locations set new record flood stages, some breaking the old record by 5-7 feet. In all, 47 NWS river forecast locations exceeded flood stage. Crests of 5-15 feet above flood stage were common, while portions of some rivers observed crests that exceeded flood stage by more than 20 feet. The flooding from Tropical Storm Alberto took a significant toll on human life, as a total of 33 persons perished. Of that total, 31 deaths occurred in Georgia, while the other 2 occurred in Alabama. Many of the fatalities, as is typical with flood events, occurred as a result of flash flooding; and most oc-curred in vehicles. In addition, approximately 50,000 people were forced from their homes due to the
Year Area Affected Recurrence
Interval Remarks
1881 Savannah Area >100 years 335 deaths; $1.5 million in damages
1893 Savannah Area >100 years 2,500 deaths; $10 million in damages
1916 Chattahoochee, Coosa, and Flint Rivers
25 to >100 years 8-21 inches of rain; $2.3 million in damages
1925 Central / South Georgia 25 to >100 years 8-11 inches of rain; 2 deaths
1929 Savannah, Ogeechee, and Altamaha Rivers
25 to >100 years 6-10 inches of rain; $3 million in damages
1940 Ogeechee and Savannah Rivers
10 to 75 years 25 deaths; $850,000 in damages; hurricane
1977* Toccoa Creek Unknown DR541; Dam failure; 39 deaths; $2.8 million in damages
1990* Conasauga, Chattooga, Toc-coa and Oconee Rivers
50 to >100 years FEMA DR857; 9 deaths; $13.9 million in damages
1990* Savannah, Ogeechee and Ohoopee Rivers
>100 years FEMA DR880; $7.6 million in damages, tropical storm
1991* Altahama, Apalachicola, Och-lockonee, Ogeechee, Satilla, and Savannah Rivers
25 to 50 years FEMA DR897; $3.4 million in damages
1994* Flint, Chattahoochee, and Altamaha Rivers
>100 years FEMA DR1033; 31 deaths; >20 inches of rain; $400 mil-lion in damages; Tropical Storm Alberto
1994* Savannah area 25 to >100 years FEMA DR1042; 15 inches of rain; $10.5 million in dam-ages
1995* Western Georgia 25 to 50 years FEMA DR1209; 5-9 inches of rain; $20 million in damag-es; hurricane
2004* Middle and South Georgia 10 to 50 years FEMA DR1560; 4-9 inches of rain; $20 million in damag-es; hurricane
2004* Northern and Southwestern Georgia
10 to 50 years FEMA DR1554; 4-9 inches of rain; $30 million in damag-es; hurricane
2009* Southwestern Georgia 10 to >500 years FEMA DR1833; 5-10 inches of rain; $36.5 million in dam-ages
2009* Northwest Georgia, Atlanta Area
> 500 years (Epic)
FEMA DR1858; 9-12 inches of rain; $225 million in dam-ages
Table 2.15 Notable Flood Events in Georgia *Presidential Declared Disasters
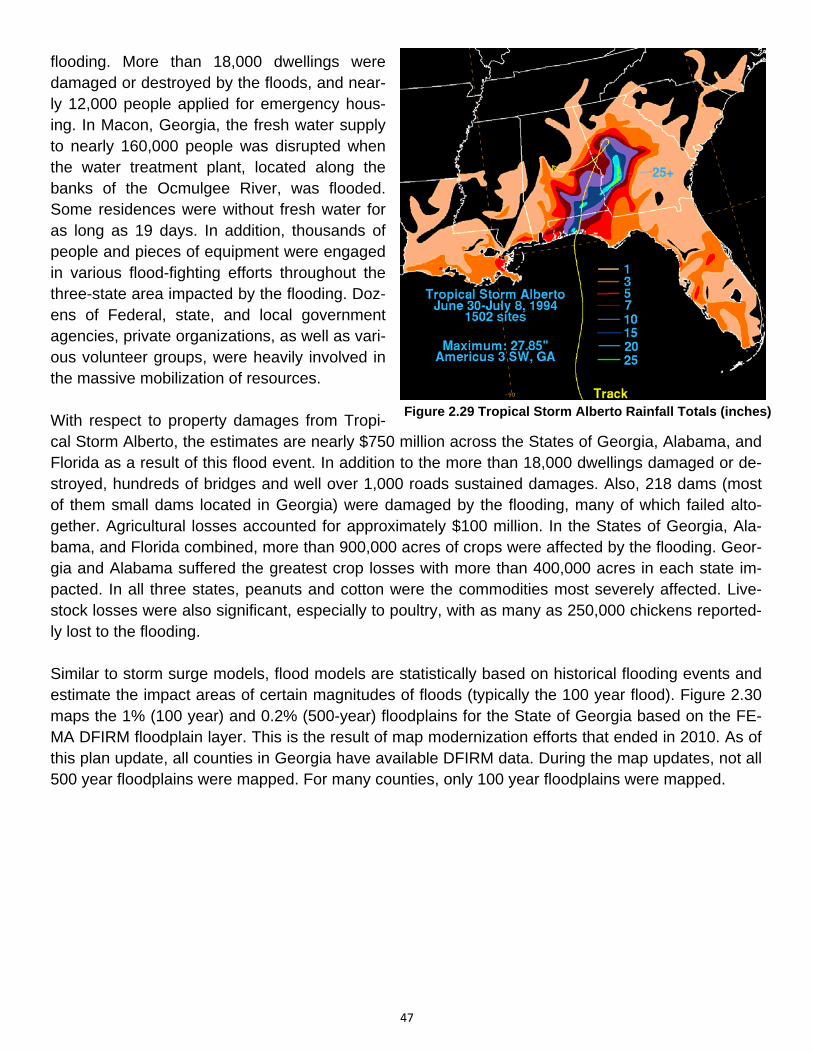
47
flooding. More than 18,000 dwellings were damaged or destroyed by the floods, and near-ly 12,000 people applied for emergency hous-ing. In Macon, Georgia, the fresh water supply to nearly 160,000 people was disrupted when the water treatment plant, located along the banks of the Ocmulgee River, was flooded. Some residences were without fresh water for as long as 19 days. In addition, thousands of people and pieces of equipment were engaged in various flood-fighting efforts throughout the three-state area impacted by the flooding. Doz-ens of Federal, state, and local government agencies, private organizations, as well as vari-ous volunteer groups, were heavily involved in the massive mobilization of resources. With respect to property damages from Tropi-cal Storm Alberto, the estimates are nearly $750 million across the States of Georgia, Alabama, and Florida as a result of this flood event. In addition to the more than 18,000 dwellings damaged or de-stroyed, hundreds of bridges and well over 1,000 roads sustained damages. Also, 218 dams (most of them small dams located in Georgia) were damaged by the flooding, many of which failed alto-gether. Agricultural losses accounted for approximately $100 million. In the States of Georgia, Ala-bama, and Florida combined, more than 900,000 acres of crops were affected by the flooding. Geor-gia and Alabama suffered the greatest crop losses with more than 400,000 acres in each state im-pacted. In all three states, peanuts and cotton were the commodities most severely affected. Live-stock losses were also significant, especially to poultry, with as many as 250,000 chickens reported-ly lost to the flooding. Similar to storm surge models, flood models are statistically based on historical flooding events and estimate the impact areas of certain magnitudes of floods (typically the 100 year flood). Figure 2.30 maps the 1% (100 year) and 0.2% (500-year) floodplains for the State of Georgia based on the FE-MA DFIRM floodplain layer. This is the result of map modernization efforts that ended in 2010. As of this plan update, all counties in Georgia have available DFIRM data. During the map updates, not all 500 year floodplains were mapped. For many counties, only 100 year floodplains were mapped.
Figure 2.29 Tropical Storm Alberto Rainfall Totals (inches)
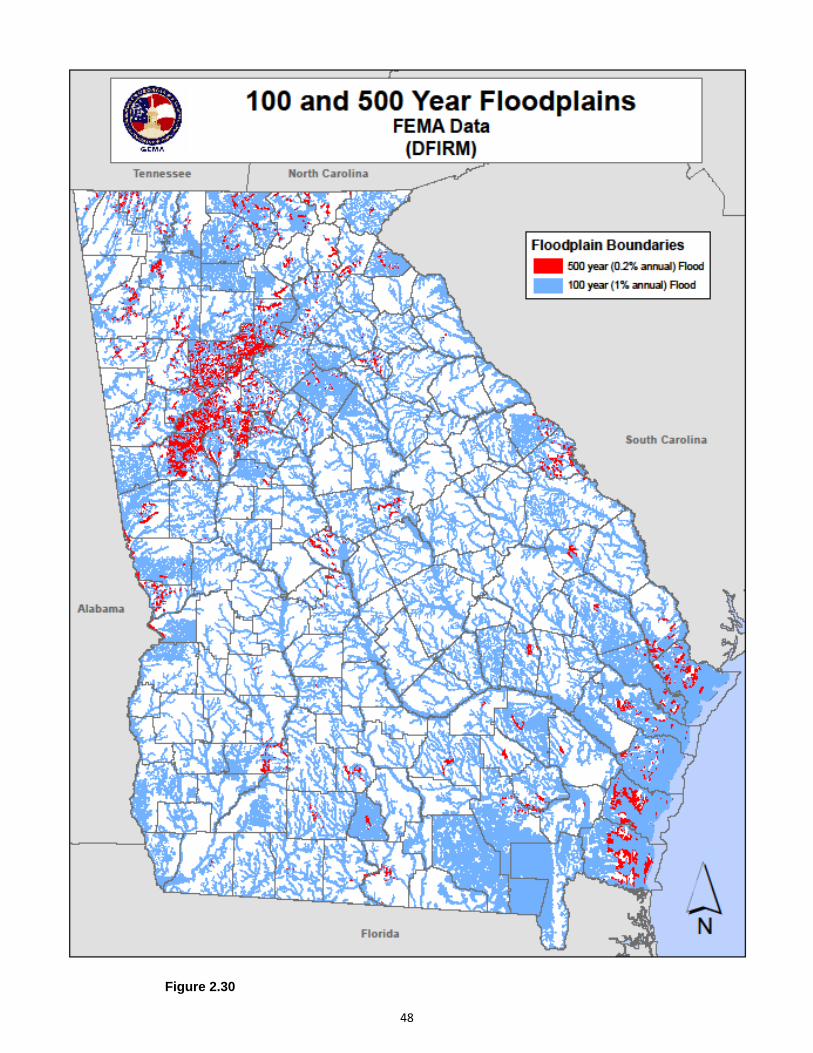
48
Figure 2.30
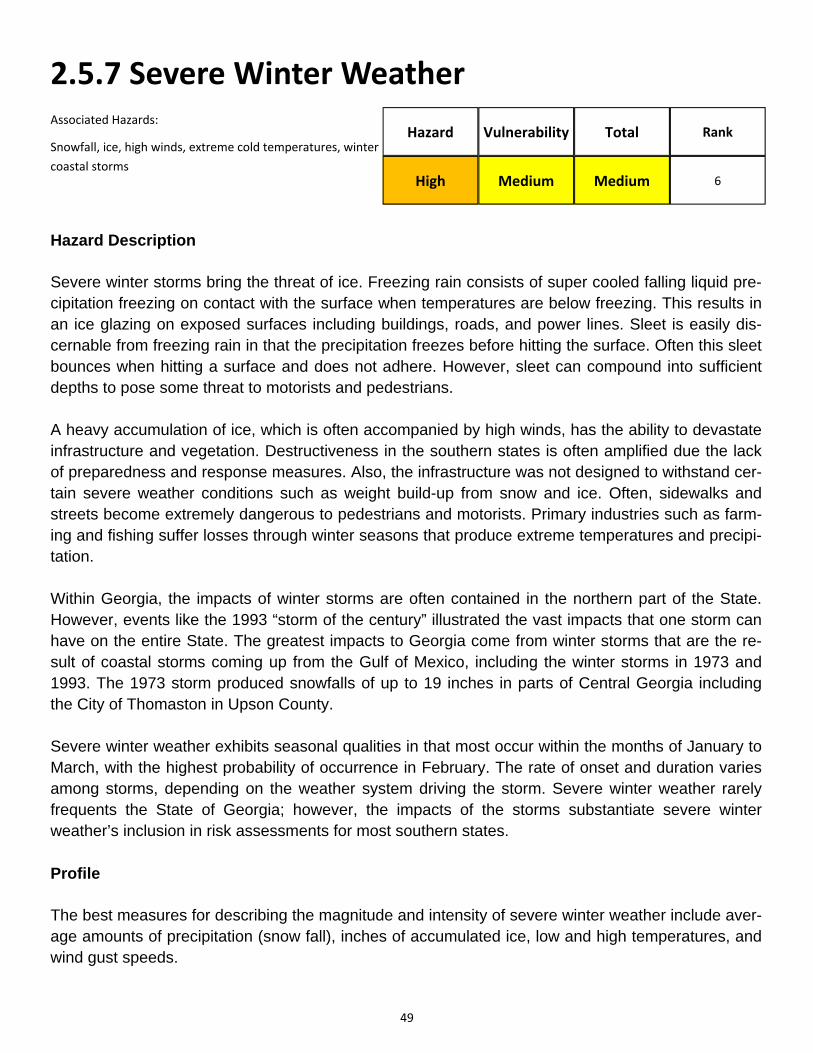
49
2.5.7 Severe Winter Weather Associated Hazards:
Snowfall, ice, high winds, extreme cold temperatures, winter
coastal storms
Hazard Vulnerability Total
High Medium Medium
Rank
6
Hazard Description Severe winter storms bring the threat of ice. Freezing rain consists of super cooled falling liquid pre-cipitation freezing on contact with the surface when temperatures are below freezing. This results in an ice glazing on exposed surfaces including buildings, roads, and power lines. Sleet is easily dis-cernable from freezing rain in that the precipitation freezes before hitting the surface. Often this sleet bounces when hitting a surface and does not adhere. However, sleet can compound into sufficient depths to pose some threat to motorists and pedestrians. A heavy accumulation of ice, which is often accompanied by high winds, has the ability to devastate infrastructure and vegetation. Destructiveness in the southern states is often amplified due the lack of preparedness and response measures. Also, the infrastructure was not designed to withstand cer-tain severe weather conditions such as weight build-up from snow and ice. Often, sidewalks and streets become extremely dangerous to pedestrians and motorists. Primary industries such as farm-ing and fishing suffer losses through winter seasons that produce extreme temperatures and precipi-tation. Within Georgia, the impacts of winter storms are often contained in the northern part of the State. However, events like the 1993 “storm of the century” illustrated the vast impacts that one storm can have on the entire State. The greatest impacts to Georgia come from winter storms that are the re-sult of coastal storms coming up from the Gulf of Mexico, including the winter storms in 1973 and 1993. The 1973 storm produced snowfalls of up to 19 inches in parts of Central Georgia including the City of Thomaston in Upson County. Severe winter weather exhibits seasonal qualities in that most occur within the months of January to March, with the highest probability of occurrence in February. The rate of onset and duration varies among storms, depending on the weather system driving the storm. Severe winter weather rarely frequents the State of Georgia; however, the impacts of the storms substantiate severe winter weather’s inclusion in risk assessments for most southern states. Profile The best measures for describing the magnitude and intensity of severe winter weather include aver-age amounts of precipitation (snow fall), inches of accumulated ice, low and high temperatures, and wind gust speeds.
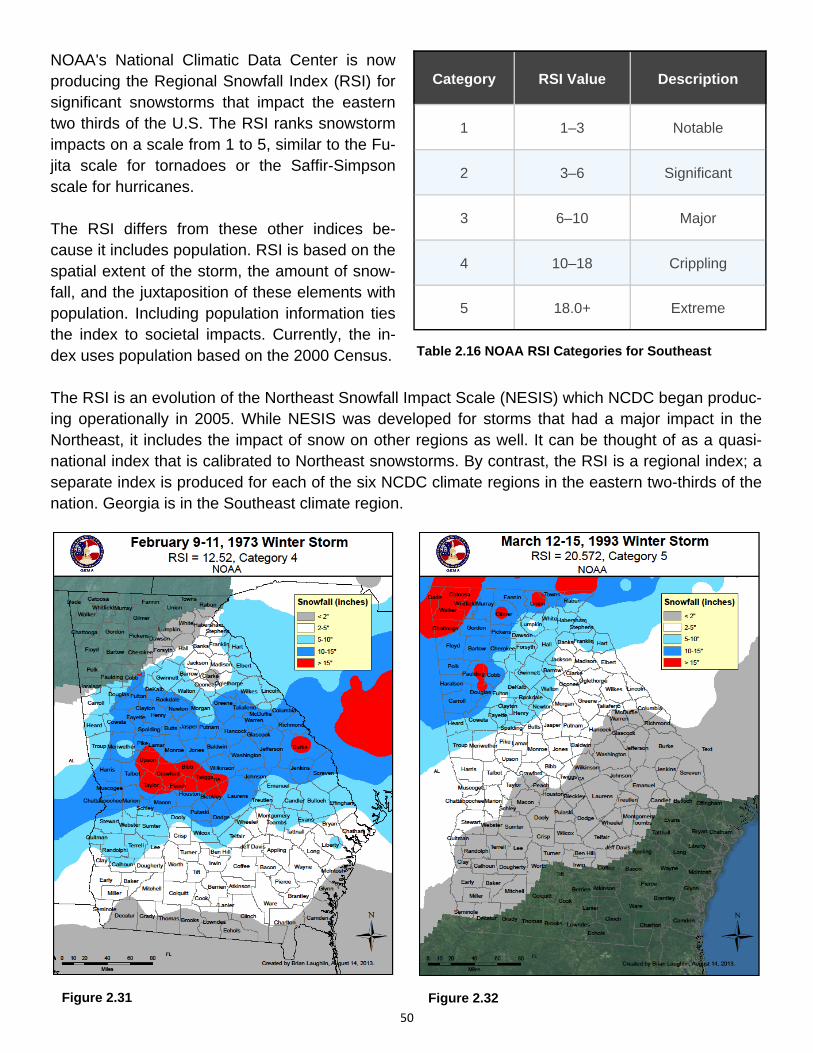
50
NOAA's National Climatic Data Center is now producing the Regional Snowfall Index (RSI) for significant snowstorms that impact the eastern two thirds of the U.S. The RSI ranks snowstorm impacts on a scale from 1 to 5, similar to the Fu-jita scale for tornadoes or the Saffir-Simpson scale for hurricanes. The RSI differs from these other indices be-cause it includes population. RSI is based on the spatial extent of the storm, the amount of snow-fall, and the juxtaposition of these elements with population. Including population information ties the index to societal impacts. Currently, the in-dex uses population based on the 2000 Census. The RSI is an evolution of the Northeast Snowfall Impact Scale (NESIS) which NCDC began produc-ing operationally in 2005. While NESIS was developed for storms that had a major impact in the Northeast, it includes the impact of snow on other regions as well. It can be thought of as a quasi-national index that is calibrated to Northeast snowstorms. By contrast, the RSI is a regional index; a separate index is produced for each of the six NCDC climate regions in the eastern two-thirds of the nation. Georgia is in the Southeast climate region.
Category RSI Value Description
1 1–3 Notable
2 3–6 Significant
3 6–10 Major
4 10–18 Crippling
5 18.0+ Extreme
Table 2.16 NOAA RSI Categories for Southeast
Figure 2.31
Figure 2.32
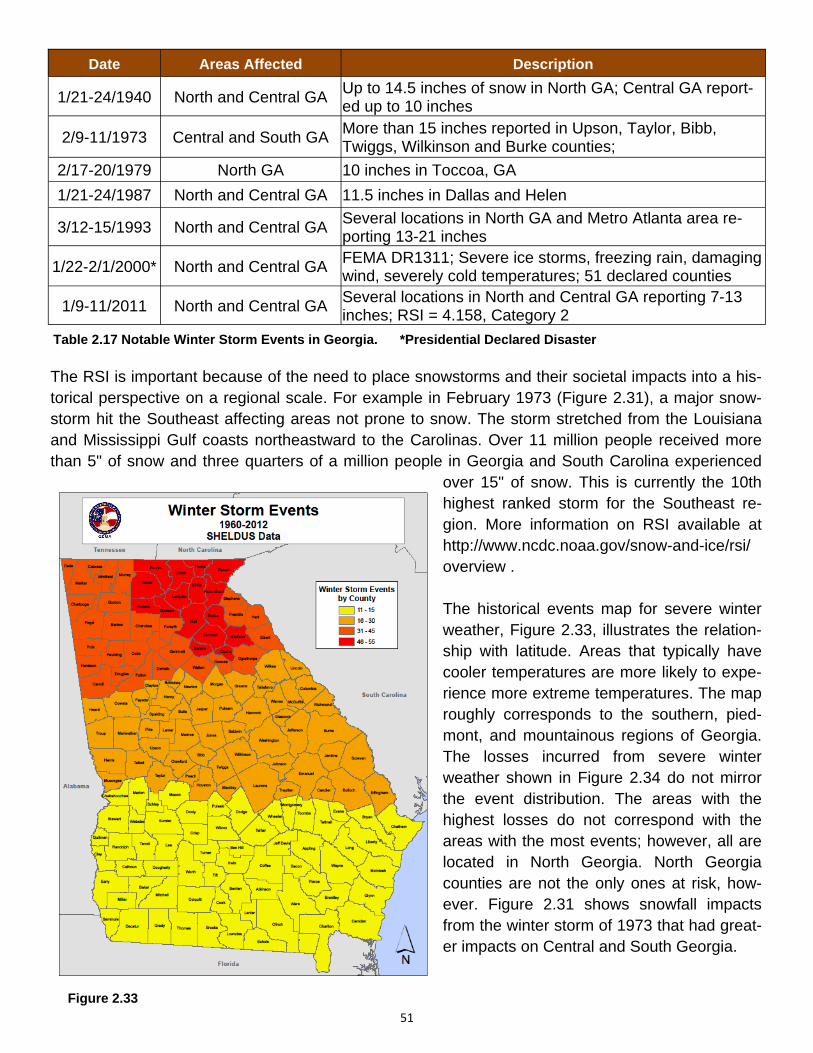
51
The RSI is important because of the need to place snowstorms and their societal impacts into a his-torical perspective on a regional scale. For example in February 1973 (Figure 2.31), a major snow-storm hit the Southeast affecting areas not prone to snow. The storm stretched from the Louisiana and Mississippi Gulf coasts northeastward to the Carolinas. Over 11 million people received more than 5" of snow and three quarters of a million people in Georgia and South Carolina experienced
over 15" of snow. This is currently the 10th highest ranked storm for the Southeast re-gion. More information on RSI available at http://www.ncdc.noaa.gov/snow-and-ice/rsi/overview . The historical events map for severe winter weather, Figure 2.33, illustrates the relation-ship with latitude. Areas that typically have cooler temperatures are more likely to expe-rience more extreme temperatures. The map roughly corresponds to the southern, pied-mont, and mountainous regions of Georgia. The losses incurred from severe winter weather shown in Figure 2.34 do not mirror the event distribution. The areas with the highest losses do not correspond with the areas with the most events; however, all are located in North Georgia. North Georgia counties are not the only ones at risk, how-ever. Figure 2.31 shows snowfall impacts from the winter storm of 1973 that had great-er impacts on Central and South Georgia.
Figure 2.33
Date Areas Affected Description
1/21-24/1940 North and Central GA Up to 14.5 inches of snow in North GA; Central GA report-ed up to 10 inches
2/9-11/1973 Central and South GA More than 15 inches reported in Upson, Taylor, Bibb, Twiggs, Wilkinson and Burke counties;
2/17-20/1979 North GA 10 inches in Toccoa, GA
1/21-24/1987 North and Central GA 11.5 inches in Dallas and Helen
3/12-15/1993 North and Central GA Several locations in North GA and Metro Atlanta area re-porting 13-21 inches
1/9-11/2011 North and Central GA Several locations in North and Central GA reporting 7-13 inches; RSI = 4.158, Category 2
1/22-2/1/2000* North and Central GA FEMA DR1311; Severe ice storms, freezing rain, damaging wind, severely cold temperatures; 51 declared counties
Table 2.17 Notable Winter Storm Events in Georgia. *Presidential Declared Disaster
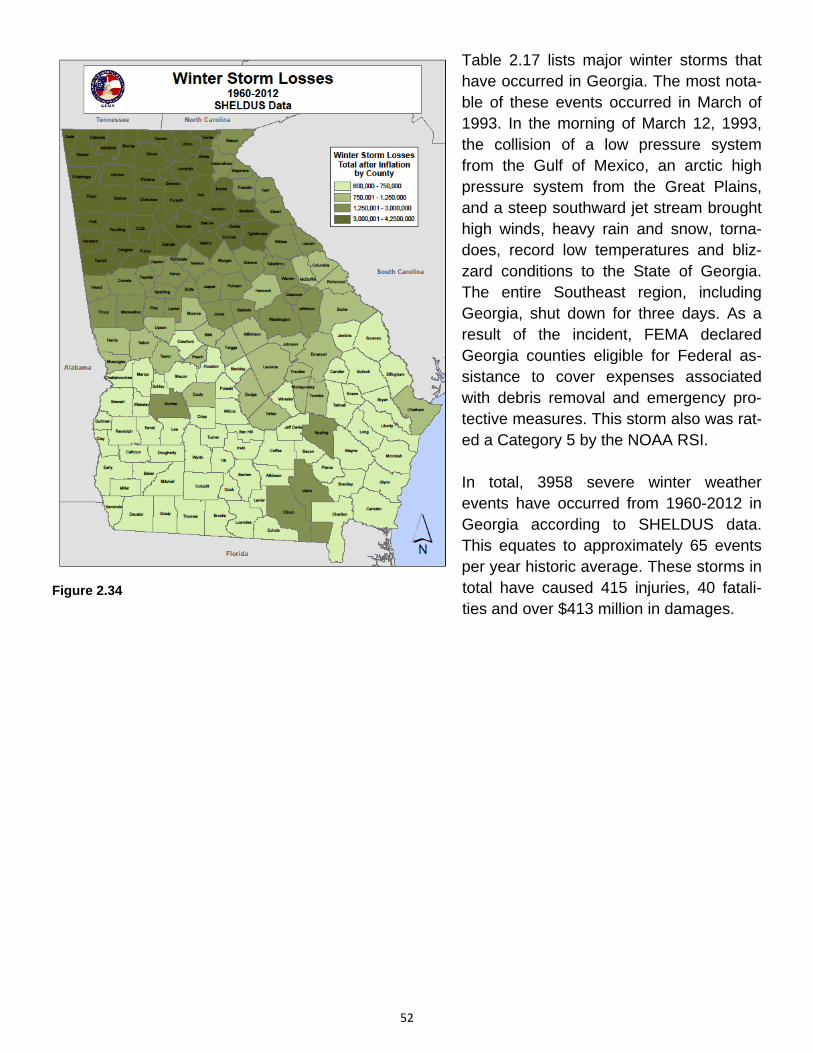
52
Table 2.17 lists major winter storms that have occurred in Georgia. The most nota-ble of these events occurred in March of 1993. In the morning of March 12, 1993, the collision of a low pressure system from the Gulf of Mexico, an arctic high pressure system from the Great Plains, and a steep southward jet stream brought high winds, heavy rain and snow, torna-does, record low temperatures and bliz-zard conditions to the State of Georgia. The entire Southeast region, including Georgia, shut down for three days. As a result of the incident, FEMA declared Georgia counties eligible for Federal as-sistance to cover expenses associated with debris removal and emergency pro-tective measures. This storm also was rat-ed a Category 5 by the NOAA RSI. In total, 3958 severe winter weather events have occurred from 1960-2012 in Georgia according to SHELDUS data. This equates to approximately 65 events per year historic average. These storms in total have caused 415 injuries, 40 fatali-ties and over $413 million in damages.
Figure 2.34
53
2.5.8 Drought
Hazard Vulnerability Total
High Medium Medium
Rank
4
Hazard Description Drought is a normal, recurrent feature of climate consisting of a deficiency of precipitation over an extended period of time (usually a season or more). This deficiency results in a water shortage for some social or environmental sector. Drought should be judged relative to some long-term average condition of balance between precipitation and evapotranspiration in a particular area that is consid-ered “normal”. Drought should not be viewed as only a natural hazard because the demand people place on water supply affects perceptions of drought conditions. The impacts of drought are vast, including limited water supplies in urban areas to insufficient water for farmland. Droughts occur in virtually every climatic zone (on every continent). Because the impacts of drought conditions are largely dependent on the human activity in the area, the spatial extent of droughts can span a few counties to an entire country. Temporal characteristics of droughts are drastically different from other hazards due to the possibility of extremely lengthy durations as well as a sluggish rate of onset. Drought conditions may endure for years to decades, which implicate droughts as having high potential to cause devastation on a given area. The duration characteristic of droughts is so important that droughts are classified in terms of length of impact. Droughts lasting 1 to 3 months are considered short term, while droughts lasting 4 to 6 months are considered intermediate and droughts lasting longer than 6 months are long term. With the slow rate of onset, most populations have some inkling that drought conditions are increas-ingly present. However, barring drastic response measures, most only have to adapt to the changing environment. Seasonality has no general impact on droughts in terms of calendar seasons. However, “wet” and “dry” seasons obviously determine the severity of drought conditions. In other words, areas are less susceptible to drought conditions if the area is experiencing a wet season. The frequency of droughts is undetermined due to the fact that the hazard spans such a long period of time. However, climatologists track periods of high and low moisture content similarly to the tracking of cooling and warming periods. Measures of drought magnitude and intensity can be found in some of the drought indices. Dr. Mi-chael Hays with the National Drought Mitigation Center (NDMC) lists the drought indices currently being used as the percent of normal, Standardized Precipitation Index, Palmer Drought Severity In-dex, Crop Moisture Index, Surface Water Supply Index, and Reclamation Drought Index. Basically, all of these indices are comparable and not absolute measures of magnitude or intensity. In other
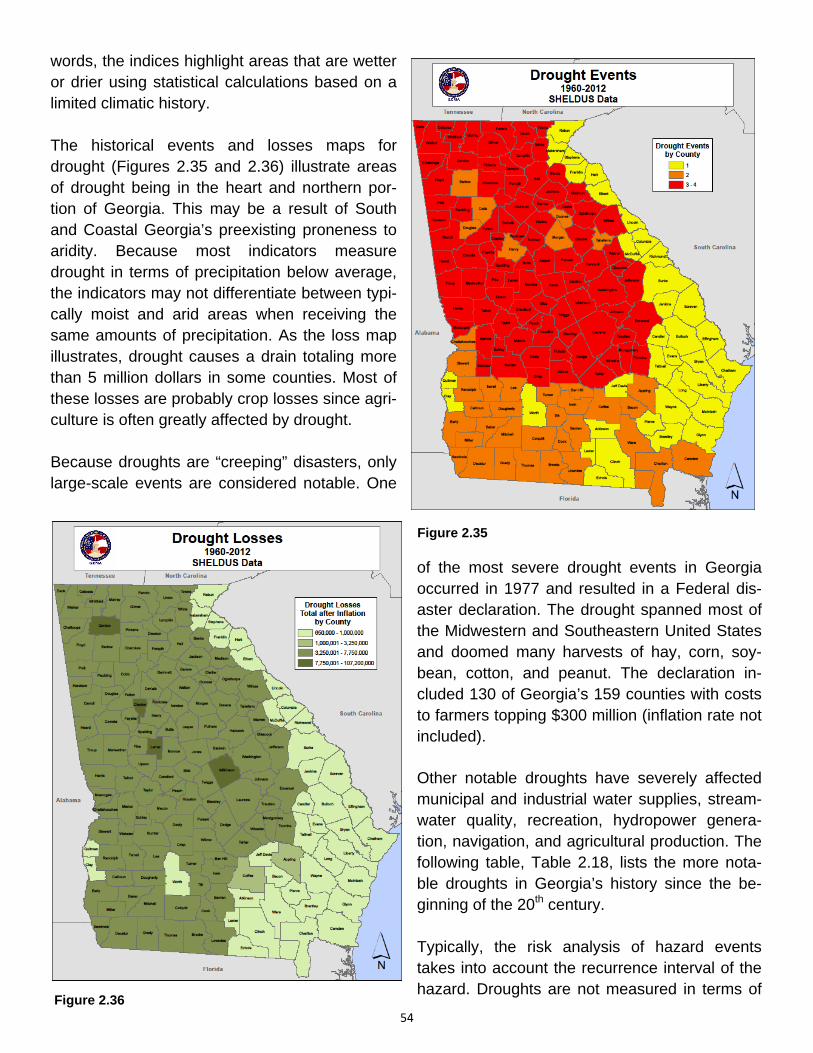
54
words, the indices highlight areas that are wetter or drier using statistical calculations based on a limited climatic history. The historical events and losses maps for drought (Figures 2.35 and 2.36) illustrate areas of drought being in the heart and northern por-tion of Georgia. This may be a result of South and Coastal Georgia’s preexisting proneness to aridity. Because most indicators measure drought in terms of precipitation below average, the indicators may not differentiate between typi-cally moist and arid areas when receiving the same amounts of precipitation. As the loss map illustrates, drought causes a drain totaling more than 5 million dollars in some counties. Most of these losses are probably crop losses since agri-culture is often greatly affected by drought. Because droughts are “creeping” disasters, only large-scale events are considered notable. One
of the most severe drought events in Georgia occurred in 1977 and resulted in a Federal dis-aster declaration. The drought spanned most of the Midwestern and Southeastern United States and doomed many harvests of hay, corn, soy-bean, cotton, and peanut. The declaration in-cluded 130 of Georgia’s 159 counties with costs to farmers topping $300 million (inflation rate not included).
Other notable droughts have severely affected municipal and industrial water supplies, stream-water quality, recreation, hydropower genera-tion, navigation, and agricultural production. The following table, Table 2.18, lists the more nota-ble droughts in Georgia’s history since the be-ginning of the 20th century. Typically, the risk analysis of hazard events takes into account the recurrence interval of the hazard. Droughts are not measured in terms of
Figure 2.36
Figure 2.35
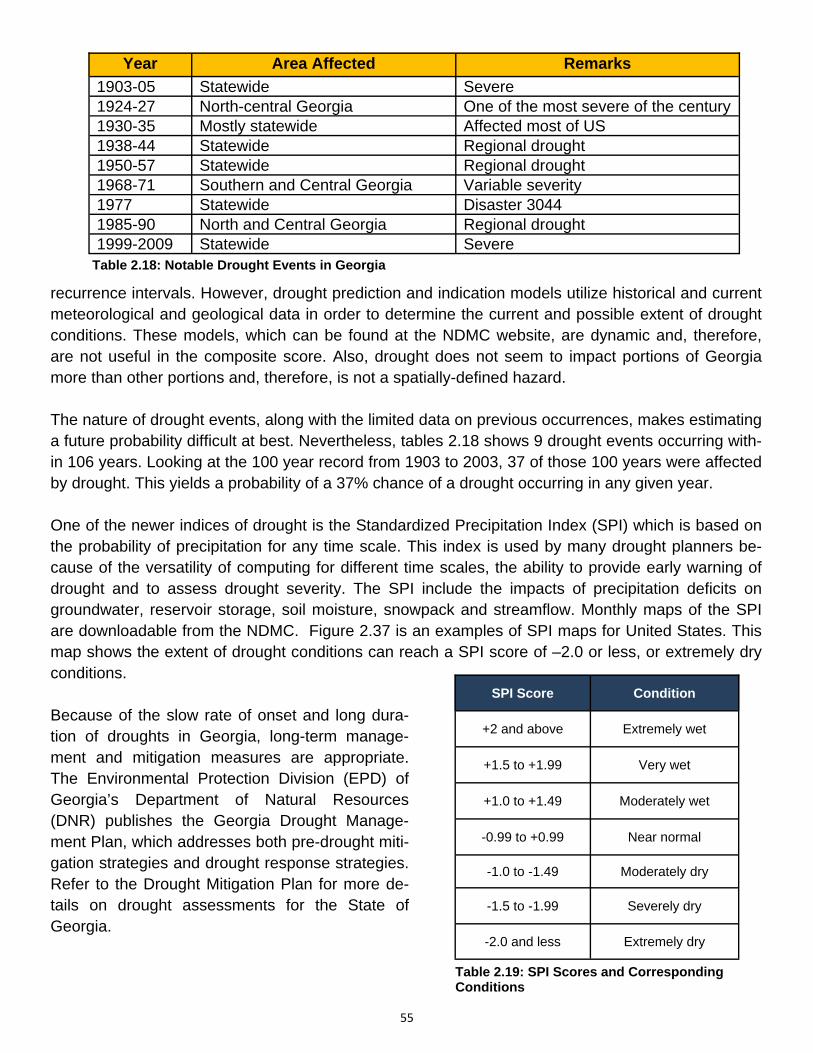
55
recurrence intervals. However, drought prediction and indication models utilize historical and current meteorological and geological data in order to determine the current and possible extent of drought conditions. These models, which can be found at the NDMC website, are dynamic and, therefore, are not useful in the composite score. Also, drought does not seem to impact portions of Georgia more than other portions and, therefore, is not a spatially-defined hazard. The nature of drought events, along with the limited data on previous occurrences, makes estimating a future probability difficult at best. Nevertheless, tables 2.18 shows 9 drought events occurring with-in 106 years. Looking at the 100 year record from 1903 to 2003, 37 of those 100 years were affected by drought. This yields a probability of a 37% chance of a drought occurring in any given year. One of the newer indices of drought is the Standardized Precipitation Index (SPI) which is based on the probability of precipitation for any time scale. This index is used by many drought planners be-cause of the versatility of computing for different time scales, the ability to provide early warning of drought and to assess drought severity. The SPI include the impacts of precipitation deficits on groundwater, reservoir storage, soil moisture, snowpack and streamflow. Monthly maps of the SPI are downloadable from the NDMC. Figure 2.37 is an examples of SPI maps for United States. This map shows the extent of drought conditions can reach a SPI score of –2.0 or less, or extremely dry conditions. Because of the slow rate of onset and long dura-tion of droughts in Georgia, long-term manage-ment and mitigation measures are appropriate. The Environmental Protection Division (EPD) of Georgia’s Department of Natural Resources (DNR) publishes the Georgia Drought Manage-ment Plan, which addresses both pre-drought miti-gation strategies and drought response strategies. Refer to the Drought Mitigation Plan for more de-tails on drought assessments for the State of Georgia.
Year Area Affected Remarks
1903-05 Statewide Severe 1924-27 North-central Georgia One of the most severe of the century 1930-35 Mostly statewide Affected most of US
1938-44 Statewide Regional drought 1950-57 Statewide Regional drought 1968-71 Southern and Central Georgia Variable severity 1977 Statewide Disaster 3044 1985-90 North and Central Georgia Regional drought 1999-2009 Statewide Severe
Table 2.18: Notable Drought Events in Georgia
SPI Score Condition
+2 and above Extremely wet
+1.5 to +1.99 Very wet
+1.0 to +1.49 Moderately wet
-0.99 to +0.99 Near normal
-1.0 to -1.49 Moderately dry
-1.5 to -1.99 Severely dry
-2.0 and less Extremely dry
Table 2.19: SPI Scores and Corresponding Conditions
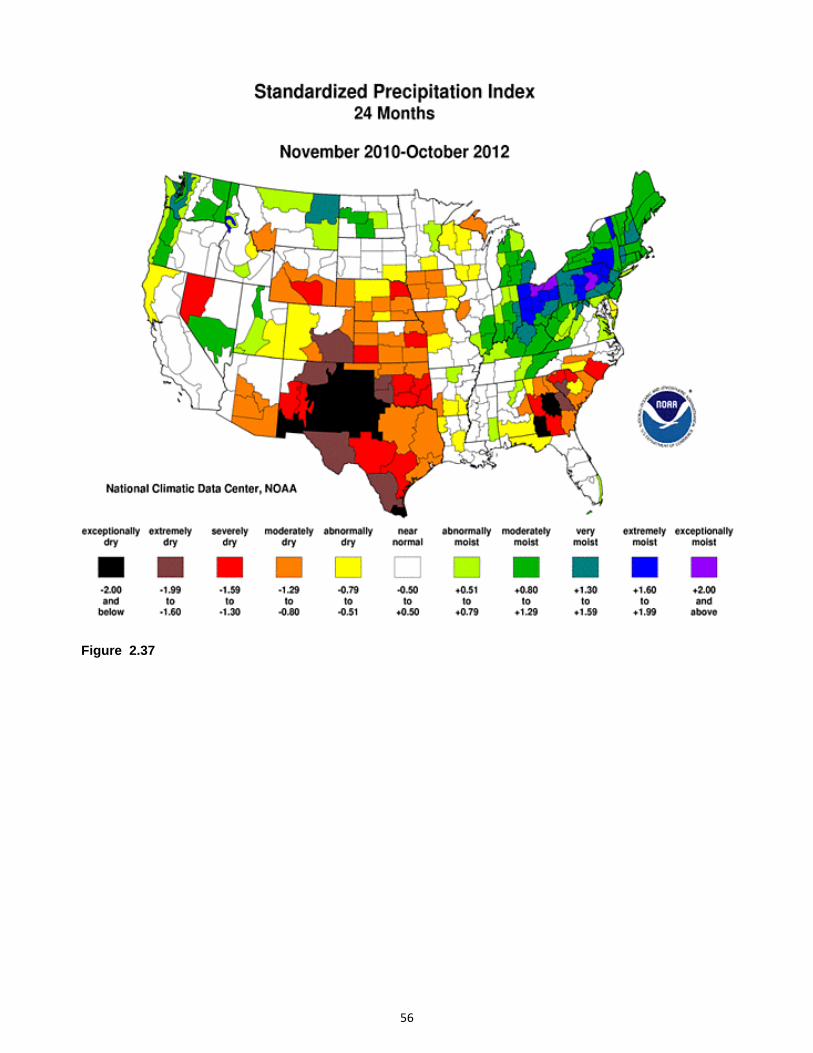
56
Figure 2.37
57
2.5.9 Wildfire
Hazard Vulnerability Total
Medium Medium Medium
Rank
6
Hazard Description A wildfire is an uncontained fire that spreads through the environment. Wildfires have the ability to consume large areas, including infrastructure, property, and resources. When massive fires, or con-flagrations, develop near populated areas, evacuations possibly ensue. Not only do the flames im-pact the environment, but the massive volumes of smoke spread by certain atmospheric conditions also impact the health of nearby populations. Wildfires result from the interaction of three crucial elements: fuel, ignition (heat), and oxygen. Natu-ral and man-made forces cause the three crucial elements to coincide in a manner that produces wildfire events. Typically, fuel consists of natural vegetation. However, as the urban and suburban footprint expands, wildfires may utilize other means of fuel such as buildings. In terms of ignition or source of heat, the primary natural source is lightning. However, humans are more responsible for wildfires than lightning (causing around 80% of fires). Man-made sources vary from the unintentional (fireworks, campfires, machinery) to the intentional (arson). With these two elements provided, the wildfires may spread as long as oxygen is present. Weather is the most variable factor affecting wildfire behavior. Strong winds propel wildfires quickly across most landscapes (unless fire breaks are present). Shifting winds create erratic wildfires, com-plicating fire management. Dry conditions provide faster-burning fuels, either making the area more vulnerable to wildfire or increasing the mobility of preexisting wildfires. Wildfires are notorious for spawning secondary hazards, such as flash flooding and landslides, long after the original fire is extinguished. Both flash flooding and landslides result from fire consuming the vegetation that provides precipitation interception and infiltration as well as slope stability. All of Georgia is prone to wildfire due to presence of wildland fuels associated with wildfires. Land cover associated with wildland fuels include coniferous, deciduous, and mixed forest; shrubland; grasslands/herbaceous; transitional; and woody and emergent herbaceous wetlands. The spatial ex-tent of wildfire events greatly depends on both the factors driving the fire as well as efforts of fire management and containment. Within the State of Georgia, the more recent fires of 2007 engulfed over 400,000 acres and even reached into Florida. However, these fires occurred in largely isolated regions with limited exposure to human development. While these fires posed minimal impact to de-velopment, air quality and visibility were greatly reduced throughout large areas of southeast Geor-gia due to smoke.
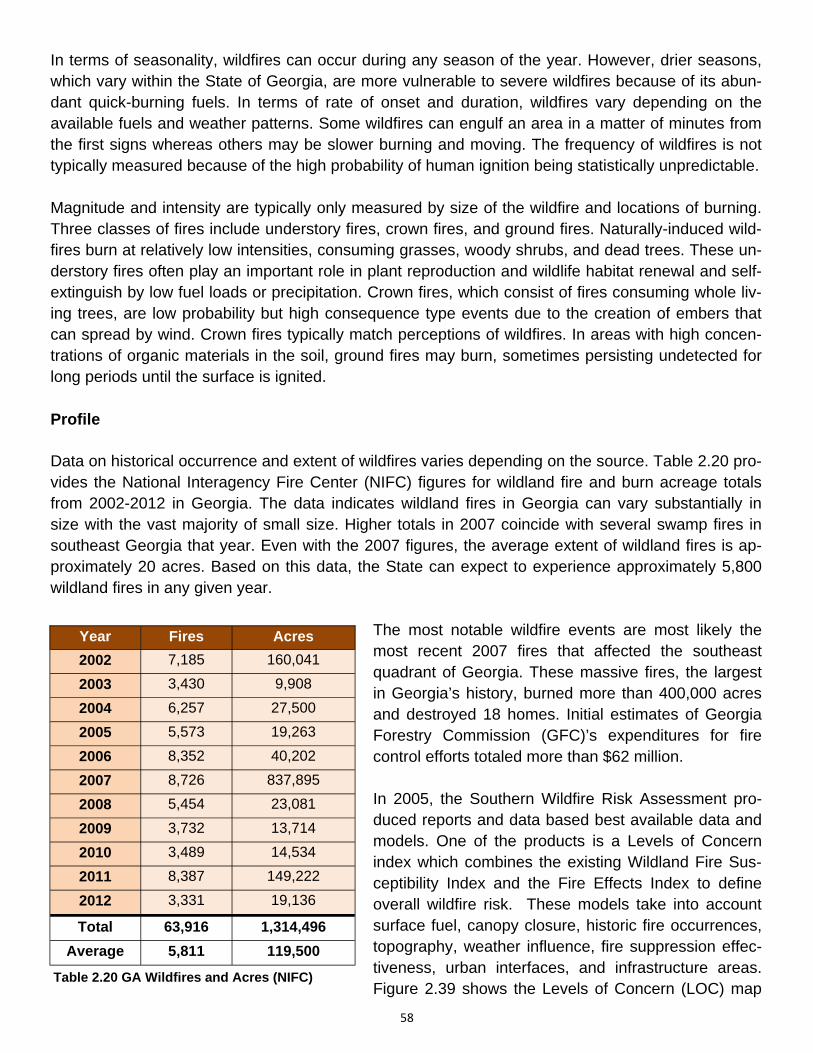
58
In terms of seasonality, wildfires can occur during any season of the year. However, drier seasons, which vary within the State of Georgia, are more vulnerable to severe wildfires because of its abun-dant quick-burning fuels. In terms of rate of onset and duration, wildfires vary depending on the available fuels and weather patterns. Some wildfires can engulf an area in a matter of minutes from the first signs whereas others may be slower burning and moving. The frequency of wildfires is not typically measured because of the high probability of human ignition being statistically unpredictable. Magnitude and intensity are typically only measured by size of the wildfire and locations of burning. Three classes of fires include understory fires, crown fires, and ground fires. Naturally-induced wild-fires burn at relatively low intensities, consuming grasses, woody shrubs, and dead trees. These un-derstory fires often play an important role in plant reproduction and wildlife habitat renewal and self-extinguish by low fuel loads or precipitation. Crown fires, which consist of fires consuming whole liv-ing trees, are low probability but high consequence type events due to the creation of embers that can spread by wind. Crown fires typically match perceptions of wildfires. In areas with high concen-trations of organic materials in the soil, ground fires may burn, sometimes persisting undetected for long periods until the surface is ignited. Profile Data on historical occurrence and extent of wildfires varies depending on the source. Table 2.20 pro-vides the National Interagency Fire Center (NIFC) figures for wildland fire and burn acreage totals from 2002-2012 in Georgia. The data indicates wildland fires in Georgia can vary substantially in size with the vast majority of small size. Higher totals in 2007 coincide with several swamp fires in southeast Georgia that year. Even with the 2007 figures, the average extent of wildland fires is ap-proximately 20 acres. Based on this data, the State can expect to experience approximately 5,800 wildland fires in any given year.
The most notable wildfire events are most likely the most recent 2007 fires that affected the southeast quadrant of Georgia. These massive fires, the largest in Georgia’s history, burned more than 400,000 acres and destroyed 18 homes. Initial estimates of Georgia Forestry Commission (GFC)’s expenditures for fire control efforts totaled more than $62 million. In 2005, the Southern Wildfire Risk Assessment pro-duced reports and data based best available data and models. One of the products is a Levels of Concern index which combines the existing Wildland Fire Sus-ceptibility Index and the Fire Effects Index to define overall wildfire risk. These models take into account surface fuel, canopy closure, historic fire occurrences, topography, weather influence, fire suppression effec-tiveness, urban interfaces, and infrastructure areas. Figure 2.39 shows the Levels of Concern (LOC) map
Year Fires Acres
2002 7,185 160,041
2003 3,430 9,908
2004 6,257 27,500
2005 5,573 19,263
2006 8,352 40,202
2007 8,726 837,895
2008 5,454 23,081
2009 3,732 13,714
2010 3,489 14,534
2011 8,387 149,222
2012 3,331 19,136
Total 63,916 1,314,496
Average 5,811 119,500
Table 2.20 GA Wildfires and Acres (NIFC)
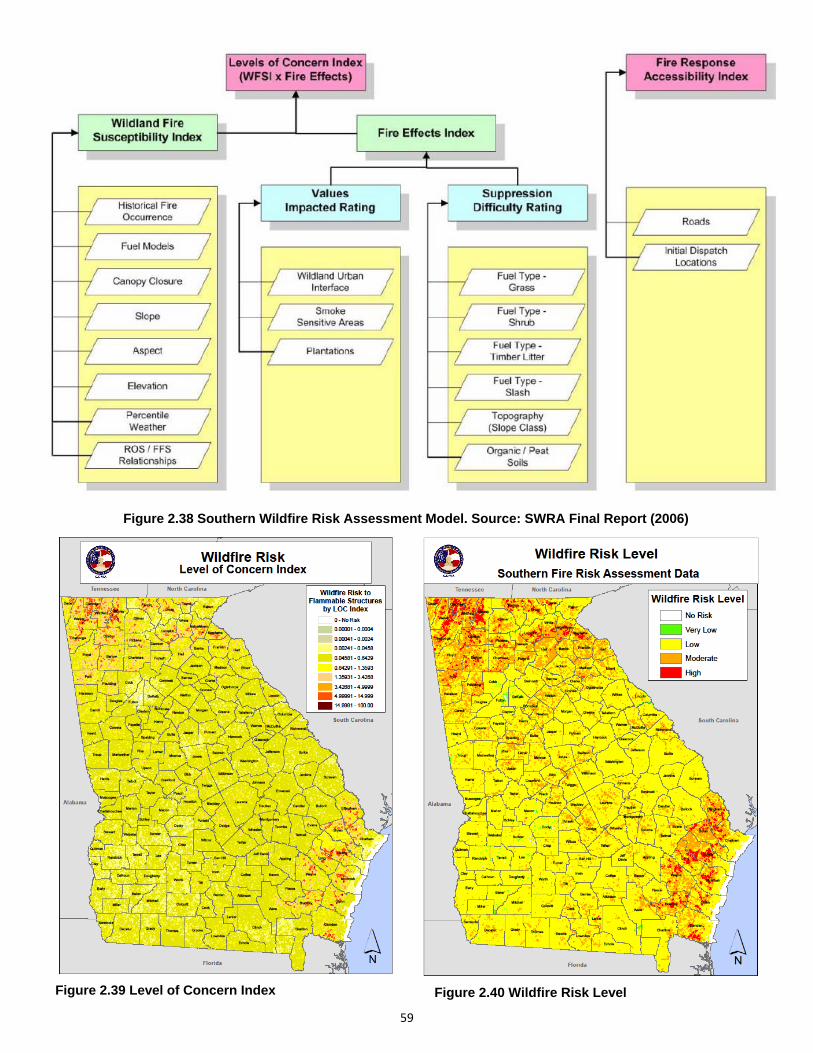
59
Figure 2.38 Southern Wildfire Risk Assessment Model. Source: SWRA Final Report (2006)
Figure 2.39 Level of Concern Index Figure 2.40 Wildfire Risk Level
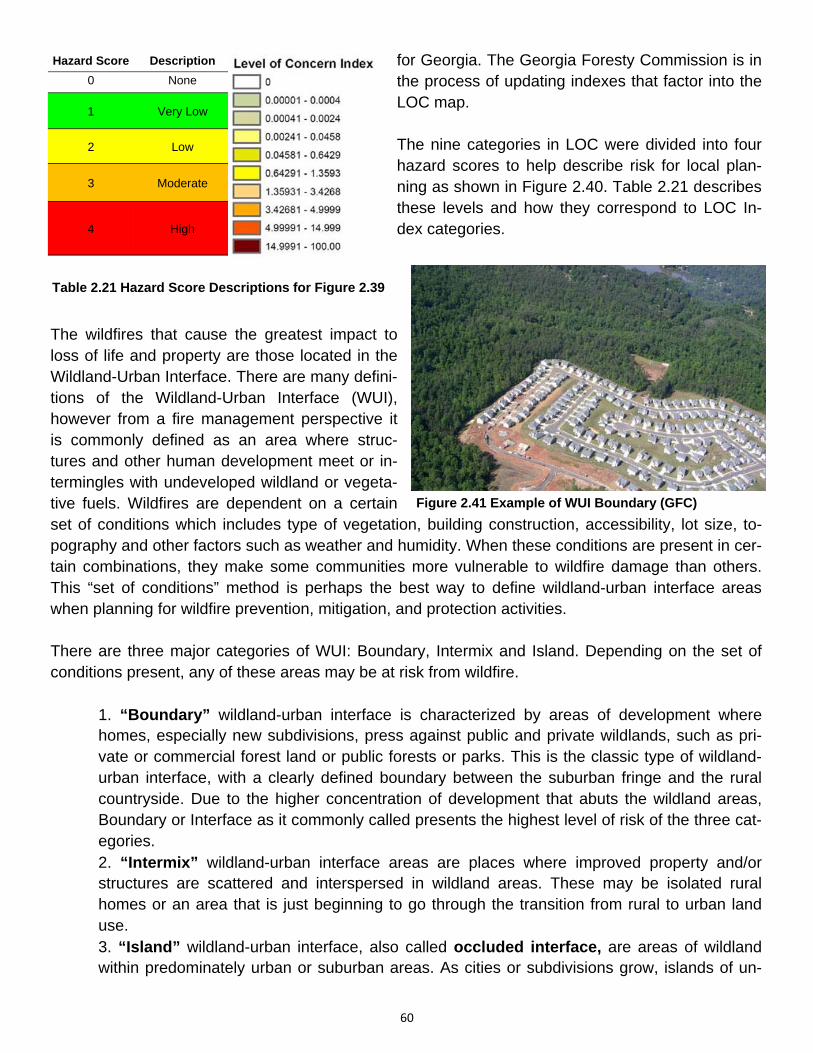
60
for Georgia. The Georgia Foresty Commission is in the process of updating indexes that factor into the LOC map. The nine categories in LOC were divided into four hazard scores to help describe risk for local plan-ning as shown in Figure 2.40. Table 2.21 describes these levels and how they correspond to LOC In-dex categories.
The wildfires that cause the greatest impact to loss of life and property are those located in the Wildland-Urban Interface. There are many defini-tions of the Wildland-Urban Interface (WUI), however from a fire management perspective it is commonly defined as an area where struc-tures and other human development meet or in-termingles with undeveloped wildland or vegeta-tive fuels. Wildfires are dependent on a certain set of conditions which includes type of vegetation, building construction, accessibility, lot size, to-pography and other factors such as weather and humidity. When these conditions are present in cer-tain combinations, they make some communities more vulnerable to wildfire damage than others. This “set of conditions” method is perhaps the best way to define wildland-urban interface areas when planning for wildfire prevention, mitigation, and protection activities. There are three major categories of WUI: Boundary, Intermix and Island. Depending on the set of conditions present, any of these areas may be at risk from wildfire.
1. “Boundary” wildland-urban interface is characterized by areas of development where homes, especially new subdivisions, press against public and private wildlands, such as pri-vate or commercial forest land or public forests or parks. This is the classic type of wildland-urban interface, with a clearly defined boundary between the suburban fringe and the rural countryside. Due to the higher concentration of development that abuts the wildland areas, Boundary or Interface as it commonly called presents the highest level of risk of the three cat-egories. 2. “Intermix” wildland-urban interface areas are places where improved property and/or structures are scattered and interspersed in wildland areas. These may be isolated rural homes or an area that is just beginning to go through the transition from rural to urban land use. 3. “Island” wildland-urban interface, also called occluded interface, are areas of wildland within predominately urban or suburban areas. As cities or subdivisions grow, islands of un-
Figure 2.41 Example of WUI Boundary (GFC)
Hazard Score Description
0 None
1 Very Low
2 Low
3 Moderate
4 High
Table 2.21 Hazard Score Descriptions for Figure 2.39
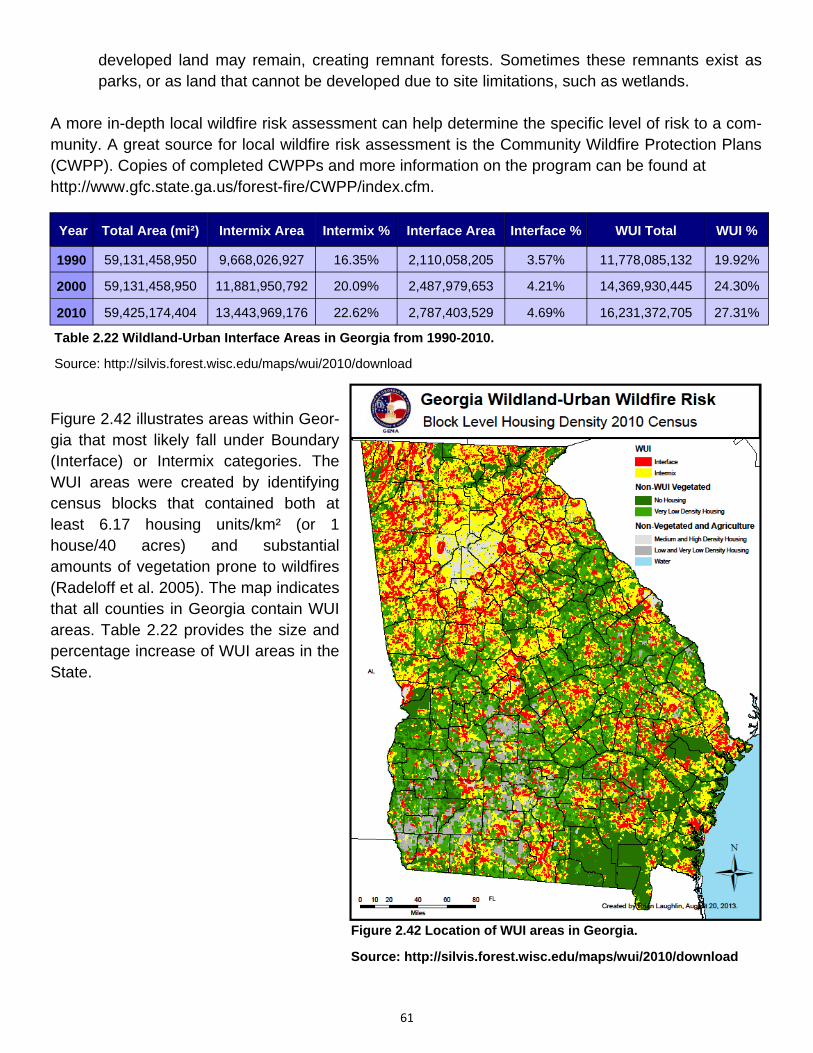
61
developed land may remain, creating remnant forests. Sometimes these remnants exist as parks, or as land that cannot be developed due to site limitations, such as wetlands.
A more in-depth local wildfire risk assessment can help determine the specific level of risk to a com-munity. A great source for local wildfire risk assessment is the Community Wildfire Protection Plans (CWPP). Copies of completed CWPPs and more information on the program can be found at http://www.gfc.state.ga.us/forest-fire/CWPP/index.cfm.
Figure 2.42 illustrates areas within Geor-gia that most likely fall under Boundary (Interface) or Intermix categories. The WUI areas were created by identifying census blocks that contained both at least 6.17 housing units/km² (or 1 house/40 acres) and substantial amounts of vegetation prone to wildfires (Radeloff et al. 2005). The map indicates that all counties in Georgia contain WUI areas. Table 2.22 provides the size and percentage increase of WUI areas in the State.
Figure 2.42 Location of WUI areas in Georgia.
Source: http://silvis.forest.wisc.edu/maps/wui/2010/download
Table 2.22 Wildland-Urban Interface Areas in Georgia from 1990-2010.
Source: http://silvis.forest.wisc.edu/maps/wui/2010/download
Year Total Area (mi²) Intermix Area Intermix % Interface Area Interface % WUI Total WUI %
1990 59,131,458,950 9,668,026,927 16.35% 2,110,058,205 3.57% 11,778,085,132 19.92%
2000 59,131,458,950 11,881,950,792 20.09% 2,487,979,653 4.21% 14,369,930,445 24.30%
2010 59,425,174,404 13,443,969,176 22.62% 2,787,403,529 4.69% 16,231,372,705 27.31%
62
2.5.10 Earthquake Associated Hazards:
Ground‐shaking, liquefac on, landslides, tsunamis Hazard Vulnerability Total
Low Low Low
Rank
8
Hazard Description Earthquakes are generally defined as the sudden motion or trembling of the Earth’s surface caused by an abrupt release of slowly accumulated strain. This release typically manifests on the surface as ground shaking, surface faulting, tectonic uplifting and subsidence, or ground failures, and tsunamis. In the United States, earthquake activity east of the Rocky Mountains is relatively low compared to the West because it is away from active plate boundaries and the plate interior strain rates are known to be very low. The physical property of earthquakes that causes the majority of damage within the United States is ground shaking. The vibrations from the seismic waves that propagate outward from the epicenter may cause failure in structures not adequately designed to withstand earthquakes. Because the seismic waves have different frequencies of vibration, the waves disseminate differently through sub-surface materials. For example, high frequency compression and shear waves arrive first whereas lower frequency Rayleigh and love waves arrive later. Not only are speeds varied between seismic waves but also the types of movement. The surface vibration may be horizontal, vertical, or a combi-nation of the two, which causes a wider array of structures to collapse. Another manifestation of earthquakes is surface faulting. This phenomenon is defined as the offset or tearing of the earth’s surface by a differential movement across a fault. Structures built across active faults tend to sustain damage regularly. There are no active faults within or near Georgia. Dis-tinct Inactive faults are known within the state north of the Columbus, Macon, and Augusta fall line and running generally northeast-southwest. One of these is the Brevard Fault line which last moved 185 million years ago and is not associated with ongoing seismic activity in Georgia. The third earthquake phenomenon that causes damage is tectonic uplift and subsidence. Tectonic uplift can cause shallowing of harbors and waterways while tectonic subsidence can cause perma-nent or intermittent inundation similar to what happened as a result of the 1964 Alaskan earthquake. Due to the association of tectonic uplift and subsidence with active faults, Georgia is not at risk to this phenomenon. The fourth earthquake damage-causing phenomena are earthquake-induced ground failures, includ-ing liquefaction and landslides. During an earthquake, the areas that are rich in sand and silt and have groundwater within 30 feet of the surface temporarily behave as viscous fluids during strong ground shaking. Structures built on these materials can settle, topple, or collapse as the ground ‘liquefies’ beneath it. Landslides can also form when earthquake shaking or seismic activity dislodg-
63
es rock and debris on steep slopes triggering rock falls, avalanches, and slides. Also, unstable, or nearly unstable slopes consisting of clay soils may lose shear strength when disturbed by ground shaking and fail, resulting in a landslide. Georgia is at very low risk of seismic induced liquefaction or landslides. The last of earthquake-induced phenomena are tsunamis, large gravity-driven waves triggered by the sudden displacement of a large volume of water (by underwater earthquake, landslide, or vol-canic eruption). The waves produced travel in all directions from the origin at speeds of up to 600 miles per hour. In deep water tsunamis normally have small wave heights, however, as the waves reach shallower water near land, the wave speed diminishes and the amplitude drastically increases. Upon impact with a shoreline, the waves can inundate land rapidly engulfing everything in its path. Successive wave crests follow, typically arriving minutes to hours later, frequently with later arrivals being more dominant. Frequently, the first tsunami waves are downward, causing dramatic exposure of beach. Because of this, people are often killed trying to collect newly exposed seashells when the positive waves then arrive. Although large tsunamis are rare in the eastern coast of the US, the possibility of such events occur-ring anywhere along the Atlantic and Gulf coast exists. For example, a severe earthquake in the Grand Banks of Newfoundland on November 18, 1929 generated tsunami waves that caused con-siderable damage in coastal Newfoundland and reached as far south as Charleston, South Carolina. Another example occurred in the Caribbean with a large earthquake on November 18, 1867 that caused tsunami waves larger than 20 feet in the Virgin Islands and Puerto Rico. Profile Earthquakes of magnitude less than 5.0 are not known to produce significant damage. Georgia’s greatest risks for earthquakes of magnitude 5.0 or greater are from three different seismic areas:
New Madrid Fault Zone- centered on the Mississippi River north of Memphis Eastern Tennessee Seismic Belt- running west of the Appalachians between Knoxville and Northeastern Alabama Charleston, SC
Modest earthquakes distributed throughout the Georgia Piedmont also occur; however, risk level re-mains low due to much lower magnitude and intensity associated with these events. The spatial ex-tent of specific earthquakes largely depends on its magnitude (discussed below). For example, the New Madrid earthquakes of 1811 and 1812, centered between St. Louis and Memphis on the Mis-sissippi River, caused damage as far away as Cincinnati and Richmond and were felt as far as Bos-ton.
The temporal characteristics of earthquakes include rate of onset, duration, and the frequency of re-currence. Earthquakes rarely give warning of their impending occurrence, and hence such events are currently considered unpredictable by many in the scientific community. When one occurs ground failure can occur within a few seconds, and strong shaking can last from a few seconds to several minutes depending on the severity of the event, and the distance an individual is from its oc-
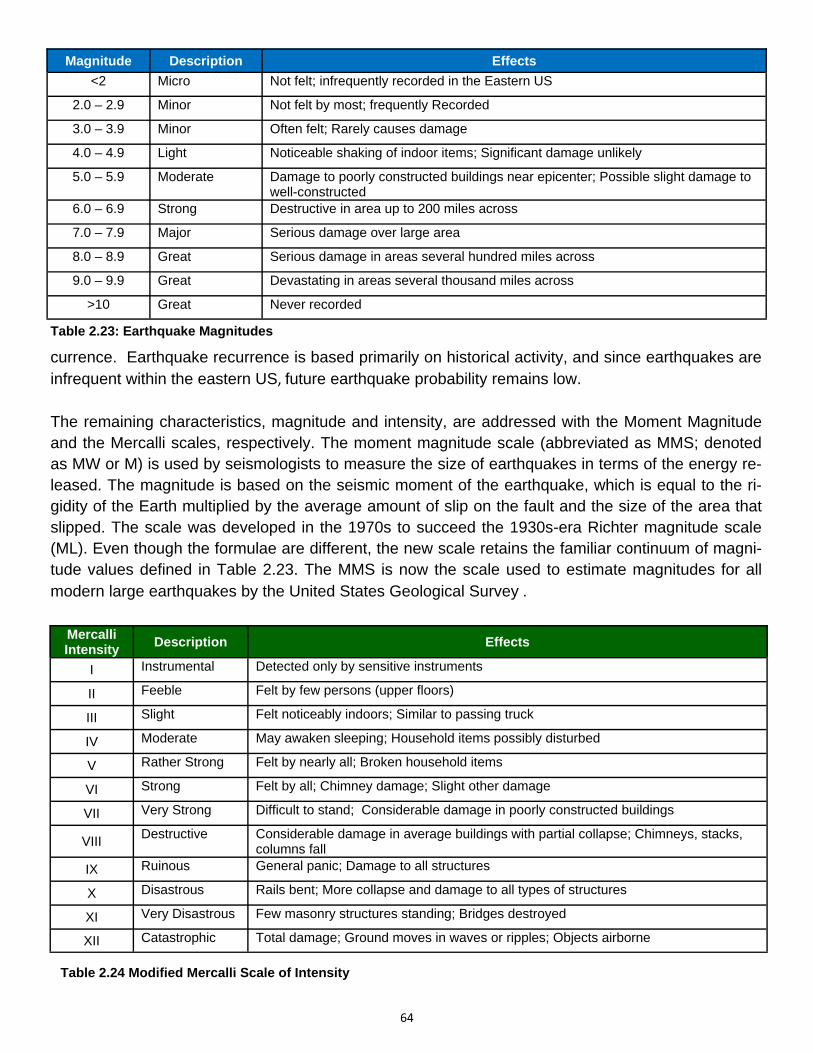
64
currence. Earthquake recurrence is based primarily on historical activity, and since earthquakes are infrequent within the eastern US, future earthquake probability remains low. The remaining characteristics, magnitude and intensity, are addressed with the Moment Magnitude and the Mercalli scales, respectively. The moment magnitude scale (abbreviated as MMS; denoted as MW or M) is used by seismologists to measure the size of earthquakes in terms of the energy re-leased. The magnitude is based on the seismic moment of the earthquake, which is equal to the ri-gidity of the Earth multiplied by the average amount of slip on the fault and the size of the area that slipped. The scale was developed in the 1970s to succeed the 1930s-era Richter magnitude scale (ML). Even though the formulae are different, the new scale retains the familiar continuum of magni-tude values defined in Table 2.23. The MMS is now the scale used to estimate magnitudes for all modern large earthquakes by the United States Geological Survey .
Magnitude Description Effects
<2 Micro Not felt; infrequently recorded in the Eastern US
2.0 – 2.9 Minor Not felt by most; frequently Recorded
3.0 – 3.9 Minor Often felt; Rarely causes damage
4.0 – 4.9 Light Noticeable shaking of indoor items; Significant damage unlikely
5.0 – 5.9 Moderate Damage to poorly constructed buildings near epicenter; Possible slight damage to well-constructed
6.0 – 6.9 Strong Destructive in area up to 200 miles across
7.0 – 7.9 Major Serious damage over large area
8.0 – 8.9 Great Serious damage in areas several hundred miles across
9.0 – 9.9 Great Devastating in areas several thousand miles across
>10 Great Never recorded
Table 2.23: Earthquake Magnitudes
Mercalli Intensity
Description Effects
I Instrumental Detected only by sensitive instruments
II Feeble Felt by few persons (upper floors)
III Slight Felt noticeably indoors; Similar to passing truck
IV Moderate May awaken sleeping; Household items possibly disturbed
V Rather Strong Felt by nearly all; Broken household items
VI Strong Felt by all; Chimney damage; Slight other damage
VII Very Strong Difficult to stand; Considerable damage in poorly constructed buildings
VIII Destructive Considerable damage in average buildings with partial collapse; Chimneys, stacks,
columns fall
IX Ruinous General panic; Damage to all structures
X Disastrous Rails bent; More collapse and damage to all types of structures
XI Very Disastrous Few masonry structures standing; Bridges destroyed
XII Catastrophic Total damage; Ground moves in waves or ripples; Objects airborne
Table 2.24 Modified Mercalli Scale of Intensity
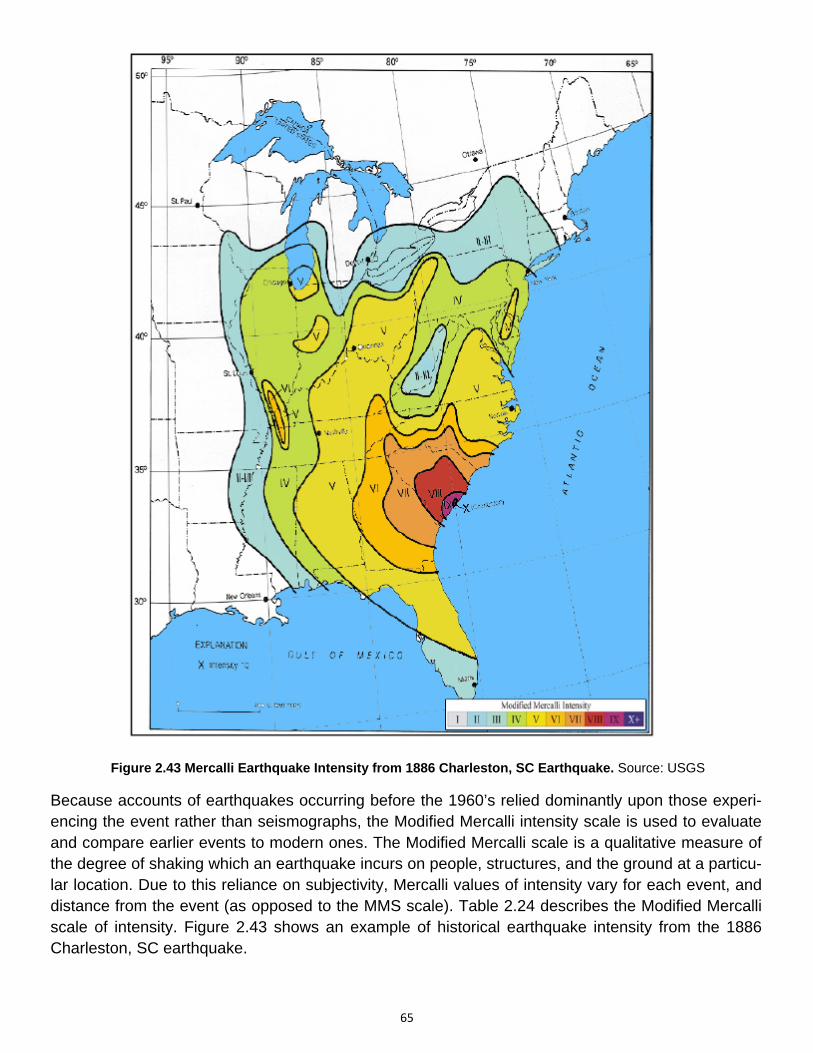
65
Because accounts of earthquakes occurring before the 1960’s relied dominantly upon those experi-encing the event rather than seismographs, the Modified Mercalli intensity scale is used to evaluate and compare earlier events to modern ones. The Modified Mercalli scale is a qualitative measure of the degree of shaking which an earthquake incurs on people, structures, and the ground at a particu-lar location. Due to this reliance on subjectivity, Mercalli values of intensity vary for each event, and distance from the event (as opposed to the MMS scale). Table 2.24 describes the Modified Mercalli scale of intensity. Figure 2.43 shows an example of historical earthquake intensity from the 1886 Charleston, SC earthquake.
Figure 2.43 Mercalli Earthquake Intensity from 1886 Charleston, SC Earthquake. Source: USGS
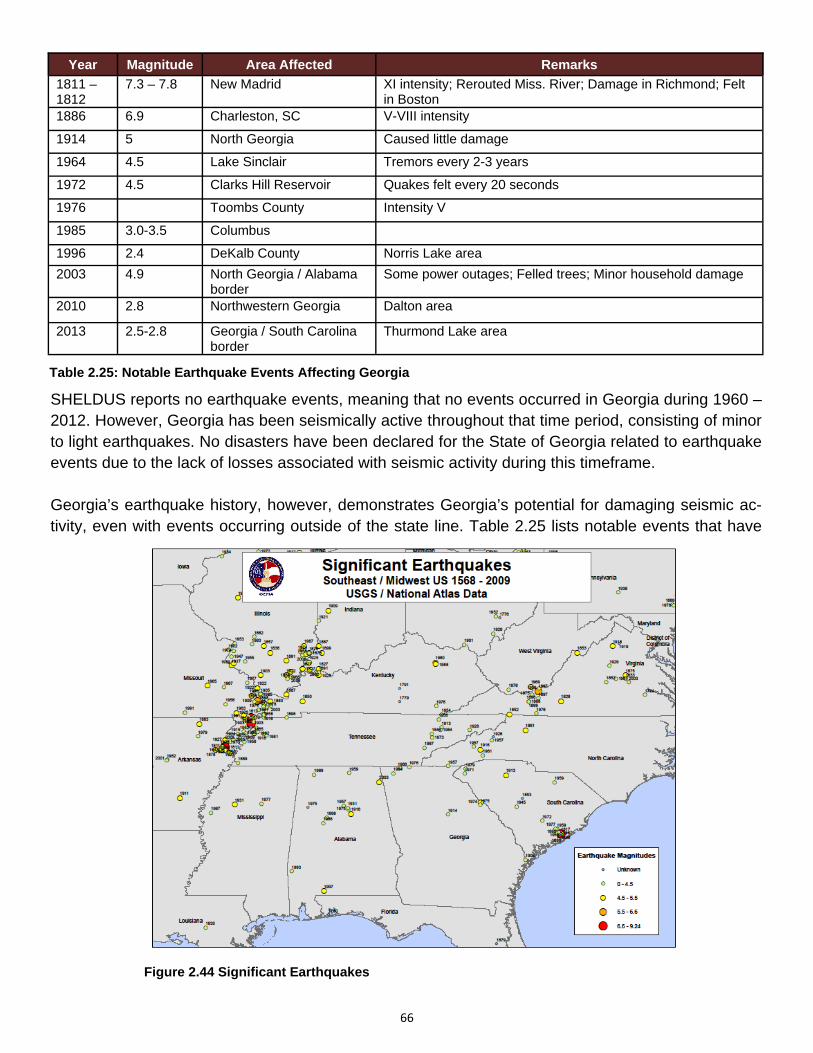
66
SHELDUS reports no earthquake events, meaning that no events occurred in Georgia during 1960 – 2012. However, Georgia has been seismically active throughout that time period, consisting of minor to light earthquakes. No disasters have been declared for the State of Georgia related to earthquake events due to the lack of losses associated with seismic activity during this timeframe. Georgia’s earthquake history, however, demonstrates Georgia’s potential for damaging seismic ac-tivity, even with events occurring outside of the state line. Table 2.25 lists notable events that have
Figure 2.44 Significant Earthquakes
Year Magnitude Area Affected Remarks
1811 – 1812
7.3 – 7.8 New Madrid XI intensity; Rerouted Miss. River; Damage in Richmond; Felt in Boston
1886 6.9 Charleston, SC V-VIII intensity
1914 5 North Georgia Caused little damage
1964 4.5 Lake Sinclair Tremors every 2-3 years
1972 4.5 Clarks Hill Reservoir Quakes felt every 20 seconds
1976 Toombs County Intensity V
1985 3.0-3.5 Columbus
1996 2.4 DeKalb County Norris Lake area
2003 4.9 North Georgia / Alabama border
Some power outages; Felled trees; Minor household damage
2010 2.8 Northwestern Georgia Dalton area
2013 2.5-2.8 Georgia / South Carolina border
Thurmond Lake area
Table 2.25: Notable Earthquake Events Affecting Georgia
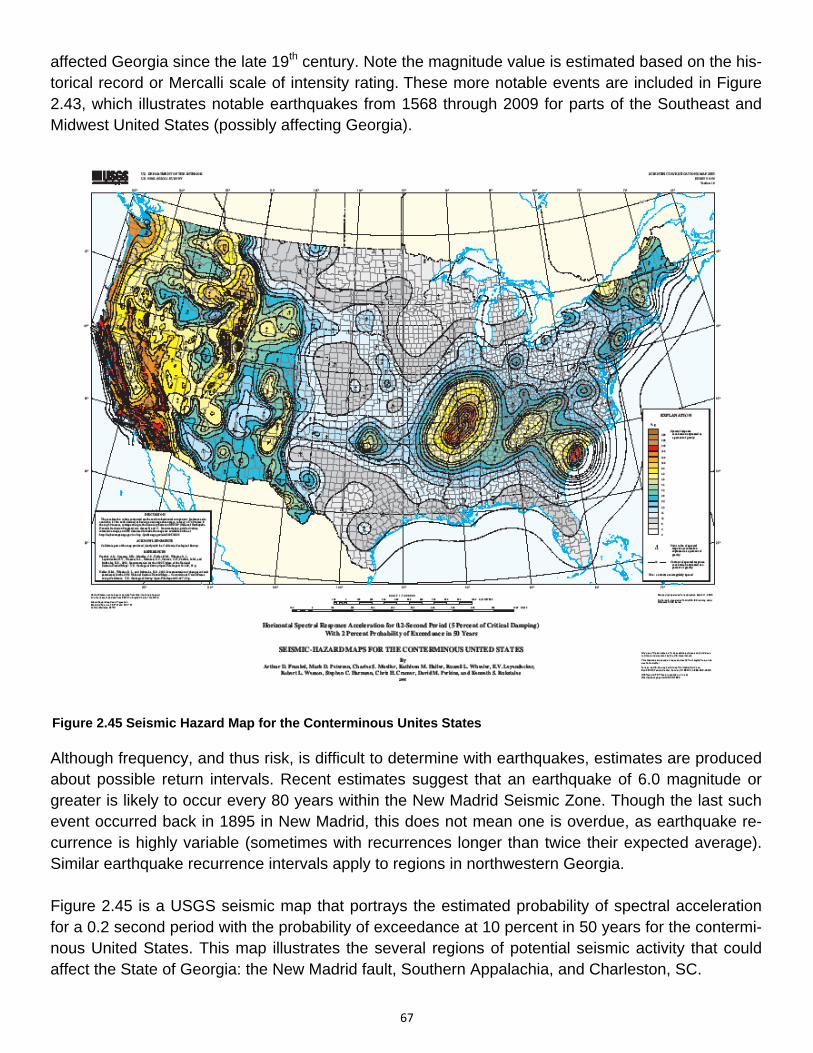
67
affected Georgia since the late 19th century. Note the magnitude value is estimated based on the his-torical record or Mercalli scale of intensity rating. These more notable events are included in Figure 2.43, which illustrates notable earthquakes from 1568 through 2009 for parts of the Southeast and Midwest United States (possibly affecting Georgia).
Although frequency, and thus risk, is difficult to determine with earthquakes, estimates are produced about possible return intervals. Recent estimates suggest that an earthquake of 6.0 magnitude or greater is likely to occur every 80 years within the New Madrid Seismic Zone. Though the last such event occurred back in 1895 in New Madrid, this does not mean one is overdue, as earthquake re-currence is highly variable (sometimes with recurrences longer than twice their expected average). Similar earthquake recurrence intervals apply to regions in northwestern Georgia. Figure 2.45 is a USGS seismic map that portrays the estimated probability of spectral acceleration for a 0.2 second period with the probability of exceedance at 10 percent in 50 years for the contermi-nous United States. This map illustrates the several regions of potential seismic activity that could affect the State of Georgia: the New Madrid fault, Southern Appalachia, and Charleston, SC.
Figure 2.45 Seismic Hazard Map for the Conterminous Unites States
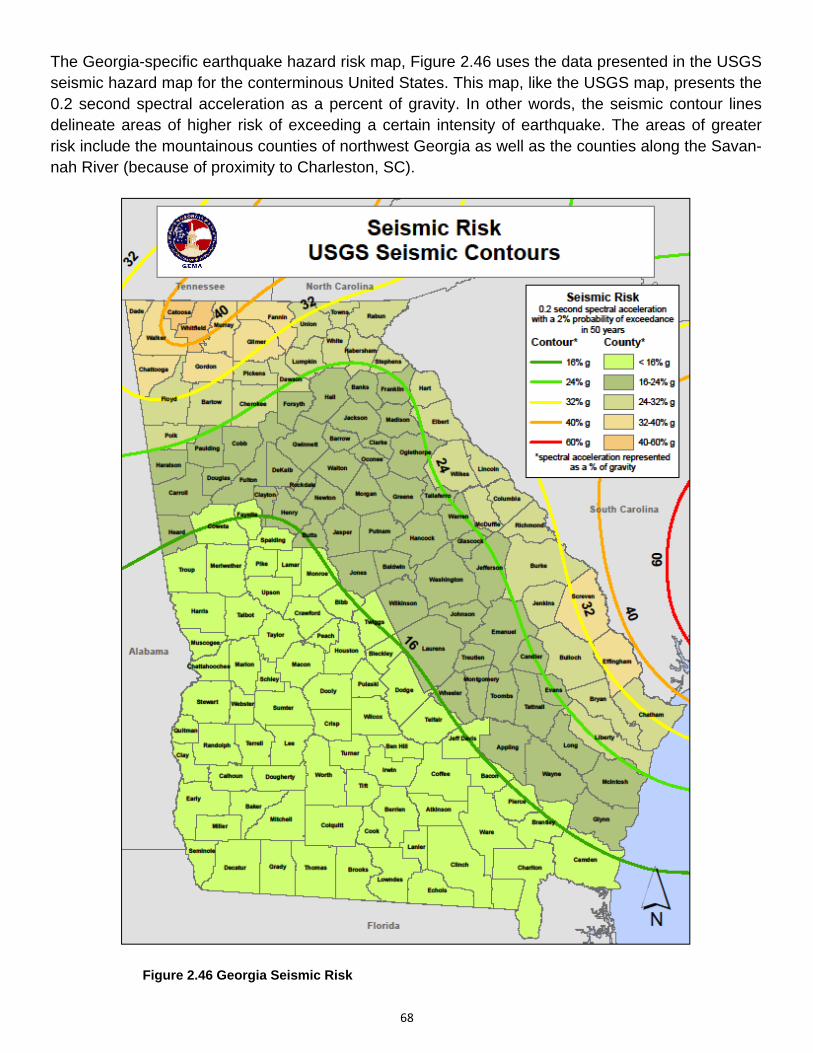
68
The Georgia-specific earthquake hazard risk map, Figure 2.46 uses the data presented in the USGS seismic hazard map for the conterminous United States. This map, like the USGS map, presents the 0.2 second spectral acceleration as a percent of gravity. In other words, the seismic contour lines delineate areas of higher risk of exceeding a certain intensity of earthquake. The areas of greater risk include the mountainous counties of northwest Georgia as well as the counties along the Savan-nah River (because of proximity to Charleston, SC).
Figure 2.46 Georgia Seismic Risk
69
2.5.11 Geologic Hazards Associated Hazards:
Sinkholes, landslides, debris flow, mudslides, flooding, tropi‐
cal cyclones, wildfire.
Hazard Vulnerability Total
Low Low Low
Rank
9
Previously called Sinkhole, this section was expanded to include description of another geologic hazard, landslides. Landslides are also associated with and called debris flows. Landslide was not assessed during the risk ranking; therefore the levels of risk and ranking in the boxes above are solely for Sinkhole. Sinkhole Sinkholes are generally defined as a natural depression or hole in the surface topography formed by mechanisms such as the gradual removal of soluble bedrock by percolating water, the collapse of cave roofs (due to some seismic activity), or the lowering of the water table. These natural phenome-na occur in areas where the subsurface rock consists of evaporites (salt, gypsum, and anhydrite) and carbonates (limestone and dolomite). However, the correlation between sinkholes and land-use practices reveal that sinkholes are often human-induced through over pumping groundwater and through altering natural water drainage patterns. In the State of Georgia, sinkholes occur due to the underlying carbonate rock beneath the area run-ning along the fall line (border between coastal plain and piedmont region of Georgia) and the area of the southern Appalachian Mountains. The spatial dispersion of sinkholes-susceptible soils in Georgia and the United States is found in Figure 2.47. In terms of spatial extent, sinkholes can affect areas from less than one meter to several hundred meters in diameter and depth. Temporal characteristics greatly depend on the underlying bedrock excluding seasonality. In other words, seasonality has no affect on sinkholes because the hazard is not meteorological. The rate of onset and duration of the event greatly depend on the type of sinkhole forming. Subsidence and so-lution sinkholes typically form gradually in areas of thin overburden or exposed carbonate rock, re-spectively. Collapse sinkholes occur rapidly in areas with thick overburden after the confining layer is breached. Therefore, the rate of onset is slow for subsidence and solution sinkholes while rapid for collapse sinkholes; and the duration is longer for subsidence and solution sinkholes and shorter for collapse sinkholes. No frequency estimates exist for sinkholes except that sinkholes are more likely in the areas depicted with soluble bedrocks. Profile Official measures and scales of magnitude and intensity do not exist for sinkholes. However, the magnitude may be measured by the areal extent of the sinkhole while intensity may be estimated by the losses involved with the hazard event.
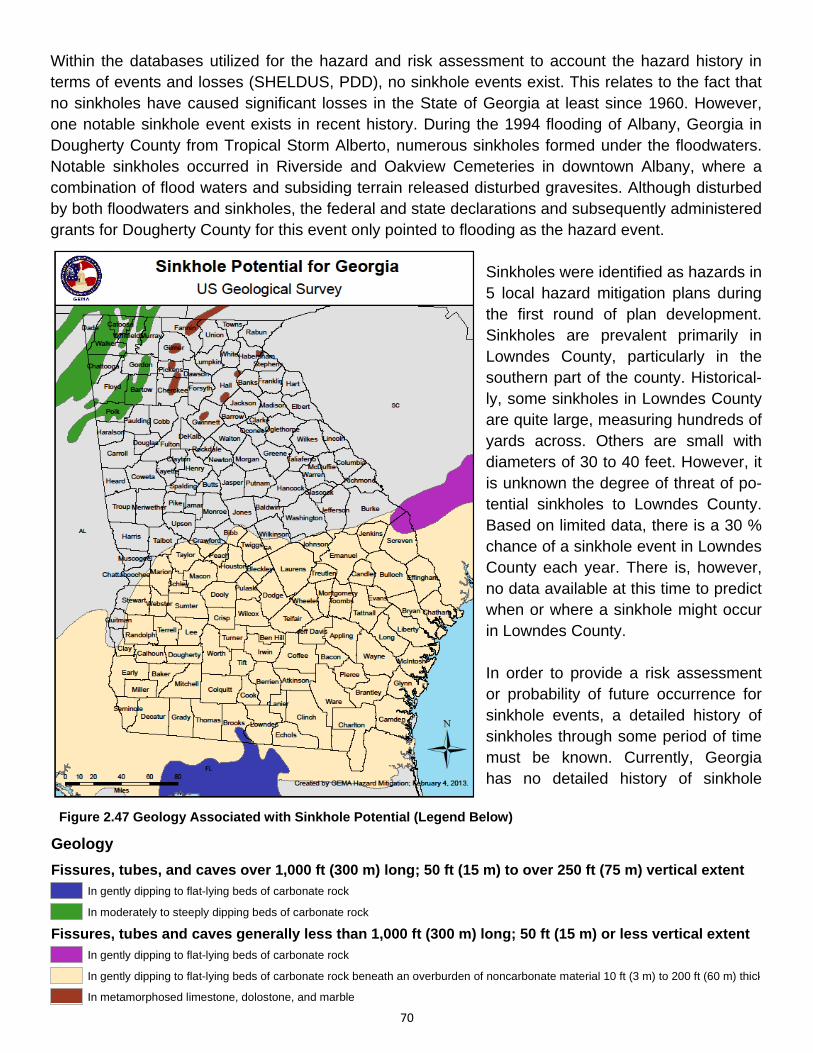
70
Within the databases utilized for the hazard and risk assessment to account the hazard history in terms of events and losses (SHELDUS, PDD), no sinkhole events exist. This relates to the fact that no sinkholes have caused significant losses in the State of Georgia at least since 1960. However, one notable sinkhole event exists in recent history. During the 1994 flooding of Albany, Georgia in Dougherty County from Tropical Storm Alberto, numerous sinkholes formed under the floodwaters. Notable sinkholes occurred in Riverside and Oakview Cemeteries in downtown Albany, where a combination of flood waters and subsiding terrain released disturbed gravesites. Although disturbed by both floodwaters and sinkholes, the federal and state declarations and subsequently administered grants for Dougherty County for this event only pointed to flooding as the hazard event.
Sinkholes were identified as hazards in 5 local hazard mitigation plans during the first round of plan development. Sinkholes are prevalent primarily in Lowndes County, particularly in the southern part of the county. Historical-ly, some sinkholes in Lowndes County are quite large, measuring hundreds of yards across. Others are small with diameters of 30 to 40 feet. However, it is unknown the degree of threat of po-tential sinkholes to Lowndes County. Based on limited data, there is a 30 % chance of a sinkhole event in Lowndes County each year. There is, however, no data available at this time to predict when or where a sinkhole might occur in Lowndes County. In order to provide a risk assessment or probability of future occurrence for sinkhole events, a detailed history of sinkholes through some period of time must be known. Currently, Georgia has no detailed history of sinkhole
Figure A.11
Figure 2.47 Geology Associated with Sinkhole Potential (Legend Below)
Geology
Fissures, tubes, and caves over 1,000 ft (300 m) long; 50 ft (15 m) to over 250 ft (75 m) vertical extentIn gently dipping to flat-lying beds of carbonate rock
In moderately to steeply dipping beds of carbonate rock
Fissures, tubes and caves generally less than 1,000 ft (300 m) long; 50 ft (15 m) or less vertical extentIn gently dipping to flat-lying beds of carbonate rock
In gently dipping to flat-lying beds of carbonate rock beneath an overburden of noncarbonate material 10 ft (3 m) to 200 ft (60 m) thick
In metamorphosed limestone, dolostone, and marble
71
events for the entire state. With no recorded losses from sinkhole events besides those sinkholes compounded by other hazards (such as the Albany floods) the sinkhole hazard threat in the State of Georgia is not significant enough to warrant further analysis or inclusion in the composite assess-ment at the end of this chapter. Landslides and Debris Flow Landslides occur in all U.S. states and territories and can be caused by a variety of factors including earthquakes, storms, volcanic eruptions, fire and by human modification of land. Landslides can oc-cur quickly, often with little notice and the best way to prepare is to stay informed about changes in and around your home that could signal that a landslide is likely to occur. In a landslide, masses of rock, earth or debris move down a slope. Debris and mud flows are rivers of rock, earth, and other debris saturated with water. They develop when water rapidly accumulates in the ground, during heavy rainfall or rapid snowmelt, changing the earth into a flowing river of mud or “slurry.” They can flow rapidly, striking with little or no warning at avalanche speeds. They also can travel several miles from their source, growing in size as they pick up trees, boulders, cars and other materials. Landslide problems can be caused by land mismanagement, particularly in mountain, canyon and coastal regions. In areas burned by forest and brush fires, a lower threshold of precipitation may initi-ate landslides. Land-use zoning, professional inspections, and proper design can minimize many landslide, mudflow, and debris flow problems. Profile An exact historical record is difficult to determine as many landslide and debris flow events are mi-nor, do not cause significant damage or go unreported. SHELDUS data from 1952 to 2012 list one event occurring in Rabun County in 2004. Property losses from this event were estimated at $100,000. This event was triggered by excessive rainfalls from Hurricane Ivan as it passed through the state. In August 2013, heavy rains created a mudslide in Sandy Springs, GA that closed a local road. It is estimated the road will remain closed for up to a year while a retaining wall is constructed at a cost of approximately $1 million. Residents have reported eight other mudslides in the area. The most vulnerable locations in Georgia are identified in Figure 2.48. Higher risk areas are mostly located in North Georgia where steeper slopes exist in mountain and hill terrain. Given the variety of events that could cause landslides or debris flows and incomplete records of previous occurrences, it is not currently possible to determine the future probability of an event in Georgia.
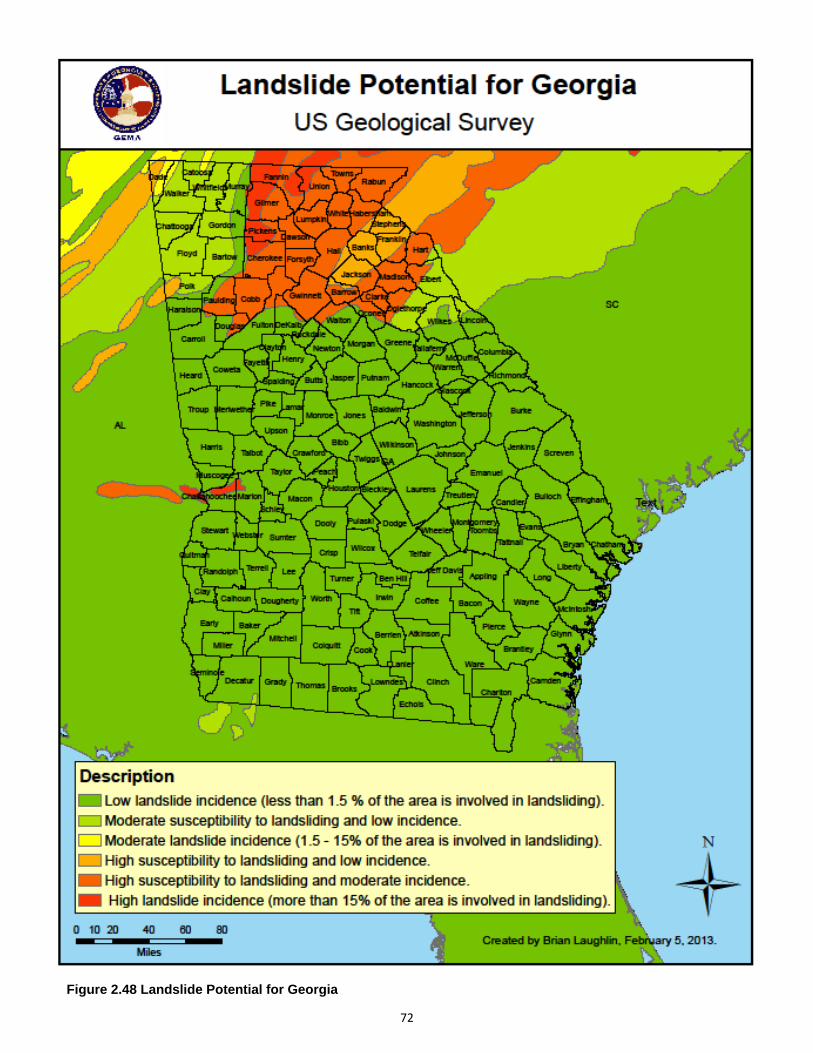
72
Figure 2.48 Landslide Potential for Georgia
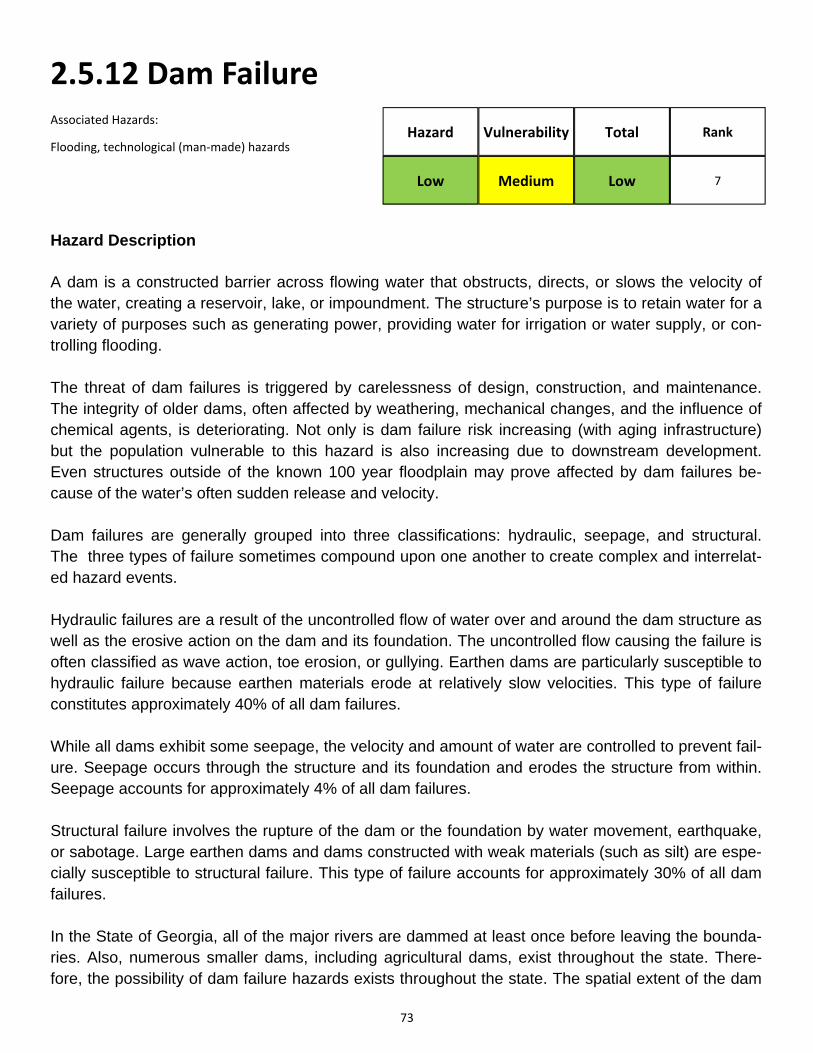
73
2.5.12 Dam Failure Associated Hazards:
Flooding, technological (man‐made) hazards Hazard Vulnerability Total
Low Medium Low
Rank
7
Hazard Description A dam is a constructed barrier across flowing water that obstructs, directs, or slows the velocity of the water, creating a reservoir, lake, or impoundment. The structure’s purpose is to retain water for a variety of purposes such as generating power, providing water for irrigation or water supply, or con-trolling flooding. The threat of dam failures is triggered by carelessness of design, construction, and maintenance. The integrity of older dams, often affected by weathering, mechanical changes, and the influence of chemical agents, is deteriorating. Not only is dam failure risk increasing (with aging infrastructure) but the population vulnerable to this hazard is also increasing due to downstream development. Even structures outside of the known 100 year floodplain may prove affected by dam failures be-cause of the water’s often sudden release and velocity. Dam failures are generally grouped into three classifications: hydraulic, seepage, and structural. The three types of failure sometimes compound upon one another to create complex and interrelat-ed hazard events. Hydraulic failures are a result of the uncontrolled flow of water over and around the dam structure as well as the erosive action on the dam and its foundation. The uncontrolled flow causing the failure is often classified as wave action, toe erosion, or gullying. Earthen dams are particularly susceptible to hydraulic failure because earthen materials erode at relatively slow velocities. This type of failure constitutes approximately 40% of all dam failures. While all dams exhibit some seepage, the velocity and amount of water are controlled to prevent fail-ure. Seepage occurs through the structure and its foundation and erodes the structure from within. Seepage accounts for approximately 4% of all dam failures. Structural failure involves the rupture of the dam or the foundation by water movement, earthquake, or sabotage. Large earthen dams and dams constructed with weak materials (such as silt) are espe-cially susceptible to structural failure. This type of failure accounts for approximately 30% of all dam failures. In the State of Georgia, all of the major rivers are dammed at least once before leaving the bounda-ries. Also, numerous smaller dams, including agricultural dams, exist throughout the state. There-fore, the possibility of dam failure hazards exists throughout the state. The spatial extent of the dam
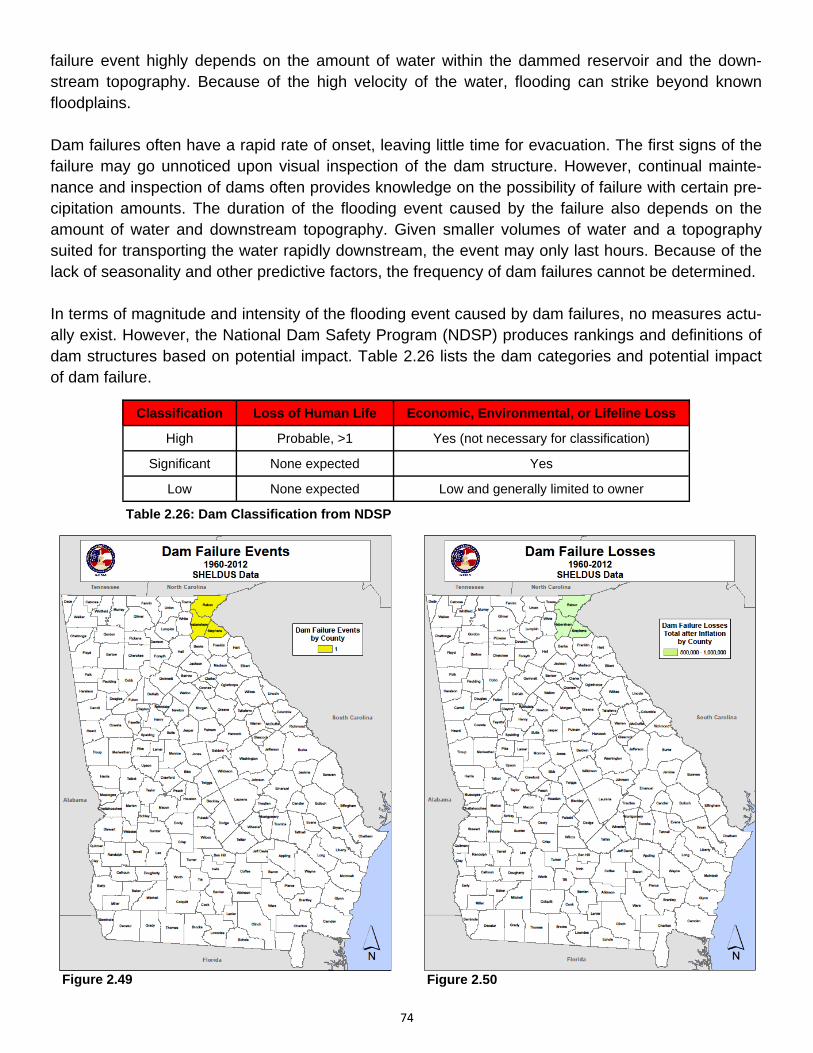
74
failure event highly depends on the amount of water within the dammed reservoir and the down-stream topography. Because of the high velocity of the water, flooding can strike beyond known floodplains. Dam failures often have a rapid rate of onset, leaving little time for evacuation. The first signs of the failure may go unnoticed upon visual inspection of the dam structure. However, continual mainte-nance and inspection of dams often provides knowledge on the possibility of failure with certain pre-cipitation amounts. The duration of the flooding event caused by the failure also depends on the amount of water and downstream topography. Given smaller volumes of water and a topography suited for transporting the water rapidly downstream, the event may only last hours. Because of the lack of seasonality and other predictive factors, the frequency of dam failures cannot be determined. In terms of magnitude and intensity of the flooding event caused by dam failures, no measures actu-ally exist. However, the National Dam Safety Program (NDSP) produces rankings and definitions of dam structures based on potential impact. Table 2.26 lists the dam categories and potential impact of dam failure.
Table 2.26: Dam Classification from NDSP
Classification Loss of Human Life Economic, Environmental, or Lifeline Loss
High Probable, >1 Yes (not necessary for classification)
Significant None expected Yes
Low None expected Low and generally limited to owner
Figure 2.49 Figure 2.50
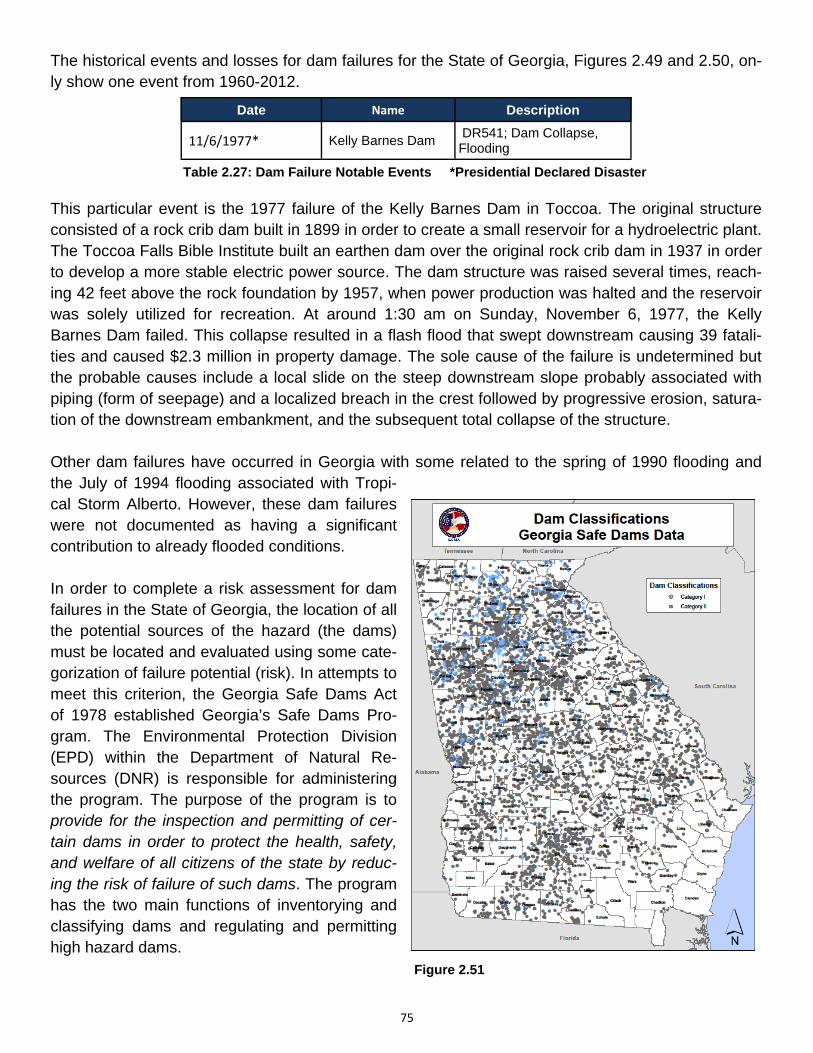
75
The historical events and losses for dam failures for the State of Georgia, Figures 2.49 and 2.50, on-ly show one event from 1960-2012.
Table 2.27: Dam Failure Notable Events *Presidential Declared Disaster
This particular event is the 1977 failure of the Kelly Barnes Dam in Toccoa. The original structure consisted of a rock crib dam built in 1899 in order to create a small reservoir for a hydroelectric plant. The Toccoa Falls Bible Institute built an earthen dam over the original rock crib dam in 1937 in order to develop a more stable electric power source. The dam structure was raised several times, reach-ing 42 feet above the rock foundation by 1957, when power production was halted and the reservoir was solely utilized for recreation. At around 1:30 am on Sunday, November 6, 1977, the Kelly Barnes Dam failed. This collapse resulted in a flash flood that swept downstream causing 39 fatali-ties and caused $2.3 million in property damage. The sole cause of the failure is undetermined but the probable causes include a local slide on the steep downstream slope probably associated with piping (form of seepage) and a localized breach in the crest followed by progressive erosion, satura-tion of the downstream embankment, and the subsequent total collapse of the structure. Other dam failures have occurred in Georgia with some related to the spring of 1990 flooding and the July of 1994 flooding associated with Tropi-cal Storm Alberto. However, these dam failures were not documented as having a significant contribution to already flooded conditions. In order to complete a risk assessment for dam failures in the State of Georgia, the location of all the potential sources of the hazard (the dams) must be located and evaluated using some cate-gorization of failure potential (risk). In attempts to meet this criterion, the Georgia Safe Dams Act of 1978 established Georgia’s Safe Dams Pro-gram. The Environmental Protection Division (EPD) within the Department of Natural Re-sources (DNR) is responsible for administering the program. The purpose of the program is to provide for the inspection and permitting of cer-tain dams in order to protect the health, safety, and welfare of all citizens of the state by reduc-ing the risk of failure of such dams. The program has the two main functions of inventorying and classifying dams and regulating and permitting high hazard dams.
Date Name Description
11/6/1977* Kelly Barnes Dam DR541; Dam Collapse, Flooding
Figure 2.51
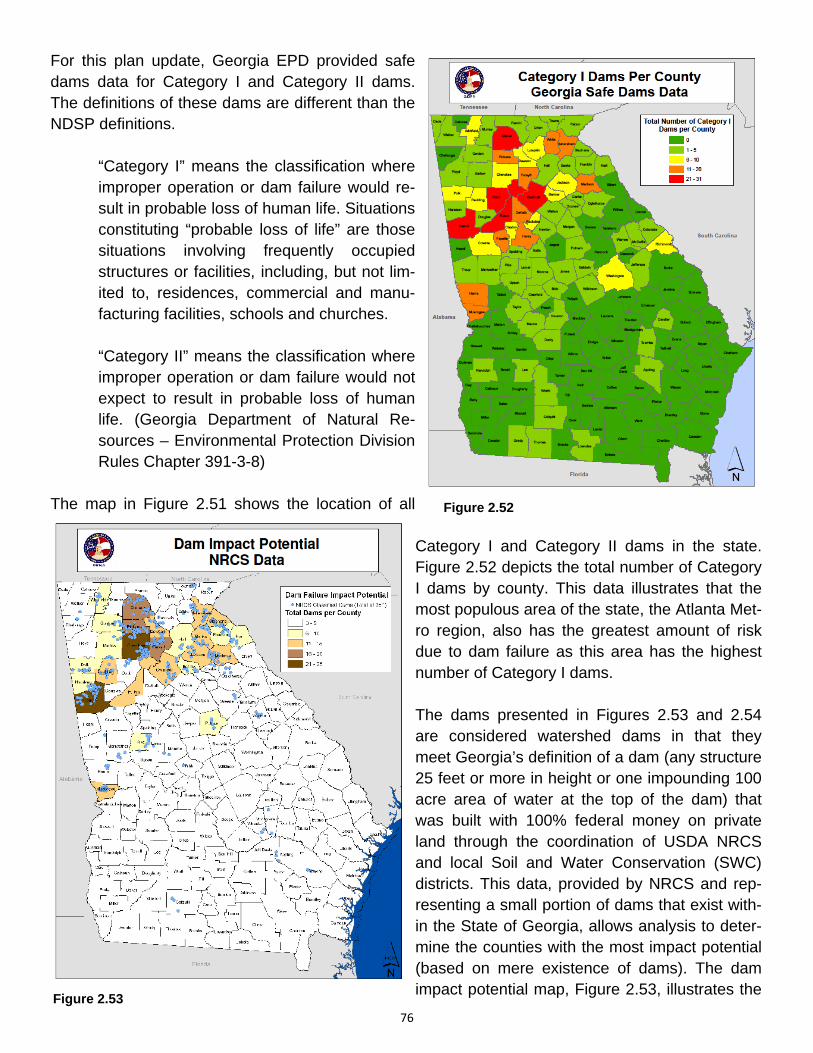
76
For this plan update, Georgia EPD provided safe dams data for Category I and Category II dams. The definitions of these dams are different than the NDSP definitions.
“Category I” means the classification where improper operation or dam failure would re-sult in probable loss of human life. Situations constituting “probable loss of life” are those situations involving frequently occupied structures or facilities, including, but not lim-ited to, residences, commercial and manu-facturing facilities, schools and churches.
“Category II” means the classification where improper operation or dam failure would not expect to result in probable loss of human life. (Georgia Department of Natural Re-sources – Environmental Protection Division Rules Chapter 391-3-8)
The map in Figure 2.51 shows the location of all
Category I and Category II dams in the state. Figure 2.52 depicts the total number of Category I dams by county. This data illustrates that the most populous area of the state, the Atlanta Met-ro region, also has the greatest amount of risk due to dam failure as this area has the highest number of Category I dams. The dams presented in Figures 2.53 and 2.54 are considered watershed dams in that they meet Georgia’s definition of a dam (any structure 25 feet or more in height or one impounding 100 acre area of water at the top of the dam) that was built with 100% federal money on private land through the coordination of USDA NRCS and local Soil and Water Conservation (SWC) districts. This data, provided by NRCS and rep-resenting a small portion of dams that exist with-in the State of Georgia, allows analysis to deter-mine the counties with the most impact potential (based on mere existence of dams). The dam impact potential map, Figure 2.53, illustrates the
Figure 2.52
Figure 2.53
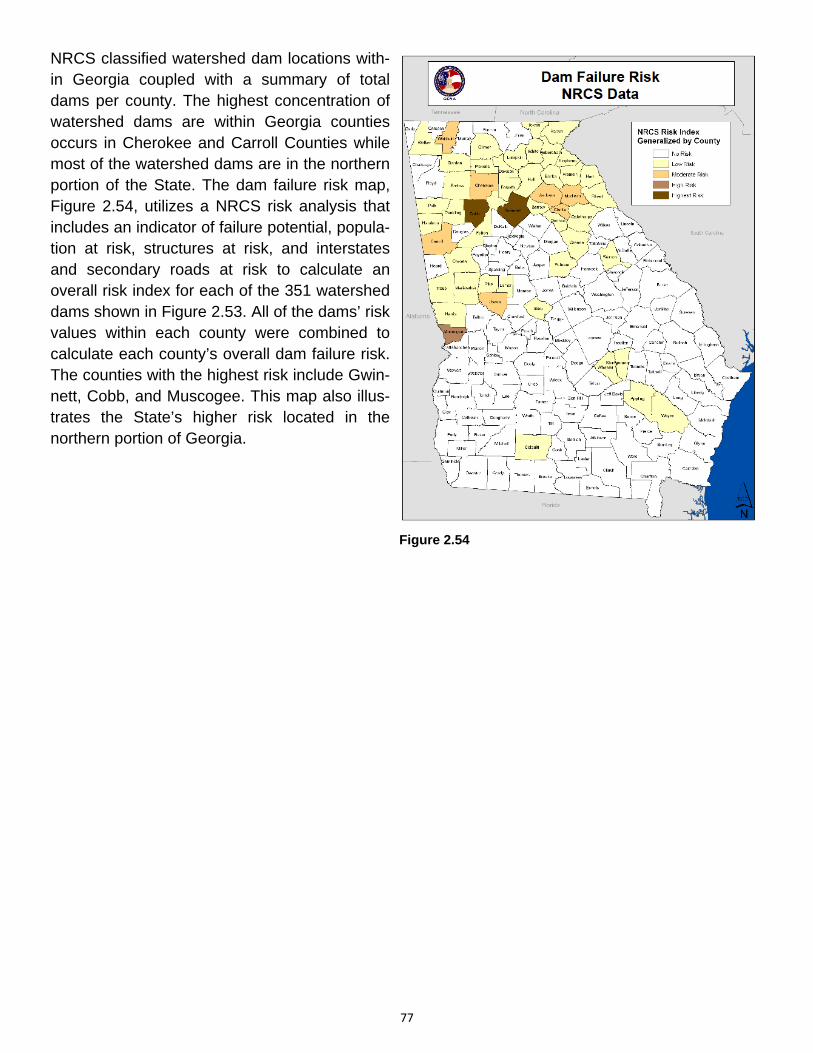
77
NRCS classified watershed dam locations with-in Georgia coupled with a summary of total dams per county. The highest concentration of watershed dams are within Georgia counties occurs in Cherokee and Carroll Counties while most of the watershed dams are in the northern portion of the State. The dam failure risk map, Figure 2.54, utilizes a NRCS risk analysis that includes an indicator of failure potential, popula-tion at risk, structures at risk, and interstates and secondary roads at risk to calculate an overall risk index for each of the 351 watershed dams shown in Figure 2.53. All of the dams’ risk values within each county were combined to calculate each county’s overall dam failure risk. The counties with the highest risk include Gwin-nett, Cobb, and Muscogee. This map also illus-trates the State’s higher risk located in the northern portion of Georgia.
Figure 2.54
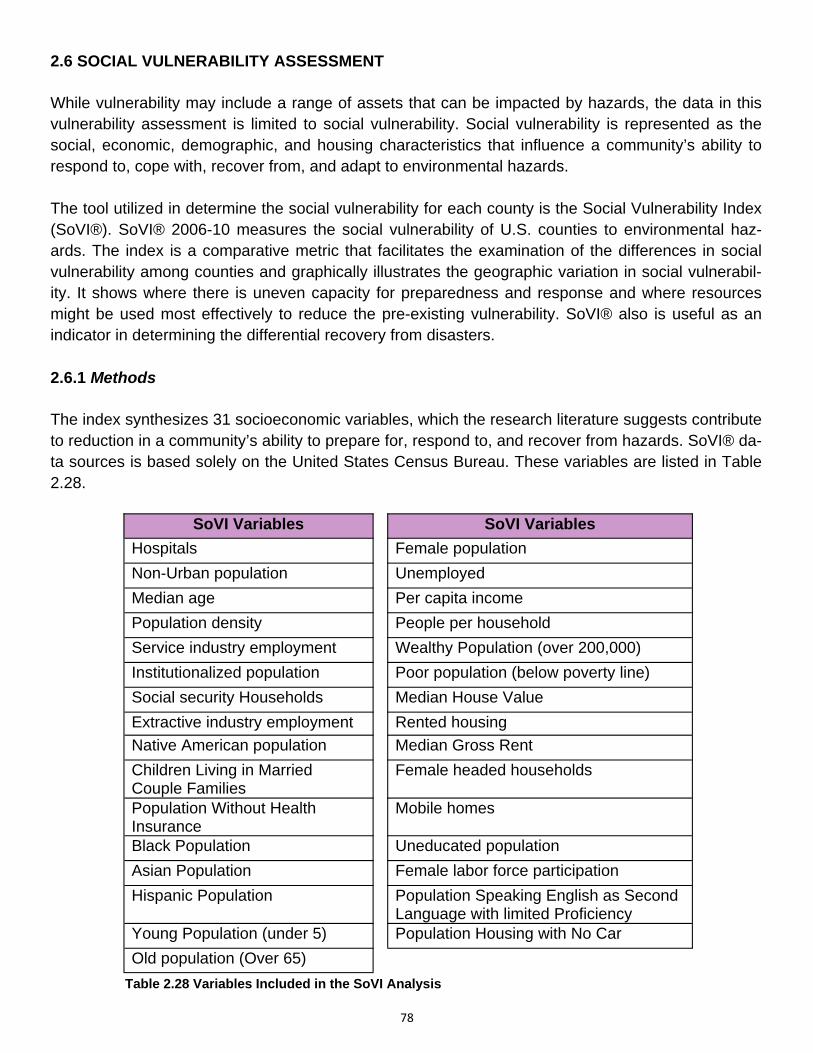
78
2.6 SOCIAL VULNERABILITY ASSESSMENT While vulnerability may include a range of assets that can be impacted by hazards, the data in this vulnerability assessment is limited to social vulnerability. Social vulnerability is represented as the social, economic, demographic, and housing characteristics that influence a community’s ability to respond to, cope with, recover from, and adapt to environmental hazards. The tool utilized in determine the social vulnerability for each county is the Social Vulnerability Index (SoVI®). SoVI® 2006-10 measures the social vulnerability of U.S. counties to environmental haz-ards. The index is a comparative metric that facilitates the examination of the differences in social vulnerability among counties and graphically illustrates the geographic variation in social vulnerabil-ity. It shows where there is uneven capacity for preparedness and response and where resources might be used most effectively to reduce the pre-existing vulnerability. SoVI® also is useful as an indicator in determining the differential recovery from disasters. 2.6.1 Methods The index synthesizes 31 socioeconomic variables, which the research literature suggests contribute to reduction in a community’s ability to prepare for, respond to, and recover from hazards. SoVI® da-ta sources is based solely on the United States Census Bureau. These variables are listed in Table 2.28.
SoVI Variables SoVI Variables
Hospitals Female population
Non-Urban population Unemployed
Median age Per capita income
Population density People per household
Service industry employment Wealthy Population (over 200,000)
Institutionalized population Poor population (below poverty line)
Social security Households Median House Value
Extractive industry employment Rented housing
Native American population Median Gross Rent
Children Living in Married Couple Families
Female headed households
Population Without Health Insurance
Mobile homes
Black Population Uneducated population
Asian Population Female labor force participation
Hispanic Population Population Speaking English as Second Language with limited Proficiency
Young Population (under 5) Population Housing with No Car
Old population (Over 65)
Table 2.28 Variables Included in the SoVI Analysis
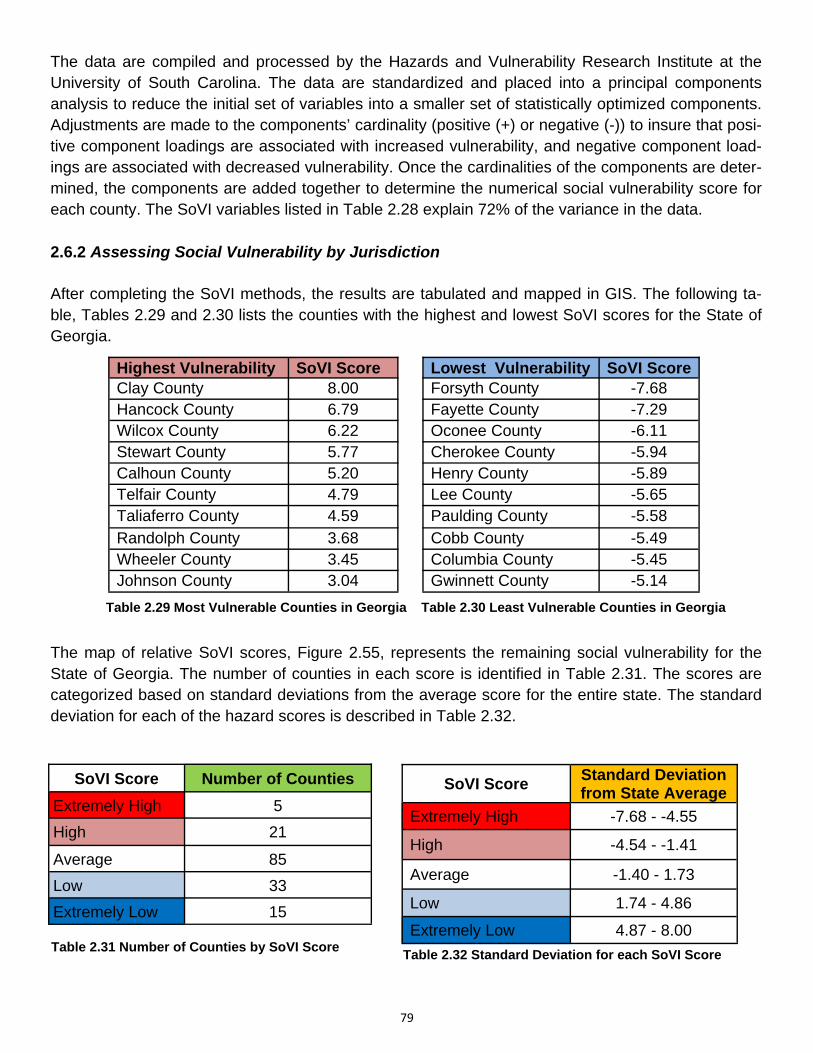
79
The data are compiled and processed by the Hazards and Vulnerability Research Institute at the University of South Carolina. The data are standardized and placed into a principal components analysis to reduce the initial set of variables into a smaller set of statistically optimized components. Adjustments are made to the components’ cardinality (positive (+) or negative (-)) to insure that posi-tive component loadings are associated with increased vulnerability, and negative component load-ings are associated with decreased vulnerability. Once the cardinalities of the components are deter-mined, the components are added together to determine the numerical social vulnerability score for each county. The SoVI variables listed in Table 2.28 explain 72% of the variance in the data. 2.6.2 Assessing Social Vulnerability by Jurisdiction After completing the SoVI methods, the results are tabulated and mapped in GIS. The following ta-ble, Tables 2.29 and 2.30 lists the counties with the highest and lowest SoVI scores for the State of Georgia.
The map of relative SoVI scores, Figure 2.55, represents the remaining social vulnerability for the State of Georgia. The number of counties in each score is identified in Table 2.31. The scores are categorized based on standard deviations from the average score for the entire state. The standard deviation for each of the hazard scores is described in Table 2.32.
Highest Vulnerability SoVI Score Lowest Vulnerability SoVI Score Clay County 8.00 Forsyth County -7.68 Hancock County 6.79 Fayette County -7.29 Wilcox County 6.22 Oconee County -6.11 Stewart County 5.77 Cherokee County -5.94 Calhoun County 5.20 Henry County -5.89 Telfair County 4.79 Lee County -5.65 Taliaferro County 4.59 Paulding County -5.58 Randolph County 3.68 Cobb County -5.49 Wheeler County 3.45 Columbia County -5.45 Johnson County 3.04 Gwinnett County -5.14
Table 2.29 Most Vulnerable Counties in Georgia Table 2.30 Least Vulnerable Counties in Georgia
SoVI Score Standard Deviation from State Average
Extremely High -7.68 - -4.55
High -4.54 - -1.41
Average -1.40 - 1.73
Low 1.74 - 4.86
Extremely Low 4.87 - 8.00
SoVI Score Number of Counties
Extremely High 5
High 21
Average 85
Low 33
Extremely Low 15
Table 2.31 Number of Counties by SoVI Score Table 2.32 Standard Deviation for each SoVI Score
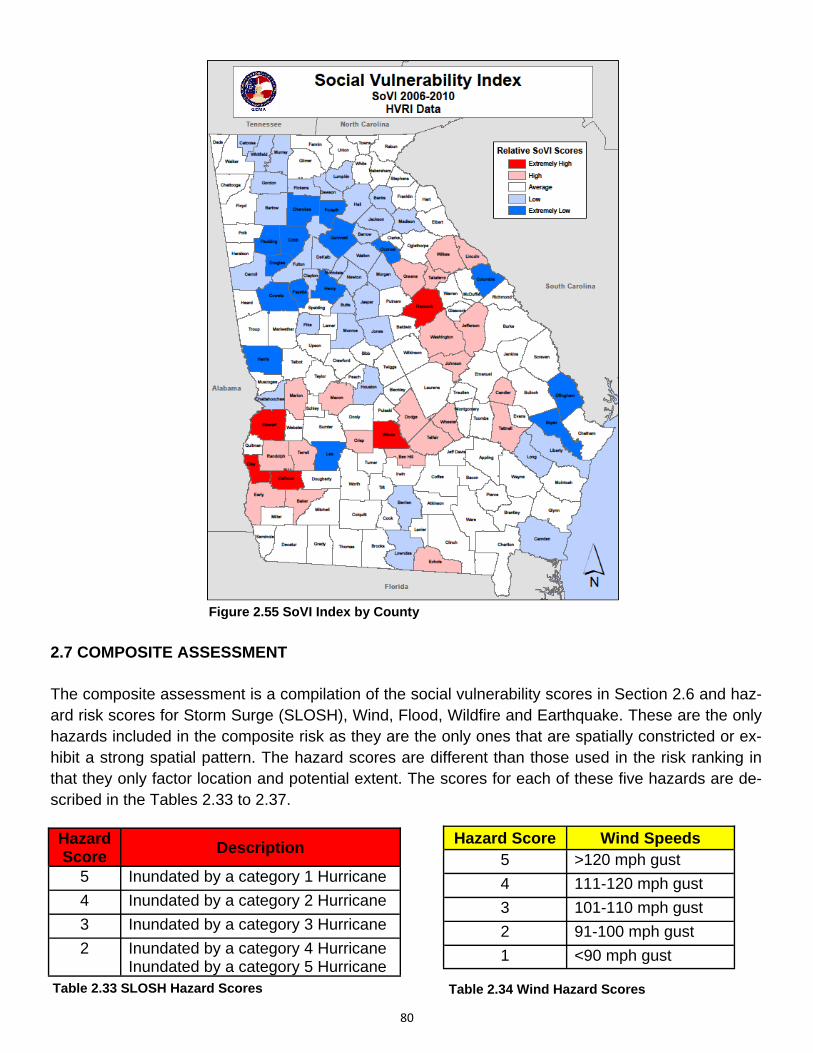
80
2.7 COMPOSITE ASSESSMENT The composite assessment is a compilation of the social vulnerability scores in Section 2.6 and haz-ard risk scores for Storm Surge (SLOSH), Wind, Flood, Wildfire and Earthquake. These are the only hazards included in the composite risk as they are the only ones that are spatially constricted or ex-hibit a strong spatial pattern. The hazard scores are different than those used in the risk ranking in that they only factor location and potential extent. The scores for each of these five hazards are de-scribed in the Tables 2.33 to 2.37.
Figure 2.55 SoVI Index by County
Hazard Score
Description
5 Inundated by a category 1 Hurricane
4 Inundated by a category 2 Hurricane
3 Inundated by a category 3 Hurricane
2 Inundated by a category 4 Hurricane Inundated by a category 5 Hurricane
Table 2.33 SLOSH Hazard Scores
Hazard Score Wind Speeds 5 >120 mph gust
4 111-120 mph gust
3 101-110 mph gust
2 91-100 mph gust
1 <90 mph gust
Table 2.34 Wind Hazard Scores
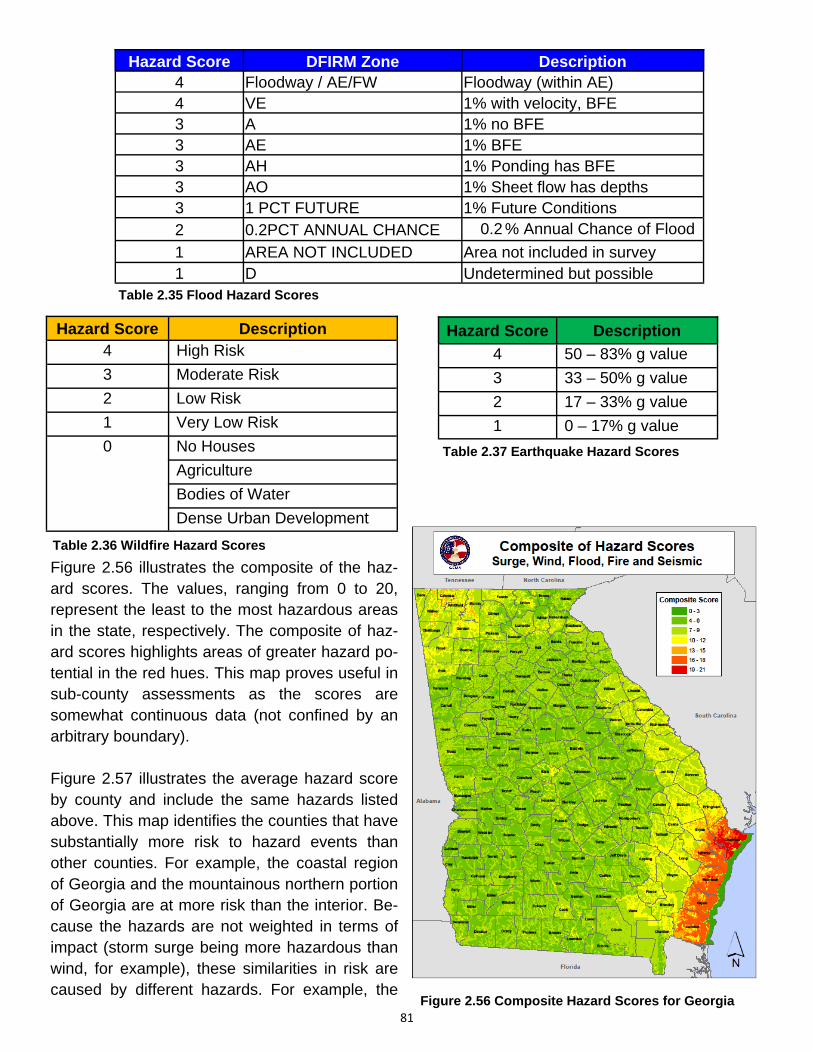
81
Figure 2.56 illustrates the composite of the haz-ard scores. The values, ranging from 0 to 20, represent the least to the most hazardous areas in the state, respectively. The composite of haz-ard scores highlights areas of greater hazard po-tential in the red hues. This map proves useful in sub-county assessments as the scores are somewhat continuous data (not confined by an arbitrary boundary). Figure 2.57 illustrates the average hazard score by county and include the same hazards listed above. This map identifies the counties that have substantially more risk to hazard events than other counties. For example, the coastal region of Georgia and the mountainous northern portion of Georgia are at more risk than the interior. Be-cause the hazards are not weighted in terms of impact (storm surge being more hazardous than wind, for example), these similarities in risk are caused by different hazards. For example, the
Hazard Score DFIRM Zone Description 4 Floodway / AE/FW Floodway (within AE) 4 VE 1% with velocity, BFE 3 A 1% no BFE 3 AE 1% BFE 3 AH 1% Ponding has BFE 3 AO 1% Sheet flow has depths 3 1 PCT FUTURE 1% Future Conditions 2 0.2PCT ANNUAL CHANCE 0.2 % Annual Chance of Flood
1 AREA NOT INCLUDED Area not included in survey 1 D Undetermined but possible
Hazard Score Description
4 High Risk
3 Moderate Risk
2 Low Risk
1 Very Low Risk
0 No Houses
Agriculture
Bodies of Water
Dense Urban Development
Hazard Score Description
4 50 – 83% g value
3 33 – 50% g value
2 17 – 33% g value
1 0 – 17% g value
Table 2.35 Flood Hazard Scores
Table 2.36 Wildfire Hazard Scores
Table 2.37 Earthquake Hazard Scores
Figure 2.56 Composite Hazard Scores for Georgia
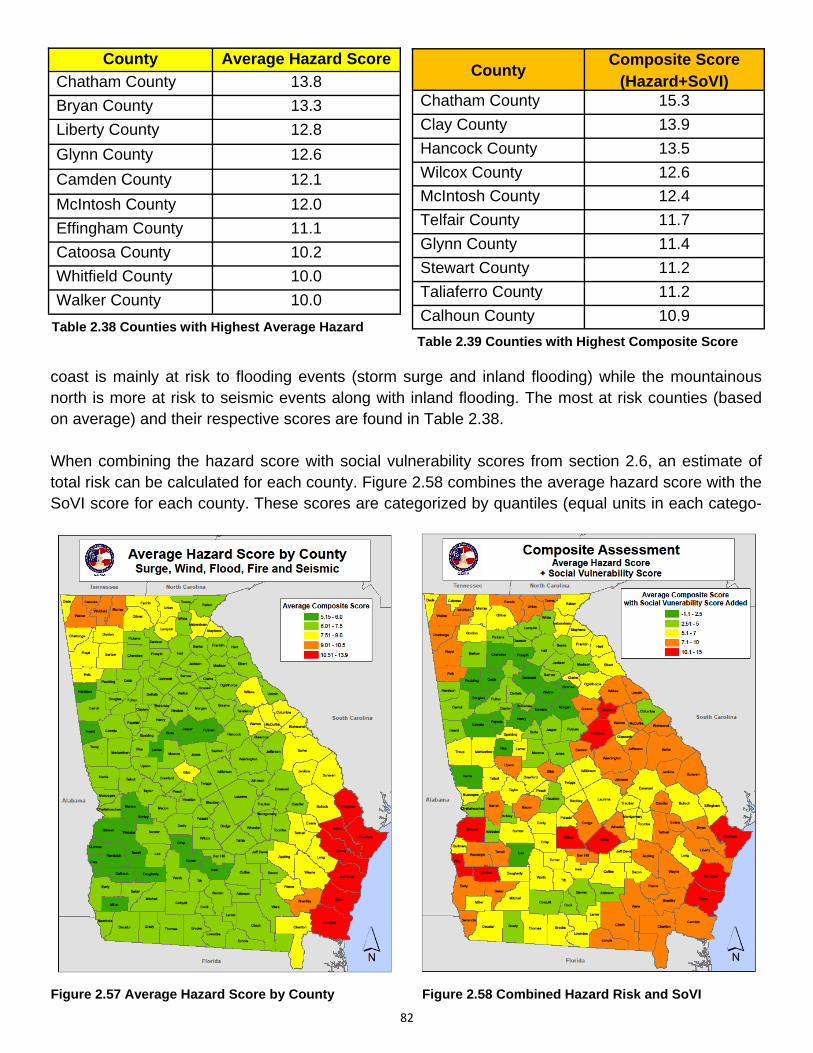
82
coast is mainly at risk to flooding events (storm surge and inland flooding) while the mountainous north is more at risk to seismic events along with inland flooding. The most at risk counties (based on average) and their respective scores are found in Table 2.38. When combining the hazard score with social vulnerability scores from section 2.6, an estimate of total risk can be calculated for each county. Figure 2.58 combines the average hazard score with the SoVI score for each county. These scores are categorized by quantiles (equal units in each catego-
Figure 2.57 Average Hazard Score by County
County Average Hazard Score
Chatham County 13.8
Bryan County 13.3
Liberty County 12.8
Glynn County 12.6
Camden County 12.1
McIntosh County 12.0
Effingham County 11.1
Catoosa County 10.2
Whitfield County 10.0
Walker County 10.0
Table 2.38 Counties with Highest Average Hazard
County Composite Score
(Hazard+SoVI) Chatham County 15.3
Clay County 13.9
Hancock County 13.5
Wilcox County 12.6
McIntosh County 12.4
Telfair County 11.7
Glynn County 11.4
Stewart County 11.2
Taliaferro County 11.2
Calhoun County 10.9
Table 2.39 Counties with Highest Composite Score
Figure 2.58 Combined Hazard Risk and SoVI
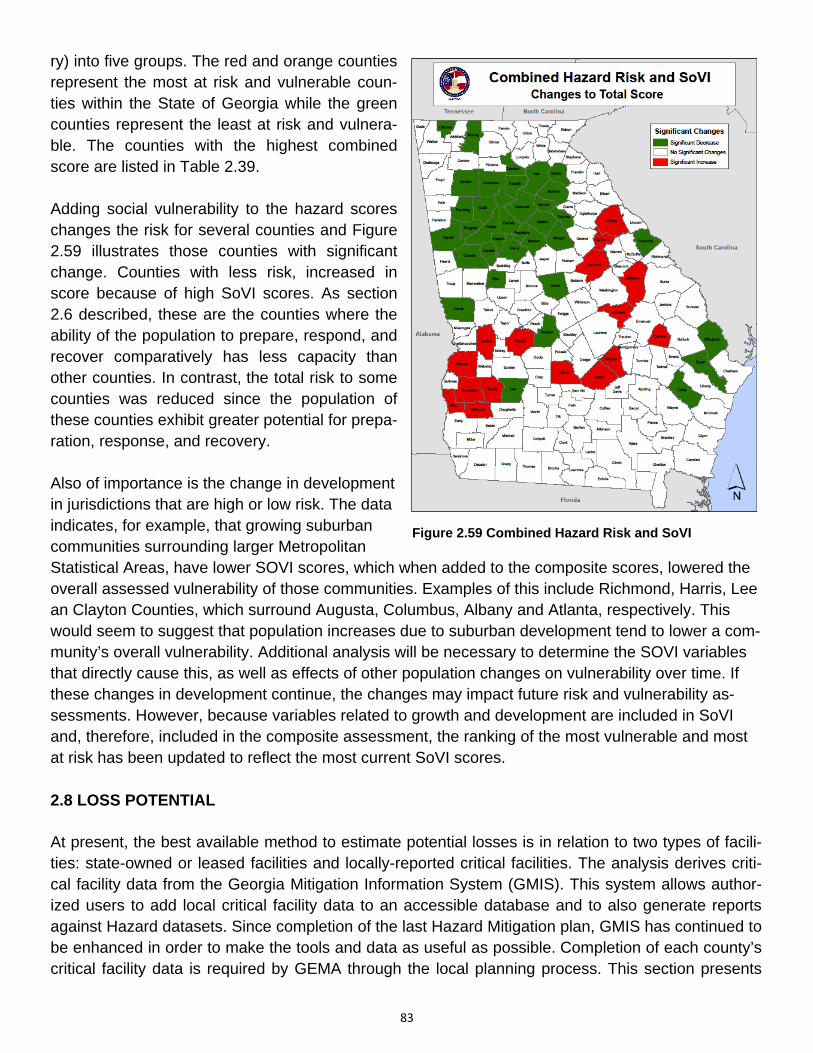
83
ry) into five groups. The red and orange counties represent the most at risk and vulnerable coun-ties within the State of Georgia while the green counties represent the least at risk and vulnera-ble. The counties with the highest combined score are listed in Table 2.39. Adding social vulnerability to the hazard scores changes the risk for several counties and Figure 2.59 illustrates those counties with significant change. Counties with less risk, increased in score because of high SoVI scores. As section 2.6 described, these are the counties where the ability of the population to prepare, respond, and recover comparatively has less capacity than other counties. In contrast, the total risk to some counties was reduced since the population of these counties exhibit greater potential for prepa-ration, response, and recovery. Also of importance is the change in development in jurisdictions that are high or low risk. The data indicates, for example, that growing suburban communities surrounding larger Metropolitan Statistical Areas, have lower SOVI scores, which when added to the composite scores, lowered the overall assessed vulnerability of those communities. Examples of this include Richmond, Harris, Lee an Clayton Counties, which surround Augusta, Columbus, Albany and Atlanta, respectively. This would seem to suggest that population increases due to suburban development tend to lower a com-munity’s overall vulnerability. Additional analysis will be necessary to determine the SOVI variables that directly cause this, as well as effects of other population changes on vulnerability over time. If these changes in development continue, the changes may impact future risk and vulnerability as-sessments. However, because variables related to growth and development are included in SoVI and, therefore, included in the composite assessment, the ranking of the most vulnerable and most at risk has been updated to reflect the most current SoVI scores. 2.8 LOSS POTENTIAL At present, the best available method to estimate potential losses is in relation to two types of facili-ties: state-owned or leased facilities and locally-reported critical facilities. The analysis derives criti-cal facility data from the Georgia Mitigation Information System (GMIS). This system allows author-ized users to add local critical facility data to an accessible database and to also generate reports against Hazard datasets. Since completion of the last Hazard Mitigation plan, GMIS has continued to be enhanced in order to make the tools and data as useful as possible. Completion of each county’s critical facility data is required by GEMA through the local planning process. This section presents
Figure 2.59 Combined Hazard Risk and SoVI
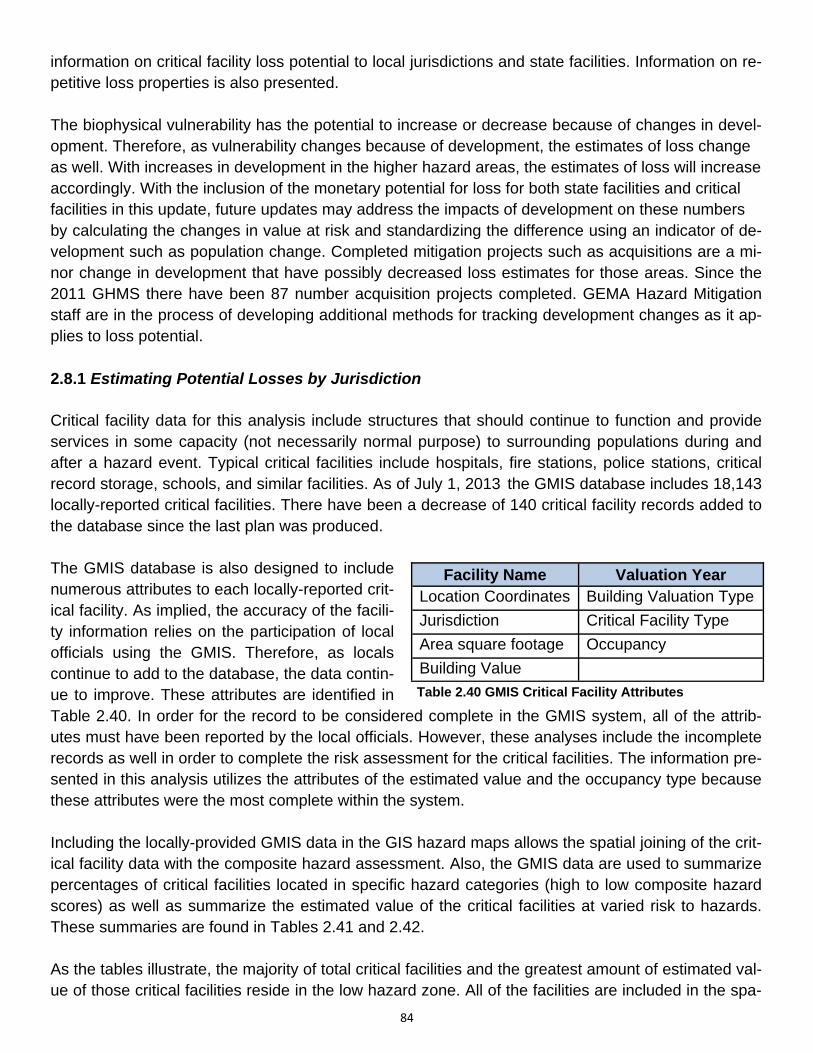
84
information on critical facility loss potential to local jurisdictions and state facilities. Information on re-petitive loss properties is also presented. The biophysical vulnerability has the potential to increase or decrease because of changes in devel-opment. Therefore, as vulnerability changes because of development, the estimates of loss change as well. With increases in development in the higher hazard areas, the estimates of loss will increase accordingly. With the inclusion of the monetary potential for loss for both state facilities and critical facilities in this update, future updates may address the impacts of development on these numbers by calculating the changes in value at risk and standardizing the difference using an indicator of de-velopment such as population change. Completed mitigation projects such as acquisitions are a mi-nor change in development that have possibly decreased loss estimates for those areas. Since the 2011 GHMS there have been 87 number acquisition projects completed. GEMA Hazard Mitigation staff are in the process of developing additional methods for tracking development changes as it ap-plies to loss potential. 2.8.1 Estimating Potential Losses by Jurisdiction Critical facility data for this analysis include structures that should continue to function and provide services in some capacity (not necessarily normal purpose) to surrounding populations during and after a hazard event. Typical critical facilities include hospitals, fire stations, police stations, critical record storage, schools, and similar facilities. As of July 1, 2013 the GMIS database includes 18,143 locally-reported critical facilities. There have been a decrease of 140 critical facility records added to the database since the last plan was produced. The GMIS database is also designed to include numerous attributes to each locally-reported crit-ical facility. As implied, the accuracy of the facili-ty information relies on the participation of local officials using the GMIS. Therefore, as locals continue to add to the database, the data contin-ue to improve. These attributes are identified in Table 2.40. In order for the record to be considered complete in the GMIS system, all of the attrib-utes must have been reported by the local officials. However, these analyses include the incomplete records as well in order to complete the risk assessment for the critical facilities. The information pre-sented in this analysis utilizes the attributes of the estimated value and the occupancy type because these attributes were the most complete within the system. Including the locally-provided GMIS data in the GIS hazard maps allows the spatial joining of the crit-ical facility data with the composite hazard assessment. Also, the GMIS data are used to summarize percentages of critical facilities located in specific hazard categories (high to low composite hazard scores) as well as summarize the estimated value of the critical facilities at varied risk to hazards. These summaries are found in Tables 2.41 and 2.42. As the tables illustrate, the majority of total critical facilities and the greatest amount of estimated val-ue of those critical facilities reside in the low hazard zone. All of the facilities are included in the spa-
Facility Name Valuation Year Location Coordinates Building Valuation Type
Jurisdiction Critical Facility Type
Area square footage Occupancy
Building Value
Table 2.40 GMIS Critical Facility Attributes
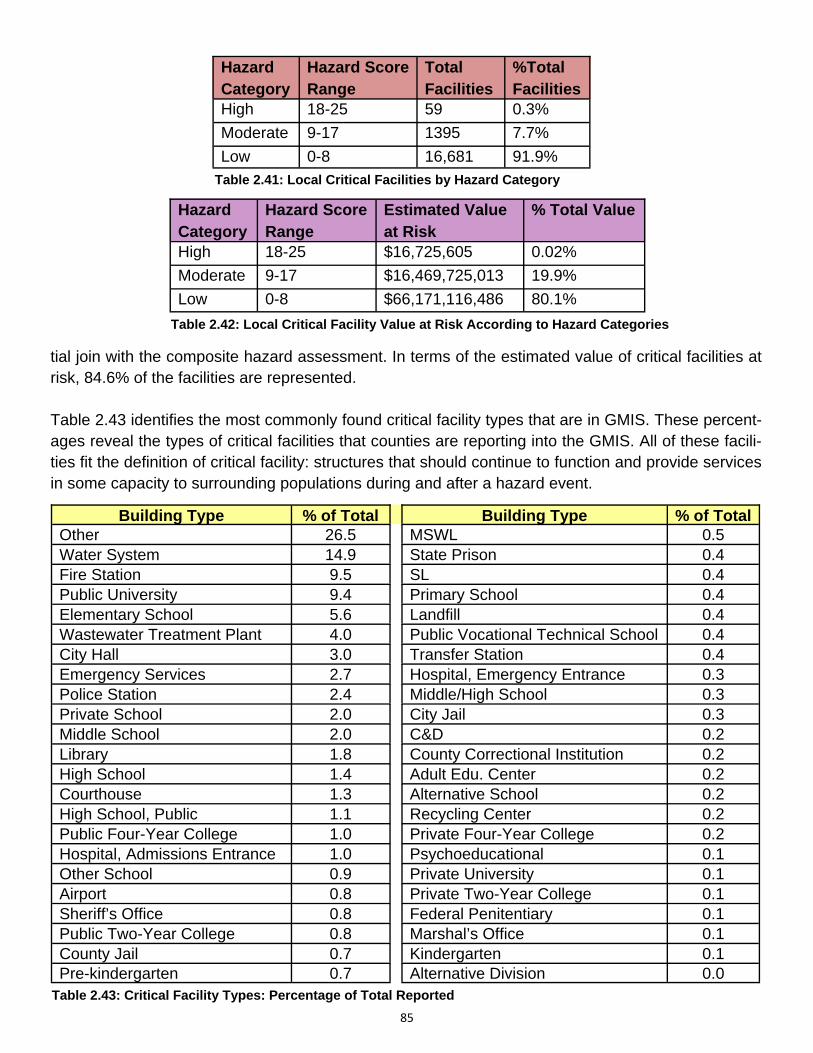
85
tial join with the composite hazard assessment. In terms of the estimated value of critical facilities at risk, 84.6% of the facilities are represented. Table 2.43 identifies the most commonly found critical facility types that are in GMIS. These percent-ages reveal the types of critical facilities that counties are reporting into the GMIS. All of these facili-ties fit the definition of critical facility: structures that should continue to function and provide services in some capacity to surrounding populations during and after a hazard event.
Building Type % of Total Building Type % of Total Other 26.5 MSWL 0.5 Water System 14.9 State Prison 0.4 Fire Station 9.5 SL 0.4 Public University 9.4 Primary School 0.4 Elementary School 5.6 Landfill 0.4 Wastewater Treatment Plant 4.0 Public Vocational Technical School 0.4 City Hall 3.0 Transfer Station 0.4 Emergency Services 2.7 Hospital, Emergency Entrance 0.3 Police Station 2.4 Middle/High School 0.3 Private School 2.0 City Jail 0.3 Middle School 2.0 C&D 0.2 Library 1.8 County Correctional Institution 0.2 High School 1.4 Adult Edu. Center 0.2 Courthouse 1.3 Alternative School 0.2 High School, Public 1.1 Recycling Center 0.2 Public Four-Year College 1.0 Private Four-Year College 0.2 Hospital, Admissions Entrance 1.0 Psychoeducational 0.1 Other School 0.9 Private University 0.1 Airport 0.8 Private Two-Year College 0.1 Sheriff’s Office 0.8 Federal Penitentiary 0.1 Public Two-Year College 0.8 Marshal’s Office 0.1 County Jail 0.7 Kindergarten 0.1 Pre-kindergarten 0.7 Alternative Division 0.0
Table 2.43: Critical Facility Types: Percentage of Total Reported
Hazard Category
Hazard Score Range
Total Facilities
%Total Facilities
High 18-25 59 0.3%
Moderate 9-17 1395 7.7%
Low 0-8 16,681 91.9%
Table 2.41: Local Critical Facilities by Hazard Category
Hazard Category
Hazard Score Range
Estimated Value at Risk
% Total Value
High 18-25 $16,725,605 0.02%
Moderate 9-17 $16,469,725,013 19.9%
Low 0-8 $66,171,116,486 80.1%
Table 2.42: Local Critical Facility Value at Risk According to Hazard Categories
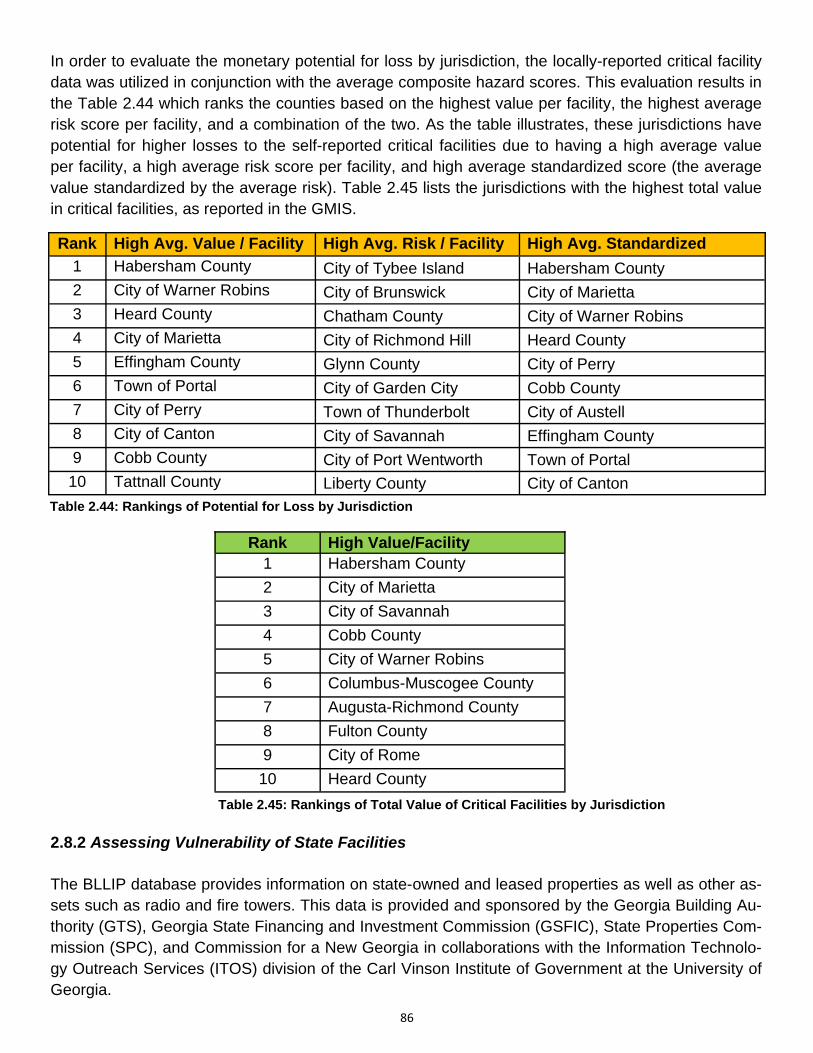
86
In order to evaluate the monetary potential for loss by jurisdiction, the locally-reported critical facility data was utilized in conjunction with the average composite hazard scores. This evaluation results in the Table 2.44 which ranks the counties based on the highest value per facility, the highest average risk score per facility, and a combination of the two. As the table illustrates, these jurisdictions have potential for higher losses to the self-reported critical facilities due to having a high average value per facility, a high average risk score per facility, and high average standardized score (the average value standardized by the average risk). Table 2.45 lists the jurisdictions with the highest total value in critical facilities, as reported in the GMIS.
2.8.2 Assessing Vulnerability of State Facilities The BLLIP database provides information on state-owned and leased properties as well as other as-sets such as radio and fire towers. This data is provided and sponsored by the Georgia Building Au-thority (GTS), Georgia State Financing and Investment Commission (GSFIC), State Properties Com-mission (SPC), and Commission for a New Georgia in collaborations with the Information Technolo-gy Outreach Services (ITOS) division of the Carl Vinson Institute of Government at the University of Georgia.
Rank High Value/Facility 1 Habersham County
2 City of Marietta
3 City of Savannah
4 Cobb County
5 City of Warner Robins
6 Columbus-Muscogee County
7 Augusta-Richmond County
8 Fulton County
9 City of Rome
10 Heard County
Table 2.45: Rankings of Total Value of Critical Facilities by Jurisdiction
Rank High Avg. Value / Facility High Avg. Risk / Facility High Avg. Standardized
1 Habersham County City of Tybee Island Habersham County 2 City of Warner Robins City of Brunswick City of Marietta 3 Heard County Chatham County City of Warner Robins 4 City of Marietta City of Richmond Hill Heard County 5 Effingham County Glynn County City of Perry 6 Town of Portal City of Garden City Cobb County 7 City of Perry Town of Thunderbolt City of Austell 8 City of Canton City of Savannah Effingham County 9 Cobb County City of Port Wentworth Town of Portal 10 Tattnall County Liberty County City of Canton
Table 2.44: Rankings of Potential for Loss by Jurisdiction
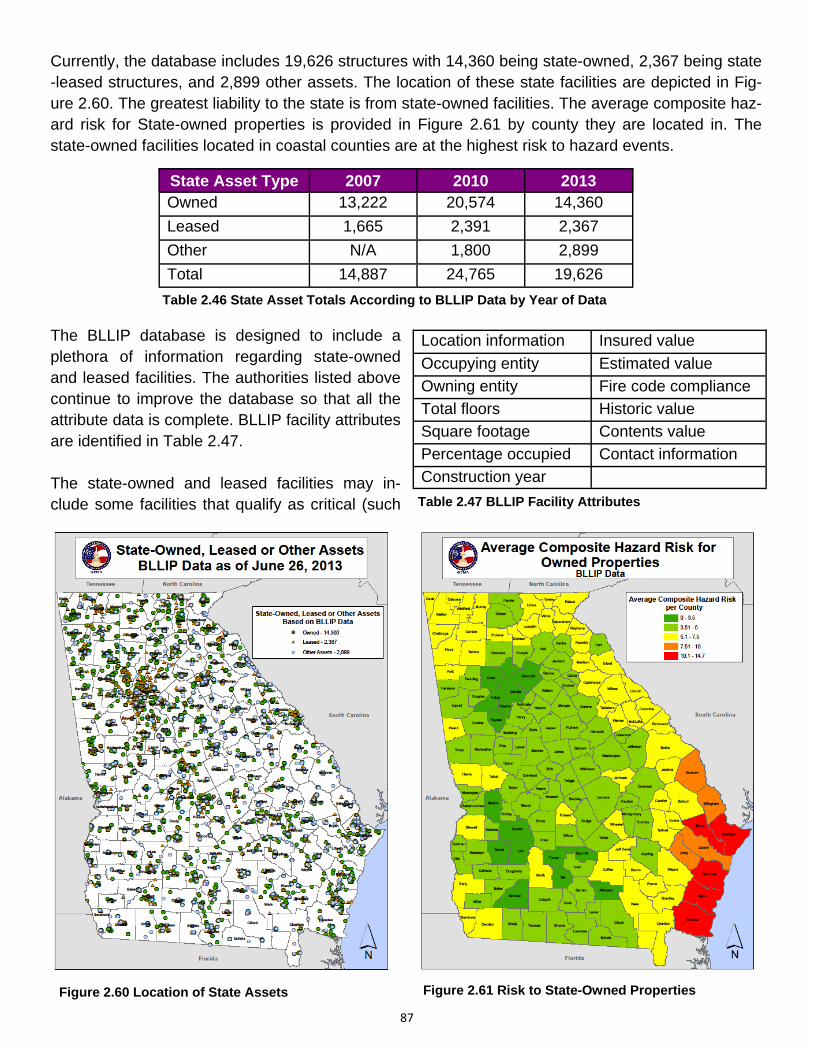
87
Currently, the database includes 19,626 structures with 14,360 being state-owned, 2,367 being state-leased structures, and 2,899 other assets. The location of these state facilities are depicted in Fig-ure 2.60. The greatest liability to the state is from state-owned facilities. The average composite haz-ard risk for State-owned properties is provided in Figure 2.61 by county they are located in. The state-owned facilities located in coastal counties are at the highest risk to hazard events.
The BLLIP database is designed to include a plethora of information regarding state-owned and leased facilities. The authorities listed above continue to improve the database so that all the attribute data is complete. BLLIP facility attributes are identified in Table 2.47. The state-owned and leased facilities may in-clude some facilities that qualify as critical (such
Figure 2.60 Location of State Assets Figure 2.61 Risk to State-Owned Properties
State Asset Type 2010 2013 Owned 20,574 14,360
Leased 2,391 2,367
Other 1,800 2,899
Total 24,765 19,626
2007 13,222
1,665
N/A
14,887
Table 2.46 State Asset Totals According to BLLIP Data by Year of Data
Location information Insured value
Occupying entity Estimated value
Owning entity Fire code compliance
Total floors Historic value
Square footage Contents value
Percentage occupied Contact information
Construction year
Table 2.47 BLLIP Facility Attributes
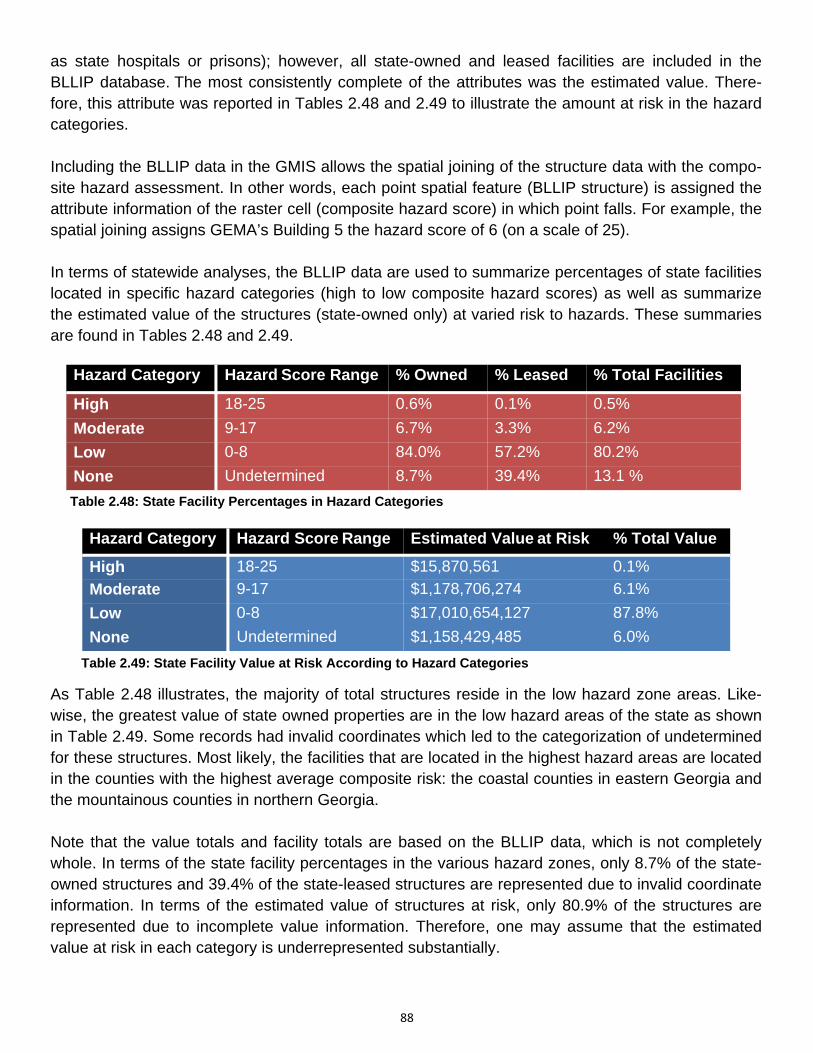
88
as state hospitals or prisons); however, all state-owned and leased facilities are included in the BLLIP database. The most consistently complete of the attributes was the estimated value. There-fore, this attribute was reported in Tables 2.48 and 2.49 to illustrate the amount at risk in the hazard categories. Including the BLLIP data in the GMIS allows the spatial joining of the structure data with the compo-site hazard assessment. In other words, each point spatial feature (BLLIP structure) is assigned the attribute information of the raster cell (composite hazard score) in which point falls. For example, the spatial joining assigns GEMA’s Building 5 the hazard score of 6 (on a scale of 25). In terms of statewide analyses, the BLLIP data are used to summarize percentages of state facilities located in specific hazard categories (high to low composite hazard scores) as well as summarize the estimated value of the structures (state-owned only) at varied risk to hazards. These summaries are found in Tables 2.48 and 2.49.
As Table 2.48 illustrates, the majority of total structures reside in the low hazard zone areas. Like-wise, the greatest value of state owned properties are in the low hazard areas of the state as shown in Table 2.49. Some records had invalid coordinates which led to the categorization of undetermined for these structures. Most likely, the facilities that are located in the highest hazard areas are located in the counties with the highest average composite risk: the coastal counties in eastern Georgia and the mountainous counties in northern Georgia. Note that the value totals and facility totals are based on the BLLIP data, which is not completely whole. In terms of the state facility percentages in the various hazard zones, only 8.7% of the state-owned structures and 39.4% of the state-leased structures are represented due to invalid coordinate information. In terms of the estimated value of structures at risk, only 80.9% of the structures are represented due to incomplete value information. Therefore, one may assume that the estimated value at risk in each category is underrepresented substantially.
Hazard Category Hazard Score Range % Owned % Leased % Total Facilities
High 18-25 0.6% 0.1% 0.5%
Moderate 9-17 6.7% 3.3% 6.2%
Low 0-8 84.0% 57.2% 80.2%
None Undetermined 8.7% 39.4% 13.1 %
Table 2.48: State Facility Percentages in Hazard Categories
Hazard Category Hazard Score Range Estimated Value at Risk % Total Value
High 18-25 $15,870,561 0.1%
Moderate 9-17 $1,178,706,274 6.1%
Low 0-8 $17,010,654,127 87.8%
None Undetermined $1,158,429,485 6.0%
Table 2.49: State Facility Value at Risk According to Hazard Categories
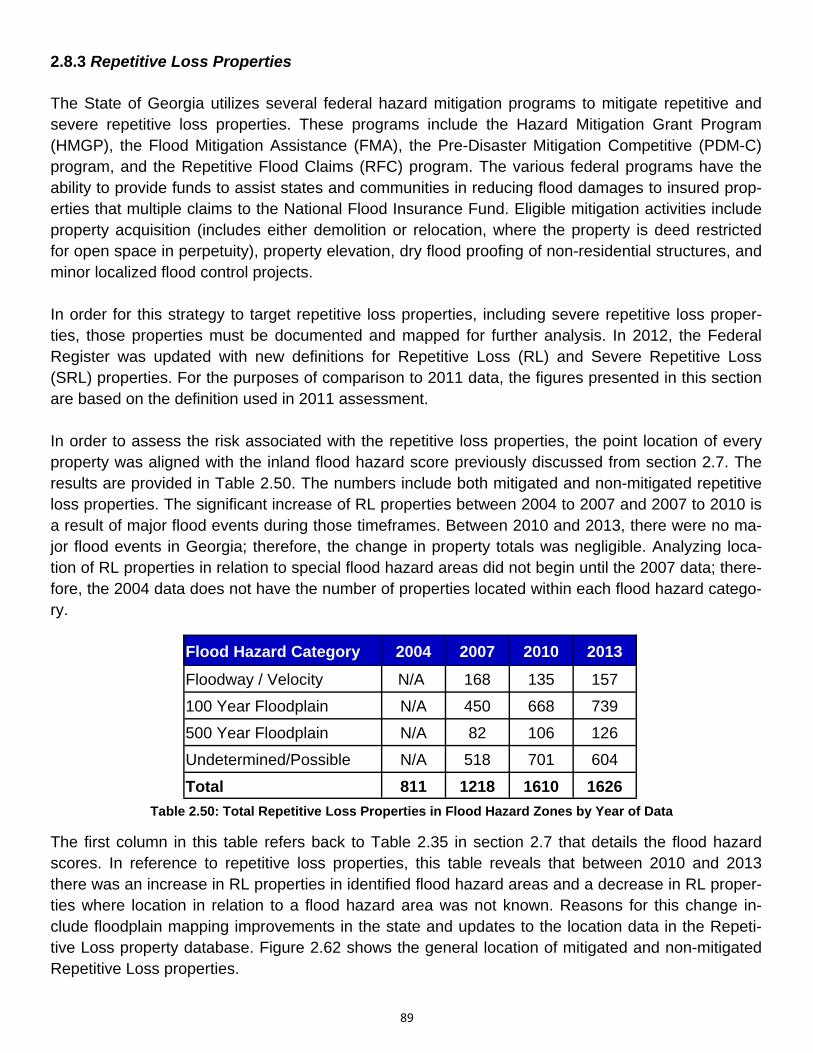
89
2.8.3 Repetitive Loss Properties The State of Georgia utilizes several federal hazard mitigation programs to mitigate repetitive and severe repetitive loss properties. These programs include the Hazard Mitigation Grant Program (HMGP), the Flood Mitigation Assistance (FMA), the Pre-Disaster Mitigation Competitive (PDM-C) program, and the Repetitive Flood Claims (RFC) program. The various federal programs have the ability to provide funds to assist states and communities in reducing flood damages to insured prop-erties that multiple claims to the National Flood Insurance Fund. Eligible mitigation activities include property acquisition (includes either demolition or relocation, where the property is deed restricted for open space in perpetuity), property elevation, dry flood proofing of non-residential structures, and minor localized flood control projects. In order for this strategy to target repetitive loss properties, including severe repetitive loss proper-ties, those properties must be documented and mapped for further analysis. In 2012, the Federal Register was updated with new definitions for Repetitive Loss (RL) and Severe Repetitive Loss (SRL) properties. For the purposes of comparison to 2011 data, the figures presented in this section are based on the definition used in 2011 assessment. In order to assess the risk associated with the repetitive loss properties, the point location of every property was aligned with the inland flood hazard score previously discussed from section 2.7. The results are provided in Table 2.50. The numbers include both mitigated and non-mitigated repetitive loss properties. The significant increase of RL properties between 2004 to 2007 and 2007 to 2010 is a result of major flood events during those timeframes. Between 2010 and 2013, there were no ma-jor flood events in Georgia; therefore, the change in property totals was negligible. Analyzing loca-tion of RL properties in relation to special flood hazard areas did not begin until the 2007 data; there-fore, the 2004 data does not have the number of properties located within each flood hazard catego-ry.
The first column in this table refers back to Table 2.35 in section 2.7 that details the flood hazard scores. In reference to repetitive loss properties, this table reveals that between 2010 and 2013 there was an increase in RL properties in identified flood hazard areas and a decrease in RL proper-ties where location in relation to a flood hazard area was not known. Reasons for this change in-clude floodplain mapping improvements in the state and updates to the location data in the Repeti-tive Loss property database. Figure 2.62 shows the general location of mitigated and non-mitigated Repetitive Loss properties.
Table 2.50: Total Repetitive Loss Properties in Flood Hazard Zones by Year of Data
Flood Hazard Category 2004 2007 2010 2013
Floodway / Velocity N/A 168 135 157
100 Year Floodplain N/A 450 668 739
500 Year Floodplain N/A 82 106 126
Undetermined/Possible N/A 518 701 604
Total 811 1218 1610 1626
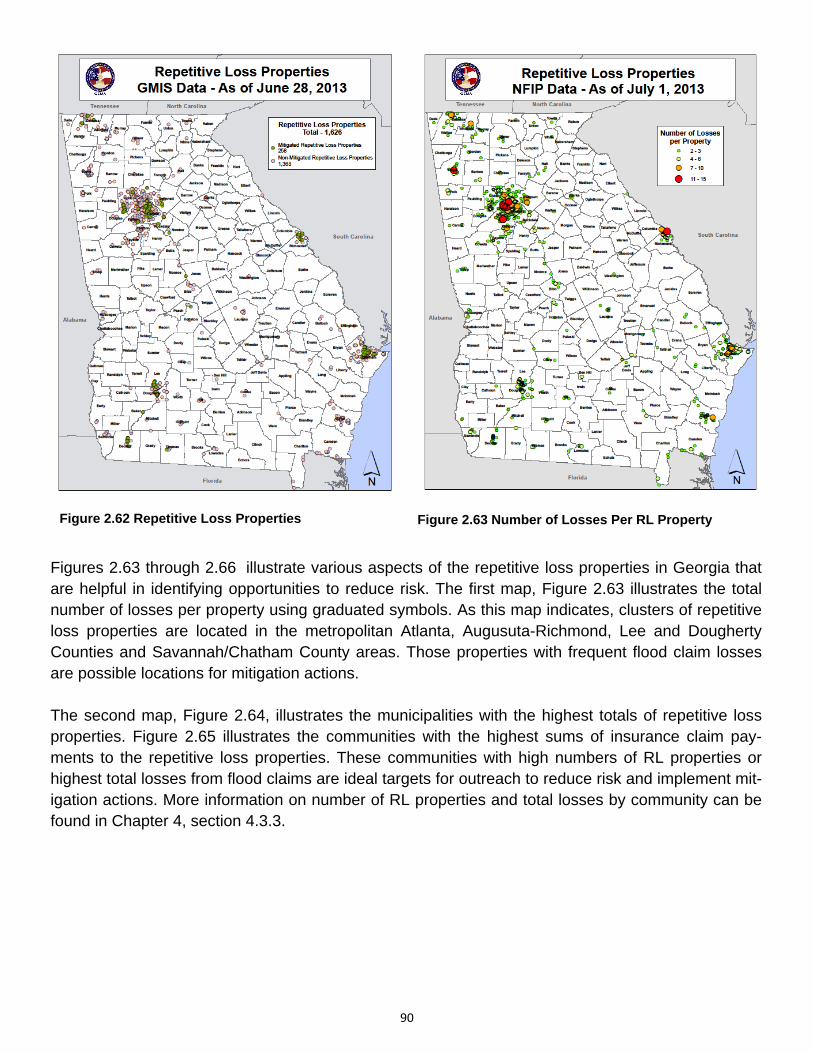
90
Figures 2.63 through 2.66 illustrate various aspects of the repetitive loss properties in Georgia that are helpful in identifying opportunities to reduce risk. The first map, Figure 2.63 illustrates the total number of losses per property using graduated symbols. As this map indicates, clusters of repetitive loss properties are located in the metropolitan Atlanta, Augusuta-Richmond, Lee and Dougherty Counties and Savannah/Chatham County areas. Those properties with frequent flood claim losses are possible locations for mitigation actions. The second map, Figure 2.64, illustrates the municipalities with the highest totals of repetitive loss properties. Figure 2.65 illustrates the communities with the highest sums of insurance claim pay-ments to the repetitive loss properties. These communities with high numbers of RL properties or highest total losses from flood claims are ideal targets for outreach to reduce risk and implement mit-igation actions. More information on number of RL properties and total losses by community can be found in Chapter 4, section 4.3.3.
Figure 2.63 Number of Losses Per RL Property Figure 2.62 Repetitive Loss Properties
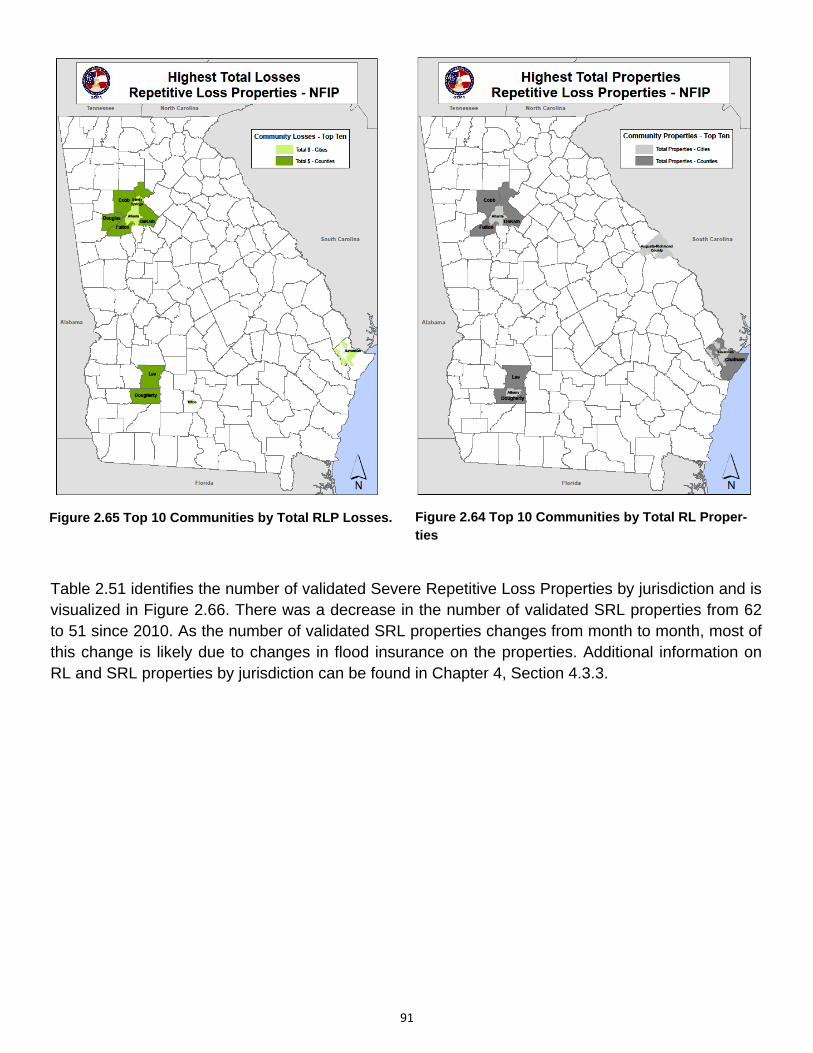
91
Table 2.51 identifies the number of validated Severe Repetitive Loss Properties by jurisdiction and is visualized in Figure 2.66. There was a decrease in the number of validated SRL properties from 62 to 51 since 2010. As the number of validated SRL properties changes from month to month, most of this change is likely due to changes in flood insurance on the properties. Additional information on RL and SRL properties by jurisdiction can be found in Chapter 4, Section 4.3.3.
Figure 2.65 Top 10 Communities by Total RLP Losses. Figure 2.64 Top 10 Communities by Total RL Proper-ties
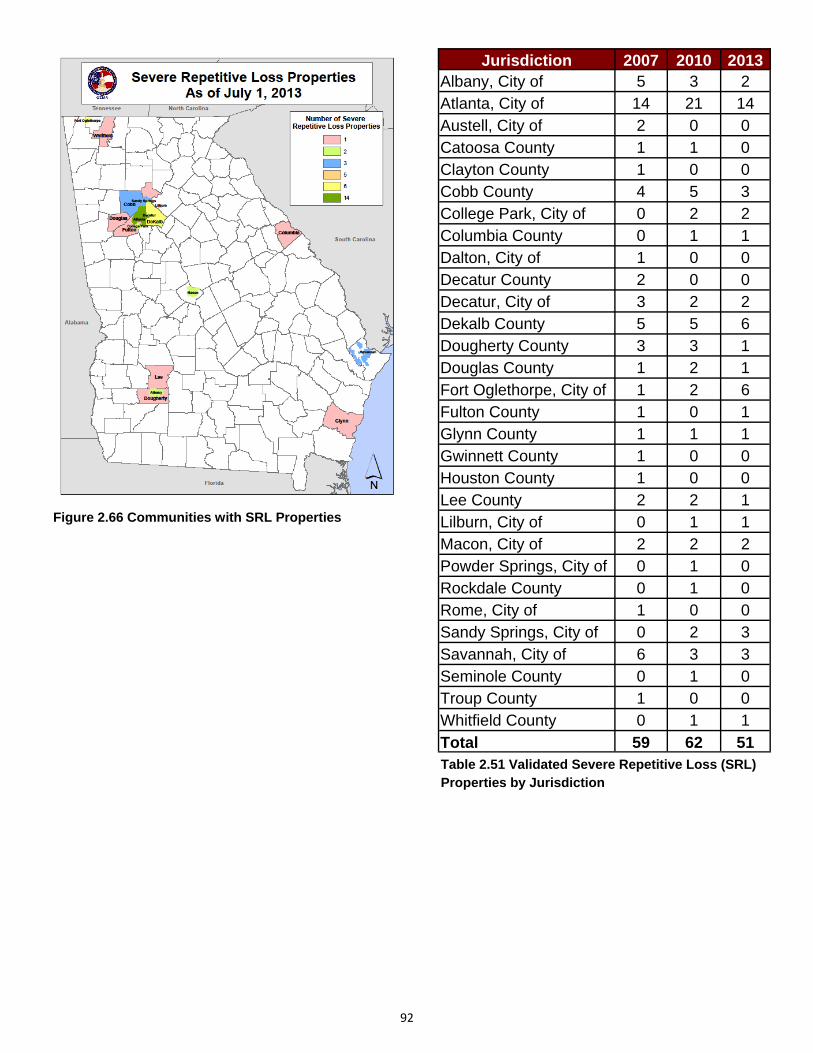
92
Jurisdiction 2007 2010 2013 Albany, City of 5 3 2 Atlanta, City of 14 21 14 Austell, City of 2 0 0 Catoosa County 1 1 0 Clayton County 1 0 0 Cobb County 4 5 3 College Park, City of 0 2 2 Columbia County 0 1 1 Dalton, City of 1 0 0 Decatur County 2 0 0 Decatur, City of 3 2 2 Dekalb County 5 5 6 Dougherty County 3 3 1 Douglas County 1 2 1 Fort Oglethorpe, City of 1 2 6 Fulton County 1 0 1 Glynn County 1 1 1 Gwinnett County 1 0 0 Houston County 1 0 0 Lee County 2 2 1 Lilburn, City of 0 1 1 Macon, City of 2 2 2 Powder Springs, City of 0 1 0 Rockdale County 0 1 0 Rome, City of 1 0 0 Sandy Springs, City of 0 2 3 Savannah, City of 6 3 3 Seminole County 0 1 0 Troup County 1 0 0 Whitfield County 0 1 1 Total 59 62 51 Table 2.51 Validated Severe Repetitive Loss (SRL) Properties by Jurisdiction
Figure 2.66 Communities with SRL Properties
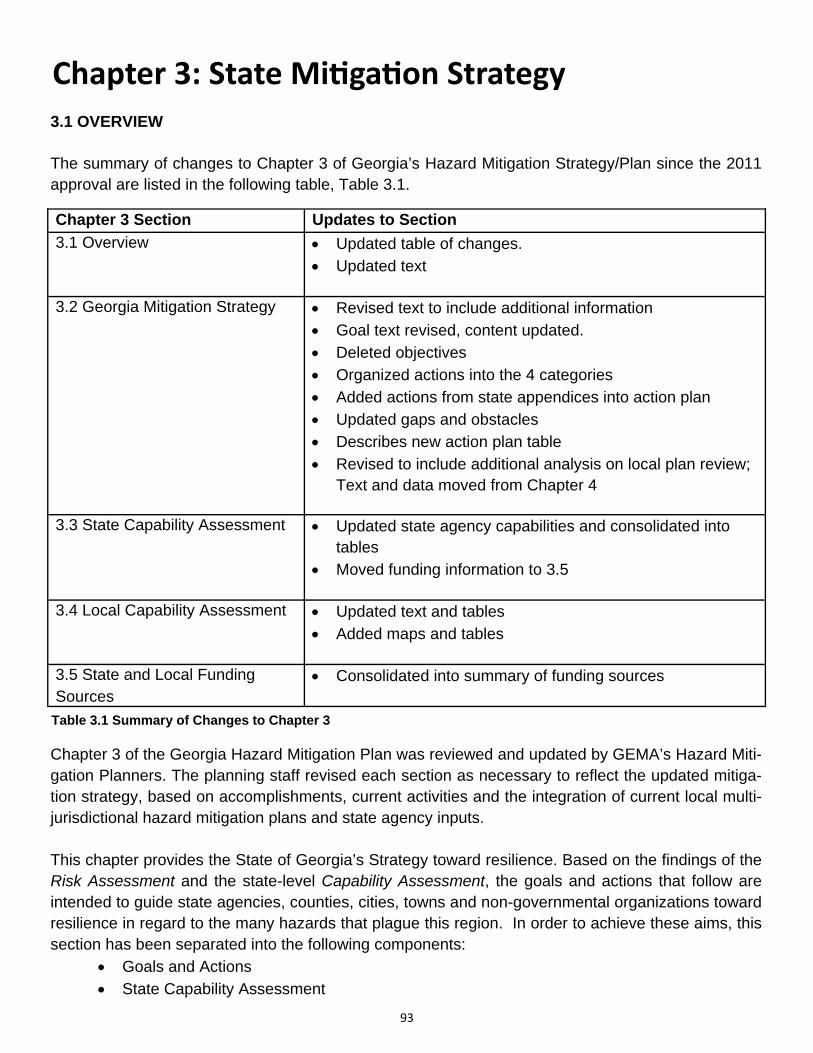
93
Chapter 3: State Mi ga on Strategy 3.1 OVERVIEW The summary of changes to Chapter 3 of Georgia’s Hazard Mitigation Strategy/Plan since the 2011 approval are listed in the following table, Table 3.1.
Chapter 3 of the Georgia Hazard Mitigation Plan was reviewed and updated by GEMA’s Hazard Miti-gation Planners. The planning staff revised each section as necessary to reflect the updated mitiga-tion strategy, based on accomplishments, current activities and the integration of current local multi-jurisdictional hazard mitigation plans and state agency inputs. This chapter provides the State of Georgia’s Strategy toward resilience. Based on the findings of the Risk Assessment and the state-level Capability Assessment, the goals and actions that follow are intended to guide state agencies, counties, cities, towns and non-governmental organizations toward resilience in regard to the many hazards that plague this region. In order to achieve these aims, this section has been separated into the following components:
Goals and Actions
State Capability Assessment
Table 3.1 Summary of Changes to Chapter 3
Chapter 3 Section Updates to Section
3.1 Overview Updated table of changes.
Updated text
3.2 Georgia Mitigation Strategy Revised text to include additional information
Goal text revised, content updated. Deleted objectives
Organized actions into the 4 categories Added actions from state appendices into action plan
Updated gaps and obstacles Describes new action plan table
Revised to include additional analysis on local plan review; Text and data moved from Chapter 4
3.3 State Capability Assessment Updated state agency capabilities and consolidated into tables
Moved funding information to 3.5
3.4 Local Capability Assessment Updated text and tables
Added maps and tables
3.5 State and Local Funding Sources
Consolidated into summary of funding sources
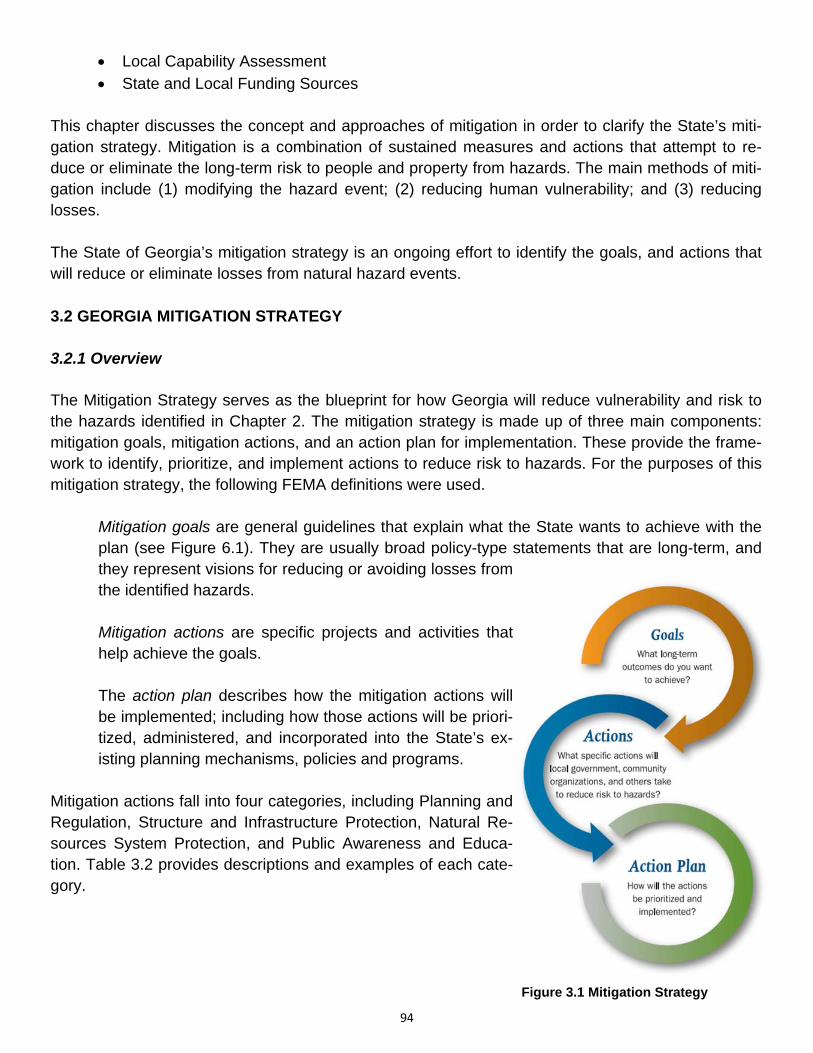
94
Local Capability Assessment
State and Local Funding Sources
This chapter discusses the concept and approaches of mitigation in order to clarify the State’s miti-gation strategy. Mitigation is a combination of sustained measures and actions that attempt to re-duce or eliminate the long-term risk to people and property from hazards. The main methods of miti-gation include (1) modifying the hazard event; (2) reducing human vulnerability; and (3) reducing losses. The State of Georgia’s mitigation strategy is an ongoing effort to identify the goals, and actions that will reduce or eliminate losses from natural hazard events. 3.2 GEORGIA MITIGATION STRATEGY 3.2.1 Overview The Mitigation Strategy serves as the blueprint for how Georgia will reduce vulnerability and risk to the hazards identified in Chapter 2. The mitigation strategy is made up of three main components: mitigation goals, mitigation actions, and an action plan for implementation. These provide the frame-work to identify, prioritize, and implement actions to reduce risk to hazards. For the purposes of this mitigation strategy, the following FEMA definitions were used.
Mitigation goals are general guidelines that explain what the State wants to achieve with the plan (see Figure 6.1). They are usually broad policy-type statements that are long-term, and they represent visions for reducing or avoiding losses from the identified hazards.
Mitigation actions are specific projects and activities that help achieve the goals.
The action plan describes how the mitigation actions will be implemented; including how those actions will be priori-tized, administered, and incorporated into the State’s ex-isting planning mechanisms, policies and programs.
Mitigation actions fall into four categories, including Planning and Regulation, Structure and Infrastructure Protection, Natural Re-sources System Protection, and Public Awareness and Educa-tion. Table 3.2 provides descriptions and examples of each cate-gory. Figure 3.1 Mitigation Strategy
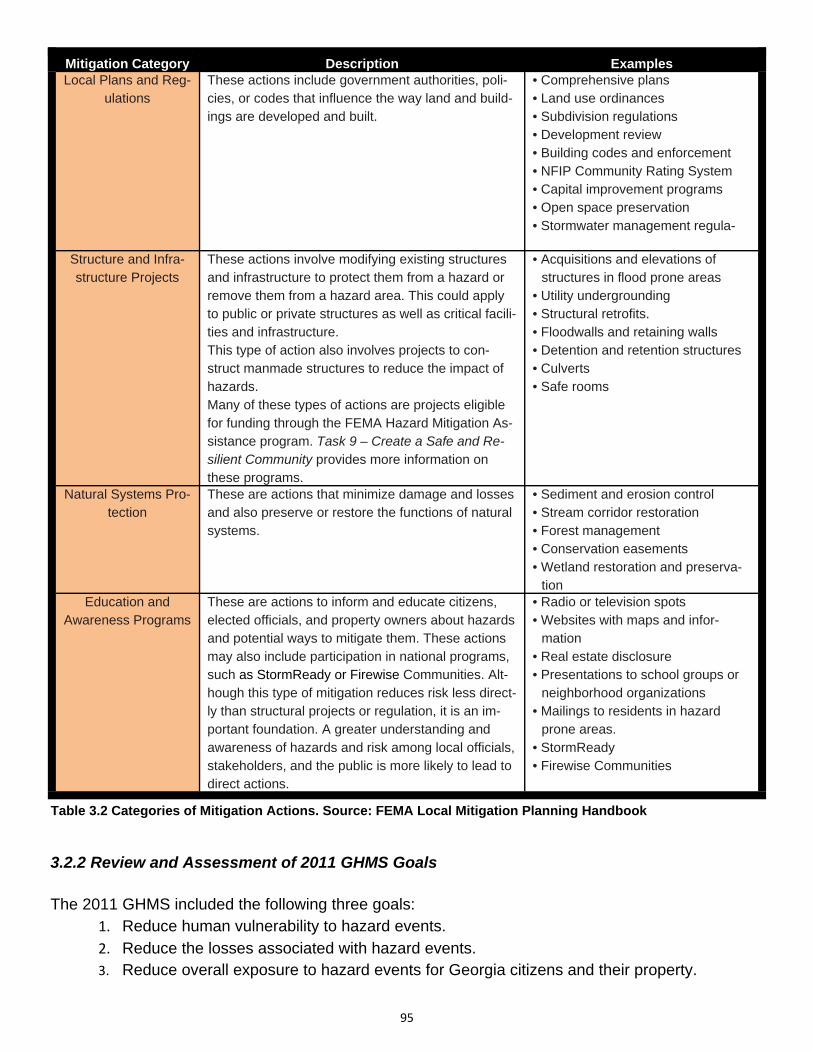
95
3.2.2 Review and Assessment of 2011 GHMS Goals The 2011 GHMS included the following three goals:
1. Reduce human vulnerability to hazard events. 2. Reduce the losses associated with hazard events. 3. Reduce overall exposure to hazard events for Georgia citizens and their property.
Mitigation Category Description Examples Local Plans and Reg-
ulations These actions include government authorities, poli-cies, or codes that influence the way land and build-ings are developed and built.
• Comprehensive plans • Land use ordinances • Subdivision regulations • Development review • Building codes and enforcement • NFIP Community Rating System • Capital improvement programs • Open space preservation • Stormwater management regula-
Structure and Infra-structure Projects
These actions involve modifying existing structures and infrastructure to protect them from a hazard or remove them from a hazard area. This could apply to public or private structures as well as critical facili-ties and infrastructure. This type of action also involves projects to con-struct manmade structures to reduce the impact of hazards. Many of these types of actions are projects eligible for funding through the FEMA Hazard Mitigation As-sistance program. Task 9 – Create a Safe and Re-silient Community provides more information on these programs.
• Acquisitions and elevations of structures in flood prone areas
• Utility undergrounding • Structural retrofits. • Floodwalls and retaining walls • Detention and retention structures • Culverts • Safe rooms
Natural Systems Pro-tection
These are actions that minimize damage and losses and also preserve or restore the functions of natural systems.
• Sediment and erosion control • Stream corridor restoration • Forest management • Conservation easements • Wetland restoration and preserva-
tion Education and
Awareness Programs These are actions to inform and educate citizens, elected officials, and property owners about hazards and potential ways to mitigate them. These actions may also include participation in national programs, such as StormReady or Firewise Communities. Alt-hough this type of mitigation reduces risk less direct-ly than structural projects or regulation, it is an im-portant foundation. A greater understanding and awareness of hazards and risk among local officials, stakeholders, and the public is more likely to lead to direct actions.
• Radio or television spots • Websites with maps and infor-
mation • Real estate disclosure • Presentations to school groups or
neighborhood organizations • Mailings to residents in hazard
prone areas. • StormReady • Firewise Communities
Table 3.2 Categories of Mitigation Actions. Source: FEMA Local Mitigation Planning Handbook
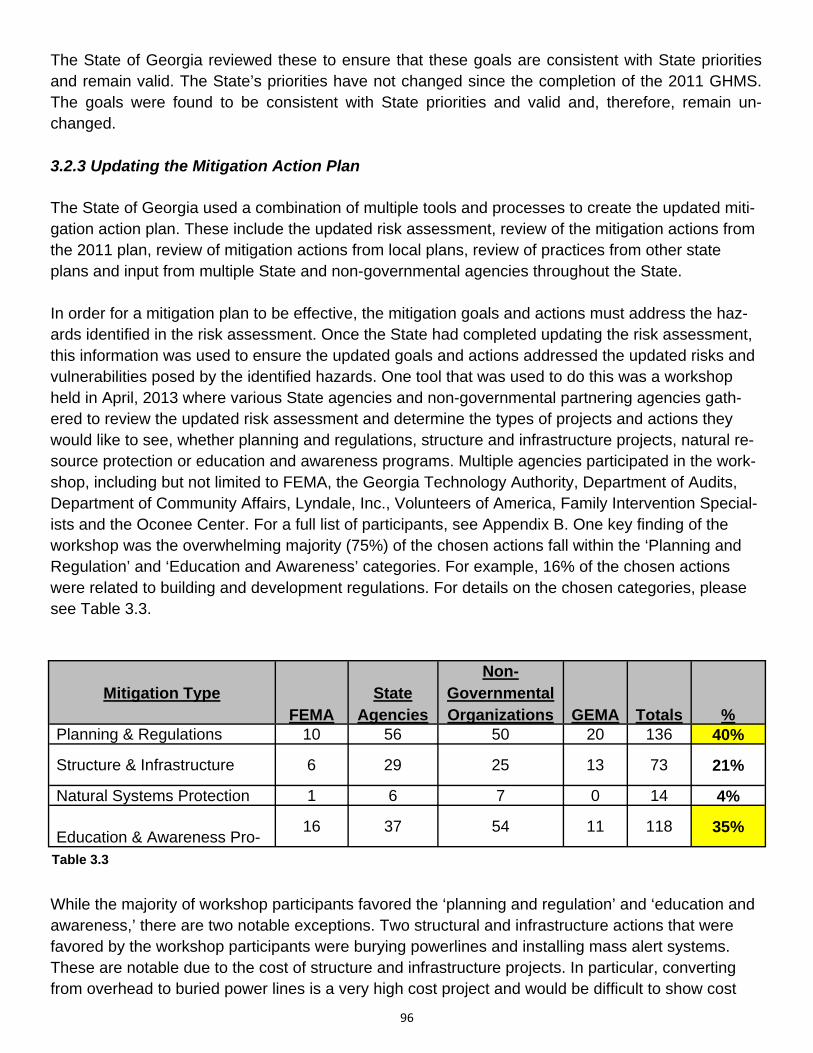
96
The State of Georgia reviewed these to ensure that these goals are consistent with State priorities and remain valid. The State’s priorities have not changed since the completion of the 2011 GHMS. The goals were found to be consistent with State priorities and valid and, therefore, remain un-changed. 3.2.3 Updating the Mitigation Action Plan The State of Georgia used a combination of multiple tools and processes to create the updated miti-gation action plan. These include the updated risk assessment, review of the mitigation actions from the 2011 plan, review of mitigation actions from local plans, review of practices from other state plans and input from multiple State and non-governmental agencies throughout the State. In order for a mitigation plan to be effective, the mitigation goals and actions must address the haz-ards identified in the risk assessment. Once the State had completed updating the risk assessment, this information was used to ensure the updated goals and actions addressed the updated risks and vulnerabilities posed by the identified hazards. One tool that was used to do this was a workshop held in April, 2013 where various State agencies and non-governmental partnering agencies gath-ered to review the updated risk assessment and determine the types of projects and actions they would like to see, whether planning and regulations, structure and infrastructure projects, natural re-source protection or education and awareness programs. Multiple agencies participated in the work-shop, including but not limited to FEMA, the Georgia Technology Authority, Department of Audits, Department of Community Affairs, Lyndale, Inc., Volunteers of America, Family Intervention Special-ists and the Oconee Center. For a full list of participants, see Appendix B. One key finding of the workshop was the overwhelming majority (75%) of the chosen actions fall within the ‘Planning and Regulation’ and ‘Education and Awareness’ categories. For example, 16% of the chosen actions were related to building and development regulations. For details on the chosen categories, please see Table 3.3.
While the majority of workshop participants favored the ‘planning and regulation’ and ‘education and awareness,’ there are two notable exceptions. Two structural and infrastructure actions that were favored by the workshop participants were burying powerlines and installing mass alert systems. These are notable due to the cost of structure and infrastructure projects. In particular, converting from overhead to buried power lines is a very high cost project and would be difficult to show cost
Mitigation Type FEMA
State Agencies
Non-Governmental Organizations GEMA Totals %
Planning & Regulations 10 56 50 20 136 40%
Structure & Infrastructure 6 29 25 13 73 21%
Natural Systems Protection 1 6 7 0 14 4%
Education & Awareness Pro-16 37 54 11 118 35%
Table 3.3
97
effectiveness. For full details on the workshop tallies, please see Appendix E Another tool that was used for updating the mitigation actions is individual interviews with various state agencies conducted by State Mitigation Planning staff. The purpose was to identify specific projects and activities other agencies in the State are planning or conducting. This process identified many new planned actions, as well as many that, while currently in progress, were not included in the 2011 strategy and are, therefore, “new” to the updated mitigation action plan. During the update process, the State noted the following gaps and obstacles, the first three of which were identified in the 2011 GHMS:
1. The 2011 GHMS noted the state would benefit from incorporating more GIS and other technical information into the hazard mitigation planning process. One major area the State has worked to improve upon is the quality and amount of technical and GIS data that is available and used in, both, local and State Mitigation Planning. The previous strategy included multiple actions to address this issue, including the following:
a. Actions 1.10 and 4.8 included development of Community Wildfire Protection Plans (CWPP), which provide greater detail than previously available on local risks of wildfire hazards. These CWPPs are now mostly complete. The State now requires local plans to include relevant data and maps from these CWPPs in risk assess-ments. The GIS data developed from this project is also included in the State risk assessment for wildfires.
b. Actions 2.4 and 2.5 related to RiskMAP studies the Georgia Department of Natural Resources has initiated in various locations in the State. The pilot phase in the Met-ropolitan Atlanta area is now approximately 90% complete and the next phase, in-cluding counties in the coastal Georgia region has been initiated. This information includes site specific flood studies with GIS and technical data that will be available for inclusion in the next updates of the studied counties’ local mitigation plans.
c. Action 4.4 related to making improvements to the Georgia Mitigation Information System (GMIS). This system is provided as a basic GIS tool for locals to use in de-veloping their risk assessments, as well as an inventory and reporting tool for their Critical Facilities. It is also used as a reporting and mapping tool for State owned and operated facilities. The State of Georgia is in the process of upgrading the sys-tem to make it more user-friendly, as well as open the possibility of including future datasets as they become available.
d. Action 2.13 related to including and updating data on NFIP repetitive loss properties in the GMIS. This helps local planners in meeting a specific requirement in their lo-cal mitigation plans. The State continues to update this data as it becomes availa-ble.
e. Action 4.10 related to updates to the Flood Hazard Maps throughout the State, as well as inclusion of the locations of high hazard dams. The updated maps have been provided to the affected counties and have been included in the GMIS. The updates to the flood maps are now complete. Dam locations, while not included in GMIS have been included in the State Mitigation Strategy as new dams are built, the dam location dataset will be updated.
98
2. Many state residents did not realize hazard mitigation planning activities were occurring in
the area. This part of the process is primarily up to local planners as they update the local mitigation plans. GEMA’s Mitigation Planning staff, however, works closely with the local planners and encourages multiple forms of public participation. Encourage FEMA template for news releases; public notices during planning process;
3. Local communities in the state were unaware of the types of assistance available to them
for hazard mitigation planning. Action 2.7 in the 2011 GHMS related to two process the GEMA Mitigation staff uses in order to address this. In the aftermath of Presidentially de-clared disasters, the staff deploys to affected areas and hosts post disaster briefings where the potential for HMGP funding for planning and projects is discussed with declared counties. Also, GEMA hosts specific training for all new Emergency Management Direc-tors. A portion of this training is focused on hazard mitigation, including the programs available and the potential funding for projects and planning. Finally, as described in sec-tion 4.4.1, the State Mitigation staff maintains a list of counties prioritized by the expiration dates of their plans and reached out to the prioritized communities, letting them know of the need to update their plans and the potential for funding assistance.
4. The GHMS would benefit from improved methods of incorporating state and local mitiga-
tion actions. While this was not noted in the previous strategy, it was a concern identified by the State mitigation planning staff in the initial phases of the current update. The State Mitigation Planning staff did three things in order to address this issue. The workshops de-scribed in Chapter 1 were new to Georgia’s planning process and provided a way to better capture input from multiple State agencies and partnering non-governmental organiza-tions. Also, the staff specifically reached out to several of the larger State agencies with individual interviews to include the projects those agencies had in process that were relat-ed to mitigation. These two processes allowed the mitigation planning staff to incorporate types of mitigation actions the workshop participants perceived as a high priority as well as include projects various State agencies have planned or in progress that have a mitigation effect. Finally, in revising the mitigation action plan, described below, part of the effort was to ensure mitigation actions noted in the local plans were adequately included in the State’s action plan.
The State of Georgia also reviewed the 2011 Action Plan, first, to ensure that the goals continued to address the updated risk assessment. The next step was to review the action steps according to the following criteria:
1. Assess their progress. 2. Determine their validity based on the State’s capabilities and the current risk assessment. 3. Ensure they contribute to the identified goals. 4. Ensure the actions are cost effective, technically feasible and environmentally sound. 5. Identify actions that could be refined, expanded or deleted. 6. Ensure the updated action plan accurately and completely describes what the State of
Georgia, including all agencies, is currently doing or plans to do over the coming years. 7. Ensure the updated Action Plan addresses all relevant needs as identified by State agen-
99
cies and local mitigation plans. 8. Determine whether the Action Plan is presented in the most effective, concise manner.
The majority of the actions from the 2011 GHMS were listed as ongoing. Upon review, the State found these actions were still ongoing. One key finding of the review was that, while valid, many of the actions in the previous plan were vague. The State, therefore, began to revise the actions, some-times separating one action into multiple, more specific actions, in order to more clearly define what, exactly, is being done. One method the State used for this was to look at examples from other state plans to see how relevant actions were described by other states. This provided a method for more clearly stating many of the actions in the 2014 update without “reinventing the wheel.” 3.2.4 Local Plan Review GEMA staff reviewed all local hazard mitigation plans to identify mitigation actions communities were proposing in order to reduce their identified risks and vulnerabilities to natural hazards. Results of this analysis are provided in Tables 3.4 and 3.5. This information was considered in the development of the updated 2014 Action Plan. The two tables are color coded such that the mitigation types in Ta-ble 3.4 are colored to match the FEMA Mitigation Categories they apply to in Table 3.5. Mitigation types that have no color do not fall within the FEMA mitigation categories and are response and pre-paredness type actions that have consistently been included in local mitigation plans. Examples of State mitigation actions related to local plans include, but are not limited to the following:
Continue supporting the use of state of the art warning technology and local warning pro-jects with available initiative funds
Support local government cost-effective requests through available grant opportunities to mitigate repetitive loss properties with priority given to severe repetitive loss properties and removal of repetitive loss properties from regulatory floodway
Continue to give priority to projects identified in local mitigation plans that minimize dam-ages to critical facilities
Table 3.4 shows changes in the percentages from the 2011 GHMS. One key observation is the high-er changes in 3 of the mitigation action types. The percentage of counties identifying ‘planning and zoning’ and ‘additional analysis’ as mitigation actions decreased from 88% and 64% to 76% and 47% respectively. In addition, the percentage of counties identifying ‘Emergency Response Opera-tions’ type actions increased from 62% to 75%. Further analysis will be necessary to determine whether these trends are indicative of concerns which would require the modification of the Action Plan.
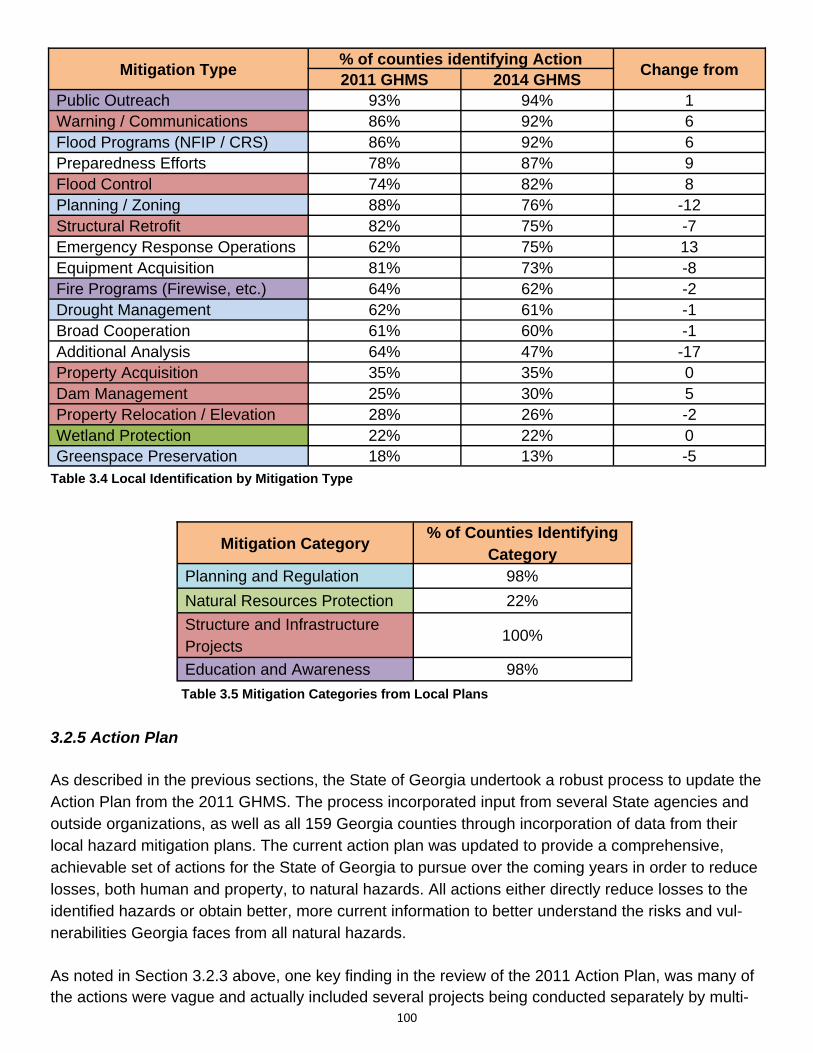
100
3.2.5 Action Plan As described in the previous sections, the State of Georgia undertook a robust process to update the Action Plan from the 2011 GHMS. The process incorporated input from several State agencies and outside organizations, as well as all 159 Georgia counties through incorporation of data from their local hazard mitigation plans. The current action plan was updated to provide a comprehensive, achievable set of actions for the State of Georgia to pursue over the coming years in order to reduce losses, both human and property, to natural hazards. All actions either directly reduce losses to the identified hazards or obtain better, more current information to better understand the risks and vul-nerabilities Georgia faces from all natural hazards. As noted in Section 3.2.3 above, one key finding in the review of the 2011 Action Plan, was many of the actions were vague and actually included several projects being conducted separately by multi-
Mitigation Type % of counties identifying Action
Change from 2011 GHMS 2014 GHMS
Public Outreach 93% 94% 1 Warning / Communications 86% 92% 6 Flood Programs (NFIP / CRS) 86% 92% 6 Preparedness Efforts 78% 87% 9 Flood Control 74% 82% 8 Planning / Zoning 88% 76% -12 Structural Retrofit 82% 75% -7 Emergency Response Operations 62% 75% 13 Equipment Acquisition 81% 73% -8 Fire Programs (Firewise, etc.) 64% 62% -2 Drought Management 62% 61% -1 Broad Cooperation 61% 60% -1 Additional Analysis 64% 47% -17 Property Acquisition 35% 35% 0 Dam Management 25% 30% 5 Property Relocation / Elevation 28% 26% -2 Wetland Protection 22% 22% 0 Greenspace Preservation 18% 13% -5
Table 3.4 Local Identification by Mitigation Type
Mitigation Category % of Counties Identifying
Category Planning and Regulation 98%
Natural Resources Protection 22%
Structure and Infrastructure Projects
100%
Education and Awareness 98%
Table 3.5 Mitigation Categories from Local Plans
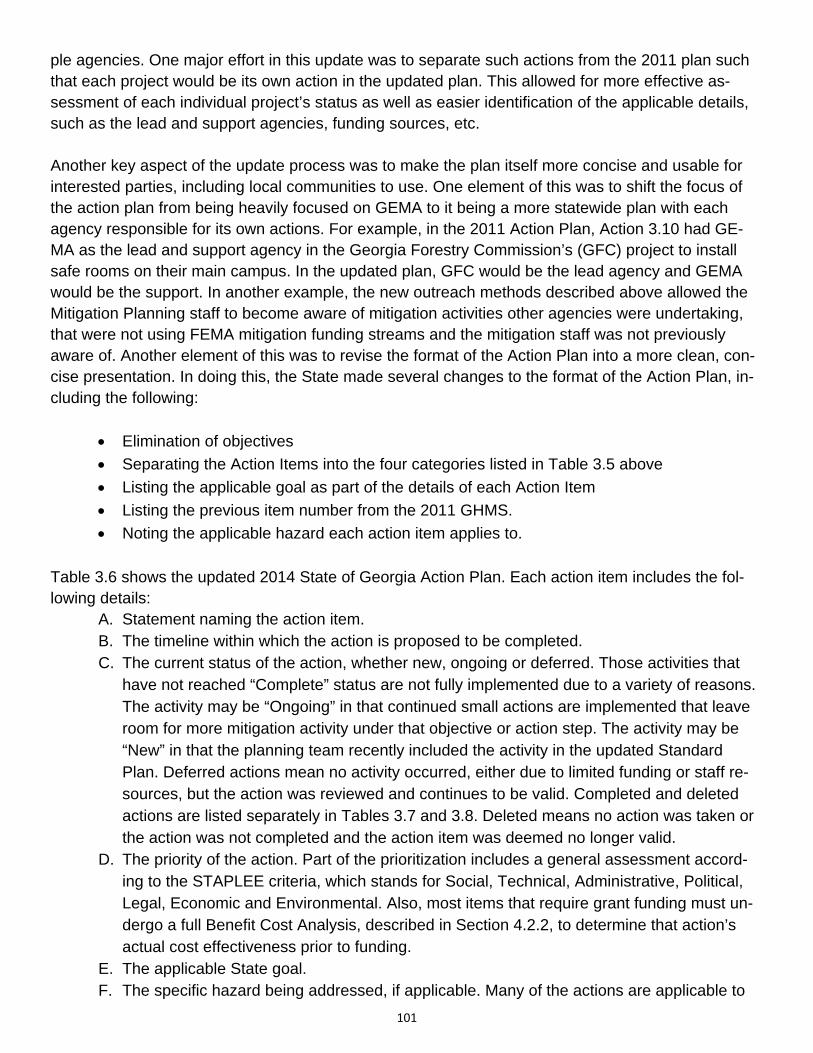
101
ple agencies. One major effort in this update was to separate such actions from the 2011 plan such that each project would be its own action in the updated plan. This allowed for more effective as-sessment of each individual project’s status as well as easier identification of the applicable details, such as the lead and support agencies, funding sources, etc. Another key aspect of the update process was to make the plan itself more concise and usable for interested parties, including local communities to use. One element of this was to shift the focus of the action plan from being heavily focused on GEMA to it being a more statewide plan with each agency responsible for its own actions. For example, in the 2011 Action Plan, Action 3.10 had GE-MA as the lead and support agency in the Georgia Forestry Commission’s (GFC) project to install safe rooms on their main campus. In the updated plan, GFC would be the lead agency and GEMA would be the support. In another example, the new outreach methods described above allowed the Mitigation Planning staff to become aware of mitigation activities other agencies were undertaking, that were not using FEMA mitigation funding streams and the mitigation staff was not previously aware of. Another element of this was to revise the format of the Action Plan into a more clean, con-cise presentation. In doing this, the State made several changes to the format of the Action Plan, in-cluding the following:
Elimination of objectives
Separating the Action Items into the four categories listed in Table 3.5 above
Listing the applicable goal as part of the details of each Action Item
Listing the previous item number from the 2011 GHMS.
Noting the applicable hazard each action item applies to. Table 3.6 shows the updated 2014 State of Georgia Action Plan. Each action item includes the fol-lowing details:
A. Statement naming the action item. B. The timeline within which the action is proposed to be completed. C. The current status of the action, whether new, ongoing or deferred. Those activities that
have not reached “Complete” status are not fully implemented due to a variety of reasons. The activity may be “Ongoing” in that continued small actions are implemented that leave room for more mitigation activity under that objective or action step. The activity may be “New” in that the planning team recently included the activity in the updated Standard Plan. Deferred actions mean no activity occurred, either due to limited funding or staff re-sources, but the action was reviewed and continues to be valid. Completed and deleted actions are listed separately in Tables 3.7 and 3.8. Deleted means no action was taken or the action was not completed and the action item was deemed no longer valid.
D. The priority of the action. Part of the prioritization includes a general assessment accord-ing to the STAPLEE criteria, which stands for Social, Technical, Administrative, Political, Legal, Economic and Environmental. Also, most items that require grant funding must un-dergo a full Benefit Cost Analysis, described in Section 4.2.2, to determine that action’s actual cost effectiveness prior to funding.
E. The applicable State goal. F. The specific hazard being addressed, if applicable. Many of the actions are applicable to
102
all hazards, though some are directly applicable to specific hazards. For example, tech-nical assistance for local mitigation plans is applicable to all hazards, where acquisition of flood prone properties would be applicable to the flood hazard.
G. The Lead Agency. The lead agency is the agency responsible for accomplishing the ac-tion.
H. Supporting Agencies. Supporting agencies are those agencies that are not responsible for the completion of the action, but provide assistance in various ways.
I. The applicable resources (staffing, funding, etc.) necessary in order to complete the ac-tion. The State of Georgia currently uses several funding sources to implement hazard mitigation activity. Primarily, these funds stem from federal, state, and local sources, which include the programs discussed in Section 3.3’s assessment of state mitigation policies, programs, and funding and Section 3.5’s description of funding sources. The State of Georgia is interested in continuing to pursue these federal, state, and local funding sources throughout the future implementation of the mitigation strategy as well as in pur-suing additional private sources
J. The item number, if applicable, from the 2011 GHMS. K. The applicable FEMA category described above.
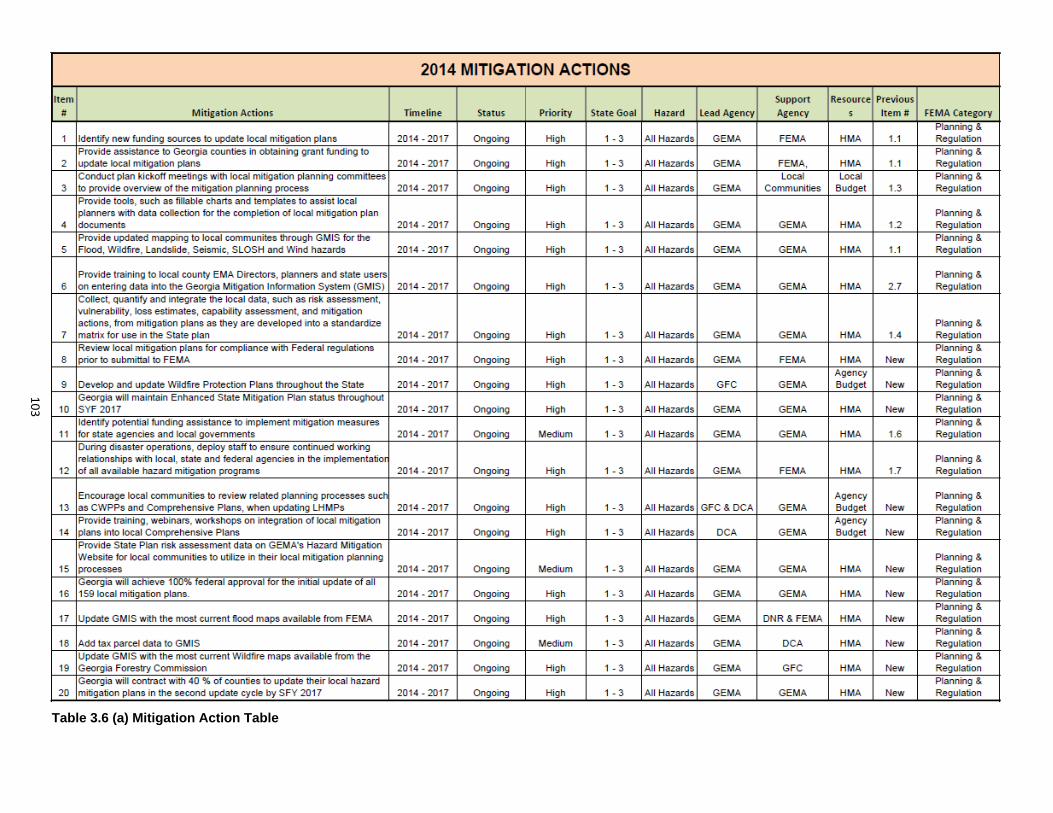
103
Table 3.6 (a) Mitigation Action Table
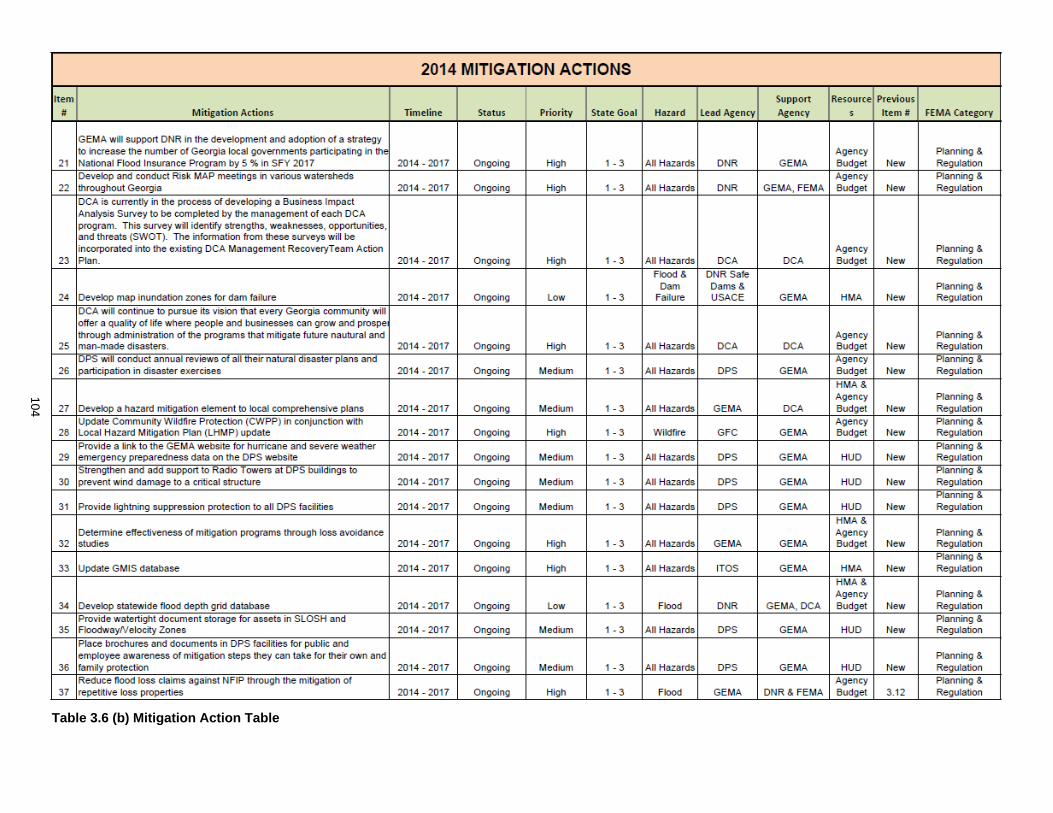
104
Table 3.6 (b) Mitigation Action Table
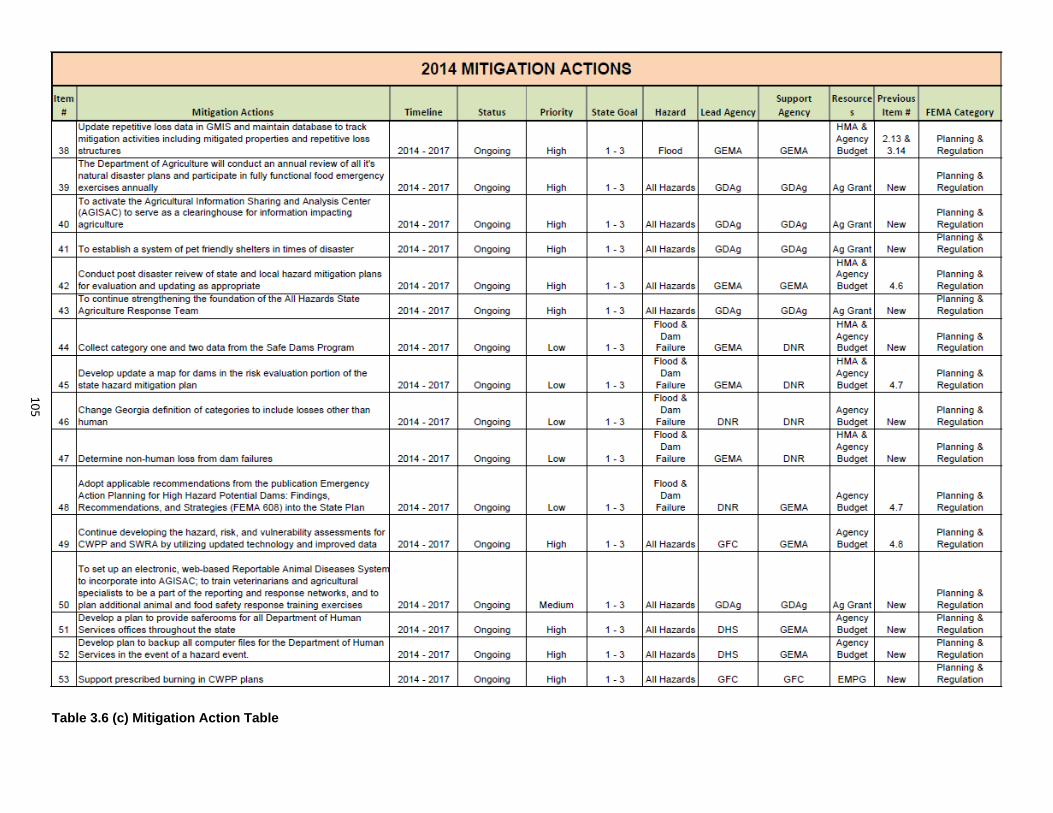
105
Table 3.6 (c) Mitigation Action Table
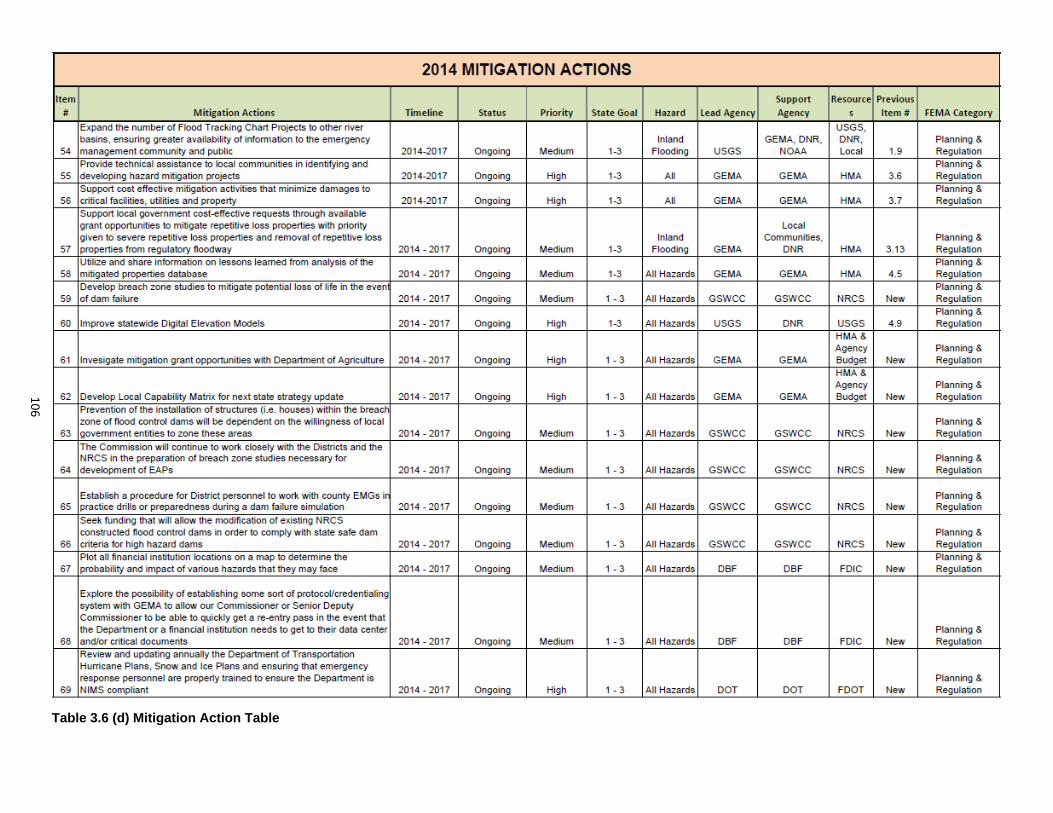
106
Table 3.6 (d) Mitigation Action Table
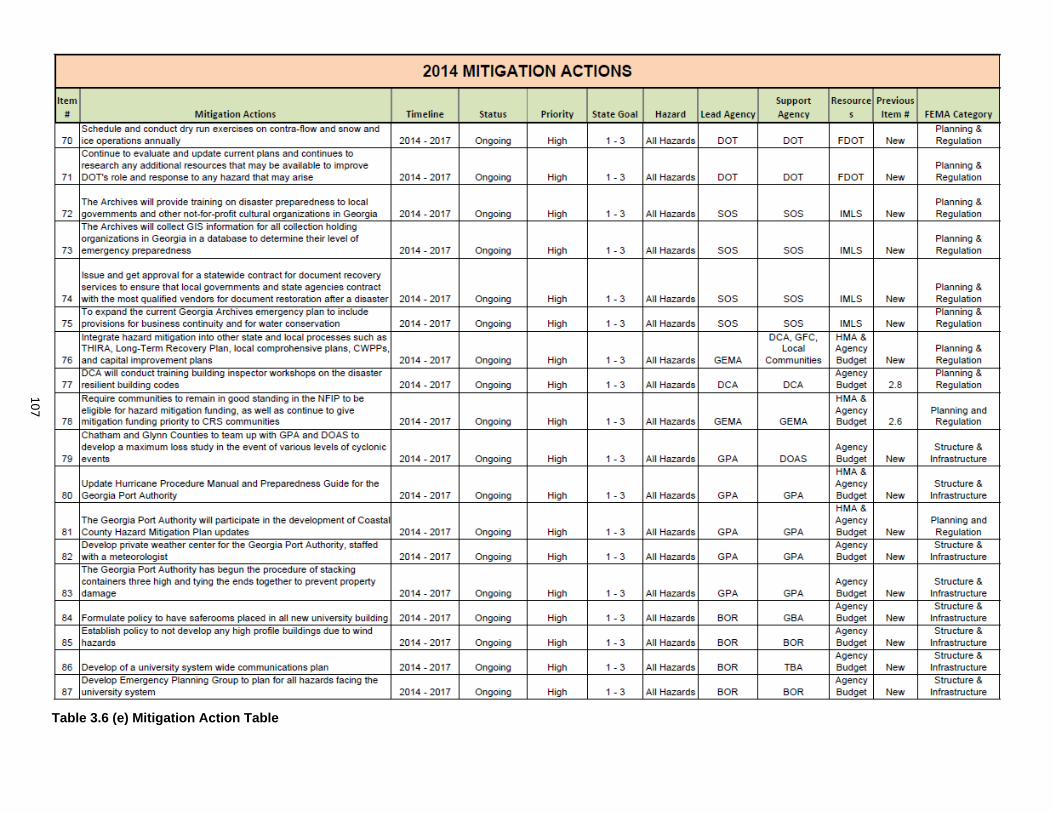
107
Table 3.6 (e) Mitigation Action Table
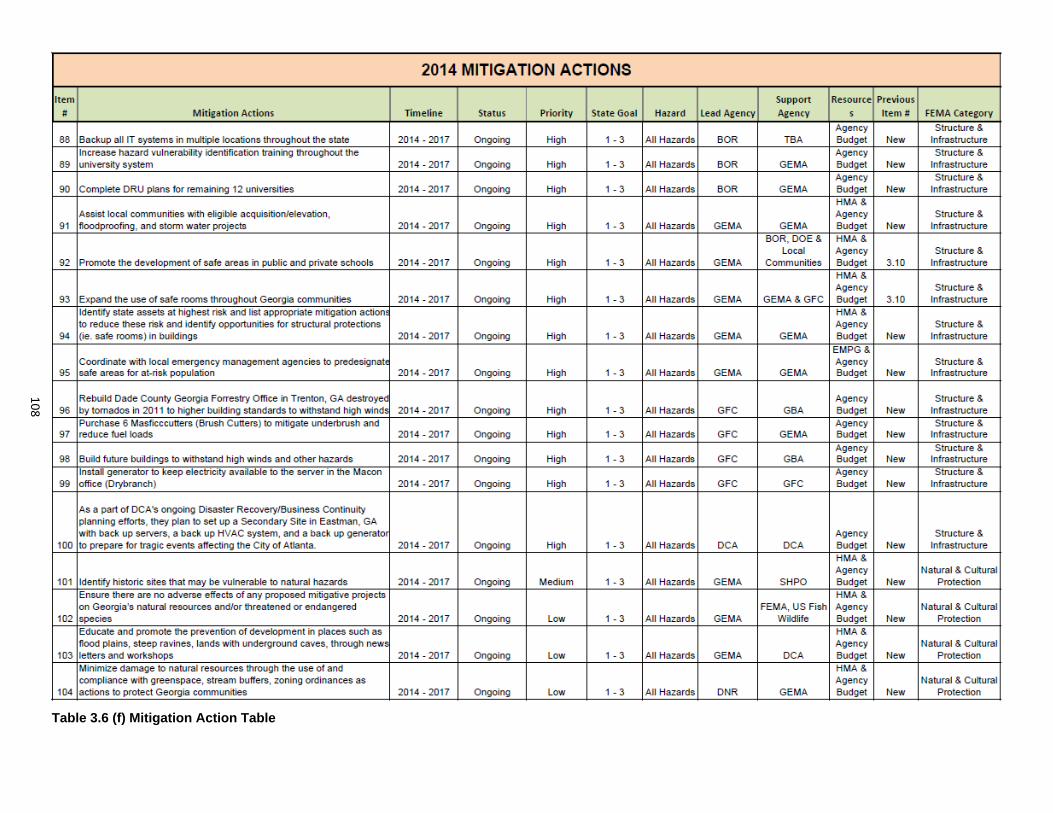
108
Table 3.6 (f) Mitigation Action Table
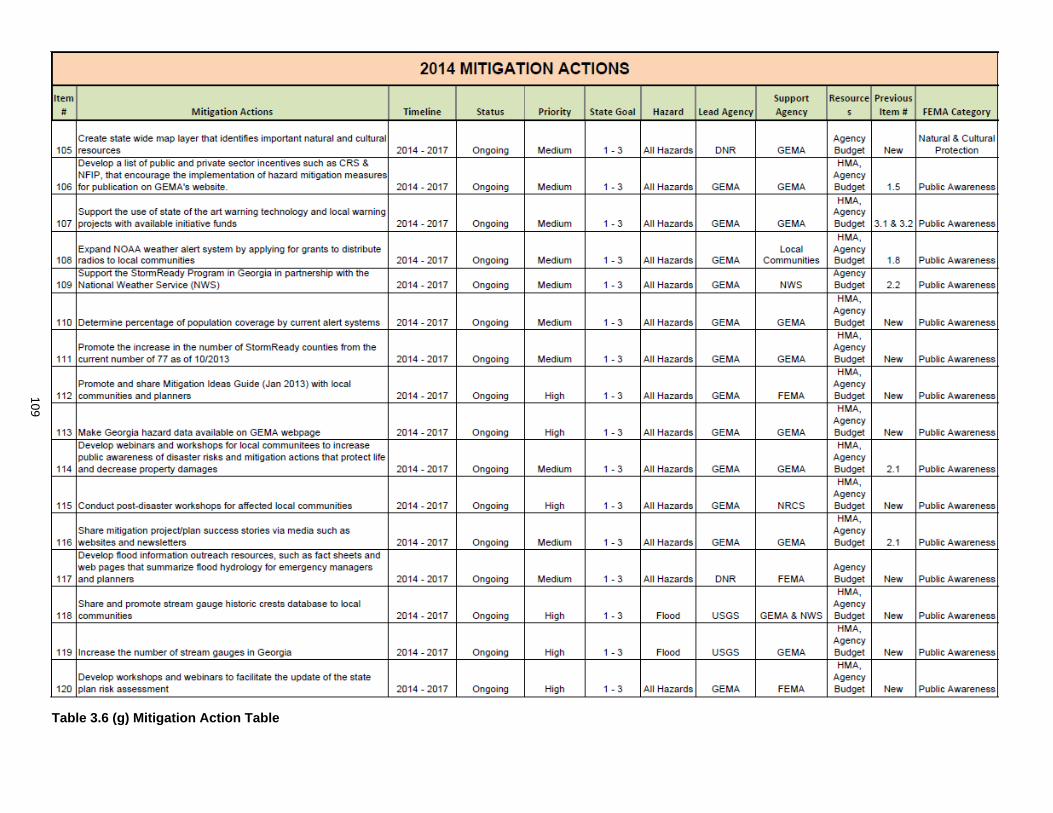
109
Table 3.6 (g) Mitigation Action Table
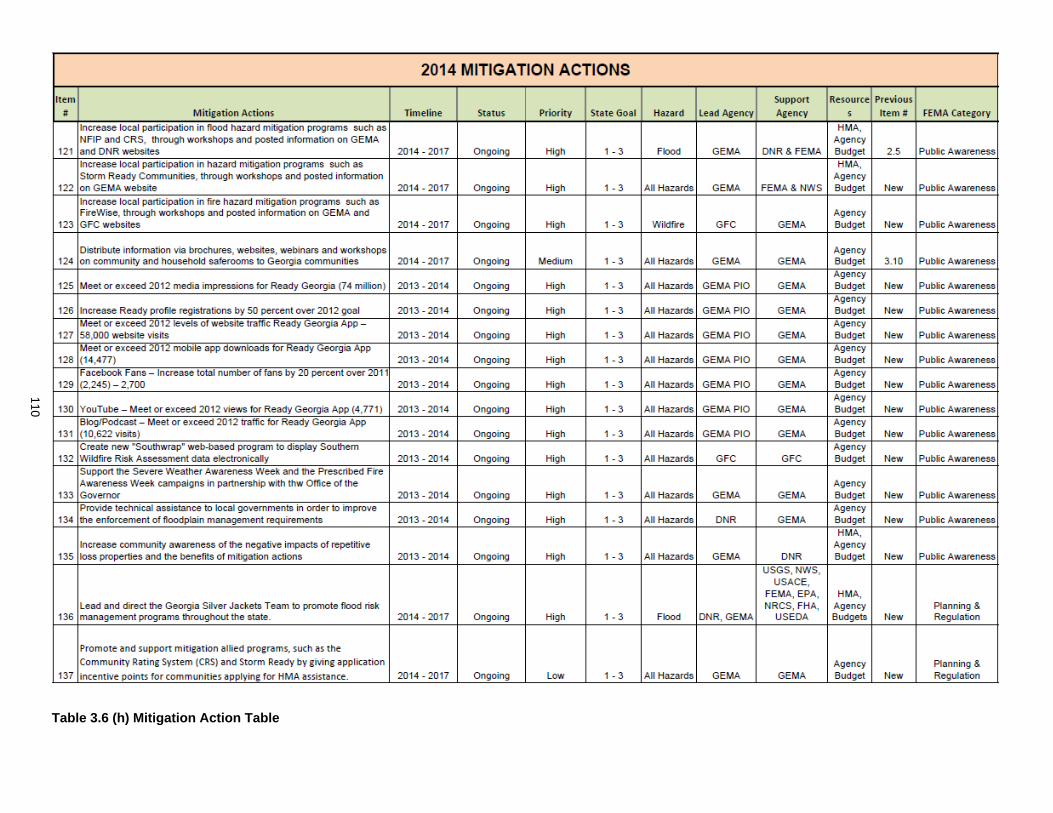
110
Table 3.6 (h) Mitigation Action Table
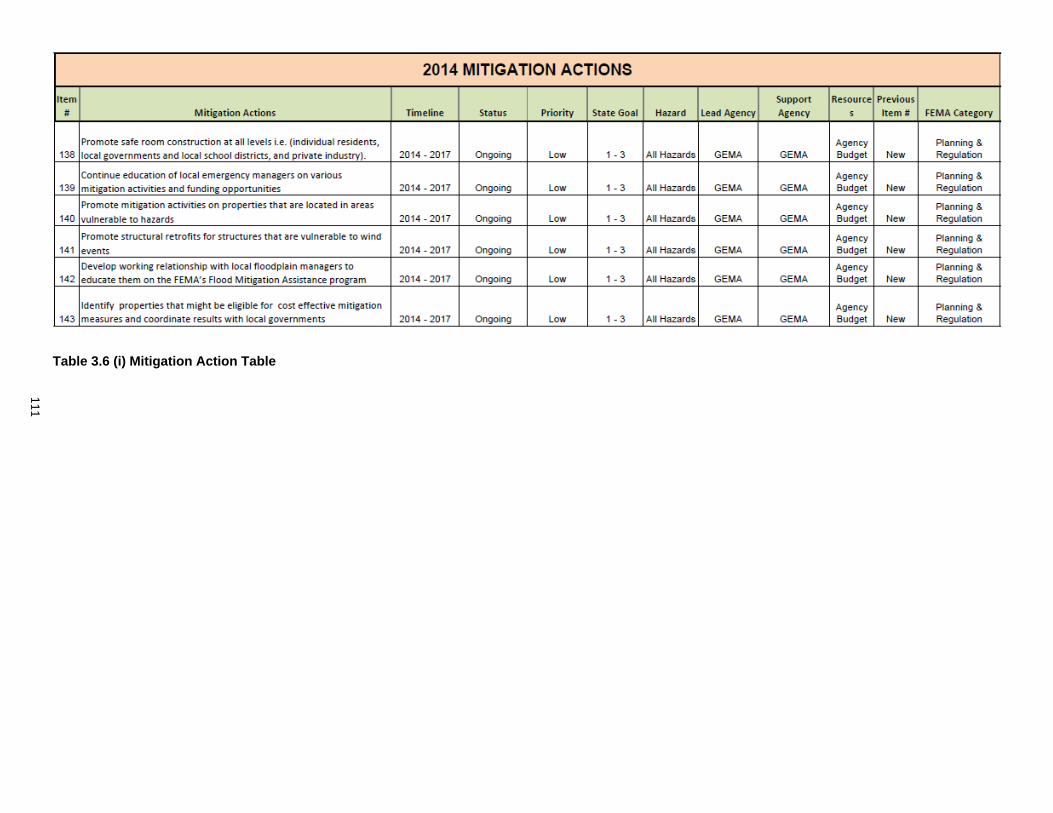
111
Table 3.6 (i) Mitigation Action Table
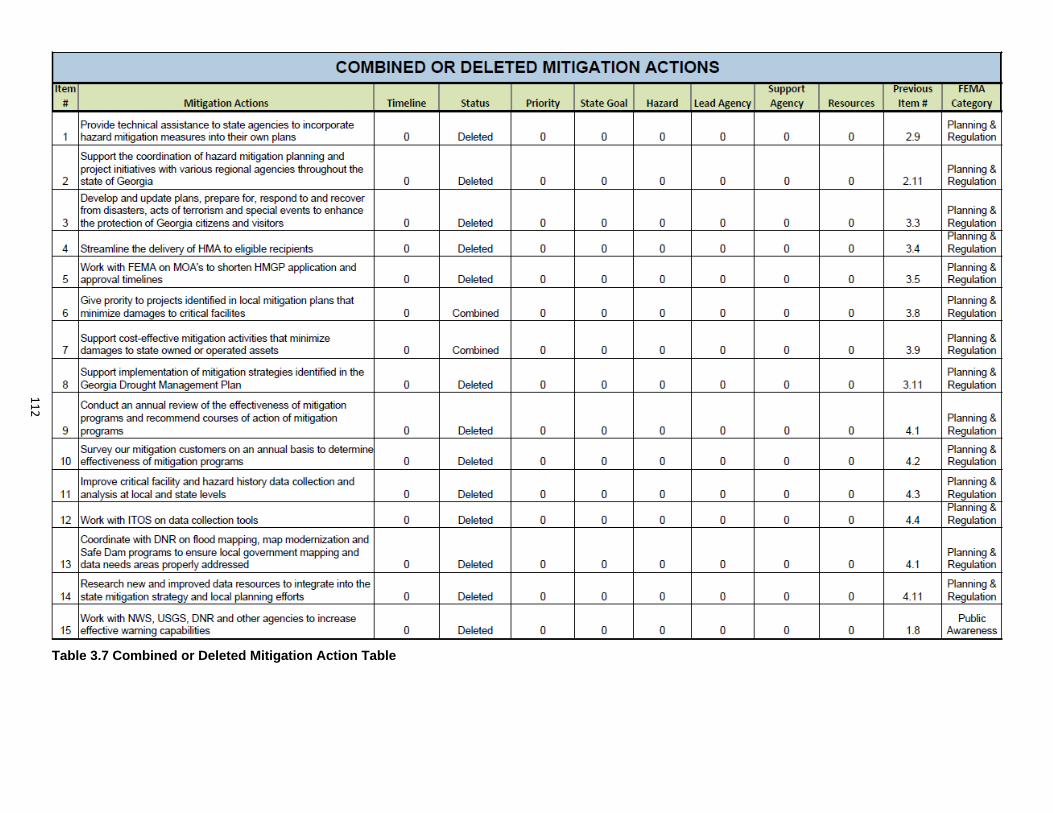
112
Table 3.7 Combined or Deleted Mitigation Action Table
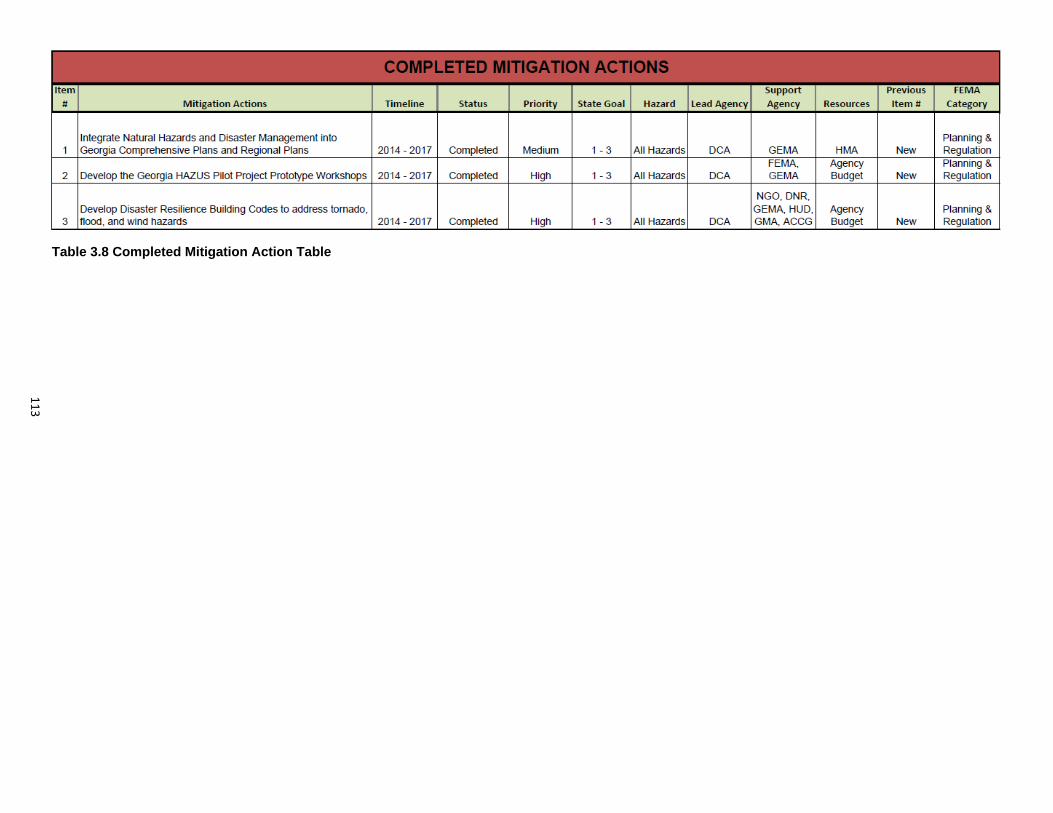
113
Table 3.8 Completed Mitigation Action Table
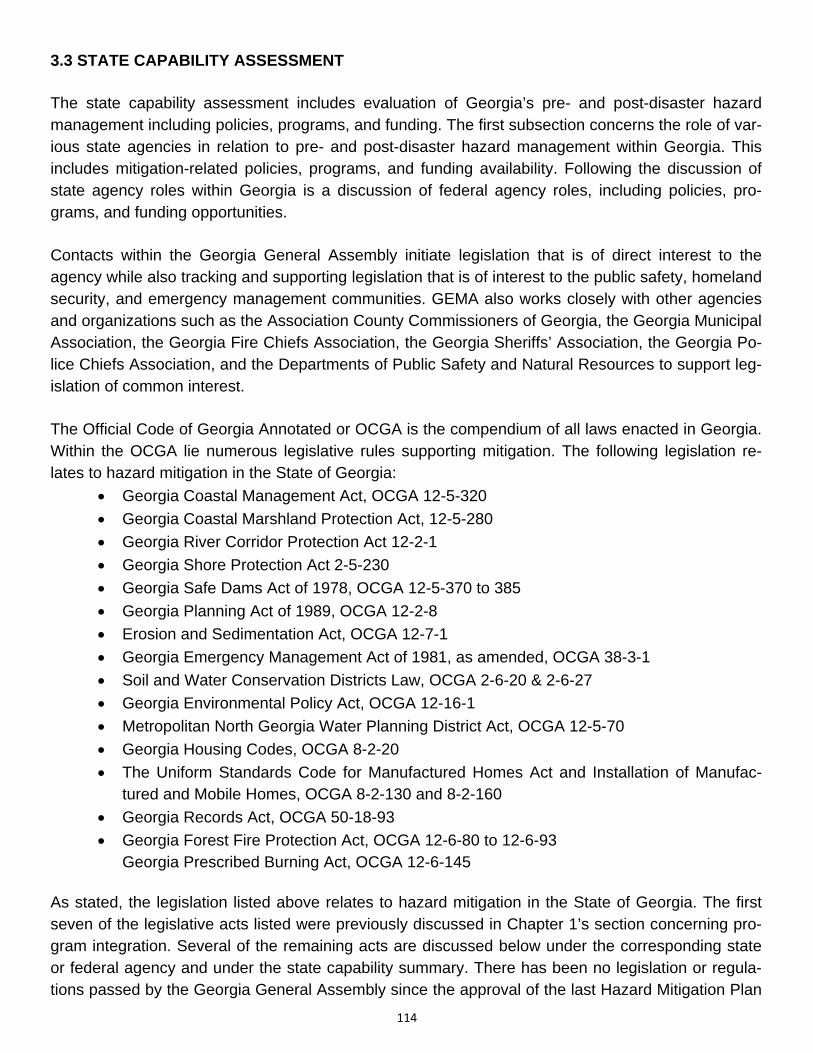
114
3.3 STATE CAPABILITY ASSESSMENT The state capability assessment includes evaluation of Georgia’s pre- and post-disaster hazard management including policies, programs, and funding. The first subsection concerns the role of var-ious state agencies in relation to pre- and post-disaster hazard management within Georgia. This includes mitigation-related policies, programs, and funding availability. Following the discussion of state agency roles within Georgia is a discussion of federal agency roles, including policies, pro-grams, and funding opportunities. Contacts within the Georgia General Assembly initiate legislation that is of direct interest to the agency while also tracking and supporting legislation that is of interest to the public safety, homeland security, and emergency management communities. GEMA also works closely with other agencies and organizations such as the Association County Commissioners of Georgia, the Georgia Municipal Association, the Georgia Fire Chiefs Association, the Georgia Sheriffs’ Association, the Georgia Po-lice Chiefs Association, and the Departments of Public Safety and Natural Resources to support leg-islation of common interest. The Official Code of Georgia Annotated or OCGA is the compendium of all laws enacted in Georgia. Within the OCGA lie numerous legislative rules supporting mitigation. The following legislation re-lates to hazard mitigation in the State of Georgia:
Georgia Coastal Management Act, OCGA 12-5-320
Georgia Coastal Marshland Protection Act, 12-5-280
Georgia River Corridor Protection Act 12-2-1
Georgia Shore Protection Act 2-5-230
Georgia Safe Dams Act of 1978, OCGA 12-5-370 to 385
Georgia Planning Act of 1989, OCGA 12-2-8
Erosion and Sedimentation Act, OCGA 12-7-1
Georgia Emergency Management Act of 1981, as amended, OCGA 38-3-1
Soil and Water Conservation Districts Law, OCGA 2-6-20 & 2-6-27
Georgia Environmental Policy Act, OCGA 12-16-1
Metropolitan North Georgia Water Planning District Act, OCGA 12-5-70
Georgia Housing Codes, OCGA 8-2-20
The Uniform Standards Code for Manufactured Homes Act and Installation of Manufac-tured and Mobile Homes, OCGA 8-2-130 and 8-2-160
Georgia Records Act, OCGA 50-18-93
Georgia Forest Fire Protection Act, OCGA 12-6-80 to 12-6-93 Georgia Prescribed Burning Act, OCGA 12-6-145
As stated, the legislation listed above relates to hazard mitigation in the State of Georgia. The first seven of the legislative acts listed were previously discussed in Chapter 1’s section concerning pro-gram integration. Several of the remaining acts are discussed below under the corresponding state or federal agency and under the state capability summary. There has been no legislation or regula-tions passed by the Georgia General Assembly since the approval of the last Hazard Mitigation Plan
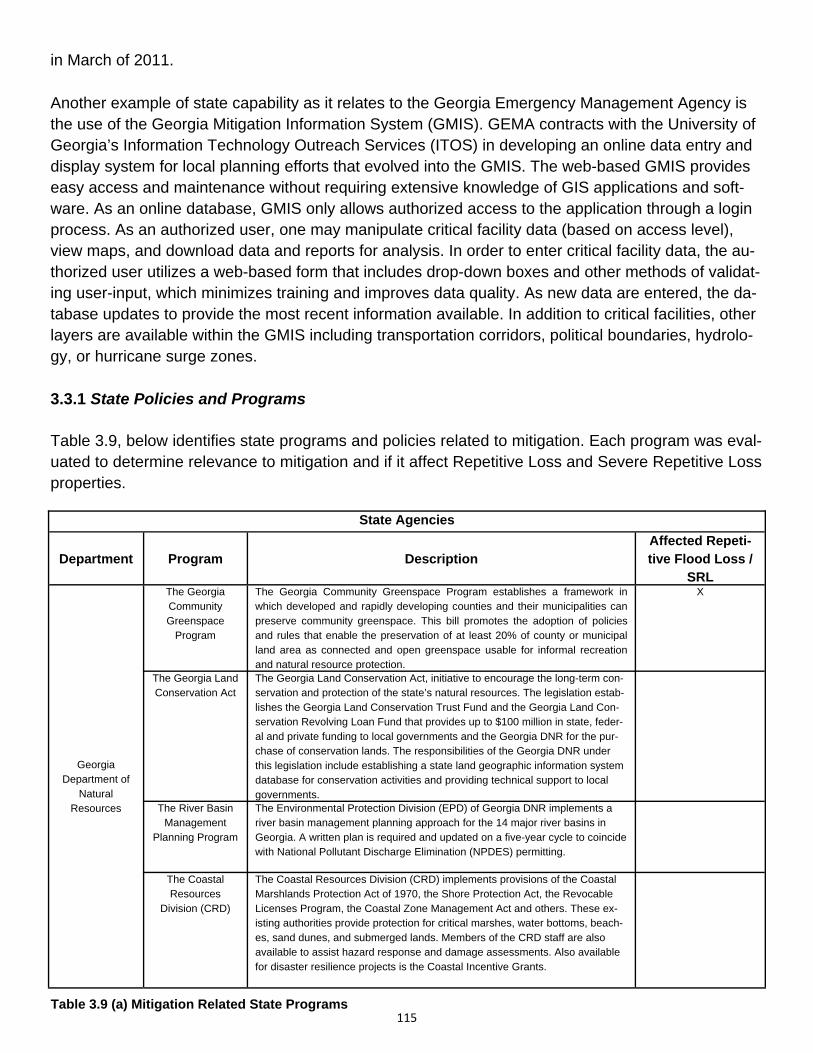
115
in March of 2011. Another example of state capability as it relates to the Georgia Emergency Management Agency is the use of the Georgia Mitigation Information System (GMIS). GEMA contracts with the University of Georgia’s Information Technology Outreach Services (ITOS) in developing an online data entry and display system for local planning efforts that evolved into the GMIS. The web-based GMIS provides easy access and maintenance without requiring extensive knowledge of GIS applications and soft-ware. As an online database, GMIS only allows authorized access to the application through a login process. As an authorized user, one may manipulate critical facility data (based on access level), view maps, and download data and reports for analysis. In order to enter critical facility data, the au-thorized user utilizes a web-based form that includes drop-down boxes and other methods of validat-ing user-input, which minimizes training and improves data quality. As new data are entered, the da-tabase updates to provide the most recent information available. In addition to critical facilities, other layers are available within the GMIS including transportation corridors, political boundaries, hydrolo-gy, or hurricane surge zones. 3.3.1 State Policies and Programs Table 3.9, below identifies state programs and policies related to mitigation. Each program was eval-uated to determine relevance to mitigation and if it affect Repetitive Loss and Severe Repetitive Loss properties.
State Agencies
Department Program Description Affected Repeti-tive Flood Loss /
SRL
Georgia Department of
Natural Resources
The Georgia Community Greenspace
Program
The Georgia Community Greenspace Program establishes a framework in which developed and rapidly developing counties and their municipalities can preserve community greenspace. This bill promotes the adoption of policies and rules that enable the preservation of at least 20% of county or municipal land area as connected and open greenspace usable for informal recreation and natural resource protection.
X
The Georgia Land Conservation Act
The Georgia Land Conservation Act, initiative to encourage the long-term con-servation and protection of the state’s natural resources. The legislation estab-lishes the Georgia Land Conservation Trust Fund and the Georgia Land Con-servation Revolving Loan Fund that provides up to $100 million in state, feder-al and private funding to local governments and the Georgia DNR for the pur-chase of conservation lands. The responsibilities of the Georgia DNR under this legislation include establishing a state land geographic information system database for conservation activities and providing technical support to local governments.
The River Basin Management
Planning Program
The Environmental Protection Division (EPD) of Georgia DNR implements a river basin management planning approach for the 14 major river basins in Georgia. A written plan is required and updated on a five-year cycle to coincide with National Pollutant Discharge Elimination (NPDES) permitting.
The Coastal Resources
Division (CRD)
The Coastal Resources Division (CRD) implements provisions of the Coastal Marshlands Protection Act of 1970, the Shore Protection Act, the Revocable Licenses Program, the Coastal Zone Management Act and others. These ex-isting authorities provide protection for critical marshes, water bottoms, beach-es, sand dunes, and submerged lands. Members of the CRD staff are also available to assist hazard response and damage assessments. Also available for disaster resilience projects is the Coastal Incentive Grants.
Table 3.9 (a) Mitigation Related State Programs
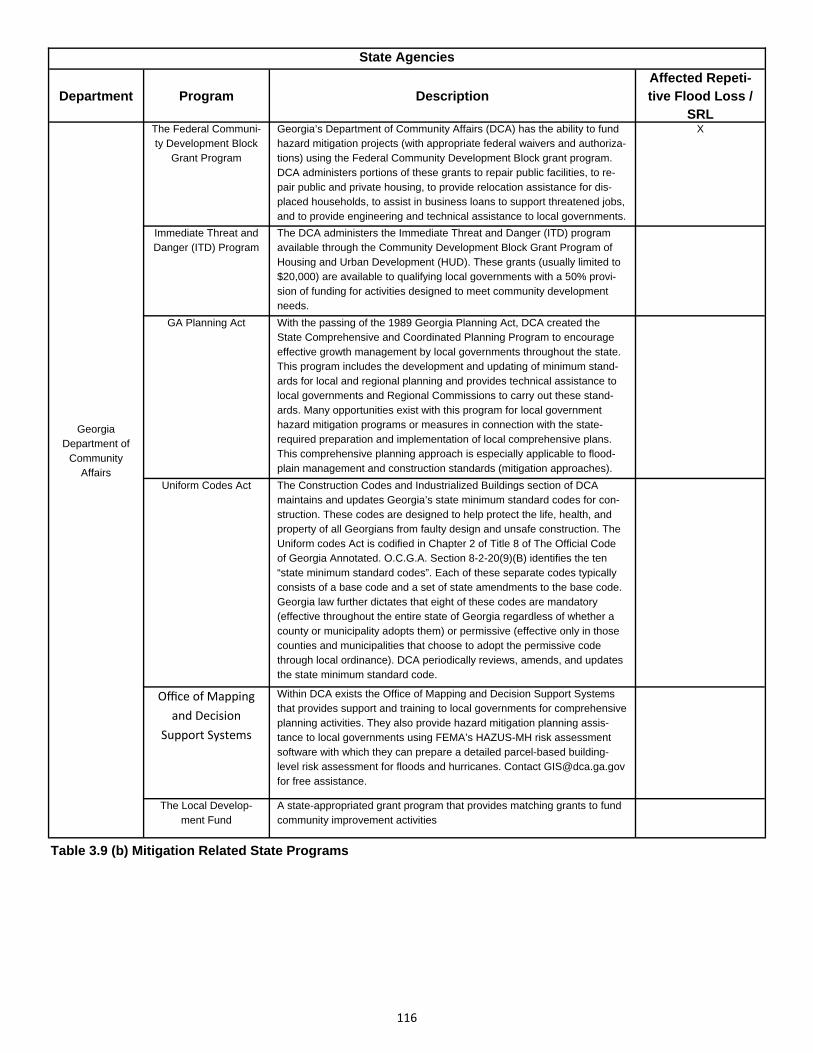
116
State Agencies
Department Program Description Affected Repeti-tive Flood Loss /
SRL
Georgia Department of
Community Affairs
The Federal Communi-ty Development Block
Grant Program
Georgia’s Department of Community Affairs (DCA) has the ability to fund hazard mitigation projects (with appropriate federal waivers and authoriza-tions) using the Federal Community Development Block grant program. DCA administers portions of these grants to repair public facilities, to re-pair public and private housing, to provide relocation assistance for dis-placed households, to assist in business loans to support threatened jobs, and to provide engineering and technical assistance to local governments.
X
Immediate Threat and Danger (ITD) Program
The DCA administers the Immediate Threat and Danger (ITD) program available through the Community Development Block Grant Program of Housing and Urban Development (HUD). These grants (usually limited to $20,000) are available to qualifying local governments with a 50% provi-sion of funding for activities designed to meet community development needs.
GA Planning Act With the passing of the 1989 Georgia Planning Act, DCA created the State Comprehensive and Coordinated Planning Program to encourage effective growth management by local governments throughout the state. This program includes the development and updating of minimum stand-ards for local and regional planning and provides technical assistance to local governments and Regional Commissions to carry out these stand-ards. Many opportunities exist with this program for local government hazard mitigation programs or measures in connection with the state-required preparation and implementation of local comprehensive plans. This comprehensive planning approach is especially applicable to flood-plain management and construction standards (mitigation approaches).
Uniform Codes Act The Construction Codes and Industrialized Buildings section of DCA maintains and updates Georgia’s state minimum standard codes for con-struction. These codes are designed to help protect the life, health, and property of all Georgians from faulty design and unsafe construction. The Uniform codes Act is codified in Chapter 2 of Title 8 of The Official Code of Georgia Annotated. O.C.G.A. Section 8-2-20(9)(B) identifies the ten “state minimum standard codes”. Each of these separate codes typically consists of a base code and a set of state amendments to the base code. Georgia law further dictates that eight of these codes are mandatory (effective throughout the entire state of Georgia regardless of whether a county or municipality adopts them) or permissive (effective only in those counties and municipalities that choose to adopt the permissive code through local ordinance). DCA periodically reviews, amends, and updates the state minimum standard code.
Office of Mapping
and Decision
Support Systems
Within DCA exists the Office of Mapping and Decision Support Systems that provides support and training to local governments for comprehensive planning activities. They also provide hazard mitigation planning assis-tance to local governments using FEMA’s HAZUS-MH risk assessment software with which they can prepare a detailed parcel-based building-level risk assessment for floods and hurricanes. Contact [email protected] for free assistance.
The Local Develop-ment Fund
A state-appropriated grant program that provides matching grants to fund community improvement activities
Table 3.9 (b) Mitigation Related State Programs
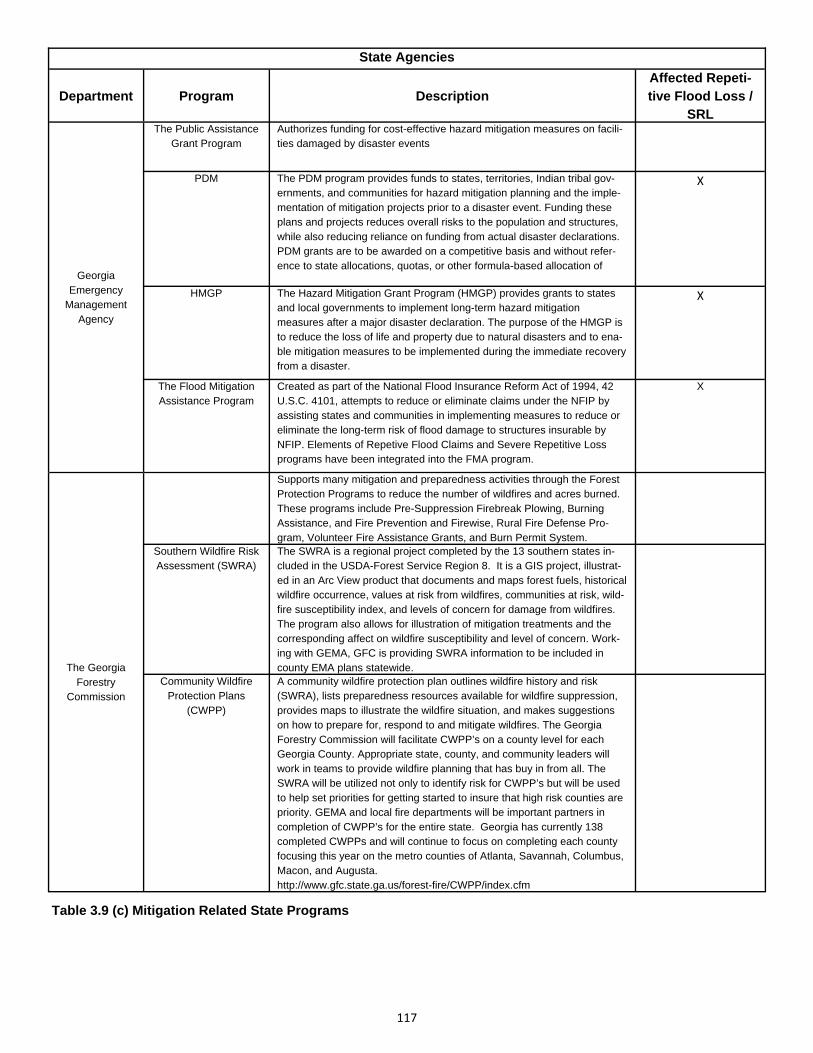
117
State Agencies
Department Program Description Affected Repeti-tive Flood Loss /
SRL
Georgia Emergency
Management Agency
The Public Assistance Grant Program
Authorizes funding for cost-effective hazard mitigation measures on facili-ties damaged by disaster events
PDM The PDM program provides funds to states, territories, Indian tribal gov-ernments, and communities for hazard mitigation planning and the imple-mentation of mitigation projects prior to a disaster event. Funding these plans and projects reduces overall risks to the population and structures, while also reducing reliance on funding from actual disaster declarations. PDM grants are to be awarded on a competitive basis and without refer-ence to state allocations, quotas, or other formula-based allocation of
X
HMGP The Hazard Mitigation Grant Program (HMGP) provides grants to states and local governments to implement long-term hazard mitigation measures after a major disaster declaration. The purpose of the HMGP is to reduce the loss of life and property due to natural disasters and to ena-ble mitigation measures to be implemented during the immediate recovery from a disaster.
X
The Flood Mitigation Assistance Program
Created as part of the National Flood Insurance Reform Act of 1994, 42 U.S.C. 4101, attempts to reduce or eliminate claims under the NFIP by assisting states and communities in implementing measures to reduce or eliminate the long-term risk of flood damage to structures insurable by NFIP. Elements of Repetive Flood Claims and Severe Repetitive Loss programs have been integrated into the FMA program.
X
The Georgia Forestry
Commission
Supports many mitigation and preparedness activities through the Forest Protection Programs to reduce the number of wildfires and acres burned. These programs include Pre-Suppression Firebreak Plowing, Burning Assistance, and Fire Prevention and Firewise, Rural Fire Defense Pro-gram, Volunteer Fire Assistance Grants, and Burn Permit System.
Southern Wildfire Risk Assessment (SWRA)
The SWRA is a regional project completed by the 13 southern states in-cluded in the USDA-Forest Service Region 8. It is a GIS project, illustrat-ed in an Arc View product that documents and maps forest fuels, historical wildfire occurrence, values at risk from wildfires, communities at risk, wild-fire susceptibility index, and levels of concern for damage from wildfires. The program also allows for illustration of mitigation treatments and the corresponding affect on wildfire susceptibility and level of concern. Work-ing with GEMA, GFC is providing SWRA information to be included in county EMA plans statewide.
Community Wildfire Protection Plans
(CWPP)
A community wildfire protection plan outlines wildfire history and risk (SWRA), lists preparedness resources available for wildfire suppression, provides maps to illustrate the wildfire situation, and makes suggestions on how to prepare for, respond to and mitigate wildfires. The Georgia Forestry Commission will facilitate CWPP’s on a county level for each Georgia County. Appropriate state, county, and community leaders will work in teams to provide wildfire planning that has buy in from all. The SWRA will be utilized not only to identify risk for CWPP’s but will be used to help set priorities for getting started to insure that high risk counties are priority. GEMA and local fire departments will be important partners in completion of CWPP’s for the entire state. Georgia has currently 138 completed CWPPs and will continue to focus on completing each county focusing this year on the metro counties of Atlanta, Savannah, Columbus, Macon, and Augusta. http://www.gfc.state.ga.us/forest-fire/CWPP/index.cfm
Table 3.9 (c) Mitigation Related State Programs
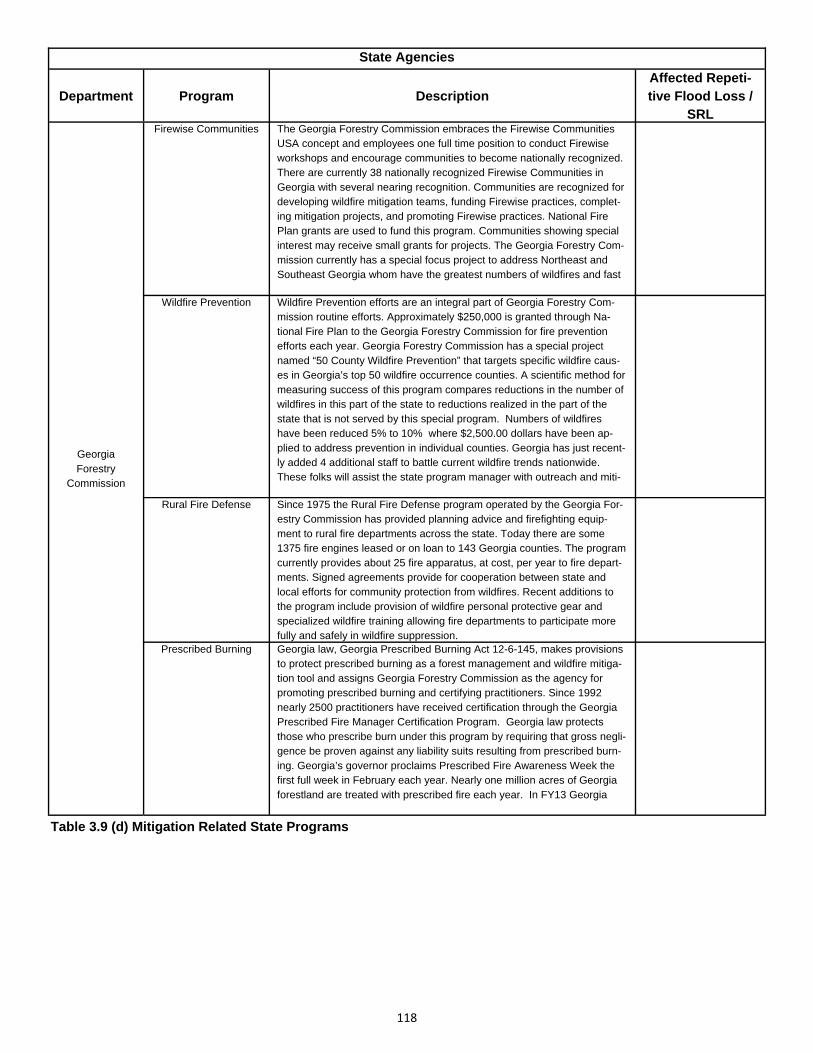
118
State Agencies
Department Program Description Affected Repeti-tive Flood Loss /
SRL
Georgia Forestry
Commission
Firewise Communities The Georgia Forestry Commission embraces the Firewise Communities USA concept and employees one full time position to conduct Firewise workshops and encourage communities to become nationally recognized. There are currently 38 nationally recognized Firewise Communities in Georgia with several nearing recognition. Communities are recognized for developing wildfire mitigation teams, funding Firewise practices, complet-ing mitigation projects, and promoting Firewise practices. National Fire Plan grants are used to fund this program. Communities showing special interest may receive small grants for projects. The Georgia Forestry Com-mission currently has a special focus project to address Northeast and Southeast Georgia whom have the greatest numbers of wildfires and fast
Wildfire Prevention Wildfire Prevention efforts are an integral part of Georgia Forestry Com-mission routine efforts. Approximately $250,000 is granted through Na-tional Fire Plan to the Georgia Forestry Commission for fire prevention efforts each year. Georgia Forestry Commission has a special project named “50 County Wildfire Prevention” that targets specific wildfire caus-es in Georgia’s top 50 wildfire occurrence counties. A scientific method for measuring success of this program compares reductions in the number of wildfires in this part of the state to reductions realized in the part of the state that is not served by this special program. Numbers of wildfires have been reduced 5% to 10% where $2,500.00 dollars have been ap-plied to address prevention in individual counties. Georgia has just recent-ly added 4 additional staff to battle current wildfire trends nationwide. These folks will assist the state program manager with outreach and miti-
Rural Fire Defense Since 1975 the Rural Fire Defense program operated by the Georgia For-estry Commission has provided planning advice and firefighting equip-ment to rural fire departments across the state. Today there are some 1375 fire engines leased or on loan to 143 Georgia counties. The program currently provides about 25 fire apparatus, at cost, per year to fire depart-ments. Signed agreements provide for cooperation between state and local efforts for community protection from wildfires. Recent additions to the program include provision of wildfire personal protective gear and specialized wildfire training allowing fire departments to participate more fully and safely in wildfire suppression.
Prescribed Burning Georgia law, Georgia Prescribed Burning Act 12-6-145, makes provisions to protect prescribed burning as a forest management and wildfire mitiga-tion tool and assigns Georgia Forestry Commission as the agency for promoting prescribed burning and certifying practitioners. Since 1992 nearly 2500 practitioners have received certification through the Georgia Prescribed Fire Manager Certification Program. Georgia law protects those who prescribe burn under this program by requiring that gross negli-gence be proven against any liability suits resulting from prescribed burn-ing. Georgia’s governor proclaims Prescribed Fire Awareness Week the first full week in February each year. Nearly one million acres of Georgia forestland are treated with prescribed fire each year. In FY13 Georgia
Table 3.9 (d) Mitigation Related State Programs
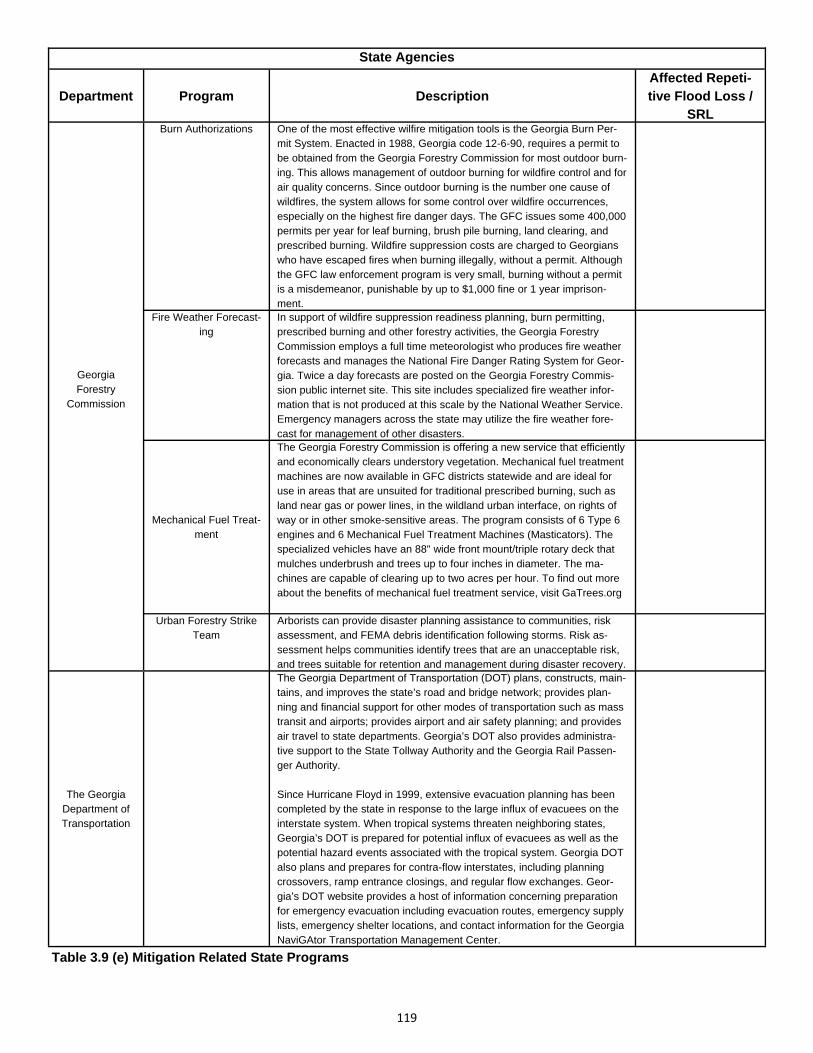
119
State Agencies
Department Program Description Affected Repeti-tive Flood Loss /
SRL
Georgia Forestry
Commission
Burn Authorizations One of the most effective wilfire mitigation tools is the Georgia Burn Per-mit System. Enacted in 1988, Georgia code 12-6-90, requires a permit to be obtained from the Georgia Forestry Commission for most outdoor burn-ing. This allows management of outdoor burning for wildfire control and for air quality concerns. Since outdoor burning is the number one cause of wildfires, the system allows for some control over wildfire occurrences, especially on the highest fire danger days. The GFC issues some 400,000 permits per year for leaf burning, brush pile burning, land clearing, and prescribed burning. Wildfire suppression costs are charged to Georgians who have escaped fires when burning illegally, without a permit. Although the GFC law enforcement program is very small, burning without a permit is a misdemeanor, punishable by up to $1,000 fine or 1 year imprison-ment.
Fire Weather Forecast-ing
In support of wildfire suppression readiness planning, burn permitting, prescribed burning and other forestry activities, the Georgia Forestry Commission employs a full time meteorologist who produces fire weather forecasts and manages the National Fire Danger Rating System for Geor-gia. Twice a day forecasts are posted on the Georgia Forestry Commis-sion public internet site. This site includes specialized fire weather infor-mation that is not produced at this scale by the National Weather Service. Emergency managers across the state may utilize the fire weather fore-cast for management of other disasters.
Mechanical Fuel Treat-ment
The Georgia Forestry Commission is offering a new service that efficiently and economically clears understory vegetation. Mechanical fuel treatment machines are now available in GFC districts statewide and are ideal for use in areas that are unsuited for traditional prescribed burning, such as land near gas or power lines, in the wildland urban interface, on rights of way or in other smoke-sensitive areas. The program consists of 6 Type 6 engines and 6 Mechanical Fuel Treatment Machines (Masticators). The specialized vehicles have an 88" wide front mount/triple rotary deck that mulches underbrush and trees up to four inches in diameter. The ma-chines are capable of clearing up to two acres per hour. To find out more about the benefits of mechanical fuel treatment service, visit GaTrees.org
Urban Forestry Strike Team
Arborists can provide disaster planning assistance to communities, risk assessment, and FEMA debris identification following storms. Risk as-sessment helps communities identify trees that are an unacceptable risk, and trees suitable for retention and management during disaster recovery.
The Georgia Department of Transportation
The Georgia Department of Transportation (DOT) plans, constructs, main-tains, and improves the state’s road and bridge network; provides plan-ning and financial support for other modes of transportation such as mass transit and airports; provides airport and air safety planning; and provides air travel to state departments. Georgia’s DOT also provides administra-tive support to the State Tollway Authority and the Georgia Rail Passen-ger Authority. Since Hurricane Floyd in 1999, extensive evacuation planning has been completed by the state in response to the large influx of evacuees on the interstate system. When tropical systems threaten neighboring states, Georgia’s DOT is prepared for potential influx of evacuees as well as the potential hazard events associated with the tropical system. Georgia DOT also plans and prepares for contra-flow interstates, including planning crossovers, ramp entrance closings, and regular flow exchanges. Geor-gia’s DOT website provides a host of information concerning preparation for emergency evacuation including evacuation routes, emergency supply lists, emergency shelter locations, and contact information for the Georgia NaviGAtor Transportation Management Center.
Table 3.9 (e) Mitigation Related State Programs
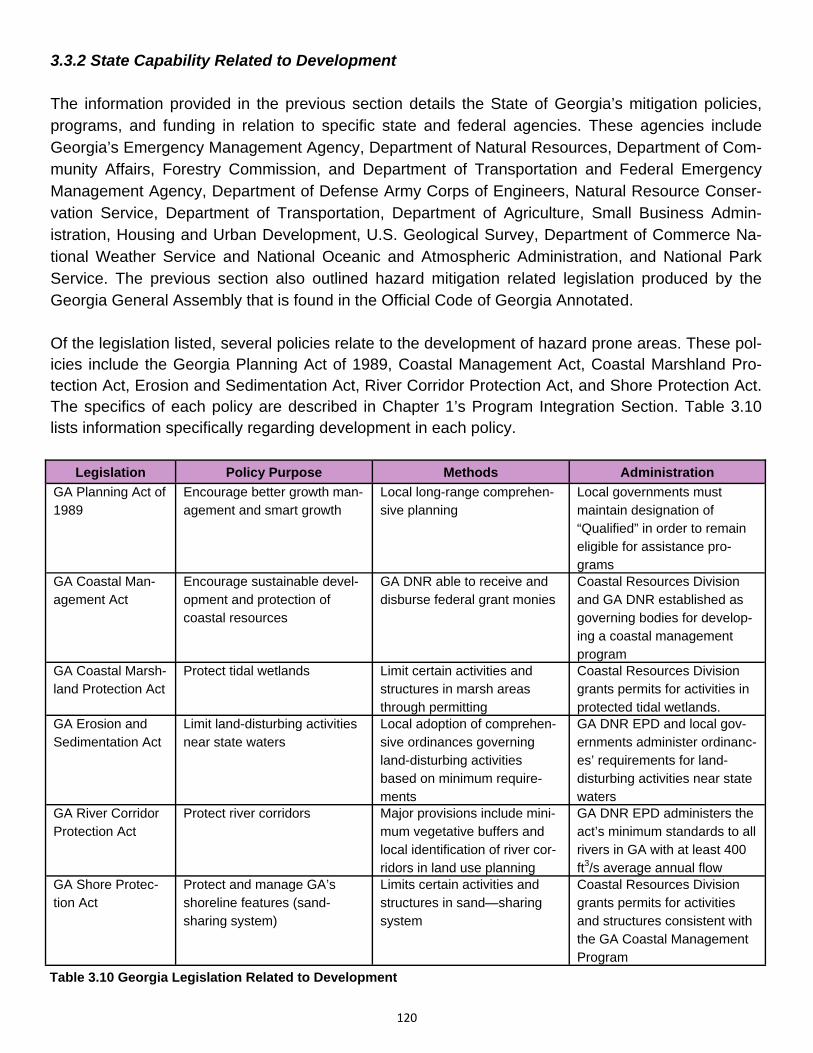
120
3.3.2 State Capability Related to Development
The information provided in the previous section details the State of Georgia’s mitigation policies, programs, and funding in relation to specific state and federal agencies. These agencies include Georgia’s Emergency Management Agency, Department of Natural Resources, Department of Com-munity Affairs, Forestry Commission, and Department of Transportation and Federal Emergency Management Agency, Department of Defense Army Corps of Engineers, Natural Resource Conser-vation Service, Department of Transportation, Department of Agriculture, Small Business Admin-istration, Housing and Urban Development, U.S. Geological Survey, Department of Commerce Na-tional Weather Service and National Oceanic and Atmospheric Administration, and National Park Service. The previous section also outlined hazard mitigation related legislation produced by the Georgia General Assembly that is found in the Official Code of Georgia Annotated. Of the legislation listed, several policies relate to the development of hazard prone areas. These pol-icies include the Georgia Planning Act of 1989, Coastal Management Act, Coastal Marshland Pro-tection Act, Erosion and Sedimentation Act, River Corridor Protection Act, and Shore Protection Act. The specifics of each policy are described in Chapter 1’s Program Integration Section. Table 3.10 lists information specifically regarding development in each policy.
Legislation Policy Purpose Methods Administration
GA Planning Act of 1989
Encourage better growth man-agement and smart growth
Local long-range comprehen-sive planning
Local governments must maintain designation of “Qualified” in order to remain eligible for assistance pro-grams
GA Coastal Man-agement Act
Encourage sustainable devel-opment and protection of coastal resources
GA DNR able to receive and disburse federal grant monies
Coastal Resources Division and GA DNR established as governing bodies for develop-ing a coastal management program
GA Coastal Marsh-land Protection Act
Protect tidal wetlands Limit certain activities and structures in marsh areas through permitting
Coastal Resources Division grants permits for activities in protected tidal wetlands.
GA Erosion and Sedimentation Act
Limit land-disturbing activities near state waters
Local adoption of comprehen-sive ordinances governing land-disturbing activities based on minimum require-ments
GA DNR EPD and local gov-ernments administer ordinanc-es’ requirements for land-disturbing activities near state waters
GA River Corridor Protection Act
Protect river corridors Major provisions include mini-mum vegetative buffers and local identification of river cor-ridors in land use planning
GA DNR EPD administers the act’s minimum standards to all rivers in GA with at least 400 ft3/s average annual flow
GA Shore Protec-tion Act
Protect and manage GA’s shoreline features (sand-sharing system)
Limits certain activities and structures in sand—sharing system
Coastal Resources Division grants permits for activities and structures consistent with the GA Coastal Management Program
Table 3.10 Georgia Legislation Related to Development
121
The State of Georgia’s policies regarding development in hazard prone areas specifically cover the areas prone to inland and coastal flooding hazards. These policies neglect to cover development in areas prone to other hazards such as wind and seismic hazards. However, the Georgia legislation does include building code standards that regulate the actual structure instead of the development of the area. These policies are discussed in the following section of this chapter that concerns local ca-pabilities. Other Georgia legislation concerns wildfire management, however, the legislation does not address development in wildfire prone areas. Other hazards such as tornadoes, severe weather, winter storms, and drought are not addressed by development-regulating legislation due to the haz-ards’ not being spatially definable. In other words, all areas of the State of Georgia could be consid-ered prone to tornadoes, severe weather, winter storms, and drought; therefore, the general devel-opment policy (Georgia Planning Act of 1989) applies statewide. By including the statewide Planning Act of 1989 and additional legislation that addresses development in flooding-prone areas, the State of Georgia’s policies related to development in hazard prone areas is effective and increases the state’s hazard mitigation capabilities. 3.4 LOCAL CAPABILITY ASSESSMENT The local capability assessment includes discussion of local policies governing building codes zon-ing and floodplain management that relate to hazard mitigation. This is followed by a discussion on the history and purpose of local mitigation planning, which increases local capability. Details of the current progress of local planning as well as the specific status of each Georgia County are further discussed in Chapter 4 of this document.
3.4.1 Local Mitigation Policies: Building Codes, Zoning, Floodplain Development Regulations and Mitigation Planning Of the state legislation listed in previous sections, several policies relate to the construction stand-ards or building codes enforced at the local level. The State provides guidance to the communities by offering model ordinances and available grant opportunities to communities interested in adopting hazard mitigation actions. These policies include Georgia’s state minimum standard codes for con-struction (the Uniform Codes Act) and the Uniform Standards Code for Manufactured Homes and Installation of Manufactured and Mobile Homes Act. The State encourages local communities to for-mally adopt the latest Georgia State Minimum Codes to be uniformly applied and consistently en-forced in the community. DCA updates these model codes whenever the latest International Codes are released to stay current with best practices. Georgia’s state minimum standard codes for construction are designed to help protect the life and property of citizens from faulty design and construction; unsafe, unsound, and unhealthy structures and conditions; and the financial hardship resulting from rebuilding after a hazard event. In other words, these codes require a minimum standard of construction which minimally mitigates certain hazards (i.e. high winds, severe thunderstorms, etc.). The Uniform Codes Act identifies the ten “state minimum standard codes” with each code typically consisting of a base code and a set of state amendments. Georgia law dictates that eight of the 10 codes are mandatory (applicable to all con-struction regardless of local enforcement) and two are permissive (only applicable if the local gov-
122
ernment chooses to adopt and enforce). The codes are as follows: Mandatory Codes:
Georgia State Minimum Standard Building Code (International Building Code with Georgia Amendments)
Georgia State Minimum Standard One and Two Family Dwelling Code (International Resi-dential Code for One and Two Family Dwellings with Georgia Amendments)
Georgia State Minimum Standard Fire Code (International Fire Code with Georgia Amend-ments)
Georgia State Minimum Standard Plumbing Code (International Plumbing Code with Georgia Amendments)
Georgia State Minimum Standard Mechanical Code (International Mechanical Code with Georgia Amendments)
Georgia State Minimum Standard Gas Code (International Fuel Gas Code with Georgia Amendments)
Georgia State Minimum Standard Electrical Code (National Electrical Code with Georgia Amendments)
Georgia State Minimum Standard Energy Code (International Energy Conservation Code with Georgia Supplements and Amendments)
Permissive Codes:
International Property Maintenance Code
International Existing Building Code As previously noted, the building, one and two family dwelling, fire, plumbing, mechanical, gas, elec-trical and energy codes are mandatory codes. Essentially, Georgia law dictates that any structure built in the state must comply with the applicable mandatory codes regardless of the local govern-ment’s decision to locally enforce. Though local governments do not adopt the mandatory codes, the local government must adopt administrative procedures in order to enforce the codes. However, the local government has the ability to choose which mandatory codes are enforced. The remaining codes, known as permissive codes, must be adopted by either ordinance or resolution by the local jurisdiction in order for the local government to enforce. In order to properly administer and enforce the state minimum standard codes, local governments must adopt reasonable administrative provisions which should include procedural requirements for code enforcement, provisions for hearings and appeals, and other procedures necessary for the proper local administration and enforcement of the state minimum standard codes. The power to adopt these administrative procedures is set forth in OCGA Section 8-2-26(a)(1) and includes pow-ers such as:
Building and structure inspection ensuring code compliance;
Inspector and personnel employment ensuring proper code enforcement;
Permit issuance and related charges; and
Contracting with other local governments for code enforcement.
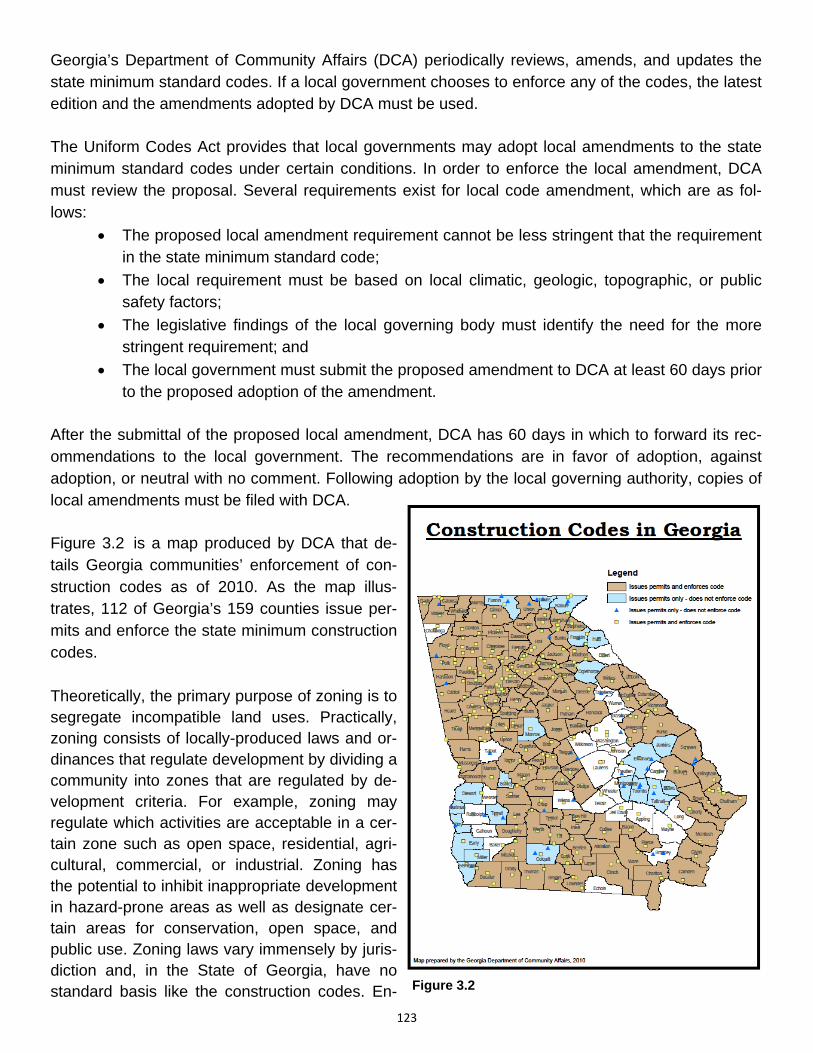
123
Georgia’s Department of Community Affairs (DCA) periodically reviews, amends, and updates the state minimum standard codes. If a local government chooses to enforce any of the codes, the latest edition and the amendments adopted by DCA must be used. The Uniform Codes Act provides that local governments may adopt local amendments to the state minimum standard codes under certain conditions. In order to enforce the local amendment, DCA must review the proposal. Several requirements exist for local code amendment, which are as fol-lows:
The proposed local amendment requirement cannot be less stringent that the requirement in the state minimum standard code;
The local requirement must be based on local climatic, geologic, topographic, or public safety factors;
The legislative findings of the local governing body must identify the need for the more stringent requirement; and
The local government must submit the proposed amendment to DCA at least 60 days prior to the proposed adoption of the amendment.
After the submittal of the proposed local amendment, DCA has 60 days in which to forward its rec-ommendations to the local government. The recommendations are in favor of adoption, against adoption, or neutral with no comment. Following adoption by the local governing authority, copies of local amendments must be filed with DCA. Figure 3.2 is a map produced by DCA that de-tails Georgia communities’ enforcement of con-struction codes as of 2010. As the map illus-trates, 112 of Georgia’s 159 counties issue per-mits and enforce the state minimum construction codes. Theoretically, the primary purpose of zoning is to segregate incompatible land uses. Practically, zoning consists of locally-produced laws and or-dinances that regulate development by dividing a community into zones that are regulated by de-velopment criteria. For example, zoning may regulate which activities are acceptable in a cer-tain zone such as open space, residential, agri-cultural, commercial, or industrial. Zoning has the potential to inhibit inappropriate development in hazard-prone areas as well as designate cer-tain areas for conservation, open space, and public use. Zoning laws vary immensely by juris-diction and, in the State of Georgia, have no standard basis like the construction codes. En- Figure 3.2
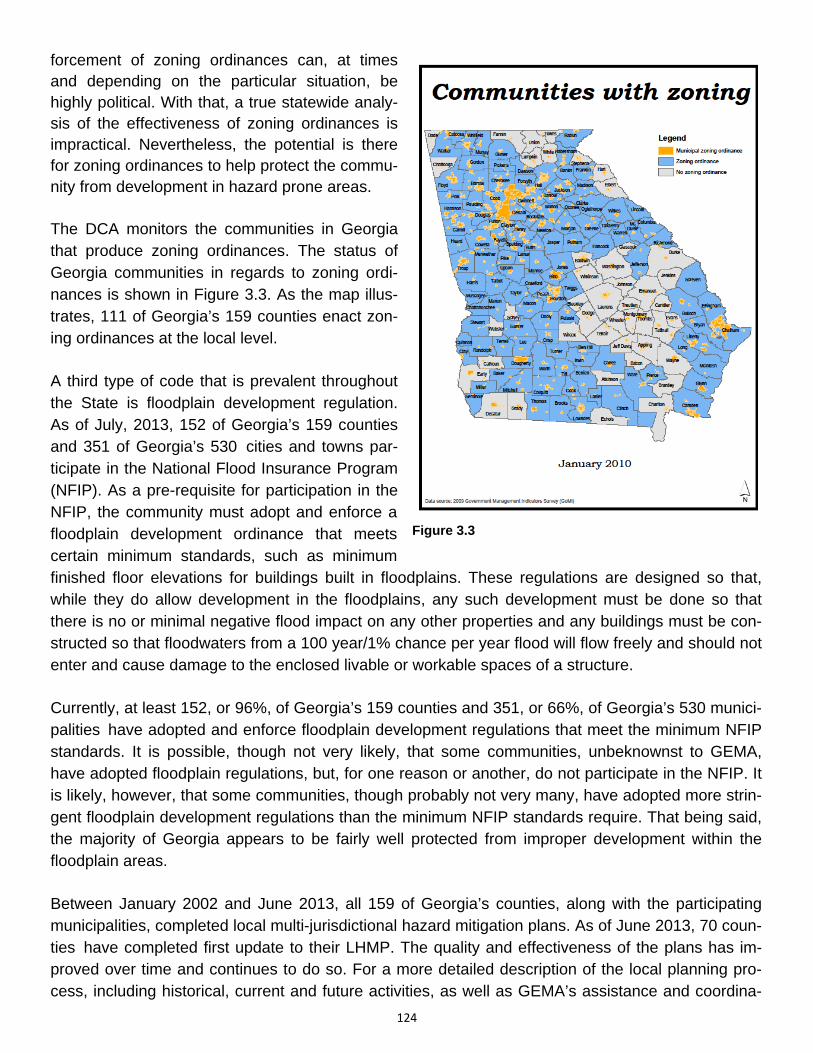
124
forcement of zoning ordinances can, at times and depending on the particular situation, be highly political. With that, a true statewide analy-sis of the effectiveness of zoning ordinances is impractical. Nevertheless, the potential is there for zoning ordinances to help protect the commu-nity from development in hazard prone areas. The DCA monitors the communities in Georgia that produce zoning ordinances. The status of Georgia communities in regards to zoning ordi-nances is shown in Figure 3.3. As the map illus-trates, 111 of Georgia’s 159 counties enact zon-ing ordinances at the local level. A third type of code that is prevalent throughout the State is floodplain development regulation. As of July, 2013, 152 of Georgia’s 159 counties and 351 of Georgia’s 530 cities and towns par-ticipate in the National Flood Insurance Program (NFIP). As a pre-requisite for participation in the NFIP, the community must adopt and enforce a floodplain development ordinance that meets certain minimum standards, such as minimum finished floor elevations for buildings built in floodplains. These regulations are designed so that, while they do allow development in the floodplains, any such development must be done so that there is no or minimal negative flood impact on any other properties and any buildings must be con-structed so that floodwaters from a 100 year/1% chance per year flood will flow freely and should not enter and cause damage to the enclosed livable or workable spaces of a structure. Currently, at least 152, or 96%, of Georgia’s 159 counties and 351, or 66%, of Georgia’s 530 munici-palities have adopted and enforce floodplain development regulations that meet the minimum NFIP standards. It is possible, though not very likely, that some communities, unbeknownst to GEMA, have adopted floodplain regulations, but, for one reason or another, do not participate in the NFIP. It is likely, however, that some communities, though probably not very many, have adopted more strin-gent floodplain development regulations than the minimum NFIP standards require. That being said, the majority of Georgia appears to be fairly well protected from improper development within the floodplain areas.
Between January 2002 and June 2013, all 159 of Georgia’s counties, along with the participating municipalities, completed local multi-jurisdictional hazard mitigation plans. As of June 2013, 70 coun-ties have completed first update to their LHMP. The quality and effectiveness of the plans has im-proved over time and continues to do so. For a more detailed description of the local planning pro-cess, including historical, current and future activities, as well as GEMA’s assistance and coordina-
Figure 3.3
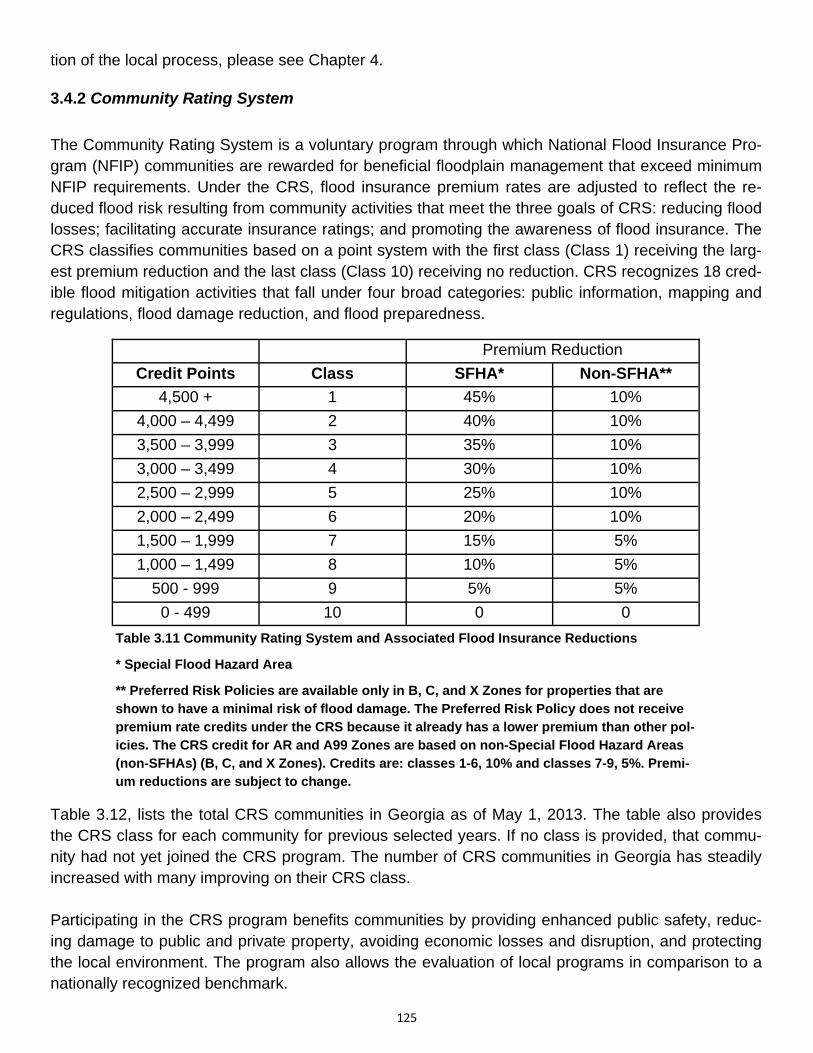
125
tion of the local process, please see Chapter 4.
3.4.2 Community Rating System
The Community Rating System is a voluntary program through which National Flood Insurance Pro-gram (NFIP) communities are rewarded for beneficial floodplain management that exceed minimum NFIP requirements. Under the CRS, flood insurance premium rates are adjusted to reflect the re-duced flood risk resulting from community activities that meet the three goals of CRS: reducing flood losses; facilitating accurate insurance ratings; and promoting the awareness of flood insurance. The CRS classifies communities based on a point system with the first class (Class 1) receiving the larg-est premium reduction and the last class (Class 10) receiving no reduction. CRS recognizes 18 cred-ible flood mitigation activities that fall under four broad categories: public information, mapping and regulations, flood damage reduction, and flood preparedness.
Table 3.12, lists the total CRS communities in Georgia as of May 1, 2013. The table also provides the CRS class for each community for previous selected years. If no class is provided, that commu-nity had not yet joined the CRS program. The number of CRS communities in Georgia has steadily increased with many improving on their CRS class. Participating in the CRS program benefits communities by providing enhanced public safety, reduc-ing damage to public and private property, avoiding economic losses and disruption, and protecting the local environment. The program also allows the evaluation of local programs in comparison to a nationally recognized benchmark.
Credit Points Class SFHA* Non-SFHA**
4,500 + 1 45% 10%
4,000 – 4,499 2 40% 10%
3,500 – 3,999 3 35% 10%
3,000 – 3,499 4 30% 10%
2,500 – 2,999 5 25% 10%
2,000 – 2,499 6 20% 10%
1,500 – 1,999 7 15% 5%
1,000 – 1,499 8 10% 5%
500 - 999 9 5% 5%
0 - 499 10 0 0
Premium Reduction
Table 3.11 Community Rating System and Associated Flood Insurance Reductions
* Special Flood Hazard Area
** Preferred Risk Policies are available only in B, C, and X Zones for properties that are shown to have a minimal risk of flood damage. The Preferred Risk Policy does not receive premium rate credits under the CRS because it already has a lower premium than other pol-icies. The CRS credit for AR and A99 Zones are based on non-Special Flood Hazard Areas (non-SFHAs) (B, C, and X Zones). Credits are: classes 1-6, 10% and classes 7-9, 5%. Premi-um reductions are subject to change.
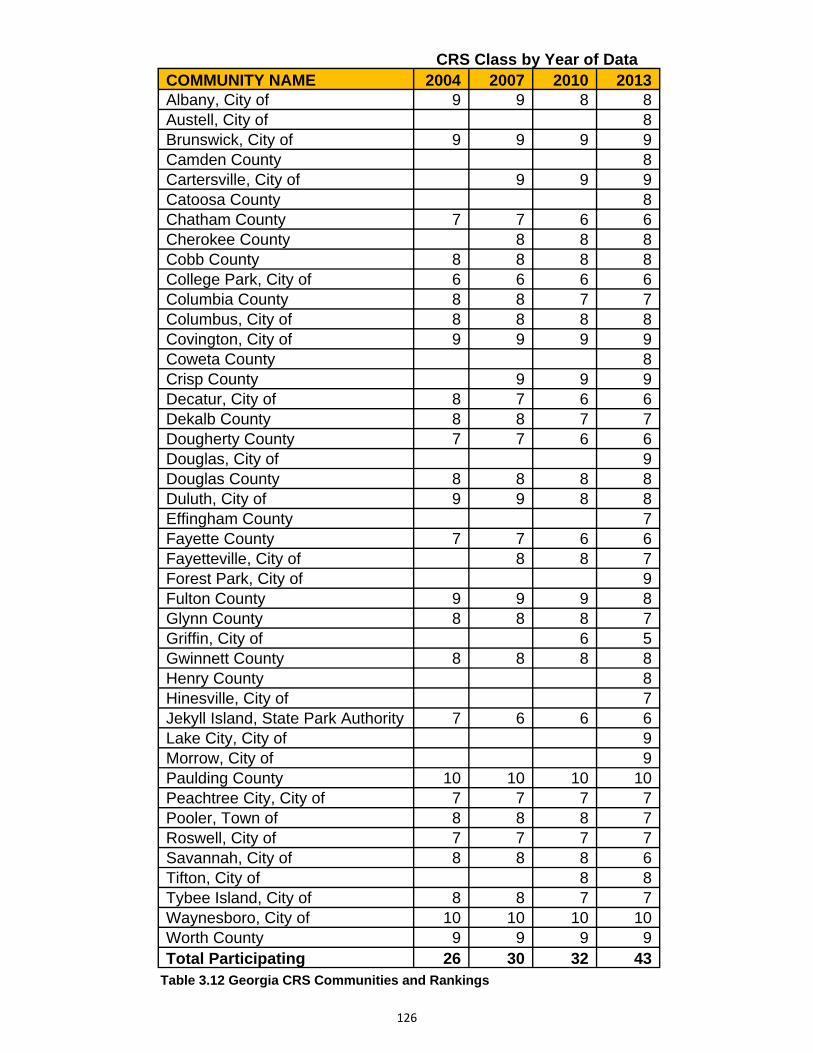
126
CRS Class by Year of Data COMMUNITY NAME 2004 2007 2010 2013 Albany, City of 9 9 8 8 Austell, City of 8 Brunswick, City of 9 9 9 9 Camden County 8 Cartersville, City of 9 9 9 Catoosa County 8 Chatham County 7 7 6 6 Cherokee County 8 8 8 Cobb County 8 8 8 8 College Park, City of 6 6 6 6 Columbia County 8 8 7 7 Columbus, City of 8 8 8 8 Covington, City of 9 9 9 9 Coweta County 8 Crisp County 9 9 9 Decatur, City of 8 7 6 6 Dekalb County 8 8 7 7 Dougherty County 7 7 6 6 Douglas, City of 9 Douglas County 8 8 8 8 Duluth, City of 9 9 8 8 Effingham County 7 Fayette County 7 7 6 6 Fayetteville, City of 8 8 7 Forest Park, City of 9 Fulton County 9 9 9 8 Glynn County 8 8 8 7 Griffin, City of 6 5 Gwinnett County 8 8 8 8 Henry County 8 Hinesville, City of 7 Jekyll Island, State Park Authority 7 6 6 6 Lake City, City of 9 Morrow, City of 9 Paulding County 10 10 10 10 Peachtree City, City of 7 7 7 7 Pooler, Town of 8 8 8 7 Roswell, City of 7 7 7 7 Savannah, City of 8 8 8 6 Tifton, City of 8 8 Tybee Island, City of 8 8 7 7 Waynesboro, City of 10 10 10 10 Worth County 9 9 9 9 Total Participating 26 30 32 43
Table 3.12 Georgia CRS Communities and Rankings
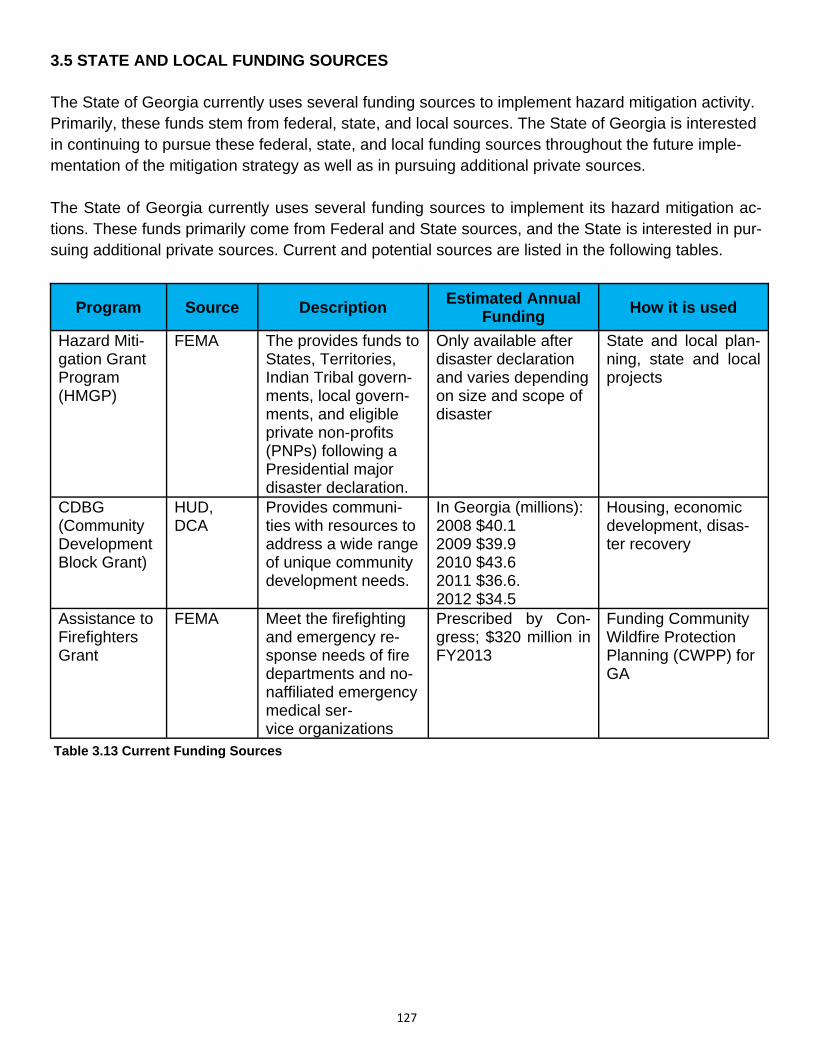
127
3.5 STATE AND LOCAL FUNDING SOURCES The State of Georgia currently uses several funding sources to implement hazard mitigation activity. Primarily, these funds stem from federal, state, and local sources. The State of Georgia is interested in continuing to pursue these federal, state, and local funding sources throughout the future imple-mentation of the mitigation strategy as well as in pursuing additional private sources. The State of Georgia currently uses several funding sources to implement its hazard mitigation ac-tions. These funds primarily come from Federal and State sources, and the State is interested in pur-suing additional private sources. Current and potential sources are listed in the following tables.
Program Source Description Estimated Annual
Funding How it is used
Hazard Miti-gation Grant Program (HMGP)
FEMA The provides funds to States, Territories, Indian Tribal govern-ments, local govern-ments, and eligible private non-profits (PNPs) following a Presidential major disaster declaration.
Only available after disaster declaration and varies depending on size and scope of disaster
State and local plan-ning, state and local projects
CDBG (Community Development Block Grant)
HUD, DCA
Provides communi-ties with resources to address a wide range of unique community development needs.
In Georgia (millions): 2008 $40.1 2009 $39.9 2010 $43.6 2011 $36.6. 2012 $34.5
Housing, economic development, disas-ter recovery
Assistance to Firefighters Grant
FEMA Meet the firefighting and emergency re-sponse needs of fire departments and no-naffiliated emergency medical ser-vice organizations
Prescribed by Con-gress; $320 million in FY2013
Funding Community Wildfire Protection Planning (CWPP) for GA
Table 3.13 Current Funding Sources
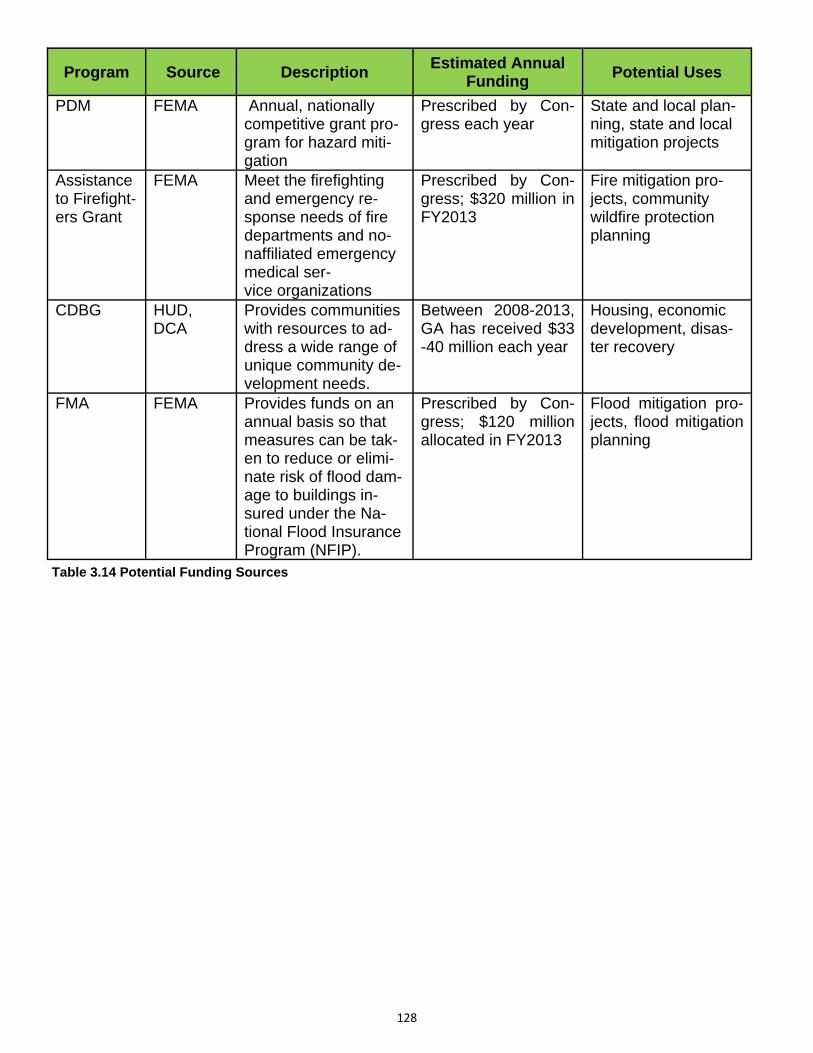
128
Program Source Description Estimated Annual
Funding Potential Uses
PDM FEMA Annual, nationally competitive grant pro-gram for hazard miti-gation
Prescribed by Con-gress each year
State and local plan-ning, state and local mitigation projects
Assistance to Firefight-ers Grant
FEMA Meet the firefighting and emergency re-sponse needs of fire departments and no-naffiliated emergency medical ser-vice organizations
Prescribed by Con-gress; $320 million in FY2013
Fire mitigation pro-jects, community wildfire protection planning
CDBG HUD, DCA
Provides communities with resources to ad-dress a wide range of unique community de-velopment needs.
Between 2008-2013, GA has received $33-40 million each year
Housing, economic development, disas-ter recovery
FMA FEMA Provides funds on an annual basis so that measures can be tak-en to reduce or elimi-nate risk of flood dam-age to buildings in-sured under the Na-tional Flood Insurance Program (NFIP).
Prescribed by Con-gress; $120 million allocated in FY2013
Flood mitigation pro-jects, flood mitigation planning
Table 3.14 Potential Funding Sources
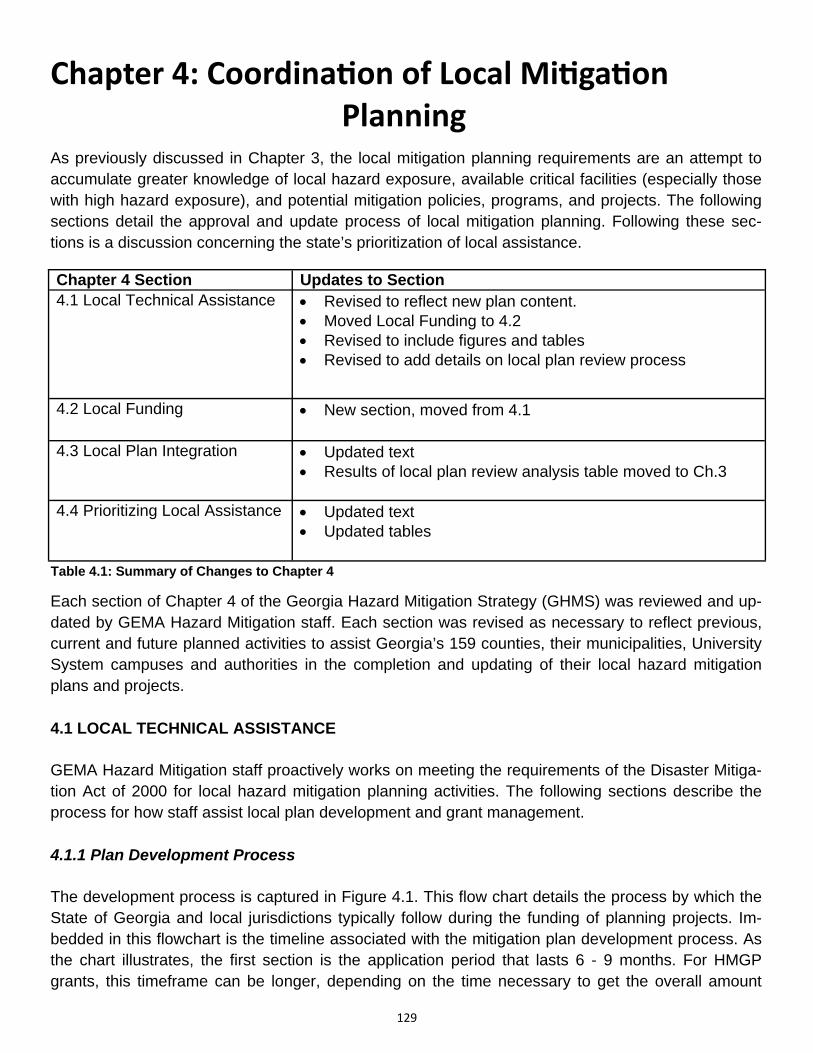
129
Chapter 4: Coordina on of Local Mi ga on Planning As previously discussed in Chapter 3, the local mitigation planning requirements are an attempt to accumulate greater knowledge of local hazard exposure, available critical facilities (especially those with high hazard exposure), and potential mitigation policies, programs, and projects. The following sections detail the approval and update process of local mitigation planning. Following these sec-tions is a discussion concerning the state’s prioritization of local assistance.
Each section of Chapter 4 of the Georgia Hazard Mitigation Strategy (GHMS) was reviewed and up-dated by GEMA Hazard Mitigation staff. Each section was revised as necessary to reflect previous, current and future planned activities to assist Georgia’s 159 counties, their municipalities, University System campuses and authorities in the completion and updating of their local hazard mitigation plans and projects. 4.1 LOCAL TECHNICAL ASSISTANCE GEMA Hazard Mitigation staff proactively works on meeting the requirements of the Disaster Mitiga-tion Act of 2000 for local hazard mitigation planning activities. The following sections describe the process for how staff assist local plan development and grant management. 4.1.1 Plan Development Process The development process is captured in Figure 4.1. This flow chart details the process by which the State of Georgia and local jurisdictions typically follow during the funding of planning projects. Im-bedded in this flowchart is the timeline associated with the mitigation plan development process. As the chart illustrates, the first section is the application period that lasts 6 - 9 months. For HMGP grants, this timeframe can be longer, depending on the time necessary to get the overall amount
Chapter 4 Section Updates to Section
4.1 Local Technical Assistance Revised to reflect new plan content. Moved Local Funding to 4.2 Revised to include figures and tables Revised to add details on local plan review process
4.2 Local Funding New section, moved from 4.1
4.3 Local Plan Integration Updated text Results of local plan review analysis table moved to Ch.3
4.4 Prioritizing Local Assistance Updated text Updated tables
Table 4.1: Summary of Changes to Chapter 4
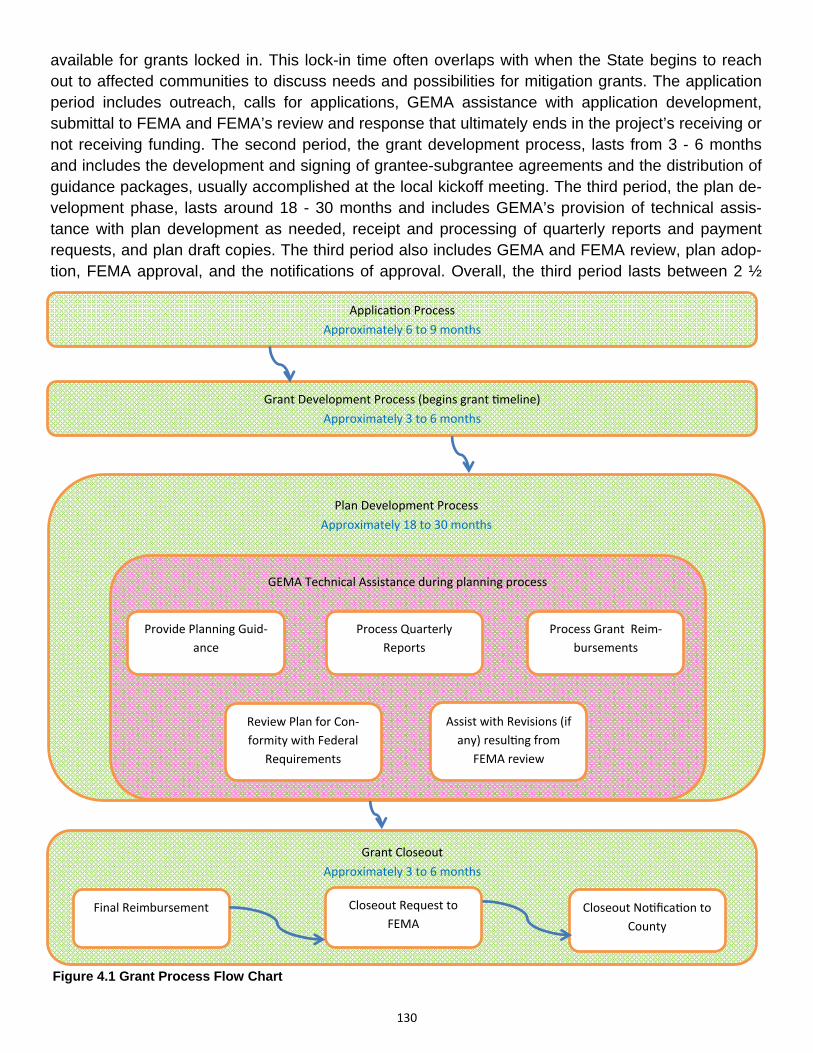
130
available for grants locked in. This lock-in time often overlaps with when the State begins to reach out to affected communities to discuss needs and possibilities for mitigation grants. The application period includes outreach, calls for applications, GEMA assistance with application development, submittal to FEMA and FEMA’s review and response that ultimately ends in the project’s receiving or not receiving funding. The second period, the grant development process, lasts from 3 - 6 months and includes the development and signing of grantee-subgrantee agreements and the distribution of guidance packages, usually accomplished at the local kickoff meeting. The third period, the plan de-velopment phase, lasts around 18 - 30 months and includes GEMA’s provision of technical assis-tance with plan development as needed, receipt and processing of quarterly reports and payment requests, and plan draft copies. The third period also includes GEMA and FEMA review, plan adop-tion, FEMA approval, and the notifications of approval. Overall, the third period lasts between 2 ½
Applica on Process
Approximately 6 to 9 months
Grant Development Process (begins grant meline)
Approximately 3 to 6 months
Plan Development Process
Approximately 18 to 30 months
GEMA Technical Assistance during planning process
Provide Planning Guid‐
ance
Process Quarterly
Reports
Process Grant Reim‐
bursements
Review Plan for Con‐
formity with Federal
Requirements
Assist with Revisions (if
any) resul ng from
FEMA review
Grant Closeout
Approximately 3 to 6 months
Final Reimbursement Closeout Request to
FEMA Closeout No fica on to
County
Figure 4.1 Grant Process Flow Chart
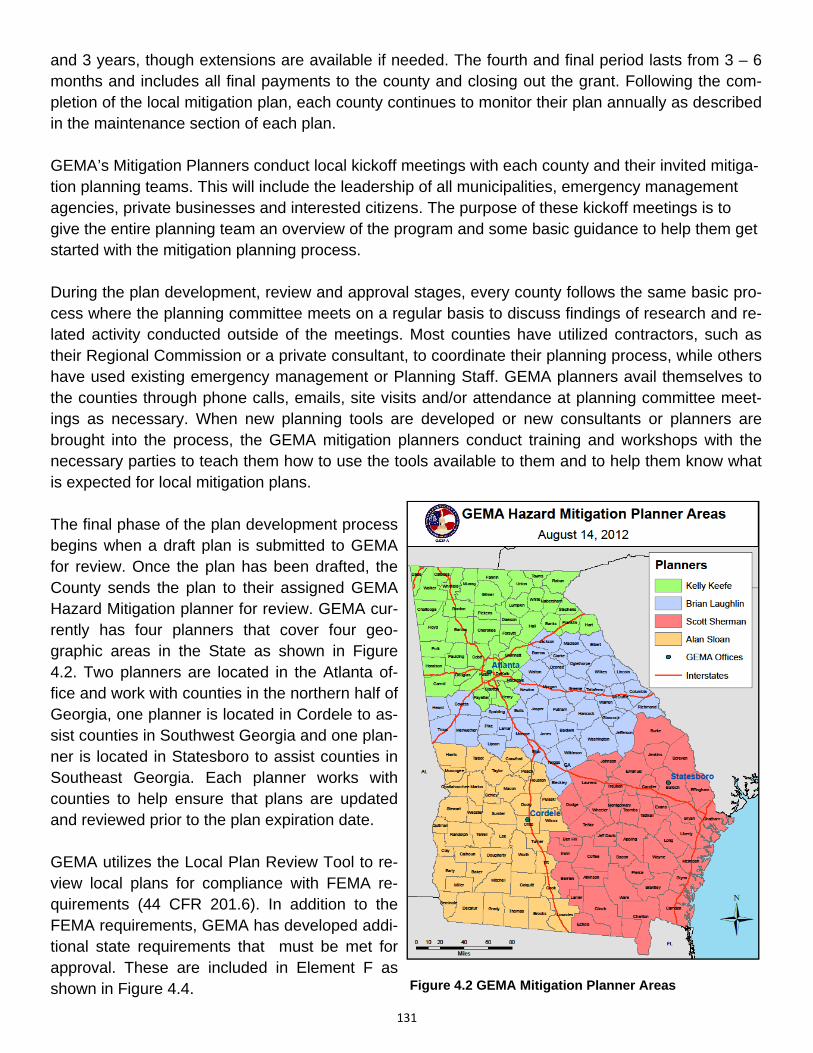
131
and 3 years, though extensions are available if needed. The fourth and final period lasts from 3 – 6 months and includes all final payments to the county and closing out the grant. Following the com-pletion of the local mitigation plan, each county continues to monitor their plan annually as described in the maintenance section of each plan. GEMA’s Mitigation Planners conduct local kickoff meetings with each county and their invited mitiga-tion planning teams. This will include the leadership of all municipalities, emergency management agencies, private businesses and interested citizens. The purpose of these kickoff meetings is to give the entire planning team an overview of the program and some basic guidance to help them get started with the mitigation planning process. During the plan development, review and approval stages, every county follows the same basic pro-cess where the planning committee meets on a regular basis to discuss findings of research and re-lated activity conducted outside of the meetings. Most counties have utilized contractors, such as their Regional Commission or a private consultant, to coordinate their planning process, while others have used existing emergency management or Planning Staff. GEMA planners avail themselves to the counties through phone calls, emails, site visits and/or attendance at planning committee meet-ings as necessary. When new planning tools are developed or new consultants or planners are brought into the process, the GEMA mitigation planners conduct training and workshops with the necessary parties to teach them how to use the tools available to them and to help them know what is expected for local mitigation plans. The final phase of the plan development process begins when a draft plan is submitted to GEMA for review. Once the plan has been drafted, the County sends the plan to their assigned GEMA Hazard Mitigation planner for review. GEMA cur-rently has four planners that cover four geo-graphic areas in the State as shown in Figure 4.2. Two planners are located in the Atlanta of-fice and work with counties in the northern half of Georgia, one planner is located in Cordele to as-sist counties in Southwest Georgia and one plan-ner is located in Statesboro to assist counties in Southeast Georgia. Each planner works with counties to help ensure that plans are updated and reviewed prior to the plan expiration date. GEMA utilizes the Local Plan Review Tool to re-view local plans for compliance with FEMA re-quirements (44 CFR 201.6). In addition to the FEMA requirements, GEMA has developed addi-tional state requirements that must be met for approval. These are included in Element F as shown in Figure 4.4. Figure 4.2 GEMA Mitigation Planner Areas
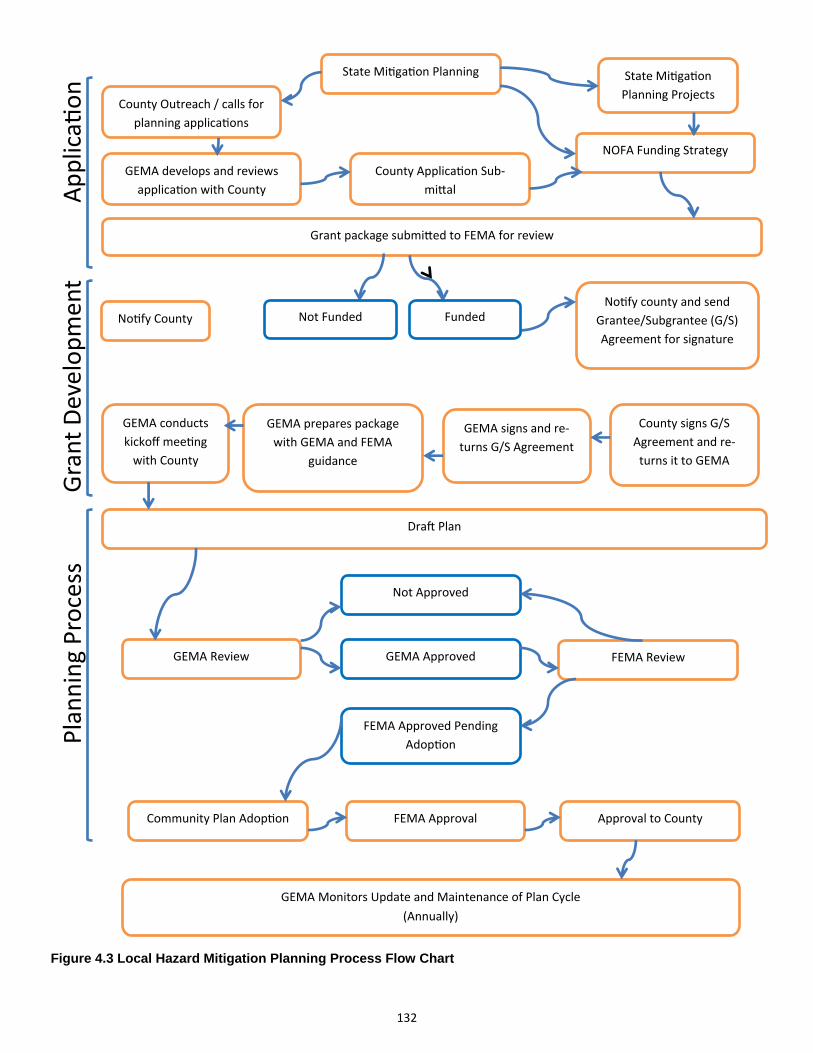
132
County Applica on Sub‐
mi al
State Mi ga on
Planning Projects
GEMA develops and reviews
applica on with County
NOFA Funding Strategy
No fy County
Grant package submi ed to FEMA for review
County Outreach / calls for
planning applica ons
State Mi ga on Planning
No fy county and send
Grantee/Subgrantee (G/S)
Agreement for signature
County signs G/S
Agreement and re‐
turns it to GEMA
GEMA signs and re‐
turns G/S Agreement
GEMA prepares package
with GEMA and FEMA
guidance
GEMA conducts
kickoff mee ng
with County
Dra Plan
GEMA Review FEMA Review
Community Plan Adop on FEMA Approval Approval to County
GEMA Monitors Update and Maintenance of Plan Cycle
(Annually)
FEMA Approved Pending
Adop on
GEMA Approved
Not Approved
Funded Not Funded
Planning Process
Applica
on
Grant Developmen
t
Figure 4.3 Local Hazard Mitigation Planning Process Flow Chart
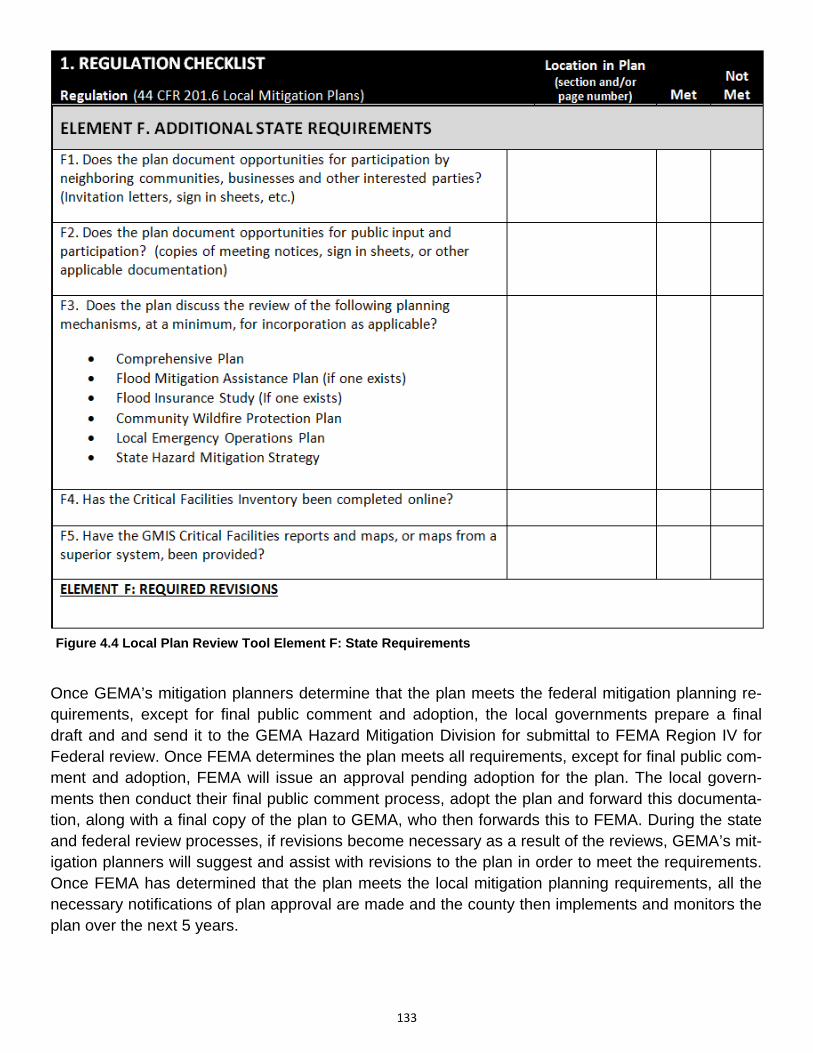
133
Once GEMA’s mitigation planners determine that the plan meets the federal mitigation planning re-quirements, except for final public comment and adoption, the local governments prepare a final draft and and send it to the GEMA Hazard Mitigation Division for submittal to FEMA Region IV for Federal review. Once FEMA determines the plan meets all requirements, except for final public com-ment and adoption, FEMA will issue an approval pending adoption for the plan. The local govern-ments then conduct their final public comment process, adopt the plan and forward this documenta-tion, along with a final copy of the plan to GEMA, who then forwards this to FEMA. During the state and federal review processes, if revisions become necessary as a result of the reviews, GEMA’s mit-igation planners will suggest and assist with revisions to the plan in order to meet the requirements. Once FEMA has determined that the plan meets the local mitigation planning requirements, all the necessary notifications of plan approval are made and the county then implements and monitors the plan over the next 5 years.
Figure 4.4 Local Plan Review Tool Element F: State Requirements
134
4.1.2 Local Planning Tools GEMA Hazard Mitigation staff continues to provide an array of tools to assist local communities with local hazard mitigation planning activities. This includes participating in local plan kickoff meetings, disseminating planning guides and documents via CDs and email, sharing information on available training and hosting planning workshops. Since the 2011 GHMS, the GEMA Hazard Mitigation website has been updated to provide infor-mation and resources on local hazard mitigation planning. Information found on the website include the current State Hazard Mitigation Strategy; FEMA planning guides, including but not limited to the How-to Guides, Disaster Mitigation Act of 2000, FEMA Mitigation Ideas and the Local Mitigation Planning Guidance with GEMA highlights (recently replaced by the Local Mitigation Planning Hand-book); GEMA planning documents and links to other useful resources. This website can be located from the GEMA webpage at http://www.gema.state.ga.us/ . Training is a vital resource to ensure that GEMA staff possesses the most effective capabilities to guide local communities in their planning efforts. Staying current on regulations, FEMA programs and best practices with appropriate FEMA mitigation training allows GEMA staff to advise local com-munities on maintaining regulatory compliance, maximize funding opportunities and improving local hazard mitigation planning. 4.2 LOCAL FUNDING Since the inception of the Federal local mitigation planning requirements, GEMA has assisted Geor-gia communities in locating and obtaining funding for plan development and updates. The planning team continues to use a grant application which addresses and provides examples of responses for both pre and post disaster grants. Upon completion of all parts of the grant application, the applicant should have an acceptable application that will have sufficient information for both of FEMA’s NEMIS and eGrants system, and to be found acceptable by FEMA. A copy of the application can be found in Appendix F. Each planning team member works very closely with the counties in their territory when developing these applications. The applications approved by FEMA are made part of the agreement between county, state and federal agencies; therefore they are prepared in great detail and fore-thought. In the eleven years Georgia has been involved in mitigation planning, the state has made use of two categories of mitigation grant sources, both of which have been provided by FEMA. These are Dis-aster Related Mitigation Programs and Non-Disaster Related Mitigation Programs. The primary dif-ference between the two categories is when and where they are available. Non-disaster related is available nationwide on a regular basis, regardless of the occurrence of disasters. Disaster related mitigation is only available in the aftermath of a declared disaster and is only available to the affect-ed state.
135
4.2.1 Disaster Related Mitigation Programs Due to a series of natural disasters which have affected the state in various forms and locations, funding for local plan development since 2009, has come solely in the form of the Hazard Mitigation Grant Program(HMGP grants), awarded by the President, provided by FEMA and administered by GEMA. One disaster, DR1973, has occurred since the 2011 approval. This disaster, in conjunction with previously declared disasters, provides sufficient funding for 155 of the 159 counties to update their plans over the course of the last several years and going into the next three.
For counties involved in a disaster, Governor Deal has authorized payment of 40% of the local match requirement by the State or 10% of the total grant amount, leaving the local government re-sponsible for only 60% of the remaining match or 15% of the total grant amount. In many cases this takes a large burden off the counties struck by disaster and whose assets have been depleted in their recovery. 4.2.2 Non-Disaster Related Mitigation Programs Historically, Georgia has used two non-disaster related mitigation programs to help local communi-ties develop and update their mitigation plans. These are the Pre-Disaster Mitigation (PDM) grant program and the Flood Mitigation Assistance (FMA) grant program. The primary difference is FMA is specifically for flood mitigation planning and, prior to October 2008, the FMA planning requirements were much more stringent. Due to a large number of disasters that have occurred in Georgia since 2007, it has not been necessary to utilize PDM since the 2008 grant cycle to fund mitigation plans. In 2008, Georgia used FMA funds for a limited number of FMA stand-alone plans. One of these (Glynn County) was only recently completed in 2012. Prior to October 2008, FMA planning require-ments were more stringent than local multi-hazard planning requirements. However, in 2008, FMA planning requirements were incorporated into the local multi-hazard planning requirements. There-fore, FEMA will no longer fund a stand-alone plan using FMA funds. If the State of Georgia finds itself in the fortunate position of not incurring any disasters over the next five years, the local applications will require financial assistance from the Pre-Disaster Mitigation or other available grant programs.
Table 4.2 Plan Updates Included in Recent Disasters (Current through September 30, 2013)
Disaster # Month/Year Total Project Costs # Applications Federal Share Approved
1686 3/2007 643,765 28 482,819
1750 3/2008 109,213 1 81,909
1761 6/2008 186,740 9 140,055
1833 5/2009 461,442 23 346,081
1858 9/2009 1,869,803 74 1,402,357
1973 4/2011 478,000 20 358,500
Total 3,748,963 155 2,811,721
136
4.2.3 Other Mitigation Funding Programs In addition to the multi-jurisdictional hazard mitigation plans discussed in Sections 4.2.1 and 4.2.2 above, GEMA has worked with various agencies on two other mitigation planning programs. The first was the Disaster Resistant University (DRU) program for college and university campuses. The oth-er was the Flood Mitigation Assistance (FMA) planning program for local governments. The Board of Regents of the University System of Georgia (USG), through a federal Pre-Disaster Mitigation (PDM) grant and GEMA, initialized the Disaster Resistant University (DRU) program for fiscal year 2003 (FY03). The PDM grant allowed all 35 public institutions within the USG to develop a hazard mitigation plan to meet the federal requirements of the Disaster Mitigation Act of 2000 and of the FEMA planning criteria promulgated in Title 44 of the Code of Federal (CFR) Regulations, 201.6 on Federal Register, 2-26-2002. Though the grant is no longer in effect, GEMA has continued to work with various campuses, as requested, in developing and updating their plans. As of December 2010, twenty-five of the thirty-six universities successfully completed hazard mitiga-tion plans. Each of the universities has been instructed to submit their plans to the counties they are located. They are also recommended to participate in the update of that county’s local hazard mitiga-tion plan during their next update. The inclusion of the university’s plan in the approved local plan makes them eligible for federal funds in the event they are affected by a presidentially approved haz-ardous event. All universities are headed up by the Board of Regents, which is a state agency, and are covered by the State Hazard Mitigation Plan. Therefore, state universities can apply for federal aid as a state entity in the event they are affected by a presidentially declared hazard event. Universities that par-ticipate in the update of a local hazard mitigation plan and have their plans included in that approved local plan, can apply for federal funding if they are subject to a presidentially declared event. Each DRU hazard mitigation plan includes a hazard, risk, and vulnerability assessment based on refined data and hazard maps provided by GEMA. The institutional level risk-based, data-driven miti-gation plans were created with clearly identified future mitigation goals and objectives that will ulti-mately lead to mitigation projects. This process and the provided data allow accurate risk and loss estimates which lead to more cost effective mitigation actions. The DRU program is an integral part of bridging non-traditional local and state partnerships within the context of emergency management. 4.3 LOCAL PLAN INTEGRATION Chapters 2 and 3 described the review of local plans to ascertain which hazards and mitigation ac-tions are identified in within those plans. The results of this review is utilized by GEMA Hazard Miti-gation staff in the assessment on how local plans are reviewed, coordinated and integrated into the state plan. With an increase in the percentage of counties identifying Wind, Hurricane Wind and Severe weath-er hazards in the local plans, the risk assessment and mitigation strategy of the state plan has been updated to include additional risk information and strategies to reflect this increase in local priority.
137
More significant changes were observed in the types of mitigation actions identified in local plans. The most notable is the decrease in Planning/Zoning actions identified from 88% in 2010 to 76% in 2013. Given that these types of actions have proven to have great value in reducing long-term risk, the mitigation strategy in the state plan was updated to include actions that support local planning and zoning efforts. In addition, GEMA Hazard Mitigation planners changed how they review local plans by creating the state requirement in the Plan Review Tool that asks if the plan references spe-cific planning mechanisms. An increase in non-mitigation actions such as preparedness and re-sponse indicates GEMA Hazard Mitigation staff should provide more effective education and training to local officials on hazard mitigation planning. Actions related to this have been integrated in the state mitigation strategy. 4.4 PRIORITIZING LOCAL ASSISTANCE The State of Georgia must utilize analytical methods for prioritizing the distribution of available fund-ing to communities and local jurisdictions. The first subsection discusses the methods the State uses for prioritizing the funding for local mitigation planning. The following section discusses the prioritiza-tion of mitigation grant program funding based on repetitive losses. 4.4.1 Prioritization of Local Plan Updates In the summer of 2008, GEMA’s mitigation Planning Team developed list of counties that at that time had received plan approval. Using this list, the Staff divided the counties into 12 levels of priority based on six month timeframes and according to each county’s plan expiration date and the date that plan updates would be due with priority 1 being the highest priority and priority 10 being the low-est. This list is updated every six months. For example, counties whose plans expire between July 1, 2015 and December 31, 2015 received priority 1 status. Those that expired between January 1, 2016 and June 30, 2016 received priority 2 status and so forth. Since that time, GEMA has continued to maintain and update the priority list as local updates are completed. In that time, GEMA has assisted 84 counties in obtaining funding assistance through HMGP to update their mitigation plans. As of August, 2013, 70 of those counties have completed their updated plan. GEMA anticipates the remainder to be completed by the end of 2014. In addition, as of August, 2013, GEMA is pursuing funding assistance for the next 29 counties in the priority list. It’s notable that, for some of these counties, this would be the second update to their plans. GEMA anticipates receiving approval and holding kickoff meetings to initiate the planning pro-cesses for these counties in the Winter and Spring of 2014. GEMA will continue to adhere to this priority system of updating local hazard mitigation plans when distributing funding and assistance for the planning process. Table 4.3 illustrates the priority of the various counties’ in terms of plan updates by 6 month period beginning in January of 2010. In each 5 year update cycle the driving factor on priority will be the county’s plan expiration date.
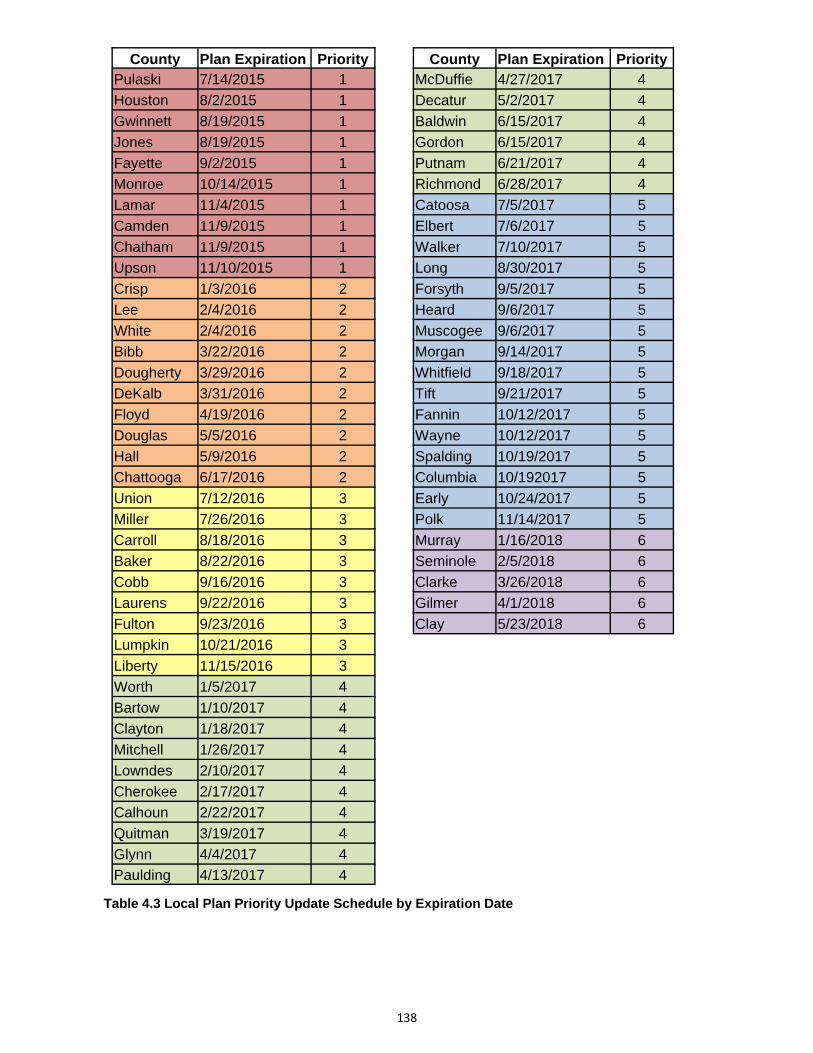
138
County Plan Expiration Priority County Plan Expiration Priority Pulaski 7/14/2015 1 McDuffie 4/27/2017 4
Houston 8/2/2015 1 Decatur 5/2/2017 4
Gwinnett 8/19/2015 1 Baldwin 6/15/2017 4
Jones 8/19/2015 1 Gordon 6/15/2017 4
Fayette 9/2/2015 1 Putnam 6/21/2017 4
Monroe 10/14/2015 1 Richmond 6/28/2017 4
Lamar 11/4/2015 1 Catoosa 7/5/2017 5
Camden 11/9/2015 1 Elbert 7/6/2017 5
Chatham 11/9/2015 1 Walker 7/10/2017 5
Upson 11/10/2015 1 Long 8/30/2017 5
Crisp 1/3/2016 2 Forsyth 9/5/2017 5
Lee 2/4/2016 2 Heard 9/6/2017 5
White 2/4/2016 2 Muscogee 9/6/2017 5
Bibb 3/22/2016 2 Morgan 9/14/2017 5
Dougherty 3/29/2016 2 Whitfield 9/18/2017 5
DeKalb 3/31/2016 2 Tift 9/21/2017 5
Floyd 4/19/2016 2 Fannin 10/12/2017 5
Douglas 5/5/2016 2 Wayne 10/12/2017 5
Hall 5/9/2016 2 Spalding 10/19/2017 5
Chattooga 6/17/2016 2 Columbia 10/192017 5
Union 7/12/2016 3 Early 10/24/2017 5
Miller 7/26/2016 3 Polk 11/14/2017 5
Carroll 8/18/2016 3 Murray 1/16/2018 6
Baker 8/22/2016 3 Seminole 2/5/2018 6
Cobb 9/16/2016 3 Clarke 3/26/2018 6
Laurens 9/22/2016 3 Gilmer 4/1/2018 6
Fulton 9/23/2016 3 Clay 5/23/2018 6
Lumpkin 10/21/2016 3
Liberty 11/15/2016 3
Worth 1/5/2017 4
Bartow 1/10/2017 4
Clayton 1/18/2017 4
Mitchell 1/26/2017 4
Lowndes 2/10/2017 4
Cherokee 2/17/2017 4
Calhoun 2/22/2017 4
Quitman 3/19/2017 4
Glynn 4/4/2017 4
Paulding 4/13/2017 4
Table 4.3 Local Plan Priority Update Schedule by Expiration Date
139
4.4.2 Prioritization of Local Plan Funding Georgia has been working in local hazard mitigation planning since 2002. Since then, all of Geor-gia’s 159 counties have completed and adopted their initial mitigation plans. One stipulation to local plans is they are only effective for 5 years and must be updated in order to maintain the community’s approved status. With that, Georgia has developed an ever evolving tracking spreadsheet which tracks local plans. Georgia uses this spreadsheet to prioritize local plan funding according to the ex-piration dates of each county’s local plan. The focus is on maintaining eligibility for each community to pursue mitigation grant funding as the need and opportunity arises. The goal is to fund the local plan updates in time to be completed prior to the expiration of the each county’s current local plan. The current priority list for the upcoming 3 years is shown in Table 4.3. 4.4.3 Prioritization of Project Funding In order to maximize the amount of federal and state funding available, GEMA employs an applica-tion prioritization system. GEMA reviews, scores and ranks submitted pre- applications and applica-tions using criteria on GEMA’s Hazard Mitigation Assistance Score Sheet. The criteria includes: nat-ural hazard exposure, history of damages, type of mitigation, potential impact on the community, im-pact on environment, community commitment to mitigation, and benefits of mitigation. Generally pre-applications and applications for acquisition and demolition projects receive the highest ranking. See Appendix F for a copy of the GEMA’s Hazard Mitigation Assistance Score Sheet. When a Hazard Mitigation assistance application cycle is opened, GEMA uses a two tiered review process. Initially, communities are directed to submit pre-applications that allow GEMA staff to deter-mine if a proposed mitigation project meets FEMA funding criteria. Completed pre-applications re-ceived by the publicly stated deadline are scored using criteria on GEMA’s Hazard Mitigation Assis-tance Score Sheet. In addition to the above criteria, for post-disaster grants (HMGP), pre-applications are prioritized under two categories- within the declared area and outside of the de-clared area. Projects that mitigate the impacts of the specific declaration event such a flood versus tornado in the declared areas have the highest priority for the State of Georgia. Applicants whose pre-applications receive the highest score and meet minimum project criteria will be invited to complete and submit a full grant application. Risk Reduction Specialists and Hazard Mitigation Planners will assist applicants in completing their applications and will conduct an initial review in accordance with the GEMA’s Hazard Mitigation Assistance Score Sheet. The State Hazard Mitigation Division Director will review the results of the staff scoring and prioritization of applica-tions. The recommendations are presented to the GEMA Agency Director for final determination. Benefit Cost Analyses (BCA) incorporate various data to determine the cost effectiveness of a pro-ject or activity. Essentially, the BCA determines whether the current cost of investing in a project will result in sufficiently reduced damages in the future. Only projects with a benefit-cost ratio (BCR) ex-ceeding 1.0 are ranked for further review and forwarded to FEMA for funding consideration. GEMA Hazard Mitigation staff work closely with project applicants to determine each project’s cost effective-ness. The basic information the state obtains to conduct accurate BCAs includes, but is not limited to the following:
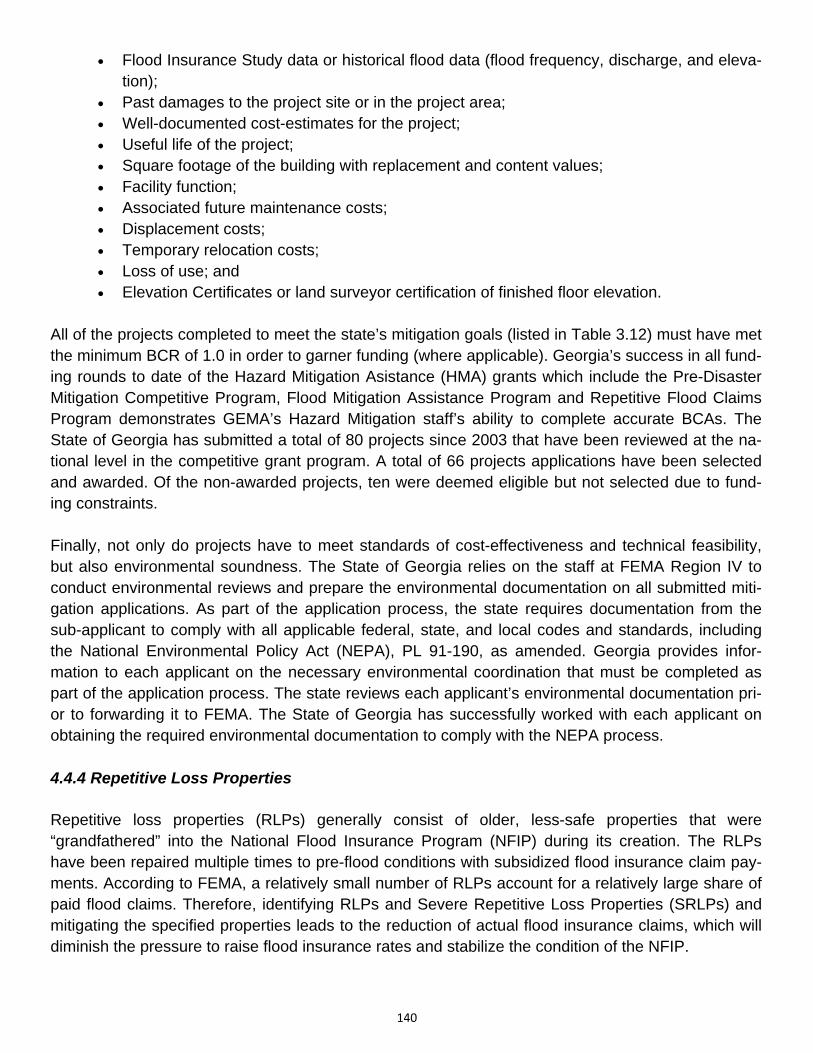
140
Flood Insurance Study data or historical flood data (flood frequency, discharge, and eleva-tion);
Past damages to the project site or in the project area; Well-documented cost-estimates for the project; Useful life of the project; Square footage of the building with replacement and content values; Facility function; Associated future maintenance costs; Displacement costs; Temporary relocation costs; Loss of use; and Elevation Certificates or land surveyor certification of finished floor elevation.
All of the projects completed to meet the state’s mitigation goals (listed in Table 3.12) must have met the minimum BCR of 1.0 in order to garner funding (where applicable). Georgia’s success in all fund-ing rounds to date of the Hazard Mitigation Asistance (HMA) grants which include the Pre-Disaster Mitigation Competitive Program, Flood Mitigation Assistance Program and Repetitive Flood Claims Program demonstrates GEMA’s Hazard Mitigation staff’s ability to complete accurate BCAs. The State of Georgia has submitted a total of 80 projects since 2003 that have been reviewed at the na-tional level in the competitive grant program. A total of 66 projects applications have been selected and awarded. Of the non-awarded projects, ten were deemed eligible but not selected due to fund-ing constraints. Finally, not only do projects have to meet standards of cost-effectiveness and technical feasibility, but also environmental soundness. The State of Georgia relies on the staff at FEMA Region IV to conduct environmental reviews and prepare the environmental documentation on all submitted miti-gation applications. As part of the application process, the state requires documentation from the sub-applicant to comply with all applicable federal, state, and local codes and standards, including the National Environmental Policy Act (NEPA), PL 91-190, as amended. Georgia provides infor-mation to each applicant on the necessary environmental coordination that must be completed as part of the application process. The state reviews each applicant’s environmental documentation pri-or to forwarding it to FEMA. The State of Georgia has successfully worked with each applicant on obtaining the required environmental documentation to comply with the NEPA process. 4.4.4 Repetitive Loss Properties Repetitive loss properties (RLPs) generally consist of older, less-safe properties that were “grandfathered” into the National Flood Insurance Program (NFIP) during its creation. The RLPs have been repaired multiple times to pre-flood conditions with subsidized flood insurance claim pay-ments. According to FEMA, a relatively small number of RLPs account for a relatively large share of paid flood claims. Therefore, identifying RLPs and Severe Repetitive Loss Properties (SRLPs) and mitigating the specified properties leads to the reduction of actual flood insurance claims, which will diminish the pressure to raise flood insurance rates and stabilize the condition of the NFIP.
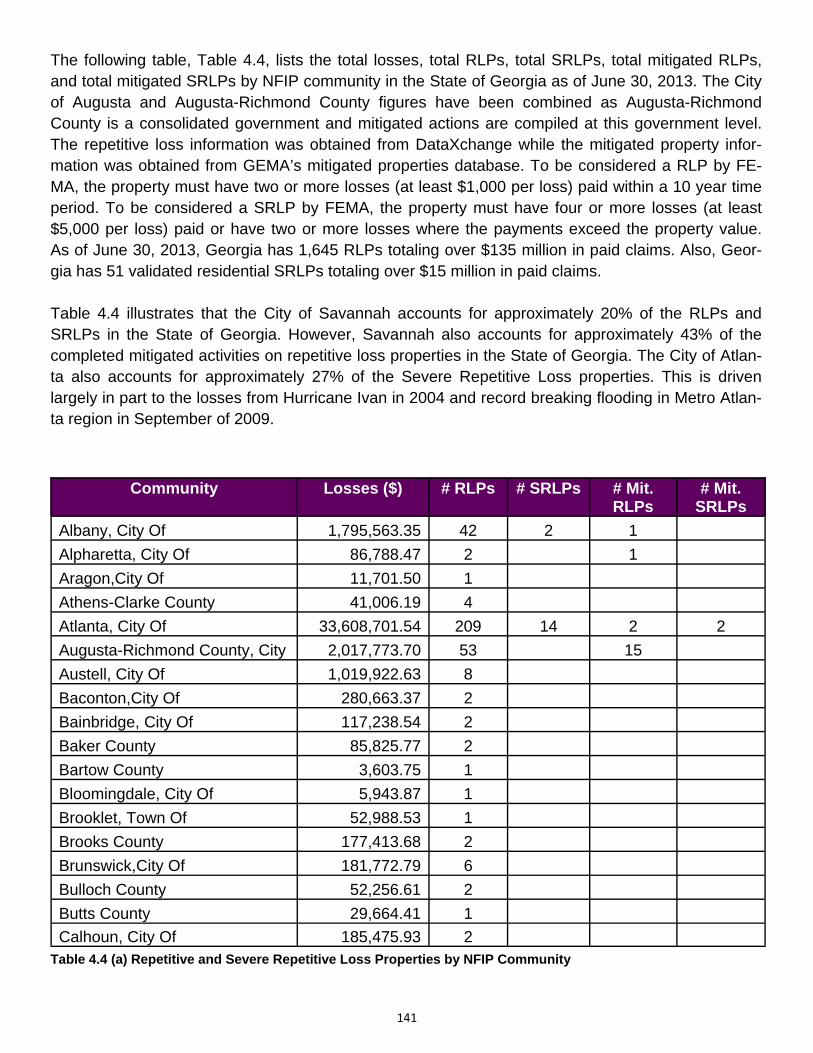
141
The following table, Table 4.4, lists the total losses, total RLPs, total SRLPs, total mitigated RLPs, and total mitigated SRLPs by NFIP community in the State of Georgia as of June 30, 2013. The City of Augusta and Augusta-Richmond County figures have been combined as Augusta-Richmond County is a consolidated government and mitigated actions are compiled at this government level. The repetitive loss information was obtained from DataXchange while the mitigated property infor-mation was obtained from GEMA’s mitigated properties database. To be considered a RLP by FE-MA, the property must have two or more losses (at least $1,000 per loss) paid within a 10 year time period. To be considered a SRLP by FEMA, the property must have four or more losses (at least $5,000 per loss) paid or have two or more losses where the payments exceed the property value. As of June 30, 2013, Georgia has 1,645 RLPs totaling over $135 million in paid claims. Also, Geor-gia has 51 validated residential SRLPs totaling over $15 million in paid claims. Table 4.4 illustrates that the City of Savannah accounts for approximately 20% of the RLPs and SRLPs in the State of Georgia. However, Savannah also accounts for approximately 43% of the completed mitigated activities on repetitive loss properties in the State of Georgia. The City of Atlan-ta also accounts for approximately 27% of the Severe Repetitive Loss properties. This is driven largely in part to the losses from Hurricane Ivan in 2004 and record breaking flooding in Metro Atlan-ta region in September of 2009.
Community Losses ($) # RLPs # SRLPs # Mit. RLPs
# Mit. SRLPs
Albany, City Of 1,795,563.35 42 2 1
Alpharetta, City Of 86,788.47 2 1
Aragon,City Of 11,701.50 1
Athens-Clarke County 41,006.19 4
Atlanta, City Of 33,608,701.54 209 14 2 2
Augusta-Richmond County, City 2,017,773.70 53 15
Austell, City Of 1,019,922.63 8
Baconton,City Of 280,663.37 2
Bainbridge, City Of 117,238.54 2
Baker County 85,825.77 2
Bartow County 3,603.75 1
Bloomingdale, City Of 5,943.87 1
Brooklet, Town Of 52,988.53 1
Brooks County 177,413.68 2
Brunswick,City Of 181,772.79 6
Bulloch County 52,256.61 2
Butts County 29,664.41 1
Calhoun, City Of 185,475.93 2
Table 4.4 (a) Repetitive and Severe Repetitive Loss Properties by NFIP Community
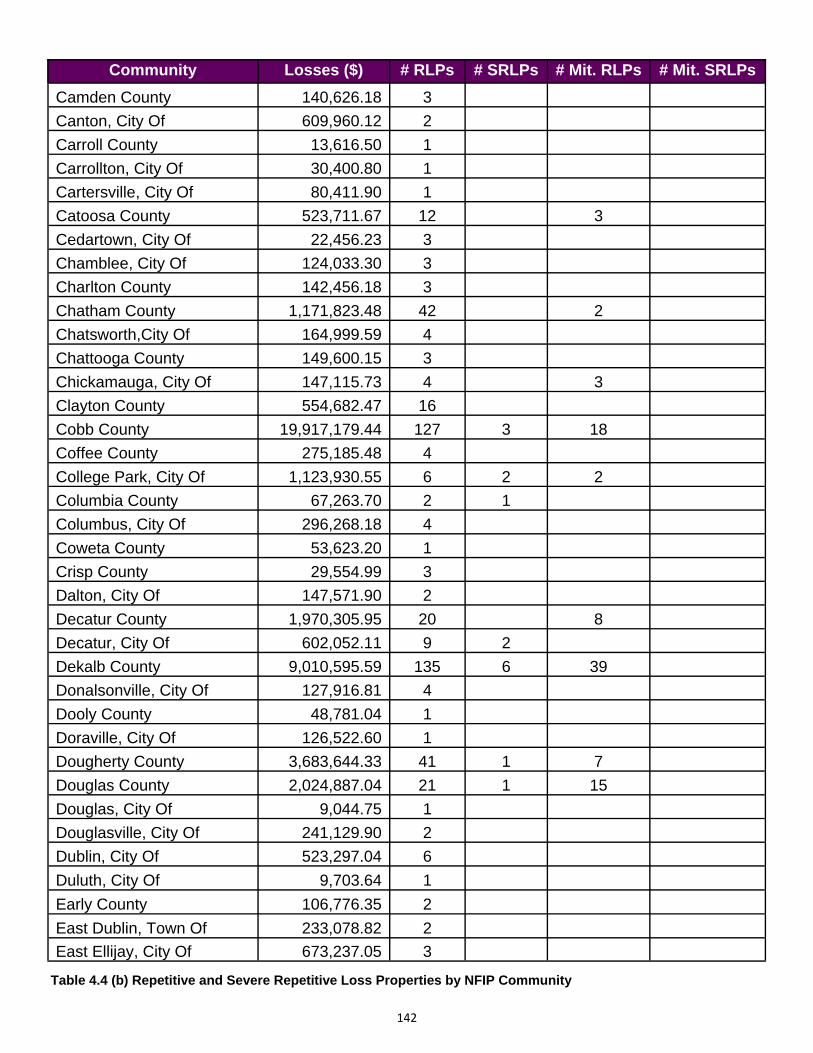
142
Community Losses ($) # RLPs # SRLPs # Mit. RLPs # Mit. SRLPs
Camden County 140,626.18 3
Canton, City Of 609,960.12 2
Carroll County 13,616.50 1
Carrollton, City Of 30,400.80 1
Cartersville, City Of 80,411.90 1
Catoosa County 523,711.67 12 3
Cedartown, City Of 22,456.23 3
Chamblee, City Of 124,033.30 3
Charlton County 142,456.18 3
Chatham County 1,171,823.48 42 2
Chatsworth,City Of 164,999.59 4
Chattooga County 149,600.15 3
Chickamauga, City Of 147,115.73 4 3
Clayton County 554,682.47 16
Cobb County 19,917,179.44 127 3 18
Coffee County 275,185.48 4
College Park, City Of 1,123,930.55 6 2 2
Columbia County 67,263.70 2 1
Columbus, City Of 296,268.18 4
Coweta County 53,623.20 1
Crisp County 29,554.99 3
Dalton, City Of 147,571.90 2
Decatur County 1,970,305.95 20 8
Decatur, City Of 602,052.11 9 2
Dekalb County 9,010,595.59 135 6 39
Donalsonville, City Of 127,916.81 4
Dooly County 48,781.04 1
Doraville, City Of 126,522.60 1
Dougherty County 3,683,644.33 41 1 7
Douglas County 2,024,887.04 21 1 15
Douglas, City Of 9,044.75 1
Douglasville, City Of 241,129.90 2
Dublin, City Of 523,297.04 6
Duluth, City Of 9,703.64 1
Early County 106,776.35 2
East Dublin, Town Of 233,078.82 2
East Ellijay, City Of 673,237.05 3
Table 4.4 (b) Repetitive and Severe Repetitive Loss Properties by NFIP Community
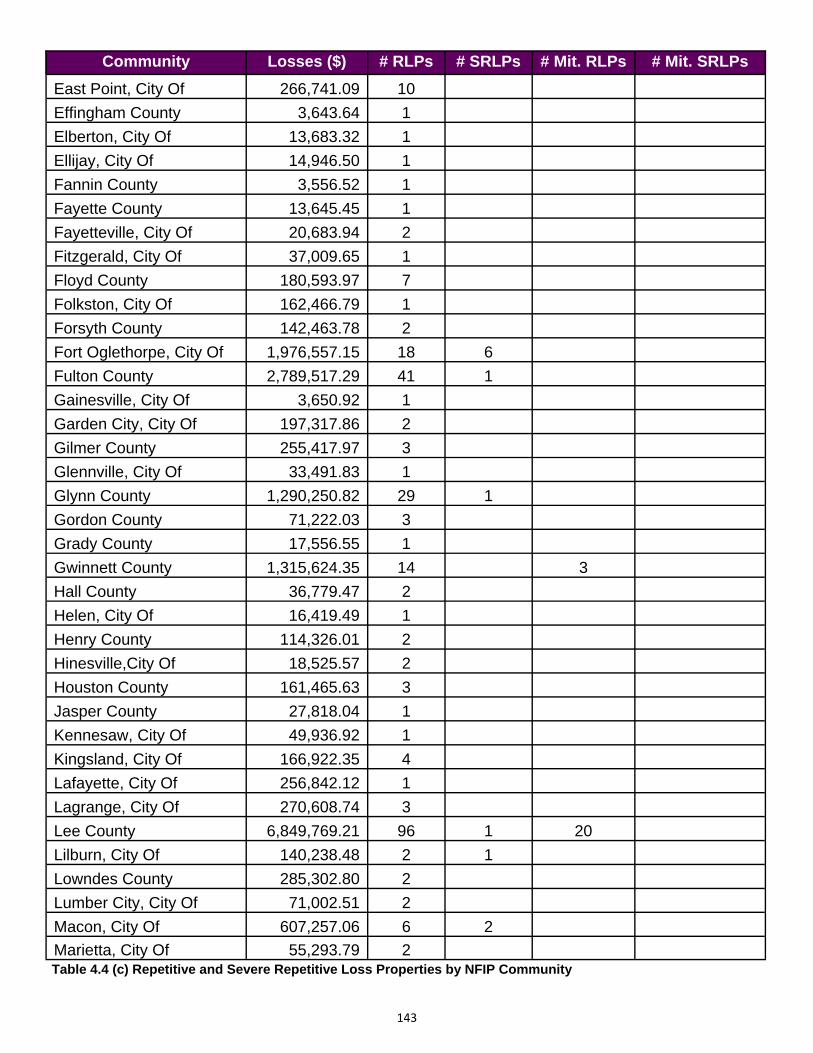
143
Community Losses ($) # RLPs # SRLPs # Mit. RLPs # Mit. SRLPs
East Point, City Of 266,741.09 10
Effingham County 3,643.64 1
Elberton, City Of 13,683.32 1
Ellijay, City Of 14,946.50 1
Fannin County 3,556.52 1
Fayette County 13,645.45 1
Fayetteville, City Of 20,683.94 2
Fitzgerald, City Of 37,009.65 1
Floyd County 180,593.97 7
Folkston, City Of 162,466.79 1
Forsyth County 142,463.78 2
Fort Oglethorpe, City Of 1,976,557.15 18 6
Fulton County 2,789,517.29 41 1
Gainesville, City Of 3,650.92 1
Garden City, City Of 197,317.86 2
Gilmer County 255,417.97 3
Glennville, City Of 33,491.83 1
Glynn County 1,290,250.82 29 1
Gordon County 71,222.03 3
Grady County 17,556.55 1
Gwinnett County 1,315,624.35 14 3
Hall County 36,779.47 2
Helen, City Of 16,419.49 1
Henry County 114,326.01 2
Hinesville,City Of 18,525.57 2
Houston County 161,465.63 3
Jasper County 27,818.04 1
Kennesaw, City Of 49,936.92 1
Kingsland, City Of 166,922.35 4
Lafayette, City Of 256,842.12 1
Lagrange, City Of 270,608.74 3
Lee County 6,849,769.21 96 1 20
Lilburn, City Of 140,238.48 2 1
Lowndes County 285,302.80 2
Lumber City, City Of 71,002.51 2
Macon, City Of 607,257.06 6 2
Marietta, City Of 55,293.79 2
Table 4.4 (c) Repetitive and Severe Repetitive Loss Properties by NFIP Community
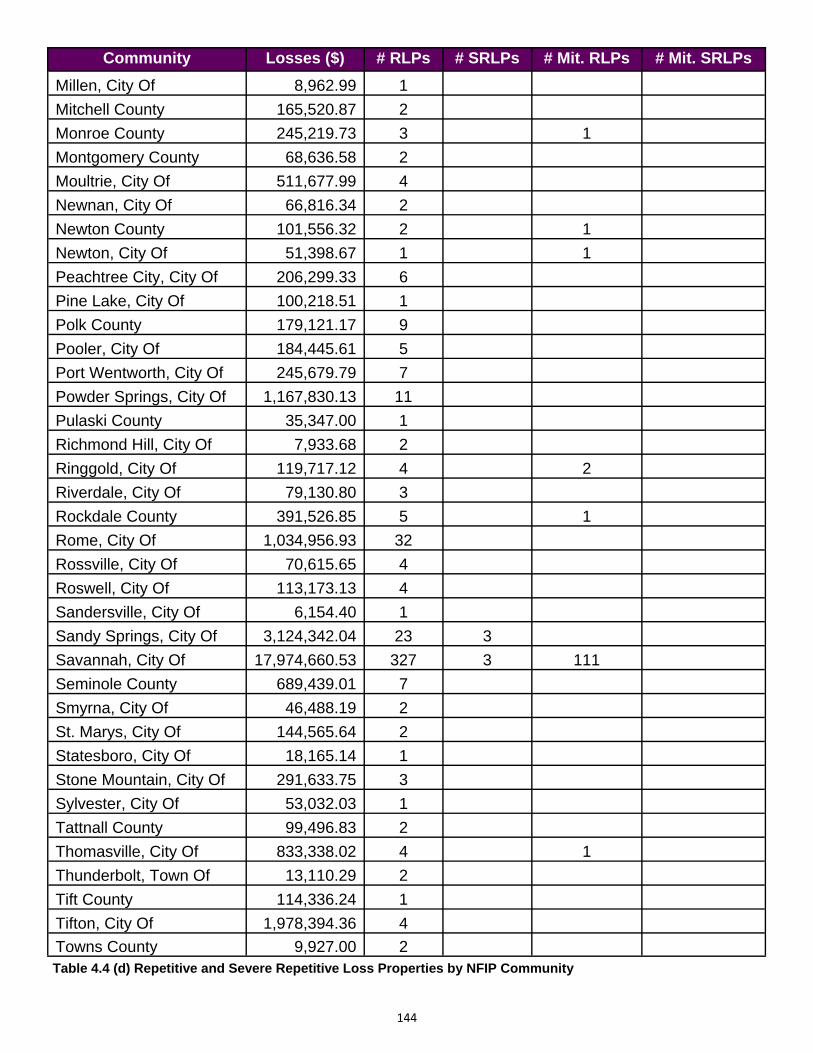
144
Community Losses ($) # RLPs # SRLPs # Mit. RLPs # Mit. SRLPs
Millen, City Of 8,962.99 1
Mitchell County 165,520.87 2
Monroe County 245,219.73 3 1
Montgomery County 68,636.58 2
Moultrie, City Of 511,677.99 4
Newnan, City Of 66,816.34 2
Newton County 101,556.32 2 1
Newton, City Of 51,398.67 1 1
Peachtree City, City Of 206,299.33 6
Pine Lake, City Of 100,218.51 1
Polk County 179,121.17 9
Pooler, City Of 184,445.61 5
Port Wentworth, City Of 245,679.79 7
Powder Springs, City Of 1,167,830.13 11
Pulaski County 35,347.00 1
Richmond Hill, City Of 7,933.68 2
Ringgold, City Of 119,717.12 4 2
Riverdale, City Of 79,130.80 3
Rockdale County 391,526.85 5 1
Rome, City Of 1,034,956.93 32
Rossville, City Of 70,615.65 4
Roswell, City Of 113,173.13 4
Sandersville, City Of 6,154.40 1
Sandy Springs, City Of 3,124,342.04 23 3
Savannah, City Of 17,974,660.53 327 3 111
Seminole County 689,439.01 7
Smyrna, City Of 46,488.19 2
St. Marys, City Of 144,565.64 2
Statesboro, City Of 18,165.14 1
Stone Mountain, City Of 291,633.75 3
Sylvester, City Of 53,032.03 1
Tattnall County 99,496.83 2
Thomasville, City Of 833,338.02 4 1
Thunderbolt, Town Of 13,110.29 2
Tift County 114,336.24 1
Tifton, City Of 1,978,394.36 4
Towns County 9,927.00 2
Table 4.4 (d) Repetitive and Severe Repetitive Loss Properties by NFIP Community
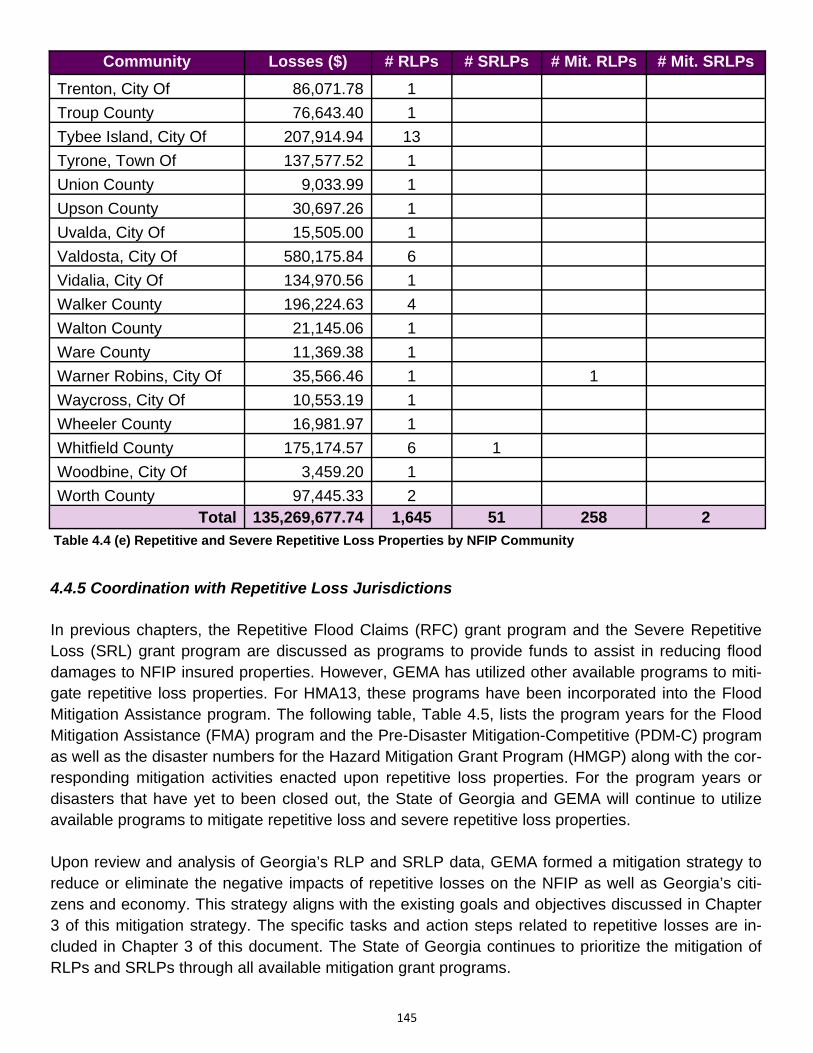
145
4.4.5 Coordination with Repetitive Loss Jurisdictions In previous chapters, the Repetitive Flood Claims (RFC) grant program and the Severe Repetitive Loss (SRL) grant program are discussed as programs to provide funds to assist in reducing flood damages to NFIP insured properties. However, GEMA has utilized other available programs to miti-gate repetitive loss properties. For HMA13, these programs have been incorporated into the Flood Mitigation Assistance program. The following table, Table 4.5, lists the program years for the Flood Mitigation Assistance (FMA) program and the Pre-Disaster Mitigation-Competitive (PDM-C) program as well as the disaster numbers for the Hazard Mitigation Grant Program (HMGP) along with the cor-responding mitigation activities enacted upon repetitive loss properties. For the program years or disasters that have yet to been closed out, the State of Georgia and GEMA will continue to utilize available programs to mitigate repetitive loss and severe repetitive loss properties. Upon review and analysis of Georgia’s RLP and SRLP data, GEMA formed a mitigation strategy to reduce or eliminate the negative impacts of repetitive losses on the NFIP as well as Georgia’s citi-zens and economy. This strategy aligns with the existing goals and objectives discussed in Chapter 3 of this mitigation strategy. The specific tasks and action steps related to repetitive losses are in-cluded in Chapter 3 of this document. The State of Georgia continues to prioritize the mitigation of RLPs and SRLPs through all available mitigation grant programs.
Community Losses ($) # RLPs # SRLPs # Mit. RLPs # Mit. SRLPs
Union County 9,033.99 1
Upson County 30,697.26 1
Uvalda, City Of 15,505.00 1
Valdosta, City Of 580,175.84 6
Vidalia, City Of 134,970.56 1
Walker County 196,224.63 4
Walton County 21,145.06 1
Ware County 11,369.38 1
Warner Robins, City Of 35,566.46 1 1
Waycross, City Of 10,553.19 1
Wheeler County 16,981.97 1
Whitfield County 175,174.57 6 1
Woodbine, City Of 3,459.20 1
Worth County 97,445.33 2 Total 135,269,677.74 1,645 51 258 2
Tyrone, Town Of 137,577.52 1
Tybee Island, City Of 207,914.94 13
Troup County 76,643.40 1
Trenton, City Of 86,071.78 1
Table 4.4 (e) Repetitive and Severe Repetitive Loss Properties by NFIP Community
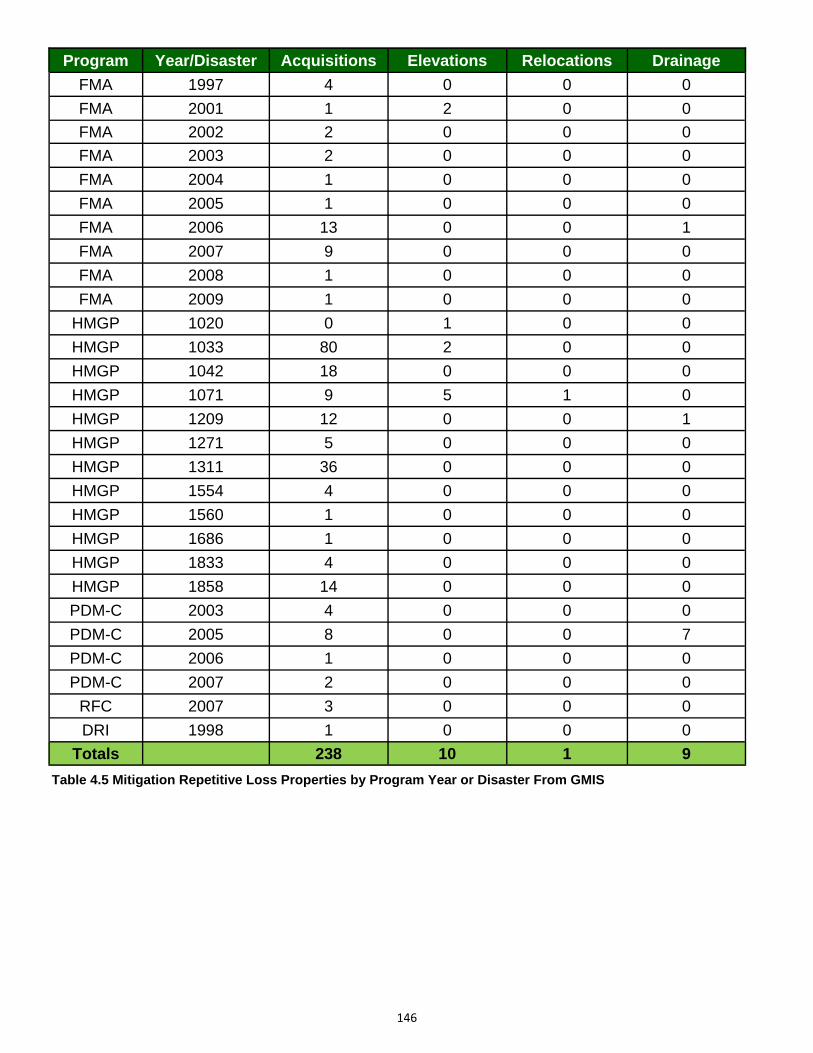
146
Table 4.5 Mitigation Repetitive Loss Properties by Program Year or Disaster From GMIS
Program Year/Disaster Acquisitions Elevations Relocations Drainage
FMA 1997 4 0 0 0
FMA 2001 1 2 0 0
FMA 2002 2 0 0 0
FMA 2003 2 0 0 0
FMA 2004 1 0 0 0
FMA 2005 1 0 0 0
FMA 2006 13 0 0 1
FMA 2007 9 0 0 0
FMA 2008 1 0 0 0
FMA 2009 1 0 0 0
HMGP 1020 0 1 0 0
HMGP 1033 80 2 0 0
HMGP 1042 18 0 0 0
HMGP 1071 9 5 1 0
HMGP 1209 12 0 0 1
HMGP 1271 5 0 0 0
HMGP 1311 36 0 0 0
HMGP 1554 4 0 0 0
HMGP 1560 1 0 0 0
HMGP 1686 1 0 0 0
HMGP 1833 4 0 0 0
HMGP 1858 14 0 0 0
PDM-C 2003 4 0 0 0
PDM-C 2005 8 0 0 7
PDM-C 2006 1 0 0 0
PDM-C 2007 2 0 0 0
RFC 2007 3 0 0 0
DRI 1998 1 0 0 0
Totals 238 10 1 9
147
Chapter 5: Plan Maintenance The purpose of Chapter 5 is to identify and evaluate the process used to monitor, evaluate and up-date the 2011 Georgia Hazard Mitigation Strategy over the previous 3 years, as well as to outline the mechanism for updating the 2014 strategy over the next three years. This chapter establishes both the method and schedule for monitoring, evaluating, and updating the plan. The following table, Ta-ble 5.1, documents the changes to Chapter 5 that have occurred since the 2008 approval.
The review of Chapter 5 of the Georgia Hazard Mitigation Strategy (GHMS) was coordinated by GE-MA Hazard Mitigation division. Each section was reviewed by the staff and revised as necessary to reflect the monitoring, evaluation and update process used over the previous 3 years. In addition, state planning stakeholders were presented opportunities to review each section in the plan as de-scribed in Chapter 1. This includes placing draft sections of the plan on the GEMA website for public review and comment. The planning team followed the process outlined in Chapter 1 in order to update the GHMS. The planning team will continue to use this process over the next three years for the next plan update. The next plan update is anticipated to begin in spring of 2014 and to be completed and approved in 2017. 5.1 MONITORING, EVALUATING, AND UPDATING THE PLAN The State of Georgia has and will continue to review and update the GHMS to submit for gubernato-rial and federal approval at a minimum of once every three years. The state may update the plan more frequently under the following conditions: a state declaration without federal assistance; a presidential disaster declaration; changes in state policy; significant updates to the hazard, risk, and vulnerability assessment based on new data; or a need deemed by the governor or state hazard mit-igation planning group. Within the state, the Hazard Mitigation Division of GEMA is responsible for coordinating the monitor-ing, evaluation, and update of the GHMS. Within this division, the Planning Program Manager is re-sponsible for the oversight of this process, including the coordination of local, state, and federal agencies. Participants in this process are listed in Chapter 1 and include state government agencies participating in mitigation programs and federal government agency representatives with general in-terest or legislative authority on items presented in the mitigation strategy.
Chapter 5 Section Updates to Section
5.1 Monitoring, Evaluating, and Updating Methods
Includes table of changes.
Revised to include new schedule for future updates.
5.2 Mitigation Activity Monitoring Updated tables
Updated Text
Table 5.1 Changes to Chapter 5
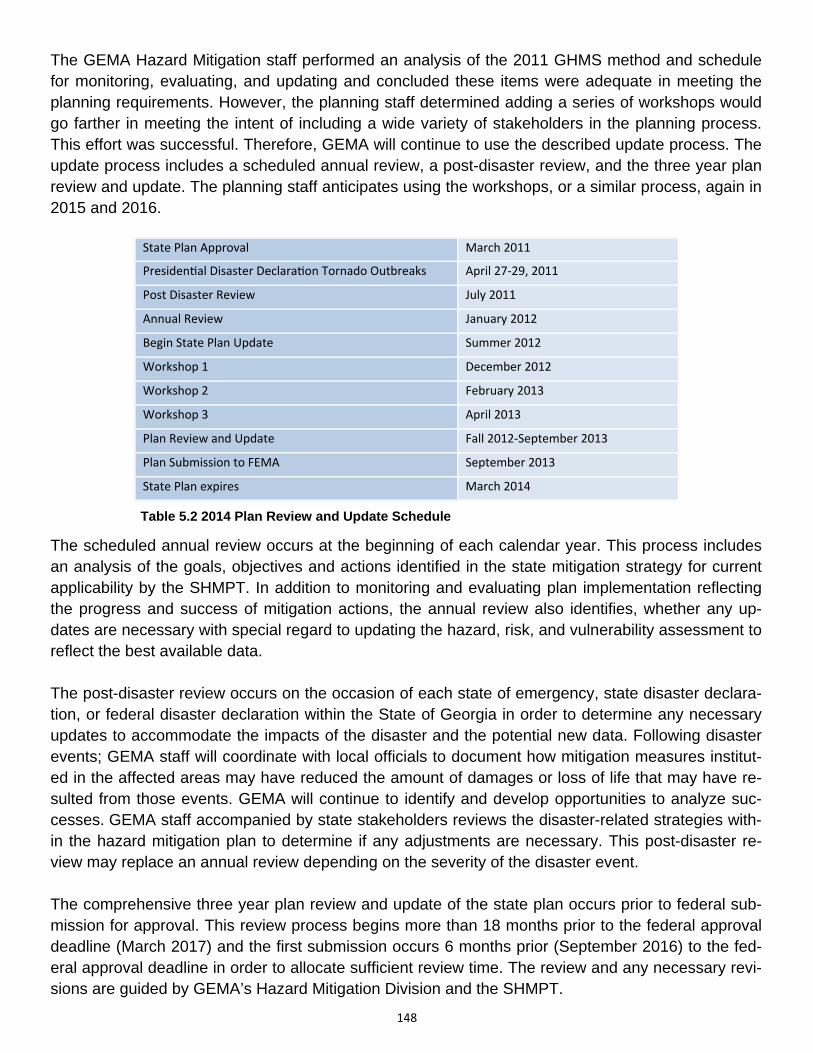
148
The GEMA Hazard Mitigation staff performed an analysis of the 2011 GHMS method and schedule for monitoring, evaluating, and updating and concluded these items were adequate in meeting the planning requirements. However, the planning staff determined adding a series of workshops would go farther in meeting the intent of including a wide variety of stakeholders in the planning process. This effort was successful. Therefore, GEMA will continue to use the described update process. The update process includes a scheduled annual review, a post-disaster review, and the three year plan review and update. The planning staff anticipates using the workshops, or a similar process, again in 2015 and 2016.
The scheduled annual review occurs at the beginning of each calendar year. This process includes an analysis of the goals, objectives and actions identified in the state mitigation strategy for current applicability by the SHMPT. In addition to monitoring and evaluating plan implementation reflecting the progress and success of mitigation actions, the annual review also identifies, whether any up-dates are necessary with special regard to updating the hazard, risk, and vulnerability assessment to reflect the best available data. The post-disaster review occurs on the occasion of each state of emergency, state disaster declara-tion, or federal disaster declaration within the State of Georgia in order to determine any necessary updates to accommodate the impacts of the disaster and the potential new data. Following disaster events; GEMA staff will coordinate with local officials to document how mitigation measures institut-ed in the affected areas may have reduced the amount of damages or loss of life that may have re-sulted from those events. GEMA will continue to identify and develop opportunities to analyze suc-cesses. GEMA staff accompanied by state stakeholders reviews the disaster-related strategies with-in the hazard mitigation plan to determine if any adjustments are necessary. This post-disaster re-view may replace an annual review depending on the severity of the disaster event. The comprehensive three year plan review and update of the state plan occurs prior to federal sub-mission for approval. This review process begins more than 18 months prior to the federal approval deadline (March 2017) and the first submission occurs 6 months prior (September 2016) to the fed-eral approval deadline in order to allocate sufficient review time. The review and any necessary revi-sions are guided by GEMA’s Hazard Mitigation Division and the SHMPT.
State Plan Approval March 2011
Presiden al Disaster Declara on Tornado Outbreaks April 27‐29, 2011
Post Disaster Review July 2011
Annual Review January 2012
Begin State Plan Update Summer 2012
Workshop 1 December 2012
Workshop 2 February 2013
Workshop 3 April 2013
Plan Review and Update Fall 2012‐September 2013
Plan Submission to FEMA September 2013
State Plan expires March 2014
Table 5.2 2014 Plan Review and Update Schedule
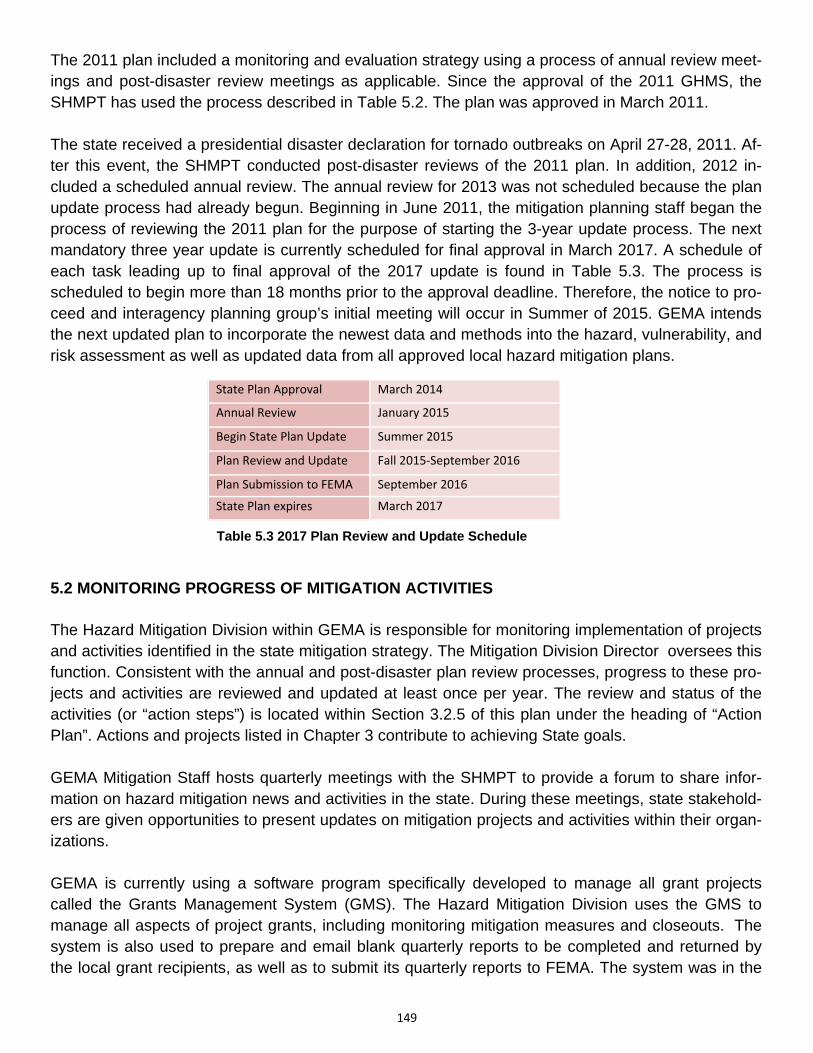
149
The 2011 plan included a monitoring and evaluation strategy using a process of annual review meet-ings and post-disaster review meetings as applicable. Since the approval of the 2011 GHMS, the SHMPT has used the process described in Table 5.2. The plan was approved in March 2011. The state received a presidential disaster declaration for tornado outbreaks on April 27-28, 2011. Af-ter this event, the SHMPT conducted post-disaster reviews of the 2011 plan. In addition, 2012 in-cluded a scheduled annual review. The annual review for 2013 was not scheduled because the plan update process had already begun. Beginning in June 2011, the mitigation planning staff began the process of reviewing the 2011 plan for the purpose of starting the 3-year update process. The next mandatory three year update is currently scheduled for final approval in March 2017. A schedule of each task leading up to final approval of the 2017 update is found in Table 5.3. The process is scheduled to begin more than 18 months prior to the approval deadline. Therefore, the notice to pro-ceed and interagency planning group’s initial meeting will occur in Summer of 2015. GEMA intends the next updated plan to incorporate the newest data and methods into the hazard, vulnerability, and risk assessment as well as updated data from all approved local hazard mitigation plans.
5.2 MONITORING PROGRESS OF MITIGATION ACTIVITIES The Hazard Mitigation Division within GEMA is responsible for monitoring implementation of projects and activities identified in the state mitigation strategy. The Mitigation Division Director oversees this function. Consistent with the annual and post-disaster plan review processes, progress to these pro-jects and activities are reviewed and updated at least once per year. The review and status of the activities (or “action steps”) is located within Section 3.2.5 of this plan under the heading of “Action Plan”. Actions and projects listed in Chapter 3 contribute to achieving State goals. GEMA Mitigation Staff hosts quarterly meetings with the SHMPT to provide a forum to share infor-mation on hazard mitigation news and activities in the state. During these meetings, state stakehold-ers are given opportunities to present updates on mitigation projects and activities within their organ-izations. GEMA is currently using a software program specifically developed to manage all grant projects called the Grants Management System (GMS). The Hazard Mitigation Division uses the GMS to manage all aspects of project grants, including monitoring mitigation measures and closeouts. The system is also used to prepare and email blank quarterly reports to be completed and returned by the local grant recipients, as well as to submit its quarterly reports to FEMA. The system was in the
State Plan Approval March 2014
Annual Review January 2015
Begin State Plan Update Summer 2015
Plan Review and Update Fall 2015‐September 2016
Plan Submission to FEMA September 2016
State Plan expires March 2017
Table 5.3 2017 Plan Review and Update Schedule
150
process of being phased in when the 2011 plan was approved. The system is now in full use and will continue to be used for the foreseeable future. In addition, the state uses the Georgia Mitigation Information System (GMIS) to track the status of mitigated properties and avoided losses to completed mitigation projects. This information is shared with local officials as well as FEMA for utilization as a vehicle to track the effectiveness and success of mitigation efforts. GEMA is in the process of upgrading this system in order to improve the sys-tem’s capability of tracking and evaluating .
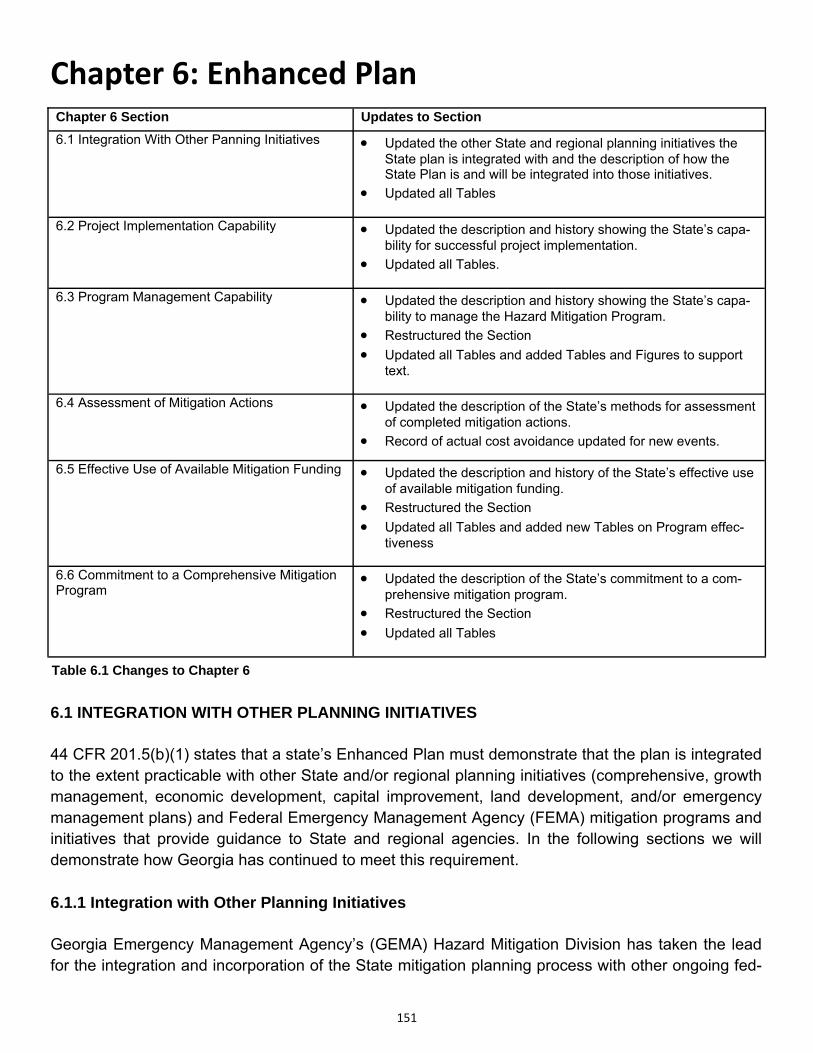
151
Chapter 6: Enhanced Plan
6.1 INTEGRATION WITH OTHER PLANNING INITIATIVES 44 CFR 201.5(b)(1) states that a state’s Enhanced Plan must demonstrate that the plan is integrated to the extent practicable with other State and/or regional planning initiatives (comprehensive, growth management, economic development, capital improvement, land development, and/or emergency management plans) and Federal Emergency Management Agency (FEMA) mitigation programs and initiatives that provide guidance to State and regional agencies. In the following sections we will demonstrate how Georgia has continued to meet this requirement. 6.1.1 Integration with Other Planning Initiatives Georgia Emergency Management Agency’s (GEMA) Hazard Mitigation Division has taken the lead for the integration and incorporation of the State mitigation planning process with other ongoing fed-
Table 6.1 Changes to Chapter 6
Chapter 6 Section Updates to Section
6.1 Integration With Other Panning Initiatives
Updated the other State and regional planning initiatives the State plan is integrated with and the description of how the State Plan is and will be integrated into those initiatives.
Updated all Tables
6.2 Project Implementation Capability
Updated the description and history showing the State’s capa-bility for successful project implementation.
Updated all Tables.
6.3 Program Management Capability
Updated the description and history showing the State’s capa-bility to manage the Hazard Mitigation Program.
Restructured the Section
Updated all Tables and added Tables and Figures to support text.
6.4 Assessment of Mitigation Actions
Updated the description of the State’s methods for assessment of completed mitigation actions.
Record of actual cost avoidance updated for new events.
6.5 Effective Use of Available Mitigation Funding
Updated the description and history of the State’s effective use of available mitigation funding.
Restructured the Section
Updated all Tables and added new Tables on Program effec-tiveness
6.6 Commitment to a Comprehensive Mitigation Program
Updated the description of the State’s commitment to a com-prehensive mitigation program.
Restructured the Section
Updated all Tables
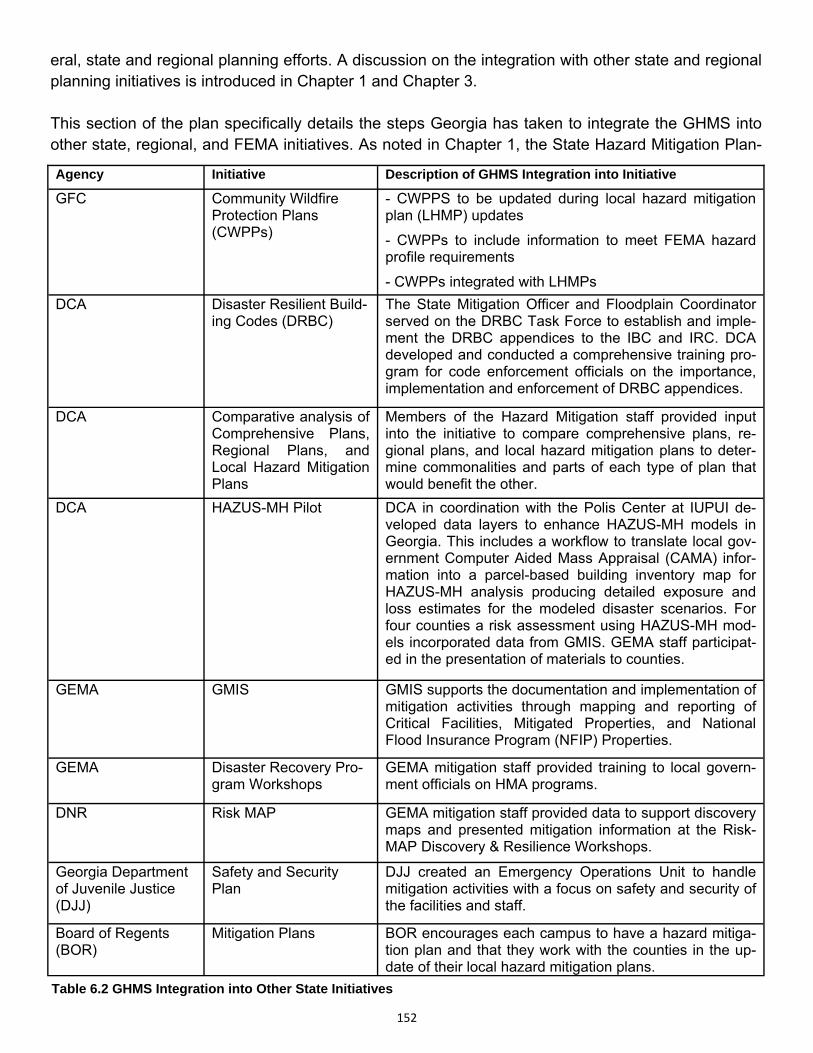
152
eral, state and regional planning efforts. A discussion on the integration with other state and regional planning initiatives is introduced in Chapter 1 and Chapter 3. This section of the plan specifically details the steps Georgia has taken to integrate the GHMS into other state, regional, and FEMA initiatives. As noted in Chapter 1, the State Hazard Mitigation Plan-
Agency Initiative Description of GHMS Integration into Initiative
GFC Community Wildfire Protection Plans (CWPPs)
- CWPPS to be updated during local hazard mitigation plan (LHMP) updates
- CWPPs to include information to meet FEMA hazard profile requirements
- CWPPs integrated with LHMPs
DCA Disaster Resilient Build-ing Codes (DRBC)
The State Mitigation Officer and Floodplain Coordinator served on the DRBC Task Force to establish and imple-ment the DRBC appendices to the IBC and IRC. DCA developed and conducted a comprehensive training pro-gram for code enforcement officials on the importance, implementation and enforcement of DRBC appendices.
DCA Comparative analysis of Comprehensive Plans, Regional Plans, and Local Hazard Mitigation Plans
Members of the Hazard Mitigation staff provided input into the initiative to compare comprehensive plans, re-gional plans, and local hazard mitigation plans to deter-mine commonalities and parts of each type of plan that would benefit the other.
DCA HAZUS-MH Pilot DCA in coordination with the Polis Center at IUPUI de-veloped data layers to enhance HAZUS-MH models in Georgia. This includes a workflow to translate local gov-ernment Computer Aided Mass Appraisal (CAMA) infor-mation into a parcel-based building inventory map for HAZUS-MH analysis producing detailed exposure and loss estimates for the modeled disaster scenarios. For four counties a risk assessment using HAZUS-MH mod-els incorporated data from GMIS. GEMA staff participat-ed in the presentation of materials to counties.
GEMA GMIS GMIS supports the documentation and implementation of mitigation activities through mapping and reporting of Critical Facilities, Mitigated Properties, and National Flood Insurance Program (NFIP) Properties.
GEMA Disaster Recovery Pro-gram Workshops
GEMA mitigation staff provided training to local govern-ment officials on HMA programs.
DNR Risk MAP GEMA mitigation staff provided data to support discovery maps and presented mitigation information at the Risk-MAP Discovery & Resilience Workshops.
Georgia Department of Juvenile Justice (DJJ)
Safety and Security Plan
DJJ created an Emergency Operations Unit to handle mitigation activities with a focus on safety and security of the facilities and staff.
Board of Regents (BOR)
Mitigation Plans BOR encourages each campus to have a hazard mitiga-tion plan and that they work with the counties in the up-date of their local hazard mitigation plans.
Table 6.2 GHMS Integration into Other State Initiatives
153
ning Team involves numerous state and Federal agencies that meet together on a regular basis throughout the planning period. The purpose of these meetings is twofold. First, they allow for the input of these various agencies into the planning process. Second, they allow for the dissemination of mitigation related information; including current activities, available programs and plan related in-formation to the participating agencies. Information provided by each agency has been collectively reviewed to accomplish the following ob-jectives:
1) Incorporate mitigation data or resources into emergency management plans and activities; 2) Link program and planning initiatives to support specific hazard mitigation strategies; 3) Check for planning initiatives that promote mitigation as part of authorities and responsibil-
ities; and 4) Coordinate with other state and regional agencies to incorporate hazard mitigation into
their own programs, regulations, and activities. The above mentioned meetings allow for the input of various agencies into the planning process. In addition, they also provide the opportunity for interaction between the participating agencies and the encouragement to take the information from the meetings and the plan document back to their re-spective agencies for incorporation, as applicable, into their various short and long term plans and programs. This section includes information from the state agencies and their programs in the effort to accom-plish mitigation goals. Throughout the planning process, GEMA utilized information provided by the agencies. State agencies were also valuable contributors to the review and update of the goals and actions provided in Chapter 3. Many of these agencies provided GEMA with information on how they planned to achieve the goals and actions that are specific to their program area. Table 6.2 has been updated to provide examples of how the Georgia Hazard Mitigation Strategy (GHMS) is integrated and incorporated into other agency activities and their programs. 6.1.2 Integration with Regional Planning Initiatives GEMA has been working very closely with numerous state agencies and non-governmental organi-zations over the past three years to pass along the benefits and concepts of hazard mitigation and how to incorporate these ideas into their own programs, regulations, and activities. In Georgia, we have the fortunate situation of a positive relationship among all state agencies and non-governmental organizations. Each organization and their individual representatives have been pro-active in their ideas and efforts to work together to help the citizens of this state. The following are lists of opportunities we took advantage of to integrate hazard mitigation into other organization’s programs. Georgia Department of Community Affairs HUD Disaster Recovery Enhancement Fund Grant Following the presidentially declared disasters in 2008 (DR1750 and DR1761), which included se-vere weather and tornados affecting over 20 counties in north and central Georgia, DCA received funding from HUD to increase disaster mitigation education and review consistency among various
154
required planning documents throughout the state. GEMA and DCA staff met numerous times with the consultant (AMEC) to develop a system that compares local comprehensive, regional and miti-gation plans for commonality and identification of areas that could benefit each and help communi-ties look ahead at their direction of growth and possible affects by natural hazards. The review process identified several areas that could benefit local community plans by incorporat-ing separate section of each plan. For example comprehensive and regional plans could benefit from the hazard analysis contained in the hazard mitigation plan so that communities keep hazards in mind when making plans to expand. The local mitigation plans can benefit from the comprehensive plans by incorporating future growth patterns, not just looking at current building stock. This shared information makes all three plans more valuable to the counties and their citizens. DCA and GEMA conducted three workshops throughout the areas affected of DR1750 and DR1761, and met with county and city officials to discuss the benefits of combining data sources. The ideas and suggestions were well received and this information was passed on to other regions that devel-op these plans. Georgia’s Coastal Zone Management Program GEMA has been working closely with DNR Coastal Resource Division over the past few years to de-termine the effects of sea level rise on our coastal areas and their natural assets. A number of feder-al and state funded studies are underway. Sea level rise is not an immediate natural hazard, howev-er, over the next 100 years, its effects to Georgia’s coastline and natural habitats could be detri-mental. Increased sea level can affect the amount of tidal surge during hazard events such as a hur-ricane or tropical wind event. Georgia’s coast has experienced some effects of rising sea levels and changing inland waterways. To what level is still being determined. Current studies estimate that Georgia’s sea level has risen approximately 3mm/year over the past 70 years. Also, during that time, rates of residential and infra-structure development along coastal Georgia’s waterways have increased significantly, resulting in more persons and property at risk. Scientists predict that the rate of global mean sea level rise dur-ing the 21st century will exceed the rate observed from 1971 thru 2010. If these predictions material-ize we will need to develop plans and actions to counter the effects. Post Disaster Redevelopment Plans Georgia’s coast has not been hit directly by a major storm in over 100 years. It is important that the state and local communities not become complacent and diligently create disaster resilient plans and incorporate long-term planning for natural disasters into both their state and local management pro-cesses. It is important that preparations be initiated to reduce our vulnerabilities to probable coastal related natural disasters and potential changes from sea-level rise. GEMA in conjunction with DCA and DNR are in the process of developing a plan to guide coastal communities in their redevelop-ment after a major natural disaster. The plan will revise state policies on the post-disaster repair and rebuilding of homes, businesses, permitted piers, docks, marinas, etc. Upon completion, this model plan will be used as a guidance document to prepare post-disaster redevelopment plans for coastal and inland communities throughout the state.
155
Regional Commissions (RC) A Regional Commission (RC) is a multi-county planning and development organization that partners with local governments in their planning and development efforts and can also serve as a service delivery organization. RCs often constitute the local and regional layers of Georgia’s “bottom-up" planning philosophy. RCs are owned and operated by the local governments that they serve. The RCs help counties plan and secure funding for development with projects such as construction, re-pair or upgrade of roads, repair or upgrade of bridges and water and sewer lines, industrial park de-velopment as well as projects related to community services, education and workforce development. The Department of Community Affairs contracts with the RCs to provide a variety of services man-dated in the Georgia Planning Act. These services include assisting local governments with compre-hensive planning, regional transportation plans, and specific plan implementation activities such as developing new zoning ordinances or putting a GIS system in place. A comprehensive plan outlines a framework for the development of an area, recognizing the physi-cal, economic, social, political, aesthetic and related factors of a community. A comprehensive plan typically results from lengthy and intensive analysis, includes a long-range scope (usually 20 years or more) and provides the overall guiding principles for growth and development of a community. Regional Transportation Plans (RTP) are integral parts of the Statewide Transportation Improvement Plan - Georgia’s four-year transportation and capital improvements program. The RTP examines re-gional and county transportation needs over the next 20+ years and provides a framework to ad-dress anticipated growth through systems and policies. It contains both short- and long-term trans-portation strategies to improve mobility and investments to improve the region’s transportation sys-tem. A significant number of counties contracted with the RCs in the development of their multi-jurisdictional Hazard Mitigation plans. While there is no formal programmatic working relationship where GEMA has any agreement directly with the RCs, by default of many of Georgia’s counties contracting with RCs to develop and update their local mitigation plans, GEMA mitigation staff has worked very closely with most of the State’s 12 RCs on this planning effort over the previous years. In addition to assisting local communities with their local planning efforts, RCs also conduct regional planning initiatives to help guide local planning efforts and to encourage cooperation between coun-ties where such cooperation would be beneficial to the region. The regional planning efforts include, but are not limited to, items such as economic development, natural and cultural resources, land use, transportation, etc. On cursory review, hazard mitigation is included, even if mostly indirectly, in regional planning efforts. A stated part of natural resources protection is maintaining a river or stream’s capacity to handle increased water levels, which otherwise, would result in flooded areas. Another part of natural resources protection is protecting these areas from incompatible develop-ment. In the case of rivers and streams, it includes protecting the banks and floodplains. In addition, local governments are required to remain consistent with their RC’s Regional Plan in or-der to maintain their Qualified Local Government status with the State of Georgia. Some regional plans include updating and adopting a Hazard Mitigation Plan as part of the minimum requirements
156
for a local government to remain consistent. This is consistent with the State Plan’s strategy of main-taining approved status for all 159 counties and their municipalities. The State will continue to work with DCA and the RCs to develop GIS capabilities which can provide communities with a better understanding of hazards that possibly affect economic development. The GEMA mitigation staff and the RCs will continue to work closely to keep the counties informed of mit-igation initiatives in their region. GEMA plans to keep a close working relationship with the RCs in developing local plan updates as they become due. HAZUS-MH Training During 2012 - 2013 the Georgia Department of Community Affairs was the recipient of a special competitive grant from the US Department of Housing and Urban Development. The HUD Disaster Recovery Enhancement Fund was a one-time supplement to the Community Development Block Grant Program for states with presidentially declared disasters during 2008. DCA used part of their award to partner with the Federal Emergency Management Agency, the Georgia Emergency and the Georgia Regional Commissions to educate a cadre of Georgia students in the use of FEMA’s HAZUS-MH risk assessment software. DCA in partnership with the POLIS Center at Indiana University Purdue University, and FEMA’s Emergency Management Institute provided a basic series of HAZUS�MH training courses to GEMA Hazard Mitigation planners, regional Commission personnel, county planners, and others in order to learn how to use and benefit from this software program. There were about 20�30 students in each class, spread over three locations (Atlanta, Savannah, and Macon). FEMA provided teleconferenc-ing from Atlanta to classrooms in Macon and Savannah, as well as subject matter experts in all three classrooms. 22 students completed the courses to receive FEMA certification as HAZUS Trained Professionals and the more advanced HAZUS Practitioner Certificate. They also developed a workflow to translate local government Computer Aided Mass Appraisal (CAMA) information into a parcel-based building inventory map for HAZUS analysis producing de-tailed exposure and loss estimates for the modeled disaster scenarios. Augusta-Richmond County was selected as one of the four pilot counties for the development of their pre disaster mitigation plan processing procedures. This process can now be readily applied to all of the other 141 Georgia counties that use similar WinGAP CAMA systems. HAZUS-MH is a nationally applicable standardized methodology that contains models for estimating potential losses from earthquakes, floods, and hurricanes. Government planners, GIS specialists, and emergency managers use HAZUS-MH to determine losses and the most beneficial mitigation approaches to take to minimize them. Some of the benefits of these courses were: the updated 2010 demographics in HAZUS inventory which can be used to estimate losses; embedded GEMA Georgia Mitigation Information System (GMIS) Essential Facilities (Fire, Police, Schools, Hospitals) into HAZUS inventory; used to estimate losses; custom tools to import Georgia parcel maps and WinGAP assessor data to create county-wide building inventory maps and to update the general building stock maps used to estimate loss-
157
es; custom tools and documented workflow to produce multi-hazard risk assessments and reports; and better coordinated inter-agency, inter-governmental hazard mitigation planning partnership. Georgia Association of Floodplain Management The Georgia Association of Floodplain Management (GAFM) promotes advances in floodplain man-agement. As a chapter of the national organization, the Association of State Floodplain Managers (ASFPM), opportunities exist to link to a nationwide network with similar aims. GAFM seeks to find and make possibilities for the presence, thoughts and actions of its members to affect and integrate within public policy the best known management practices expressing collective intent and experi-ence, thereby initiating within the general populace the recognition towards, and resonance with sound floodplain, stormwater, wetlands, river corridor, and coastline management as an imperative duty of environmental stewardship, described by the actions, examples and contributions of its mem-bers. The GAFM provides educational opportunities allowing dissemination of general and technical infor-mation, in order to keep its members abreast with the advancement of floodplain and stormwater management knowledge. GAFM encourages the exchange of information, ideas and experiences among the practitioners and advocates of floodplain, stormwater, wetlands, river corridor, and coast-line management. Due to its role as the State Floodplain Coordinator, the Floodplain Management Unit of the Georgia Department of Natural Resources, Environmental Protection Division (DNR-EPD/FM) has a strong working relationship with GAFM and GEMA. The State will continue to work with DNR-EPD/FM on the implementation of mitigation plans and projects. GEMA staff has supported each of GAFM’s an-nual workshops and a few of the regional workshops to provide mitigation information to its mem-bers. GEMA mitigation staff will continue to coordinate with DNR-EPD/FM and GAFM to inform them of mitigation initiatives in their region. Metropolitan North Georgia Water Planning District (MNGWPD) The Metropolitan North Georgia Water Planning District (District) was created by the Georgia Gen-eral Assembly in 2001 (O.C.G.A. 12-5-570) and is currently comprised of 15 counties, 92 cities and 7 water authorities in the Metropolitan Atlanta area. Per this legislation, the District developed three water management plans and five model ordinances, including the Model Floodplain Management / Flood Damage Prevention Ordinance. Each year the District surveys the jurisdictions to report activi-ties and achievements. The purpose of the Flood Damage Prevention Ordinance is to protect, maintain and enhance the public health, safety, environment and general welfare and to minimize public and private losses due to flood conditions in flood hazard areas. Furthermore, the intent of the ordinance is to protect the beneficial uses of floodplain areas for water quality protection, stream bank and stream corridor pro-tection, wetlands preservation, as well as ecological and environmental protection. The model ordi-nance requires local governments to adhere to a 3 foot freeboard requirement which will significantly reduce future flood damages and flood insurance premiums on new and substantially improved structures.
158
All of the jurisdictions surveyed in 2012 except for two have adopted the Model Floodplain Manage-ment / Flood Damage Prevention Ordinance or equivalent regulations. This ordinance is intended to minimize future flooding impacts and integrate floodplain management with stormwater management during the land development process by promoting the No Adverse Impact approach. Eighty-seven of these jurisdictions have incorporated the new floodplain management provisions into their local development review process. As part of the adoption of the model floodplain ordinance, local jurisdictions are required to delineate the future-conditions hydrology 100-year floodplain within their jurisdictions. The ordinance also re-quires the local government to regulate floodplains on all streams with a drainage area of 100 acres and greater. Future-conditions flood studies are based on the best estimates of future land use con-ditions within a watershed. Local governments are responsible, at a minimum, for delineating future-conditions floodplains for all streams with a drainage area of one-square mile or greater. Forty-seven communities have responded by providing completed mapping of future-conditions floodplains within their jurisdictions, while another 25 have partially completed mapping in their city or county. Eight jurisdictions currently have a RFP or contract in place for the mapping of future-conditions floodplain, and/or they have completed some preliminary technical work. 6.1.3 Integration with Federal Programs and Planning Initiatives This section of the plan includes federal programs that GEMA and the State of Georgia utilize, which includes regulations that provide local communities with guidance for state and regional agencies. The State integrates several FEMA programs to accomplish our mitigation goals. Table 6.3 summa-rizes the Federal Program or Planning Initiative and how GHMS is integrated into them. National Flood Insurance Program (NFIP) The Georgia Department of Natural Resources (DNR), Environmental Protection Division (EPD) is a cooperating technical partner (CTP) with FEMA in the administration of the NFIP. GEMA works closely with the DNR floodplain management staff on NFIP issues as project eligibility requirements for mitigation grants depends on NFIP participation. Flood insurance, floodplain management, and flood hazard mapping are the three main components of the NFIP. Federally backed flood insurance is available to homeowners, renters, and business owners in communities who voluntarily participate in the NFIP. Increasing participation in the NFIP and encouraging property owners to purchase flood insurance significantly reduces disaster losses. There are 643 counties and cities in Georgia, of which 84% participate in the NFIP. The number of participating communities has increased by 14% since the last plan update.
Coastal model flood ordinance (coastal communities only) Riverine model flood ordinance (non-coastal communities)
Metropolitan North Georgia Water Planning District (for the fifteen counties currently com-prising the Water Planning District as established in 2001 by Senate Bill 130 and subse-quently modified)
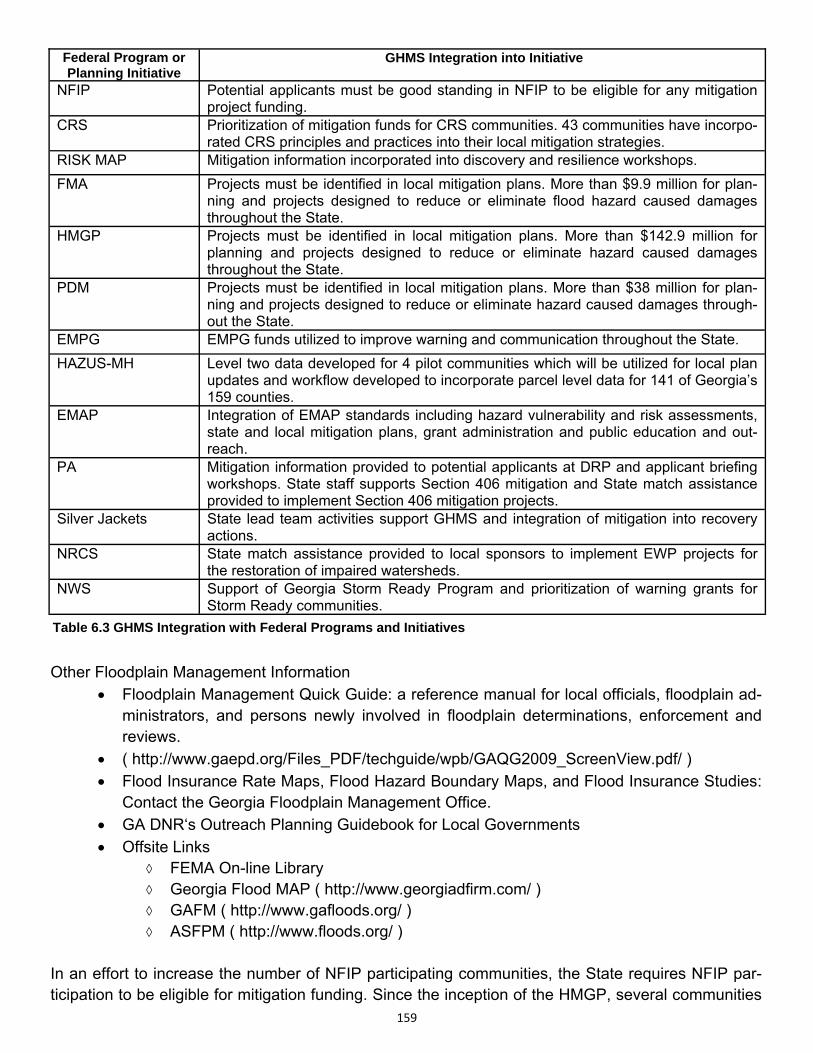
159
Other Floodplain Management Information Floodplain Management Quick Guide: a reference manual for local officials, floodplain ad-
ministrators, and persons newly involved in floodplain determinations, enforcement and reviews.
( http://www.gaepd.org/Files_PDF/techguide/wpb/GAQG2009_ScreenView.pdf/ ) Flood Insurance Rate Maps, Flood Hazard Boundary Maps, and Flood Insurance Studies:
Contact the Georgia Floodplain Management Office. GA DNR‘s Outreach Planning Guidebook for Local Governments
Offsite Links FEMA On-line Library Georgia Flood MAP ( http://www.georgiadfirm.com/ ) GAFM ( http://www.gafloods.org/ ) ASFPM ( http://www.floods.org/ )
In an effort to increase the number of NFIP participating communities, the State requires NFIP par-ticipation to be eligible for mitigation funding. Since the inception of the HMGP, several communities
Federal Program or Planning Initiative
GHMS Integration into Initiative
NFIP Potential applicants must be good standing in NFIP to be eligible for any mitigation project funding.
CRS Prioritization of mitigation funds for CRS communities. 43 communities have incorpo-rated CRS principles and practices into their local mitigation strategies.
RISK MAP Mitigation information incorporated into discovery and resilience workshops.
FMA Projects must be identified in local mitigation plans. More than $9.9 million for plan-ning and projects designed to reduce or eliminate flood hazard caused damages throughout the State.
HMGP Projects must be identified in local mitigation plans. More than $142.9 million for planning and projects designed to reduce or eliminate hazard caused damages throughout the State.
PDM Projects must be identified in local mitigation plans. More than $38 million for plan-ning and projects designed to reduce or eliminate hazard caused damages through-out the State.
EMPG EMPG funds utilized to improve warning and communication throughout the State.
HAZUS-MH Level two data developed for 4 pilot communities which will be utilized for local plan updates and workflow developed to incorporate parcel level data for 141 of Georgia’s 159 counties.
EMAP Integration of EMAP standards including hazard vulnerability and risk assessments, state and local mitigation plans, grant administration and public education and out-reach.
PA Mitigation information provided to potential applicants at DRP and applicant briefing workshops. State staff supports Section 406 mitigation and State match assistance provided to implement Section 406 mitigation projects.
Silver Jackets State lead team activities support GHMS and integration of mitigation into recovery actions.
NRCS State match assistance provided to local sponsors to implement EWP projects for the restoration of impaired watersheds.
NWS Support of Georgia Storm Ready Program and prioritization of warning grants for Storm Ready communities.
Table 6.3 GHMS Integration with Federal Programs and Initiatives
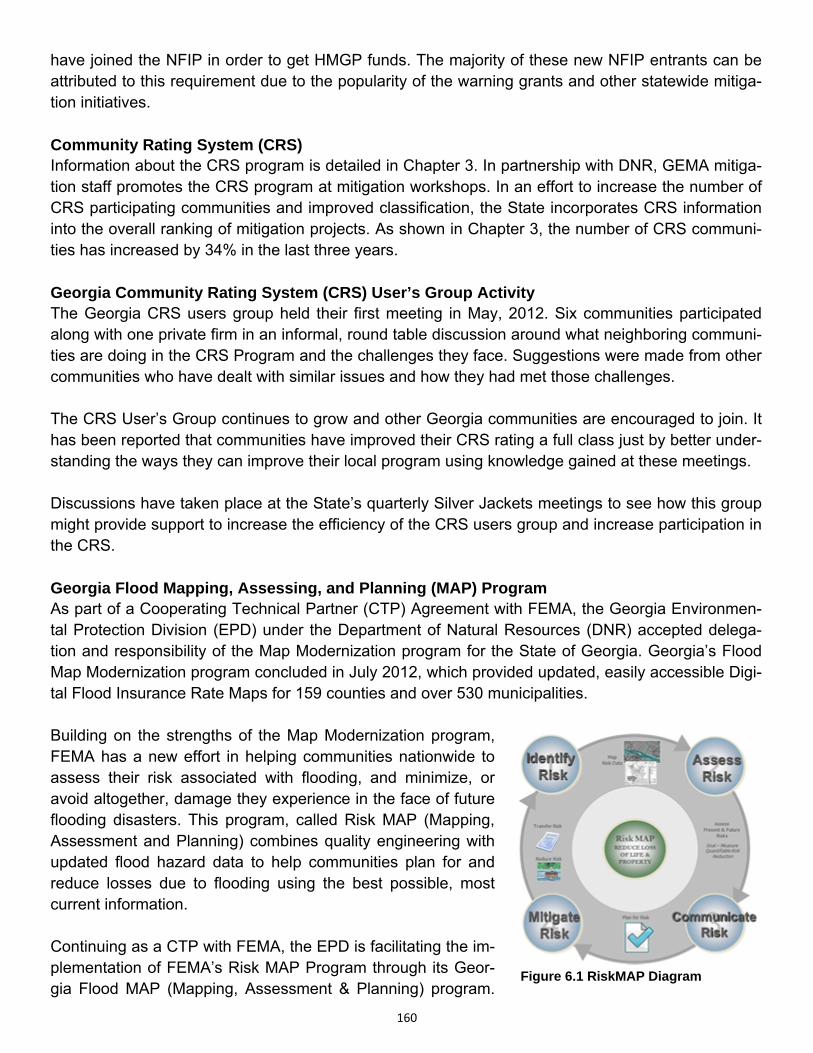
160
have joined the NFIP in order to get HMGP funds. The majority of these new NFIP entrants can be attributed to this requirement due to the popularity of the warning grants and other statewide mitiga-tion initiatives. Community Rating System (CRS) Information about the CRS program is detailed in Chapter 3. In partnership with DNR, GEMA mitiga-tion staff promotes the CRS program at mitigation workshops. In an effort to increase the number of CRS participating communities and improved classification, the State incorporates CRS information into the overall ranking of mitigation projects. As shown in Chapter 3, the number of CRS communi-ties has increased by 34% in the last three years. Georgia Community Rating System (CRS) User’s Group Activity The Georgia CRS users group held their first meeting in May, 2012. Six communities participated along with one private firm in an informal, round table discussion around what neighboring communi-ties are doing in the CRS Program and the challenges they face. Suggestions were made from other communities who have dealt with similar issues and how they had met those challenges. The CRS User’s Group continues to grow and other Georgia communities are encouraged to join. It has been reported that communities have improved their CRS rating a full class just by better under-standing the ways they can improve their local program using knowledge gained at these meetings. Discussions have taken place at the State’s quarterly Silver Jackets meetings to see how this group might provide support to increase the efficiency of the CRS users group and increase participation in the CRS. Georgia Flood Mapping, Assessing, and Planning (MAP) Program As part of a Cooperating Technical Partner (CTP) Agreement with FEMA, the Georgia Environmen-tal Protection Division (EPD) under the Department of Natural Resources (DNR) accepted delega-tion and responsibility of the Map Modernization program for the State of Georgia. Georgia’s Flood Map Modernization program concluded in July 2012, which provided updated, easily accessible Digi-tal Flood Insurance Rate Maps for 159 counties and over 530 municipalities. Building on the strengths of the Map Modernization program, FEMA has a new effort in helping communities nationwide to assess their risk associated with flooding, and minimize, or avoid altogether, damage they experience in the face of future flooding disasters. This program, called Risk MAP (Mapping, Assessment and Planning) combines quality engineering with updated flood hazard data to help communities plan for and reduce losses due to flooding using the best possible, most current information. Continuing as a CTP with FEMA, the EPD is facilitating the im-plementation of FEMA’s Risk MAP Program through its Geor-gia Flood MAP (Mapping, Assessment & Planning) program.
Figure 6.1 RiskMAP Diagram
161
This will provide direct management and support of all regulatory, engineering, and mapping activi-ties within the State of Georgia. EPD is committed to developing a fully integrated floodplain man-agement program that incorporates:
Mapping needs assessments;
Project scoping; Hydrologic and hydraulic modeling;
Floodplain delineation; An internal quality control process for all aspects of the program;
Digital Flood Insurance Rate Map (DFIRM) revisions;
Post preliminary DFIRM processing; and Risk Assessment & Communication.
Benefits to Georgia communities and citizens include:
The updated study data will provide more accurate information for Georgia communities to help with design decisions when rebuilding after flood disasters, building new structures and infrastructure, and when retrofitting existing structures.
DFIRMs will more accurately depict flood risk information.
Users will be able to make more precise flood risk determinations. Builders and developers can use the updated map data to determine where and how to
build structures more safely and how high to build to reduce the risk of flood damage. Real estate agents will be better able to inform clients of the risk factors that may affect
the property they are buying or selling as well as any flood insurance requirements. Insurance agents will know their clients’ current flood risk and can provide more informed
recommendations regarding flood insurance coverage options. Residents and business owners will understand their current flood risk and be able to
make better decisions about insuring and protecting their property against floods. Community officials will be able to develop more comprehensive approach to disaster miti-
gation planning, economic development and emergency response, resulting in a safer Georgia in which to live and work.
The Non-Regulatory products will provide substantially more and detailed information to communities to enable them to identify mitigation activities and for local plan updates. These products can further identify where flooding may take place within a community. Developing the additional locations could be used to help prioritize potential mitigation ac-tions within the community. These products include changes since last firm, depth and probability grids, HAZUS-MH loss estimates, and areas of mitigation interest.
RISK MAP Activities Upper Chattahoochee River Basin (UCRB) Project In April 2010, the Georgia Department of Natural Resources – Floodplain Management (GA DNR) launched the UCRB RiskMAP project that will assess and re-map flood risks along a 107-mile stretch of the Chattahoochee River Basin, including Cobb, Coweta, DeKalb, Douglas, Forsyth, Ful-ton and Gwinnett Counties. The new study will replace outdated detailed studies within the basin that date back as far as 1977. The updated maps will incorporate studies using new technology that
162
results in more accurate measurement and modeling. The models will also incorporate data collect-ed from recent flooding, such as the widespread floods of September 2009 to ensure that the new flood maps reflect the effects of actual flooding events that have occurred in the region. Scoping meetings were held with each county and extensive surveying performed. Preliminary flood maps were completed and made available for public review in September- November 2011 and be-came effective in the March-April of 2012. Over 50 meetings were held within the project area follow-ing the issuance of the Preliminary Maps. Letters of final determination were completed in the Au-gust-November 2012 and the new maps went effective February-May 2013. DNR in partnership with GEMA and FEMA hosted Disaster Resilience workshops for each of the communities when the new maps and products were completed. With the new maps and associated studies, government agen-cies, residents, and businesses throughout the upper Chattahoochee River region will have more up-to-date information about their flood risks and the data will be easily available online. In addition, the non-regulatory products produced will further support the identification of mitigation projects and local mitigation plan updates. Georgia Coastal Mapping Project GA DNR launched its second Georgia Flood MAP project in the fall of 2010. The Georgia Coastal Mapping Project will involve two different studies (riverine and coastal) in nine coastal counties (Bryan, Camden, Charlton, Chatham, Effingham, Glynn, Liberty, Long, and McIntosh). The coastal study will provide the most detailed analysis of the flood risk along the coastline ever performed. New elevation and updated storm data will be used along with the latest computer models and high-capacity systems to generate Georgia’s most accurate coastal study, flood maps and improved un-derstanding of the coastal flood risk. While this is occurring, a second study will be ongoing that will map in more detail select watersheds in the nine coastal counties. Again, new elevation and storm data will be used to more accurately model and map the current flood risk. The preliminary FIRMs for the coastal phase are expected to be issued in the Spring of 2015. Initial Discovery Meetings for Three Watersheds In the spring of 2012, in partnership with GEMA and FEMA, the GA DNR conducted the Discovery Process for communities within the Middle Chattahoochee, Upper Ocmulgee, Middle Savannah and Upper Savannah Watersheds. This process began with online surveys to obtain basic needs docu-mentation from communities followed by one-on-one telephone interviews to determine the detailed mapping needs of the community as well as mitigation efforts in place. After information was ob-tained from communities, as well as GA DNR, FEMA and GEMA, watershed-wide Discovery Meet-ings were held to further explain this new initiative to stakeholders while encouraging intercommunity dialogue and mitigation planning. Communities shared information with one another about capital improvement projects within the watershed as well as major mitigation projects (both ongoing and planned) in addition to major flooding and mapping issues. Community participants included emer-gency managers, planners, engineers, zoning administrators, permitting officials, among other tech-nical staff.
163
In January 2013, a new flood hazard mapping project commenced that will assess and re-map the flood risks within the Middle Chattahoochee – Lake Harding and Upper Ocmulgee River Basin wa-tersheds. Project kick-off meeting were held throughout each watershed to introduce the project scope to all impacted communities. GA DNR and its contractors have engaged county and commu-nity officials as well as industry stakeholders from the involved counties to share information as well as receive updated information related to local flooding as well as any new detailed studies that may have been locally performed. DNR has published newsletters that provide much more detail on the RISK MAP activities. These newsletters can be accessed on the GeorgiaDFIRM website. As part of the transition to Georgia Flood MAP Program, the GeorgiaDFIRM.com website has been updated to more effectively distrib-ute comprehensive information about the program to floodplain management officials, property own-ers, and other community stakeholders. The website contains background information, status re-ports, technical data, outreach materials, and valuable links to other pertinent information. GEMA works closely with State floodplain management staff to advance the Map Modernization and Risk MAP initiatives. Mitigation staff supported all of the discovery meetings with data and presenta-tion of information. In addition, staff supported all of the Disaster Resilience Workshops. These im-proved flood maps and non-regulatory products will lead to a much more refined risk assessment in our ongoing efforts to reduce Georgia’s flood vulnerability. GEMA has worked with some of the com-munities in the RISK MAP study area to utilize the non-regulatory products to select future flood miti-gation projects. Flood Mitigation Assistance (FMA) FEMA provides FMA funds to assist States and communities implement measures that reduce or eliminate the long term risk of flood damage to buildings, manufactured homes, and other structures insurable under the National Flood Insurance Program. Georgia has utilized planning, project, and technical assistance grants through the FMA program. As noted in Section 6.5, FMA funds are uti-lized to develop flood mitigation plans and implement projects that reduce or eliminate claims against the NFIP primarily through property acquisition. With the recent update to the FMA program to incorporate Severe Repetitive Loss (SRL) and Repetitive Flood Claims programs, the State has focused its efforts for the HMA13 application cycle to address SRL properties. Hazard Mitigation Grant Program (HMGP) The Hazard Mitigation Grant Program (HMGP) provides grants to States and local governments to implement long-term hazard mitigation measures after a major disaster declaration. The purpose of the HMGP is to reduce the loss of life and property due to natural disasters and to enable mitigation measures to be implemented during the immediate recovery from a disaster. The HMGP is author-ized under Section 404 of the Robert T. Stafford Disaster Relief and Emergency Assistance Act. The Disaster Mitigation Act of 2000 (DMA2K) placed a much greater emphasis on risk-based data driven mitigation plans. Georgia utilized primarily PDM funds to meet the initial development of state and local mitigation planning requirements of DMA2K. For the initial plan development, 20 of the state’s 159 counties received HMGP planning assistance with the remainder receiving assistance through the PDM program. Through the Enhanced Plan, the State has received a 33% increase in
164
mitigation funds in the aftermath of a disaster for DR1833, DR1858, and DR1973. This has made additional funds available to meet the plan update funding needs in Georgia. HMGP grants are a major component of funding Georgia will utilize to not only update plans but to implement state and local projects identified in these plans. With the increase in HMGP funds due to the 6 presidential disaster declarations since 2007, the majority of the local plan updates are being funded through the HMGP 7% allocation. HMGP funds have been utilized to fund the completion of the first local plan update cycle and the third State Mitigation Plan update. Pre-Disaster Mitigation Program (PDM) The PDM program provides funds to states, territories, Indian tribal governments, and communities for hazard mitigation planning and the implementation of mitigation projects prior to a disaster event. Funding these plans and projects reduces overall risks to the population and structures, while also reducing reliance on funding from actual disaster declarations. PDM grants are to be awarded on a competitive basis and without reference to state allocations, quotas, or other formula-based alloca-tion of funds. The 44CFR Part 201, Hazard Mitigation Planning, established criteria for State and local hazard miti-gation planning authorized by Section 322 of the Stafford Act, as amended by Section 104 of the Disaster Mitigation Act of 2000. State and local mitigation plans meeting these criteria must be ap-proved in order to receive PDM funds for State and local mitigation projects. Therefore, the develop-ment and update of State and local mitigation plans is essential to maintain eligibility for future PDM funding. The State has utilized the PDM program to fund the initial development of multi-jurisdictional plan-ning grants for 136 counties and plan updates in 3 counties. The State is pursuing PDM funds through the FY13 application cycle to start the second local plan update cycle for 28 counties. Sec-tion 6.5 includes a further discussion on the utilization of the PDM program since its inception in 2002. GEMA mitigation staff works closely with local governments to develop and submit projects and plans for funding consideration. Mitigation staff has also served on the national review panel and GEMA will continue to support the development of plans and projects for future PDM funding. HAZUS-MH HAZUS-MH is a nationally applicable standardized methodology and software program that contains models for estimating potential losses from earthquakes, floods, and hurricane winds. HAZUS-MH was developed by the Federal Emergency Management Agency (FEMA) under contract with the Na-tional Institute of Building Sciences (NIBS). Loss estimates produced by HAZUS-MH are based on current scientific and engineering knowledge of the effects of hurricane winds, floods, and earth-quakes. Estimating losses is essential to decision-making at all levels of government, providing a ba-sis for developing mitigation plans and policies, emergency preparedness, and response and recov-ery planning. HAZUS-MH uses ArcGIS software to map and display hazard data and the results of damage and economic loss estimates for buildings and infrastructure. It also allows users to estimate the impacts of hurricane winds, floods, and earthquakes on built environment and populations. HAZUS-MH is
165
fast-running to facilitate use in real time to support response and recovery following a natural disas-ter. HAZUS User Groups (HUGs) have been in existence since 1997. These public-private partnerships between public, private, and academic organizations use HAZUS-MH software and technology to build enhanced disaster-resistant communities and save lives, time, and dollars. Georgia has its own chapter which is very active. In addition, as described in Section 6.1.2 above, The Georgia Department of Community Affairs, with the support of the Georgia Emergency Management Agency, conducted HAZUS-MH training in three locations throughout the state for local communities and interested Regional Commissions. This training will allow more local communities to make use of the program for their planning needs. Emergency Management Performance Grants (EMPG) Concerning the enhanced plan element of plan integration, one of the examples of demonstrated in-tegration with FEMA programs and initiatives include how the enhanced plan guides activities fund-ed by EMPG. One activity funded through the EMPG was the Emergency Management Accreditation Program (EMAP) certification. EMAP is a standard-based voluntary assessment and accreditation process for state and local government programs responsible for coordinating prevention, mitigation, prepared-ness, response, and recovery activities for natural and human-caused disasters. Accreditation is based on compliance with collaboratively developed national standards, the EMAP Standard. (The EMAP Standard is based on the NFPA 1600 Standard on Disaster/Emergency Management and Business Continuity Programs, 2004). Georgia went through the EMAP reaccreditation in March 2013. Georgia received full reaccreditation on the 64 standards in May 2013. The Georgia programs continue to meet national standards for disaster preparedness and response. The Georgia Mitigation Information System was noted as a best practice in our exit interview. Starting in Fiscal Year 2008, GEMA established criteria for local EMAs to be eligible for additional funds above the baseline EMPG allocation. These response and recovery project competitive award criteria demonstrate enhanced plan integration. In order to be eligible for these enhancement grants, local governments must have an approved local hazard mitigation plan or be in the process of updat-ing their plan to meet the five year recertification. In addition, the local government must be in good standing in the NFIP. Since the time of the last update, an additional $1.02 million has been awarded to 33 local governments for warning and communication enhancements. As a result of this initiative, almost $1.5 million has been awarded to 59 local governments to implement projects to improve warning and communication. Public Assistance Program The objective of the Federal Emergency Management Agency's (FEMA) Public Assistance (PA) Grant Program is to provide assistance to State, Tribal and local governments, and certain types of Private Nonprofit organizations so that communities can quickly respond to and recover from major
166
disasters or emergencies declared by the President. Through the PA Program, FEMA provides Fed-eral disaster grant assistance for debris removal, emergency protective measures, and the repair, replacement, or restoration of disaster-damaged, publicly owned facilities and the facilities of certain Private Non-Profit (PNP) organizations. The PA Program also encourages protection of these dam-aged facilities from future events by providing assistance for hazard mitigation measures during the recovery process, which is commonly referred to as Section 406 mitigation. Georgia utilized Section 403to assist with the implementation of the HMGP for DR 1858. Both pro-grams (HMGP and PA) were packaged to local governments in an effort to maximize the number of substantially damaged (SD) properties that could be mitigated through property acquisition and dem-olition. The PA program was utilized to cover the expenses associated with the demolition of HMGP funded SD acquisitions. As a result of this initiative, more than $2 million in demolition expenses were covered by the PA program, which freed up these funds to acquire approximately 20-30 more SD properties. Local governments are encouraged to pursue Section 406 mitigation. Public Assistance Mitigation Profile reports for DR 1833, DR 1858 and DR1973, which were pulled from FEMA’s EMMI System, can be viewed in Appendix H. These reports show a significant amount of Section 406 mitigation completed for DR1833 and DR1858. Silver Jackets Effective and continuous collaboration between state and Federal agencies is critical to successfully reducing the risk of flooding and other natural disasters in the United States and enhancing re-sponse and recovery efforts when such events do occur. No single agency has all the answers, but often multiple programs can be leveraged to provide a cohesive solution. The Silver Jackets is an innovative program that provides an opportunity to consistently bring together multiple Federal, State and sometimes local agencies to learn from one another and apply that knowledge to reduce risk. The Silver Jackets program provides a formal and consistent strategy for an interagency approach to planning and implementing measures to reduce the risks associated with flooding and other natural hazards. The program is a partnership of the U.S. Army Corps of Engineers, the Federal Emergency Manage-ment Agency (FEMA) and other federal and state agencies. Silver Jacket programs are developed at the state level with support from the Corps, FEMA and other Federal agencies. The program's pri-mary goals are to:
Create or supplement a mechanism to collaboratively address risk management issues, prioritize those issues, and implement solutions;
Increase and improve risk communication through a unified interagency effort; Leverage information and resources, including providing access to such national programs
as FEMA's Map Modernization program and RiskMAP programs and USACE's Levee In-ventory and Assessment Initiative;
Provide focused, coordinated hazard mitigation assistance in implementing high-priority actions such as those identified by state mitigation plans; and
167
Identify gaps among the various agency programs and/or barriers to implementation, such as conflicting agency policies or authorities, and provide recommendations for addressing these issues.
The program's desired outcomes are:
Reduced flood risk;
Agencies better understand and leverage each other's programs; Collaboration between various agencies, coordinated programs, cohesive solutions;
Multi-agency technical resource for state and local agencies; and Mechanism for establishing relationships to facilitate integrated solutions post-disaster
Georgia has developed a Silver Jackets team with a signed charter. The team meets on a quarterly basis or as needed to address flood risk reduction strategies. A copy of the charter along with GE-MA’s adoption can be found in Appendix H. Team activities over the past three years have resulted in the development of Flood Forecast Inun-dation Maps (FFIM) similar to what was completed in Albany, Georgia. FFIMS have been completed for Suwanee Creek at Suwanee, Sweetwater Creek at Austell, Chattahoochee River at SR280 near Atlanta, and Peachtree Creek at Atlanta. FFIMs are under development for the Ocmulgee River at Macon. The FFIMs assist federal, state, and local officials as well as property owners to be able to take ac-tion long before a flood actually happens to save lives and reduce property damages. This online tool helps identify where the potential threat of floodwaters is greatest, enabling federal, state, and local officials to better plan for flood response, resource recovery, and assess evacuation routes at various flood levels before the rain falls. Pilot funds have been awarded for the Macon Levee Safety Project. This project will examine the high-risk problems of the reduced level of protection and under seepage and opportunities that could alleviate these problems, reduce the risk of loss of life and damages to property and support accredi-tation. Pilot funds have been awarded to assist Augusta-Richmond County with the identification of cost-effective mitigation strategies for the Hyde Park area. The purpose of this project is for the Georgia Silver Jackets Team to assist the state and Augusta-Richmond County in eliminating the risk of loss of life and damages to 189 properties in Hyde Park. Funding has been committed on each presidentially declared disaster to provide or assist with the non-federal match for locally sponsored projects under this program. Since 1994, almost $25 million has been approved on EWP measures and the State has provided $5.7 million as match for this pro-gram. Since the last plan update, GEMA and NRCS established a Memorandum of Understanding for DR1973 which authorized the State to provide 40% of the non-federal match requirement on all Emergency Watershed Protection projects approved by NRCS.
168
National Weather Service (NWS) GEMA has continued its partnership with NWS on the StormReady program. This NWS program recognizes counties that have reached a high level of severe weather preparedness. StormReady counties have increased by 12 since July of 2010, presently reaching 79 total counties. In addition, GEMA supports the Atlanta Integrated Warning Team. This team is made up of staff from the Na-tional Weather Service, emergency management, the media, the private sector and social scientists to look for ways to improve the warning system and reduce weather related fatalities and injuries. 6.2 PROJECT IMPLEMENTATION CAPABILITY The 44 CFR 201.5(b)(2) (i) and (ii) states the Enhanced Plan must document the State’s project im-plementation capability, identifying and demonstrating the ability to implement the plan, including:
Established eligibility criteria for multi-hazard mitigation measures; and A system to determine the cost effectiveness of mitigation measures, consistent with OMB
Circular A-94, Guidelines and Discount Rates for Benefit-Cost Analysis of Federal Pro-grams, and to rank the measures according to the State’s eligibility criteria.
Georgia Emergency Management Agency’s Hazard Mitigation Division staff has overall responsibility for implementation of the Hazard Mitigation Assistance programs. These programs include the Haz-ard Mitigation Grant Program (HMGP), Flood Mitigation Assistance (FMA) program, and Pre-Disaster Mitigation (PDM) program. The Biggert-Waters Flood Insurance Reform Act of 2012 incor-porated elements of the Repetitive Flood Claims and Severe Repetitive Loss programs into the FMA program so the implementation of these two programs have been incorporated into the FMA pro-gram. State criteria have been developed for determining eligibility for all types of proposed multi-hazard mitigation measures for these programs. The State utilizes the procedures outlined in the HMGP administrative plan for the administration of all of the programs mentioned above. The State submitted its last update to the HMGP administra-tive plan in May 2011 for the DR1973 disaster. The HMGP administrative plan was approved by FE-MA in July 2011. See Appendix H for the HMGP Administrative Plan. 6.2.1 Eligibility Criteria Applications that are received by the Hazard Mitigation Division for funding consideration through the HMGP, FMA, and PDM programs are reviewed for the following eligibility criteria:
Conformance with the goals and actions of the State Hazard Mitigation Plan;
Meets applicant eligibility requirements;
Meets project type requirements which include but are not limited to: Voluntary acquisition or relocation of hazard-prone structures for conversion to
open space in perpetuity; Retrofitting of existing buildings and facilities for wildfire, seismic, wind or flood haz-
ards (i.e., elevation, storm shutters, hurricane clips), including designs and feasibil-ity studies when included as part of the proposed project;
169
Construction of “safe rooms”(i.e., tornado and severe wind shelters) that meet the FEMA construction criteria in FEMA 320 “Taking Shelter from the Storm” and FEMA 361 “Design and Construction Guidance for Community Shelters”;
Minor structural hazard control or protection projects that may include vegetation management, stormwater management (e.g., culverts, floodgates, retention ba-sins), or shoreline/landslide stabilization;
Localized flood control projects that are designed specifically to protect critical facili-ties (defined as Hazardous Materials Facilities, Emergency Operation Centers, Power Facilities, Water Facilities, Sewer and Wastewater Treatment Facilities, Communications Facilities, Emergency Medical Care Facilities, Fire Protection, and Emergency Facilities) and that do not constitute a section of a larger flood control system;
Development of State or local plans that meet DMA2K requirements; and Projects that improve the warning and communication capabilities of local govern-
ments for severe weather or emergency events (HMGP Only). Have a beneficial impact upon the project area;
Be in conformance with 44 CFR Part 9, Floodplain Management and Protection of Wet-lands and 44 CFR Part 10, Environmental Considerations;
Solve a problem independently or constitute a functional portion of a solution where there is assurance that the project as a whole will be completed (Projects that merely identify or analyze hazards or problems without a funded, scheduled implementation program is not eligible.);
Addresses a problem that has been repetitive, or a problem that poses a significant risk if left unsolved;
Be cost-effective. Demonstrate that the project will not cost more than the anticipated val-ue of the reduction in both direct damages (property) and subsequent negative impacts (loss of function, deaths, injuries) to the area if future disasters were to occur. Both costs and benefits will be computed on a net present value basis (i.e. obtaining expected dam-age estimates as a function of hazard intensity);
Has been determined to be the most practical, effective, and environmentally sound alter-native after consideration of a range of options, including the “no action” alternative; and
Contributes, to the extent practicable, to a long term solution to the problem it is intended to address;
Considers long-term changes to the areas and entities it protects, and has manageable future maintenance and modification requirements; and
Have a federally approved hazard mitigation plan. In addition, GEMA also considers the following criteria in evaluating proposed mitigation projects:
Conformance with the goals and objectives of the Local Hazard Mitigation Plan. For each of the HMA programs, projects must be listed in plan;
Mitigation activities that if not taken will have a severe detrimental impact on the communi-ty such as the loss of life, loss of essential services, damage to critical facilities, or eco-nomic hardship;
Mitigation activities that have the greatest potential for reducing future disaster losses;
170
Mitigation activities that are designed to accomplish multiple objectives, including damage reduction, environmental enhancement, historical preservation, recreational opportunities, and economic recovery;
The community’s level of interest and demonstrated degree of commitment to mitigation programs and activities;
Communities participation in and compliance with the National Flood Insurance Program (NFIP); GEMA coordinates with the Georgia Department of Natural Resources in deter-mining a community’s compliance with the NFIP.
The proposed project does not encourage development in a Special Flood Hazard Area; Applicant has the ability to provide for the non-federal cost share; and
Applicant and/or local government that are receiving the mitigation benefit must be in good standing in the National Flood Insurance Program (exception for planning grants)
The eligibility requirements were reviewed during the update process. No changes were necessary. 6.2.2 Cost Effectiveness Determination As stated in the above criteria, projects have to be cost-effective. Only projects with a benefit-cost ratio of at least 1 to 1 are forwarded to FEMA for funding consideration. The State utilizes a system to determine the cost-effectiveness of all mitigation measures consistent with OMB Circular A-94 for each project application submitted to FEMA for funding with the exception of Planning, TA/Management, and Initiative projects. Prior to mitigation grant applications being scored for competi-tive ranking, GEMA Hazard Mitigation Staff works closely with each applicant to get sufficient docu-mentation to determine if the proposed applications are cost-effective. Only projects with a benefit-cost ratio exceeding 1.0 are ranked for further funding consideration. Each analysis conducted by GEMA staff utilizes the most recent Benefit Cost Analysis (BCA) tools (current version is BCA Ver-sion 4.8.0) approved and provided by FEMA. State Mitigation staff work very closely with the sub-applicants on proposed grants to ensure they meet the minimum benefit cost requirements. Although the state mitigation staff completes the benefit-cost analysis, they depend on information in the application provided by the community. To help communities develop mitigation projects that are as cost-effective as possible, and that have a benefit of one dollar for each dollar of cost, the mitiga-tion staff developed the Pre-application and application specific worksheets for each type of project and are used for all of the mitigation programs. The information requested on the worksheets pro-vides staff with the data necessary for an accurate and complete benefit-cost analysis. Sub-applicants submit the worksheets (pre-applications) for benefit-cost review, prior to moving forward with the completion of the full application. The worksheets are updated annually and utilized with every HMA application process. The State has extensive experience in utilizing the FEMA developed benefit-cost modules. Since October 1, 1995, the State has utilized FEMA developed software to complete benefit-cost (BC) re-views for each mitigation project submitted for federal funding. Due to the high number of flood miti-gation projects, the state has gained the most experience in utilizing the FEMA flood BC models (both Full Data and Limited Data).
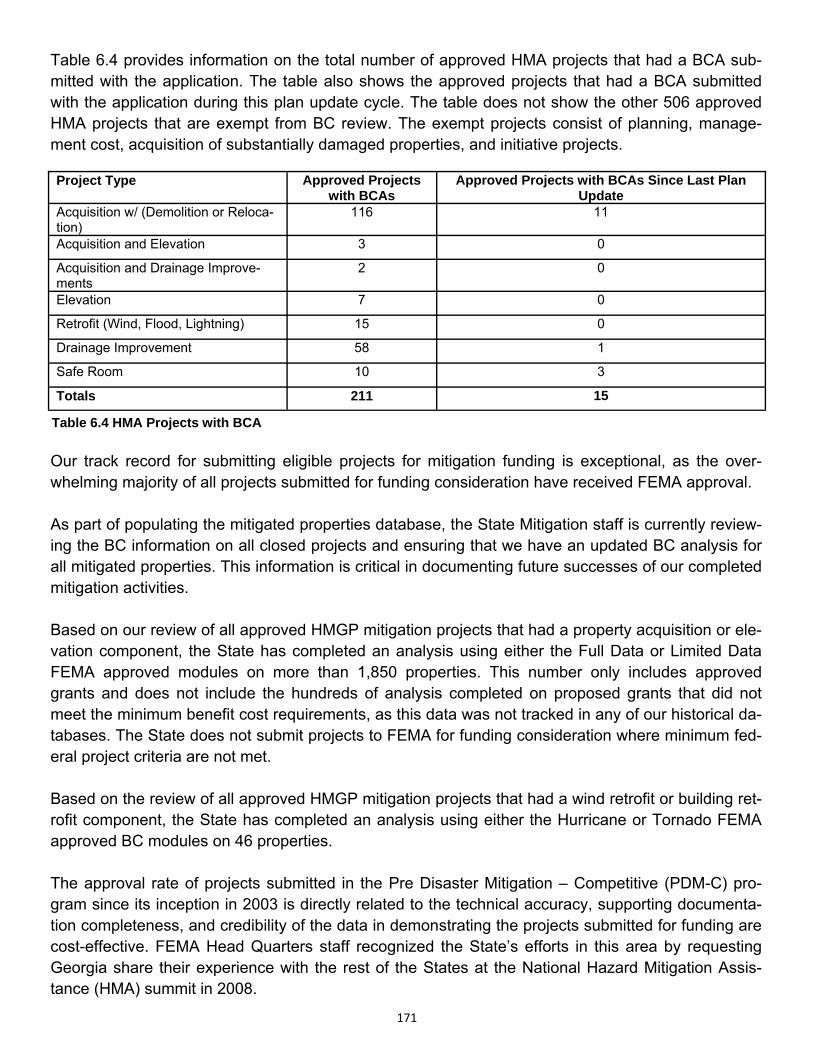
171
Table 6.4 provides information on the total number of approved HMA projects that had a BCA sub-mitted with the application. The table also shows the approved projects that had a BCA submitted with the application during this plan update cycle. The table does not show the other 506 approved HMA projects that are exempt from BC review. The exempt projects consist of planning, manage-ment cost, acquisition of substantially damaged properties, and initiative projects.
Our track record for submitting eligible projects for mitigation funding is exceptional, as the over-whelming majority of all projects submitted for funding consideration have received FEMA approval. As part of populating the mitigated properties database, the State Mitigation staff is currently review-ing the BC information on all closed projects and ensuring that we have an updated BC analysis for all mitigated properties. This information is critical in documenting future successes of our completed mitigation activities. Based on our review of all approved HMGP mitigation projects that had a property acquisition or ele-vation component, the State has completed an analysis using either the Full Data or Limited Data FEMA approved modules on more than 1,850 properties. This number only includes approved grants and does not include the hundreds of analysis completed on proposed grants that did not meet the minimum benefit cost requirements, as this data was not tracked in any of our historical da-tabases. The State does not submit projects to FEMA for funding consideration where minimum fed-eral project criteria are not met. Based on the review of all approved HMGP mitigation projects that had a wind retrofit or building ret-rofit component, the State has completed an analysis using either the Hurricane or Tornado FEMA approved BC modules on 46 properties. The approval rate of projects submitted in the Pre Disaster Mitigation – Competitive (PDM-C) pro-gram since its inception in 2003 is directly related to the technical accuracy, supporting documenta-tion completeness, and credibility of the data in demonstrating the projects submitted for funding are cost-effective. FEMA Head Quarters staff recognized the State’s efforts in this area by requesting Georgia share their experience with the rest of the States at the National Hazard Mitigation Assis-tance (HMA) summit in 2008.
Project Type Approved Projects with BCAs
Approved Projects with BCAs Since Last Plan Update
Acquisition w/ (Demolition or Reloca-tion)
116 11
Acquisition and Elevation 3 0
Acquisition and Drainage Improve-ments
2 0
Elevation 7 0
Retrofit (Wind, Flood, Lightning) 15 0
Drainage Improvement 58 1
Safe Room 10 3
Totals 211 15
Table 6.4 HMA Projects with BCA
172
All GEMA Risk Reduction Hazard Mitigation Division staff receive benefit-cost training from FEMA Region IV or at EMI to fully understand how to utilize the FEMA benefit-cost modules for completing the benefit-cost analysis. Each new employee as part of their training is required to attend the next available FEMA offered BC training courses. The State has implemented hazard mitigation eligibility criteria reviews in 21 presidential declared disasters on 600 projects since 1990. In addition, similar types of reviews are done for the Flood Mit-igation Assistance and PDM-C programs. The projects submitted have been diverse in nature and include drainage improvements, acquisition, elevation, wind retrofit, tornado safe room construction, planning, and many warning initiative projects. The State’s system for determining cost-effectiveness for Hazard Mitigation Assistance grants has been reviewed. The State continues to use the most recent FEMA BCA tools in determining cost-effectiveness for mitigation grants and the process is updated to incorporate these tools. 6.2.3 System to Rank Projects GEMA Hazard Mitigation Division staff review all proposed mitigation pre-applications and applica-tions to ensure that the proposed projects are eligible and meet minimum criteria as outlined above. In evaluating proposed projects, GEMA reviews, ranks and scores proposed projects. The State re-view criteria include a scoring sheet to determine potential for funding and overall priority within the application process. There are two basic types of projects: Regular Program Projects and Initiative Projects. Each has its own score sheet. The main categories utilized in ranking the Regular Program project submissions include natural hazard, history of damages, type of mitigation, potential impact on community, estimated environmental impact, community commitment to mitigation, and benefits. The ranking categories in the Initiative Project score sheet include History of Tornado Hazard in County, Potential Benefit to Community, Cost Effectiveness and Intangible Factors. Each category within either score sheet is given a maximum range of points. Point amounts were developed over several years by the Hazard Mitigation staff and are based primarily upon HMGP guidelines. Maximum point possibilities per category range from 5 to 25 points and are listed below. The maximum amount of points any one project could accumulate would be 100. The Regular Pro-gram score sheet has a possible 10 bonus points which can be used in a tie breaker situation. Categories included in the Regular Program score sheet are described here: Natural Hazard Score – The natural hazard score is dependent upon the type of disaster, its location
in regard to the coast and if a tornado is involved. A maximum of 25 points is possible in this sec-tion, depending upon the following criteria: the total amount of damage, the amount of flooding, proximity to the coast line and historic record of tornados in that area. In a post-disaster environ-ment, priorities are established by the disaster type(s). In the event of multiple disasters scoring will be calculated for each event and combined to give an overall score. (In some situations with multiple disasters the score could exceed 25)
173
History of Damage in Project Area – Historical records of events in a county/project area and the likelihood of the event happening again will determine the total amount of points issued in this category. Five points are given for every event documented, up to a maximum of five events. The highest amount available in this category is 25 points.
Type of Mitigation – In this category the reviewer must determine if the mitigative action is Non-
Structural or Structural. Examples of Non-Structural projects are flood proofing, retrofitting, eleva-tion, acquisition and the implementation of stricter building codes. Structural projects would entail flood walls and storm water drainage improvements. The most effective type of mitigative action can garner 5 points.
Potential Impact on Community – Projects are prioritized by their ability to eliminate or reduce the
effects upon the community by a disaster event. The failure to implement a project can have ei-ther a severe, moderate or no potential impact on a community. Depending upon the amount of perceived future impact avoidance, a project can accumulate up to 15 points.
Estimated Environmental Impact – Environmental impact is broken into three categories; Major,
Moderate and Insignificant. A maximum of 5 points is awarded to the project according to its abil-ity to reduce the impact of a disaster to the environment.
Intangible Factors – These factors include whether or not a community is storm ready, its CRS rat-
ing, amount of local cost share paid by the community and the community’s experience in suc-cessfully completing mitigation projects.
Benefits – One point is awarded per $500,000 in hazard avoidance benefits to a community with a
maximum of 15 points. Bonus Point Section – (Tie Breaker) The State utilizes the quality of the data in the application as a
tie-breaker if needed. A maximum of 10 points can be given to an application depending upon the quality of the data in the application, the amount of hazard data, damage history, cost data and environmental impact analysis. It is in this section that two applications with very similar scores are compared and a tie breaker is issued.
Initiative projects are non-competitive; however, they are competitive between each other for the funds available. Categories included in the most recently used Initiative Program score sheet are de-scribed here: History of Tornado Hazard in County – The more likely a tornado event will occur determines the
amount of points awarded a project. The likelihood is calculated based on the history of tornados in that area. The higher the likelihood the higher the points to a maximum of 25.
Potential Benefit to Community – One quarter of a point is awarded per 1,000 population warned per
device. Maximum award possible 25 points.
174
Cost Effectiveness ($/per capita warned) – Cost effectiveness is broken down into 6 categories. Points are awarded based on the overall cost per capita warned. Maximum award is 25 points.
Intangible Factors – These factors include whether or not a community is storm ready and the com-
munities experience in successfully completing mitigation projects. A maximum of 25 points can be awarded in this category.
Based on State priorities, non-structural projects such as acquisition, demolition, and relocation gen-erally receive the highest ranking and the greatest consideration for funding. Planning projects are given priority over structural and non-structural projects due to the fact that a FEMA approved haz-ard mitigation plan is a requirement for a community to be eligible for a federal grant. Therefore, planning projects always receives a higher ranking than a structural or non-structural application. Counties involved in a Presidential Declaration are given priority over non-declared counties. Appendix F provides the HMA score sheet used for the FMA grant for FY 2013. This score sheet is used to rank all of the HMA project grants that meet BC and other project eligibility criteria. For the Flood Mitigation Assistance Program, additional criteria include the proposed project must address mitigating an NFIP insured property with repetitive loss and severe repetitive loss properties receiving priority. 6.3 PROGRAM MANAGEMENT CAPABILITY The 44 CFR 201.5(b)(2) (iii A-D) states the Enhanced Plan must document that the State has the capability to effectively manage the HMGP as well as other mitigation grant programs, and provide a record of the following:
Meeting HMGP and other mitigation grant application timeframes and submitting com-plete, technically feasible, and eligible project applications with appropriate supporting documentation;
Preparing and submitting accurate environmental reviews and benefit-cost analyses; Submitting complete and accurate quarterly progress and financial reports on time; and
Completing HMGP and other mitigation grant projects within established performance pe-riods, including financial reconciliation.
This section of the plan demonstrates the State’s capabilities to effectively manage the Hazard Miti-gation Grant Program (HMGP) and other mitigation grant programs. GEMA’s Hazard Mitigation Division has primary responsibility for program management. The Divi-sion consists of a Planning Section and a Risk Reduction Section, with staff dedicated to providing technical assistance to state agencies and local governments on the development and implementa-tion of mitigation plans and projects. Each section is supervised by a Program Manager who reports to the Division Director. The respective program managers review all activities of their program staff for compliance. The number of program staff can vary based on disaster activity. Since the last plan update, the Division has added one additional planner to support state and local plan updates. The
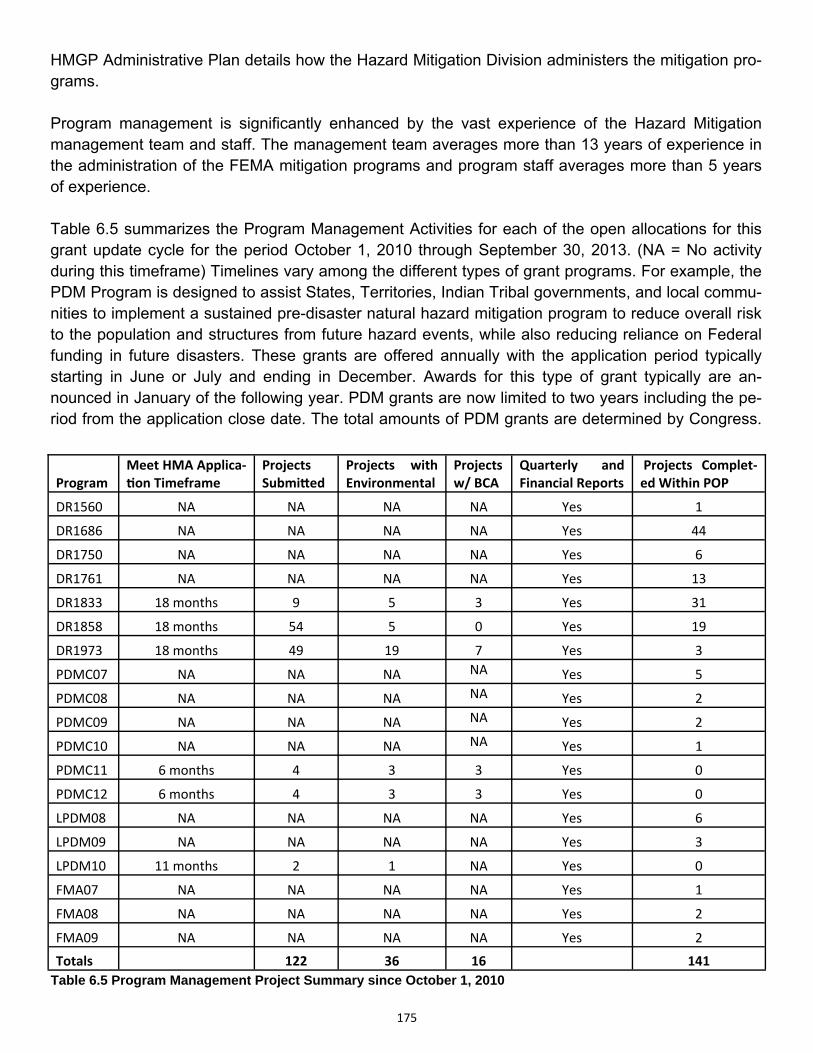
175
HMGP Administrative Plan details how the Hazard Mitigation Division administers the mitigation pro-grams. Program management is significantly enhanced by the vast experience of the Hazard Mitigation management team and staff. The management team averages more than 13 years of experience in the administration of the FEMA mitigation programs and program staff averages more than 5 years of experience. Table 6.5 summarizes the Program Management Activities for each of the open allocations for this grant update cycle for the period October 1, 2010 through September 30, 2013. (NA = No activity during this timeframe) Timelines vary among the different types of grant programs. For example, the PDM Program is designed to assist States, Territories, Indian Tribal governments, and local commu-nities to implement a sustained pre-disaster natural hazard mitigation program to reduce overall risk to the population and structures from future hazard events, while also reducing reliance on Federal funding in future disasters. These grants are offered annually with the application period typically starting in June or July and ending in December. Awards for this type of grant typically are an-nounced in January of the following year. PDM grants are now limited to two years including the pe-riod from the application close date. The total amounts of PDM grants are determined by Congress.
Program
Meet HMA Applica‐on Timeframe
Projects Submi ed
Projects with Environmental
Projects w/ BCA
Quarterly and Financial Reports
Projects Complet‐ed Within POP
DR1560 NA NA NA NA Yes 1
DR1686 NA NA NA NA Yes 44
DR1750 NA NA NA NA Yes 6
DR1761 NA NA NA NA Yes 13
DR1833 18 months 9 5 3 Yes 31
DR1858 18 months 54 5 0 Yes 19
DR1973 18 months 49 19 7 Yes 3
PDMC07 NA NA NA NA Yes 5
PDMC08 NA NA NA NA Yes 2
PDMC09 NA NA NA NA Yes 2
PDMC10 NA NA NA NA Yes 1
PDMC11 6 months 4 3 3 Yes 0
PDMC12 6 months 4 3 3 Yes 0
LPDM08 NA NA NA NA Yes 6
LPDM09 NA NA NA NA Yes 3
LPDM10 11 months 2 1 NA Yes 0
FMA07 NA NA NA NA Yes 1
FMA08 NA NA NA NA Yes 2
FMA09 NA NA NA NA Yes 2
Totals 122 36 16 141
Table 6.5 Program Management Project Summary since October 1, 2010
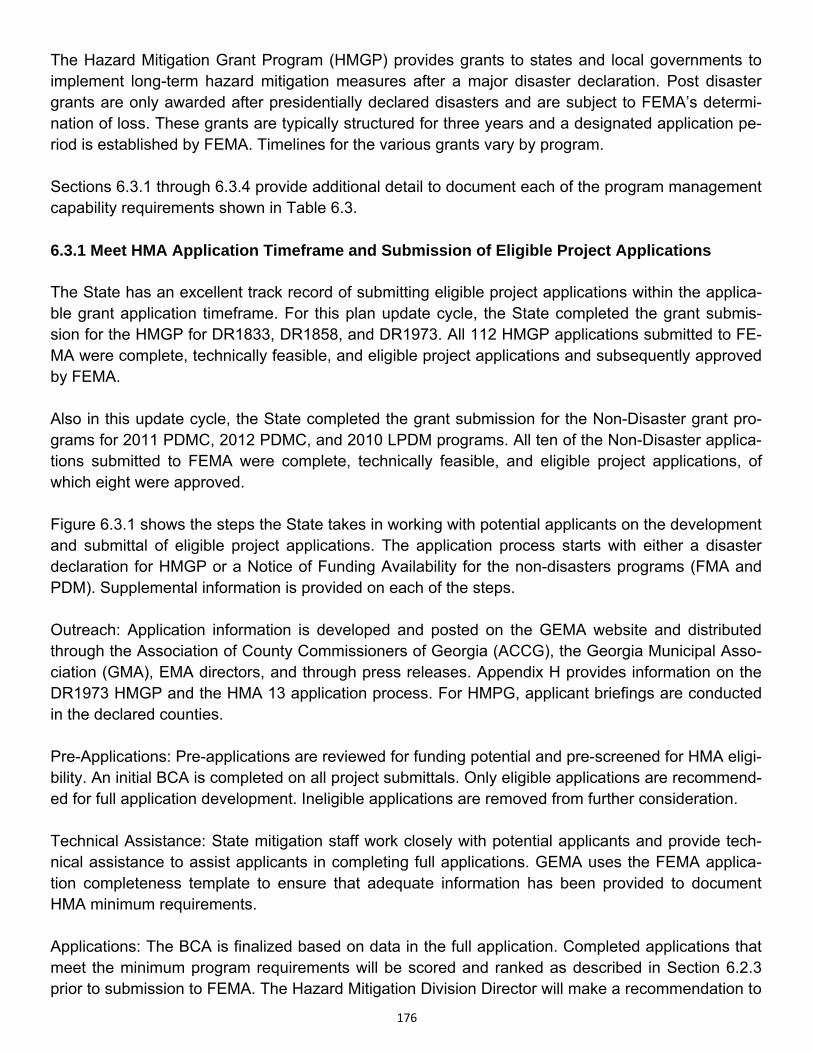
176
The Hazard Mitigation Grant Program (HMGP) provides grants to states and local governments to implement long-term hazard mitigation measures after a major disaster declaration. Post disaster grants are only awarded after presidentially declared disasters and are subject to FEMA’s determi-nation of loss. These grants are typically structured for three years and a designated application pe-riod is established by FEMA. Timelines for the various grants vary by program. Sections 6.3.1 through 6.3.4 provide additional detail to document each of the program management capability requirements shown in Table 6.3. 6.3.1 Meet HMA Application Timeframe and Submission of Eligible Project Applications The State has an excellent track record of submitting eligible project applications within the applica-ble grant application timeframe. For this plan update cycle, the State completed the grant submis-sion for the HMGP for DR1833, DR1858, and DR1973. All 112 HMGP applications submitted to FE-MA were complete, technically feasible, and eligible project applications and subsequently approved by FEMA. Also in this update cycle, the State completed the grant submission for the Non-Disaster grant pro-grams for 2011 PDMC, 2012 PDMC, and 2010 LPDM programs. All ten of the Non-Disaster applica-tions submitted to FEMA were complete, technically feasible, and eligible project applications, of which eight were approved. Figure 6.3.1 shows the steps the State takes in working with potential applicants on the development and submittal of eligible project applications. The application process starts with either a disaster declaration for HMGP or a Notice of Funding Availability for the non-disasters programs (FMA and PDM). Supplemental information is provided on each of the steps. Outreach: Application information is developed and posted on the GEMA website and distributed through the Association of County Commissioners of Georgia (ACCG), the Georgia Municipal Asso-ciation (GMA), EMA directors, and through press releases. Appendix H provides information on the DR1973 HMGP and the HMA 13 application process. For HMPG, applicant briefings are conducted in the declared counties. Pre-Applications: Pre-applications are reviewed for funding potential and pre-screened for HMA eligi-bility. An initial BCA is completed on all project submittals. Only eligible applications are recommend-ed for full application development. Ineligible applications are removed from further consideration. Technical Assistance: State mitigation staff work closely with potential applicants and provide tech-nical assistance to assist applicants in completing full applications. GEMA uses the FEMA applica-tion completeness template to ensure that adequate information has been provided to document HMA minimum requirements. Applications: The BCA is finalized based on data in the full application. Completed applications that meet the minimum program requirements will be scored and ranked as described in Section 6.2.3 prior to submission to FEMA. The Hazard Mitigation Division Director will make a recommendation to
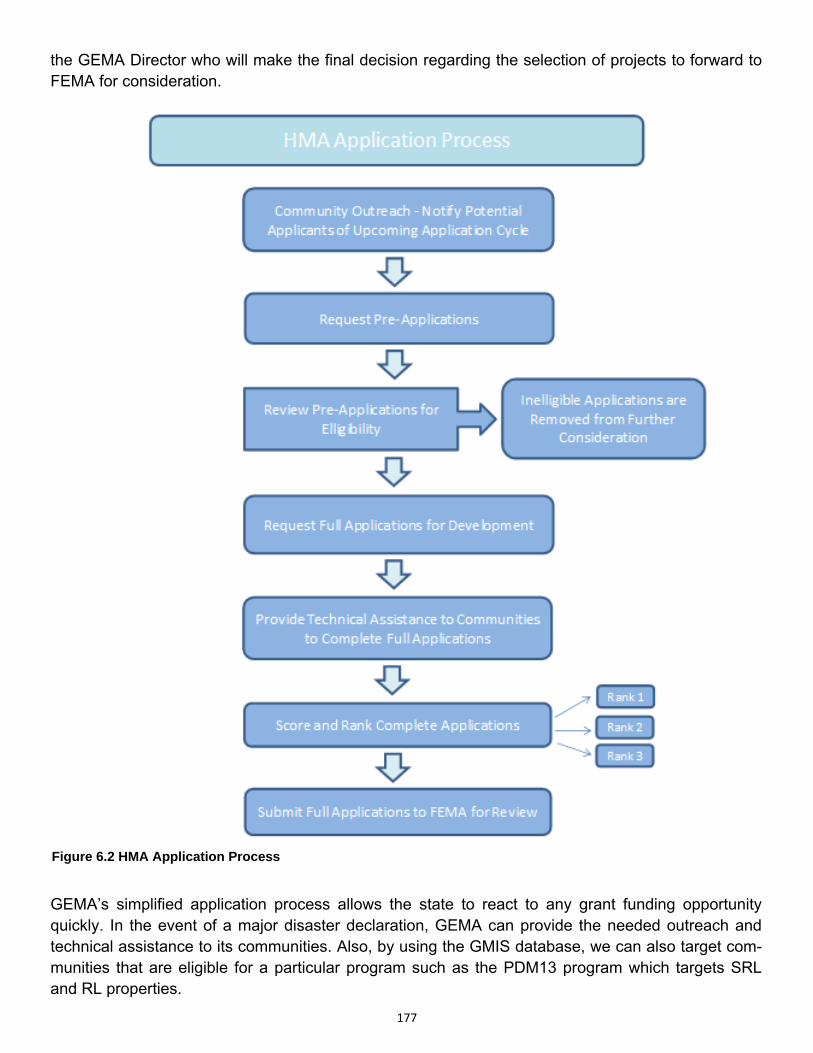
177
the GEMA Director who will make the final decision regarding the selection of projects to forward to FEMA for consideration.
GEMA’s simplified application process allows the state to react to any grant funding opportunity quickly. In the event of a major disaster declaration, GEMA can provide the needed outreach and technical assistance to its communities. Also, by using the GMIS database, we can also target com-munities that are eligible for a particular program such as the PDM13 program which targets SRL and RL properties.
Figure 6.2 HMA Application Process
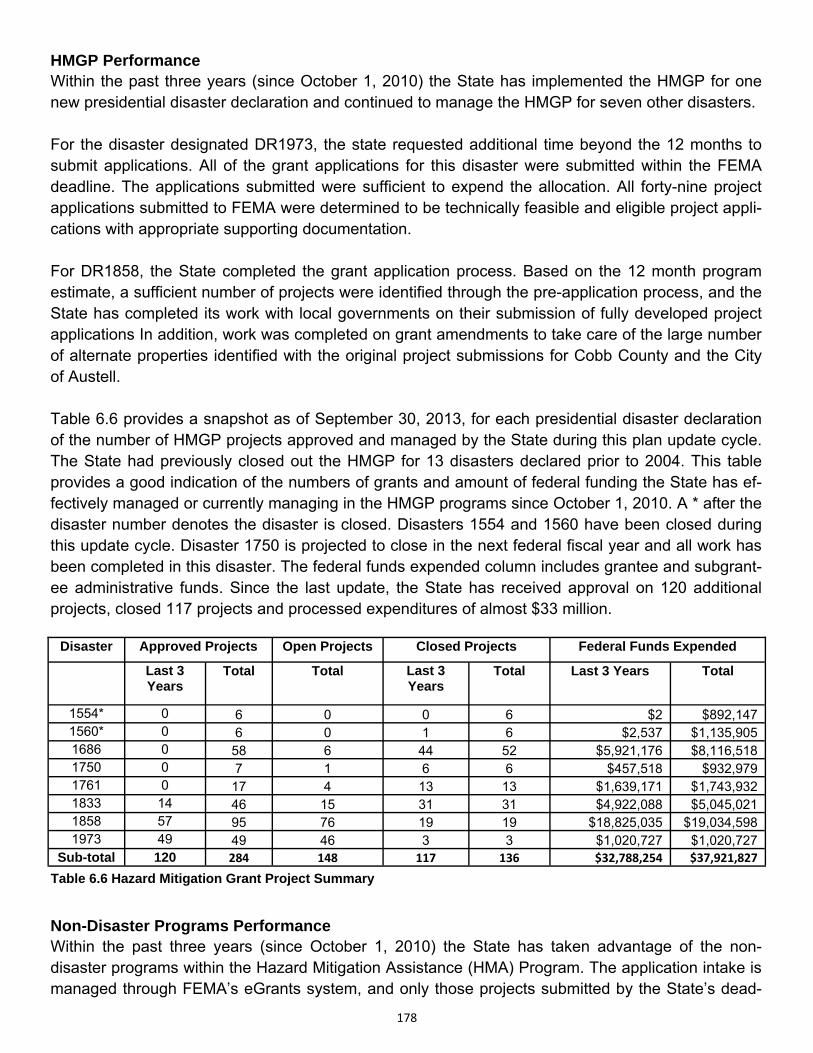
178
HMGP Performance Within the past three years (since October 1, 2010) the State has implemented the HMGP for one new presidential disaster declaration and continued to manage the HMGP for seven other disasters. For the disaster designated DR1973, the state requested additional time beyond the 12 months to submit applications. All of the grant applications for this disaster were submitted within the FEMA deadline. The applications submitted were sufficient to expend the allocation. All forty-nine project applications submitted to FEMA were determined to be technically feasible and eligible project appli-cations with appropriate supporting documentation. For DR1858, the State completed the grant application process. Based on the 12 month program estimate, a sufficient number of projects were identified through the pre-application process, and the State has completed its work with local governments on their submission of fully developed project applications In addition, work was completed on grant amendments to take care of the large number of alternate properties identified with the original project submissions for Cobb County and the City of Austell. Table 6.6 provides a snapshot as of September 30, 2013, for each presidential disaster declaration of the number of HMGP projects approved and managed by the State during this plan update cycle. The State had previously closed out the HMGP for 13 disasters declared prior to 2004. This table provides a good indication of the numbers of grants and amount of federal funding the State has ef-fectively managed or currently managing in the HMGP programs since October 1, 2010. A * after the disaster number denotes the disaster is closed. Disasters 1554 and 1560 have been closed during this update cycle. Disaster 1750 is projected to close in the next federal fiscal year and all work has been completed in this disaster. The federal funds expended column includes grantee and subgrant-ee administrative funds. Since the last update, the State has received approval on 120 additional projects, closed 117 projects and processed expenditures of almost $33 million.
Non-Disaster Programs Performance Within the past three years (since October 1, 2010) the State has taken advantage of the non-disaster programs within the Hazard Mitigation Assistance (HMA) Program. The application intake is managed through FEMA’s eGrants system, and only those projects submitted by the State’s dead-
Disaster Approved Projects Open Projects Closed Projects Federal Funds Expended
Last 3 Years
Total Total Last 3 Years
Total Last 3 Years Total
1554* 0 6 0 0 6 $2 $892,147 1560* 0 6 0 1 6 $2,537 $1,135,905 1686 0 58 6 44 52 $5,921,176 $8,116,518 1750 0 7 1 6 6 $457,518 $932,979 1761 0 17 4 13 13 $1,639,171 $1,743,932 1833 14 46 15 31 31 $4,922,088 $5,045,021 1858 57 95 76 19 19 $18,825,035 $19,034,598 1973 49 49 46 3 3 $1,020,727 $1,020,727
Sub-total 120 284 148 117 136 $32,788,254 $37,921,827
Table 6.6 Hazard Mitigation Grant Project Summary
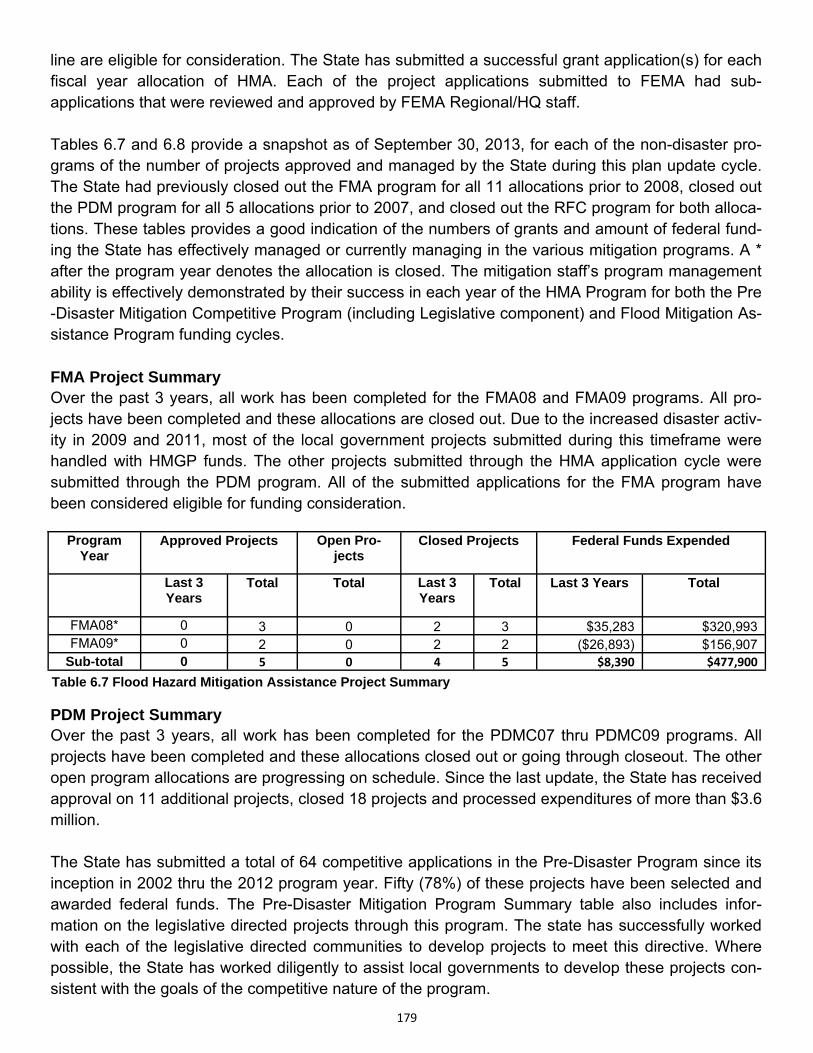
179
line are eligible for consideration. The State has submitted a successful grant application(s) for each fiscal year allocation of HMA. Each of the project applications submitted to FEMA had sub-applications that were reviewed and approved by FEMA Regional/HQ staff. Tables 6.7 and 6.8 provide a snapshot as of September 30, 2013, for each of the non-disaster pro-grams of the number of projects approved and managed by the State during this plan update cycle. The State had previously closed out the FMA program for all 11 allocations prior to 2008, closed out the PDM program for all 5 allocations prior to 2007, and closed out the RFC program for both alloca-tions. These tables provides a good indication of the numbers of grants and amount of federal fund-ing the State has effectively managed or currently managing in the various mitigation programs. A * after the program year denotes the allocation is closed. The mitigation staff’s program management ability is effectively demonstrated by their success in each year of the HMA Program for both the Pre-Disaster Mitigation Competitive Program (including Legislative component) and Flood Mitigation As-sistance Program funding cycles. FMA Project Summary Over the past 3 years, all work has been completed for the FMA08 and FMA09 programs. All pro-jects have been completed and these allocations are closed out. Due to the increased disaster activ-ity in 2009 and 2011, most of the local government projects submitted during this timeframe were handled with HMGP funds. The other projects submitted through the HMA application cycle were submitted through the PDM program. All of the submitted applications for the FMA program have been considered eligible for funding consideration.
PDM Project Summary Over the past 3 years, all work has been completed for the PDMC07 thru PDMC09 programs. All projects have been completed and these allocations closed out or going through closeout. The other open program allocations are progressing on schedule. Since the last update, the State has received approval on 11 additional projects, closed 18 projects and processed expenditures of more than $3.6 million. The State has submitted a total of 64 competitive applications in the Pre-Disaster Program since its inception in 2002 thru the 2012 program year. Fifty (78%) of these projects have been selected and awarded federal funds. The Pre-Disaster Mitigation Program Summary table also includes infor-mation on the legislative directed projects through this program. The state has successfully worked with each of the legislative directed communities to develop projects to meet this directive. Where possible, the State has worked diligently to assist local governments to develop these projects con-sistent with the goals of the competitive nature of the program.
Program Year
Approved Projects Open Pro-jects
Closed Projects Federal Funds Expended
Last 3 Years
Total Total Last 3 Years
Total Last 3 Years Total
FMA08* 0 3 0 2 3 $35,283 $320,993 FMA09* 0 2 0 2 2 ($26,893) $156,907
Sub-total 0 5 0 4 5 $8,390 $477,900
Table 6.7 Flood Hazard Mitigation Assistance Project Summary
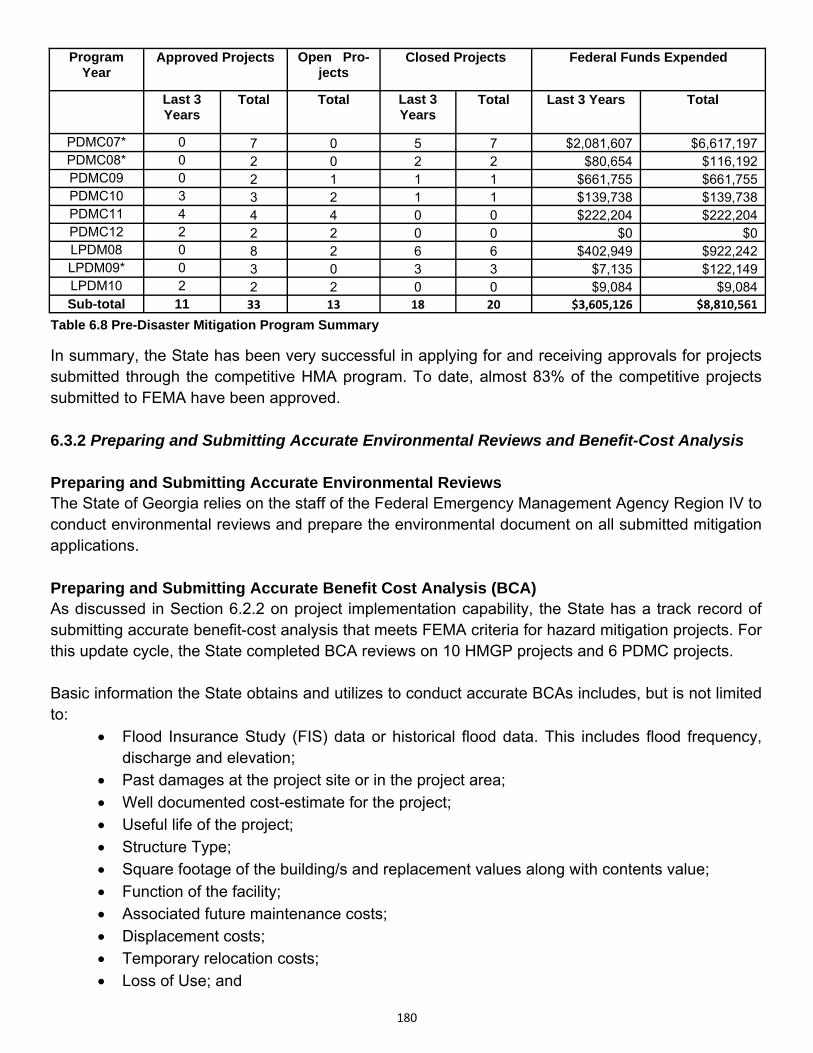
180
In summary, the State has been very successful in applying for and receiving approvals for projects submitted through the competitive HMA program. To date, almost 83% of the competitive projects submitted to FEMA have been approved. 6.3.2 Preparing and Submitting Accurate Environmental Reviews and Benefit-Cost Analysis Preparing and Submitting Accurate Environmental Reviews The State of Georgia relies on the staff of the Federal Emergency Management Agency Region IV to conduct environmental reviews and prepare the environmental document on all submitted mitigation applications. Preparing and Submitting Accurate Benefit Cost Analysis (BCA) As discussed in Section 6.2.2 on project implementation capability, the State has a track record of submitting accurate benefit-cost analysis that meets FEMA criteria for hazard mitigation projects. For this update cycle, the State completed BCA reviews on 10 HMGP projects and 6 PDMC projects. Basic information the State obtains and utilizes to conduct accurate BCAs includes, but is not limited to:
Flood Insurance Study (FIS) data or historical flood data. This includes flood frequency, discharge and elevation;
Past damages at the project site or in the project area;
Well documented cost-estimate for the project; Useful life of the project;
Structure Type; Square footage of the building/s and replacement values along with contents value;
Function of the facility; Associated future maintenance costs;
Displacement costs;
Temporary relocation costs;
Loss of Use; and
Program Year
Approved Projects Open Pro-jects
Closed Projects Federal Funds Expended
Last 3 Years
Total Total Last 3 Years
Total Last 3 Years Total
PDMC07* 0 7 0 5 7 $2,081,607 $6,617,197 PDMC08* 0 2 0 2 2 $80,654 $116,192 PDMC09 0 2 1 1 1 $661,755 $661,755 PDMC10 3 3 2 1 1 $139,738 $139,738 PDMC11 4 4 4 0 0 $222,204 $222,204 PDMC12 2 2 2 0 0 $0 $0 LPDM08 0 8 2 6 6 $402,949 $922,242 LPDM09* 0 3 0 3 3 $7,135 $122,149 LPDM10 2 2 2 0 0 $9,084 $9,084 Sub-total 11 33 13 18 20 $3,605,126 $8,810,561
Table 6.8 Pre-Disaster Mitigation Program Summary
181
Elevation Certificates or certification from land surveyor of finished floor elevation. GEMA mitigation staff utilizes their experience to assist in determining the appropriate FEMA ap-proved BC module to use for each project. Based on the type of project and information provided in the pre-application and application, GEMA staff will determine which benefit cost analysis module will be used to determine the project’s cost effectiveness. The BCA determines whether the cost of investing in a project today, will result in sufficiently re-duced damages in the future to justify spending the money on the project. If the benefit is greater than the cost, then the project is cost-effective. Cost effectiveness is determined by comparing the project cost to the value of damages prevented after the mitigation measure. If the dollar-value of the benefits exceeds the cost of funding the project, the project is cost-effective. To arrive at a ratio, the benefits are divided by the costs, resulting in a benefit-cost ratio (BCR). The BCR simply states whether the benefits exceed the project costs, and by how much. To arrive at a BCR, divide the ben-efits by the cost. If the result is 1.0 or greater, then the project is cost-effective. If it is less than 1.0, it is not cost-effective. A narrative analysis is used when the benefits of a project cannot be easily quantified into specific categories and do not conform to any of the other modules or formats. This analysis allows for a subjective, broad-based approach to quantify the benefits of a project so that all benefits of the pro-ject can be recorded and the project objectively assessed. This type of analysis is used normally in the HMGP 5% State Initiative projects. If the project is cost-effective, it is considered by GEMA for funding consideration and full application development. If the project is not cost-effective, mitigation staff would attempt to obtain additional information from the applicant to arrive at a positive BCA. If there is no additional credible data avail-able or all available data has been utilized, and the project is still not cost-effective, the project is not considered for full application development. The mitigation staff’s ability to complete accurate BCAs was demonstrated by their success in all funding rounds to date of the HMA programs. In addition, the State has completed Data Documenta-tion Templates for all applications submitted from 2005 through 2012. This form is utilized to docu-ment each piece of data and the values that are input into the various FEMA benefit-cost models. This form documents the accuracy of the BCA. Due to changes within the BCA tool version 4.8, the State will discontinue this form as it is incorporated into the BCA tool to document the information utilized in completing the BCA. 6.3.3 Quarterly Reports The State of Georgia provides timely, complete, and accurate quarterly progress and financial re-ports on all funded HMA grants. Separate financial reports are submitted quarterly from the Office of Planning and Budget for each of the open disasters or allocations. For this update cycle, the State submitted all quarterly reports within 30 days of the end of the calendar quarter. Subsequent meet-ings were held with FEMA staff on each quarterly report submission to discuss any findings or ques-tions. All questions and findings were satisfactorily addressed.
182
The State provides an enhanced quarterly and financial report on all open mitigation projects. This report includes detail on work completed, work remaining, project delays (if any), and all associated financial information. This reporting format has been shared at Regional meetings with other Region IV states as a model format for other states to follow. The quarterly report submissions also include budget-comparison reports on each of the State’s open management grants. GEMA uses an agency wide computer program to manage all federal grants called the Grants Man-agement System (GMS). Some of the major features included in the system are:
Ability to view key dates, funding amounts, status, expenditures, itemization of subgrants and current balances for all federal grant allocations;
Ability to add/view/track key dates, funding amounts, applications data, status, expenditure history, adjustment history, progress report history, closeout details, correspondence, and current balances on all plans, applications and subgrants;
Automated subgrantee Progress Report generation and creation of FEMA Quarterly Pro-gress Report from the subgrantee reports;
Ability to generate and track correspondence (paper and email) tailored by subgrants; and
Ability to generate dozens of standard reports and user-created ad hoc reports. One of the significant enhancements of this system is the ability to create quarterly reports to FEMA that includes additional information on activities completed in the quarter with all activities tied back to the milestones for the project. This new report format was developed and has been utilized for all quarterly report submissions for this plan update cycle. Upon project approval notification from FEMA, a State/Local Grantee/Subgrantee Agreement is pre-pared by GEMA and sent to the subgrantee for signature. Upon receipt of the signed agreement, the GEMA Director signs the agreement and a fully executed agreement is sent to the subgrantee with instructions to start the project. The signed agreement requires the subgrantee to submit quarterly status reports within 15 days of the end of the quarter. Due dates are January 15, April 15, July 15 and October 15. As noted above, GEMA uses GMS to generate the subgrantee quarterly report which is emailed to the project point of contact. The reports include financial information current as of the end of the quarter, as well as grant status information current as of the end of the previous quarter. The counties update the status and return the reports to their assigned planner or specialist who then inputs the updated information into the GMS system. As an incentive to receiving timely quarterly reports from each subgrantee, the State requires all reports to be current in order to pro-cess progress payments. The quarterly report consists of a letter with narrative information regarding each open grant pro-gram as well as information on other activities that the mitigation staff has been involved in for the quarter. In addition, a project summary spreadsheet is completed for each program detailing the sta-tus of each funded program listing both closed and open projects. The GMS printout and budget comparison reports complete the quarterly report package. In addition to the quarterly report submitted for each of the open projects, the Office of Planning and Budget submits the FF 20-10 financial reports and the PMS 272 Federal Cash Transaction Report for each of the open disasters. The submitted reports are consistent with SMARTLINK and based on
183
the approved supplements received from FEMA. When GEMA’s internal financial tracking system, based on supplements received, is not in balance with SMARTLINK, the State notifies FEMA pro-gram staff to get the missing supplements so the reports will balance at the end of each quarter. 6.3.4 Grant Completion and Closeout For this update cycle, the State closed 117 HMGP projects in seven disasters, and 22 projects in eight non-disaster programs. Two disaster and five non-disaster programs were successfully closed. The following summarizes the process that the mitigation staff follows in monitoring approved grants and completing project and declaration closeouts within established performance periods including financial reconciliation. The State/Local Grantee/subgrantee Agreement that is signed by both GEMA and the subgrantee requires the subgrantee to complete the project based on milestones established in the grant appli-cation (not to exceed three years from project obligation date). In addition, for project grants, they are required to submit supporting documentation identified at final inspection within 30 days. If the subgrantee cannot complete the project within the identified performance period per the grant agreement, a request for a time extension must be submitted to GEMA 90 days prior to the end of the performance period. Requests for time extensions needs to explain why the completion date cannot be met, how much of the project work remains, and an estimated date for completion. If an extension request for any project means that the activity period will go beyond the State’s perfor-mance period (or closeout date for disasters), GEMA will request up to a one-year time performance extension. This request will be submitted to FEMA 60 days prior to the end of the performance peri-od. All mitigation projects that receive federal funding go through the same financial reconciliation as part of the closeout process. State Mitigation staff utilizes the signed grantee-subgrantee agreement with each applicant to monitor progress of their project and ensure the project is on track. Site visits are scheduled as necessary. Upon written notification of project completion, GEMA Hazard Mitiga-tion staff conducts a final inspection to ensure the project is completed per the terms of the agree-ment and verifies the GPS coordinates and takes photographs of each mitigated property. For plan-ning grants, GEMA Hazard Mitigation staff conducts a desk audit to verify the approved scope of work has been completed. As part of the final inspection, all financial documents are reviewed to en-sure only allowable costs are reimbursed consistent with Office of Management and Budget circu-lars. Project closeout requests are made to FEMA upon completion of final inspection and financial reconciliation on a project-by-project basis. In the project closeout request, GEMA certifies to FEMA that costs incurred in the performance of eligible work are allowable, that the approved work was completed, and that the mitigation measure is in compliance with the Federal-State Agreement (for the HMGP) or Agreement Articles (for non-disaster programs) and the State/Local Assistance Agreement. GEMA mitigation staff will prepare a project closeout worksheet which is submitted to FEMA Region IV along with a request to close the grant. The financial reconciliation and project closeout requests are completed within 90 days of the final inspection. Upon receipt of final claim amounts from FEMA, any remaining funds are liquidated and closeout notice sent to the subgrantee.
184
When all projects are completed and closed out for the disaster declaration, GEMA prepares the Declaration Closeout Letter and final financial status report, SF425, for the HMGP and forwards it to FEMA. The subgrantee and grantee closeout reports are valuable for not only historical purposes and in monitoring projects for adherence to certain grant agreements such as open space deed restrictions, but they are also valuable in documenting disaster avoidance and developing success stories. The closeout reports including those properties that have been acquired have been shared with the De-partment of Natural Resources Floodplain Management staff. This information is useful by floodplain management staff during community assistance contacts and visits. In addition, during these visits floodplain management staff can monitor the acquired sites to ensure that the subgrantees have ad-hered to the required deed restrictions. This information is also utilized to support Risk MAP Discov-ery and Resilience workshops. 6.4 ASSESSMENT OF MITIGATION ACTIONS The 44 CFR 201.5(b)(2)(iv) states the Enhanced Plan must document the system and strategy by which the State will conduct an assessment of the completed mitigation actions and include a record of the effectiveness (actual cost avoidance) of each mitigation action. 6.4.1 System to Track the Assessment of Mitigation Actions The information collected on each site that has had a mitigation action completed includes:
Funding Source; Project Number;
Applicant;
Property Address; Parcel Number;
GIS Coordinates; Mitigation Action;
Structure Size; Replacement Value of property mitigated (Structure and Contents);
Damage Source; Hazard Data;
Elevation Data;
Cost;
Benefits; Repetitive Loss Number ;
Avoided Losses; Last Inspection Date; and
Project Closeout Date. The State Hazard Mitigation Division is currently populating the database for all completed and closed projects within the HMGP and PDM programs. The database is greater than 99% completed
185
with 1,891 records in the system as of September 30, 2013. The State continues to populate the da-tabase with information from older disaster allocations. The database is updated by State Hazard Mitigation Division staff on completed mitigation projects as part of the closeout process. Repetitive Loss Property Tracking When a property acquisition project is completed, a record is added to GMIS for each of the ac-quired and deed restricted properties and the last inspection date is entered into the database. GE-MA Hazard Mitigation staff utilizes the GMIS to pull a list of acquired properties needing certification. This list is sent to the subgrantee along with a request to verify the properties are being maintained according to the deed restrictions. Upon receipt of the certification, GEMA Hazard Mitigation staff updates GMIS to reflect the most recent inspection date. The GMIS is undergoing a complete update to a new platform with enhancements to be completed by June 2014. Specific details on the updated system will be reported in the next State Plan Update cycle. 6.4.2 Strategy to Assess Mitigation Actions The following action steps will be taken to effectively assess completed mitigation actions in Geor-gia:
Finish the process of populating the Mitigated Properties Database on all completed miti-gation projects that are administered by GEMA.
Incorporate mitigation activities completed by other agencies into the Mitigated Properties database.
Review Hazard Event information submitted to GEMA to determine the potential for loss reduction as a result of all completed mitigated actions documented in the Mitigated Prop-erties system.
Upon determination that the completed mitigation action resulted in a reduction of damag-es, data will be entered into the Mitigated Properties database and a computation of dam-ages avoided for each structure mitigated.
Local governments will be able to access the data in the GMIS for their community and pull reports for their counties and municipalities on completed mitigation actions and any avoided losses as a result of hazard events documented in the project area after the projects are completed. Record of Actual Cost Avoidance A critical component to estimate the actual avoided losses is having accurate information on the haz-ard event and information about the exposure of the property to damages. Scenario losses are com-puted based on established hazard damage relationships such as depth damage curves for wind and flood events provided by FEMA in benefit-cost modules. For flood events, avoided losses can be computed by knowing how much flooding would have occurred at the site by comparing the fin-ished floor elevation data with the water surface elevation of the hazard event. Applying the depth damage curves and additional information collected allows one to compute scenario losses at the site that would have occurred if the structure had not been mitigated.
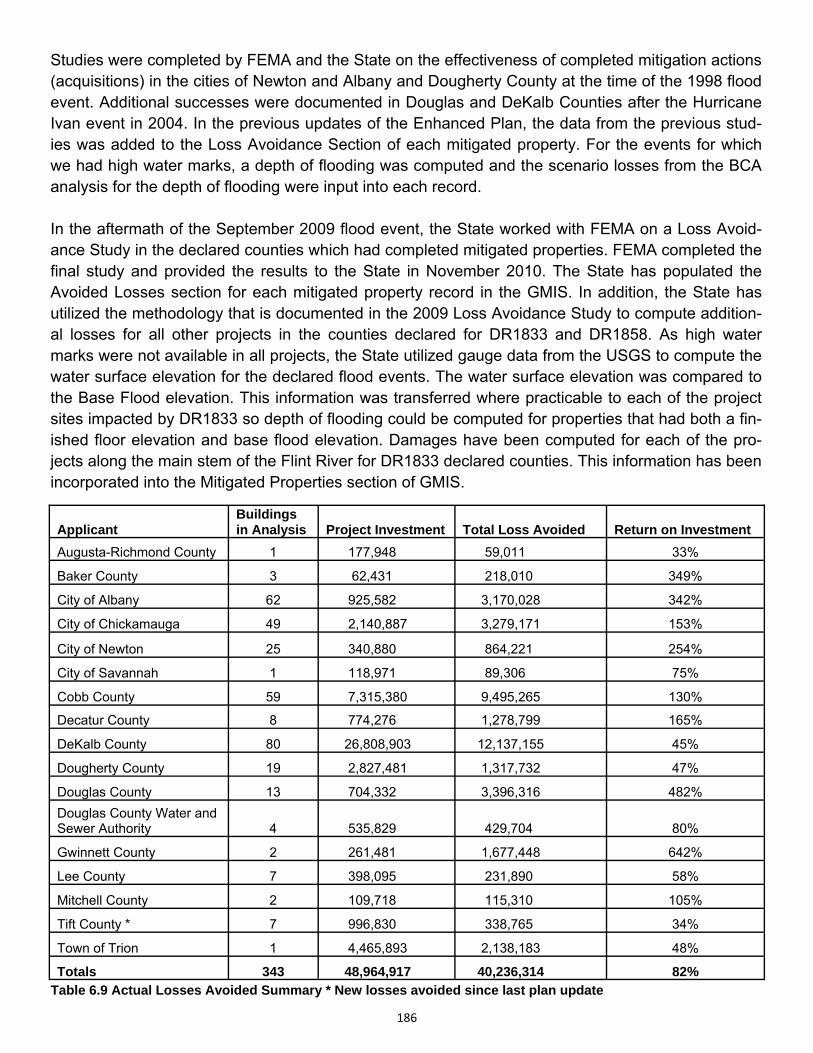
186
Studies were completed by FEMA and the State on the effectiveness of completed mitigation actions (acquisitions) in the cities of Newton and Albany and Dougherty County at the time of the 1998 flood event. Additional successes were documented in Douglas and DeKalb Counties after the Hurricane Ivan event in 2004. In the previous updates of the Enhanced Plan, the data from the previous stud-ies was added to the Loss Avoidance Section of each mitigated property. For the events for which we had high water marks, a depth of flooding was computed and the scenario losses from the BCA analysis for the depth of flooding were input into each record. In the aftermath of the September 2009 flood event, the State worked with FEMA on a Loss Avoid-ance Study in the declared counties which had completed mitigated properties. FEMA completed the final study and provided the results to the State in November 2010. The State has populated the Avoided Losses section for each mitigated property record in the GMIS. In addition, the State has utilized the methodology that is documented in the 2009 Loss Avoidance Study to compute addition-al losses for all other projects in the counties declared for DR1833 and DR1858. As high water marks were not available in all projects, the State utilized gauge data from the USGS to compute the water surface elevation for the declared flood events. The water surface elevation was compared to the Base Flood elevation. This information was transferred where practicable to each of the project sites impacted by DR1833 so depth of flooding could be computed for properties that had both a fin-ished floor elevation and base flood elevation. Damages have been computed for each of the pro-jects along the main stem of the Flint River for DR1833 declared counties. This information has been incorporated into the Mitigated Properties section of GMIS.
Applicant Buildings in Analysis Project Investment Total Loss Avoided Return on Investment
Augusta-Richmond County 1 177,948 59,011 33%
Baker County 3 62,431 218,010 349%
City of Albany 62 925,582 3,170,028 342%
City of Chickamauga 49 2,140,887 3,279,171 153%
City of Newton 25 340,880 864,221 254%
City of Savannah 1 118,971 89,306 75%
Cobb County 59 7,315,380 9,495,265 130%
Decatur County 8 774,276 1,278,799 165%
DeKalb County 80 26,808,903 12,137,155 45%
Dougherty County 19 2,827,481 1,317,732 47%
Douglas County 13 704,332 3,396,316 482%
Douglas County Water and Sewer Authority 4 535,829 429,704 80%
Gwinnett County 2 261,481 1,677,448 642%
Lee County 7 398,095 231,890 58%
Mitchell County 2 109,718 115,310 105%
Tift County * 7 996,830 338,765 34%
Town of Trion 1 4,465,893 2,138,183 48%
Totals 343 48,964,917 40,236,314 82% Table 6.9 Actual Losses Avoided Summary * New losses avoided since last plan update
187
Since the last State Plan Update, the State has not received any presidential disaster declarations for flooding. The State had several areas impacted by flooding, but the only location that impacted a mitigation project area was in Tift County. A localized flood event impacted an area in Tift County where property acquisition had just been completed. Applying the methodology described above, seven properties which had just been acquired would have received flood damages estimated at $338,765. Currently there are 483 records in the database totaling $40.2 million in losses avoided. Table 6.9 provides a record of the actual losses avoided for all HMA applicants. The return on investment (ROI) was calculated for each individual building for each event that was analyzed. The ROI reflects only the damage and project costs related to the buildings in the analysis or just those buildings were actual losses avoided were computed. It is interesting to note that with less than 20 years of history in evaluating projects where mitigation has been completed, there are several areas where the ROI exceeds 100%. This suggests that miti-gation activities have been completed in areas where hazard events continue to occur. The GMIS database will be an ongoing tool to capture success stories on future disaster events. By capturing information at the property level, the State can at any time create a report on the effective-ness of any completed mitigation project. 6.5 EFFECTIVE USE OF AVAILABLE MITIGATION FUNDING The 44 CFR 201.5(b)(3) states the Enhanced Plan must demonstrate that the State effectively uses existing mitigation programs to achieve its mitigation goals. The State of Georgia continues to effectively implement hazard mitigation programs towards achiev-ing its goals to:
Reduce human vulnerability to hazard events;
Reduce the losses associated with hazard events; and Reduce overall exposure to hazard events for Georgia citizens and their property.
The mitigation programs utilized in implementing mitigation measures throughout the state are pri-marily federally funded and state administered. These include the Hazard Mitigation Grant Program (HMGP), the Flood Mitigation Assistance Program (FMA), the Pre-Disaster Mitigation Program (PDM), and the Emergency Management Performance Grants. The Repetitive Flood Claims Pro-gram (RFC) data has been incorporated into the FMA program. The projects that have been ap-proved and funded through these programs support the State’s hazard mitigation goals and specific program eligibility criteria. Project effectiveness can be defined as the ability of a mitigation project to reduce or eliminate the possibility of future damage or human suffering. There are three levels of project effectiveness. High effectiveness would be given to projects that create the most effective type of mitigation such as property acquisition or relocation where no damage would occur in the event of a future disaster. Medium effectiveness would entail projects that reduce the likelihood of future damage, however, in
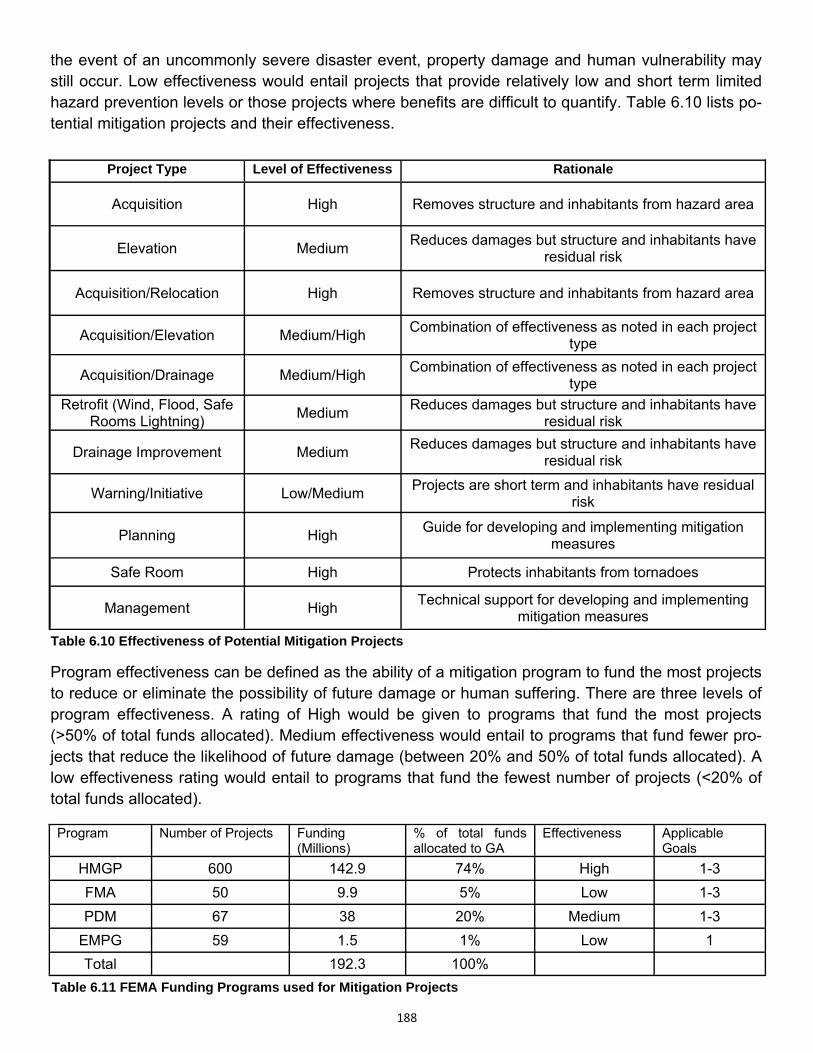
188
the event of an uncommonly severe disaster event, property damage and human vulnerability may still occur. Low effectiveness would entail projects that provide relatively low and short term limited hazard prevention levels or those projects where benefits are difficult to quantify. Table 6.10 lists po-tential mitigation projects and their effectiveness.
Program effectiveness can be defined as the ability of a mitigation program to fund the most projects to reduce or eliminate the possibility of future damage or human suffering. There are three levels of program effectiveness. A rating of High would be given to programs that fund the most projects (>50% of total funds allocated). Medium effectiveness would entail to programs that fund fewer pro-jects that reduce the likelihood of future damage (between 20% and 50% of total funds allocated). A low effectiveness rating would entail to programs that fund the fewest number of projects (<20% of total funds allocated).
Project Type Level of Effectiveness Rationale
Acquisition High Removes structure and inhabitants from hazard area
Elevation Medium Reduces damages but structure and inhabitants have
residual risk
Acquisition/Relocation High Removes structure and inhabitants from hazard area
Acquisition/Elevation Medium/High Combination of effectiveness as noted in each project
type
Acquisition/Drainage Medium/High Combination of effectiveness as noted in each project
type
Retrofit (Wind, Flood, Safe Rooms Lightning)
Medium Reduces damages but structure and inhabitants have
residual risk
Drainage Improvement Medium Reduces damages but structure and inhabitants have
residual risk
Warning/Initiative Low/Medium Projects are short term and inhabitants have residual
risk
Planning High Guide for developing and implementing mitigation
measures
Safe Room High Protects inhabitants from tornadoes
Management High Technical support for developing and implementing
mitigation measures
Table 6.10 Effectiveness of Potential Mitigation Projects
Program Number of Projects Funding (Millions)
% of total funds allocated to GA
Effectiveness Applicable Goals
HMGP 600 142.9 74% High 1-3
FMA 50 9.9 5% Low 1-3
PDM 67 38 20% Medium 1-3
EMPG 59 1.5 1% Low 1
Total 192.3 100%
Table 6.11 FEMA Funding Programs used for Mitigation Projects
189
Table 6.11 provides a summary of FEMA Funding Programs used for Mitigation Projects. The list ties each program with the associated State mitigation goal, along with a corresponding level of pro-gram effectiveness. RFC program information has been included with the FMA and LPDM has been included with the PDM information. In addition, the amount of funds utilized in accomplishing mitiga-tion goals has also been incorporated into the table. Hazard Mitigation Grant Program (HMGP) Table 6.12 lists information about the HMGP and the funds approved for each federally declared dis-aster from 1990 through September 30, 2013.The table has been updated to combine information about disasters where all work was completed prior to this plan update which includes 15 disasters from DR857 through DR1560. Since 2004, Georgia has provided and made available 10% of all match funds for counties involved in disasters. The State of Georgia will continue to contribute a per-centage of the non-federal cost share for all counties included in a Presidential Declaration. GEMA’s Hazard Mitigation Division will continue to provide technical assistance to all counties, their munici-palities and state agencies. Any unused mitigation program funding was a result of unavailable non-federal match by counties, uninterested property owners, and/or insufficient program funds to implement prioritized mitigation actions.
Program Highlights Through the HMGP, local governments have permanently mitigated losses through the acquisition of 1317 flood prone properties. Another 89 flood prone properties have been elevated and 36 retrofits predominantly wind related have been completed, and two safe rooms constructed. Rounding out the activities, 433 outdoor warning sirens have been installed and 35 drainage improvement projects completed. The program also funded the initial development of 20 local mitigation plans, 155 local plan updates, and the initial development and 2 updates of the State Mitigation Plan. Table 6.13 summarizes the number of projects and project types funded through the HMGP and their associat-ed State Mitigation Goal.
Disaster Federal Alloca-tion (NEMIS)
Federal Share Expended
State Share Expended
Local Share Expended
Approved Projects
Percentage of Funds Used
DR857–1560 $87,748,097 $83,383,944 $4,421,111 $31,618,372 328 95.0%
DR1686 $12,699,596 10,164,570 664,025 2,724,163 58 80.0%
DR1750 $1,258,542 932,979 38,476 272,518 7 74.1% DR1761 $2,821,243 2,445,520 103,365 711,810 17 86.7%
DR1833 $5,756,746
5,704,463 804,882 1,204,073 46 99.1% DR1858 $35,438,896 35,104,735 4,956,491 6,744,748 95 99.1%
DR1973 5,380,886 5,365,349 523,041 1,265,373 49 99.7% DR1686-DR1973
$63,355,909 $59,717,616 $$7,090,280 $12,922,685 272 94.3%
Total $151,104,816 $143,101,560 $11,511,391 $44,541,057 600 94.7%
Table 6.12 HMGP Funding by Disaster
190
Since the last plan update, the State has effectively utilized initiative funding from the HMGP to im-prove the warning and communication capabilities. For disaster DR1973, the state prioritized the uti-lization of the HMGP funds for projects in the declared counties that reduce or eliminate damages to life and property resulting from high winds and tornadoes. The State utilized the full 5% initiative and 5% tornado initiative to improve the warning and communication capabilities of local governments in the declared counties and also gave preference to those projects that help local government main-tain or achieve storm ready status. In addition to the outdoor warning siren type projects, there was an increased interest in mass alert systems and weather radio projects. For DR1973, the enhanced plan status provided an additional $1.3 million to the State of Georgia for HMGP projects. These additional funds were also made available to the declared counties to ad-dress warning and communication enhancements and Safe Room type projects. The State was also able to meet the unmet needs from DR1858 with these funds. Flood Mitigation Assistance (FMA) Program The State has facilitated the use of FMA funds by local governments for the development of flood hazard mitigation plans and projects since the program was initiated in 1997. Planning grants were targeted to the communities that had the largest number of repetitive loss properties identified by FEMA. All communities with 10 or more repetitive loss properties have received funding to develop an FMA plan. Project grants have been targeted to the communities with the largest number of re-petitive loss properties who meet the planning requirements. Availability of local match has hindered many local governments in pursuing project grants. Table 6.5.e lists information through September 30, 2013, about the FMA funds approved since the program has been in existence. The table has been updated to combine information about allocations where all work was completed prior to this plan update which includes 11 allocations from 1997 through 2007. Program Highlights Through the FMA project grants, local governments have permanently mitigated losses through the acquisition of 35 NFIP insured properties. Another 2 NFIP insured properties have been elevated and another 8 properties protected through a drainage improvement. The program also funded the development of 11 FMA plans and the initial development of 3 local mitigation plans. Table 6.14 summarizes the number of projects and project types funded through the FMA and their associated State Mitigation Goal.
Program Project Type Number of Projects Goal
HMGP
Acquisition 86 2 Elevation 4 2
Acquisition/Relocation 4 2 Acquisition/Elevation 3 2 Acquisition/Drainage 2 2
Retrofit (Wind, Flood, Safe Rooms Lightning) 15 1,2 Drainage Improvement 49 2
Warning/Initiative 238 1 Planning 168 1,3
Safe Room 25 1,2
Management 6 1,2,3
Table 6.13 Projects Funded with HMGP
191
Since the last update, all work has been completed for the FMA08 and FMA09 programs.
Repetitive Flood Claims (RFC) Program The State has facilitated the use of RFC funds by local governments for the development of acquisi-tion projects to permanently mitigate flood damages to NFIP insured structures. Table 6.16 lists in-formation about the RFC funding received through September 30, 2013. The table has been updat-ed to combine information about allocations where all work was completed prior to this plan update which includes 2 allocations.
Program Highlights Through the RFC project grants, local governments have permanently mitigated losses through the acquisition of 9 NFIP insured properties. Table 6.17 summarizes the number of projects and project types funded through the RFC and their associated State Mitigation Goal. The Biggert-Waters Flood Insurance Reform Act of 2012 eliminated the Repetitive Flood Claims program and future funding to mitigate RFC properties will be accomplished with the other Hazard Mitigation Assistance (HMA) programs. Severe Repetitive Loss (SRL) Program Georgia has not made an application for SRL grants since the program’s inception in 2008. In the initial roll out of the SRL program, Georgia had fewer than forty validated SRL properties and did not qualify for an allocation. An analysis of these properties showed that 50% of the properties previous-
Fiscal Year Total Approved Federal Share State Share Local Share Approved Pro-jects
FMA97-07 $8,158,886 $5,934,569 $117,033 $2,107,284 41 FMA08 $427,991 $320,993 $13,239 $93,759 3 FMA09 $210,725 $156,907 $7,921 $45,898 2
FMA08– 09 $638,716 $477,900 $21,159 $139,657 5 Total $8,797,602 $6,412,469 $138,192 $2,246,941 46
Table 6.14
Program Project Type Number of Projects Applicable Goal
FMA
Acquisition 18 2 Elevation 2 2 Planning 13 1,3
Drainage Improvement 2 2 Management 11 1,2,3
Table 6.15
Fiscal Year Total Approved Federal Share State Share Local Share Approved Projects
RFC06 - RFC07 3,243,615 3,243,615 0 0 4
Table 6.16
Program Project Type Number of Projects Goal
RFC
Acquisition 2 2
Management 2 1,2,3
Table 6.17
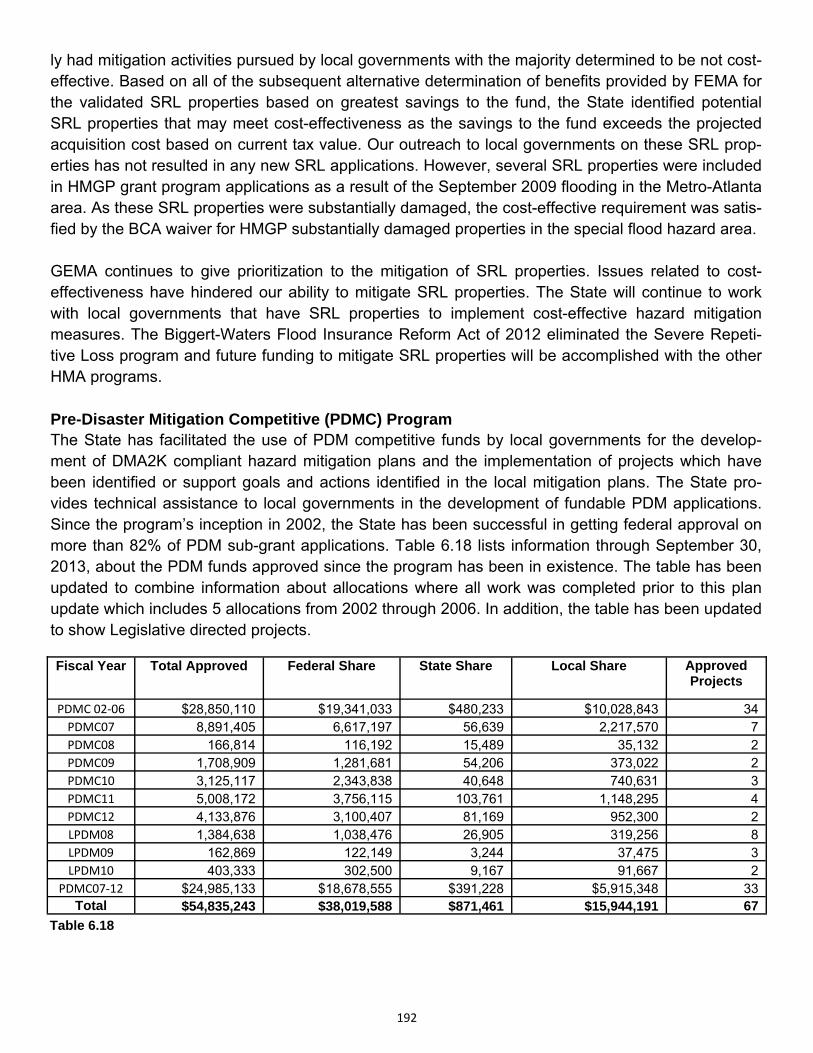
192
ly had mitigation activities pursued by local governments with the majority determined to be not cost-effective. Based on all of the subsequent alternative determination of benefits provided by FEMA for the validated SRL properties based on greatest savings to the fund, the State identified potential SRL properties that may meet cost-effectiveness as the savings to the fund exceeds the projected acquisition cost based on current tax value. Our outreach to local governments on these SRL prop-erties has not resulted in any new SRL applications. However, several SRL properties were included in HMGP grant program applications as a result of the September 2009 flooding in the Metro-Atlanta area. As these SRL properties were substantially damaged, the cost-effective requirement was satis-fied by the BCA waiver for HMGP substantially damaged properties in the special flood hazard area. GEMA continues to give prioritization to the mitigation of SRL properties. Issues related to cost-effectiveness have hindered our ability to mitigate SRL properties. The State will continue to work with local governments that have SRL properties to implement cost-effective hazard mitigation measures. The Biggert-Waters Flood Insurance Reform Act of 2012 eliminated the Severe Repeti-tive Loss program and future funding to mitigate SRL properties will be accomplished with the other HMA programs. Pre-Disaster Mitigation Competitive (PDMC) Program The State has facilitated the use of PDM competitive funds by local governments for the develop-ment of DMA2K compliant hazard mitigation plans and the implementation of projects which have been identified or support goals and actions identified in the local mitigation plans. The State pro-vides technical assistance to local governments in the development of fundable PDM applications. Since the program’s inception in 2002, the State has been successful in getting federal approval on more than 82% of PDM sub-grant applications. Table 6.18 lists information through September 30, 2013, about the PDM funds approved since the program has been in existence. The table has been updated to combine information about allocations where all work was completed prior to this plan update which includes 5 allocations from 2002 through 2006. In addition, the table has been updated to show Legislative directed projects.
Fiscal Year Total Approved Federal Share State Share Local Share Approved Projects
PDMC 02‐06 $28,850,110 $19,341,033 $480,233 $10,028,843 34 PDMC07 8,891,405 6,617,197 56,639 2,217,570 7 PDMC08 166,814 116,192 15,489 35,132 2 PDMC09 1,708,909 1,281,681 54,206 373,022 2 PDMC10 3,125,117 2,343,838 40,648 740,631 3 PDMC11 5,008,172 3,756,115 103,761 1,148,295 4 PDMC12 4,133,876 3,100,407 81,169 952,300 2 LPDM08 1,384,638 1,038,476 26,905 319,256 8 LPDM09 162,869 122,149 3,244 37,475 3 LPDM10 403,333 302,500 9,167 91,667 2
PDMC07‐12 $24,985,133 $18,678,555 $391,228 $5,915,348 33 Total $54,835,243 $38,019,588 $871,461 $15,944,191 67
Table 6.18
193
Program Highlights Through the PDMC and LPDM, local governments have permanently mitigated losses through the acquisition of 126 flood prone properties. Another 116 flood prone properties have been mitigated through drainage improvements and 5 safe rooms constructed. The program also funded the initial development of 136 local mitigation plans and 3 local plan updates. Table 6.19 summarizes the number of projects and project types funded through the PDMC and their associated State Mitigation Goal.
Conclusion The mitigation staff has administered 717 hazard mitigation projects since 1990. These activities as well as those described above and throughout the plan demonstrate that Georgia effectively uses existing mitigation programs to achieve its mitigation goals. The State endeavors to continue to pursue these mitigation programs along with additional programs and funding streams in the future to take advantage of every possible opportunity to accomplish our goals. Table 6.20 summarizes the information for all four of the FEMA mitigation grants programs and funding received in Georgia through September 30, 2013.
The State has given priority to the funding of non-structural mitigation projects to eliminate the dam-ages occurring to flood prone structures, both insured and uninsured. Through September 30, 2013, 1,487 flood prone structures have been permanently mitigated through the implementation of acqui-sition projects through the HMA programs. The State’s mitigated properties database is almost 100% completed. Based on information reported to date, 258 properties on FEMA’s repetitive loss list have been mitigated primarily through property acquisition. Over 75% of the State’s available mitigation funding has been directed to mitigating re-petitively damaged structures through acquisition, elevation or relocation. The State will continue to target these types of properties in future mitigation projects. In addition, GEMA has provided support
Program Project Type Number of Projects Goal
PDMC
Planning 9 1,3 Acquisition 26 2
Drainage Improvement 7 2 Elevation 1 2
Safe Room 1 1,2 Management 10 1,2,3
LPDM
Acquisition 1 2 Warning/Initiative 5 1
Management 3 1,2,3 Safe Room 3 1,2
Drainage Improvement 1 2 Table 6.19
Total Approved Federal Share State Share Local Share Approved Projects
266,030,467 190,777,233 12,521,043 62,640,525 717
Table 6.20
194
to local governments in the development of all hazard mitigation plans and projects through the issu-ance of guidance, education through workshops and grants. 6.6 COMMITMENT TO A COMPREHENSIVE MITIGATION PROGRAM The 44 CFR 201.5(b)(4)(i-vi) states the Enhanced Plan must demonstrate that each state is commit-ted to a comprehensive state mitigation program. Georgia has a long-standing commitment to sup-port a comprehensive mitigation program. This commitment has been demonstrated through contin-ued support for local mitigation planning, legislation enacted that supports mitigation, commitment to mitigation through state funding for mitigation projects, commitment to assist state and local jurisdic-tions in reducing vulnerability to critical facilities and the continued practice of integrating mitigation into post-disaster recovery. This section provides a discussion of each aspect of the State of Geor-gia’s commitment, how each aspect has been implemented and the State’s plan to continue imple-mentation. 6.6.1 Local Mitigation Planning Support Georgia is committed to support local mitigation planning by providing workshops, training, tools, and technical assistance to meet the planning requirements of the Disaster Mitigation Act of 2000. The Hazard Mitigation Planning Staff supports the development of local mitigation plans with dedi-cated resources, which includes on-site technical assistance and in-county service through the use of field stationed planners. Additional details on local plan support are provided in Chapter 4. GEMA has acquired funding for local governments to complete the first local plan update cycle and is in the process of acquiring funding to begin the second cycle of local plan updates. 6.6.2 Statewide Program of Hazard Mitigation GEMA and the Hazard Mitigation Division support the development, of legislation and executive ac-tions, as well as, the formation of public/private partnerships that promote hazard mitigation. GEMA tracks and supports legislation of interest to the public safety, homeland security and emergency management communities, including bills relevant to hazard mitigation. GEMA also works closely in partnership with other agencies and organizations to leverage support for legislation of common in-terest. Those entities include the Association County Commissioners of Georgia, the Georgia Munic-ipal Association, the Georgia Fire Chiefs Association, the Georgia Sheriffs' Association, the Georgia Police Chiefs Association, the Departments of Public Safety and Natural Resources, and others. Legislation Supporting Mitigation The Official Code of Georgia Annotated or O.C.G.A is the compendium of all laws in Georgia. Geor-gia has numerous legislative rules that support the mitigation process in the State. Below is a list of this legislation and O.C.G.A, which is more thoroughly discussed in Chapter 3 and Appendix J. Georgia Emergency Management Act of 1981, as amended, O.C.G.A § 38-3-1 Soil and Water Conservation Districts Law, O.C.G.A §§ 2-6-20 to 23 & § 2-6-27 Coastal Marshlands Protection, O.C.G.A. § 12-5-280 Georgia Safe Dams Act of 1978, O.C.G.A §§ 12-5-370 to 385 Erosion and Sedimentation Act, O.C.G.A § 12-7-1
195
Georgia Environmental Policy Act, O.C.G.A § 12-16-1 Metropolitan North Georgia Water Planning District Act, O.C.G.A § 12-5-570 Uniform Codes Act, O.C.G.A § 8-2-20 The Uniform Standards Code for Manufactured Homes Act and Installation of Manufactured and Mo-bile Homes, O.C.G.A § 8-2-130 and § 8-2-160 Georgia Planning Act of 1989, O.C.G.A §12-2-8 Georgia Forest Fire Protection Act, O.C.G.A §12-6-80 to §12-6-93 Georgia Prescribed Burning Act, O.C.G.A §12-6-145 Georgia Geospatial Advisory Council, O.C.G.A §12-5-9 Mitigation Councils Georgia State Inter-Agency Hazard Mitigation Planning Team In July 2006, the State Hazard Mitigation Task Force, now called the State Hazard Mitigation Plan-ning Team (SHMPT) was convened by letter from GEMA Director Charley English. The team was made up of a number of state agencies and was instrumental in updating the State Mitigation Plan. The SHMPT was introduced in Chapter 1 and meeting details are included in Appendix B. Other Partnerships Association of County Commissioners of Georgia (ACCG) and Georgia Municipal Association (GMA) The State of Georgia places considerable value on partnerships the State utilizes ACCG and GMA to publicize the availability of mitigation program grant funds for local and county governments. In addition, GEMA provides information to ACCG and GMS at their annual meetings. Geographical Information Systems Coordinating Committee (GISCC) The Georgia GISCC’s vision is that all levels of government become highly effective and efficient through the coordination and use of geospatially-related data, standards and technologies. The GISCC’s mission is to be a valued advisor on sustainable geospatial governance, investments, poli-cies and data-driven decisions influencing Georgia. The GISCC, formed by the Information Technology Policy Council (ITPC) in July of 1998, is the offi-cially recognized statewide advisory and coordinating body for geospatially-related activities, pend-ing legislative approval. The GISCC provides an efficient and effective framework for the collabora-tion, communication, planning, budgeting, acquisition, utilization and archiving of all state, regional and local geospatial resources. The GISCC leads and encourages continued development and use of the Georgia Spatial Data In-frastructure (GaSDI) which feeds the National Spatial Data Infrastructure (NSDI), defined as the “technology, policies, and people necessary to promote geospatial data sharing throughout all levels of government, the private and non-profit sectors, and academia.” The term “infrastructure” is de-fined as the “underlying base or the basic facilities, equipment, services, and installations needed for the growth and functioning of a community or organization.” In the same manner that roads are vital-
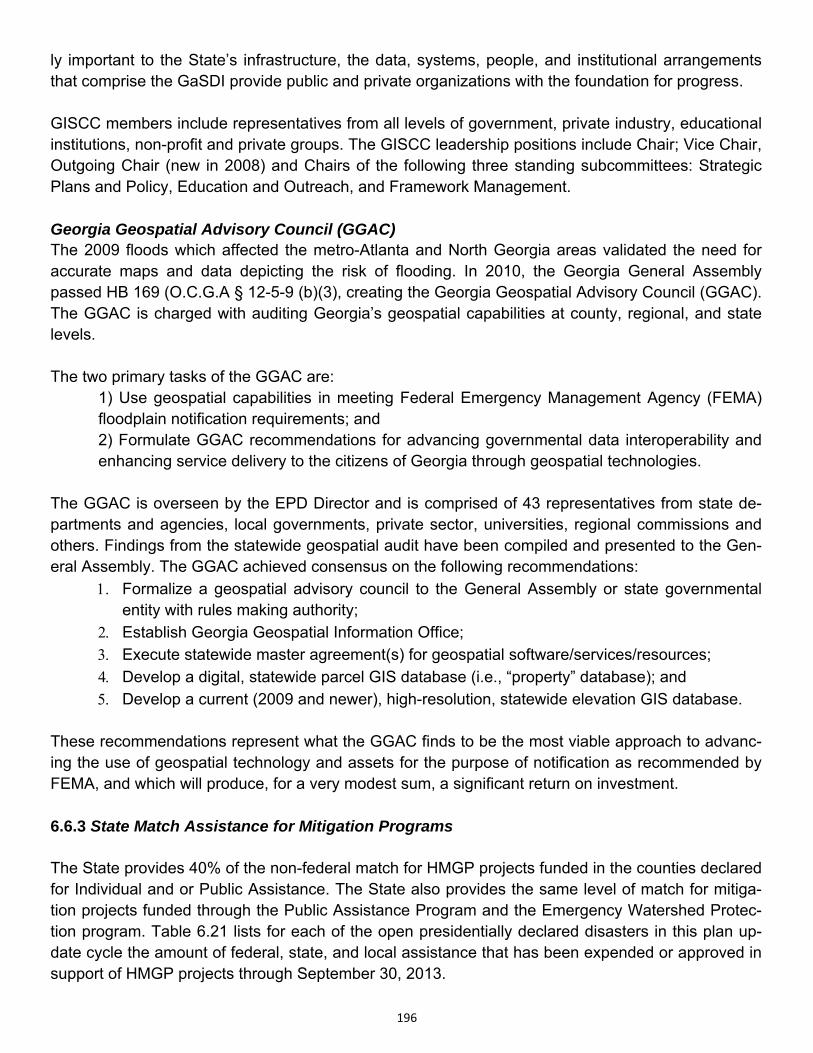
196
ly important to the State’s infrastructure, the data, systems, people, and institutional arrangements that comprise the GaSDI provide public and private organizations with the foundation for progress. GISCC members include representatives from all levels of government, private industry, educational institutions, non-profit and private groups. The GISCC leadership positions include Chair; Vice Chair, Outgoing Chair (new in 2008) and Chairs of the following three standing subcommittees: Strategic Plans and Policy, Education and Outreach, and Framework Management. Georgia Geospatial Advisory Council (GGAC) The 2009 floods which affected the metro-Atlanta and North Georgia areas validated the need for accurate maps and data depicting the risk of flooding. In 2010, the Georgia General Assembly passed HB 169 (O.C.G.A § 12-5-9 (b)(3), creating the Georgia Geospatial Advisory Council (GGAC). The GGAC is charged with auditing Georgia’s geospatial capabilities at county, regional, and state levels. The two primary tasks of the GGAC are:
1) Use geospatial capabilities in meeting Federal Emergency Management Agency (FEMA) floodplain notification requirements; and 2) Formulate GGAC recommendations for advancing governmental data interoperability and enhancing service delivery to the citizens of Georgia through geospatial technologies.
The GGAC is overseen by the EPD Director and is comprised of 43 representatives from state de-partments and agencies, local governments, private sector, universities, regional commissions and others. Findings from the statewide geospatial audit have been compiled and presented to the Gen-eral Assembly. The GGAC achieved consensus on the following recommendations:
Formalize a geospatial advisory council to the General Assembly or state governmental entity with rules making authority;
Establish Georgia Geospatial Information Office; Execute statewide master agreement(s) for geospatial software/services/resources;
Develop a digital, statewide parcel GIS database (i.e., “property” database); and Develop a current (2009 and newer), high-resolution, statewide elevation GIS database.
These recommendations represent what the GGAC finds to be the most viable approach to advanc-ing the use of geospatial technology and assets for the purpose of notification as recommended by FEMA, and which will produce, for a very modest sum, a significant return on investment. 6.6.3 State Match Assistance for Mitigation Programs The State provides 40% of the non-federal match for HMGP projects funded in the counties declared for Individual and or Public Assistance. The State also provides the same level of match for mitiga-tion projects funded through the Public Assistance Program and the Emergency Watershed Protec-tion program. Table 6.21 lists for each of the open presidentially declared disasters in this plan up-date cycle the amount of federal, state, and local assistance that has been expended or approved in support of HMGP projects through September 30, 2013.
197
6.6.4 Construction Standards for Mitigation DCA’s Construction Codes and Industrialized Buildings Program establish minimum building con-struction standards for all new structures. Local governments that adopt building codes under one of these programs must utilize these minimum standards. Chapter 3.4.1 provides a list of building con-struction codes in the State of Georgia. These include eight mandatory and two permissive codes. Disaster Resilient Building Codes (DRBC) Appendices The Georgia Department of Community Affairs (DCA) was awarded a grant through the U.S. Depart-ment of Housing and Urban Development (HUD) to develop new disaster resilient building code (DRBC) Appendices for the International Building Code (IBC) and the International Residential Build-ing Code (IRC). A task force of 19 stakeholders was appointed to look for opportunities to improve any provisions relating to hurricane, flood, and tornado disasters. In addition to improving existing provisions in the codes, the task force developed new provisions that address these issues. See Ap-pendix I for the Georgia State International Building Code and Georgia State International Residen-tial Code in regards to Disaster Resilient Construction. The optional appendices contain increased construction requirements (code plus) for disaster resilience that may be adopted in whole or part and are available for adoption by local jurisdictions in the State of Georgia as of January 1, 2013. DRBC Workshops/Training The state has developed and conducted a comprehensive training program for building officials on the importance, implementation and enforcement of the disaster resilient construction appendices. The training focused on the provisions within the appendices and aide in helping a community to de-termine which options may apply to provide increased requirements beyond what may be currently enforced. 6.6.5 Mitigating Risks to Critical and Essential Facilities Critical facilities is used to describe all manmade structures or other improvements that, because of their function, size, service area, or uniqueness, have the poten-tial to cause serious bodily harm, extensive property damage, or disruption of vital socioeconomic activities if they are destroyed, dam-aged, or if their functionality is impaired. Critical facilities commonly include all public and private fa-cili-ties that a community considers essential for the delivery of vital services and for the protection of the community. They usually include emergency response facilities (fire stations, police sta-tions,
Disaster Total Approved Federal Share State Share Local Share
DR1560 1,493,304 1,096,129 45,672 351,503 DR1686 13,552,758 10,164,570 664,025 2,724,163 DR1750 1,243,973 932,979 38,476 272,518 DR1761 3,260,695 2,445,520 103,365 711,810 DR1833 7,713,418 5,704,463 804,882 1,204,073 DR1858 46,805,974 35,104,735 4,956,491 6,744,748 DR1973 7,153,763 5,365,349 523,041 1,265,373 Total 81,223,885 60,813,745 7,135,952 13,274,188
Percent 74.9% 8.8% 16.3%
Table 6.21
198
rescue squads, and emergency operation centers [EOCs]), custodial facilities (jails and other deten-tion centers, long-term care facilities, hospitals, and other health care facilities), schools, emergency shelters, utilities (water supply, wastewater treatment facilities, and power), communications facili-ties, and any other as-sets determined by the community to be of critical importance for the protec-tion of the health and safety of the population. Essential facilities are a subset of critical facilities and include hospitals, fire and police stations, res-cue and other emergency service facilities, power stations, water supply facilities, aviation facilities, and other buildings critical for post disaster response and recovery operations. Chapter 2 of the Standard Plan addresses both state-owned and operated facilities as well as critical facilities in order to focus on loss potential within the state. Assessing state-owned and operated fa-cilities allows GEMA to prioritize mitigation efforts directed towards other state agencies with more efficiency as well as to aid in protecting the state’s assets. Because critical facilities include any facil-ity or structure that should continue to function and provide necessary services in some capacity (not necessarily normal purpose) to surrounding populations during and after a hazard event, GEMA aims mitigation efforts in this area as well. As discussed in Section 2.8 of the Standard Plan, an assessment to identify the state-owned and leased facilities has been completed in all 159 Georgia counties. The state has utilized this infor-mation to update the hazard, risk, and vulnerability assessment. Subsequently, future hazard, risk, and vulnerability assessments will include analyses of all spatially defined hazards identified in Chapter 2 of the Standard Plan that have the potential to affect state-owned and operated facilities that are stored in the Building, Land & Lease Inventory of Property (BLLIP) system as well as critical facilities stored in the GMIS system. Efforts are currently underway to develop processes for state agencies to identify critical facilities in the BLLIP system and also to have the GMIS site consume the relevant BLLIP information. Once the risk assessments have been completed for all spatially defined hazards, a formal, comprehensive, multi-year plan to mitigate the risks posed to the identified facilities will be developed. In addition, through community education and outreach, GEMA has encouraged local jurisdictions to include mitigation activities that would reduce or eliminate the vulnerability to local jurisdictional criti-cal facilities. Section 2.4.2 of the Standard Plan provides a table containing a list of hazards identi-fied by local hazard mitigation plans and Section 3.2.4 of the Standard Plan provides a table contain-ing a list of mitigation activities addressed in each of the approved or submitted local hazard mitiga-tion plans. 6.6.6 Integrating Mitigation to Post Disaster Recovery Operations Hazard Mitigation is an integral part of Georgia’s post-disaster recovery operations. Staff from the Mitigation Division support FEMA staff at the Joint Field Office (JFO). State and FEMA staff work to-gether to identify mitigation opportunities through both the Human Services, Public Assistance, Small Business Administration and Floodplain Management programs. Public Assistances’ staff is very proactive in pursuing mitigation activities in the immediate post disaster recovery effort for re-
199
pair and restoration projects. GEMA’s Mitigation staff supports the Public Assistance staff at their ap-plicant briefings. GEMA’s Mitigation staff conducts applicant briefings in the declared counties and provides technical assistance to all potential grant applicants on project development. For DR1973, GEMA Hazard Mitigation staff worked very closely with FEMA Mitigation staff at the JFO to develop a Joint Mitigation Implementation plan for the disaster. The Joint Mitigation Imple-mentation Plan detailed actions taken at the JFO to address the mitigation priorities identified by GE-MA and FEMA in response to damage from severe storms/tornadoes associated with FEMA DR1973. The priorities were compiled by the State in cooperation with the JFO Mitigation staff to support the State Mitigation Plan for Georgia. Mitigation staff also worked very closely with FEMA’s Hazards and Performance Analysis staff on benefit cost analysis of individual Safe Room type pro-jects. This work resulted in higher benefits for Georgia Counties bordering the State of Alabama than the FEMA developed standard benefits identified in the Expedited Residential Safe Room applica-tion. Safe Room workshops were conducted at four colleges and at GEMA providing information to more than 100 people on guidelines for determining areas of Safe Refuge within buildings.