2014 traffic safety culture index
TRANSCRIPT

2014 Traffic Safety Culture Index January 2015
607 14th Street, NW, Suite 201 | Washington, DC 20005 | AAAFoundation.org | 202-638-5944
Car crashes rank among the leading causes of death in the United States.

2
Title
2014 Traffic Safety Culture Index (January 2015)
About the Sponsor
AAA Foundation for Traffic Safety
607 14th Street, NW, Suite 201
Washington, DC 20005
202-638-5944
www.aaafoundation.org
Founded in 1947, the AAA Foundation in Washington, D.C. is a not-for-profit, publicly
supported charitable research and education organization dedicated to saving lives by
preventing traffic crashes and reducing injuries when crashes occur. Funding for this report
was provided by voluntary contributions from AAA/CAA and their affiliated motor clubs,
from individual members, from AAA-affiliated insurance companies, as well as from other
organizations or sources.
This publication is distributed by the AAA Foundation for Traffic Safety at no charge, as a
public service. It may not be resold or used for commercial purposes without the explicit
permission of the Foundation. It may, however, be copied in whole or in part and
distributed for free via any medium, provided the AAA Foundation is given appropriate
credit as the source of the material. The AAA Foundation for Traffic Safety assumes no
liability for the use or misuse of any information, opinions, findings, conclusions, or
recommendations contained in this report.
If trade or manufacturer’s names are mentioned, it is only because they are considered
essential to the object of this report and their mention should not be construed as an
endorsement. The AAA Foundation for Traffic Safety does not endorse products or
manufacturers.
©2015, AAA Foundation for Traffic Safety

3
Introduction
In the quarter century from 1989 through 2013, the lives of more than a million men,
women, and children have ended violently as the result of motor vehicle crashes in the
United States. Motor vehicle crashes are a leading cause of death for children, teens, and
young adults up to age 34, and the leading cause for people ages 15-34.1 Statistics from the
United States Department of Transportation indicate that 32,719 people died in motor
vehicle crashes in 2013.2 This represents a decrease of 3.1 percent from 2012. It also
represents an average of 90 lives per day that are needlessly cut short as the result of
crashes on our roads.
Since 2006, the AAA Foundation for Traffic Safety has been sponsoring research to better
understand traffic safety culture.3-12 The Foundation’s long-term term vision is to create a
“social climate in which traffic safety is highly valued and rigorously pursued.”11 In 2008,
the AAA Foundation conducted the first Traffic Safety Culture Index,8 a nationally-
representative survey, to begin to assess a few key indicators of the degree to which traffic
safety is valued and is being pursued.
As in previous years, this Traffic Safety Culture Index finds that Americans do value safe
travel and desire a greater level of safety than they now experience. They perceive unsafe
driver behaviors such as speeding and impaired driving as serious threats to their personal
safety and generally support laws that would improve traffic safety by restricting driver
behavior, even when such laws would restrict behaviors they admit to engaging in
themselves.
As in previous years, the survey also highlights some aspects of the current traffic safety
culture that might be characterized most appropriately as a culture of indifference, in
which drivers effectively demonstrate a “Do as I say, not as I do” attitude. For example,
substantial numbers of drivers say that it is completely unacceptable to drive 15 mph over
the speed limit on freeways, yet admit having done that in the past month.
In past years, findings from the survey were reportable only at the national level. In
addition, this year, sampling was expanded to allow for reporting at the state level for 24
states, which cover 80 percent of the U.S. population.
This report presents the methods for the AAA Foundation’s seventh annual Traffic Safety
Culture Index and summarizes major national-level results. Selected state level results are
shown by state in Appendix B.

4
Summary of Major Findings
Personal exposure to crashes
Nearly 1 in 5 drivers have been involved in a serious crash at some point in their lives,
and 1 in 10 has been seriously injured in a crash.
Nearly 1 in 3 Americans have had a friend or relative seriously injured or killed in a
crash.
Impaired driving Drivers view drinking and driving as a very serious threat, and virtually all disapprove
of drinking and driving and acknowledge that others also disapprove of it. One in 8,
however, admit to driving at least once in the past year when they thought their alcohol
level might have been close to or possibly over the legal limit, and of these, more than
19 percent (2.4% of all drivers) said they did so in the past month.
There is majority support for requiring alcohol-ignition interlocks for drivers convicted
of DWI, even for first-time offenders (80.2%); requiring built-in interlocks for all new
vehicles (72.8 %); and lowering the legal limit for blood alcohol concentration (BAC)
from 0.08 to 0.05 grams per deciliter (g/dL) (63.4%).
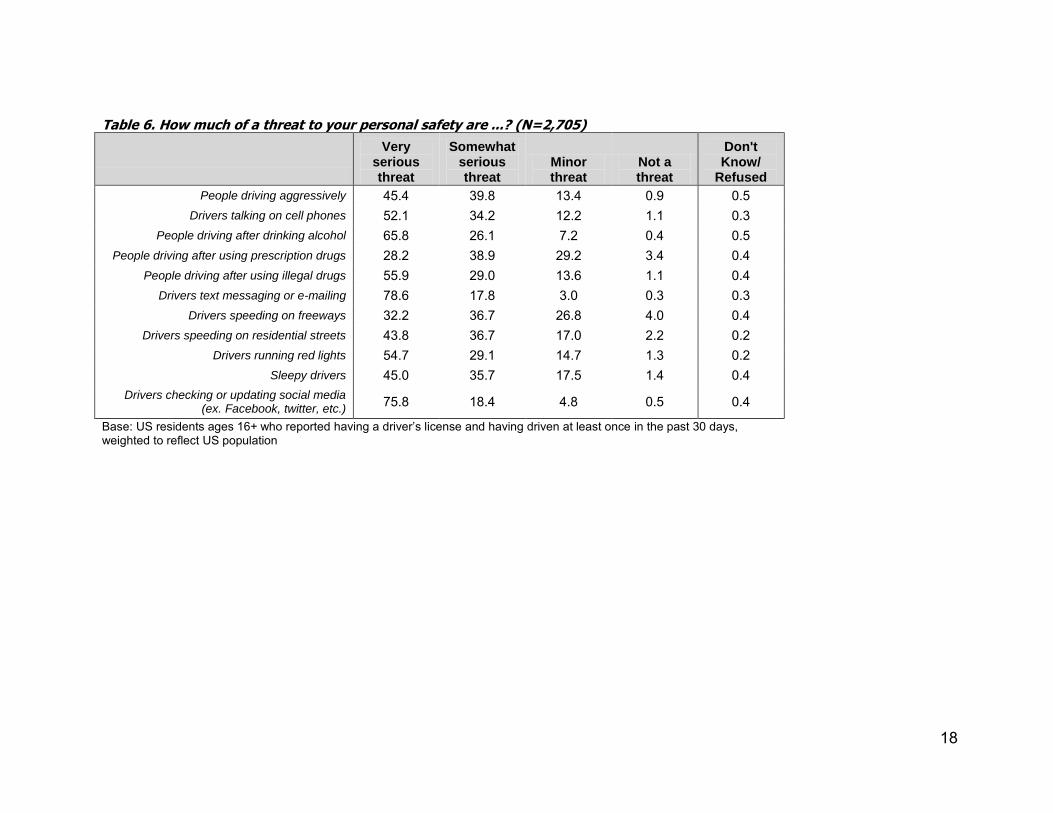
A majority of drivers (55.9%) view people driving after using illegal drugs as a very
serious threat, while much fewer (28.2%) say the same about people driving after using
prescription drugs.
Cell phone use and texting Cell phone use while driving is widespread. More than 2 in 3 drivers report talking on
their cell phone while driving in the past month, and nearly 1 in 3 say they do so fairly
often or regularly. There is fairly strong disapproval toward using a hand-held cell
phone while driving (65.7%), but nearly half of all drivers believe incorrectly that most
others actually approve of it. People are more accepting of hands-free cell phone use
than hand-held (65.4% vs. 33.0%).
Most drivers view texting or emailing while driving as a very serious threat to their own
personal safety and consider it completely unacceptable. However, more than 1 in 8
drivers (12.7%) don’t perceive social disapproval from others; more than 1 in 4 (27.1%)
admit to typing or sending a text message or email while driving in the past month; and
more than 1 in 3 (36.1%) report reading a text message or email while driving in the
past month.
More than 2 in 3 drivers (67.8%) support restricting the use of hand-held cell phones
while driving, but less than half (40.2%) support an outright ban on using any type of
cell phone (including hands-free) while driving. There is strong support (89.3%) for laws
restricting reading, typing, or sending a text message or email while driving.

5
Speeding Speeding on freeways is common. Nearly half of drivers (46.1%) say they have driven 15
mph over the speed limit on a freeway in the past month, and more than 1 in 5 say they
consider it acceptable to do so. Similarly, nearly half of drivers (43.5%) say they have
driven 10 mph over the speed limit on a residential street in the past month. There is
greater social disapproval for speeding on a residential street than on a freeway (90.2%
versus 76.0%).
Red-light running Nearly all drivers view it as unacceptable to drive through a traffic light that just
turned red when they could have stopped safely; however, more than 1 in 3 drivers
(35.6%) admit doing this in the past month.
Drowsy driving Most drivers view drowsy driving as a serious threat to their safety and a completely
unacceptable behavior; however, more than 1 in 4 (29.4%) admit to driving when they
were so tired that they had a hard time keeping their eyes open at some point in the
past month.
Seatbelts and helmets Most drivers (88.0%) view it as unacceptable to drive without wearing a seatbelt, and
more than 4 in 5 (81.7%) say that they never do; however, nearly 1 in 5 (17.9%) admit
that they have driven without wearing their seatbelt in the past 30 days, and more than
1 in 7 (14.9%) say they have done this more than once.
More than 4 in 5 Americans (82.1%) support a law requiring all motorcycle riders to
wear a helmet, and 62.2 percent strongly support this.
Methods
A sample of respondents ages 16 and older was recruited from KnowledgePanel®14, an
online research panel recruited and maintained by market research firm GfK. The panel
consists of members of a representative sample of households recruited using standard
probability-based random digit dial (RDD) and address-based sampling methods. The
sampling frame includes all U.S. households reachable by telephone or by regular mail,
irrespective of telephone or Internet access or use. If a sampled household lacks Internet
access or an Internet-capable computer, GfK provides Internet access and a netbook
computer at no cost to the household. Individuals not sampled by GfK cannot volunteer to
join the panel. Because each individual respondent’s probability of selection into the panel
and probability of selection for a particular survey are known, statistics can be weighted to
reflect the entire population from which the sample was drawn.
Sampled panelists received an invitation to complete the survey and were asked to do so at
their earliest convenience. The questionnaire was made available in English and Spanish,

6
and respondents were able to complete it in the language of their choice. The survey was
administered between August 29 and October 6, 2014.
National Sample
Respondents were sampled as follows: Respondents ages 19 and older were sampled
directly from the membership of the panel, with approximately equal numbers sampled
from each of the 9 U.S. Census Divisions. The questionnaire was sent to 4,427 panelists
ages 19 and older; 2,528 completed the questionnaire.
Respondents ages 16-18 were recruited indirectly from a sample of panel members whose
existing household information indicated were parents of at least one teen in this age
range. Sampled parents were asked to confirm that they had an eligible teen, provide
consent for the teen to be included in the survey, and forward the survey to the teen. If a
parent had more than one eligible teen, one was selected randomly by a computer
algorithm. Invitations were sent to 3,155 parents of teens aged 16-18, and 963 respondents
ages 16-18 completed the questionnaire.
State Samples
The survey was sent to an additional 11,641 panelists ages 19 and older in the states listed
in Table 1* (technical constraints made it infeasible to expand the sample to allow for
reporting for the remaining 26 states) to provide sample size sufficient for reporting of
results at the state level in those states; 6,923 completed the questionnaire. For state-level
analysis, these respondents were combined with 3,004 respondents ages 16 and older from
the national sample who resided in those states. The numbers of respondents from each
state included in state-level analysis are shown in Table 1.
Table 1. Total Number of Respondents by State for States in which
Results are Reported at the State Level
State N
Arizona 419 Maryland 342 Oregon 344
California 548 Michigan 424 Pennsylvania 459
Colorado 328 Minnesota 430 Rhode Island* 395
Florida 438 Missouri 399 Tennessee 328
Georgia 423 New Jersey 407 Texas 471
Illinois 424 New York 417 Virginia 427
Indiana 424 North Carolina 408 Washington 405
Massachusetts 403 Ohio 429 Wisconsin 435
* The survey was administered separately for Rhode Island by Ewald & Wasserman, LLC. The
survey was printed and mailed using address-based sampling to a simple random sample of 1000
households in the state of Rhode Island on August 18, 2014, with instructions requesting the survey
be completed by a person 18 an older, and if there were multiple adults in the household, to have the
one who had his or her birthday most recently complete the survey. Analyses for Rhode Island are
based on 336 respondents who reported having a valid driver’s license and having driven at least
once in the past 30 days, among 395 completed surveys received by September 16, 2014.
7
Selected state-level results are reported at the state level in Appendix B.
Weighting
The data were weighted to account for probability of selection for recruitment into
KnowledgePanel, probability of selection for this survey, non-response at both stages, and
to align the characteristics of the respondents to those of the population of residents ages
16+ from which the sample was drawn with respect to gender, age, race/Hispanic ethnicity,
education, census region, metropolitan/non-metro status, number of people ages 16 and
older in the household, and household income using data from the U.S. Census Bureau’s
Current Population Survey15. All analyses were based on weighted data.
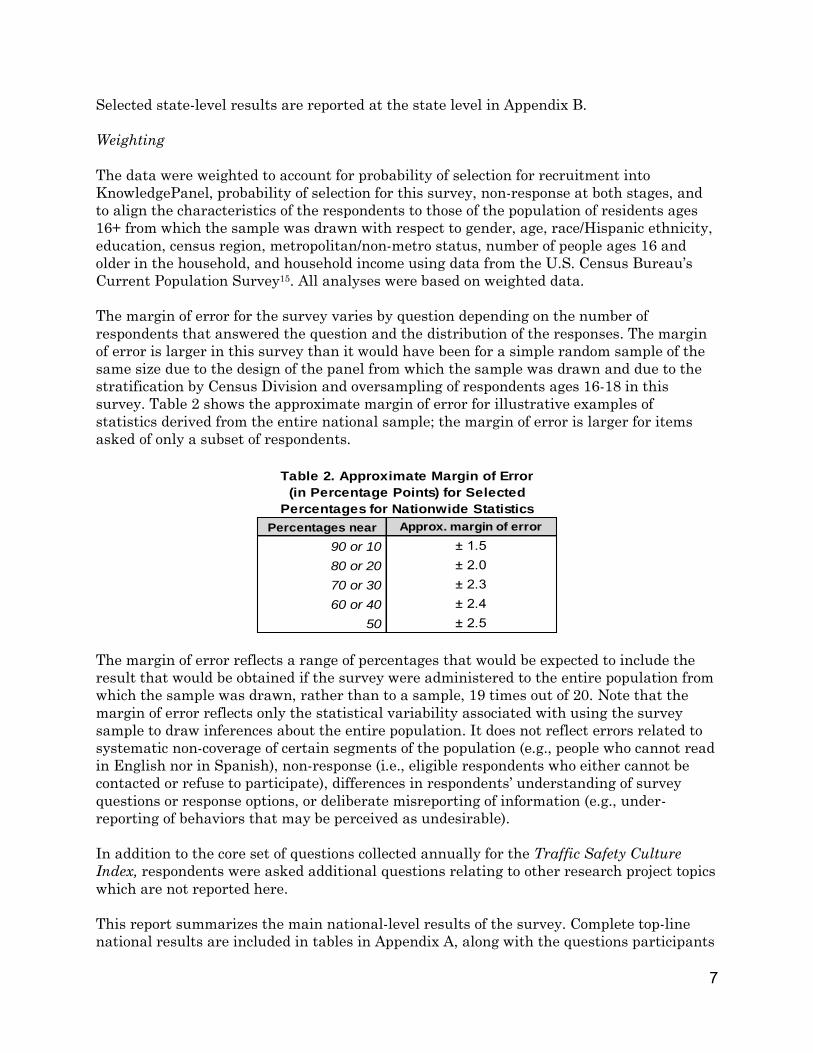
The margin of error for the survey varies by question depending on the number of
respondents that answered the question and the distribution of the responses. The margin
of error is larger in this survey than it would have been for a simple random sample of the
same size due to the design of the panel from which the sample was drawn and due to the
stratification by Census Division and oversampling of respondents ages 16-18 in this
survey. Table 2 shows the approximate margin of error for illustrative examples of
statistics derived from the entire national sample; the margin of error is larger for items
asked of only a subset of respondents.
Percentages near Approx. margin of error
90 or 10 ± 1.5
80 or 20 ± 2.0
70 or 30 ± 2.3
60 or 40 ± 2.4
50 ± 2.5
Table 2. Approximate Margin of Error
(in Percentage Points) for Selected
Percentages for Nationwide Statistics
The margin of error reflects a range of percentages that would be expected to include the
result that would be obtained if the survey were administered to the entire population from
which the sample was drawn, rather than to a sample, 19 times out of 20. Note that the
margin of error reflects only the statistical variability associated with using the survey
sample to draw inferences about the entire population. It does not reflect errors related to
systematic non-coverage of certain segments of the population (e.g., people who cannot read
in English nor in Spanish), non-response (i.e., eligible respondents who either cannot be
contacted or refuse to participate), differences in respondents’ understanding of survey
questions or response options, or deliberate misreporting of information (e.g., under-
reporting of behaviors that may be perceived as undesirable).
In addition to the core set of questions collected annually for the Traffic Safety Culture
Index, respondents were asked additional questions relating to other research project topics
which are not reported here.
This report summarizes the main national-level results of the survey. Complete top-line
national results are included in tables in Appendix A, along with the questions participants

8
were asked. State-level results are summarized by state in Appendix B. The descriptive
statistics provided in this report were calculated for respondents who reported having a
valid driver’s license and having driven in the past 30 days.
Results and Discussion
Traffic safety as a social issue
A majority of drivers express some opinions consistent with a belief that traffic safety is a
serious issue that warrants attention. They perceive unsafe driver behaviors such as
speeding, talking on cell phones, texting and e-mailing, and red light running as serious
threats to their personal safety (Table 6). More than 5 in 6 drivers support their state
adopting a vision to reduce the number of people killed in crashes to zero, and most express
support for traffic safety laws. “Move-over” laws, which require drivers to take special
actions such as reduce speed or move to another lane when passing an emergency vehicle
stopped on the side of the road to protect emergency personnel, received the greatest
amount of support amongst the laws and regulations included in the survey, with 92.9
percent of drivers expressing support (Table 12).
Drivers appear to be concerned about driver competence, expressing high levels of support
for mandatory driver education for new drivers (89.6% for new drivers under 18, 82.6% for
all new drivers regardless of their age). Two out of three (66.3%) support applying
restrictions (such as night driving or passenger restrictions) to all new drivers for a period
of time (regardless of age), which are currently applied in most states only to new drivers
younger than 18 (Table 12).
Although many drivers seem to think traffic safety is important generally, the survey
findings reveal some aspects of the current traffic safety culture that might be
characterized as a culture of indifference, with drivers effectively saying “Do as I say, not as
I do.” For example, substantial numbers of drivers say that it is completely unacceptable for
a driver to drive when they’re so sleepy that they have trouble keeping their eyes open, yet
many admit to doing so anyway.
Nearly half of all drivers have been touched in some way by a serious motor vehicle crash at
some point in their lives. Specifically, nearly 1 in 5 (18.6%) report having been involved in a
motor vehicle crash in which someone had to go to the hospital, including 10.3 percent who
have been seriously injured in a crash themselves. Nearly 1 in 3 drivers (28.6 %) report
having had a friend or relative who was seriously injured or killed in a motor vehicle crash
(Table 19). Overall, nearly 2 in 5 drivers (37.7%) report having been involved in a serious
crash, having had a friend or relative seriously injured or killed in a crash, or both.
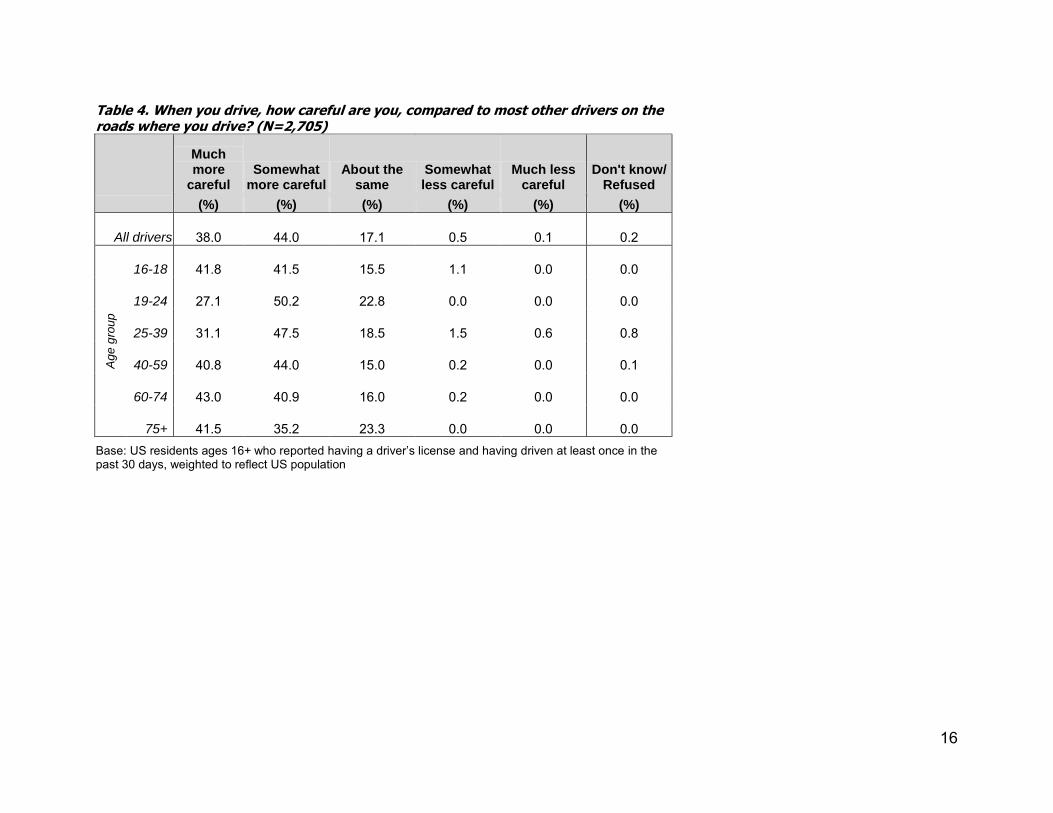
Most drivers (82.0%) believe that they drive somewhat or much more carefully than other
drivers on the roads they drive (Table 4), which indicates that many drivers overestimate
how carefully they drive. Only 0.6 percent of drivers said they drive somewhat or much less
carefully than most other drivers. Drivers ages 19-24 and those 75+ were the least likely to
rate themselves as more careful than most other drivers. Slightly more than half of drivers
(58.4%) believe they drive about as fast as most other drivers on the roads they drive (Table
5). More than 1 in 6 drivers (18.3%) said they drive somewhat or much faster than other

9
drivers, though more than a quarter (27.5%) of drivers ages 25-39 and only 6.9 percent of
drivers over 75 admitted the same.
Attitudes and behavior: Impaired driving
Drinking and driving is viewed as a very serious safety threat, social disapproval is almost
universal, social stigma is felt strongly, and relatively few drivers admit to drinking and
driving. There is majority support for requiring all DWI offenders to use alcohol-ignition
interlocks on their vehicles, even for first-time offenses (Table 12).
Nearly 2 in 3 drivers (65.8%) say that people driving after drinking alcohol are a very
serious threat to their personal safety (Table 6), and 97.4 percent say that they personally
consider it unacceptable (91.0% completely unacceptable) to drive when they think they
may have had too much to drink (Table 8). Additionally, 91.6 percent perceive that, where
they live, most other people consider it unacceptable for motorists to drive when they think
they may have had too much to drink (Table 7).
One in 8 drivers report having driven when they thought that their alcohol level might
have been close to or possibly over the legal limit within the past 12 months, 8.3 percent
said they did so more than once (Table 15). Of those who reported driving when their
alcohol level may have been close to or over the legal limit in the past year, 19.4 percent
(2.4% of all drivers) said they did so in the past month (Table 16).
More than four out of five (80.2%) drivers support requiring all drivers who have been
convicted of DWI more than once to use a device that won’t let their car start if they have
been drinking, even for first time offenders, called an alcohol ignition interlock device. A
smaller but significant majority (72.8%) also support requiring all new cars to have built-in
technology that won’t let the car start if the driver’s alcohol level is over the legal limit
(Table 12). A slightly smaller majority (63.4%) of drivers support lowering the BAC limit
from .08 to .05 g/dL (30.7% strongly; 32.7% somewhat). Support was lower among those
who report drinking more, but even 51.5 percent of drivers who drink “a few times a week”
and 60.1 percent of drivers who drink “a few times a month” supported lowering the BAC
limit.
Slightly less than half (45.6%) of all respondents perceived that “drivers using drugs” are a
somewhat or much bigger problem than 3 years ago (Table 3). More than half of drivers
(55.9%) reported that people driving after using illegal drugs are a very serious threat, but
fewer (28.2%) reported that people driving after using prescription drugs are a very serious
threat (Table 6). Drivers aged 60 and older were the least likely to report that people
driving after using prescription drugs are a very serious threat.
More than 80 percent of licensed drivers reported that where they live, most people would
say it is somewhat (28.3%) or completely (55.6%) unacceptable for a driver to drive one hour
after using marijuana (Table 7), while more than 9 in 10 drivers (91.9%) said they
personally feel it is unacceptable (Table 8).
More than four out of five drivers (85.3%) support having a per se law for marijuana, which
makes it illegal to drive with a certain amount marijuana in one’s system (Table 12).

10
Attitudes and behavior: Cell phone use and text messaging
Cell phone use while driving remains widespread. More than 2 in 3 drivers (69.2%) report
having talked on a cell phone while driving within the past 30 days; 61.6 percent report
doing this on more than one occasion, and 29.1 percent say they talk on their cell phone
while driving fairly often or regularly (Table 10).
More than half of drivers (52.1%) say that drivers talking on cell phones are a very serious
threat to their personal safety (Table 6). Sixty-six percent of drivers say that they
personally consider it unacceptable (42.2% completely unacceptable) for a driver to talk on
a hand-held cell phone while driving; 33.0 percent consider it somewhat or completely
acceptable (Table 8). One in 3 drivers (33.3%) consider it unacceptable for a driver to talk
on a hands-free cell phone while driving; nearly 2 in 3 (65.4%) consider it acceptable (Table
8). Nearly half of drivers (44.9%) believe that most other people where they live consider it
somewhat or completely acceptable for a driver to talk on a hand-held cell phone, and 4 in 5
drivers (80.1%) believe that most other people consider it acceptable to talk on a hands-free
cell phone (Table 7).
Most drivers (74.6%) believe that when talking on a cell phone while driving, it is safer to
use a hands-free device than a hand-held device (Table 17). However, of the nearly 70
percent of drivers who reported talking on a cell phone while driving in the past 30 days,
nearly half said they usually or always hold their cell phone in their hand when they talk
on the phone while driving (Table 14). Drivers are divided with regard to laws prohibiting
any and all cell phone use while driving (hand-held and hands-free), with greater opposition
than support for such legislation (58.6% oppose versus 40.2% support). (Table 12)
Most drivers (78.6%) say that drivers text messaging or emailing are a very serious threat
to their personal safety (Table 6); 96.4 percent say that they personally consider it
unacceptable (84.4% completely unacceptable) for a driver to type a text or email while
driving (Table 8); and 86.3 percent believe that most other people where they live consider
it unacceptable to text while driving (Table 7). Nonetheless, more than 1 in 3 drivers
(36.1%) admit to reading a text message or email while driving in the past 30 days, and 8.6
percent admit to doing this fairly often or regularly. In that same time period more than 1
in 4 drivers (27.1%) admit to typing or sending a text or e-mail, and 5.2 percent say they do
so fairly often or regularly (Table 10).
Nearly 9 in 10 drivers (89.3%) support having a law against reading, typing, or sending a
text message or email while driving; more than 2 in 3 (68.2%) strongly support such a law
(Table 12). Drivers are more evenly divided on the issue of the federal government
regulating non-driving-related in-vehicle technologies for distraction: 48.2 percent support
such regulation, with less than 1 in 5 (19.7%) strongly supporting regulation.
Self-reported distracted driving behavior and support for laws that prohibit or limit
distracted driving behavior vary widely by age. Drivers ages 25-39 report talking on cell
phones and texting and emailing while driving in the past 30 days more than any other age
group, with drivers ages 19-24 and 40-59 following closely behind (Table 11). More drivers
ages 25-39 report using the internet while driving (32.8 %) than any other age group, along
with 22.4 percent of drivers ages 19-24. Drivers over 60 years of age engage in these
activities while driving less than any other age group. The social acceptability of engaging

11
in distracting activities also varied by age: drivers ages 25-39 are the most likely to say that
talking on either a hand-held or hands-free cell phone while driving are acceptable, while
those ages 16-18 are most likely to say that typing texts or emails, as well as using the
internet while driving while driving are acceptable (Table 9). Drivers ages 25-39 were the
least likely to support laws that restrict text messaging and all cell phone use while driving
(Table 13).
Attitudes and behavior: Speeding
Speeding on freeways is prevalent. Nearly half of drivers (46.1%) say they have driven 15
mph over the speed limit on a freeway in the past month (Table 10), and 14.1 percent say
they did so fairly often or regularly. Additionally, 43.5 percent of drivers report having
driven 10 mph over the speed limit on a residential street in the past 30 days, with 9.3
percent reporting they did so regularly or fairly often.
More than 2 in 5 drivers (43.8%) say that drivers speeding on residential streets are a very
serious threat to their personal safety, and nearly one in three (32.2%) say this about
drivers speeding on freeways (Table 6). Moreover, 90.2 percent consider it unacceptable
(64.6% completely unacceptable) for a driver to drive 10 mph over the speed limit on a
residential street (Table 8), and 76.6 percent believe that most other people where they live
consider it unacceptable for a driver to do so (Table 7). Three in four drivers (76.0%)
consider it unacceptable to drive 15 mph over the speed limit on freeways. However, more
than 1 in 3 drivers (35.1%) believe incorrectly that most other people consider it acceptable
to drive 15 mph over the speed limit on freeways. More than 4 in 5 drivers consider it
unacceptable to drive 10 mph over the speed limit in an urban area, and most (95.7%)
consider it unacceptable to do so in a school zone.
Attitudes and behavior: Red-light running
Most drivers (94.0%) consider it unacceptable for a driver to drive through a light that had
already turned red when they could have stopped safely (72.7% completely unacceptable)
(Table 8), and 84.1 percent say that most other people where they live consider this
unacceptable (Table 7). Nonetheless, more than 1 in 3 drivers (35.6%) admit to having
driven through a light that had just turned red in the past 30 days when they could have
stopped safely. More than 1 in 5 drivers (22.7%) report having done this more than once;
however, very few (2.0%) report doing this fairly often or regularly (Table 10).
Despite the fact that an overwhelming proportion of drivers consider red-light running
unacceptable, only slightly more than half (54.6%) of drivers support using cameras to
automatically ticket drivers who run red lights in urban areas, and only slightly fewer
(53.3%) support using such cameras on residential streets (Table 12).
Attitudes and behavior: Drowsy driving
Most people view driving while drowsy as a serious threat to their own personal safety and
a completely unacceptable behavior; however, many drivers still admit to driving while
extremely drowsy themselves.
12
Nearly half of all drivers (45.0%) view sleepy drivers as a very serious threat to their
personal safety (Table 6). Virtually all drivers (96.2%) consider it unacceptable for someone
to drive when they are so sleepy that they have a hard time keeping their eyes open (81.3%
completely unacceptable) (Table 8), and most (90.7%) believe that most other people where
they live consider it unacceptable (Table 7).
Despite this, more than 1 in 4 drivers (29.4%) reported having driven when they were so
tired that they had a hard time keeping their eyes open in the past 30 days. One in five
(19.8%) reported having done this more than once, and 2.4 percent reported having done
this fairly often or regularly (Table 10).
Attitudes and behavior: Seatbelts and helmets
Most drivers (88.0%) say it is unacceptable for a driver to drive without wearing his or her
seatbelt (75.0% completely unacceptable) (Table 8). Moreover, 82.4 percent say they believe
that most other people where they live consider driving without wearing a seatbelt to be
unacceptable (Table 7).
Despite strong social disapproval, nearly 1 in 5 drivers (17.9%) report having driven
without wearing their seatbelt in the past 30 days; 14.9 percent report doing this more than
once, and 5.7 percent report driving without a seatbelt fairly often or regularly (Table 10).
While motorcycle helmet usage was not covered extensively in the survey, more than 4 in 5
drivers (82.1%) support a law requiring all motorcycle riders to wear a helmet (62.2%
strongly support) (Table 12).

13
References
1. Centers for Disease Control. WISQARS Leading Causes of Death Reports, National and
Regional, 2003 – 2012. Retrieved 3 December 2014 from
http://www.cdc.gov/injury/wisqars/leading_causes_death.html.
2. National Highway Traffic Safety Administration. (2014). Traffic Safety Facts: 2013
Motor Vehicle Crashes: Overview. Report no. DOT HS 812 101. Washington, DC:
National Highway Traffic Safety Administration.
3. AAA Foundation for Traffic Safety. (2014). 2013 Traffic Safety Culture Index.
Washington, DC: AAA Foundation for Traffic Safety. Available:
https://www.aaafoundation.org/sites/default/files/TSCI%202013%20Final%20FTS%20Fo
rmat.pdf.
4. AAA Foundation for Traffic Safety. (2013). 2012 Traffic Safety Culture Index.
Washington, DC: AAA Foundation for Traffic Safety. Available:
https://www.aaafoundation.org/sites/default/files/2012TrafficSafetyCultureIndex.pdf.
5. AAA Foundation for Traffic Safety. (2012). 2011 Traffic Safety Culture Index.
Washington, DC: AAA Foundation for Traffic Safety. Available:
https://www.aaafoundation.org/sites/default/files/2011TSCIndex%20%281%29_0.pdf.
6. AAA Foundation for Traffic Safety. (2010). 2010 Traffic Safety Culture Index.
Washington, DC: AAA Foundation for Traffic Safety. Available:
https://www.aaafoundation.org/sites/default/files/2010TSCIndexFinalReport%20%281%
29.pdf.
7. AAA Foundation for Traffic Safety. (2009). 2009 Traffic Safety Culture Index.
Washington, DC: AAA Foundation for Traffic Safety. Available:
https://www.aaafoundation.org/sites/default/files/2009TSCIndexFinalReport.pdf.
8. AAA Foundation for Traffic Safety. (2008). 2008 Traffic Safety Culture Index.
Washington, DC: AAA Foundation for Traffic Safety. Available:
https://www.aaafoundation.org/sites/default/files/2008TSCIndexFinalReport.pdf.
9. AAA Foundation for Traffic Safety. (2008). Cell Phones and Driving: Research Update.
Washington, DC: AAA Foundation for Traffic Safety. Available:
https://www.aaafoundation.org/sites/default/files/CellPhonesandDrivingReport.pdf.
10. AAA Foundation for Traffic Safety. (2007). Traffic Safety Culture in the United States:
The Journey Forward. Washington, DC: AAA Foundation for Traffic Safety. Available:
https://www.aaafoundation.org/sites/default/files/SafetyCultureReport%20%281%29.pdf.
11. Girasek DC. (2011). Towards operationalising and measuring Traffic Safety Culture
construct. International Journal of Injury Control and Safety Promotion.
http://dx.doi.org/10.1080/17457300.2011.603147.

14
12. Arnold LS, Girasek DC, Tefft BC, Grabowski JG. (2013) Temporal Trends in Indicators
of Traffic Safety Culture among Drivers in the United States, 2009-2012. Washington,
DC: AAA Foundation for Traffic Safety. Available:
https://www.aaafoundation.org/sites/default/files/TSCI%20Trends%20Final%20Formatt
ed%20AAAFTS.pdf.
13. Mizenko AJ, Tefft BC, Arnold LS, Grabowksi JG. (2014) Older American Drivers and
Traffic Safety Culture: A LongROAD Study. Washington, DC: AAA Foundation for
Traffic Safety. Available:
https://www.aaafoundation.org/sites/default/files/2014OlderDriversSafetyCulture.pdf.
14. GfK. (2011). KnowledgePanel® Design Summary. Menlo Park, CA: Knowledge
Networks.
www.knowledgenetworks.com/knpanel/docs/KnowledgePanel(R)-Design-Summary-
Description.pdf.
15. Current Population Survey: March 2014. [Data files]. Washington, DC: Bureau of
Census. http://www.bls.gov/cps/.

15
Appendix A: National Data Tables
Table 3. Please tell us how much of a problem each of the issues below is today compared to 3 years ago. (N=2,705)
Much bigger
problem today (%)
Somewhat bigger
problem today (%)
About the same
(%)
Somewhat smaller problem
today (%)
Much smaller problem
today (%)
Don't Know/
Refused (%)
Traffic congestion 30.9 37.7 29.8 1.2 0.2 0.1
Aggressive drivers 30.3 31.0 37.0 1.2 0.3 0.3
Distracted drivers 57.8 27.2 14.0 0.7 0.2 0.2
Drunk driving 21.2 20.4 49.9 7.6 0.6 0.3
Drivers using drugs 20.6 25.0 50.3 3.1 0.5 0.5
Base: US residents ages 16+ who reported having a driver’s license and having driven at least once in the past 30 days, weighted to reflect US population
16
Table 4. When you drive, how careful are you, compared to most other drivers on the roads where you drive? (N=2,705)
Much more
careful Somewhat
more careful About the
same Somewhat less careful
Much less careful
Don't know/ Refused
(%) (%) (%) (%) (%) (%)
All drivers 38.0 44.0 17.1 0.5 0.1 0.2
Ag
e g
rou
p
16-18 41.8 41.5 15.5 1.1 0.0 0.0
19-24 27.1 50.2 22.8 0.0 0.0 0.0
25-39 31.1 47.5 18.5 1.5 0.6 0.8
40-59 40.8 44.0 15.0 0.2 0.0 0.1
60-74 43.0 40.9 16.0 0.2 0.0 0.0
75+ 41.5 35.2 23.3 0.0 0.0 0.0
Base: US residents ages 16+ who reported having a driver’s license and having driven at least once in the past 30 days, weighted to reflect US population

17
Table 5. How fast do you usually drive, compared to most other drivers on the roads you drive? (N=2,705)
Much faster
Somewhat faster
About the same
Somewhat slower
Much slower
Don't know/
Refused
(%) (%) (%) (%) (%) (%)
All drivers 0.9 17.5 58.4 22.2 0.6 0.5
Ag
e g
rou
p
16-18 0.9 13.5 56.4 27.7 1.2 0.3
19-24 4.2 20.4 63.9 11.1 0.0 0.4
25-39 1.2 26.3 56.6 14.6 0.6 0.7
40-59 0.5 18.2 56.0 24.6 0.4 0.3
60-74 0.3 8.9 60.8 28.0 1.3 0.7
75+ 0.0 6.9 66.2 26.9 0.0 0.0
Base: US residents ages 16+ who reported having a driver’s license and having driven at least once in the past 30 days, weighted to reflect US population
18
Table 6. How much of a threat to your personal safety are ...? (N=2,705)
Very serious threat
Somewhat serious threat
Minor threat
Not a threat
Don't Know/
Refused
People driving aggressively 45.4 39.8 13.4 0.9 0.5
Drivers talking on cell phones 52.1 34.2 12.2 1.1 0.3
People driving after drinking alcohol 65.8 26.1 7.2 0.4 0.5
People driving after using prescription drugs 28.2 38.9 29.2 3.4 0.4
People driving after using illegal drugs 55.9 29.0 13.6 1.1 0.4
Drivers text messaging or e-mailing 78.6 17.8 3.0 0.3 0.3
Drivers speeding on freeways 32.2 36.7 26.8 4.0 0.4
Drivers speeding on residential streets 43.8 36.7 17.0 2.2 0.2
Drivers running red lights 54.7 29.1 14.7 1.3 0.2
Sleepy drivers 45.0 35.7 17.5 1.4 0.4
Drivers checking or updating social media (ex. Facebook, twitter, etc.)
75.8 18.4 4.8 0.5 0.4
Base: US residents ages 16+ who reported having a driver’s license and having driven at least once in the past 30 days, weighted to reflect US population
19
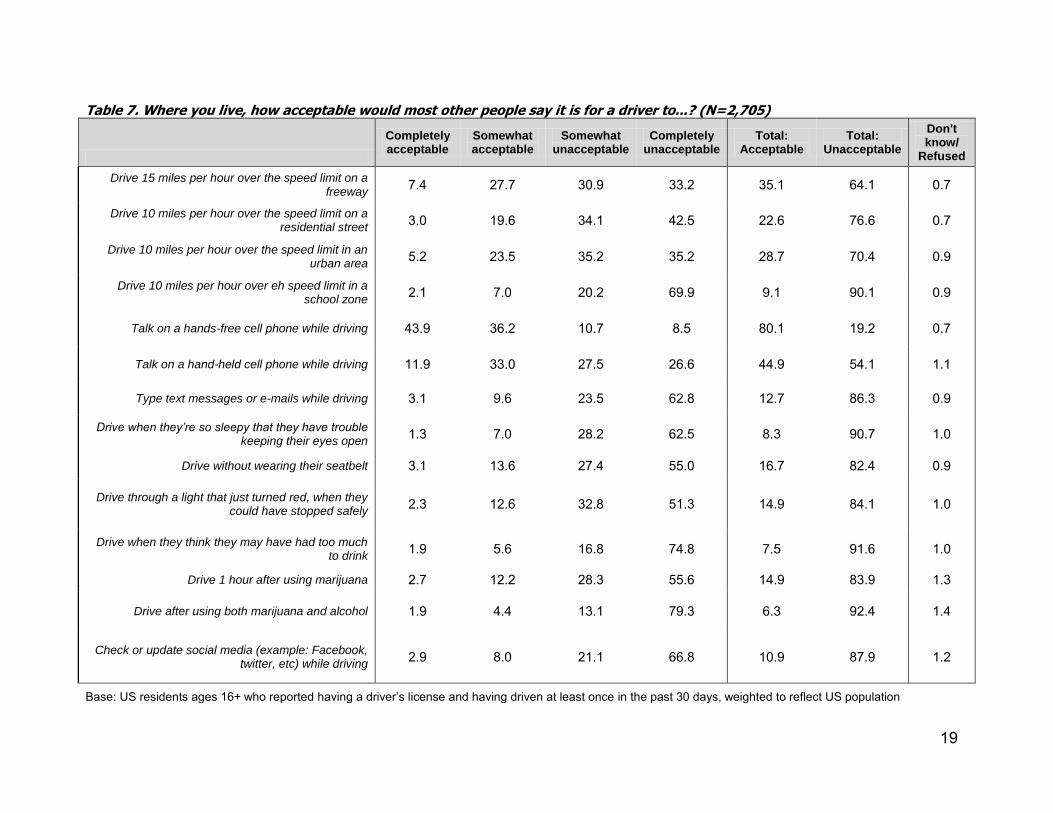
Table 7. Where you live, how acceptable would most other people say it is for a driver to...? (N=2,705)
Completely acceptable
Somewhat acceptable
Somewhat unacceptable
Completely unacceptable
Total: Acceptable
Total: Unacceptable
Don't know/
Refused
Drive 15 miles per hour over the speed limit on a freeway
7.4 27.7 30.9 33.2 35.1 64.1 0.7
Drive 10 miles per hour over the speed limit on a residential street
3.0 19.6 34.1 42.5 22.6 76.6 0.7
Drive 10 miles per hour over the speed limit in an urban area
5.2 23.5 35.2 35.2 28.7 70.4 0.9
Drive 10 miles per hour over eh speed limit in a school zone
2.1 7.0 20.2 69.9 9.1 90.1 0.9
Talk on a hands-free cell phone while driving 43.9 36.2 10.7 8.5 80.1 19.2 0.7
Talk on a hand-held cell phone while driving 11.9 33.0 27.5 26.6 44.9 54.1 1.1
Type text messages or e-mails while driving 3.1 9.6 23.5 62.8 12.7 86.3 0.9
Drive when they’re so sleepy that they have trouble keeping their eyes open
1.3 7.0 28.2 62.5 8.3 90.7 1.0
Drive without wearing their seatbelt 3.1 13.6 27.4 55.0 16.7 82.4 0.9
Drive through a light that just turned red, when they could have stopped safely
2.3 12.6 32.8 51.3 14.9 84.1 1.0
Drive when they think they may have had too much to drink
1.9 5.6 16.8 74.8 7.5 91.6 1.0
Drive 1 hour after using marijuana 2.7 12.2 28.3 55.6 14.9 83.9 1.3
Drive after using both marijuana and alcohol 1.9 4.4 13.1 79.3 6.3 92.4 1.4
Check or update social media (example: Facebook, twitter, etc) while driving
2.9 8.0 21.1 66.8 10.9 87.9 1.2
Base: US residents ages 16+ who reported having a driver’s license and having driven at least once in the past 30 days, weighted to reflect US population

20
Table 8. How acceptable do you, personally, feel it is for a driver to…? (N=2,705)
Completely acceptable
Somewhat acceptable
Somewhat unacceptable
Completely unacceptable
Total: Acceptable
Total: Unacceptable
Don't know/
Refused
Drive 15 miles per hour over the speed limit on a freeway
3.8 18.9 26.1 49.9 22.7 76.0 1.3
Drive 10 miles per hour over the speed limit on a residential street
1.2 7.5 25.6 64.6 8.7 90.2 1.1
Drive 10 miles per hour over the speed limit in an urban area
2.0 12.3 28.5 56.1 14.3 84.6 1.2
Drive 10 miles per hour over the speed limit in a school zone
0.8 2.2 11.3 84.4 3.0 95.7 1.2
Talk on a hands-free cell phone while driving 31.6 33.8 15.8 17.5 65.4 33.3 1.3
Talk on a hand-held cell phone while driving 9.2 23.8 23.5 42.2 33.0 65.7 1.3
Type text messages or e-mails while driving 0.5 2.0 12.0 84.4 2.5 96.4 1.2
Drive when they’re so sleepy that they have trouble keeping their eyes open
0.4 1.8 14.9 81.3 2.2 96.2 1.6
Drive without wearing their seatbelt 3.7 6.9 13.0 75.0 10.6 88.0 1.3
Drive through a light that just turned red, when they could have stopped safely
0.7 3.8 21.3 72.7 4.5 94.0 1.5
Drive when they think they may have had too much to drink
0.4 0.9 6.4 91.0 1.3 97.4 1.2
Drive 1 hour after using marijuana 1.6 5.2 14.4 77.5 6.8 91.9 1.3
Drive after using both marijuana and alcohol 0.4 1.2 5.3 91.7 1.6 97.0 1.3
Check or update social media (example: Facebook, twitter, etc) while driving
0.4 1.3 8.4 88.5 1.7 96.9 1.3
Base: US residents ages 16+ who reported having a driver’s license and having driven at least once in the past 30 days, weighted to reflect US population

21
Table 9. Acceptability of performing distracting tasks while driving by age group and gender, United States, 2014 (N=2,705)
Type text messages or
email Talk on hand-
held cell phone
Talk on a hands-free
phone Check/update social media
(%) (%) (%) (%)
All drivers 2.5 33.1 65.4 1.8
Ag
e g
rou
p
16-18 7.6 34.1 67.7 6.5
19-24 2.5 42.9 62.8 2.0
25-39 5.0 44.7 72.8 3.3
40-59 2.1 34.1 67.2 1.4
60-74 0.2 21.2 58.1 0.3
75+ 0.0 10.0 52.4 0.0 Base: US residents ages 16+ who reported having a driver’s license and having driven at least once in the past 30 days, weighted to reflect US population

22
Table 10. In the past 30 days, how often have you…? (N=2,705)
Regularly Fairly often
Rarely Just once Never Total: Any
Fairly often/
Regularly
Don't know/
Refused
Driven 15 miles per hour over the speed limit on a freeway 3.2 10.9 27.0 5.0 53.7 46.1 14.1 0.3
Driven 10 miles per hour over the speed limit on a residential street 1.6 7.7 28.1 6.1 56.0 43.5 9.3 0.5
Read a text message or e-mail while you were driving 1.2 7.4 20.7 6.8 63.6 36.1 8.6 0.4
Typed or sent a text message or e-mail while you were driving 1.1 4.1 16.8 5.1 72.2 27.1 5.2 0.6
Driven without wearing your seatbelt 2.4 3.3 9.2 3.0 81.7 17.9 5.7 0.4
Driven when you were so tired that you had a hard time keeping your eyes open
0.3 2.1 17.4 9.6 70.2 29.4 2.4 0.5
Driven through a light that had just turned red when you could have stopped safely
0.5 1.5 20.7 12.9 64.0 35.6 2.0 0.4
Talked on a cell phone while you were driving (any type of phone) 9.4 19.7 32.5 7.6 30.6 69.2 29.1 0.3
Used the internet (example: Facebook, twitter, other apps and websites, etc.) while you were driving
1.6 2.4 9.7 3.6 82.4 17.3 4.0 0.3
Base: US residents ages 16+ who reported having a driver’s license and having driven at least once in the past 30 days, weighted to reflect US population

23
Table 11. Behaviors reported at least once while driving in past 30 days by age group and gender, United States, 2014 (N=2,705)
Read text message or
Typed/sent text message
or email
Talked on a cell phone of
any kind Used the internet
(%) (%) (%) (%)
All drivers 36.0 27.2 69.1 17.3
Ag
e g
rou
p
16-18 34.7 27.4 55.7 17.6
19-24 50.3 41.3 72.4 22.4
25-39 53.7 45.8 78.7 32.8
40-59 40.2 28.3 74.7 16.8
60-74 12.6 6.1 58.5 3.1
75+ 6.1 4.6 38.6 2.6
Base: US residents ages 16+ who reported having a driver’s license and having driven at least once in the past 30 days, weighted to reflect US population

24
Table 12. How strongly do you support or oppose…?
Support strongly
Support somewhat
Oppose somewhat
Oppose strongly
Support (strongly
or somewhat)
Oppose (strongly
or somewhat)
N
(%) (%) (%) (%) (%) (%) (%)
Having a law against reading, typing, or sending a text message
or email while driving 68.2 21.1 7.4 2.0 89.3 9.4 2,705
Having a law against using a hand-held cell phone while driving, for all
drivers regardless of their age 40.5 27.3 21.8 9.0 67.8 30.8 2,705
Having a law against using any type of cell phone while driving, hand-held or hands-free, for all drivers regardless of their age
20.3 19.9 33.0 25.6 40.2 58.6 2,705
Having a law requiring all drivers who have been convicted of DWI to use a device that won’t let their car
start if they have been drinking, even if it’s their first time being
convicted of DWI
51.1 29.1 13.9 4.7 80.2 18.6 2,705
Requiring all new cars to have a built-in technology that won’t let the car start if the driver’s alcohol level
is over the legal limit
45.0 27.8 14.9 11.0 72.8 25.9 2,705
Using cameras to automatically ticket drivers who drive more than
10 mph over the speed limit on freeways
13.8 22.0 27.2 35.9 35.8 63.1 1,031
Using cameras to automatically ticket drivers who drive more than
10 mph over the speed limit on residential streets
19.2 23.0 26.9 29.4 42.2 56.3 991
Using cameras to automatically ticket drivers who drive more than
10 mph over the speed limit in urban areas
13.5 24.2 29.3 31.7 37.7 61.0 1,050
Using cameras to automatically ticket drivers who drive more than
10 mph over the speed limit in school zones
31.3 24.1 18.9 25.0 55.4 43.9 1,033
Using cameras to automatically ticket drivers who run red lights in
urban areas 27.8 26.8 20.3 23.9 54.6 44.2 969
Using cameras to automatically ticket drivers who run red lights on
residential streets 25.4 27.9 22.1 23.6 53.3 45.7 1,006
Requiring all new drivers younger than 18 to take a state-approved drivers education course before
getting a license
60.3 29.3 6.8 2.8 89.6 9.6 1,006
Requiring all new drivers (regardless of age) to take a state-approved drivers education course
before getting a license
52.8 29.8 11.9 4.5 82.6 16.4 1,029

25
Requiring all drivers age 85 and older to renew their license in-person (not by mail or online)
55.0 32.4 8.9 3.0 87.4 11.9 1,626
Requiring all drivers age 85 and older to pass a simple screening test, for health problems that can
affect their driving, when they renew their license
50.6 36.9 8.2 2.9 87.5 11.1 1,527
Requiring all states to publish maps that show the locations of motor
vehicle accidents in which people were seriously injured or killed
each year
20.6 40.5 27.3 10.2 61.1 37.5 2,705
Having a law requiring all motorcycle riders to wear a helmet
62.2 19.9 9.9 6.8 82.1 16.7 2,705
Having the federal government regulate non-driving-related
technologies in cars to make sure they don’t distract drivers
19.7 28.5 27.2 23.2 48.2 50.4 2,705
Having a law making it illegal to drive with more than a certain
amount of marijuana in your system
61.0 24.3 9.0 4.7 85.3 13.7 2,705
Lowering the limit for a driver's blood alcohol concentration from
0.08 to 0.05 g/dL a 30.7 32.7 19.7 16.1 63.4 35.8 2,705
Applying restrictions (such as night driving or passenger restrictions) to all new drivers for a period of time,
regardless of age b
28.0 38.4 23.4 9.6 66.3 33.0 2,705
Having a law requiring drivers to take special actions (for example: reduce speed or move to another
lane) when passing an emergency vehicle stopped on the side of the
road c
63.5 29.4 4.8 1.8 92.9 6.6 2,705
Your state adopting a vision to reduce the number of people killed
in accidents to zero d
50.5 35.4 8.6 4.2 86.0 12.8 2,705
Base: US residents ages 16+ who reported having a driver’s license and having driven at least once in the past 30 days, weighted to reflect US population Note: Columns do not sum to 100 because refusals are not shown. The proportion that refused to respond was 1.5 percent or smaller for all questions.
These items were asked in separate questions as follows:
a “In the United States, the legal limit for a driver’s blood alcohol concentration (a measure of the amount of alcohol in a person’s
blood) is 0.08 grams of alcohol per deciliter of blood. In Australia, France, Italy, Spain, and several other countries, the limit is 0.05. How strongly do you support or oppose lowering the limit in the United States from 0.08 to 0.05?”
b “In most states, when a new driver gets their first license that allows them to drive by themselves, the license has some restrictions
(for example: not allowed to drive late at night, not allowed to carry passengers) for the first several months of licensed driving. In most states, these restrictions only apply to new drivers younger than 18. How strongly would you support or oppose applying some restrictions to all new drivers, regardless of their age?”
c “How strongly do you support or oppose having a law that requires drivers to take special actions (for example: reduce speed or
move to another lane) when passing an emergency vehicle stopped on the side of the road?”
d “The governments in some states have adopted a vision that in the future, no people will be killed in car accidents in their state. How
strongly do you support or oppose your state adopting a vision to reduce the number of people killed in accidents to zero?”

26
Table 13. Support for distracted driving laws & regulation by age group and gender, United States, 2014 (N=2,705)
Text message/Email
ban Hand-held cell
phone ban All cell phone
ban
Federal gov't. regulation of non-driving
technologies in cars
(%) (%) (%) (%)
All drivers 89.3 67.8 40.1 48.2
Ag
e g
rou
p
16-18 85.8 65.2 41.5 47.4
19-24 85.4 54.4 31.7 41.9
25-39 83.5 57.9 28.2 43.1
40-59 89.8 66.8 39.1 47.1
60-74 94.7 79.6 52.5 54.4
75+ 96.2 89.5 59.6 61.3 Base: US residents ages 16+ who reported having a driver’s license and having driven at least once in the past 30 days, weighted to reflect US population

27
Table 14. When you talk on your cell phone while driving, do you usually hold the phone in your hand, or do you use a hands-free device? (N=1,826)
I always hold the phone in
my hand
I usually hold the phone in
my hand
I hold the phone in my hand about
half the time, and use a hands-free
device about half of the
time
I usually use a hands-free
device
I always use a hands-free
device
Don't know/
Refused
All drivers 27.9 16.2 9.6 16.3 29.2 0.8
Ag
e G
rou
p
16-18 32.3 18.2 10.6 21.3 17.6 0.0
19-24 21.2 29.5 10.4 10.8 28.1 0.0
25-39 26.6 15.4 12.6 20.0 24.5 0.9
40-59 27.1 15.8 10.0 15.2 31.5 0.3
60-74 33.0 13.3 5.4 14.0 32.9 1.4
75+ 29.8 13.0 1.8 19.3 31.8 4.3
Base: US residents ages 16+ who reported having a driver’s license and having driven at least once in the past 30 days, weighted to reflect US population

28
Table 15. In the past year, how often have you driven when you thought your alcohol level might have been close to or possibly over the legal limit? (N=2,705)
Regularly Fairly often Rarely Just once
Not in the past year
(%) (%) (%) (%) (%)
All drivers 0.4 1.1 6.7 4.1 87.7
Ag
e g
rou
p
16-18 0.0 0.5 0.8 1.2 97.6
19-24 0.4 2.4 4.4 1.7 91.1
25-39 0.5 1.2 8.1 6.4 83.9
40-59 0.6 1.0 8.7 5.1 84.7
60-74 0.2 1.3 3.3 1.6 93.7
75+ 0.0 0.0 8.2 1.8 90.0
Base: US residents ages 16+ who reported having a driver’s license and having driven at least once in the past 30 days, weighted to reflect US population

29
Table 16. About how long ago was the last time you drove when you thought your alcohol level might have been close to or possibly over the legal limit? (N=2,705)
Within the past month
At least 1 month ago,
but less than 3
months ago
At least 3 months ago, but
less than 6 months ago
6 months or longer ago
Not in the past year
Don’t know/ Refused
(%) (%) (%) (%) (%) (%)
All drivers 2.4 2.4 2.8 4.7 87.7 0.1
Ag
e g
rou
p
16-18 0.0 0.5 1.2 0.8 97.6 0.0
19-24 2.6 1.9 3.0 0.4 91.1 1.0
25-39 3.7 2.6 4.5 5.4 83.9 0.0
40-59 2.3 3.2 3.0 6.6 84.7 0.2
60-74 2.0 1.5 1.4 1.5 93.7 0.0
75+ 0.0 1.6 0.4 8.1 90.0 0.0 Base: US residents ages 16+ who reported having a driver’s license and having driven at least once in the past 30 days, weighted to reflect US population

30
Table 17. Compared to holding a cell phone in your hand and talking while you were driving, how safe or dangerous do you think it is to talk while driving using a hands-free device? (N=2,705)
Hands-free device is
much safer
Hands-free device is
somewhat safer
They are about the
same
Hands-free device is
somewhat more
dangerous
Hands-free device is
much more dangerous
Don't know/ Refused
(%) (%) (%) (%) (%) (%)
All drivers 29.0 45.6 23.1 1.2 0.6 0.5
Age g
rou
p
16-18 27.9 48.4 22.6 0.7 0.5 0.0
19-24 33.8 43.0 22.5 0.0 0.0 0.7
25-39 29.4 49.0 19.7 1.2 0.0 0.7
40-59 29.4 41.9 26.4 1.0 0.8 0.5
60-74 25.6 50.6 21.7 1.6 0.3 0.2
75+ 32.9 39.1 22.0 2.8 3.3 0.0
Base: US residents ages 16+ who reported having a driver’s license and having driven at least once in the past 30 days, weighted to reflect US population

31
Table 18. Driver Characteristics (Column percent weighted to reflect U.S. resident population ages 16+, unweighted N)
Type of Vehicle Driven Most Often % N
Car 58.7 1,565
Van / Minivan 8.6 222
Pickup Truck 12.0 329
SUV 18.3 532
Other 1.8 39
Motorcycle 0.2 7
Don't know / Refused 0.4 11
Number of Times Stopped by Police for Moving Violation in Past 2 Years
0 84.0 2,284
1 12.6 336
2+ 2.7 71
Don't know / Refused 0.8 14
Number of Tickets for Moving Violations in Past 2 Years
0 89.3 2,434
1 8.3 208
2+ 1.7 45
Don't know / Refused 0.7 18
Number of Accidents while Driving in Past 2 Years
0 88.4 2,379
1 9.7 271
2+ 1.2 39
Don't know / Refused 0.6 16 Base: US residents ages 16+ who reported having a driver’s license and having driven at least once in the past 30 days, weighted to reflect US population

32
Table 19. Sample Characteristics (Column percent weighted to reflect U.S. resident population ages 16+, unweighted N)
Drivers All Respondents
(N=2,705) (N=3,494)
% N % N
Age Group
16-18 3.7 514 5.4 963
19-24 7.1 111 9.5 182
25-39 24.1 452 25.4 550
40-59 37.6 1017 34.2 1112
60-74 21.5 478 19.6 528
75+ 6.0 133 5.9 159
Gender
Male 50.0 1,335 48.4 1,706
Female 50.0 1,370 51.6 1,788
Race/Ethnicity
Non-Hispanic White 70.4 2,032 65.5 2,424
Non-Hispanic Black 9.7 195 11.2 286
Other Race/Multiple Races 7.2 170 7.8 247
Hispanic (Any race) 12.7 308 15.5 537
Language of Interview
English 95.5 2,602 93.6 3,270
Spanish 4.5 103 6.4 224
Type of Community
Country 13.5 368 12.7 438
Small Town 20.4 592 20.0 724
Medium-Sized Town 18.6 512 18.0 661
Small City 22.7 619 21.9 795
Large City 24.3 604 26.0 836
Unknown 0.5 10 1.4 40
Region
Northeast 17.3 515 18.3 687
Midwest 22.9 666 21.5 803
South 37.7 915 36.6 1,166
West 22.2 609 23.6 838
Ever Involved in Serious Motor Vehicle Accident
Yes 18.6 492 17.4 571
No 80.6 2,197 80.9 2,878
Don’t know / Refused 0.8 16 1.7 45

33
Ever Seriously Injured in Motor Vehicle Accident
Yes 10.3 267 10.1 319
No 89.2 2,422 88.4 3,124
Don’t know / Refused 0.5 16 1.5 51
Friend or Relative Ever Seriously Injured or Killed in Motor Vehicle
Accident
Yes 28.6 787 28.3 993
No 70.8 1,905 70.4 2,462
Don’t know / Refused 0.6 13 1.4 39

34
Appendix B: Selected State Data Tables
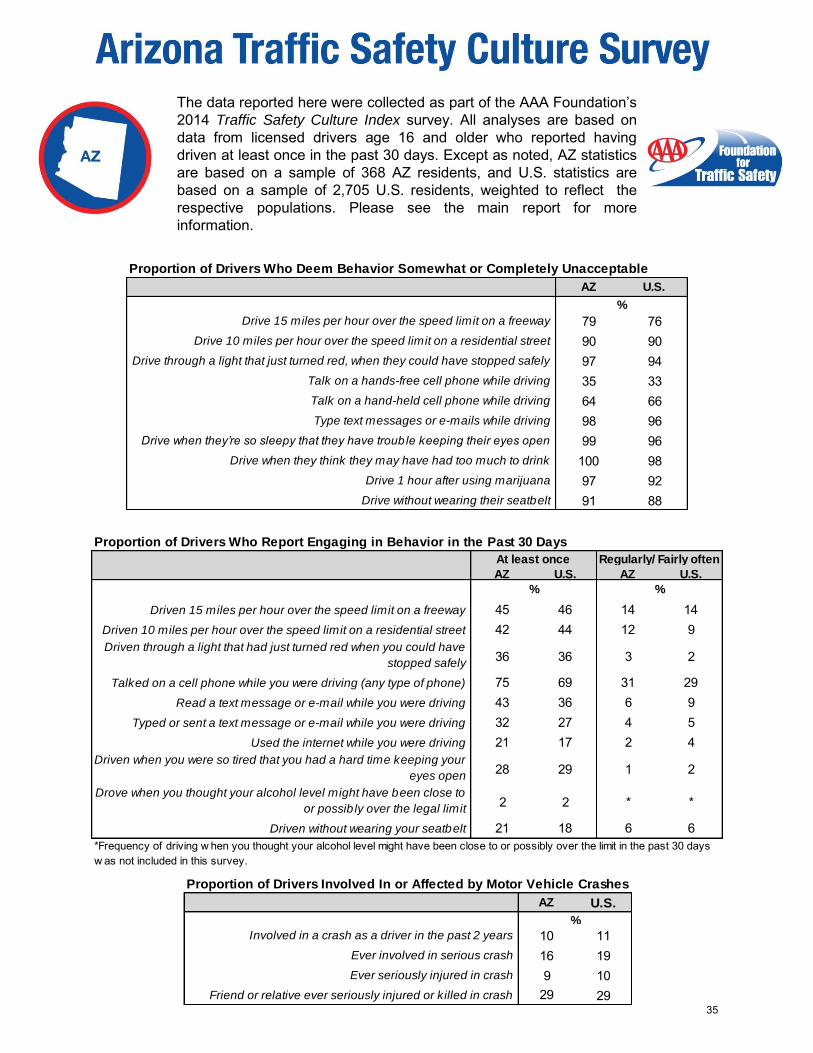
The data reported here were collected as part of the AAA Foundation’s
2014 Traffic Safety Culture Index survey. All analyses are based on
data from licensed drivers age 16 and older who reported having
driven at least once in the past 30 days. Except as noted, AZ statistics
are based on a sample of 368 AZ residents, and U.S. statistics are
based on a sample of 2,705 U.S. residents, weighted to reflect the
respective populations. Please see the main report for more
information.
AZ U.S.
Drive 15 miles per hour over the speed limit on a freeway 79 76
Drive 10 miles per hour over the speed limit on a residential street 90 90
Drive through a light that just turned red, when they could have stopped safely 97 94
Talk on a hands-free cell phone while driving 35 33
Talk on a hand-held cell phone while driving 64 66
Type text messages or e-mails while driving 98 96
Drive when they’re so sleepy that they have trouble keeping their eyes open 99 96
Drive when they think they may have had too much to drink 100 98
Drive 1 hour after using marijuana 97 92
Drive without wearing their seatbelt 91 88
Proportion of Drivers Who Deem Behavior Somewhat or Completely Unacceptable
%
AZ U.S. AZ U.S.
Driven 15 miles per hour over the speed limit on a freeway 45 46 14 14
Driven 10 miles per hour over the speed limit on a residential street 42 44 12 9
Driven through a light that had just turned red when you could have
stopped safely36 36 3 2
Talked on a cell phone while you were driving (any type of phone) 75 69 31 29
Read a text message or e-mail while you were driving 43 36 6 9
Typed or sent a text message or e-mail while you were driving 32 27 4 5
Used the internet while you were driving 21 17 2 4
Driven when you were so tired that you had a hard time keeping your
eyes open28 29 1 2
Drove when you thought your alcohol level might have been close to
or possib ly over the legal limit2 2 * *
Driven without wearing your seatbelt 21 18 6 6
*Frequency of driving w hen you thought your alcohol level might have been close to or possibly over the limit in the past 30 days
w as not included in this survey.
Proportion of Drivers Who Report Engaging in Behavior in the Past 30 Days
At least once Regularly/ Fairly often
%%
AZ U.S.
Involved in a crash as a driver in the past 2 years 10 11
Ever involved in serious crash 16 19
Ever seriously injured in crash 9 10
Friend or relative ever seriously injured or killed in crash 29 29
Proportion of Drivers Involved In or Affected by Motor Vehicle Crashes
%
35
2014 AZ Traffic Safety Culture Survey AAA Foundation for Traffic Safety
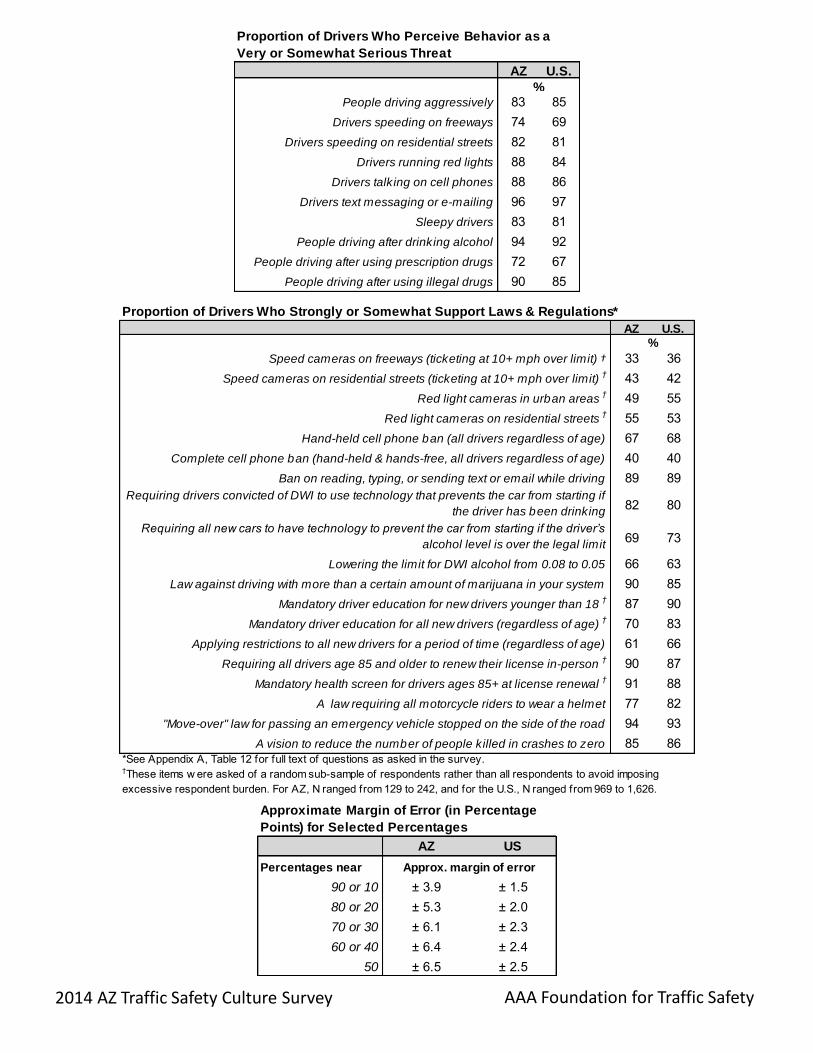
AZ U.S.
People driving aggressively 83 85
Drivers speeding on freeways 74 69
Drivers speeding on residential streets 82 81
Drivers running red lights 88 84
Drivers talking on cell phones 88 86
Drivers text messaging or e-mailing 96 97
Sleepy drivers 83 81
People driving after drinking alcohol 94 92
People driving after using prescription drugs 72 67
People driving after using illegal drugs 90 85
%
Proportion of Drivers Who Perceive Behavior as a
Very or Somewhat Serious Threat
AZ US
Percentages near
90 or 10 ± 3.9 ± 1.5
80 or 20 ± 5.3 ± 2.0
70 or 30 ± 6.1 ± 2.3
60 or 40 ± 6.4 ± 2.4
50 ± 6.5 ± 2.5
Approximate Margin of Error (in Percentage
Points) for Selected Percentages
Approx. margin of error
AZ U.S.
Speed cameras on freeways (ticketing at 10+ mph over limit) † 33 36
Speed cameras on residential streets (ticketing at 10+ mph over limit)† 43 42
Red light cameras in urban areas† 49 55
Red light cameras on residential streets† 55 53
Hand-held cell phone ban (all drivers regardless of age) 67 68
Complete cell phone ban (hand-held & hands-free, all drivers regardless of age) 40 40
Ban on reading, typing, or sending text or email while driving 89 89
Requiring drivers convicted of DWI to use technology that prevents the car from starting if
the driver has been drinking82 80
Requiring all new cars to have technology to prevent the car from starting if the driver’s
alcohol level is over the legal limit69 73
Lowering the limit for DWI alcohol from 0.08 to 0.05 66 63
Law against driving with more than a certain amount of marijuana in your system 90 85
Mandatory driver education for new drivers younger than 18† 87 90
Mandatory driver education for all new drivers (regardless of age)† 70 83
Applying restrictions to all new drivers for a period of time (regardless of age) 61 66
Requiring all drivers age 85 and older to renew their license in-person† 90 87
Mandatory health screen for drivers ages 85+ at license renewal† 91 88
A law requiring all motorcycle riders to wear a helmet 77 82
"Move-over" law for passing an emergency vehicle stopped on the side of the road 94 93
A vision to reduce the number of people killed in crashes to zero 85 86*See Appendix A, Table 12 for full text of questions as asked in the survey.†These items w ere asked of a random sub-sample of respondents rather than all respondents to avoid imposing
excessive respondent burden. For AZ, N ranged from 129 to 242, and for the U.S., N ranged from 969 to 1,626.
Proportion of Drivers Who Strongly or Somewhat Support Laws & Regulations*
%

The data reported here were collected as part of the AAA Foundation’s
2014 Traffic Safety Culture Index survey. All analyses are based on
data from licensed drivers age 16 and older who reported having
driven at least once in the past 30 days. Except as noted, CA statistics
are based on a sample of 384 CA residents, and U.S. statistics are
based on a sample of 2,705 U.S. residents, weighted to reflect the
respective populations. Please see the main report for more
information.
CA U.S. CA U.S.
Driven 15 miles per hour over the speed limit on a freeway 51 46 12 14
Driven 10 miles per hour over the speed limit on a residential street 44 44 8 9
Driven through a light that had just turned red when you could have
stopped safely29 36 1 2
Talked on a cell phone while you were driving (any type of phone) 61 69 27 29
Read a text message or e-mail while you were driving 34 36 8 9
Typed or sent a text message or e-mail while you were driving 27 27 5 5
Used the internet while you were driving 16 17 2 4
Driven when you were so tired that you had a hard time keeping your
eyes open30 29 3 2
Drove when you thought your alcohol level might have been close to
or possib ly over the legal limit2 2 * *
Driven without wearing your seatbelt 7 18 1 6
*Frequency of driving w hen you thought your alcohol level might have been close to or possibly over the limit in the past 30 days
Proportion of Drivers Who Report Engaging in Behavior in the Past 30 Days
At least once Regularly/ Fairly often
%%
CA U.S.
Drive 15 miles per hour over the speed limit on a freeway 73 76
Drive 10 miles per hour over the speed limit on a residential street 89 90
Drive through a light that just turned red, when they could have stopped safely 95 94
Talk on a hands-free cell phone while driving 36 33
Talk on a hand-held cell phone while driving 85 66
Type text messages or e-mails while driving 95 96
Drive when they’re so sleepy that they have trouble keeping their eyes open 96 96
Drive when they think they may have had too much to drink 94 98
Drive 1 hour after using marijuana 93 92
Drive without wearing their seatbelt 91 88
Proportion of Drivers Who Deem Behavior Somewhat or Completely Unacceptable
%
CA U.S.
Involved in a crash as a driver in the past 2 years 14 11
Ever involved in serious crash 13 19
Ever seriously injured in crash 10 10
Friend or relative ever seriously injured or killed in crash 24 29
Proportion of Drivers Involved In or Affected by Motor Vehicle Crashes
%
37

2014 CA Traffic Safety Culture Survey AAA Foundation for Traffic Safety
CA U.S.
People driving aggressively 88 85
Drivers speeding on freeways 74 69
Drivers speeding on residential streets 86 81
Drivers running red lights 88 84
Drivers talking on cell phones 89 86
Drivers text messaging or e-mailing 96 97
Sleepy drivers 85 81
People driving after drinking alcohol 92 92
People driving after using prescription drugs 73 67
People driving after using illegal drugs 86 85
%
Proportion of Drivers Who Perceive Behavior as a
Very or Somewhat Serious Threat
CA US
Percentages near
90 or 10 ± 3.4 ± 1.5
80 or 20 ± 4.4 ± 2.0
70 or 30 ± 5.1 ± 2.3
60 or 40 ± 5.5 ± 2.4
50 ± 5.7 ± 2.5
Approximate Margin of Error (in Percentage
Points) for Selected Percentages
Approx. margin of error
CA U.S.
Speed cameras on freeways (ticketing at 10+ mph over limit) † 31 36
Speed cameras on residential streets (ticketing at 10+ mph over limit)† 46 42
Red light cameras in urban areas† 53 55
Red light cameras on residential streets† 49 53
Hand-held cell phone ban (all drivers regardless of age) 85 68
Complete cell phone ban (hand-held & hands-free, all drivers regardless of age) 44 40
Ban on reading, typing, or sending text or email while driving 89 89
Requiring drivers convicted of DWI to use technology that prevents the car from starting if
the driver has been drinking81 80
Requiring all new cars to have technology to prevent the car from starting if the driver’s
alcohol level is over the legal limit77 73
Lowering the limit for DWI alcohol from 0.08 to 0.05 65 63
Law against driving with more than a certain amount of marijuana in your system 85 85
Mandatory driver education for new drivers younger than 18† 96 90
Mandatory driver education for all new drivers (regardless of age)† 84 83
Applying restrictions to all new drivers for a period of time (regardless of age) 64 66
Requiring all drivers age 85 and older to renew their license in-person† 83 87
Mandatory health screen for drivers ages 85+ at license renewal† 92 88
A law requiring all motorcycle riders to wear a helmet 88 82
"Move-over" law for passing an emergency vehicle stopped on the side of the road 86 93
A vision to reduce the number of people killed in crashes to zero 84 86*See Appendix A, Table 12 for full text of questions as asked in the survey.†These items w ere asked of a random sub-sample of respondents rather than all respondents to avoid imposing
excessive respondent burden. For CA, N ranged from 132 to 235, and for the U.S., N ranged from 969 to 1,626.
Proportion of Drivers Who Strongly or Somewhat Support Laws & Regulations*
%

The data reported here were collected as part of the AAA Foundation’s
2014 Traffic Safety Culture Index survey. All analyses are based on
data from licensed drivers age 16 and older who reported having
driven at least once in the past 30 days. Except as noted, CO statistics
are based on a sample of 299 CO residents, and U.S. statistics are
based on a sample of 2,705 U.S. residents, weighted to reflect the
respective populations. Please see the main report for more
information.
CO U.S.
Involved in a crash as a driver in the past 2 years 13 11
Ever involved in serious crash 18 19
Ever seriously injured in crash 10 10
Friend or relative ever seriously injured or killed in crash 37 29
Proportion of Drivers Involved In or Affected by Motor Vehicle Crashes
%
CO U.S. CO U.S.
Driven 15 miles per hour over the speed limit on a freeway 47 46 17 14
Driven 10 miles per hour over the speed limit on a residential street 41 44 10 9
Driven through a light that had just turned red when you could have
stopped safely37 36 2 2
Talked on a cell phone while you were driving (any type of phone) 71 69 30 29
Read a text message or e-mail while you were driving 34 36 9 9
Typed or sent a text message or e-mail while you were driving 24 27 8 5
Used the internet while you were driving 16 17 8 4
Driven when you were so tired that you had a hard time keeping your
eyes open23 29 4 2
Drove when you thought your alcohol level might have been close to
or possib ly over the legal limit2 2 * *
Driven without wearing your seatbelt 19 18 4 6
*Frequency of driving w hen you thought your alcohol level might have been close to or possibly over the limit in the past 30 days
w as not included in this survey.
Proportion of Drivers Who Report Engaging in Behavior in the Past 30 Days
At least once Regularly/ Fairly often
%%
CO U.S.
Drive 15 miles per hour over the speed limit on a freeway 75 76
Drive 10 miles per hour over the speed limit on a residential street 91 90
Drive through a light that just turned red, when they could have stopped safely 93 94
Talk on a hands-free cell phone while driving 32 33
Talk on a hand-held cell phone while driving 59 66
Type text messages or e-mails while driving 95 96
Drive when they’re so sleepy that they have trouble keeping their eyes open 97 96
Drive when they think they may have had too much to drink 98 98
Drive 1 hour after using marijuana 92 92
Drive without wearing their seatbelt 88 88
Proportion of Drivers Who Deem Behavior Somewhat or Completely Unacceptable
%
39

2014 CO Traffic Safety Culture Survey AAA Foundation for Traffic Safety
CO US
Percentages near
90 or 10 ± 4.8 ± 1.5
80 or 20 ± 6.1 ± 2.0
70 or 30 ± 6.9 ± 2.3
60 or 40 ± 7.4 ± 2.4
50 ± 7.6 ± 2.5
Approximate Margin of Error (in Percentage
Points) for Selected Percentages
Approx. margin of error
CO U.S.
People driving aggressively 89 85
Drivers speeding on freeways 65 69
Drivers speeding on residential streets 82 81
Drivers running red lights 85 84
Drivers talking on cell phones 86 86
Drivers text messaging or e-mailing 98 97
Sleepy drivers 83 81
People driving after drinking alcohol 91 92
People driving after using prescription drugs 66 67
People driving after using illegal drugs 87 85
%
Proportion of Drivers Who Perceive Behavior as a
Very or Somewhat Serious Threat
CO U.S.
Speed cameras on freeways (ticketing at 10+ mph over limit) † 27 36
Speed cameras on residential streets (ticketing at 10+ mph over limit)† 42 42
Red light cameras in urban areas† 47 55
Red light cameras on residential streets† 43 53
Hand-held cell phone ban (all drivers regardless of age) 62 68
Complete cell phone ban (hand-held & hands-free, all drivers regardless of age) 35 40
Ban on reading, typing, or sending text or email while driving 93 89
Requiring drivers convicted of DWI to use technology that prevents the car from starting if
the driver has been drinking75 80
Requiring all new cars to have technology to prevent the car from starting if the driver’s
alcohol level is over the legal limit65 73
Lowering the limit for DWI alcohol from 0.08 to 0.05 57 63
Law against driving with more than a certain amount of marijuana in your system 89 85
Mandatory driver education for new drivers younger than 18† 88 90
Mandatory driver education for all new drivers (regardless of age)† 78 83
Applying restrictions to all new drivers for a period of time (regardless of age) 69 66
Requiring all drivers age 85 and older to renew their license in-person† 86 87
Mandatory health screen for drivers ages 85+ at license renewal† 91 88
A law requiring all motorcycle riders to wear a helmet 75 82
"Move-over" law for passing an emergency vehicle stopped on the side of the road 96 93
A vision to reduce the number of people killed in crashes to zero 85 86*See Appendix A, Table 12 for full text of questions as asked in the survey.†These items w ere asked of a random sub-sample of respondents rather than all respondents to avoid imposing
excessive respondent burden. For CO, N ranged from 100 to 192, and for the U.S., N ranged from 969 to 1,626.
Proportion of Drivers Who Strongly or Somewhat Support Laws & Regulations*
%

The data reported here were collected as part of the AAA Foundation’s
2014 Traffic Safety Culture Index survey. All analyses are based on
data from licensed drivers age 16 and older who reported having
driven at least once in the past 30 days. Except as noted, FL statistics
are based on a sample of 372 FL residents, and U.S. statistics are
based on a sample of 2,705 U.S. residents, weighted to reflect the
respective populations. Please see the main report for more
information.
FL U.S.
Drive 15 miles per hour over the speed limit on a freeway 74 76
Drive 10 miles per hour over the speed limit on a residential street 88 90
Drive through a light that just turned red, when they could have stopped safely 96 94
Talk on a hands-free cell phone while driving 31 33
Talk on a hand-held cell phone while driving 60 66
Type text messages or e-mails while driving 96 96
Drive when they’re so sleepy that they have trouble keeping their eyes open 98 96
Drive when they think they may have had too much to drink 97 98
Drive 1 hour after using marijuana 90 92
Drive without wearing their seatbelt 91 88
Proportion of Drivers Who Deem Behavior Somewhat or Completely Unacceptable
%
FL U.S. FL U.S.
Driven 15 miles per hour over the speed limit on a freeway 44 46 13 14
Driven 10 miles per hour over the speed limit on a residential street 46 44 10 9
Driven through a light that had just turned red when you could have
stopped safely33 36 1 2
Talked on a cell phone while you were driving (any type of phone) 71 69 32 29
Read a text message or e-mail while you were driving 37 36 5 9
Typed or sent a text message or e-mail while you were driving 27 27 4 5
Used the internet while you were driving 22 17 4 4
Driven when you were so tired that you had a hard time keeping your
eyes open27 29 2 2
Drove when you thought your alcohol level might have been close to
or possib ly over the legal limit3 2 * *
Driven without wearing your seatbelt 14 18 5 6
*Frequency of driving w hen you thought your alcohol level might have been close to or possibly over the limit in the past 30 days
w as not included in this survey.
Proportion of Drivers Who Report Engaging in Behavior in the Past 30 Days
At least once Regularly/ Fairly often
%%
FL U.S.
Involved in a crash as a driver in the past 2 years 11 11
Ever involved in serious crash 17 19
Ever seriously injured in crash 11 10
Friend or relative ever seriously injured or killed in crash 32 29
Proportion of Drivers Involved In or Affected by Motor Vehicle Crashes
%
41

2014 FL Traffic Safety Culture Survey AAA Foundation for Traffic Safety
FL US
Percentages near
90 or 10 ± 3.6 ± 1.5
80 or 20 ± 4.6 ± 2.0
70 or 30 ± 5.3 ± 2.3
60 or 40 ± 5.6 ± 2.4
50 ± 5.6 ± 2.5
Approximate Margin of Error (in Percentage
Points) for Selected Percentages
Approx. margin of error
FL U.S.
People driving aggressively 90 85
Drivers speeding on freeways 75 69
Drivers speeding on residential streets 85 81
Drivers running red lights 91 84
Drivers talking on cell phones 85 86
Drivers text messaging or e-mailing 96 97
Sleepy drivers 82 81
People driving after drinking alcohol 92 92
People driving after using prescription drugs 74 67
People driving after using illegal drugs 86 85
%
Proportion of Drivers Who Perceive Behavior as a
Very or Somewhat Serious Threat
FL U.S.
Speed cameras on freeways (ticketing at 10+ mph over limit) † 29 36
Speed cameras on residential streets (ticketing at 10+ mph over limit)† 51 42
Red light cameras in urban areas† 54 55
Red light cameras on residential streets† 61 53
Hand-held cell phone ban (all drivers regardless of age) 63 68
Complete cell phone ban (hand-held & hands-free, all drivers regardless of age) 37 40
Ban on reading, typing, or sending text or email while driving 88 89
Requiring drivers convicted of DWI to use technology that prevents the car from starting if
the driver has been drinking82 80
Requiring all new cars to have technology to prevent the car from starting if the driver’s
alcohol level is over the legal limit77 73
Lowering the limit for DWI alcohol from 0.08 to 0.05 60 63
Law against driving with more than a certain amount of marijuana in your system 80 85
Mandatory driver education for new drivers younger than 18† 91 90
Mandatory driver education for all new drivers (regardless of age)† 79 83
Applying restrictions to all new drivers for a period of time (regardless of age) 62 66
Requiring all drivers age 85 and older to renew their license in-person† 89 87
Mandatory health screen for drivers ages 85+ at license renewal† 92 88
A law requiring all motorcycle riders to wear a helmet 83 82
"Move-over" law for passing an emergency vehicle stopped on the side of the road 93 93
A vision to reduce the number of people killed in crashes to zero 88 86*See Appendix A, Table 12 for full text of questions as asked in the survey.†These items w ere asked of a random sub-sample of respondents rather than all respondents to avoid imposing
excessive respondent burden. For FL, N ranged from 127 to 242, and for the U.S., N ranged from 969 to 1,626.
Proportion of Drivers Who Strongly or Somewhat Support Laws & Regulations*
%
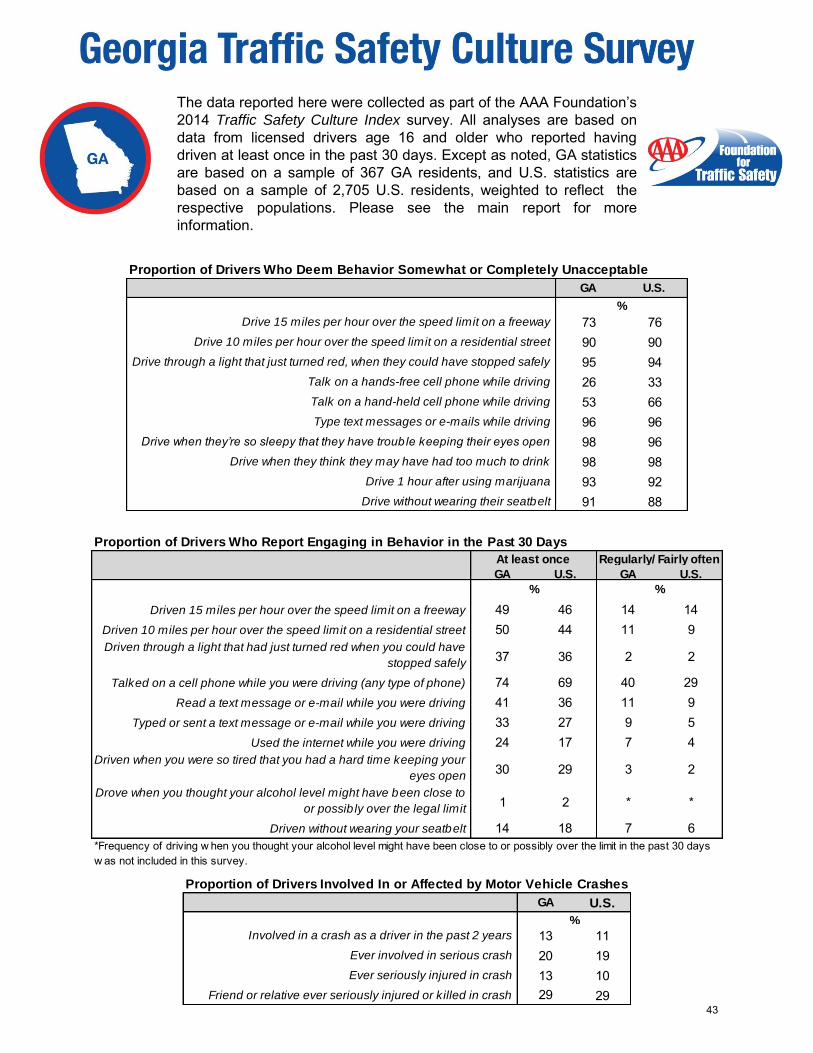
The data reported here were collected as part of the AAA Foundation’s
2014 Traffic Safety Culture Index survey. All analyses are based on
data from licensed drivers age 16 and older who reported having
driven at least once in the past 30 days. Except as noted, GA statistics
are based on a sample of 367 GA residents, and U.S. statistics are
based on a sample of 2,705 U.S. residents, weighted to reflect the
respective populations. Please see the main report for more
information.
GA U.S. GA U.S.
Driven 15 miles per hour over the speed limit on a freeway 49 46 14 14
Driven 10 miles per hour over the speed limit on a residential street 50 44 11 9
Driven through a light that had just turned red when you could have
stopped safely37 36 2 2
Talked on a cell phone while you were driving (any type of phone) 74 69 40 29
Read a text message or e-mail while you were driving 41 36 11 9
Typed or sent a text message or e-mail while you were driving 33 27 9 5
Used the internet while you were driving 24 17 7 4
Driven when you were so tired that you had a hard time keeping your
eyes open30 29 3 2
Drove when you thought your alcohol level might have been close to
or possib ly over the legal limit1 2 * *
Driven without wearing your seatbelt 14 18 7 6
*Frequency of driving w hen you thought your alcohol level might have been close to or possibly over the limit in the past 30 days
w as not included in this survey.
Proportion of Drivers Who Report Engaging in Behavior in the Past 30 Days
At least once Regularly/ Fairly often
%%
GA U.S.
Drive 15 miles per hour over the speed limit on a freeway 73 76
Drive 10 miles per hour over the speed limit on a residential street 90 90
Drive through a light that just turned red, when they could have stopped safely 95 94
Talk on a hands-free cell phone while driving 26 33
Talk on a hand-held cell phone while driving 53 66
Type text messages or e-mails while driving 96 96
Drive when they’re so sleepy that they have trouble keeping their eyes open 98 96
Drive when they think they may have had too much to drink 98 98
Drive 1 hour after using marijuana 93 92
Drive without wearing their seatbelt 91 88
Proportion of Drivers Who Deem Behavior Somewhat or Completely Unacceptable
%
GA U.S.
Involved in a crash as a driver in the past 2 years 13 11
Ever involved in serious crash 20 19
Ever seriously injured in crash 13 10
Friend or relative ever seriously injured or killed in crash 29 29
Proportion of Drivers Involved In or Affected by Motor Vehicle Crashes
%
43

2014 GA Traffic Safety Culture Survey AAA Foundation for Traffic Safety
GA U.S.
People driving aggressively 89 85
Drivers speeding on freeways 70 69
Drivers speeding on residential streets 85 81
Drivers running red lights 88 84
Drivers talking on cell phones 84 86
Drivers text messaging or e-mailing 97 97
Sleepy drivers 83 81
People driving after drinking alcohol 93 92
People driving after using prescription drugs 75 67
People driving after using illegal drugs 90 85
%
Proportion of Drivers Who Perceive Behavior as a
Very or Somewhat Serious Threat
GA US
Percentages near
90 or 10 ± 3.3 ± 1.5
80 or 20 ± 4.5 ± 2.0
70 or 30 ± 5.2 ± 2.3
60 or 40 ± 5.6 ± 2.4
50 ± 5.7 ± 2.5
Approximate Margin of Error (in Percentage
Points) for Selected Percentages
Approx. margin of error
GA U.S.
Speed cameras on freeways (ticketing at 10+ mph over limit) † 22 36
Speed cameras on residential streets (ticketing at 10+ mph over limit)† 37 42
Red light cameras in urban areas† 56 55
Red light cameras on residential streets† 61 53
Hand-held cell phone ban (all drivers regardless of age) 58 68
Complete cell phone ban (hand-held & hands-free, all drivers regardless of age) 35 40
Ban on reading, typing, or sending text or email while driving 89 89
Requiring drivers convicted of DWI to use technology that prevents the car from starting if
the driver has been drinking82 80
Requiring all new cars to have technology to prevent the car from starting if the driver’s
alcohol level is over the legal limit77 73
Lowering the limit for DWI alcohol from 0.08 to 0.05 61 63
Law against driving with more than a certain amount of marijuana in your system 82 85
Mandatory driver education for new drivers younger than 18† 93 90
Mandatory driver education for all new drivers (regardless of age)† 83 83
Applying restrictions to all new drivers for a period of time (regardless of age) 66 66
Requiring all drivers age 85 and older to renew their license in-person† 87 87
Mandatory health screen for drivers ages 85+ at license renewal† 85 88
A law requiring all motorcycle riders to wear a helmet 90 82
"Move-over" law for passing an emergency vehicle stopped on the side of the road 95 93
A vision to reduce the number of people killed in crashes to zero 89 86*See Appendix A, Table 12 for full text of questions as asked in the survey.†These items w ere asked of a random sub-sample of respondents rather than all respondents to avoid imposing
excessive respondent burden. For GA, N ranged from 123 to 243, and for the U.S., N ranged from 969 to 1,626.
Proportion of Drivers Who Strongly or Somewhat Support Laws & Regulations*
%

The data reported here were collected as part of the AAA Foundation’s
2014 Traffic Safety Culture Index survey. All analyses are based on
data from licensed drivers age 16 and older who reported having
driven at least once in the past 30 days. Except as noted, IL statistics
are based on a sample of 375 IL residents, and U.S. statistics are
based on a sample of 2,705 U.S. residents, weighted to reflect the
respective populations. Please see the main report for more
information.
IL U.S.
Drive 15 miles per hour over the speed limit on a freeway 68 76
Drive 10 miles per hour over the speed limit on a residential street 89 90
Drive through a light that just turned red, when they could have stopped safely 95 94
Talk on a hands-free cell phone while driving 32 33
Talk on a hand-held cell phone while driving 80 66
Type text messages or e-mails while driving 95 96
Drive when they’re so sleepy that they have trouble keeping their eyes open 96 96
Drive when they think they may have had too much to drink 97 98
Drive 1 hour after using marijuana 92 92
Drive without wearing their seatbelt 90 88
Proportion of Drivers Who Deem Behavior Somewhat or Completely Unacceptable
%
IL U.S. IL U.S.
Driven 15 miles per hour over the speed limit on a freeway 51 46 18 14
Driven 10 miles per hour over the speed limit on a residential street 43 44 7 9
Driven through a light that had just turned red when you could have
stopped safely33 36 1 2
Talked on a cell phone while you were driving (any type of phone) 66 69 29 29
Read a text message or e-mail while you were driving 41 36 7 9
Typed or sent a text message or e-mail while you were driving 30 27 6 5
Used the internet while you were driving 16 17 4 4
Driven when you were so tired that you had a hard time keeping your
eyes open26 29 4 2
Drove when you thought your alcohol level might have been close to
or possib ly over the legal limit3 2 * *
Driven without wearing your seatbelt 15 18 5 6
*Frequency of driving w hen you thought your alcohol level might have been close to or possibly over the limit in the past 30 days
w as not included in this survey.
Proportion of Drivers Who Report Engaging in Behavior in the Past 30 Days
At least once Regularly/ Fairly often
%%
IL U.S.
Involved in a crash as a driver in the past 2 years 10 11
Ever involved in serious crash 21 19
Ever seriously injured in crash 15 10
Friend or relative ever seriously injured or killed in crash 29 29
Proportion of Drivers Involved In or Affected by Motor Vehicle Crashes
%
45

2014 IL Traffic Safety Culture Survey AAA Foundation for Traffic Safety
IL U.S.
People driving aggressively 85 85
Drivers speeding on freeways 67 69
Drivers speeding on residential streets 79 81
Drivers running red lights 86 84
Drivers talking on cell phones 92 86
Drivers text messaging or e-mailing 98 97
Sleepy drivers 83 81
People driving after drinking alcohol 93 92
People driving after using prescription drugs 63 67
People driving after using illegal drugs 87 85
%
Proportion of Drivers Who Perceive Behavior as a
Very or Somewhat Serious Threat
IL US
Percentages near
90 or 10 ± 3.4 ± 1.5
80 or 20 ± 4.6 ± 2.0
70 or 30 ± 5.2 ± 2.3
60 or 40 ± 5.6 ± 2.4
50 ± 5.7 ± 2.5
Approximate Margin of Error (in Percentage
Points) for Selected Percentages
Approx. margin of error
IL U.S.
Speed cameras on freeways (ticketing at 10+ mph over limit) † 28 36
Speed cameras on residential streets (ticketing at 10+ mph over limit)† 40 42
Red light cameras in urban areas† 44 55
Red light cameras on residential streets† 39 53
Hand-held cell phone ban (all drivers regardless of age) 79 68
Complete cell phone ban (hand-held & hands-free, all drivers regardless of age) 39 40
Ban on reading, typing, or sending text or email while driving 86 89
Requiring drivers convicted of DWI to use technology that prevents the car from starting if
the driver has been drinking81 80
Requiring all new cars to have technology to prevent the car from starting if the driver’s
alcohol level is over the legal limit74 73
Lowering the limit for DWI alcohol from 0.08 to 0.05 68 63
Law against driving with more than a certain amount of marijuana in your system 88 85
Mandatory driver education for new drivers younger than 18† 93 90
Mandatory driver education for all new drivers (regardless of age)† 77 83
Applying restrictions to all new drivers for a period of time (regardless of age) 66 66
Requiring all drivers age 85 and older to renew their license in-person† 87 87
Mandatory health screen for drivers ages 85+ at license renewal† 87 88
A law requiring all motorcycle riders to wear a helmet 79 82
"Move-over" law for passing an emergency vehicle stopped on the side of the road 93 93
A vision to reduce the number of people killed in crashes to zero 88 86*See Appendix A, Table 12 for full text of questions as asked in the survey.
†These items w ere asked of a random sub-sample of respondents rather than all respondents to avoid imposing
excessive respondent burden. For IL, N ranged from 114 to 226, and for the U.S., N ranged from 969 to 1,626.
Proportion of Drivers Who Strongly or Somewhat Support Laws & Regulations*
%

The data reported here were collected as part of the AAA Foundation’s
2014 Traffic Safety Culture Index survey. All analyses are based on
data from licensed drivers age 16 and older who reported having
driven at least once in the past 30 days. Except as noted, IN statistics
are based on a sample of 394 IN residents, and U.S. statistics are
based on a sample of 2,705 U.S. residents, weighted to reflect the
respective populations. Please see the main report for more
information.
IN U.S.
Drive 15 miles per hour over the speed limit on a freeway 78 76
Drive 10 miles per hour over the speed limit on a residential street 90 90
Drive through a light that just turned red, when they could have stopped safely 92 94
Talk on a hands-free cell phone while driving 29 33
Talk on a hand-held cell phone while driving 50 66
Type text messages or e-mails while driving 97 96
Drive when they’re so sleepy that they have trouble keeping their eyes open 97 96
Drive when they think they may have had too much to drink 99 98
Drive 1 hour after using marijuana 89 92
Drive without wearing their seatbelt 87 88
Proportion of Drivers Who Deem Behavior Somewhat or Completely Unacceptable
%
IN U.S. IN U.S.
Driven 15 miles per hour over the speed limit on a freeway 40 46 8 14
Driven 10 miles per hour over the speed limit on a residential street 42 44 9 9
Driven through a light that had just turned red when you could have
stopped safely41 36 1 2
Talked on a cell phone while you were driving (any type of phone) 74 69 33 29
Read a text message or e-mail while you were driving 37 36 12 9
Typed or sent a text message or e-mail while you were driving 25 27 7 5
Used the internet while you were driving 20 17 5 4
Driven when you were so tired that you had a hard time keeping your
eyes open31 29 2 2
Drove when you thought your alcohol level might have been close to
or possib ly over the legal limit2 2 * *
Driven without wearing your seatbelt 18 18 6 6
*Frequency of driving w hen you thought your alcohol level might have been close to or possibly over the limit in the past 30 days
w as not included in this survey.
Proportion of Drivers Who Report Engaging in Behavior in the Past 30 Days
At least once Regularly/ Fairly often
%%
IN U.S.
Involved in a crash as a driver in the past 2 years 7 11
Ever involved in serious crash 20 19
Ever seriously injured in crash 11 10
Friend or relative ever seriously injured or killed in crash 35 29
Proportion of Drivers Involved In or Affected by Motor Vehicle Crashes
%
47
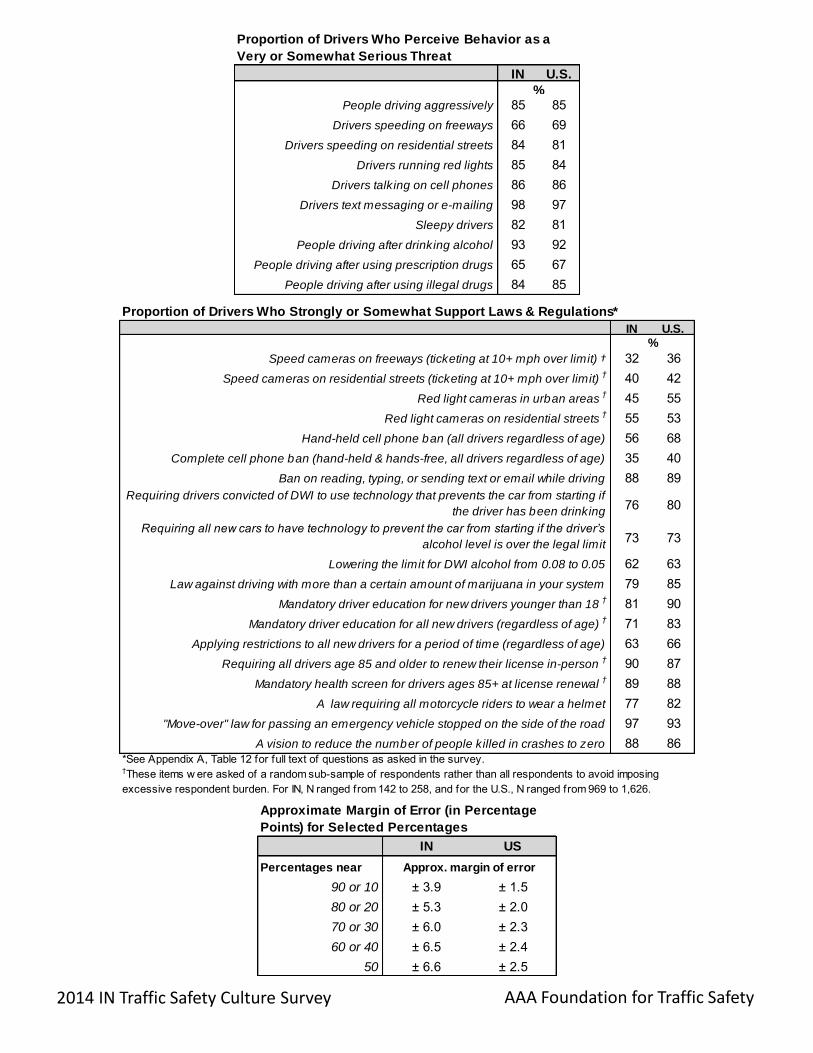
2014 IN Traffic Safety Culture Survey AAA Foundation for Traffic Safety
IN US
Percentages near
90 or 10 ± 3.9 ± 1.5
80 or 20 ± 5.3 ± 2.0
70 or 30 ± 6.0 ± 2.3
60 or 40 ± 6.5 ± 2.4
50 ± 6.6 ± 2.5
Approximate Margin of Error (in Percentage
Points) for Selected Percentages
Approx. margin of error
IN U.S.
People driving aggressively 85 85
Drivers speeding on freeways 66 69
Drivers speeding on residential streets 84 81
Drivers running red lights 85 84
Drivers talking on cell phones 86 86
Drivers text messaging or e-mailing 98 97
Sleepy drivers 82 81
People driving after drinking alcohol 93 92
People driving after using prescription drugs 65 67
People driving after using illegal drugs 84 85
%
Proportion of Drivers Who Perceive Behavior as a
Very or Somewhat Serious Threat
IN U.S.
Speed cameras on freeways (ticketing at 10+ mph over limit) † 32 36
Speed cameras on residential streets (ticketing at 10+ mph over limit)† 40 42
Red light cameras in urban areas† 45 55
Red light cameras on residential streets† 55 53
Hand-held cell phone ban (all drivers regardless of age) 56 68
Complete cell phone ban (hand-held & hands-free, all drivers regardless of age) 35 40
Ban on reading, typing, or sending text or email while driving 88 89
Requiring drivers convicted of DWI to use technology that prevents the car from starting if
the driver has been drinking76 80
Requiring all new cars to have technology to prevent the car from starting if the driver’s
alcohol level is over the legal limit73 73
Lowering the limit for DWI alcohol from 0.08 to 0.05 62 63
Law against driving with more than a certain amount of marijuana in your system 79 85
Mandatory driver education for new drivers younger than 18† 81 90
Mandatory driver education for all new drivers (regardless of age)† 71 83
Applying restrictions to all new drivers for a period of time (regardless of age) 63 66
Requiring all drivers age 85 and older to renew their license in-person† 90 87
Mandatory health screen for drivers ages 85+ at license renewal† 89 88
A law requiring all motorcycle riders to wear a helmet 77 82
"Move-over" law for passing an emergency vehicle stopped on the side of the road 97 93
A vision to reduce the number of people killed in crashes to zero 88 86*See Appendix A, Table 12 for full text of questions as asked in the survey.†These items w ere asked of a random sub-sample of respondents rather than all respondents to avoid imposing
excessive respondent burden. For IN, N ranged from 142 to 258, and for the U.S., N ranged from 969 to 1,626.
Proportion of Drivers Who Strongly or Somewhat Support Laws & Regulations*
%

The data reported here were collected as part of the AAA Foundation’s
2014 Traffic Safety Culture Index survey. All analyses are based on
data from licensed drivers age 16 and older who reported having
driven at least once in the past 30 days. Except as noted, MA statistics
are based on a sample of 350 MA residents, and U.S. statistics are
based on a sample of 2,705 U.S. residents, weighted to reflect the
respective populations. Please see the main report for more
information.
MA U.S.
Drive 15 miles per hour over the speed limit on a freeway 61 76
Drive 10 miles per hour over the speed limit on a residential street 83 90
Drive through a light that just turned red, when they could have stopped safely 91 94
Talk on a hands-free cell phone while driving 31 33
Talk on a hand-held cell phone while driving 60 66
Type text messages or e-mails while driving 97 96
Drive when they’re so sleepy that they have trouble keeping their eyes open 98 96
Drive when they think they may have had too much to drink 97 98
Drive 1 hour after using marijuana 89 92
Drive without wearing their seatbelt 84 88
Proportion of Drivers Who Deem Behavior Somewhat or Completely Unacceptable
%
MA U.S.
Involved in a crash as a driver in the past 2 years 10 11
Ever involved in serious crash 19 19
Ever seriously injured in crash 9 10
Friend or relative ever seriously injured or killed in crash 24 29
Proportion of Drivers Involved In or Affected by Motor Vehicle Crashes
%
MA U.S. MA U.S.
Driven 15 miles per hour over the speed limit on a freeway 68 46 24 14
Driven 10 miles per hour over the speed limit on a residential street 67 44 14 9
Driven through a light that had just turned red when you could have
stopped safely45 36 3 2
Talked on a cell phone while you were driving (any type of phone) 78 69 35 29
Read a text message or e-mail while you were driving 36 36 9 9
Typed or sent a text message or e-mail while you were driving 28 27 5 5
Used the internet while you were driving 16 17 5 4
Driven when you were so tired that you had a hard time keeping your
eyes open29 29 1 2
Drove when you thought your alcohol level might have been close to
or possib ly over the legal limit3 2 * *
Driven without wearing your seatbelt 19 18 9 6
*Frequency of driving w hen you thought your alcohol level might have been close to or possibly over the limit in the past 30 days
w as not included in this survey.
Proportion of Drivers Who Report Engaging in Behavior in the Past 30 Days
At least once Regularly/ Fairly often
%%
49

2014 MA Traffic Safety Culture Survey AAA Foundation for Traffic Safety
MA US
Percentages near
90 or 10 ± 3.8 ± 1.5
80 or 20 ± 5.2 ± 2.0
70 or 30 ± 5.9 ± 2.3
60 or 40 ± 6.5 ± 2.4
50 ± 6.6 ± 2.5
Approximate Margin of Error (in Percentage
Points) for Selected Percentages
Approx. margin of error
MA U.S.
People driving aggressively 88 85
Drivers speeding on freeways 71 69
Drivers speeding on residential streets 84 81
Drivers running red lights 87 84
Drivers talking on cell phones 83 86
Drivers text messaging or e-mailing 97 97
Sleepy drivers 81 81
People driving after drinking alcohol 93 92
People driving after using prescription drugs 72 67
People driving after using illegal drugs 86 85
%
Proportion of Drivers Who Perceive Behavior as a
Very or Somewhat Serious Threat
MA U.S.
Speed cameras on freeways (ticketing at 10+ mph over limit) † 32 36
Speed cameras on residential streets (ticketing at 10+ mph over limit)† 36 42
Red light cameras in urban areas† 50 55
Red light cameras on residential streets† 57 53
Hand-held cell phone ban (all drivers regardless of age) 66 68
Complete cell phone ban (hand-held & hands-free, all drivers regardless of age) 40 40
Ban on reading, typing, or sending text or email while driving 95 89
Requiring drivers convicted of DWI to use technology that prevents the car from starting if
the driver has been drinking79 80
Requiring all new cars to have technology to prevent the car from starting if the driver’s
alcohol level is over the legal limit75 73
Lowering the limit for DWI alcohol from 0.08 to 0.05 60 63
Law against driving with more than a certain amount of marijuana in your system 81 85
Mandatory driver education for new drivers younger than 18† 91 90
Mandatory driver education for all new drivers (regardless of age)† 80 83
Applying restrictions to all new drivers for a period of time (regardless of age) 68 66
Requiring all drivers age 85 and older to renew their license in-person† 91 87
Mandatory health screen for drivers ages 85+ at license renewal† 90 88
A law requiring all motorcycle riders to wear a helmet 89 82
"Move-over" law for passing an emergency vehicle stopped on the side of the road 91 93
A vision to reduce the number of people killed in crashes to zero 86 86*See Appendix A, Table 12 for full text of questions as asked in the survey.†These items w ere asked of a random sub-sample of respondents rather than all respondents to avoid imposing
excessive respondent burden. For MA, N ranged from 115 to 242, and for the U.S., N ranged from 969 to 1,626.
Proportion of Drivers Who Strongly or Somewhat Support Laws & Regulations*
%

The data reported here were collected as part of the AAA Foundation’s
2014 Traffic Safety Culture Index survey. All analyses are based on
data from licensed drivers age 16 and older who reported having
driven at least once in the past 30 days. Except as noted, MD statistics
are based on a sample of 308 MD residents, and U.S. statistics are
based on a sample of 2,705 U.S. residents, weighted to reflect the
respective populations. Please see the main report for more
information.
MD U.S.
Drive 15 miles per hour over the speed limit on a freeway 66 76
Drive 10 miles per hour over the speed limit on a residential street 84 90
Drive through a light that just turned red, when they could have stopped safely 96 94
Talk on a hands-free cell phone while driving 25 33
Talk on a hand-held cell phone while driving 77 66
Type text messages or e-mails while driving 87 96
Drive when they’re so sleepy that they have trouble keeping their eyes open 96 96
Drive when they think they may have had too much to drink 97 98
Drive 1 hour after using marijuana 91 92
Drive without wearing their seatbelt 90 88
Proportion of Drivers Who Deem Behavior Somewhat or Completely Unacceptable
%
MD U.S.
Involved in a crash as a driver in the past 2 years 13 11
Ever involved in serious crash 25 19
Ever seriously injured in crash 17 10
Friend or relative ever seriously injured or killed in crash 34 29
Proportion of Drivers Involved In or Affected by Motor Vehicle Crashes
%
MD U.S. MD U.S.
Driven 15 miles per hour over the speed limit on a freeway 66 46 29 14
Driven 10 miles per hour over the speed limit on a residential street 61 44 18 9
Driven through a light that had just turned red when you could have
stopped safely36 36 4 2
Talked on a cell phone while you were driving (any type of phone) 80 69 40 29
Read a text message or e-mail while you were driving 46 36 18 9
Typed or sent a text message or e-mail while you were driving 33 27 15 5
Used the internet while you were driving 20 17 5 4
Driven when you were so tired that you had a hard time keeping your
eyes open35 29 3 2
Drove when you thought your alcohol level might have been close to
or possib ly over the legal limit5 2 * *
Driven without wearing your seatbelt 17 18 3 6
*Frequency of driving w hen you thought your alcohol level might have been close to or possibly over the limit in the past 30 days
w as not included in this survey.
Proportion of Drivers Who Report Engaging in Behavior in the Past 30 Days
At least once Regularly/ Fairly often
%%
51

2014 MD Traffic Safety Culture Survey AAA Foundation for Traffic Safety
MD U.S.
People driving aggressively 87 85
Drivers speeding on freeways 66 69
Drivers speeding on residential streets 82 81
Drivers running red lights 88 84
Drivers talking on cell phones 85 86
Drivers text messaging or e-mailing 94 97
Sleepy drivers 79 81
People driving after drinking alcohol 88 92
People driving after using prescription drugs 65 67
People driving after using illegal drugs 81 85
%
Proportion of Drivers Who Perceive Behavior as a
Very or Somewhat Serious Threat
MD US
Percentages near
90 or 10 ± 4.9 ± 1.5
80 or 20 ± 6.5 ± 2.0
70 or 30 ± 7.3 ± 2.3
60 or 40 ± 7.7 ± 2.4
50 ± 7.7 ± 2.5
Approximate Margin of Error (in Percentage
Points) for Selected Percentages
Approx. margin of error
MD U.S.
Speed cameras on freeways (ticketing at 10+ mph over limit) † 31 36
Speed cameras on residential streets (ticketing at 10+ mph over limit)† 41 42
Red light cameras in urban areas† 65 55
Red light cameras on residential streets† 66 53
Hand-held cell phone ban (all drivers regardless of age) 83 68
Complete cell phone ban (hand-held & hands-free, all drivers regardless of age) 37 40
Ban on reading, typing, or sending text or email while driving 89 89
Requiring drivers convicted of DWI to use technology that prevents the car from starting if
the driver has been drinking78 80
Requiring all new cars to have technology to prevent the car from starting if the driver’s
alcohol level is over the legal limit66 73
Lowering the limit for DWI alcohol from 0.08 to 0.05 57 63
Law against driving with more than a certain amount of marijuana in your system 82 85
Mandatory driver education for new drivers younger than 18† 91 90
Mandatory driver education for all new drivers (regardless of age)† 81 83
Applying restrictions to all new drivers for a period of time (regardless of age) 71 66
Requiring all drivers age 85 and older to renew their license in-person† 86 87
Mandatory health screen for drivers ages 85+ at license renewal† 85 88
A law requiring all motorcycle riders to wear a helmet 83 82
"Move-over" law for passing an emergency vehicle stopped on the side of the road 92 93
A vision to reduce the number of people killed in crashes to zero 80 86*See Appendix A, Table 12 for full text of questions as asked in the survey.†These items w ere asked of a random sub-sample of respondents rather than all respondents to avoid imposing
excessive respondent burden. For MD, N ranged from 109 to 202, and for the U.S., N ranged from 969 to 1,626.
Proportion of Drivers Who Strongly or Somewhat Support Laws & Regulations*
%

The data reported here were collected as part of the AAA Foundation’s
2014 Traffic Safety Culture Index survey. All analyses are based on
data from licensed drivers age 16 and older who reported having
driven at least once in the past 30 days. Except as noted, MI statistics
are based on a sample of 375 MI residents, and U.S. statistics are
based on a sample of 2,705 U.S. residents, weighted to reflect the
respective populations. Please see the main report for more
information.
MI U.S. MI U.S.
Driven 15 miles per hour over the speed limit on a freeway 40 46 7 14
Driven 10 miles per hour over the speed limit on a residential street 40 44 8 9
Driven through a light that had just turned red when you could have
stopped safely34 36 3 2
Talked on a cell phone while you were driving (any type of phone) 73 69 32 29
Read a text message or e-mail while you were driving 36 36 8 9
Typed or sent a text message or e-mail while you were driving 31 27 5 5
Used the internet while you were driving 17 17 4 4
Driven when you were so tired that you had a hard time keeping your
eyes open31 29 3 2
Drove when you thought your alcohol level might have been close to
or possib ly over the legal limit4 2 * *
Driven without wearing your seatbelt 15 18 3 6
*Frequency of driving w hen you thought your alcohol level might have been close to or possibly over the limit in the past 30 days
w as not included in this survey.
Proportion of Drivers Who Report Engaging in Behavior in the Past 30 Days
At least once Regularly/ Fairly often
%%
MI U.S.
Drive 15 miles per hour over the speed limit on a freeway 80 76
Drive 10 miles per hour over the speed limit on a residential street 89 90
Drive through a light that just turned red, when they could have stopped safely 92 94
Talk on a hands-free cell phone while driving 35 33
Talk on a hand-held cell phone while driving 61 66
Type text messages or e-mails while driving 94 96
Drive when they’re so sleepy that they have trouble keeping their eyes open 95 96
Drive when they think they may have had too much to drink 97 98
Drive 1 hour after using marijuana 91 92
Drive without wearing their seatbelt 88 88
Proportion of Drivers Who Deem Behavior Somewhat or Completely Unacceptable
%
MI U.S.
Involved in a crash as a driver in the past 2 years 10 11
Ever involved in serious crash 17 19
Ever seriously injured in crash 10 10
Friend or relative ever seriously injured or killed in crash 38 29
Proportion of Drivers Involved In or Affected by Motor Vehicle Crashes
%
53

2014 MI Traffic Safety Culture Survey AAA Foundation for Traffic Safety
MI US
Percentages near
90 or 10 ± 3.4 ± 1.5
80 or 20 ± 4.8 ± 2.0
70 or 30 ± 5.5 ± 2.3
60 or 40 ± 5.9 ± 2.4
50 ± 6.1 ± 2.5
Approximate Margin of Error (in Percentage
Points) for Selected Percentages
Approx. margin of error
MI U.S.
People driving aggressively 84 85
Drivers speeding on freeways 64 69
Drivers speeding on residential streets 76 81
Drivers running red lights 82 84
Drivers talking on cell phones 84 86
Drivers text messaging or e-mailing 93 97
Sleepy drivers 76 81
People driving after drinking alcohol 91 92
People driving after using prescription drugs 60 67
People driving after using illegal drugs 85 85
%
Proportion of Drivers Who Perceive Behavior as a
Very or Somewhat Serious Threat
MI U.S.
Speed cameras on freeways (ticketing at 10+ mph over limit) † 32 36
Speed cameras on residential streets (ticketing at 10+ mph over limit)† 38 42
Red light cameras in urban areas† 48 55
Red light cameras on residential streets† 52 53
Hand-held cell phone ban (all drivers regardless of age) 64 68
Complete cell phone ban (hand-held & hands-free, all drivers regardless of age) 40 40
Ban on reading, typing, or sending text or email while driving 89 89
Requiring drivers convicted of DWI to use technology that prevents the car from starting if
the driver has been drinking77 80
Requiring all new cars to have technology to prevent the car from starting if the driver’s
alcohol level is over the legal limit70 73
Lowering the limit for DWI alcohol from 0.08 to 0.05 57 63
Law against driving with more than a certain amount of marijuana in your system 81 85
Mandatory driver education for new drivers younger than 18† 92 90
Mandatory driver education for all new drivers (regardless of age)† 87 83
Applying restrictions to all new drivers for a period of time (regardless of age) 72 66
Requiring all drivers age 85 and older to renew their license in-person† 88 87
Mandatory health screen for drivers ages 85+ at license renewal† 85 88
A law requiring all motorcycle riders to wear a helmet 79 82
"Move-over" law for passing an emergency vehicle stopped on the side of the road 96 93
A vision to reduce the number of people killed in crashes to zero 86 86*See Appendix A, Table 12 for full text of questions as asked in the survey.†These items w ere asked of a random sub-sample of respondents rather than all respondents to avoid imposing
excessive respondent burden. For MI, N ranged from 129 to 251, and for the U.S., N ranged from 969 to 1,626.
Proportion of Drivers Who Strongly or Somewhat Support Laws & Regulations*
%

The data reported here were collected as part of the AAA Foundation’s
2014 Traffic Safety Culture Index survey. All analyses are based on
data from licensed drivers age 16 and older who reported having
driven at least once in the past 30 days. Except as noted, MN statistics
are based on a sample of 388 MN residents, and U.S. statistics are
based on a sample of 2,705 U.S. residents, weighted to reflect the
respective populations. Please see the main report for more
information.
MN U.S.
Drive 15 miles per hour over the speed limit on a freeway 79 76
Drive 10 miles per hour over the speed limit on a residential street 95 90
Drive through a light that just turned red, when they could have stopped safely 91 94
Talk on a hands-free cell phone while driving 41 33
Talk on a hand-held cell phone while driving 58 66
Type text messages or e-mails while driving 98 96
Drive when they’re so sleepy that they have trouble keeping their eyes open 95 96
Drive when they think they may have had too much to drink 99 98
Drive 1 hour after using marijuana 94 92
Drive without wearing their seatbelt 92 88
Proportion of Drivers Who Deem Behavior Somewhat or Completely Unacceptable
%
MN U.S. MN U.S.
Driven 15 miles per hour over the speed limit on a freeway 32 46 6 14
Driven 10 miles per hour over the speed limit on a residential street 26 44 5 9
Driven through a light that had just turned red when you could have
stopped safely33 36 1 2
Talked on a cell phone while you were driving (any type of phone) 72 69 26 29
Read a text message or e-mail while you were driving 33 36 5 9
Typed or sent a text message or e-mail while you were driving 20 27 2 5
Used the internet while you were driving 12 17 1 4
Driven when you were so tired that you had a hard time keeping your
eyes open23 29 1 2
Drove when you thought your alcohol level might have been close to
or possib ly over the legal limit2 2 * *
Driven without wearing your seatbelt 12 18 3 6
*Frequency of driving w hen you thought your alcohol level might have been close to or possibly over the limit in the past 30 days
w as not included in this survey.
Proportion of Drivers Who Report Engaging in Behavior in the Past 30 Days
At least once Regularly/ Fairly often
%%
MN U.S.
Involved in a crash as a driver in the past 2 years 10 11
Ever involved in serious crash 15 19
Ever seriously injured in crash 7 10
Friend or relative ever seriously injured or killed in crash 28 29
Proportion of Drivers Involved In or Affected by Motor Vehicle Crashes
%
55

2014 MN Traffic Safety Culture Survey AAA Foundation for Traffic Safety
MN US
Percentages near
90 or 10 ± 4.0 ± 1.5
80 or 20 ± 5.3 ± 2.0
70 or 30 ± 5.8 ± 2.3
60 or 40 ± 6.2 ± 2.4
50 ± 6.3 ± 2.5
Approximate Margin of Error (in Percentage
Points) for Selected Percentages
Approx. margin of error
MN U.S.
People driving aggressively 81 85
Drivers speeding on freeways 62 69
Drivers speeding on residential streets 76 81
Drivers running red lights 79 84
Drivers talking on cell phones 85 86
Drivers text messaging or e-mailing 97 97
Sleepy drivers 82 81
People driving after drinking alcohol 91 92
People driving after using prescription drugs 57 67
People driving after using illegal drugs 82 85
%
Proportion of Drivers Who Perceive Behavior as a
Very or Somewhat Serious Threat
MN U.S.
Speed cameras on freeways (ticketing at 10+ mph over limit) † 29 36
Speed cameras on residential streets (ticketing at 10+ mph over limit)† 46 42
Red light cameras in urban areas† 59 55
Red light cameras on residential streets† 48 53
Hand-held cell phone ban (all drivers regardless of age) 62 68
Complete cell phone ban (hand-held & hands-free, all drivers regardless of age) 43 40
Ban on reading, typing, or sending text or email while driving 91 89
Requiring drivers convicted of DWI to use technology that prevents the car from starting if
the driver has been drinking78 80
Requiring all new cars to have technology to prevent the car from starting if the driver’s
alcohol level is over the legal limit70 73
Lowering the limit for DWI alcohol from 0.08 to 0.05 62 63
Law against driving with more than a certain amount of marijuana in your system 87 85
Mandatory driver education for new drivers younger than 18† 99 90
Mandatory driver education for all new drivers (regardless of age)† 91 83
Applying restrictions to all new drivers for a period of time (regardless of age) 64 66
Requiring all drivers age 85 and older to renew their license in-person† 90 87
Mandatory health screen for drivers ages 85+ at license renewal† 92 88
A law requiring all motorcycle riders to wear a helmet 78 82
"Move-over" law for passing an emergency vehicle stopped on the side of the road 95 93
A vision to reduce the number of people killed in crashes to zero 83 86
*See Appendix A, Table 12 for full text of questions as asked in the survey.†These items w ere asked of a random sub-sample of respondents rather than all respondents to avoid imposing
excessive respondent burden. For MN, N ranged from 126 to 254, and for the U.S., N ranged from 969 to 1,626.
Proportion of Drivers Who Strongly or Somewhat Support Laws & Regulations*
%

The data reported here were collected as part of the AAA Foundation’s
2014 Traffic Safety Culture Index survey. All analyses are based on
data from licensed drivers age 16 and older who reported having
driven at least once in the past 30 days. Except as noted, MO statistics
are based on a sample of 361 MO residents, and U.S. statistics are
based on a sample of 2,705 U.S. residents, weighted to reflect the
respective populations. Please see the main report for more
information.
MO U.S.
Drive 15 miles per hour over the speed limit on a freeway 80 76
Drive 10 miles per hour over the speed limit on a residential street 93 90
Drive through a light that just turned red, when they could have stopped safely 95 94
Talk on a hands-free cell phone while driving 33 33
Talk on a hand-held cell phone while driving 57 66
Type text messages or e-mails while driving 94 96
Drive when they’re so sleepy that they have trouble keeping their eyes open 97 96
Drive when they think they may have had too much to drink 98 98
Drive 1 hour after using marijuana 93 92
Drive without wearing their seatbelt 86 88
Proportion of Drivers Who Deem Behavior Somewhat or Completely Unacceptable
%
MO U.S. MO U.S.
Driven 15 miles per hour over the speed limit on a freeway 41 46 9 14
Driven 10 miles per hour over the speed limit on a residential street 37 44 7 9
Driven through a light that had just turned red when you could have
stopped safely27 36 2 2
Talked on a cell phone while you were driving (any type of phone) 75 69 34 29
Read a text message or e-mail while you were driving 41 36 10 9
Typed or sent a text message or e-mail while you were driving 29 27 7 5
Used the internet while you were driving 18 17 5 4
Driven when you were so tired that you had a hard time keeping your
eyes open31 29 2 2
Drove when you thought your alcohol level might have been close to
or possib ly over the legal limit5 2 * *
Driven without wearing your seatbelt 25 18 11 6
*Frequency of driving w hen you thought your alcohol level might have been close to or possibly over the limit in the past 30 days
w as not included in this survey.
Proportion of Drivers Who Report Engaging in Behavior in the Past 30 Days
At least once Regularly/ Fairly often
%%
MO U.S.
Involved in a crash as a driver in the past 2 years 7 11
Ever involved in serious crash 23 19
Ever seriously injured in crash 14 10
Friend or relative ever seriously injured or killed in crash 36 29
Proportion of Drivers Involved In or Affected by Motor Vehicle Crashes
%
57

2014 MO Traffic Safety Culture Survey AAA Foundation for Traffic Safety
MO US
Percentages near
90 or 10 ± 4.0 ± 1.5
80 or 20 ± 5.5 ± 2.0
70 or 30 ± 6.2 ± 2.3
60 or 40 ± 6.6 ± 2.4
50 ± 6.7 ± 2.5
Approximate Margin of Error (in Percentage
Points) for Selected Percentages
Approx. margin of error
MO U.S.
People driving aggressively 78 85
Drivers speeding on freeways 64 69
Drivers speeding on residential streets 74 81
Drivers running red lights 78 84
Drivers talking on cell phones 82 86
Drivers text messaging or e-mailing 96 97
Sleepy drivers 82 81
People driving after drinking alcohol 91 92
People driving after using prescription drugs 57 67
People driving after using illegal drugs 85 85
%
Proportion of Drivers Who Perceive Behavior as a
Very or Somewhat Serious Threat
MO U.S.
Speed cameras on freeways (ticketing at 10+ mph over limit) † 21 36
Speed cameras on residential streets (ticketing at 10+ mph over limit)† 28 42
Red light cameras in urban areas† 40 55
Red light cameras on residential streets† 39 53
Hand-held cell phone ban (all drivers regardless of age) 55 68
Complete cell phone ban (hand-held & hands-free, all drivers regardless of age) 33 40
Ban on reading, typing, or sending text or email while driving 87 89
Requiring drivers convicted of DWI to use technology that prevents the car from starting if
the driver has been drinking75 80
Requiring all new cars to have technology to prevent the car from starting if the driver’s
alcohol level is over the legal limit63 73
Lowering the limit for DWI alcohol from 0.08 to 0.05 59 63
Law against driving with more than a certain amount of marijuana in your system 81 85
Mandatory driver education for new drivers younger than 18† 86 90
Mandatory driver education for all new drivers (regardless of age)† 70 83
Applying restrictions to all new drivers for a period of time (regardless of age) 59 66
Requiring all drivers age 85 and older to renew their license in-person† 87 87
Mandatory health screen for drivers ages 85+ at license renewal† 86 88
A law requiring all motorcycle riders to wear a helmet 82 82
"Move-over" law for passing an emergency vehicle stopped on the side of the road 95 93
A vision to reduce the number of people killed in crashes to zero 87 86
*See Appendix A, Table 12 for full text of questions as asked in the survey.†These items w ere asked of a random sub-sample of respondents rather than all respondents to avoid imposing
excessive respondent burden. For MO, N ranged from 125 to 227, and for the U.S., N ranged from 969 to 1,626.
Proportion of Drivers Who Strongly or Somewhat Support Laws & Regulations*
%

The data reported here were collected as part of the AAA Foundation’s
2014 Traffic Safety Culture Index survey. All analyses are based on
data from licensed drivers age 16 and older who reported having
driven at least once in the past 30 days. Except as noted, NJ statistics
are based on a sample of 355 NJ residents, and U.S. statistics are
based on a sample of 2,705 U.S. residents, weighted to reflect the
respective populations. Please see the main report for more
information.
NJ U.S.
Drive 15 miles per hour over the speed limit on a freeway 64 76
Drive 10 miles per hour over the speed limit on a residential street 84 90
Drive through a light that just turned red, when they could have stopped safely 95 94
Talk on a hands-free cell phone while driving 38 33
Talk on a hand-held cell phone while driving 87 66
Type text messages or e-mails while driving 98 96
Drive when they’re so sleepy that they have trouble keeping their eyes open 98 96
Drive when they think they may have had too much to drink 99 98
Drive 1 hour after using marijuana 93 92
Drive without wearing their seatbelt 88 88
Proportion of Drivers Who Deem Behavior Somewhat or Completely Unacceptable
%
NJ U.S. NJ U.S.
Driven 15 miles per hour over the speed limit on a freeway 63 46 26 14
Driven 10 miles per hour over the speed limit on a residential street 58 44 17 9
Driven through a light that had just turned red when you could have
stopped safely37 36 2 2
Talked on a cell phone while you were driving (any type of phone) 66 69 30 29
Read a text message or e-mail while you were driving 39 36 10 9
Typed or sent a text message or e-mail while you were driving 30 27 8 5
Used the internet while you were driving 18 17 6 4
Driven when you were so tired that you had a hard time keeping your
eyes open35 29 5 2
Drove when you thought your alcohol level might have been close to
or possib ly over the legal limit4 2 * *
Driven without wearing your seatbelt 12 18 7 6
*Frequency of driving w hen you thought your alcohol level might have been close to or possibly over the limit in the past 30 days
w as not included in this survey.
Proportion of Drivers Who Report Engaging in Behavior in the Past 30 Days
At least once Regularly/ Fairly often
%%
NJ U.S.
Involved in a crash as a driver in the past 2 years 10 11
Ever involved in serious crash 24 19
Ever seriously injured in crash 14 10
Friend or relative ever seriously injured or killed in crash 26 29
Proportion of Drivers Involved In or Affected by Motor Vehicle Crashes
%
59
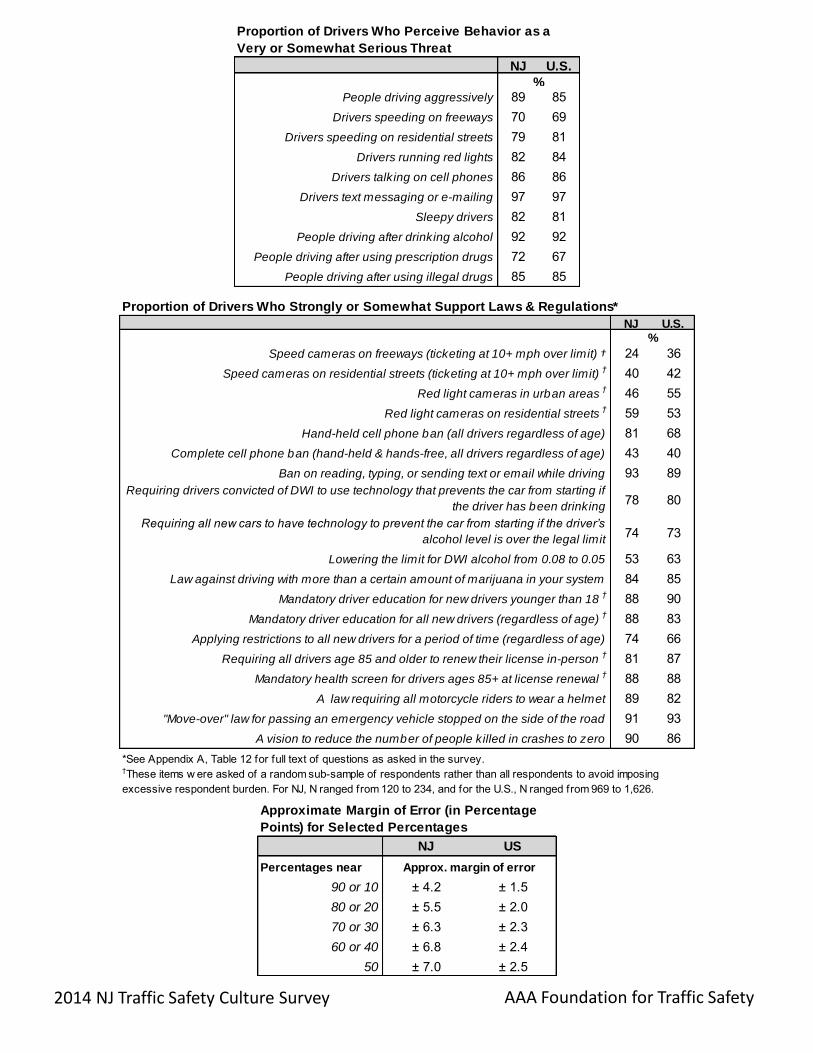
2014 NJ Traffic Safety Culture Survey AAA Foundation for Traffic Safety
NJ US
Percentages near
90 or 10 ± 4.2 ± 1.5
80 or 20 ± 5.5 ± 2.0
70 or 30 ± 6.3 ± 2.3
60 or 40 ± 6.8 ± 2.4
50 ± 7.0 ± 2.5
Approximate Margin of Error (in Percentage
Points) for Selected Percentages
Approx. margin of error
NJ U.S.
People driving aggressively 89 85
Drivers speeding on freeways 70 69
Drivers speeding on residential streets 79 81
Drivers running red lights 82 84
Drivers talking on cell phones 86 86
Drivers text messaging or e-mailing 97 97
Sleepy drivers 82 81
People driving after drinking alcohol 92 92
People driving after using prescription drugs 72 67
People driving after using illegal drugs 85 85
%
Proportion of Drivers Who Perceive Behavior as a
Very or Somewhat Serious Threat
NJ U.S.
Speed cameras on freeways (ticketing at 10+ mph over limit) † 24 36
Speed cameras on residential streets (ticketing at 10+ mph over limit)† 40 42
Red light cameras in urban areas† 46 55
Red light cameras on residential streets† 59 53
Hand-held cell phone ban (all drivers regardless of age) 81 68
Complete cell phone ban (hand-held & hands-free, all drivers regardless of age) 43 40
Ban on reading, typing, or sending text or email while driving 93 89
Requiring drivers convicted of DWI to use technology that prevents the car from starting if
the driver has been drinking78 80
Requiring all new cars to have technology to prevent the car from starting if the driver’s
alcohol level is over the legal limit74 73
Lowering the limit for DWI alcohol from 0.08 to 0.05 53 63
Law against driving with more than a certain amount of marijuana in your system 84 85
Mandatory driver education for new drivers younger than 18† 88 90
Mandatory driver education for all new drivers (regardless of age)† 88 83
Applying restrictions to all new drivers for a period of time (regardless of age) 74 66
Requiring all drivers age 85 and older to renew their license in-person† 81 87
Mandatory health screen for drivers ages 85+ at license renewal† 88 88
A law requiring all motorcycle riders to wear a helmet 89 82
"Move-over" law for passing an emergency vehicle stopped on the side of the road 91 93
A vision to reduce the number of people killed in crashes to zero 90 86
*See Appendix A, Table 12 for full text of questions as asked in the survey.†These items w ere asked of a random sub-sample of respondents rather than all respondents to avoid imposing
excessive respondent burden. For NJ, N ranged from 120 to 234, and for the U.S., N ranged from 969 to 1,626.
Proportion of Drivers Who Strongly or Somewhat Support Laws & Regulations*
%
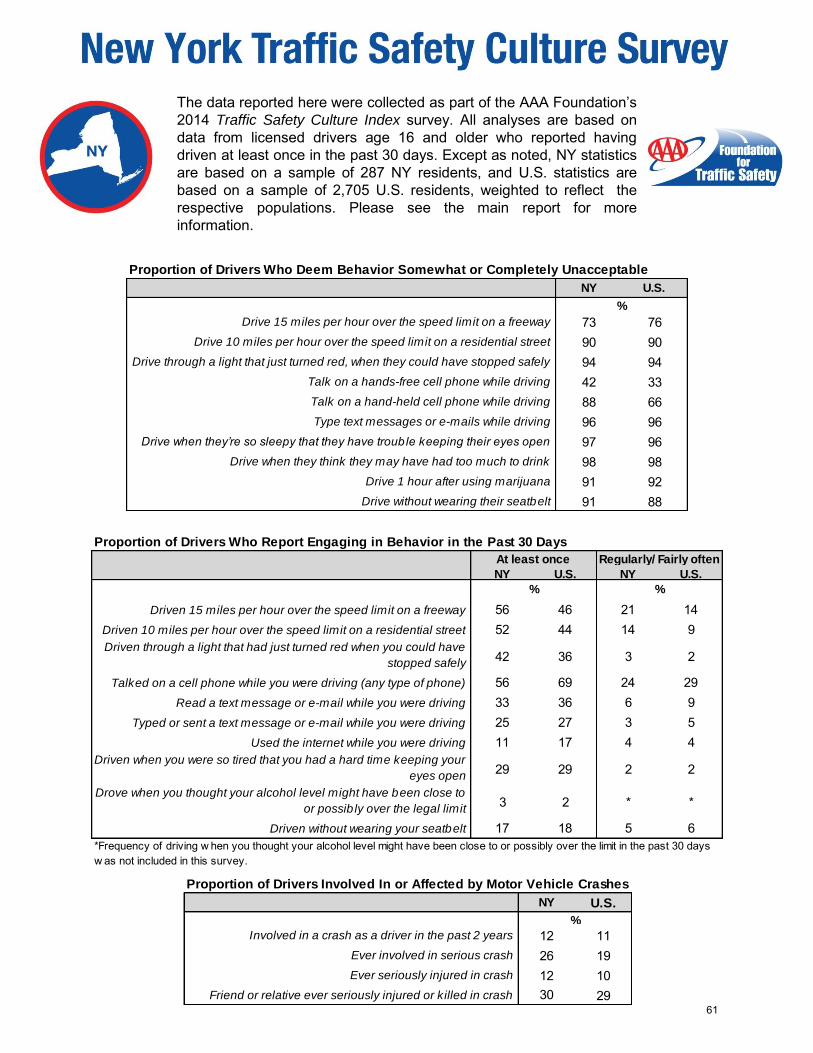
The data reported here were collected as part of the AAA Foundation’s
2014 Traffic Safety Culture Index survey. All analyses are based on
data from licensed drivers age 16 and older who reported having
driven at least once in the past 30 days. Except as noted, NY statistics
are based on a sample of 287 NY residents, and U.S. statistics are
based on a sample of 2,705 U.S. residents, weighted to reflect the
respective populations. Please see the main report for more
information.
NY U.S.
Drive 15 miles per hour over the speed limit on a freeway 73 76
Drive 10 miles per hour over the speed limit on a residential street 90 90
Drive through a light that just turned red, when they could have stopped safely 94 94
Talk on a hands-free cell phone while driving 42 33
Talk on a hand-held cell phone while driving 88 66
Type text messages or e-mails while driving 96 96
Drive when they’re so sleepy that they have trouble keeping their eyes open 97 96
Drive when they think they may have had too much to drink 98 98
Drive 1 hour after using marijuana 91 92
Drive without wearing their seatbelt 91 88
Proportion of Drivers Who Deem Behavior Somewhat or Completely Unacceptable
%
NY U.S. NY U.S.
Driven 15 miles per hour over the speed limit on a freeway 56 46 21 14
Driven 10 miles per hour over the speed limit on a residential street 52 44 14 9
Driven through a light that had just turned red when you could have
stopped safely42 36 3 2
Talked on a cell phone while you were driving (any type of phone) 56 69 24 29
Read a text message or e-mail while you were driving 33 36 6 9
Typed or sent a text message or e-mail while you were driving 25 27 3 5
Used the internet while you were driving 11 17 4 4
Driven when you were so tired that you had a hard time keeping your
eyes open29 29 2 2
Drove when you thought your alcohol level might have been close to
or possib ly over the legal limit3 2 * *
Driven without wearing your seatbelt 17 18 5 6
*Frequency of driving w hen you thought your alcohol level might have been close to or possibly over the limit in the past 30 days
w as not included in this survey.
Proportion of Drivers Who Report Engaging in Behavior in the Past 30 Days
At least once Regularly/ Fairly often
%%
NY U.S.
Involved in a crash as a driver in the past 2 years 12 11
Ever involved in serious crash 26 19
Ever seriously injured in crash 12 10
Friend or relative ever seriously injured or killed in crash 30 29
Proportion of Drivers Involved In or Affected by Motor Vehicle Crashes
%
61

2014 NY Traffic Safety Culture Survey AAA Foundation for Traffic Safety
NY US
Percentages near
90 or 10 ± 4.2 ± 1.5
80 or 20 ± 5.4 ± 2.0
70 or 30 ± 6.2 ± 2.3
60 or 40 ± 6.6 ± 2.4
50 ± 6.8 ± 2.5
Approximate Margin of Error (in Percentage
Points) for Selected Percentages
Approx. margin of error
NY U.S.
People driving aggressively 88 85
Drivers speeding on freeways 70 69
Drivers speeding on residential streets 85 81
Drivers running red lights 87 84
Drivers talking on cell phones 91 86
Drivers text messaging or e-mailing 99 97
Sleepy drivers 85 81
People driving after drinking alcohol 92 92
People driving after using prescription drugs 73 67
People driving after using illegal drugs 89 85
%
Proportion of Drivers Who Perceive Behavior as a
Very or Somewhat Serious Threat
NY U.S.
Speed cameras on freeways (ticketing at 10+ mph over limit) † 35 36
Speed cameras on residential streets (ticketing at 10+ mph over limit)† 49 42
Red light cameras in urban areas† 60 55
Red light cameras on residential streets† 64 53
Hand-held cell phone ban (all drivers regardless of age) 87 68
Complete cell phone ban (hand-held & hands-free, all drivers regardless of age) 44 40
Ban on reading, typing, or sending text or email while driving 94 89
Requiring drivers convicted of DWI to use technology that prevents the car from starting if
the driver has been drinking80 80
Requiring all new cars to have technology to prevent the car from starting if the driver’s
alcohol level is over the legal limit79 73
Lowering the limit for DWI alcohol from 0.08 to 0.05 59 63
Law against driving with more than a certain amount of marijuana in your system 83 85
Mandatory driver education for new drivers younger than 18† 92 90
Mandatory driver education for all new drivers (regardless of age)† 84 83
Applying restrictions to all new drivers for a period of time (regardless of age) 69 66
Requiring all drivers age 85 and older to renew their license in-person† 83 87
Mandatory health screen for drivers ages 85+ at license renewal† 89 88
A law requiring all motorcycle riders to wear a helmet 91 82
"Move-over" law for passing an emergency vehicle stopped on the side of the road 92 93
A vision to reduce the number of people killed in crashes to zero 90 86
*See Appendix A, Table 12 for full text of questions as asked in the survey.†These items w ere asked of a random sub-sample of respondents rather than all respondents to avoid imposing
excessive respondent burden. For NY, N ranged from 100 to 181, and for the U.S., N ranged from 969 to 1,626.
Proportion of Drivers Who Strongly or Somewhat Support Laws & Regulations*
%

The data reported here were collected as part of the AAA Foundation’s
2014 Traffic Safety Culture Index survey. All analyses are based on
data from licensed drivers age 16 and older who reported having
driven at least once in the past 30 days. Except as noted, NC statistics
are based on a sample of 263 NC residents, and U.S. statistics are
based on a sample of 2,705 U.S. residents, weighted to reflect the
respective populations. Please see the main report for more
information.
NC U.S.
Drive 15 miles per hour over the speed limit on a freeway 81 76
Drive 10 miles per hour over the speed limit on a residential street 91 90
Drive through a light that just turned red, when they could have stopped safely 95 94
Talk on a hands-free cell phone while driving 31 33
Talk on a hand-held cell phone while driving 50 66
Type text messages or e-mails while driving 97 96
Drive when they’re so sleepy that they have trouble keeping their eyes open 98 96
Drive when they think they may have had too much to drink 98 98
Drive 1 hour after using marijuana 91 92
Drive without wearing their seatbelt 92 88
Proportion of Drivers Who Deem Behavior Somewhat or Completely Unacceptable
%
NC U.S. NC U.S.
Driven 15 miles per hour over the speed limit on a freeway 43 46 8 14
Driven 10 miles per hour over the speed limit on a residential street 41 44 6 9
Driven through a light that had just turned red when you could have
stopped safely36 36 2 2
Talked on a cell phone while you were driving (any type of phone) 77 69 37 29
Read a text message or e-mail while you were driving 37 36 6 9
Typed or sent a text message or e-mail while you were driving 29 27 4 5
Used the internet while you were driving 22 17 5 4
Driven when you were so tired that you had a hard time keeping your
eyes open31 29 2 2
Drove when you thought your alcohol level might have been close to
or possib ly over the legal limit2 2 * *
Driven without wearing your seatbelt 21 18 3 6
*Frequency of driving w hen you thought your alcohol level might have been close to or possibly over the limit in the past 30 days
w as not included in this survey.
Proportion of Drivers Who Report Engaging in Behavior in the Past 30 Days
At least once Regularly/ Fairly often
%%
NC U.S.
Involved in a crash as a driver in the past 2 years 11 11
Ever involved in serious crash 25 19
Ever seriously injured in crash 12 10
Friend or relative ever seriously injured or killed in crash 31 29
Proportion of Drivers Involved In or Affected by Motor Vehicle Crashes
%
63

2014 NC Traffic Safety Culture Survey AAA Foundation for Traffic Safety
NC US
Percentages near
90 or 10 ± 3.8 ± 1.5
80 or 20 ± 5.1 ± 2.0
70 or 30 ± 5.9 ± 2.3
60 or 40 ± 6.4 ± 2.4
50 ± 6.6 ± 2.5
Approximate Margin of Error (in Percentage
Points) for Selected Percentages
Approx. margin of error
NC U.S.
People driving aggressively 89 85
Drivers speeding on freeways 70 69
Drivers speeding on residential streets 79 81
Drivers running red lights 82 84
Drivers talking on cell phones 86 86
Drivers text messaging or e-mailing 97 97
Sleepy drivers 82 81
People driving after drinking alcohol 92 92
People driving after using prescription drugs 72 67
People driving after using illegal drugs 85 85
%
Proportion of Drivers Who Perceive Behavior as a
Very or Somewhat Serious Threat
NC U.S.
Speed cameras on freeways (ticketing at 10+ mph over limit) † 46 36
Speed cameras on residential streets (ticketing at 10+ mph over limit)† 51 42
Red light cameras in urban areas† 59 55
Red light cameras on residential streets† 61 53
Hand-held cell phone ban (all drivers regardless of age) 60 68
Complete cell phone ban (hand-held & hands-free, all drivers regardless of age) 39 40
Ban on reading, typing, or sending text or email while driving 92 89
Requiring drivers convicted of DWI to use technology that prevents the car from starting if
the driver has been drinking80 80
Requiring all new cars to have technology to prevent the car from starting if the driver’s
alcohol level is over the legal limit76 73
Lowering the limit for DWI alcohol from 0.08 to 0.05 73 63
Law against driving with more than a certain amount of marijuana in your system 87 85
Mandatory driver education for new drivers younger than 18† 97 90
Mandatory driver education for all new drivers (regardless of age)† 82 83
Applying restrictions to all new drivers for a period of time (regardless of age) 67 66
Requiring all drivers age 85 and older to renew their license in-person† 92 87
Mandatory health screen for drivers ages 85+ at license renewal† 87 88
A law requiring all motorcycle riders to wear a helmet 91 82
"Move-over" law for passing an emergency vehicle stopped on the side of the road 93 93
A vision to reduce the number of people killed in crashes to zero 88 86
*See Appendix A, Table 12 for full text of questions as asked in the survey.†These items w ere asked of a random sub-sample of respondents rather than all respondents to avoid imposing
excessive respondent burden. For NC, N ranged from 124 to 235, and for the U.S., N ranged from 969 to 1,626.
Proportion of Drivers Who Strongly or Somewhat Support Laws & Regulations*
%

The data reported here were collected as part of the AAA Foundation’s
2014 Traffic Safety Culture Index survey. All analyses are based on
data from licensed drivers age 16 and older who reported having
driven at least once in the past 30 days. Except as noted, OH statistics
are based on a sample of 373 OH residents, and U.S. statistics are
based on a sample of 2,705 U.S. residents, weighted to reflect the
respective populations. Please see the main report for more
information.
OH U.S.
Drive 15 miles per hour over the speed limit on a freeway 76 76
Drive 10 miles per hour over the speed limit on a residential street 89 90
Drive through a light that just turned red, when they could have stopped safely 93 94
Talk on a hands-free cell phone while driving 31 33
Talk on a hand-held cell phone while driving 59 66
Type text messages or e-mails while driving 96 96
Drive when they’re so sleepy that they have trouble keeping their eyes open 96 96
Drive when they think they may have had too much to drink 97 98
Drive 1 hour after using marijuana 89 92
Drive without wearing their seatbelt 88 88
Proportion of Drivers Who Deem Behavior Somewhat or Completely Unacceptable
%
OH U.S. OH U.S.
Driven 15 miles per hour over the speed limit on a freeway 46 46 13 14
Driven 10 miles per hour over the speed limit on a residential street 45 44 10 9
Driven through a light that had just turned red when you could have
stopped safely34 36 1 2
Talked on a cell phone while you were driving (any type of phone) 76 69 33 29
Read a text message or e-mail while you were driving 37 36 9 9
Typed or sent a text message or e-mail while you were driving 27 27 6 5
Used the internet while you were driving 16 17 2 4
Driven when you were so tired that you had a hard time keeping your
eyes open28 29 2 2
Drove when you thought your alcohol level might have been close to
or possib ly over the legal limit1 2 * *
Driven without wearing your seatbelt 24 18 11 6
*Frequency of driving w hen you thought your alcohol level might have been close to or possibly over the limit in the past 30 days
w as not included in this survey.
Proportion of Drivers Who Report Engaging in Behavior in the Past 30 Days
At least once Regularly/ Fairly often
%%
OH U.S.
Involved in a crash as a driver in the past 2 years 10 11
Ever involved in serious crash 24 19
Ever seriously injured in crash 14 10
Friend or relative ever seriously injured or killed in crash 35 29
Proportion of Drivers Involved In or Affected by Motor Vehicle Crashes
%
65

2014 OH Traffic Safety Culture Survey AAA Foundation for Traffic Safety
OH US
Percentages near
90 or 10 ± 3.4 ± 1.5
80 or 20 ± 4.7 ± 2.0
70 or 30 ± 5.6 ± 2.3
60 or 40 ± 6.0 ± 2.4
50 ± 6.1 ± 2.5
Approximate Margin of Error (in Percentage
Points) for Selected Percentages
Approx. margin of error
OH U.S.
People driving aggressively 85 85
Drivers speeding on freeways 67 69
Drivers speeding on residential streets 76 81
Drivers running red lights 84 84
Drivers talking on cell phones 88 86
Drivers text messaging or e-mailing 97 97
Sleepy drivers 79 81
People driving after drinking alcohol 90 92
People driving after using prescription drugs 64 67
People driving after using illegal drugs 83 85
%
Proportion of Drivers Who Perceive Behavior as a
Very or Somewhat Serious Threat
OH U.S.
Speed cameras on freeways (ticketing at 10+ mph over limit) † 25 36
Speed cameras on residential streets (ticketing at 10+ mph over limit)† 33 42
Red light cameras in urban areas† 43 55
Red light cameras on residential streets† 32 53
Hand-held cell phone ban (all drivers regardless of age) 58 68
Complete cell phone ban (hand-held & hands-free, all drivers regardless of age) 37 40
Ban on reading, typing, or sending text or email while driving 91 89
Requiring drivers convicted of DWI to use technology that prevents the car from starting if
the driver has been drinking77 80
Requiring all new cars to have technology to prevent the car from starting if the driver’s
alcohol level is over the legal limit65 73
Lowering the limit for DWI alcohol from 0.08 to 0.05 61 63
Law against driving with more than a certain amount of marijuana in your system 81 85
Mandatory driver education for new drivers younger than 18† 88 90
Mandatory driver education for all new drivers (regardless of age)† 88 83
Applying restrictions to all new drivers for a period of time (regardless of age) 65 66
Requiring all drivers age 85 and older to renew their license in-person† 87 87
Mandatory health screen for drivers ages 85+ at license renewal† 86 88
A law requiring all motorcycle riders to wear a helmet 73 82
"Move-over" law for passing an emergency vehicle stopped on the side of the road 98 93
A vision to reduce the number of people killed in crashes to zero 87 86*See Appendix A, Table 12 for full text of questions as asked in the survey.†These items w ere asked of a random sub-sample of respondents rather than all respondents to avoid imposing
excessive respondent burden. For OH, N ranged from 124 to 227, and for the U.S., N ranged from 969 to 1,626.
Proportion of Drivers Who Strongly or Somewhat Support Laws & Regulations*
%

The data reported here were collected as part of the AAA Foundation’s
2014 Traffic Safety Culture Index survey. All analyses are based on
data from licensed drivers age 16 and older who reported having
driven at least once in the past 30 days. Except as noted, OR statistics
are based on a sample of 311 OR residents, and U.S. statistics are
based on a sample of 2,705 U.S. residents, weighted to reflect the
respective populations. Please see the main report for more
information.
OR U.S.
Drive 15 miles per hour over the speed limit on a freeway 80 76
Drive 10 miles per hour over the speed limit on a residential street 90 90
Drive through a light that just turned red, when they could have stopped safely 95 94
Talk on a hands-free cell phone while driving 38 33
Talk on a hand-held cell phone while driving 82 66
Type text messages or e-mails while driving 97 96
Drive when they’re so sleepy that they have trouble keeping their eyes open 98 96
Drive when they think they may have had too much to drink 98 98
Drive 1 hour after using marijuana 86 92
Drive without wearing their seatbelt 87 88
Proportion of Drivers Who Deem Behavior Somewhat or Completely Unacceptable
%
OR U.S. OR U.S.
Driven 15 miles per hour over the speed limit on a freeway 46 46 11 14
Driven 10 miles per hour over the speed limit on a residential street 45 44 5 9
Driven through a light that had just turned red when you could have
stopped safely34 36 2 2
Talked on a cell phone while you were driving (any type of phone) 76 69 22 29
Read a text message or e-mail while you were driving 37 36 7 9
Typed or sent a text message or e-mail while you were driving 27 27 7 5
Used the internet while you were driving 16 17 3 4
Driven when you were so tired that you had a hard time keeping your
eyes open28 29 3 2
Drove when you thought your alcohol level might have been close to
or possib ly over the legal limit1 2 * *
Driven without wearing your seatbelt 24 18 1 6
*Frequency of driving w hen you thought your alcohol level might have been close to or possibly over the limit in the past 30 days
w as not included in this survey.
Proportion of Drivers Who Report Engaging in Behavior in the Past 30 Days
At least once Regularly/ Fairly often
%%
OR U.S.
Involved in a crash as a driver in the past 2 years 8 11
Ever involved in serious crash 19 19
Ever seriously injured in crash 14 10
Friend or relative ever seriously injured or killed in crash 33 29
Proportion of Drivers Involved In or Affected by Motor Vehicle Crashes
%
67

2014 OR Traffic Safety Culture Survey AAA Foundation for Traffic Safety
OR US
Percentages near
90 or 10 ± 4.8 ± 1.5
80 or 20 ± 6.5 ± 2.0
70 or 30 ± 7.5 ± 2.3
60 or 40 ± 8.1 ± 2.4
50 ± 8.3 ± 2.5
Approximate Margin of Error (in Percentage
Points) for Selected Percentages
Approx. margin of error
OR U.S.
People driving aggressively 85 85
Drivers speeding on freeways 67 69
Drivers speeding on residential streets 76 81
Drivers running red lights 84 84
Drivers talking on cell phones 88 86
Drivers text messaging or e-mailing 97 97
Sleepy drivers 79 81
People driving after drinking alcohol 90 92
People driving after using prescription drugs 64 67
People driving after using illegal drugs 83 85
%
Proportion of Drivers Who Perceive Behavior as a
Very or Somewhat Serious Threat
OR U.S.
Speed cameras on freeways (ticketing at 10+ mph over limit) † 25 36
Speed cameras on residential streets (ticketing at 10+ mph over limit)† 33 42
Red light cameras in urban areas† 43 55
Red light cameras on residential streets† 32 53
Hand-held cell phone ban (all drivers regardless of age) 58 68
Complete cell phone ban (hand-held & hands-free, all drivers regardless of age) 37 40
Ban on reading, typing, or sending text or email while driving 91 89
Requiring drivers convicted of DWI to use technology that prevents the car from starting if
the driver has been drinking77 80
Requiring all new cars to have technology to prevent the car from starting if the driver’s
alcohol level is over the legal limit65 73
Lowering the limit for DWI alcohol from 0.08 to 0.05 61 63
Law against driving with more than a certain amount of marijuana in your system 81 85
Mandatory driver education for new drivers younger than 18† 88 90
Mandatory driver education for all new drivers (regardless of age)† 88 83
Applying restrictions to all new drivers for a period of time (regardless of age) 65 66
Requiring all drivers age 85 and older to renew their license in-person† 87 87
Mandatory health screen for drivers ages 85+ at license renewal† 86 88
A law requiring all motorcycle riders to wear a helmet 73 82
"Move-over" law for passing an emergency vehicle stopped on the side of the road 98 93
A vision to reduce the number of people killed in crashes to zero 87 86*See Appendix A, Table 12 for full text of questions as asked in the survey.†These items w ere asked of a random sub-sample of respondents rather than all respondents to avoid imposing
excessive respondent burden. For OR, N ranged from 103 to 222, and for the U.S., N ranged from 969 to 1,626.
Proportion of Drivers Who Strongly or Somewhat Support Laws & Regulations*
%
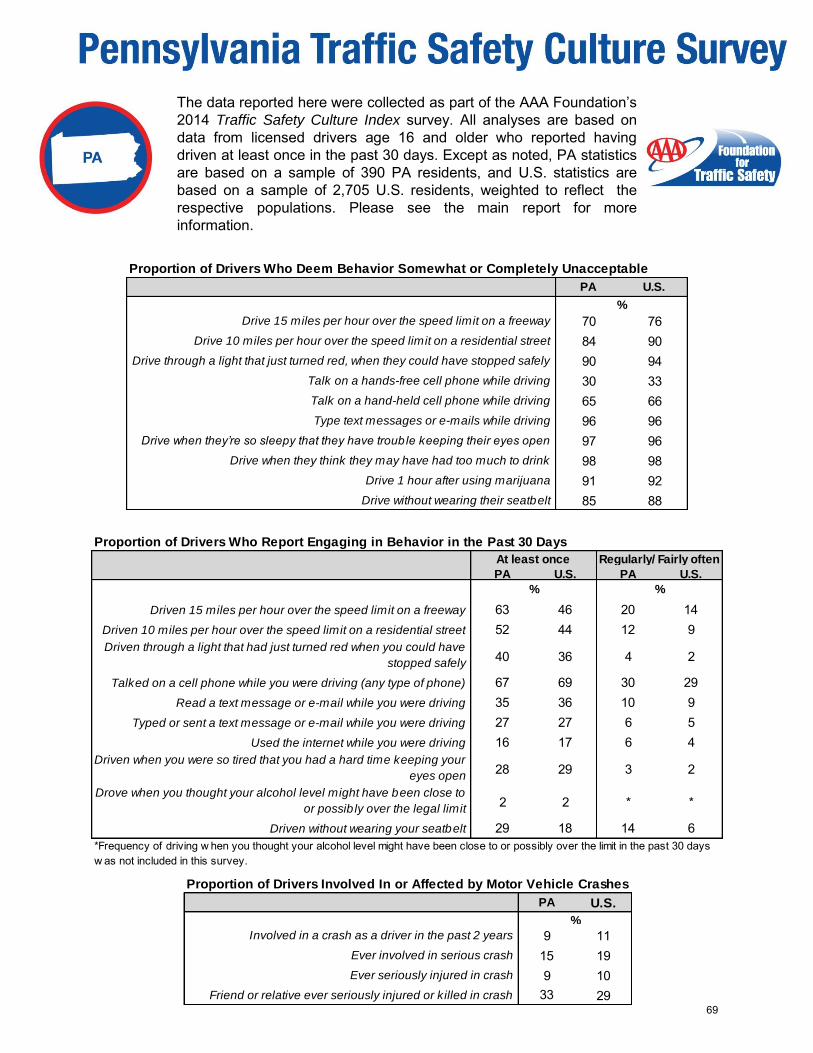
The data reported here were collected as part of the AAA Foundation’s
2014 Traffic Safety Culture Index survey. All analyses are based on
data from licensed drivers age 16 and older who reported having
driven at least once in the past 30 days. Except as noted, PA statistics
are based on a sample of 390 PA residents, and U.S. statistics are
based on a sample of 2,705 U.S. residents, weighted to reflect the
respective populations. Please see the main report for more
information.
PA U.S.
Drive 15 miles per hour over the speed limit on a freeway 70 76
Drive 10 miles per hour over the speed limit on a residential street 84 90
Drive through a light that just turned red, when they could have stopped safely 90 94
Talk on a hands-free cell phone while driving 30 33
Talk on a hand-held cell phone while driving 65 66
Type text messages or e-mails while driving 96 96
Drive when they’re so sleepy that they have trouble keeping their eyes open 97 96
Drive when they think they may have had too much to drink 98 98
Drive 1 hour after using marijuana 91 92
Drive without wearing their seatbelt 85 88
Proportion of Drivers Who Deem Behavior Somewhat or Completely Unacceptable
%
PA U.S. PA U.S.
Driven 15 miles per hour over the speed limit on a freeway 63 46 20 14
Driven 10 miles per hour over the speed limit on a residential street 52 44 12 9
Driven through a light that had just turned red when you could have
stopped safely40 36 4 2
Talked on a cell phone while you were driving (any type of phone) 67 69 30 29
Read a text message or e-mail while you were driving 35 36 10 9
Typed or sent a text message or e-mail while you were driving 27 27 6 5
Used the internet while you were driving 16 17 6 4
Driven when you were so tired that you had a hard time keeping your
eyes open28 29 3 2
Drove when you thought your alcohol level might have been close to
or possib ly over the legal limit2 2 * *
Driven without wearing your seatbelt 29 18 14 6
*Frequency of driving w hen you thought your alcohol level might have been close to or possibly over the limit in the past 30 days
w as not included in this survey.
Proportion of Drivers Who Report Engaging in Behavior in the Past 30 Days
At least once Regularly/ Fairly often
%%
PA U.S.
Involved in a crash as a driver in the past 2 years 9 11
Ever involved in serious crash 15 19
Ever seriously injured in crash 9 10
Friend or relative ever seriously injured or killed in crash 33 29
Proportion of Drivers Involved In or Affected by Motor Vehicle Crashes
%
69

2014 PA Traffic Safety Culture Survey AAA Foundation for Traffic Safety
PA US
Percentages near
90 or 10 ± 3.6 ± 1.5
80 or 20 ± 4.6 ± 2.0
70 or 30 ± 5.2 ± 2.3
60 or 40 ± 5.6 ± 2.4
50 ± 5.6 ± 2.5
Approximate Margin of Error (in Percentage
Points) for Selected Percentages
Approx. margin of error
PA U.S.
People driving aggressively 91 85
Drivers speeding on freeways 68 69
Drivers speeding on residential streets 82 81
Drivers running red lights 83 84
Drivers talking on cell phones 88 86
Drivers text messaging or e-mailing 97 97
Sleepy drivers 82 81
People driving after drinking alcohol 93 92
People driving after using prescription drugs 69 67
People driving after using illegal drugs 85 85
%
Proportion of Drivers Who Perceive Behavior as a
Very or Somewhat Serious Threat
PA U.S.
Speed cameras on freeways (ticketing at 10+ mph over limit) † 37 36
Speed cameras on residential streets (ticketing at 10+ mph over limit)† 45 42
Red light cameras in urban areas† 56 55
Red light cameras on residential streets† 61 53
Hand-held cell phone ban (all drivers regardless of age) 67 68
Complete cell phone ban (hand-held & hands-free, all drivers regardless of age) 42 40
Ban on reading, typing, or sending text or email while driving 89 89
Requiring drivers convicted of DWI to use technology that prevents the car from starting if
the driver has been drinking79 80
Requiring all new cars to have technology to prevent the car from starting if the driver’s
alcohol level is over the legal limit74 73
Lowering the limit for DWI alcohol from 0.08 to 0.05 61 63
Law against driving with more than a certain amount of marijuana in your system 86 85
Mandatory driver education for new drivers younger than 18† 91 90
Mandatory driver education for all new drivers (regardless of age)† 78 83
Applying restrictions to all new drivers for a period of time (regardless of age) 69 66
Requiring all drivers age 85 and older to renew their license in-person† 85 87
Mandatory health screen for drivers ages 85+ at license renewal† 90 88
A law requiring all motorcycle riders to wear a helmet 78 82
"Move-over" law for passing an emergency vehicle stopped on the side of the road 93 93
A vision to reduce the number of people killed in crashes to zero 88 86*See Appendix A, Table 12 for full text of questions as asked in the survey.†These items w ere asked of a random sub-sample of respondents rather than all respondents to avoid imposing
excessive respondent burden. For PA, N ranged from 137 to 250, and for the U.S., N ranged from 969 to 1,626.
Proportion of Drivers Who Strongly or Somewhat Support Laws & Regulations*
%

The data reported here were collected as part of the AAA Foundation’s
2014 Traffic Safety Culture Index survey. Analyses are based on data
from licensed drivers who reported having driven at least once in the
past 30 days. RI statistics are based on the responses of 336 drivers
ages 18 and older who completed a survey administered by mail to a
simple random sample of addresses in RI. U.S. statistics are based on
a sample of 2,705 U.S. residents age 16 and older who completed the
survey online, and responses were weighted to reflect the population.
Please see the main report for more information.
RI U.S.
Drive 15 miles per hour over the speed limit on a freeway 58 76
Drive 10 miles per hour over the speed limit on a residential street 74 90
Drive through a light that just turned red, when they could have stopped safely 95 94
Talk on a hands-free cell phone while driving 31 33
Talk on a hand-held cell phone while driving 63 66
Type text messages or e-mails while driving 95 96
Drive when they’re so sleepy that they have trouble keeping their eyes open 96 96
Drive when they think they may have had too much to drink 96 98
Drive 1 hour after using marijuana 90 92
Drive without wearing their seatbelt 89 88
Proportion of Drivers Who Deem Behavior Somewhat or Completely Unacceptable
%
RI U.S. RI U.S.
Driven 15 miles per hour over the speed limit on a freeway 71 46 27 14
Driven 10 miles per hour over the speed limit on a residential street 71 44 24 9
Driven through a light that had just turned red when you could have
stopped safely46 36 1 2
Talked on a cell phone while you were driving (any type of phone) 85 69 52 29
Read a text message or e-mail while you were driving 36 36 8 9
Typed or sent a text message or e-mail while you were driving 25 27 6 5
Used the internet while you were driving 13 17 1 4
Driven when you were so tired that you had a hard time keeping your
eyes open35 29 2 2
Drove when you thought your alcohol level might have been close to
or possib ly over the legal limit3 2 * *
Driven without wearing your seatbelt 21 18 6 6*Frequency of driving w hen you thought your alcohol level might have been close to or possibly over the limit in the past 30 days
w as not included in this survey.
Proportion of Drivers Who Report Engaging in Behavior in the Past 30 Days
At least once Regularly/ Fairly often
%%
RI U.S.
Involved in a crash as a driver in the past 2 years 18 11
Ever involved in serious crash 31 19
Ever seriously injured in crash 16 10
Friend or relative ever seriously injured or killed in crash 48 29
Proportion of Drivers Involved In or Affected by Motor Vehicle Crashes
%
71
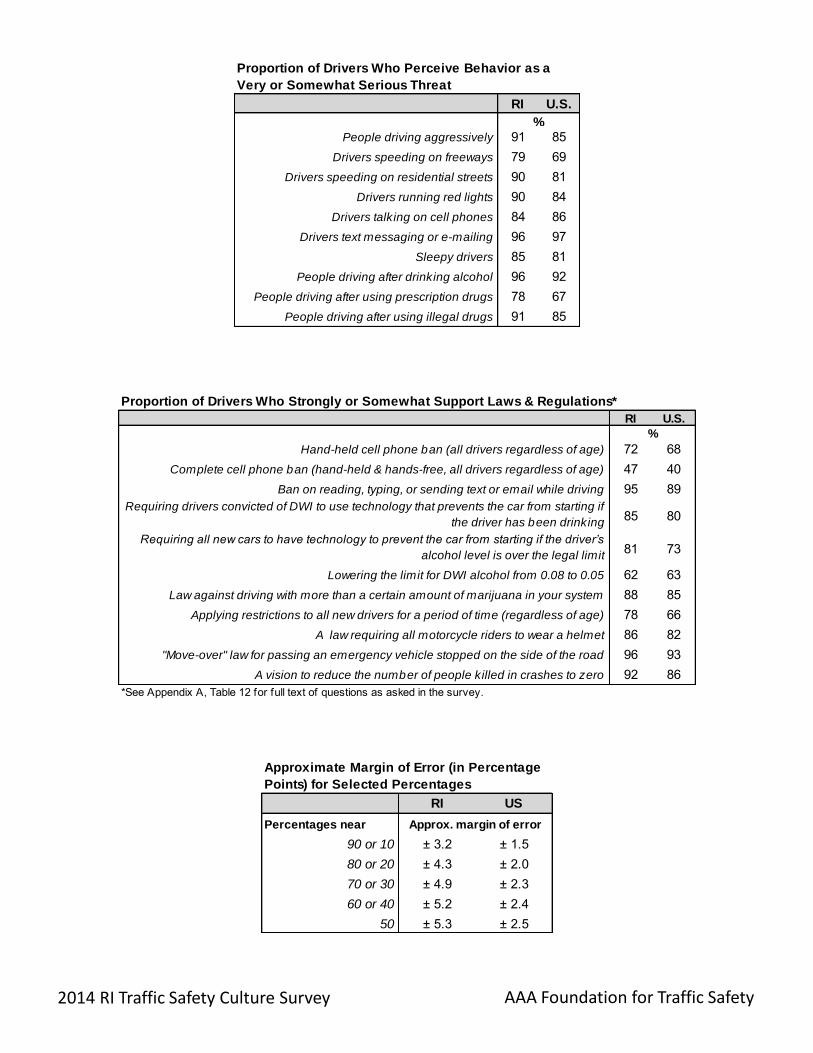
2014 RI Traffic Safety Culture Survey AAA Foundation for Traffic Safety
RI U.S.
People driving aggressively 91 85
Drivers speeding on freeways 79 69
Drivers speeding on residential streets 90 81
Drivers running red lights 90 84
Drivers talking on cell phones 84 86
Drivers text messaging or e-mailing 96 97
Sleepy drivers 85 81
People driving after drinking alcohol 96 92
People driving after using prescription drugs 78 67
People driving after using illegal drugs 91 85
%
Proportion of Drivers Who Perceive Behavior as a
Very or Somewhat Serious Threat
RI U.S.
Hand-held cell phone ban (all drivers regardless of age) 72 68
Complete cell phone ban (hand-held & hands-free, all drivers regardless of age) 47 40
Ban on reading, typing, or sending text or email while driving 95 89
Requiring drivers convicted of DWI to use technology that prevents the car from starting if
the driver has been drinking85 80
Requiring all new cars to have technology to prevent the car from starting if the driver’s
alcohol level is over the legal limit81 73
Lowering the limit for DWI alcohol from 0.08 to 0.05 62 63
Law against driving with more than a certain amount of marijuana in your system 88 85
Applying restrictions to all new drivers for a period of time (regardless of age) 78 66
A law requiring all motorcycle riders to wear a helmet 86 82
"Move-over" law for passing an emergency vehicle stopped on the side of the road 96 93
A vision to reduce the number of people killed in crashes to zero 92 86
*See Appendix A, Table 12 for full text of questions as asked in the survey.
Proportion of Drivers Who Strongly or Somewhat Support Laws & Regulations*
%
RI US
Percentages near
90 or 10 ± 3.2 ± 1.5
80 or 20 ± 4.3 ± 2.0
70 or 30 ± 4.9 ± 2.3
60 or 40 ± 5.2 ± 2.4
50 ± 5.3 ± 2.5
Approximate Margin of Error (in Percentage
Points) for Selected Percentages
Approx. margin of error

The data reported here were collected as part of the AAA Foundation’s
2014 Traffic Safety Culture Index survey. All analyses are based on
data from licensed drivers age 16 and older who reported having
driven at least once in the past 30 days. Except as noted, TN statistics
are based on a sample of 297 TN residents, and U.S. statistics are
based on a sample of 2,705 U.S. residents, weighted to reflect the
respective populations. Please see the main report for more
information.
TN U.S.
Drive 15 miles per hour over the speed limit on a freeway 77 76
Drive 10 miles per hour over the speed limit on a residential street 91 90
Drive through a light that just turned red, when they could have stopped safely 95 94
Talk on a hands-free cell phone while driving 29 33
Talk on a hand-held cell phone while driving 50 66
Type text messages or e-mails while driving 97 96
Drive when they’re so sleepy that they have trouble keeping their eyes open 98 96
Drive when they think they may have had too much to drink 99 98
Drive 1 hour after using marijuana 90 92
Drive without wearing their seatbelt 85 88
Proportion of Drivers Who Deem Behavior Somewhat or Completely Unacceptable
%
TN U.S. TN U.S.
Driven 15 miles per hour over the speed limit on a freeway 51 46 14 14
Driven 10 miles per hour over the speed limit on a residential street 52 44 7 9
Driven through a light that had just turned red when you could have
stopped safely37 36 2 2
Talked on a cell phone while you were driving (any type of phone) 77 69 37 29
Read a text message or e-mail while you were driving 47 36 12 9
Typed or sent a text message or e-mail while you were driving 34 27 7 5
Used the internet while you were driving 20 17 6 4
Driven when you were so tired that you had a hard time keeping your
eyes open33 29 3 2
Drove when you thought your alcohol level might have been close to
or possib ly over the legal limit0 2 * *
Driven without wearing your seatbelt 22 18 7 6
*Frequency of driving w hen you thought your alcohol level might have been close to or possibly over the limit in the past 30 days
w as not included in this survey.
Proportion of Drivers Who Report Engaging in Behavior in the Past 30 Days
At least once Regularly/ Fairly often
%%
TN U.S.
Involved in a crash as a driver in the past 2 years 12 11
Ever involved in serious crash 23 19
Ever seriously injured in crash 13 10
Friend or relative ever seriously injured or killed in crash 35 29
Proportion of Drivers Involved In or Affected by Motor Vehicle Crashes
%
73

2014 TN Traffic Safety Culture Survey AAA Foundation for Traffic Safety
TN U.S.
People driving aggressively 85 85
Drivers speeding on freeways 66 69
Drivers speeding on residential streets 82 81
Drivers running red lights 80 84
Drivers talking on cell phones 86 86
Drivers text messaging or e-mailing 98 97
Sleepy drivers 79 81
People driving after drinking alcohol 93 92
People driving after using prescription drugs 72 67
People driving after using illegal drugs 83 85
%
Proportion of Drivers Who Perceive Behavior as a
Very or Somewhat Serious Threat
TN US
Percentages near
90 or 10 ± 4.0 ± 1.5
80 or 20 ± 5.3 ± 2.0
70 or 30 ± 6.1 ± 2.3
60 or 40 ± 6.6 ± 2.4
50 ± 6.7 ± 2.5
Approximate Margin of Error (in Percentage
Points) for Selected Percentages
Approx. margin of error
TN U.S.
Speed cameras on freeways (ticketing at 10+ mph over limit) † 35 36
Speed cameras on residential streets (ticketing at 10+ mph over limit)† 38 42
Red light cameras in urban areas† 41 55
Red light cameras on residential streets† 53 53
Hand-held cell phone ban (all drivers regardless of age) 58 68
Complete cell phone ban (hand-held & hands-free, all drivers regardless of age) 37 40
Ban on reading, typing, or sending text or email while driving 89 89
Requiring drivers convicted of DWI to use technology that prevents the car from starting if
the driver has been drinking88 80
Requiring all new cars to have technology to prevent the car from starting if the driver’s
alcohol level is over the legal limit74 73
Lowering the limit for DWI alcohol from 0.08 to 0.05 65 63
Law against driving with more than a certain amount of marijuana in your system 87 85
Mandatory driver education for new drivers younger than 18† 91 90
Mandatory driver education for all new drivers (regardless of age)† 86 83
Applying restrictions to all new drivers for a period of time (regardless of age) 63 66
Requiring all drivers age 85 and older to renew their license in-person† 80 87
Mandatory health screen for drivers ages 85+ at license renewal† 88 88
A law requiring all motorcycle riders to wear a helmet 88 82
"Move-over" law for passing an emergency vehicle stopped on the side of the road 97 93
A vision to reduce the number of people killed in crashes to zero 92 86*See Appendix A, Table 10 for full text of questions as asked in the survey.†These items w ere asked of a random sub-sample of respondents rather than all respondents to avoid imposing
excessive respondent burden. For TN, N ranged from 107 to 199, and for the U.S., N ranged from 969 to 1,626.
Proportion of Drivers Who Strongly or Somewhat Support Laws & Regulations*
%

The data reported here were collected as part of the AAA Foundation’s
2014 Traffic Safety Culture Index survey. All analyses are based on
data from licensed drivers age 16 and older who reported having
driven at least once in the past 30 days. Except as noted, TX statistics
are based on a sample of 377 TX residents, and U.S. statistics are
based on a sample of 2,705 U.S. residents, weighted to reflect the
respective populations. Please see the main report for more
information.
TX U.S.
Drive 15 miles per hour over the speed limit on a freeway 84 76
Drive 10 miles per hour over the speed limit on a residential street 93 90
Drive through a light that just turned red, when they could have stopped safely 93 94
Talk on a hands-free cell phone while driving 33 33
Talk on a hand-held cell phone while driving 64 66
Type text messages or e-mails while driving 94 96
Drive when they’re so sleepy that they have trouble keeping their eyes open 95 96
Drive when they think they may have had too much to drink 97 98
Drive 1 hour after using marijuana 92 92
Drive without wearing their seatbelt 91 88
Proportion of Drivers Who Deem Behavior Somewhat or Completely Unacceptable
%
TX U.S. TX U.S.
Driven 15 miles per hour over the speed limit on a freeway 41 46 10 14
Driven 10 miles per hour over the speed limit on a residential street 38 44 9 9
Driven through a light that had just turned red when you could have
stopped safely32 36 2 2
Talked on a cell phone while you were driving (any type of phone) 74 69 30 29
Read a text message or e-mail while you were driving 39 36 9 9
Typed or sent a text message or e-mail while you were driving 29 27 6 5
Used the internet while you were driving 16 17 4 4
Driven when you were so tired that you had a hard time keeping your
eyes open27 29 3 2
Drove when you thought your alcohol level might have been close to
or possib ly over the legal limit1 2 * *
Driven without wearing your seatbelt 13 18 3 6
*Frequency of driving w hen you thought your alcohol level might have been close to or possibly over the limit in the past 30 days
w as not included in this survey.
Proportion of Drivers Who Report Engaging in Behavior in the Past 30 Days
At least once Regularly/ Fairly often
%%
TX U.S.
Involved in a crash as a driver in the past 2 years 12 11
Ever involved in serious crash 18 19
Ever seriously injured in crash 10 10
Friend or relative ever seriously injured or killed in crash 31 29
Proportion of Drivers Involved In or Affected by Motor Vehicle Crashes
%
75

2014 TX Traffic Safety Culture Survey AAA Foundation for Traffic Safety
TX US
Percentages near
90 or 10 ± 3.8 ± 1.5
80 or 20 ± 4.9 ± 2.0
70 or 30 ± 5.6 ± 2.3
60 or 40 ± 6.0 ± 2.4
50 ± 6.2 ± 2.5
Approximate Margin of Error (in Percentage
Points) for Selected Percentages
Approx. margin of error
TX U.S.
Speed cameras on freeways (ticketing at 10+ mph over limit) † 35 36
Speed cameras on residential streets (ticketing at 10+ mph over limit)† 52 42
Red light cameras in urban areas† 63 55
Red light cameras on residential streets† 65 53
Hand-held cell phone ban (all drivers regardless of age) 68 68
Complete cell phone ban (hand-held & hands-free, all drivers regardless of age) 43 40
Ban on reading, typing, or sending text or email while driving 85 89
Requiring drivers convicted of DWI to use technology that prevents the car from starting if
the driver has been drinking85 80
Requiring all new cars to have technology to prevent the car from starting if the driver’s
alcohol level is over the legal limit71 73
Lowering the limit for DWI alcohol from 0.08 to 0.05 65 63
Law against driving with more than a certain amount of marijuana in your system 84 85
Mandatory driver education for new drivers younger than 18† 90 90
Mandatory driver education for all new drivers (regardless of age)† 83 83
Applying restrictions to all new drivers for a period of time (regardless of age) 65 66
Requiring all drivers age 85 and older to renew their license in-person† 93 87
Mandatory health screen for drivers ages 85+ at license renewal† 86 88
A law requiring all motorcycle riders to wear a helmet 81 82
"Move-over" law for passing an emergency vehicle stopped on the side of the road 94 93
A vision to reduce the number of people killed in crashes to zero 85 86*See Appendix A, Table 10 for full text of questions as asked in the survey.†These items w ere asked of a random sub-sample of respondents rather than all respondents to avoid imposing
excessive respondent burden. For TX, N ranged from 131 to 229, and for the U.S., N ranged from 969 to 1,626.
Proportion of Drivers Who Strongly or Somewhat Support Laws & Regulations*
%
TX U.S.
People driving aggressively 87 85
Drivers speeding on freeways 77 69
Drivers speeding on residential streets 83 81
Drivers running red lights 90 84
Drivers talking on cell phones 91 86
Drivers text messaging or e-mailing 95 97
Sleepy drivers 87 81
People driving after drinking alcohol 93 92
People driving after using prescription drugs 78 67
People driving after using illegal drugs 89 85
%
Proportion of Drivers Who Perceive Behavior as a
Very or Somewhat Serious Threat

The data reported here were collected as part of the AAA Foundation’s
2014 Traffic Safety Culture Index survey. All analyses are based on
data from licensed drivers age 16 and older who reported having
driven at least once in the past 30 days. Except as noted, VA statistics
are based on a sample of 391 VA residents, and U.S. statistics are
based on a sample of 2,705 U.S. residents, weighted to reflect the
respective populations. Please see the main report for more
information.
VA U.S. VA U.S.
Driven 15 miles per hour over the speed limit on a freeway 40 46 9 14
Driven 10 miles per hour over the speed limit on a residential street 46 44 12 9
Driven through a light that had just turned red when you could have
stopped safely40 36 2 2
Talked on a cell phone while you were driving (any type of phone) 80 69 37 29
Read a text message or e-mail while you were driving 44 36 13 9
Typed or sent a text message or e-mail while you were driving 30 27 8 5
Used the internet while you were driving 22 17 4 4
Driven when you were so tired that you had a hard time keeping your
eyes open35 29 3 2
Drove when you thought your alcohol level might have been close to
or possib ly over the legal limit1 2 * *
Driven without wearing your seatbelt 20 18 6 6
*Frequency of driving w hen you thought your alcohol level might have been close to or possibly over the limit in the past 30 days
w as not included in this survey.
Proportion of Drivers Who Report Engaging in Behavior in the Past 30 Days
At least once Regularly/ Fairly often
%%
VA U.S.
Drive 15 miles per hour over the speed limit on a freeway 76 76
Drive 10 miles per hour over the speed limit on a residential street 90 90
Drive through a light that just turned red, when they could have stopped safely 93 94
Talk on a hands-free cell phone while driving 27 33
Talk on a hand-held cell phone while driving 54 66
Type text messages or e-mails while driving 96 96
Drive when they’re so sleepy that they have trouble keeping their eyes open 96 96
Drive when they think they may have had too much to drink 98 98
Drive 1 hour after using marijuana 93 92
Drive without wearing their seatbelt 88 88
Proportion of Drivers Who Deem Behavior Somewhat or Completely Unacceptable
%
VA U.S.
Involved in a crash as a driver in the past 2 years 10 11
Ever involved in serious crash 20 19
Ever seriously injured in crash 9 10
Friend or relative ever seriously injured or killed in crash 30 29
Proportion of Drivers Involved In or Affected by Motor Vehicle Crashes
%
77

2014 VA Traffic Safety Culture Survey AAA Foundation for Traffic Safety
VA U.S.
People driving aggressively 85 85
Drivers speeding on freeways 64 69
Drivers speeding on residential streets 80 81
Drivers running red lights 81 84
Drivers talking on cell phones 81 86
Drivers text messaging or e-mailing 96 97
Sleepy drivers 79 81
People driving after drinking alcohol 90 92
People driving after using prescription drugs 59 67
People driving after using illegal drugs 83 85
%
Proportion of Drivers Who Perceive Behavior as a
Very or Somewhat Serious Threat
VA US
Percentages near
90 or 10 ± 4.1 ± 1.5
80 or 20 ± 5.3 ± 2.0
70 or 30 ± 6.2 ± 2.3
60 or 40 ± 6.7 ± 2.4
50 ± 6.9 ± 2.5
Approximate Margin of Error (in Percentage
Points) for Selected Percentages
Approx. margin of error
VA U.S.
Speed cameras on freeways (ticketing at 10+ mph over limit) † 31 36
Speed cameras on residential streets (ticketing at 10+ mph over limit)† 49 42
Red light cameras in urban areas† 52 55
Red light cameras on residential streets† 65 53
Hand-held cell phone ban (all drivers regardless of age) 61 68
Complete cell phone ban (hand-held & hands-free, all drivers regardless of age) 38 40
Ban on reading, typing, or sending text or email while driving 83 89
Requiring drivers convicted of DWI to use technology that prevents the car from starting if
the driver has been drinking78 80
Requiring all new cars to have technology to prevent the car from starting if the driver’s
alcohol level is over the legal limit69 73
Lowering the limit for DWI alcohol from 0.08 to 0.05 61 63
Law against driving with more than a certain amount of marijuana in your system 81 85
Mandatory driver education for new drivers younger than 18† 89 90
Mandatory driver education for all new drivers (regardless of age)† 76 83
Applying restrictions to all new drivers for a period of time (regardless of age) 66 66
Requiring all drivers age 85 and older to renew their license in-person† 90 87
Mandatory health screen for drivers ages 85+ at license renewal† 87 88
A law requiring all motorcycle riders to wear a helmet 88 82
"Move-over" law for passing an emergency vehicle stopped on the side of the road 92 93
A vision to reduce the number of people killed in crashes to zero 83 86*See Appendix A, Table 12 for full text of questions as asked in the survey.†These items w ere asked of a random sub-sample of respondents rather than all respondents to avoid imposing
excessive respondent burden. For VA, N ranged from 127 to 249, and for the U.S., N ranged from 969 to 1,626.
Proportion of Drivers Who Strongly or Somewhat Support Laws & Regulations*
%

The data reported here were collected as part of the AAA Foundation’s
2014 Traffic Safety Culture Index survey. All analyses are based on
data from licensed drivers age 16 and older who reported having
driven at least once in the past 30 days. Except as noted, WA statistics
are based on a sample of 360 WA residents, and U.S. statistics are
based on a sample of 2,705 U.S. residents, weighted to reflect the
respective populations. Please see the main report for more
information.
WA U.S.
Drive 15 miles per hour over the speed limit on a freeway 76 76
Drive 10 miles per hour over the speed limit on a residential street 88 90
Drive through a light that just turned red, when they could have stopped safely 93 94
Talk on a hands-free cell phone while driving 38 33
Talk on a hand-held cell phone while driving 84 66
Type text messages or e-mails while driving 93 96
Drive when they’re so sleepy that they have trouble keeping their eyes open 96 96
Drive when they think they may have had too much to drink 95 98
Drive 1 hour after using marijuana 83 92
Drive without wearing their seatbelt 86 88
Proportion of Drivers Who Deem Behavior Somewhat or Completely Unacceptable
%
WA U.S. WA U.S.
Driven 15 miles per hour over the speed limit on a freeway 35 46 8 14
Driven 10 miles per hour over the speed limit on a residential street 37 44 10 9
Driven through a light that had just turned red when you could have
stopped safely24 36 1 2
Talked on a cell phone while you were driving (any type of phone) 59 69 20 29
Read a text message or e-mail while you were driving 34 36 10 9
Typed or sent a text message or e-mail while you were driving 27 27 7 5
Used the internet while you were driving 15 17 7 4
Driven when you were so tired that you had a hard time keeping your
eyes open24 29 2 2
Drove when you thought your alcohol level might have been close to
or possib ly over the legal limit2 2 * *
Driven without wearing your seatbelt 10 18 4 6
*Frequency of driving w hen you thought your alcohol level might have been close to or possibly over the limit in the past 30 days
w as not included in this survey.
Proportion of Drivers Who Report Engaging in Behavior in the Past 30 Days
At least once Regularly/ Fairly often
%%
WA U.S.
Involved in a crash as a driver in the past 2 years 10 11
Ever involved in serious crash 22 19
Ever seriously injured in crash 11 10
Friend or relative ever seriously injured or killed in crash 27 29
Proportion of Drivers Involved In or Affected by Motor Vehicle Crashes
%
79

2014 WA Traffic Safety Culture Survey AAA Foundation for Traffic Safety
WA US
Percentages near
90 or 10 ± 3.9 ± 1.5
80 or 20 ± 5.0 ± 2.0
70 or 30 ± 5.9 ± 2.3
60 or 40 ± 6.2 ± 2.4
50 ± 6.4 ± 2.5
Approximate Margin of Error (in Percentage
Points) for Selected Percentages
Approx. margin of error
WA U.S.
People driving aggressively 85 85
Drivers speeding on freeways 64 69
Drivers speeding on residential streets 77 81
Drivers running red lights 84 84
Drivers talking on cell phones 87 86
Drivers text messaging or e-mailing 95 97
Sleepy drivers 75 81
People driving after drinking alcohol 90 92
People driving after using prescription drugs 63 67
People driving after using illegal drugs 83 85
%
Proportion of Drivers Who Perceive Behavior as a
Very or Somewhat Serious Threat
WA U.S.
Speed cameras on freeways (ticketing at 10+ mph over limit) † 26 36
Speed cameras on residential streets (ticketing at 10+ mph over limit)† 54 42
Red light cameras in urban areas† 54 55
Red light cameras on residential streets† 58 53
Hand-held cell phone ban (all drivers regardless of age) 82 68
Complete cell phone ban (hand-held & hands-free, all drivers regardless of age) 42 40
Ban on reading, typing, or sending text or email while driving 92 89
Requiring drivers convicted of DWI to use technology that prevents the car from starting if
the driver has been drinking80 80
Requiring all new cars to have technology to prevent the car from starting if the driver’s
alcohol level is over the legal limit63 73
Lowering the limit for DWI alcohol from 0.08 to 0.05 60 63
Law against driving with more than a certain amount of marijuana in your system 84 85
Mandatory driver education for new drivers younger than 18† 87 90
Mandatory driver education for all new drivers (regardless of age)† 77 83
Applying restrictions to all new drivers for a period of time (regardless of age) 63 66
Requiring all drivers age 85 and older to renew their license in-person† 89 87
Mandatory health screen for drivers ages 85+ at license renewal† 83 88
A law requiring all motorcycle riders to wear a helmet 87 82
"Move-over" law for passing an emergency vehicle stopped on the side of the road 88 93
A vision to reduce the number of people killed in crashes to zero 79 86*See Appendix A, Table 12 for full text of questions as asked in the survey.†These items w ere asked of a random sub-sample of respondents rather than all respondents to avoid imposing
excessive respondent burden. For WA, N ranged from 115 to 242, and for the U.S., N ranged from 969 to 1,626.
Proportion of Drivers Who Strongly or Somewhat Support Laws & Regulations*
%

The data reported here were collected as part of the AAA Foundation’s
2014 Traffic Safety Culture Index survey. All analyses are based on
data from licensed drivers age 16 and older who reported having
driven at least once in the past 30 days. Except as noted, WI statistics
are based on a sample of 408 WI residents, and U.S. statistics are
based on a sample of 2,705 U.S. residents, weighted to reflect the
respective populations. Please see the main report for more
information.
WI U.S.
Drive 15 miles per hour over the speed limit on a freeway 80 76
Drive 10 miles per hour over the speed limit on a residential street 91 90
Drive through a light that just turned red, when they could have stopped safely 94 94
Talk on a hands-free cell phone while driving 35 33
Talk on a hand-held cell phone while driving 61 66
Type text messages or e-mails while driving 97 96
Drive when they’re so sleepy that they have trouble keeping their eyes open 97 96
Drive when they think they may have had too much to drink 98 98
Drive 1 hour after using marijuana 92 92
Drive without wearing their seatbelt 85 88
Proportion of Drivers Who Deem Behavior Somewhat or Completely Unacceptable
%
WI U.S. WI U.S.
Driven 15 miles per hour over the speed limit on a freeway 37 46 8 14
Driven 10 miles per hour over the speed limit on a residential street 40 44 9 9
Driven through a light that had just turned red when you could have
stopped safely29 36 2 2
Talked on a cell phone while you were driving (any type of phone) 68 69 28 29
Read a text message or e-mail while you were driving 33 36 7 9
Typed or sent a text message or e-mail while you were driving 21 27 5 5
Used the internet while you were driving 13 17 5 4
Driven when you were so tired that you had a hard time keeping your
eyes open25 29 2 2
Drove when you thought your alcohol level might have been close to
or possib ly over the legal limit3 2 * *
Driven without wearing your seatbelt 20 18 10 6
*Frequency of driving w hen you thought your alcohol level might have been close to or possibly over the limit in the past 30 days
w as not included in this survey.
Proportion of Drivers Who Report Engaging in Behavior in the Past 30 Days
At least once Regularly/ Fairly often
%%
WI U.S.
Involved in a crash as a driver in the past 2 years 7 11
Ever involved in serious crash 20 19
Ever seriously injured in crash 11 10
Friend or relative ever seriously injured or killed in crash 39 29
Proportion of Drivers Involved In or Affected by Motor Vehicle Crashes
%
81

2014 WI Traffic Safety Culture Survey AAA Foundation for Traffic Safety
WI US
Percentages near
90 or 10 ± 3.5 ± 1.5
80 or 20 ± 4.7 ± 2.0
70 or 30 ± 5.5 ± 2.3
60 or 40 ± 6.0 ± 2.4
50 ± 6.1 ± 2.5
Approximate Margin of Error (in Percentage
Points) for Selected Percentages
Approx. margin of error
WI U.S.
People driving aggressively 85 85
Drivers speeding on freeways 64 69
Drivers speeding on residential streets 79 81
Drivers running red lights 78 84
Drivers talking on cell phones 86 86
Drivers text messaging or e-mailing 97 97
Sleepy drivers 79 81
People driving after drinking alcohol 92 92
People driving after using prescription drugs 66 67
People driving after using illegal drugs 82 85
%
Proportion of Drivers Who Perceive Behavior as a
Very or Somewhat Serious Threat
WI U.S.
Speed cameras on freeways (ticketing at 10+ mph over limit) † 26 36
Speed cameras on residential streets (ticketing at 10+ mph over limit)† 54 42
Red light cameras in urban areas† 54 55
Red light cameras on residential streets† 58 53
Hand-held cell phone ban (all drivers regardless of age) 82 68
Complete cell phone ban (hand-held & hands-free, all drivers regardless of age) 42 40
Ban on reading, typing, or sending text or email while driving 92 89
Requiring drivers convicted of DWI to use technology that prevents the car from starting if
the driver has been drinking80 80
Requiring all new cars to have technology to prevent the car from starting if the driver’s
alcohol level is over the legal limit63 73
Lowering the limit for DWI alcohol from 0.08 to 0.05 60 63
Law against driving with more than a certain amount of marijuana in your system 84 85
Mandatory driver education for new drivers younger than 18† 87 90
Mandatory driver education for all new drivers (regardless of age)† 77 83
Applying restrictions to all new drivers for a period of time (regardless of age) 63 66
Requiring all drivers age 85 and older to renew their license in-person† 89 87
Mandatory health screen for drivers ages 85+ at license renewal† 83 88
A law requiring all motorcycle riders to wear a helmet 87 82
"Move-over" law for passing an emergency vehicle stopped on the side of the road 88 93
A vision to reduce the number of people killed in crashes to zero 79 86*See Appendix A, Table 12 for full text of questions as asked in the survey.†These items w ere asked of a random sub-sample of respondents rather than all respondents to avoid imposing
excessive respondent burden. For WI, N ranged from 153 to 266, and for the U.S., N ranged from 969 to 1,626.
Proportion of Drivers Who Strongly or Somewhat Support Laws & Regulations*
%