2014 year-end statistical report training membership income expenses
TRANSCRIPT

2014 YEAR-END STATISTICAL REPORT TRAINING
MEMBERSHIP
INCOME
EXPENSES

LOCAL CHURCH YEAR–END STATISTICAL REPORT TRAINING
• OVERVIEW• TABLE 1– Membership & Participation• TABLE 2– Church Assets & Expenses• TABLE 3– Church Income• Netting Concept w/ Examples
2
OVERVIEW
DEADLINE: January 31, 2015All pastors of local churches are required to submit a year-end statistical report each year
[The Book of Discipline ¶ 606.7] by January 31st.
Website : http://ezra.gcfa.org
There have been NO MAJOR CHANGES to the Tables from last year,
with the exception of the expansion of question 10.
3

PROCESS
• First Log In with the Information Provided to you by the Conference Office.
Username: 3360_ _ _ _ (4-Digit Church Number)
Password: gnjchurch14You will be prompted to change your password, and please note the conference office does not have access to your new
password. Keep the username and password available for all users.
• Print a Blank Report Form• Collect your statistics and fill them in on the blank form.
NOTE: Remember prior year information can not be changed
4

PROCESS
• Once you have completed the forms, Click Enter Stats option to fill them in online.
Note: Navigating over each line or clicking the ? at the end of each line will give you an explanation for what is being asked.
• Make sure you save each table before going to another.• You can Save, but not Submit with errors.
All errors must be corrected.• Provide an explanation for all warnings before you submit
your final Stats.
5

PROCESS
• Submit Stats by January 31, 2015.• Your Stats will be vetted by conference staff after final
submission and if there are any questions or errors you will be contacted via email.
• Final Statistical Report is submitted by the Conference to GCFA pursuant to their due date in Spring of 2015.
6
TABLE 1: MEMBERSHIP &PARTICIPATION
Membership & Participation statistics are the key components to church vitality.• Line 1 cannot be changed. If there is an error,
use lines 2c (+) or 5c (-), so that Line 9 is accurate.
• Lines 9a – 9i are used by GCFA to gather data to spot geographical trends. If not known, use your best estimate.
7

TABLE 1
• Line 10 – Average Worship Attendance at all Weekly Worship Services
The following additional questions associated with Line 10 are informational.
10a – Number of visitors at all worship services during the year. 10b – Number of those who worship online via the churches website.
8
TABLE 2: CHURCH ASSETS & EXPENSES
Table 2 includes both Church Assets and Church Expenses.
9

TABLE 2
Balance Sheet Items (Assets and Liabilities)• 31 - Market Value of church property, parsonages, and
equipment• 32 - Market Value of liquid assets (i.e. Endowments, Trust Funds, etc.)
& other property • 33 - Debt secured by church assets (i.e. mortgage)• 34a - Other Debts (i.e. credit cards, unsecured lines of credit)• 34b - Conference Debt Completed by Conference Office• Lines 35-42 Completed by Conference
NOTE: Lines 31-42 are not included in your Shared Ministry Calculation.
10
TABLE 2
Church Expenses Lines 43 – 60• 43 – Amounts given directly to United Methodist Benevolence
Causes (not sent to the Conference Office)– i.e. UMCOR, or Neighborhood Center– Net loss from a Church Subsidiary Organization (i.e. Church Operated Preschools)
• 44 – Amounts given to non-United Methodist Benevolence and Charitable Causes (not sent to Conference Office)
– i.e. Habitat for Humanity, Community food pantries, Girl Scouts & Boy Scouts not chartered by the church, community theatre group, adult school, and exercise & weight loss groups that promote global health.
– Net loss from church sponsored non-United Methodist programs.– Line 44 will be included in Shared Ministry calculations for the following year 2016
Only if 100% of prior year’s Shared Ministry was not paid.
11

TABLE 2
• 48 & 49 – Pastor and Associate Pastor’s base compensation.• 50a – 50b (50) – Pastor and Associate Pastor’s Housing
Expenses paid.– Utilities for parsonage or housing allowance or rent paid in lieu of a
parsonage.– Do not include Capital Improvements
• 51a – 51b (51) – Pastor and Associate Pastor’s Accountable Reimbursements.
• 52a – 52b (52) – Pastor and Associate Pastor’s Cash Allowances. (Do not include Conference Health Plan Premiums)
12

TABLE 2
• 53 & 54 – Deacon and Diaconal Ministers Salary and Benefits. (Do not include Conference Health Plan Premiums)
• 55 – Other Staff Salary & Benefits 55a - Other Staff Compensation 55b - Church share of Payroll Taxes (FICA/ Medicare) 55c - Other Staff Expenses (i.e. 1099 independent contractors) 55d - Church share of staff Health Plan Premiums
(Do not include any Conference Health Plan Premiums)
– Staff includes all employees who receive a W-2 and does not include those who receive a 1099.
Note: Anyone who you control their time and duties are considered employees and should receive W-2s at year-end.
13
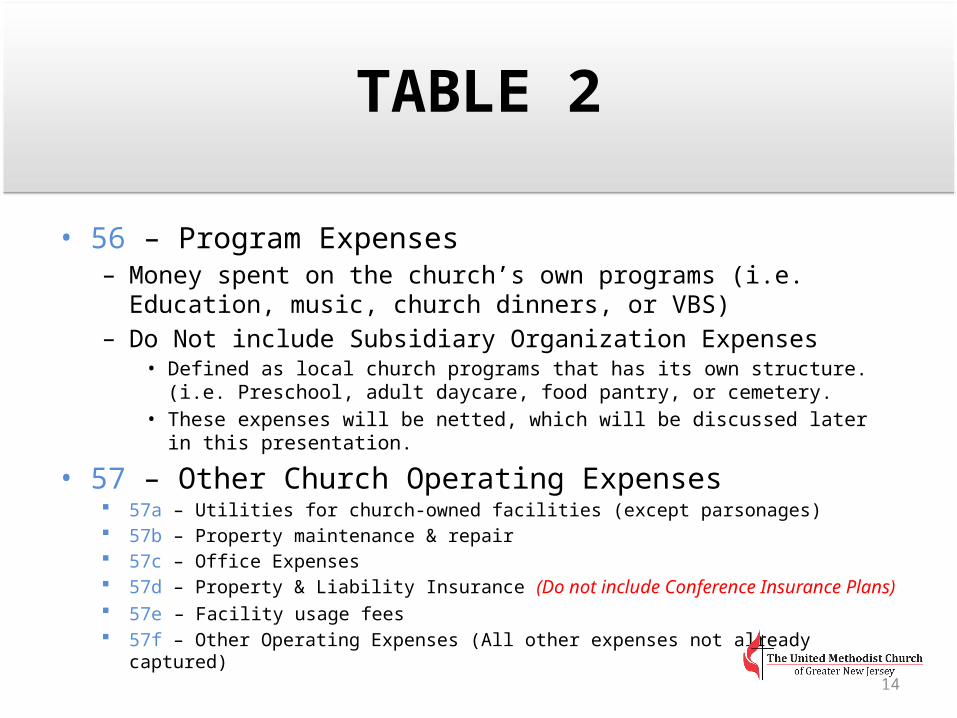
TABLE 2
• 56 – Program Expenses– Money spent on the church’s own programs (i.e. Education, music,
church dinners, or VBS)– Do Not include Subsidiary Organization Expenses
• Defined as local church programs that has its own structure. (i.e. Preschool, adult daycare, food pantry, or cemetery.
• These expenses will be netted, which will be discussed later in this presentation.
• 57 – Other Church Operating Expenses 57a – Utilities for church-owned facilities (except parsonages) 57b – Property maintenance & repair 57c – Office Expenses 57d – Property & Liability Insurance (Do not include Conference Insurance Plans) 57e – Facility usage fees 57f – Other Operating Expenses (All other expenses not already captured)
14

TABLE 2
• 58 – Principal & Interest paid on debts (i.e. Mortgages and Loans)• 59 – Capital Expenses (Building Improvements and Major
Equipment purchases)– Improvements include that which will extend the life of the asset more than a year.
• i.e. Painting a room, or remodeling a kitchen– Major equipment purchase
• i.e. New boiler ( not a boiler repair)
• 60 Grand Total of Church Expenses Lines 48-57 are the Local Church Expenses included in the Shared
Ministry Calculation with the exception of line 52. (Line #s highlighted in blue)
Increases to these expenses will result in an increase in the church’s Shared Ministry Allocation.
15

Table 3: Income
All funds received or collected by the church are reported on Table 3.
16

TABLE 3
• 61 – Number of households/individuals giving to the church• 62a – 62i (62) – Income for Church Operations &
Mission/Benevolences 62a – Amount received through pledges (planned giving toward
annual operations and mission/benevolence) 62b – Amount received from non-pledging, but identified givers 62c – Amount received from unidentified givers 62d – Amount received from Interest and Dividends 62e – Amount received from sale of church assets
• i.e. Furniture and equipment (Do not include building and land.)
17

TABLE 3
62f – Amount received from building use fees, contributions, and rentals
• Amounts should be netted with associated expenses (i.e. Utilities, and Staff Exps)• Any losses as a result of netting United Methodist and Non-United Methodist
benevolences from Table 2, lines 43 and 44.
62g – Amounts received from fundraisers and other sources• Amounts can be netted with associated expenses
62h – Amounts used for church operations from Endowments and/or Trustees
62i – Amounts received through Offerings that are designated for Non- Specific missions/benevolences.
18

TABLE 3
• 63a – 63d (63) – Amounts received for Capital Campaigns and other designated special projects. 63a – Capital Campaigns 63b – Memorials, endowments, and bequests 63c – Other sources and projects
• i.e. Land sales or interest and dividends from capital funds, endowments, or memorial fund investments
• 64a – 64c (64) – Amounts received from Districts, Annual Conferences, Jurisdictional Conferences, General Church and/or other institutional sources outside the local church. 64a – Equitable Compensation Funds received 64b – Advance Special, apportioned & connectional received 64c – All other grants and financial support from institutional sources
19
NETTING CONCEPT w/ EXAMPLES
20

NETTING CONCEPT
The Netting Concept allows you to combine income and expenses associated with a specific program that would result in a net surplus or deficit. If your program results in collecting or raising more money than spent on conducting the program than you have a net surplus. Therefore the expenses have been absorbed by the income and the remaining income will be reported on the appropriate income line on Table 3.On the other hand, if your program results in more money being spent on conducting the program than money collected or raised than you have a net deficit. Since there was not enough income to absorb all the expenses, the remaining expenses will be reported on the appropriate expense lines on Table 3, lines 43 and 44 respectively. However, please note that even though you will be reporting expenses it will be less than the expenses reported if you did not use the netting concept.
21
NETTING EXAMPLESSubsidiary Organizations
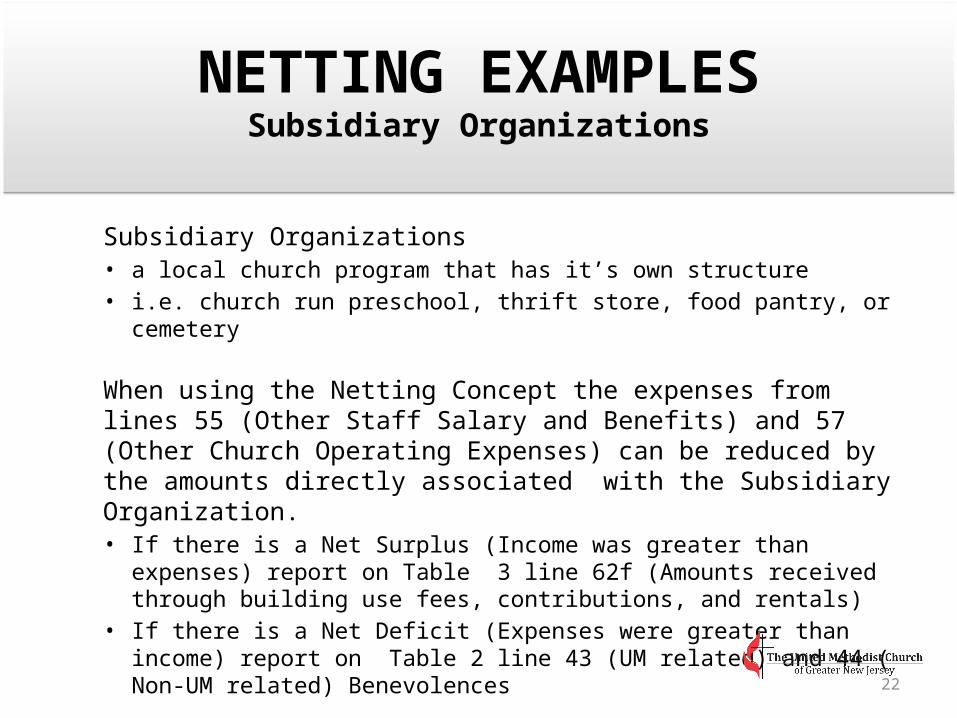
Subsidiary Organizations• a local church program that has it’s own structure• i.e. church run preschool, thrift store, food pantry, or cemetery
When using the Netting Concept the expenses from lines 55 (Other Staff Salary and Benefits) and 57 (Other Church Operating Expenses) can be reduced by the amounts directly associated with the Subsidiary Organization.• If there is a Net Surplus (Income was greater than expenses) report on Table 3
line 62f (Amounts received through building use fees, contributions, and rentals)
• If there is a Net Deficit (Expenses were greater than income) report on Table 2 line 43 (UM related) and 44 ( Non-UM related) Benevolences
22

NETTING EXAMPLESSubsidiary Organizations
CHURCH A(No Netting Concept)
Income: $500 Table 3 Line 62f Expenses: Utilities $180 Table 2 Line 57a Supplies $120 Table 2 Line 57f
Total $300
Net Surplus $200 (500-300=200)
Income is netted with expenses and no expenses are reported, therefore no effect on the Shared Ministry Calculation.
Income and Expenses are reported separately, therefore the increase in expenses will effect the Shared Ministry Calculation.
CHURCH B(Netting Concept)
Income: $500
Expenses: Utilities $180 Supplies $120
Total $300
Net Surplus $200 Table 3 Line 62f (500-300=200)
*Note: Net Loss would be Table 2 Line 43
Subsidiary Organization – Thrift Store Netting Concept
23

NETTING EXAMPLESChurch Programs - Fundraisers
CHURCH A(No Netting Concept)
Income: Meal Contributions $640 Table 3 Line 62g Expenses: Utilities $ 40 Table 2 Line 57a Supplies $100 Table 2 Line 56
Total $140
Net Surplus $500 (640-140=500)
Income is netted with expenses and no expenses are reported, therefore no effect on the Shared Ministry Calculation.
Income and Expenses are reported separately, therefore the increase in expenses will effect the Shared Ministry Calculation.
CHURCH B(Netting Concept)
Income: Meal Contributions $640
Expenses: Utilities $ 40 Supplies $100
Total $140
Net Surplus(or Deficit) $500 Table 3 Line 62g (640-140=500)
Church Fundraiser – Pancake Breakfast Netting Concept
24

NETTING EXAMPLESNon-United Methodist Programs
CHURCH A(No Netting Concept)
Income: Donation for Church Usage$1000 Table 3 Line 62f Expenses*: Building Expenses $6250 Table 2 Line 57a Supplies $ 500 Table 2 Line 57c Staff $3000 Table 2 Line 55a Total Expenses $9750
Net Deficit $(8,750) (1000-9750=-8750)
Income is netted with expenses and no expenses are reported, therefore no effect on the Shared Ministry Calculation.
Income and Expenses are reported separately, therefore the increase in expenses will effect the Shared Ministry Calculation.
CHURCH B(Netting Concept)
Income: Donation for Church Usage$1000
Expenses*: Building Expenses $6250 Supplies $ 500 Staff $3000 Total Expenses $9750
Net Deficit $(8,750) Table 2 Line 44 (1000-9750=-8750)
Non-United Methodist - Community Food Pantry Netting Concept
*Percentage calculation of Total Expenses based on a reasonable basis such as percentage of facility usage. $25,000 Total Building Expense 25% Used by Food Pantry =$6250 Amount used by Food Pantry
25

John Cardillo, Conference Treasurer732-359-1030 • [email protected]
Danielle Andrews, Senior Accountant732-359-1031 • [email protected]
CONFERENCE CONTACTS
26