2015 2017 service plan - bc assessment
TRANSCRIPT

BC Assessment
2015 – 2017
SERVICE PLAN

For more information on BC Assessment contact:
400 – 3450 Uptown Boulevard
Victoria, B.C., V8Z 0B9
Tel 250 595 6211
or visit our website at
www.bcassessment.ca

BC Assessment
2015 – 2017 Service Plan 3
Accountability Statement
BC Assessment’s 2015 - 2017 Service Plan was prepared under the Board’s direction in accordance
with the Budget Transparency and Accountability Act and the BC Reporting Principles. The service
plan is consistent with government’s strategic priorities and fiscal plan. The Board is accountable for
the contents of the service plan, including what has been included in the plan and how it has been
reported.
All significant assumptions, policy decisions, events and identified risks, as of December 5, 2014
have been considered in preparing the service plan. The performance measures presented are
consistent with BC Assessment’s mandate and goals, and focus on aspects critical to the
organization’s performance. The targets in the service plan have been determined based on an
assessment of BC Assessment’s operating environment, forecast conditions, risk assessment and past
performance.
Sincerely,
Judy Rogers
Chair, Board of Directors
BC Assessment
2015 – 2017 Service Plan 4
Table of Contents
Accountability Statement ........................................................................................................................................................................................................................ 3
Strategic Direction and Operating Context ............................................................................................................................................................... 5
Performance Plan ................................................................................................................................................................................................................................................ 6
Financial Plan ............................................................................................................................................................................................................................................................ 14
Resource Summary Table .................................................................................................................................................................................................................. 14
Appendix ......................................................................................................................................................................................................................................................................... 16
Hyperlinks to Additional Information ............................................................................................................................................................................ 16

BC Assessment
2015 – 2017 Service Plan 5
Strategic Direction and Operating Environment
Strategic Direction
BC Assessment’s legislative mandate is to establish and maintain uniform real property assessments
throughout British Columbia in accordance with the Assessment Act. The 2015–2017 Service Plan
aligns with the Taxpayer Accountability Principles and continues our strategy to increase our value
and relevance by leveraging our excellence in property assessment to become a leader in property
information for the benefit of our customers.
Specifically, BC Assessment will focus on the directions contained in the 2015/16 Mandate Letter:
1. Replace the existing valueBC™ information system with NextGen valueBC by 2018 to
improve the collection, maintenance and distribution of assessment information.
2. Develop and execute a plan to ensure up-to-date inventory across all property types with the
goal of achieving inventory accuracy by 2017.
3. Develop and execute upon a strategy to maintain the average 2015 tax levy on existing
taxpayers at levels equivalent to 2014 and ensure any increase on funds generated through
non-market change (e.g. new construction or zoning changes) is used to improve customer
service.
4. Identify and assess emerging assessment policy or methodology issues which could impact the
current or future economic viability of existing property types or economic sectors and work
with the Ministry and key partners to provide policy, regulatory and legislative solutions to
ensure fairness and equity.
Operating Environment
As a result of our strategy to become a leader in providing property information services that our
customers’ value, BC Assessment is implementing a Customer division that creates a single
accountability for the services and products our customers receive.
In addition to aligning with government direction, BC Assessment considers other factors that may
have a significant effect on our results. Revenue risks include fluctuations of our estimated tax levies
from non-market change and data sales, and our major expense risk is uncertainty about the expected
levels of assessment appeals that directly impact our appeals budget. Operational risks include change
management (the risk that change results in resistance to new products, services and ways of
working), employee engagement, people resources, financial resources, multi-initiative planning, and
resource allocation. Opportunities include leveraging technology to enhance productivity, leveraging
our excellence in property assessment to add value to our products and services, investing in our
employees to improve efficiency, and leveraging partnerships for information exchange and cost
sharing.
BC Assessment
2015 – 2017 Service Plan 6
Performance Plan
Goals, Strategies, Measures and Targets
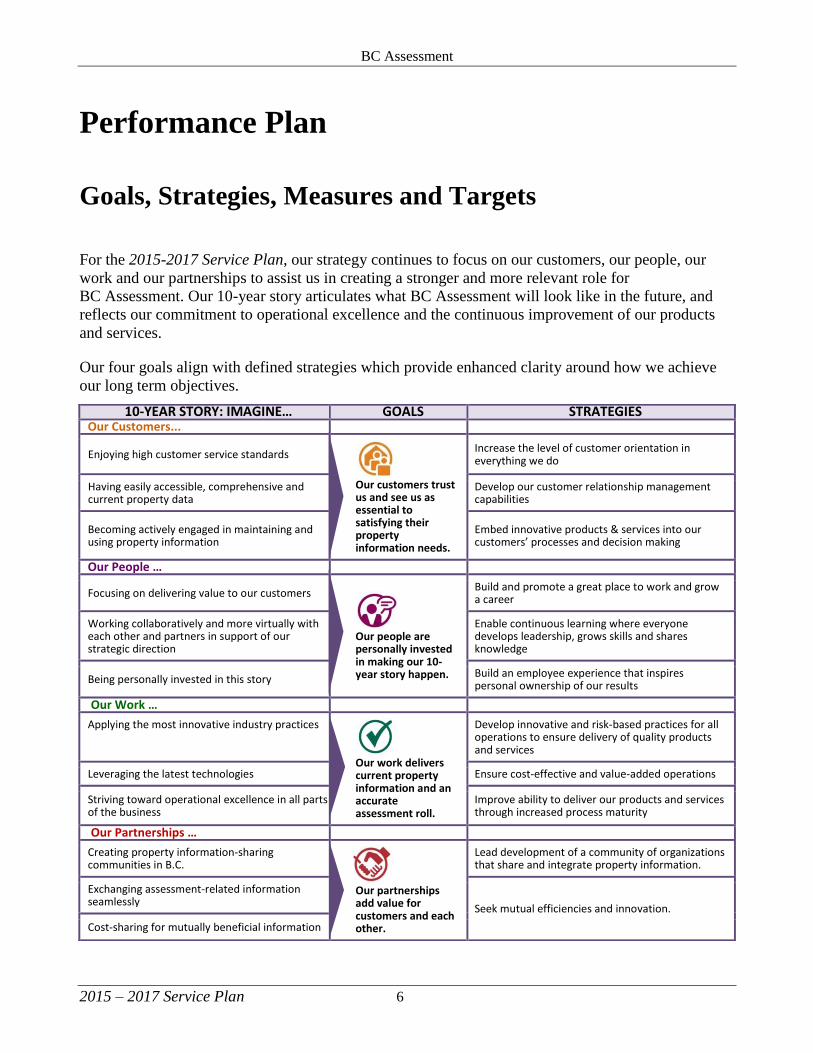
For the 2015-2017 Service Plan, our strategy continues to focus on our customers, our people, our
work and our partnerships to assist us in creating a stronger and more relevant role for
BC Assessment. Our 10-year story articulates what BC Assessment will look like in the future, and
reflects our commitment to operational excellence and the continuous improvement of our products
and services.
Our four goals align with defined strategies which provide enhanced clarity around how we achieve
our long term objectives.
10-YEAR STORY: IMAGINE… GOALS STRATEGIES Our Customers...
Enjoying high customer service standards
Our customers trust us and see us as essential to satisfying their property information needs.
Increase the level of customer orientation in everything we do
Having easily accessible, comprehensive and current property data
Develop our customer relationship management capabilities
Becoming actively engaged in maintaining and using property information
Embed innovative products & services into our customers’ processes and decision making
Our People …
Focusing on delivering value to our customers
Our people are personally invested in making our 10-year story happen.
Build and promote a great place to work and grow a career
Working collaboratively and more virtually with each other and partners in support of our strategic direction
Enable continuous learning where everyone develops leadership, grows skills and shares knowledge
Being personally invested in this story Build an employee experience that inspires personal ownership of our results
Our Work …
Applying the most innovative industry practices
Our work delivers current property information and an accurate assessment roll.
Develop innovative and risk-based practices for all operations to ensure delivery of quality products and services
Leveraging the latest technologies Ensure cost-effective and value-added operations
Striving toward operational excellence in all parts of the business
Improve ability to deliver our products and services through increased process maturity
Our Partnerships …
Creating property information-sharing communities in B.C.
Our partnerships add value for customers and each other.
Lead development of a community of organizations that share and integrate property information.
Exchanging assessment-related information seamlessly
Seek mutual efficiencies and innovation.
Cost-sharing for mutually beneficial information
BC Assessment
2015 – 2017 Service Plan 7
Goal 1: Our customers trust us and see us as essential to
satisfying their property information needs.
BC Assessment is a customer-focused organization that aims to meet the needs of our customers
while operating within our mandate and financial capacity. Our vision is, “We are trusted to value
B.C.” Implicit in achieving this vision is that our customers trust us and see us as essential to
satisfying their property information needs. In support of this goal, BC Assessment has articulated
three broad strategies that provide clarity around how we will achieve this goal.
Strategies
Increase the level of customer orientation in everything we do.
Develop our customer relationship management capabilities.
Embed innovative products & services into our customer processes and decision making.
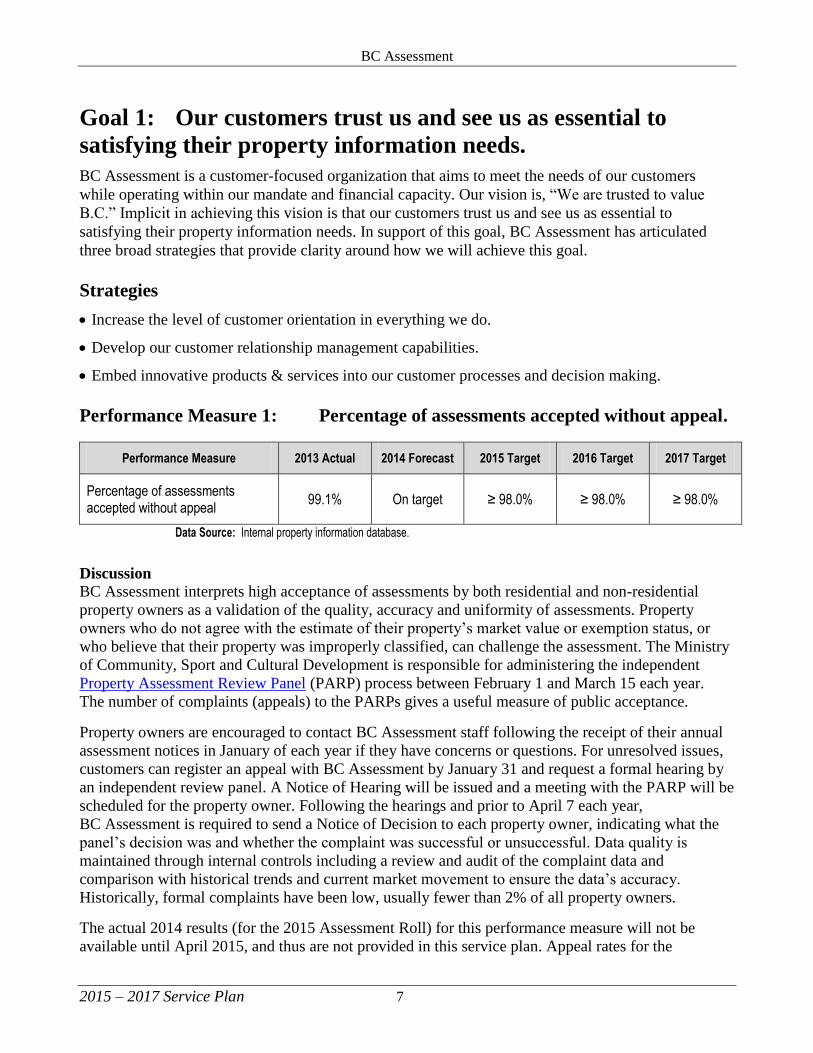
Performance Measure 1: Percentage of assessments accepted without appeal.
Performance Measure 2013 Actual 2014 Forecast 2015 Target 2016 Target 2017 Target
Percentage of assessments accepted without appeal
99.1% On target ≥ 98.0% ≥ 98.0% ≥ 98.0%
Data Source: Internal property information database.
Discussion
BC Assessment interprets high acceptance of assessments by both residential and non-residential
property owners as a validation of the quality, accuracy and uniformity of assessments. Property
owners who do not agree with the estimate of their property’s market value or exemption status, or
who believe that their property was improperly classified, can challenge the assessment. The Ministry
of Community, Sport and Cultural Development is responsible for administering the independent
Property Assessment Review Panel (PARP) process between February 1 and March 15 each year.
The number of complaints (appeals) to the PARPs gives a useful measure of public acceptance.
Property owners are encouraged to contact BC Assessment staff following the receipt of their annual
assessment notices in January of each year if they have concerns or questions. For unresolved issues,
customers can register an appeal with BC Assessment by January 31 and request a formal hearing by
an independent review panel. A Notice of Hearing will be issued and a meeting with the PARP will be
scheduled for the property owner. Following the hearings and prior to April 7 each year,
BC Assessment is required to send a Notice of Decision to each property owner, indicating what the
panel’s decision was and whether the complaint was successful or unsuccessful. Data quality is
maintained through internal controls including a review and audit of the complaint data and
comparison with historical trends and current market movement to ensure the data’s accuracy.
Historically, formal complaints have been low, usually fewer than 2% of all property owners.
The actual 2014 results (for the 2015 Assessment Roll) for this performance measure will not be
available until April 2015, and thus are not provided in this service plan. Appeal rates for the
BC Assessment
2015 – 2017 Service Plan 8
2015 Assessment Roll will be included in the 2014 Annual Service Plan Report to be published in
May 2015.
Changes to Customer Satisfaction Surveys
BC Assessment regularly reviews customer feedback to identify areas where we can improve and
enhance the customer experience. Based on this feedback, we engaged a market research firm to
update our surveying processes and methodologies. We worked with our key customer groups to
develop and implement new service standards that will guide service delivery, inform our customers
about the level of service they can expect from us and allow us to monitor and report our
performance. The updated customer surveys will be implemented in 2015 to establish baselines and
targets for future years.
Goal 2: Our people are personally invested in making our
10-year story happen.
Research suggests that successful employee engagement is the foundation for a workplace that
enhances satisfaction and commitment, and creates an environment where people want to come to
work. Engaged employees contribute to higher levels of customer satisfaction, trust and confidence in
what an organization does.
Strategies
Build and promote a great place to work and grow a career.
Enable continuous learning where everyone develops leadership, grows skills and shares
knowledge.
Build an employee experience that inspires personal ownership of our results.
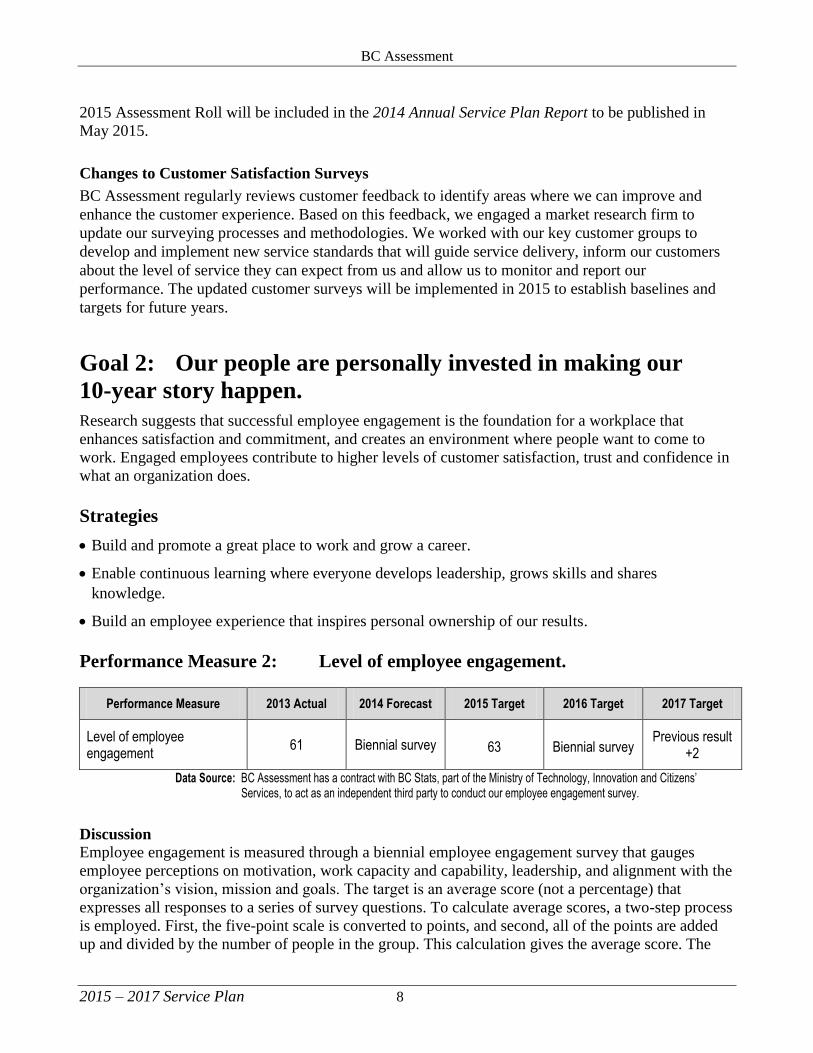
Performance Measure 2: Level of employee engagement.
Performance Measure 2013 Actual 2014 Forecast 2015 Target 2016 Target 2017 Target
Level of employee engagement
61 Biennial survey 63 Biennial survey Previous result
+2
Data Source: BC Assessment has a contract with BC Stats, part of the Ministry of Technology, Innovation and Citizens’ Services, to act as an independent third party to conduct our employee engagement survey.
Discussion Employee engagement is measured through a biennial employee engagement survey that gauges
employee perceptions on motivation, work capacity and capability, leadership, and alignment with the
organization’s vision, mission and goals. The target is an average score (not a percentage) that
expresses all responses to a series of survey questions. To calculate average scores, a two-step process
is employed. First, the five-point scale is converted to points, and second, all of the points are added
up and divided by the number of people in the group. This calculation gives the average score. The

BC Assessment
2015 – 2017 Service Plan 9
survey is conducted by an independent organization, and only those results with a confidence level of
95% are reported. The average scores from the employee engagement survey allow comparisons
within and between departments and organizations. As an example, in 2009, BC Assessment began
using the same employee engagement survey approach as the provincial government, to permit
benchmarking against the government’s annual engagement score results.
In spring 2012, BC Assessment’s management implemented a biennial survey schedule for employee
engagement, to allow sufficient time to analyze previous results and effect improvements. It was
acknowledged at the same time that a static long-term target cannot account for the future state of the
many, complex engagement drivers; thus, targets have been set at “previous result + 2” to reflect both
the previous result and the desired level of continuous improvement to the score.
Goal 3: Our work delivers current property information and
an accurate assessment roll.
BC Assessment is committed to improving operational effectiveness while adhering to sound
environmental practices. Continued investment in new technologies and systems will enable
BC Assessment to contribute to a stable tax base and provide innovative assessment solutions to
customers, while continuing to limit increases in the costs associated with property assessment
services.
Strategies
Develop innovative and risk-based practices for all operations to ensure delivery of quality products
and services.
Ensure cost-effective and value-added operations.
Improve ability to deliver our products and services through increased process maturity.
Performance Measure 3: Assessment to sales ratio (ASR).
Performance Measure 2013 Actual 2014 Result 2015 Target 2016 Target 2017 Target
Assessment to sales ratio - Residential
- Non-residential 98.0% 96.2%
98.0% 96.5%
97-100% 95-100%
97-100% 95-100%
97-100% 95-100%
Data Source: Internal property information database.
Discussion
The ASR is a common roll quality measure used by the International Association of Assessing
Officers (IAAO). The ASR measures how closely assessments mirror a property’s actual selling price.
BC Assessment measures the ASR for properties according to internationally recognized standards.
The ASR is calculated by dividing the assessed value (as determined by BC Assessment) of a
property that has sold by its selling price and expressing the result as a percentage. For example, if a

BC Assessment
2015 – 2017 Service Plan 10
property is assessed with a value of $243,000 and it sold for $250,000, the ASR would be 97.2%. In
short, the ASR measures how accurately BC Assessment appraises property at market value. The
IAAO has set a standard for a median ASR of 90-110% for an acceptable level of assessment
achievement. BC Assessment’s targets of 97-100% for residential properties and 95-100% for non-
residential properties are far more challenging targets than the international standards.
BC Assessment’s statistics are based on all available single-family residential arms’ length sales for
the two quarters surrounding BC Assessment’s valuation date of July 1. In regions with significant
market movement over the six-month period, the dispersion will be overstated. For non-residential
sales, data are based on sales occurring throughout the year.
The actual 2014 (2015 Assessment Roll) ASR results in the 2015–2017 Service Plan are based on the
2015 Completed Roll. The 2014 results that will be included in the 2014 Annual Service Plan Report
will be based on the 2015 Revised Roll, and may differ slightly from the 2015 Completed Roll results.
Performance Measure 4: Coefficient of dispersion (COD).
Performance Measure 2013 Actual 2014 Result 2015 Target 2016 Target 2017 Target
Coefficient of dispersion - Urban
- Rural
5.6% 7.8%
5.8% 7.8%
5.0 – 10.0% 5.0 – 15.0%
5.0 – 10.0% 5.0 – 15.0%
5.0 – 10.0% 5.0 – 15.0%
Data Source: Internal property information database.
Discussion
The COD measures the quality of assessments by calculating
the dispersion, or spread, of all the ASRs around the median
ASR. The COD is a measure of appraisal uniformity. A more
accurate portfolio of assessments would be indicated by a
lower COD percentage. BC Assessment also measures the
COD for properties located in both urban and rural areas,
according to internationally recognized standards.
BC Assessment has set targets for the COD based on IAAO
standards for single-family residential properties of 5-10% for
homogeneous (urban) regions and 5-15% for heterogeneous
(rural) regions. To calculate the COD, add together the
differences between each ASR in the group and the median
ASR. The average difference is the sum of these numbers
divided by the median and expressed as a percentage. An
example calculation is presented in the box to the right.
The actual 2014 (2015 Assessment Roll) COD results in the 2015–2017 Service Plan are based on the
2015 Completed Roll. The 2014 results that will be included in the 2014 Annual Service Plan Report
will be based on the 2015 Revised Roll, and may differ slightly from the 2015 Completed Roll results.
EXAMPLE CALCULATION OF COEFFICIENT OF DISPERSION
Using 97.5% as the Median
Assessment to Sales
Ratio (ASR)
Deviation
from Median
95.5% 2.0
96.7% 1.8
97.5% 0.0
98.7% 1.2
99.2% 1.7
Total Deviation 5.7
Average Deviation 1.14
Coefficient of Dispersion
= 1.14 ÷ 97.5% = 1.17

BC Assessment
2015 – 2017 Service Plan 11
Performance Measure 5: Assessment roll stability – change in taxes collected.
Performance Measure 2013 Actual 2014 Forecast 2015 Target 2016 Target 2017 Target
Assessment roll stability – change in taxes collected
0.37%1 On target ≤ 0.22% ≤ 0.22% ≤ 0.22%
Data Source: Internal property information database.
Discussion
In any given year, property status can change, and new properties may be created while others are
deleted. BC Assessment annually measures the stability of the assessment roll by analyzing the
number of additions or deletions made to the roll. Roll stability is a critical issue for local
governments, which rely almost exclusively on property taxes to fund services to their taxpayers. The
objective of this measure is to track changes in taxes collected by the taxing jurisdictions, indicating a
stable, dependable assessment roll. This performance measure is accepted by BC Assessment and
throughout the taxing jurisdictions as a good measure of the stability of the assessment roll.
Supplementary changes after the annual assessment roll has been revised by Property Assessment
Review Panels (www.cscd.gov.bc.ca/parp/) can be due to mistakes in information or to adjustments
made after a property is appealed to the Property Assessment Appeal Board
(www.assessmentappeal.bc.ca/). This performance measure estimates the change in the amount of
taxes collected or refunded by taxing jurisdictions based on the change in general taxable value for a
period of 19 months after the Revised Roll. For example, the 2014 value measures the 2013 roll
stability by estimating the changes in taxes collected as a result of supplementary rolls issued
between May 1, 2013 and December 31, 2014. The 2014 value will be reported in the
2014Annual Service Plan Report, which will be published in May 2015.
Performance Measure 6: Net cost per property for assessment services
Performance Measure 2013 Actual 2014 Forecast 2015 Target 2016 Target 2017 Target
Net cost per property for assessment services
$41.62 $42.49 $43.54 $44.40 $45.29
Data Source: Internal property information database.
Discussion
BC Assessment’s primary source of revenue is from a tax levy collected from each taxable property.
This tax levy is a component of the property taxes paid by property owners to the taxing jurisdictions,
which in turn remit the tax levy collected to BC Assessment. This performance measure reflects
BC Assessment’s commitment to keeping costs for assessment services to the taxpayer as low as
1
The result for 2013 showed only deductions and achieved the performance target of ≤ 0.37%. For 2014 onward, the measure has been adjusted to
capture both gains and deductions, whereas the previous measure only measured deductions.

BC Assessment
2015 – 2017 Service Plan 12
possible while still meeting increased service demands in a progressively more complex assessment
environment.
Cost per property target adjustments are made each year as new information becomes available and
our forecasts are refined. The targets for 2015 to 2017 have been set using service plan forecasts that
take into consideration projected new construction and development, and assumptions regarding
changes in revenues and expenditures. The targets reflect a commitment by BC Assessment to
increasing its internal efficiencies.
The cost per property for assessment services funded from the levy has been calculated by taking total
expenditures for the year, less revenues that are not categorized as tax levies, payments in lieu of taxes
or First Nations revenue and dividing that figure by the number of properties for the revised roll
produced for the following year. BC Assessment maintains appropriate internal controls and will
continue reporting regularly to the Board of Directors and to the Office of the Comptroller General.
Goal 4: Our partnerships add value for customers and each
other.
BC Assessment is also focused on its partnerships, such as with the Surveyor of Taxes of the Ministry
of Finance, local governments and other industry groups. For BC Assessment, the objective of
working with partners is to advance mutually beneficial objectives while operating within its mandate
and financial capacity.
Strategies
Lead development of a community of organizations that share and integrate property information.
Seek mutual efficiencies and innovation.
Performance Measure 7: Percentage of partnerships formalized.
Performance Measure 2013 Actual 2014 Forecast 2015 Target 2016 Target 2017 Target
Percentage of partnerships formalized N/A New
Establish baseline
Maintain or improve result
Maintain or improve result
Discussion
BC Assessment is developing a strategic framework and partnership model by conducting research
through interviews with key partners. This research will help us identify what is important to our
partnerships. Specific performance measures will be developed in 2015 for the
2016-2018 Service Plan.

BC Assessment
2015 – 2017 Service Plan 13
Taxpayer Accountability Principles
All our work directly supports the Taxpayer Accountability Principles. Examples of how we support
each principle are described in the table below.
Principle BC Assessment Implementation
Cost
consciousness
(efficiency)
Continuing to strengthen our cost management capabilities to provide services
and programs efficiently and effectively.
Absorbing the growth in properties without increasing staff has been strengthened
through process improvements that have resulted in more efficient property data
collection. Financial controls and adoption of LEAN methodology to minimize
waste have allowed us to contain costs and stay within our budget, as well as
absorb an increase in demand for assessment services. Over the past two decades,
the number of properties in B.C. has increased by 50% while the number of
employees has remained at the same level as in 1991.
Continuing work to improve property data leads to lower appeals that result in
cost savings that can be redirected to further improving data.
Accountability Demonstrating accountability to taxpayers and alignment with government’s
strategic agenda by incorporating the 2015/16 Mandate Letter from our Minister
into our 2015-2017 Service Plan. Our planning process is focused on identifying
the priorities that will ensure the directions in the mandate letter are
accomplished. Through reporting quarterly to government on our financial
results and annually to the public, we transparently show our progress and
performance against our goals and targets.
Increasing the amount of property data available to the public online
demonstrates transparency for taxpayers and our customers.
Appropriate
compensation Our compensation oversight rests with the Public Sector Employers’ Council
(PSEC) and the PSEC Secretariat approves all compensation plans. Our Board of
Directors complies with the Public Sector Employers Act by disclosing the annual
total compensation for the Chief Executive Officer and the top four highest paid
executives. Our compensation philosophy is to provide fair compensation and to
target the total compensation package at the 50th percentile of the defined
comparator markets.
Service
Building a culture of innovation and continuous improvement to deliver cost-
efficient, effective, value-for-money public services.
Established Customer Service Commitments that set out service levels to our
customers, which we report publicly on how we perform on these commitments.
Reorganizing our core assessment functions to increase efficiency to improve
service to our customers.
Respect Demonstrated through a number of our people practices, most notably through
supervisor and employee feedback sessions held throughout the year.
Standards of Conduct policy has recently been amended to address building
respectful workplaces.
Integrity Addressed in our Standards of Conduct policy which has been regularly updated
and communicated to all employees and managers, as well as to the public.

BC Assessment
2015 – 2017 Service Plan 14
Financial Plan
Resource Summary Table
($m) 2013 Actual 2014
Forecast 2015
Budget 2016
Budget 2017
Budget
Revenue
Tax levies 82,085 83,781 85,282 87,852 90,549
Other 5,838 5,739 5,276 5,436 5,598
Total revenue 87,923 89,520 90,558 93,288 96,147
Operating expenditures
Salaries and benefits 54,588 55,838 58,619 59,816 61,169
Other operating expenditures 27,083 27,065 28,344 29,182 30,692
Amortization 3,962 3,595 3,595 4,290 4,287
Total operating expenditures 85,633 86,498 90,558 93,288 96,147
Net income 2,290 3,022 0 0 0
Capital investment
Information technology 1,226 2,512 6,787 8,530 8,700
Other (tenant improvements, vehicles, furniture) 1,146 1,440 1,205 454 2,006
Total capital investment 2,372 3,952 7,991 8,984 10,706
Accumulated surplus
Equity in capital assets 12,571 13,110 17,751 22,672 27,951
Equity from operations – appropriated 16,000 17,400 13,089 7,772 4,164
Equity from operations – unappropriated 2,272 3,355 3,025 3,421 1,750
Total accumulated surplus 30,843 33,865 33,865 33,865 33,865
Total liabilities 0 0 0 0 0
Key Forecast Assumptions
BC Assessment’s financial planning process takes a long term view of the nature and level of
operating and capital expenditures, cash flows, equity balances, and tax levy revenue requirements to
ensure finances are managed to meet current and long-term spending commitments, address
increasing demands, and execute the highest priority programs.
Tax levy revenue, cash flow, and operating and capital requirements are anticipated far enough in
advance so planning decisions can be made proactively in an appropriate timeframe to ensure
financial long-term sustainability.

BC Assessment
2015 – 2017 Service Plan 15
Management Perspective on Future Financial Outlook
BC Assessment is funded primarily through property tax levies administered by the taxing authorities
– budgeted to be approximately $85.3 million in 2015. In addition, BC Assessment receives revenue
from a number of other sources, including contracts with First Nations, payments in lieu of taxes and
data sales. The latter includes provision of bulk electronic assessment roll, sales and residential
inventory data, custom reports, and enhanced data provision with BC OnLine and private sector data
agents. Revenue from all these non-tax sources helps reduce the levy paid by property owners.
The organization collects its revenues from taxing authorities in July of each year. BC Assessment
borrows funds from the provincial government to finance operations and capital expenditures during
the first half of the year and repays its debt in full by August of each year. The Minister of Finance
acts as the fiscal agent of BC Assessment.
The Board of Directors approves the annual operating and capital budget. The Board also approves
the annual levy following the provincial Cabinet’s review and agreement.
BC Assessment manages the increasing financial pressures resulting from folio growth, continuous
improvement of customer service levels and the fiscal environment by encouraging and investing in
innovation to improve workforce productivity, and by using risk-based operating and resource
allocation methodologies.
BC Assessment
2015 – 2017 Service Plan 16
Appendix:
Hyperlinks to Additional Information
Board of Directors and Corporate Governance -
www.bcassessment.ca/about/Pages/BoardofDirectors.aspx
Organizational Overview - www.bcassessment.ca/about/Pages/Default.aspx
Executive Management Team -
www.bcassessment.ca/ABOUT/Pages/ExecutiveManagementTeam.aspx