2015 cafr final · table of contents i. introductory section exhibit page board of commissioners...
TRANSCRIPT

COMPREHENSIVEANNUAL FINANCIAL REPORT
OF THEMETROPOLITAN WATER RECLAMATION
DISTRICT OF GREATER CHICAGO
Chicago, Illinois
For the Year EndedDecember 31, 2015
Finance DepartmentJACQUELINE TORRES, Clerk/Director of Finance Incorporated May 29, 1889

Page intentionally left blank

TABLE OF CONTENTS
I. INTRODUCTORY SECTION Exhibit Page
Board of Commissioners and Principal Offi cers 7Organization Chart 8President’s Letter 9Awards and Achievements Recognition 14Certifi cate of Achievement for Excellence in Financial Reporting 16Clerk/Director of Finance Letter of Transmittal 17Statement of Responsibility 29
II. FINANCIAL SECTION
Independent Auditors’ Report 32
Management’s Discussion and Analysis (MD&A) - Unaudited 35
Basic Financial Statements
Combined Fund/Government-wide Financial StatementsGovernmental Funds Balance Sheets / Statements of Net Position - December 31, 2015
(with comparative amounts for prior year) A-1 52Statements of Governmental Fund Revenues, Expenditures, and Changes in Fund Balances/
Statements of Activities - year ended December 31, 2015 (with comparative amounts for prior year) A-2 54
Fund Financial StatementsGeneral Corporate Fund
Statement of Revenues, Expenditures and Changes in Fund Balances - Budget and Actual on Budgetary Basis - year ended December 31, 2015 A-3 56
Retirement FundStatement of Revenues, Expenditures and Changes in Fund Balances - Budget and
Actual on Budgetary Basis - year ended December 31, 2015 A-4 57
Pension and Other Post Employment Benefi ts Trust FundsStatements of Fiduciary Net Position - December 31, 2015 (with comparative amounts for prior year) A-5 58Statements of Changes in Fiduciary Net Position - year ended December 31, 2015
(with comparative amounts for prior year) A-6 59
Notes to the Basic Financial Statements 61
Required Supplementary Information (RSI) Other Than MD&A - Unaudited
Modifi ed Approach for Eligible Infrastructure Assets 112Schedule of Changes in the District’s Net Pension Liability 117Schedule of District Contributions 118Progress in Funding Other Post Employment Benefi ts Trust Fund 119
Supplementary Information
Combining and Individual Fund Statements and Schedules
Combining Balance Sheets - Nonmajor Governmental Funds - December 31, 2015(with comparative amounts for prior year) B-1 122
Combining Statements of Revenues, Expenditures, and Changes in Fund Balances - NonmajorGovernmental Funds - year ended December 31, 2015 (with comparative amounts for prior year) B-2 123
General Corporate Fund-Corporate and Reserve Claim DivisionsSchedule of Appropriations and Expenditures on a Budgetary Basis - year ended December 31, 2015 C-1 126
Exhibit PageSchedule of Expenditures by Type - GAAP Basis - year ended December 31, 2015 (with comparative
amounts for prior year) C-2 136
Debt Service FundSchedule of Revenues, Expenditures and Changes in Fund Balances - Including Comparison of
Budget and Actual on Budgetary Basis - year ended December 31, 2015 D-1 140
Capital Projects FundsSchedule of Appropriations and Expenditures on Budgetary Basis - year ended December 31, 2015 E-1 142
Trust FundsPension and Other Post Employment Trust Funds - Combining Statements of Fiduciary Net Position F-1 148
December 31, 2015 (with comparative amounts for prior years)
Pension and Other Post Employment Trust Funds Combining Statements of Changes in Fiduciary Net Position F-2 149
Year ended December 31, 2015 (with comparative amounts for prior years)
III. STATISTICAL AND DEMOGRAPHICS SECTION - UNAUDITED
Net Position by Component I-1 154Changes in Net Position I-2 156Fund Balances: Government Funds I-3 158Changes in Fund Balances: Government Funds I-4 160Equalized Assessed Value, Direct Tax Rate and Estimated Actual Value of Taxable Property I-5 162District Direct Property Tax Rates, Overlapping Property Tax Rates of Major Local Governments,
and District Tax Levies by Fund I-6 163Principal Property Taxpayers I-7 164Property Tax Levies and Collections I-8 165User Charge Rates I-9 166Ratios of Total General Bonded Debt and Net Bonded Debt Outstanding I-10 168Estimate of Direct and Overlapping Debt I-11 169Computation of Statutory Debt Margin I-12 170Demographic and Economic Statistics I-13 172Principal Employers I-14 173Budgeted Positions by Fund/Department I-15 174Operating Indicators I-16 175Capital Asset Statistics I-17 176
IV. SINGLE AUDIT SECTION
Independent Auditors’ Report on Internal Control Over Financial Reporting and on Compliance 178and Other Matters Based on an Audit of Financial Statements Performed in Accordancewith Government Auditing Standards
Independent Auditors’ Report on the Schedule of Expenditures of Federal Awards 180Independent Auditors’ Report on Compliance for Each Major Program and on Internal Control 182 Over Compliance Required by the Uniform GuidanceSchedule of Expenditures of Federal Awards - year ended December 31, 2015 184Notes to Schedule of Expenditures of Federal Awards - year ended December 31, 2015 185Schedule of Findings and Questioned Costs 188

I.INTRODUCTORY
SECTION
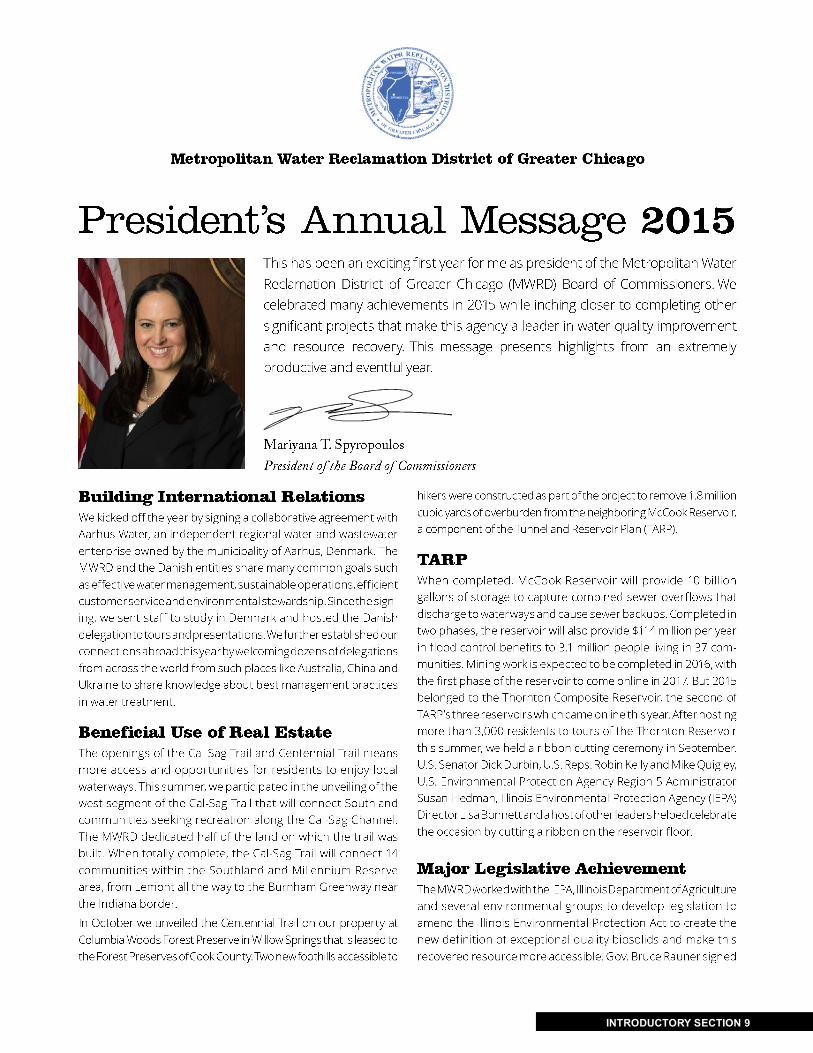
MWRD President Mariyana T. Spyropoulos and US Army Corps of Engineers Lieutenant Colonel Kevin Lovell hold the large scissors to cut the ribbon on the Thornton Composite Reservoir on September 1, 2015. They are joined by MWRD Vice President Barbara J. McGowan, Chairman of Finance Frank Avila, and Commissioners Timothy Bradford, Cynthia M. Santos, Debra Shore and Kari K. Steele; MWRD Executive Director David St. Pierre; Senator Dick Durbin; Congresswoman Robin Kelly; USEPA Region 5 Administrator Susan Hedman, IEPA Director Lisa Bon-nett; Secretary/Treasurer of Chicago Federation of Labor Robert Reiter; South Suburban Mayors Executive Director Ed Paesel; and Friends of Chicago River Executive Director Margaret Frisbie. The ribbon cutting was held to celebrate the connection of the tunnel system to the 7.9 billion gallon capacity reservoir, which provides fl ood protection benefi ts for 556,000 people in 14 communities throughout the south side of Chicago and south suburbs and improves water quality in the Calumet Rivers and Calumet-Sag Channel by preventing combined sewer overfl ows.

6 INTRODUCTORY SECTION
Page intentionally left blank

INTRODUCTORY SECTION 7
Metropolitan Water Reclamation District of Greater Chicago
Board of Commissioners and Principal Offi cers
Board of Commissioners:Honorable Mariyana T. Spyropoulos, PresidentHonorable Barbara J. McGowan, Vice President
Honorable Frank Avila, Chairman, Committee on FinanceHonorable Michael A. AlvarezHonorable Timothy BradfordHonorable Cynthia M. Santos
Honorable Debra ShoreHonorable Kari K. SteeleHonorable David J. Walsh
Principal Offi cers:David St. Pierre, Executive Director
Mary Ann Boyle, TreasurerAllison Fore, Public and Intergovernmental Affairs Offi cerThomas C. Granato, Director of Monitoring and Research
Ronald M. Hill, General CounselDenice E. Korcal, Director of Human Resources
Darlene A. LoCascio, Director of Procurement and Materials ManagementCatherine A. O’Connor, Director of Engineering
Manju Prakash Sharma, Director of Maintenance and OperationsJohn Sudduth, Director of Information Technology
Jacqueline Torres, Clerk/Director of Finance
Main Offi ce100 East Erie Street
Chicago, Illinois 60611

8 INTRODUCTORY SECTION
Metropolitan Water Reclamation District of Greater Chicago
Organization Chart
1,982 BudgetedPositions in 2015
INTRODUCTORY SECTION 9

10 INTRODUCTORY SECTION

INTRODUCTORY SECTION 11

12 INTRODUCTORY SECTION

INTRODUCTORY SECTION 13
Page intentionally left blank

14 INTRODUCTORY SECTION
Metropolitan Water Reclamation District of Greater ChicagoMulti-Year Awards
1975-2014Government Finance Offi cers Association of the United States and Canada
Certifi cate of Achievement for Excellence in Financial Reporting/Comprehensive Annual Financial Report
1993-2014Government Finance Offi cers Association of the United States and Canada
Certifi cate of Achievement for Excellence in Financial Reporting Award for Retirement Fund’sComprehensive Annual Financial Report
1985-2015Government Finance Offi cers Association of the United States and Canada
Award for Distinguished Budget Presentation
2007-2014Government Finance Offi cers Association of the United States and Canada
Certifi cate of Achievement for Excellence in Financial Reporting Award for the Retiree Health Care Trust Fund’sComprehensive Annual Financial Report
2010-2011Chicago Public Schools
Certifi cate of Appreciation for providing outstanding work-based learning experiences for Chicago Public School Career and Technical Education students through participation in the Work-Based Learning Program
Individual Year Awards (partial listing)
2011National Association of Clean Water Agencies, formerly known as Association of Metropolitan Sewage Agencies
NACWA Award for Full Compliance with National Pollutant Discharge Elimination System, Gold Award for Hanover Park WaterReclamation Plant
National Association of Clean Water Agencies, formerly known as Association of Metropolitan Sewage AgenciesNACWA Award for Compliance with National Pollutant Discharge Elimination System, Silver Award for John E. Egan Water
Reclamation Plant
Water Environment FederationThomas E. Kunetz, Assistant Director of Engineering, is a recipient of the Water Environment Federation’s
Fellows Recognition Program, which honors professional achievements, stature, and contributions to the water profession
2012American Academy of Environmental Engineers
Excellence in Environmental Engineering Grand Prize for the University Research for Chicago Health, Environmental Exposure, and Recreation Study (CHEERS)
American Public Works AssociationThomas E. Kunetz, Assistant Director of Engineering, is the recipient of the Charles Walter Nichols Award for National Environmental
Excellence, which recognizes outstanding and meritorious achievement in the environmental fi eld
Chicago City Branch and Chicago Metro Chapter: Project of the Year in the Environmental $25 to $75 Million Category for the design of the Calumet Central Boiler Facility
Federation of Women ContractorsOutstanding Program of the Year Award for the MWRD Affi rmative Action Program
National Association of Clean Water Agencies, formerly known as Association of Metropolitan Sewage AgenciesNACWA Award for Compliance with National Pollutant Discharge Elimination System, Silver Award for John E. Egan Water
Reclamation Plant

INTRODUCTORY SECTION 15
Metropolitan Water Reclamation District of Greater Chicago2013
Illinois Water Environment AssociationCommissioner Debra Shore is the recipient of the inaugural Public Offi cial of the Year award. The Public Offi cial of the Year award
is presented to an elected or appointed public offi cial that has made a documented signifi cant contribution in the areas of clean water legislation, public policy, government service, or another area of public prominence that resulted in improvements to the water
environment
National Association of Clean Water Agencies, formerly known as Association of Metropolitan Sewage AgenciesNACWA Award for Compliance with National Pollutant Discharge Elimination System, Silver Award for John E. Egan and Stickney
Water Reclamation Plants
National Association of Clean Water Agencies, formerly known as Association of Metropolitan Sewage AgenciesFormer Executive Director Richard Lanyon was inducted into the Hall of Fame and became the fi fth District executive in its ranks. The other four are former Director of M&R Dr. Cecil Lue-Hing and former General Superintendents Bart Lynam, Hugh McMillan,
and Ben Sosewitz
National Association of Government Defi ned Contribution AdministratorsLeadership Recognition Award of Distinction for National Save for Retirement Week Campaign
Water Environment Research FoundationAward for Excellence in Innovation
2014Academy of Interactive and Visual Arts
The Interactive Multimedia Communicator Award for “National Save for Retirement Week Campaign”
Center for Active DesignExcellence Award (Honorable Mention) for the Space to Grow program, a collaboration between the District, Chicago Public School
Systems, and the City of Chicago Department of Water Management. Space to Grow was the only submission from Chicago to be recognized. Fellow award recipients span the globe
Illinois Association for Floodplain and Stormwater ManagementSustainability Award for the Space to Grow program for the redevelopment of four school properties using a variety of Best
Management Practices for creating green space
National Association of Clean Water Agencies, formerly known as Association of Metropolitan Sewage AgenciesExcellence in Management Platinum Award for excellence in utility management and successful implementation of programs that
address the range of management challenges facing public wastewater utilities in today’s competitive environment
National Association of Clean Water Agencies, formerly known as Association of Metropolitan Sewage AgenciesNACWA Award for Compliance with National Pollutant Discharge Elimination System, Platinum Award for 23 consecutive years of full compliance for Calumet Water Reclamation Plant; Platinum Award for 18 consecutive years of full compliance for Lemont
Water Reclamation Plant; Platinum Award for 10 consecutive years of full compliance for James C. Kirie Water Reclamation Plant; Platinum Award for 9 consecutive years of full compliance for Terrence J. O’Brien Water Reclamation Plant; and Platinum Award for
7 consecutive years of full compliance for Hanover Park Water Reclamation Plant
National Association of Clean Water Agencies, formerly known as Association of Metropolitan Sewage AgenciesNACWA Award for Compliance with National Pollutant Discharge Elimination System, Gold Award for John E. Egan and Stickney
Water Reclamation Plants
National Physical Plan AllianceChampion Award for the Space to Grow program for the collaborative efforts of the District, Chicago Public Schools, and the
Department of Water Management in transforming Chicago’s underused and outdated schoolyards into vibrant outdoor spaces that benefi t students, communities and the environment
2015Chatham Business Association
Partner Award
Government Finance Offi cers Association of the United States and CanadaBudget document received outstanding in the overall category of Communications Device

16 INTRODUCTORY SECTION

INTRODUCTORY SECTION 17
May 9, 2016
To the Citizens of the Metropolitan Water Reclamation District of Greater Chicago and to the Financial Community:
The Comprehensive Annual Financial Report (CAFR), of which this transmittal letter is a component, has been prepared in accordance with Chapter 70, Illinois Compiled Statutes, Act 2605/5.13 for the fi scal year ended December 31, 2015. This statute requires that the Clerk/Director of Finance prepare and publish the fi nancial statements and any other data necessary to refl ect the true fi nancial condition and operations of the Metropolitan Water Reclamation District of Greater Chicago (the District) within six months of the close of each fi scal year.
The CAFR’s basic fi nancial statements have been prepared in conformance with generally accepted accounting principles (GAAP) in the United States of America, promulgated by the Governmental Accounting Standards Board (GASB). In accordance with Chapter 70, Illinois Compiled Statutes, Act 2605/5.12, the District’s basic fi nancial statements for the period ended December 31, 2015, have been subject to an audit by independent accountants. The unmodifi ed opinion of RSM US LLP, has been included in the Financial Section of this report.
District management assumes full responsibility for the completeness and reliability of all the information presented in this report. To provide a reasonable basis for making these representations, management of the District has established a comprehensive internal control framework that is designed both to protect the government’s assets from loss, theft, or misuse and to compile suffi cient reliable information for the preparation of the District’s fi nancial statements in accordance with GAAP. The cost of internal controls should not outweigh their benefi ts; therefore, the District’s comprehensive framework of internal controls has been designed to provide reasonable assurance, rather than absolute assurance, that the fi nancial statements will be free from material misstatement. Management understands the risks of fi nancial processing and has implemented procedures to evaluate the effectiveness of these controls. District management and Internal Audit staff continually evaluate the internal control structure.
Both the investment community and taxpayers rely on the CAFR for basic information about the District, its past performance, current fi nancial condition, future plans, and services provided. Financial data and the facts contained herein create an indispensable profi le for potential bond investors. Taxpayers can, with full confi dence, assess the level, effi ciency, and effectiveness of the services provided and the related costs.
GAAP requires that management provide a narrative introduction, overview, and an analysis to accompany the basic fi nancial statements in the form of a Management’s Discussion and Analysis (MD&A). This letter of transmittal is designed to complement the MD&A and should be read in conjunction with it. The District’s MD&A can be found immediately following the independent auditor’s report.

18 INTRODUCTORY SECTION
MISSION STATEMENT
The District will protect the health and safety of the public in its service area, protect the quality of the water supply source (Lake Michigan), improve the quality of water in watercourses in its service area, protect businesses and homes from fl ood damages, and manage water as a vital resource for its service area. The District’s service area is 883.4 square miles of Cook County, Illinois. The District is committed to achieving the highest standards of excellence in fulfi lling its mission.
BACKGROUND
The District was originally organized as the Sanitary District of Chicago in 1889 under an act of the Illinois General Assembly. The enabling act was in direct response to a typhoid and cholera epidemic. The District reversed the fl ow of the Chicago and Calumet River systems to divert contaminated water from Lake Michigan so it could be diluted as it fl owed downstream into the Mississippi River. Subsequently, the District built collection treatment facilities to treat sewage in an environmentally effective manner.
The District operates primarily within the boundaries of Cook County. Although the District exercises no direct control over wastewater collection and transmission systems maintained by cities, towns, and villages in Cook County, it does control municipal sewer construction by permits in suburban Cook County. Furthermore, the District provides the main sewer lines for the collection of wastewater from local sewer systems together with the treatment and disposal thereof. Combined sewage and stormwater runoff is stored, treated, and released using District facilities. The District owns and operates seven water reclamation plants (WRP) and 22 pumping stations that treat an average of 1.3 billion gallons of wastewater each day. The Central (Stickney) WRP is the largest plant in the world. The District controls approximately 76.1 miles of navigable waterways that serve as headwaters of the Illinois waterway system. Stringent federal and state standards require that the District’s wastewater treatment processes keep the waterways free of pollution. The District monitors industries in Cook County to assure that hazardous substances not suitable for a sewer are disposed of in an environmentally responsible way that complies with applicable laws.
REPORTING ENTITY
The District is governed by a nine-member Board of Commissioners, elected at large for six-year terms. The terms are staggered so that three commissioners are elected every two years. The Executive Director, who is appointed by the Board of Commissioners, manages and controls all District operations, and serves as the Chief Executive Offi cer.
The District is a separate legal entity sharing an overlapping tax base with the City of Chicago, the Chicago Board of Education, the County of Cook, the Cook County Forest Preserve District, the Chicago Park District, the Chicago Public Building Commission, the City Colleges of Chicago, and various municipalities and school districts outside the City of Chicago but within the District’s boundaries. However, these governments do not meet the established criteria for inclusion in the reporting entity and are therefore excluded.
The multi-award winning Metropolitan Water Reclamation District of Greater Chicago is headed by the Board of Commissioners who determine its policies. (Seated L to R) Vice President Barbara J. McGowan, President Mariyana T. Spyropoulos and Chairman of Finance Frank Avila (Standing L to R) David J. Walsh, Cynthia M. Santos, Debra Shore, Kari K. Steele, Timothy Bradford and Michael A. Alvarez

INTRODUCTORY SECTION 19
Students, teachers and parents plant bulbs in one of the raised gardens at the Orozco Community Academy’s new Space to Grow schoolyard prior to the ribbon cutting celebration in October. The Space to Grow program is an innovative public-private partnership co-managed by the Healthy Schools Campaign and Openlands and funded in part by the MWRD. The program aims to develop Chicago schoolyards into centers of school and community life that support active and healthy lifestyles, outdoor learning, physical education and engagement with nature. Among those in attendance are Orozco Principal Efrain Mar-tinez, MWRD President Mariyana T. Spyropoulos, and 25th Ward Al-derman Danny Solis.
MAJOR INITIATIVES
Intercepting Sewers
In order to collect wastewater from local sewer systems for conveyance to its water reclamation plants, the District has constructed approximately 560 miles of intercepting sewers and force mains. These intercepting sewers range in size from 6 inches to 27 feet in diameter. A continuing inspection program and lining of deteriorated sewers ensure a high service level on existing sewers.
The expected construction cost over the next fi ve years for the sewer program is $24.7 million. This money will primarily be used in the rehabilitation of deteriorated District interceptors.
Water Reclamation Plant Expansions and Improvements
The District has a total secondary treatment capacity of approximately 2 billion gallons per day. To ensure that the District continues to provide high quality service in the future, master planning studies for the major treatment plants, Calumet, Central (Stickney), and O’Brien have been completed. The studies were undertaken to determine the future needs of each plant and to establish a long range plan for each facility that will improve the air and water environment. Over the next fi ve years, approximately $133 million in construction projects will be awarded.
Biosolids Management
The District collects biosolids from the wastewater treatment processes. The effective dewatering and drying of these biosolids is a major District undertaking. As discussed in the Notes to Basic Financial Statements (Note 14), the District’s Board of Commissioners authorized the District to enter into a long-term contract to build and operate a 150 dry ton per day biosolids processing facility at the Central (Stickney) WRP. The facility has been operational since July 2010. The expected construction cost over the next fi ve years for the biosolids management program is $78.4 million.
The MWRD joined the Wheeling Park District and Village of Wheeling in opening the Heritage Park Flood Control Facility in Wheeling. The facility is situated in the Des Plaines River watershed near the inter-section of Dundee and Wolf Roads in Wheeling. The complex provides compensatory floodwater storage upstream of the U.S. Army Corps of Engineers’ Levee 37 flood control structure in Mount Prospect and Prospect Heights.

20 INTRODUCTORY SECTION
Tunnel and Reservoir Plan – Phase I
The District’s Board of Commissioners adopted the Tunnel and Reservoir Plan (TARP) in 1972 as a comprehensive pollution and fl ood control program for its 375 square mile combined sewer area. This area comprises 52 communities, including the City of Chicago. The primary goals of TARP are as follows: protect Lake Michigan, the area’s primary source of drinking water from polluted backfl ows; clean up the area’s waterways; and provide an outlet for fl oodwater and rainfall runoff by capturing wastewater before it enters streams and rivers from within the District’s service area. TARP Phase I is composed of four tunnel systems that store polluted sewer overfl ows during wet weather. All 109.4 miles of Phase I tunnels have been constructed and are operational and the entire system has an approximate construction cost of $2.33 billion. TARP, by providing an outlet for fl oodwater and rainfall runoff and by capturing wastewater before it enters streams and rivers, is having a remarkable impact on the water quality in Chicago’s rivers, including the quality of life for residents and visitors to the Chicagoland area. Marked visible improvement in the water quality of local rivers has increased recreational use and tourism, and has spurred real estate development of riverside hotels, restaurants, promenades, marinas, and apartment buildings.
Tunnel and Reservoir Plan – Phase II
Phase II is the fl ood control segment of TARP and consists of three storage reservoirs to serve as outlets for combined sewer overfl ows (CSO’s). The three reservoirs – Gloria Alitto Majewski, Thornton, and McCook – will provide 15.2 billion combined gallons of storage for CSO’s that otherwise would spill into local waterways, degrading the water quality and causing fl ooding. The District has executed Project Cooperation Agreements (PCAs) with the Army Corps of Engineers (the Corps) to construct all three reservoirs. However, the District has assumed responsibility for the design and construction of the Thornton Composite
Reservoir from the Corps, and is seeking reimbursement of the federal cost sharing portion of the reservoir. The combined construction and land rights cost for all three reservoirs is estimated at $1.5 billion, with the Corps and the District providing approximately $790 million and $710 million, respectively. The Gloria Alitto Majewski Reservoir, the smallest of the three, was completed in 1998 at a cost of $45 million. The Thornton Composite Reservoir became operational in 2015 with a capacity of 4.8 billion gallons at a cost of $417 million. Engineering design and construction for the McCook reservoir continues.
Some construction contracts for the McCook Reservoir have been completed and others are currently in progress. The overburden removal for the McCook Reservoir has been substantially completed and mining began in March 2008. The accompanying exhibit on page 21 shows the status and components of both phases of TARP.
Workers gather for a unique portrait opportunity near the entrance to one of the tunnels at the McCook Reservoir, standing on some of the 4,600 tons of rock that had been blasted out using 1,000 tons of explosives. The blast opened the top portion of the 33-foot diameter tunnel to the reservoir. Work remains to be done before the fi rst stage of the 10 billion gallon reservoir becomes operational in 2017, but the McCook Main Tunnel is now open to the reservoir. A major part of the Tunnel and Reservoir Plan (TARP), the McCook Reservoir will help reduce fl ooding and improve water quality within a 254.7 square mile area, including much of the city of Chicago and 36 other communities.
MWRD President Mariyana T. Spyropoulos (from left), Friends of the River Executive Director Margaret Frisbie, MWRD Vice President Barbara T. McGowan, MWRD Commissioner Debra Shore, MWRD Commissioner Kari K. Steele and MWRD Chairman of Finance Frank Avila introduced a new skimmer boat, “Skim Pickens,” in May 2015. The boat will be used to remove fl oating debris from Chicago Area Waterways at least fi ve days a week and up to seven depending on storms.

INTRODUCTORY SECTION 21

22 INTRODUCTORY SECTION
Green Infrastructure and TARP
A consent decree between MWRDGC and the U.S. Department of Justice was entered into in 2014. One section of the consent decree is designed to foster the use of green infrastructure controls to reduce the amount of storm-water that fl ows into the sewer systems during a storm and requires MWRDGC to develop a Green Infrastructure Program Plan, which was approved by the Environmental Protection Agency in 2015. In 2014, MWRDGC part-nered with Chicago Public Schools System (CPSS) and the Chicago Department of Water Management (CDWM) to incorporate stormwater retention at four elementary schools while reconstructing substandard playgrounds under a program known as Space to Grow. The projects serve to educate the public on the importance of stormwater management and the value of green infrastructure to reduce basement backup fl ooding. The success of this project led to MWRDGC, CPSS, and CDWM to agree to partner on 30 more schools from 2015 through 2019. In 2015, two more CPSS playgrounds were completed and it is anticipated 9 playgrounds will be improved in 2016. The District also completed construction of a green infrastructure project in the City of Blue Island where permeable pavement and rain gardens were installed to combat local fl ooding. The District partnered with the City of Evan-ston to install permeable pavement, swales, and rain gardens at the City’s Civic Center. In 2016, the District will be partnering through intergovernmental agreements with the Village of Crestwood, City of Berwyn, Village of Kenilworth, Village of Niles, Village of Wilmette, Village of Northbrook, and Village of Skokie on various green infrastructure projects. The consent decree provides an enforceable schedule for implementing MWRDG’s Tunnel and Reservoir Plan, which will result in a signifi cant decrease in the volume of water discharged to the waterways from combined sewer overfl ows in Cook County, along with dramatically reducing the potential for fl ooding.
Resource Recovery Projects
The District had voluntarily sought a phosphorus discharge limitation in our National Pollutant Discharge Elimi-nation System (NPDES) permits and had decided we would pursue achieving this through our biological process. With one of the District’s objectives of sustainability, at the Stickney WRP, the District is pursuing the recovery of phosphorus. We have entered into agreements for the design and construction of a phosphorus recovery facility. This facility will utilize the Pearl Reactor manufactured by Ostara to recovery a phosphorus product for the centrate streams of the pre- and post-digestion centrifuges. The facility is designed for potential recovery of approximately 9,500 tons/year of product. The construction of the facility continues with start-up projected in early 2016. A sep-arate agreement has been issued to Ostara for the marketing and benefi cial use of the produced product.
The anaerobic digesters at the Calumet Water Reclamation Plant produce biogas as a natural byproduct of the digestion process. The biogas contains methane gas, and is currently used as a fuel for the plant’s boilers. The an-aerobic digesters have the capacity to take in more organic material than is currently produced by the plant, thus increasing the volume of biogas that can be produced and used as a renewable energy source. The District will seek liquid organic waste material, such as high strength waste from food industries, and fats, oils, and grease from grease traps, for direct input into the anaerobic digesters to increase biogas gas production. The District is in the process of designing a receiving station at the Calumet Water Reclamation Plant to receive daily deliveries of the liquid organic waste. The receiving station will be advertised for receipt of construction bids in 2016. In addition, in 2015 the District awarded a design contract to a fi rm to design a cleaning facility to produce “biomethane,” which will meet natural gas specifi cations, and inject the biomethane into a natural gas transmission pipeline. The biogas cleaning facility is planned to begin operation by the end of 2017. Through a proposal process, the District selected a transportation fuel company to purchase the biomethane from the District for both the commodity value of the biomethane and the environmental attributes associated with the renewable energy. The anaerobic digesters can accept up to an additional 200,000 gallons per day of liquid organic waste, which can increase biogas production up to 75% over current production volumes, and move the District to 40% of its goal of energy neutrality.
Stormwater Management
The District undertakes stormwater management projects under two phases of its Stormwater Management Program. Phase I consists of projects identifi ed under Detailed Watershed Plans (DWPs), which were completed in 2010. Phase I projects address regional waterway overbank fl ooding and streambank stabilization concerns. In 2015, construction was completed on 3 Phase I projects and construction was initiated on 4 additional Phase I projects. It is anticipated 11 Phase I projects will be advertised in 2016. In addition, there are 10 Phase I projects in various stages of design. The District initiated Phase II of its Stormwater Management Program in 2013 to address local fl ooding problems

INTRODUCTORY SECTION 23
not necessarily involving overbank fl ooding. In 2013, 2014 and 2015, several Phase II projects were approved by the District to assist communities and agencies across Cook County to address fl ooding issues. Twenty-six shov-el-ready projects were approved for District funding assistance to local municipalities, and 15 problem areas were identifi ed for further study by the District under Phase 2. Since late in 2014, MWRD has been performing preliminary engineering for the 15 problem areas, while 14 of the shovel-ready projects were under construction (three of those completed in 2015), and six of the remaining 12 projects are under design. The three other problem areas that were identifi ed will need further study before a potential solution can be designed; those investigations began in 2014. In early 2016, it is anticipated that several of the MWRD preliminary engineering projects will move into fi nal design.
For circumstances where a fl ood control project is not feasible, MWRD initiated a Flood-Prone Property Acquisi-tion Program in 2015 and has partnered with the Village of Glenview and City of Des Plaines to acquire 30 proper-ties. The structures on the acquired properties have been removed and a deed restriction requiring the property to remain as open space into perpetuity. The municipalities own the acquired properties and perform all required main-tenance. In 2016, MWRD will be working with several municipalities to acquire additional fl ood-prone properties.
On October 3, 2013, the MWRD Board of Commissioners adopted the District’s Watershed Management Ordinance (WMO), which replaced the Sewer Permit Ordinance and established uniform, minimum, countywide stormwater management regulations for new development and redevelopment in Cook County. Components regulated under the WMO include drainage and detention, volume control, fl oodplain management, isolated wetland protection, riparian environment protection, and soil erosion and sediment control. The WMO became effective on May 1, 2014. Since that time, over 500 permits have been issued. MWRD has conducted 16 training events in addition to presenting at various seminars and conferences hosted by professional organizations in the past two years. The rules and regulations of the WMO serve to prevent the fl ooding situation in Cook County from worsening through development or redevelopment.
Replacement and Maintenance of Facilities
Many of the District’s plants and interceptor sewers were placed in service over 50 years ago. In order to maintain continuous operations, the District has initiated a Master Plan to replace physically deteriorating facilities through rehabilitation, alteration or expansion. The expected construction cost over the next fi ve years for the replacement and maintenance of facilities is $43.9 million. As discussed in the MD&A, condition assessments required under the modifi ed approach alert management to the need for maintenance and preservation projects for its infrastructure assets.
Means of Financing
The primary source of fi nancing construction projects is through State Revolving Fund (SRF) funding. The Water Quality Act Amendment of 1987 authorized the creation of State Revolving Funds. The Fund administered by the State of Illinois provides loans to municipal agencies for their wastewater construction programs. These loans carry interest rates which are below general rates available in the municipal bond market. The SRF loans are repaid through issuance of IEPA Series Capital Improvement bonds, whose interest rates match the SRF loan rates. When available, federal and state grants may also provide partial funding of construction projects. An additional source of fi nancing construction projects is through the sale of Capital Improvement bonds.
BUDGET PROCESS
The Board of Commissioners is required to adopt an annual budget no later than the close of the previous fi scal year. This annual budget serves as the foundation for the Metropolitan Water Reclamation District’s fi nancial planning and control. Annual budgets are prepared for the General Corporate, Construction, Capital Improvements Bond, Stormwater Management, and Debt Service Funds.
The District utilizes an on-line, real-time computer system to provide budget control at the line item level for the General Corporate, Construction, and Stormwater Management Funds, at the fund level for the Debt Service Fund, and at the line item class level for the Capital Improvements Bond Fund. All budget-relevant transactions are tested for the suffi ciency of available appropriation before any obligations resulting from purchase requisitions, purchase orders, or contracts are formally recognized, or payments resulting from payroll or other expenditures are released.

24 INTRODUCTORY SECTION
ECONOMIC BASE OUTLOOK
The District’s service area is sizeable, encompassing 98% of the assessed valuation of Cook County. The equalized assessed valuation of the District has experienced a .8% average growth rate over the last ten years and the current equalized assessed valuation of $125,736,187,743 is 1.8% higher than the previous year. A strong fund balance, along with an emphasis on controlling expenditures, should allow the District to protect its operations from eco-nomically sensitive revenues stemming from fi scal constraints at the federal and state levels.
COMMITMENT TO SUSTAINABILITY
Sustainability is a key feature of the District’s core values. The District is committed to developing initiatives that promote sustainability, which is to meet the needs of the present without compromising the ability of future gen-erations to meet their own needs. The development of these initiatives includes the Triple Bottom Line approach, which aids to capture and expand the spectrum of values and criteria for measuring organizational success through sound economic, environmental and social decisions when appropriate.
The District’s strategy is to engage stakeholders to continue in its core mission to protect the quality of the water supply source and manage water as a vital resource while establishing goals and objectives to reduce the consump-tion of energy and resources used in carrying out its mission. Listed below are the District’s major sustainable initiatives:
Financial Sustainability Initiatives
• District issued the fi rst ever green bonds in the State of Illinois to allow investors to invest directly into environmentally benefi cial capital projects. The District defi ned four categories of green projects: TARP, stormwater management, resource recovery and plant expansions & system improvements.
• Worked with the IEPA to pass legislation in Illinois that would recognize the federal ‘Class A” designation of biosolids, which will open up new markets for this valuable soil enhancement product and allow the District to reduce operating costs.
• 2015 was the fi rst year operating under new policy guidelines established by the Board concerning the District’s pension fund and the OPEB fund, which demonstrate the District’s commitment to sound fi scal management.
• Established local collaborations to utilize woodchips and landscape wastes from the City of Chicago and other local entities for composting with District biosolids as a cost-effective option to generate Exceptional Quality biosolids compost for local benefi cial reuse.
• Collaboration with U.S. Geological Survey and IEPA to evaluate groundwater in the TARP areas to reduce the groundwater monitoring requirement and costs associated with operation of TARP.
• Continue efforts to automate laboratory procedures to increase effi ciency and reduce cost of laboratory operations.
• Developing a retiree benefi t strategy to help control retiree health care costs and ensure the long-term viability of the program.
• Continued efforts to control health care costs through the Employee Wellness Program by conducting on-site health fairs and fl u vaccinations.
• Utilize information technology to improve business processes through automation in workfl ow, eliminating unnecessary tasks, reducing errors, making business intelligence data more available for better decision making and making performance measurements more visible.
• Evaluate business practices to maximize the District’s real estate portfolio. The District continues a balanced approach to maximize rental income while setting aside holdings for public recreational use.
• Continue long-term fi scal planning through the fi ve-year budgetary forecast and the Strategic Business Plan.
• Maintain reserve funds suffi cient to allow for fl exibility and protection in a volatile fi nancial environment.

INTRODUCTORY SECTION 25
Environmental Sustainability Initiatives
• Continue to implement strategies to meet the District’s goal of becoming energy neutral by 2023; specifi cally, food-to-energy and double gas productions, maximize use of digester gas capacity, market electrical capacity at Lockport, explore algae nutrient process reduction processes, and reduce energy consumption by 25%.
• Recover phosphorous from the plant’s liquid waste stream and turning the phosphorous into a fertilizer pellet and entered into an agreement for the eventual marketing and benefi cial reuse of the recovered phosphorus product. By taking this approach, the District is recovering a non-renewable resource and placing it back into the food cycle, rather than letting it be diluted and lost to the water environment.
• Research technologies using algae as a means to recover nutrients from wastewater. The algae can be used in a sustainable manner such as compost, aquaculture food supplement, bioplastics, and commercial dyes.
• Continue the development of an Odor Master Plan for odor mitigation for all District facilities and install an odor monitoring system at Calumet WRP to improve environmental quality for surrounding communities and employees.
• Collaborated with non-point source stakeholders and University of Illinois to establish fi led-scale research and demonstrations at the Fulton County site on best management practices for reducing nutrient loss from agricultural land as a means to foster collaboration between point and non-point source sectors.
• Update technology for laboratory operations that minimize hazardous waste and optimize safety.• Evaluate opportunities to enter into an agreement with one or more fi rms to supply liquid organic waste to
the Calumet WRP, which will maximize the production of biogas, a renewable energy source. The organic waste material will increase biogas production in the Calumet WRP’s anaerobic digesters by 30%.
• Obtain the benefi t of recent Illinois legislative changes to biosolids rules by increasing the use of Exceptional Quality biosolids within the 126 community service areas of the District annually to ensure most biosolids are benefi cially reused locally. The District can also reduce its carbon footprint by reducing signifi cant vehicle traffi c as organics will no longer need to be hauled to landfi lls.
• Continue operation of the Heritage Park Flood Control Facility, which provides necessary compensatory storage for the USACE’s Levee 37 project along the Des Plaines River. Sustainable elements of this project include native plantings, bioswales, natural stream bank stabilization, and the establishment of a riparian area.
• Replace wooden pallets with plastic pallets in the District’s storerooms, increasing their useful life by 15 years.
• Update IT infrastructure to reduce electricity consumption needed to run computing, telecom equipment and datacenters; reduce resources consumed to build out new facilities and reduce electronic waste that results from equipment disposal.
Infrastructure Sustainability Initiatives
• Implement the District’s Green Infrastructure Program Plan and Comprehensive Land Use Policy approved by the EPA in 2015.
• Providing fl ood relief to the Southern suburbs by completing construction of the 7.9 billion gallon Thornton Reservoir, this was placed into service in 2015.
• Implement ANITAtm Mox moving bed biofi lm process at Egan WRP.• Provide funding for the Space to Grow project through a partnership with Chicago Public Schools (CPS),
whereby construction of green infrastructure was completed at four CPS campuses. • Grow partnerships with communities throughout the county to address the serious issues of fl ooding.• Implementation of the Project Vetting Process allowing for well-informed and objective decision making,
appropriate allocation of limited resources and assigning priorities based on organizational goals and needs.• Engage in full cost pricing and perform Triple Bottom Line analysis for all Engineering process system
evaluations.• Provide the talent required for current and future needs through effective recruitment, selection, and
employee development and benefi t programs. • Provided internship opportunities for students to learn about District operations through direct experience,
and promote careers in the water resource recovery fi eld. • Employed e-learning for mandatory employee training and expanded its use for other targeted training
programs.

26 INTRODUCTORY SECTION
FINANCIAL POLICIES
In order to protect the strong fi nancial position of the District, ensure uninterrupted services, and stabilize annual tax levies, the Board of Commissioners adopted the following policies on December 21, 2006 to enhance and maintain budgetary fund balances. The General Corporate Fund policy was amended and the Stormwater Management Fund policy was adopted on December 10, 2009. The Stormwater Management Fund policy and the Bond Interest Funds Investment Income Policy were amended on November 3, 2011.
To ensure the long-term fi nancial health of the pension program and other post-employment benefi ts, the Pension Funding Policy and the amended OPEB Advance Funding Policy were adopted on October 2, 2014.
General Corporate Fund
• Corporate Fund undesignated fund balance as of January 1 of each budget year is to be kept between 12% and 15% of appropriations. The fund balance may be maintained by not fully appropriating prior year fund balances. This level of fund balance will ensure the District’s ability to maintain all operations even in the event of unanticipated revenue shortfalls and provide time to adjust budget and operations.
• Corporate Working Cash Fund must be suffi cient to fi nance 95% of the full annual expenditure of the Corporate Fund. This will be fi nanced through transfers of surpluses from the Construction Working Cash Fund, direct tax levies, tax levy fi nanced debt (Working Cash Bonds) and transfers of accumulated interest from other funds. This level of fund balance will continue fi nancing the Corporate Fund in the event of the typical and extraordinary delays in second installment real estate tax collections.
• It is the intent of the Board of Commissioners to fund the Reserve Claim Fund to the maximum level permitted by statute, 0.05% of the Equalized Assessed Valuation, whenever economically feasible. This will be fi nanced through tax levies at the maximum 0.5 cents per $100 of equalized assessed valuation when economically feasible and fi nancially prudent. This level of funding will protect the District in the event that environmental remediation costs cannot be recovered from former industrial tenants of District properties, catastrophic failure of District operational infrastructure or other claims. As the District is partially self-insured, adequate reserves are critical.
The District will appropriate funds from the unassigned fund balance for emergencies as well as for other require-ments that the District believes to be in its best interest. In the event that any of these specifi c component objectives cannot be met, the Executive Director will report this fact and the underlying causes to the Board of Commission-ers with a plan to bring the fund balances back into compliance with policy within a two-year period. In order to maintain relevance, this policy will be reviewed every three years following adoption or sooner at the discretion of the Executive Director.
Stormwater Management FundThe maximum property tax levy of 5 cents per $100 of Equalized Assessed Valuation for the Stormwater Manage-ment Fund shall be allocated at a maximum 2 cents per $100 of equalized assessed valuation to fund operations and maintenance expenditures and a maximum 3 cents per $100 of equalized assessed valuation to fund direct cash outfl ows for capital and capital-related expenditures and the interest and redemption of general obligation bond issues for capital projects.
Capital Improvements Bond Fund Investment IncomeInvestment earnings from the Capital Improvements Bond Fund resulting from all future bond issues will fund an equity transfer to the Bond Redemption and Interest Funds and be used to abate property tax levies or for other corporate needs. This practice will also limit the payment of arbitrage rebates.

INTRODUCTORY SECTION 27
FINANCIAL POLICIES (continued)
Bond Redemption and Interest Funds Investment Income (Debt Service Fund)Fund balances in the Bond Redemption and Interest Funds that might accumulate due to investment income will be identifi ed and used to abate Bond and Interest property tax levies or for other corporate purposes. These abatements appropriately reduce property tax levies by the amount earned on invested balances above what is necessary for paying principal and interest due over the following 12 months, while still maintaining appropriate fund balances and when not required for other corporate purposes. This policy and the subsequent tax abatements will assist in compliance with the Board of Commissioners’ overall tax levy policy (not to exceed a 5% increase over prior year not including the Stormwater Management Fund tax levy).
Abatement of Interest Rate Subsidies from Build American Bond IssuancesInterest reimbursement payments related to taxes levied for Build America Bond issuances will be presented to the Board of Commissioners for approval to abate, to be used for any lawful corporate purpose, or a combination thereof as determined as part of the annual budget process. Such abatement or alternative lawful use of the funds will be presented to the Board of Commissioners for approval prior to any abatement or use of reimbursement funds.
Capital Improvements Bond Fund Accumulated IncomeRevenues that have accumulated in the Capital Improvements Bond Fund (CIBF) from investment income, grants, or State Revolving Fund revenues will primarily be used for capital projects. Capital projects are generally in the CIBF; however, capital projects in the Construction or Corporate Funds of critical importance may be fi nanced by transfers from this revenue source. These funds may be transferred to the Bond Redemption and Interest Funds to be used to abate property taxes, or may be used for other corporate needs as necessary.
Accounting Policies of Fund BalanceThe General Corporate Fund is a combination of the Corporate, Working Cash, and Reserve Claim Funds. In the General Corporate Fund, the District considers restricted amounts to have been spent fi rst when an expenditure is incurred for purposes for which both restricted and unrestricted fund balance is available, followed by committed amounts, and then assigned amounts. Unassigned amounts are used only after the other categories of fund balance have been fully utilized. In governmental funds other than the General Corporate Fund, the District considers re-stricted amounts to have been spent last. When an expenditure is incurred for purposes for which both restricted and unrestricted fund balance is available, the District will fi rst utilize assigned amounts, followed by committed amounts, and then restricted amounts.
Committed Fund BalanceThe District’s commissioners shall establish, modify, or rescind a fund balance commitment by formal action of the Board of Commissioners.
Assigned Fund BalancesThe Executive Director may assign amounts of fund balances to a specifi c purpose.
Retirement FundThe funding goal of the Policy is to contribute annually to the Fund an amount that over time will increase the ratio of the Fund assets to accrued liabilities to 100% by the year 2050. This is to be achieved by accumulating adequate resources for future benefi t payments in a manner that fully funds the long-term costs of benefi ts and reduces vola-tility in the employer contribution amounts, in accordance with statutory requirements.
OPEB TrustThe OPEB Trust establishes a reserve that will help ensure the fi nancial ability to provide health care coverage for District retirees and their benefi ciaries in the future. The Advance Funding Policy for the OPEB Trust Fund, amended in October 2014, refl ects a 100% funding goal to be achieved by 2027 with no further advance contribu-tions required after 2026. The policy to increase the OPEB liability funding percentage helps to solidify the Dis-trict’s solid fi nancial foundation and makes the retiree healthcare plan sustainable for the long-term.

28 INTRODUCTORY SECTION
AWARDS
The Government Finance Offi cers Association of the United States and Canada (GFOA) awarded a Certifi cate of Achievement for Excellence in Financial Reporting to the Metropolitan Water Reclamation District of Greater Chicago for its Comprehensive Annual Financial Report for the fi scal year ended December 31, 2014. This was the 40th consecutive year that the Metropolitan Water Reclamation District has achieved this prestigious award. In order to be awarded a Certifi cate of Achievement, a government must publish an easily readable and effi ciently organized comprehensive annual fi nancial report. This report must satisfy both generally accepted accounting prin-ciples and applicable legal requirements.
A Certifi cate of Achievement is valid for a period of one year only. We believe that our current comprehensive annual fi nancial report continues to meet the Certifi cate of Achievement Program’s requirements, and we are sub-mitting it to the GFOA to determine its eligibility for another certifi cate.
The District has been presented with the award for Distinguished Budget Presentation by the GFOA for the annual budget for the year beginning January 1, 2015. To receive this award, a governmental unit must publish a budget document that meets program criteria as a policy document, fi nancial plan, communications medium, and opera-tions guide. The award, which is valid for a one year period only, has been received for 31 consecutive years.
ACKNOWLEDGMENTS
Preparation of this report refl ects the combined efforts of the dedicated professional personnel of the operating and support Departments. Their expertise, enthusiasm, and unswerving focus on excellence are gratefully acknowl-edged. The general citizenry, in our opinion, may fully rely on the 2015 Comprehensive Annual Financial Report as a fair and accurate presentation, in all material aspects, of the fi nancial position and operational results of the Metropolitan Water Reclamation District of Greater Chicago.
Respectfully submitted,

INTRODUCTORY SECTION 29

30 INTRODUCTORY SECTION
Page intentionally left blank

II.FINANCIAL
SECTION
On Sept. 26, water professionals from around the globe converged at Pershing East Magnet School, 3200 S. Calumet Ave., Chicago, to construct a green infrastructure learning garden as part of the Water Environment Federation’s (WEF’s) 88th Annual Technical Exhibition and Conference.

32 FINANCIAL SECTION
To the Honorable President and Members of the Board of CommissionersMetropolitan Water Reclamation District of Greater ChicagoChicago, Illinois
We have audited the accompanying financial statements of the governmental activities, each major fund, and the aggregate remaining fund information of the Metropolitan Water Reclamation District of Greater Chicago (the District), as of and for the year ended December 31, 2015, and the related notes to the financial statements, which collectively comprise the District’s basic financial statements as listed in the table of contents.
Management is responsible for the preparation and fair presentation of these financial statements in accordance with accounting principles generally accepted in the United States of America; this includes the design, implementation, and maintenance of internal control relevant to the preparation and fair presentation of financial statements that are free from material misstatement, whether due to fraud or error.
Our responsibility is to express opinions on these financial statements based on our audit. We did not audit the financial statements of the Metropolitan Water Reclamation District Pension Trust Fund (Pension Fund),which represents 85 percent, and 59 percent, respectively, of the assets, and revenues/additions of the aggregate remaining fund information. Those statements were audited by other auditors, whose report has been furnished to us, and our opinion, insofar as it relates to the amounts included for the Pension Fund,is based solely on the report of the other auditors. We conducted our audit in accordance with auditing standards generally accepted in the United States of America and the standards applicable to financial audits contained in , issued by the Comptroller General of the United States. Those standards require that we plan and perform the audit to obtain reasonable assurance about whether the financial statements are free of material misstatement.
An audit involves performing procedures to obtain audit evidence about the amounts and disclosures in the financial statements. The procedures selected depend on the auditor’s judgment, including the assessment of the risks of material misstatement of the financial statements, whether due to fraud or error. In making those risk assessments, the auditor considers internal control relevant to the entity’s preparation and fair presentation of the financial statements in order to design audit procedures that are appropriate in the circumstances, but not for the purpose of expressing an opinion on the effectiveness of the entity’s internal control. Accordingly, we express no such opinion. An audit also includes evaluating the appropriateness of accounting policies used and the reasonableness of significant accounting estimates made by management, as well as evaluating the overall presentation of the financial statements.
FINANCIAL SECTION 33
We believe that the audit evidence we have obtained is sufficient and appropriate to provide a basis for our audit opinions.
In our opinion, based on our audit and the report of the other auditor, the financial statements referred to above present fairly, in all material respects, the respective financial position of the governmental activities, each major fund, and the aggregate remaining fund information of the Metropolitan Water Reclamation District of Greater Chicago, as of December 31, 2015, and the respective changes in financial position thereof and the respective budgetary comparisons for the General Corporate Fund and the Retirement Fund for the year then ended in accordance with accounting principles generally accepted in the United States of America.
As discussed in Note 15 to the financial statements, during the year ended December 31, 2015 the District implemented the provisions of GASB Statement No. 68
an amendment of GASB Statement No. 27 and GASB Statement No. 71 , which
required a restatement to opening net position. Our opinion is not modified with respect to this matter.
The basic financial statements include partial prior-year comparative information. Such information does not include sufficient detail to constitute a presentation in conformity with accounting principles generally accepted in the United States of America. Accordingly, such information should be read in conjunction with the government’s basic financial statements for the year ended December 31, 2014, from which such partial information was derived. The basic financial statements as of and for the year ended December 31, 2014, were audited by other auditors whose report, dated May 11, 2015, expressed an unmodified opinion.
Accounting principles generally accepted in the United States of America require that management’sdiscussion and analysis, modified approach information, and pension and other postemployment benefit plans schedules on pages 35 – 50 and 112 – 119 be presented to supplement the basic financial statements. Such information, although not a part of the basic financial statements, is required by the Governmental Accounting Standards Board who considers it to be an essential part of financial reporting for placing the basic financial statements in an appropriate operational, economic, or historical context. We have applied certain limited procedures to the required supplementary information in accordance withauditing standards generally accepted in the United States of America, which consisted of inquiries of management about the methods of preparing the information and comparing the information for consistency with management’s responses to our inquiries, the basic financial statements, and other knowledge we obtained during our audit of the basic financial statements. We do not express an opinion or provide any assurance on the information because the limited procedures do not provide us with sufficient evidence to express an opinion or provide any assurance.
Our audit for the year ended December 31, 2015 was conducted for the purpose of forming opinions on the financial statements that collectively comprise the District's basic financial statements. The Combining and Individual Fund Statements and Schedules and the Introductory and Statistical and Demographic Section for the year ended December 31, 2015 are presented for purposes of additional analysis and are not a required part of the basic financial statements. Such information is the responsibility of management and was derived from and relates directly to the underlying accounting and other records used to prepare the basic financial statements. The Combining and Individual Fund Statements and Schedules have been subjected to the auditing procedures applied in the audits of the financial statements for the year ended December 31, 2015 and certain additional procedures, including comparing and reconciling such information directly to the underlying accounting and other records used to prepare the basic financial statements or to the basic financial statements themselves, and other additional procedures in accordance with auditing standards generally accepted in the United States of America by us and other auditors. In our

34 FINANCIAL SECTION
opinion, based on our audit, the procedures performed as described above, and the report of the other auditors, the Combining and Individual Fund Statements and Schedules are fairly stated in all material respects in relation to the basic financial statements as a whole for the year ended December 31, 2015.
The District's basic financial statements for the year ended December 31, 2014 (not fully presented herein), were audited by other auditors whose report thereon dated May 11, 2015, expressed unmodified opinions on the respective financial statements of the governmental activities, each major fund, and the aggregate remaining fund information. The report of the other auditors dated May 11, 2015, stated that the Combining and Individual Fund Statements and Schedules for the year ended December 31, 2014 were subjected to the auditing procedures applied in the audit of the 2014 basic financial statements and certain additional auditing procedures, including comparing and reconciling such information directly to the underlying accounting and other records used to prepare those basic financial statements or to those basic financialstatements themselves, and other additional procedures in accordance with auditing standards generally accepted in the United States of America and, in their opinion, was fairly stated in all material respects in relation to the basic financial statements as a whole for the year ended December 31, 2014.
Our audit was conducted for the purpose of forming opinions on the financial statements that collectively comprise the District's basic financial statements. The Introductory Section and the Statistical and Demographics Section listed in the table of contents are presented for purposes of additional analysis and are not a required part of the basic financial statements. Such information has not been subjected to the auditing procedures applied in the audit of the basic financial statements, and accordingly, we do not express an opinion or provide any assurance on it.
In accordance with , we have also issued our report dated May 9, 2016 onour consideration of the District’s internal control over financial reporting and on our tests of its compliance with certain provisions of laws, regulations, contracts, and grant agreements and other matters. The purpose of that report is to describe the scope of our testing of internal control over financial reporting and compliance and the results of that testing, and not to provide an opinion on internal control over financial reporting or on compliance. That report is an integral part of an audit performed in accordance with
in considering the District’s internal control over financial reporting and compliance.
Chicago, IllinoisMay 9, 2016

FINANCIAL SECTION 35
Management’s Discussion and Analysis (MD&A) - UnauditedYear ended December 31, 2015 Metropolitan Water Reclamation District of Greater Chicago
The Metropolitan Water Reclamation District of Greater Chicago (the “District”) is providing Management’s Discussion and Analysis (MD&A) to assist the readers in understanding the fi nancial information presented in this report. The MD&A includes a discussion of the basic fi nancial statements and their relationship to each other. It also offers an analysis of the District’s fi nancial activities at both the government-wide and fund levels, based on known facts, and compares the current year’s results with the prior year’s. A budgetary analysis of the District’s General Corporate Fund is provided, as well as an analysis of capital assets and debt activity. Finally, the MD&A concludes with a discussion of issues that are expected to be signifi cant to the District’s fi nances.
The MD&A should be read in conjunction with the Clerk/Director of Finance’s letter of transmittal and the basic fi nancial statements.
2015 FINANCIAL HIGHLIGHTS
● The District’s government-wide net position is $4,529,206,000. This can be attributed to the District’s positive balance of $4,630,463,000 in net investment in capital assets.
● The District’s government-wide net position increased by $37,750,000 in 2015. The increase is primarily due to an increase in capital assets, which is related to the new disinfection facilities and phosphorous recovery technologies being implemented to meet the District’s goal of being environmentally responsible. This includes construction of disinfection facilities at the Calumet and O’Brien WRPs, improved settling tanks and aerated grit facility at the Stickney WRP, implementing a process at the Stickney WRP to recover phosphorous, continued construction of TARP tunnels, completion of the Thornton reservoir, and continued construction on the McCook reservoir to alleviate fl ooding throughout Cook County.
● The District’s combined fund balances for its governmental funds at December 31, 2015 totaled $784,400,000, an increase of $165,000,000 from the prior year. The increase is primarily attributable to the issuance of general obligation bonds in 2015.
● The District’s government-wide liabilities increased by $396,993,000 in 2015 which is largely attributable to the issuance of general obligation bonds. The District implemented GASB 68 in 2015, resulting in a restatement of 2014 net position. As a result of the implementation of GASB 68, the District was required to record a pension liability of $947,300,000 in 2015 and $914,578,000 in 2014.
DISCUSSION OF THE BASIC FINANCIAL STATEMENTS
The District’s basic fi nancial statements include both a short and long-term view of its fi nancial activities. The focus is on both the District as a whole (government-wide) and on major individual funds. The District’s basic fi nancial statements include three components: (1) government-wide fi nancial statements; (2) fund fi nancial statements; and (3) notes to the basic fi nancial statements. In addition to the basic fi nancial statements, the fi nancial section of this report includes Required Supplementary Information (RSI) and Combining and Individual Fund Statements and Schedules.
Government-wide fi nancial statements. The government-wide fi nancial statements are provided to give readers a long-term overview of the District’s fi nances, similar to a private-sector business. Government-wide statements consist of the Statements of Net Position and Statements of Activities, and are prepared using the accrual basis of accounting and the economic resources (long-term) measurement focus. They include all the District’s governmental activities; there are no business-type activities. The fi duciary funds’ resources are restricted for employee pensions and other post-employment benefi ts, and are not available to support the operations of the District. Therefore, the fi duciary funds are not reported in the government-wide fi nancial statements.

Management’s Discussion and Analysis (MD&A) - UnauditedYear ended December 31, 2015
36 FINANCIAL SECTION
The Statements of Net Position report the fi nancial position of the District as a whole, presenting all the assets and liabilities (including capital assets and long-term obligations) with the difference between the assets and deferred outfl ows of resources less liabilities and deferred infl ows of resources representing net position. The increase or decrease in net position over time can serve as a useful indicator of whether the fi nancial position of the District is improving or declining.
The Statements of Activities report the operating results of the District as a whole, presenting all revenues and expenses of the District as well as the change in net position. The Statements of Activities include revenues earned in the current fi scal year that will be received in future years, and expenses incurred for the current year that will be paid in future years (i.e. revenue for uncollected taxes and expenses for accumulated, but unused, compensated absences). Revenues are segregated by general revenues and program revenues. General revenues include taxes, interest on investments, and all other revenues not classifi ed as program revenues. Program revenues include charges for services (i.e. user charges, land rentals, fees, forfeitures, and penalties) and capital grants. Depreciation for depreciable capital assets is recorded as an expense in this statement.
Fund fi nancial statements. The District uses fund accounting to demonstrate compliance with fi nance-related legal requirements. For this purpose, a fund is a grouping of related accounts used to maintain control over resources segregated for specifi c activities or objectives.
The fund fi nancial statements include information segregated between the District’s governmental funds and its fi duciary funds. The governmental funds are used to account for the day-to-day activities of the District, while the fi duciary funds account for employee pensions (Pension Trust Fund) and other post-employment benefi ts (OPEB Trust Fund). The Governmental Funds Balance Sheets and Statements of Governmental Fund Revenues, Expenditures and Changes in Fund Balances focus the reader’s attention on the short-term fi nancial position and results of operations, respectively, using the modifi ed accrual basis of accounting. They also include a budgetary statement for the General Corporate Fund that compares the original and fi nal budget amounts to actual results. This statement is provided to demonstrate compliance with the budget.
The Statements of Fiduciary Net Position and Statements of Changes in Fiduciary Net Position report the net position available for future pension and OPEB benefi ts and the change in net position, respectively. The fi duciary fi nancial statements utilize the accrual basis of accounting, similar to that used for the government-wide fi nancial statements.
Reconciliation of governmental fund fi nancial statements to government-wide fi nancial statements. Because the short-term focus of governmental fund fi nancial statements is narrower than the long-term government-wide fi nancial statement focus, reconciliations are required to explain the differences between the fund and government-wide fi nancial statements. As a special purpose government, the District has elected to present the reconciliation by combining the presentation of the governmental fund statements with the government-wide statements. The Governmental Funds Balance Sheets are reconciled to the Statements of Net Position in a combined fi nancial statement presentation (Exhibit A-1). Likewise, the Statements of Governmental Fund Revenues, Expenditures, and Changes in Fund Balances are reconciled to the Statements of Activities in a combined fi nancial statement presentation (Exhibit A-2).
Notes to the basic fi nancial statements. The basic fi nancial statements include notes that provide additional disclosure to better explain the fi nancial data provided in the basic fi nancial statements.
KEY FINANCIAL COMPARISONS
Property taxes. The primary source of revenue for the District is ad valorem property taxes. All District funds, with the exception of the District’s Capital Improvements Bond Fund, derive their revenues primarily from property taxes. In 2015, total property tax revenues increased by $4,681,000 in the District’s Statement of Changes in Net Position, as shown on page 39. A signifi cant portion of the increase in property taxes is due to an increase in the Bond and Interest Fund levy. The District issued “Green Bonds” in 2015 to fulfi ll its statutory responsibilities, but also to allow investors the opportunity to invest in these environmentally benefi cial projects. Increases in the tax levy also occurred in the Stormwater Fund. A portion of the Stormwater levy will be used to fund the District’s Green Bonds, which will be used for green Stormwater Management Program projects.

Metropolitan Water Reclamation District of Greater Chicago
FINANCIAL SECTION 37
These environmentally friendly projects include identifying fl ood and erosion-prone areas while recommending projects to focus on concerns, address local drainage problems, develop Stormwater Master Plans across Cook County, and establish a program for purchasing fl ood-prone and fl ood-damaged property.
Interest. The decrease in interest income of $4,105,000 on page 39 is mainly attributable to a decrease in the average holdings in the U.S. Government Agencies and Municipal Bonds from $520,745,000 in 2014 to $388,940,000 in 2015.
Tax increment fi nancing. The increase in other general revenues of $11,292,000, on page 39, is primarily due to the $8,144,000 increase in additional tax increment fi nancing distributions received from the City of Chicago during 2015.
Construction costs. The decrease in construction costs of $7,757,000 on page 39 was primarily due to the completion of construction projects including the disinfection facilities at the Calumet and O’Brien WRPs and the Thornton Reservoir in 2015.
Employee costs. The District’s employee-related expenditures are the largest single cost of the General Corporate Fund, comprising 66.6% of the total outlays for 2015. Employee costs are composed of regular pay, overtime, and health care benefi ts. The decrease in employee costs of $10,353,000 on page 41 was mostly attributable to a $15 million decrease in other post-employment benefi t contributions (OPEB), offset by an approximate $4 million increase in wages due to 21 positions being added in 2015.
Energy costs. A signifi cant amount of District expenditures are energy costs, mainly electricity and gas. In 2015, energy costs in the General Corporate Fund showed a slight increase of $24,000 as seen on page 41. Energy costs were held fl at mostly due to fi xed-rate electricity contracts, along with aggressive energy conservation efforts.
Pension costs. The annual amount expensed in connection to the District’s net pension liability. There are a variety of costs included in this calculation including employee service cost, interest, benefi t payments and differences between expected and actual experiences. Employee contributions and net investment income of the fund offset some of these annual expenses. The District implemented GASB 68, “Accounting and Financial Reporting for Pensions”, in the current period. Please see Notes 7, 11 and 15 of the basic fi nancial statements.
Claims and judgments. In 2015, the General Corporate Fund claims and judgments expenditures decreased $39,330,000, as shown on page 41, due to a settlement paid on a lawsuit from the Reserve Claim Fund in 2014. The claim had been properly accrued in the government-wide fi nancial statements in the prior year, resulting in a minimal change in the Statement of Net Position for claims and judgments expense on page 39.

Management’s Discussion and Analysis (MD&A) - UnauditedYear ended December 31, 2015
38 FINANCIAL SECTION
ANALYSIS OF GOVERNMENT-WIDE FINANCIAL STATEMENTS
A condensed comparison of the Statements of Net Position for December 31, 2015 and 2014, is presented in the following schedule (in thousands of dollars):
Percent Increase Increase
2015 2014 (Decrease) (Decrease)Assets:
Current and other assets $ 1,349,680 $ 1,173,059 $ 176,621 15.1 %Capital assets 7,282,020 7,040,441 241,579 3.4
Total assets 8,631,700 8,213,500 418,200 5.1Deferred Outfl ows of Resources
Loss on prior debt refunding 12,511 13,518 (1,007) (7.4)Deferred amounts related to pension 91,456 73,906 17,550 23.7
Total deferred outfl ows of resources 103,967 87,424 16,543 18.9Liabilities:
Current liabilities 303,102 279,344 23,758 8.5Long-term liabilities 3,903,359 3,530,124 373,235 10.6
Total liabilities 4,206,461 3,809,468 396,993 10.4Net Position:
Net investment in capital assets 4,630,463 4,548,793 81,670 1.8Restricted 654,897 665,612 (10,715) (1.6)Unrestricted (Defi cit) (756,154) (722,949) (33,205) 4.6
Total net position $ 4,529,206 $ 4,491,456 $ 37,750 0.8 %
The above schedule reports that the District’s net position totaled $4,529,206,000 at December 31, 2015, which represents the amount the District’s assets and deferred outfl ows exceeded its liabilities. The largest portion of the net position, $4,630,463,000, represents the District’s capital assets used to provide services to taxpayers, net of the related debt. These assets include land, buildings, equipment, and infrastructure, and they are not available for the District’s future spending needs. Restricted net assets totaled $654,897,000 and represents resources that are subject to external or legal restrictions as to how they may be spent, such as federal grants or state loans, capital bond proceeds, tax levies for working cash, and debt service. The remaining portion of the unrestricted net position is a defi cit of ($756,154,000).

Metropolitan Water Reclamation District of Greater Chicago
FINANCIAL SECTION 39
A comparison of the changes in net position resulting from the District’s operations for the years ended December 31, 2015 and 2014 is presented in the following schedule (in thousands of dollars):
Percent Increase Increase
2015 2014 (Decrease) (Decrease)Revenues General Revenues:
Taxes $ 571,103 $ 566,422 $ 4,681 0.8 %Interest 5,381 9,486 (4,105) (43.3)Other 22,145 10,853 11,292 104.0
Program Revenues:User charges 46,238 50,696 (4,458) (8.8)Land rentals 18,189 16,357 1,832 11.2Fees, forfeits, and penalties 4,885 5,456 (571) (10.5)Capital grants 11,170 11,089 81 0.7
Total revenues 679,111 670,359 8,752 1.3Expenses
Board of Commissioners 3,671 3,721 (50) (1.3)General Administration 14,835 15,096 (261) (1.7)Monitoring and Research 27,259 26,922 337 1.3Procurement and Materials Management 6,801 6,331 470 7.4Human Resources 58,512 72,896 (14,384) (19.7)Information Technology 14,602 14,708 (106) (0.7)Law 6,008 6,812 (804) (11.8)Finance 3,401 3,433 (32) (0.9)Engineering 27,232 26,561 671 2.5Maintenance and Operations 173,177 169,234 3,943 2.3Pension costs 87,145 92,944 (5,799) (6.2)OPEB Trust Fund costs (5,408) (19,449) 14,041 (72.2)Claims and judgments 23,560 2,660 20,900 785.7Construction costs 69,434 77,191 (7,757) (10.0)Loss on disposal of capital assets 32 127 (95) (74.8)Unallocated depreciation 12,123 12,229 (106) (0.9)Interest 118,977 114,328 4,649 4.1
Total expenses 641,361 625,744 15,617 2.5Increase in net position 37,750 44,615 (6,865) (15.4)
Total net position, beginningof year as restated 4,491,456 4,446,841 44,615 1.0
Total net position, end of year as restated $ 4,529,206 $ 4,491,456 $ 37,750 0.8 %
Total revenues increased by $8,752,000 in 2015, or 1.3% from the prior year and total expenses increased by $15,617,000 in 2015. The major reasons for the variances are detailed under “Key Financial Comparisons” on pages 36-37.

Management’s Discussion and Analysis (MD&A) - UnauditedYear ended December 31, 2015
40 FINANCIAL SECTION
The following charts show the major sources of revenue and expenses for the year ended December 31, 2015:
ANALYSIS OF DISTRICT’S GOVERNMENTAL FUND FINANCIAL STATEMENTS
As previously discussed, the focus of the District’s governmental funds is on short-term infl ows, outfl ows, and currently available resources. The emphasis in the governmental fund fi nancial statements is on major funds. Each major fund is presented as a separate column in the governmental fund fi nancial statements. For 2015, the District reports four major funds and two non-major funds. The four major governmental funds are the General Corporate Fund, the Retirement Fund, the Capital Improvements Bond Fund, and the Debt Service Fund. The non-major governmental funds are the Construction Fund and the Stormwater Management Fund.
The District ended the current fi scal year with combined governmental fund balances of $784,400,000, an increase of $165,000,000 or 26.6% from 2014. A total of $39,760,000 of the fund balances represents non-spendable fund balances. Restricted fund balances totaled $684,237,000, Assigned fund balances totaled $127,920,000, and the remaining defi cit of ($67,517,000) was unassigned.
General Corporate FundThe General Corporate Fund is the principal operating fund of the District. It includes annual property taxes and other
revenues, which are used for the payment of general operating expenditures not chargeable to other funds. The General Corporate Fund’s fund balance at the end of the current fi scal year totaled $287,112,000. The fund balance represented 84.3% of the General Corporate Fund expenditures, a good indication of the fund’s liquidity. The total fund balance for the General Corporate Fund had a slight increase of $86,000 from 2014. The District’s General Corporate Fund consists of the Corporate, Corporate Working Cash, and Reserve Claim Divisions, which are presented and explained in Note 1b on pages 62-64.
The General Corporate Fund ended the year with an unassigned fund balance defi cit of ($58,427,000) due to the required reserve claims restriction, non-spendable inventories and restricted working cash.

Metropolitan Water Reclamation District of Greater Chicago
FINANCIAL SECTION 41
A detailed comparison of the General Corporate Fund revenues for the years ended December 31, 2015 and 2014 is shown in the following schedule (in thousands of dollars):
General Corporate Fund Comparative Revenue Schedule
2015 2014 Percent % of % of Increase Increase
Amount Total Amount Total (Decrease) (Decrease)Revenues:
Property taxes $ 225,861 66.3 % $ 230,128 67.6 % $ (4,267) (1.9)%Personal property
replacement tax 25,295 7.4 27,309 8.0 (2,014) (7.4)Total tax revenue 251,156 73.7 257,437 75.5 (6,281) (2.4)
Interest on investments 1,838 0.5 3,594 1.1 (1,756) (48.9)Land sales 3,164 0.9 8 0.0 3,156 395.5Tax increment fi nancing distributions 13,069 3.9 4,925 1.5 8,144 165.4Claims and damage settlements 191 0.1 177 0.1 14 7.9Government grants - 0.0 21 0.0 (21) (100.0)Miscellaneous 3,486 1.0 2,908 0.9 578 19.9User charges 45,938 13.5 50,396 14.8 (4,458) (8.8)Land rentals 18,189 5.3 16,357 4.8 1,832 11.2Fees, forfeits, and penalties 3,667 1.1 3,959 1.2 (292) (7.4)
Total revenues $ 340,698 100.0 % $ 339,782 100.0 % $ 916 0.3 %
Revenues for the General Corporate Fund come from various major sources: property taxes, replacement taxes, user charges, interest on investments, rental income and tax increment fi nancing distributions. In 2015, General Corporate Fund revenues totaled $340,698,000, an increase of $916,000, or 0.3%, from 2014. The major variances in revenues are explained under “Key Financial Comparisons” on pages 36-37.
A comparative analysis of the General Corporate Fund expenditures by object class for the years ended December 31, 2015 and 2014, is shown in the following schedule (in thousands of dollars):
General Corporate FundComparative Expenditures Schedule
2015 2014 Percent% of % of Increase Increase
Amount Total Amount Total (Decrease) (Decrease)Expenditures:
Employee cost $ 226,834 66.6 % $ 237,187 61.1 % $ (10,353) (4.4)%Energy cost 37,207 10.9 37,183 9.6 24 0.1Chemicals 7,473 2.2 5,798 1.5 1,675 28.9Solids disposal 10,356 3.0 9,007 2.3 1,349 15.0Repair to structures/equipment 16,514 4.8 14,395 3.7 2,119 14.7Materials, parts & supplies 11,486 3.4 11,914 3.1 (428) (3.6)Machinery & equipment 690 0.2 1,157 0.3 (467) (40.4)Land 326 0.1 - 0.0 326 326.0Claims and judgments 5,658 1.7 44,988 11.6 (39,330) (87.4)All other 24,068 7.1 26,252 6.8 (2,184) (8.3)
Total expenditures $ 340,612 100.0 % $ 387,881 100.0 % $ (47,269) (12.2)%

Management’s Discussion and Analysis (MD&A) - UnauditedYear ended December 31, 2015
42 FINANCIAL SECTION
In 2015, General Corporate Fund expenditures totaled $340,612,000, an overall decrease of $47,269,000, or 12.2%, from 2014. Employee costs, energy costs, and repair to structures and equipment were the three largest expenditure components of the General Corporate Fund in 2015, accounting for 82.4% of total expenditures versus 74.4% in 2014. The major variances in expenses are explained under “Key Financial Comparisons” on pages 36-37.
Other Major Funds. The District’s Debt Service Fund accounts for property tax revenues and interest earnings used for the payment of principal and interest on bonded debt. The Debt Service Fund’s fund balance at the end of the current fi scal year totaled $140,806,000. The fund balance represented 65.6% of the total Debt Service Fund expenditures. The fund balance for the Debt Service Fund increased by $644,000 in the current year, as a result of an increase to the fund’s tax levy in order to make upcoming bond principal and interest payments.
The Capital Improvements Bond Fund is a capital projects fund used by the District for the construction and preservation of capital facilities. The Capital Improvements Bond Fund’s resources are bond proceeds, government grants, and state revolving fund loans. The fund balance in the Capital Improvements Bond Fund at the end of the current fi scal year totaled $303,650,000. This amount will provide resources for the 2016 capital construction program. The fund balance represented 1.10% of the fund’s expenditures. The fund balance increase of $181,961,000 in the current year was primarily due to the District issuing $225,000,000 of General Obligation Improvement Bonds in 2015.
The Retirement fund is classifi ed as a major fund because total liabilities in prior years have been greater than 10% of the total governmental funds, and the fund is used for collection of the tax levy which is remitted to the Pension Board. This presentation remains for comparative purposes. There is no fund balance for the Retirement Fund at the end of the current fi scal year, as all funds are transferred, or due to, the District’s Pension Fund.
GENERAL CORPORATE FUND BUDGET ANALYSIS
The General Corporate Fund budget includes the budgetary accounts of the Corporate Fund and Reserve Claim divisions. A comparison of the 2015 original budget to the fi nal amended budget and actual results for the General Corporate Fund is presented in the basic fi nancial statements (Exhibit A-3). A comparison of the General Corporate Fund’s 2015 budget and actual results at the appropriation line item level is presented in Combining and Individual Fund Statements and Schedules (Exhibit C-1).
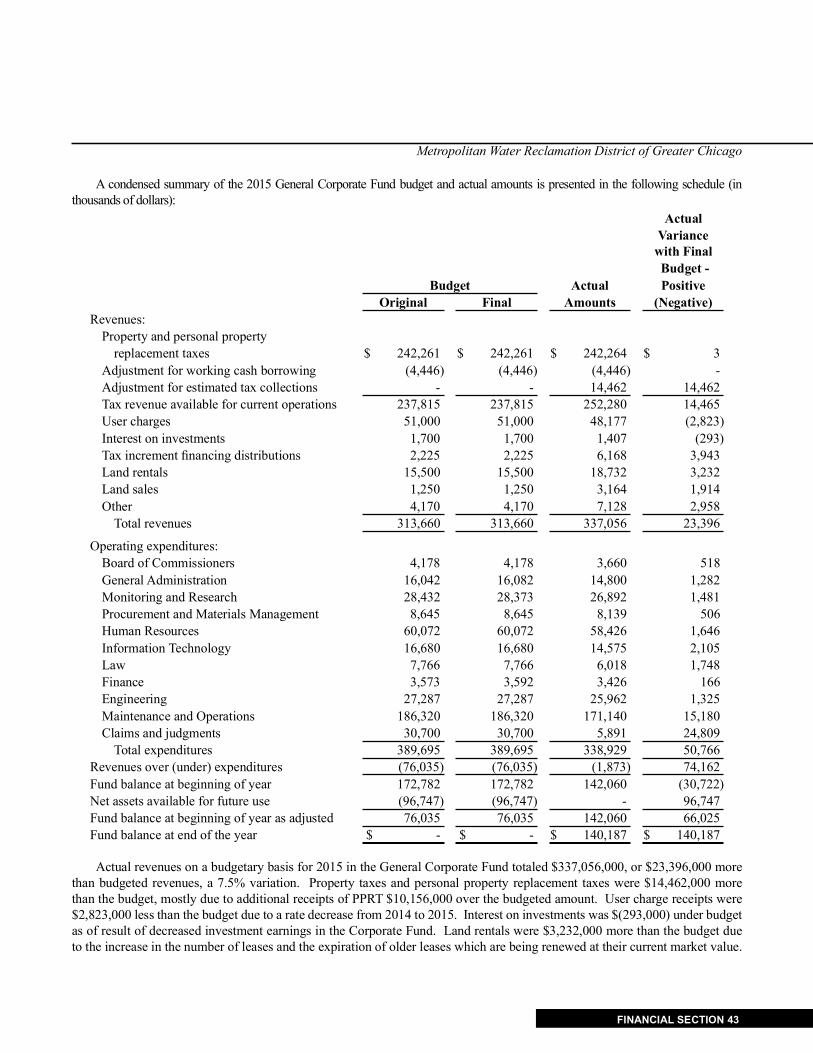
Metropolitan Water Reclamation District of Greater Chicago
FINANCIAL SECTION 43
A condensed summary of the 2015 General Corporate Fund budget and actual amounts is presented in the following schedule (in thousands of dollars):
ActualVariance
with Final Budget -
Budget Actual PositiveOriginal Final Amounts (Negative)
Revenues:Property and personal property
replacement taxes $ 242,261 $ 242,261 $ 242,264 $ 3Adjustment for working cash borrowing (4,446) (4,446) (4,446) -Adjustment for estimated tax collections - - 14,462 14,462Tax revenue available for current operations 237,815 237,815 252,280 14,465User charges 51,000 51,000 48,177 (2,823)Interest on investments 1,700 1,700 1,407 (293)Tax increment fi nancing distributions 2,225 2,225 6,168 3,943Land rentals 15,500 15,500 18,732 3,232Land sales 1,250 1,250 3,164 1,914Other 4,170 4,170 7,128 2,958
Total revenues 313,660 313,660 337,056 23,396
Operating expenditures:Board of Commissioners 4,178 4,178 3,660 518General Administration 16,042 16,082 14,800 1,282Monitoring and Research 28,432 28,373 26,892 1,481Procurement and Materials Management 8,645 8,645 8,139 506Human Resources 60,072 60,072 58,426 1,646Information Technology 16,680 16,680 14,575 2,105Law 7,766 7,766 6,018 1,748Finance 3,573 3,592 3,426 166Engineering 27,287 27,287 25,962 1,325Maintenance and Operations 186,320 186,320 171,140 15,180Claims and judgments 30,700 30,700 5,891 24,809
Total expenditures 389,695 389,695 338,929 50,766Revenues over (under) expenditures (76,035) (76,035) (1,873) 74,162Fund balance at beginning of year 172,782 172,782 142,060 (30,722)Net assets available for future use (96,747) (96,747) - 96,747Fund balance at beginning of year as adjusted 76,035 76,035 142,060 66,025Fund balance at end of the year $ - $ - $ 140,187 $ 140,187
Actual revenues on a budgetary basis for 2015 in the General Corporate Fund totaled $337,056,000, or $23,396,000 more than budgeted revenues, a 7.5% variation. Property taxes and personal property replacement taxes were $14,462,000 more than the budget, mostly due to additional receipts of PPRT $10,156,000 over the budgeted amount. User charge receipts were $2,823,000 less than the budget due to a rate decrease from 2014 to 2015. Interest on investments was $(293,000) under budget as of result of decreased investment earnings in the Corporate Fund. Land rentals were $3,232,000 more than the budget due to the increase in the number of leases and the expiration of older leases which are being renewed at their current market value.

Management’s Discussion and Analysis (MD&A) - UnauditedYear ended December 31, 2015
44 FINANCIAL SECTION
The 2015 General Corporate Fund fi nal appropriation of $389,695,000 did not change from the original amount. Actual budgetary expenditures totaled $338,929,000, or 87.0%, of the total appropriation. The $50,766,000 excess of appropriations over actual expenditures was primarily due to claims and judgments costs being $24,809,000 less than appropriations. The District’s Reserve Claim fund actual payments were signifi cantly lower than budgeted resulting in a large variance between budget and actual because it is the policy of the District to appropriate the entire Reserve Claim fund balance. This is consistent with the Board of Commissioners’ policy to accumulate suffi cient reserves for payment of future claims without exposing the District to fi nancial risk that could curtail normal operations. Expenditures for the Maintenance & Operations Department were $15,180,000 below appropriations, for a variety of reasons including underutilization of the pelletizer facility, decreased repairs, and the related repair parts, and a decreased need for chemicals based on using more effi cient processes.
CAPITAL ASSETS AND MODIFIED APPROACH
Capital Assets. The District’s reportable capital assets, net of accumulated depreciation, as of December 31, 2015, amounted to $7,282,020,000. Reportable capital assets, net of accumulated depreciation, for 2015 as compared to 2014 are as follows (in thousands of dollars):
2015 2014Increase
(Decrease)
Percent Increase
(Decrease)Land $ 130,573 $ 129,458 $ 1,115 0.9 %Permanent easements 1,330 1,330 - 0.0Buildings 7,354 7,539 (185) (2.5)Machinery and equipment 27,588 27,706 (118) (0.4)Computer software 1,549 2,248 (699) (31.1)Depreciable infrastructure 1,674,158 1,685,392 (11,234) (0.7)Modifi ed infrastructure 4,662,520 4,356,999 305,521 7.0Construction in progress 776,948 829,769 (52,821) (6.4)
Total $ 7,282,020 $ 7,040,441 $ 241,579 3.4 %
Signifi cant capital asset changes during the current fi scal year included the following:
● Total capital asset additions exceeded retirements and depreciation by $241,579,000 in 2015.
● Construction in progress decreased by $52,821,000 from 2014 to 2015 due to the completion of the Thornton Composite Reservoir, the related Thornton Tollway Dam, and the Disinfecton facilities at the Calumet and O’Brien WRPs.
● Major projects which remained in progress during 2015 include: the Westside Primary Settling Tanks and Aerated Grit Facility at Stickney WRP, the West Weather Facility Reservoir at Lemont WRP, and the phosphorous recovery system at multiple water reclamation plants.
In addition to the above, commitments totaling $490,845,261 remain outstanding for ongoing construction projects. Additional disclosure on construction commitments can be found in Note 9 to the basic fi nancial statements.
Modifi ed approach. The District’s infrastructure assets include interceptor sewers, wastewater treatment basins, waterway assets (such as reservoirs and aeration stations) and deep tunnels, drop shafts and regulating elements making up a pollution and fl ood control program called TARP. The District is using the modifi ed approach to report its infrastructure assets, with the exception of the TARP deep tunnels and drop shafts, which are depreciated. The District elected the modifi ed approach to: a) clearly convey to the taxpayers the District’s efforts to maintain infrastructure assets at or above an established condition level; b) provide and codify a process to coordinate construction projects between the Engineering and Maintenance and Operations departments; c) readily highlight infrastructure assets that need signifi cant repair/rehabilitation/replacement under a construction project; and d) provide additional evaluative information to bond rating agencies to insure that the District’s bond rating is maintained at the highest level.

Metropolitan Water Reclamation District of Greater Chicago
FINANCIAL SECTION 45
The Kirie, Hanover, Egan, Central (Stickney), O’Brien, Calumet, Lemont, and Waterways network assets had their initial condition assessments completed between 2002 and 2006. The Hanover, Calumet and Lemont networks each had its most recent condition assessment completed in 2015. The Kirie, Central (Stickney) and Waterways networks each had its most recent condition assessment completed in 2014. The Egan and O’Brien networks each had its most recent condition assessment completed in 2013. (See further discussion of the modifi ed approach in the Required Supplementary Information Section).
As noted in the Required Supplementary Information, the condition ratings for eligible infrastructure assets compare favorably with the District’s target level of acceptable or better. In addition, there are no signifi cant differences between the estimated maintenance and preservation costs and the actual costs. Additional disclosure on the District’s capital assets and modifi ed approach can be found in the Notes 1.k. and 6 to the basic fi nancial statements and in the Required Supplementary Information section.
DEBT ACTIVITY
Long-term Debt. The District’s long-term liabilities as of December 31, 2015, totaled $4,026,914,000. The breakdown of this debt and changes from 2014 to 2015 are as follows (in thousands of dollars):
2015 2014Increase
(Decrease)
Percent Increase
(Decrease)Bonds payable, net $ 2,770,788 $ 2,500,785 $ 270,003 10.8 %Bond anticipation notes 161,697 90,460 71,237 78.7Claims payable 53,570 35,668 17,902 50.2Compensated absences 25,153 27,564 (2,411) (8.7)Capital lease 43,405 45,653 (2,248) (4.9)Net Pension liability 947,300 914,578 32,722 3.6Net OPEB obligation 25,001 30,409 (5,408) (17.8)
Total $ 4,026,914 $ 3,645,117 $ 381,797 10.5 %
Signifi cant changes in long-term liabilities during the current fi scal year included the following:
● Bonds payable, net, increased by $270,003,000 in 2015 as a result of General Obligation bond issuances.
● Bond anticipation notes increased by $71,237,000 in 2015 as a result of the issuance of $181,537,000 in notes, the accrual of $1,663,000 of interest and the conversion of $111,963,000 from bond anticipation notes to bonds.
● Claims payable increased by $17,902,000 due to the increases in general and construction claims.
The District’s general obligation bonds have the following long-term credit ratings:Standard & Poor’s Corporation AAAFitch, Inc. AAAMoody’s Investors Service Aa2
In August 2013, Moody’s Investor Service downgraded the District’s Bonds from Aaa to Aa1. In July 2015, Moody’s further downgraded the District’s Bonds from Aa1 to Aa2. The primary reason for the downgrades is the pressure on the District’s tax base due to the signifi cant debt burden and pension liabilities for major governmental agencies in Cook County, refl ecting Moody’s opinion on the affordability of possible tax increases by other agencies and how this could impact Cook County residents. In addition, Moody’s changed its pension rating methodology in April 2013 and implemented different assumptions to estimate the unfunded pension liability than is currently required by governmental accounting standards. Additional disclosure on debt can be found in Note 11 to the basic fi nancial statements.

Management’s Discussion and Analysis (MD&A) - UnauditedYear ended December 31, 2015
46 FINANCIAL SECTION
Debt Limits and Borrowing Authority. Various applicable sections of the Illinois Compiled Statutes establish the following limitations relative to the District’s debt:
Effective October 1, 1997, the District may fund up to 100% of the aggregate total of the estimated amount of taxes levied or to be levied for corporate purposes, plus the General Corporate Fund portion of the personal property replacement tax, through borrowing from the Corporate Working Cash Fund and issuance of tax anticipation notes or warrants. The policy of the District currently is to fund up to 95%. The provisions also pertain to the Construction, Construction Working Cash, Stormwater Management, and Stormwater Working Cash Funds.
The amount of the District’s debt may not exceed 5.75% of the last published equalized assessed valuation of taxable real estate within the District, which was $125,736,187,743 for the 2014 property tax levy. At December 31, 2015, the District’s statutory debt limit of $7,229,830,795 exceeded the applicable net debt amount of $2,853,167,287 by $4,376,663,508.
The Illinois Compiled Statutes provide authorization for the funding of the District Capital Improvement Program by the issuance of non-referendum capital improvement bonds. Starting in 2003, bonds may be issued during any budget year in an amount not to exceed $150 million plus the amount of any bonds authorized and unissued during the three preceding budget years. The District has issued various series of bonds since the authorization. This limitation is not applicable to refunding bonds, money received from the Water Pollution Control Revolving Fund and obligations issued as part of the American Recovery and Reinvestment Act of 2009, issued prior to January 1, 2011, commonly known as “Build America Bonds”. Bonds authorized, unissued and carried forward were $425,000,000 for the budget year ended December 31, 2015.
The District has non-referendum bonding authority until the year 2024. When the Property Tax Extension Limitation Law was made applicable to Cook County, the legislature recognized that the completion of the Tunnel and Reservoir Plan (TARP) was such a high priority that it exempted TARP bonds from tax cap limits. In 2010, the Local Government Debt Reform Act was amended. The District’s debt service extension base for the 2015 levy year is $158,198,004 (the “Debt Service Extension Base”), which can be increased each year by the lesser of 5% or the percentage increase in the Consumer Price Index (as defi ned in the Limitation Law). The Property Tax Extension Limitation Law has been amended so that the issuance of bonds by the District to construct TARP will not reduce the District’s ability to issue limited bonds for other major capital projects. The amount of outstanding non-referendum Capital Improvement Bonds may not exceed 3.35% of the last known equalized assessed valuation of taxable property within the District. At December 31, 2015, the District’s outstanding capital improvement and refunding bonds (excluding State Revolving Fund bonds and alternate bonds) of $1,933,805,000 did not exceed the limitation of $4,212,162,289.
Outstanding capital improvement and refunding bonds related to the Clean-up and Flood Control Program and the remaining authorization at December 31, 2015, are indicated in the following schedule (in millions of dollars):
Capital Improvement and Refunding BondsOutstanding and Remaining Authorization
CapitalYear of Issue Total Improvement Refunding2006 408 11 3972007 344 - 3442009 600 600 -2011 336 336 -2014 246 175 71Total bonds outstanding at December 31, 2015 1,934 $ 1,122 $ 812Remaining bond authorization at December 31, 2015 2,278Total bond authorization at December 31, 2015 $ 4,212

Metropolitan Water Reclamation District of Greater Chicago
FINANCIAL SECTION 47
The amount of non-referendum Corporate Working Cash Fund bonds, when added to (a) proceeds from the sale of Working Cash Fund bonds previously issued, (b) any amounts collected from the Corporate Working Cash Fund levy, and (c) amounts transferred from the Construction Working Cash Fund, may not exceed 90% of the amount produced by multiplying the maximum general corporate tax rate permitted by the last known equalized assessed valuation of all property in the District at the time the bonds are issued, plus 90% of the District’s last known entitlement of the Personal Property Replacement Tax.
Additional information on the District’s debt can be found in Note 11 to the basic fi nancial statements and Exhibits I-10 through I-12 of the Statistical Section.
ECONOMY AND OTHER CONDITIONS IMPACTING THE DISTRICT
The equalized assessed valuation of the District has experienced a .9% average growth rate over the last ten years although the 2014 equalized assessed valuation of $125,736,188,000 is 1.9% higher than the previous year. The Cook County Assessor’s offi ce is in the process of gauging the impact of housing price declines and foreclosures on property values, which may result in decreased valuations in the next reassessment. A strong fund balance, along with an emphasis on controlling expenditures, should allow the District to protect its operations from economically sensitive revenues stemming from fi scal constraints at the federal and state levels. The boundaries of the District encompass 91% of the land area of Cook County. The District is located in one of the strongest and economically diverse geographical areas of Illinois. Unemployment for the Chicago-Naperville-Joliet Metropolitan Division decreased to a seasonally adjusted rate of 5.8% for 2015 down from 7.0% a year earlier. Employment, tourism, manufacturing, and the commercial and residential real estate markets had all been negatively impacted but are slowly improving. This trend is expected to continue through most, if not all, of 2016.
Corporate Fund. The Corporate Fund is the District’s general operating fund and includes appropriation requests for all the day-to-day operational costs anticipated for 2016. The total appropriation for the Corporate Fund in 2016 is $366.3 million, an increase of $7.3 million, or 2.0% from the 2015 Adjusted Budget. The 2016 tax levy for the Corporate Fund is $226.1 million, a decrease of $1.1 million or .5% compared to the 2015 Adjusted Budget.
Continuing through 2016, economically sensitive non-property tax revenues, such as interest income, are expected to slowly improve based on forecasted local and national economic indicators.
Property taxes and user charges are the primary funding sources for the District’s Corporate Fund. Illinois law limits the tax rate of this fund to 41 cents per $100 of equalized assessed valuation. The estimated tax rate for the Corporate Fund in 2016 is 16.87 cents, a decrease of .59 cents from 2015 as adjusted. User charges are collected from industrial, commercial, and non-profi t organizations to recover operations, maintenance, and replacement costs proportional to their sewage discharges, in excess of property taxes collected. The major categories of payers: chemical manufacturers, food processors, and government services, are generally expected to maintain their recent level of discharges.
Stormwater Management Fund. The Stormwater Management Fund was established by Public Act 93-1049 on January 1, 2005. This fund accounts for tax levies and other revenue to be used for stormwater management activities throughout all of Cook County, including areas that currently lie outside the District’s boundaries.
The fund consolidates the stormwater management activities of the Engineering and Maintenance & Operations Departments.
The Stormwater Management Fund appropriation for 2016 totals $40.5 million, a decrease of $6.1 million or 13.0% from the 2015 Adjusted Budget.
The District issued Alternate Revenue Bonds funded from the Stormwater Levy in 2015. The “green” projects fi nanced by the bonds involves the development, design, planning and construction of regional and local stormwater facilities provided for in the countywide stormwater management plan and the acquisition of real property.
Management’s Discussion and Analysis (MD&A) - UnauditedYear ended December 31, 2015
48 FINANCIAL SECTION
Detailed Watershed Plans (DWP) have been developed for the watersheds in Cook County. Potential projects from the completed plans are prioritized on a countywide basis with the fi nal selection of specifi c projects for implementation chosen by the Board of Commissioners. Two categories have been established for DWP projects. The fi rst category is streambank stabilization, which involves addressing critical active streambank erosion threatening public safety, structures, and/or infrastructure. The second category of projects addresses regional overbank fl ooding. The selected projects constitute the Stormwater Capital Improvement Program, and will be scheduled according to funding availability. Prior to DWP completion, the District considered funding regional fl ood control projects studied by other agencies. The Heritage Park Flood Control Facility is one such project. Ordinance O13-002, an Ordinance to Adopt the Watershed Management Ordinance with an effective date of May 1, 2014, was passed by the Board of Commissioners on October 3, 2013.
The Heritage Park Flood Control Facility project provides the required compensatory fl oodplain storage for the United States Army Corps of Engineer’s Levee 37 project along the Des Plaines River. As described in an intergovernmental agreement between the District, the Wheeling Park District and the Village of Wheeling signed on April 1, 2010, this project also provides additional stormwater detention and recreational amenities. Construction of the project began in 2012, and the fl ood control components, including the compensatory storage required for Levee 37, are operational while work to complete site amenities will be performed in early 2015. Based on the District’s completion of the fl ood control improvements at Heritage Park in 2014, the USACE has since fi nished constructing their fl oodwall/levee system which provides protection to over 600 structures from Des Plaines River fl ooding.
The Board of Commissioners granted authority in 2011 for the establishment of a Green Infrastructure Program, which will facilitate the planning, design, and construction of multiple green infrastructure projects throughout Cook County in partnership with a variety of stakeholders.
Property taxes are the primary funding source for the District’s Stormwater Management Fund. Illinois law limits the tax rate of this fund to 5 cents per $100 of equalized assessed valuation. The estimated tax rate for the Stormwater Management Fund in 2016 is 2.56 cents, which is an increase of 0.71 cents from 2015 as adjusted.
Capital Improvement Program: Construction Fund and Capital Improvements Bond Fund. The District’s overall Capital Program includes 2016 project awards, land acquisition, support, future projects, and projects under construction, with a total cost of approximately $1.6 billion. Capital projects involve the acquisition, improvement, replacement, remodeling, completing, altering, constructing, and enlarging of District facilities. Included are all fi xtures which are permanently attached to and made a part of such structures and non–structural improvements, and which cannot be removed without, in some way, impairing the facility or structure.
Projects under construction have been presented and authorized in previous Budgets and are recognized in the annual Budget as both outstanding liabilities in the Capital Improvements Bond Fund, and as re-appropriations in the Construction Fund. Future projects, not yet appropriated, are included in the Annual Budget to present a comprehensive picture of the District’s Capital program. These future projects will be requested for appropriation subject to their priority, design, and available funding.
The District utilizes two funds for its Capital program, the Construction Fund and the Capital Improvements Bond Fund. The Construction Fund is utilized as a “pay as you go” capital rehabilitation and modernization program. Capital projects are fi nanced by a tax levy suffi cient to pay for project costs as they are constructed. As the District replaces, rehabilitates, and modernizes aged and less effective infrastructure, capital projects are assigned to the Corporate, Construction, or Capital Improvements Bond Fund based on the nature of the project, dollar magnitude, and useful life of the improvement. The Construction Fund is used for operations related projects, where the useful life of the improvement is less than 20 years.
The Capital Improvements Bond Fund, the District’s other capital fund, includes major capital infrastructure projects whose useful lives extend beyond 20 years, and which will be fi nanced by long-term debt, Federal and State grants, and State Revolving Fund loans.

Metropolitan Water Reclamation District of Greater Chicago
FINANCIAL SECTION 49
The 1995 Tax Extension Limitation Law (Tax Cap), and subsequent amendments to the bill, dramatically impacted the methods of fi nancing the Capital Improvements Bond Fund. The original legislation required, in general, that all new debt be approved by referendum. However, an exemption for projects initiated before October 1, 1991 was granted to the District to enable completion of the Tunnel and Reservoir Plan (TARP). The bill was later amended to establish a “debt extension base,” which allowed local governments, with non-referendum authority, to continue to issue non-referendum debt in terms of “limited bonds” as long as their annual debt service levies did not exceed 1994 levels. This law was further amended in 1997 to exclude TARP project debt from this debt service extension base. The passage of legislation in 1997 allowing for expanded authority to issue “limited bonds” by excluding pre-existing TARP projects provides additional fi nancing fl exibility to proceed with our Capital program.
Construction Fund. The Construction fund appropriation for 2016 totals $36.6 million, a decrease of $1.3 million or 3.4% from the 2015 Adjusted Budget.
Capital projects in the Construction Fund are primarily supported by property taxes and thus subject to the Tax Cap. The 2016 tax levy planned for the Construction Fund is $16.6 million, an increase of $.1 million or .06 percent from the 2015 Adjusted Levy.
Capital Improvements Bond Fund. The 2016 appropriation for the Capital Improvements Bond Fund is $483.8 million, an increase of $30.7 million or 6.8 percent from the 2015 Adjusted Budget. The appropriation is based on the scheduled award of $373.0 million in projects. Capital Improvements Bond Fund projects scheduled for award in 2016 with estimated award values consist of one TARP project at $139 million; six plant expansion and improvement projects at $43.0 million; six facilities replacement projects at $42.9 million; fi fteen stormwater management projects at $95.3 million, and two solids projects at $20.4 million.
The increase in appropriation for the Capital Improvements Bond Fund of $30.7 million refl ects the pattern in the award of major projects. An appropriation for the open value of existing contracts is also carried forward from the prior year.
The remaining $110.8 million appropriation for this fund will provide for studies, services, and supplies to support District design and administration of proposed and ongoing construction activity, including the TARP reservoirs. A comprehensive narrative, and exhibits detailing our entire Capital program, is provided in the Capital Budget (Section V) of the 2016 budget document.
A listing and description of proposed projects, and projects under construction, scheduled for 2016, can be found in the Capital Budget (Section V) of the 2016 Budget document.
Other Post-Employment Benefi ts (OPEB) Trust. The District provides subsidized health care benefi ts for its retirees. The Government Accounting Standards Board (GASB) Pronouncement 45 requires reporting of the future liability for maintaining these benefi ts in the Comprehensive Annual Financial Report (CAFR).
In 2007, the Board adopted an initial advance funding policy meant to (i) improve the District’s fi nancial position by reducing the amount of future contributions and (ii) serve to establish a reserve to help ensure the fi nancial ability to provide healthcare coverage for District retirees and annuitants in the future. On October 2, 2014, the advance funding policy was amended by the Board with the following guidelines:
Target Funding Level: 100% maximum Funding Period: 12 years Funding Amount: $5 million funding in each of the twelve years 2015 through 2026, with no further advance funding contribution required after 2026.
Beginning in 2027, cash to be withdrawn from the Trust to fund claims and insurance premiums will be determined by the Trust’s actuary with the target funding level to be maintained at 100% for all future years. There is currently no legal requirement for the District to partially or fully fund the OPEB Trust Fund and any funding is on a voluntary basis.

Management’s Discussion and Analysis (MD&A) - UnauditedYear ended December 31, 2015
50 FINANCIAL SECTION
The policy adopted by the District is cautious by design, and will provide ample opportunity for adjustment as experience is gained. Future direction may also be changed signifi cantly by national health care policies and programs.
In 2006, the District proposed state legislation to give authority to establish an OPEB trust. Public Act 95-394 became effective on August 23, 2007. Since inception, the District has budgeted and transferred a total of $117.4 million into the OPEB Trust Fund. The District contributed $20.0 million in 2014 and $5.0 million in 2015 to reach that goal. Total net position was $149,329,000 as of December 31, 2015. The accumulated unfunded OPEB obligation was estimated at approximately $137 million and $139 million at December 31, 2015 and December 31, 2014, respectively. On December 19, 2013, the Board of Commissioners adopted a revised investment policy statement for the Metropolitan Water Reclamation District Retiree Health Care Trust.
Upcoming Pension Reporting Changes. The District has implemented GASB 68, Accounting and Financial Reporting for Pensions, beginning with the year ended December 31, 2015. The implementation of this standard resulted in a net pension liability recognized by the District of $947.3 million; however, net position remained positive.
Organized Labor. The District has six collective bargaining agreements that cover sixteen unions and include approximately 760 of the District’s employees for the purposes of establishing wages and benefi ts. Three-year successor agreements were negotiated with all bargaining units in 2014 and will expire in 2017.
Retirement Fund. On August 3, 2012 Governor Quinn signed House Bill 4513, now Public Act 97-0894, into law. The tax multiple, which is limited by state statute, was increased in 2013 from 2.19 to the amount suffi cient to meet the Fund’s actuarially determined contribution requirement, but not to exceed an amount equal to 4.19 times the employee contributions two years prior. The employee contributions for tier 1 employees (those hired before January 1, 2011) increased 1% each year for 3 years beginning January 1, 2013, increasing the contribution rate from 9% to 12%. The employee contributions will remain at 12% until the funded ratio reaches 90% then the contribution rate will be reduced to 9%.
REQUESTS FOR ADDITIONAL INFORMATION
This fi nancial report is intended to provide a general summary of the District’s fi nances to interested parties, and to demonstrate the District’s accountability over the resources it receives. Please feel free to contact the Clerk/Director of Finance or Comptroller at the Metropolitan Water Reclamation District of Greater Chicago, 100 E. Erie Street, Chicago, Illinois 60611-2803, (312) 751-6500, if additional information is needed.

BASIC FINANCIAL STATEMENTS

Exhibit A-1Governmental Funds Balance Sheets/Statements of Net PositionDecember 31, 2015(with comparative amounts for prior year)
52 FINANCIAL SECTION
General Debt Service Capital Improvements (in thousands of dollars) Corporate Fund Fund Bond Fund
2015 2014 2015 2014 2015 2014Assets and deferred outfl ows of resources
Assets:Cash $ 57,769 $ 45,390 $ 15,826 $ 2,065 $ 92,764 $ 6,574Certifi cates of deposit (note 4) 4,498 10,295 2,014 7,013 16,617 6,002Investments (note 4) 174,547 191,294 90,831 99,313 202,441 119,156Prepaid insurance 2,137 2,143 - - - -Taxes receivable, net (note 5) 224,745 224,845 216,631 210,679 - -Other receivables, net (note 5) 8,720 4,380 - 928 41,521 32,908Due from other funds (note 12) 77 52 - - - -Restricted deposits 1,405 1,409 - - - -Inventories 37,623 39,586 - - - -Capital assets not being depreciated/amortized (note 6) - - - - - -Capital assets being depreciated/amortized, net (note 6) - - - - - -
Total assets $ 511,521 $ 519,394 $ 325,302 $ 319,998 $ 353,343 $ 164,640Deferred outfl ows of resources:
Loss on prior debt refunding - - - - - -Deferred amount related to pension - - - - - -
Total deferred outfl ows of resources $ - $ - $ - $ - $ - $ -Liabilities, deferred infl ows of resources, and fund
balances/net position Liabilities:
Accounts payable and other liabilities (note 5) $ 28,815 $ 37,817 $ - $ - $ 48,760 $ 42,951Due to Pension Trust Fund (note 12) - - - - - -Due to other funds (note 12) - - - - - -Accrued interest payable - - - - - -Unearned Revenue (note 5) 4,222 3,686 - - - -Long-term liabilities: (note 11)
Due within one year - - - - - -Due in more than one year - - - - - -
Total liabilities 33,037 41,503 - - 48,760 42,951Deferred infl ows of resources:
Unavailable tax revenue (note 5) 191,372 190,865 184,496 178,908 - -Other unavailable revenue (note 5) - - - 928 933 -
Total deferred infl ows of resources 191,372 190,865 184,496 179,836 933 -Fund balances:
Nonspendable:Prepaid insurance 2,137 2,143 - - - -Inventories 37,623 39,586 - - - -
Restricted for:Deposits 1,405 1,409 - - - -Working cash 278,852 278,148 - - - -Reserve claims 25,522 27,590 - - - -Debt service - - 140,806 140,162 - -Capital projects - - - - 175,730 8,921Construction - - - - - -Stormwater management - - - - - -
Assigned - - - - 127,920 112,768Unassigned (Defi cit) (58,427) (61,850) - - - -
Total fund balances 287,112 287,026 140,806 140,162 303,650 121,689Total liabilities, deferred infl ows, and fund balances $ 511,521 $ 519,394 $ 325,302 $ 319,998 $ 353,343 $ 164,640
Net position:Net investment in capital assetsRestricted for corporate working cashRestricted for reserve claimRestricted for debt serviceRestricted for capital projectsRestricted for construction working cashRestricted for stormwater working cashUnrestricted (Defi cit)
Total net position
See accompanying notes to the basic fi nancial statements.

Metropolitan Water Reclamation District of Greater Chicago
FINANCIAL SECTION 53
Retirement Other Governmental / Total Governmental Adjustments Statements of Fund Nonmajor Funds Funds (Note 2a) Net Position
2015 2014 2015 2014 2015 2014 2015 2014 2015 2014
$ - $ - $ 7,342 $ 3,244 $ 173,701 $ 57,273 $ - $ - $ 173,701 $ 57,273- - 502 1,801 23,631 25,111 - - 23,631 25,111- - 50,305 71,555 518,124 481,318 - - 518,124 481,318- - - - 2,137 2,143 - - 2,137 2,143
61,566 54,678 39,131 37,056 542,073 527,258 - - 542,073 527,258- - 745 745 50,986 38,961 - - 50,986 38,961- - - - 77 52 (77) (52) - -- - - - 1,405 1,409 - - 1,405 1,409- - - - 37,623 39,586 - - 37,623 39,586- - - - - - 5,571,371 5,317,556 5,571,371 5,317,556- - - - - - 1,710,649 1,722,885 1,710,649 1,722,885
$ 61,566 $ 54,678 $ 98,025 $ 114,401 $ 1,349,757 $ 1,173,111 $ 7,281,943 $ 7,040,389 $ 8,631,700 $ 8,213,500
- - - - - - 12,511 13,518 12,511 13,518- - - - - - 91,456 73,906 91,456 73,906
$ - $ - $ - $ - $ - $ - $ 103,967 $ 87,424 $ 103,967 $ 87,424
$ - $ - $ 11,785 $ 12,337 $ 89,360 $ 93,105 $ - $ - $ 89,360 $ 93,10513,867 13,293 - - 13,867 13,293 57,174 41,385 71,041 54,678
- - 77 52 77 52 (77) (52) - -- - - - - - 14,924 13,623 14,924 13,623- - - - 4,222 3,686 - (741) 4,222 2,945
- - - - - - 123,555 114,993 123,555 114,993- - - - - - 3,903,359 3,530,124 3,903,359 3,530,124
13,867 13,293 11,862 12,389 107,526 110,136 4,098,935 3,699,332 4,206,461 3,809,468
47,699 41,385 33,331 31,489 456,898 442,647 (456,898) (442,647) - -- - - - 933 928 (933) (928) - -
47,699 41,385 33,331 31,489 457,831 443,575 (457,831) (443,575)) - -
- - - - 2,137 2,143 (2,137) (2,143)- - - - 37,623 39,586 (37,623) (39,586)
- - - - 1,405 1,409 (1,405) (1,409)- - 59,163 58,868 338,015 337,016 (338,015) (337,016)- - - - 25,522 27,590 (25,522) (27,590)- - - - 140,806 140,162 (140,806) (140,162)- - - - 175,730 8,921 (175,730) (8,921)- - 2,759 6,316 2,759 6,316 (2,759) (6,316)- - - 5,339 - 5,339 - (5,339)- - - - 127,920 112,768 (127,920) (112,768)- - (9,090) - (67,517) (61,850) 67,517 61,850- - 52,832 70,523 784,400 619,400 (784,400) (619,400)
$ 61,566 $ 54,678 $ 98,025 $ 114,401 $ 1,349,757 $ 1,173,111
4,630,463 4,548,793 4,630,463 4,548,793278,852 278,148 278,852 278,148
6,499 7,764 6,499 7,764310,383 305,375 310,383 305,375
- 15,457 - 15,45721,947 21,833 21,947 21,83337,216 37,035 37,216 37,035
(756,154) (722,949) (756,154) (722,949)$ 4,529,206 $ 4,491,456 $ 4,529,206 $ 4,491,456

Exhibit A-2Statements of Governmental Fund Revenues, Expenditures and Changes in Fund Balances/Statements of ActivitiesYear ended December 31, 2015(with comparative amounts for prior year)
54 FINANCIAL SECTION
General Debt Service Capital Improvements (in thousands of dollars) Corporate Fund Fund Bond Fund
2015 2014 2015 2014 2015 2014Revenues
General revenues: Property taxes $ 225,861 $ 230,128 $ 212,150 $ 202,991 $ - $ -Personal property replacement tax 25,295 27,309 - - - -Interest on investments 1,838 3,594 887 1,342 1,975 3,283Land sales 3,164 8 - - - -Tax increment fi nancing distributions 13,069 4,925 - - - -Claims and damage settlements 191 177 - - 127 452Miscellaneous 3,486 2,908 4 5 2,377 2,396Gain on sale of capital assets - - - - - -
Program revenues: Charges for services:
User charges 45,938 50,396 - - - - Land rentals 18,189 16,357 - - - - Fees, forfeits, and penalties 3,667 3,959 - - - -
Capital grants and contributions: Federal and state grants - 21 - 11,141 11,165 -
Total revenues 340,698 339,782 213,041 215,479 15,644 6,131 Expenditures/Expenses
Operations: Board of Commissioners 3,662 3,710 - - - -General Administration 14,833 14,829 - - - -Monitoring and Research 27,486 26,687 - - - -Procurement and Materials Management 6,885 6,325 - - - -Human Resources 58,441 72,879 - - - -Information Technology 14,697 14,582 - - - -Law 6,018 6,802 - - - -Finance 3,427 3,425 - - - -Engineering 25,971 25,278 - - - -Maintenance and Operations 173,534 168,376 - - - -Pension costs - - - - - -OPEB costs - - - - - -Claims and judgments 5,658 44,988 - - - -
Construction costs - - - - 271,269 186,112 Loss on disposal of capital assets - - - - - - Depreciation and amortization (unallocated) - - - - - - Debt service:
Redemption of bonds and capital lease - - 98,973 86,976 2,247 2,142Interest and bond issuance costs - - 115,793 107,868 2,887 2,247
Total expenditures/expenses 340,612 387,881 214,766 194,844 276,403 190,501 Revenues over (under) expenditures 86 (48,099) (1,725) 20,635 (260,759) (184,370)
Other fi nancing sources (uses): Payment to escrow agent for refunded bonds - - (82,906) - - -Bond anticipation notes issued - - - - 181,537 81,721Bond anticipation notes converted - - - - 111,964 27,623Bond anticipation notes refunded - - - - (111,964) (27,623)Refunding bonds issued - - 70,805 - - -General obligation bonds issued - - - - 225,000 -Premium on bonds issued - - 12,346 - 36,183 -Transfers - - 2,124 (3,000) - (8,000)
Total other fi nancing sources (uses) - - 2,369 (3,000) 442,720 73,721 Revenues and other fi nancing sources (uses)
over (under) expenditures 86 (48,099) 644 17,635 181,961 (110,649) Change in net position - - - - - - Fund balances/net position:
Beginning of the year, as restated (note 15) 287,026 335,125 140,162 122,527 121,689 232,338 End of the year $ 287,112 $ 287,026 $ 140,806 $ 140,162 $ 303,650 $ 121,689
See accompanying notes to the basic fi nancial statements.

Metropolitan Water Reclamation District of Greater Chicago
FINANCIAL SECTION 55
Retirement Other Governmental / Total Governmental Adjustments Statements of Fund Nonmajor Funds Funds (Note 2b) Activities
2015 2014 2015 2014 2015 2014 2015 2014 2015 2014
$ 49,929 $ 51,293 $ 37,362 $ 31,904 $ 525,302 $ 516,316 $ 7,938 $ 10,535 $ 533,240 $ 526,85112,568 12,262 - - 37,863 39,571 - - 37,863 39,571
- - 681 1,267 5,381 9,486 - - 5,381 9,486- - - - 3,164 8 (3,164) (8) - -- - - - 13,069 4,925 - - 13,069 4,925- - 32 1 350 630 - - 350 6301 1 1 135 5,869 5,445 (65) (155) 5,804 5,290- - - - - - 2,922 8 2,922 8
- - 300 300 46,238 50,696 - - 46,238 50,696- - - - 18,189 16,357 - - 18,189 16,357- - 1,218 1,497 4,885 5,456 - - 4,885 5,456
- - - - 11,165 11,162 5 (73) 11,170 11,08962,498 63,556 39,594 35,104 671,475 660,052 7,636 10,307 679,111 670,359
- - - - 3,662 3,710 9 11 3,671 3,721- - - - 14,833 14,829 2 267 14,835 15,096- - - - 27,486 26,687 (227) 235 27,259 26,922- - - - 6,885 6,325 (84) 6 6,801 6,331- - - - 58,441 72,879 71 17 58,512 72,896- - - - 14,697 14,582 (95) 126 14,602 14,708- - - - 6,018 6,802 (10) 10 6,008 6,812- - - - 3,427 3,425 (26) 8 3,401 3,433- - - - 25,971 25,278 1,261 1,283 27,232 26,561- - - - 173,534 168,376 (357) 858 173,177 169,234
62,498 75,556 - - 62,498 75,556 24,647 17,388 87,145 92,944- - - - - - (5,408) (19,449) (5,408) (19,449)- - - - 5,658 44,988 17,902 (42,328) 23,560 2,660- - 55,161 50,147 326,430 236,259 (256,996) (159,068) 69,434 77,191- - - - - - 32 127 32 127- - - - - - 12,123 12,229 12,123 12,229
- - - - 101,220 89,118 (101,220) (89,118) - -- - - - 118,680 110,115 297 4,213 118,977 114,328
62,498 75,556 55,161 50,147 949,440 898,929 (308,079) (273,185) 641,361 625,744- (12,000) (15,567) (15,043) (277,965) (238,877) 315,715 283,492
- - - - (82,906) - 82,906 - - -- - - - 181,537 81,721 (181,537) (81,721) - -- - - - 111,964 27,623 (111,964) (27,623) - -- - - - (111,964) (27,623) 111,964 27,623 - -- - - - 70,805 - (70,805) - - -- - - - 225,000 - (225,000) - - -- - - - 48,529 - (48,529) - - -- 12,000 (2,124) (1,000) - - - - - -- 12,000 (2,124) (1,000) 442,965 81,721 (442,965) (81,721) - -
- - (17,691) (16,043) 165,000 (157,156) (165,000) 157,156 - -- - - - - - 37,750 44,615 37,750 44,615
- - 70,523 86,566 619,400 776,556 - - 4,491,456 4,446,841$ - $ - $ 52,832 $ 70,523 $ 784,400 $ 619,400 $ - $ - $ 4,529,206 $ 4 ,491,456
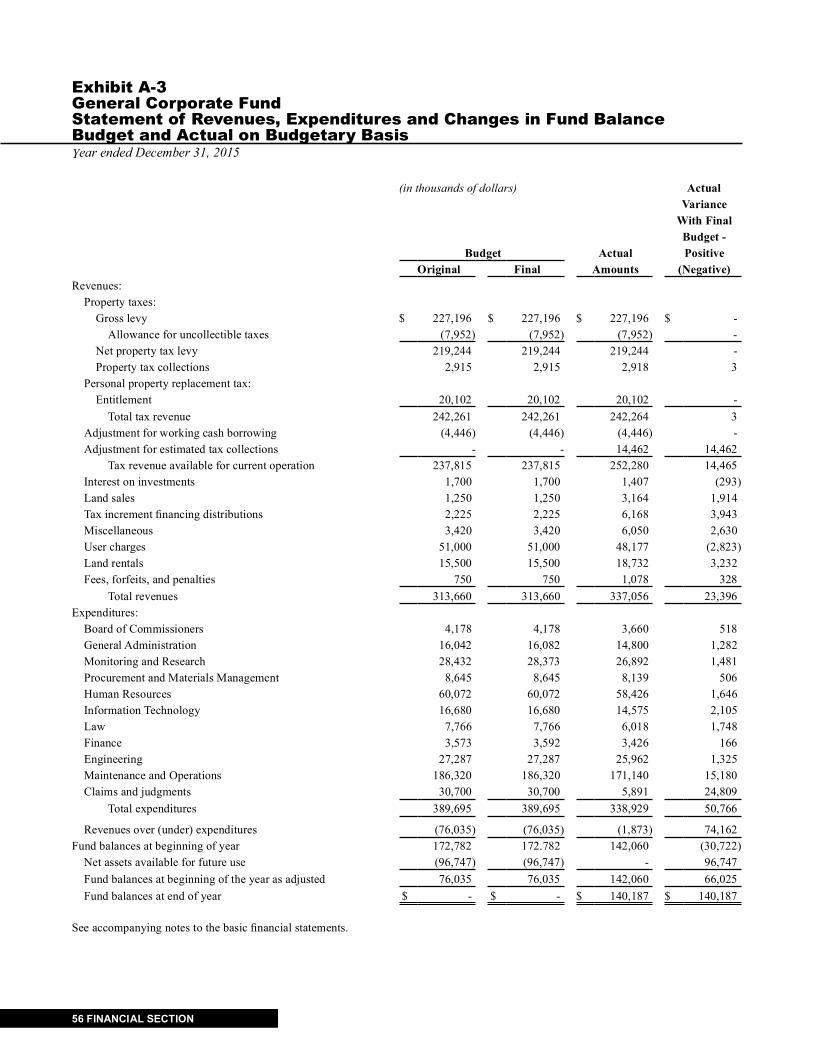
Exhibit A-3General Corporate FundStatement of Revenues, Expenditures and Changes in Fund BalanceBudget and Actual on Budgetary BasisYear ended December 31, 2015
56 FINANCIAL SECTION
(in thousands of dollars) Actual Variance With Final
Budget - Budget Actual Positive
Original Final Amounts (Negative) Revenues:
Property taxes:Gross levy $ 227,196 $ 227,196 $ 227,196 $ -
Allowance for uncollectible taxes (7,952) (7,952) (7,952) - Net property tax levy 219,244 219,244 219,244 -Property tax collections 2,915 2,915 2,918 3
Personal property replacement tax: Entitlement 20,102 20,102 20,102 -
Total tax revenue 242,261 242,261 242,264 3Adjustment for working cash borrowing (4,446) (4,446) (4,446) -Adjustment for estimated tax collections - - 14,462 14,462
Tax revenue available for current operation 237,815 237,815 252,280 14,465Interest on investments 1,700 1,700 1,407 (293)Land sales 1,250 1,250 3,164 1,914Tax increment fi nancing distributions 2,225 2,225 6,168 3,943Miscellaneous 3,420 3,420 6,050 2,630User charges 51,000 51,000 48,177 (2,823)Land rentals 15,500 15,500 18,732 3,232Fees, forfeits, and penalties 750 750 1,078 328
Total revenues 313,660 313,660 337,056 23,396Expenditures:
Board of Commissioners 4,178 4,178 3,660 518General Administration 16,042 16,082 14,800 1,282Monitoring and Research 28,432 28,373 26,892 1,481Procurement and Materials Management 8,645 8,645 8,139 506Human Resources 60,072 60,072 58,426 1,646Information Technology 16,680 16,680 14,575 2,105Law 7,766 7,766 6,018 1,748Finance 3,573 3,592 3,426 166Engineering 27,287 27,287 25,962 1,325Maintenance and Operations 186,320 186,320 171,140 15,180Claims and judgments 30,700 30,700 5,891 24,809
Total expenditures 389,695 389,695 338,929 50,766
Revenues over (under) expenditures (76,035) (76,035) (1,873) 74,162Fund balances at beginning of year 172,782 172.782 142,060 (30,722)
Net assets available for future use (96,747) (96,747) - 96,747Fund balances at beginning of the year as adjusted 76,035 76,035 142,060 66,025Fund balances at end of year $ - $ - $ 140,187 $ 140,187
See accompanying notes to the basic fi nancial statements.

FINANCIAL SECTION 57
Exhibit A-4Retirement FundStatement of Revenues, Expenditures and Changes in Fund BalanceBudget and Actual on Budgetary BasisYear ended December 31, 2015
(in thousands of dollars)Actual
Variancewith Final
Actual on Budget -Final Budgetary Positive
Retirement Fund Budget Basis (Negative)Revenues:
Property taxes $ 48,762 $ 49,929 $ 1,167Personal property replacement tax 12,892 12,568 (324)Miscellaneous - 1 1
Total tax revenue 61,654 62,498 844
Operating expenditures:Pension costs 61,654 62,498 (844)
Total expenditures 61,654 62,498 (844)
Revenues over (under) expenditures - - -
Fund balances at beginning of the year - - -
Fund balances at end of the year $ - $ - $ -
See accompanying notes to the basic fi nancial statements.

Exhibit A-5Pension and Other Post Employment Benefi ts Trust FundsStatements of Fiduciary Net PositionDecember 31, 2015(with comparative amounts for prior year)
58 FINANCIAL SECTION
(in thousands of dollars)
2015 2014
AssetsCash $ 104 $ 275Receivables
Employer contributions-taxes (net of allowance for uncollectibles of $5,252 in 2015; $3,495 in 2014) 70,772 61,654Securities sold 10,565 9,929Forward foreign exchange contracts 83,320 28,089Accrued interest and dividends 4,463 4,600Accounts receivable 53 40
Total receivables 169,173 104,312
Investments at fair valueCorporate and governmental bonds and notes 312,644 252,271Money market funds 550 13,857Pooled funds - fi xed income 179,025 246,148Pooled funds - equities 66,652 59,949Balanced funds 14,649 12,379Common and preferred stocks 757,683 808,449Short-term investments 39,867 34,621
Total investments 1,371,070 1,427,674Securities lending capital 36,893 51,053
Total assets $ 1,577,240 $ 1,583,314
LiabilitiesAccounts payable $ 1,387 $ 1,660Securities lending collateral 36,893 51,053Forward foreign exchange contracts 83,320 28,089Securities purchased 19,658 18,342
Total liabilities 141,258 99,144
Net position restricted for pension and OPEB benefi ts $ 1,435,982 $ 1,484,170
See accompanying notes to the basic fi nancial statements.

Exhibit A-6Pension and Other Post Employment Benefi ts Trust FundsStatements of Changes in Fiduciary Net PositionYear ended December 31, 2015(with comparative amounts for prior year)
FINANCIAL SECTION 59
(in thousands of dollars)
2015 2014Additions:
Contributions:Employer contributions $ 89,359 $ 107,623Employee contributions 21,385 18,975Retiree contributions 7,406 6,773
Total contributions 118,150 133,371
Investment income:Net appreciation (depreciation) in fair value of investments (26,196) 65,857Interest and dividend income 27,778 26,782
Total investment income 1,582 92,639Less investment expenses (5,585) (5,942)
Investment income (loss) net of expenses (4,003) 86,697
Securities lending activities:Securities lending income 98 64Borrower rebates 645 506Bank fees (178) (135)
Net income from securities lending activities 565 435
Other 29 4
Total additions 114,741 220,507Deductions:
Annuities and benefi ts:Employee annuitants 116,885 111,352Retiree health care benefi ts 20,723 20,490Surviving spouse annuitants 21,279 20,444Child annuitants 116 157Ordinary disability benefi ts 722 821Duty disability benefi ts 159 140
Total annuities and benefi ts 159,884 153,404Refunds of employee contributions 1,349 984Administrative expenses 1,696 1,446
Total deductions 162,929 155,834
Net increase (decrease) (48,188) 64,673Net position restricted for pension and OPEB benefi ts
Beginning of year 1,484,170 1,419,497End of year $ 1,435,982 $ 1,484,170
See accompanying notes to the basic fi nancial statements.

NOTES TO THE BASICFINANCIAL STATEMENTS

Metropolitan Water Reclamation District of Greater Chicago
FINANCIAL SECTION 61
Notes to the Basic Financial Statements
Index to NotesNote Page Number
1. Summary of Signifi cant Accounting Policies .......................................................................................................................................................................62
a. Financial Reporting Entity................................................................................................................................................................................................ 62
b. Government-wide and Fund Financial Statements ............................................................................................................................................................62
c. Basis of Accounting and Measurement Focus ...................................................................................................................................................................70
d. Budgeting (Appropriations) ...............................................................................................................................................................................................70
e. Deposits with Escrow Agent..............................................................................................................................................................................................71
f. Certifi cates of Deposit .......................................................................................................................................................................................................71
g. Investments ........................................................................................................................................................................................................................71
h. Inventory ............................................................................................................................................................................................................................71
i. Prepaid Assets....................................................................................................................................................................................................................72
j. Restricted Assets ................................................................................................................................................................................................................72
k. Interfund Transactions .......................................................................................................................................................................................................72
l. Capital Assets ....................................................................................................................................................................................................................72
m. Compensated Absences .....................................................................................................................................................................................................73
n. Deferred Outfl ows/Infl ows of Resources ..........................................................................................................................................................................73
o. Long-Term Obligations ....................................................................................................................................................................................................73
p. Fund Balances ..................................................................................................................................................................................................................73
q. Net Position .....................................................................................................................................................................................................................74
r. User Charge ......................................................................................................................................................................................................................74
s. Comparative Data and Reclassifi cations ..........................................................................................................................................................................74
t. Use of Estimates ...............................................................................................................................................................................................................74
u. New Accounting Pronouncements ....................................................................................................................................................................................74
2. Reconciliation of Fund and Government wide Financial Statements ....................................................................................................................................75
a. Reconciliation of Total Fund Balances to Total Net Position ............................................................................................................................................75
b. Reconciliation of the Change in Fund Balances to the Change in Net Position.................................................................................................................76
3. Reconciliation of Budgetary Basis Accounting to GAAP Basis Accounting ........................................................................................................................77
4. Deposits and Investments .....................................................................................................................................................................................................77
5. Receivables, Deferred Infl ow of Resources, and Payables ...................................................................................................................................................87
6. Capital Assets ..........................................................................................................................................................................................................................89 7. Pension Plan ............................................................................................................................................................................................................................90
8. OPEB - Other Post-Employment Benefi ts ..............................................................................................................................................................................94
9. Commitments and Rebatable Arbitrage Earnings ...................................................................................................................................................................96
10. Risk Management and Claims ................................................................................................................................................................................................98
11. Long-Term Debt ...................................................................................................................................................................................................................101
12. Interfund Transactions ..........................................................................................................................................................................................................106
13. Property Tax Extension Limitation Law ...............................................................................................................................................................................107
14. Leases ...................................................................................................................................................................................................................................107
15. Restatement for Implementation of New Accounting Standard ...........................................................................................................................................108
16. Subsequent Events ................................................................................................................................................................................................................109

Notes to the Basic Financial StatementsYear ended December 31, 2015
62 FINANCIAL SECTION
1. Summary of Signifi cant Accounting Policies
The signifi cant accounting policies of the Metropolitan Water Reclamation District of Greater Chicago (District) conform to generally accepted accounting principles (GAAP) in the United States of America as applicable to governmental units and are described below.
a. Financial Reporting Entity - The District is a municipal corporation governed by an elected nine-member Board of Commissioners. As required by GAAP, these fi nancial statements present the District (the primary government) and its component units, the Metropolitan Water Reclamation District Retirement Fund (Pension Trust Fund - Note 7) and the Metropolitan Water Reclamation District Retiree Health Care Trust Fund (OPEB Trust Fund - Note 8). The Board of Trustees for the Pension Trust Fund is composed of seven members. Two of these Trustees are Commissioners appointed by the Board of Commissioners of the District, four are District employees elected by members of the fund and one is a retired employee of the District. Although the Pension Trust Fund and OPEB Trust Fund are legally separate entities, for which the primary government is not fi nancially accountable, they are included in the District’s basic fi nancial statements as fi duciary funds. The nature and signifi cance of the Pension Trust Fund and OPEB Trust Fund’s relationship with the primary government is such that exclusion would render the District’s fi nancial statements incomplete or misleading. Complete fi nancial statements of the Pension Trust Fund can be obtained from their administrative offi ce at 111 East Erie Street, Chicago, Illinois, 60611-2898 or on their website: mwrdrf.org. Complete fi nancial statements of the OPEB Trust Fund can be obtained from the Treasurer of the Metropolitan Water Reclamation District at 100 East Erie Street, Chicago, Illinois 60611-5498 or on the District’s website: mwrd.org.
b. Government-wide and Fund Financial Statements - The District’s basic fi nancial statements include government-wide fi nancial statements and fund fi nancial statements.
The government-wide fi nancial statements include the Statements of Net Position and the Statements of Activities, and contain information for all the District’s governmental activities but exclude the Pension Trust Fund and the OPEB Trust Fund, fi duciary funds whose resources are not available to fi nance the District’s operations. The effect of interfund transactions has been removed from the government-wide statements. The Statements of Net Position report the fi nancial condition of the District. This statement includes all existing resources and obligations, both current and noncurrent, with the difference between the two reported as net position. The Statements of Activities report the District’s operating results for the year with the difference between expenses and revenues representing the changes in net position. Expenses are reported by department while revenues are segregated by program revenues and general revenues. Program revenues contain charges for services including user charges, land rentals, fees, forfeitures, penalties and capital grants. General revenues include taxes, interest on investments, and all other revenues not classifi ed as program revenues.
In government, the basic accounting and reporting entity is a “fund.” A fund is defi ned as an independent fi scal and accounting entity, with a self-balancing set of accounts which record fi nancial resources, together with all related liabilities, obligations, reserves, and equities, which are segregated for the purpose of carrying on specifi c activities or attaining certain objectives, in accordance with special regulations, restrictions or limitations. Separate fund fi nancial statements are included in the basic fi nancial statements for the major governmental funds. The emphasis of the governmental fund fi nancial statements is on major funds, with each major fund displayed as a separate column. The governmental fund fi nancial statements include a budgetary statement for the General Corporate Fund.
As a special purpose government, the District has elected to make a combined presentation of the governmental fund statements and the government-wide statements; therefore, the basic fi nancial statements include combined Governmental Funds Balance Sheets/Statements of Net Position (Exhibit A-1) and combined Statements of Governmental Fund Revenues, Expenditures, and Changes in Fund Balances/Statements of Activities (Exhibit A-2). Individual line items of the governmental fund fi nancials are reconciled to government-wide fi nancials in a separate column on the combined presentations, with an in-depth explanations offered in Note 2.

Metropolitan Water Reclamation District of Greater Chicago
FINANCIAL SECTION 63
The District reports the following major governmental funds:
General Corporate FundThe fund was established to account for an annual property tax levy, and certain other revenues, which are to be
used for the payments of general expenditures of the District not specifi cally chargeable to other funds. Included in this fund are accounts maintained by the District restricted to making temporary loans to the Corporate Fund. These accounts were established under Chapter 70, ILCS 2605/9b of the Illinois Compiled Statutes, which refers to these accounts as a “Working Cash Fund.” Amounts borrowed from the Working Cash Fund in one year are generally repaid by the Corporate Fund from tax collections received during the subsequent year. Also included in this fund are accounts of the “Reserve Claim Fund,” established under Chapter 70, ILCS 2605/12 of the Illinois Compiled Statutes, which is restricted for the payment of claims, awards, losses, judgments or liabilities which might be imposed against the District, and for the repair or replacement of certain property maintained by the District. The assets, liabilities, deferred infl ows of resources and fund balances of the General Corporate Fund, detailed as to the Corporate, Working Cash, and Reserve Claim account divisions at December 31, 2015 are as follows (in thousands of dollars):
Total CorporateGeneral Working Reserve
Corporate Corporate Cash ClaimFund Division Division Division
Assets Cash $ 57,769 $ 53,861 $ 537 $ 3,371Certifi cates of deposit 4,498 1,991 1,005 1,502Investments 174,547 67,467 87,310 19,770Prepaid insurance 2,137 2,137 - -Receivables:
Property taxes receivable 240,435 234,638 - 5,797Allowance for uncollectible taxes (15,690) (15,394) - (296)Taxes receivable, net 224,745 219,244 - 5,501
User charges 782 782 - -Miscellaneous 7,938 7,658 - 280
Due from Stormwater Management Fund 77 77 - -Restricted deposits 1,405 1,405 - -Inventories 37,623 37,623 - -
Total assets $ 511,521 $ 392,245 $ 88,852 $ 30,424
Liabilities, Deferred Infl ows and Fund Balances Liabilities:
Accounts payable and other liabilities $ 28,815 $ 28,610 $ - $ 205Unearned Revenue 4,222 4,222 - -
Due to corporate fund from corporate working cash - 190,000 (190,000) -Total liabilities 33,037 222,832 (190,000) 205
Deferred infl ows of resources:Unavailable tax revenue 191,372 186,675 - 4,697
Total deferred infl ows of resources 191,372 186,675 - 4,697Fund balances:
Nonspendable:Prepaid insurance 2,137 2,137 - -Inventories 37,623 37,623 - -
Restricted for:Deposits 1,405 1,405 - -Working cash 278,852 - 278,852 -Reserve claims 25,522 - - 25,522
Unassigned (Defi cit) (58,427) (58,427) - -Total fund balances 287,112 (17,262) 278,852 25,522Total liabilities, deferred infl ows and fund balances $ 511,521 $ 392,245 $ 88,852 $ 30,424

Notes to the Basic Financial StatementsYear ended December 31, 2015
64 FINANCIAL SECTION
The revenues, expenditures, and changes in fund balances of the General Corporate Fund, detailed as to the Corporate, Working Cash, and Reserve Claim account divisions for the year ended December 31, 2015, are as follows (in thousands of dollars):
Total CorporateGeneral Working Reserve
Corporate Corporate Cash ClaimFund Division Division Division
Revenues:Property taxes $ 225,861 $ 222,591 $ - $ 3,270Personal property replacement tax 25,295 25,295 - -
Total tax revenue 251,156 247,886 - 3,270Interest on investments 1,838 804 704 330Land sales 3,164 3,164 - -Tax increment fi nancing distributions 13,069 13,069 - -Claims and damage settlements 191 178 - 13Miscellaneous 3,486 3,486 - -User charges 45,938 45,938 - -Land rentals 18,189 18,189 - -Fees, forfeits and penalties 3,667 3,667 - -
Total revenues 340,698 336,381 704 3,613Operations:
Board of Commissioners 3,662 3,662 - -General Administration 14,833 14,833 - -Monitoring and Research 27,486 27,486 - -Procurement and Materials Management 6,885 6,885 - -Human Resources 58,441 58,441 - -Information Technology 14,697 14,697 - -Law 6,018 6,018 - -Finance 3,427 3,427 - -Engineering 25,971 25,971 - -Maintenance and Operations 173,534 173,534 - -Claims and judgments 5,658 - - 5,658
Total expenditures 340,612 334,954 - 5,658
Revenues over (under) expenditures 86 1,427 704 (2,045)Other fi nancing sources (uses):
Intrafund transfer - 23 - (23)Net Change in Fund balance 86 1,450 704 (2,068)
Fund balance at the beginning of year 287,026 (18,712) 278,148 27,590Fund balance at the end of year $ 287,112 $ (17,262) $ 278,852 $ 25,522
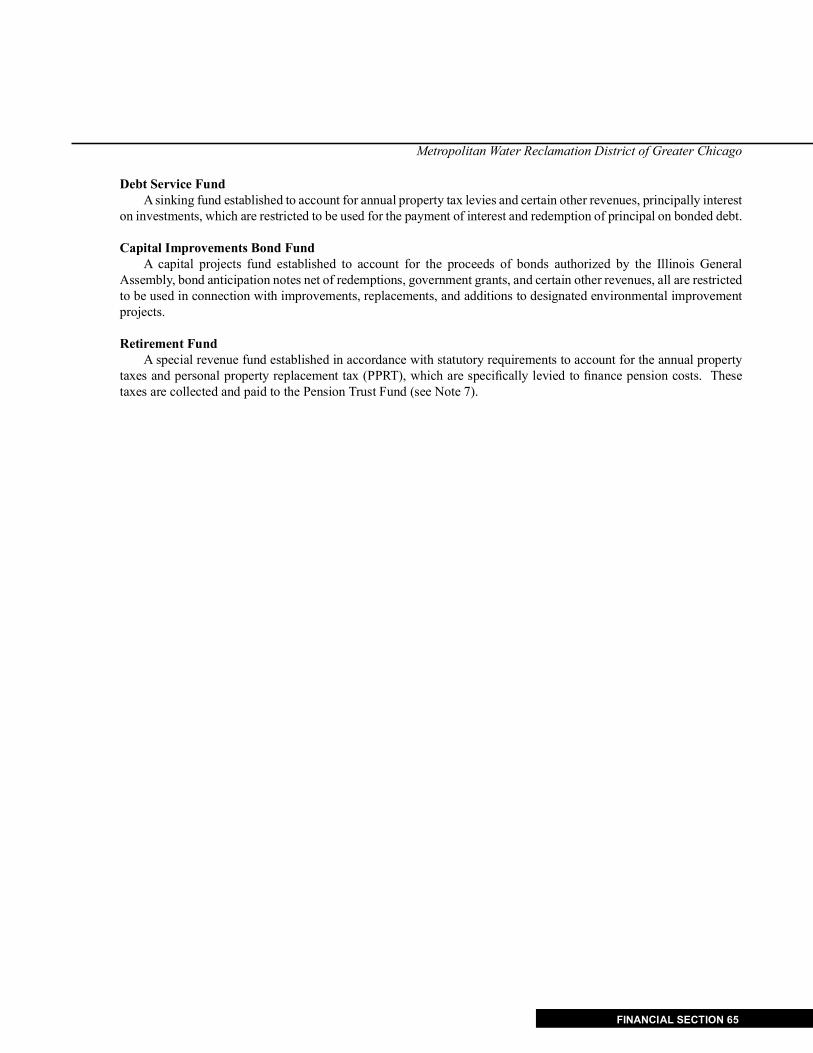
Metropolitan Water Reclamation District of Greater Chicago
FINANCIAL SECTION 65
Debt Service Fund A sinking fund established to account for annual property tax levies and certain other revenues, principally interest
on investments, which are restricted to be used for the payment of interest and redemption of principal on bonded debt.
Capital Improvements Bond FundA capital projects fund established to account for the proceeds of bonds authorized by the Illinois General
Assembly, bond anticipation notes net of redemptions, government grants, and certain other revenues, all are restricted to be used in connection with improvements, replacements, and additions to designated environmental improvement projects.
Retirement FundA special revenue fund established in accordance with statutory requirements to account for the annual property
taxes and personal property replacement tax (PPRT), which are specifi cally levied to fi nance pension costs. These taxes are collected and paid to the Pension Trust Fund (see Note 7).

Notes to the Basic Financial StatementsYear ended December 31, 2015
66 FINANCIAL SECTION
The District reports the following non-major governmental funds:
Construction FundA capital projects fund established to fi nance smaller construction projects on a pay-as-you-go basis. The Fund is
primarily fi nanced with an annual property tax levy and certain other revenues to be used to fi nance modernization and rehabilitation projects. Included in this fund are accounts maintained by the District restricted to making temporary loans to the Construction Fund. These accounts were established under Chapter 70, ILCS 2605/9(c) of the Illinois Compiled Statutes, which refers to these accounts as a “Construction Working Cash Fund.” Amounts borrowed in one year are generally repaid by the Construction Fund from tax collections received during the subsequent year. The assets, liabilities, deferred infl ows of resources and fund balances of the Construction Fund, detailed as to the Working Cash and Construction account divisions at December 31, 2015 are as follows (in thousands of dollars):
ConstructionTotal Working
Construction Construction CashFund Division Division
AssetsCash $ 4,561 $ 4,217 $ 344 Investments 21,843 12,240 9,603Receivables:
Property taxes receivable 17,062 17,062 -Allowance for uncollectible taxes (1,139) (1,139) -Taxes receivable, net 15,923 15,923 -
Miscellaneous receivable 745 745 -Total assets $ 43,072 $ 33,125 $ 9,947
Liabilities, Deferred Infl ows of Resources, and Fund Balances Liabilities:
Accounts payable and other liabilities $ 4,812 $ 4,812 $ -Due to Construction Fund from
Construction Working Cash - 12,000 (12,000)Total liabilities 4,812 16,812 (12,000)
Deferred infl ows of resources:Unavailable tax revenue 13,554 13,554 -
Total deferred infl ows of resources 13,554 13,554 -Fund balances:
Restricted for:Working cash 21,947 - 21,947Capital projects 2,759 2,759 -
Total fund balances 24,706 2,759 21,947Total liabilities, deferred infl ows, and fund balances $ 43,072 $ 33,125 $ 9,947

Metropolitan Water Reclamation District of Greater Chicago
FINANCIAL SECTION 67
The revenues, expenditures, and changes in fund balances of the Construction Fund, detailed as to the Construction and Working Cash account divisions for the year ended December 31, 2015, are as follows (in thousands of dollars):
Total WorkingConstruction Construction Cash
Fund Division DivisionRevenues:
Property taxes $ 16,617 $ 16,617 $ - Total tax revenue 16,617 16,617 -
Interest on investments 332 218 114User charge 300 300 -Claims and damages settlements 32 32 -Fees, forfeits and penalties 1,218 1,218 -
Total revenues 18,499 18,385 114Construction Costs:
Personal services 2,798 2,798 -Contractual services 841 841 -Materials and supplies 1,797 1,797 -Machinery and equipment 3,125 3,125 -Capital projects 13,381 13,381 -
Total expenditures 21,942 21,942 -
Revenues over (under) expenditures (3,443) (3,557) 114Net Change in Fund balance (3,443) (3,557) 114
Fund balance at the beginning of year 28,149 6,316 21,833Fund balance at the end of year $ 24,706 $ 2,759 $ 21,947

Notes to the Basic Financial StatementsYear ended December 31, 2015
68 FINANCIAL SECTION
Stormwater Management FundA capital projects fund established to account for the annual property taxes which are specifi cally levied to
fi nance all activities associated with stormwater management, including construction projects. Included in this fund are accounts maintained by the District restricted to making temporary loans to the Stormwater Management Fund. These accounts were established under Chapter 70, ILCS 2605/9(e) of the Illinois Compiled Statutes, which refers to these accounts as a “Stormwater Working Cash Fund.” Amounts borrowed in one year are generally repaid by the Stormwater Management Fund from tax collections received during the subsequent year.
The assets, liabilities, deferred infl ows of resources and fund balances of the Stormwater Management Fund, detailed as to the Working Cash and Stormwater Management account divisions at December 31, 2015 are as follows (in thousands of dollars):
Total StormwaterStormwater Stormwater WorkingManagement Management Cash
Fund Division Division Assets
Cash $ 2,781 $ 49 $ 2,732Certifi cates of deposit 502 - 502Investments 28,462 6,880 21,582Receivables:
Property taxes receivable 24,728 24,728 -Allowance for uncollectible taxes (1,520) (1,520) -
Taxes receivable, net 23,208 23,208 -Total assets $ 54,953 $ 30,137 $ 24,816
Liabilities, Deferred Infl ows, and Fund Balances Liabilities:
Accounts payable and other liabilities $ 6,973 $ 6,973 $ -Due to Corporate Fund 77 77 -Due to Stormwater Management Fund
from Stormwater Working Cash - 12,400 (12,400)Total liabilities 7,050 19,450 (12,400)
Deferred infl ows of resources:Unavailable tax revenue 19,777 19,777 -
Total deferred infl ows of resources 19,777 19,777 -Fund balances:
Restricted for:Working cash 37,216 - 37,216Unassigned (9,090) (9,090) -
Total fund balances 28,126 (9,090) 37,216Total liabilities, deferred infl ows, and fund balances $ 54,953 $ 30,137 $ 24,816

Metropolitan Water Reclamation District of Greater Chicago
FINANCIAL SECTION 69
The revenues, expenditures, and changes in fund balances of the Stormwater Management Fund, detailed as to the Stormwater Management and Working Cash account divisions for the year ended December 31, 2015, are as follows (in thousands of dollars):
Total StormwaterStormwater Stormwater Working
Management Management CashFund Division Division
Revenues:Property taxes $ 20,745 $ 20,745 $ -
Total tax revenue 20,745 20,745 -Interest on investments 350 169 181
Total revenues 21,095 20,914 181Construction Costs:
Personal services 14,863 14,863 - Contractual services 11,509 11,509 - Materials and supplies 1,666 1,666 -Capital projects 4,991 4,991 - Fixed and other charges 190 190 -
Total expenditures 33,219 33,219 -
Revenues over (under) expenditures (12,124) (12,305) 181
Other fi nancing sources (uses):Transfer out to Pension Fund (2,124) (2,124) -
Total other fi nancing sources (uses): (2,124) (2,124) - Net Change in Fund balance (14,248) (14,429) 181
Fund balance at the beginning of year 42,374 5,339 37,035Fund balance at end of year $ 28,126 $ (9,090) $ 37,216
In addition, the District reports the following fi duciary funds:
Pension Trust FundThis fund is a fi duciary fund established to account for employer/employee contributions, investment earnings,
and expenses for employee pensions. The balance refl ected as employer contributions receivable represents amounts due to the plan pursuant to legal requirements.
OPEB Trust FundThis fund is a fund established (pursuant to 70 ILCS 2605/9.6(d)) to administer the defi ned benefi t, post-
employment health care plan. The intention of the District is that the Fund satisfi es the requirements of Section 115 of the Internal Revenue Code of 1986, as amended. A private letter ruling regarding the exclusion of the Trust’s income from gross income under Section 115 has been received from the IRS.

Notes to the Basic Financial StatementsYear ended December 31, 2015
70 FINANCIAL SECTION
c. Basis of Accounting and Measurement Focus
Government-wide and Fiduciary Fund Financial StatementsThe government-wide and fi duciary fi nancial statements are reported using the economic resources measurement
focus and the accrual basis of accounting. Revenues are recorded when earned and expenses are recorded at the time liabilities are incurred, regardless of the period of related cash fl ows. Property taxes are recognized in the year of levy and personal property replacement taxes are recognized in the year earned. Grants and similar items are recognized as revenue in the fi scal year that all eligibility requirements have been met.
Governmental Fund Financial StatementsThe District’s governmental funds are reported using the current fi nancial resources measurement focus and the
modifi ed accrual basis of accounting. Under the modifi ed accrual basis, revenues are recognized when they become measurable and available to fi nance operations. Expenditures are recognized in the period in which the fund liability is incurred except for principal and interest on long-term debt, compensated absences, claims, judgments, and arbitrage, which are recognized when due and payable.
The accounting and reporting treatment applied to the capital assets and long-term liabilities associated with a fund are determined by its measurement focus. Since governmental funds are accounted for on the current fi nancial resources measurement focus, only current assets and current liabilities are included on their balance sheets. Their reported fund balance (net current assets) is considered a measure of “available spendable resources.” Governmental fund operating statements present increases (revenues and other fi nancing sources) and decreases (expenditures and other fi nancing uses) in net current assets. Accordingly, they are said to present a summary of sources and uses of “available spendable resources” during a period.
Property taxes, user charge revenue, interest, land rentals, and personal property replacement tax revenue are susceptible to accrual. In general, the revenue recognition period is limited to amounts collected during the period or within sixty days following year-end. Receivables that are unavailable are reported as deferred infl ow of resources.
Grants from Federal and State agencies are recorded as revenues in the fund fi nancial statements when reimbursable expenditures are incurred, or other eligibility requirements imposed by the provider are met, and the grant resources are measurable and available.
Property taxes attach as an enforceable lien on property as of January 1 of the levy year. They are levied and recorded as a receivable as of January 1 and are due in two installments in the following year.
d. Budgeting (appropriations) - The District’s fi scal year begins January 1 and ends on December 31. The District’s procedure for adopting the annual budget consists of the following stages:
(1) Department Heads propose expenditure estimates for the coming year which, if approved by the Executive Director, become his recommendations for presentation to the Committee on Budget and Employment.
(2) The Board of Commissioners holds a public hearing on the Capital Improvement Program in October.
(3) The Committee on Budget and Employment comprises all nine Commissioners and holds hearings with the Executive Director and with the Department Heads. These hearings are open to the public. After these budgetary reviews, the Committee on Budget and Employment submits its Tentative Budget to the Board of Commissioners.
(4) The Tentative Budget is put on public display for ten to twenty days. A public hearing is held during the ten to twenty day time frame where citizen groups, including civic groups, labor, and the press, are invited to critique the tentative budget.
(5) Shortly after the public hearings, the Board of Commissioners adopts the budget for the coming year.

Metropolitan Water Reclamation District of Greater Chicago
FINANCIAL SECTION 71
(6) Then, after a minimum fi ve-day waiting period following budget adoption, and at a Regular Board Meeting, the Commissioners consider and approve any budget amendments. The Adopted Budget, along with any approved amendments, is the fi nal budget document. This process must be completed prior to December 31 preceding the year to which the budget applies.
(7) The budget implementation phase begins January 1.
(8) The legal level of control for the District’s appropriations (the level at which the Board of Commissioners must approve any transfers of appropriated amounts) is on a line item class (object) basis. (A line item class represents a group of line items. For example, the line item class “personal services” is a grouping of line items such as salaries and wages, group insurance, professional services, Medicare contributions). Transfers of appropriations between objects of expenditure or between departments must be presented to the Board of Commissioners in accordance with applicable statutes. The District’s Annual Appropriation Ordinance further requires line item class appropriations be supported by a schedule of line items, and expenditures be made in accordance with such schedule of line items. For the Debt Service Fund and the Retirement Fund, the level of control is on a fund basis.
(9) The Executive Director is authorized to transfer appropriations between line items within an object class of
expenditure within a department. After March 1, transfers of appropriations between objects of expenditures or between departments can be made with the approval of the Board of Commissioners.
(10) Budgets are adopted on a basis not consistent with generally accepted accounting principles. In the General Corporate Fund budget, revenues are recognized on a cash basis except for property and personal property replacement taxes, which are recognized based on working cash borrowing plus an estimate of collections of property and property replacement taxes over and above the working cash borrowing. Expenditures are recognized on a GAAP basis except for inventory expenditures, which are accounted for on the purchase method for budgetary purposes and on the consumption method for GAAP fi nancial reporting purposes. Transfers out to other funds are budgeted as expenditures, while transfers in are considered other fi nancing sources. The Capital Improvements Bond Fund is budgeted on an “obligation” basis of accounting, which records total expenditures and grant revenues in the period in which contracts or grants are awarded. Appropriations lapse at year-end for the General Corporate, Retirement, Construction, Stormwater Management, and Debt Service Funds. Appropriations for the Capital Improvements Bond Fund lapse at the end of the year to the extent of the unencumbered balances. Encumbered balances are not reported as reservations of fund balances, as the amounts are re-appropriated in the following year.
(11) All governmental funds have legally adopted budgets.
e. Deposits with escrow agent (if any) represent cash with the escrow agent for the subsequent payment of interest on debt.
f. Certifi cates of deposit are stated at cost plus accrued interest.
g. Investments of the Governmental Funds are stated at fair value plus accrued interest. The investment with the State Treasurer’s Illinois Funds is measured at the net asset value per share provided by the pool. The Illinois Funds are not registered with the SEC. State statute requires the State Treasurer’s Illinois Funds to comply with the Illinois Public Funds Investment Act (30 ILCS 235). Oversight is provided by the State Treasurer. Investments of the Pension and OPEB Trust Funds, other than short-term investments, are stated at fair value.
h. Inventory, consisting mainly of materials, supplies, and repair parts which maintain and extend the life of the District’s Treatment facilities, is reported on the Balance Sheet of the General Corporate Fund and the government-wide Statements of Net Position. The District maintains a perpetual record-keeping system and uses a moving-average method, based on cost, for pricing its storeroom inventories. Materials, supplies, and repair parts are recorded as expenditures/expenses when consumed.

Notes to the Basic Financial StatementsYear ended December 31, 2015
72 FINANCIAL SECTION
i. Prepaid assets represent services the District has paid for but has not received the full benefi t. Prepaids are recorded as expenditures/expenses when consumed.
Inventory balances and prepaid insurance at year-end are reported as nonspendable fund balance in the governmental funds.
j. Restricted assets represent cash and investments set aside pursuant to real estate escrow and intergovernmental agreements.
k. Interfund transactions represent governmental fund transactions for the following: a) loans between funds reported as due to /due from other funds; b) reimbursements between funds reported in the fund fi nancials as expenditures in the reimbursing fund and a corresponding reduction in expenditures in the reimbursed fund; and c) transfers between funds. All interfund transactions are eliminated in the government-wide fi nancial statements. See note 12 for further disclosure of interfund transactions.
l. Capital assets including land (and land improvements), buildings, equipment, computer software, infrastructure, acquired easements, and construction in progress are recorded at historical cost or estimated historical cost in the government-wide fi nancial statements. Interest costs are not capitalized. Infrastructure assets include the District’s sewers, water reclamation plants (WRP,) waterway assets, TARP deep tunnels, and drop shafts. The thresholds for reporting capital assets are as follows:
Land and buildings $100,000 and over Infrastructure $500,000 and over Equipment $20,000 and over Computer software $100,000 and over
Depreciation and amortization of capital assets is provided on the straight-line method (using a ten percent salvage value for equipment) over the following estimated useful lives:
Buildings and land improvements 80 years Infrastructure (TARP deep tunnels and drop shafts only) 200 years Equipment 6-50 years Computer software 5 years
The District is using the modifi ed approach as an alternative to depreciation to report its eligible infrastructure assets, with the exception of the TARP deep tunnels and drop shafts, which are depreciated. The modifi ed infrastructure assets are categorized into networks, systems, and subsystems. Each of the District’s seven WRPs represents a separate network and the waterway assets are an eighth network. The systems within the networks are categorized by the process fl ow through the network (i.e., collection system, treatment processes system, solids processing system, fl ood & pollution control system, or drying solids/utilization system). The subsystems represent the major processes of each system (e.g., fi ne screens and grit chambers are subsystems of the treatment processes system). Condition assessments at each network are performed at the subsystem level and these assessments are compiled into a single assessment for each system. The rating scales used in the condition assessments are explained in the Required Supplementary Information immediately following the notes. Infrastructure assets reported under the modifi ed approach are not depreciated, since the District manages these assets using an asset management system, and documents that the assets are being preserved at a level of acceptable or better, as evidenced by a condition assessment.
In compliance with Governmental Accounting Standards Board (GASB) Statement 34, existing infrastructure assets accounted for with the modifi ed approach are not reported in the government-wide fi nancial statements until an initial condition assessment is completed for the assets’ network. Currently, all the District’s WRPs infrastructure assets are reported as infrastructure under the modifi ed approach in the government-wide fi nancial statements. Condition assessments of eligible infrastructure assets must be completed at least every three years following the initial

Metropolitan Water Reclamation District of Greater Chicago
FINANCIAL SECTION 73
assessments. The Kirie, Central (Stickney), Hanover, O’Brien, Egan, Calumet, Lemont WRPs, and Waterways had their initial condition assessments completed between 2002 and 2006. The Kirie, Central (Stickney) and Waterways networks each had its most recent condition assessment completed in 2014. The Egan and O’Brien networks each had its most recent condition assessment completed in 2013. The Hanover, Calumet and Lemont networks each had its most recent condition assessment completed in 2012.
Modifi ed infrastructure assets under construction are reported in the government-wide fi nancial statements as construction in progress, and are reclassifi ed to infrastructure assets when construction is substantially complete.
m. Compensated Absences for accumulated unpaid vacation, holiday, overtime, severance and sick leave are paid to employees upon retirement or termination. An employee is eligible to receive 100 percent of earned vacation, holiday and overtime pay. Depending upon the date of hire and/or collective bargaining agreements, employees may also be eligible to receive severance pay and 50% of accumulated sick pay up to a maximum of sixty days. Compensated absences are accrued as they are earned in the government-wide fi nancial statements. Expenditures and liabilities for compensated absences are recorded in the fund fi nancial statements when due and payable. Included in the long-term liabilities of the Statements of Net Position at December 31, 2015, are liabilities for compensated absences of $2,563,000, due within one year, and $22,590,000, due in more than one year.
n. Deferred Outfl ows/Infl ows of Resources - Deferred infl ow of resources is an acquisition of net position by the government that is applicable to a future period. Deferred outfl ow of resources is a consumption of net position by the government that is applicable to a future reporting period.
o. Long-Term Obligations – Long-term debt and other long-term obligations are reported in the government-wide Statements of Net Position. Bond premiums are reported with bonds payable and amortized over the life of the bonds, using the straight-line method, in the government-wide fi nancial statements. In addition, the refunding transaction cost, representing the excess of the amount required to refund debt over the book value of the old debt, is reported as a deferred outfl ow of resources and amortized over the shorter of the life of the old debt or new debt in the government-wide fi nancial statements.
The face amounts of the debt and bond premiums are recognized as other fi nancing sources during the issuance period in the fund fi nancial statements, while bond discounts are reported as other fi nancing uses. Issuance costs, whether or not withheld from the actual debt proceeds received, and refunding costs are recognized as debt service expenditures in the fund fi nancial statements.
p. Fund Balances - The Board of Commissioners on December 9, 2010, adopted a new fund balance classifi cation policy in accordance with GASB Statement No. 54, Fund Balance Reporting and Governmental Fund Type Defi nitions: The policy categorizes the balances of governmental funds into the following categories: nonspendable, restricted, committed, assigned and unassigned fund balances. The categories are described as follows:
• Nonspendable Fund Balance – This consists of amounts that cannot be spent because they are either not in spendable form, or are legally or contractually required to be maintained intact.
• Restricted Fund Balance – Reported when constraints placed on the use of resources are either externally imposed by creditors, grantors, contributors, or laws or regulations of other governments; or imposed by law through constitutional provisions or enabling legislation.
• Committed Fund Balance – This consists of amounts that can only be used for specifi c purposes pursuant to constraints imposed by a board motion. The District’s commissioners shall establish, modify, or rescind a fund balance commitment by vote of a motion presented to the Board.

Notes to the Basic Financial StatementsYear ended December 31, 2015
74 FINANCIAL SECTION
• Assigned Fund Balances – This consists of amounts that are constrained by the District’s intent to be used for specifi c purposes, but are neither restricted nor committed. The District’s Board of Commissioners approved a motion authorizing the Executive Director to assign amounts of fund balances to a specifi c purpose. The District has an assigned fund balance of $127,920,000 in the Capital Improvement Bond Fund, for future capital projects.
• Unassigned Fund Balances – This classifi cation represents fund balance that has not been assigned to other funds and has not been restricted, committed, or assigned to specifi c purposes within the general fund.
• In the General Corporate Fund, the District considers restricted amounts to have been spent fi rst when an expenditure is incurred for purposes for which restricted fund balance is available, followed by committed amounts, and then assigned amounts. Unassigned amounts are used only after the other categories of fund balance have been fully utilized. In governmental funds other than the General Corporate Fund, the District considers restricted amounts to have been spent last. When an expenditure is incurred for purposes for which restricted fund balance is available, the District will fi rst utilize assigned amounts, followed by committed amounts, and then restricted amounts.
q. Net Position – The government-wide Statements of Net Position display three components of net position, as follows:
• Net investment in capital assets - This consists of capital assets, net of accumulated depreciation, less the outstanding balances of any debt attributable to capital assets.
• Restricted Net Position - This consists of net position that is legally restricted by outside parties, or by law through constitutional provisions or enabling legislation. Net position restricted for working cash and reserve claims is based on legal restrictions, while net position restricted for debt service and capital projects is based on legal restrictions and/or outside parties. The government-wide statement of net position reports $654,897,000 of restricted net position.
• Unrestricted Net Position - This consists of net position that does not meet the defi nition of “restricted” or “net investment in capital assets.”
r. User Charge – The Environmental Protection Agency requires grant recipients to charge certain users of waste water treatment services a proportionate share of the cost of operations and maintenance. The District has utilized a User Charge System since January 1, 1980. The system was developed in accordance with 70 ILCS 2305/7.1.
s. Comparative data and reclassifi cations – The basic fi nancial statements present comparative data for the prior year to provide an understanding of the changes in fi nancial position and results of operations. Certain prior year amounts have been reclassifi ed to conform to the current year presentation.
t. Use of Estimates – The preparation of fi nancial statements requires management to make estimates and assumptions that affect the reported amounts of assets, deferred outfl ows, liabilities and deferred infl ows, disclosure of contingent assets and liabilities at the date of the fi nancial statements and the reported amounts of revenues and expenditures/expenses during the reported period. Actual results could differ from those estimates.
u. New Accounting Pronouncement - Issued in 2012, GASB Statement No. 68, Accounting and Financial Reporting for Pensions, is designed to improve accounting and fi nancial reporting for pensions. Additionally, GASB Statement No. 71, Pension Transition for Contributions made Subsequent to the Measurement Date, was issued in November 2013 to address timing differences between employer contributions and the measurement date. These statements will replace GASB Statement No. 27, Accounting for Pensions by State and Local Governmental Employers, and the requirements of GASB statement No. 50, Pension Disclosures. The District implemented these statements for the year ending December 31, 2015 and they have been incorporated.

Metropolitan Water Reclamation District of Greater Chicago
FINANCIAL SECTION 75
2. Reconciliation of Fund and Government-wide Financial Statementsa. Reconciliation of Total Fund Balances to Total Net Position - The following explanations are provided for the
reconciling adjustments shown in the Governmental Funds Balance Sheets/Statements of Net Position at December 31, 2015 (in thousands of dollars):
Total fund balances of governmental funds $ 784,400Amounts reported for governmental activities in the Statements of Net Position are different because:Capital assets are not current fi nancial resources and therefore are not reported as assets in governmental funds. However, capital assets are reported in the Statements of Net Position. The cost of capital assets and accumulated depreciation is as follows:
Capital assets 7,549,564Accumulated depreciation/amortization (267,544)
Capital assets, net 7,282,020Long-term liabilities are not due and payable in the current period and accordingly are not reported as liabilities in governmental funds. However, long-term liabilities are reported in the Statements of Net Position. The long-term liabilities consist of:
Compensated absences (25,153)Claims and judgments (53,570)Capital lease (43,405)Bond anticipation notes (161,697)General obligation debt (2,655,365)Net OPEB obligation (25,001)Net Pension liability (947,300)Due to Pension Trust Fund (57,174)
Total long-term liabilities (3,968,665)Bond refunding transactions are recorded as deferred outfl ows of resources in the governmental funds while bond premiums and discounts are recorded as other fi nancing sources and uses, respectively. Bond premiums are amortized over the life of the bonds for the Statements of Net Position. They consist of:
Bond premium (115,423)Bond refunding transactions 12,511
Total bond premium and refunding transactions (102,912)Interest on debt is not accrued in governmental funds, but rather is recognized as a liability and an expenditure when due. Interest is recorded as a liability as it is incurred in the Statements of Net Position. The 2015 amount is:
Accrued interest (14,924)Some assets reported in governmental funds do not increase fund balance because the assets are not “available” to pay for current-period expenditures. These assets are offset by deferred infl ow of resources in the governmental funds. However, these assets increase net position in the Statements of Net Position. They consist of:
Deferred property taxes and personal property replacement tax 456,898Grants and rents 933
Adjustment to deferred infl ow of resources 457,831Deferred outfl ows of resources represent items related to pension, which will be recognized as a pension expense in future reporting periods. Deferred outfl ows consist of employer contributions and “other” which includes differences between expected and actual experience, changes of assumptions, and net differences between projected and actual earnings on pension plan investments. However, these items are reported in the Statement of Net Position. They consist of:
Deferred outfl ow for employer contributions subsequent to measurement date 71,041Deferred outfl ows other pension related amounts 20,415
Adjustment to deferred outfl ows of resources 91,456Interfund transactions are eliminated for Government-wide reporting. These transactions consist of:
Due from other funds 77Due to other funds (77)
Total interfund - Total net position of governmental activities $ 4,529,206

Notes to the Basic Financial StatementsYear ended December 31, 2015
76 FINANCIAL SECTION
b. Reconciliation of the Change in Fund Balances to the Change in Net Position - The following explanations are provided for the adjustments shown in the Statements of Governmental Fund Revenues, Expenditures, and Changes in Fund Balances/Statements of Activities for the year ended December 31, 2015 (in thousands of dollars):
Net change in fund balances of governmental funds $ 165,000Amounts reported for governmental activities in the Statements of Activities are different because: Construction costs for capital outlays are reported as expenditures in governmental funds. However, in the Statements of Activities, the cost of capital assets is allocated over their estimated useful lives as depreciation expense except for those assets under the modifi ed approach. In the current period, these amounts are:
Construction costs and other capital outlays 256,996Depreciation expense-allocated to various departments (2,955)Depreciation/amortization expense-unallocated (12,123)
Excess of construction and capital outlay costs over depreciation expense 241,918Debt proceeds provide current fi nancial resources to governmental funds. However, issuing debt increases long-term liabilities in the Statements of Net Position. In the current period, debt proceeds and related items were:
General obligation bond proceeds (295,805)Bond issuance premium (48,529)Bond anticipation notes proceeds (181,537)
Debt proceeds total (525,871)Repayment of long-term debt is reported as an expenditure in the governmental funds, or as an other fi nancing use in the case of refunding, but the repayment reduces the long-term liabilities in the Statements of Net Position. In the current year, the repayments consist of:
Payment to escrow agent for refunded bonds 82,906Debt service principal retirement 101,220
Debt service principal retirement total 184,126Some expenses reported in the Statements of Activities do not require the use of current fi nancial resources and therefore are not reported as expenditures in governmental funds. These activities consist of:
Change in compensated absences-allocated to various departments 2,411Change in claims and judgments (17,902)Change in bond interest (315)Change in bond anticipation notes interest (2,404)Amortization of bond issuance/refunding costs (5,305)Amortization of bond premium 7,727Change in net pension liability (15,172)Due to Pension Trust Fund (9,475)Change in OPEB costs 5,408
Total additional expenses (35,027)The proceeds from the sale of land and equipment are reported as revenue in the governmental funds. However, the cost of the land and equipment is removed from the capital assets account in the Statements of Net Position and offset against sale proceeds resulting in gain or (loss) in the Statements of Activities. The net effect of miscellaneous transactions involving capital asset sales:
Total land and equipment sales (339)Unavailable tax revenues and certain other revenues that are earned but “unavailable” for the current period are not recognized in governmental funds. These revenues consist of:
Property tax - net 7,938Grant and rent adjustment 5
Total adjustments 7,943Change in net position of governmental activities $ 37,750

Metropolitan Water Reclamation District of Greater Chicago
FINANCIAL SECTION 77
3. Reconciliation of Budgetary Basis Accounting to GAAP Basis Accounting
The District prepares its budget in conformity with practices prescribed or permitted by the applicable statutes of the State of Illinois, which differ from GAAP. To reconcile the budgetary cash basis fi nancials to the GAAP fund basis fi nancials, the following schedule was prepared (in thousands of dollars):
General CorporateFund
Revenues and other sources (uses) over (under) expenditures on a budgetary basis $ (1,873)Adjustment from Budget to GAAP for:
Tax revenues (1,124)Cash basis other revenues 4,766GAAP versus budgetary expenditure differences (1,683)
Revenues and other sources (uses) over (under) expenditures on GAAP basis $ 86
4. Deposits and Investments
DepositsAs of December 31, 2015 the District, the Pension Trust Fund and OPEB Trust Fund deposits were fully insured and
collateralized.
Investments (excluding Trust Funds) The investments which the District may purchase are limited by Illinois law to the following: (1) securities which are
fully guaranteed by the U.S. Government as to principal and interest; (2) certain U.S. Government Agency securities; (3) certifi cates of deposit or time deposits of banks and savings and loan associations which are insured by a Federal corporation; (4) short-term discount obligations of the Federal National Mortgage Association; (5) certain short-term obligations of corporations (commercial paper) rated in the highest classifi cations by at least two of the major rating services; (6) fully collateralized repurchase agreements; (7) the State Treasurer’s Illinois funds; (8) money market mutual funds and certain other instruments; and (9) municipal bonds of the State of Illinois, or of any other state, or of any political subdivisions thereof, whether interest is taxable or tax-exempt under federal law, rated within the four highest classifi cations by a major rating service. District policies require that repurchase agreements be collateralized only with direct U.S. Treasury securities that are maintained at a value of at least 102% of the investment amount (at market).

Notes to the Basic Financial StatementsYear ended December 31, 2015
78 FINANCIAL SECTION
The following schedule reports the fair values and maturities (using the segmented time distribution method) for the District’s investments at December 31, 2015 (in thousands of dollars):
Investment Maturities (in Years)Fair Less Than
Investment Type Value 1 Year 1- 5 Years
U.S. Agencies $ 222,192 $ 49,903 $ 172,289Municipal Bonds 132,692 46,191 86,501Commercial Paper 159,949 159,949 -State Treasurer’s Illinois Funds 2,418 2,418 -
Total Investments $ 517,251 $ 258,461 $ 258,790
The Illinois Funds invest a minimum of 75% of its assets in authorized investments of less than one year and no investment shall exceed two years maturity. The above fair value amount excludes accrued interest receivable of $873,000.
Interest Rate Risk The District’s investment policy protects against fair value losses resulting from rising interest rates by structuring its investments so that suffi cient securities mature to meet cash requirements, thereby avoiding the need to sell securities on the open market prior to maturity, except when such a sale is required by state statute. In addition, the District’s policy limits direct investments to securities maturing in fi ve (5) years or less. Written notifi cation is required to be made to the Board of Commissioners of the intent to invest in securities maturing more than fi ve (5) years from the date of purchase.
Credit Risk The District’s investment policy applies the “prudent person” standard in managing its investment portfolio. As such, investments are made with such judgment and care, under circumstances then prevailing, which persons of prudence, discretion and intelligence exercise in management of their own affairs, not for speculation, but for investment, considering the probable safety of their capital as well as the probable income to be derived. The District’s investment policy limits investments in commercial paper to the highest rating classifi cations, as established by at least two of the four major rating services, and which mature not later than 270 days from the purchase date. Such purchases may not exceed 10% of the issuer corporation’s outstanding obligations.

Metropolitan Water Reclamation District of Greater Chicago
FINANCIAL SECTION 79
Credit ratings for the District’s investments in debt securities as described by Standard & Poor’s, Moody’s and Fitch at December 31, 2015 (excluding investments in U.S. Treasuries, if any, which are not considered to have credit risk), are as follows:
Credit Ratings at % of Total12/31/15 % of Investment Investments in
Investment Type S&P/Moody’s/Fitch Type Debt Securities
U.S. Agencies Federal National Mortgage Association (FNMA) AA+/Aaa/AAA 40.2%Federal Home Loan Mortgage Corporation (FHLMC) AA+/Aaa/AAA 32.8%Federal Home Loan Banks (FHLB) AA+/Aaa/NR 22.5%Federal Farm Credit Banks (FFCB) AA+/Aaa/AAA 4.5%
Total U.S. Agencies 100.0% 43.0%
Commercial Paper A-1/P-1/F1 100.0% 30.9%State Treasurer’s Illinois Funds AAAm/NR/NR 100.0% 0.5%State of Illinois * A-/Baa1/BBB+ 26.8% 6.9%Colorado Housing & Finance Authority * NR/Aa2/AA 15.2% 3.9%New York City Transitional Finance Authority * AAA/Aa1/AAA 10.2% 2.6%Illinois Sales Tax * AAA/NR/AA+ 7.5% 1.9%Rosemont, Illinois * AA/A3/NR 6.0% 1.6%Dormitory Authority State of New York * AAA/Aa1/AA+ 4.4% 1.1%Mississippi Development Bank, Jackson Public School District * A/NR/NR 4.4% 1.1%Waukegan, Illinois * NR/A2/NR 3.3% 0.8%Peoria County Illinois School District * NR/Aa2/NR 3.3% 0.8%Long Beach California Bond Finance Authority * AA-/NR/AA- 3.2% 0.8%State of Connecticut * AA/Aa3/AA 2.3% 0.6%Arizona School Facilities Board * AAA/Aaa/AAA 2.3% 0.6%Indiana University * AA+/Aaa/NR 1.6% 0.4%Holland, Michigan * AA/NR/NR 1.5% 0.4%University of Illinois * AA-/Aa3/NR 1.4% 0.4%New York State Urban Development Corporate * AAA/Aa1/AA+ 1.2% 0.3%Cook County Illinois * AA/A2/A+ 1.1% 0.3%California Department of Water Resources * AAA/Aa1/NR 1.1% 0.3%Houston Texas Utility System * AA/Aa2/AA 0.9% 0.2%Monmouth County Improvement Authority * AAA/Aaa/AAA 0.9% 0.2%Chicago Illinois Wastewater Transmission * A/NR/AA 0.8% 0.2%Tampa-Hillsborough County Florida Expressway Authority * A/A2/NR 0.6% 0.2%
100.0%
* Municipal BondNR - Not Rated

Notes to the Basic Financial StatementsYear ended December 31, 2015
80 FINANCIAL SECTION
Concentration of Credit RiskThe District’s goal is to limit the amount that can be invested in commercial paper to one-third of the District’s total
investments, and no more than 20% of the amount invested in commercial paper can be invested in any one entity. In 2015, the fair value of commercial paper represented 30.9% of the District’s total investments. None of the District’s commercial paper in any one entity exceeded the 20% goal. As of December 31, 2015, the following investments were greater than 5% of total investments (in thousands of dollars):
Investment Fair Value
Federal National Mortgage Association (FNMA) $ 89,465Federal Home Loan Mortgage Corporation (FHLMC) 72,900Federal Home Loan Bank (FHLB) 49,903State of Illinois Municipal Bonds 45,687
Custodial Credit RiskThe District’s investments are not exposed to custodial credit risk since its investment policy requires all investments
and investment collateral to be held in safekeeping by a third party custodial institution, as designated by the Treasurer, in the District’s name. Custodial credit risk is the risk that, in the event of the failure of the counterparty, the District will not be able to recover the value of its investments or collateral securities which are in the possession of the outside party.
Trust Fund Investments The Pension Trust Fund uses the “prudent person rule” as the Fund’s investment authority as set forth in the Illinois
Compiled Statutes. The Fund’s asset allocation policy allows investments in domestic equities, international equities and fi xed income securities.
The OPEB Trust Fund is authorized under State Statute 70 ILCS 2605/9.6(d). In accordance with the Statute, the Trust Fund shall be managed by the District Treasurer in any manner deemed appropriate subject only to the prudent person standard. The Trust adopted its investment policy on November 19, 2009, which was revised on December 19, 2013. Investments shall be limited to publicly traded securities and mutual funds, adequately diversifi ed among various market segments and sectors as well as other developed countries and emerging markets.
At December 31, 2015, the OPEB Trust’s assets were invested in fi xed income and equity open-ended mutual funds traded on national securities exchanges. Investments are stated at fair value. The fair value of mutual fund units traded on national securities exchanges is the last reported sales price on the last business day of the fi scal year of the Trust. Purchases and sales of mutual fund units are accounted for on the trade dates.
Interest Rate Risk Interest rate risk is defi ned as the risk that the fair value of an investment will be adversely affected by changes in market interest rates. Generally, the longer the maturity of an investment, the greater the sensitivity of its fair value to changes in market interest rates becomes. One strategy to manage exposure to interest rate risk is to purchase a combination of short-term and long-term investments, while considering cash fl ow needs of the Pension Trust Fund. The Pension Trust Fund does not maintain an investment policy relative to interest rate risk; however, the Board of Trustees recognizes that its investments are subject to short-term volatility and their goal is to maximize total return within prudent risk parameters.

Metropolitan Water Reclamation District of Greater Chicago
FINANCIAL SECTION 81
The following table categorizes the Pension Trust Fund’s interest bearing investments and presents the fair value and segmented time distribution of debt securities held by the Pension Trust Fund as of December 31, 2015 (in thousands of dollars):
Investment Maturities (In Years)Less than
Investment Type Fair Value 1 Year 1-5 Years 6-10 Years 10+ YearsFixed Income:
Pooled Funds - Long Term investments $ 111,638 $ - $ - $ 111,638 $ -Pooled Funds - Short Term investments 39,867 39,867 - - -Corporate bonds and notes 197,386 4,115 60,585 58,379 74,307Common collective trust 17,954 59 6,492 10,455 948Municipal bonds 3,864 - 235 - 3,629U.S. Governmental and government agency obligations 93,440 4,814 5,122 9,796 73,708
Total Fixed Income 464,149Equities:
Common and Preferred Stock 757,683Securities lending Collateral 36,893
Total Equities 794,576Total Investments $ 1,258,725
The Fund’s benefi t liabilities extend many years into the future; therefore, the Pension Trust Fund’s policy is to maintain a long-term focus on its investment decision-making process. The Fund’s fi xed income performance objective is the Barclays Capital Aggregate Bond Index.
The OPEB Trust’s benefi t liabilities extend many years into the future, and the Trust’s policy is to maintain a long-term focus on its investment decision-making process. Fixed income investments susceptible to interest rate risk are monitored to prevent such investments from exceeding established allocation targets.

Notes to the Basic Financial StatementsYear ended December 31, 2015
82 FINANCIAL SECTION
The following illustrates the terms of investments that are highly sensitive to interest rate fl uctuations and reports the fair values and maturities for the OPEB Trust Fund’s investments at December 31, 2015 (in thousands of dollars):
AverageMaturities
Investment Type Fair Value Percentage (years)Fixed Income Mutual Funds:
Dodge & Cox Income $ 29,982 44.5% 8.3Payden Core Bond Fund 7,474 11.1% 7.7Western Asset Core Plus 29,931 44.4% 11.8
Total Fixed Income 67,387
Equities:Fidelity Contra Fund 11,183Vanguard Small Cap Index Instl. 5,555LSV Value Equity Institutional 10,909Spartan 500 Index Advantage Class 11,154Spartan Mid Cap Index 5,574Artisan International Investor Class 7,454Harbor International Instl. 14,823
Total Equities Income 66,652Global Balanced Funds:
PIMCO All Asset Institutional 14,649Money Market Funds:
Illinois Funds Investment Pool 40Other Money Market Funds 510
Total Money Market Funds 550Total Investments $ 149,238
Credit Risk
Credit risk is defi ned as the risk that the issuer of a debt security will not pay its par value upon maturity. The Illinois Statutes prescribe the “prudent person rule” as the Pension Trust Fund’s investment authority and within the “prudent person” framework, the Board of Trustees adopts investment guidelines that consider credit risk for the Pension Trust Fund’s investment managers which are included within their respective investment Management Agreements.
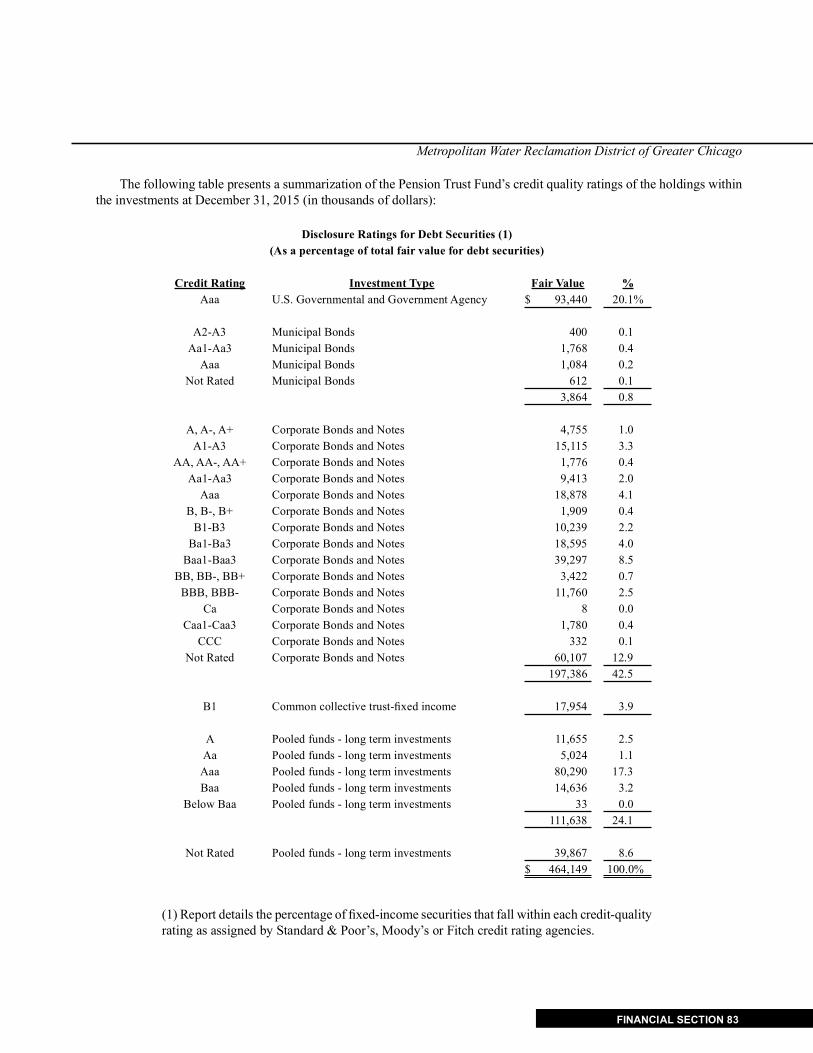
Metropolitan Water Reclamation District of Greater Chicago
FINANCIAL SECTION 83
The following table presents a summarization of the Pension Trust Fund’s credit quality ratings of the holdings within the investments at December 31, 2015 (in thousands of dollars):
Disclosure Ratings for Debt Securities (1)(As a percentage of total fair value for debt securities)
Credit Rating Investment Type Fair Value %Aaa U.S. Governmental and Government Agency $ 93,440 20.1%
A2-A3 Municipal Bonds 400 0.1Aa1-Aa3 Municipal Bonds 1,768 0.4
Aaa Municipal Bonds 1,084 0.2Not Rated Municipal Bonds 612 0.1
3,864 0.8
A, A-, A+ Corporate Bonds and Notes 4,755 1.0A1-A3 Corporate Bonds and Notes 15,115 3.3
AA, AA-, AA+ Corporate Bonds and Notes 1,776 0.4Aa1-Aa3 Corporate Bonds and Notes 9,413 2.0
Aaa Corporate Bonds and Notes 18,878 4.1B, B-, B+ Corporate Bonds and Notes 1,909 0.4
B1-B3 Corporate Bonds and Notes 10,239 2.2Ba1-Ba3 Corporate Bonds and Notes 18,595 4.0
Baa1-Baa3 Corporate Bonds and Notes 39,297 8.5BB, BB-, BB+ Corporate Bonds and Notes 3,422 0.7
BBB, BBB- Corporate Bonds and Notes 11,760 2.5Ca Corporate Bonds and Notes 8 0.0
Caa1-Caa3 Corporate Bonds and Notes 1,780 0.4CCC Corporate Bonds and Notes 332 0.1
Not Rated Corporate Bonds and Notes 60,107 12.9197,386 42.5
B1 Common collective trust-fi xed income 17,954 3.9
A Pooled funds - long term investments 11,655 2.5Aa Pooled funds - long term investments 5,024 1.1Aaa Pooled funds - long term investments 80,290 17.3Baa Pooled funds - long term investments 14,636 3.2
Below Baa Pooled funds - long term investments 33 0.0111,638 24.1
Not Rated Pooled funds - long term investments 39,867 8.6$ 464,149 100.0%
(1) Report details the percentage of fi xed-income securities that fall within each credit-quality rating as assigned by Standard & Poor’s, Moody’s or Fitch credit rating agencies.

Notes to the Basic Financial StatementsYear ended December 31, 2015
84 FINANCIAL SECTION
The OPEB Trust’s Investment Policy requires a minimum of 85% of the fi xed income holdings of an actively managed fi xed income mutual fund be of investment grade quality or higher at purchase; rated no lower than “Baa” by Moody’s and no lower than “BBB” by Standard and Poor’s. The Trustee, at its discretion, may impose a higher standard on an individual investment’s circumstances or as investment objectives dictate. Fixed income purchases shall be limited to obligations issued or guaranteed as to principal and interest by the U.S. Government, Canadian Government, or any agency or instrumentality thereof, or to corporate and municipal issues.
The following reports the credit ratings for the OPEB Trust Fund’s debt securities at December 31, 2015; excluded are U.S. government obligations or obligations explicitly guaranteed by the U.S. Government, if any, which are classifi ed under the headings U.S. Treasuries and U.S. Agencies:
Disclosure Ratings for Debt Securities(As a percentage of total fair value for debt securities)
Credit RatingDodge & CoxIncome Fund
Payden CoreBond Fund
Western AssetCore Plus Fund
AAA 45.0 % 51.0 % 45.4 %AA 3.1 4.0 4.3A 8.0 12.0 18.8
BBB 32.8 33.0 16.3BB 8.5 0.0 4.9B 2.6 0.0 4.5
Below B 0.0 0.0 3.8Not Rated 0.0 0.0 2.0
100.0 % 100.0 % 100.0 %
Morningstar Inc. provided the percentage of fi xed-income securities that fall within each credit-quality rating as assigned by Standard & Poor’s or Moody’s credit rating agencies.
The credit rating for the Illinois Funds money market investment pool was AAAm by Standard and Poor’s at December 31, 2015. The Trust’s investment in an additional money market fund was not individually rated by a nationally recognized statistical rating organization.

Metropolitan Water Reclamation District of Greater Chicago
FINANCIAL SECTION 85
Foreign Currency RiskForeign currency risk is the risk of loss arising from changes in currency exchange rates. All foreign currency-
denominated investments are in equities, fi xed income and foreign cash. The Pension Trust Fund’s exposure to foreign currency risk at December 31, 2015 was as follows:
Common Stock Fair Value %Australian Dollar $ 11,983,409 7.2Canadian Dollar 4,666,082 2.8Swiss Franc 16,812,203 10.1Danish Krone 4,561,234 2.7Euro 35,682,538 21.4British Pound Sterling 38,841,400 23.2Hong Kong Dollar 6,119,568 3.7Israeli Shekel 1,607,225 1.0Japanese Yen 35,101,257 21.0Norwegian Krone 2,471,708 1.5New Zealand Dollar 1,252,471 0.7Swedish Krona 4,534,258 2.7Singapore Dollar 3,443,343 2.0 Total $ 167,076,696 100.0%
Corporate Bonds and Notes Fair Value %Australian Dollar $ 6,601,201 14.0Canadian Dollar 2,729,878 5.8Chinese Yuan 302,113 0.6Euro 22,904,805 48.7British Pound Sterling 2,359,590 5.0Indian Rupee 1,052,705 2.2Japanese Yen 5,367,154 11.4Mexican New Peso 515,112 1.1Norwegian Krone 1,762,331 3.7New Zealand Dollar 1,077,818 2.3Romanian Leu 277,338 0.6Russian Ruble 544,498 1.2Swedish Krona 495,490 1.1Singapore Dollar 1,076,111 2.3 Total $ 47,066,144 100.0%

Notes to the Basic Financial StatementsYear ended December 31, 2015
86 FINANCIAL SECTION
Foreign Cash Fair Value %Australian Dollar $ 45,273 3.7Canadian Dollar 59,471 4.8Swiss Franc 28,231 2.3Chinese Yuan 9,879 0.8Danish Krone 28,327 2.3Euro 219,323 17.8British Pound Sterling 45,284 3.7Hong Kong Dollar 471,532 38.3Israeli Shekel 5,669 0.5Japanese Yen 157,947 12.8Mexican New Peso 20,706 1.7Norwegian Krone 81,814 6.7New Zealand Dollar 4,361 0.4Swedish Krona 25,844 2.1Singapore Dollar 26,064 2.1 Total $ 1,229,725 100.0%
The OPEB Trust Fund’s policy is to disclose any investment denomination in a foreign currency. Exposure to foreign currency risk is limited to the international investment allocation target maximum of 20% of the fair value of the investment portfolio.
As of December 31, 2015, the OPEB Trust investments in international equity mutual funds stated at fair market value are as follows (in thousands of dollars):
Fund Name Fair ValueHarbor International Instl. $ 14,822Artisan International Fund 7,454
$ 22,276
Securities LendingThe Pension Trust Fund lends its securities to broker-dealers and other entities with a simultaneous agreement to return
the collateral for the same securities in the future. The Bank of New York Mellon, the Fund’s master custodian, lends for collateral in the form of cash, irrevocable letters of credit or other securities worth at least 102% of the lent securities’ market value, and international securities for collateral worth at least 105%. The contract with the Fund’s master custodian requires it to indemnify the Fund if the borrowers fail to return the securities (and if the collateral is inadequate to replace the securities lent) or fail to pay the Fund for income distributions by the securities issuers while the securities are out on loan.
All securities loans can be terminated on demand by either the Pension Trust Fund or the borrower, although the average term of the loans is one week. Cash collateral is invested in the lending agent’s short-term investment pool, which at year-end has a weighted average maturity of 4 days.
The relationship between the maturities of the investment pool and the Pension Trust Fund’s loans is affected by the maturities of the securities loans made by other entities that use the agent’s pool, which the Fund cannot determine. The Pension Trust Fund cannot pledge or sell collateral securities without borrower default; as such, the collateral security or non-cash collateral is not reported in the fi nancial statements.
Although the Fund’s securities lending activities are collateralized as described above, they involve both market and
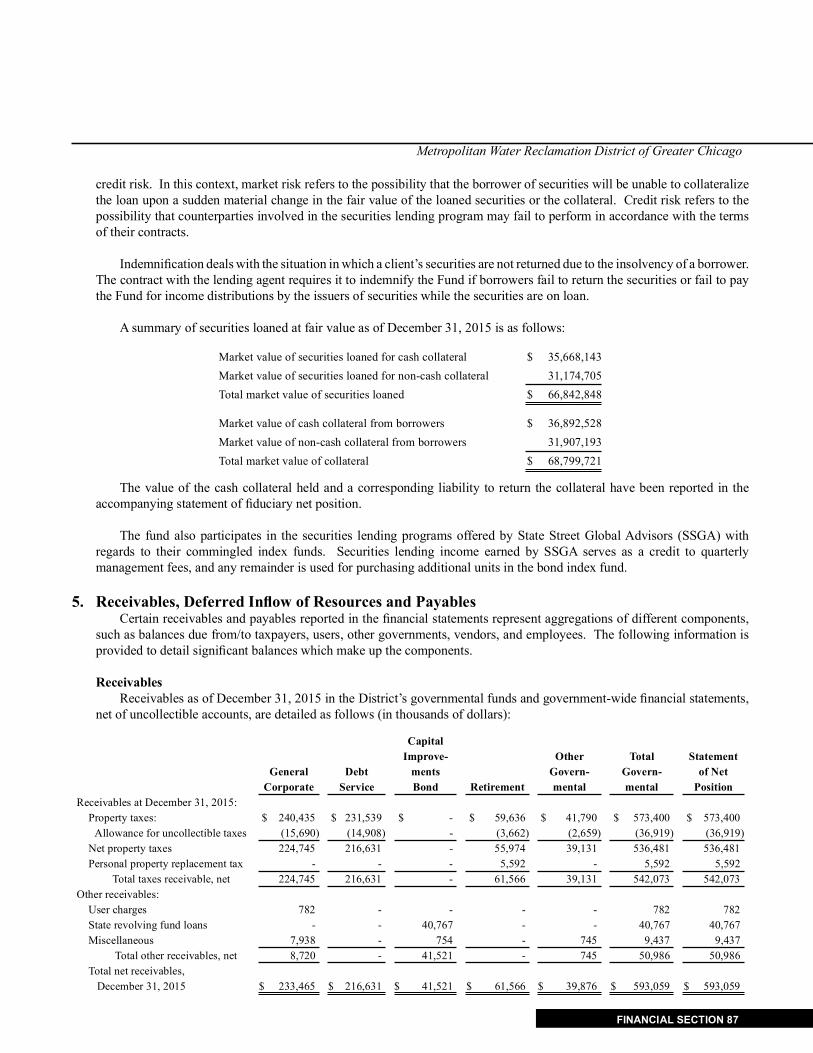
Metropolitan Water Reclamation District of Greater Chicago
FINANCIAL SECTION 87
credit risk. In this context, market risk refers to the possibility that the borrower of securities will be unable to collateralize the loan upon a sudden material change in the fair value of the loaned securities or the collateral. Credit risk refers to the possibility that counterparties involved in the securities lending program may fail to perform in accordance with the terms of their contracts.
Indemnifi cation deals with the situation in which a client’s securities are not returned due to the insolvency of a borrower. The contract with the lending agent requires it to indemnify the Fund if borrowers fail to return the securities or fail to pay the Fund for income distributions by the issuers of securities while the securities are on loan.
A summary of securities loaned at fair value as of December 31, 2015 is as follows:
Market value of securities loaned for cash collateral $ 35,668,143Market value of securities loaned for non-cash collateral 31,174,705Total market value of securities loaned $ 66,842,848
Market value of cash collateral from borrowers $ 36,892,528Market value of non-cash collateral from borrowers 31,907,193Total market value of collateral $ 68,799,721
The value of the cash collateral held and a corresponding liability to return the collateral have been reported in the accompanying statement of fi duciary net position.
The fund also participates in the securities lending programs offered by State Street Global Advisors (SSGA) with regards to their commingled index funds. Securities lending income earned by SSGA serves as a credit to quarterly management fees, and any remainder is used for purchasing additional units in the bond index fund.
5. Receivables, Deferred Infl ow of Resources and PayablesCertain receivables and payables reported in the fi nancial statements represent aggregations of different components,
such as balances due from/to taxpayers, users, other governments, vendors, and employees. The following information is provided to detail signifi cant balances which make up the components.
ReceivablesReceivables as of December 31, 2015 in the District’s governmental funds and government-wide fi nancial statements,
net of uncollectible accounts, are detailed as follows (in thousands of dollars):
CapitalImprove- Other Total Statement
General Debt ments Govern- Govern- of NetCorporate Service Bond Retirement mental mental Position
Receivables at December 31, 2015: Property taxes: $ 240,435 $ 231,539 $ - $ 59,636 $ 41,790 $ 573,400 $ 573,400
Allowance for uncollectible taxes (15,690) (14,908) - (3,662) (2,659) (36,919) (36,919)Net property taxes 224,745 216,631 - 55,974 39,131 536,481 536,481Personal property replacement tax - - - 5,592 - 5,592 5,592
Total taxes receivable, net 224,745 216,631 - 61,566 39,131 542,073 542,073Other receivables:
User charges 782 - - - - 782 782State revolving fund loans - - 40,767 - - 40,767 40,767Miscellaneous 7,938 - 754 - 745 9,437 9,437
Total other receivables, net 8,720 - 41,521 - 745 50,986 50,986Total net receivables, December 31, 2015 $ 233,465 $ 216,631 $ 41,521 $ 61,566 $ 39,876 $ 593,059 $ 593,059

Notes to the Basic Financial StatementsYear ended December 31, 2015
88 FINANCIAL SECTION
The property tax receivable includes a nominal amount that is not expected to be collected within one year of the fi nancial statement date.
Deferred Infl ow of ResourcesUnavailable tax revenue is reported in the Governmental Funds Balance Sheets in connection with receivables for
property taxes that are not considered to be available to liquidate liabilities of the current period. Other unavailable revenue is reported in the Governmental Funds Balance Sheets and the government-wide Statements of Net Position for rental resources that have been received, but not earned. Other unavailable revenue is reported in the Governmental Funds Balance Sheets for the federal subsidy accrual relating to the direct reimbursement for the District’s Build America Bonds. A summary of unavailable revenue as of December 31, 2015 is as follows (in thousands of dollars).
Capital Other Total StatementGeneral Debt Improvements Govern- Govern- Adjust- of Net
Corporate Service Bond Retirement mental mental ments PositionDeferred infl ow of resourcesat December 31, 2015:
Property tax revenue $ 191,372 $ 184,496 $ - $ 47,699 $ 33,331 $ 456,898 $ (456,898) $ -Other amounts:
Grant revenue - - 933 - - 933 (933) -Total deferred revenueat December 31, 2015 $ 191,372 $ 184,496 $ 933 $ 47,699 $ 33,331 $ 457,831 $ (457,831) $ -
PayablesPayables reported as “Accounts payable and other liabilities” at December 31, 2015 in the District’s governmental
funds and government-wide fi nancial statements are detailed as follows (in thousands of dollars):
CapitalImprove- Other Total Statement
General Debt ments Govern- Govern- of NetCorporate Service Bond Retirement mental mental Position
Accounts payable and other liabilities at December 31, 2015:
Vouchers payable and other liabilities $ 25,098 $ - $ 48,760 $ - $ 11,785 $ 85,643 $ 85,643Accrued payroll and withholdings 2,650 - - - - 2,650 2,650Bid deposits 1,067 - - - - 1,067 1,067Unearned revenue 4,222 - - - - 4,222 4,222
Total accounts payable and other liabilities as of December 31, 2015 $ 33,037 $ - $ 48,760 $ - $ 11,785 $ 93,582 $ 93,582

Metropolitan Water Reclamation District of Greater Chicago
FINANCIAL SECTION 89
6. Capital Assets
A summary of the changes in capital assets for the year ended December 31, 2015, are as follows (in thousands of dollars):
Balances BalancesJanuary 1, 2015 Additions Retirements December 31, 2015
Governmental activities:Capital assets not depreciated/amortized:
Land $ 129,458 $ 1,357 $ 242 $ 130,573 Permanent easements 1,330 - - 1,330Construction in progress 829,769 268,671 321,492 776,948Infrastructure under modifi ed approach 4,356,999 309,069 3,548 4,662,520
Total capital assets not depreciated/amortized 5,317,556 579,097 325,282 5,571,371Capital assets depreciated/amortized:
Buildings 13,226 - - 13,226Equipment 58,137 2,749 633 60,253Computer software 6,141 - - 6,141Infrastructure and easements 1,898,383 190 - 1,898,573
Total capital assets being depreciated/amortized 1,975,887 2,939 633 1,978,193Less accumulated depreciation/amortization:
Buildings 5,687 185 - 5,872Equipment 30,431 2,770 536 32,665Computer software 3,893 699 - 4,592Infrastructure and easements 212,991 11,424 - 224,415
Total accumulated depreciation/amortization 253,002 15,078 536 267,544
Total capital assets depreciated/amortized, net 1,722,885 (12,139) 97 1,710,649
Governmental activities capital assets, net $ 7,040,441 $ 566,958 $ 325,379 $ 7,282,020

Notes to the Basic Financial StatementsYear ended December 31, 2015
90 FINANCIAL SECTION
Depreciation and amortization expense in the government-wide Statements of Activities, for the year ended December 31, 2015, was charged to the District’s governmental functions as follows (in thousands of dollars):
Department AmountBoard of Commissioners $ 12 General Administration 172Monitoring and Research 272Procurement and Materials Management 7Human Resources 17Information Technology 105Law 12Finance 9Engineering 1,523Maintenance and Operations 826 Total allocated depreciation 2,955Unallocated infrastructure depreciation 12,123 Total depreciation $ 15,078
7. Pension Plan
Plan DescriptionThe Metropolitan Water Reclamation District Retirement Fund (Pension Trust Fund) is the administrator of a single employer
defi ned benefi t pension plan (Plan) in accordance with 40 ILCS 5 of the Illinois Compiled Statutes. Article 13 of the Illinois Pension code grants the authority to establish the defi ned benefi ts of the Plan, as well as the employer and employee contribution levels of the Plan and may be amended only by the Illinois Legislature. The District contribution is currently calculated in accordance with state statute as to the amount suffi cient to meet the Fund’s actuarially determined contribution requirement, but not to exceed an amount equal to 4.19 times the employee contributions two years prior. For the year ended December 31, 2015, the District’s average contribution rate was 40% of annual payroll. The District’s actual contribution to the Retirement Fund was $71,041,361.
The Pension Trust Fund issues a fi nancial report that includes fi nancial statements and required supplementary information establishing the fi nancial position of the Plan. That report may be obtained by writing to the Metropolitan Water Reclamation District Retirement Fund, 111 E. Erie, Chicago, IL, 60611-2898 or electronically on their website: www. mwrdrf.org.
The Pension Trust Fund provides retirement, death, and disability benefi ts to plan members and benefi ciaries. Pension legislation (Public Act 96-0889) was approved in 2010 and established two tiers of members with different eligibility conditions and benefi t provisions:
Tier 1 – Employees hired before January 1, 2011 are required to contribute 12% of their salary to the Fund Tier 2 – Employees hired on or after January 1, 2011 are required to contribute 9% of their salary to the Fund.
The District is required to contribute the remaining amounts necessary to fi nance the requirements of the Plan on an actuarially funded basis.

Metropolitan Water Reclamation District of Greater Chicago
FINANCIAL SECTION 91
Retirement Eligibility and Benefi ts All full time employees of the District are eligible to participate in the retirement plan.
Tier 1 employees must have at least fi ve years of service at age 60 and include service of 120 days or more per year to receive an undiscounted retirement benefi t. Employees in this tier who reach age 55 (or 50 if hired on or before June 13, 1997) with at least ten years of service are entitled to receive a minimum retirement benefi t; however, if the employee is less than age 60 or service less than 30 years, the normal retirement benefi t is reduced by .5% for each full month the member is less than age 60 or service is less than 30 years, whichever is less. Upon withdrawal from service a Tier 1 employee under age 55 (50 if hired on or before June 13, 1997) or age 55 (50 if hired on or before June 13, 1997) and less than age 60 with less than 20 years of service or age 60 or over with less than 5 year of service, is eligible for a refund of accumulated employee contributions without interest upon request. The retirement benefi t is calculated as 2.2% of the fi nal average salary for each of the fi rst 20 years of service and 2.4% for each year of service in excess of 20 years. The benefi t shall not exceed 80% of fi nal average salary. Tier 1 employees receive a 3% cost of living adjustment annually.
Tier 2 employees must have at least 10 years of service at age 67 to be eligible to receive an undiscounted retirement benefi t. Employees in this tier who reach age 62 with at least ten years of service are entitled to receive a minimum retirement benefi t; however, if the employee is less than age 67, the normal retirement benefi t is reduced by .5% for each full month the member is less than age 67. A Tier 2 employee is eligible for a refund of accumulated employee contributions without interest if under age 62 regardless of service, or if less than 10 years of service regardless of age on withdrawal. The retirement benefi t is calculated as 2.2% of the fi nal average salary for each of the fi rst 20 years of service and 2.4% for each year of service in excess of 20 years. The benefi t shall not exceed 80% of fi nal average salary. Pensionable salary is limited to $111,572 in 2015 for Tier 2 employees. Tier 2 employees receive a cost of living adjustment as the lesser of 3% and half of the CPI-u for the 12 months ending the September 30th prior to the increase date.
If a covered employee leaves employment before the age of 55, accumulated employee contributions are refundable without interest. Upon receipt of a refund, the employee forfeits rights to benefi ts from the fund.
There are two other types of annuities available to family members of the plan: Surviving Spouse Annuity and Children’s Annuity. The spouses of employees hired before June 13, 1997 are immediately eligible to receive a surviving spouse annuity; spouses of employees hired on or after June 13, 1997 are eligible after three years of member’s service. For all Tier1 employees hired before January 1, 2011, the surviving spouse annuity is equal to 60% of the employee’s retirement benefi t at the time of death plus 1% for each year of total service to a maximum of 85%. For Tier 2 employees, an eligible surviving spouse will be entitled to an annuity equal to 66 2/3% of the employee’s retirement benefi t at time of death. Each unmarried child, until the age of 18 (23 if full time student) of an employee that dies in service or of a former member that dies with at least ten years of service, is eligible for a monthly annuity of $500 per month (if one parent is living) and $1,000 per month (if neither parent is living) to a maximum total benefi t of $5,000 per month.
Employees covered At December 31, 2015, the following employees were covered by the benefi t terms:
Inactive EmployeesEmployees or benefi ciaries currently receiving benefi ts 2,359Entitled but not yet receiving benefi ts 130
Active Employees 1,846Total Members 4,335

Notes to the Basic Financial StatementsYear ended December 31, 2015
92 FINANCIAL SECTION
Basis of Accounting The Pension Plan’s fi nancial statements are prepared using the accrual basis of accounting. For purposes of measuring the net pension liability, deferred outfl ows of resources and deferred infl ows of resources related to pensions, and pension expense, information about the fi duciary net position the Pension Plan and additions to/deductions from the Pension Plan’s fi duciary net position have been determined on the same basis as they are reported by the Pension Plan. For this purpose, benefi t payments (including refunds of employee contributions) are recognized when due and payable in accordance with the benefi t terms. Investments are reported at fair value. Detailed information about the pension plan’s fi duciary net position is available in the separately issued Retirement Fund fi nancial report. Page 90 has the information for obtaining those statements.
Net Pension Liability and the Changes in the Net Pension Liability The District’s net pension liability was measured as of December 31, 2014, and the total pension liability used to calculate the net pension liability was determined by an actuarial valuation as of that date. The District implemented GASB 68 and restated December 31, 2014 Net Position for governmental activities. The net pension liability at December 31, 2015 is $947,300,000, which increased from the December 31, 2014 balance of $914,578,000.
Total Pension Plan Fiduciary Net PensionLiability Net Position Liability
Balances at beginning of year Measurement Date $ (2,213,192) $ 1,298,614 $ (914,578)Service Cost (31,602) - (31,602)Interest (163,338) - (163,338)Difference between expected and actual experiences (10,861) - (10,861)Benefi t payments 133,898 (133,898) -Contributions-employer 2014 - 73,906 73,906Contributions-employer 2015 - - -Contributions-employee - 18,975 18,975Net investment income - 81,601 81,601Difference between projected and actual earnings - - -
Current year amortization - - -Administrative expenses - (1,407) (1,407)Other - 4 4
Balances at end of year Measurement Date $ (2,285,095) $ 1,337,795 $ (947,300)
Deferred Outfl ows of Resources and Deferred Infl ows of Resources Related to Pensions At December 31, 2015, the District reported deferred outfl ows of resources and deferred infl ows of resources related to pensions from the following sources (in thousands of dollars):
Deferred Outfl ows of Resources
Deferred Infl owsof Resources
Differences between expected and actual experience $ 9,051 $ -Changes in assumptions - -Net difference between projected and actual
earnings on pension plan investments 11,364 -20,415 -

Metropolitan Water Reclamation District of Greater Chicago
FINANCIAL SECTION 93
Amounts reported as deferred outfl ows of resources and deferred infl ows of resources related to pensions will be recognized in pension expense as follows (in thousands of dollars):
Year ended December 31:2016 $ 4,6512017 4,6512018 4,6512019 4,6512020 1,811
$ 20,415
The Districts contributions to the Retirement Fund subsequent to the measurement date of the net pension liability (December 31, 2014) amounted to $71,041,000 and are reported as deferred outfl ows of resources.
Actuarial Methods and Assumptions The District’s net pension liability was measured as of December 31, 2014, and the total pension liability used to calculate the net pension liability was determined by an actuarial valuation as of that date. The total pension liability in the December 31, 2014 actuarial valuation was determined using the Entry Age Normal actuarial cost method and using the following actuarial assumptions, applied to all periods included in the measurement:
Infl ation 2.50%Salary increases 7.00% to 4.25%Investment Rate of Return 7.50%, net of investment expense, including infl ationCost of living adjustments Tier 1: 3%
Tier 2: the lesser of 3% and half of the CPI-u for the 12 months ending the September 30th prior to the increase dateSurviving spouse annuitants: 1.25%
Mortality rates were based on the RP-2000 Combined Healthy Mortality Tables with generational mortality improvements based on Scale AA. Pre-retirement mortality rates are the same as post-retirement rates.
The actuarial assumptions used in the December 31, 2014 valuation were based on the results of an actuarial experience study for a fi ve year period ending December 31, 2013.
Investment Allocation and Rate of Return The long-term expected rate of return on pension plan investments was determined using a building-block method in which best estimates ranges of expected future real rates of return. These ranges are combined to produce the long term expected rate of return by weighting the expected future real rates of return by the target asset allocation percentage and by adding expected infl ation. The Pension Board’s adopted target asset allocation and best estimates of real rates of return for each major asset class are summarized in the following table:
Asset Class Target AllocationExpected
Real Rate of ReturnDomestic Equity 42% 6.3%International Equity 23% 5.7%Bonds 35% 1.8%

Notes to the Basic Financial StatementsYear ended December 31, 2015
94 FINANCIAL SECTION
The discount rate used to measure the total pension liability was 7.5%. The projection of cash fl ows used to determine the discount rate assumed that plan member contributions will be made at the current contribution rate and that sponsor contributions will be made at rates equal to the difference between actuarially determined contribution rates and the member rate. Based on those assumptions, the pension plan’s fi duciary net position was projected to be available to make all projected future benefi t payments of current plan members; therefore, the long term expected rate of return of 7.5% was applied to all periods of projected benefi t payments to determine the pension liability.
A sensitivity analysis is also completed to show the effect on the net pension liability if the discount rate was plus or minus one percentage point than the current rate (in thousands of dollars):
1% Decrease6.5%
Current DiscountRate of 7.5%
1% Increase8.5%
Net Pension Liability $ 1,217,730 $ 947,300 $ 720,079
Payable to the Pension Plan and Pension Expense At December 31, 2015, the District reported a payable of $71,041,000 for the outstanding amount of contributions to the pension plan required for the year ended December 31, 2015. The pension expense for the year ended December 31, 2015 was $87,145,000.
8. OPEB - Other Post-Employment Benefi ts
Plan DescriptionThe Metropolitan Water Reclamation District Retiree Health Care Trust (OPEB Trust) administers the fi nancing and
payment of other post employment benefi ts for the Metropolitan Water Reclamation District of Greater Chicago. Pursuant to Illinois Statute 70 ILCS 2605/9.6(d), the District adopted the Metropolitan Water Reclamation District Retiree Health Care Plan (Plan) effective December 6, 2007. The purpose of the Plan is to provide postretirement medical and prescription drug coverage benefi ts to retirees as well as spouses and dependents of retirees that fulfi ll certain eligibility requirements. Retirees and annuitants receiving a pension through the Pension Trust Fund are eligible for District sponsored health insurance. As of December 31, 2015 there are 2,775 retirees and benefi ciaries currently receiving health care coverage.
The OPEB Trust Fund issues a fi nancial report that includes fi nancial statements and required supplementary information establishing the fi nancial position of the Plan. That report may be obtained by writing to the Metropolitan Water Reclamation District Retiree Health Care Trust Fund, 100 E. Erie, Chicago, IL, 60611-2898 or electronically on the District’s website: www.mwrd.org.
Basis of Accounting The fi nancial statements of the Trust are prepared using the accrual basis of accounting. Employer contributions to the Trust are recognized when due and the employer has made a formal commitment to provide the contributions. Benefi ts and refunds are recognized when due and payable in accordance with the terms of the Plan.
Contributions The District has not entered into any long-term contracts for contributions to the plan as of the date of this report. State Statute 70 ILCS 2605/9.6d is the legislation establishing the Trust and gives the District Board of Commissioners discretionary authority to determine contribution amounts to be paid by the District. The OPEB Funding Policy includes a target funded ratio of 100% with an expected funding period of 12 years (beginning in 2015). In 2015, $5,000,000 was contributed by the District to the OPEB Trust Fund bringing the total contributed through December 31, 2015 to $117,400,000. In succeeding fi scal years, the Trust will receive the District (employer) contribution as determined by the Board of Commissioners. There is currently no requirement for the District to partially or fully fund the Trust, and any funding is on a voluntary basis. Plan participants do not contribute to the plan other than providing premium contributions as discussed below.

Metropolitan Water Reclamation District of Greater Chicago
FINANCIAL SECTION 95
The District allows employees who retire and meet certain eligibility requirements to continue medical coverage as participants in the Metropolitan Water Reclamation District Retiree Health Care Plan. The plan allows for subsidized health care benefi ts for its retirees. Retirees contribute 35% of the premium and the District pays the remaining 65%. Each year for the next six years, retiree contributions will rise by 2.5% until the premium reaches 50%. Annually, the Board approves an appropriation to fund retiree medical costs as part of the Human Resources Department, General Corporate Fund budget. The amount of OPEB expenditure recognized during 2015 by the District was $18,317,000, all claims paid (net of participant contributions).
Annual OPEB Cost and Net OPEB ObligationThe following OPEB cost and net OPEB obligation was determined for the year ended December 31, 2015 (in
thousands of dollars).
Annual required contribution (ARC) $ 12,472Interest on net OPEB obligation 2,053Adjustment to annual required contribution (1,616)Annual OPEB cost 12,909Contributions made (18,317)Increase (decrease) in net OPEB obligation (5,408)Net OPEB obligation beginning of year 30,409Net OPEB obligation end of year $ 25,001
Funding Status and ProgressThe funding status of the plan as of the most recent actuarial valuation date is as follows (in thousands of dollars):
Actuarial Actuarial Unfunded UAALActuarial Value Accrued Liability AAL/ Funded Covered as a Percentage of
Period Valuation of Assets (AAL)-Entry Age (UAAL) Ratio Payroll Covered PayrollEnded Date (a) (b) (b-a) (a/b) (c) ((b-a)/c)
12/31/2015 12/31/2015 $ 149,329 $ 286,646 $ 137,317 52.1% $ 176,757 77.7%
Actuarial Methods and AssumptionsActuarial valuations of an ongoing plan involve estimates of the value of reported amounts and assumptions about
the probability of occurrence of events far into the future. Examples include assumptions about future employment, mortality, and the health care cost trend. Actuarially determined amounts are subject to continual revision as actual results are compared with past expectations and new estimates are made about the future. The schedule of funding progress, presented as required supplementary information following the notes to the fi nancial statements, compares whether the actuarial values of plan assets are increasing or decreasing over time relative to the actuarial accrued liabilities for benefi ts.
The accompanying schedules of employer contributions present trend information about the amounts actually contributed to the plan by employers in comparison to the Annual Required Contribution (ARC), an amount that is actuarially determined in accordance with the parameters of GASB Statement 45, “Accounting and Financial Reporting by Employers for Postemployment Benefi ts Other Than Pensions”. The ARC represents a level of funding that, if paid on an ongoing basis, is projected to cover normal cost for each year and amortize any unfunded actuarial liabilities (or funding excess) over a period not to exceed thirty years.
Projections of benefi ts for fi nancial reporting purposes are based on the substantive plan (the plan as understood by the employer and plan members) and include the types of benefi ts provided at the time of each valuation and the historical pattern of sharing of benefi t costs between the employer and plan members to that point. The actuarial methods and

Notes to the Basic Financial StatementsYear ended December 31, 2015
96 FINANCIAL SECTION
assumptions used include techniques that are designed to reduce the effects of short-term volatility in actuarial accrued liabilities and the actuarial value of assets, consistent with the long-term perspective of the calculations.
The annual required contribution for the current year actuarial valuation using the entry age normal actuarial cost method and the level percentage of payroll amortization method. Additional assumptions are summarized in the following table:
Valuation date December 31, 2015Actuarial cost method Entry Age NormalAmortization method and period 30 years, open, level percentage of payrollAsset valuation method Fair market valueDiscount rate 6.75% Infl ation Rate 3.00%Health care cost trend rates 8.0% Initial rate, 4.5% Ultimate rate, 2021 Ultimate YearAnnual projected payroll growth rate 3.60%
Trend InformationThe OPEB annual required contribution, percentage of annual required contributions contributed and net OPEB
obligation for the year ending December 31, 2015, are presented below (in thousands of dollars):
Schedule of Employer Contributions
Annual OPEB Percentage Net OPEBPeriod Ended Cost Contributed Obligation
12/31/2015 $ 12,909 141.9% $ 25,00112/31/2014 14,268 236.3 30,40912/31/2013 14,268 237.1 49,858
9. Commitments and Rebatable Arbitrage Earnings
The General Corporate Fund has existing purchase order encumbrances of $2,190,239 at December 31, 2015. Construction, Stormwater Management, and Capital Improvements Bond Funds’ contract commitments (encumbrances) were $490,845,261 at December 31, 2015. State Revolving Fund Loan commitments of $152,090,821 at December 31, 2015, are also collectible as contract expenditures are incurred.
The Internal Revenue Code requires that an issuer of tax-exempt bonds rebate to the United States any excess investment earnings made with the gross proceeds of an issue over the amount which would have been earned had such proceeds been invested at a rate equal to the yield on the issue. The Internal Revenue Code offers certain “safe harbors” permitting qualifi ed governments to keep extra earnings that result from arbitrage. The District has made a determination of their probable liability for amounts potentially due to the United States government. As of December 31, 2015, the District has no arbitrage rebate liability.
The District participated in a rulemaking before the Illinois Pollution Control Board involving a Use Attainability Analysis (UAA)(Docket R08-9) that sought to upgrade the recreational and aquatic uses, and criteria protective of those uses, for the Chicago Area Waterway System (CAWS). In connection with the rulemaking, the District agreed to add disinfection processes at its O’Brien and Calumet water reclamation plants. The cost of the capital improvements to add the disinfection processes is approximately $93 million. The Calumet WRP’s disinfection facilities have been operational since July 2015. Disinfection facilities at the O’Brien WRP have been operational since February 2016. At this time, the District is not required to disinfect the effl uent discharged from its Stickney WRP. The rulemaking has now been concluded.

Metropolitan Water Reclamation District of Greater Chicago
FINANCIAL SECTION 97
National Pollutant Discharge Elimination SystemNPDES Permits. The District operates its water reclamation plants (the “WRPs”) in accordance with National
Pollutant Discharge Elimination System (“NPDES”) permits issued by the IEPA. The NPDES permits for the Stickney, Calumet and O’Brien WRPs expired in 2007 and the District timely reapplied for renewal.
After an extended public comment period, the IEPA issued renewed permits in December 2013. These permits included phosphorous limits of 1.0 mg/L at all three plants.
Several non-governmental organizations (“NGOs”) fi led a third party appeal of the NPDES permits for all three plants arguing that the 1.0 mg/L phosphorous limit was insuffi cient to meet water quality standards. The IPCB disposed of the case via summary judgment, but this ruling was recently overturned by the Illinois Court of Appeals. The Court of Appeals has remanded the case back to the IPCB, which must now rule on the factual evidence in the record.
While the District is in the midst of an overall phosphorous and nitrogen removal program, if the NGOs prevail in this case and the IPCB requires the IEPA to reduce the phosphorous limit, the costs for such reduction are estimated to be substantial. See “ENVIRONMENTAL MATTERS National Pollutant Discharge Elimination System – NPDES Suit (Citizen Suit Litigation)” below.
NPDES Consent Decree. The District’s NPDES permits, in addition to controlling discharges from the WRPs, also impose conditions upon combined sewer system overfl ows (the “CSOs”). In compliance with the NPDES permits, the District’s TARP was developed as a long term control plan to control CSOs. The USEPA alleged that discharges from the District’s CSOs have and continue to violate certain permit requirements, including the prohibition on discharging pollutants into waters that cause or contribute to violations of applicable water quality standards for dissolved oxygen, solids, and fl oatables. IEPA joined the USEPA in alleging the stated water quality violations. Entities with combined sewer systems that allegedly are in violation of applicable water quality standards are subject to an enforceable schedule for the implementation of a long term control plan, with “enforceable” requiring a judgment or a consent decree entered in a federal district court.
In December 2011, the USEPA and IEPA fi led a lawsuit against the District for the alleged violations, and lodged a consent decree negotiated between the USEPA, IEPA and the District. The case is captioned United States of America and State of Illinois v. Metropolitan Water Reclamation District of Greater Chicago, 11 CV 08859. Without an admission of liability, the consent decree resolved the federal and state claims associated with the District’s CSOs. The consent decree, among other things: (a) establishes a construction schedule with interim milestones for completion and operation of portions of the District’s TARP plan; (b) obligates the District to advance funds to the U.S. Army Corps of Engineers (the “Corps”) for portions of the District’s TARP for which the Corps is responsible should federal funds be unavailable to the Corps by the stated deadlines; (c) establishes performance criteria and develops post-construction monitoring for portions of the TARP system; (d) requires the District to continue seasonal operation of debris boats and pontoon boats to control fl oatables in the CAWS; (e) requires the District to submit annual reports on its compliance with the terms of the consent decree; (f) imposes stipulated penalties for violations of the decree; (g) imposes a total civil penalty of $675,000, which the District has already paid; (h) requires the District to implement one or more green infrastructure projects within one year for a minimum of $325,000, which the District has done; and (i) to implement additional green infrastructure projects staggered over the next 15 years that provide a minimum of 10 million gallons of design retention capacity in an individual storm.
In August 2012, the Natural Resources Defense Council, Inc., Sierra Club, Inc., Prairie Rivers Network, Alliance for the Great Lakes and Environmental Law and Policy Center (“Intervenors”) were granted leave to intervene in the litigation. Intervenors opposed entry of the decree. On January 6, 2014, the United States District Court for the Northern District of Illinois (“District Court”) entered the consent decree, and the Intervenors appealed. On July 9, 2015, the United States Court of Appeals for the Seventh Circuit issued its opinion captioned United States of America and State of Illinois v. Metropolitan Water Reclamation District of Greater Chicago, et al., 14-1776 & 14-1777 affi rming the District court, thereby ending the litigation. The Court retained jurisdiction to enforce the terms of the decree.

Notes to the Basic Financial StatementsYear ended December 31, 2015
98 FINANCIAL SECTION
NPDES Citizen Suit. In May 2011, the Natural Resources Defense Council, Sierra Club, and Prairie Rivers Network (the “NGOS”) fi led a Clean Water Act (“CWA”) citizen suit against the District in the District Court alleging violations of CWA-based water quality standards. The complaint in Count I alleges that the District’s CSO discharges into the CAWS violated certain conditions of the District’s NPDES permits. Due to the duplicative nature between the relief sought and the subject of the District’s approved Consent Decree, the parties have agreed to hold Count I in abeyance; the parties expect that Count I will ultimately be dismissed. The complaint in Count II alleges that the District’s discharge of phosphorous from its three largest WRPs indirectly cause violations of narrative standards and water quality standards contained in the District’s NPDES permits for those three WRPs.
The NGOS are seeking a permanent injunction preventing the alleged violations of the CWA, an order requiring the District to complete all actions necessary to comply with its permits and CWA, and an award of civil penalties as well as attorney’s fees. An adverse ruling could result in signifi cant costs and expenses to the District. Furthermore, if the District were required to reduce the phosphorus in its effl uent at its three major WRPs, to a level more stringent than the existing 1.0 mg/l phosphorus effl uent limit, the District could be obligated to incur substantial capital costs and increased ongoing operational expenses. The character and magnitude of any such capital costs would be materially different depending on the stringency of any standard that may be imposed by the court. The District is vigorously defending this lawsuit and denies that the NGOS are entitled to the relief sought. The court recently denied both parties motions for summary judgment and set the case for trial in early 2017.
The District has previously been and is presently a party to several proposed class action lawsuits in the Circuit Court of Cook County arising out of local sewer back-ups and basement fl ooding. The District is also in receipt of a number of fl ooding claims in which lawsuits have not yet been fi led. The lawsuits and claims are generally brought in tort, or for constitutional or statutory violations. As of the date of this Offi cial Statement, the Circuit Court of Cook County and the Illinois Appellate Court for the First District have ruled in the District’s favor in every fully-adjudicated matter. A constitutional question is currently on appeal to the Illinois Supreme Court and other cases remain pending in the Circuit Court of Cook County Illinois Chancery Division.
The District will continue to vigorously contest liability in each of these matters.
10. Risk Management and Claims
The District is primarily self-insured for the “working layer” of losses and purchases excess insurance to assist in the response to catastrophic claims. Under the “Reserve Claim Fund” the District may levy an annual property tax not to exceed .005% of the equalized assessed valuation of taxable property within the District’s territorial limits. The Reserve Claim Fund can be used for the payment of claims, awards, losses, judgments, liabilities, settlements, or demands and associated attorney’s fees and costs that might be imposed on or incurred by such sanitary district in matters including, but not limited to, the Workers’ Compensation Act or the Workers’ Occupational Diseases Act, any claim in tort, any claim of deprivation of any constitutional or statutory right or protection, for all expenses, fees, and costs, both direct and in support of any property owned by such sanitary district which is damaged by fi re, fl ood, explosion, vandalism or any other peril, natural or man made. The aggregate amount that may accumulate in the Reserve Claim Fund cannot exceed .05% of the equalized assessed valuation. The Reserve Claim Fund accounts are included in the General Corporate Fund as described in Note 1.b to the fi nancial statements.
From time to time, the District may be involved in various litigation relating to claims arising from general liability, property damage, automobile liability, personal injury, employment practices, marine liability, and public offi cials liability. The majority of these claims and judgments would be covered by insurance or paid from the Reserve Claim Fund accounts.
The District may be involved in various litigation relating to claims arising from construction contracts. Construction related liability claims can typically be tendered to the Contractor for defense and indemnifi cation. Most other claims and judgments involving disputed construction contracts would be paid by the Capital Improvements Bond or Construction Funds.

Metropolitan Water Reclamation District of Greater Chicago
FINANCIAL SECTION 99
The District may be also involved in various litigation for claims relating to environmental regulations. Under current environmental protection laws, the District may be ultimately responsible for the environmental remediation of some of its leased-out properties. The District has developed a preliminary estimate of environmental remediation costs for major lease sites. The range of such estimated costs at December 31, 2015, is between $27.5 million and $42.4 million. The District is of the opinion that the tenants (except for those who are bankrupt, out of business, or otherwise fi nancially unable to perform) would ultimately be liable for the bulk, if not all, of these site clean-up costs. Negotiations are ongoing between the District’s lawyers and the tenants to resolve remedial activity and cost liability issues. The current estimated cost was determined to be $33,575,000 with an estimated cost recoverable amount of $22,150,000 resulting in $11,425,000 being recognized at December 31, 2015 in the liabilities of the government-wide fi nancial statements. Of this amount, $2,000,000 is classifi ed as a short-term liability and the remaining $9,425,000 is considered a long-term liability. These estimates are subject to changes as a result of price increases, changes in technology and new laws and regulations. These estimates were generated using the expected cash fl ows technique. GASB Statement No. 49 addresses accounting and fi nancial reporting standards for pollution (including contamination) remediation obligations, which are obligations to address the current or potential detrimental effects of existing pollution by participating in pollution remediation activities such as site assessments and cleanups. The scope of the document excludes pollution prevention or control obligations with respect to current operations, and future pollution remediation activities that are required upon retirement of an asset.
The District provides health insurance benefi ts to employees through a fully insured health maintenance organization and a self-insured comprehensive indemnity/PPO plan. The District provides dental insurance benefi ts through a fully insured dental maintenance organization and a self-insured dental indemnity plan. The District does not purchase stop-loss insurance for its self-insured comprehensive indemnity/PPO plan. The District provides life insurance benefi ts for active employees through an insured life insurance program.
Additional insurance policies in effect at December 31, 2015, are listed below. There were no reductions in insurance coverage from the prior year. Settled claims have not exceeded this coverage in any of the past three fi scal years. The current insurance coverage and risk retention related to these policies is as follows:
Marine Liability Aggregate ....................................................................................................$10,000,000 Deductible ..........................................................................................................$10,000 Workers’ Compensation Per Occurrence..................................................................................................Statutory Deductible......................................................................................................$2,000,000 Excess Liability Aggregate.....................................................................................................$50,000,000 Deductible......................................................................................................$1,000,000 Deductible - Flood Class Action ...................................................................$5,000,000 Deductible - Employers Liability...................................................................$2,000,000 Government Crime Forgery or Alteration Per Occurrence .................................................................................................$750,000 Deductible ..........................................................................................................$50,000 Employee Theft (including Faithful Performance) Per Occurrence ..............................................................................................$6,000,000 Deductible ........................................................................................................$100,000 Computer Fraud Per Occurrence ..............................................................................................$6,000,000 Deductible ........................................................................................................$100,000 Funds Transfer Fraud Per Occurrence ..............................................................................................$6,000,000 Deductible ........................................................................................................$100,000

Notes to the Basic Financial StatementsYear ended December 31, 2015
100 FINANCIAL SECTION
Property Insurance Per Occurrence .......................................................................................$1,500,000,000 Deductible .....................................................................................................$1,000,000 Earth Movement Per Occurrence ..........................................................................................$250,000,000 Deductible .....................................................................................................$1,000,000 Flood and Water Damage Per Occurrence ..........................................................................................$250,000,000 Deductible .....................................................................................................$1,000,000 Flood and Water Damage - Lockport Powerhouse Per Occurrence ..........................................................................................$200,000,000 Deductible .....................................................................................................$1,000,000 Group Travel Accident Aggregate Limit ..........................................................................................$10,000,000 Accidental Death Per Employee (5 times salary up to this maximum) ........................................$500,000 Accidental Dismemberment, Paralysis and other Coverages Per Loss ..................................................................................................% per Schedule Pension & Welfare Fiduciary Liability Aggregate ......................................................................................................$5,000,000 Self-Insured Retention........................................................................................$10,000 Group Term Life (basic) Per Employee .....................................................................................................$20,000
The following changes in claims liabilities for the past two years have been calculated and include claims reported but not settled as well as those incurred but not reported in the government-wide fi nancial statements (in thousands of dollars):
2015 2014Claims Payable at January 1 $ 35,668 $ 77,996Claims incurred 5,903 44,988Changes in prior years’ claims estimate 17,902 (42,328)Claim payments (5,903) (44,988)Claims Payable at December 31 $ 53,570 $ 35,668

Metropolitan Water Reclamation District of Greater Chicago
FINANCIAL SECTION 101
11. Long-Term Debt
The following is a summary of general long-term liability activity of the District for the year ended December 31, 2015 (in thousands of dollars):
Balance Balance Due January 1, December 31, Within
2015 Additions Reductions 2015 One YearGovernmental long-term liabilities:Bonds and notes payable:
General obligation debt $ 1,816,796 $ 295,805 $ (128,795) $ 1,983,806 $ 49,630Converted bond anticipation notes 605,824 111,964 (46,229) 671,559 50,682Bond anticipation notes 90,460 183,201 (111,964) 161,697 - Total bonds & notes payable 2,513,080 590,970 (286,988) 2,817,062 100,312
Other Bond Cost:Premium 78,165 48,529 (11,271) 115,423 8,051
Net bonds and notes payable 2,591,245 639,499 (298,259) 2,932,485 108,363Other liabilities:
Claims and judgments 35,668 23,805 (5,903) 53,570 10,271Compensated absences 27,564 54 (2,465) 25,153 2,563Capital lease (note 14) 45,653 - (2,248) 43,405 2,358OPEB obligation (note 8) 30,409 - (5,408) 25,001 -Net pension liability, (note 7) as restated 914,578 355,311 (322,589) 947,300 - Total governmental long-term liabilities $ 3,645,117 $ 1,018,669 $ (636,872) $ 4,026,914 $ 123,555
Liabilities for the Bonds and Bond Anticipation Notes are paid from the Debt Service Fund. Liabilities for Compensated Absences are primarily paid from the General Corporate and Stormwater Management Funds. Most claims resulting from construction projects are paid from either the Capital Improvements Bond or the Construction Funds, while all other claims are paid from the Reserve Claim Fund accounts in the General Corporate Fund.

Notes to the Basic Financial StatementsYear ended December 31, 2015
102 FINANCIAL SECTION
As of December 31, 2015, the annual debt service requirements for general obligation bonds are shown below(in thousands of dollars):
Bonds Payable Maturity Table
Capital Improvement& Alternate Revenue State Revolving
Bond Series Refunding Funds Series(0.891-5.720%) (2.00-5.035%) (0.0-2.905%)(Issued 07/06 (Issued 05/06 (Issued 06/96 Total Total
Maturing to 12/14) to 12/14) to 07/15) Principal Interest2016 $ 28,775 $ 20,855 $ 50,682 $ 100,312 $ 115,7352017 23,310 29,380 50,673 103,363 112,4172018 29,450 26,000 47,987 103,437 108,8752019 22,410 33,070 46,784 102,264 105,2002020 13,740 35,530 44,435 93,705 101,550
2021-2025 82,360 194,050 213,753 490,163 457,0932026-2030 132,265 232,425 157,819 522,509 365,1742031-2035 366,470 240,470 59,427 666,367 239,5162036-2040 391,785 - - 391,785 69,8652041-2044 81,460 - - 81,460 10,431
$ 1,172,025 $ 811,780 $ 671,560 $ 2,655,365 $ 1,685,856
Expenditures for principal and interest made on January 1, 2016 approximated $25,426,000 and $6,306,000, respectively.
2015 Bond Issues In January 2015, the District issued $100,000,000 of Taxable General Obligation Capital Improvement Bonds, Unlimited Tax Series A (Green Bonds), with maturity dates from 2039 to 2044. The bonds were issued at a premium of $14,440,000. Interest accrues on the bonds at a rate of 5.0%, payable on December 1 and June 1.
In January 2015, the District issued $50,000,000 of Taxable General Obligation Bonds, (Alternate Revenue Source), Unlimited Tax Series B (Green Bonds), with maturity dates from 2016 to 2044. The bonds were issued at a premium of $7,720,129. Interest accrues on the bonds at rates ranging from 2.0% to 5.0%, payable on December 1 and June 1.
The $50.0 million 2014 Tax Series B bonds (Green Bonds) proceeds will be used to fund a portion of the Stormwater Management Program projects. The pledge of the Stormwater Water Fund tax levy will remain until the fi nal maturity in December 2044. The District has covenanted in the Series 2014B Bond Ordinance to provide for, collect, and apply such Stormwater Management Tax Receipts to the payment of the 2014B Bonds and the provision of not less than an additional .25 times the annual debt service on the 2014B bonds. The amount of pledges remaining at December 31, 2015 is $98,844,900 as shown below (in thousands of dollars).
Issue
Pledged Revenue Collected
Debt Service Principal
Expenditures Interest Total
2014 Tax Series B (Green Bonds) $ 2,124 $ 50,000 $ 44,845 $ 94,845
In January 2015, the District issued $75,000,000 of Taxable General Obligation Capital Improvement Bonds, Limited Tax Series C (Green Bonds), with maturity dates from 2016 to 2028. The bonds were issued at a premium of $14,022,875. Interest accrues on the bonds at rates ranging from 2.0% to 5.0%, payable on December 1 and June 1.

Metropolitan Water Reclamation District of Greater Chicago
FINANCIAL SECTION 103
In January 2015, the District issued $70,805,000 in General Obligation Refunding Bonds, Limited Tax Series D, with maturity dates from 2016 to 2022. The bonds were issued at a premium of $12,346,220. Interest accrues on the bonds at rates ranging from 2.0% to 5.0%, payable on December 1 and June 1. The bonds were issued to refund $76,050,000 of outstanding principal amount, plus accrued interest, of July 2006 Limited Tax Series.
2011 Bond Issues In July 2011, the District issued $30,000,000 of Taxable General Obligation Capital Improvement Bonds, Limited Tax Series A, with maturity dates from 2013 to 2016. Interest accrues on the bonds at rates ranging from 0.891% to 2.229%, payable December 1 and June 1.
In July 2011, the District issued $270,000,000 of General Obligation Capital Improvement Bonds, Limited Tax Series B, with maturity dates from 2017 to 2032. The bonds were issued at a premium of $27,686,556. Interest accrues on the bonds at rates ranging from 3.0% to 5.0%, payable December 1 and June 1.
In July 2011, the District issued $100,000,000 of General Obligation Capital Improvement Bonds, Unlimited Tax Series C, with maturity dates from 2013 to 2031. The bonds were issued at a premium of $9,657,071. Interest accrues on the bonds at rates ranging from 3.0% to 5.0%, payable December 1 and June 1.
2009 Bond Issues In August 2009, the District issued $600,000,000 in taxable General Obligation Capital Improvement Bonds, Limited Tax Series of August 2009 (Build America Bonds – Direct Payment). The bonds have an interest rate of 5.72%, payable on December 1 and June 1, and mature on December 1, 2038. The bonds are subject to mandatory sinking fund redemption on December 1 in years 2033 through 2038. The Build America Bonds (BAB) program was authorized as part of the American Recovery and Reinvestment Act of 2009 and includes a subsidy of 35% of interest cost to be paid to the District by the U.S. Treasury for the life of the bonds. The federal subsidy reduces the effective interest rate on the bonds to 3.72%. Sequestration may reduce the subsidy received from the U.S. Treasury in future years.
2007 Bond Issues In March 2007, the District issued $188,315,000 in fi xed rate General Obligation Refunding Bonds, Unlimited Tax Series A, at a premium of $16,775,789. The bonds have interest rates from 4.00 to 5.00%, payable on December 1 and June 1, and maturity dates from 2014 to 2022.
In March 2007, the District issued $91,845,000 in General Obligation Refunding Bonds, Unlimited Tax Series B, at a premium of $17,462,417 and $101,860,000 in General Obligation Refunding Bonds, Limited Tax Series C, at a premium of $18,859,718. Both series have an interest rate of 5.25%, payable on December 1 and June 1, and maturity dates from 2025 to 2035.
The 2007 Unlimited Tax Series A Bonds were issued to refund $146,000,000 of outstanding principal amount, plus accrued interest, of 2002 Limited Tax Series E and $57,900,000 of outstanding principal amount, plus accrued interest, of 2002 Unlimited Tax Series C.
The 2007 Unlimited Tax Series B Bonds were issued to refund $100,000,000 of outstanding principal, plus accrued interest, of 2006 Unlimited Tax Series. The 2008 Limited Tax Series C Bonds were issued to refund the $110,435,000 of outstanding principal, plus accrued interest, of 2006 Limited Tax Series.
2006 Bond IssuesIn May 2006, the District issued $346,600,000 in General Obligation Refunding Bonds, Unlimited Tax Series, at a
premium of $11,652,662, and $50,790,000 in General Obligation Refunding Bonds, Limited Tax Series, at a premium of $1,674,942. Both series have an interest rate of 5.00%, payable on December 1 and June 1, and maturity dates from 2023 to 2031.

Notes to the Basic Financial StatementsYear ended December 31, 2015
104 FINANCIAL SECTION
The Unlimited Tax Series Bonds were issued to refund the $363,000,000 outstanding principal amount of Variable Rate General Obligation Refunding Bonds, Unlimited Tax Series A, issued June 2002. The Limited Tax Series Bonds were issued to refund the $53,000,000 outstanding principal amount of Variable Rate General Obligation Refunding Bonds, Limited Tax Series B, issued June 2002.
In July 2006, the District issued $250,000,000 of General Obligation Capital Improvement Bonds, Limited Tax Series, with maturity dates from 2010 to 2033. The bonds were issued at a premium of $9,323,100. Interest accrues on the bonds at a rate of 5.0%, payable December 1 and June 1. An amount of $110,435,000 of these bonds was due to mature in the years 2027 to 2033, which was refunded in March 2007. An amount of $76,050,000 of these bonds was due to mature in the years 2017 to 2022, which was refunded in January 2015.
Capital Improvement Bonds, IEPA SeriesThe District has adopted bond ordinances authorizing issuance of its general obligation bonds to the Illinois
Environmental Protection Agency (IEPA). The most recent such authorization was pursuant to a bond ordinance adopted in calendar year 2014 in the amount of $425,000,000 for Capital Improvement Bonds, 2014 IEPA Series. The IEPA approves various capital improvements related to sewage treatment works and fl ood control facilities for funding from the State Water Pollution Control Revolving Loan Fund (SRF). Once a project has been approved, the State offers the District a loan from the RLF, which the District incorporates into the form of the bond which is issued to the IEPA (the Loan/Bond). When work on the project begins, the District pays the contractor. The District receives from the IEPA a corresponding amount of advance on the Loan/Bond. This form of loan is commonly referred to as a drawdown loan. The advances continue on the Loan/Bond until the project is completed or the amount of the loan fully advances, whichever occurs fi rst. In general, within two years of the fi rst advance on a Loan/Bond, the IEPA promulgates a repayment schedule on such Loan/Bond. The repayment schedules call for level payments of principal and interest, collectively, over a 20 year period beginning within six months of the date the repayment schedule is promulgated. Under this authority, the IEPA has approved the following loan amount:
2015 ................................................................... ............. $ 54,600,0002014................................................................................... $ 83,600,0002013....................................................................................$ 17,400,000
In 2012, the District authorized the issuance of $ 300,000,000 of Capital Improvement Bonds, 2012 IEPA Series, for capital improvements related to sewage treatment works and fl ood control facilities. The terms and conditions are similar to the 2014 IEPA Series. Under this authority, the IEPA has subsequently approved the following loan amounts. Under this authority, the IEPA has subsequently approved the following loan amounts:
2015.................................................................................... $ 13,700,0002014................................................................................... $ 61,900,0002013.................................................................................... $194,900,0002012.................................................................................... $ 15,000,000
State Revolving Fund (SRF) Loan proceeds of $181,537,000 are recognized as “other fi nancing sources” in the Capital Improvements Bond Fund. The amount recognized is based upon reimbursable expenditures incurred during the fi scal year. The amount recognized as SRF proceeds is also recognized as a long-term liability in the government-wide Statements of Net Position.
The District refi nances bond anticipation notes through the issuance of its Capital Improvement Bonds in the amount of the bond anticipation notes, plus accrued interest. As a result, there is no debt service required until these notes are converted into bonds. The District has accrued principal of $181,537,000 and interest of $1,663,000 through the balance sheet date on bond anticipation notes resulting in the total increase to long-term debt of $183,200,000.
The converted bond anticipation notes, a reduction of long-term debt, for $111,964,000 in 2015 represented the sum of converted bond anticipation note principal of $110,859,000 and interest in the amount of $1,105,000.

Metropolitan Water Reclamation District of Greater Chicago
FINANCIAL SECTION 105
2015 Bond Issues and adjustments to existing issues under the IEPA 2004, 2009, and 2012 authority, included:
• July 2015 – The District issued $2,365,000 of Capital Improvement Bonds - IEPA Series 04A, through the conversion of the sum of bond anticipation note principal of $2,339,000 and interest of $26,000 with maturity dates from January 1, 2016 to July 1, 2027. Interest on the bonds accrues at a rate of 2.5%, payable January 1 and July 1.
• July 2015 – The District issued $9,002,000 of Capital Improvement Bonds - IEPA Series 09D, through the conversion of the sum of bond anticipation note principal of $8,875,000 and interest of $127,000 with maturity dates from January 1, 2016 to July 1, 2033. Interest on the bonds accrues at a rate of 2.295%, payable January 1 and July 1.
• July 2015 – The District issued $42,000 of Capital Improvement Bonds – IEPA Series 09H, through the conversion of bond anticipation note principal of $42,000 with maturity dates from January 1, 2016 to January 1, 2031. Terms of the loan agreement provide for the forgiveness of all accrued interest. Payments of principal are made on January 1 and July 1.
• July 2015 – The District issued $807,000 of Capital Improvement Bonds - IEPA Series 12A, through the conversion of the sum of bond anticipation note principal of $793,000 and interest of $14,000 with maturity dates from January 1, 2016 to January 1, 2034. Interest on the bonds accrues at a rate of 2.295%, payable January 1 and July 1.
• July 2015 – The District issued $840,000 of Capital Improvement Bonds - IEPA Series 12B, through the conversion of the sum of bond anticipation note principal of $826,000 and interest of $14,000 with maturity dates from January 1, 2016 to January 1, 2034. Interest on the bonds accrues at a rate of 2.295%, payable January 1 and July 1.
• July 2015 – The District issued $26,910,000 of Capital Improvement Bonds - IEPA Series 12D, through the conversion of the sum of bond anticipation note principal of $26,600,000 and interest of $310,000 with maturity dates from January 1, 2016 to July 1, 2035. Interest on the bonds accrues at a rate of 1.93%, payable January 1 and July 1.
• July 2015 – The District issued $5,343,000 of Capital Improvement Bonds - IEPA Series 12E, through the conversion of the sum of bond anticipation note principal of $5,308,000 and interest of $35,000 with maturity dates from January 1, 2016 to January 1, 2035. Interest on the bonds accrues at a rate of 1.93%, payable January 1 and July 1.
• July 2015 – The District issued $33,670,000 of Capital Improvement Bonds - IEPA Series 12F, through the conversion of the sum of bond anticipation note principal of $33,388,000 and interest of $282,000 with maturity dates from January 1, 2016 to July 1, 2035. Interest on the bonds accrues at a rate of 1.93%, payable January 1 and July 1.
• July 2015 – The District issued $18,835,000 of Capital Improvement Bonds - IEPA Series 12H, through the conversion of the sum of bond anticipation note principal of $18,645,000 and interest of $190,000 with maturity dates from January 1, 2016 to July 1, 2035. Interest on the bonds accrues at a rate of 1.93%, payable January 1 and July 1.
• July 2015 – The District issued $2,189,000 of Capital Improvement Bonds - IEPA Series 12J, through the conversion of the sum of bond anticipation note principal of $2,172,000 and interest of $17,000 with maturity dates from January 1, 2016 to January 1, 2035. Interest on the bonds accrues at a rate of 1.995%, payable January 1 and July 1.

Notes to the Basic Financial StatementsYear ended December 31, 2015
106 FINANCIAL SECTION
• July 2015 – The District issued $10,168,000 of Capital Improvement Bonds - IEPA Series 12K, through the conversion of the sum of bond anticipation note principal of $10,093,000 and interest of $75,000 with maturity
dates from January 1, 2016 to July 1, 2035. Interest on the bonds accrues at a rate of 1.995%, payable January 1 and July 1.
• July 2015 – The District issued $1,793,000 of Capital Improvement Bonds - IEPA Series 12O, through the conversion of the sum of bond anticipation note principal of $1,778,000 and interest of $15,000 with maturity dates from January 1, 2016 to July 1, 2035. Interest on the bonds accrues at a rate of 1.995%, payable January 1 and July 1.
Beginning in 1991, the District’s Board of Commissioners adopted ordinances providing for the issuance of bond anticipation notes. The bond anticipation notes are issued exclusively to cover interim project loan advances from the Illinois Environmental Protection Agency. Principal and interest liabilities related to the bond anticipation notes were $161,696,000 at December 31, 2015. Of the bond anticipation notes outstanding at December 31, 2015, $2,303,000 will be fi nanced through IEPA Series 2009 bonds, $153,673,000 will be fi nanced through IEPA Series 2012 bonds, and the remaining $5,720,000 will be fi nanced through IEPA series 2014 bonds. None of these outstanding bond anticipation notes are expected to be repaid within the next calendar year; therefore, the notes are reported as part of long-term debt.
Refunding Transactions In prior years, the District defeased certain obligations and other bonds by placing the proceeds of new bonds and
additional cash in trust to provide for all future debt service requirements of the refunded debt. Accordingly, the trust account assets and the liability for the refunded bonds are not included in the accompanying fi nancial statements, as the District defeased its obligation for payment of the refunded bonded debt upon completion of the refunding transactions. Bonds outstanding in the amount of $300,809,000 were considered defeased at December 31, 2015. In 2015, a deposit of $82,906,000 was made to an escrow agent for the partial advanced refunding of the 2006 general obligation capital improvement bonds, with a net carrying value of $79,752,000, for a loss on refunding of $3,154,000. The new debt has a par value of $70,805,000 and a premium of $12,346,000. The District completed the refunding to reduce its total debt service payments over the next eight years by $6,695,000 resulting in an economic gain of $6,081,000.
12. Interfund Transactions
The interfund receivable and payable balances at the end of the year are reported as “due from/to other funds” in the Governmental Funds Balance Sheets and are eliminated in the government-wide Statements of Net Position. The balances represent payroll transactions paid from the General Corporate Fund that are later reimbursed by other funds. Also, any temporary cash overdrafts are reclassifi ed as interfund receivable/payable balances at the end of the year in the fund balance sheet. Interfund balances are generally repaid within a year of the fi scal year end.
Individual interfund receivable and payable balances at December 31, 2015 are as follows (in thousands of dollars):
Interfund Receivables Payables
General Corporate Fund $ 77 $ - Capital Projects Funds:
Stormwater Management Fund (Nonmajor Fund) - 77 $ 77 $ 77
In addition to the previous table, amounts were due from the Primary Government to the Pension Trust Fund of $13,867,000 at December 31, 2015 that represented earned but uncollected property taxes in the Retirement Fund and the government-wide Statements of Net Position.

Metropolitan Water Reclamation District of Greater Chicago
FINANCIAL SECTION 107
Transfers between funds as authorized in the budget are recorded as “other fi nancing sources (uses)” in the fund operating statements. Transfers are eliminated in the government-wide Statements of Activities.
13. Property Tax Extension Limitation Law
Effective March 1, 1995, the Property Tax Extension Limitation Law limits the amount of property taxes the District can extend for years subsequent to 1993. The law limits the District’s increase in aggregate tax levy extension to 5% of the previous year or to the percentage increase in the consumer price index, whichever is less. The limitation does not apply to the District’s Debt Service and Stormwater Management Fund levies. In addition, the individual tax levies of the Corporate, Construction, Reserve Claim, Corporate Working Cash, and Construction Working Cash Funds have statutory limitations. The Corporate levy cannot exceed .41% of the equalized assessed valuation, while the Construction levy cannot exceed .10% of the equalized assessed valuation and the Corporate Working Cash and Construction Working Cash levies individually cannot exceed .005% of the equalized assessed valuation. The Reserve Claim levy cannot exceed .005% of the equalized assessed valuation and the aggregate amount which may accumulate in the Reserve Claim Fund shall not exceed .05% of the equalized assessed valuation. The Stormwater Management Fund levy cannot exceed .05% of the equalized assessed valuation as a result of statutory changes.
14. Leases
Capital LeaseIn December 2000, the Board of Commissioners authorized the District to enter into a long-term contract with an
engineering fi rm to design, build, fi nance, own, operate, and maintain a 150 dry ton per day biosolids processing facility at the District’s Central (Stickney) Water Reclamation Plant, and benefi cially use the fi nal product for a period of twenty years.
The cost of the biosolids processing facility is considered a capital lease since it will become the property of the District at the end of the contract. The District also has an option to purchase the facility at the end of the fi fth, tenth, and fi fteenth year of operation for the remaining principal portion of the debt. Total payments for the capital lease are estimated at $83,123,000 for the full term of the contract, which will be paid from the Capital Improvements Bond Fund. The gross amount of assets acquired under the capital lease is $54,535,000. During 2015, the District incurred expenses of approximately $2,247,000 for principal and $2,142,000 for interest. The contract expires twenty years from the date of commercial operation, which was declared in July 2010.
As of December 31, 2015, the future minimum lease payments for the biosolids facility are shown below (in thousands of dollars):
Capital Lease Payable Maturity Table
MaturingTotal
PrincipalTotal
InterestTotal
Payments2016 2,358 2,032 4,3902017 2,473 1,916 4,3892018 2,595 1,795 4,3902019 2,722 1,668 4,3902020 2,856 1,534 4,390
2021-2025 16,523 5,425 21,9482026-2029 13,878 1,204 15,082
Total Minimum Lease Payments $ 43,405 $ 15,574 $ 58,979

Notes to the Basic Financial StatementsYear ended December 31, 2015
108 FINANCIAL SECTION
Lease RentalsThe District leases land to governmental and commercial tenants under operating lease agreements for periods of up to
99 years. There were no contingent lease rentals for the period. The commercial leases are considered non-cancellable and the following is a summary of the minimum future rentals for these leases at December 31, 2015, (in thousands of dollars):
2016 $ 10,5672017 10,3222018 10,0392019 9,6572020 9,657
Later Years 239,696Total Minimum Future Rental Income $ 289,938
The cost of the land associated with the commercial leases is $5,458,200. The District does not lease any depreciable assets.
15. Restatement for Implementation of New Accounting Standard
The District’s net position has been restated as of December 31, 2014. The restatement is a result of the implementation of GASB Statement No. 68, “Accounting and Financial Reporting for Pensions – an amendment of GASB Statement No. 27” and GASB Statement No. 71, “Pension Transition for Contributions Made Subsequent to the Measurement Date – an amendment of GASB Statement No. 68”. The restatement is to record the effect of the net pension liability and deferred outfl ows of resources as of the measurement date for the previous year. The effect of the restatement on FY 2014 and the effect of the restatement on the partial summarized information for fi scal year 2013 included with this report is shown below (in thousands of dollars):
Governmental Activities 2014
Governmental Activities 2013
Net position end of year, as previously reported $ 5,228,778 $ 5,164,932Implementation of GASB Statements No. 68 and 71:
Net pension liability (914,578) (916,228)Write-off the net pension obligation 103,350 105,193Deferred outfl ow of resources - pension contributions subsequent to the measurement date 73,906 92,944
Net position end of year, as restated $ 4,491,456 $ 4,446,841
The restatement of beginning net position adjusts the beginning deferred outfl ow of resources for pension contributions made subsequent to the measurement date of the beginning net pension liability. Restatement of the beginning balances for other deferred outfl ows of resources and deferred infl ows of resources related to pensions was not done because it was not practical to determine all such amounts.

Metropolitan Water Reclamation District of Greater Chicago
FINANCIAL SECTION 109
16. Subsequent Events
On April 7, 2016, the District’s Board of Commissioners adopted ordinances authorizing and providing for the issuance of General Obligation Capital Improvement Bonds at a maximum of $500,000,000. The types of bonds and maximum issuance amounts are as follows (in thousands of dollars):
TYPE AMOUNTTax Qualifi ed Energy Conservation Bonds $ 4,000Unlimited Tax Bonds (Alternate Revenue Source) 50,000Limited Tax Capital Improvements 20,000Unlimited Tax Capital Improvements 30,000Limited Tax Refunding 50,000Unlimited Tax Refunding 346,000
$ 500,000
The proceeds of the refunding bonds are intended to refund certain maturities of the District’s outstanding General Obligation Capital Improvement Bonds.
In February 2016, the Board of Commissioners approved an ordinance providing for a full abatement of $3,391,347 for the General Obligation Unlimited Tax Bonds (Alternate Revenue Source) 2014 Series B (Green Bonds). This amount will be refl ected in the District’s fi nancial statements as of December 31, 2015.
On April 19, 2016, the Illinois Department of Revenue issued a statement that a recent tax system modernization initiative resulted in an overpayment of Personal Property Replacement Tax (PPRT) to the taxing districts that receive PPRT. The overpayment made to the District is currently estimated at $4,963,000. The District has reported a liability to the State of Illinois in the Corporate Fund for the subsequent repayment which is to occur over a two-year period commencing in January 2017.

110 FINANCIAL SECTION
Page intentionally left blank

REQUIRED SUPPLEMENTARY INFORMATION (RSI)OTHER THAN MD&A - Unaudited

Required Supplementary Information (RSI) Other than MD&A - UnauditedYear ended December 31, 2015
112 FINANCIAL SECTION
Modifi ed Approach for Eligible Infrastructure Assets The District has elected to use the modifi ed approach to report eligible infrastructure and ancillary assets at its seven water reclamation plants (WRP) and its waterway assets. Each of the seven plants represents a separate network, while the waterway assets represent an eighth network. The eight networks are as follows:
1. Central (Stickney) WRP Basin All systems, subsystems, and components associated with the Central (Stickney) WRP service area (excluding Waterways Network assets).
2. O’Brien WRP Basin All systems, subsystems, and components associated with the O’Brien WRP service area (excluding Waterways Network assets).
3. Calumet WRP Basin All systems, subsystems, and components associated with the Calumet WRP service area (excluding Waterways Network assets and Lemont Network).
4. Egan WRP Basin All systems, subsystems, and components associated with the Egan WRP service area (excluding Waterways Network assets).
5. Kirie WRP Basin All systems, subsystems, and components associated with the Kirie WRP service area (excluding Waterways Network assets).
6. Hanover Park WRP Basin All systems, sub-systems, and components associated with the Hanover Park WRP service area (excluding Waterways Network assets).
7. Lemont WRP Basin All systems, subsystems, and components associated with the Lemont WRP service area (excluding Waterways Network assets).
8. Waterways All waterways under the jurisdiction of the District including the Waterways Control System, Lockport Powerhouse and Controlling Works, Chicago River Controlling Works, Wilmette Pumping Station, all District fl ood control reservoirs and pump stations, sidestream elevated pool aeration stations, instream aeration stations, Melas Park, and Centennial Fountain.
Each of the above networks is further segregated into systems, subsystems, and components. The network systems are classifi ed by the process fl ow through the network (i.e., collection processes, treatment processes, solids processing, fl ood and pollution control, and solids drying/utilization). The subsystems of each system represent the major processes (e.g., the treatment processes system includes fi ne screens, grit tanks, and aeration tanks as subsystems). Components of subsystems comprise the working unit or assembly (e.g., the fi ne screens subsystem includes conveyors, rakes, and gates as components). Ratings are determined by District civil, mechanical, and electrical engineers, who review the subsystem/component maintenance records and physically inspect the assets.

Metropolitan Water Reclamation District of Greater Chicago
FINANCIAL SECTION 113
Ratings are assessed at the subsystem level and are compiled for reporting purposes into one rating for each system of a network. The assessment scale used to rate the networks’ systems is as follows:
Asset Condition Assessment Description
(1) Excellent Relatively new asset or recently rehabilitated or otherwise restored to a like-new asset condition.
(2) Very Good Performance successful, operation reliable, no signifi cant maintenance required beyond routine preventative maintenance or minor repair in foreseeable future.
(3) Good Performance successful, operation reliable, signifi cant maintenance required in foreseeable future.
(4) Acceptable Performance successful, operation reliable, signifi cant rehabilitation/replacement planned in near future.
(5) Fair Performance marginal, operation not reliable without immediate repair/replacement.
(6) Poor Inoperable or operation signifi cantly impaired.
It is the District’s policy to maintain eligible infrastructure assets reported under the modifi ed approach at a level of acceptable or better.
Initial condition assessments of the Kirie, Hanover, Egan, O’Brien, Central (Stickney), Calumet, Lemont and Waterways WRP networks were completed between 2002 and 2006.
Condition assessments of each network will continue at least every three years following the initial assessment. The Egan and O’Brien networks were re-assessed in 2013, the Kirie, Central (Stickney), and Waterways networks were re-assessed in 2014, and the Hanover, Calumet, and Lemont networks were re-assessed in 2015.
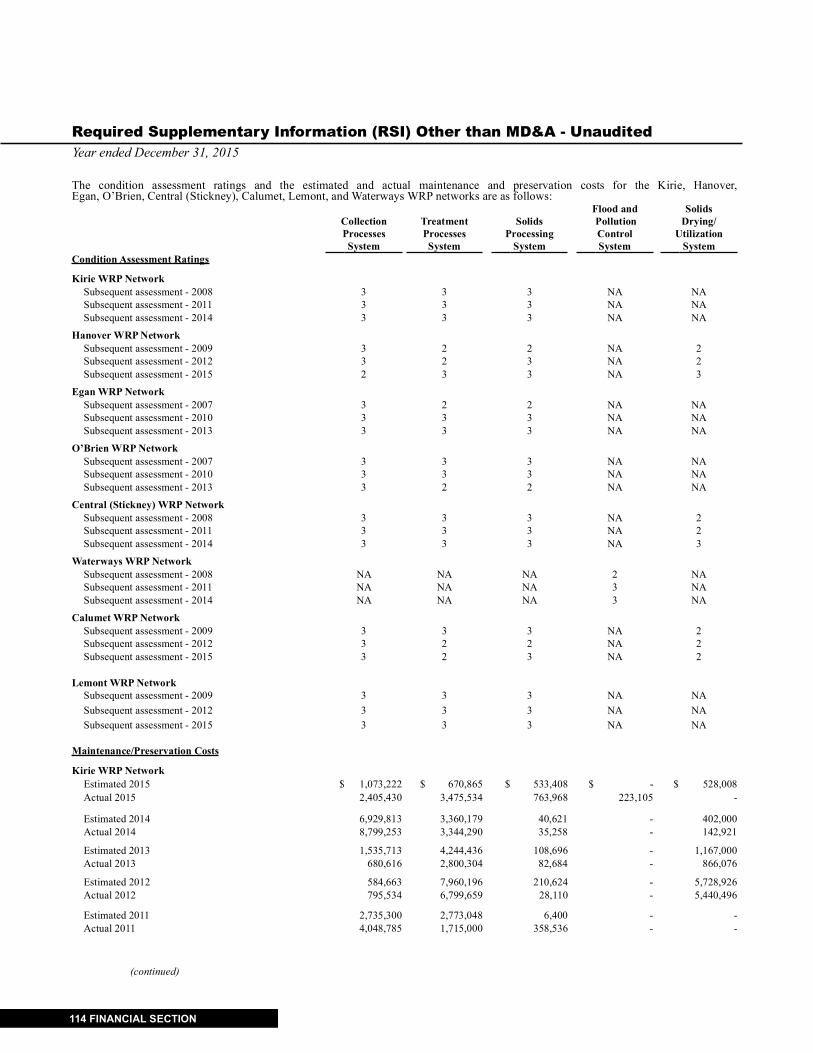
Required Supplementary Information (RSI) Other than MD&A - UnauditedYear ended December 31, 2015
114 FINANCIAL SECTION
The condition assessment ratings and the estimated and actual maintenance and preservation costs for the Kirie, Hanover, Egan, O’Brien, Central (Stickney), Calumet, Lemont, and Waterways WRP networks are as follows:
Flood and Solids Collection Treatment Solids Pollution Drying/ Processes Processes Processing Control Utilization
System System System System SystemCondition Assessment Ratings
Kirie WRP NetworkSubsequent assessment - 2008 3 3 3 NA NASubsequent assessment - 2011 3 3 3 NA NASubsequent assessment - 2014 3 3 3 NA NA
Hanover WRP NetworkSubsequent assessment - 2009 3 2 2 NA 2Subsequent assessment - 2012 3 2 3 NA 2Subsequent assessment - 2015 2 3 3 NA 3
Egan WRP NetworkSubsequent assessment - 2007 3 2 2 NA NASubsequent assessment - 2010 3 3 3 NA NASubsequent assessment - 2013 3 3 3 NA NA
O’Brien WRP NetworkSubsequent assessment - 2007 3 3 3 NA NASubsequent assessment - 2010 3 3 3 NA NASubsequent assessment - 2013 3 2 2 NA NA
Central (Stickney) WRP NetworkSubsequent assessment - 2008 3 3 3 NA 2Subsequent assessment - 2011 3 3 3 NA 2Subsequent assessment - 2014 3 3 3 NA 3
Waterways WRP NetworkSubsequent assessment - 2008 NA NA NA 2 NASubsequent assessment - 2011 NA NA NA 3 NASubsequent assessment - 2014 NA NA NA 3 NA
Calumet WRP NetworkSubsequent assessment - 2009 3 3 3 NA 2Subsequent assessment - 2012 3 2 2 NA 2Subsequent assessment - 2015 3 2 3 NA 2
Lemont WRP NetworkSubsequent assessment - 2009 3 3 3 NA NASubsequent assessment - 2012 3 3 3 NA NASubsequent assessment - 2015 3 3 3 NA NA
Maintenance/Preservation Costs
Kirie WRP NetworkEstimated 2015 $ 1,073,222 $ 670,865 $ 533,408 $ - $ 528,008Actual 2015 2,405,430 3,475,534 763,968 223,105 -
Estimated 2014 6,929,813 3,360,179 40,621 - 402,000Actual 2014 8,799,253 3,344,290 35,258 - 142,921
Estimated 2013 1,535,713 4,244,436 108,696 - 1,167,000Actual 2013 680,616 2,800,304 82,684 - 866,076
Estimated 2012 584,663 7,960,196 210,624 - 5,728,926Actual 2012 795,534 6,799,659 28,110 - 5,440,496
Estimated 2011 2,735,300 2,773,048 6,400 - -Actual 2011 4,048,785 1,715,000 358,536 - -
(continued)

Metropolitan Water Reclamation District of Greater Chicago
FINANCIAL SECTION 115
Flood and Solids Collection Treatment Solids Pollution Drying/ Processes Processes Processing Control Utilization
System System System System SystemHanover WRP Network
Estimated 2015 $ 1,054,822 $ 696,765 $ 519,408 $ - $ 517,408Actual 2015 1,703,347 2,534,283 1,213,150 - 33,479
Estimated 2014 142,317 732,151 674,596 - 65,800Actual 2014 243,960 855,994 543,204 - -
Estimated 2013 155,517 778,851 1,808,221 - 72,400Actual 2013 231,153 1,014,670 1,581,782 - 29,223
Estimated 2012 191,617 797,168 3,345,043 - 28,200Actual 2012 199,915 959,531 567,985 - 28,416
Estimated 2011 170,200 626,223 190,200 - 27,400Actual 2011 233,598 985,072 514,495 - 29,153
Egan WRP NetworkEstimated 2015 $ 1,513,197 $ 4,403,940 $ 3,821,483 $ 610,475 $ -Actual 2015 2,261,452 3,590,430 4,257,420 14,735 -
Estimated 2014 626,241 2,885,084 8,833,464 - - Actual 2014 862,655 3,026,570 5,957,431 - -
Estimated 2013 653,741 4,350,679 2,045,064 - -Actual 2013 865,065 3,744,215 1,758,866 - -
Estimated 2012 785,152 4,419,441 1,206,657 - -Actual 2012 903,678 4,488,430 1,511,647 - -
Estimated 2011 639,479 7,666,487 651,528 1,154,000 -Actual 2011 971,945 4,473,685 1,094,366 1,042,670 -
O’Brien WRP NetworkEstimated 2015 $ 2,771,072 $ 6,201,615 $ 1,501,758 $ 2,740,624 $ -Actual 2015 6,890,505 8,135,664 1,260,479 3,840,355 -
Estimated 2014 5,355,115 7,256,184 537,919 3,061,000 -Actual 2014 5,618,267 8,380,776 432,517 2,732,851 -
Estimated 2013 10,460,115 7,787,840 1,267,919 2,097,000 -Actual 2013 12,046,926 9,530,828 475,148 3,038,583 -
Estimated 2012 3,301,450 4,565,194 383,608 7,236,000 -Actual 2012 4,232,213 5,122,387 541,287 11,924,519 -
Estimated 2011 7,861,157 4,853,642 572,747 41,000 -Actual 2011 9,952,532 6,111,578 438,867 2,243,730 -
Central (Stickney) WRP NetworkEstimated 2015 $ 51,338,722 $ 19,534,565 $ 8,059,908 $ 4,725,000 $ 4,528,808Actual 2015 14,497,119 11,535,580 3,029,722 781,105 964,557
Estimated 2014 15,875,228 17,334,819 10,565,977 - 1,377,507Actual 2014 10,557,770 20,427,807 10,398,973 121,615 2,444,671
Estimated 2013 16,102,533 16,765,601 9,453,922 - 2,027,507Actual 2013 9,431,129 16,923,785 10,563,927 - 1,555,668
Estimated 2012 10,760,149 11,999,337 8,664,888 - 3,566,472Actual 2012 10,777,690 18,585,996 10,922,993 - 3,135,077
Estimated 2011 11,279,737 30,318,366 8,293,784 - 6,667,383Actual 2011 12,033,277 33,694,435 10,937,293 - 5,818,433
(continued)

Required Supplementary Information (RSI) Other than MD&A - UnauditedYear ended December 31, 2015
116 FINANCIAL SECTION
Flood and Solids Collection Treatment Solids Pollution Drying/ Processes Processes Processing Control Utilization
System System System System SystemWaterways WRP Network
Estimated 2015 $ - $ - $ - $ 9,534,574 $ -Actual 2015 - - - 6,365,775 -
Estimated 2014 - - - 1,314,200 -Actual 2014 1,437 - - 831,265 -
Estimated 2013 - - - 1,319,000 -Actual 2013 11,323 - - 1,047,698 -
Estimated 2012 - - - 1,324,200 -Actual 2012 - - - 1,552,914 -
Estimated 2011 15,000 - - 1,635,188 -Actual 2011 8,653 - - 1,177,533 -
Calumet WRP NetworkEstimated 2015 $ 15,532,197 $ 3,612,840 $ 1,904,283 $ 21,221,249 $ 14,000Actual 2015 5,004,441 7,014,378 3,798,937 5,119,450 780,400
Estimated 2014 5,891,856 6,156,523 2,241,157 1,949,900 -Actual 2014 4,295,832 6,741,305 2,366,667 590,908 -
Estimated 2013 6,229,856 6,288,023 2,330,057 915,100 -Actual 2013 3,505,024 5,932,302 2,416,419 734,104 -
Estimated 2012 5,325,141 8,260,407 2,095,308 709,453 -Actual 2012 5,255,239 6,140,875 2,157,252 1,042,053 -
Estimated 2011 7,089,465 10,080,957 3,432,425 5,315,335 -Actual 2011 6,604,037 8,195,502 4,145,249 4,582,004 -
Lemont WRP NetworkEstimated 2015 $ 837,722 $ 443,665 $ - $ - $ -Actual 2015 1,415,229 1,321,857 23,898 - -
Estimated 2014 47,000 34,200 - - -Actual 2014 17,475 417 - - -
Estimated 2013 47,000 34,200 - - -Actual 2013 (4,607) 8,294 - - -
Estimated 2012 48,004 12,404 - - -Actual 2012 25,000 31,200 - - -
Estimated 2011 97,000 34,200 - - -Actual 2011 17,087 7,240 - - -

Metropolitan Water Reclamation District of Greater Chicago
FINANCIAL SECTION 117
Schedule of Changes in the District’s Net Pension Liability And Related Ratios Last Ten Fiscal Years (in thousands of dollars)
2015Total pension liability:Service cost $ 31,602Interest 163,338Changes of benefi t terms -Differences between expected and actual experience 10,861Changes of assumptions -Benefi t payments, including refunds of employee contributions (133,898)Net change in total pension liability 71,903
Total pension liability - beginning 2,213,192Total pension liability - ending 2,285,095
Plan fi duciary net position:
Contributions - employer 73,906Contributions - employee 18,975Net investment income 81,601Benefi t payments, including refunds of employee contributions (133,898)Administrative expense (1,407)Other 4Net change in plan fi duciary net position 39,181
Plan fi duciary net position - beginning 1,298,614Plan fi duciary net position - ending 1,337,795
Net pension liability - ending $ 947,300
Plan fi duciary net position as a percentage of the total pension liability 58.54%
Covered-employee payroll 176,184
Net pension liability as a percentage of covered-employee payroll 537.68%
The District implemented the provisions of GASB 68 in Fiscal Year 2015. The District has presented as many years as are available.

Required Supplementary Information (RSI) Other than MD&A - UnauditedYear ended December 31, 2015
118 FINANCIAL SECTION
Schedule of District ContributionsLast 10 Years(in thousands of dollars)
Actual ContributionsContributions as a in Relation to Percentage of
Actuarially the Actuarially Contribution Covered- Covered-Determined Determined Defi ciency/ employee employee
Year Contributions Contributions (Excess) Payroll Payroll
2015 $ 64,478 $ 73,906 $ (9,428) $ 176,184 41.95%2014 68,414 92,944 (24,530) 169,376 54.87%2013 74,829 65,098 9,731 163,817 39.74%2012 69,393 37,379 32,014 164,275 22.75%2011 61,873 29,918 31,955 174,486 17.15%2010 54,790 32,154 22,636 176,915 18.17%2009 49,758 33,407 16,351 167,865 19.90%2008 47,090 27,947 19,143 158,831 17.60%2007 47,369 34,476 12,893 152,767 22.57%2006 43,165 26,174 16,991 149,246 17.54%
Notes to the Schedule of District Contributions
Valuation Date: The actuarially determined contribution (ADC) is calculated as of December 31, 2013.
Methods and Assumptions used to determine the ADC:Actuarial cost method Entry age normalAmortization method Level percent of pay. Prior to 2013, 30 year open
amortization. From the 2013 ADC calculation, closed to 2050.Remaining amortization period 37 years remaining as of 1/1/14Asset valuation method 5 years smoothed valueInvestment rate of return 7.75%Infl ation 2.50%Salary increases 5.00%Payroll growth 3.70%Termination rates Termination rates are based on the most recent experience analysis
and vary by age and service of member.Mortality rates UP-1994 (-2M, -1F) as of the 2011 ADC calculationRetirement rates Retirement rates are based on the most recent experience analysis and vary by age and service of member. Rates were reduced by 20% as of the 2011 ADC calculation to refl ect actual experience.Disability rates A separate disability rate assumption was added as of the 2013 ADC calculation.
A copy of the Pension Plan CAFR may be obtained by accessing the Metropolitan Water Reclamation District Retirement Fund’s website at www.mwrdrf.org

Metropolitan Water Reclamation District of Greater Chicago
FINANCIAL SECTION 119
Progress in Funding Other Post Employment Trust Funds
The following schedule presents the progress in funding the OPEB Trust Fund over the last three years:
(in thousands of dollars)
Actuarial UAAL as aAccrued Unfunded Percentage of
Actuarial Actuarial Liability AAL/ Funded Covered CoveredPeriod Valuation Value (AAL) (UAAL) Ratio Payroll PayrollEnded Date of Assets (a) Entry Age (b) (b-a) (a/b) (c) ((b-a)/c)
12/31/2015 12/31/2015 $ 149,329 $ 286,646 $ 137,317 52.10% $ 176,757 77.69%12/31/2013 12/31/2013 120,883 260,364 139,481 46.43% 164,005 85.05%12/31/2011 12/31/2011 54,996 394,676 339,680 13.93% 162,853 208.58%
Actuarial valuations are required to be completed every two years. The most recent actuarial valuation was completed as of December 31, 2015.
A copy of the OPEB Trust Fund CAFR may be obtained by accessing the District’s website at www.mwrd.org

120 FINANCIAL SECTION
Page intentionally left blank

OTHER SUPPLEMENTARY INFORMATION
COMBINING AND INDIVIDUAL FUND STATEMENTS AND SCHEDULES
NON-MAJOR GOVERNMENTAL FUNDS
CONSTRUCTION FUND
Fund established to account for proceeds of annual property tax levies and certain other revenues used for the acquisition of long-term assets used in principal functions of the District.
STORMWATER MANAGEMENT FUND
Fund established to account for the annual property taxes which are specifi cally levied to fi nance all activities associated with stormwater management, including construction projects.

Exhibit B-1Combining Balance Sheets - Nonmajor Governmental Funds
122 FINANCIAL SECTION
December 31, 2015(with comparative amounts for prior year)
(in thousands of dollars)
Stormwater Total Nonmajor Construction Fund Management Fund Governmental Funds2015 2014 2015 2014 2015 2014
AssetsCash $ 4,561 $ 747 $ 2,781 $ 2,497 $ 7,342 $ 3,244Certifi cates of deposit - 800 502 1,001 502 1,801Investments 21,843 29,997 28,462 41,558 50,305 71,555Taxes receivable, net 15,923 16,791 23,208 20,265 39,131 37,056Other receivable 745 745 - - 745 745
Total assets $ 43,072 $ 49,080 $ 54,953 $ 65,321 $ 98,025 $ 114,401
Liabilities, Deferred Infl ows of Resources and Fund Balances
Liabilities:Accounts payable and other liabilities $ 4,812 $ 6,648 $ 6,973 $ 5,689 $ 11,785 $ 12,337Due to other funds - - 77 52 77 52
Total liabilities 4,812 6,648 7,050 5,741 11,862 12,389Deferred infl ows of resources:
Unavailable tax revenue 13,554 14,283 19,777 17,206 33,331 31,489Total deferred infl ows of resources 13,554 14,283 19,777 17,206 33,331 31,489
Fund balances:Restricted for:
Working Cash 21,947 21,833 37,216 37,035 59,163 58,868Capital projects 2,759 6,316 - 5,339 2,759 11,655
Unassigned - - (9,090) - (9,090) -Total fund balances 24,706 28,149 28,126 42,374 52,832 70,523Total liabilities, deferred infl ows, and fund balances $ 43,072 $ 49,080 $ 54,953 $ 65,321 $ 98,025 $ 114,401

FINANCIAL SECTION 123
Exhibit B-2Combining Statements of Revenues, Expenditures and Changes in Fund Balances - Nonmajor Governmental FundsYear ended December 31, 2015(with comparative amounts for prior year)
(in thousands of dollars) Stormwater Total Nonmajor
Construction Fund Management Fund Governmental Funds2015 2014 2015 2014 2015 2014
Revenues Revenues:
Property taxes $ 16,617 $ 11,831 $ 20,745 $ 20,073 $ 37,362 $ 31,904 Interest on investments 332 564 349 703 681 1,267 Fees, forfeits and penalties 1,218 1,491 - 6 1,218 1,497 User charge 300 300 - - 300 300 Claims and damage settlements 32 1 - - 32 1 Miscellaneous - - 1 135 1 135
Total revenues 18,499 14,187 21,095 20,917 39,594 35,104
Expenditures Current Operations:
Construction costs 21,942 22,754 33,219 27,393 55,161 50,147 Total expenditures 21,942 22,754 33,219 27,393 55,161 50,147
Revenues over (under) expenditures (3,443) (8,567) (12,124) (6,476) (15,567) (15,043)
Other fi nancing sources (uses): Transfer out to Debt Service Fund - - (2,124) - (2,124) - Transfer out to Retirement Fund - - - (1,000) - (1,000)
Total other fi nancing sources (uses) - - (2,124) (1,000) (2,124) (1,000)Revenues over (under) expenditures and other fi nancing uses (3,443) (8,567) (14,248) (7,476) (17,691) (16,043)
Fund balances Beginning of the year 28,149 36,716 42,374 49,850 70,523 86,566 End of the year $ 24,706 $ 28,149 $ 28,126 $ 42,374 $ 52,832 $ 70,523

124 FINANCIAL SECTION
Page intentionally left blank

GENERAL CORPORATE FUND
A fund used to account for an annual property tax levy and certain other revenues, which are to be used for the operations and payments of general expenditures of the District not specifi cally chargeable to other funds.
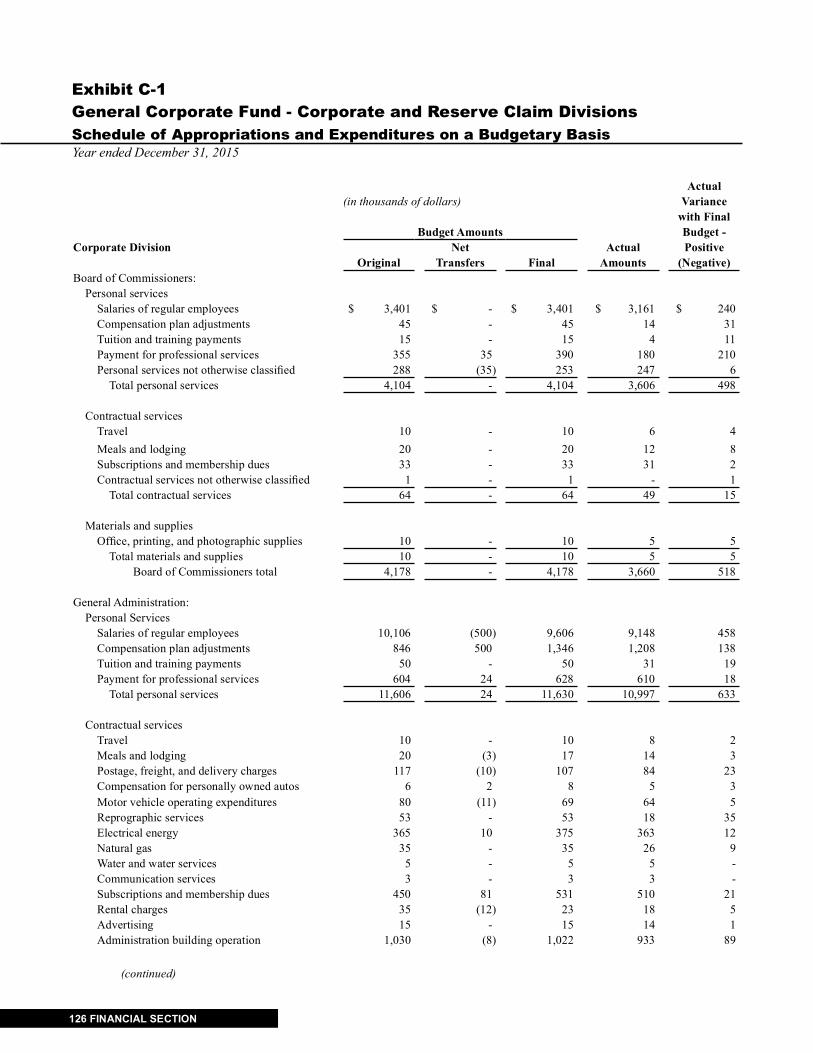
Exhibit C-1General Corporate Fund - Corporate and Reserve Claim DivisionsSchedule of Appropriations and Expenditures on a Budgetary BasisYear ended December 31, 2015
126 FINANCIAL SECTION
Actual(in thousands of dollars) Variance
with FinalBudget Amounts Budget -
Corporate Division Net Actual PositiveOriginal Transfers Final Amounts (Negative)
Board of Commissioners:Personal services
Salaries of regular employees $ 3,401 $ - $ 3,401 $ 3,161 $ 240Compensation plan adjustments 45 - 45 14 31Tuition and training payments 15 - 15 4 11Payment for professional services 355 35 390 180 210Personal services not otherwise classifi ed 288 (35) 253 247 6
Total personal services 4,104 - 4,104 3,606 498
Contractual servicesTravel 10 - 10 6 4Meals and lodging 20 - 20 12 8Subscriptions and membership dues 33 - 33 31 2Contractual services not otherwise classifi ed 1 - 1 - 1
Total contractual services 64 - 64 49 15
Materials and suppliesOffi ce, printing, and photographic supplies 10 - 10 5 5
Total materials and supplies 10 - 10 5 5Board of Commissioners total 4,178 - 4,178 3,660 518
General Administration: Personal Services
Salaries of regular employees 10,106 (500) 9,606 9,148 458Compensation plan adjustments 846 500 1,346 1,208 138Tuition and training payments 50 - 50 31 19Payment for professional services 604 24 628 610 18
Total personal services 11,606 24 11,630 10,997 633
Contractual servicesTravel 10 - 10 8 2Meals and lodging 20 (3) 17 14 3Postage, freight, and delivery charges 117 (10) 107 84 23Compensation for personally owned autos 6 2 8 5 3Motor vehicle operating expenditures 80 (11) 69 64 5Reprographic services 53 - 53 18 35Electrical energy 365 10 375 363 12Natural gas 35 - 35 26 9Water and water services 5 - 5 5 -Communication services 3 - 3 3 -Subscriptions and membership dues 450 81 531 510 21Rental charges 35 (12) 23 18 5Advertising 15 - 15 14 1Administration building operation 1,030 (8) 1,022 933 89
(continued)

Metropolitan Water Reclamation District of Greater Chicago
FINANCIAL SECTION 127
Actual(in thousands of dollars) Variance
with FinalBudget Amounts Budget -
Corporate Division (continued) Net Actual PositiveOriginal Transfers Final Amounts (Negative)
General Administration (continued):Administrative building operation annex $ 750 $ (32) $ 718 $ 655 $ 63Contractual services not otherwise classifi ed 381 (2) 379 238 141Repairs to buildings 242 (36) 206 113 93Repairs to offi ce furniture and equipment 100 - 100 78 22Communication equipment maintenance 16 - 16 16 -Repairs to vehicle equipment 400 42 442 433 9
Total contractual services 4,113 21 4,134 3,598 536
Materials and suppliesElectrical parts and supplies 17 - 17 7 10Plumbing accessories and supplies 18 - 18 14 4Hardware 17 - 17 14 3Vehicle parts and supplies - 9 9 8 1Offi ce, printing, and photographic supplies 145 3 148 109 39Cleaning supplies 2 - 2 1 1Wearing apparel 40 (4) 36 21 15Books, maps, and charts 5 (3) 2 - 2Materials and supplies not otherwise classifi ed 69 - 69 31 38
Total materials and supplies 313 5 318 205 113
Machinery and equipmentMachinery and equipment not otherwise classifi ed 10 (10) - - -
Total machinery and equipment 10 (10) - - -General Administration total 16,042 40 16,082 14,800 1,282
Monitoring and Research:Personal services
Salaries of regular employees 25,239 - 25,239 24,596 643Compensation plan adjustments 929 (34) 895 716 179Salaries of non-budgeted employees - 34 34 28 6Tuition and training payments 50 2 52 50 2Payment for professional services 202 (67) 135 55 80
Total personal services 26,420 (65) 26,355 25,445 910
Contractual services Travel 11 1 12 8 4Meals and lodging 28 8 36 30 6Postage, freight, and delivery charges 7 - 7 5 2Compensation for personally owned autos 45 - 45 28 17Motor vehicle operating services 3 - 3 1 2Reprographic services 1 - 1 1 -Water and water services 1 - 1 - 1
(continued)
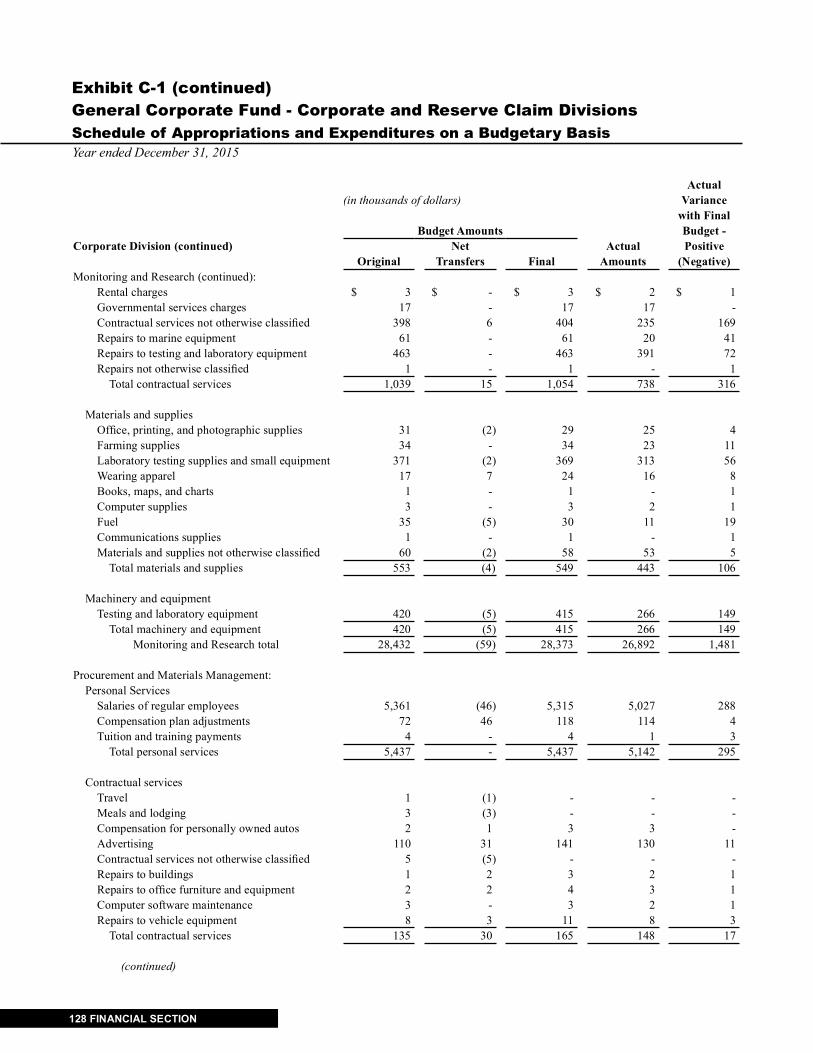
Exhibit C-1 (continued)General Corporate Fund - Corporate and Reserve Claim DivisionsSchedule of Appropriations and Expenditures on a Budgetary BasisYear ended December 31, 2015
128 FINANCIAL SECTION
Actual(in thousands of dollars) Variance
with FinalBudget Amounts Budget -
Corporate Division (continued) Net Actual PositiveOriginal Transfers Final Amounts (Negative)
Monitoring and Research (continued):Rental charges $ 3 $ - $ 3 $ 2 $ 1Governmental services charges 17 - 17 17 -Contractual services not otherwise classifi ed 398 6 404 235 169Repairs to marine equipment 61 - 61 20 41Repairs to testing and laboratory equipment 463 - 463 391 72Repairs not otherwise classifi ed 1 - 1 - 1
Total contractual services 1,039 15 1,054 738 316
Materials and suppliesOffi ce, printing, and photographic supplies 31 (2) 29 25 4Farming supplies 34 - 34 23 11Laboratory testing supplies and small equipment 371 (2) 369 313 56Wearing apparel 17 7 24 16 8Books, maps, and charts 1 - 1 - 1Computer supplies 3 - 3 2 1Fuel 35 (5) 30 11 19Communications supplies 1 - 1 - 1Materials and supplies not otherwise classifi ed 60 (2) 58 53 5
Total materials and supplies 553 (4) 549 443 106
Machinery and equipmentTesting and laboratory equipment 420 (5) 415 266 149
Total machinery and equipment 420 (5) 415 266 149Monitoring and Research total 28,432 (59) 28,373 26,892 1,481
Procurement and Materials Management:Personal Services
Salaries of regular employees 5,361 (46) 5,315 5,027 288Compensation plan adjustments 72 46 118 114 4Tuition and training payments 4 - 4 1 3
Total personal services 5,437 - 5,437 5,142 295
Contractual servicesTravel 1 (1) - - -Meals and lodging 3 (3) - - -Compensation for personally owned autos 2 1 3 3 -Advertising 110 31 141 130 11Contractual services not otherwise classifi ed 5 (5) - - -Repairs to buildings 1 2 3 2 1Repairs to offi ce furniture and equipment 2 2 4 3 1Computer software maintenance 3 - 3 2 1Repairs to vehicle equipment 8 3 11 8 3
Total contractual services 135 30 165 148 17
(continued)

Metropolitan Water Reclamation District of Greater Chicago
FINANCIAL SECTION 129
Actual(in thousands of dollars) Variance
with FinalBudget Amounts Budget -
Corporate Division (continued) Net Actual PositiveOriginal Transfers Final Amounts (Negative)
Procurement and Materials Management (continued):Materials and supplies
Metals $ 121 $ - $ 121 $ 95 $ 26Electrical parts and supplies 311 - 311 310 1Plumbing accessories and supplies 282 (20) 262 216 46Hardware 40 - 40 40 -Buildings, grounds, paving materials, and supplies 104 5 109 108 1Fiber, paper and insulation materials 39 - 39 39 -Paints, solvents, and related materials 39 - 39 39 -Vehicle parts and supplies 10 - 10 10 -Mechanical and repair parts 117 2 119 119 -Offi ce, printing, and photographic supplies 17 9 26 19 7Laboratory testing supplies and small equipment 566 30 596 595 1Cleaning supplies 244 - 244 241 3Tools and supplies 66 - 66 65 1Wearing apparel 118 13 131 131 -Safety and medical supplies 123 (62) 61 60 1Computer supplies 80 - 80 75 5Fuel 369 (68) 301 221 80Gas (in containers) 45 31 76 67 9Communications supplies 10 - 10 8 2Lubricants 239 - 239 238 1Materials and supplies not otherwise classifi ed 53 30 83 79 4
Total materials and supplies 2,993 (30) 2,963 2,775 188
Machinery and equipmentMachinery and equipment not otherwise classifi ed 80 - 80 74 6
Total machinery and equipment 80 - 80 74 6Procurement and Materials Management total 8,645 - 8,645 8,139 506
Human Resources:Personal services
Salaries of regular employees 5,921 - 5,921 5,745 176Compensation plan adjustments 154 (3) 151 149 2Social security and medicare contributions 2,693 - 2,693 2,631 62Salaries of non-budgeted employees - 3 3 2 1Employee claims 60 - 60 38 22Tuition and training payments 668 - 668 510 158Payment for professional services 1,324 - 1,324 1,211 113Health and life insurance premiums 44,526 - 44,526 44,187 339Personal services not otherwise classifi ed 162 - 162 102 60
Total personal services 55,508 - 55,508 54,575 933
(continued)
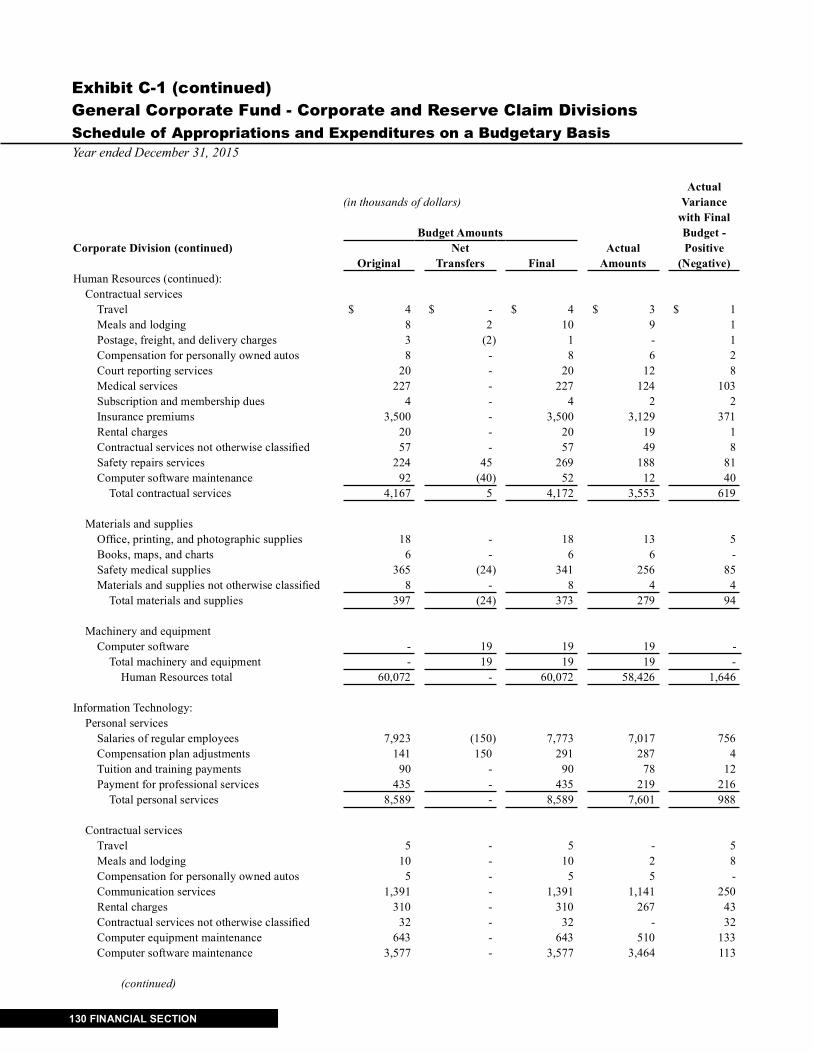
Exhibit C-1 (continued)General Corporate Fund - Corporate and Reserve Claim DivisionsSchedule of Appropriations and Expenditures on a Budgetary BasisYear ended December 31, 2015
130 FINANCIAL SECTION
Actual(in thousands of dollars) Variance
with FinalBudget Amounts Budget -
Corporate Division (continued) Net Actual PositiveOriginal Transfers Final Amounts (Negative)
Human Resources (continued):Contractual services
Travel $ 4 $ - $ 4 $ 3 $ 1Meals and lodging 8 2 10 9 1Postage, freight, and delivery charges 3 (2) 1 - 1Compensation for personally owned autos 8 - 8 6 2Court reporting services 20 - 20 12 8Medical services 227 - 227 124 103Subscription and membership dues 4 - 4 2 2Insurance premiums 3,500 - 3,500 3,129 371Rental charges 20 - 20 19 1Contractual services not otherwise classifi ed 57 - 57 49 8Safety repairs services 224 45 269 188 81Computer software maintenance 92 (40) 52 12 40
Total contractual services 4,167 5 4,172 3,553 619
Materials and suppliesOffi ce, printing, and photographic supplies 18 - 18 13 5Books, maps, and charts 6 - 6 6 -Safety medical supplies 365 (24) 341 256 85Materials and supplies not otherwise classifi ed 8 - 8 4 4
Total materials and supplies 397 (24) 373 279 94
Machinery and equipmentComputer software - 19 19 19 -
Total machinery and equipment - 19 19 19 -Human Resources total 60,072 - 60,072 58,426 1,646
Information Technology:Personal services
Salaries of regular employees 7,923 (150) 7,773 7,017 756Compensation plan adjustments 141 150 291 287 4Tuition and training payments 90 - 90 78 12Payment for professional services 435 - 435 219 216
Total personal services 8,589 - 8,589 7,601 988
Contractual servicesTravel 5 - 5 - 5Meals and lodging 10 - 10 2 8Compensation for personally owned autos 5 - 5 5 -Communication services 1,391 - 1,391 1,141 250Rental charges 310 - 310 267 43Contractual services not otherwise classifi ed 32 - 32 - 32Computer equipment maintenance 643 - 643 510 133Computer software maintenance 3,577 - 3,577 3,464 113
(continued)

Metropolitan Water Reclamation District of Greater Chicago
FINANCIAL SECTION 131
Actual(in thousands of dollars) Variance
with FinalBudget Amounts Budget -
Corporate Division (continued) Net Actual PositiveOriginal Transfers Final Amounts (Negative)
Information Technology (continued):Communication equipment maintenance $ 719 $ - $ 719 $ 652 $ 67
Total contractual services 6,692 - 6,692 6,041 651
Materials and suppliesOffi ce, printing, and photographic supplies 19 5 24 23 1Computer software 253 (8) 245 159 86Computer supplies 838 3 841 546 295Communication supplies 90 - 90 85 5
Total materials and supplies 1,200 - 1,200 813 387
Machinery and equipmentComputer equipment 52 - 52 25 27Computer software 26 - 26 15 11Communication equipment 121 - 121 80 41
Total machinery and equipment 199 - 199 120 79Information Technology total 16,680 - 16,680 14,575 2,105
Law: Personal Services
Salaries of regular employees 4,650 - 4,650 4,456 194Compensation plan adjustments 45 - 45 12 33Tuition and training payments 14 - 14 12 2Payment for professional services 2,067 - 2,067 688 1,379
Total personal services 6,776 - 6,776 5,168 1,608
Contractual servicesTravel 6 - 6 4 2Meals and lodging 9 (1) 8 3 5Postage, freight, and delivery charges 1 1 2 1 1Compensation for personally owned autos 3 - 3 1 2Reprographic services 48 - 48 1 47Court reporting services 50 (5) 45 4 41Contractual services not otherwise classifi ed 77 5 82 79 3
Total contractual services 194 - 194 93 101
Materials and suppliesOffi ce, printing, and photographic supplies 7 - 7 4 3Books, maps, and charts 17 - 17 9 8Materials and supplies not otherwise classifi ed 2 - 2 1 1
Total materials and supplies 26 - 26 14 12
Fixed and other chargesTaxes on real estate 770 - 770 743 27
Total fi xed and other charges 770 - 770 743 27Law total 7,766 - 7,766 6,018 1,748
(continued)

Exhibit C-1 (continued)General Corporate Fund - Corporate and Reserve Claim DivisionsSchedule of Appropriations and Expenditures on a Budgetary BasisYear ended December 31, 2015
132 FINANCIAL SECTION
Actual(in thousands of dollars) Variance
with FinalBudget Amounts Budget -
Corporate Division (continued) Net Actual PositiveOriginal Transfers Final Amounts (Negative)
Finance:Personal services
Salaries of regular employees $ 3,112 $ - $ 3,112 $ 3,008 $ 104Compensation plan adjustments 43 - 43 21 22Tuition and training payments 28 - 28 28 -Payment for professional services 311 - 311 289 22
Total personal services 3,494 - 3,494 3,346 148
Contractual servicesTravel 3 (1) 2 2 -Meals and lodging 5 1 6 6 -Postage, freight, and delivery charges 3 (1) 2 - 2Compensation for personally owned autos - 1 1 1 -Reprographic services 3 - 3 2 1Court reporting services 50 - 50 40 10Contractual services not otherwise classifi ed 1 14 15 13 2Repairs to offi ce furniture and equipment 5 - 5 5 -
Total contractual services 70 14 84 69 15
Materials and suppliesOffi ce, printing, and photographic supplies 8 5 13 10 3Books, maps, and charts 1 - 1 1 -
Total materials and supplies 9 5 14 11 3Finance total 3,573 19 3,592 3,426 166
Engineering:Personal services
Salaries of regular employees 25,560 (272) 25,288 24,340 948Compensation plan adjustments 251 186 437 419 18Tuition and training payments 96 46 142 113 29Payments for professional services 576 (51) 525 454 71Personal service expenditure - preliminary
engineering reports and studies 50 91 141 100 41Total personal services 26,533 - 26,533 25,426 1,107
Contractual servicesTravel 10 - 10 9 1Meals and lodging 20 - 20 19 1Postage, freight, and delivery charges 1 1 2 2 -Compensation for personally owned autos 39 (1) 38 25 13Motor vehicle operating services 1 - 1 - 1Reprographic services 7 - 7 4 3Water and water services 3 - 3 3 -Rental charges 4 - 4 4 -Contractual services not otherwise classifi ed 579 (330) 249 79 170Repairs to waterway facilities 10 - 10 10 -
(continued)

Metropolitan Water Reclamation District of Greater Chicago
FINANCIAL SECTION 133
Actual(in thousands of dollars) Variance
with FinalBudget Amounts Budget -
Corporate Division (continued) Net Actual PositiveOriginal Transfers Final Amounts (Negative)
Engineering (continued):Repairs to testing and laboratory equipment $ 3 $ - $ 3 $ 1 $ 2Repairs not otherwise classifi ed 19 - 19 8 11
Total contractual services 696 (330) 366 164 202
Materials and suppliesOffi ce, printing, and photographic supplies 41 - 41 31 10Wearing apparel 5 - 5 5 -Books, maps, and charts 7 - 7 7 -Materials and supplies not otherwise classifi ed 5 - 5 3 2
Total materials and supplies 58 - 58 46 12
Land - 330 330 326 4Engineering total 27,287 - 27,287 25,962 1,325
Maintenance and Operations:Personal services
Salaries of regular employees 88,484 (1,173) 87,311 83,833 3,478Compensation plan adjustments 4,375 358 4,733 4,643 90Salaries of non-budgeted employees 25 65 90 31 59Tuition and training payments 248 - 248 169 79Payment for professional services 783 150 933 506 427
Total personal services 93,915 (600) 93,315 89,182 4,133
Contractual servicesTravel 63 - 63 11 52Meals and lodging 102 - 102 40 62Compensation for personally owned autos 182 - 182 174 8Motor vehicle operating services 2 - 2 - 2Electrical energy 32,993 601 33,594 34,855 (1,261)Natural gas 2,398 - 2,398 1,963 435Water and water services 1,584 99 1,683 1,660 23Communications services 570 - 570 410 160Testing and inspection services 163 100 263 182 81Rental charges 177 - 177 153 24Governmental service charges 3,283 - 3,283 3,207 76Maintenance of grounds and pavements 1,937 - 1,937 1,541 396Contractual services not otherwise classifi ed 693 - 693 543 150Waste material disposal charges 14,395 (2,358) 12,037 10,355 1,682Farming services 22 8 30 30 -Sludge disposal 5,522 - 5,522 3,604 1,918Repairs to collection facilities 3,249 240 3,489 2,893 596Repairs to waterway facilities 101 - 101 15 86Repairs to process facilities 6,252 485 6,737 5,985 752Repairs to railroads 324 - 324 264 60
(continued)

Exhibit C-1 (continued)General Corporate Fund - Corporate and Reserve Claim DivisionsSchedule of Appropriations and Expenditures on a Budgetary BasisYear ended December 31, 2015
134 FINANCIAL SECTION
Actual(in thousands of dollars) Variance
with FinalBudget Amounts Budget -
Corporate Division (continued) Net Actual PositiveOriginal Transfers Final Amounts (Negative)
Maintenance and Operations (continued):Repairs to buildings $ 1,601 $ - $ 1,601 $ 805 $ 796Repairs to material handling and farm equipment 331 140 471 364 107Safety repairs and services 221 - 221 125 96Repairs to marine equipment 80 - 80 53 27Computer software maintenance 5 - 5 3 2Communication equipment maintenance 40 - 40 - 40Repairs to vehicle equipment 118 - 118 85 33Repairs not otherwise classifi ed 16 - 16 5 11
Total contractual services 76,424 (685) 75,739 69,325 6,414
Materials and suppliesMetals 43 - 43 39 4Electrical parts and supplies 1,426 - 1,426 1,250 176Plumbing accessories and supplies 760 - 760 593 167Hardware 31 - 31 21 10Buildings, grounds, paving materials, and supplies 300 - 300 136 164Fiber, paper and insulation materials 15 - 15 9 6Paints, solvents, and related materials 5 - 5 5 -Vehicle parts and supplies 180 - 180 82 98Mechanical repair parts 2,932 - 2,932 2,107 825Manhole materials 11 - 11 10 1Offi ce, printing, and photographic supplies 57 - 57 50 7Farming supplies 5 - 5 5 -Processing chemicals 8,950 1,253 10,203 7,473 2,730Laboratory testing supplies and small equipment 23 - 23 17 6Cleaning supplies 5 - 5 2 3Tools and supplies 215 - 215 200 15Wearing apparel 3 - 3 2 1Books, maps, and charts 1 - 1 - 1Safety and medical supplies 175 - 175 78 97Computer software 7 - 7 6 1Computer supplies 19 - 19 15 4Fuel 455 - 455 224 231Gas (in containers) 12 - 12 4 8Communication supplies 11 - 11 2 9Lubricants 24 - 24 16 8Materials and supplies not otherwise classifi ed 66 - 66 56 10
Total materials and supplies 15,731 1,253 16,984 12,402 4,582
Machinery and equipmentEquipment for collection facilities 106 4 110 81 29Equipment for process facilities 128 22 150 140 10Material handling and farming equipment - 6 6 5 1
(continued)

Metropolitan Water Reclamation District of Greater Chicago
FINANCIAL SECTION 135
Actual(in thousands of dollars) Variance
with FinalBudget Amounts Budget -
Corporate Division (continued) Net Actual PositiveOriginal Transfers Final Amounts (Negative)
Maintenance and Operations (continued):Testing and laboratory equipment $ 16 $ - $ 16 $ 5 $ 11
Total machinery and equipment 250 32 282 231 51Maintenance and Operations total 186,320 - 186,320 171,140 15,180
Corporate Division TotalTotal all departments:
Personal services $ 242,382 $ (641) $ 241,741 $ 230,488 $ 11,253Contractual services 93,594 (930) 92,664 83,778 8,886Materials and supplies 21,290 1,205 22,495 16,993 5,502Machinery and equipment 959 36 995 710 285Land - 330 330 326 4Fixed and other charges 770 - 770 743 27
Total Corporate Division 358,995 - 358,995 333,038 25,957
Reserve Claim DivisionEmployee claims 10,000 - 10,000 4,100 5,900General claims and emergency repair and
replacement cost over $10,000 20,700 - 20,700 1,791 18,909Total Reserve Claim Division 30,700 - 30,700 5,891 24,809
Total General Corporate Fund $ 389,695 $ - $ 389,695 $ 338,929 $ 50,766

Exhibit C-2General Corporate Fund - Corporate and Reserve Claim DivisionsSchedule of Expenditures by Type - GAAP Basis
136 FINANCIAL SECTION
Year ended December 31, 2015(with comparative amounts for prior year)
(in thousands of dollars) Percent Percent ofIncrease Increase Total
2015 2014 (Decrease) (Decrease) 2015Personal services:
Salaries and wages $ 178,323 $ 174,227 $ 4,096 2 % 52 %Employee health and life insurance premiums 44,187 59,015 (14,828) (25) 13Payment for professional services 4,211 5,469 (1,258) (23) 1Social security and medicare contributions 2,631 2,428 203 8 1Tuition and training payments 998 867 131 15 0Other 138 198 (60) (30) 0
Total personal services 230,488 242,204 (11,716) (5) 67Contractual services:
Electrical energy 35,219 33,477 1,742 5 10Natural gas 1,988 3,706 (1,718) (46) 1Postage, freight, and delivery charges 93 111 (18) (16) 0Waste material disposal charges 10,356 9,007 1,349 15 3Administration building operation 1,588 1,617 (29) (2) 1Communication services 1,553 1,718 (165) (10) 1Farming services 30 24 6 25 0Court reporting services 56 78 (22) (28) 0Water and water services 1,668 1,569 99 6 1Motor vehicle operating services 65 76 (11) (14) 0Employee travel and transportation 433 498 (65) (13) 0Medical services 124 129 (5) (4) 0Rental charges 463 251 212 84 0Maintenance of grounds and pavements 1,540 1,636 (96) (6) 0Governmental service charges 3,223 3,663 (440) (12) 1Repairs to process facilities 5,985 3,675 2,310 63 2Other repairs 10,529 10,720 (191) (2) 3Other contractual services 8,835 9,162 (327) (4) 3
Total contractual services 83,748 81,117 2,631 3 26Materials and supplies:
Processing chemicals 7,473 5,798 1,675 29 2Laboratory testing supplies 959 903 56 6 0Mechanical repair parts 2,557 1,956 601 31 1Fuels and lubricants 762 1,008 (246) (24) 0Electrical parts and supplies 1,805 1,831 (26) (1) 1Plumbing accessories and supplies 841 1,309 (468) (36) 0Offi ce, printing, and photographic supplies 294 398 (104) (26) 0Buildings, grounds, paving materials, and supplies 280 259 21 8 0Cleaning supplies 251 240 11 5 0Metals 140 171 (31) (18) 0Computer supplies 726 799 (73) (9) 0Other materials and supplies 2,871 3,040 (169) (6) 1
Total materials and supplies 18,959 17,712 1,247 7 5(continued)

FINANCIAL SECTION 137
Metropolitan Water Reclamation District of Greater Chicago
(in thousands of dollars) Percent Percent ofIncrease Increase Total
2015 2014 (Decrease) (Decrease) 2015Machinery and equipment:
Testing and laboratory equipment $ 272 $ 461 $ (189) (41) 0Equipment for collection facilities 81 11 70 636 0Computer software 34 82 (48) (59) 0Communication equipment 80 285 (205) (72) 0Other machinery and equipment 223 318 (95) (30) 0
Total machinery and equipment 690 1,157 (467) (40) 0Land: 326 - 326 100 0Fixed other charges:
Taxes on real estate 743 703 40 6 0
Total fi xed other charges 743 703 40 6 0Claims and judgments 5,658 44,988 (39,330) (87) 2
Total expenditures $ 340,612 $ 387,881 $ (47,269) 100 %

138 FINANCIAL SECTION
Page intentionally left blank

DEBT SERVICE FUND
Fund established to account for annual property tax levies and certain other revenues, principally interest on investments, which are used for payments of interest and redemption of general obligation bond is-sues.

Exhibit D-1Debt Service FundSchedule of Revenues, Expenditures, and Changes in Fund Balances Including Comparison of Budget and Actual on Budgetary BasisYear ended December 31, 2015
140 FINANCIAL SECTION
(in thousands of dollars)
Actual Variance
with FinalActual on Budget -
Final Budgetary PositiveBudget Basis (Negative)
Revenues:Property taxes $ 212,000 $ 211,785 $ (215)
Total tax revenue 212,000 211,785 (215)
Interest on investments 1,500 1,039 (461)Miscellaneous - 4 4
Total revenues 213,500 212,828 (672)
Expenditures:Debt service 216,501 214,526 1,975
Revenues over (under) expenditures (3,001) (1,698) 1,303
Other fi nancing sources (uses):Premium on bonds - 12,346 12,346Refunding transaction costs - (241) (241)Sale of refunding bonds - 70,805 70,805Transfer to escrow agent - (82,906) (82,906)Transfers from Stormwater Fund - 2,124 2,124
Total other fi nancing sources (uses) - 2,128 2,128Revenues and Other fi nancing (use)
over (under) expenditures (3,001) 430 3,431
Fund balances at beginning of year 111,128 108,500 (2,628)Fund balances at end of the year $ 108,127 $ 108,930 $ 803
CAPITAL PROJECTS FUNDS
Construction Fund
Fund established to account for proceeds of annual property tax levies and certain other revenues used for the acquisition of long-term assets used in principal functions of the District.
Stormwater Management Fund
Fund established to account for the annual property taxes which are specifi cally levied to fi nance all activi-ties associated with stormwater management, including construction projects.
Capital Improvements Bond Fund
Fund established to account for proceeds of debt, government grants, and certain other revenues used in connection with improvements, replacements, and additions to designated environmental projects.

Exhibit E-1Capital Projects FundsSchedule of Appropriations and Expenditures on Budgetary BasisYear ended December 31, 2015
142 FINANCIAL SECTION
Actual(in thousands of dollars) Variance
with FinalBudget Amounts Budget -
Net Actual PositiveOriginal Transfers Final Amounts (Negative)
Construction Fund:Personal services
Payment for professional services $ 3,759 $ 111 $ 3,870 $ 2,252 $ 1,618Preliminary engineering reports and studies 543 (29) 514 425 89Construction drawings, specifi cations, and cost estimates 3,489 - 3,489 - 3,489Post-award engineering for construction projects 192 (72) 120 120 -
Total personal services 7,983 10 7,993 2,797 5,196
Contractual servicesTesting and inspection services 10 - 10 1 9Court reporting services 5 - 5 - 5Soil and rock mechanics investigation 40 - 40 - 40Contractual services not otherwise classifi ed 400 (100) 300 152 148Repairs to collection facilities 515 - 515 487 28Other contractual services 625 100 725 201 524
Total contractual services 1,595 - 1,595 841 754
Materials and suppliesVehicle parts and supplies 50 (25) 25 - 25Mechanical repair parts 2,624 - 2,624 1,777 847Lab testing supplies, small equipment, and chemicals 20 - 20 19 1Computer supplies 200 (200) - - -
Total materials and supplies 2,894 (225) 2,669 1,796 873
Machinery and equipmentEquipment for waterway facilities 120 182 302 119 183Equipment for process facilities 1,045 1,500 2,545 1,373 1,172Marine equipment 266 (266) - - -Computer equipment 534 200 734 731 3Computer software 40 - 40 - 40Vehicle equipment 1,429 (343) 1,086 493 593Machinery and equipment not otherwise classifi ed 746 (56) 690 409 281
Total machinery and equipment 4,180 1,217 5,397 3,125 2,272
Capital ProjectsCollection facilities structures 740 (222) 518 302 216Process facility structures 3,891 276 4,167 3,010 1,157Buildings 3,573 1,161 4,734 3,368 1,366Capital projects not otherwise classifi ed 1,831 (1,355) 476 - 476Preservation of collection facility structures 1,064 437 1,501 806 695
(continued)

Metropolitan Water Reclamation District of Greater Chicago
FINANCIAL SECTION 143
Actual(in thousands of dollars) Variance
with FinalBudget Amounts Budget -
Net Actual PositiveOriginal Transfers Final Amounts (Negative)
Construction Fund (continued):Capital Projects (continued)
Preservation of waterway facility structures $ 562 $ (62) $ 500 $ - $ 500Preservation of process facility structures 7,996 (1,562) 6,434 4,978 1,456Preservation of buildings 1,272 - 1,272 779 493Preservation capital projects not otherwise classifi ed 330 4 334 101 233
Total capital projects 21,259 (1,323) 19,936 13,344 6,592
Land - 321 321 - 321
Construction Fund Summary: Personal services 7,983 10 7,993 2,797 5,196Contractual services 1,595 - 1,595 841 754Materials and supplies 2,894 (225) 2,669 1,796 873Machinery and equipment 4,180 1,217 5,397 3,125 2,272Capital projects 21,259 (1,323) 19,936 13,344 6,592Land - 321 321 - 321
Construction Fund total 37,911 - 37,911 21,903 16,008
Stormwater Management Fund:Personal services
Salaries of regular employees 5,506 - 5,506 5,134 372Compensation plan adjustments 163 - 163 101 62Tuition and training payments 10 - 10 2 8Payment for professional services 275 (40) 235 10 225Health and life insurance 578 - 578 522 56Preliminary engineering reports and studies 10,348 1,996 12,344 7,816 4,528Construction drawings, specifi cations, and cost estimates 2,247 (112) 2,135 1,249 886Post-award engineering for construction projects 358 (200) 158 29 129
Total personal services 19,485 1,644 21,129 14,863 6,266
Contractual servicesTravel 2 - 2 1 1Meals and lodging 5 - 5 2 3Postage and delivery charges 1 - 1 1 -Compensation for personally owned autos 24 - 24 19 5Motor vehicle operating services 1 - 1 - 1Testing and inspection services 20 - 20 1 19Court reporting services 10 - 10 9 1
(continued)

Exhibit E-1 (continued)Capital Projects FundsSchedule of Appropriations and Expenditures on Budgetary BasisYear ended December 31, 2015
144 FINANCIAL SECTION
Actual(in thousands of dollars) Variance
with FinalBudget Amounts Budget -
Net Actual PositiveOriginal Transfers Final Amounts (Negative)
Stormwater Management Fund (continued):Contractual services (continued)
Soil and rock mechanics investigation $ 25 $ - $ 25 6 19Intragovernmental agreements - 7,915 7,915 6,571 1,344Contractual services not otherwise classifi ed 11,759 (9,115) 2,644 2,615 29Waste material disposal charges 54 - 54 37 17Repairs to collection facilities 50 - 50 - 50Repairs to waterways facilities 2,500 - 2,500 2,247 253Repairs not otherwise classifi ed 5 - 5 - 5
Total contractual services 14,456 (1,200) 13,256 11,509 1,747
Materials and suppliesOffi ce, printing, and photo supplies 5 - 5 - 5Processing chemicals 5 - 5 2 3Tools and supplies 2 - 2 1 1Wearing apparel 2 - 2 1 1Materials and supplies not otherwise classifi ed 330 1,475 1,805 1,646 159
Total materials and supplies 344 1,475 1,819 1,650 169
Capital ProjectsWaterways facilities structure 4,352 (1,309) 3,043 1,457 1,586Capital projects not otherwise classifi ed 448 (420) 28 - 28Preservation of waterway facility structures 4,064 (190) 3,874 3,534 340
Total capital projects 8,864 (1,919) 6,945 4,991 1,954
Fixed and other chargesEquity transfer 3,190 - 3,190 2,124 1,066Payments for easements 250 - 250 190 60
Total fi xed and other charges 3,440 - 3,440 2,314 1,126
Stormwater Management Fund Summary:Personal services 19,485 1,644 21,129 14,863 6,266Contractual services 14,456 (1,200) 13,256 11,509 1,747Material and supplies 344 1,475 1,819 1,650 169Capital projects 8,864 (1,919) 6,945 4,991 1,954Fixed and other charges 3,440 - 3,440 2,314 1,126
Stormwater Management Fund total 46,589 - 46,589 35,327 11,262
(continued)

Metropolitan Water Reclamation District of Greater Chicago
FINANCIAL SECTION 145
Actual(in thousands of dollars) Variance
with FinalBudget Amounts Budget -
Net Actual PositiveOriginal Transfers Final Amounts (Negative)
Capital Improvements Bond Fund Summary:Personal services $ 14,850 $ - $ 14,850 $ (30,284) 45,134Contractual services 9,449 34,000 43,449 19,922 23,527Machinery and equipment 423 - 423 423 -Capital projects 416,301 (34,000) 382,301 102,221 280,080Land 10,300 - 10,300 1,045 9,255Fixed and other charges 1,750 - 1,750 761 989
Capital Improvements Bond Fund total * 453,073 - 453,073 94,088 358,985Capital Projects Funds total $ 537,573 $ - $ 537,573 $ 151,318 $ 386,255
* The Capital Improvements Bond Fund is budgeted on an “obligation” basis which records expenditures in the period in which the contracts or grants are awarded.

146 FINANCIAL SECTION
Page intentionally left blank

TRUST FUNDS
PENSION TRUST FUND
A fi duciary fund established to account for employer / employee contributions, investment earnings, and expenses for employee pensions.
OPEB TRUST FUND
Fund established to administer the defi ned benefi t post-employment health care plan.

Exhibit F-1Pension and Other Post Employment Trust FundsCombining Statements of Fiduciary Net PositionDecember 31, 2015(with comparative amounts for prior year)
148 FINANCIAL SECTION
(in thousands of dollars)
Pension Trust Fund OPEB Trust Fund Total Fiduciary Funds2015 2014 2015 2014 2015 2014
Assets
Cash $ 104 $ 275 $ - $ - $ 104 $ 275Receivables
Employer contributions-taxes (net of allowance for uncollectible
$5,252 in 2015; $3,495 in 2014) 70,772 61,654 - - 70,772 61,654Securities sold 10,565 9,929 - - 10,565 9,929Forward foreign exchange contracts 83,320 28,089 - - 83,320 28,089Accrued interest and dividends 4,368 4,529 95 71 4,463 4,600Accounts receivable 53 40 - - 53 40
Total receivables 169,078 104,241 95 71 169,173 104,312
Investments at fair valueCorporate and governmental bonds and notes 312,644 252,271 - - 312,644 252,271Money market funds - - 550 13,857 550 13,857Pooled funds - fi xed income 111,638 186,016 67,387 60,132 179,025 246,148Pooled funds - equities - - 66,652 59,949 66,652 59,949Balanced funds - - 14,649 12,379 14,649 12,379Common and preferred stocks 757,683 808,449 - - 757,683 808,449Short-term investments 39,867 34,621 - - 39,867 34,621
Total investments 1,221,832 1,281,357 149,238 146,317 1,371,070 1,427,674
Securities lending capital 36,893 51,053 - - 36,893 51,053
Total assets 1,427,907 1,436,926 149,333 146,388 1,577,240 1,583,314
LiabilitiesAccounts payable 1,383 1,646 4 14 1,387 1,660Securities lending collateral 36,893 51,053 - - 36,893 51,053Forward foreign exchange contracts 83,320 28,089 - - 83,320 28,089Securities purchased 19,658 18,342 - - 19,658 18,342
Total liabilities 141,254 99,130 4 14 141,258 99,144
Net position restricted for pension and OPEB benefi ts $ 1,286,653 $ 1,337,796 $ 149,329 $ 146,374 $ 1,435,982 $ 1,484,170

FINANCIAL SECTION 149
Exhibit F-2Pension and Other Post Employment Trust Funds Combining Statements of Changes in Fiduciary Net PositionYear ended December 31, 2015(with comparative amounts for prior year)
(in thousands of dollars)
Pension Trust Fund OPEB Trust Fund Total Fiduciary Funds2015 2014 2015 2014 2015 2014
Additions:Contributions:
Employer contributions $ 71,042 $ 73,906 $ 18,317 $ 33,717 $ 89,359 $ 107,623Employee contributions 21,385 18,975 - - 21,385 18,975Retiree contributions - - 7,406 6,773 7,406 6,773
Total contributions 92,427 92,881 25,723 40,490 118,150 133,371
Investment income:Net appreciation (depreciation) in fair value
of investments (20,895) 63,590 (5,301) 2,267 (26,196) 65,857Interest and dividend income 24,444 23,476 3,334 3,306 27,778 26,782
Total investment income (loss) 3,549 87,066 (1,967) 5,573 1,582 92,639Less investment expenses (5,543) (5,900) (42) (42) (5,585) (5,942)
Investment income (loss) net of expenses (1,994) 81,166 (2,009) 5,531 (4,003) 86,697
Security lending activities:Security lending income 98 64 - - 98 64 Borrower rebates 645 506 - - 645 506
Bank fees (178) (135) - - (178) (135)Net income from securities lending activities 565 435 - - 565 435
Other 29 4 - - 29 4
Total additions 91,027 174,486 23,714 46,021 114,741 220,507Deductions:
Annuities and benefi tsEmployee annuitants 116,885 111,352 - - 116,885 111,352Retiree health care benefi ts - - 20,723 20,490 20,723 20,490Surviving spouse annuitants 21,279 20,444 - - 21,279 20,444Child annuitants 116 157 - - 116 157Ordinary disability benefi ts 722 821 - - 722 821Duty disability benefi ts 159 140 - - 159 140
Total annuities and benefi ts 139,161 132,914 20,723 20,490 159,884 153,404
Refunds of employee contributions 1,349 984 - - 1,349 984Administrative expenses 1,660 1,406 36 40 1,696 1,446
Total deductions 142,170 135,304 20,759 20,530 162,929 155,834
Net increase (decrease) (51,143) 39,182 2,955 25,491 (48,188) 64,673Net position held in trust for pension and
OPEB benefi tsBeginning of year 1,337,796 1,298,614 146,374 120,883 1,484,170 1,419,497
End of year $ 1,286,653 $ 1,337,796 $ 149,329 $ 146,374 $ 1,435,982 $ 1,484,170

150 FINANCIAL SECTION
Page intentionally left blank

III.STATISTICAL AND
DEMOGRAPHICSSECTION
MWRD biosolids were mixed with soil to improve the quality of the fi elds at the new Maggie Daley Park in downtown Chicago. With improved soil quality, the turf grass is healthier, more durable and requires less maintenance. Biosolids provide nutrients but also improve soil structure, help retain moisture and prevent erosion.

152 STATISTICAL SECTION
Page intentionally left blank
STATISTICAL SECTION 153
Statistical and Demographics Section (Unaudited)
This part of the District’s comprehensive annual fi nancial report presents detailed information as a context for understanding the information in the fi nancial statements, note disclosures, and required supplementary information and the District’s overall fi nancial health.
Contents Exhibits
Financial Trends I-1 through I-4
These schedules contain trend information to help the reader understand how the District’s fi nancial performance and well-being have changed over time.
Revenue Capacity I-5 through I-9
These schedules contain information to help the reader assess the District’s most signifi cant local revenue sources, property taxes and user charges.
Debt Capacity I-10 through I-12
These schedules present information to help the reader assess the affordability of the District’s current levels of outstanding debt and its ability to issue additional debt in the future.
Demographic and Economic Information I-13 and I-14
These schedules offer demographic and economic indicators to help the reader understand the environment within which the District’s fi nancial activities take place.
Operating Information I-15 through I-17
These schedules contain service and infrastructure data to help the reader understand how the information in this fi nancial report relates to the services the District provides and the activities it performs.
Sources: Unless otherwise noted the information in these schedules is derived from the comprehensive annual fi nancial reports for the relevant year.

Exhibit I-1Net Position by ComponentLast Ten Fiscal Years
154 STATISTICAL SECTION
(accrual basis of accounting)(in thousands of dollars)
2015 2014 2013 2012
Net investment in capital assets $ 4,630,463 $ 4,548,793 $ 4,506,950 $ 4,514,633
RestrictedRestricted for corporate working cash 278,852 278,148 276,894 277,006Restricted for reserve claim 6,499 7,764 9,861 4,524Restricted for debt service 310,383 305,375 278,970 268,760Restricted for capital projects - 15,457 28,886 18,828Restricted for construction working cash 21,947 21,833 21,644 21,649Restricted for stormwater working cash 37,216 37,035 37,690 37,737
Unrestricted (Defi cit) (756,154) (722,949) (714,054) (1,006)
Total net position $ 4,529,206 $ 4,491,456 $ 4,446,841 $ 5,142,131

STATISTICAL SECTION 155
Metropolitan Water Reclamation District of Greater Chicago
2011 2010 2009 2008 2007 2006
$ 4,506,544 $ 4,492,811 $ 4,559,884 $ 4,575,974 $ 4,580,604 $ 4,541,778
277,270 277,249 275,459 272,120 267,848 263,2296,211 22,521 25,073 35,817 31,295
257,418 227,320 232,815 212,353 203,656 220,30629,908 38,018 - 13,412 18,656 1,04421,611 27,377 27,286 27,005 26,313 25,75039,573 39,554 38,953 37,902 35,275 32,064
(53,477) (96,934) (49,191) 47,316 70,431 95,357
$ 5,085,058 $ 5,027,916 $ 5,110,279 $ 5,221,899 $ 5,234,078 $ 5,179,528
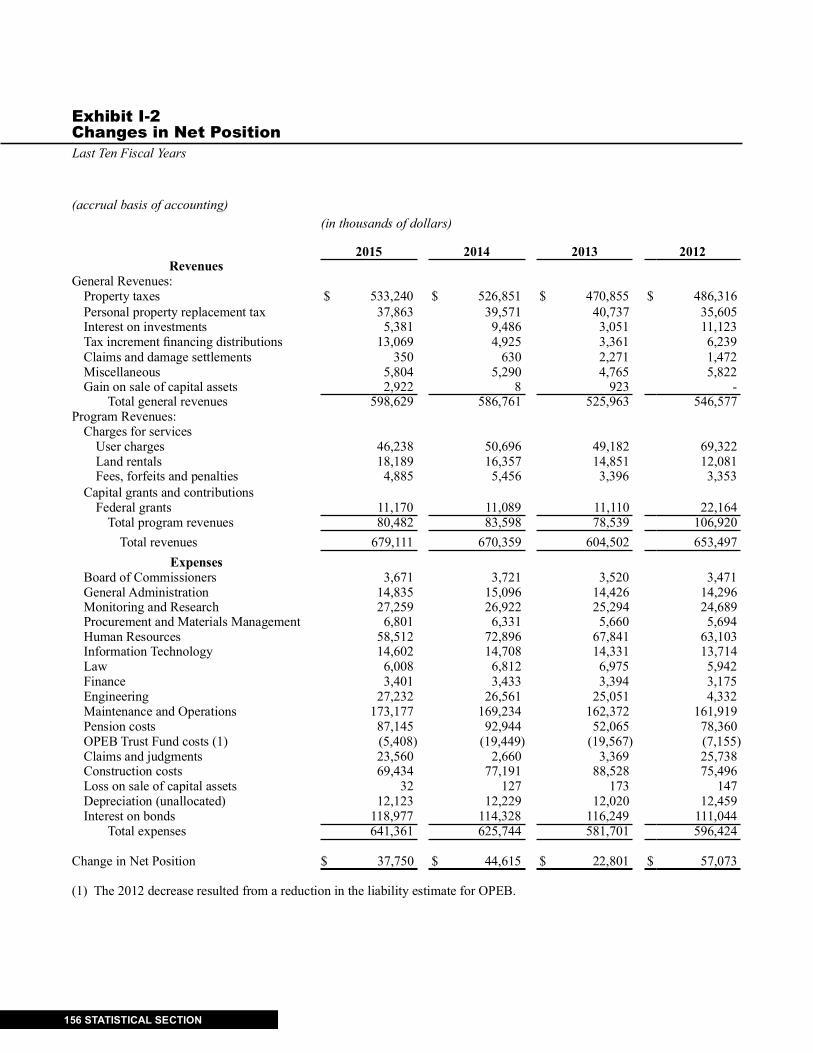
Last Ten Fiscal Years
156 STATISTICAL SECTION
Exhibit I-2Changes in Net Position
(accrual basis of accounting)(in thousands of dollars)
2015 2014 2013 2012Revenues
General Revenues:Property taxes $ 533,240 $ 526,851 $ 470,855 $ 486,316Personal property replacement tax 37,863 39,571 40,737 35,605Interest on investments 5,381 9,486 3,051 11,123Tax increment fi nancing distributions 13,069 4,925 3,361 6,239Claims and damage settlements 350 630 2,271 1,472Miscellaneous 5,804 5,290 4,765 5,822Gain on sale of capital assets 2,922 8 923 -
Total general revenues 598,629 586,761 525,963 546,577Program Revenues:
Charges for servicesUser charges 46,238 50,696 49,182 69,322Land rentals 18,189 16,357 14,851 12,081Fees, forfeits and penalties 4,885 5,456 3,396 3,353
Capital grants and contributionsFederal grants 11,170 11,089 11,110 22,164
Total program revenues 80,482 83,598 78,539 106,920Total revenues 679,111 670,359 604,502 653,497
ExpensesBoard of Commissioners 3,671 3,721 3,520 3,471General Administration 14,835 15,096 14,426 14,296Monitoring and Research 27,259 26,922 25,294 24,689Procurement and Materials Management 6,801 6,331 5,660 5,694Human Resources 58,512 72,896 67,841 63,103Information Technology 14,602 14,708 14,331 13,714Law 6,008 6,812 6,975 5,942Finance 3,401 3,433 3,394 3,175Engineering 27,232 26,561 25,051 4,332Maintenance and Operations 173,177 169,234 162,372 161,919Pension costs 87,145 92,944 52,065 78,360OPEB Trust Fund costs (1) (5,408) (19,449) (19,567) (7,155)Claims and judgments 23,560 2,660 3,369 25,738Construction costs 69,434 77,191 88,528 75,496Loss on sale of capital assets 32 127 173 147Depreciation (unallocated) 12,123 12,229 12,020 12,459Interest on bonds 118,977 114,328 116,249 111,044
Total expenses 641,361 625,744 581,701 596,424
Change in Net Position $ 37,750 $ 44,615 $ 22,801 $ 57,073
(1) The 2012 decrease resulted from a reduction in the liability estimate for OPEB.

STATISTICAL SECTION 157
Metropolitan Water Reclamation District of Greater Chicago
2011 2010 2009 2008 2007 2006
$ 506,888 $ 409,550 $ 429,968 $ 432,412 $ 370,777 $ 392,77536,849 39,352 37,477 42,527 45,935 37,74313,156 9,119 7,632 27,112 48,750 43,65912,715 6,818 1,359 797 644 1,167
1,298 285 695 606 64 614 4,859 5,181 6,642 5,450 3,434 2,584
676 2,736 - - 21 -576,441 473,041 483,773 508,904 469,625 478,542
57,469 49,433 47,886 49,439 54,612 53,98612,161 10,040 9,660 9,572 9,243 7,972
3,279 2,731 4,305 4,357 3,383 4,693
17,218 17,156 5,518 896 253 -90,127 79,360 67,369 64,264 67,491 66,651
666,568 552,401 551,142 573,168 537,116 545,193
3,348 3,627 3,680 3,748 3,513 3,42214,844 15,767 19,046 18,438 16,875 17,29325,221 28,450 29,252 27,612 26,178 25,317
6,928 6,447 6,196 5,398 6,631 5,48047,683 46,882 43,670 61,465 61,878 35,21614,423 16,127 20,611 20,767 16,475 11,312
7,151 8,132 7,491 7,274 6,147 5,7482,962 3,189 3,233 3,238 3,109 3,2184,028 6,245 9,284 8,144 4,483 4,519
178,438 191,090 209,488 196,612 179,938 156,98470,331 62,996 54,804 45,343 49,891 42,32010,251 24,540 25,464 8,920 7,405 - 25,488 9,134 17,536 9,174 17,606 87684,240 104,947 131,095 93,421 56,914 70,594
95 381 436 750 273 4,43012,235 11,428 9,227 9,224 9,216 9,216
101,760 95,382 72,249 65,819 64,584 81,876609,426 634,764 662,762 585,347 531,116 477,821
$ 57,142 $ (82,363) $ (111,620) $ (12,179) $ 6,000 $ 67,372

Exhibit I-3Fund Balances: Governmental Funds
158 STATISTICAL SECTION
Last Ten Fiscal Years
(modifi ed accrual basis of accounting)(in thousands of dollars)
2015 2014 2013 2012 2011General Corporate Fund
Nonspendable: Prepaid insurance $ 2,137 $ 2,143 $ 2,391 $ - $ - Inventories 37,623 39,586 40,136 39,467 38,922Restricted 305,779 307,147 344,558 344,186 342,398Unassigned (Defi cit) (58,427) (61,850) (51,960) (19,151) (96,225)
Total General Corporate Fund 287,112 287,026 335,125 364,502 285,095
All Other Governmental FundsRestricted 378,458 219,606 328,953 575,796 763,064Assigned 127,920 112,768 112,478 - -Unassigned (9,090) - - - -
Total Governmental Funds $ 784,400 $ 619,400 $ 776,556 $ 940,298 $ 1,048,159

Metropolitan Water Reclamation District of Greater Chicago
STATISTICAL SECTION 159
2010 2009 2008 2007 2006
$ - $ - $ - $ - $ -38,924 38,761 38,067 35,787 36,326
341,381 338,602 333,650 323,238 306,705 (175,521) (166,687) (142,300) (124,515) (98,053) 204,784 210,676 229,417 234,510 244,978
519,456 773,035 464,633 631,736 750,189- - - - -- - - - -
$ 724,240 $ 983,711 $ 694,050 $ 866,246 $ 995,167

Exhibit I-4Changes in Fund Balances: Governmental Funds
160 STATISTICAL SECTION
Last Ten Fiscal Years
(modifi ed accrual basis of accounting)(in thousands of dollars)
2015 2014 2013 2012 2011Revenues
General Revenues:Property taxes $ 525,302 $ 516,316 $ 454,966 $ 489,168 $ 492,751Personal property replacement tax 37,863 39,571 40,737 35,605 36,849Interest on investments 5,381 9,486 3,051 11,123 13,156Land sales 3,164 8 2,575 2,326Tax increment fi nancing distributions 13,069 4,925 3,361 6,239 12,715Claims and damage settlements 350 630 2,271 1,472 1,298Miscellaneous 5,869 5,445 4,765 5,822 4,859
Program Revenues:Charges for servicesUser charges 46,238 50,696 49,182 69,322 57,469Land rentals 18,189 16,357 14,851 12,081 12,161Fees, forfeits and penalties 4,885 5,456 3,396 3,353 2,534
Capital grants and contributionsGovernment grants 11,165 11,162 11,110 22,164 17,218
Total revenues 671,475 660,052 590,265 656,349 653,336Expenditures
Operations:Board of Commissioners 3,662 3,710 3,514 3,463 3,344General Administration 14,833 14,829 14,111 13,877 14,332Monitoring and Research 27,486 26,687 25,128 24,495 25,084Procurement and Materials Management 6,885 6,325 5,671 5,698 6,949Human Resources 58,441 72,879 67,856 63,105 47,710Information Technology 14,697 14,582 14,024 13,167 13,820Law 6,018 6,802 6,984 5,942 7,166Finance 3,427 3,425 3,393 3,172 2,965Engineering 25,971 25,278 23,987 3,229 2,975Maintenance and Operations 173,534 168,376 161,787 161,188 177,908Pension costs 62,498 75,556 67,523 66,191 36,635Claims and judgments 5,658 44,988 4,970 5,998 6,923Construction costs 326,430 236,259 199,231 259,315 337,051
Debt service:Redemption of bonds 101,220 89,118 85,709 71,400 64,112Interest on bonds 118,680 110,115 111,665 118,854 98,015
Total expenditures 949,440 898,929 795,553 819,094 844,989Revenues over (under) expenditures (277,965) (238,877) (205,288) (162,745) (191,653)Other Financing Sources (Uses)
Payment to escrow agent (82,906) - - - (253)State revolving fund loan proceeds 181,537 81,721 41,546 54,884 78,481Sale of refunding bonds 70,805 - - - -Proceeds from sale of bonds 225,000 - - - 400,000Premium on sale of bonds 48,529 - - - 37,344Proceeds from capital lease - - - -
Total other fi nancing sources (uses) 442,965 81,721 41,546 54,884 515,572
Net change in fund balance $ 165,000 $ (157,156) $ (163,742) $ (107,861) $ 323,919Debt service as a percentage of
non-capital expenditures 31.7% 26.9% 28.8% 29.9% 27.4%

Metropolitan Water Reclamation District of Greater Chicago
STATISTICAL SECTION 161
2010 2009 2008 2007 2006
$ 410,663 $ 418,077 $ 399,917 $ 376,757 $ 380,67539,352 37,477 42,527 45,935 37,743
9,119 7,632 27,112 48,750 43,6593,045 6 6 28 5166,818 1,359 797 644 1,167
285 695 606 64 6145,181 6,642 5,450 3,495 2,729
49,433 47,886 49,439 54,117 52,50410,040 9,660 9,572 9,243 7,972
2,731 4,305 4,357 3,383 4,693
20,233 1,440 896 253 -556,900 535,179 540,679 542,669 532,272
3,628 3,659 3,721 3,496 3,40115,411 18,555 17,958 16,491 16,97428,445 28,891 27,146 25,892 24,985
6,493 6,156 5,341 6,556 5,35246,944 43,603 61,385 61,841 35,16215,823 20,200 19,328 16,125 11,034
8,164 7,446 7,211 6,121 5,7093,203 3,208 3,205 3,093 3,1975,367 7,951 6,703 4,331 4,318
191,165 208,123 194,916 179,012 155,89930,099 31,744 28,937 31,115 30,071
6,728 9,464 7,626 9,353 4,954496,885 397,265 191,415 194,151 164,157
60,602 73,105 112,577 90,466 83,692104,414 67,148 66,591 68,148 88,177
1,023,371 926,518 754,060 716,191 637,082 (466,471) (391,339) (213,381) (173,522) (104,810)
- - - (437,621) (416,000)152,465 81,000 41,185 47,104 27,464
- - - 382,020 397,390- 600,000 - - 350,000- - - 53,098 24,594
54,535 - - - -207,000 681,000 41,185 44,601 383,448
$ (259,471) $ 289,661 $ (172,196) $ (128,921) $ 278,638
26.1% 21.2% 27.3% 27.4% 31.6%

Exhibit I-5Equalized Assessed Value, Direct Tax Rate, and Estimated Actual Value of Taxable PropertyLast Ten Fiscal Years
162 STATISTICAL SECTION
(in thousands of dollars, except tax rates)Equalized
Fiscal Year Chicago Suburbs Total Total Direct Estimated Assessed ValueEnded Equalized Equalized Equalized Tax Full Taxable as a Percentage
December 31, Assessed Value Assessed Value Assessed Value Rate (1) Value of Full Value
2005 $ 59,304,530 $ 71,282,391 $ 130,586,921 0.315 $ 581,371,295 22.5%2006 69,511,192 71,957,450 141,468,642 0.284 666,223,062 21.22007 73,645,316 82,327,478 155,972,794 0.263 656,474,744 23.82008 80,977,543 89,119,839 170,097,382 0.252 616,163,594 27.62009 84,586,808 89,880,835 174,467,643 0.261 550,135,369 31.72010 82,087,170 84,830,896 166,918,066 0.274 449,811,540 37.12011 75,122,914 73,925,579 149,048,493 0.320 442,787,689 33.72012 65,250,387 68,147,608 133,397,995 0.370 414,382,389 32.22013 62,363,876 61,055,668 123,419,544 0.417 459,860,597 26.82014 64,908,057 60,828,131 125,736,188 0.430 (3) 459,860,597 (2) 27.3
Source: Cook County Clerk for Equalized Assessed Values and Tax Rates and the Civic Federation for Estimated Full Values(1) Tax rates per $100 equalized assessed valuation(2) Current data not available from Civic Federation(3) Does not include values for Railroad, Pollution Control or the part of O’Hare Airport located in DuPage County.

STATISTICAL SECTION 163
Last Ten Fiscal Years
Exhibit I-6District Direct Property Tax Rates, Overlapping Property Tax Rates of Major Local Governments, and District Tax Levies by Fund
(rates per $100 of assessed value)
2015 (1) 2014 2013 2012 2011 2010 2009 2008 2007 2006District direct rates
Corporate $ 0.175 $ 0.183 $ 0.182 $ 0.179 $ 0.168 $ 0.144 $ 0.135 $ 0.141 $ 0.150 $ 0.151Reserve Claim 0.004 0.002 0.005 0.005 0.002 0.001 0.002 0.004 0.004 0.004Retirement 0.044 0.040 0.042 0.021 0.019 0.016 0.016 0.015 0.016 0.018Debt Service 0.175 0.174 0.163 0.135 0.114 0.094 0.097 0.083 0.087 0.087Construction 0.013 0.014 0.009 0.015 0.001 0.005 0.006 - 0.003 0.013Stormwater Management 0.019 0.017 0.016 0.015 0.016 0.014 0.005 0.009 0.003 0.011
Total direct rate $ 0.430 $ 0.430 $ 0.417 $ 0.370 $ 0.320 $ 0.274 $ 0.261 $ 0.252 $ 0.263 $ 0.284
Major local governments’ tax rates (2)
City of Chicago - $ 1.193 $ 1.209 $ 1.151 $ 0.999 $ 0.914 $ 0.887 $ 0.928 $ 1.004 $ 1.012Chicago Board of Education - 3.660 3.671 3.422 2.875 2.581 2.366 2.472 2.583 2.697Chicago Park District - 0.401 0.420 0.395 0.346 0.319 0.309 0.323 0.355 0.379Cook County - 0.568 0.560 0.531 0.462 0.423 0.394 0.415 0.446 0.500Cook County Forest Preserve Dist. - 0.069 0.069 0.063 0.058 0.051 0.049 0.051 0.053 0.057City Colleges of Chicago - 0.193 0.199 0.190 0.165 0.151 0.150 0.156 0.159 0.205Chicago School Finance Authority - - - - - - - - 0.091 0.118City of Chicago Library Fund - 0.134 0.135 0.128 0.111 0.102 0.099 0.102 0.040 0.050City of Chicago School Bldg/Imprvmt - 0.146 0.152 0.146 0.119 0.116 0.112 0.117 - -
District’s tax levies by fund (in thousands)Corporate $227,196 $230,000 $224,400 $237,247 $249,828 $240,059 $236,027 $240,082 $233,982 $213,860Stormwater Management 24,050 21,000 20,000 20,000 24,100 24,029 8,849 15,212 3,942 15,508Reserve Claim 5,700 3,000 6,171 6,670 3,400 1,951 3,182 7,073 6,530 5,957Retirement 58,004 50,531 51,621 28,490 28,163 26,478 26,751 25,664 24,843 25,072Debt Service 227,879 218,319 201,388 180,748 169,645 156,090 169,051 140,614 135,730 123,608Construction 16,500 17,400 11,079 20,418 1,819 8,749 10,411 - 5,181 17,766
Total tax levies $559,329 $540,250 $514,659 493,573 $476,955 $457,356 $454,271 $428,645 $410,208 $401,771
Source: Cook County Clerk(1) District’s tax rates are estimated based on 2015 equalized assessed valuation of $126 billion. (2) Major local governments’ rates for 2015 are not yet available.

Exhibit I-7Principal Property Taxpayers2014 and Nine Years Ago
164 STATISTICAL SECTION
(in thousands of dollars)2014 (1) 2005
Percentage PercentageEqualized of Total Equalized of Total Assessed Equalized Assessed Equalized
Taxpayer Type of Business Value (3) Rank Assessed Value Value Rank Assessed Value
Willis Tower Retail & Offi ce $ 364,454 1 0.29% $ 519,080 1 0.40%Aon Center Insurance 241,083 2 0.19 341,767 2 0.26Merchandise Mart Retail & Offi ce 236,632 3 0.19 - - -Citadel Center Offi ce 233,798 4 0.19 - - -Hyatt Center Offi ce 223,714 5 0.18 - - -CME Center (2) Offi ce 220,757 6 0.18 341,076 3 0.26One North Wacker Drive Offi ce 215,718 7 0.17 - - -Blue Cross Blue Shield Tower Offi ce 206,782 8 0.16 - - -Water Tower Place Retail & Offi ce 195,486 9 0.16 183,187 9 0.14Chase Tower Banking 194,963 10 0.16 218,014 6 0.17AT & T Corporate Center Communications - - - 268,519 4 0.21One Prudential Plaza Financial Services - - - 266,283 5 0.20Citigroup Center Banking - - - 196,622 7 0.15Leo Burnett Building Advertising - - - 188,219 8 0.14R.R. Donnelley & Sons Publishing - - - 177,418 10 0.14
$ 2,333,387 1.87% $ 2,700,185 2.07%
Source: Cook County Treasurer’s Offi ce and Cook County Clerk’s Offi ce(1) 2015 information is unavailable(2) Two adjoining tower offi ce buildings; formerly referred to as Equity Offi ce(3) The Equalized Assessed Valuation for 2014 is $125,736,187,743

STATISTICAL SECTION 165
Last Ten Fiscal Years
Exhibit I-8Property Tax Levies and Collections
(in thousands of dollars)
Fiscal Year Taxes Levied Collected within the First Year
Ended for the Percentage FinalDecember 31 Fiscal Year Amount of Levy Due Date
2006 $ 401,771 $ 353,566 88.0% 12/03/072007 410,208 390,440 95.2 11/03/082008 428,645 400,048 93.3 12/01/092009 455,360 383,612 84.2 12/13/102010 457,356 435,009 95.1 11/01/112011 476,955 460,618 96.6 08/01/122012 493,573 476,881 96.6 08/01/132013 514,659 497,452 96.7 08/01/142014 540,250 523,203 96.8 08/01/152015 560,179 - - 08/01/16
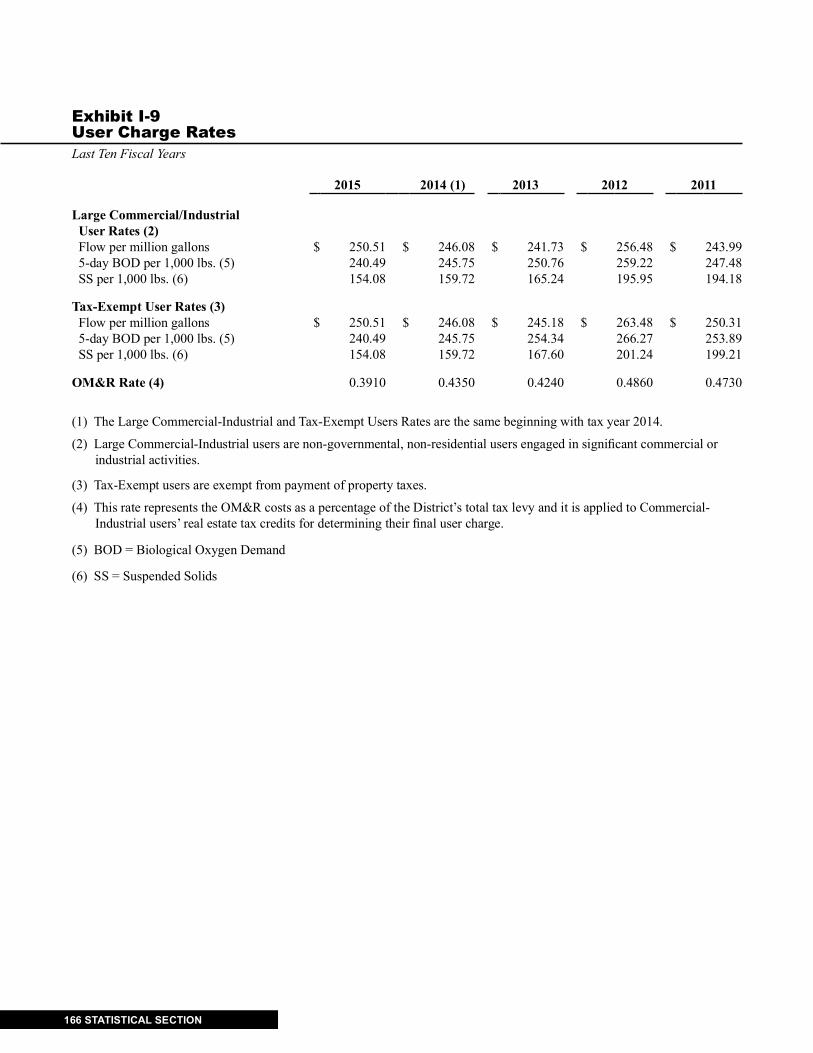
Exhibit I-9User Charge RatesLast Ten Fiscal Years
166 STATISTICAL SECTION
2015 2014 (1) 2013 2012 2011
Large Commercial/Industrial User Rates (2) Flow per million gallons $ 250.51 $ 246.08 $ 241.73 $ 256.48 $ 243.99 5-day BOD per 1,000 lbs. (5) 240.49 245.75 250.76 259.22 247.48 SS per 1,000 lbs. (6) 154.08 159.72 165.24 195.95 194.18
Tax-Exempt User Rates (3) Flow per million gallons $ 250.51 $ 246.08 $ 245.18 $ 263.48 $ 250.31 5-day BOD per 1,000 lbs. (5) 240.49 245.75 254.34 266.27 253.89 SS per 1,000 lbs. (6) 154.08 159.72 167.60 201.24 199.21
OM&R Rate (4) 0.3910 0.4350 0.4240 0.4860 0.4730
(1) The Large Commercial-Industrial and Tax-Exempt Users Rates are the same beginning with tax year 2014.
(2) Large Commercial-Industrial users are non-governmental, non-residential users engaged in signifi cant commercial or industrial activities.
(3) Tax-Exempt users are exempt from payment of property taxes.
(4) This rate represents the OM&R costs as a percentage of the District’s total tax levy and it is applied to Commercial- Industrial users’ real estate tax credits for determining their fi nal user charge.
(5) BOD = Biological Oxygen Demand
(6) SS = Suspended Solids
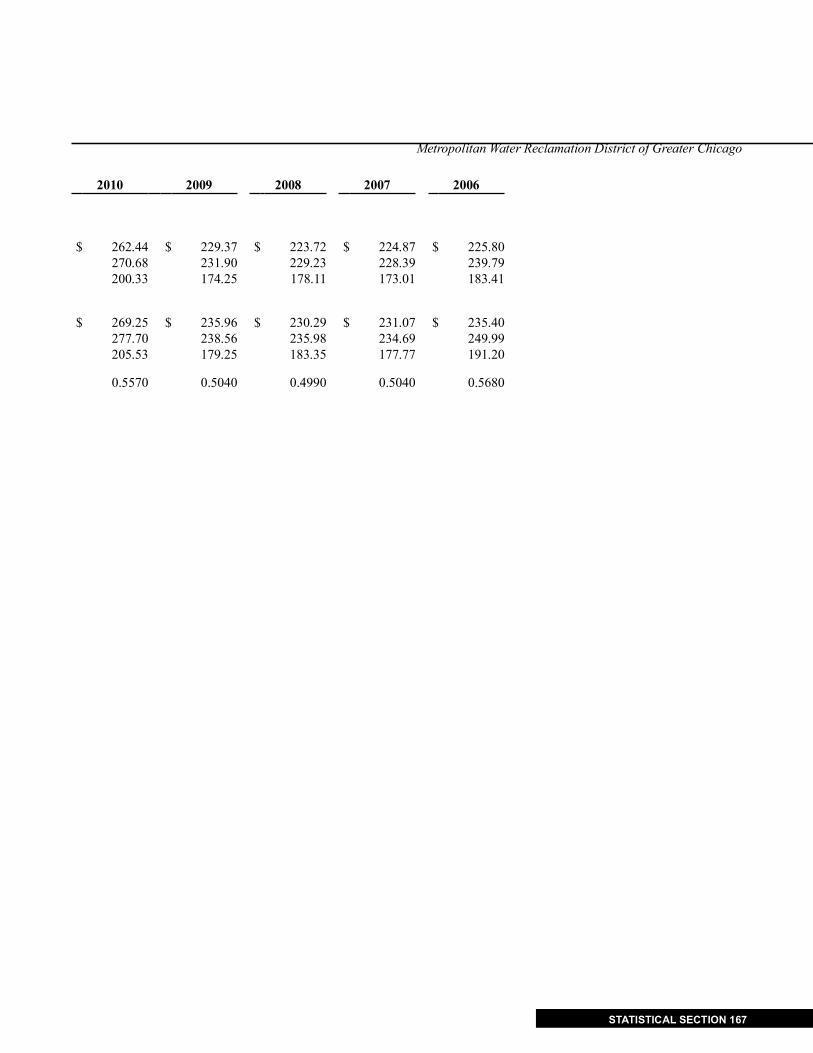
STATISTICAL SECTION 167
Metropolitan Water Reclamation District of Greater Chicago
2010 2009 2008 2007 2006
$ 262.44 $ 229.37 $ 223.72 $ 224.87 $ 225.80270.68 231.90 229.23 228.39 239.79200.33 174.25 178.11 173.01 183.41
$ 269.25 $ 235.96 $ 230.29 $ 231.07 $ 235.40277.70 238.56 235.98 234.69 249.99205.53 179.25 183.35 177.77 191.20
0.5570 0.5040 0.4990 0.5040 0.5680

Exhibit I-10Ratios of Total General Bonded Debt and Net Bonded Debt Outstanding (1)Last Ten Fiscal Years
168 STATISTICAL SECTION
(dollars and population in thousands, except debt per capita)
Net Debt Resources Total as a % of
Bond Available Debt Total Estimated NetGeneral Anticipation Capital for as a % Debt Full Debt
Fiscal Obligation Notes and Lease Total Repayment Net Personal Per Taxable PerYear Bonds Interest Payable (4) Debt of Debt (2) Debt Income (3) Capita (3) Value (3) Capita (3)
2006 $ 1,579,401 $ 25,261 $ - $1,604,662 $ 124,540 $ 1,480,122 1.15% $ 302.37 0.22% $ 278.902007 1,465,854 63,131 - 1,528,985 97,492 1,431,493 1.10 289.69 0.22 271.222008 1,392,699 64,894 - 1,457,593 101,053 1,356,540 1.05 277.00 0.22 257.802009 1,979,203 86,286 - 2,065,489 106,279 1,959,210 1.46 392.01 0.36 371.842010 1,961,974 196,225 53,688 2,211,887 111,055 2,100,832 1.44 422.12 0.47 400.922011 2,466,464 108,008 51,784 2,626,256 137,217 2,489,039 1.87 503.50 0.56 477.192012 2,515,376 44,527 49,838 2,609,741 136,173 2,473,568 1.79 506.75 0.60 480.302013 2,481,973 35,809 47,795 2,565,577 122,527 2,443,050 1.73 489.52 0.59 466.142014 2,500,785 90,460 45,653 2,558,733 140,162 2,418,571 1.77 481.15 0.58 454.792015 2,770,788 161,697 43,405 2,860,467 140,806 2,719,661 1.84 543.82 0.59 517.05
(1) Represents long-term debt for general bonded debt, and bond anticipation notes, including interest, which are eventually converted to general bonded debt. Details of the District’s long-term debt can be found in the notes to the basic fi nancial statements.(2) Represents the restricted fund balance in the Debt Service Fund.(3) See Exhibit I-13 for personal income and population information, and Exhibit I-5 for estimated full taxable value information. (4) The District entered into a capital lease agreement in 2010.

STATISTICAL SECTION 169
As of December 31, 2015
Exhibit I-11Estimate of Direct and Overlapping Debt
(In thousands of dollars)
Direct debtBonds and notes payable $ 2,655,365Capital lease 43,405
ApplicableOverlapping bonded debt of major local governments (1) Net Debt (2) % Applicable (3) Amount
City of Chicago $ 9,106,165 100.00% $ 9,106,165Chicago Board of Education 6,130,423 (4)(5) 100.00 6,130,423 (4)Chicago Park District 798,045 (4) 100.00 798,045 (4)City Colleges (District 508) 245,995 100.00 245,995Cook County 3,477,527 97.96 3,406,585Cook County Forest Preserve District 163,117 97.96 159,789
Total overlapping debt (6) 19,847,002
Total direct and overlapping debt $ 22,545,772
(1) Excludes outstanding tax anticipation notes and warrants. Except as stated, does not include debt issued by other taxing authorities in Cook County.(2) Source: Each of the respective taxing districts, current as of 1/21/2016.(3) Based on 2013 Equalized Assessed Valuations, which are the most recent available.(4) Includes approximately $246 million, $5.18 billion and $303 million of general obligation bonds of the City Colleges (District 508), Chicago Board of Education and the Chicago Park District, respectively, issued as “alternate revenue” bonds secured by alternate revenue sources. An ad valorem property tax levy is filed in an amount sufficient to pay debt service on the alternate revenue bonds. When suffi cient revenues have accumulated to pay annual debt service on the alternate revenue bonds, the property tax levy is abated. To date, alternate revenues have been available in amounts suffi cient to pay principal and interest coming due on the alternate revenue bonds issued by the Chicago Board of Education and the Chicago Park District.(5) Includes approximately $158 million of Public Building Commission Bonds debt.(6) Source of data: U.S. Census Estimate.(7) Source of data: The Civic Federation, Chicago, Illinois (based upon information from the Illinois Department of Revenue).

Exhibit I-12Computation of Statutory Debt MarginLast Ten Fiscal Years
170 STATISTICAL SECTION
(in thousands of dollars)
2015 (1) 2014 2013 2012 2011
Equalized assessed valuation $ 125,736,188 $ 125,736,188 $ 123,419,544 $ 133,397,995 $ 149,048,493Statutory debt limit (5.75% of equalized
assessed valuation) 7,229,831 7,229,831 7,096,624 7,670,385 8,570,288
Total debt applicable to debt limit:General obligation bonds outstanding 2,655,365 2,422,620 2,481,973 2,515,375 2,466,464
Less: alternate bonds (2) (50,000) - - - -Adjusted general obligation bonds outstanding 2,605,365 2,422,620 2,481,973 2,515,375 2,466,464
Bond anticipation notes outstanding 161,697 90,460 35,809 44,527 108,008Capital lease outstanding 43,405 45,653 47,795 49,837 51,784Liabilities of tax fi nanced funds:
Corporate 23,647 37,136 30,150 30,076 35,347Stormwater 6,973 5,689 3,515 2,496 1,956Debt service - - - - - Reserve claim 205 681 380 1,110 1,381Construction 4,812 6,648 2,816 4,062 1,542
Total applicable debt 2,846,104 2,608,887 2,602,438 2,647,483 2,666,482Less applicable assets:
Debt service funds unrestricted cash and investments 108,671 108,392 98,006 105,285 114,344Interest payable in the next twelve months (115,735) (106,175) (107,868) (109,300) (116,410)
Total applicable assets 7,064 2,217 (9,862) (4,015) (2,066)
Total net debt applicable to debt limit 2,853,168 2,606,670 2,612,300 2,651,498 2,668,548
Statutory debt margin $ 4,376,663 $ 4,623,161 $ 4,484,324 $ 5,018,887 $ 5,901,740
Total applicable net debt as apercentage of statutory debt limit 39.5% 36.1% 36.8% 34.6% 31.1%
(1) Debt limit calculation based on 2014 equalized assessed valuation since 2015 value is not yet available.(2) Alternate bonds do not count against the debt limit.

STATISTICAL SECTION 171
Metropolitan Water Reclamation District of Greater Chicago
2010 2009 2008 2007 2006
$ 166,918,066 $ 174,467,643 $ 170,097,382 $ 155,972,794 $ 141,468,642
9,597,789 10,031,889 9,780,599 8,968,436 8,134,447
1,961,974 1,979,203 1,392,699 1,465,854 1,579,401- - - - -
1,961,974 1,979,203 1,392,699 1,465,854 1,579,401196,225 86,286 64,894 63,131 25,261
53,688 - - - -
45,381 45,260 42,374 38,699 27,2332,496 1,101 1,470 1,179 340
- - - - 56410 327 1,036 1,243 1,495
1,732 4,236 2,855 2,662 2,8102,261,906 2,116,413 1,505,328 1,572,768 1,636,596
88,710 88,849 89,397 77,599 108,814 (92,619) (59,873) (73,103) (68,877) (69,111) (3,909) 28,976 16,294 8,722 39,703
2,265,815 2,087,437 1,489,034 1,564,046 1,596,893
$ 7,331,974 $ 7,944,452 $ 8,291,565 $ 7,404,390 $ 6,537,554
23.6% 20.8% 15.2% 17.4% 19.6%
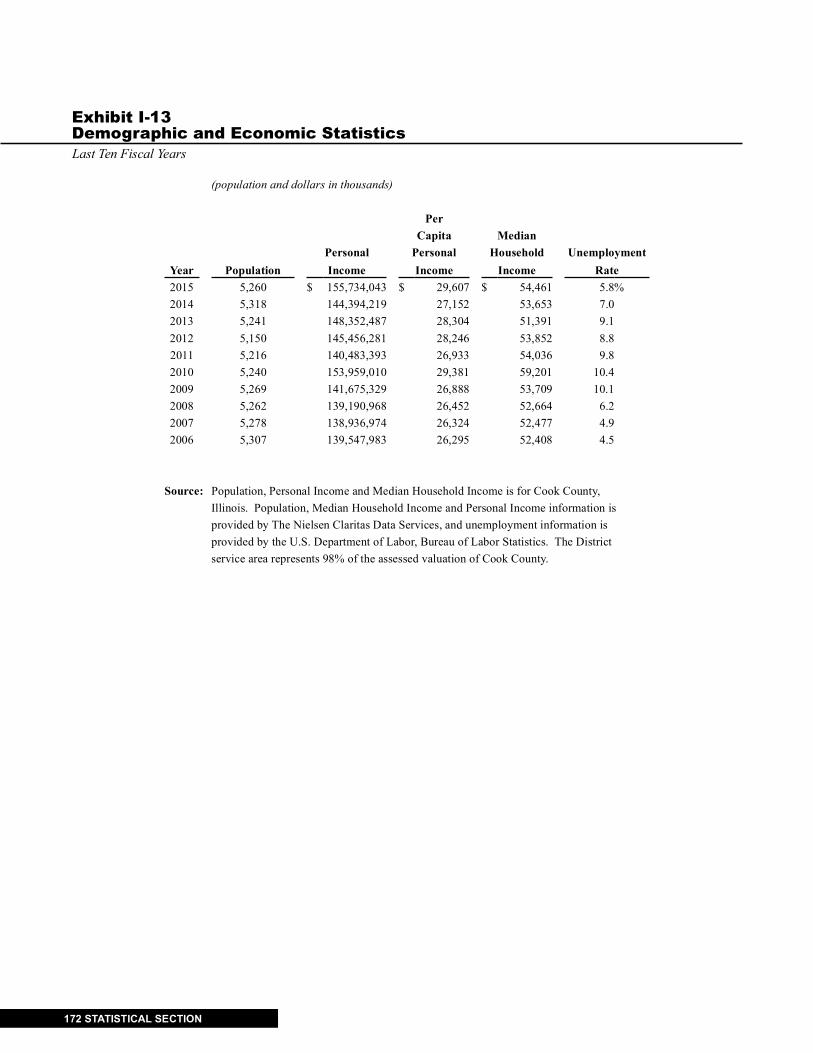
Exhibit I-13Demographic and Economic StatisticsLast Ten Fiscal Years
172 STATISTICAL SECTION
(population and dollars in thousands)
PerCapita Median
Personal Personal Household UnemploymentYear Population Income Income Income Rate2015 5,260 $ 155,734,043 $ 29,607 $ 54,461 5.8%2014 5,318 144,394,219 27,152 53,653 7.02013 5,241 148,352,487 28,304 51,391 9.12012 5,150 145,456,281 28,246 53,852 8.82011 5,216 140,483,393 26,933 54,036 9.82010 5,240 153,959,010 29,381 59,201 10.42009 5,269 141,675,329 26,888 53,709 10.12008 5,262 139,190,968 26,452 52,664 6.22007 5,278 138,936,974 26,324 52,477 4.92006 5,307 139,547,983 26,295 52,408 4.5
Source: Population, Personal Income and Median Household Income is for Cook County,Illinois. Population, Median Household Income and Personal Income information is provided by The Nielsen Claritas Data Services, and unemployment information isprovided by the U.S. Department of Labor, Bureau of Labor Statistics. The Districtservice area represents 98% of the assessed valuation of Cook County.

STATISTICAL SECTION 173
2015 and Nine Years Ago
Exhibit I-14Principal Employers
2015 2006Percentage Percentage
of Total of Total Employer Employees Rank Employment (5) Employees Rank Employment
U.S. Government (1) 45,673 1 0.87% 51,700 1 0.97%Chicago Public Schools (2) 38,933 2 0.74 43,783 2 0.83City of Chicago (2) 30,345 3 0.58 39,675 3 0.75Cook County (3) 21,622 4 0.41 25,482 5 0.48Advocate Health Care 18,556 5 0.35 25,279 6 0.48University of Chicago (2) 16,025 6 0.30 - - -J.P. Morgan Chase & Co. 15,015 7 0.29 - - -State of Illinois (2) 14,925 8 0.28 17,056 8 0.32Northwestern Memorial Healthcare (4) 14,550 9 0.28 - - -United Continental Holdings Inc. 14,000 10 0.27 - - -Jewel-Osco - - - 34,037 4 0.64United Parcel Service of America, Inc. - - - 19,000 7 0.36SBC Communications, Inc. - - - 16,500 9 0.31Wal-Mart Stores Inc. - - - 16,350 10 0.31
Total 229,644 4.37% 288,862 5.45%
(1) Fiscal year ends in September(2) Fiscal year ends in June(3) Fiscal year ends in November(4) Fiscal year ends in August(5) Total employment for 2015 based on a population of 5,260,069; total employment for 2006 based on a population of 5,306,935 employees.
Source: Reprinted with permission, Crain’s Chicago Business [December 21, 2015] © Crain Communications, Inc.

Exhibit I-15Budgeted Positions by Fund/DepartmentLast Ten Fiscal Years
174 STATISTICAL SECTION
Budgeted Positions
Fund/Department 2015 2014 2013 2012 2011 2010 2009 2008 2007 2006
General Corporate FundBoard of Commissioners 37 37 37 37 40 45 45 45 45 45General Administration 119 112 109 114 125 124 146 138 144 145Monitoring and Research 297 288 286 280 303 308 308 309 311 317Procurement and Materials Management 63 62 62 62 69 70 70 70 70 70Human Resources 74 72 58 57 59 60 54 54 53 53Information Technology 70 70 70 69 71 71 72 72 66 63Law 37 36 38 37 38 40 40 40 40 41Finance 29 29 29 29 31 31 31 33 34 35Engineering (Corporate Fund) (1) 242 241 242 29 32 34 34 34 33 33Maintenance & Operations 955 951 947 943 1,029 1,047 1,046 1,045 1,044 1,071
Total General Corporate Fund 1,923 1,898 1,878 1,657 1,797 1,830 1,846 1,840 1,840 1,873
Engineering (Construction Fund) (2) 0 0 0 21 28 45 45 45 49 63Engineering (Stormwater
Management) 59 63 49 48 44 50 49 47 48 38Engineering (Capital Improvements
Bond Fund) (2) 0 0 0 196 202 191 191 177 157 133
Grand Total 1,982 1,961 1,927 1,922 2,071 2,116 2,131 2,109 2,094 2,107
(1) Increase due to the transfer of positions from the Capital Improvements Bond and Construction Funds to the Corporate Fund(2) Decrease due to the transfer of positions from the Capital Improvements Bond and Construction Funds to the Corporate Fund

STATISTICAL SECTION 175
Last Ten Fiscal Years
Exhibit I-16Operating Indicators
Number of Commercial and Local Sewer Gallons of Gallons of Daily
Number of Industrial Connections to Pumping Station Sewage SewageArea Communities People Population Intercepting Maximum Processed Treatment
Served (1) Served (2) Served(3) Equivalent Served Sewers Capacity (4) per Day (4) Capacity (4)
2015 883 129 5,260,069 4,500,000 10,000 4,000,000 1,244,200 2,000,0002014 883 129 5,318,365 4,500,000 10,000 4,000,000 1,288,600 2,000,0002013 884 126 5,241,489 4,500,000 10,000 4,000,000 1,218,200 2,000,0002012 884 126 5,149,578 4,500,000 10,000 4,000,000 1,070,200 2,000,0002011 884 126 5,215,968 4,500,000 10,000 4,000,000 1,342,800 2,000,0002010 884 126 5,239,879 4,500,000 10,000 4,000,000 1,245,200 2,000,0002009 884 126 5,269,000 4,500,000 10,000 4,000,000 1,366,700 2,000,0002008 884 126 5,262,000 4,500,000 10,000 4,000,000 1,284,600 2,000,0002007 876 126 5,278,157 4,500,000 10,000 4,000,000 1,310,000 2,000,0002006 876 126 5,306,935 4,500,000 10,000 4,000,000 1,329,000 2,000,000
(1) In square miles(2) Including the City of Chicago(3) Nielson -- Claritas Data Service(4) In thousands of gallons.

Exhibit I-17Capital Asset StatisticsLast Ten Fiscal Years
176 STATISTICAL SECTION
2015 2014 2013 2012 2011 2010 2009 2008 2007 2006 Miles of intercepting sewers
and force mains operated 560 560 560 559 559 559 559 559 559 559 Miles of waterway
water levels controlled 76 76 76 76 76 76 76 76 76 76Acres of strip-mined land
utilized for solids processing 13,796+ 13,796+ 13,796+ 13,796+ 13,796+ 13,796+ 13,796+ 13,796+ 13,000+ 13,000+Number of water reclamation
plants 7 7 7 7 7 7 7 7 7 7
Number of pumping stations 22 22 22 22 22 22 22 22 23 23
Miles of TARP tunnels constructed for pollution and fl ood control 109.4 109.4 109.4 109.4 109.4 109.4 109.4 109.4 109.4 109.4
Number of TARPreservoirs constructed 2 1 1 1 1 1 1 1 1 1
Number of TARP reservoirsunder construction 1 2 2 2 2 2 2 2 2 2
Number of fl ood controlreservoirs 35 33 31 31 31 31 31 32 32 32
Instream aeration stations 2 2 2 2 2 2 2 2 2 2
Sidestream elevated pool aeration stations 5 5 5 5 5 5 5 5 5 5
Source: District’s Engineering Department

IV.SINGLE AUDIT
SECTION
Kayakers gather for a quick tutorial on the Chicago River near Clark Street in July. Improvements to water quality and the newly opened Chicago Riverwalk are drawing more and more people to the Chicago river.

178 SINGLE AUDIT SECTION
178
To the Honorable President and Members of the Board of CommissionersMetropolitan Water Reclamation District of Greater ChicagoChicago, Illinois
We have audited, in accordance with auditing standards generally accepted in the United States of America and the standards applicable to financial audits contained in issued by the Comptroller General of the United States, the financial statements of the governmental activities, each major fund and the aggregate remaining fund information of Metropolitan Water Reclamation District of Greater Chicago (the District) , as of and for the year ended December 31, 2015, and the related notes to the financial statements, which collectively comprise the District’s basic financial statements, and have issued our report thereon dated May 9, 2016. Our report includes a reference to other auditors who audited the financial statements of the District's Pension Trust Fund as described in our report on the District's financial statements. This report does not include the results of the other auditors' testing of internal control over financial reporting or compliance and other matters that are reported separately by those auditors.
In planning and performing our audit of the financial statements, we considered the District's internal control over financial reporting (internal control) to determine the audit procedures that are appropriate in the circumstances for the purpose of expressing our opinions on the financial statements, but not for the purpose of expressing an opinion on the effectiveness of the District’s internal control. Accordingly, we do not express an opinion on the effectiveness of the District’s internal control.
A exists when the design or operation of a control does not allow management or employees, in the normal course of performing their assigned functions, to prevent, or detect and correct, misstatements on a timely basis. A is a deficiency, or a combination of deficiencies, in internal control, such that there is a reasonable possibility that a material misstatement of the entity’s financial statements will not be prevented, or detected and corrected on a timely basis. A
is a deficiency, or a combination of deficiencies, in internal control that is less severe than a material weakness, yet important enough to merit attention by those charged with governance.
Our consideration of internal control was for the limited purpose described in the first paragraph of this section and was not designed to identify all deficiencies in internal control that might be material weaknesses or significant deficiencies. Given these limitations, during our audit we did not identify any deficiencies in internal control that we consider to be material weaknesses. However, material weaknesses may exist that have not been identified.

SINGLE AUDIT SECTION 179
179
As part of obtaining reasonable assurance about whether the District's financial statements are free from material misstatement, we performed tests of its compliance with certain provisions of laws, regulations, contracts, and grant agreements, noncompliance with which could have a direct and material effect on the determination of financial statement amounts. However, providing an opinion on compliance with those provisions was not an objective of our audit, and accordingly, we do not express such an opinion. The results of our tests disclosed no instances of noncompliance or other matters that are required to be reported under .
The purpose of this report is solely to describe the scope of our testing of internal control and compliance and the results of that testing, and not to provide an opinion on the effectiveness of the entity’s internal control or on compliance. This report is an integral part of an audit performed in accordance with
in considering the entity’s internal control and compliance. Accordingly, this communication is not suitable for any other purpose.
Chicago, IllinoisMay 9, 2016

180 SINGLE AUDIT SECTION
INDEPENDENT AUDITORS’ REPORT
The Honorable President andMembers of the Board of CommissionersMetropolitan Water Reclamation District of Greater Chicago
Report on the Schedule of Expenditures of Federal Awards
We have audited the accompanying Schedule of Expenditures of Federal Awards (the “Schedule”) of the Metropolitan Water Reclamation District of Greater Chicago (the “District”), for the year ended Decem-ber 31, 2015 and the related notes to the Schedule.
Management’s Responsibility for the Schedule of Expenditures of Federal AwardsManagement is responsible for the preparation and fair presentation of this fi nancial statement in accor-dance with accounting principles generally accepted in the United States of America; this includes the de-sign, implementation, and maintenance of internal control relevant to the preparation and fair presentation of the fi nancial statement that is free from material misstatement, whether due to fraud or error.
Auditors’ ResponsibilityOur responsibility is to express an opinion on this fi nancial statement based on our audit. We conducted our audit in accordance with auditing standards generally accepted in the United States of America; the standards applicable to fi nancial audits contained in Government Auditing Standards, issued by the Comp-troller General of the United States; and the audit requirements of Title 2 U.S. Code of Federal Regulation Part 200, Uniform Administrative Requirements, Cost Principles, and Audit Requirements for Federal Awards (Uniform Guidance). Those standards and the Uniform Guidance require that we plan and per-form the audit to obtain reasonable assurance about whether the fi nancial statement is free from material misstatement.
An audit involves performing procedures to obtain audit evidence about the amounts and disclosures in the fi nancial statement. The procedures selected depend on the auditor’s judgment, including the assess-ment of the risks of material misstatement of the fi nancial statement, whether due to fraud or error. In mak-ing those risk assessments, the auditor considers internal control relevant to the entity’s preparation and fair presentation of the fi nancial statement in order to design audit procedures that are appropriate in the circumstances, but not for the purpose of expressing an opinion on the effectiveness of the entity’s internal control. Accordingly, we express no such opinion. An audit also includes evaluating the appropriateness of accounting policies used and the reasonableness of signifi cant accounting estimates made by manage-ment, as well as evaluating the overall presentation of the fi nancial statement. We believe that the audit evidence we have obtained is suffi cient and appropriate to provide a basis for our audit opinion.

SINGLE AUDIT SECTION 181
Opinion In our opinion, the fi nancial statement referred to above presents fairly, in all material respects, the ex-penditures of federal awards of the District for the year ended December 31, 2015, in accordance with accounting principles generally accepted in the United States of America.
Report on Other Legal and Regulatory RequirementsIn accordance with Title 2 U.S. Code of Federal Regulation Part 200, Uniform Administrative Require-ments, Cost Principles, and Audit Requirements for Federal Awards (Uniform Guidance), we have also issued a report dated May 9, 2016 on our consideration of the District’s compliance with requirements that could have a direct and material effect on the major program and on internal control over compliance in accordance with the Uniform Guidance. That report is an integral part of an audit performed in accordance with the Uniform Guidance and should be read in conjunction with this report.
Chicago, IllinoisMay 9, 2016

182 SINGLE AUDIT SECTION
INDEPENDENT AUDITORS’ REPORT ON COMPLIANCEFOR EACH MAJOR PROGRAM AND ON INTERNAL CONTROL
OVER COMPLIANCE REQUIRED BY THE UNIFORM GUIDANCE
The Honorable President andMembers of the Board of CommissionersMetropolitan Water Reclamation District of Greater Chicago
Report on Compliance for the Major Federal Program
We have audited the Metropolitan Water Reclamation District of Greater Chicago’s (the “District”) com-pliance with the types of compliance requirements described in the OMB Compliance Supplement that could have a direct and material effect on the District’s major federal program for the year ended Decem-ber 31, 2015. The District’s major federal program is identifi ed in the summary of auditor’s results section of the accompanying schedule of fi ndings and questioned costs.
Management’s ResponsibilityManagement is responsible for compliance with the federal statutes, regulations, and the terms and condi-tions of its federal awards applicable to its federal programs.
Auditors’ ResponsibilityOur responsibility is to express an opinion on compliance for the District’s major federal program based on our audit of the types of compliance requirements referred to above. We conducted our audit of compli-ance in accordance with auditing standards generally accepted in the United States of America; the stan-dards applicable to fi nancial audits contained in Government Auditing Standards, issued by the Comptrol-ler General of the United States; and the audit requirements of Title 2 U.S. Code of Federal Regulations Part 200, Uniform Administrative Requirements, Costs Principles, and Audit Requirements for Federal Awards (Uniform Guidance). Those standards and the Uniform Guidance require that we plan and per-form the audit to obtain reasonable assurance about whether noncompliance with the types of compliance requirements referred to above that could have a direct and material effect on a major federal program oc-curred. An audit includes examining, on a test basis, evidence about the District’s compliance with those requirements and performing such other procedures as we considered necessary in the circumstances.
We believe that our audit provides a reasonable basis for our opinion on compliance for the major federal program. However, our audit does not provide a legal determination of the District’s compliance.

SINGLE AUDIT SECTION 183
Opinion on the Major Federal ProgramIn our opinion, the District complied, in all material respects, with the types of compliance requirements referred to above that could have a direct and material effect on its major federal program for the year ended December 31, 2015.
Report on Internal Control over Compliance
Management of the District is responsible for establishing and maintaining effective internal control over compliance with the types of compliance requirements referred to above. In planning and performing our audit of compliance, we considered the District’s internal control over compliance with the types of requirements that could have a direct and material effect on the major federal program to determine the auditing procedures that are appropriate in the circumstances for the purpose of expressing an opinion on compliance for the major federal program and to test and report on internal control over compliance in accordance with the Uniform Guidance, but not for the purpose of expressing an opinion on the effective-ness of internal control over compliance. Accordingly, we do not express an opinion on the effectiveness of the District’s internal control over compliance.
A defi ciency in internal control over compliance exists when the design or operation of a control over compliance does not allow management or employees, in the normal course of performing their assigned functions, to prevent, or detect and correct, noncompliance with a type of compliance requirement of a federal program on a timely basis. A material weakness in internal control over compliance is a defi ciency, or combination of defi ciencies, in internal control over compliance, such that there is a reasonable pos-sibility that material noncompliance with a type of compliance requirement of a federal program will not be prevented, or detected and corrected, on a timely basis. A signifi cant defi ciency in internal control over compliance is a defi ciency, or a combination of defi ciencies, in internal control over compliance with a type of compliance requirement of a federal program that is less severe than a material weakness in inter-nal control over compliance, yet important enough to merit attention by those charged with governance.
Our consideration of internal control over compliance was for the limited purpose described in the fi rst paragraph of this section and was not designed to identify all defi ciencies in internal control over compli-ance that might be material weaknesses or signifi cant defi ciencies. We did not identify any defi ciencies in internal control over compliance that we consider to be material weaknesses. However, material weak-nesses may exist that have not been identifi ed.
The purpose of this report on internal control over compliance is solely to describe the scope of our testing of internal control over compliance and the results of that testing based on the requirements of the Uniform Guidance. Accordingly, this report is not suitable for any other purpose.
Chicago, IllinoisMay 9, 2016

Schedule of Expenditures of Federal AwardsYear ended December 31, 2015
184 SINGLE AUDIT SECTION
Pass-Through Federal Entity TotalFederal Grantor/Pass-Through Grantor/ CFDA Identifying Award Passed-Through Federal Program or Cluster Title Number Number Date to Subrecipients Expenditures U.S. Environmental Protection Agency Passed through Illinois Environmental Protection Agency Capitalization Grants for Clean Water State Revolving Funds Project Descriptions Westside Primary Settling Tanks & 66.458 L173076 December 2014 - 5,404,100 Aerated Grit Tanks, Stickney WRP Sludge Thickening Facilities at 66.458 L174558 May 2012 - 416,500 Stickney Water Reclamation Plant Des Plaines River Intercepting 66.458 L174621 May 2014 - 1,947,737 Sewer Rehabilitation, SSA Calumet TARP Pumping Station 66.458 L174923 May 2013 - 446,800 Improvements, Calumet WRP Wet Weather Treatment Facility 66.458 L174924 September 2013 - 2,474,400 and Reservoir, Lemont WRP TARP Control Structure 66.458 L174925 December 2013 - 289,400 Rehabilitation, NSA, SSA, CSA Disinfection Facilities at the 66.458 L174988 August 2013 - 1,165,500 Calumet WRP Disinfection Facilities at the 66.458 L174989 August 2013 - 1,914,100 Terrence J. O’Brien WRP Phosphorus Recovery Facility at 66.458 L175161 December 2014 - 7,206,400 Stickney WRP Coarse Screens and RSP Slide 66.458 L175164 September 2014 - 280,800 Gates Replacements at Egan WRP Rehab of Final Settling Tanks 11-14 66.458 L175172 October 2013 - 122,600 in Batteries A, B and C, OWRP Battery C Airlift & Air Main Rehab 66.458 L175222 November 2014 - 724,500 and Aeration Tanks 6-8 DP Rplc SWRP Total U.S. Environmental Protection Agency Funding of Capitalization Grants for Clean Water State Revolving Funds $22,392,837 Total Federal Expenditures $22,392,837
See Accompanying Notes to Schedule of Expenditures of Federal Awards.

Notes to Schedule of Expenditures of Federal AwardsYear ended December 31, 2015
SINGLE AUDIT SECTION 185
Note 1 – Basis of Presentation
The accompanying Schedule of Expenditures of Federal Awards (the “Schedule”) includes the federal award activity of the Metropolitan Water Reclamation District of Greater Chicago (the “District”) under programs of the federal government for the year ended December 31, 2015. The information in this Schedule is presented in accordance with the requirements of Title 2 U.S. Code of Federal Regulation Part 200, Uniform Administrative Requirements, Cost Principles, and Audit Requirements for Federal Awards (Uniform Guidance). Because the Schedule presents only a selected portion of the operations of the District, it is not intended to and does not present the fi nancial position and the respective change in fi nancial positon of the District.
Note 2 – Summary of Signifi cant Accounting Policies
Expenditures reported on the Schedule are reported on the accrual basis of accounting. Such expenditures are recognized following the cost principles contained in the Uniform Guidance, wherein certain types of expenditures are not allowable or are limited as to reimbursement. The District does not receive funding for indirect costs.
Note 3 – Program Descriptions
CFDA # 66.458 – Capitalization Grants for Clean Water State Revolving Funds
The Capitalization Grants for Clean Water State Revolving Funds create State Revolving Funds (SRFs) through a program of capitalization grants to states, which will provide a long-term source of state fi nancing for construction of wastewater treatment facilities and implementation of other water quality management activities. The capitalization grant is deposited in the SRF, which is used to provide loans and other types of fi nancial assistance, but no grants, to local communities and inter-municipal and interstate agencies. The States must agree to enter into binding commitments with recipients to provide fi nancial assistance from the SRF in an amount equal to 16.67% of the total SRF loan, with the federal share being 83.33%. Those loans awarded under the American Recovery and Reinvestment Act of 2009 (ARRA) are funded 50% from ARRA funds and 50% from SRFs. There were no loans awarded under ARRA for the year ended December 31, 2015.
Note 4 – Project Descriptions
Descriptions of projects, funded wholly or partially by federal sources, for which the District received funds during the year ended December 31, 2015:
State Revolving Fund Loans
Loan #L173076 was awarded to the District on December 18, 2014, under Public Law 95-217 (Federal Water Pollution Control Act). The loan provides for the Westside Primary Settling Tanks 1-9 and Aerated Grit Facility, SWRP, Project 04-128-3P. The maximum SRF loan amount is $80,000,000. The maximum pass through federal funding is $66,664,000. A total of $5,404,100 in federal funds was disbursed by the Illinois Environmental Protection Agency (IEPA) during fi scal year 2015. As of Decem-ber 31, 2015, $53,611,194 was outstanding. The outstanding amount is presented as a bond anticipation note in the District’s fi nancial statements.
Loan #L174558 was awarded to the District on May 8, 2012, under Public Law 95-217 (Federal Water Pollution Control Act). The loan provides for the Sludge Thickening Facilities at the Stickney Water Reclamation Plant, Project 09-176-3P. The maxi-mum SRF loan amount is $40,000,000. The maximum pass through federal funding is $33,332,000. A total of $416,500 in federal funds was disbursed by the IEPA during fi scal year 2015. As of December 31, 2015, $2,302,783 was outstanding. The outstanding amount is presented as a bond anticipation note in the District’s fi nancial statements.

Notes to Schedule of Expenditures of Federal AwardsYear ended December 31, 2015
186 SINGLE AUDIT SECTION
Note 4 – Project Descriptions – Continued
Loan #L174621 was awarded to the District on May 8, 2014, under Public Law 95-217 (Federal Water Pollution Control Act). The loan provides for Des Plaines River Intercepting Sewer Rehabilitation, SSA, Project 06-158-3S. The maximum SRF loan amount is $13,628,725. The maximum pass through federal funding is $11,356,817. A total of $1,947,737 in federal funds was disbursed by the IEPA during fi scal year 2015. As of December 31, 2015, $10,295,663 was outstanding. The outstanding amount is presented as a bond anticipation note in the District’s fi nancial statements. Loan #L174923 was awarded to the District on May 2, 2013, under Public Law 95-217 (Federal Water Pollution Control Act). The loan provides for Calumet TARP Pump Station Improvements, Project 06-212-3M. The maximum SRF loan amount is $32,893,059. The maximum pass through federal funding is $27,409,786. A total of $446,800 in federal funds was disbursed by the IEPA during fi scal year 2015. As of December 31, 2015, $15,405,089 was outstanding. The outstanding amount is presented as a bond anticipation note in the District’s fi nancial statements.
Loan #L174924 was awarded to the District on September 27, 2013, under Public Law 95-217 (Federal Water Pollution Con-trol Act). The loan provides for Wet Weather Treatment Facility and Reservoir at the Lemont WRP, Project 10-716-3P. The maximum SRF loan amount is $29,787,157. The maximum pass through federal funding is $24,821,638. A total of $2,474,400 in federal funds was disbursed by the IEPA during fi scal year 2015. As of December 31, 2015, $9,232,439 was outstanding. The outstanding amount is presented as a bond anticipation note in the District’s fi nancial statements.
Loan #L174925 was awarded to the District on December 13, 2013, under Public Law 95-217 (Federal Water Pollution Control Act). The loan provides for TARP Control Structure Rehabilitation, NSA, SSA, CSA, Project 10-880-3H. The maximum SRF loan amount is $14,828,138. The maximum pass through federal funding is $12,356,287. A total of $289,400 in federal funds was disbursed by the IEPA during fi scal year 2015. As of December 31, 2015, $2,116,102 was outstanding. The outstanding amount is presented as a bond anticipation note in the District’s fi nancial statements.
Loan #L174988 was awarded to the District on August 22, 2013, under Public Law 95-217 (Federal Water Pollution Control Act). The loan provides for Disinfection Facilities, Calumet WRP, Project 11-241-3P. The maximum SRF loan amount is $34,973,952. The maximum pass through federal funding is $29,143,794. A total of $1,165,500 in federal funds was disbursed by the IEPA during fi scal year 2015. As of December 31, 2015, $5,257,318 was outstanding. The outstanding amount is pre-sented as a bond anticipation note in the District’s fi nancial statements.
Loan #L174989 was awarded to the District on August 22, 2013, under Public Law 95-217 (Federal Water Pollution Control Act). The loan provides for Disinfection Facilities, Terrence J. O’Brien WRP, Project 11-054-3P. The maximum SRF loan amount is $66,136,932. The maximum pass through federal funding is $55,111,905. A total of $1,914,100 in federal funds was disbursed by the IEPA during fi scal year 2015. As of December 31, 2015, $19,531,167 was outstanding. The outstanding amount is presented as a bond anticipation note in the District’s fi nancial statements.
Loan #L175161 was awarded to the District on December 18, 2014, under Public Law 95-217 (Federal Water Pollution Con-trol Act). The loan provides for Phosphorus Recovery Facility, SWRP, Project 11-195-3P. The maximum SRF loan amount is $32,802,513. The maximum pass through federal funding is $27,334,334. A total of $7,206,400 in federal funds was disbursed by the IEPA during fi scal year 2015. As of December 31, 2015, $27,931,171 was outstanding. The outstanding amount is presented as a bond anticipation note in the District’s fi nancial statements.
Loan #L175164 was awarded to the District on September 16, 2014, under Public Law 95-217 (Federal Water Pollution Con-trol Act). The loan provides for Coarse Screens and RSP Slide Gates Replacement, EWRP, Project 11-405-3M. The maximum SRF loan amount is $2,795,420. The maximum pass through federal funding is $2,329,423. A total of $280,800 in federal funds was disbursed by the IEPA during fi scal year 2015. As of December 31, 2015, $1,967,120 was outstanding. The out-standing amount is presented as a bond anticipation note in the District’s fi nancial statements.

Notes to Schedule of Expenditures of Federal AwardsYear ended December 31, 2015
SINGLE AUDIT SECTION 187
Note 4 – Project Descriptions – Continued
Loan #L175172 was awarded to the District on October 30, 2013, under Public Law 95-217 (Federal Water Pollution Control Act). The loan provides for Rehabilitation of Final Settling Tanks 11, 12, 13 and 14 in Batteries A, B and C, OWRP, Project 08-041-3P. The maximum SRF loan amount is $2,758,546. The maximum pass through federal funding is $2,298,696. A total of $122,600 in federal funds was disbursed by the IEPA during fi scal year 2015. As of December 31, 2015, $402,042 was outstanding. The outstanding amount is presented as a bond anticipation note in the District’s fi nancial statements. Loan #L175222 was awarded to the District on November 19, 2014, under Public Law 95-217 (Federal Water Pollution Con-trol Act). The loan provides for Battery C Airlift and Air Main Rehabilitation and Aeration Tanks 6, 7 and 8 Diffuser Plate Replacement, SWRP, Project 09-181-3P. The maximum SRF loan amount is $5,021,765. The maximum pass through federal funding is $4,184,637. A total of $724,500 in federal funds was disbursed by the IEPA during fi scal year 2015. As of Decem-ber 31, 2015, $3,398,515 was outstanding. The outstanding amount is presented as a bond anticipation note in the District’s fi nancial statements.

Schedule of Findings and Questioned CostsYear ended December 31, 2015
188 SINGLE AUDIT SECTION
SECTION I – SUMMARY OF AUDITOR’S RESULTS
Financial Statements
Type of auditor’s report issued: Unmodifi ed
Internal control over fi nancial reporting:
Material weakness(es) identifi ed? Yes X No
Signifi cant defi ciency(ies) identifi ed? Yes X None reported
Noncompliance material to fi nancial statements noted? Yes X No
Federal Awards
Internal control over major programs:
Material weakness(es) identifi ed? Yes X No
Signifi cant defi ciency(ies) identifi ed? Yes X None reported
Type of auditor’s report issued on compliance for major programs: Unmodifi ed
Any audit fi ndings disclosed that are required to be reported in accordance with CFR 200.516(a)? Yes X No
Identifi cation of major programs:
U.S. Environmental Protection Agency
CFDA Number Name of Federal Program
66.458 Capitalization Grants for Clean Water State Revolving Funds
Dollar threshold used to distinguish between Type A and Type B programs: $750,000
Auditee qualifi ed as low-risk auditee? X Yes No

SINGLE AUDIT SECTION 189
Schedule of Findings and Questioned CostsYear ended December 31, 2015
SECTION II – FINANCIAL STATEMENT FINDINGS – Required to be Reported in Accordance with Governmental Auditing Standards
None
SECTION III – FEDERAL AWARD FINDINGS AND QUESTIONED COSTS
None
SECTION IV – SUMMARY OF PRIOR YEAR AUDIT FINDINGS
None

190 SINGLE AUDIT SECTION