2015 citizen satisfaction survey - cityofgp.com · c. c. 3 methodology banister research &...
TRANSCRIPT
Banister Research and Consulting Inc.
2015 Citizen Satisfaction Survey
May 8th, 2015
Ba
nis
ter R
esea
rc
h a
nd
Co
nsu
lt
ing
In
c.
Ba
nis
ter R
esea
rc
h a
nd
Co
nsu
lt
ing
In
c.
2
Table of Contents
2
I. Methodology 3
II. 2015 Highlights 4
III. Detailed Findings 7
Citizen Overview: Life in Grande Prairie Today 8
City Performance: Evaluating Program and Service Delivery 22
Tax Dollars and User Fees: Perceptions Related to City Finances 34
Contact and Communication: Perceptions Related to Customer Service and City Communications
42
Grande Prairie and The Web: Assessing Online Use 58
Growing City: Perceptions Related to Growth and Development 63
Grande Prairie and Snow Removal: Evaluating Snow Removal 67
IV. Demographics 72

Ba
nis
ter R
esea
rc
h a
nd
Co
nsu
lt
ing
In
c.
Ba
nis
ter R
esea
rc
h a
nd
Co
nsu
lt
ing
In
c.
3
Methodology
Banister Research & Consulting Inc. (Banister Research) conducted a telephone survey with a randomly selected sample of 400 Grande Prairie residents aged 18 years or older between April 7th and April 17th, 2015.
In order to obtain an accurate representation of the residents of Grande Prairie, a cell-phone data-set (n=40) was created and implemented for the 2015 survey.
Final data was weighted to ensure the overall sample’s age and gender composition reflects that of the Grande Prairie population aged 18 or older, according to the 2011 Federal Census data.
With a sample size of 400, results are considered accurate to within +/- 4.9 percentage points, 19 times out of 20.
Where possible, results for areas of citizen satisfaction are compared to 2011 and 2013.
3

Ba
nis
ter R
esea
rc
h a
nd
Co
nsu
lt
ing
In
c.
Ba
nis
ter R
esea
rc
h a
nd
Co
nsu
lt
ing
In
c.
4
2015 HighlightsPerceptions about the quality of life in Grande Prairie remains high, despite a decrease in 2015 While the decrease of respondents who agree that the ‘quality of life in Grande Prairie is
good’ is statistically significant, the overall percentage still remains high at 90% (compared to 95% in 2013).
Nearly one-third (29%) indicated that the quality of life in Grande Prairie has worsened in the past three years, a significant increase from 16% in 2013.
Community pride has slightly decreased in strength. While 80% of respondents agreed ‘I am proud to live in Grande Prairie’, (comparable to 84%
in 2013), 77% agreed that ‘Grande Prairie is a great community to raise a family (a significant decrease from 87% in 2013).
The local economic outlook is not as promising as it was reported in 2013. Agreement that Grande Prairie ‘has a vibrant and healthy local economy’ currently stands at
82% - a statistically significant decrease from 94% in 2013.
Safety is an Issue in Grande Prairie. Agreement with the statement that ‘Grande Prairie is a place where residents feel safe and
secure’ experienced a significant 20 percentage points decrease from 78% in 2013 to 58% in 2015.
The most frequently given reason for perceptions of a worsened quality of life was “crime/drugs”, with 59% of responses.
4

Ba
nis
ter R
esea
rc
h a
nd
Co
nsu
lt
ing
In
c.
Ba
nis
ter R
esea
rc
h a
nd
Co
nsu
lt
ing
In
c.
5
2015 HighlightsThe City of Grande Prairie has realized significant decreases in performance ratings. Close to eight-in-ten (79%) respondents were satisfied with the overall level and quality of
services and programs – a significant decrease from 86% reported in 2013.
With the exception of City Infrastructure Services, all services experienced a decrease in satisfaction ratings compared to 2013.
Satisfaction with City Infrastructure Services has improved. Three-fifths of respondents (60%) were satisfied with City Infrastructure Services – a
significant increase from 48% in 2013.
Customer Service Satisfaction has remained consistent. Among those who contacted the City in the last 12 months, 75% were satisfied with the
contact – comparable to 79% in 2013.
The perceived value received from property taxes is comparable to 2013. While the number of respondents who provided a ‘good value’ rating is still short of a
majority at 34%, it is comparable to 39% reported in 2013.
5
Ba
nis
ter R
esea
rc
h a
nd
Co
nsu
lt
ing
In
c.
Ba
nis
ter R
esea
rc
h a
nd
Co
nsu
lt
ing
In
c.
6
2015 HighlightsSatisfaction with snow removal has significant improvement. Currently, roughly two-thirds or respondents (66%) are satisfied with the City of Grande
Prairie’s snow removal performance – a significant 18 percentage point improvement from 2013 where under half (48%) were satisfied.
Among the one-third who are dissatisfied, the most frequent reason given was “plows leave ridges/piles of snow on residential property” (43%).
6

Banister Research and Consulting Inc.
7
Detailed Findings:Life in Grande Prairie Today
Ba
nis
ter R
esea
rc
h a
nd
Co
nsu
lt
ing
In
c.
Ba
nis
ter R
esea
rc
h a
nd
Co
nsu
lt
ing
In
c.
8
Citizen Overview: Issue Agenda
“Roads, infrastructure and potholes” occupies the top position on the issue agenda
• In 2015, 44% of Grande Prairie residents cite “improve the roads/infrastructure/potholes” as an important issue, while 28% say it is the most important issue.
• This is far ahead of “lower crime rate/improve street safety” (22%) which replaced “lower taxes/taxes are too high” (18%) as the second most important issue.
• Other important issues included “improve snow and ice removal” (13%), “synchronize traffic lights” (19%) and “increase sanitation” (8%).
8

Ba
nis
ter R
esea
rc
h a
nd
Co
nsu
lt
ing
In
c.
Ba
nis
ter R
esea
rc
h a
nd
Co
nsu
lt
ing
In
c.
9
Top-of-Mind Issues (Top Responses)*
Improving roads/infrastructure/potholes – 44%
Lower crime rate/improve street safety – 22%
Lower taxes/taxes are too high – 16%
Improve snow/ice removal services – 13%
Improve/synchronize traffic lights/control/road safety – 11%
What is the most important local issue facing the City today?
n=400*Multiple responses
9

Ba
nis
ter R
esea
rc
h a
nd
Co
nsu
lt
ing
In
c.
Ba
nis
ter R
esea
rc
h a
nd
Co
nsu
lt
ing
In
c.
10
Base: All respondents (n=400)*roundingQ1. In your view, as a resident of the City of Grande Prairie, what is the most important LOCAL issue facing the City today, that is the one issue you feel should receive the greatest attention from your local leaders? What is the next most important local issue facing the City?
Top-of-Mind Issues
10
9%
1%
10%
2
2
2
2
3
3
3
3
6%
8%
11%
18%
28%
10%
1
1
1
1
1%
3%
4%
5%
5%
6%
5%
4%
16%
9%
19%*
3%
3%
3%
3%
4%
6%
7%
8%
11%
13%
16%
22%
44%
0% 10% 20% 30% 40% 50% 60% 70% 80% 90% 100%
Don't Know/Not Stated
None/nothing
Other (3% of responses or less)
City growth
Lack of affordable/low income housing
Healthcare/need new hospital
Improve economy/lack of jobs
Fiscal responsibility
Improve quality/number of schools
Increase community activities
Sanitation/City cleanliness
Synchronize traffic lights
Improve snow/ice removal
Lower taxes
Lower crime rate
Improve roads/infrastructure
First Mention Second Mention
Ba
nis
ter R
esea
rc
h a
nd
Co
nsu
lt
ing
In
c.
Ba
nis
ter R
esea
rc
h a
nd
Co
nsu
lt
ing
In
c.
11
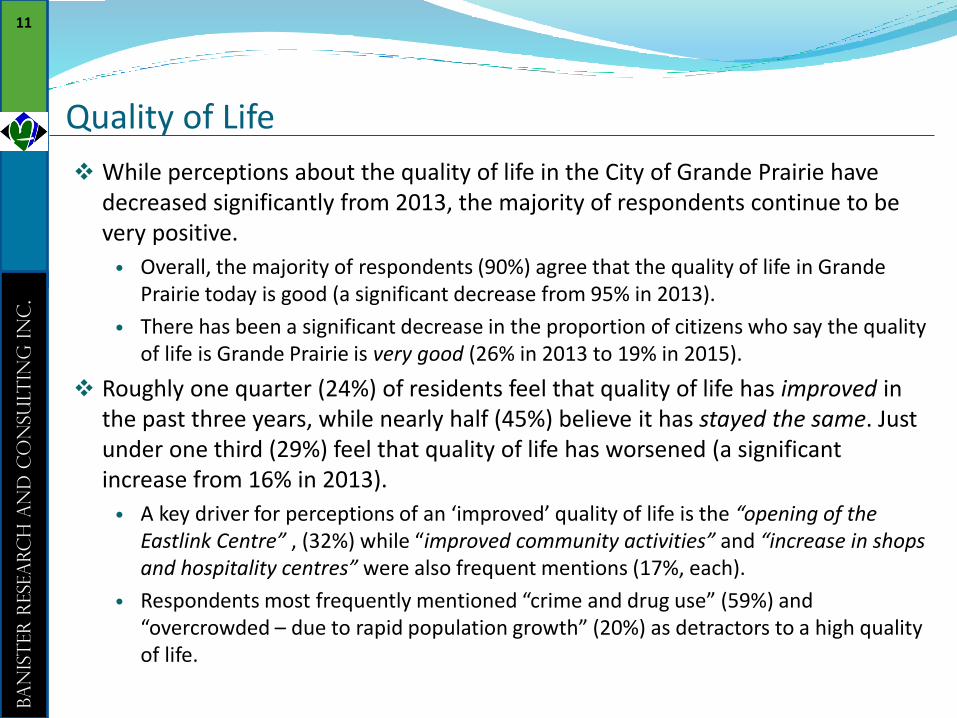
Quality of Life
While perceptions about the quality of life in the City of Grande Prairie have decreased significantly from 2013, the majority of respondents continue to be very positive.
• Overall, the majority of respondents (90%) agree that the quality of life in Grande Prairie today is good (a significant decrease from 95% in 2013).
• There has been a significant decrease in the proportion of citizens who say the quality of life is Grande Prairie is very good (26% in 2013 to 19% in 2015).
Roughly one quarter (24%) of residents feel that quality of life has improved in the past three years, while nearly half (45%) believe it has stayed the same. Just under one third (29%) feel that quality of life has worsened (a significant increase from 16% in 2013).
• A key driver for perceptions of an ‘improved’ quality of life is the “opening of the Eastlink Centre” , (32%) while “improved community activities” and “increase in shops and hospitality centres” were also frequent mentions (17%, each).
• Respondents most frequently mentioned “crime and drug use” (59%) and “overcrowded – due to rapid population growth” (20%) as detractors to a high quality of life.
11

Ba
nis
ter R
esea
rc
h a
nd
Co
nsu
lt
ing
In
c.
Ba
nis
ter R
esea
rc
h a
nd
Co
nsu
lt
ing
In
c.
12
Poor2015: 10%2013: 5%2011: 8%
1%
7%
74%
19%
1%
4%
69%
26%
1%
8%
71%
19%
0% 10% 20% 30% 40% 50% 60% 70% 80% 90% 100%
2015 (n=400) 2013 (n=405) 2011 (n=400)
Very good
Good
Poor
Very poor
Overall Quality of Life in Grande Prairie
12
Base: All respondentsQ2. How would you rate the overall quality of life in the City of Grande Prairie today?
Good2015: 90%2013: 95%2011: 92%
↑↓ Denotes statistically significant increase or decrease from 2013 to 2015
↓
↓
↑
↑

Ba
nis
ter R
esea
rc
h a
nd
Co
nsu
lt
ing
In
c.
Ba
nis
ter R
esea
rc
h a
nd
Co
nsu
lt
ing
In
c.
13
Improved
Stayed the same
Worsened
Don’t Know
2%
19%
55%
24%
4%
16%
51%
28%
2%
29%
45%
24%
0% 10% 20% 30% 40% 50% 60% 70% 80% 90% 100%
2015 (n=400) 2013 (n=405) 2011 (n=400)
Perceived Change in Quality of Life in Grande Prairie
13
Base: All respondentsQ3. And, do you feel that the quality of life in the City of Grande Prairie in the past three years has…?
↑ Denotes statistically significant increase from
2013 to 2015
↑

Ba
nis
ter R
esea
rc
h a
nd
Co
nsu
lt
ing
In
c.
Ba
nis
ter R
esea
rc
h a
nd
Co
nsu
lt
ing
In
c.
14
*Multiple responses Base: Respondents who say quality of life has improved in the past 3 years (n=90) Q4a. Why do you think the quality of life has IMPROVED?
Reasons for Improved Quality of Life*
14
2%
6%
5%
6%
7%
8%
8%
9%
11%
15%
17%
17%
32%
0% 20% 40% 60% 80% 100%
Don't Know/Not Stated
Other (all mentions of 2% or less)
Sense of community
Schools/educational facilities
Increase in parks/green spaces
Improved street maintenance/snow and ice removal
Improved employment opportunities
Improved infrastructure
Improved/more services
More City growth/development
Shops/industries/hospitality centres
Improved community activities
Opening of Eastlink Centre

Ba
nis
ter R
esea
rc
h a
nd
Co
nsu
lt
ing
In
c.
Ba
nis
ter R
esea
rc
h a
nd
Co
nsu
lt
ing
In
c.
15
59%
20%
9%
9%
8%
8%
7%
5%
4%
3%
10%
1%
0% 20% 40% 60% 80% 100%
Crime / drugs
Overcrowded
Transients / homeless people
Infrastructure / roads
Taxes
Cost of living
Economy / recession
Traffic issues / bad driving
Inadequate / expensive housing
Lack of quality services / facilities
Other
Don’t know / Not stated
*Multiple responses Base: Respondents who say quality of life has worsened in the past 3 years (n=127) Q4b. Why do you think the quality of life has WORSENED?
Reasons for Deteriorated Quality of Life*
15
Ba
nis
ter R
esea
rc
h a
nd
Co
nsu
lt
ing
In
c.
Ba
nis
ter R
esea
rc
h a
nd
Co
nsu
lt
ing
In
c.
16
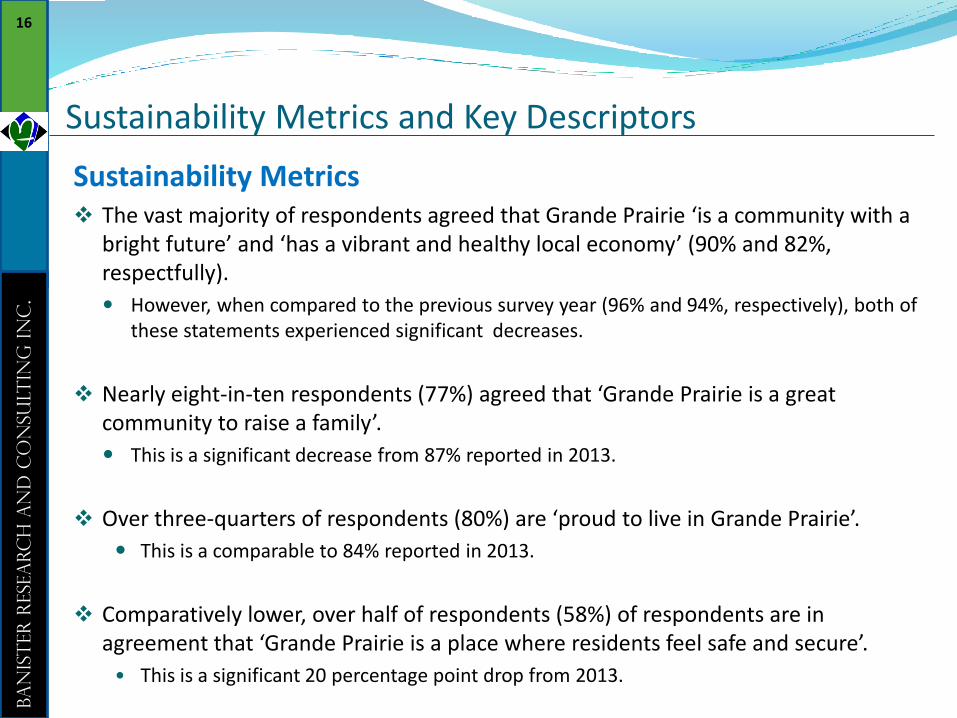
Sustainability Metrics and Key Descriptors
Sustainability Metrics The vast majority of respondents agreed that Grande Prairie ‘is a community with a
bright future’ and ‘has a vibrant and healthy local economy’ (90% and 82%, respectfully).
However, when compared to the previous survey year (96% and 94%, respectively), both of these statements experienced significant decreases.
Nearly eight-in-ten respondents (77%) agreed that ‘Grande Prairie is a great community to raise a family’.
This is a significant decrease from 87% reported in 2013.
Over three-quarters of respondents (80%) are ‘proud to live in Grande Prairie’.
This is a comparable to 84% reported in 2013.
Comparatively lower, over half of respondents (58%) of respondents are in agreement that ‘Grande Prairie is a place where residents feel safe and secure’.
• This is a significant 20 percentage point drop from 2013.
16

Ba
nis
ter R
esea
rc
h a
nd
Co
nsu
lt
ing
In
c.
Ba
nis
ter R
esea
rc
h a
nd
Co
nsu
lt
ing
In
c.
17
Sustainability Metrics and Key Descriptors
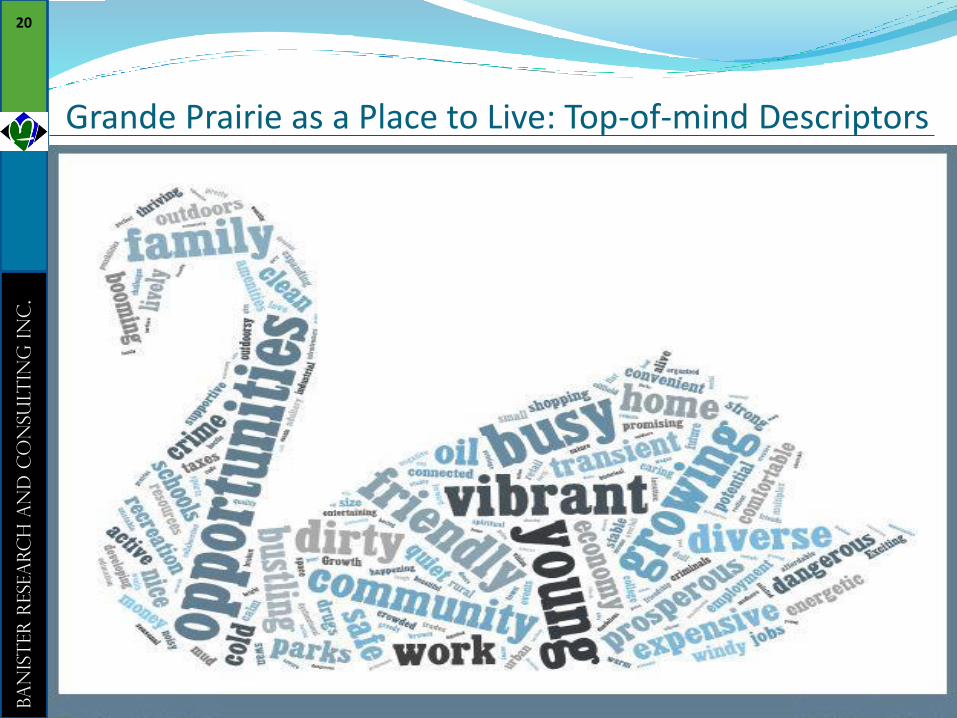
Key Descriptors When asked “what three words do you think best describe Grande Prairie as a place to
live, overall”, 83% of respondents offered positive descriptors, while just 17% provided negative descriptors.
A wide array of words were used, with “growing/booming” (11%), “jobs/employment” (10%), “busy” (9%), “vibrant/energetic” (8%), “opportunity” (7%), “friendly” (7%), “young” (6%) and “good/stable” (6%) each garnering more than 5% of mentions.
17
Ba
nis
ter R
esea
rc
h a
nd
Co
nsu
lt
ing
In
c.
Ba
nis
ter R
esea
rc
h a
nd
Co
nsu
lt
ing
In
c.
18
80%
84%
83%
77%
87%
84%
35%
50%
45%
55%
45%
45%
8%
4%
7%
Grande Prairie is a community
with a bright future
2015
2013
2011
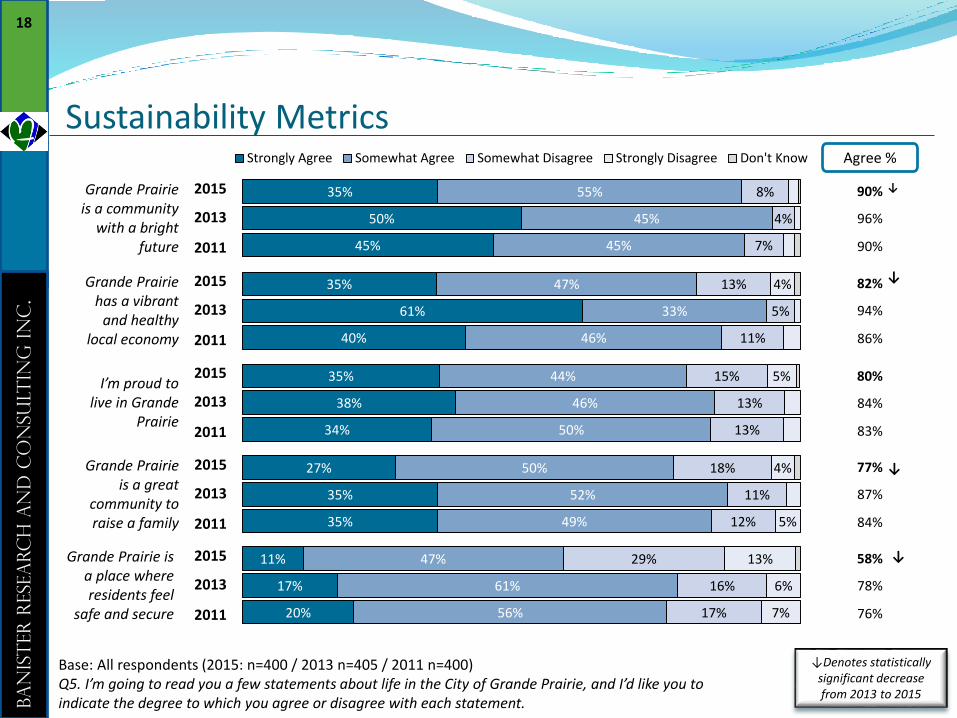
Base: All respondents (2015: n=400 / 2013 n=405 / 2011 n=400)Q5. I’m going to read you a few statements about life in the City of Grande Prairie, and I’d like you to indicate the degree to which you agree or disagree with each statement.
Sustainability Metrics
18
Agree %
90%
96%
90%
35%
61%
40%
47%
33%
46%
13%
5%
11%
4%Grande Prairie has a vibrant
and healthy local economy
2015
2013
2011
11%
17%
20%
47%
61%
56%
29%
16%
17%
13%
6%
7%
Grande Prairie is a place where residents feel
safe and secure
2015
2013
2011
82%
94%
86%
58%
78%
76%
Strongly Agree Somewhat Agree Somewhat Disagree Strongly Disagree Don't Know
↓Denotes statistically significant decrease from 2013 to 2015
↓
↓
↓
27%
35%
35%
50%
52%
49%
18%
11%
12%
4%
5%
Grande Prairie is a great
community to raise a family
2015
2013
2011
35%
38%
34%
44%
46%
50%
15%
13%
13%
5%I’m proud to live in Grande
Prairie
2015
2013
2011
↓

Ba
nis
ter R
esea
rc
h a
nd
Co
nsu
lt
ing
In
c.
Ba
nis
ter R
esea
rc
h a
nd
Co
nsu
lt
ing
In
c.
19
*Multiple responses Base: All respondents (n=400)Q6. What three words, images or phrases do you think best describe Grande Prairie as a place to live, overall?
Grande Prairie as a Place to Live: Top of Mind Descriptors*
19
19%
48%
4%
4%
17%
4%
4%
4%
4%
5%
5%
5%
6%
6%
7%
7%
8%
9%
10%
11%
83%
0% 10% 20% 30% 40% 50% 60% 70% 80% 90%
Don't Know
Other (all mentions of 4% or less)
Dirty/unclean
Crime/increased crime levels
Negative (NET)
Good place to live
Potential/bright future
Family oriented
Parks/green/outdoor space
Good services/amenities
Small/small city
Community oriented
Good/stable economy
Young
Friendly
Opportunity
Vibrant/energetic
Busy
Jobs/employment
Growing/booming
Positive (NET)
201375% Positive, 15% Negative
Most frequent positive words•Growing/booming – 12%•Busy – 8%•Good/alright – 8%
Most frequent negative words•Expensive – 4%•Windy – 4%
Ba
nis
ter R
esea
rc
h a
nd
Co
nsu
lt
ing
In
c.
Ba
nis
ter R
esea
rc
h a
nd
Co
nsu
lt
ing
In
c.
20
Grande Prairie as a Place to Live: Top-of-mind Descriptors
20

Banister Research and Consulting Inc.
21
City Performance:Evaluating Program and
Service Delivery

Ba
nis
ter R
esea
rc
h a
nd
Co
nsu
lt
ing
In
c.
Ba
nis
ter R
esea
rc
h a
nd
Co
nsu
lt
ing
In
c.
22
Overall Satisfaction with City Programs and Services
Over three-quarters of respondents (79%) are satisfied with the overall level and quality of services and programs provided by the City of Grande Prairie.
Strength of satisfaction is tempered with just 15% of respondents indicating they are very satisfied, while 64% were somewhat satisfied.
Overall satisfaction experienced a significant decrease compared to 2013 survey results (79% versus 86% in 2013).
22

Ba
nis
ter R
esea
rc
h a
nd
Co
nsu
lt
ing
In
c.
Ba
nis
ter R
esea
rc
h a
nd
Co
nsu
lt
ing
In
c.
23
4%
16%
67%
13%
3%
11%
69%
16%
3%
16%
64%
15%
0% 10% 20% 30% 40% 50% 60% 70% 80% 90% 100%
2015 (n=400) 2013 (n=405) 2011 (n=400)
Dissatisfied2015: 19%2013: 14%2011: 20%
Very satisfied
Somewhat satisfied
Not very satisfied
Not at all satisfied
Overall Satisfaction with City Programs and Services
23
Base: All respondentsQ7. Please tell me how satisfied you are with the overall level and quality of services and programs provided bythe City of Grande Prairie. Are you…?
Satisfied2015: 79%↓
2013: 86%2011: 80%

Ba
nis
ter R
esea
rc
h a
nd
Co
nsu
lt
ing
In
c.
Ba
nis
ter R
esea
rc
h a
nd
Co
nsu
lt
ing
In
c.
24
City Performance: Importance and Satisfaction with Services and Programs
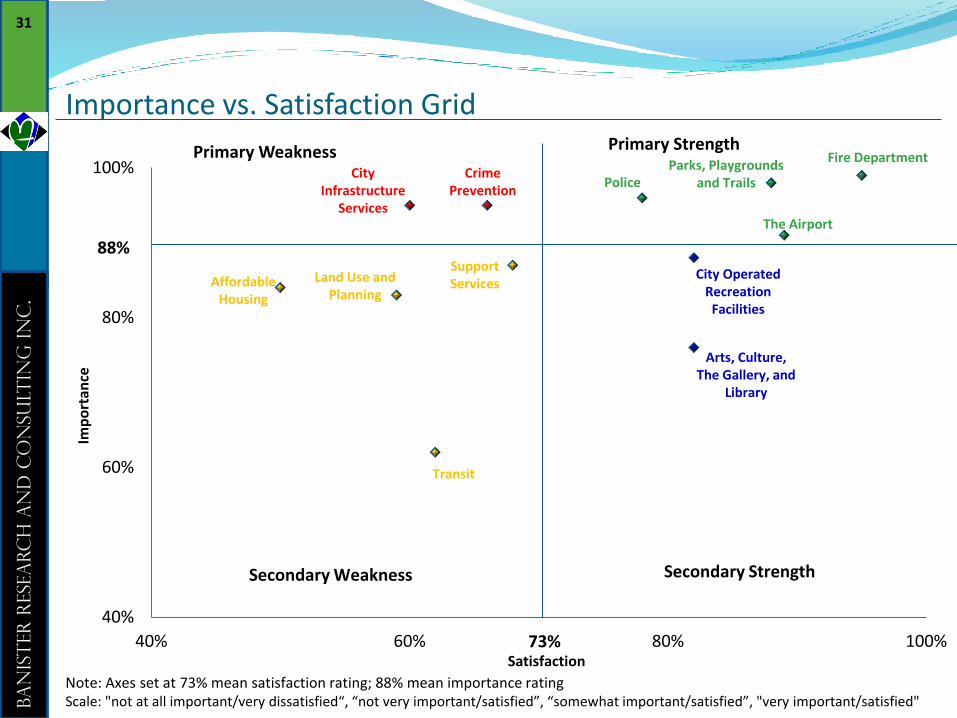
With the exception of Transit at 62%, at least three-quarters of respondents deemed all 12 programs and services evaluated to be important.
• There were no increases to importance ratings compared to 2013. With the exception of ‘Parks, playgrounds and trails’, ‘City Infrastructure Services’, and ‘Support Services for families’, all services experienced a significant decrease in importance ratings.
• Considering very important ratings, the ‘Fire Department’ (87%), ‘The Police/Enforcement’ (80%), and ‘Crime prevention’ (80%) emerged on top, as they did in 2013. Just like in 2013, ‘Arts, culture, The Gallery and Library’ (38%) and ‘Transit’ (26%) were at the other end of the spectrum.
Satisfaction with City programs and services varies tremendously.
• Satisfaction is highest for ‘The Fire Department’, with 95% satisfied and 68% very satisfied (a significant decrease from 98% satisfied and 81% very satisfied).
• Another significant change included an 18 percentage point increase in overall satisfaction with ‘City Infrastructure Services’ (from 42% in 2013 to 60% in 2015).
Those who have lived in Grande Prairie for 5 years or less were significantly more likely to be satisfied with Land Use and Planning and City Operated Recreation Facilities (versus those who have lived in Grande Prairie for 11 years or more).
24

Ba
nis
ter R
esea
rc
h a
nd
Co
nsu
lt
ing
In
c.
Ba
nis
ter R
esea
rc
h a
nd
Co
nsu
lt
ing
In
c.
25
Importance of Services and Programs
25
26%
38%
41%
52%
52%
51%
59%
74%
80%
63%
80%
87%
36%
38%
42%
32%
34%
37%
31%
21%
15%
33%
16%
12%
0% 20% 40% 60% 80% 100%
Transit
Arts, Culture, The Gallery, and Library
Land Use and Planning
Affordable Housing
Support Services for Families
City Operated Recreational Facilities
The Airport
City Infrastucture Services
Crime Prevention
Parks, Playgrounds, and Trails
Police/Enforcement
Fire Department
Very Important Somewhat Important
Changes 2013 to 2015
99% -1↓
96% -3↓
95% -4↓
95% -2
88% -9↓
96% -1
83% -11↓
76% -10 ↓
62% -8↓
91%* -4↓
87%* -3
84% -6↓
Base: All respondents (n=400)Q8. I’m going to read you a list of programs and services provided to you by the City of Grande Prairie. Please tell me how important each one is to you. *Rounding ↓Indicates a significant decrease from the previous survey year

Ba
nis
ter R
esea
rc
h a
nd
Co
nsu
lt
ing
In
c.
Ba
nis
ter R
esea
rc
h a
nd
Co
nsu
lt
ing
In
c.
26
Tracking Importance of City Programs and Services
26
Base: All respondentsQ8. I’m going to read you a list of programs and services provided to you by the City of Grande Prairie. Please tell me how important each one is to you. ↓ Indicates a significant decrease from the previous survey year *Percentage of respondents who rated each City program or service as “very important”
76%
77%
89%
92%
85%
95%
83%
78%
88%
93%
89%
98%
59%↓
63%↓
74%↓
80%↓
80%↓
87%↓
0% 20% 40% 60% 80% 100%
The Airport
Parks, Playgrounds and Trails
City Infrastructure Services
The Police/Enforcement
Crime Prevention
The Fire Department
2015 (n=400) 2013 (n=405) 2011 (n=400)

Ba
nis
ter R
esea
rc
h a
nd
Co
nsu
lt
ing
In
c.
Ba
nis
ter R
esea
rc
h a
nd
Co
nsu
lt
ing
In
c.
27
Tracking Importance of City Programs and Services* (cont’d)
27
Base: All respondentsQ8. I’m going to read you a list of programs and services provided to you by the City of Grande Prairie. Please tell me how important each one is to you. ↓ Indicates a significant decrease from the previous survey year*Percentage of respondents who rated each City program or service as “very important”
39%
48%
60%
70%
72%
71%
44%
48%
67%
74%
72%
64%
26%↓
38%↓
41%↓
51%↓
52%↓
52%↓
0% 20% 40% 60% 80% 100%
Transit
Arts, Culture, The Gallery, andLibrary
Land Use and Planning
City Operated RecreationalFacilities
Support Services
Affordable Housing
2015 (n=400) 2013 (n=405) 2011 (n=400)

Ba
nis
ter R
esea
rc
h a
nd
Co
nsu
lt
ing
In
c.
Ba
nis
ter R
esea
rc
h a
nd
Co
nsu
lt
ing
In
c.
28
Satisfaction with City Services and Programs
28
9%
8%
11%
20%
15%
22%
30%
36%
36%
41%
38%
68%
41%
51%
49%
42%
51%
46%
47%
46%
46%
47%
51%
27%
0% 20% 40% 60% 80% 100%
Affordable Housing
Land Use and Planning
City Infrastucture Services
Transit
Crime Prevention
Support Services for Families
Police/Enforcement
Arts, Culture, The Gallery, and Library
City Operated Recreational Facilities
Parks, Playgrounds, and Trails
The Airport
Fire Department
Very Satisfied Somewhat Satisfied
Changes 2013 to 2015
95% -3↓
89% -5↓
82% -3
82% -8↓
68% -13↓
88% -3
60% +18↑
59% -11↓
50% -8↓
78%* -8↓
66% -14↓
62%* -10↓
Base: All respondents (n=400)Q9. And, how satisfied are you with the job the City is doing in providing this program or service? Are you…? *Rounding ↑↓Denotes statistically significant increase or decrease from 2013 to 2015

Ba
nis
ter R
esea
rc
h a
nd
Co
nsu
lt
ing
In
c.
Ba
nis
ter R
esea
rc
h a
nd
Co
nsu
lt
ing
In
c.
29
Tracking Satisfaction with City Programs and Services*
29
Base: All respondentsQ9. And, how satisfied are you with the job the City is doing in providing this program or service? *Percentage of respondents who were “very satisfied” with each City program or service
40%
31%
45%
49%
43%
77%
41%
40%
42%
53%
47%
81%
30%↓
36%
36%
38%↓
41%
68% ↓
0% 20% 40% 60% 80% 100%
The Police/Enforcement
City Operated Recreational Facilities
Arts, Culture, The Gallery, andLibrary
The Airport
Parks, Playgrounds, and Trails
The Fire Department
2015 (n=400) 2013 (n=405) 2011 (n=400)
↓Denotes statistically significant decrease from 2013 to 2015

Ba
nis
ter R
esea
rc
h a
nd
Co
nsu
lt
ing
In
c.
Ba
nis
ter R
esea
rc
h a
nd
Co
nsu
lt
ing
In
c.
30
Tracking Satisfaction with City Programs and Services* (cont’d)
30
Base: All respondentsQ9. And, how satisfied are you with the job the City is doing in providing this program or service?*Percentage of respondents who were “very satisfied” with each City program or service
10%
10%
3%
25%
23%
19%
13%
8%
8%
25%
28%
22%
8%↓
9%
11%
15%↓
20%↓
22%
0% 20% 40% 60% 80% 100%
Land Use and Planning
Affordable Housing
City Infrastructure Services
Crime Prevention
Transit
Support Services
2015 (n=400) 2013 (n=405) 2011 (n=400)
↓Denotes statistically significant decrease from
2013 to 2015
Ba
nis
ter R
esea
rc
h a
nd
Co
nsu
lt
ing
In
c.
Ba
nis
ter R
esea
rc
h a
nd
Co
nsu
lt
ing
In
c.
31
Importance vs. Satisfaction Grid
31
40%
60%
80%
100%
40% 60% 80% 100%
Transit
Parks, Playgrounds and Trails
Fire Department
The Airport
Police
Arts, Culture, The Gallery, and
Library
City Operated Recreation Facilities
Crime Prevention
City Infrastructure
Services
Affordable Housing
Land Use and Planning
Support Services
88%
73%Satisfaction
Imp
ort
ance
Note: Axes set at 73% mean satisfaction rating; 88% mean importance ratingScale: "not at all important/very dissatisfied“, “not very important/satisfied”, “somewhat important/satisfied”, "very important/satisfied"
Secondary Strength Secondary Weakness
Primary Strength Primary Weakness
Ba
nis
ter R
esea
rc
h a
nd
Co
nsu
lt
ing
In
c.
Ba
nis
ter R
esea
rc
h a
nd
Co
nsu
lt
ing
In
c.
32
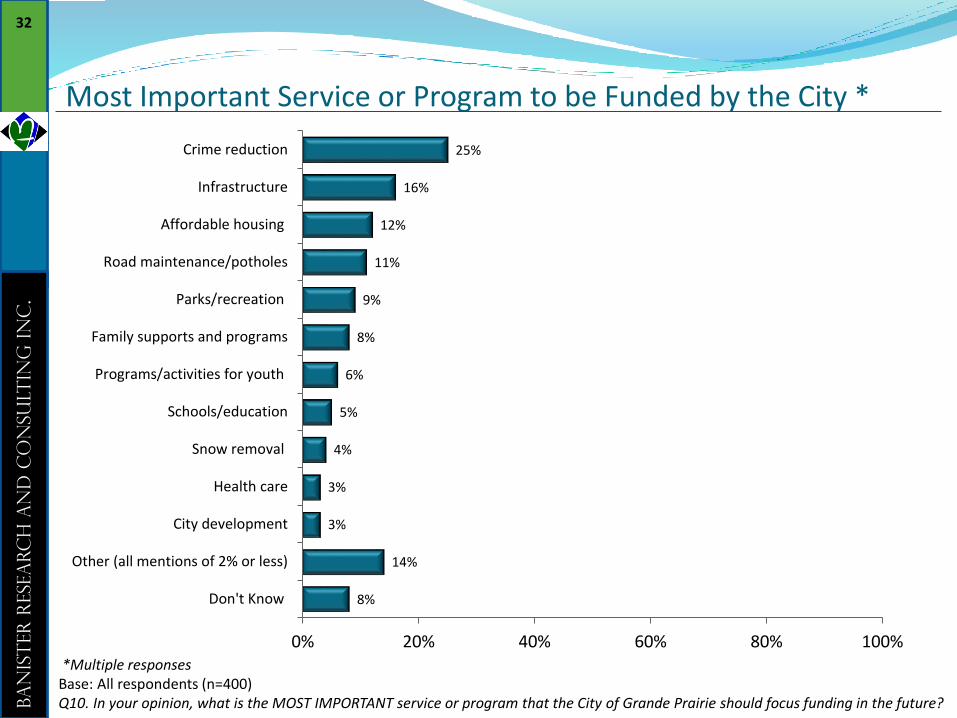
*Multiple responses Base: All respondents (n=400)Q10. In your opinion, what is the MOST IMPORTANT service or program that the City of Grande Prairie should focus funding in the future?
Most Important Service or Program to be Funded by the City *
32
8%
14%
3%
3%
4%
5%
6%
8%
9%
11%
12%
16%
25%
0% 20% 40% 60% 80% 100%
Don't Know
Other (all mentions of 2% or less)
City development
Health care
Snow removal
Schools/education
Programs/activities for youth
Family supports and programs
Parks/recreation
Road maintenance/potholes
Affordable housing
Infrastructure
Crime reduction
Banister Research and Consulting Inc.
33
Tax Dollars and User Fees:Perceptions Related to City Finances
Ba
nis
ter R
esea
rc
h a
nd
Co
nsu
lt
ing
In
c.
Ba
nis
ter R
esea
rc
h a
nd
Co
nsu
lt
ing
In
c.
34
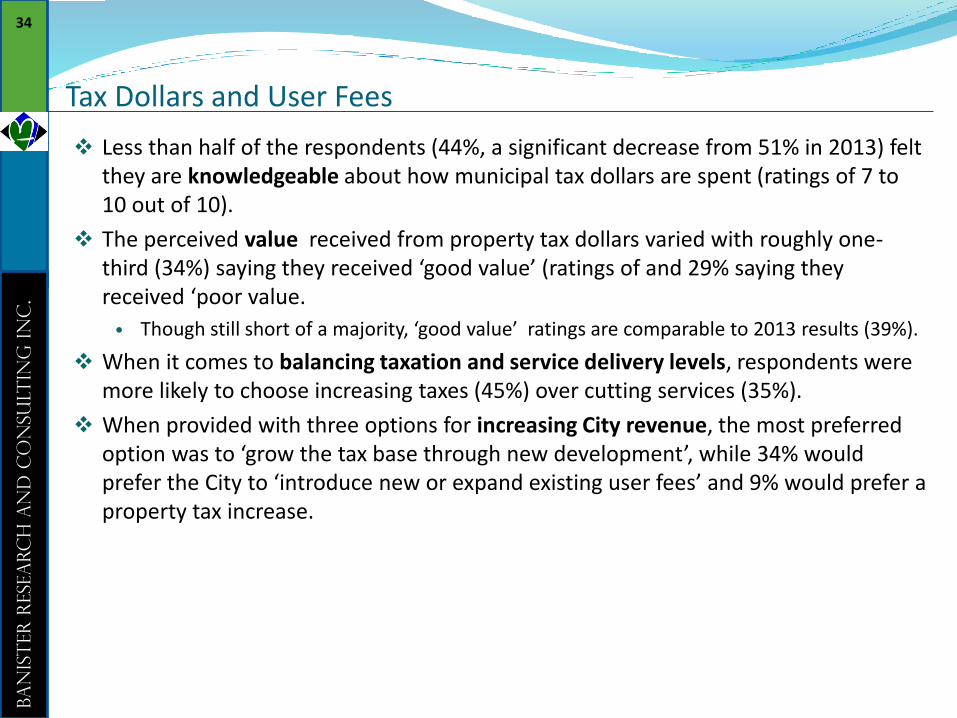
Tax Dollars and User Fees
Less than half of the respondents (44%, a significant decrease from 51% in 2013) felt they are knowledgeable about how municipal tax dollars are spent (ratings of 7 to 10 out of 10).
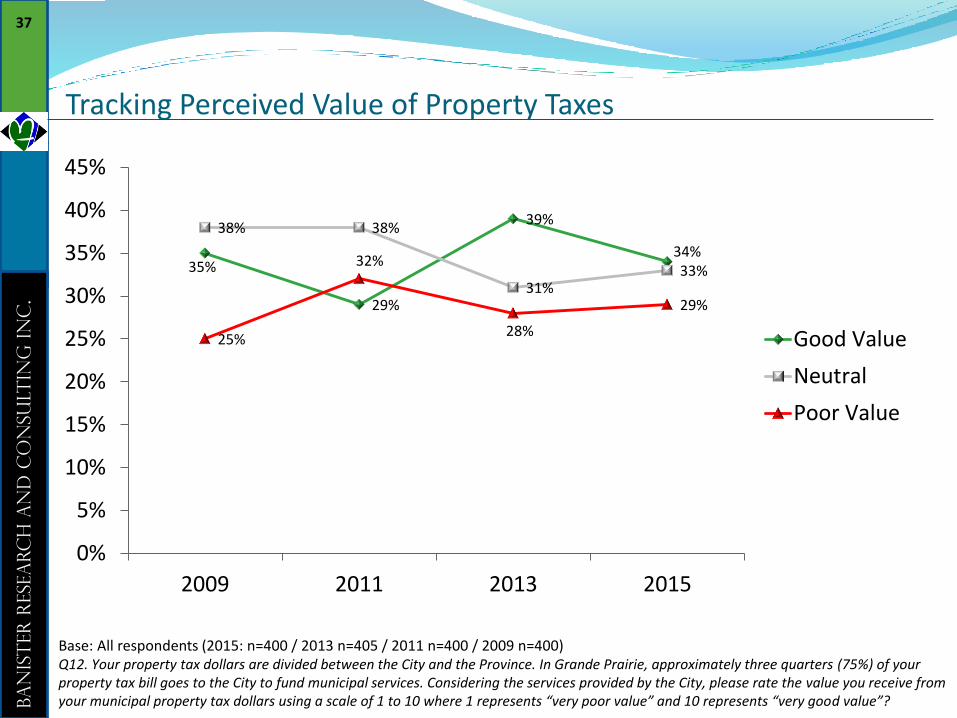
The perceived value received from property tax dollars varied with roughly one-third (34%) saying they received ‘good value’ (ratings of and 29% saying they received ‘poor value.
• Though still short of a majority, ‘good value’ ratings are comparable to 2013 results (39%).
When it comes to balancing taxation and service delivery levels, respondents were more likely to choose increasing taxes (45%) over cutting services (35%).
When provided with three options for increasing City revenue, the most preferred option was to ‘grow the tax base through new development’, while 34% would prefer the City to ‘introduce new or expand existing user fees’ and 9% would prefer a property tax increase.
34

Ba
nis
ter R
esea
rc
h a
nd
Co
nsu
lt
ing
In
c.
Ba
nis
ter R
esea
rc
h a
nd
Co
nsu
lt
ing
In
c.
35
15%
33%
43%
9%
14%
34%
43%
8%
17%
39%
37%
8%
0% 20% 40% 60% 80% 100%
2015 (n=400) 2013 (n=405) 2011 (n=400)
Very knowledgeable
Somewhat knowledgeable
Not very knowledgeable
Not at all knowledgeable
Perceived Knowledge Levels of Municipal Tax Dollar Spending
35
Base: All respondentsQ11. Thinking about how the City of Grande Prairie government is run, and what services it provides, would you say you are very, somewhat, not very, or not at all knowledgeable about how municipal dollars are spent?
Knowledgeable2015: 44%↓
2013: 51%2011: 52%
↓ Denotes statistically significant decrease from 2013 to 2015

Ba
nis
ter R
esea
rc
h a
nd
Co
nsu
lt
ing
In
c.
Ba
nis
ter R
esea
rc
h a
nd
Co
nsu
lt
ing
In
c.
36
Perceived Value of Property Taxes
36
Base: All respondentsQ12. Your property tax dollars are divided between the City and the Province. In Grande Prairie, approximately three quarters (75%) of your property tax bill goes to the City to fund municipal services. Considering the services provided by the City, please rate the value you receive from your municipal property tax dollars using a scale of 1 to 10 where 1 represents “very poor value” and 10 represents “very good value”?
2%
4%
6%
9%
8%
17%
14%
24%
9%
3%
3%
4%
5%
4%
8%
12%
19%
14%
19%
11%
2%
3%
0% 20% 40% 60% 80% 100%
Don't know
Very poor value -1
2
3
4
5
6
7
8
9
Very good value - 10
2015 (n=400) 2013 (n=405)
Good Value: 2015: 34%*2013: 39%
Poor Value: 2015: 29%
2013: 28%*
Mean: 2015: 5.52013: 5.5
*Rounding
Ba
nis
ter R
esea
rc
h a
nd
Co
nsu
lt
ing
In
c.
Ba
nis
ter R
esea
rc
h a
nd
Co
nsu
lt
ing
In
c.
37
Tracking Perceived Value of Property Taxes
37
Base: All respondents (2015: n=400 / 2013 n=405 / 2011 n=400 / 2009 n=400)Q12. Your property tax dollars are divided between the City and the Province. In Grande Prairie, approximately three quarters (75%) of your property tax bill goes to the City to fund municipal services. Considering the services provided by the City, please rate the value you receive from your municipal property tax dollars using a scale of 1 to 10 where 1 represents “very poor value” and 10 represents “very good value”?
35%
29%
39%
34%
38% 38%
31%33%
25%
32%
28%
29%
0%
5%
10%
15%
20%
25%
30%
35%
40%
45%
2009 2011 2013 2015
Good Value
Neutral
Poor Value

Ba
nis
ter R
esea
rc
h a
nd
Co
nsu
lt
ing
In
c.
Ba
nis
ter R
esea
rc
h a
nd
Co
nsu
lt
ing
In
c.
38
Balancing Taxation and Service Delivery Levels
38
Base: All respondents*“It depends” was added as a response option in 2015. Data may, therefore, not be comparable to previous years, and any comparisons should be interpreted with cautionQ13. Municipal property taxes are the primary way to pay for services and programs provided by the City of Grande Prairie. Due to the increased cost of maintaining current service levels and infrastructure, the City must balance taxation and service delivery levels. To deal with this situation, which of the following four options would you most like the City to pursue?
4%
14%
13%
28%
23%
18%
5%
10%
5%
10%
25%
27%
19%
0% 20% 40% 60% 80% 100%
Don't know
It depends*
None
Cut services to reduce taxes
Cut services to maintain current taxlevel
Increase taxes to maintain services atcurrent level
Increase taxes to expand services
2015 (n=400) 2013 (n=405)
Increase Taxes: 2015: 45%*2013: 41%
Cut Services: 2015: 35%2013: 41%
*Rounding

Ba
nis
ter R
esea
rc
h a
nd
Co
nsu
lt
ing
In
c.
Ba
nis
ter R
esea
rc
h a
nd
Co
nsu
lt
ing
In
c.
39
Tracking Balancing Taxation and Service Delivery Levels
39
Base: All respondents (2015: n=400 / 2013 n=405 / 2011 n=400 / 2009 n=400)Q12. Municipal property taxes are the primary way to pay for services and programs provided by the City of Grande Prairie. Due to theincreased cost of maintaining current service levels and infrastructure, the City must balance taxation and service delivery levels. To deal with this situation, which of the following four options would you most like the City to pursue?*“It depends” was added as a response option in 2015. Data may, therefore, not be comparable to previous years, and any comparisons should be interpreted with caution
17% 17% 18% 19%
29%
26%
23%
27%27% 27%28%
25%
10%12%
13%
10%
14%16% 14%
5%
0%
5%
10%
15%
20%
25%
30%
35%
2009 2011 2013 2015
Increase taxes - to expandservices
Increase taxes - tomaintain services atcurrent levelCut services - to maintaincurrent tax levels
Cut services - to reducetaxes
None

Ba
nis
ter R
esea
rc
h a
nd
Co
nsu
lt
ing
In
c.
Ba
nis
ter R
esea
rc
h a
nd
Co
nsu
lt
ing
In
c.
40
15%
0%
79%
7%
14%
59%
29%
5%
17%
49%↓
34%
9%
0% 20% 40% 60% 80% 100%
2015 (n=400) 2013 (n=405) 2011 (n=400)
Increase property taxes
Introduce new or expand existing user fees
Grow the tax base through new
development*
Don’t know
Options for Increasing City Revenue
40
Base: All respondentsQ14. Assuming the City needs to increase the amount of revenue it collects from citizens, would you prefer the City to…?* “Grow the tax base through new development” was not available as an option prior to 2013.
↓ Denotes statistically significant decrease from 2013 to 2015

Banister Research and Consulting Inc.
41
Contact and Communication:Perceptions Related to Customer Service and City
Communications

Ba
nis
ter R
esea
rc
h a
nd
Co
nsu
lt
ing
In
c.
Ba
nis
ter R
esea
rc
h a
nd
Co
nsu
lt
ing
In
c.
42
Contact and Communication: City Contact and Service Delivery and Transparency
City Contact
Just over half (51%) of respondents indicated they had contact with the City of Grande Prairie in the last 12 months, comparable to 48% in 2013.
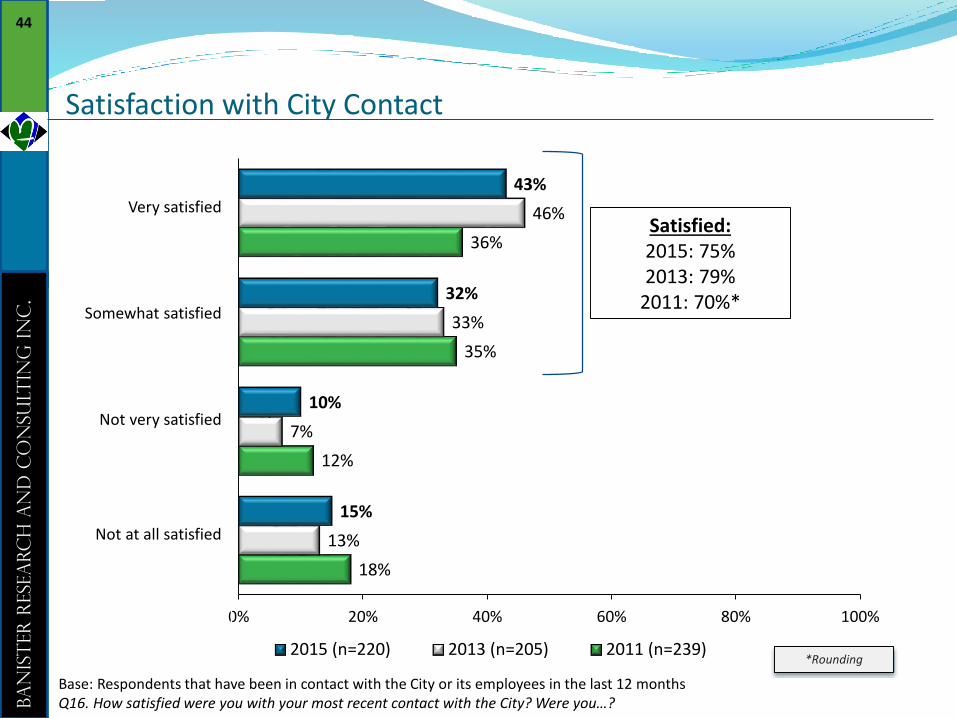
Among those who contacted the City (n=220) 75% were satisfied with the contact, with 43% being very satisfied within the 75% (comparable to 2013).
Service Delivery and Transparency
While 81% of respondents agreed that ‘City staff are courteous, helpful and knowledgeable’, agreement is comparatively lower that ‘the City of Grande Prairie practices open and accessible government’ (68%, a significant decrease from 79% in 2013), ‘City staff are easy to get a hold of when I need them’ ( 68%), ‘ the quality of service from the City is consistently high’ (62%) and ‘the City responds quickly to requests and concerns’ (54%, a significant decrease from 65% in 2013).
Citizen Contact Centre
Eighteen percent (18%) of respondents were aware of the Citizen Contact Centre. Of those who were aware (n=72) nearly one-third (32%) used it since its launch in November, 2014. The majority of respondents who have used the Citizen Contact Centre (84%; n=21) were satisfied.*
42
*Use caution interpreting results when n<30

Ba
nis
ter R
esea
rc
h a
nd
Co
nsu
lt
ing
In
c.
Ba
nis
ter R
esea
rc
h a
nd
Co
nsu
lt
ing
In
c.
43
Contact with the City of Grande Prairie
43
Contacted City in Last Twelve Months
Yes 51%
No 49%
Yes2013: 48%2011: 59%
Base: All respondents (2015 n=400 / 2013 n=405 / 2011 n=400)Q15. Have you contacted or dealt with the City of Grande Prairie or one of its employees in the last 12 months?
Ba
nis
ter R
esea
rc
h a
nd
Co
nsu
lt
ing
In
c.
Ba
nis
ter R
esea
rc
h a
nd
Co
nsu
lt
ing
In
c.
44
18%
12%
35%
36%
13%
7%
33%
46%
15%
10%
32%
43%
0% 20% 40% 60% 80% 100%
2015 (n=220) 2013 (n=205) 2011 (n=239)
Satisfied: 2015: 75%2013: 79%
2011: 70%*
*Rounding
Very satisfied
Somewhat satisfied
Not very satisfied
Not at all satisfied
Satisfaction with City Contact
44
Base: Respondents that have been in contact with the City or its employees in the last 12 months Q16. How satisfied were you with your most recent contact with the City? Were you…?

Ba
nis
ter R
esea
rc
h a
nd
Co
nsu
lt
ing
In
c.
Ba
nis
ter R
esea
rc
h a
nd
Co
nsu
lt
ing
In
c.
45
Tracking Perceptions of City Service Delivery and Transparency
45
Base: All respondentsQ17. Thinking about your personal dealings with the City of Grande Prairie, your general impressions, and anything you may have read, seen or heard, please tell me whether you agree or disagree with each of the following statements about the City?
53%
56%
68%
72%
81%
65%
66%
73%
79%
83%
54% ↓
62%
68%
68%↓
81%
The City responds quickly torequests and concerns
The quality of service fromthe City is consistently high
City staff are easy to get ahold of when I need them
The City of Grande Prairiepractices open and
accessible government
City staff are courteous,helpful and knowledgeable
25%17%
23%
21%
26%
35%33%
42%
37%32%
45%
13%16%
20%
13%
↓ Denotes statistically significant decrease from 2013 to 2015
Percentage of those who either strongly or somewhat agree
Percentage of those who either strongly or somewhat disagree
2015 (n=400)
2013 (n=405)
2011 (n=400)

Ba
nis
ter R
esea
rc
h a
nd
Co
nsu
lt
ing
In
c.
Ba
nis
ter R
esea
rc
h a
nd
Co
nsu
lt
ing
In
c.
46
Citizen Contact Centre
46
Were you aware of the Citizen Contact Centre, launched in November, 2014?
Yes 18%
No 82%
Base: All respondents (n=400)Q18. Prior to today, were you aware of the Citizen Contact Centre, launched in November, 2014?New to the 2015 survey

Ba
nis
ter R
esea
rc
h a
nd
Co
nsu
lt
ing
In
c.
Ba
nis
ter R
esea
rc
h a
nd
Co
nsu
lt
ing
In
c.
47
Citizen Contact Centre
47
Have you used the Citizen Contact Centre since its launch in November, 2014?
Yes 32%
No 68%
Base: Respondents that were aware of the Citizen Contact Centre (n=72)Q18. Have you used the Citizen Contact Centre, since its launch in November, 2014?New to the 2015 survey

Ba
nis
ter R
esea
rc
h a
nd
Co
nsu
lt
ing
In
c.
Ba
nis
ter R
esea
rc
h a
nd
Co
nsu
lt
ing
In
c.
48
7%
9%
55%
28%
0% 20% 40% 60% 80% 100%
Satisfied: 2015: 84%*
*Rounding
Very satisfied
Somewhat satisfied
Not very satisfied
Not at all satisfied
Satisfaction with Citizen Contact Centre
48
Base: Respondents that have used the Citizen Contact Centre (n=21)****Use caution interpreting results when n<30Q20. How satisfied were you with your most recent contact with the Citizen Contact Centre? Were you…?

Ba
nis
ter R
esea
rc
h a
nd
Co
nsu
lt
ing
In
c.
Ba
nis
ter R
esea
rc
h a
nd
Co
nsu
lt
ing
In
c.
49
Contact and Communication: Information Needs, Channels and Satisfaction
Information Needs
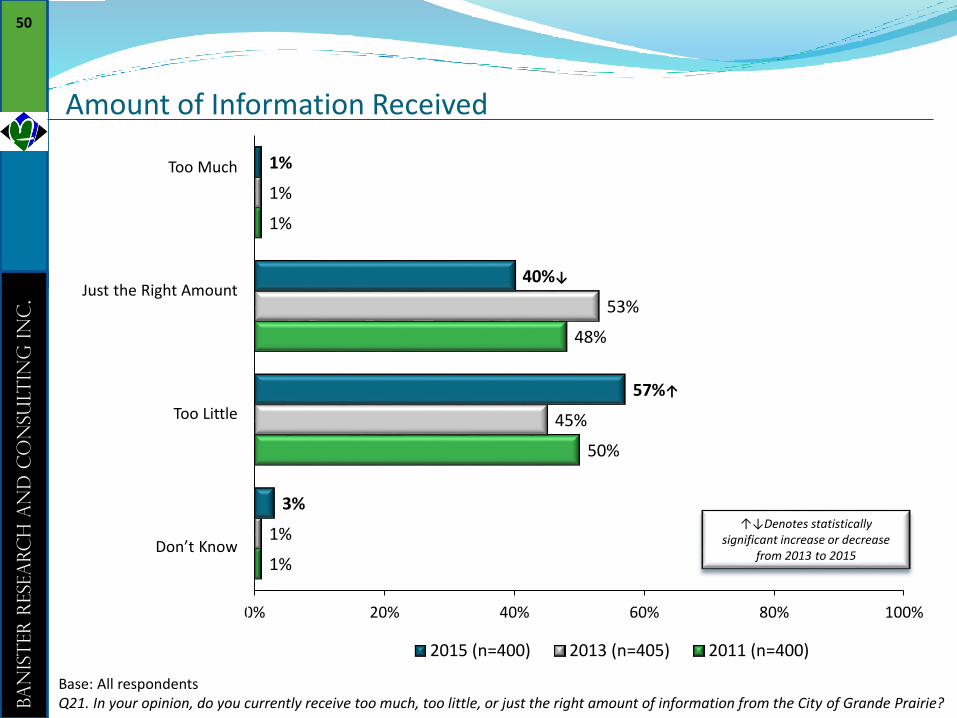
Two-fifths of respondents (40%, a significant decrease from 53% in 2013) indicated they receive the right amount of information from the City of Grande Prairie, while 57% would like more (a significant increase from 45% in 2013).
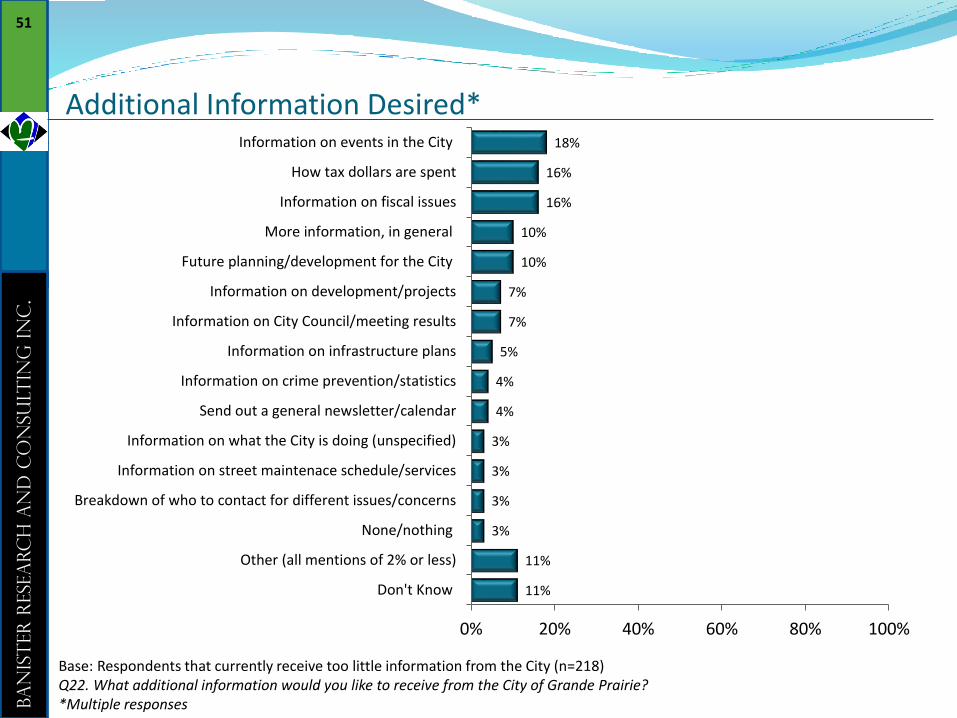
• Among those who would like additional information (n=218), the most frequent requests were information on “events in the City” (18%), “how tax dollars are spent” (16%), and information on “fiscal issues” (16%).
Information Channels
The main sources of receiving information from the City were ‘City website’ (40%), ‘radio newscasts’ (39%), ‘social media’ (33%) and ‘newspaper articles’ (32%).
Ease of Understanding Information
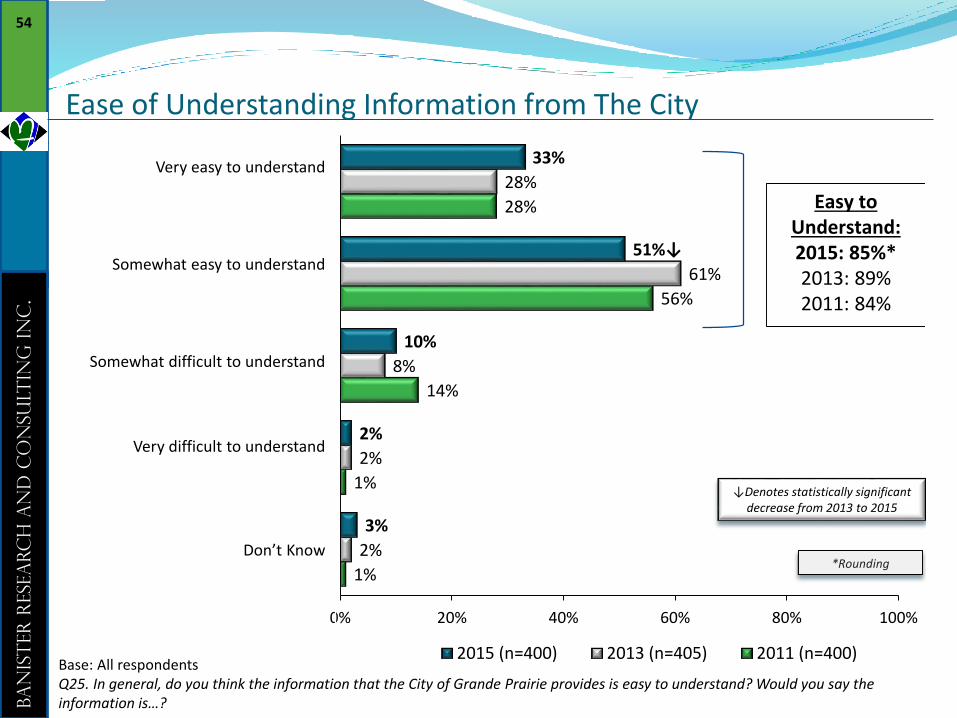
Eighty-five percent (85%) of respondents indicated that the information provided by Grande Prairie is easy to understand (comparable to 89% in 2013).
49
Ba
nis
ter R
esea
rc
h a
nd
Co
nsu
lt
ing
In
c.
Ba
nis
ter R
esea
rc
h a
nd
Co
nsu
lt
ing
In
c.
50
1%
50%
48%
1%
1%
45%
53%
1%
3%
57%↑
40%↓
1%
0% 20% 40% 60% 80% 100%
2015 (n=400) 2013 (n=405) 2011 (n=400)
↑↓Denotes statistically significant increase or decrease
from 2013 to 2015
Too Much
Just the Right Amount
Too Little
Don’t Know
Amount of Information Received
50
Base: All respondents Q21. In your opinion, do you currently receive too much, too little, or just the right amount of information from the City of Grande Prairie?
Ba
nis
ter R
esea
rc
h a
nd
Co
nsu
lt
ing
In
c.
Ba
nis
ter R
esea
rc
h a
nd
Co
nsu
lt
ing
In
c.
51
Additional Information Desired*
51
Base: Respondents that currently receive too little information from the City (n=218) Q22. What additional information would you like to receive from the City of Grande Prairie?*Multiple responses
11%
11%
3%
3%
3%
3%
4%
4%
5%
7%
7%
10%
10%
16%
16%
18%
0% 20% 40% 60% 80% 100%
Don't Know
Other (all mentions of 2% or less)
None/nothing
Breakdown of who to contact for different issues/concerns
Information on street maintenace schedule/services
Information on what the City is doing (unspecified)
Send out a general newsletter/calendar
Information on crime prevention/statistics
Information on infrastructure plans
Information on City Council/meeting results
Information on development/projects
Future planning/development for the City
More information, in general
Information on fiscal issues
How tax dollars are spent
Information on events in the City

Ba
nis
ter R
esea
rc
h a
nd
Co
nsu
lt
ing
In
c.
Ba
nis
ter R
esea
rc
h a
nd
Co
nsu
lt
ing
In
c.
52
Most Important Information*
52
Base: All respondents (n=400) Q23. Thinking about your community information needs, what kinds of information are important for the City of Grande Prairie to provide you with? Anything else?*Multiple responses
25%
21%
3%
3%
4%
4%
4%
6%
7%
7%
7%
8%
10%
10%
15%
0% 20% 40% 60% 80% 100%
Don't Know
Other (all mentions of 2% or less)
None/nothing
Provide contact information/phone numbers
Programs/activities (unspecified)
Recreation/family recreation
Information/updates on infrastructure
Information on snow removal/street clearing
Information/updates on local services
Tax information
Information/updates on planning/development
Information/updates on the budget
Information on crime/safety
Information/updates on tax spending
Event information/announcements

Ba
nis
ter R
esea
rc
h a
nd
Co
nsu
lt
ing
In
c.
Ba
nis
ter R
esea
rc
h a
nd
Co
nsu
lt
ing
In
c.
53
Main Source of Information from the City
53
Base: All respondents (n=400)Multiple responses Q24. Thinking about yourself, what are your top 3 sources of receiving information from the City of Grande Prairie?
3%
19%
6%
7%
8%
10%
10%
10%
14%
27%
32%
33%
39%
40%
0% 20% 40% 60% 80% 100%
Don't Know
Other (all mentions of 4% or less)
Local television
Phone book/telephone
Online/internet
Information flyers
Radio advertisements
Word-of-mouth
Direct mail/billing inserts
Newspaper articles
Social Media
Radio newscasts
City website
Ba
nis
ter R
esea
rc
h a
nd
Co
nsu
lt
ing
In
c.
Ba
nis
ter R
esea
rc
h a
nd
Co
nsu
lt
ing
In
c.
54
1%
1%
14%
56%
28%
2%
2%
8%
61%
28%
3%
2%
10%
51%↓
33%
0% 20% 40% 60% 80% 100%
2015 (n=400) 2013 (n=405) 2011 (n=400)
Easy to Understand: 2015: 85%*2013: 89%2011: 84%
*Rounding
↓Denotes statistically significant decrease from 2013 to 2015
Very easy to understand
Somewhat easy to understand
Somewhat difficult to understand
Very difficult to understand
Don’t Know
Ease of Understanding Information from The City
54
Base: All respondents Q25. In general, do you think the information that the City of Grande Prairie provides is easy to understand? Would you say the information is…?

Ba
nis
ter R
esea
rc
h a
nd
Co
nsu
lt
ing
In
c.
Ba
nis
ter R
esea
rc
h a
nd
Co
nsu
lt
ing
In
c.
55
Contact and Communication: City Performance and Citizen Involvement
Agreement with all four statements regarding City performance and citizen involvement continues to be moderate.
Thinking about themselves, just over two-fifths of respondents (42%) agreed that they believe that ‘the City of Grande Prairie really does care about my opinion as a citizen’ (ratings of 7 to 10 out of 10).
Two-fifths of respondents (40%) agreed that they are doing their ‘part as a citizen by keeping up-to-date about local issues and politics’, while the same proportion (40%) indicated that they ‘trust the news media’.
Thirty-nine percent (39%) agreed ‘the City does a great job of communicating updated and relevant information’.
55

Ba
nis
ter R
esea
rc
h a
nd
Co
nsu
lt
ing
In
c.
Ba
nis
ter R
esea
rc
h a
nd
Co
nsu
lt
ing
In
c.
56
40%
41%
42%
31%
39%
33%
29%
19%
25%
I feel like I’m doing my part as a citizen by keeping up-to-date
about local issues and politics
2015
2013
2011
Base: All respondents (2015: n=400 / 2013 n=405 / 2011 n=400)Q26. I’m going to read you a few statements about life in the City of Grande Prairie, and I’d like you to indicate the degree to which you agree or disagree with each statement.
Perspectives on Communications and Citizen Involvement
56
40%
38%
37%
35%
33%
39%
25%
29%
24%
I trust the news media
2015
2013
2011
39%
41%
35%
36%
39%
39%
23%
20%
26%
The City does a great job of communicating updated and
relevant information
2015
2013
2011
42%
40%
39%
32%
35%
32%
26%
25%
28%
I believe the City of Grande Prairie really does care about
my opinion as a citizen
2015
2013
2011
Agree (10, 9, 8, or 7) Neutral (6 or 5) Disagree (4, 3, 2, or 1)

Banister Research and Consulting Inc.
57
Grande Prairie and The Web:Assessing Online Use

Ba
nis
ter R
esea
rc
h a
nd
Co
nsu
lt
ing
In
c.
Ba
nis
ter R
esea
rc
h a
nd
Co
nsu
lt
ing
In
c.
58
Grande Prairie and The Web: Assessing Online Use
Respondents were asked how frequently they “use social online media or online sources/sites to follow, get information about, discuss etc. public policy, social and/or political issues”.
Over one-quarter (29%) reported using these sources multiple times a day, daily, or almost daily, while 14% use them 2 to 3 times per week or once a week, 9% two or three times per month, 17% once a month or less, and 18% never.
• These results are comparable to the results reported in 2013
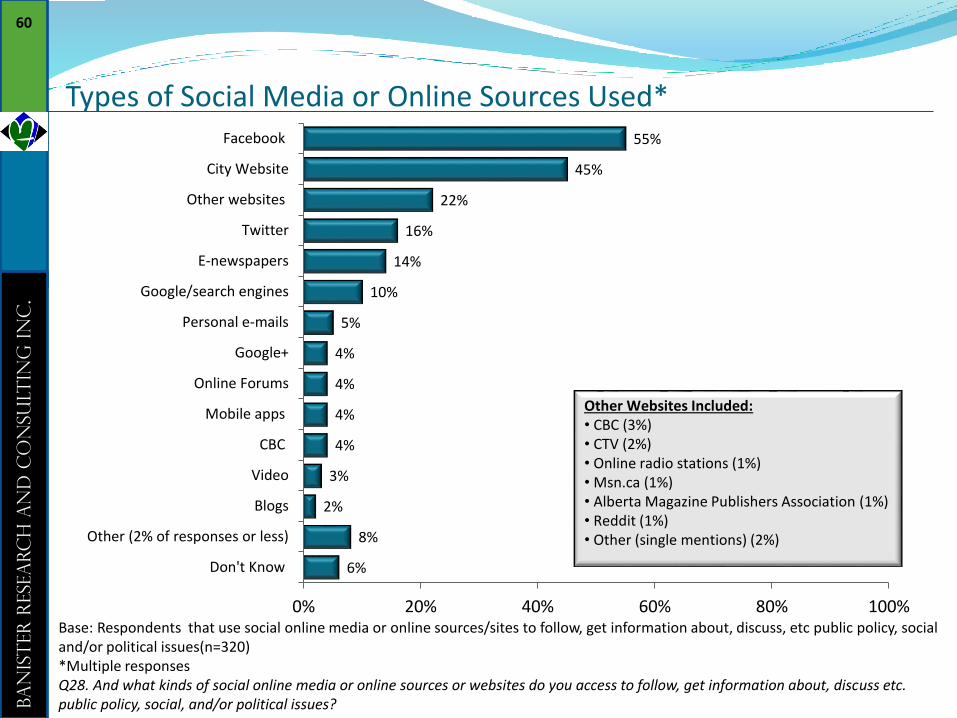
Among those who use social media or online sources or sites for these purposes (n=320), the most frequent sites used were Facebook (55%) and the City of Grande Prairie website (45%).
58

Ba
nis
ter R
esea
rc
h a
nd
Co
nsu
lt
ing
In
c.
Ba
nis
ter R
esea
rc
h a
nd
Co
nsu
lt
ing
In
c.
59
Frequency of using Social Media or Online Sources with Regards to Public Policy, Social and/or Political Issues
59
Base: All respondents Q27. How frequently do you use social online media or online sources/sites to follow, get information about, discuss etc. public policy, social, and/or political issues?
17%
22%
9%
11%
16%
17%
7%
18%
17%
9%
14%
14%
21%
8%
0% 20% 40% 60% 80% 100%
Never
Once a month or less
2 to 3 times a month
Once a week
2 to 3 times a week
Everyday or almost everyday
Several times a day
2015 (n=400) 2013 (n=405)
Ba
nis
ter R
esea
rc
h a
nd
Co
nsu
lt
ing
In
c.
Ba
nis
ter R
esea
rc
h a
nd
Co
nsu
lt
ing
In
c.
60
Types of Social Media or Online Sources Used*
60
Base: Respondents that use social online media or online sources/sites to follow, get information about, discuss, etc public policy, social and/or political issues(n=320)*Multiple responsesQ28. And what kinds of social online media or online sources or websites do you access to follow, get information about, discuss etc. public policy, social, and/or political issues?
6%
8%
2%
3%
4%
4%
4%
4%
5%
10%
14%
16%
22%
45%
55%
0% 20% 40% 60% 80% 100%
Don't Know
Other (2% of responses or less)
Blogs
Video
CBC
Mobile apps
Online Forums
Google+
Personal e-mails
Google/search engines
E-newspapers
Other websites
City Website
Other Websites Included:• CBC (3%) • CTV (2%)• Online radio stations (1%)• Msn.ca (1%)• Alberta Magazine Publishers Association (1%)• Reddit (1%)• Other (single mentions) (2%)
Ba
nis
ter R
esea
rc
h a
nd
Co
nsu
lt
ing
In
c.
Ba
nis
ter R
esea
rc
h a
nd
Co
nsu
lt
ing
In
c.
61
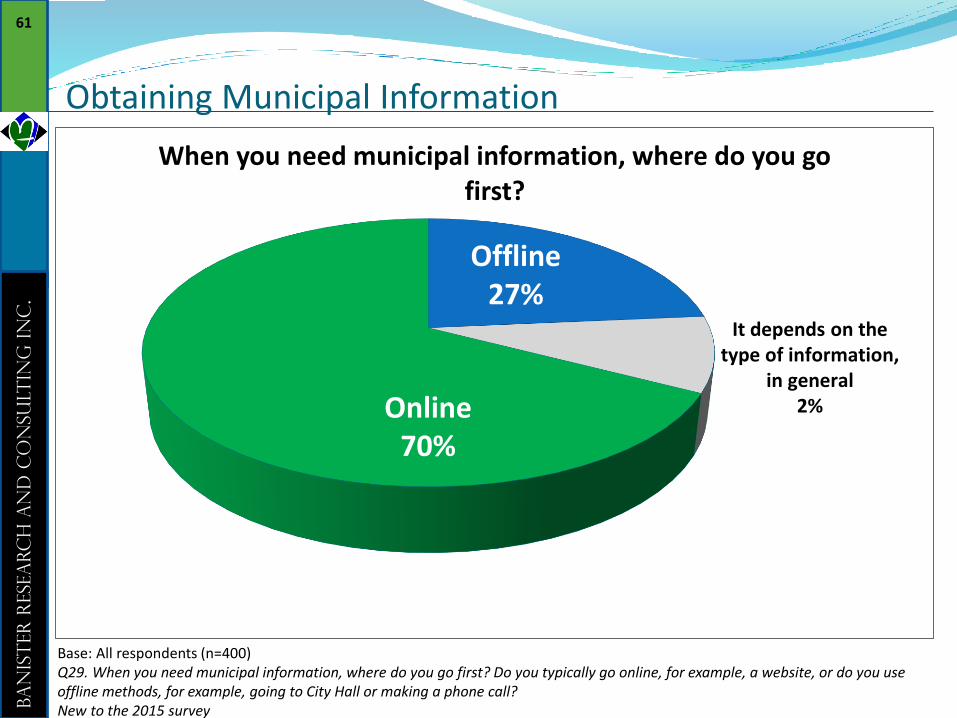
Obtaining Municipal Information
61
When you need municipal information, where do you go first?
Offline 27%
Online 70%
It depends on the type of information,
in general2%
Base: All respondents (n=400)Q29. When you need municipal information, where do you go first? Do you typically go online, for example, a website, or do you useoffline methods, for example, going to City Hall or making a phone call? New to the 2015 survey

Ba
nis
ter R
esea
rc
h a
nd
Co
nsu
lt
ing
In
c.
Ba
nis
ter R
esea
rc
h a
nd
Co
nsu
lt
ing
In
c.
62
Awareness and Effectiveness of Methods Used to Engage Residents
62
Base: All respondents (n=400)New to the 2015 survey Q30/31. The City of Grande Prairie is currently working to actively engage residents in municipal issues. I am now going to read to you a list of some of the other methods that the City uses to engage residents, and for each method, I would like you to tell me if you were aware of it, prior to completing this survey? How effective do you think each of these methods are, in terms or communicatinginformation to you about municipal issues?
35%
36%
39%
44%
47%
52%
62%
68%
69%
83%
21%
16%
42%
29%
22%
44%
58%
72%
76%
90%
0% 20% 40% 60% 80% 100%
YouTube content
Citizen Budget online tool
Community Interactions or Solutions-Based Meetings
E-newsletter
Municipal Government Day Ad Campaign or Commercials
Centennial Events Ad Campaigns or Commercials (in 2014)
Tradeshows
City Website
Aware of Each Method Method is either somewhat or very effective

Banister Research and Consulting Inc.
63
Growing City:Perceptions Related to Growth and Development

Ba
nis
ter R
esea
rc
h a
nd
Co
nsu
lt
ing
In
c.
Ba
nis
ter R
esea
rc
h a
nd
Co
nsu
lt
ing
In
c.
64
Growing City: Perceptions Related to Growth and Development
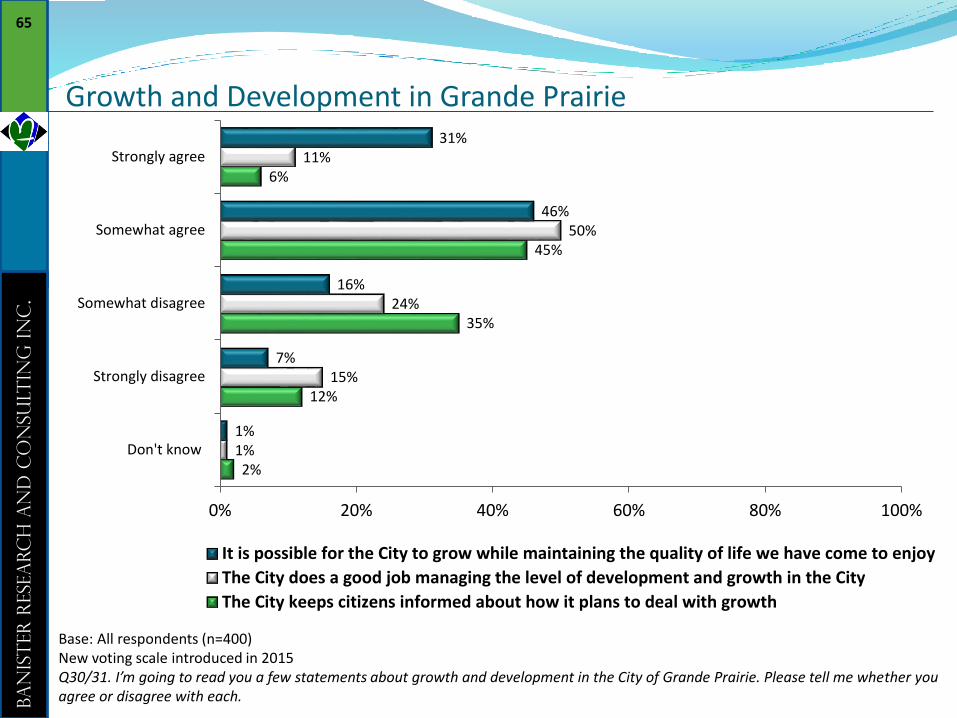
Over three-quarters of respondents (77%) agreed that ‘it is possible for the City to grow while maintaining the quality of life we have come to enjoy in this City’
Three-fifths of respondents (60%) agreed that ‘the City does a good job managing the level of development and growth in the City’.
Just over half of the respondents (51%) agreed that ‘the City of Grande Prairie keeps citizens informed about how it plans to deal with growth.
64
Ba
nis
ter R
esea
rc
h a
nd
Co
nsu
lt
ing
In
c.
Ba
nis
ter R
esea
rc
h a
nd
Co
nsu
lt
ing
In
c.
65
Growth and Development in Grande Prairie
65
Base: All respondents (n=400)New voting scale introduced in 2015Q30/31. I’m going to read you a few statements about growth and development in the City of Grande Prairie. Please tell me whether you agree or disagree with each.
2%
12%
35%
45%
6%
1%
15%
24%
50%
11%
1%
7%
16%
46%
31%
0% 20% 40% 60% 80% 100%
Don't know
Strongly disagree
Somewhat disagree
Somewhat agree
Strongly agree
It is possible for the City to grow while maintaining the quality of life we have come to enjoy
The City does a good job managing the level of development and growth in the City
The City keeps citizens informed about how it plans to deal with growth
Banister Research and Consulting Inc.
66
Grande Prairie and Snow Removal:Evaluating Snow Removal
Ba
nis
ter R
esea
rc
h a
nd
Co
nsu
lt
ing
In
c.
Ba
nis
ter R
esea
rc
h a
nd
Co
nsu
lt
ing
In
c.
67
Grande Prairie and Snow Removal: Evaluating Snow Removal
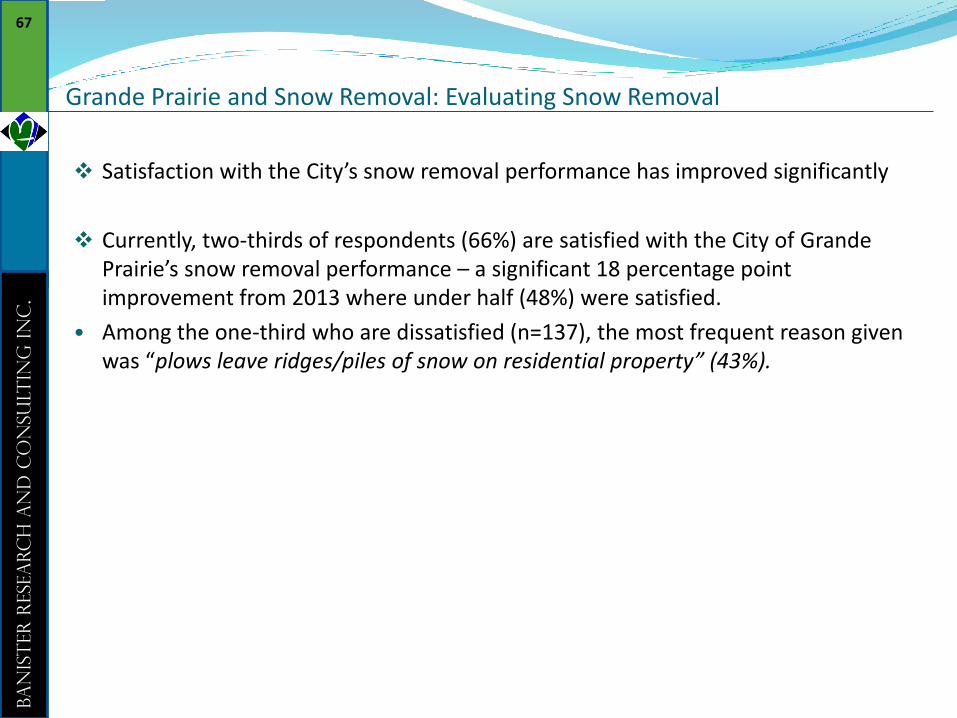
Satisfaction with the City’s snow removal performance has improved significantly
Currently, two-thirds of respondents (66%) are satisfied with the City of Grande Prairie’s snow removal performance – a significant 18 percentage point improvement from 2013 where under half (48%) were satisfied.
• Among the one-third who are dissatisfied (n=137), the most frequent reason given was “plows leave ridges/piles of snow on residential property” (43%).
67
Ba
nis
ter R
esea
rc
h a
nd
Co
nsu
lt
ing
In
c.
Ba
nis
ter R
esea
rc
h a
nd
Co
nsu
lt
ing
In
c.
68
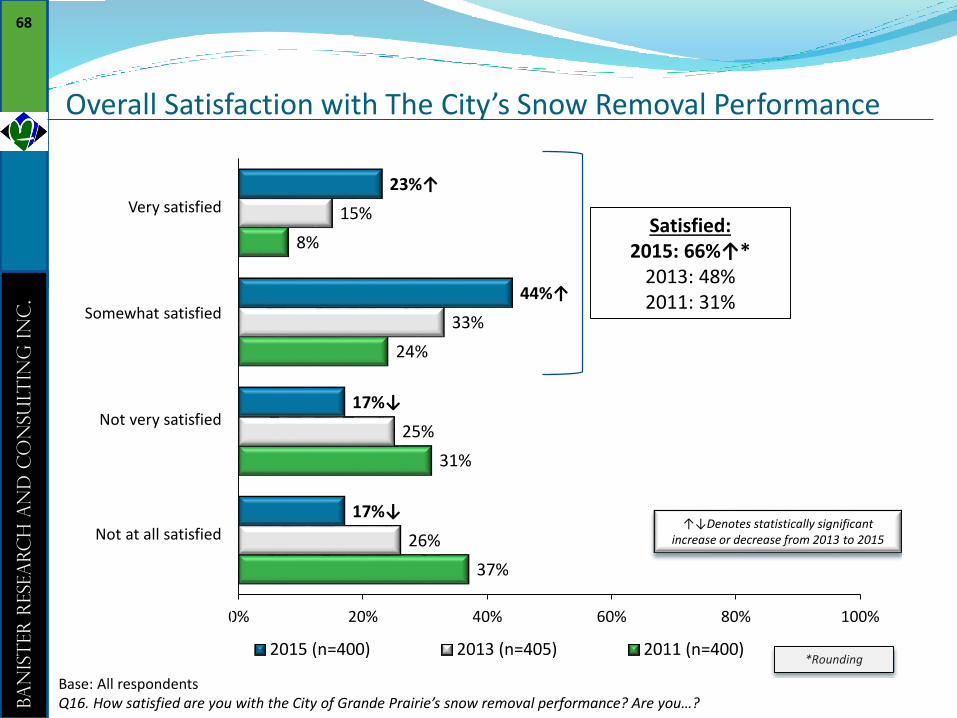
37%
31%
24%
8%
26%
25%
33%
15%
17%↓
17%↓
44%↑
23%↑
0% 20% 40% 60% 80% 100%
2015 (n=400) 2013 (n=405) 2011 (n=400)
Satisfied: 2015: 66%↑*
2013: 48%2011: 31%
*Rounding
↑↓Denotes statistically significant increase or decrease from 2013 to 2015
Very satisfied
Somewhat satisfied
Not very satisfied
Not at all satisfied
Overall Satisfaction with The City’s Snow Removal Performance
68
Base: All respondentsQ16. How satisfied are you with the City of Grande Prairie’s snow removal performance? Are you…?

Ba
nis
ter R
esea
rc
h a
nd
Co
nsu
lt
ing
In
c.
Ba
nis
ter R
esea
rc
h a
nd
Co
nsu
lt
ing
In
c.
69
Reasons for Satisfaction with Snow Removal Performance
69
Base: Respondents that are very/somewhat satisfied with the City’s snow removal performance (n=261)Q34a. Why are you very/somewhat satisfied with the City of Grande Prairie’s snow removal performance?
5%
13%
3%
3%
4%
4%
6%
12%
15%
22%
22%
0% 20% 40% 60% 80% 100%
Don't Know
Other (2% of responses or less)
Snow banks are too high
Not enough focus on residential areas
There is room for improvement
Slow/not on schedule
Not often enough
Plows leave ridges/piles of snow on residential property
Snow removal has improved
Snow is removed quickly
No issues/they are fine/do a good job

Ba
nis
ter R
esea
rc
h a
nd
Co
nsu
lt
ing
In
c.
Ba
nis
ter R
esea
rc
h a
nd
Co
nsu
lt
ing
In
c.
70
Reasons for Dissatisfaction with Snow Removal Performance
70
Base: Respondents that are not very/not at all satisfied with the City’s snow removal performance (n=137)Q34b. Why are you not very/not at all satisfied with the City of Grande Prairie’s snow removal performance?
2%
10%
4%
4%
4%
5%
5%
8%
10%
11%
14%
16%
43%
0% 20% 40% 60% 80% 100%
Don't Know
Other (3% of responses or less)
Not enough focus on residential areas
Dissatisfied with changes to snow removal schedule/plan
Non-existent service in my area
Snow banks are too high
Not enough equipment/manpower
A lot of vehicles stuck in snow
Sidewalks not cleared
Poorly cleared/lots of ruts
Not often enough
Slow/not on schedule
Plows leave ridges/piles of snow on residential property
Banister Research and Consulting Inc. 71
Demographics

Ba
nis
ter R
esea
rc
h a
nd
Co
nsu
lt
ing
In
c.
Ba
nis
ter R
esea
rc
h a
nd
Co
nsu
lt
ing
In
c.
72
72
Female49% Male
51%
18 to 24 17%
25 to 34 29%
35 to 44 19%
45 to 54 17%
55 to 64 10%
65 years and older
8%
Age
Gender
5 years or less 12%
6 to 10 years 20%
11 to 20 years 29%
More than 20 years 38%
Mean 19 years
Tenure in Grande Prairie
1 person 9%
2 people 27%
3 people 21%
4 people 30%
5 or more people 13%
Mean 3 people
Household Size
Household Composition
Including yourself, how many people in each of the following age groups live in your household?*
Under 13 years old 38%
Between 13 and 17 years old 15%
Between 18 and 44 years old 76%
Between 45 and 64 years old 49%
65 years of age or older 11%
*Percentage of people with at least 1 person in each category

Ba
nis
ter R
esea
rc
h a
nd
Co
nsu
lt
ing
In
c.
Ba
nis
ter R
esea
rc
h a
nd
Co
nsu
lt
ing
In
c.
73
73
No13%
Yes86%
Own or Rent Responsible for Property Taxes
Less than $30,000 5%
$30,000 to just under $45,000 3%
$45,000 to just under $60,000 8%
$60,000 to just under $75,000 6%
$75,000 to just under $90,000 9%
$90,000 to just under $105,000 11%
$105,000 to just under $120,000 8%
$120,000 to just under $135,000 6%
$135,000 to just under $150,000 8%
$150,000 and over 21%
No Response 15%
Income
Completed high school or less
30%
Some post-secondary or completed college
49%
Completed university or post-grad degree
21%
No response <1%
Education
Rent12%
Own80%
Other7%